Embed Size (px)
Citation preview
RRSについて考える
慈恵ICU2017/07/18山口庸子
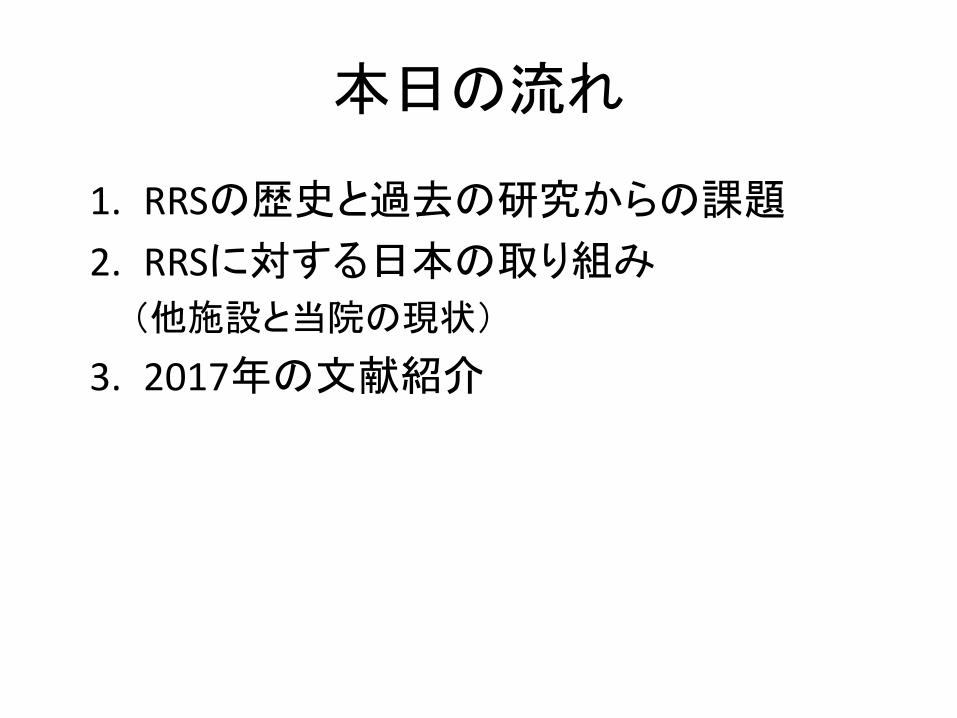
本日の流れ
1. RRSの歴史と過去の研究からの課題
2. RRSに対する日本の取り組み
(他施設と当院の現状)
3. 2017年の文献紹介

1. RRSの歴史と過去の研究からの課題
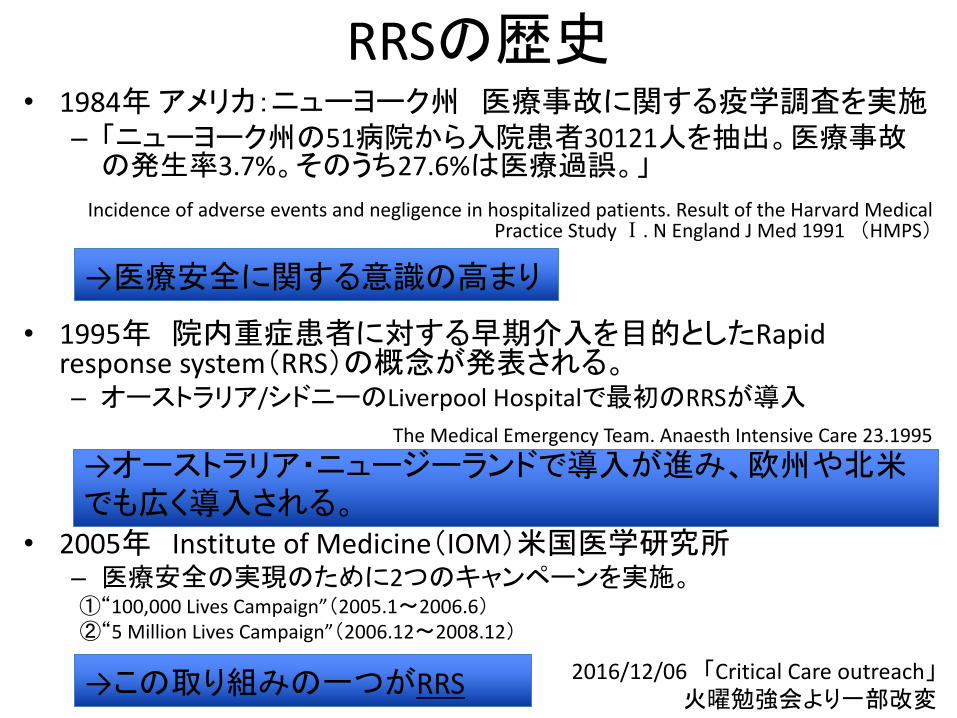
RRSの歴史• 1984年 アメリカ:ニューヨーク州 医療事故に関する疫学調査を実施
– 「ニューヨーク州の51病院から入院患者30121人を抽出。医療事故の発生率3.7%。そのうち27.6%は医療過誤。」
Incidenceofadverseeventsandnegligenceinhospitalizedpatients.ResultoftheHarvardMedicalPracticeStudyⅠ.NEnglandJMed1991 (HMPS)
• 1995年 院内重症患者に対する早期介入を目的としたRapidresponsesystem(RRS)の概念が発表される。– オーストラリア/シドニーのLiverpoolHospitalで 初のRRSが導入
TheMedicalEmergencyTeam.Anaesth IntensiveCare 23.1995
• 2005年 InstituteofMedicine(IOM)米国医学研究所– 医療安全の実現のために2つのキャンペーンを実施。①“100,000LivesCampaign”(2005.1〜2006.6)②“5MillionLivesCampaign”(2006.12〜2008.12)
22016/12/06 「CriticalCareoutreach」火曜勉強会より一部改変
→医療安全に関する意識の高まり
→オーストラリア・ニュージーランドで導入が進み、欧州や北米でも広く導入される。
→この取り組みの一つがRRS
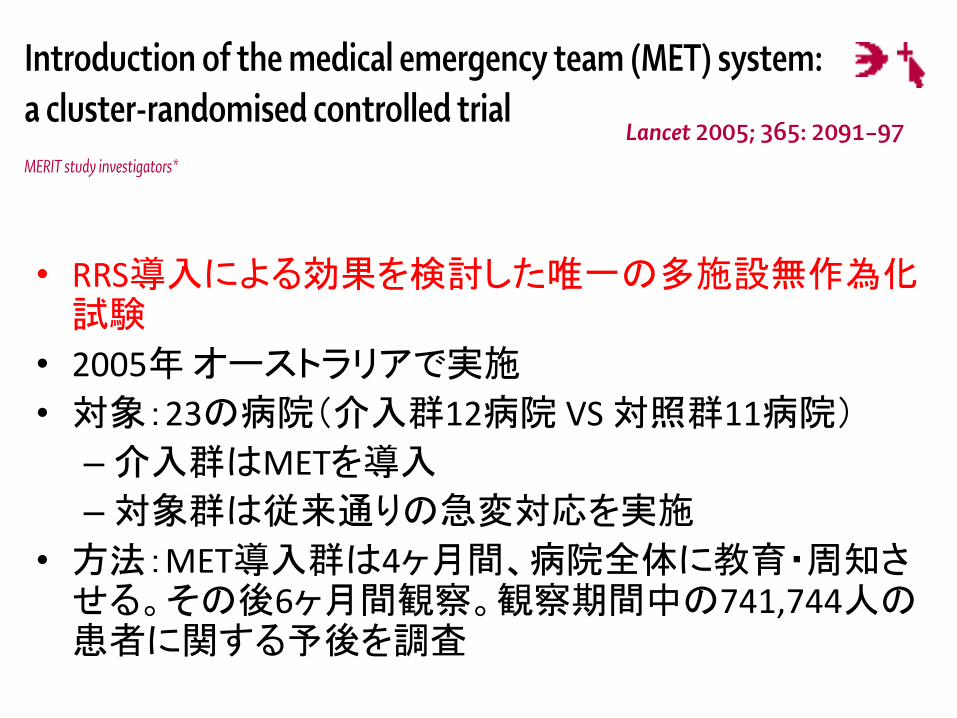
• RRS導入による効果を検討した唯一の多施設無作為化試験
• 2005年 オーストラリアで実施
• 対象:23の病院(介入群12病院 VS対照群11病院)
–介入群はMETを導入
–対象群は従来通りの急変対応を実施
• 方法:MET導入群は4ヶ月間、病院全体に教育・周知させる。その後6ヶ月間観察。観察期間中の741,744人の患者に関する予後を調査
Articles
IntroductionUnexpected deaths and cardiac arrests that occur inhospitals1–3 are often preceded by warning signs.4,5
Similarly, unplanned admissions to intensive care units(ICU) are commonly foretold by abnormalities inpatients’ vital signs without appropriate action beingundertaken.6,7 These findings suggest that some of theseadverse outcomes might be preventable.
A hospital-wide approach to the management ofpatients at risk of unexpected deaths and cardiac arrests,by early recognition of deterioration and earlyresuscitation, has been developed to reduce the numberof unexpected deaths, cardiac arrests, and unplannedICU admissions.8 This approach is based on the medicalemergency team (MET) system, which includes staffeducation, the introduction of MET calling criteria,increased awareness of the dangers of physiologicalinstability, and immediate availability of a MET. TheMET quickly responds to abnormalities in patients’ vitalsigns, specific conditions, and staff concerns in muchthe same way as a cardiac arrest team would, but at anearlier stage of physiological instability.
The rationale behind this approach is that earlyintervention in response to physiological instabilitymight prevent further deterioration in many patients. Instudies that have had restricted analysis (by being small,using historical controls, or using unrandomisedcomparisons), operation of a MET system has beenassociated with a reduction in unplanned ICU admis-sions,9 cardiac arrests, and deaths.10–12 To rigorouslyassess the MET system, we undertook a cluster-
randomised controlled trial in 23 hospitals in Australiaand investigated the effectiveness of the system inhospitals of various sizes and organisationalcharacteristics.
MethodsParticipating hospitals and proceduresWe identified potential participating hospitals using theAustralian Hospital and Health Services Yearbook.13
Public hospitals with more than 20 000 estimatedadmissions every year, with an ICU and emergencydepartment, and that did not already have a MET, wereeligible for participation. The director of the ICU oremergency department was contacted and invited toparticipate. Approval to participate was obtained from allthe hospitals’ human research ethics committees.
Outcome and process measures were obtained in allhospitals for a baseline period of 2 months. Halfwaythrough the baseline period, an independent statistician(who had no other involvement in the study) randomlyassigned hospitals to receive standardised METimplementation or to be controls. Randomisation wasconcealed from the project investigators andparticipating hospitals, and was stratified by teaching ornon-teaching status and blocked by the number ofhospital beds with a group size of four using SASversion 6.12.
During the next 4 months, an educational strategy wasundertaken to prepare hospitals for the introduction ofthe MET system (implementation period). The controlhospitals did not receive any education about the MET at
Lancet 2005; 365: 2091–97
Correspondence to: Prof Ken Hillman, University ofNew South Wales, Division ofCritical Care, Liverpool Hospital,Locked Bag 7103, Sydney 1871,[email protected]
*Investigators listed at end ofreport
www.thelancet.com Vol 365 June 18, 2005 2091
Introduction of the medical emergency team (MET) system:a cluster-randomised controlled trialMERIT study investigators*
SummaryBackground Patients with cardiac arrests or who die in general wards have often received delayed or inadequate care.We investigated whether the medical emergency team (MET) system could reduce the incidence of cardiac arrests,unplanned admissions to intensive care units (ICU), and deaths.
Methods We randomised 23 hospitals in Australia to continue functioning as usual (n=11) or to introduce a METsystem (n=12). The primary outcome was the composite of cardiac arrest, unexpected death, or unplanned ICUadmission during the 6-month study period after MET activation. Analysis was by intention to treat.
Findings Introduction of the MET increased the overall calling incidence for an emergency team (3·1 vs 8·7 per 1000admissions, p=0·0001). The MET was called to 30% of patients who fulfilled the calling criteria and who weresubsequently admitted to the ICU. During the study, we recorded similar incidence of the composite primaryoutcome in the control and MET hospitals (5·86 vs 5·31 per 1000 admissions, p=0·640), as well as of the individualsecondary outcomes (cardiac arrests, 1·64 vs 1·31, p=0·736; unplanned ICU admissions, 4·68 vs 4·19, p=0·599; andunexpected deaths, 1·18 vs 1·06, p=0·752). A reduction in the rate of cardiac arrests (p=0·003) and unexpecteddeaths (p=0·01) was seen from baseline to the study period for both groups combined.
Interpretation The MET system greatly increases emergency team calling, but does not substantially affect theincidence of cardiac arrest, unplanned ICU admissions, or unexpected death.
Articles
strategy that was focused on the education of staff torecognise patients at risk of unexpected deaths andcardiac arrests and to call the MET as soon as suchpatients were identified.
Although our educational approach was successful byincreasing the emergency team calling incidences in theMET hospitals, rates could have been raised further by asophisticated, broad-based, and continued educationalapproach using academic detailing, educationallyinfluential opinion leaders, or timely reminders. Moresophisticated interventions are an important area forfuture study. The low rate of MET calls precedingunplanned ICU admissions and unexpected deathswhen MET criteria were documented suggests thatMET implementation in our study could have beenimproved. However, we do not know whether betterimplementation would have increased the number ofMET calls or whether an increased number of callswould have changed the negative outcome that werecorded.
Additionally, we sought to implement change andmeasure improvement over a short period. In thisrespect, our study emphasises the restrictions inherentto such studies in a dynamic health-care environment.By comparison, similar complex interventions such asthe introduction of trauma systems have taken up to10 years before any effect on mortality has beendetected.22,23 Whether the MET system might improveoutcome over an extended period is unknown andextended term study of MET systems is needed.
Our ability to show that the MET system improvedoutcome would have also depended on the quality ofcare provided by the participating hospitals, because ifhospitals already had effective systems to manage
deteriorating patients in general wards, the METimplementation might not improve outcome. In ourstudy, only up to half the patients had MET callingcriteria documented before an adverse event, and manypatients had incomplete or absent records in the periodpreceding cardiac arrest, death, or unplanned ICUadmission. It is unlikely that a patient could be admittedfrom the general ward to the ICU as an unplannedadmission without fulfilling the MET calling criteria,and so it seems safe to assume that virtually all thesepatients would have fulfilled the MET calling criteria.Although these data are not a definitive measure of thequality of ward care, they do not suggest that suchquality of care was especially good in the study hospitals,and this seems to be an unlikely explanation for thenegative outcome we recorded.
Our study was ambitious in design, scope, andintervention. It included a wide range of tertiary,metropolitan, and non-metropolitan hospitals indifferent states across Australia. As implementation ofthe MET system changes the delivery of emergencycare within a hospital, randomisation of hospitalsrather than patients was the most appropriate way ofassessing the system. The fact that both control andMET hospitals improved their adverse outcome rateduring the study could have reduced our ability torecord a positive treatment effect. Possible explana-tions for this finding include seasonal variation orincreased awareness of patient safety, causingsystematic change in the delivery of health care inAustralia. We carefully prevented contamination ofhospitals in the control group, in particular the controlhospitals received no specific training in the recog-nition of patients at risk of unexpected deaths and
www.thelancet.com Vol 365 June 18, 2005 2095
Control MET p Difference (95% CI)* Adjusted p Adjusted odds ratio (95% CI) ICC (95% CI) DEFT
Primary outcome 5·86 5·31 0·804 –0·264 (–2·449 to 1·921) 0·640 0·98 (0·83 to 1·16) 0·0666 (0·0525 to 0·0841) 4·018Cardiac arrest† 1·64 1·31 0·306 –0·208 (–0·620 to 0·204) 0·736 0·94 (0·79 to 1·13) 0·0196 (0·0065 to 0·0707) 1·511Unplanned ICU admission 4·68 4·19 0·899 –0·135 (–2·330 to 2·060) 0·599 1·04 (0·89 to 1·21) 0·0951 (0·0757 to 0·1191) 4·258Unexpected death† 1·18 1·06 0·564 –0·093 (–0·423 to 0·237) 0·752 1·03 (0·84 to 1·28) 0·0205 (0·0061 to 0·0663) 1·457
Outcome data are crude rate per 1000 admissions. ICC= intraclass correlation coefficient. *Difference weighted by number of hospital admissions during study period. †Excludes events with pre-existing NFR orders.
Table 3: Primary and secondary outcomes during study period
Outcome Control hospitals MET hospitals Control and MET hospitals combined
Baseline Study Weighted p Baseline Study Weighted p Baseline Study Weighted pdifference difference difference
Primary outcome 7·07 5·86 –1·41 0·030 6·58 5·31 –0·39 0·612 6·82 5·57 –0·85 0·089Cardiac arrest* 2·61 1·64 –0·98 0·004 1·60 1·31 –0·44 0·171 2·08 1·47 –0·68 0·003Unplanned ICU admission 5·29 4·96 –0·53 0·280 4·68 4·19 –0·02 0·976 5·12 4·42 –0·23 0·577Unexpected death* 1·61 1·18 –0·68 0·040 1·65 1·06 –0·31 0·132 1·63 1·11 –0·48 0·010
Outcome data are crude rate per 1000 admissions. *Excludes events with pre-existing NFR orders. Differences are weighted by number of hospital admissions during study period. p values for weighted differences are derivedfrom the paired weighted t test. If the change in outcomes from baseline to study periods are compared (ie, the change over time in control hospitals vs change over time in MET hospitals), p values for weighted differences are:primary outcome, p=0·297; cardiac arrest, p=0·190; unplanned ICU admission, p=0·508; unexpected death p=0·288. p values for change over time are derived from the weighted t test.
Table 4: Primary and secondary outcomes during baseline and study periods
• 入院患者1000例あたりで比較
–重篤な有害事象発生件数
–心停止発生件数
–予期し得ないICUへの入室件数
–予期し得ない死亡数
–緊急対応チームの起動件数:3.1VS8.7(p=0.001)
→コントロール群とMET導入群で、いずれも有意差を認めず
MERIT Studyの問題点
1) RRSの起動基準を満たした場合でも30%しかMETがコールされていない
2) RRS導入のための準備期間がわずか4ヶ月であ
り、病院全体に十分浸透しないまま研究が開始された可能性がある
3) MERIT studyが行われた時期はオーストラリア全体にRRSに関する認識が広まってきた時期と重なっており、対照群の病院でもRRSに関する知識の影響を受けている可能性もある
Demonstratingthebenefitofmedicalemergencyteams(MET)provesmoredifficultthananticipated.Crit Care10:306- 307,2006
内野滋彦:MET/RRTの概念と歴史.ICUとCCU34:427-432,2010
RESEARCH Open Access
Rapid response systems: a systematicreview and meta-analysisRitesh Maharaj1,2,3*, Ivan Raffaele2 and Julia Wendon1,2
Abstract
Introduction: Although rapid response system teams have been widely adopted by many health systems, theireffectiveness in reducing hospital mortality is uncertain. We conducted a meta-analysis to examine the impact ofrapid response teams on hospital mortality and cardiopulmonary arrest.
Method: We conducted a systematic review of studies published from January 1, 1990, through 31 December2013, using PubMed, EMBASE, CINAHL (Cumulative Index to Nursing and Allied Health Literature) and theCochrane Library. We included studies that reported data on the primary outcomes of ICU and in-hospitalmortality or cardiopulmonary arrests.
Results: Twenty-nine eligible studies were identified. The studies were analysed in groups based on adult andpaediatric trials that were further sub-grouped on methodological design. There were 5 studies that were consideredeither cluster randomized control trial, controlled before after or interrupted time series. The remaining studies werebefore and after studies without a contemporaneous control. The implementation of RRS has been associated withan overall reduction in hospital mortality in both the adult (RR 0.87, 95 % CI 0.81–0.95, p<0.001) and paediatric (RR=0.8295 % CI 0.76–0.89) in-patient population. There was substantial heterogeneity in both populations. The rapid responsesystem team was also associated with a reduction in cardiopulmonary arrests in adults (RR 0.65, 95 % CI 0.61–0.70,p<0.001) and paediatric (RR=0.64 95 % CI 0.55–0.74) patients.
Conclusion: Rapid response systems were associated with a reduction in hospital mortality and cardiopulmonaryarrest. Meta-regression did not identify the presence of a physician in the rapid response system to be significantlyassociated with a mortality reduction.
IntroductionMany ward patients may deteriorate to the point ofunexpected ICU admission or even cardiac arrest anddeath. About one-half of the serious adverse eventsare deemed to be preventable [1]. Patients oftenshow some signs of physiological deterioration forseveral hours (median 6 hours) before cardiac arrest[2, 3]. Theoretically, this would appear to be suffi-cient time to deliver interventions that would alterthe trajectory of deterioration. This ‘failure to rescue’ isthe context in which rapid response systems (RRSs) havebeen introduced [4].
Most RRS trials have used similar criteria for activationof the team. These include various thresholds forrespiratory rate, heart rate, blood pressure and mental stateas well as the ‘staff worried’ criterion [5]. Unfortunately, thedetermination of respiratory rate and mental state on thewards is error prone and vital signs are unlikely to bemeasured more frequently than five times per dayoutside the ICU [6–8]. Variations in activation potentiallyinfluence the effectiveness of RRSs. Non-activation anddelays in activation may be associated with harm andtoo liberal activation may cause system fatigue [9–11].Consequently, the time spent implementing and maintain-ing the concept of a RRS and the rate of RRS activationmay be a contributory factor to its success.The RRS team is usually multidisciplinary in nature and
tailored to meet the institutional needs and resources. Inthis respect there is some variation in the constitution of aRRS. In the UK the RRS team may be nurse led, and in
* Correspondence: [email protected] College London, Denmark Hill, London SE5 9RW, UK2Department of Critical Care Medicine, King’s College Hospital NHSFoundation Trust, Denmark Hill, London SE5 9RW, UKFull list of author information is available at the end of the article
© 2015 Maharaj et al. This is an Open Access article distributed under the terms of the Creative Commons AttributionLicense (http://creativecommons.org/licenses/by/4.0), which permits unrestricted use, distribution, and reproduction inany medium, provided the original work is properly credited. The Creative Commons Public Domain Dedication waiver(http://creativecommons.org/publicdomain/zero/1.0/) applies to the data made available in this article, unless otherwise stated.
Maharaj et al. Critical Care (2015) 19:254 DOI 10.1186/s13054-015-0973-y
the USA nurse or respiratory therapists may lead [12, 13].In Australia, New Zealand and Scandinavia, a physician-led RRS is favoured [5, 14]. The optimal compositionof a RRS team is unknown and may depend upon orga-nizational structure.Organizations such as the Institute for Healthcare
Improvement, the 2009 Joint Commission’s NationalPatient Safety Goal in the USA, the National Instituteof Clinical Excellence (NICE) in the UK as well as numer-ous other organizations have driven the implementationof RRS teams [15, 16]. Despite high face validity, theeffectiveness of RRS teams in reducing hospital mortalityremains controversial. A high-quality meta-analysis in2010 did not find evidence of RRS teams reducinghospital mortality in adults [17]. A more recent re-view by Winters et al. [18] included studies of varyingmethodological quality and design, with inconsistentfindings across outcomes. Both analyses aggregated studiesof varying methodology and quality, further limitingthe interpretation of the results [18].Accordingly, a systematic review and meta-regression
was undertaken to assess the effect of the RRS onhospital mortality and cardiopulmonary arrest outsidethe ICU and to evaluate the potential relationshipbetween the number of RRS team activations per 1000admissions, the presence of a physician in the RRS teamand the duration of the implementation phase and theeffectiveness of RRS teams.
MethodsA systematic review of studies published between 1January 1990 and 31 December 2013 was conducted inaccordance with published guidelines [19, 20]. We usedthe PubMed, EMBASE, CINAHL (Cumulative Index toNursing and Allied Health Literature) and CochraneRegister of Controlled trials databases. Additionally, a handsearch of bibliographies of key publications was performed.Search terms included ‘rapid response team’, medicalemergency team’ and ‘critical care outreach’. Details of theelectronic search are described in Fig. 1 with additional in-formation provided in the supplementary appendix.
Study eligibility criteria and selectionThe inclusion criteria for this meta-analysis was that stud-ies had to be a study that described the effect of RRS teamsin a population of hospital in-patients that included acomparison between a control cohort and intervention co-hort, and provided quantitative data about mortality ratesor cardiopulmonary arrests. There was no country restric-tion but only English language studies were included.A total of 2935 abstracts were identified by the search
strategy. The titles and abstracts were independentlyassessed for eligibility by two investigators (RM and IR).Eight hundred and eighty-one duplicate studies were
removed and a further 1994 studies were removed becausethey were not relevant or did not report sufficient data(Fig. 1). In cases with multiple articles with overlappingdata from the same population, we included data fromthe most comprehensive study and excluded the otherstudies [21–24].
Data extraction processTwo reviewers independently, using a standardizedformat, extracted the data. For each study the followingdata elements were extracted: year of study, type ofstudy design (randomized controlled trial (RCT),before–after, interrupted time series), type of hospital,number of centres, type of RRS, types of interventions,period pre and post implementation, demographics,number of activations per 1000 admissions, effect on do-not-resuscitate orders, non-ICU cardiopulmonary arrest,
Fig. 1 Literature search flow diagram
Maharaj et al. Critical Care (2015) 19:254 Page 2 of 15
Ø 目的:Rapid response systemの効果を検討する。Ø デザイン:システマティックレビュー、メタアナリシスØ 結果:29文献が検出。(成人21件、小児8件)• 内訳:5文献(clusterrandomizedcontroltrial,controlledbefore
after,interruptedtimeseries),25件単施設• RRTの実施は、院内死亡率を有意に減少させた。 (RR0.87,95%CI0.81–0.95,p<0.001)(成人)
• 小児においても有意に減少した。(RR=0.8295%CI0.76–0.89)• RRTの実施は、心停止率を有意に減少させた。 (RR0.65,95%CI0.61–0.70,p<0.001)(成人)
• 小児においても有意に減少した。(RR=0.6495%CI0.55–0.74)
22016/12/06 「CriticalCareoutreach」火曜勉強会より抜粋
Available online http://ccforum.com/content/13/5/313
Page 1 of 5(page number not for citation purposes)
AbstractUp to 17% of hospital admissions are complicated by seriousadverse events unrelated to the patients presenting medicalcondition. Rapid Response Teams (RRTs) review patients duringearly phase of deterioration to reduce patient morbidity and mortality.However, reports of the efficacy of these teams are varied. The aimsof this article were to explore the concept of RRT dose, to assesswhether RRT dose improves patient outcomes, and to assesswhether there is evidence that inclusion of a physician in the teamimpacts on the effectiveness of the team. A review of availableliterature suggested that the method of reporting RRT utilization rate,(RRT dose) is calls per 1,000 admissions. Hospitals with matureRRTs that report improved patient outcome following RRTintroduction have a RRT dose between 25.8 and 56.4 calls per1,000 admissions. Four studies report an association betweenincreasing RRT dose and reduced in-hospital cardiac arrest rates.Another reported that increasing RRT dose reduced in-hospitalmortality for surgical but not medical patients. The MERIT studyinvestigators reported a negative relationship between MET-likeactivity and the incidence of serious adverse events. Fourteenstudies reported improved patient outcome in association with theintroduction of a RRT, and 13/14 involved a Physician-led MET.These findings suggest that if the RRT is the major method forreviewing serious adverse events, the dose of RRT activation mustbe sufficient for the frequency and severity of the problem it isintended to treat. If the RRT dose is too low then it is unlikely toimprove patient outcomes. Increasing RRT dose appears to beassociated with reduction in cardiac arrests. The majority of studiesreporting improved patient outcome in association with theintroduction of an RRT involve a MET, suggesting that inclusion of aphysician in the team is an important determinant of its effectiveness.
IntroductionThere are many conditions in medicine for which there is arelationship between the dose of therapy given and theresponse to such therapy. This dose-response is seen inevery day practice in relation to diuretics for the treatment offluid overload, fluid therapy for volume depletion, catechol-amines for shock, and oxygen supplementation for hypoxemia.
Amounts of delivered therapy are also likely to be importantdeterminants of outcome for systems of care. Thus, nursestaffing levels have been shown to impact on rates ofcomplications in hospitalized patients [1,2], and outcomes ofcancer surgery are better in high volume institutions [3].
In this article, we briefly review the background to the role ofthe Rapid Response Team (RRT) in preventing seriousadverse events (SAEs) in hospitalized patients. We alsointroduce the concept of ‘RRT dose’, the number of RRTactivations per 1,000 admissions or discharges. In addition,we highlight possible differences in RRT composition thatmight indirectly affect ‘dose’, and stress the importance ofphysician inclusion in relation to the types of therapy the RRTcan deliver. Finally, we emphasize the importance of RRTdose in preventing SAEs in hospitalized patients.
The background to the Rapid Response TeamconceptMultiple studies around the world have demonstrated thatpatients admitted to hospitals suffer SAEs at a rate ofbetween 2.9% [4] and 17% [5] of cases. Such events maynot be directly related to the patient’s original diagnosis orunderlying medical condition. Of greater concern, theseevents may result in prolonged length of hospital stay, perma-nent disability, and even death in up to 10% of cases.
Other studies have shown that these events are frequentlypreceded by signs of physiological instability that manifest asderangements in commonly measured vital signs [6-9]. Suchderangements form the basis for RRT activation criteria usedin many hospitals.
When patients fulfill one or more criteria, ward staff activatethe RRT, which then reviews and treats the patient. The
ViewpointEffectiveness of the Medical Emergency Team: the importance ofdoseDaryl Jones1, Rinaldo Bellomo1 and Michael A DeVita2
1Department of Intensive Care, Austin Hospital, Studley Road, Heidelberg, VIC 3084, Australia2West Penn Allegheny Health System, Pittsburgh, PA, USA
Corresponding author: Daryl Jones, [email protected]
Published: 6 October 2009 Critical Care 2009, 13:313 (doi:10.1186/cc7996)This article is online at http://ccforum.com/content/13/5/313© 2009 BioMed Central Ltd
DNR = do not resuscitate; MERIT = Medical Early Response Intervention and Therapy; MET = Medical Emergency Team; RRS = Rapid ResponseSystem; RRT = Rapid Response Team; SAE = serious adverse event.
Ø 背景
• 医学において、実施された治療の容量とその治療への反応との間に関連性がある多くの状況がある。
– 体液過多に対する治療の利尿剤、 volume減少に対する輸
液療法、ショック時のカテコラミン、低酸素血症に対する酸素投与。
Ø 目的
• 入院患者の重篤な有害事象の予防におけるRRTの役割の背景をレビューする。
• 「RRT dose」の概念、つまり1,000入院または退院あたりのRRT介入数を紹介する。
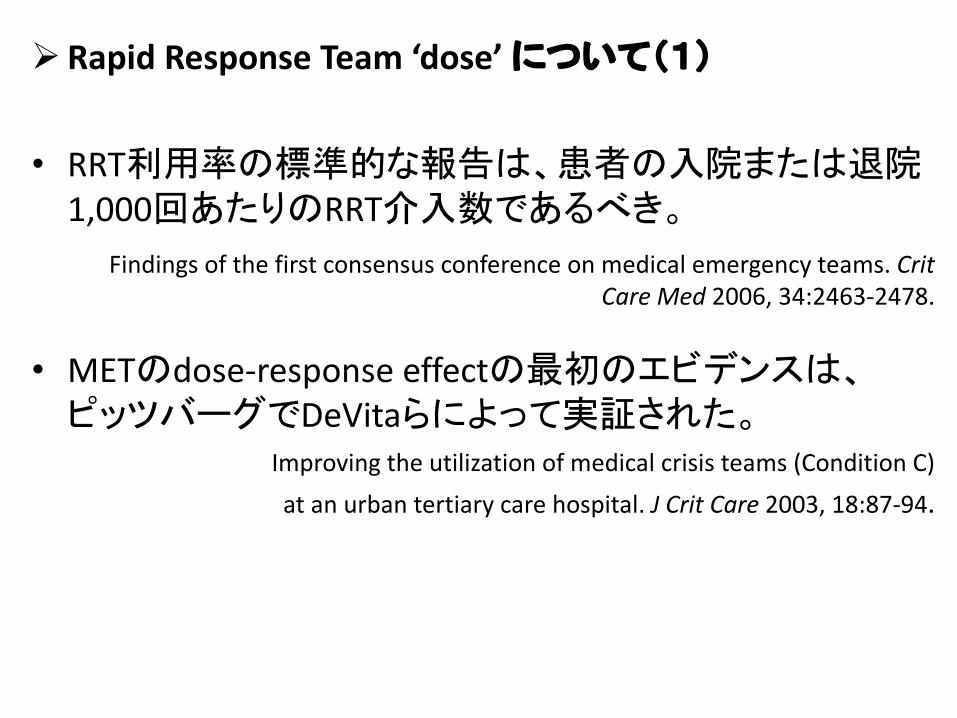
Ø RapidResponseTeam‘dose’について(1)
• RRT利用率の標準的な報告は、患者の入院または退院1,000回あたりのRRT介入数であるべき。
• METのdose-responseeffectの 初のエビデンスは、ピッツバーグでDeVitaらによって実証された。
Findingsofthefirstconsensusconferenceonmedicalemergencyteams.CritCareMed2006,34:2463-2478.
Improvingtheutilizationofmedicalcrisisteams(ConditionC)atanurbantertiarycarehospital.JCrit Care 2003,18:87-94.
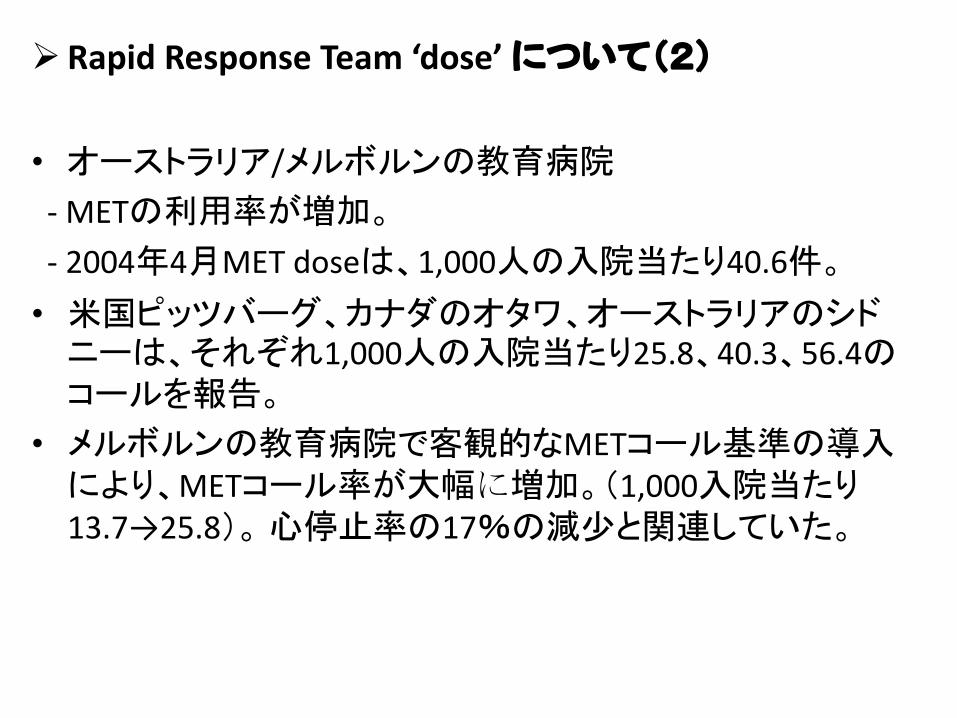
Ø RapidResponseTeam‘dose’について(2)
• オーストラリア/メルボルンの教育病院
- METの利用率が増加。
- 2004年4月MET doseは、1,000人の入院当たり40.6件。
• 米国ピッツバーグ、カナダのオタワ、オーストラリアのシドニーは、それぞれ1,000人の入院当たり25.8、40.3、56.4のコールを報告。
• メルボルンの教育病院で客観的なMETコール基準の導入により、METコール率が大幅に増加。(1,000入院当たり13.7→25.8)。 心停止率の17%の減少と関連していた。
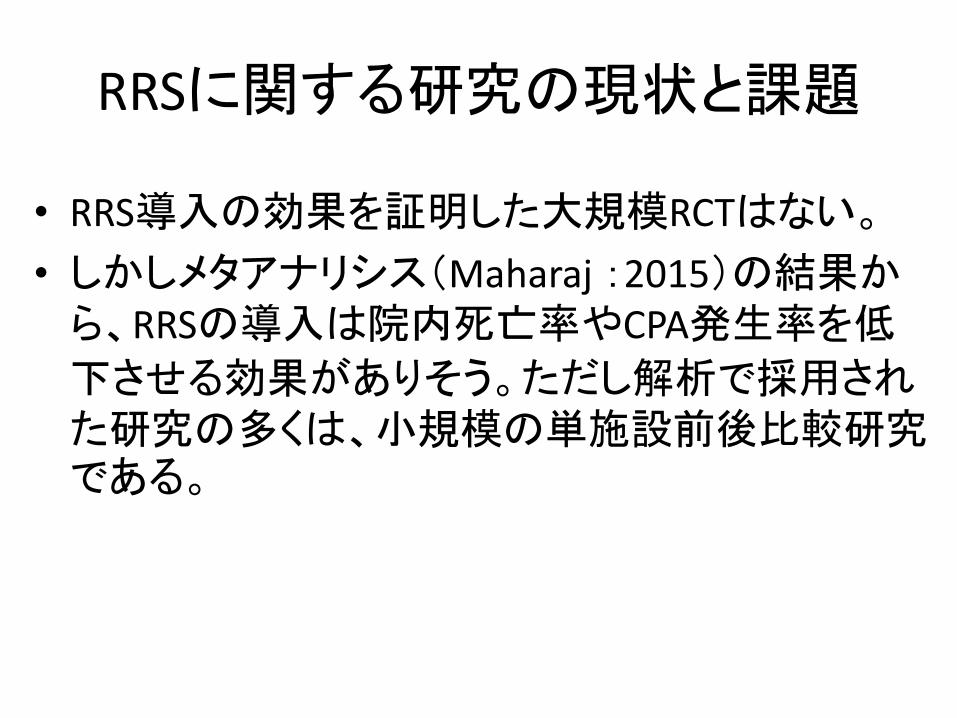
RRSに関する研究の現状と課題
• RRS導入の効果を証明した大規模RCTはない。
• しかしメタアナリシス(Maharaj :2015)の結果から、RRSの導入は院内死亡率やCPA発生率を低
下させる効果がありそう。ただし解析で採用された研究の多くは、小規模の単施設前後比較研究である。
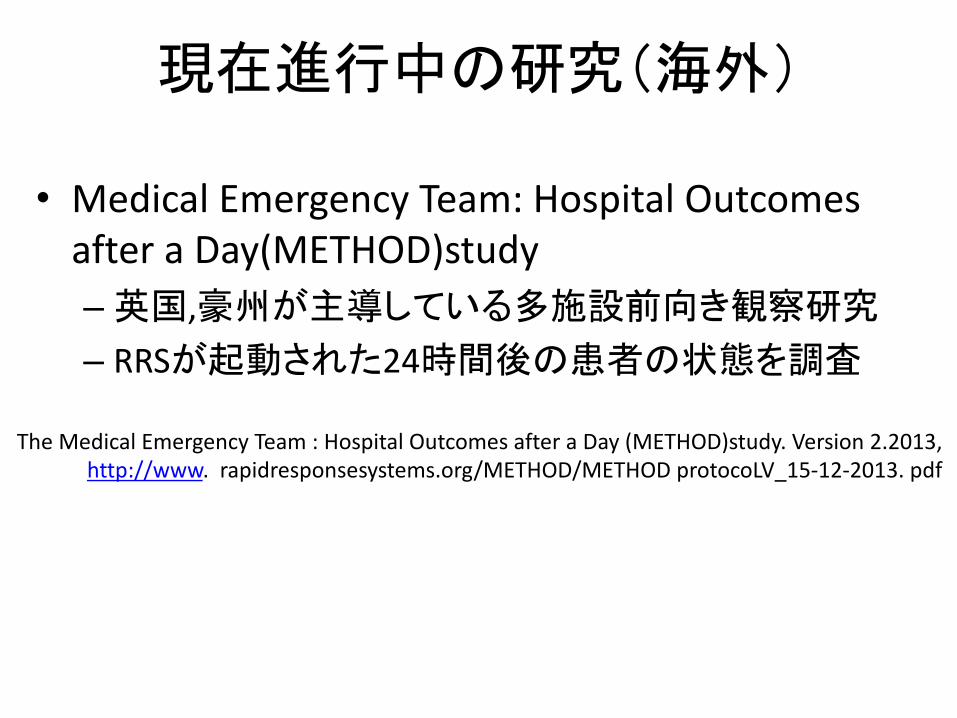
現在進行中の研究(海外)
• MedicalEmergencyTeam:HospitalOutcomesafteraDay(METHOD)study–英国,豪州が主導している多施設前向き観察研究
– RRSが起動された24時間後の患者の状態を調査
TheMedicalEmergencyTeam:HospitalOutcomesafteraDay(METHOD)study.Version2.2013,http://www. rapidresponsesystems.org/METHOD/METHODprotocoLV_15-12-2013.pdf

2. RRSに対する日本の取り組み(他施設と当院の現状)
RRSに対する日本の取り組み
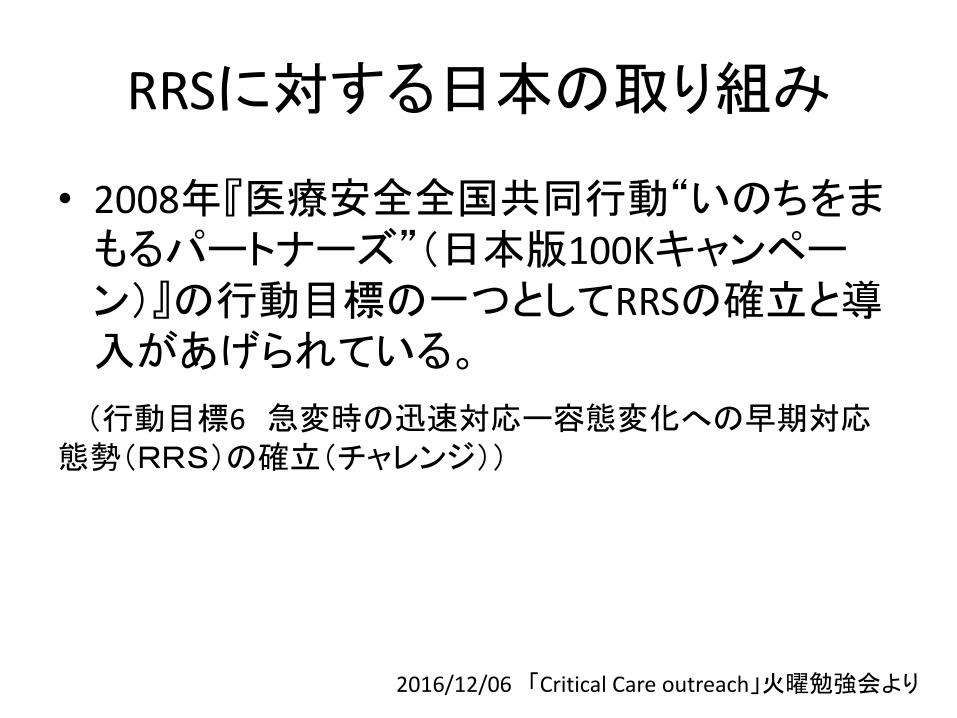
• 2008年『医療安全全国共同行動“いのちをまもるパートナーズ”(日本版100Kキャンペーン)』の行動目標の一つとしてRRSの確立と導入があげられている。
(行動目標6 急変時の迅速対応ー容態変化への早期対応態勢(RRS)の確立(チャレンジ))
22016/12/06 「CriticalCareoutreach」火曜勉強会より
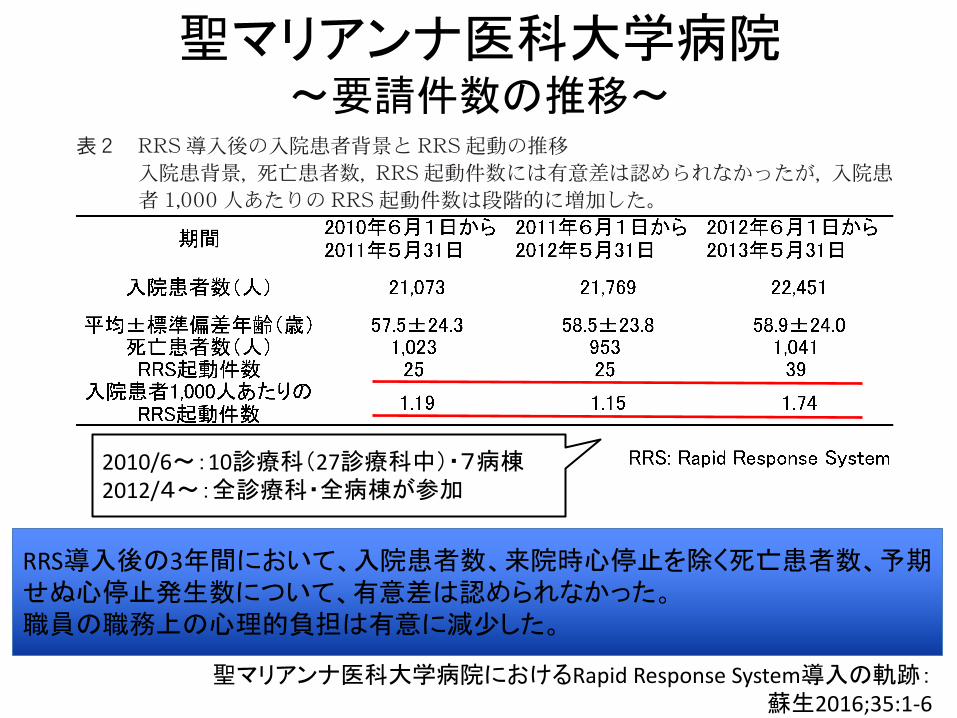
聖マリアンナ医科大学病院〜要請件数の推移〜
聖マリアンナ医科大学病院におけるRapid Response System導入の軌跡:蘇生2016;35:1-6
!"#$%#&'()*+,-./0123456!*
!"#$%&'()*+,-.+/0-12334567(.189:;<=>
!"#$%&'!()*+,-.*/0123"456
!"#$%&'()*+,-./01-213456
!"#"$%&'()*+,'-./01234567
!"#$%&'()*+,-./0123456789
!"#$%&'()*+,-./012$345678
!"#$%&'()*+,-./0123456278
!"#$%&'()*+,-./012345678"
!"#$%&'()*+,-./01234567!"!
!"#$%&'()*+,-./01234566789
!"#$%&'()*+,-./0123456789
!"#$%&'()*+,-./01234567
!"#$%&'()*+#,-#.&/)0#'+1"*023456786
!"#$%&'$()*+,-./01$%23$(4
!"#$%&'()*+,*-./0123.45067543895:
!"#$%%&'()*+,-./!"!"#$%&'()**+
!"#$%&'()*+,-./01234).567
!"#$%&'()*+,-!.$/01234!"!"
!"#$%&'(!"!"#$%&'()*+,-./0
!"#$%&'
!"#$%&'())*+,-./012-34567
!"#$%&'()*+,-./0(12345678
!"#$%&'()*+,-.,/012345678
!"#$!%&'()*+,-../01-234567
!"#$%&'()*+#,-.-/(01234567
!"#$%&'()*+,-./-012345678
!"#$%&'()*+,-./012345!678
!"#$%&'(%)*+,-)./0123456)
!"#$%&'()*+,"#-../01&23456
!"#$%&'$()*+,-.#/01234567
!"#$%&'()*+,-./
!"#$%&'()*+,-./0112#34567
!"#$%&'()*+,(-./0#1234!56
!"#$%&'()*+',-./012345678
!"#$%&'()*!+,-./012034567
!"#$%&'()*+,-)./012345067
!"#$%&'()*+,-./012344356789:3;<=>9
!"#"$%&%#'()*!+,-./0123456789
!"#$$%&'()*+,-./012345&67
!"#$%&'()*+,-./!"!"#$%&'()*+
!"#$%&$'()")*+,$'+(!$-!.)*)/!01234567!"#$%
!"#$%&'()*$*+%&'(%)"',-../)$01((,23 4 561!!"
!"#$%&'()*+,-./01!234,5./
!"#$%&'()*+,-./012%34)*+567
!"#$%&'()*+,-.!/012#345%67
!"#$%&'()*+,-./0()1"23.45
!"#$%&'()*+,-./012,$345678
!"#$%&'()*+,-./0123453678
!"#$%&'()!"!"#$%&'()#*+",-
!"#$%&'()*+,-./01234-567$
!"#$%&"'$!"!"#$%&'#()*+,-.
!"#$%$&'()*+,-./,012345$&
!"#$%&'()*+,-./0,1234567#
!"#$%&'()*+,-./(,0123&'45
!"#$%&'()*+,-./0123456789
!"#$%&'()*+,-./0123456789
!"#$%&'()*+,-./012345$67)
!"#$%&'())*+,-./012%34567
!"#$%&'()*+,-./012'34567#
!"#$%&'()*+,-
!"#$%&%'()*+,-./0-1234567
!"#$%!&'()*+,-./0123456789:;<
!!"#$%&'()*+,-./0121345%678
!"#$%&'()*+,-./01234$5678
!"#$%&'()*+,-./01234567
!"#"$%&'(()*+,-./01'2345
!"#$%&'()*+,-./0123456789
!"#$%&'()* !!"#
!"#!!"#$%&$'()*+,!!"-.&/0!!!"#$%&'()$*+',,-./0+1234526789:;<=>'"#$
!"#$$$%&'()**+,-./01234567'8
RRS導入後の3年間において、入院患者数、来院時心停止を除く死亡患者数、予期せぬ心停止発生数について、有意差は認められなかった。職員の職務上の心理的負担は有意に減少した。
2010/6〜:10診療科(27診療科中)・7病棟2012/4〜:全診療科・全病棟が参加
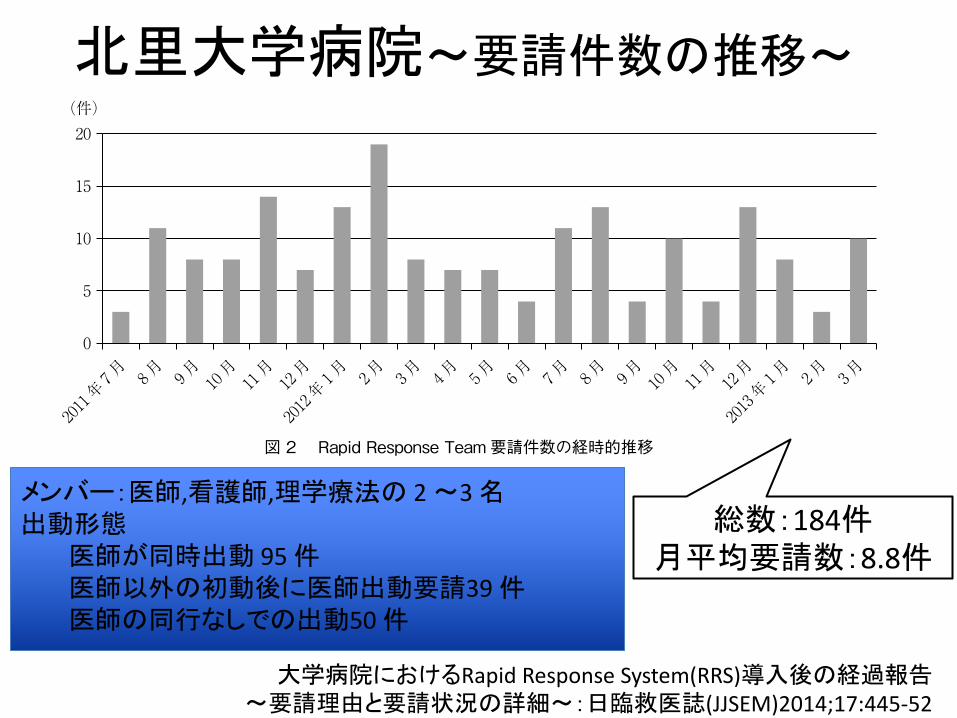
北里大学病院〜要請件数の推移〜
日臨救医誌(JJSEM)2014;17:445-52 447
大学病院でのRRS導入
方法,RRS は全職員で取り組まなくてはならないものであるということを周知する内容としている。要請時には医師,看護師,理学療法士からなる 2ないし 3名程度のチーム構成で出動する。医師同時出動を原則として目標にしているが,同時出動不可能な場合もある。しかし,先着RRTの評価の結果,直ちに救急・集中治療の専門医の診察が必要と判断された場合には,必ずRRTの医師が診察を行うようにしている。RRS の周知教育は,週 1回程度の講義を継続して行っている。
方 法
RRT要請記録は,要請直後に全ての症例において記録され,保管されている。内容は,要請日時,病棟,患者番号,年齢,性別,要請理由,要請者職種,出動したRRTの形体等の基本情報,要請から到着までの時間や介入時間,患者の状態,背景,評価,介入内容の詳細,患者予後を記録し,データベース化している。要請を受けた 184 件につき,2011 年 7 月からの RRT要請件数の推移を月別に比較した。要請者職種,要請理由(要請者が最も危機的と判断した 1つのみ)を調査した。さらにRRT到着時に該当していた要請基準(以下該当要請基準と略す)を調査した。該当要請基準はRRTが評価した。要請時に,対象に対して心肺蘇生をしない指示,すなわち do not attempt resuscitation(以下,DNAR)オーダーの有無とその要請後の変化を調査した。介入内容とその述べ件数を調査した。介入後転帰を調査した。また,RRS 講義受講者数の経時的推移を調査した。なお,当院においてのDNARオーダーは,1995年日本救急医学会救命救急法検討委員会による「DNR(do
not resuscitate)とは尊厳死の概念に相通じるもので,癌の末期,老衰,救命の可能性がない患者などで,本人または家族の希望で心肺蘇生法(CPR)を行わないことをいう。これに基づいて医師が指示する場合をDNR指示(do not resuscitate order)という」 7)との定義に基づいている。これは 2009 年に作成された日本救急医学会・医学用語解説集においては,“DNAR”の項で解説されている 8)。
結 果
図2に,RRT要請件数の経時的推移,図3に要請者内訳を示す。2013年 3月までに184件の要請があり,月間の平均要請数は8.8件であった。RRT要請件数に経時的な増減はなかった。要請者は看護師が最多で147件であり,次いで医師33件,理学療法士4件であった。RRTの出動形体は医師が同時出動した件数は95件,医師以外の初動後に医師出動要請した件数は39件,医師の同行なしでの出動が50件であった。
147
33
4
■ 看護師■ 医師■ 理学療法士
図 2 Rapid Response Team要請件数の経時的推移
図 3 Rapid Response Team要請者内訳(件数)
0
5
10
15
20(件)
2011 年7 月 8 月 9 月 10
月11月12月
2012 年1 月 2 月 3 月 4 月 5 月 6月 7月 8月 9月 10
月11月12月
2013 年1 月 2 月 3 月
総数:184件月平均要請数:8.8件
メンバー:医師,看護師,理学療法の 2〜3名出動形態
医師が同時出動 95件医師以外の初動後に医師出動要請39件医師の同行なしでの出動50件
大学病院におけるRapidResponseSystem(RRS)導入後の経過報告〜要請理由と要請状況の詳細〜:日臨救医誌(JJSEM)2014;17:445-52
北里大学病院〜要請内容〜
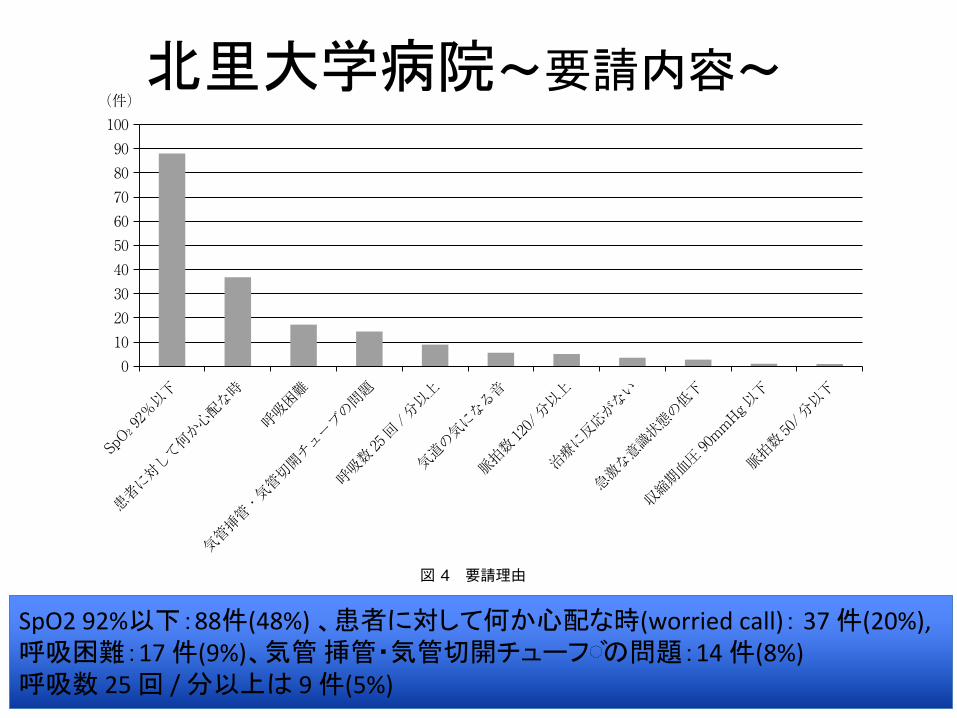
SpO292%以下:88件(48%)、患者に対して何か心配な時(worriedcall):37件(20%),呼吸困難:17件(9%)、気管挿管・気管切開チューフ◌゙の問題:14件(8%)呼吸数25回/分以上は9件(5%)
日臨救医誌(JJSEM)2014;17:445-52448
小池 朋孝,他
要請理由は,184件中 SpO2 92%以下が 88件(48%)と最多であった。患者に対して何か心配な時(worried call)は 37件(20%),呼吸困難は 17件(9%),気管挿管・気管切開チューブの問題は 14件(8%),呼吸数25回 /分以上は 9件(5%),気道の気になる音,脈拍数 120以上はそれぞれ 5件(3%)であった(図4)。RRT到着時の該当要請基準においては,SpO2 92%以下は 105件,呼吸数 25回 /分以上 75件,呼吸困難は 42件,気管挿管・気管切開チューブの問題は 19件,気道の気になる音は 34件,脈拍数 120/ 分以上は 17件であった(図5)。RRTの要請が行われている症例の
うち,DNARオーダーの症例は 37件(20%)であった。RRTの介入後にDNARオーダーとなった症例は 10件であった。介入内容は,吸引 103 件,酸素投与 68件,理学療法 40件,バッグ換気 25件,人工呼吸器の設定変更 25件と比較的軽度の呼吸療法にかかわる介入が多かった(図6)。RRT介入後,144 件は一般病棟で経過観察し,ICUへの緊急入室は 13件であった。27件は ICUからのコールであった。RRS 講義受講延べ人数は,2013 年 3 月の時点で約400 人に達した。定例開催の講義,勉強会により,受
図 4 要請理由
図 5 Rapid Response Team到着時該当要請基準(要請 1件につき複数項目あり)
0
100(件)
908070605040302010
SpO2 92%以下
患者に対して何か心配な時
呼吸困難
気管挿管・気管切開チューブの問題
呼吸数25回/ 分以上
気道の気になる音
脈拍数120/ 分以上
治療に反応がない
急激な意識状態の低下
収縮期血圧90mmHg以下
脈拍数50/分以下
0
120(件)
100
80
60
40
20
SpO2 92%以下
呼吸数25回/ 分以上
呼吸困難
患者に対して何か心配な時
気道の気になる音
挿管・気管切開チューブの問題
脈拍数120以上
収縮期血圧90mmHg以下
急激な意識状態の低下
治療に反応がない
急性の明らかな出血
呼吸数10回/ 分以下
尿量4時間で50ml 以下
脈拍数50/分以下
• 本邦において、「RRS」に関する報告を医中誌で検索すると、49件と少ない。
• また、経時的にRRSの推移を報告したものはほとんど見られなかった。
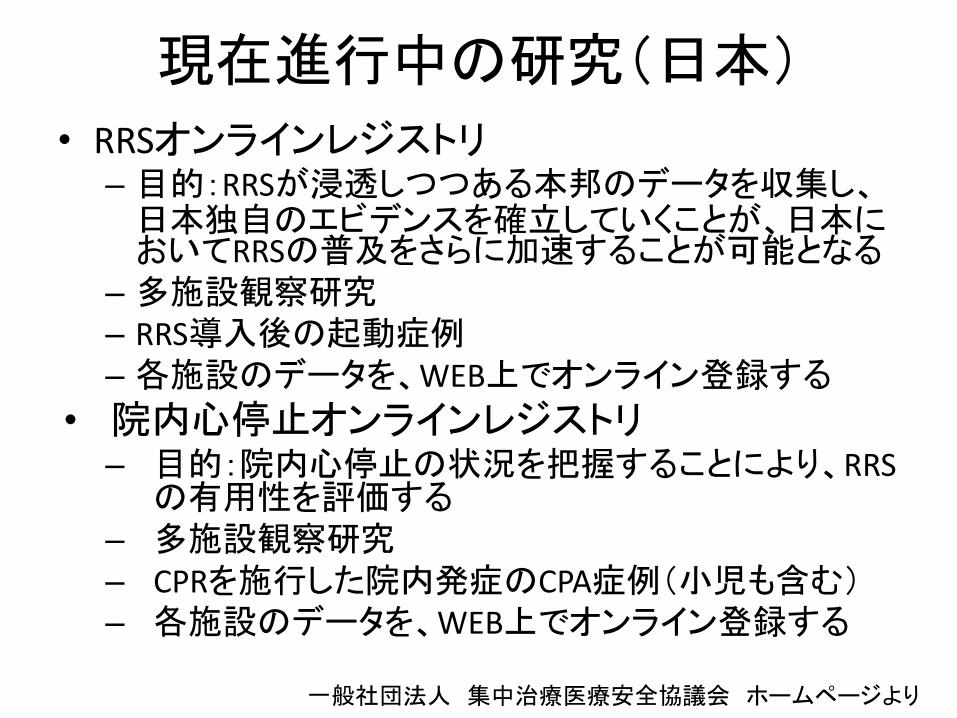
現在進行中の研究(日本)• RRSオンラインレジストリ– 目的:RRSが浸透しつつある本邦のデータを収集し、
日本独自のエビデンスを確立していくことが、日本においてRRSの普及をさらに加速することが可能となる
– 多施設観察研究– RRS導入後の起動症例– 各施設のデータを、WEB上でオンライン登録する
• 院内心停止オンラインレジストリ– 目的:院内心停止の状況を把握することにより、RRS
の有用性を評価する– 多施設観察研究– CPRを施行した院内発症のCPA症例(小児も含む)– 各施設のデータを、WEB上でオンライン登録する
一般社団法人 集中治療医療安全協議会 ホームページより

当院のRRSの推移
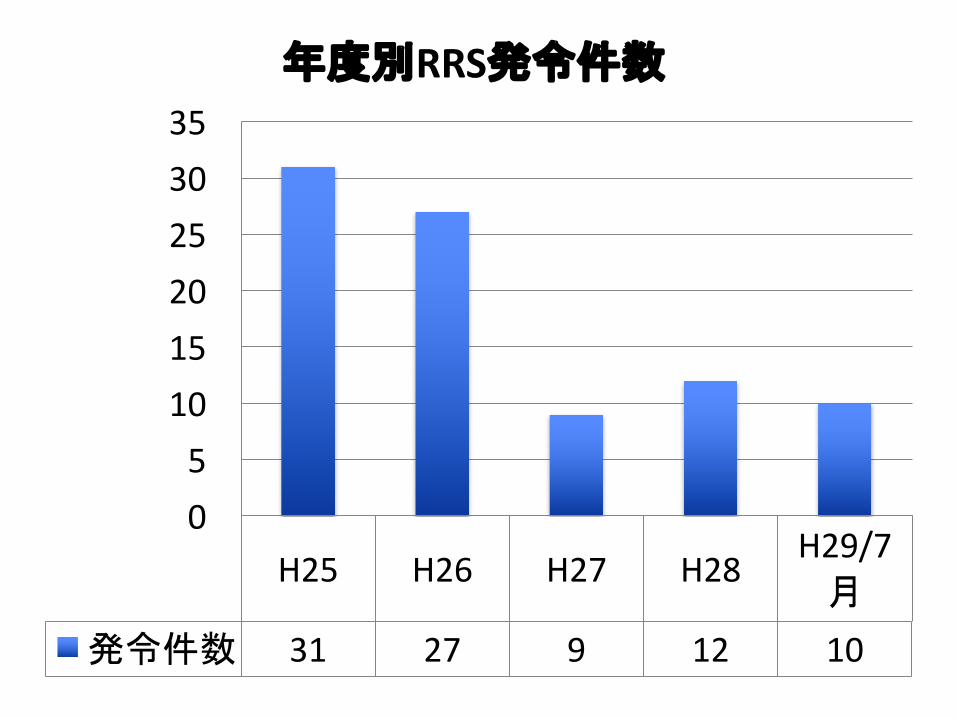
H25 H26 H27 H28H29/7
月
発令件数 31 27 9 12 10
05101520253035
年度別RRS発令件数
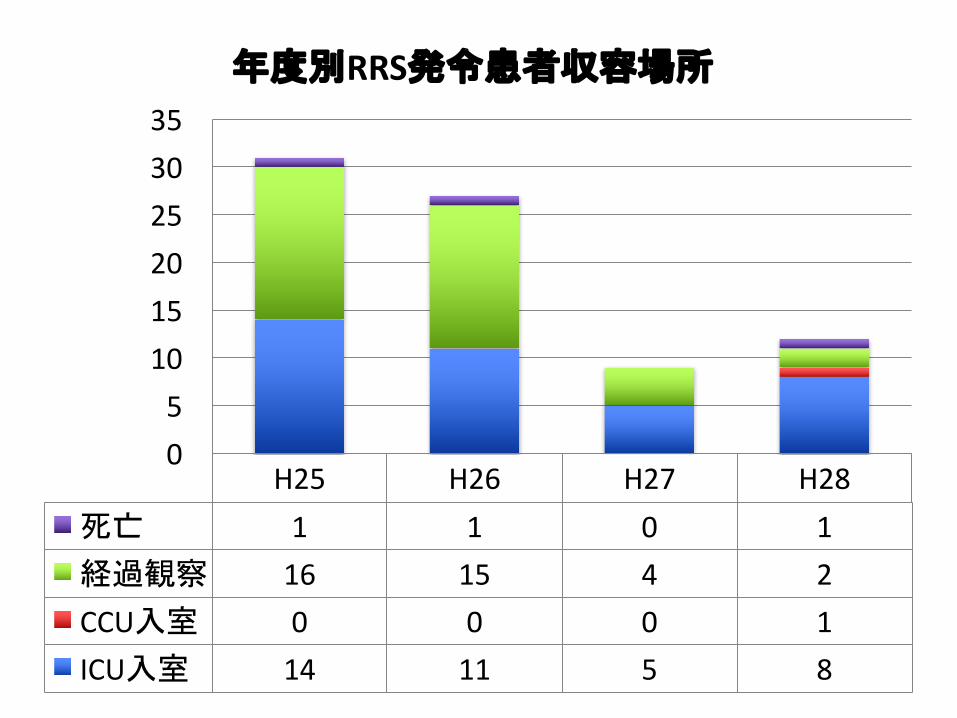
H25 H26 H27 H28死亡 1 1 0 1経過観察 16 15 4 2CCU入室 0 0 0 1ICU入室 14 11 5 8
05
101520253035
年度別RRS発令患者収容場所
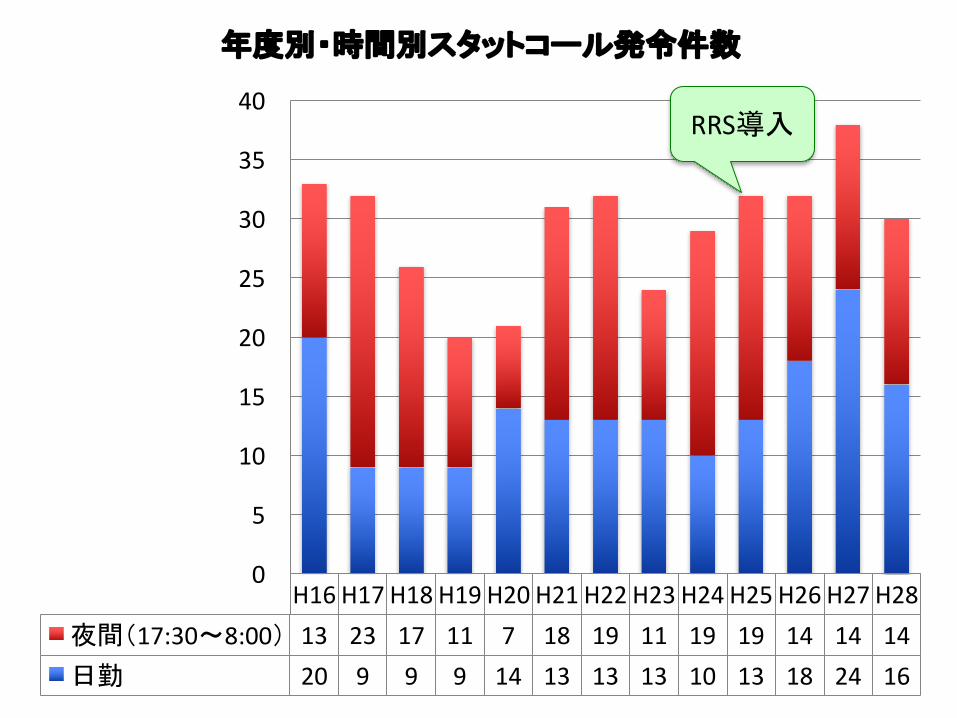
H16 H17 H18 H19 H20 H21 H22 H23 H24 H25 H26 H27 H28夜間(17:30〜8:00) 13 23 17 11 7 18 19 11 19 19 14 14 14日勤 20 9 9 9 14 13 13 13 10 13 18 24 16
0
5
10
15
20
25
30
35
40
年度別・時間別スタットコール発令件数
RRS導入
当院RRSの現状と課題
• H25年からRRSが導入されているが、開始2年目までは25〜30件/年の発令があったが、その後は10件/年、前後と発令数が少ない状況が続いている。
• RRS件数が顕著に低下したH27年度のスタットコールは約2割増であったが、H28年度は開始から11年間の平均28件/年とほぼ同程度であった。
• RRS周知に関する取り組み:ナースに対する勉強会(シミュレーション)を約3回/年とRRS・スタットコールフィードバックでのアピール。医療安全講習会。
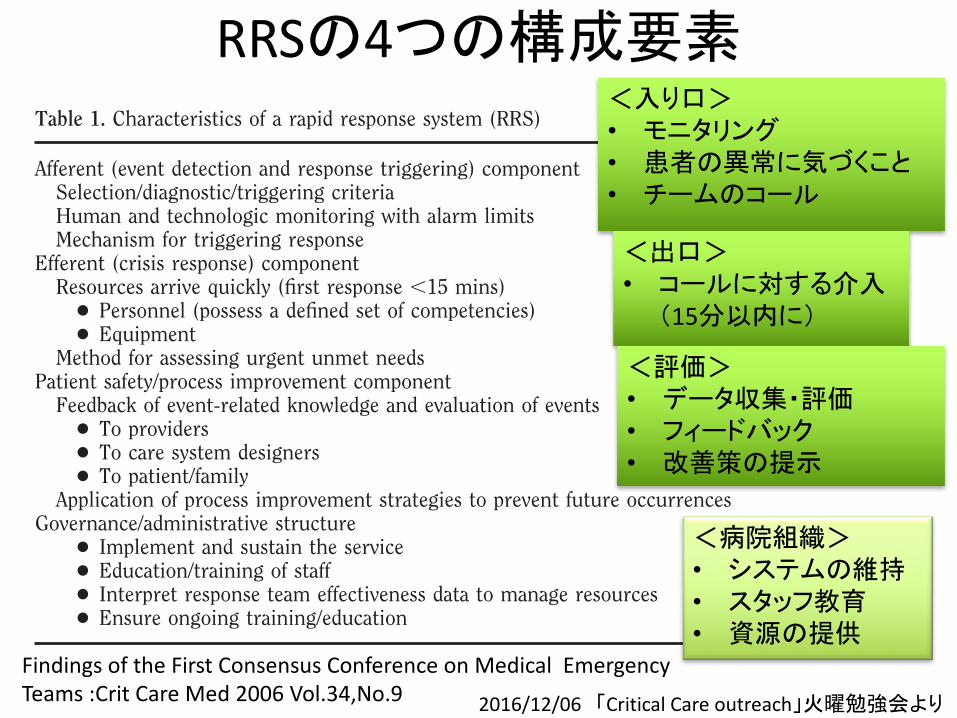
RRSの4つの構成要素
and case control studies (Hillman et al.,Resuscitation 2001, Hillman et al. 2002,Bellomo et al. 2003, Bellomo et al. 2004,Kause et al. 2004, Harrison GA). Evidenceof the incidence of in-hospital medicalemergencies can be derived from large ret-rospective epidemiologic studies of adverseevents, in-hospital cardiac arrests, emer-gency ICU admissions, and unexpecteddeaths (Bristow et al. 2000, Bellomo et al.2003, Bellomo et al. 2004).
Although all the studies demonstratethe occurrence of medical emergencies,they cannot provide an estimate of theincidence of in-hospital medical emer-gencies, for the following reasons: (1)none of the end points in these studieswas a “medical emergency” as definedabove, and regardless of definition, not allmedical emergencies progress to endpoints evaluated by these studies; (2) allof the studies employed retrospective de-signs; and (3) most of the studies wereconducted at a single institution, and theresults may not be generalizable.
What Is a MET Patient?
A MET patient is one who has deterio-rated, physiologically or psychologically(as described above), to the point that heor she is at risk of serious harm and there-fore urgently requires a clinical response.The MET patient requires a clinical re-sponse that is currently not being provided,creating a mismatch between the patient’sclinical condition and the resources pres-ent. A patient who is experiencing a medicalemergency may be identified by objectiveor subjective criteria. These include abnor-malities in vital signs, neurologic abnor-
malities (e.g., syncope, sudden weakness,delirium, or seizure), sudden-onset chestpain, or subjectively perceived risk of dete-rioration of the patient (Goldhill, White &Sumner 1999, Goldhill et al. 1999, Hillmanet al. 2002). The perceived risk of harm orimminent deterioration may exist withoutthe patient having abnormalities in vitalsigns that are routinely monitored (Hodgetts2002). A diverse set of clinical conditionsmay contribute to a patient experiencing amedical emergency. These include tradi-tional emergencies such as pulmonaryedema, asthma, respiratory distress, car-diac arrhythmias, stroke, hypovolemia, orhemorrhage but may also extend to arange of other conditions, which may in-clude acute psychiatric events and acuteneed for palliative care (DeVita 2004,Goldhill 1999). For the purposes of re-porting, authors should include their cri-sis criteria to help the reader understandthe patient population being described.In the future, it would be reasonable toassess the various identification criteriareported to determine whether a standardset is possible and desirable. No studies todate have compared the relative ability ofvarious criteria to identify patients at riskfor sudden death or patients most likelyto derive outcome benefit from a METintervention.
What Are the Characteristics ofRapid Response Systems?
Hospital systems must be able to detectand treat patients in crisis before adverseconsequences arise. We achieved consensusthat the new term Rapid Response System(RRS) be used to describe a whole system
(and not just the individual components ofthe system) for providing a safety net forpatients who suddenly become critically illand have a mismatch of needs and re-sources. There are four components of anRRS, discussed in detail below and in Table1. At a minimum, an RRS must have anafferent (case detection and response-triggering) limb and an efferent (medicalresponse) limb to attempt to prevent dete-rioration and must be available 24 hrs aday, 7 days a week. The reported character-istics of these two components appear tovary between different programs. Matureforms of RRS (irrespective of the effectorarm of the system) appear to share fourcommon elements. We acknowledge thatnot all models reported in the literatureappear to provide a complete and inte-grated system of all four components.
The term “Rapid Response System” (RRS)describes the entire system: the afferentand efferent limbs, as well as evaluative/process improvement and administrativelimbs. We recommend that the terms METand RRT be reserved for the efferent limbsof the RRS only. Given the preponderanceof studies using the term MET to describea response team that has “full” criticalcare capabilities, we endorse the idea thatthe term MET be used to describe re-sponse teams that have all of the follow-ing competencies: (1) ability to prescribetherapy; (2) advanced airway manage-ment skills; (3) capability to establishcentral vascular lines; and (4) ability tobegin an ICU level of care at the bedside.In most hospitals utilizing METs, theteam is physician-led. We propose thatthe term RRT be reserved for responseteams that do not have all these capabil-ities but instead use an intermediate or“ramp up” approach in which the re-sponse team rapidly assesses patientneeds, begins basic care to stabilize thepatient, and can rapidly triage patients toa safer care setting (like an ICU). Suchteams have the ability to call in otherresources to provide ICU-level care on anexpedited basis. We recognize that theterm RRT has been used in a variety ofways not limited to our more narrowdefinition. However, the use of standard-ized terminology will improve communi-cation and education.
Finally, the term CCO has been used toencompass RRSs but sometimes includingother activities. Most CCO teams reportedin the literature appear to function in amanner similar to our definition of an RRTbut also provide outreach to prospectivelyidentify and treat high-risk patients to pre-
Table 1. Characteristics of a rapid response system (RRS)
Afferent (event detection and response triggering) componentSelection/diagnostic/triggering criteriaHuman and technologic monitoring with alarm limitsMechanism for triggering response
Efferent (crisis response) componentResources arrive quickly (first response !15 mins)
● Personnel (possess a defined set of competencies)● Equipment
Method for assessing urgent unmet needsPatient safety/process improvement component
Feedback of event-related knowledge and evaluation of events● To providers● To care system designers● To patient/family
Application of process improvement strategies to prevent future occurrencesGovernance/administrative structure
● Implement and sustain the service● Education/training of staff● Interpret response team effectiveness data to manage resources● Ensure ongoing training/education
2465Crit Care Med 2006 Vol. 34, No. 9
<入り口>• モニタリング• 患者の異常に気づくこと• チームのコール
<出口>• コールに対する介入
(15分以内に)
<評価>• データ収集・評価• フィードバック• 改善策の提示
<病院組織>• システムの維持• スタッフ教育• 資源の提供
Findings of the First Consensus ConferenceonMedicalEmergencyTeams:Crit CareMed2006Vol.34,No.9 22016/12/06 「CriticalCareoutreach」火曜勉強会より
3. 入り口(Afferent component)について検討した論文紹介-2017年-

ORIGINAL CONTRIBUTION
Predicting Early Rapid Response TeamActivation in Patients Admitted From theEmergency Department: The PeRRT ScoreShawna D. Bellew, MD, Daniel Cabrera, MD, Christine M. Lohse, MS, andM. Fernanda Bellolio, MD, MS
ABSTRACT
Objectives: Rapid response teams (RRTs) respond to signs of deterioration to avoid morbidity and mortality.Early RRT activation (eRRT) in patients admitted from the emergency department (ED) is associated withsignificantly increased mortality. Predicting these events may represent an opportunity to identify patients whowould benefit from further resuscitation, aid disposition decision-making, or improve communication between EDand inpatient providers. We aimed to create a clinical prediction instrument to quantify the risk of eRRT.
Methods: We performed an observational cohort study of patients admitted to a non–intensive care unit (ICU)setting who triggered eRRT from January 2009 to December of 2012 compared to those who did not triggereRRT. Age, sex, ED vital sign measurements, and final ED diagnosis by ICD-9 code were evaluated in amultivariable logistic regression model. The performance of prediction models was assessed using discriminationsummarized by area under a receiver operating curve (AUC) and calibration with the Hosmer and Lemeshowgoodness-of-fit test. The final model was used to create a simplified scoring system.
Results: The eRRT group consisted of 474 patients who were compared to 2,575 patients in the referencegroup. Age and sex did not add significant discrimination to the model and were eliminated from the simplified,final model. This model, which included vital signs and diagnosis category, was found to have an AUC of 0.754(95% confidence interval [CI] = 0.730 to 0.778) and was used to create a simplified scoring system. The oddsratio for the association of a 1-unit increase in risk score with eRRT was 1.37 (95% CI = 1.32 to 1.41; p < 0.001).When internally validated, the score was found to have an AUC of 0.759 (95% CI = 0.735 to 0.753). Calculatedscores ranged from !3 to 18, which corresponded to predicted probabilities of eRRT ranging from 5.1% to72.2%.
Conclusions: In summary, the PeRRT score is a simple tool that can be referenced by emergency providers atthe bedside to quantify the risk of early RRT activation and potential deterioration, helping to answer thequestion, “How likely is my patient to trigger an RRT activation in the next twelve hours?” Given that patientswho trigger eRRT have an elevated risk of morbidity and mortality, higher scores should result in resuscitativeintervention, further observation in the ED, consideration of ICU admission, or direct enhanced communicationbetween ED and inpatient providers. A prospective multicenter study is required to further validate thisinstrument.
Rapid response teams (RRTs), also commonlyreferred to as medical emergency teams, are multi-
disciplinary groups of providers who respond to signs
of clinical deterioration, performing interventions toprevent morbidity and mortality and evaluating theneed for transfer to a higher level of care. The theory
From the Department of Emergency Medicine (SDB, DC, MFB), the Robert D. and Patricia E. Kern Center for the Science of Health Care Delivery(MFB), and the Division of Biomedical Statistics and Informatics (CML), Mayo Clinic, Rochester, MN.Received June 23, 2016; revision received August 25, 2016; accepted August 28, 2016.The authors have no relevant financial information or potential conflicts to disclose.Dr. Bellolio is a Scholar in the Mayo Clinic Kern Center for the Science of Health Care Delivery, Mayo Clinic, Rochester, MN.Supervising Editor: Jacob W. Ufberg, MD.Address for correspondence and reprints: Shawna D Bellew, MD; e-mail: [email protected] EMERGENCY MEDICINE 2017;24:216–225.
216ISSN 1069-6563PII ISSN 1069-6563583
© 2016 by the Society for Academic Emergency Medicinedoi: 10.1111/acem.13077
Ø 背景• earlywarningsignsの早期認識と早期RRT介入は、状態の悪化を防ぎ、
死亡率を下げる。• ICU入室の遅れは、死亡率の増加と関連している。• 救急入院で24時間以内のRRT介入の患者は、院内死亡率の4倍のリス
クがある。• 救急部からの入院直後に発令されるRRSは、しばしば入院病棟の配置エ
ラーもしくはICUベッドの不足であることが示唆されている。Ø 目的• 救急部からの入院症例で、12時間以内の早期RRT(eRRT)介入となるリ
スクを定量化する予測ツールを開発する。
behind RRTs rests on the belief that recognition ofearly warning signs, and therefore early intervention,can prevent decline and eventual death.Transfer to the intensive care unit (ICU) is the
result in 5% to 25% of RRT activations.1–4 Delayedadmission to the ICU has been associated withincreased mortality.5 Meanwhile, patients with RRTactivation within 24 hours of emergency department(ED) admission have been found to have a fourfoldincreased risk of in-hospital mortality.2,3 It has beensuggested that RRT activation, particularly those occur-ring soon after admission from the ED, is often theresult of initial disposition errors or scarcity of ICUbeds.6 Abnormal vital sign measurements taken in theED, particularly respiratory rates, have been shown tobe predictive of these events and perhaps can alsoherald a high risk of future deterioration.2,7
We set out to develop a clinical prediction instru-ment to quantify the risk of early RRT activationwithin 12 hours of admission from the ED (early acti-vation or eRRT) to a non-ICU setting, to identifywhich patients may benefit from admission to a moni-tored or intensive care setting or require further evalu-ation and stabilization in the ED prior to hospitaladmission.
METHODS
Study Design
We performed an observational cohort study,comparing patients who triggered eRRT activation(within 12 hours of admission) to those who did nottrigger eRRT, to determine which features were predic-tive of eRRT. The predictive features of eRRT werethen used to develop a model that estimates the proba-bility of eRRT based on final ED diagnosis and vitalsign abnormalities. The institutional review boardapproved the research protocol. We adhered to theSTROBE (Strengthening the Reporting of Observa-tional Studies in Epidemiology) guidelines for report-ing observational studies.8
Study Setting and PopulationThe study setting was the ED at the Mayo ClinicHospital, Saint Marys Campus, an academic tertiarycare center with an annual ED census of about 75,000patient visits. The medical center has 1,265 beds and200 ICU beds. Patients are admitted from the ED toeither a floor or an ICU. The ED cannot admit to
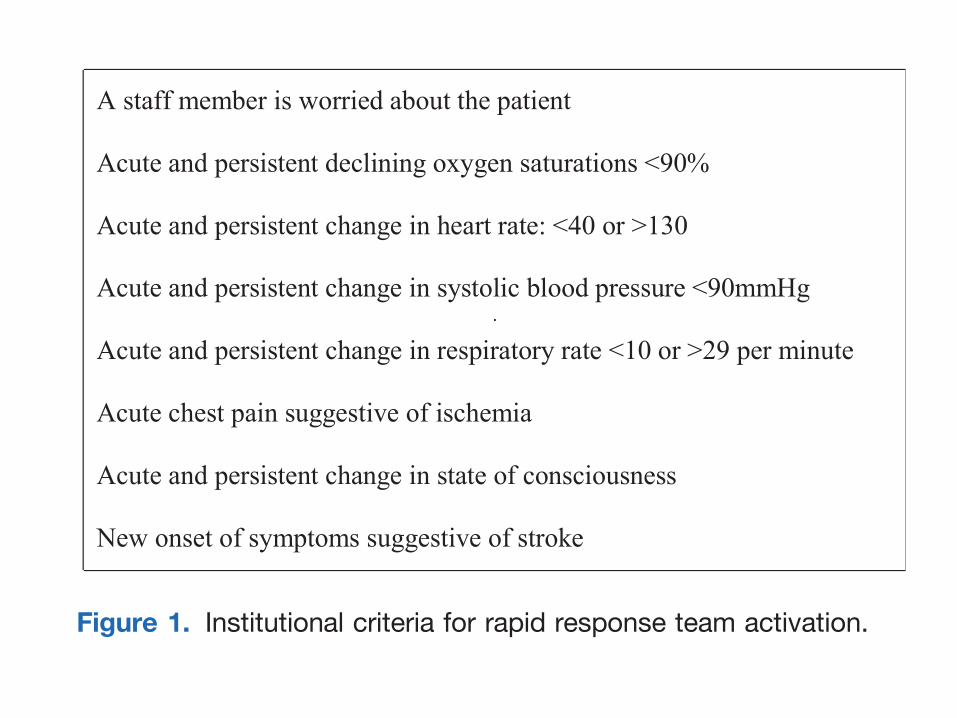
progressive care (step-down) units. RRTs were initiallyimplemented in 2006 and the team responding tothese calls consists of a critical care physician, ICUnurses, and respiratory therapists. The institutionalRRT criteria are shown in Figure 1.The eRRT cohort included all consecutive adult
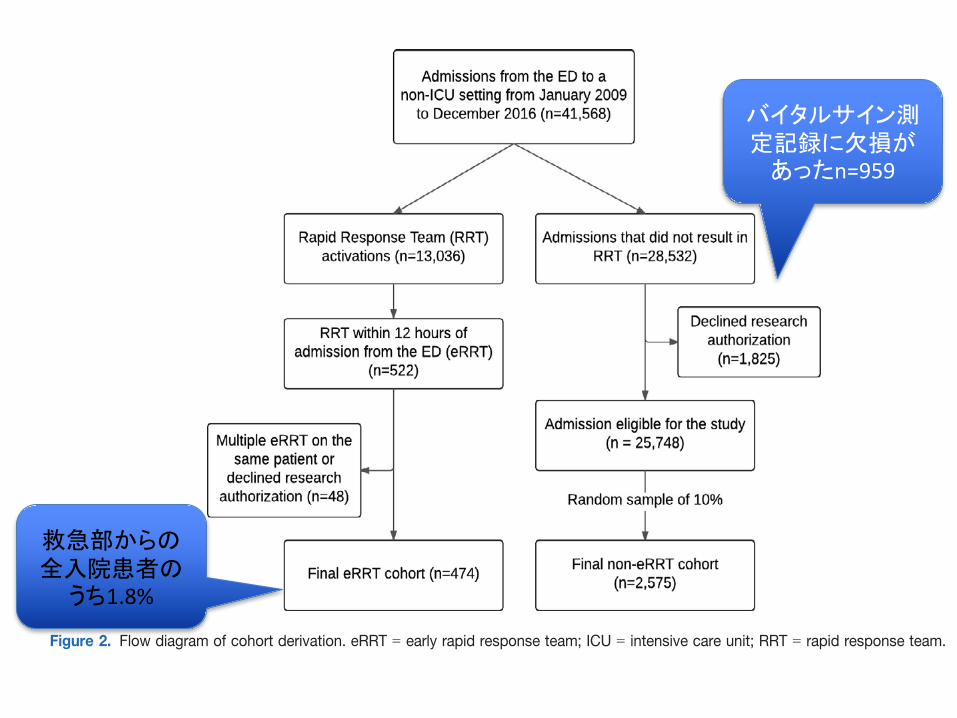
patients who were admitted to a non-ICU setting fromthe ED who triggered a RRT within 12 hours ofadmission (eRRT) from January 2009 to December2012. The eRRT cohort data were originally collectedfor a previous study, which was foundational to thiswork and has been previously reported.7 The referencecohort consisted of a random sample of 10% of allconsecutive patients admitted to a non-ICU settingfrom the ED during the same period who did nottrigger eRRT.Patients were excluded if they were admitted to the
ICU, were directly admitted to the hospital (withoutan ED visit), or were dismissed home from the ED.Patients under the age of 18 as well as those who didnot consent to having their medical records reviewedfor research purposes were also excluded.The random sample was selected by assigning each
patient a random number generated using SAS soft-ware blinded to ED diagnosis and vital signs, sortingthe cohort by this number, and selecting the first10%.
Data Measures and AnalysisVital sign measurements (first and last set of vitalsigns recorded in the ED), ED final diagnoses, age,and sex were extracted from the electronic medicalrecord by a data quality analyst. Data were extractedinto a Microsoft Excel (Microsoft Corp.) spreadsheet.Statistical analyses were performed by a biostatisticianusing version 9.3 of the SAS software package
ood pressure <90mmHg
A staff member is worried about the patient
Acute and persistent declining oxygen saturations <90%
Acute and persistent change in heart rate: <40 or >130
Acute and persistent change in systolic bl
Acute and persistent change in respiratory rate <10 or >29 per minute
Acute chest pain suggestive of ischemia
Acute and persistent change in state of consciousness
New onset of symptoms suggestive of stroke
Figure 1. Institutional criteria for rapid response team activation.
ACADEMIC EMERGENCY MEDICINE • February 2017, Vol. 24, No. 2 • www.aemj.org 217
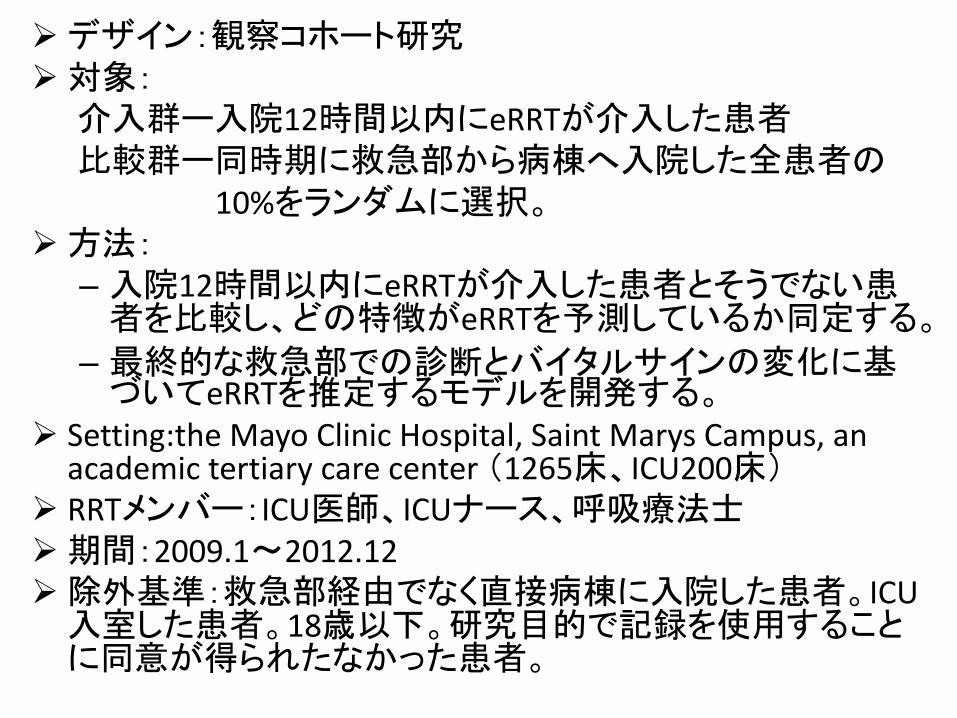
Ø デザイン:観察コホート研究Ø 対象:
介入群ー入院12時間以内にeRRTが介入した患者比較群ー同時期に救急部から病棟へ入院した全患者の
10%をランダムに選択。Ø 方法:– 入院12時間以内にeRRTが介入した患者とそうでない患
者を比較し、どの特徴がeRRTを予測しているか同定する。
– 終的な救急部での診断とバイタルサインの変化に基づいてeRRTを推定するモデルを開発する。
Ø Setting:the MayoClinicHospital,SaintMarys Campus,anacademictertiarycarecenter(1265床、ICU200床)
Ø RRTメンバー:ICU医師、ICUナース、呼吸療法士Ø 期間:2009.1〜2012.12Ø 除外基準:救急部経由でなく直接病棟に入院した患者。ICU
入室した患者。18歳以下。研究目的で記録を使用することに同意が得られたなかった患者。
behind RRTs rests on the belief that recognition ofearly warning signs, and therefore early intervention,can prevent decline and eventual death.Transfer to the intensive care unit (ICU) is the
result in 5% to 25% of RRT activations.1–4 Delayedadmission to the ICU has been associated withincreased mortality.5 Meanwhile, patients with RRTactivation within 24 hours of emergency department(ED) admission have been found to have a fourfoldincreased risk of in-hospital mortality.2,3 It has beensuggested that RRT activation, particularly those occur-ring soon after admission from the ED, is often theresult of initial disposition errors or scarcity of ICUbeds.6 Abnormal vital sign measurements taken in theED, particularly respiratory rates, have been shown tobe predictive of these events and perhaps can alsoherald a high risk of future deterioration.2,7
We set out to develop a clinical prediction instru-ment to quantify the risk of early RRT activationwithin 12 hours of admission from the ED (early acti-vation or eRRT) to a non-ICU setting, to identifywhich patients may benefit from admission to a moni-tored or intensive care setting or require further evalu-ation and stabilization in the ED prior to hospitaladmission.
METHODS
Study Design
We performed an observational cohort study,comparing patients who triggered eRRT activation(within 12 hours of admission) to those who did nottrigger eRRT, to determine which features were predic-tive of eRRT. The predictive features of eRRT werethen used to develop a model that estimates the proba-bility of eRRT based on final ED diagnosis and vitalsign abnormalities. The institutional review boardapproved the research protocol. We adhered to theSTROBE (Strengthening the Reporting of Observa-tional Studies in Epidemiology) guidelines for report-ing observational studies.8
Study Setting and PopulationThe study setting was the ED at the Mayo ClinicHospital, Saint Marys Campus, an academic tertiarycare center with an annual ED census of about 75,000patient visits. The medical center has 1,265 beds and200 ICU beds. Patients are admitted from the ED toeither a floor or an ICU. The ED cannot admit to
progressive care (step-down) units. RRTs were initiallyimplemented in 2006 and the team responding tothese calls consists of a critical care physician, ICUnurses, and respiratory therapists. The institutionalRRT criteria are shown in Figure 1.The eRRT cohort included all consecutive adult
patients who were admitted to a non-ICU setting fromthe ED who triggered a RRT within 12 hours ofadmission (eRRT) from January 2009 to December2012. The eRRT cohort data were originally collectedfor a previous study, which was foundational to thiswork and has been previously reported.7 The referencecohort consisted of a random sample of 10% of allconsecutive patients admitted to a non-ICU settingfrom the ED during the same period who did nottrigger eRRT.Patients were excluded if they were admitted to the
ICU, were directly admitted to the hospital (withoutan ED visit), or were dismissed home from the ED.Patients under the age of 18 as well as those who didnot consent to having their medical records reviewedfor research purposes were also excluded.The random sample was selected by assigning each
patient a random number generated using SAS soft-ware blinded to ED diagnosis and vital signs, sortingthe cohort by this number, and selecting the first10%.
Data Measures and AnalysisVital sign measurements (first and last set of vitalsigns recorded in the ED), ED final diagnoses, age,and sex were extracted from the electronic medicalrecord by a data quality analyst. Data were extractedinto a Microsoft Excel (Microsoft Corp.) spreadsheet.Statistical analyses were performed by a biostatisticianusing version 9.3 of the SAS software package
ood pressure <90mmHg
A staff member is worried about the patient
Acute and persistent declining oxygen saturations <90%
Acute and persistent change in heart rate: <40 or >130
Acute and persistent change in systolic bl
Acute and persistent change in respiratory rate <10 or >29 per minute
Acute chest pain suggestive of ischemia
Acute and persistent change in state of consciousness
New onset of symptoms suggestive of stroke
Figure 1. Institutional criteria for rapid response team activation.
ACADEMIC EMERGENCY MEDICINE • February 2017, Vol. 24, No. 2 • www.aemj.org 217
summarized in Table 3. Predicted probabilities basedon risk score ranged from 0.051 to 0.722 (or 5.1%to 72.2%). The distribution of patients in the deriva-tion cohort by risk score as well as the predictedprobability of eRRT by risk score are illustrated inFigure 5.
DISCUSSION
The PeRRT score is a vital signs and diagnosis basedtool designed to be used at the bedside to quantify therisk of eRRT activation and to aid in the complexdecision making related to disposition of patients. Forexample, a patient with an ED diagnosis of pneumo-nia (+5) and a final heart rate in the ED of 110 (+3)would have a PeRRT score of 8 and therefore an esti-mated 50% risk of RRT activation in the first12 hours after admission. This information could betaken into consideration by the physician when decid-ing disposition. In particular, in response to scores of8 or greater, we recommend emergency providerseither admit the patient to a higher level of care, pro-vide further resuscitation, continue to observe thepatient in the ED, or discuss the risk of deteriorationwith the admitting team. The threshold score foradmission to a higher level of care would be deter-mined by the availability of beds, provider risk
tolerance, and institutional culture, practices andguidelines.Studies have long demonstrated that patients show
objective signs of deterioration hours before cardiacarrest.10–12 Unfortunately, these signs may be difficultto recognize and therefore represent missed opportuni-ties to provide potentially corrective, resuscitative care.For this reason, rapid response systems were devel-oped and implemented throughout the world. Whileearly individual studies regarding the effect of RRTimplementation on cardiac arrests and mortality werepromising, with associated decreases in the rate of car-diac arrest and mortality,13–16 later systematic reviewsand meta-analyses revealed mixed results.17–21
Common RRT trigger criteria include provider con-cern, changes in mental status, chest pain, bleeding,and vital signs deviations. If a patient meets any singlecriterion, any care provider can summon the RRT tothe bedside to evaluate the patient. Another methodof identifying patients at risk for deterioration is com-monly employed in the United Kingdom, where earlywarning systems (EWS) that aggregate multiple datapoints have been developed for this purpose.22
It has been suggested that unexpected ICU transfersas well as RRT activations, particularly those thatoccur soon after admission, are often the result of dis-position errors or failure to resuscitate in the
Figure 2. Flow diagram of cohort derivation. eRRT = early rapid response team; ICU = intensive care unit; RRT = rapid response team.
ACADEMIC EMERGENCY MEDICINE • February 2017, Vol. 24, No. 2 • www.aemj.org 219
救急部からの全入院患者の
うち1.8%
バイタルサイン測定記録に欠損が
あったn=959
ED.6,23,24 These patients have significantly worse out-comes than patients with similar illness severity who areadmitted directly to the ICU.5 Therefore, we set out todevelop a tool that could be used to help cliniciansquantify the risk of eRRT and associated potential deteri-oration and therefore preempt it by admitting high-risk
patients to a higher level of care or proceeding with addi-tional resuscitation in the ED.Retrospective studies thus far have come to hetero-
geneous conclusions, identifying abnormal tempera-ture, respiratory rate, diastolic blood pressure, andheart rate as possible predictors of eRRT activation.2,25
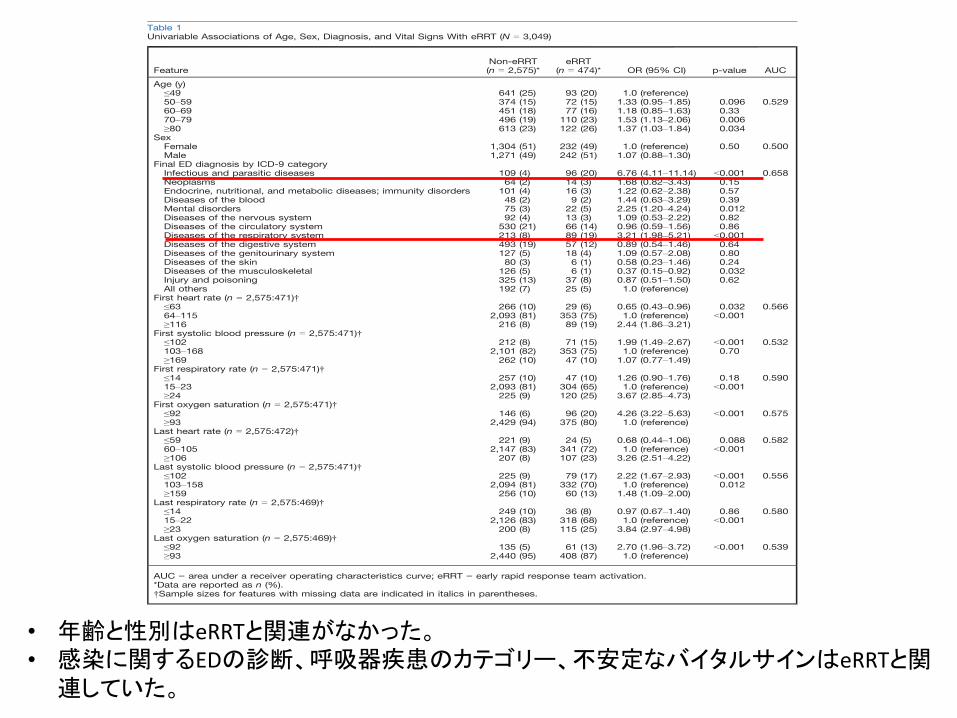
Table 1Univariable Associations of Age, Sex, Diagnosis, and Vital Signs With eRRT (N = 3,049)
FeatureNon-eRRT(n = 2,575)*
eRRT(n = 474)* OR (95% CI) p-value AUC
Age (y)≤49 641 (25) 93 (20) 1.0 (reference)50–59 374 (15) 72 (15) 1.33 (0.95–1.85) 0.096 0.52960–69 451 (18) 77 (16) 1.18 (0.85–1.63) 0.3370–79 496 (19) 110 (23) 1.53 (1.13–2.06) 0.006≥80 613 (23) 122 (26) 1.37 (1.03–1.84) 0.034
SexFemale 1,304 (51) 232 (49) 1.0 (reference) 0.50 0.500Male 1,271 (49) 242 (51) 1.07 (0.88–1.30)
Final ED diagnosis by ICD-9 categoryInfectious and parasitic diseases 109 (4) 96 (20) 6.76 (4.11–11.14) <0.001 0.658Neoplasms 64 (2) 14 (3) 1.68 (0.82–3.43) 0.15Endocrine, nutritional, and metabolic diseases; immunity disorders 101 (4) 16 (3) 1.22 (0.62–2.38) 0.57Diseases of the blood 48 (2) 9 (2) 1.44 (0.63–3.29) 0.39Mental disorders 75 (3) 22 (5) 2.25 (1.20–4.24) 0.012Diseases of the nervous system 92 (4) 13 (3) 1.09 (0.53–2.22) 0.82Diseases of the circulatory system 530 (21) 66 (14) 0.96 (0.59–1.56) 0.86Diseases of the respiratory system 213 (8) 89 (19) 3.21 (1.98–5.21) <0.001Diseases of the digestive system 493 (19) 57 (12) 0.89 (0.54–1.46) 0.64Diseases of the genitourinary system 127 (5) 18 (4) 1.09 (0.57–2.08) 0.80Diseases of the skin 80 (3) 6 (1) 0.58 (0.23–1.46) 0.24Diseases of the musculoskeletal 126 (5) 6 (1) 0.37 (0.15–0.92) 0.032Injury and poisoning 325 (13) 37 (8) 0.87 (0.51–1.50) 0.62All others 192 (7) 25 (5) 1.0 (reference)
First heart rate (n = 2,575:471)†≤63 266 (10) 29 (6) 0.65 (0.43–0.96) 0.032 0.56664–115 2,093 (81) 353 (75) 1.0 (reference) <0.001≥116 216 (8) 89 (19) 2.44 (1.86–3.21)
First systolic blood pressure (n = 2,575:471)†≤102 212 (8) 71 (15) 1.99 (1.49–2.67) <0.001 0.532103–168 2,101 (82) 353 (75) 1.0 (reference) 0.70≥169 262 (10) 47 (10) 1.07 (0.77–1.49)
First respiratory rate (n = 2,575:471)†≤14 257 (10) 47 (10) 1.26 (0.90–1.76) 0.18 0.59015–23 2,093 (81) 304 (65) 1.0 (reference) <0.001≥24 225 (9) 120 (25) 3.67 (2.85–4.73)
First oxygen saturation (n = 2,575:471)†≤92 146 (6) 96 (20) 4.26 (3.22–5.63) <0.001 0.575≥93 2,429 (94) 375 (80) 1.0 (reference)
Last heart rate (n = 2,575:472)†≤59 221 (9) 24 (5) 0.68 (0.44–1.06) 0.088 0.58260–105 2,147 (83) 341 (72) 1.0 (reference) <0.001≥106 207 (8) 107 (23) 3.26 (2.51–4.22)
Last systolic blood pressure (n = 2,575:471)†≤102 225 (9) 79 (17) 2.22 (1.67–2.93) <0.001 0.556103–158 2,094 (81) 332 (70) 1.0 (reference) 0.012≥159 256 (10) 60 (13) 1.48 (1.09–2.00)
Last respiratory rate (n = 2,575:469)†≤14 249 (10) 36 (8) 0.97 (0.67–1.40) 0.86 0.58015–22 2,126 (83) 318 (68) 1.0 (reference) <0.001≥23 200 (8) 115 (25) 3.84 (2.97–4.98)
Last oxygen saturation (n = 2,575:469)†≤92 135 (5) 61 (13) 2.70 (1.96–3.72) <0.001 0.539≥93 2,440 (95) 408 (87) 1.0 (reference)
AUC = area under a receiver operating characteristics curve; eRRT = early rapid response team activation.*Data are reported as n (%).†Sample sizes for features with missing data are indicated in italics in parentheses.
220 Bellew et al. • PeRRT Score
• 年齢と性別はeRRTと関連がなかった。• 感染に関するEDの診断、呼吸器疾患のカテゴリー、不安定なバイタルサインはeRRTと関
連していた。
instrument has a similar predictive accuracy(AUC = 0.76) to existing EWS, while having theadvantage of being designed specifically to be imple-mented at the bedside by emergency clinicians whencontemplating patient disposition.
LIMITATIONS
There are several limitations to our study. First, this isa single-center study from a large academic center,which is particularly relevant because every center hasvariations in ICU bed availability, RRT criteria, prac-tice culture, and resource allocation. Therefore, exter-nal validation would strengthen the utility of our tool.The use of medical records and ICD-9 codes has vul-nerability due to miscoding, missing data, and dataentry errors.Further, the outcome that our tool is designed to
predict is eRRT, which acts as a surrogate marker ofpatients who are at risk for deterioration. This couldlead to overtriage of patients to the ICU since a por-tion of patients who trigger RRT are not transferred tothe ICU (38% in our population).While it stands to reason that immediate RRT after
admission to a floor setting would indicate an oppor-tunity for improvement in triage, communication, orresuscitation, it is unclear if and to what degree thesame is true of early RRT. While previous studieshave primarily used a cutoff of 24 hours, we felt thatisolating our study to even earlier RRT activationswould increase the likelihood that these events wererepresentative of a true opportunity for improvement.
The most ideal cutoff to define early RRT remainsunknown.Our analysis was limited in its scope given that
we studied the relationship of age, sex, diagnosis(broadly defined into categories based on the WorldHealth Organization classification), and ED vitalsigns with eRRT. There are additional opportunitiesto enhance the model by studying the utility of add-ing additional data points such as laboratory results(i.e., lactate or white blood cell count), specific diag-nosis (i.e., hemorrhage or seizure), or specific comor-bidities.Finally, we did not compare the performance of our
tool to provider gestalt or assess the incremental valueof the addition of this tool to provider gestalt for pre-dicting eRRT. While it may be that provider gestalt isequal or superior to the PeRRT score for predictingeRRT, as has been shown to be true with other well-known clinical decision aids,28,29 evidence of suchsuperiority would not invalidate the utility of the toolfor several reasons.Clinical prediction instruments such as this one
would remain particularly useful for inexperienced pro-viders, who have yet to develop a sense of whichpatients at their institution will trigger eRRT. If imple-mented as an alert or an available data point in theelectronic environment, the score could serve as anextra signal to heighten awareness of patients at riskfor deterioration and cognitively offloading providersas well as acting as a safeguard. This approach hasbeen implemented successfully for improving sepsiscare in the ED setting.30 The benefit of such an alert
0
0.1
0.2
0.3
0.4
0.5
0.6
0.7
0.8
≤ -1 0 1 2 3 4 5 6 7 8 9 10 ≥ 11PeRRT Score
Predicted Probability of eRRT and Patient Distribution by eRRT Score
Predicted probability of eRRT by score
Percentage of patients by score
Figure 5. Predicted probability of eRRT and distribution of patients by score (n = 3,043). eRRT = early rapid response team. [Color figurecan be viewed at wileyonlinelibrary.com]
ACADEMIC EMERGENCY MEDICINE • February 2017, Vol. 24, No. 2 • www.aemj.org 223
could not evaluate the ability of age, sex, or diagnosisto predict eRRT. With PeRRT, we compared theeRRT cohort to a large randomly selected controlgroup and modified the method of abstracting the“final diagnosis” from chart review to the use of
ICD-9 codes and standardized classifications. Thismethod was felt to be more convenient, reliable, andreflective of existing literature.2,26
Existing aggregate EWSs vary widely in accuracywith AUCs varying from 0.61 to 0.84.22 Notably,existing tools were developed to predict various end-points, primarily ICU admission as opposed to RRT,as in the case of our tool. Further, these systems havebeen primarily studied in admitted patients, asopposed to using ED data. Therefore, these scoringsystems when applied to an ED population may fail toidentify critically ill patients.27 Our prediction
Add together the intercept and any features that apply and calculate x.The predicted probability of eRRT activation is defined as ex / ( 1 + ex ).
Example 1: A patient with a disease of the musculoskeletal system and connective tissue and no extreme vital signs:
x = −2.6074 − 1.1406 = −3.7480Predicted probability of eRRT activation = 0.023.
Example 2: A patient with an infectious and parasitic disease and the extreme vital signs of last heart rate ≥106 and last systolic blood pressure ≤102:
x = −2.6074 + 1.6592 + 0.8854 + 0.5961 = 0.5333Predicted probability of eRRT activation = 0.630.
Figure 3. Equation for calculating the probability of eRRT using the simplified multivariable model. eRRT = early rapid response team.
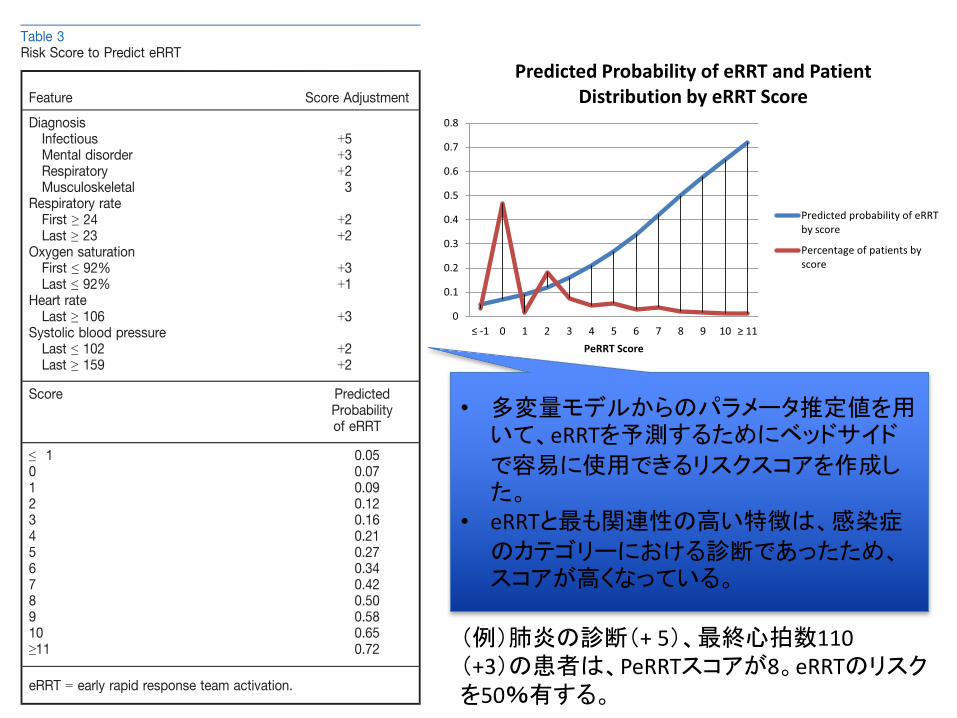
Table 3Risk Score to Predict eRRT
Feature Score Adjustment
DiagnosisInfectious +5Mental disorder +3Respiratory +2Musculoskeletal !3
Respiratory rateFirst ≥ 24 +2Last ≥ 23 +2
Oxygen saturationFirst ≤ 92% +3Last ≤ 92% +1
Heart rateLast ≥ 106 +3
Systolic blood pressureLast ≤ 102 +2Last ≥ 159 +2
Score PredictedProbabilityof eRRT
≤!1 0.050 0.071 0.092 0.123 0.164 0.215 0.276 0.347 0.428 0.509 0.5810 0.65≥11 0.72
eRRT = early rapid response team activation.
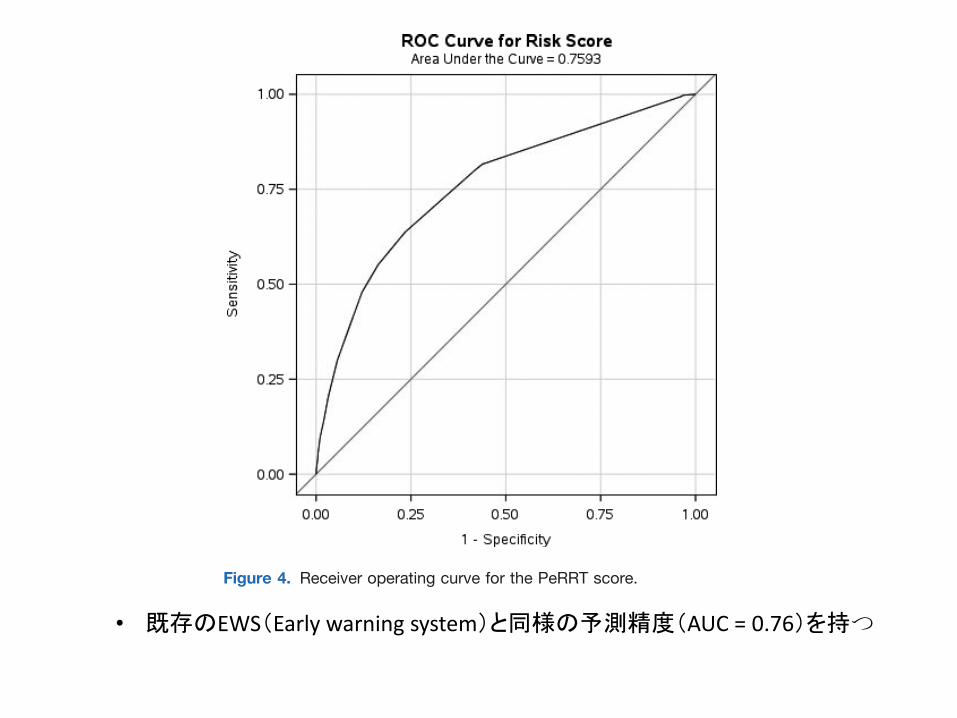
Figure 4. Receiver operating curve for the PeRRT score.
222 Bellew et al. • PeRRT Score
• 多変量モデルからのパラメータ推定値を用いて、eRRTを予測するためにベッドサイド
で容易に使用できるリスクスコアを作成した。
• eRRTと も関連性の高い特徴は、感染症
のカテゴリーにおける診断であったため、スコアが高くなっている。
(例)肺炎の診断(+5)、 終心拍数110(+3)の患者は、PeRRTスコアが8。eRRTのリスクを50%有する。
could not evaluate the ability of age, sex, or diagnosisto predict eRRT. With PeRRT, we compared theeRRT cohort to a large randomly selected controlgroup and modified the method of abstracting the“final diagnosis” from chart review to the use of
ICD-9 codes and standardized classifications. Thismethod was felt to be more convenient, reliable, andreflective of existing literature.2,26
Existing aggregate EWSs vary widely in accuracywith AUCs varying from 0.61 to 0.84.22 Notably,existing tools were developed to predict various end-points, primarily ICU admission as opposed to RRT,as in the case of our tool. Further, these systems havebeen primarily studied in admitted patients, asopposed to using ED data. Therefore, these scoringsystems when applied to an ED population may fail toidentify critically ill patients.27 Our prediction
Add together the intercept and any features that apply and calculate x.The predicted probability of eRRT activation is defined as ex / ( 1 + ex ).
Example 1: A patient with a disease of the musculoskeletal system and connective tissue and no extreme vital signs:
x = −2.6074 − 1.1406 = −3.7480Predicted probability of eRRT activation = 0.023.
Example 2: A patient with an infectious and parasitic disease and the extreme vital signs of last heart rate ≥106 and last systolic blood pressure ≤102:
x = −2.6074 + 1.6592 + 0.8854 + 0.5961 = 0.5333Predicted probability of eRRT activation = 0.630.
Figure 3. Equation for calculating the probability of eRRT using the simplified multivariable model. eRRT = early rapid response team.
Table 3Risk Score to Predict eRRT
Feature Score Adjustment
DiagnosisInfectious +5Mental disorder +3Respiratory +2Musculoskeletal !3
Respiratory rateFirst ≥ 24 +2Last ≥ 23 +2
Oxygen saturationFirst ≤ 92% +3Last ≤ 92% +1
Heart rateLast ≥ 106 +3
Systolic blood pressureLast ≤ 102 +2Last ≥ 159 +2
Score PredictedProbabilityof eRRT
≤!1 0.050 0.071 0.092 0.123 0.164 0.215 0.276 0.347 0.428 0.509 0.5810 0.65≥11 0.72
eRRT = early rapid response team activation.
Figure 4. Receiver operating curve for the PeRRT score.
222 Bellew et al. • PeRRT Score
• 既存のEWS(Early warning system)と同様の予測精度(AUC=0.76)を持つ
この研究のまとめ
• 救急部でのバイタルサインと診断を使用して、eRRT介入の予測を定量化することが可能であることが示された。
• Predict eRRTスコアは、潜在的な病態の悪化と早期RRTの介入のリスクを定量化した簡単なツールである。
• 救急部医師が患者の配置を考える際に、ベッドサイドで使用することができる。
• 患者の配置が不確かな場合にPeRRTスコアを参照することで、救急部と病棟及びICU間のコミュニケーションが改善されることが期待できる。
Design and Development of a Proactive RapidResponse SystemMichelle Heal, MSN, RN, Sarah Silvest-Guerrero, DNP, RN, Cindy Kohtz, EdD, MSN, RN, CNE
Timely identification of patient deterioration can prompt in-tervention and prevent the escalation of care and un-planned intensive care admissions. However, both personalexperience and professional literature reveals that staffnurses in the acute care setting may not notice subtle signsof patient deterioration or may be reluctant to activate therapid response system. To overcome these barriers, a pro-active rapid response system with early warning signs wascreated and studied. Using a quasi-experimental design,data were collected from two medical-surgical nursing unitsat one large tertiary medical center over a 6-month period.One unit used the new rapid response system and earlywarning sign criteria with real-time data entry and trigger ac-tivation. A second unit served as the control and relied onthe nurse for rapid response system activation. Findings re-vealed that the use of the newly developed rapid responsesystem demonstrated significantly greater sensitivity tosubtle signs of patient deterioration and prompted earlyevaluation and intervention.
KEY WORDS: Early warning signs, Patient deterioration,Rapid response system
S tudies show that 84% of patients demonstrate earlywarning signs (EWSs) of clinical deteriorationwithin8 hours preceding a cardiopulmonary arrest. Fur-ther, the survival statistics for these patients aregrim, with fewer than 20% of resuscitated patients
surviving to be discharged from the hospital.1,2 Rather thanintervening when a cardiac arrest occurs or is imminent, thepurpose of this study is to identify patient deterioration early,to proactively intervene, and to reduce the need for patienttransfer to a higher level of care. To accomplish this, a set ofnewly developed EWSs system criteria was introduced andfully integrated into the patient's electronic medical record(EMR). Any criterion that was under or over the given
parameters was assigned a score. Scores for each patientwere then auto-tallied by the EMR for a total score. Anytotal score exceeding an assigned threshold prompted atrigger, and a resulting follow-up of the patient by the crisisnurse, the leader of the rapid response team (RRT).
BACKGROUNDAn RRT, sometimes called a medical emergency team orcritical care outreach, is defined as a team of healthcare pro-fessionals who bring critical care expertise to the patient’sbedside.3 The first RRT was introduced in Sydney,Australia, in 1990 and in the United States in 1997.4 Sincethen, the use of RRTs or a similar system to access expertassistance for inpatient acute care has been endorsed by theInstitute of Healthcare Improvement, Agency for HealthcareResearch and Quality, and the Joint Commission.5–7 Thecomposition of RRTs varies by institution but often includesa crisis nurse, a respiratory therapist, and a nursing supervi-sor.8 Regardless of composition, the premise is the same, toenable early detection and early intervention, thus prevent-ing intensive care admission or cardiac arrest.3,9
In contrast to a RRT, a rapid response system (RRS) is anumbrella term that includes the RRT and an escalation pro-tocol based on the specific EWSs. Rapid response systemsconsist of an afferent limb (identification) and an efferentlimb (response).10 Early warning signs vary by institution andare composed of select physiological variables and predeter-mined parameters for each.11 Early warning system scoringsystems can take one of two forms, those based on the devi-ation of a single physiological parameter and those based onan aggregate score of multiple physiological criteria. The lat-ter involving an aggregate score is considered superior.10
A nurse noting patient deterioration may activate theRRS. However, many times, EWSs go unnoticed or unre-ported.11 “Failure to rescue,” a phrase denoting the inabilityof bedside caregivers to note or report patient deteriorationand take action to intervene, is often applied in retrospectto the hours preceding these types of adverse patientevents.1,12 As a result, subtle changes in vital signs and physio-logical alterations may be overlooked until compensatorymechanisms fail and the patient requires emergent inter-vention.13 Furthermore, while early identification of
Copyright © 2017 Wolters Kluwer Health, Inc. All rights reserved.
Author Affiliation: OSF Saint Francis Medical Center (Ms Heal and Dr Silvest-Guerrero); SaintFrancis Medical Center College of Nursing, Peoria, Illinois (Dr Kohtz).
Cindy Kohtz will move to Wesleyan Illinois University as an associate professor in August 2016.Michelle Heal has moved to Peoria Surgical Group as of August 2016.
The authors have disclosed that they have no significant relationship with, or financial interest in,any commercial companies pertaining to this article.
Corresponding author: Michelle Heal, MSN, RN, Peoria Surgical Group, LTD, 1001 Main Street,Suite 300, Peoria, IL 61606 ([email protected]).
CONTINUING EDUCATION1.0ANCC
CONTACT HOUR
Volume 35 | Number 2 CIN: Computers, Informatics, Nursing 77
Copyright © 2017 Wolters Kluwer Health, Inc. All rights reserved.
Ø 背景
• earlywarningsigns(EWS) は組織によって異なる。
• earlywarningsignsのスコアリング方法は、一つの生理学的パラメータの逸脱と、複数の生理学的criteriaの総合点の2つの方法がある。後者の方が優れている。
• 実際には、EWSは気づかれないことや、報告されないことも多い。
これは、ベッドサイドの医療者が患者の悪化に気づいたり、介入する能力がないことを意味する。結果として、バイタルサインや生理学的小さな変化は、患者の代償機構が働かなくなり、緊急介入が必要となるまで見過ごされてしまう。
• 臨床の知識不足や、コミュニケーションエラー、技術的な問題、バイタルサインの記録不足など多くの要因が関連している。
R can operate on a variety of platforms and can use eitherWindows or MacOS operating system.31 For this study, pa-tients younger than 18 years of age or who were identified asactive comfort measures were excluded from the study. Ac-tive comfort measures in this study denote individuals whohave do-not-resuscitate orders and who have expressed thewish to limit interventions to those that provide comfortand pain relief. They do not wish to have aggressive or inva-sive interventions to prolong their lives.
On the intervention unit, a total of 794 instances of trig-gers were found by the crisis nurse during the every 4-hourEMR review. Of those, 412 bedside assessments and or in-terventions were completed to potentially prevent furtherpatient deterioration. A full RRTwas activated on 132 occa-sions on the intervention unit. On the control unit, staff acti-vated a RRT event 110 times.
Census remained unchanged for each unit in the postin-tervention timeframe with a census of 25 for the interventionunit and 23 for the control unit. While the intervention unithad 1 cardiopulmonary arrest and the control unit had 3,there was no significant difference.
However, the newly developed RRS did demonstrateincreased sensitivity to early patient deterioration. Aftercontrolling for unit, census, and month, Poisson regressionanalysis demonstrated a significant positive association be-tween the intervention unit and RRT count with a P value <.05 (actual P value = .013) when compared with the controlunit. This indicates that the introduction of the newly devel-oped RRS significantly increased the chances of a RRT eventon the intervention unit. Table 2 shows patient outcomes byunit. Table 3 shows EWS criteria and the frequency that atrigger was generated with a score of 3 or greater.
DISCUSSION AND IMPLICATIONSResearch reveals that approximately 50% of RRT calls re-sult in patient stabilization without the patient moving to ahigher level of care.1 Reduced lengths of stay and increasedsatisfaction among patients, families, and nurses are also pos-itive benefits related to having RRTs in place.13,32,33 The
intervention unit had fewer cardiopulmonary arrests thanthe control unit, therefore there was no significant difference.Perhaps extending the length of the study could have shedmore light on this important patient outcome. Regardless,the researchers were pleased with the overall sensitivity ofthe newly developed EWS criteria and the electronic triggersgenerated through integration into the EMR.
Prior research demonstrates that RR, HR, and low oxy-gen saturations are the most frequently reported predictorsof patient deterioration.34 In this study, RRwas the most fre-quent trigger, followed by temperature, SPO2, and MAP.Heart rate ranked last out of the five most frequent measure-ments to activate a trigger.
In retrospect, the researchers would have tracked addi-tional data for analysis, such as, length of stay (LOS) for pa-tients receiving RRT activation on the interventional unitand control unit. Rapid response teams have been shownto decrease mean LOS.32 Therefore, it would be valuableto understand how proactive rounding versus reactiverounding affects this variable.32 We also would have donea post hoc analysis of RRT activation using the conventionalEWS criteria on both the interventional and control units andcompared that data with the actual data to determine overallcapture rate with and without proactive rounding.
Additionally, Barwise et al32 found that delayed activationof the RRT increased mortality. However, none of the pa-tients in either the control or intervention units died. Perhapsa longer time for data collection could shed more light onthis aspect of the new RRS.
The proactive rounding model used in this study pro-motes timely identification of patient deterioration and over-comes the barrier of requiring staff nurse activation of theRRS. Nevertheless, a limitation was realized. The EMRsare reviewed for trigger activation only one time every4 hours. It would be helpful if technology prompted amobilealarm for the crisis nurse so as to not wait for the 4 hours in-crements of time for EMR review. This presents a future op-portunity for interdisciplinary collaboration between nursingand information technology specialists.
Lastly, in reflecting on our study, we wish that we wouldhave obtained consent to record anecdotal remarks madeby nurses over the course of data collection. Many times,
Table 2. Patient Outcomes by UnitIntervention
UnitControlUnit
Triggers 868 N/ARRTs 132 110Patients experiencing a cardiopulmonaryarrest
1 3
Patients that stayed on the unit 18 16Patients that transferred to a higherlevel of care
65 75
Patients who died 0 0
Table 3. EWS Physiological Measurements andFrequency of Trigger ActivationVital Sign Frequency
RR 282Temperature 281Pulse oximetry 126MAP 92HR 13
Volume 35 | Number 2 CIN: Computers, Informatics, Nursing 81
Copyright © 2017 Wolters Kluwer Health, Inc. All rights reserved.
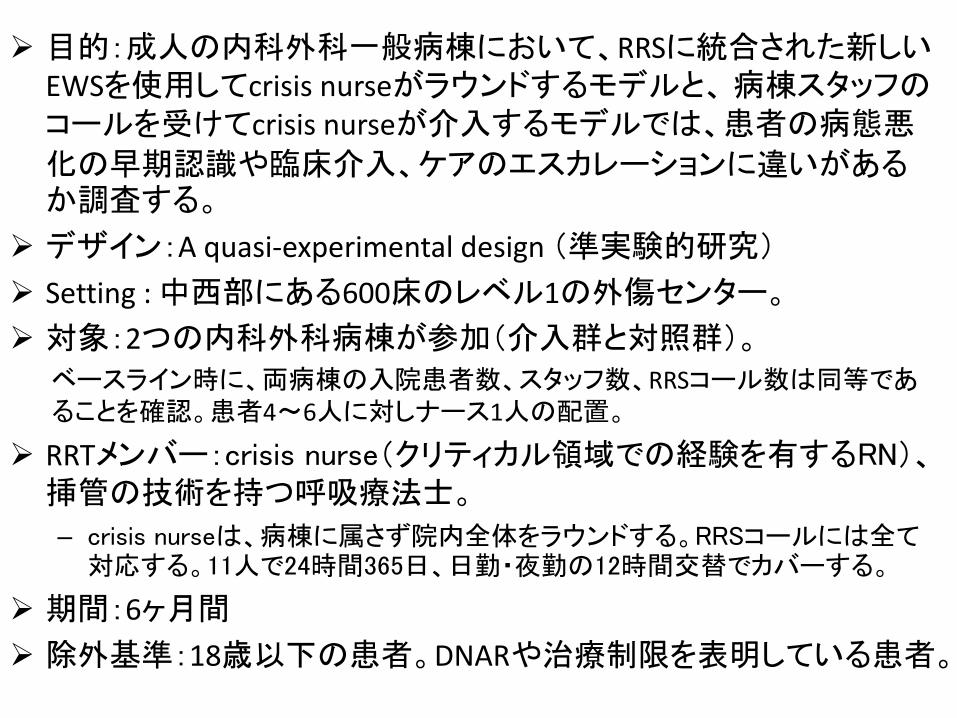
Ø 目的:成人の内科外科一般病棟において、RRSに統合された新しいEWSを使用してcrisisnurseがラウンドするモデルと、 病棟スタッフのコールを受けてcrisisnurseが介入するモデルでは、患者の病態悪
化の早期認識や臨床介入、ケアのエスカレーションに違いがあるか調査する。
Ø デザイン:Aquasi-experimentaldesign(準実験的研究)
Ø Setting:中西部にある600床のレベル1の外傷センター。
Ø 対象:2つの内科外科病棟が参加(介入群と対照群)。
ベースライン時に、両病棟の入院患者数、スタッフ数、RRSコール数は同等であることを確認。患者4〜6人に対しナース1人の配置。
Ø RRTメンバー:crisis nurse(クリティカル領域での経験を有するRN)、挿管の技術を持つ呼吸療法士。
– crisis nurseは、病棟に属さず院内全体をラウンドする。RRSコールには全て対応する。11人で24時間365日、日勤・夜勤の12時間交替でカバーする。
Ø 期間:6ヶ月間
Ø 除外基準:18歳以下の患者。DNARや治療制限を表明している患者。
Ø 方法:
– 約6ヶ月かけて、新EWSツールの開発と患者の電子記録(EMR: electronic medical record)の中に新EWSを統合するための技術を構築した。(crisis nurseが、どの場所からでもいつでも全患者のEWSの総スコアをレビューできることが重要だった。)
– EMRは、crisis nurse が見て分かるように総スコアを自動的に集計。総スコアが3以上であればトリガーしアラートの一種が発生する。
– データ収集頻度は、患者の状態やバイタル測定の頻度による。病棟で一般的な頻度である4〜8時間ごとに収集。
– crisis nurseは、院内のEMRを使用して4時間ごとにトリガーされた内容を見直した。
– トリガーされた患者がいた場合crisis nurseは、敗血症に対するアセスメントと患者をより包括的評価するために、追加データ(白血球数、血糖値、乳酸値、意識レベル、confusionassessmentmethod(CAM))を調べた。
– 対象の2病棟へ新EWSシステムとEMRについて説明。生理学的データをリアルタイムで入力することの重要性を両病棟の管理者に強調して伝えた。2週間の教育期間を設けた。
• 介入群– 病棟ナースは、バイタル測定値をEMRに入力するが、RRS起動のトリガーとなる具
体的な測定値やパラメーターは認識していない。– RRSはトリガーに基づいて自動的に始動されない。– Crisis nurseが4時間ごとにEMRの患者トリガースコア3以上をレビューし、標準化さ
れた治療アルゴリズムを使用して対応する責任がある。Crisisnurseの裁量で、迅速に対応するために、アルゴリズムの1つもしくは複数のステップを省略して実施することができる。
• 対照群– 介入群と同様に測定値をEMRに入力するが、自動的にトリガーされない。– 病棟ナースが、患者の状態から必要性を認識しRRTを要請する。要請を受けた
Crisisnurseのアルゴリズムは介入群と同様。
participate in the study, one to serve as a control and one toserve as the intervention unit. The nursing units involved inthe study were considered sister units; while geographicallyseparate units, the nurses often work both units, one or moredays on one unit and then the other. At baseline, the twounits were determined to be equivalent in terms of patientpopulation, staffing, census, and rapid response call rates.The average daily census was 25 for the intervention unitand 23 for the control unit. The typical staffing for each unitwas one nurse caring for four to six patients.
InterventionAfter integrating the EWS criteria into the EMR, educationconcerning the EWS system and research study was pro-vided to the unit leadership and the educator of both units.Education included an overview of the study, the purposeof the study, discussion concerning the expected challengesof implementation, and potential benefits to the staff and pa-tients. The importance of real-time data entry of physiologi-cal measurements was emphasized to representatives of bothunits. The unit leadership and educator were accountable todisseminate the information to the nursing staff, includingthe patient care technicians (PCTs), over a 2-week period.Because physiological measurements are entered into theEMR by both nurses and PCTs, education involving bothpopulations was deemed essential.
Likewise, members of the RRT were provided similar ed-ucation regarding the study as well as expectations specific totheir roles. At the institution where the study was conducted,the RRT is composed of one crisis nurse (a registered nursewith a background in critical care) and one respiratory ther-apist with intubation skills. The crisis nurse has a dedicatedrole; she/he is not assigned to a specific unit or patient. Eachshift, the crisis nurse makes rounds of all nursing units withinthe medical center to inquire about patients previously iden-tified as having a high risk for deterioration. Additionally, thecrisis nurse initiates intravenous access on patients deemeddifficult sticks and attends and assists all cardiopulmonaryarrests needing resuscitation efforts. In situations with patientdeterioration but without arrest, the crisis nurse is a first
responder to all activations of the RRS and initiates furtherassessments and interventions. Escalation to a higher levelof care is often initiated based on the crisis nurse's findings.At the time of the study, there were a total of 11 crisis nurses,each working 12-hour shifts with both days and night shiftsrotated to provide 24/7 coverage.
Once all education for the nursing units and RRT mem-bers was complete, the use of the new RRS with EWScriteria and EMR integration went live on the interventionunit and data collection of both units began. Physiologicalmeasurements (Table 1) were entered into the EMR by thePCTs and/or nursing staff.
The frequency of performing physiological measurementwas prescribed by the HCP or done at the discretion of thenursing staff. Nurses working on the intervention units werenot aware of specific measurements or parameters thatwould serve as triggers for RRS activation. Additionally,the RRS was not automatically activated based on triggers.Rather, the crisis nurse was responsible to review the patienttrigger scores of 3 or greater in the EMR every 4 hours andto respond using a standardized algorithm of care (seeFigure 1). At the crisis nurse's discretion, one or more stepsin the algorithm may be omitted to expedite care and pro-mote optimal patient outcomes.
This same algorithm of care was used on the control unitas well. However, unlike the intervention unit, the EMRs ofthose patients on the control unit were not automaticallypopulated to report triggers. Instead, nursing staff membersinitiated an RRT event based on perceived patient need.
Data collection ran concurrently for both units over 6 consec-utive months. Data collection included the number of patientswho triggered assessment and/or intervention by the crisis nurseor RRT on the intervention unit compared with the numberof RRT calls generated by staff from the control unit.
RESULTSAt the end of the 6-month period, data were analyzed usingan open source program called R, version 3.1.2, a robustand free statistical computing program available online(The R Foundation for Statistical Computing, Vienna, Austria).
FIGURE 1. Crisis Nurse Standardized Algorithm of Care.
CONTINUING EDUCATION
80 CIN: Computers, Informatics, Nursing February 2017
Copyright © 2017 Wolters Kluwer Health, Inc. All rights reserved.
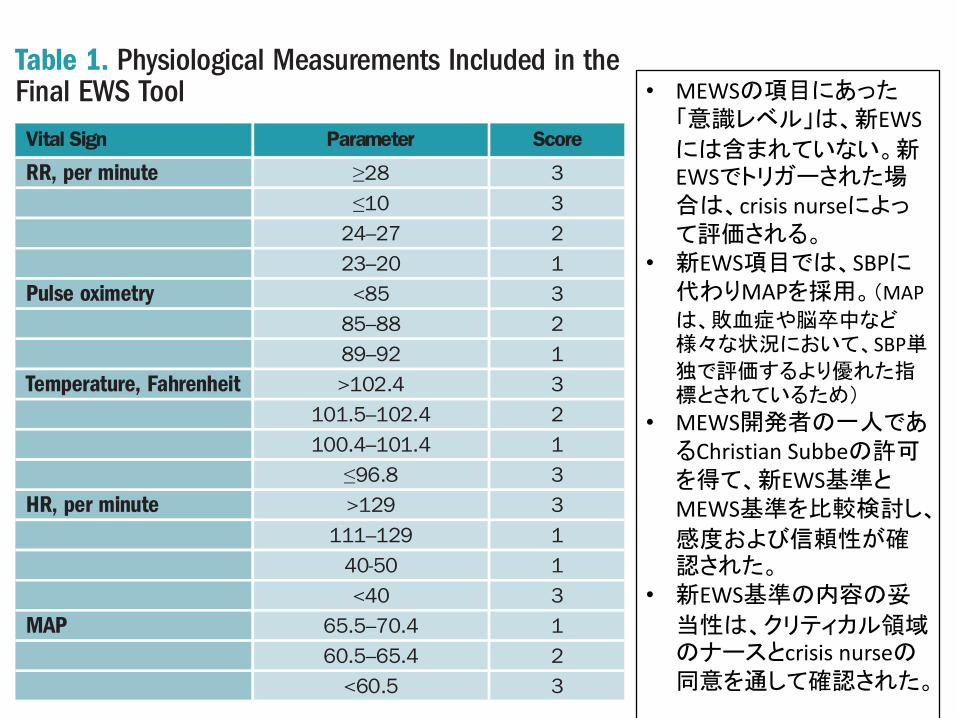
working with information technology to integrate the toolinto the EMR.
Early Warning Sign Tool DevelopmentBased on the literature review of common EWS criteria andparameters for each criterion and the researchers' own pro-fessional experience with critical care, EWS criteria using se-lect physiological measures and parameters were developedand integrated into the EMR. Selected physiological mea-sures included RR, HR, temperature, pulse oximetry (SPO2),and mean arterial pressure (MAP).
Level of consciousness, included in the MEWS, was not acomponent of the newly developed EWS criteria but wasevaluated by the crisis nurse as secondary data if a trigger oc-curred. The criterion of SPO2 was included. SPO2 had beenused by Stenhouse et al,17,26 and low values have been re-ported as common antecedents of RRS calls.17,26
AlthoughMAP was not found to be included in any of theEWS criteria that we reviewed, MAP reflects both cardiacoutput and systemic vascular resistance and concisely ad-dresses both systolic and diastolic values. Further, MAP iscommonly used to guide patient care in the treatment ofsepsis, stroke, and hypertension and in some situations canbe considered superior to systolic blood pressure alone.27–30
Given this and the researchers' own clinical observations,MAP replaced systolic blood pressure in the newly devel-oped EWS criteria.
Scoring of the EWS criteria was based on predeterminedparameters. The degree of variance from the predetermined
normal parameter for a given criterion resulted in an EWSscore ranging from 1 to 3. Unlike many other EWS criteria,a score of 0 was not included if the criterion measured fellwithin the normal parameter. (See Table 1 for physiologicalmeasurements included in the EWS criteria, parameters foreach, and the scoring system used.) Once entered, the EMRauto-tabulated an aggregate score visible to the crisis nurse.Any score of 3 or greater resulted in a trigger, a type of red flagor alert. Frequency of data collection was dependent on patientcondition and HCP orders. Therefore, data were typically en-tered at the point of care every 4 to 8 hours on general units.
Because the crisis nurse is constantly on the move through-out the shift, it was important to be able to review the datagenerated on all patients at any point in time from any loca-tion. Integrating the criteria into patients' EMRs enabledthe crisis nurse to do this. The crisis nurse remotely reviewedtriggers every 4 hours using the EMR from any of the com-puter kiosks located throughout the medical center. For thoseindividuals with triggers, the crisis nurse would evaluate ad-ditional data (white blood cell count, blood glucose, lactatelevels, level of consciousness, and confusion assessment method)to gain a more comprehensive picture of the patient and to as-sess for developing sepsis. The final product was a set of fullycustomized EWS criteria that was anticipated to be highlysensitive to patient instability.
Before going live with the use of the newly developedEWS criteria and RRS, the constructs of validity and reli-ability were addressed. Content validity of the proposedEWS criteria was established through the review and agree-ment of fellow crisis nurses and colleagues in the critical caresetting. With the permission of Dr Christian Subbe, one ofthe MEWS developers, reliability was established by com-paring the results of the newly developed EWS criteria withthe MEWS criteria. For this testing, retrospective analysiswas performed comparing MEWS scores against the scoresgenerated by the newly developed EWS criteria. This analy-sis examined physiological measurements recorded in theEMR prior to 24 RRT calls over a 1-month period. Findingsdemonstrated that the MEWS criteria captured 71% of thepatients (17/24 patients) 6.5 hours prior to an RRT callcompared with the pilot EWS criteria that captured 75%of the patients (18/24 patients) within the same timeframe.This analysis supported the sensitivity and reliability of thenewly developed EWS criteria. Further, while the newEWS criteria required real-time data entry of physiologicalmeasurements, it did not rely on staff nurse recognitionand phone activation of the RRS.
Sample and SettingThe setting for this study was a 600-bed level 1 trauma med-ical center located in the Midwest. Two medical-surgicalnursing units from the medical center were invited to
Table 1. Physiological Measurements Included in theFinal EWS ToolVital Sign Parameter Score
RR, per minute Q28 3e10 3
24–27 223–20 1
Pulse oximetry <85 385–88 289–92 1
Temperature, Fahrenheit >102.4 3101.5–102.4 2100.4–101.4 1
e96.8 3HR, per minute >129 3
111–129 140-50 1<40 3
MAP 65.5–70.4 160.5–65.4 2<60.5 3
Volume 35 | Number 2 CIN: Computers, Informatics, Nursing 79
Copyright © 2017 Wolters Kluwer Health, Inc. All rights reserved.
• MEWSの項目にあった「意識レベル」は、新EWSには含まれていない。新EWSでトリガーされた場合は、crisisnurseによって評価される。
• 新EWS項目では、SBPに代わりMAPを採用。(MAPは、敗血症や脳卒中など様々な状況において、SBP単
独で評価するより優れた指標とされているため)
• MEWS開発者の一人であるChristianSubbeの許可を得て、新EWS基準とMEWS基準を比較検討し、
感度および信頼性が確認された。
• 新EWS基準の内容の妥
当性は、クリティカル領域のナースとcrisisnurseの同意を通して確認された。
R can operate on a variety of platforms and can use eitherWindows or MacOS operating system.31 For this study, pa-tients younger than 18 years of age or who were identified asactive comfort measures were excluded from the study. Ac-tive comfort measures in this study denote individuals whohave do-not-resuscitate orders and who have expressed thewish to limit interventions to those that provide comfortand pain relief. They do not wish to have aggressive or inva-sive interventions to prolong their lives.
On the intervention unit, a total of 794 instances of trig-gers were found by the crisis nurse during the every 4-hourEMR review. Of those, 412 bedside assessments and or in-terventions were completed to potentially prevent furtherpatient deterioration. A full RRTwas activated on 132 occa-sions on the intervention unit. On the control unit, staff acti-vated a RRT event 110 times.
Census remained unchanged for each unit in the postin-tervention timeframe with a census of 25 for the interventionunit and 23 for the control unit. While the intervention unithad 1 cardiopulmonary arrest and the control unit had 3,there was no significant difference.
However, the newly developed RRS did demonstrateincreased sensitivity to early patient deterioration. Aftercontrolling for unit, census, and month, Poisson regressionanalysis demonstrated a significant positive association be-tween the intervention unit and RRT count with a P value <.05 (actual P value = .013) when compared with the controlunit. This indicates that the introduction of the newly devel-oped RRS significantly increased the chances of a RRT eventon the intervention unit. Table 2 shows patient outcomes byunit. Table 3 shows EWS criteria and the frequency that atrigger was generated with a score of 3 or greater.
DISCUSSION AND IMPLICATIONSResearch reveals that approximately 50% of RRT calls re-sult in patient stabilization without the patient moving to ahigher level of care.1 Reduced lengths of stay and increasedsatisfaction among patients, families, and nurses are also pos-itive benefits related to having RRTs in place.13,32,33 The
intervention unit had fewer cardiopulmonary arrests thanthe control unit, therefore there was no significant difference.Perhaps extending the length of the study could have shedmore light on this important patient outcome. Regardless,the researchers were pleased with the overall sensitivity ofthe newly developed EWS criteria and the electronic triggersgenerated through integration into the EMR.
Prior research demonstrates that RR, HR, and low oxy-gen saturations are the most frequently reported predictorsof patient deterioration.34 In this study, RRwas the most fre-quent trigger, followed by temperature, SPO2, and MAP.Heart rate ranked last out of the five most frequent measure-ments to activate a trigger.
In retrospect, the researchers would have tracked addi-tional data for analysis, such as, length of stay (LOS) for pa-tients receiving RRT activation on the interventional unitand control unit. Rapid response teams have been shownto decrease mean LOS.32 Therefore, it would be valuableto understand how proactive rounding versus reactiverounding affects this variable.32 We also would have donea post hoc analysis of RRT activation using the conventionalEWS criteria on both the interventional and control units andcompared that data with the actual data to determine overallcapture rate with and without proactive rounding.
Additionally, Barwise et al32 found that delayed activationof the RRT increased mortality. However, none of the pa-tients in either the control or intervention units died. Perhapsa longer time for data collection could shed more light onthis aspect of the new RRS.
The proactive rounding model used in this study pro-motes timely identification of patient deterioration and over-comes the barrier of requiring staff nurse activation of theRRS. Nevertheless, a limitation was realized. The EMRsare reviewed for trigger activation only one time every4 hours. It would be helpful if technology prompted amobilealarm for the crisis nurse so as to not wait for the 4 hours in-crements of time for EMR review. This presents a future op-portunity for interdisciplinary collaboration between nursingand information technology specialists.
Lastly, in reflecting on our study, we wish that we wouldhave obtained consent to record anecdotal remarks madeby nurses over the course of data collection. Many times,
Table 2. Patient Outcomes by UnitIntervention
UnitControlUnit
Triggers 868 N/ARRTs 132 110Patients experiencing a cardiopulmonaryarrest
1 3
Patients that stayed on the unit 18 16Patients that transferred to a higherlevel of care
65 75
Patients who died 0 0
Table 3. EWS Physiological Measurements andFrequency of Trigger ActivationVital Sign Frequency
RR 282Temperature 281Pulse oximetry 126MAP 92HR 13
Volume 35 | Number 2 CIN: Computers, Informatics, Nursing 81
Copyright © 2017 Wolters Kluwer Health, Inc. All rights reserved.
新しいEWS基準で総スコアが3以上でトリガーされた件数
• 呼吸回数が も多く、ついで体温、SpO2となっている。
R can operate on a variety of platforms and can use eitherWindows or MacOS operating system.31 For this study, pa-tients younger than 18 years of age or who were identified asactive comfort measures were excluded from the study. Ac-tive comfort measures in this study denote individuals whohave do-not-resuscitate orders and who have expressed thewish to limit interventions to those that provide comfortand pain relief. They do not wish to have aggressive or inva-sive interventions to prolong their lives.
On the intervention unit, a total of 794 instances of trig-gers were found by the crisis nurse during the every 4-hourEMR review. Of those, 412 bedside assessments and or in-terventions were completed to potentially prevent furtherpatient deterioration. A full RRTwas activated on 132 occa-sions on the intervention unit. On the control unit, staff acti-vated a RRT event 110 times.
Census remained unchanged for each unit in the postin-tervention timeframe with a census of 25 for the interventionunit and 23 for the control unit. While the intervention unithad 1 cardiopulmonary arrest and the control unit had 3,there was no significant difference.
However, the newly developed RRS did demonstrateincreased sensitivity to early patient deterioration. Aftercontrolling for unit, census, and month, Poisson regressionanalysis demonstrated a significant positive association be-tween the intervention unit and RRT count with a P value <.05 (actual P value = .013) when compared with the controlunit. This indicates that the introduction of the newly devel-oped RRS significantly increased the chances of a RRT eventon the intervention unit. Table 2 shows patient outcomes byunit. Table 3 shows EWS criteria and the frequency that atrigger was generated with a score of 3 or greater.
DISCUSSION AND IMPLICATIONSResearch reveals that approximately 50% of RRT calls re-sult in patient stabilization without the patient moving to ahigher level of care.1 Reduced lengths of stay and increasedsatisfaction among patients, families, and nurses are also pos-itive benefits related to having RRTs in place.13,32,33 The
intervention unit had fewer cardiopulmonary arrests thanthe control unit, therefore there was no significant difference.Perhaps extending the length of the study could have shedmore light on this important patient outcome. Regardless,the researchers were pleased with the overall sensitivity ofthe newly developed EWS criteria and the electronic triggersgenerated through integration into the EMR.
Prior research demonstrates that RR, HR, and low oxy-gen saturations are the most frequently reported predictorsof patient deterioration.34 In this study, RRwas the most fre-quent trigger, followed by temperature, SPO2, and MAP.Heart rate ranked last out of the five most frequent measure-ments to activate a trigger.
In retrospect, the researchers would have tracked addi-tional data for analysis, such as, length of stay (LOS) for pa-tients receiving RRT activation on the interventional unitand control unit. Rapid response teams have been shownto decrease mean LOS.32 Therefore, it would be valuableto understand how proactive rounding versus reactiverounding affects this variable.32 We also would have donea post hoc analysis of RRT activation using the conventionalEWS criteria on both the interventional and control units andcompared that data with the actual data to determine overallcapture rate with and without proactive rounding.
Additionally, Barwise et al32 found that delayed activationof the RRT increased mortality. However, none of the pa-tients in either the control or intervention units died. Perhapsa longer time for data collection could shed more light onthis aspect of the new RRS.
The proactive rounding model used in this study pro-motes timely identification of patient deterioration and over-comes the barrier of requiring staff nurse activation of theRRS. Nevertheless, a limitation was realized. The EMRsare reviewed for trigger activation only one time every4 hours. It would be helpful if technology prompted amobilealarm for the crisis nurse so as to not wait for the 4 hours in-crements of time for EMR review. This presents a future op-portunity for interdisciplinary collaboration between nursingand information technology specialists.
Lastly, in reflecting on our study, we wish that we wouldhave obtained consent to record anecdotal remarks madeby nurses over the course of data collection. Many times,
Table 2. Patient Outcomes by UnitIntervention
UnitControlUnit
Triggers 868 N/ARRTs 132 110Patients experiencing a cardiopulmonaryarrest
1 3
Patients that stayed on the unit 18 16Patients that transferred to a higherlevel of care
65 75
Patients who died 0 0
Table 3. EWS Physiological Measurements andFrequency of Trigger ActivationVital Sign Frequency
RR 282Temperature 281Pulse oximetry 126MAP 92HR 13
Volume 35 | Number 2 CIN: Computers, Informatics, Nursing 81
Copyright © 2017 Wolters Kluwer Health, Inc. All rights reserved.→新しく開発されたRRSにより、早期の患者の悪化に対する感受性が高まった。
• *1)2つの病棟の人数や、月などを調整した後、ポアソン回帰分析で、介入群と対照群を比較した。介入群と対照群では、RRT件数の間に有意な正の関連が示された(P<.013)。
• その他の項目では有意差は認められなかった。
P<.05*1
この研究のまとめ
• 重篤な有害事象や、死亡率に関しては有意差は認められなかった。データ収集期間を長くすることで結果は変わるかもしれない。
• 理想的なRRSは、EWS基準の進化とともに発展している。
• 新EWSではMAPの追加が考慮されるべきであり、この研究でトリガーされた頻度を考慮して、さらなるEWS項目について研究を重ねていく必要がある。
• RRTの介入について、Crisis nurseは、4時間ごとのレビューでトリガーが起動されたことに気づいた。技術の進歩によって、自動化された警報が移動通信を介してCrisisNurseに送信されるようになることが望ましい。
American Journal of Medical Quality2017, Vol. 32(1) 12 –18© The Author(s) 2015Reprints and permissions: sagepub.com/journalsPermissions.navDOI: 10.1177/1062860615613841journals.sagepub.com/home/ajmq
Article
Patients deemed suitable for care on a general hospital unit frequently deteriorate during their hospitalization because of disease progression and imperfect triage sys-tems. Rapid response systems (RRSs) have been applied to identify and treat deteriorating patients on general hos-pital units.1,2 Given the evidence that unplanned intensive care unit (ICU) patient transfer results in worse outcomes than more controlled ICU admission,3-5 it is logical to assume that earlier identification of deteriorating patients could provide a window of opportunity to prevent adverse outcomes. The most commonly proposed approach to the problem of identifying and stabilizing deteriorating hos-pitalized patients includes some combination of an early warning system to detect the deterioration and an RRS to deal with it, although the evidence supporting this approach is inconsistent.2,6-11 The study team previously demonstrated that a relatively simple hospital-specific prediction model employing routine laboratory values and vital sign data is capable of predicting clinical dete-rioration, the need for ICU transfer, and hospital mortal-ity in patients admitted to general medicine units.12-16 Therefore, the team set out to review the outcomes of patients admitted to the 8 general medicine units of Barnes-Jewish Hospital during the development and
implementation of an RRS employing real-time clinical deterioration alerts (RTCDAs).
Methods
Study LocationThis retrospective analysis utilized data derived from 8 adult general medicine units of Barnes-Jewish Hospital, a 1250-bed academic medical center in St Louis, Missouri, over 12 years (January 1, 2003, to December 31, 2014). Patient care on the medicine units is delivered by either attending hospitalist physicians or dedicated house staff physicians under the supervision of an attending physi-cian. Nursing care on the general medicine units is car-ried out according to hospital guidelines and policies.
613841 AJMXXX10.1177/1062860615613841American Journal of Medical QualityKollef et alresearch-article2015
1Washington University, St Louis, MO2BJC HealthCare, St Louis, MO3Barnes-Jewish Hospital, St Louis, MO
Corresponding Author:Marin H. Kollef, MD, Division of Pulmonary and Critical Care Medicine, Washington University School of Medicine, 660 South Euclid Avenue, Campus Box 8052, St Louis, MO 63110. Email: [email protected]
Mortality and Length of Stay Trends Following Implementation of a Rapid Response System and Real-Time Automated Clinical Deterioration Alerts
Marin H. Kollef, MD1, Kevin Heard, BS2, Yixin Chen, PhD1, Chenyang Lu, PhD1, Nelda Martin, APRN3, and Thomas Bailey, MD1
AbstractA study was performed to determine the potential influence of a rapid response system (RRS) employing real-time clinical deterioration alerts (RTCDAs) on patient outcomes involving 8 general medicine units. Introduction of the RRS occurred in 2006 with staged addition of the RTCDAs in 2009. Statistically significant year-to-year decreases in mortality were observed through 2014 (r = −.794; P = .002). Similarly, year-to-year decreases in the number of cardiopulmonary arrests (CPAs; r = −.792; P = .006) and median lengths of stay (r = −.841; P = .001) were observed. There was a statistically significant year-to-year increase in the number of RRS activations for these units (r = .939; P < .001) that was inversely correlated with the occurrence of CPAs (r = −.784; P = .007). In this single-institution retrospective study, introduction of a RRS employing RTCDAs was associated with lower hospital mortality, CPAs, and hospital length of stay.
Keywordsclinical deterioration alert, rapid response system, hospital length of stay, morbidity and mortality
Ø 背景
• 日々の採血デーアやバイタルサインから成る予測モデル(病院独自のモデル)は、一般病棟入室患者の病態の悪化や、ICU搬送の必要性、病院死亡率を予測できる。
• real-timeclinicaldeteriorationalerts(RTCDAs)の開発は、ワシントン大学とバーンズユダヤ病院で行われた共同プログラムの一環である。
• RTCDA予測モデルは、一般病棟からの患者データを用いて開発、検証された。内部には開発されたJavaベースの臨床判断支援ルールエンジンが用いられた。
• 臨床データの悪化からリスクがあると特定された患者は、リアルタイムでRRSチームのナースに自動アラートが送信される。 RTCDAは365日24時間作成される。
Ø 目的• RTCDAsを使用したRRSの効果を検討する。
Ø デザイン:後ろ向き研究
Ø Setting: ミズーリ州セントルイスにある1250床の学術医療センターBarnes-JewishHospital
Ø 対象:8つの成人病棟
基本は、患者4人に対しナース1人の配置。
Ø RRTメンバー: registerednurse、2〜3年目のmedicineresident、呼吸療法士。
– RRSナースは、2011年以前はICUから交替で担っていた。2012年からは専属。病院から貸与されたRTCDAsが送られる携帯電話を携帯し、受信後20分以内にすべてのアラートに応答する。
– RRSナースは、アラートが発信された患者をMEWSを使用し評価し、さらにそれらのcriteriaに基づいて臨床判断・トリアージする。そしてRRS医師または主治医と討議する。
Ø 期間:2003年1月1日〜2014年12月31日Ø 除外基準:DNARを表明している患者。緩和ケアを受けている患者。
14 American Journal of Medical Quality 32(1)
to respond to RRS calls as they occurred. Starting in 2012, the RRS team nurse member was established as a dedicated position without other clinical responsibilities. The RRS nurse carries a hospital-issued mobile phone to which the RTCDAs were sent and was instructed to respond to all alerts within 20 minutes of their receipt. Internal audits conducted by the Center for Clinical Excellence, BJC Healthcare, throughout the study period have demonstrated that RRS nurse response times have been less than 10 minutes for more than 95% of all alerts generated. The RRS nurse would initially evaluate the alerted patient using the Modified Early Warning Score17,18 and make further clinical and triage decisions based on those criteria and discussions with the RRS phy-sician or the patient’s treating physicians. The RRS/RTCDAs was only employed on the 8 general medicine units through 2014. Cardiopulmonary arrests (CPAs) were defined as the need for cardiopulmonary resuscita-tion or emergent tracheal intubation.
Statistical AnalysisTo evaluate the effectiveness of the RRS/RTCDAs, the yearly hospital mortality, incidence of CPAs, and median hospital length of stay were compared for the study years 2003 to 2014. Data on CPAs were only available starting in 2005. The number and year-to-year change in RRS acti-vations also was assessed and compared to the occurrence of CPAs. Year-to-year changes in hospital mortality, CPAs, and hospital length of stay, as well as the relation-ship between CPAs and RRS activations was described by the Pearson correlation coefficient. Linear regression was used to assess the relationship between changes in year-to-year outcomes while controlling for comorbidities with the Charlson comorbidity score, patient age, and sex.
Analyses were performed using SPSS, version 11.0 for Windows (SPSS, Inc., Chicago, Illinois).
ResultsBetween January 1, 2003, and December 31, 2014, a total of 163 311 consecutive patients were admitted to the gen-eral medicine units (Table 2). There was a statistically significant year-to-year decrease in hospital mortality for patients admitted to the general medicine units (r = −.794; P = .002; Figure 1). Linear regression identified study year to be an independent determinant of hospital mortal-ity (0.108% decrease in hospital mortality per study year increment; 95% confidence interval [CI], 0.091% to 0.125%; P < .001). There also was a statistically signifi-cant year-to-year decrease in the number of CPAs for patients admitted to the general medicine units (r = −.792; P = .006; Figure 2).
A statistically significant year-to-year increase was observed in the number of RRS activations for the gen-eral medicine units (r = .939; P < .001; Figure 2). A sta-tistically significant inverse correlation was found between the occurrence of CPAs and the number of RRS activations (r = −.784; P = .007; Figure 2). Linear regres-sion identified study year to be an independent determi-nant of CPAs (3.367 decrease in CPAs per study year increment; 95% CI = 2.213 CPAs to 4.521 CPAs; P = .019). Median hospital length of stay demonstrated a sta-tistically significant year-to-year decrease during the study years for patients admitted to the general medicine units (r = −.841; P = .001; Figure 3). Linear regression analysis identified study year to be an independent deter-minant of the median hospital length of stay (0.081 day decrease in median hospital length of stay per study year increment; 95% CI = 0.055 days to 0.107 days; P = .015).
Table 2. Study Population Characteristics.a
2003 2004 2005 2006 2007 2008 2009 2010 2011 2012 2013 2014
General medicine units Patient number 11 404 13 127 13 709 12 379 11 839 13 577 14 512 14 523 14 535 14 712 14 199 14 795 Age, years 60
[46, 76]60
[46, 75]60
[46, 75]59
[45, 75]58
[45, 73]57
[44, 73]57
[44, 71]56
[43, 70]57
[44, 70]56
[43, 70]57
[44, 69]57
[44, 69] Male, % 44.7 45.6 45.4 44.5 46.1 45.4 46.8 45.6 46.5 47.2 48.2 48.2 Charlson score 4 [2, 6] 4 [2, 6] 4 [2, 6] 4 [2, 7] 4 [2, 7] 4 [2, 7] 4 [2, 7] 4 [2, 7] 5 [2, 7] 5 [2, 8] 5 [2, 8] 5 [2, 8] Income, US$ 30 962
[252 89, 37 963]
30 887 [25 289, 37 963]
30 887 [25 289, 37 793]
30 876 [25 289, 37 555]
30 876 [25 289, 37 555]
30 074 [25 234, 37 555]
29 281 [25 234, 37 555]
28 973 [24 830, 36 744]
30 028 [25 118, 37 555]
30 091 [25 234, 37 503]
30 091 [25 189, 37 555]
29 286 [25 234, 37 793]
Hospital mortality, % 2.87 2.99 2.63 2.59 2.50 2.36 2.22 2.11 2.26 2.41 2.41 2.22 Cardiopulmonary
arrests, nn/a n/a 57 50 69 58 49 43 51 43 37 35
Hospital length of stay, days
3.79 [2.02, 6.81]
3.69 [1.99, 6.68]
3.54 [1.94, 6.36]
3.59 [1.98, 6.39]
3.52 [1.95, 6.31]
3.23 [1.84, 6.01]
3.08 [1.78, 5.79]
3.17 [1.82, 5.85]
3.34 [1.85, 5.99]
3.24 [1.86, 5.93]
3.28 [1.84, 5.98]
3.10 [1.75, 5.82]
Rapid Response System activation
0 0 0 72 57 112 126 149 309 419 400 370
aCardiopulmonary arrest data only collected beginning in 2005. Values expressed as medians with interquartile range. Nursing staffing ratios and physician coverage models were stable over this time period.
• 2003年から2014年までに合計163311人が入院した。• RTCDAsより発生した全アラートの95%以上で、RRSナースが10分
未満に対応していた。
Kollef et al 15
Figure 1. Hospital mortality for January 1, 2003, through December 31, 2014, for the 8 general medicine units.Solid line represents the mean value with the dashed lines depicting the upper and lower limits of the 95% confidence intervals. P = .002 for the year-to-year decrease in hospital mortality for patients admitted to the general medicine units.
Figure 2. Cardiopulmonary arrests between January 1, 2005, and December 31, 2014, for the 8 general medicine units.P = .006 for the year-to-year decrease in cardiopulmonary arrests for patients admitted to the general medicine units. P < .001 for the year-to-year increase in rapid response system activations. Cardiopulmonary arrest data were only available starting in 2005.Abbreviation: RRT, rapid response team.
Discussion
This single-institution retrospective study demonstrated that the introduction of an institution-specific RRS employ-ing RTCDAs on general medicine units was associated with lower mortality, decreased occurrence of CPAs, and
reduced hospital stay. The study also found year-to-year reductions in CPAs to be significantly correlated with increasing RRS activations.
The study RRS is unique in employing RTCDAs, in addition to nursing assessments, in order to trigger the RRS. Davis et al recently described a successful RRS
• 入院患者の院内死亡率は年率で有意に低下した(r=-.794;P=.002)。線形回帰で、study yearが病院死亡
率の独立した決定要因であることを特定された。(年ごとの病院死亡率の減少率0.108%、95%信頼区間[CI]、0.091%〜0.125%、P<.001)。
Kollef et al 15
Figure 1. Hospital mortality for January 1, 2003, through December 31, 2014, for the 8 general medicine units.Solid line represents the mean value with the dashed lines depicting the upper and lower limits of the 95% confidence intervals. P = .002 for the year-to-year decrease in hospital mortality for patients admitted to the general medicine units.
Figure 2. Cardiopulmonary arrests between January 1, 2005, and December 31, 2014, for the 8 general medicine units.P = .006 for the year-to-year decrease in cardiopulmonary arrests for patients admitted to the general medicine units. P < .001 for the year-to-year increase in rapid response system activations. Cardiopulmonary arrest data were only available starting in 2005.Abbreviation: RRT, rapid response team.
Discussion
This single-institution retrospective study demonstrated that the introduction of an institution-specific RRS employ-ing RTCDAs on general medicine units was associated with lower mortality, decreased occurrence of CPAs, and
reduced hospital stay. The study also found year-to-year reductions in CPAs to be significantly correlated with increasing RRS activations.
The study RRS is unique in employing RTCDAs, in addition to nursing assessments, in order to trigger the RRS. Davis et al recently described a successful RRS
• 入院患者のCPA数は、有意に低下した(r=-.792;P=.006)。
• RRSの発令数は、年々有意に増加した。(r=.939;P<.001)
• CPAの発生とRRS発令数との間
には、有意な逆相関が見られた(r=-.784;P=0.007)。線形回帰で、studyyearが CPAの独
立した決定であると特定された(studyyear増分あたりCPAが3.367減少。95%CI=2.213CPAsto4.521CPAs;P=.019)。
16 American Journal of Medical Quality 32(1)
employing a novel curriculum aimed at hospital unit managers and primary responders (nurses and respira-tory therapists).19 The RRS curriculum was designed to be a comprehensive tool to support inpatient resuscita-tion management utilizing quality improvement data, staff training, and focused initiatives. Davis et al found that the incidence of non-ICU CPAs decreased signifi-cantly whereas the incidence of ICU CPAs remained unchanged. Moreover, hospital mortality significantly decreased with implementation of their RRS and they observed a year-to-year change in the incidence of Code Blue that was inversely related to the change in RRS activations. Chen et al described the experience in New South Wales, Australia, where dedicated efforts toward implementing RRSs and improving the clinical impact of such systems have been in place for more than a decade.20 Among 82 acute care hospitals with more than 9 million admissions, these investigators found that as RRSs were progressively introduced, there was a coin-cidental reduction in CPAs and hospital mortality. The RRSs described by Davis et al and Chen et al utilized traditional bedside staff approaches for the activation of the RRS. The present study experience suggests that automated real-time alerts generated by informatics sys-tems also can be successfully applied to trigger RRS activations.
Other recent investigations also have suggested that the introduction of RRSs can improve patient outcomes in the hospital setting. Maharaj et al conducted a system-atic review of all studies conducted between 1990 and 2013 to assess the impact of RRSs on patient outcomes.21
These investigators identified 29 eligible studies involv-ing either adult or pediatric patients. The implementation of RRSs was associated with an overall reduction in hos-pital mortality in both the adult (relative risk [RR] = 0.87; 95% CI = 0.81-0.95) and pediatric (RR = 0.82; 95% CI = 0.76-0.89) inpatient populations. However, there was substantial heterogeneity in both populations. RRS teams also were associated with a reduction in CPAs in adult (RR = 0.65; 95% CI = 0.61-0.70) and pediatric (RR = 0.64; 95% CI = 0.55-0.74) patients. Meta-regression did not identify the presence of a physician in the RRS to be significantly associated with a mortality reduction. A more recent study has shed light on the tim-ing of RRSs and patient outcomes. Chen et al found that RRS activation more than 15 minutes after detection and documentation of patient instability was indepen-dently associated with an increased risk of ICU admis-sion and hospital mortality.22 The use of an RTCDA is a method that can ensure rapid activation of the RRS once an alert for clinical deterioration is identified, thus mini-mizing any delays that could occur with a nonautomated system. Interestingly, the maximum number of RRS acti-vations, approximately one per day, is lower than that described by others.19 This is likely a function of the desire to limit false negative alerts. However, the major-ity of the RRS alerts were for preemptive respiratory and hemodynamic deterioration (Table 1). This may explain the observed decreasing rate of CPAs over time.
Although statistically significant and potentially clin-ically important outcome improvements were observed with the implementation of the RRS/RTCDAs on the 8
Figure 3. Hospital length of stay between January 1, 2003, and December 31, 2014, for the 8 general medicine units.Hospital length of stay showed a statistically significant decrease over this time period for patients admitted to the general medicine units (P = .001).
• 一般病棟入院患者の入院期間中央値は、年々有意に減少した(r=-841;P=.001)。• 線形回帰分析で、study yearが入院期間中央値の独立した決定要因であると特定され
た(study year増分あたりの入院期間中央値の減少0.081日;95%CI=0.055daysto0.107days;P=.015)。
この研究のまとめ
• 単施設での後ろ向き研究では、RTCDA使用したRRSの導入は、院内死亡率、CPA発生率、入院期間の有意な減少を認めた。
• RRS件数の増加とCPA発生数の減少は、有意に相関した。
• 情報科学システムによって生成された自動リアルタイムアラート(RTCDA)も、RRS活動のトリガーにうまく適用できることが示唆された。
• 研究の限界として、経時的なアウトカムを調整するために疾患の生理学的重症度を使用しなかった。病棟患者の重症度が低下していたら、結果への潜在的バイアスとなりうる。(しかしCharlson comorbidityscores(チャールソン併存疾患指数)が増加していることを考慮すると影響は少ないかもしれない。 )
本日のまとめ
• RRS導入の効果を証明した大規模RCTはない。• 小規模の単施設前後比較研究では、RRS導入に
より院内死亡率/CPA発生率が低下した結果も出ている。今後の研究結果が待たれる。
• 本邦からの報告はまだ少なく、データを蓄積している段階である。
• 当院のRRSは発令件数が少なく、“RRT dose”を考えると「入り口(Afferent component)」を増やす取り組みが必要である。
• 近年、早期および適切なタイミングでのRRT介入のために、新スコアや自動アラートシステムの検討がされている。
私見
• RRSの効果が発揮されるために1000入院あたり25回のRRTdoseを考えると、当院のRRS発令数は極端に少ない。理想値を計算するとかなりの発令数(3桁位)となり、現時点ではかなり現実的ではないように思う。
• 今後の研究の蓄積を待つしかないが、RRTdoseは、各病院のスタッフの数や質、体制、重症度などにも大きく左右されると思われ、25回/1000入院の数値より少ない発令数でも効果は期待できないのだろうか。
• いずれにしても、当院において“入り口(Afferentcomponent)”を増やす努力をしていく必要がある。そのためには、まずリソースナースのラウンドや勉強会の開催等によってRRSの周知の機会を増やすことはすぐに取りかかれることであると感じた。