Embed Size (px)
Citation preview
Moscow 2015
RUSSIA` 2015STATISTICAL POCKETBOOK
FEDERAL STATE STATISTICS SERVICE (Rosstat)
UDK 31(470)
The Editorial Board:
A. Surinov – Chairman of the Editorial Board
E. Baranov, N. Bugakova, M. Gelvanovsky, L. Gokhberg, M. Dianov, V. Elizarov, V. Zhitkov, V. Zabelin, Yu. Ivanov, A. Kevesh, A. Kosarev, K. Laikam, I. Masakova, V. Nesterov, G. Oksenoit, O. Rybak, B. Ryabushkin, A. Tatarinov, A. Khoroshilov
Russia` 2015: Statistical pocketbook/ Rosstat. – Moscow, 2015. – 62 pp.
ISBN 978-5-89476-399-6The statistical pocketbook gives concise information
related to social and economic development of Russia in 2014 as compared to the previous year.
Main indicators data is provided reflecting demo-graphic processes, labour market, social field and living standard, trade, financial situation, external economic activities. Information is provided related to selected economic activities in accordance with OKVED. Main so-cial and economic indicators by the federal districts of the Russian Federation are presented.
2014 data on some of indicators is preliminary and is subject to further revisions.
UDK 31(470)
ISBN 978-5-89476-399-6 © Federal State Statistics Service, 2015 E-mail: [email protected] http://www.gks.ru

�RUSSIA’ 2015
GENERAL CHARACTERISTICS
Capital city – MoscowRussia covers Eastern Europe and Northern AsiaArea1) – 17.1 mln. sq. km (13 percent of agricultural land, 51 percent of forest land, 13 percent of surface water, including swamps)Population2) 146267 thou. persons (as of 01.01. 2015)Population density – 8.5 person per 1 sq. km
(as of 01.01. 2015)Maximum stretch, thou. km: longitudinal – 4 latitudinal – 9Russia is bounded by: Arctic Ocean seas (Barents, White, Kara, Laptev, East Siberian, Chukchi seas); Pacific Ocean seas (Bering, sea of Оkhotsk, sea of Japan); Atlantic Ocean seas (Baltic, Black, sea of Azov)The largest islands, thou. sq. km : Novaya Zemlya 82.6 Sakhalin 76.4 New Siberian 38 Severnaya Zemlya 37State borders:in the North West with Norway and Finland;in the West with Poland, Estonia, Latvia, Lithuania and Belarus;in the South West with Ukraine;in the South with Abkhazia, Georgia, South Osetia, Azerbaijan and Kazakhstan;in the South East with China, Mongolia and the Democratic People’s Republic of Korea;in the East (sea borders) with USA and JapanThe longest rivers, thou. km: Lena 4.3 Ob’ 3.7 Volga 3.5 Yenisey 3.5 Amur 2.8
1) Data source: Federal Service for State Registration, Cadastre and Cartography as of 01.01.2014 with due regard to data from the Ministry of Property and Land Relations of the Republic of Crimea on the area of the Republic of Crimea - 26.1 thou. sq. km . Depart-ment of State Registration of Rights and Cadastre of the City of Sevastopol on the area of the City of Sevastopol - 0.9 thou. sq. km .2) With due regard to data on the Crimean Federal District.
� RUSSIA’ 2015
General Characteristics
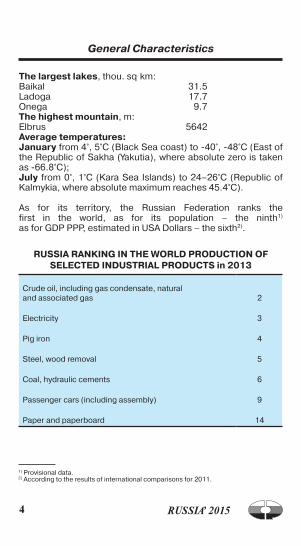
The largest lakes, thou. sq. km: Baikal 31.5 Ladoga 17.7 Onega 9.7The highest mountain, m: Elbrus 5642Average temperatures:January from 4°, 5°C (Black Sea coast) to -40°, -48°C (East of the Republic of Sakha (Yakutia), where absolute zero is taken as -66.8°C);July from 0°, 1°C (Kara Sea Islands) to 24–26°C (Republic of Kalmykia, where absolute maximum reaches 45.4°C).
As for its territory, the Russian Federation ranks the first in the world, as for its population – the ninth1)
as for GDP PPP, estimated in USA Dollars – the sixth2).
RUSSIA RANKING IN THE wORLD PRODUCTION OF SELECTED INDUSTRIAL PRODUCTS in 2013
Crude oil, including gas condensate, natural and associated gas 2
Electricity 3
Pig iron 4
Steel, wood removal 5
Coal, hydraulic cements 6
Passenger cars (including assembly) 9
Paper and paperboard 14
1) Provisional data.2) According to the results of international comparisons for 2011.
�RUSSIA’ 2015
General Characteristics
STATE SYSTEMAccording to the Constitution, the Russian Federation – Russia is
a democratic federative law-governed state with a republican form of government (Article 1).
State power in the Russian Federation shall be exercised by the President of the Russian Federation, the Federal Assembly (the Council of Federation and the State Duma), the Government of the Russian Federation, and the courts of the Russian Federation (Article 11).
The President of the Russian Federation shall be the Head of State and shall be elected for six years by citizens of the Russian Federation on the basis of universal, equal, direct suffrage by secret ballot (Articles 80, 81).
The Federal Assembly - parliament of the Russian Federation shall be the representative and legislative body of the Russian Federation and shall consist of two chambers - the Council of Federation and the State Duma. The Council of Federation shall include two representatives from each constituent entity of the Russian Federation: one from the legisla-tive (representative) and one from the executive State government body; representatives of the Russian Federation, appointed by the President of the Russian Federation, such representatives shall not exceed 10 percent of the total number of the Federation Council members – representatives from legislative (representative) and executive State government bodies of constituent entities of the Russian Federation. The State Duma shall consist of 450 deputies and shall be elected for a term of five years (Ar-ticles 94–96).
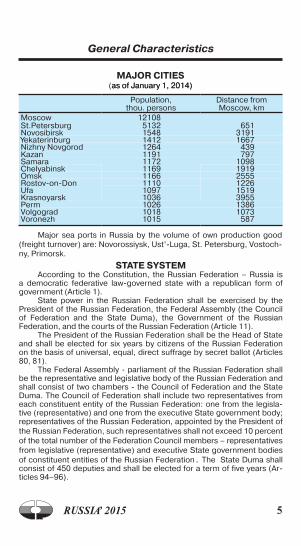
MAJOR CITIES (as of January 1, 2014)as of January 1, 2014)
Population, thou. persons
Distance from Moscow, km
Moscow 12108St.Petersburg 5132 651Novosibirsk 1548 3191Yekaterinburg 1412 1667Nizhny Novgorod 1264 439Kazan 1191 797Samara 1172 1098Chelyabinsk 1169 1919Omsk 1166 2555Rostov-on-Don 1110 1226Ufa 1097 1519Krasnoyarsk 1036 3955Perm 1026 1386Volgograd 1018 1073Voronezh 1015 587
Major sea ports in Russia by the volume of own production good (freight turnover) are: Novorossiysk, Ust’-Luga, St. Petersburg, Vostoch-ny, Primorsk.
� RUSSIA’ 2015
General Characteristics
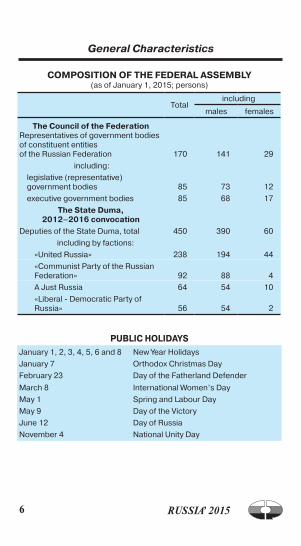
COMPOSITION OF THE FEDERAL ASSEMBLY(as of January 1, 2015; persons)
Total including
males females
The Council of the FederationRepresentatives of government bodies of constituent entities of the Russian Federation 170 141 29
including:
legislative (representative) government bodies 85 73 12
executive government bodies 85 68 17
The State Duma, 2012–2016 convocation
Deputies of the State Duma, total 450 390 60
including by factions:
«United Russia» 238 194 44
«Communist Party of the Russian Federation» 92 88 4
A Just Russia 64 54 10
«Liberal - Democratic Party of Russia» 56 54 2
PUBLIC HOLIDAYS
January 1, 2, 3, 4, 5, 6 and 8 New Year Holidays
January 7 Orthodox Christmas Day
February 23 Day of the Fatherland Defender
March 8 International Women’s Day
May 1 Spring and Labour Day
May 9 Day of the Victory
June 12 Day of Russia
November 4 National Unity Day
�RUSSIA’ 2015
General Characteristics
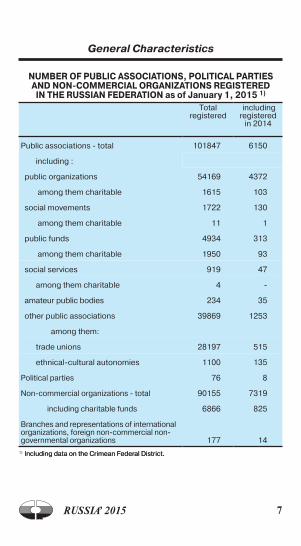
NUMBER OF PUBLIC ASSOCIATIONS, POLITICAL PARTIES AND NON-COMMERCIAL ORGANIZATIONS REGISTERED
IN THE RUSSIAN FEDERATION as of January 1, 2015 1)
Total registered
including registered
in 2014
Public associations - total 101847 6150
including :
public organizations 54169 4372
among them charitable 1615 103
social movements 1722 130
among them charitable 11 1
public funds 4934 313
among them charitable 1950 93
social services 919 47
among them charitable 4 -
amateur public bodies 234 35
other public associations 39869 1253
among them:
trade unions 28197 515
ethnical-cultural autonomies 1100 135
Political parties 76 8
Non-commercial organizations - total 90155 7319
including charitable funds 6866 825
Branches and representations of international organizations, foreign non-commercial non-governmental organizations 177 14
1) Including data on the Crimean Federal District.Including data on the Crimean Federal District..

� RUSSIA’ 2015
POPULATION AND LABOUR MARKET
POPULATION (as of January 1 ; mln. persons)
2014 20151)
Total 143.7 146.3urban 106.6 108.3rural 37.1 38.0
1) InIncluding data on the Crimean Federal District.
VITAL STATISTICS (per 1000 population)
2013 20141)
Births 13.2 13.3Deaths 13.0 13.1Natural increase, decrease (-) 0.2 0.2Infant deaths under 1 year per 1000 live births 8.2 7.4Marriages 8.5 8.4Divorces 4.7 4.8
1) Provisional data. Including data on the Crimean Federal District.
Thou. persons
Females – 77120 thou. Males – 66547 thou.
1400 1200 1000 800 600 400 200 0 0 200 400 600 800 1000 1200 1400
100
95
90
85
80
75
70
65
60
55
50
45
40
35
30
25
20
15
10
5
0
POPULATION BY AGE AND SEX (as of January 1, 2014)
Age, years
�RUSSIA’ 2015
Population and Labour Market
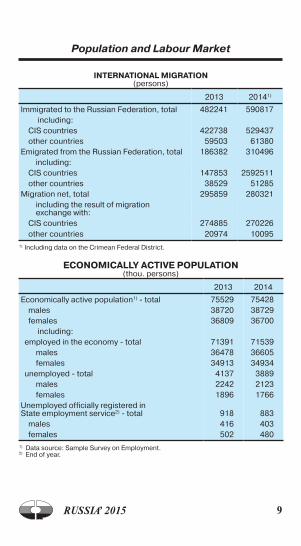
INTERNATIONAL MIGRATION(persons)
2013 20141)
Immigrated to the Russian Federation, total 482241 590817 including:
CIS countries 422738 529437other countries 59503 61380
Emigrated from the Russian Federation, total 186382 310496including:
CIS countries 147853 2592511other countries 38529 51285
Migration net, total 295859 280321including the result of migration exchange with:
CIS countries 274885 270226other countries 20974 10095
1) Including data on the Crimean Federal District.
ECONOMICALLY ACTIVE POPULATION(thou. persons)
2013 2014
Economically active population1) - total 75529 75428males 38720 38729females 36809 36700
including:employed in the economy - total 71391 71539
males 36478 36605females 34913 34934
unemployed - total 4137 3889males 2242 2123females 1896 1766
Unemployed officially registered inState employment service2) - total 918 883
males 416 403females 502 480
1) Data source: Sample Survey on Employment.2) End of year.
10 RUSSIA’ 2015
Population and Labour Market
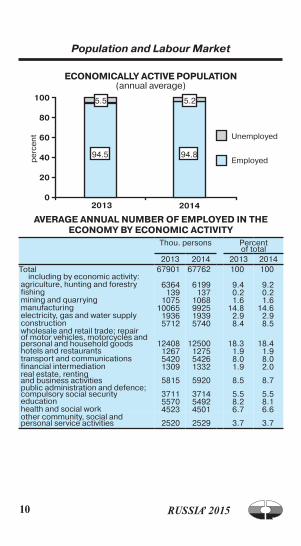
ECONOMICALLY ACTIVE POPULATION (annual average)
Unemployed
Employedpe
rce
nt
AVERAGE ANNUAL NUMBER OF EMPLOYED IN THE ECONOMY BY ECONOMIC ACTIVITY
Thou. persons Percent of total
2013 2014 2013 2014Total 67901 67762 100 100
including by economic activity:agriculture, hunting and forestry 6364 6199 9.4 9.2fishing 139 137 0.2 0.2mining and quarrying 1075 1068 1.6 1.6manufacturing 10065 9925 14.8 14.6electricity, gas and water supply 1936 1939 2.9 2.9construction 5712 5740 8.4 8.5wholesale and retail trade; repair of motor vehicles, motorcycles and personal and household goods 12408 12500 18.3 18.4hotels and restaurants 1267 1275 1.9 1.9transport and communications 5420 5426 8.0 8.0financial intermediation 1309 1332 1.9 2.0real estate, renting and business activities 5815 5920 8.5 8.7public administration and defence; compulsory social security 3711 3714 5.5 5.5education 5570 5492 8.2 8.1health and social work 4523 4501 6.7 6.6other community, social and personal service activities 2520 2529 3.7 3.7
100
80
60
40
20
02013 2014
5.5
94.5
5.2
94.8
11RUSSIA’ 2015
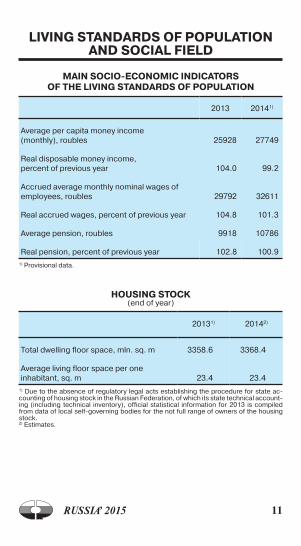
LIVING STANDARDS OF POPULATION AND SOCIAL FIELD
MAIN SOCIO-ECONOMIC INDICATORS OF THE LIVING STANDARDS OF POPULATION
2013 20141)
Average per capita money income (monthly), roubles 25928 27749
Real disposable money income, percent of previous year 104.0 99.2
Accrued average monthly nominal wages of employees, roubles 29792 32611
Real accrued wages, percent of previous year 104.8 101.3
Average pension, roubles 9918 10786
Real pension, percent of previous year 102.8 100.91) Provisional data.
HOUSING STOCK(end of year)
20131) 20142)
Total dwelling floor space, mln. sq. m 3358.6 3368.4
Average living floor space per one inhabitant, sq. m 23.4 23.4
1) Due to the absence of regulatory legal acts establishing the procedure for state ac-counting of housing stock in the Russian Federation, of which its state technical account-ing (including technical inventory), official statistical information for 2013 is compiled from data of local self-governing bodies for the not full range of owners of the housing stock.2) Estimates.
12 RUSSIA’ 2015
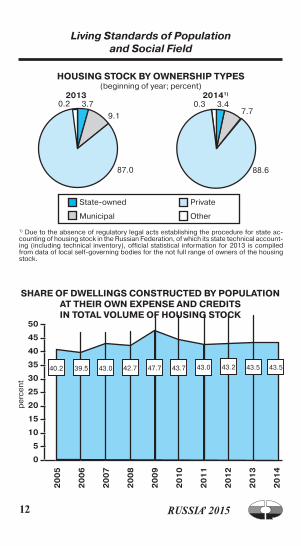
Living Standards of Population and Social Field
HOUSING STOCK BY OwNERSHIP TYPES (beginning of year; percent)
2013 20141)
SHARE OF DwELLINGS CONSTRUCTED BY POPULATION AT THEIR OwN EXPENSE AND CREDITS IN TOTAL VOLUME OF HOUSING STOCK
State-owned
Municipal
Private
Other
pe
rce
nt
50
45
40
35
30
25
20
15
10
5
0
20
05
20
06
20
07
20
08
20
09
20
10
20
11
20
12
20
13
20
14
39.540.2 43.0 42.7 47.7
3.7
9.1
87.0
0.2
43.7 43.0 43.5
1) Due to the absence of regulatory legal acts establishing the procedure for state ac-counting of housing stock in the Russian Federation, of which its state technical account-ing (including technical inventory), official statistical information for 2013 is compiled from data of local self-governing bodies for the not full range of owners of the housing stock.
43.2
3.47.7
88.6
0.3
43.5
1�RUSSIA’ 2015
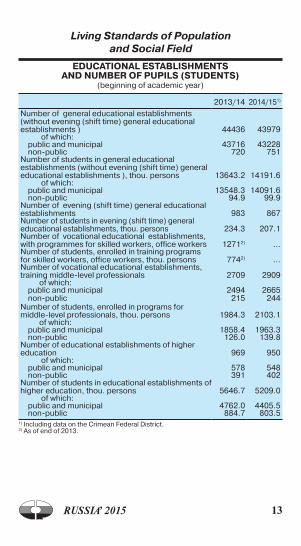
Living Standards of Population and Social Field
EDUCATIONAL ESTABLISHMENTS AND NUMBER OF PUPILS (STUDENTS)
(beginning of academic year)
2013/14 2014/151)
Number of general educational establishments (without evening (shift time) general educational establishments ) 44436 43979
of which:public and municipal 43716 43228non-public 720 751
Number of students in general educational establishments (without evening (shift time) general educational establishments ), thou. persons 13643.2 14191.6
of which:public and municipal 13548.3 14091.6non-public 94.9 99.9
Number of evening (shift time) general educational establishments 983 867Number of students in evening (shift time) general educational establishments, thou. persons 234.3 207.1Number of vocational educational establishments, with programmes for skilled workers, office workers 12712) ...Number of students, enrolled in training programs for skilled workers, office workers, thou. persons 7742) ...Number of vocational educational establishments, training middle-level professionals 2709 2909
of which:public and municipal 2494 2665non-public 215 244
Number of students, enrolled in programs for middle-level professionals, thou. persons 1984.3 2103.1
of which:public and municipal 1858.4 1963.3non-public 126.0 139.8
Number of educational establishments of higher education 969 950
of which:public and municipal 578 548non-public 391 402
Number of students in educational establishments of higher education, thou. persons 5646.7 5209.0
of which:public and municipal 4762.0 4405.5non-public 884.7 803.5
1) Including data on the Crimean Federal District.2) As of end of 2013.
1� RUSSIA’ 2015
Living Standards of Population and Social Field
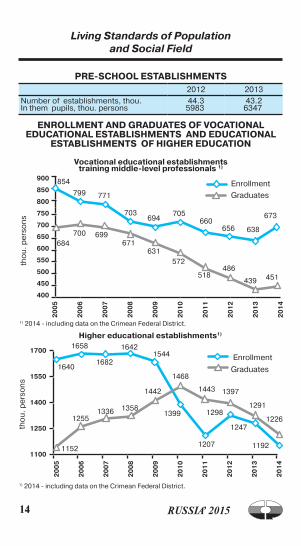
PRE-SCHOOL ESTABLISHMENTS2012 2013
Number of establishments, thou. 44.3 43.2In them pupils, thou. persons 5983 6347
ENROLLMENT AND GRADUATES OF VOCATIONAL EDUCATIONAL ESTABLISHMENTS AND EDUCATIONAL
ESTABLISHMENTS OF HIGHER EDUCATION
tho
u. p
ers
on
s
1640
1658
1152
1255
1700
1550
1400
1250
1100
20
05
20
06
20
07
20
08
20
09
20
10
20
11
20
12
20
13
20
14
1682
1336
Enrollment
Graduates
1642
1358
1544
1442
1399
1468
Vocational educational establishments training middle-level professionals 1)
tho
u. p
ers
on
s
Enrollment
Graduates
854
799
900
850
800
750
700
650
600
550
500
450
400
20
05
20
06
20
07
20
08
20
09
20
10
20
11
20
12
20
13
20
14
684699
771
700
703
631
694
671
705
572
Higher educational establishments1)
660
518
1207
1443
486
656
1397
12981226
1192
638
451
673
439
1247
1291
1) 2014 - including data on the Crimean Federal District.
1) 2014 - including data on the Crimean Federal District.

1�RUSSIA’ 2015
Living Standards of Population and Social Field
MAIN INDICATORS OF PUBLIC HEALTH (beginning of year)
2013 2014Number of physicians, persons:
total, thou. 703 703per 10 000 population 49 49
Number of medium-level medical personnel, persons:
total, thou. 1520 1518per 10 000 population 106 106
Number of hospitals, thou. 6.2 5.9Number of hospital beds:
total, thou. 1332 1302per 10 000 population 93 91
Number of medical organizations rendering out-patient services, thou. 16.5 16.5Capacity of medical organizations rendering out-patient services, number of patients’ visits per a shift:
total, thou. 3780 3799per 10 000 population 264 265
SANATORIA, RECREATION ORGANIZATIONS AND TOURIST BASES1)
(beginning of year)
2013 2014Number of sanatoria and habitations with medical treatment 1250 1211
Number of beds in them, thou. 342 333Number of rest homes 98 97
Number of beds in them, thou. 24 25Number of rest cases, campings and recreation organizations 1589 1515
Number of beds in them, thou. 191 180Number of tourist bases 159 155
Number of beds in them, thou. 16 16
1) Excluding micro businesses.
CULTURAL AND ART ESTABLISHMENTS
2012 2013
Number of public libraries, thou. 40.8 39.8Library stock, mln. copies 864 851Number of clubs and related establishments, thou. 43.7 42.4Number of museums 2687 2727Number of visits to museums, mln. 90.1 95.8Number of professional theatres 643 658Theatre attendance, mln. persons 33.9 35.8
1� RUSSIA’ 2015
Living Standards of Population and Social Field
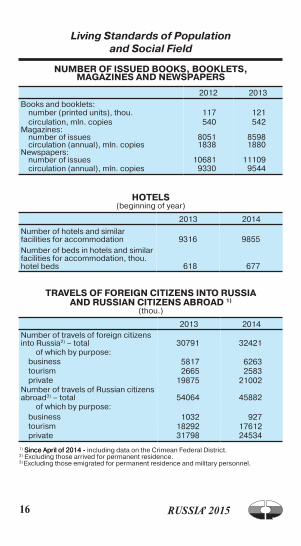
NUMBER OF ISSUED BOOKS, BOOKLETS, MAGAZINES AND NEwSPAPERS
2012 2013
Books and booklets:number (printed units), thou. 117 121circulation, mln. copies 540 542
Magazines:number of issues 8051 8598circulation (annual), mln. copies 1838 1880
Newspapers:number of issues 10681 11109circulation (annual), mln. copies 9330 9544
HOTELS(beginning of year)
2013 2014
Number of hotels and similar facilities for accommodation 9316 9855Number of beds in hotels and similar facilities for accommodation, thou. hotel beds 618 677
TRAVELS OF FOREIGN CITIZENS INTO RUSSIA AND RUSSIAN CITIZENS ABROAD 1)
(thou.)
2013 2014Number of travels of foreign citizens into Russia2) – total 30791 32421
of which by purpose:business 5817 6263tourism 2665 2583private 19875 21002
Number of travels of Russian citizens abroad3) – total 54064 45882
of which by purpose:business 1032 927tourism 18292 17612private 31798 24534
1) Since April of 2014 -Since April of 2014 - including data on the Crimean Federal District.2) Excluding those arrived for permanent residence.3) Excluding those emigrated for permanent residence and military personnel.
1�RUSSIA’ 2015
Living Standards of Population and Social Field
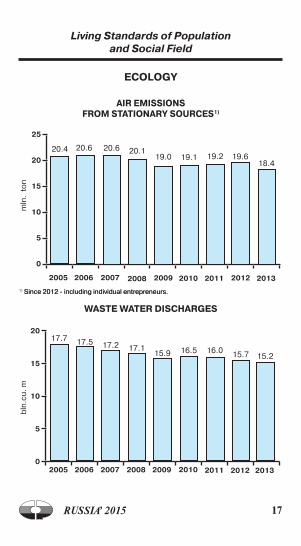
ECOLOGY
AIR EMISSIONS
FROM STATIONARY SOURCES1)
wASTE wATER DISCHARGES
bln
.cu
. mm
ln.
ton
25
20
15
10
5
0
200920062005
20
15
10
5
02005
17.7
2006
17.5
2007
20.4 20.6 20.6
2007
17.2
20.1
2008
17.1
2008
19.0
2009
15.9
19.1
2010
2010
16.5
19.2
2011
16.0
2011
19.6
2013
1) Since 2012 - including individual entrepreneurs.Since 2012 - including individual entrepreneurs.
15.2
2013
18.4
2012
15.7
2012
1� RUSSIA’ 2015
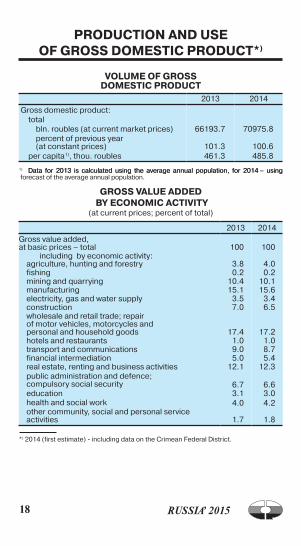
PRODUCTION AND USE OF GROSS DOMESTIC PRODUCT*)
VOLUME OF GROSS DOMESTIC PRODUCT
2013 2014
Gross domestic product:total
bln. roubles (at current market prices) 66193.7 70975.8percent of previous year (at constant prices) 101.3 100.6
per capita1), thou. roubles 461.3 485.8
1) Data for 2013 is calculated using the average annual population, for 2014 – usingData for 2013 is calculated using the average annual population, for 2014 – using forecast of the average annual population.
GROSS VALUE ADDED BY ECONOMIC ACTIVITY
(at current prices; percent of total)
2013 2014
Gross value added, at basic prices – total 100 100
including by economic activity:agriculture, hunting and forestry 3.8 4.0fishing 0.2 0.2mining and quarrying 10.4 10.1manufacturing 15.1 15.6electricity, gas and water supply 3.5 3.4construction 7.0 6.5wholesale and retail trade; repair of motor vehicles, motorcycles and personal and household goods 17.4 17.2hotels and restaurants 1.0 1.0transport and communications 9.0 8.7financial intermediation 5.0 5.4real estate, renting and business activities 12.1 12.3public administration and defence; compulsory social security 6.7 6.6education 3.1 3.0health and social work 4.0 4.2other community, social and personal service activities 1.7 1.8
*) 2014 (first estimate) - including data on the Crimean Federal District.
1�RUSSIA’ 2015
Production and Use of Gross Domestic Product
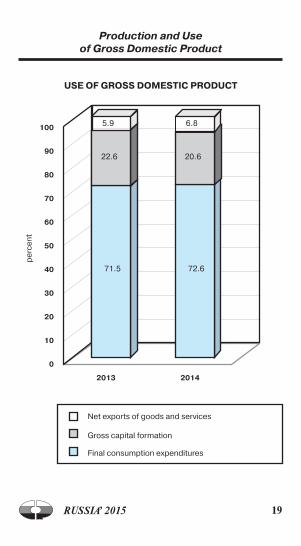
USE OF GROSS DOMESTIC PRODUCT
Net exports of goods and services
Gross capital formation
Final consumption expenditures
100
90
80
70
60
50
40
30
20
10
0
2013 2014
pe
rce
nt
5.9
22.6
71.5
6.8
20.6
72.6
20 RUSSIA’ 2015
INDUSTRY
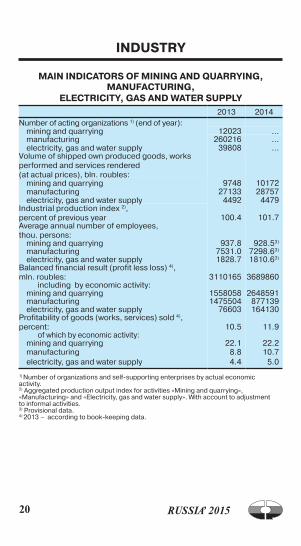
MAIN INDICATORS OF MINING AND QUARRYING, MANUFACTURING,
ELECTRICITY, GAS AND wATER SUPPLY
2013 2014Number of acting organizations 1) (end of year):
mining and quarrying 12023 ...manufacturing 260216 ...electricity, gas and water supply 39808 ...
Volume of shipped own produced goods, works performed and services rendered (at actual prices), bln. roubles:
mining and quarrying 9748 10172manufacturing 27133 28757electricity, gas and water supply 4492 4479
Industrial production index 2), percent of previous year 100.4 101.7Average annual number of employees, thou. persons:
mining and quarrying 937.8 928.53)
manufacturing 7531.0 7298.63)
electricity, gas and water supply 1828.7 1810.63)
Balanced financial result (profit less loss) 4), mln. roubles: 3110165 3689860
including by economic activity:mining and quarrying 1558058 2648591manufacturing 1475504 877139electricity, gas and water supply 76603 164130
Profitability of goods (works, services) sold 4), percent: 10.5 11.9
of which by economic activity:mining and quarrying 22.1 22.2manufacturing 8.8 10.7electricity, gas and water supply 4.4 5.0
1) Number of organizations and self-supporting enterprises by actual economic activity.2) Aggregated production output index for activities «Mining and quarrying», «Manufacturing» and «Electricity, gas and water supply». With account to adjustment to informal activities. 3) Provisional data.4) 2013 – according to book-keeping data.
21RUSSIA’ 2015
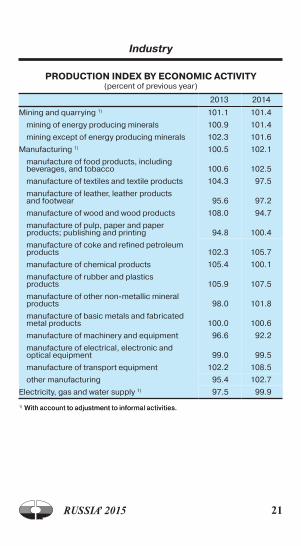
PRODUCTION INDEX BY ECONOMIC ACTIVITY(percent of previous year)
2013 2014
Mining and quarrying 1) 101.1 101.4
mining of energy producing minerals 100.9 101.4
mining except of energy producing minerals 102.3 101.6
Manufacturing 1) 100.5 102.1
manufacture of food products, including beverages, and tobacco 100.6 102.5
manufacture of textiles and textile products 104.3 97.5
manufacture of leather, leather products and footwear 95.6 97.2
manufacture of wood and wood products 108.0 94.7
manufacture of pulp, paper and paper products; publishing and printing 94.8 100.4
manufacture of coke and refined petroleum products 102.3 105.7
manufacture of chemical products 105.4 100.1
manufacture of rubber and plastics products 105.9 107.5
manufacture of other non-metallic mineral products 98.0 101.8
manufacture of basic metals and fabricated metal products 100.0 100.6
manufacture of machinery and equipment 96.6 92.2
manufacture of electrical, electronic and optical equipment 99.0 99.5
manufacture of transport equipment 102.2 108.5
other manufacturing 95.4 102.7
Electricity, gas and water supply 1) 97.5 99.9
1) With account to adjustment to informal activities.With account to adjustment to informal activities.
Industry
22 RUSSIA’ 2015
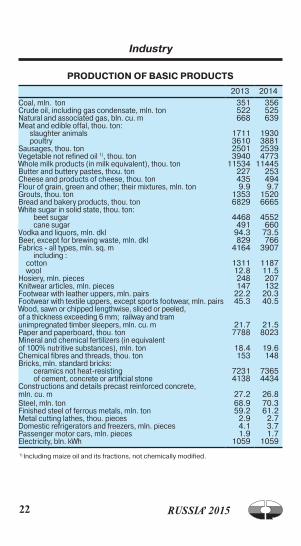
PRODUCTION OF BASIC PRODUCTS
2013 2014
Coal, mln. ton 351 356Crude oil, including gas condensate, mln. ton 522 525Natural and associated gas, bln. cu. m 668 639Meat and edible offal, thou. ton:
slaughter animals 1711 1930poultry 3610 3881
Sausages, thou. ton 2501 2539Vegetable not refined oil 1), thou. ton 3940 4773Whole milk products (in milk equivalent), thou. ton 11534 11445Butter and buttery pastes, thou. ton 227 253Cheese and products of cheese, thou. ton 435 494Flour of grain, green and other; their mixtures, mln. ton 9.9 9.7Grouts, thou. ton 1353 1520Bread and bakery products, thou. ton 6829 6665White sugar in solid state, thou. ton:
beet sugar 4468 4552cane sugar 491 660
Vodka and liquors, mln. dkl 94.3 73.5Beer, except for brewing waste, mln. dkl 829 766Fabrics - all types, mln. sq. m 4164 3907
including :cotton 1311 1187wool 12.8 11.5
Hosiery, mln. pieces 248 207Knitwear articles, mln. pieces 147 132Footwear with leather uppers, mln. pairs 22.2 20.3Footwear with textile uppers, except sports footwear, mln. pairs 45.3 40.5Wood, sawn or chipped lengthwise, sliced or peeled, of a thickness exceeding 6 mm; railway and tram unimpregnated timber sleepers, mln. cu. m 21.7 21.5Paper and paperboard, thou. ton 7788 8023Mineral and chemical fertilizers (in equivalent of 100% nutritive substances), mln. ton 18.4 19.6Chemical fibres and threads, thou. ton 153 148Bricks, mln. standard bricks:
ceramics not heat-resisting 7231 7365of cement, concrete or artificial stone 4138 4434
Constructions and details precast reinforced concrete,mln. cu. m 27.2 26.8Steel, mln. ton 68.9 70.3Finished steel of ferrous metals, mln. ton 59.2 61.2Metal cutting lathes, thou. pieces 2.9 2.7Domestic refrigerators and freezers, mln. pieces 4.1 3.7Passenger motor cars, mln. pieces 1.9 1.7Electricity, bln. kWh 1059 1059
Industry
1) Including maize oil and its fractions, not chemically modified.
2�RUSSIA’ 2015
AGRICULTURE AND FORESTRY*)
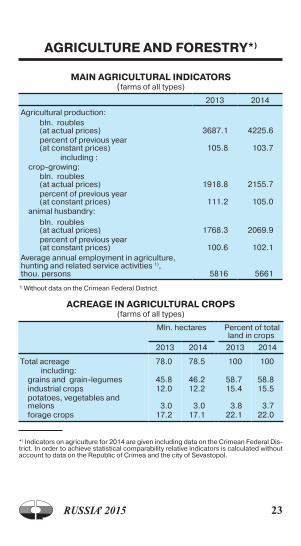
MAIN AGRICULTURAL INDICATORS (farms of all types)
2013 2014
Agricultural production:bln. roubles (at actual prices) 3687.1 4225.6percent of previous year (at constant prices) 105.8 103.7
including :crop-growing:
bln. roubles (at actual prices) 1918.8 2155.7percent of previous year (at constant prices) 111.2 105.0
animal husbandry:bln. roubles (at actual prices) 1768.3 2069.9percent of previous year (at constant prices) 100.6 102.1
Average annual employment in agriculture, hunting and related service activities 1), thou. persons 5816 5661
1) Without data on the Crimean Federal District.
ACREAGE IN AGRICULTURAL CROPS (farms of all types)
Mln. hectares Percent of total land in crops
2013 2014 2013 2014
Total acreage 78.0 78.5 100 100 including:
grains and grain-legumes 45.8 46.2 58.7 58.8industrial crops 12.0 12.2 15.4 15.5potatoes, vegetables and melons 3.0 3.0 3.8 3.7forage crops 17.2 17.1 22.1 22.0
*) Indicators on agriculture for 2014 are given including data on the Crimean Federal Dis-trict. In order to achieve statistical comparability relative indicators is calculated without account to data on the Republic of Crimea and the city of Sevastopol.
2� RUSSIA’ 2015
Agriculture and Forestry
Peasant (farm) enterprises, including individual entrepreneurs
Household enterprises
Agricultural enterprises
20.9
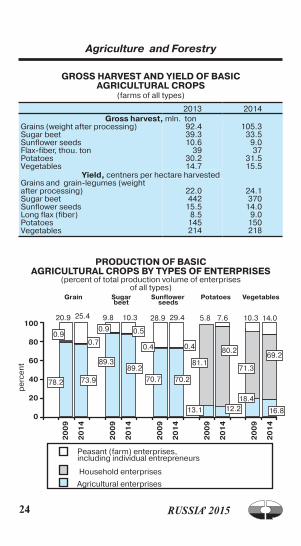
GROSS HARVEST AND YIELD OF BASIC AGRICULTURAL CROPS
(farms of all types)
2013 2014Gross harvest, mln. ton
Grains (weight after processing) 92.4 105.3Sugar beet 39.3 33.5Sunflower seeds 10.6 9.0Flax-fiber, thou. ton 39 37Potatoes 30.2 31.5Vegetables 14.7 15.5
Yield, centners per hectare harvestedGrains and grain-legumes (weight after processing) 22.0 24.1Sugar beet 442 370Sunflower seeds 15.5 14.0Long flax (fiber) 8.5 9.0Potatoes 145 150Vegetables 214 218
PRODUCTION OF BASIC AGRICULTURAL CROPS BY TYPES OF ENTERPRISES
(percent of total production volume of enterprises of all types)
Grain Sugar Sunflower Potatoes Vegetables beet seeds
100
80
60
40
20
0
20
09
20
14
20
09
20
14
20
09
20
14
20
09
20
14
20
09
20
14
14.010.37.65.89.825.4 29.428.910.3
0.7
0.9
78.2
13.1
81.1
70.270.7
89.3
73.9
69.2
71.3
80.2
89.2
0.5
0.4
12.2 16.8
18.4
pe
rce
nt
0.9
0.4
2�RUSSIA’ 2015
Agriculture and Forestry
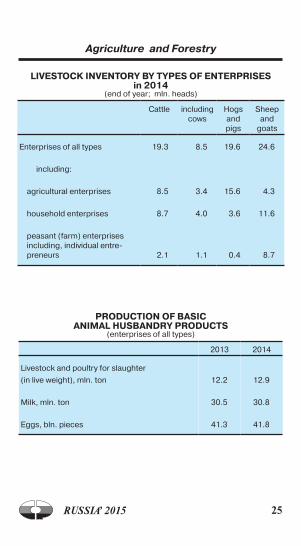
LIVESTOCK INVENTORY BY TYPES OF ENTERPRISES in 2014
(end of year; mln. heads)
Cattle including cows
Hogs and pigs
Sheep and
goats
Enterprises of all types 19.3 8.5 19.6 24.6
including:
agricultural enterprises 8.5 3.4 15.6 4.3
household enterprises 8.7 4.0 3.6 11.6
peasant (farm) enterprises including, individual entre-preneurs 2.1 1.1 0.4 8.7
PRODUCTION OF BASIC ANIMAL HUSBANDRY PRODUCTS
(enterprises of all types)
2013 2014
Livestock and poultry for slaughter
(in live weight), mln. ton
12.2
12.9
Milk, mln. ton 30.5 30.8
Eggs, bln. pieces 41.3 41.8

2� RUSSIA’ 2015
Peasant (farm) enterprises, including individual entrepreneurs
Household enterprises
Agricultural enterprises
PRODUCTION OF BASIC ANIMAL HUSBANDRY PRODUCTS BY TYPES OF ENTERPRISES
(percent of total production volume of enterprises of all types)
Meat and poultry for slaughter Milk Eggs (in live weight)
100
80
60
40
20
0
2009 2009 20092014 2014 2014
55.0 69.3
41.727.3 51.1
44.5
46.7
47.0
23.5 20.8
3.3 0.80.86.34.43.4
FOREST RESOURCES in 2013(end of year)
Total area of forest fund’s lands and lands of other categories, where forests are located, mln. ha 1183.4
including forest lands 891.2
of them covered with forest vegetation 795.3
Total wood stock, bln. cu. m 83.0
Agriculture and Forestry
75.7 78.4
pe
rce
nt
2�RUSSIA’ 2015
Agriculture and Forestry
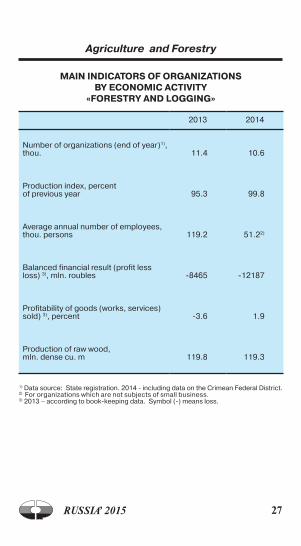
MAIN INDICATORS OF ORGANIZATIONS BY ECONOMIC ACTIVITY
«FORESTRY AND LOGGING»
2013 2014
Number of organizations (end of year)1), thou. 11.4 10.6
Production index, percent of previous year 95.3 99.8
Average annual number of employees, thou. persons 119.2 51.22)
Balanced financial result (profit less loss) 3), mln. roubles -8465 -12187
Profitability of goods (works, services) sold) 3), percent -3.6 1.9
Production of raw wood, mln. dense cu. m 119.8 119.3
1) Data source: State registration. 2014 - including data on the Crimean Federal District.2) For organizations which are not subjects of small business.3) 2013 – according to book-keeping data. Symbol (-) means loss.
2� RUSSIA’ 2015
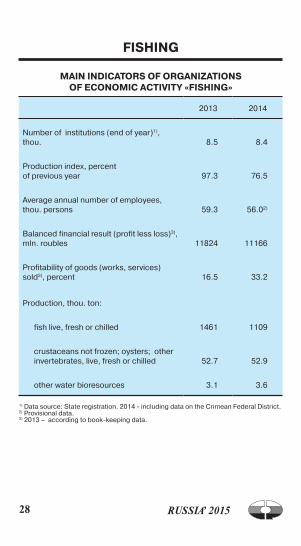
MAIN INDICATORS OF ORGANIZATIONS OF ECONOMIC ACTIVITY «FISHING»
2013 2014
Number of institutions (end of year)1), thou. 8.5 8.4
Production index, percent of previous year 97.3 76.5
Average annual number of employees, thou. persons 59.3 56.02)
Balanced financial result (profit less loss)3), mln. roubles 11824 11166
Profitability of goods (works, services) sold3), percent 16.5 33.2
Production, thou. ton:
fish live, fresh or chilled 1461 1109
crustaceans not frozen; oysters; other invertebrates, live, fresh or chilled 52.7 52.9
other water bioresources 3.1 3.6
1) Data source: State registration. 2014 - including data on the Crimean Federal District.2) Provisional data.3) 2013 – according to book-keeping data.
FISHING
2�RUSSIA’ 2015
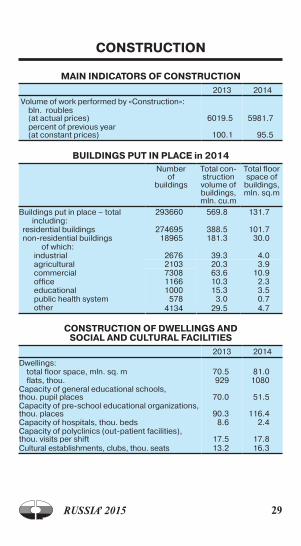
CONSTRUCTION
MAIN INDICATORS OF CONSTRUCTION
2013 2014
Volume of work performed by «Construction»:bln. roubles (at actual prices) 6019.5 5981.7percent of previous year (at constant prices) 100.1 95.5
BUILDINGS PUT IN PLACE in 2014Number
of buildings
Total con- struction volume of buildings, mln. cu.m
Total floor space of
buildings, mln. sq.m
Buildings put in place – total 293660 569.8 131.7 including:
residential buildings 274695 388.5 101.7non-residential buildings 18965 181.3 30.0
of which:industrial 2676 39.3 4.0agricultural 2103 20.3 3.9commercial 7308 63.6 10.9office 1166 10.3 2.3educational 1000 15.3 3.5public health system 578 3.0 0.7other 4134 29.5 4.7
CONSTRUCTION OF DwELLINGS AND SOCIAL AND CULTURAL FACILITIES
2013 2014
Dwellings:total floor space, mln. sq. m 70.5 81.0flats, thou. 929 1080
Capacity of general educational schools, thou. pupil places 70.0 51.5Capacity of pre-school educational organizations, thou. places 90.3 116.4Capacity of hospitals, thou. beds 8.6 2.4Capacity of polyclinics (out-patient facilities), thou. visits per shift 17.5 17.8Cultural establishments, clubs, thou. seats 13.2 16.3
�0 RUSSIA’ 2015
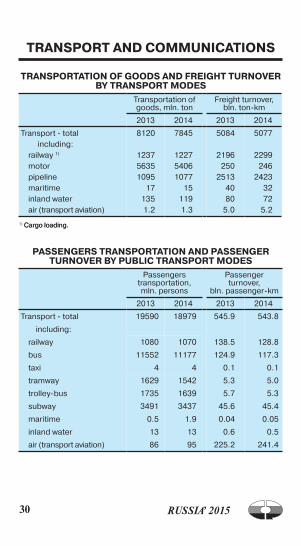
TRANSPORT AND COMMUNICATIONS
TRANSPORTATION OF GOODS AND FREIGHT TURNOVER BY TRANSPORT MODES
Transportation of goods, mln. ton
Freight turnover, bln. ton-km
2013 2014 2013 2014
Transport - total 8120 7845 5084 5077 including:
railway 1) 1237 1227 2196 2299motor 5635 5406 250 246pipeline 1095 1077 2513 2423maritime 17 15 40 32inland water 135 119 80 72air (transport aviation) 1.2 1.3 5.0 5.2
1) Cargo loading.Cargo loading.
PASSENGERS TRANSPORTATION AND PASSENGER TURNOVER BY PUBLIC TRANSPORT MODES
Passengers transportation, mln. persons
Passenger turnover,
bln. passenger-km
2013 2014 2013 2014
Transport - total 19590 18979 545.9 543.8
including:
railway 1080 1070 138.5 128.8
bus 11552 11177 124.9 117.3
taxi 4 4 0.1 0.1
tramway 1629 1542 5.3 5.0
trolley-bus 1735 1639 5.7 5.3
subway 3491 3437 45.6 45.4
maritime 0.5 1.9 0.04 0.05
inland water 13 13 0.6 0.5
air (transport aviation) 86 95 225.2 241.4
�1RUSSIA’ 2015
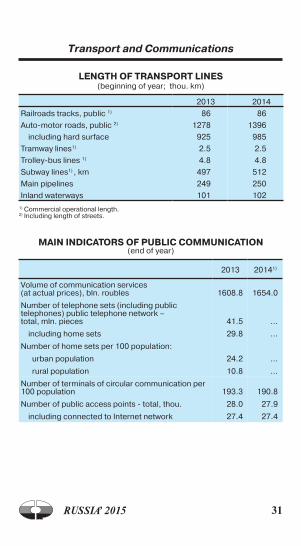
Transport and Communications
LENGTH OF TRANSPORT LINES (beginning of year; thou. km)
2013 2014
Railroads tracks, public 1) 86 86
Auto-motor roads, public 2) 1278 1396
including hard surface 925 985
Tramway lines1) 2.5 2.5
Trolley-bus lines 1) 4.8 4.8
Subway lines1) , km 497 512
Main pipelines 249 250
Inland waterways 101 1021) Commercial operational length.2) Including length of streets.
MAIN INDICATORS OF PUBLIC COMMUNICATION(end of year)
2013 20141)
Volume of communication services (at actual prices), bln. roubles 1608.8 1654.0
Number of telephone sets (including public telephones) public telephone network – total, mln. pieces 41.5 ...
including home sets 29.8 ...
Number of home sets per 100 population:
urban population 24.2 ...
rural population 10.8 ...
Number of terminals of circular communication per 100 population 193.3 190.8
Number of public access points - total, thou. 28.0 27.9
including connected to Internet network 27.4 27.4
�2 RUSSIA’ 2015
Transport and Communications
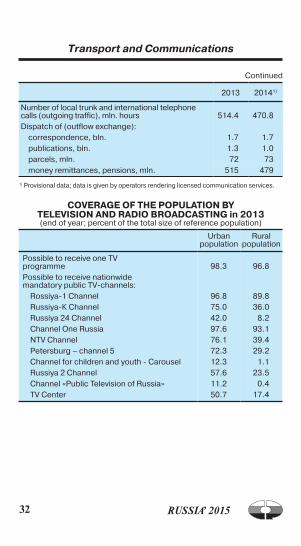
Continued
2013 20141)
Number of local trunk and international telephone calls (outgoing traffic), mln. hours 514.4 470.8Dispatch of (outflow exchange):
correspondence, bln. 1.7 1.7publications, bln. 1.3 1.0parcels, mln. 72 73money remittances, pensions, mln. 515 479
1) Provisional data; data is given by operators rendering licensed communication services.
COVERAGE OF THE POPULATION BY TELEVISION AND RADIO BROADCASTING in 2013(end of year; percent of the total size of reference population)
Urban population
Rural population
Possible to receive one TV programme 98.3 96.8Possible to receive nationwide mandatory public TV-channels:
Rossiya-1 Channel 96.8 89.8Russiya-К Channel 75.0 36.0Russiya 24 Channel 42.0 8.2Channel One Russia 97.6 93.1NTV Channel 76.1 39.4Petersburg – channel 5 72.3 29.2Channel for children and youth - Carousel 12.3 1.1Russiya 2 Channel 57.6 23.5Channel «Public Television of Russia» 11.2 0.4TV Center 50.7 17.4
��RUSSIA’ 2015
TRADE AND SERVICES
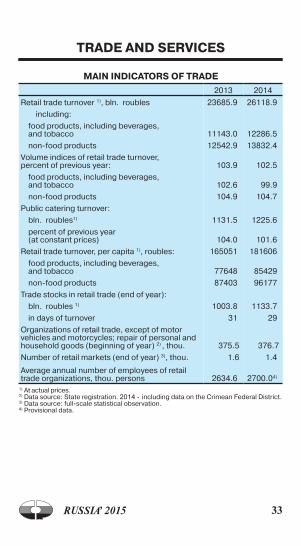
MAIN INDICATORS OF TRADE
2013 2014
Retail trade turnover 1), bln. roubles 23685.9 26118.9
including:
food products, including beverages, and tobacco 11143.0 12286.5
non-food products 12542.9 13832.4
Volume indices of retail trade turnover, percent of previous year: 103.9 102.5
food products, including beverages, and tobacco 102.6 99.9
non-food products 104.9 104.7
Public catering turnover:
bln. roubles1) 1131.5 1225.6
percent of previous year (at constant prices) 104.0 101.6
Retail trade turnover, per capita 1), roubles: 165051 181606
food products, including beverages, and tobacco 77648 85429
non-food products 87403 96177
Trade stocks in retail trade (end of year):
bln. roubles 1) 1003.8 1133.7
in days of turnover 31 29
Organizations of retail trade, except of motor vehicles and motorcycles; repair of personal and household goods (beginning of year) 2) , thou. 375.5 376.7
Number of retail markets (end of year) 3), thou. 1.6 1.4
Average annual number of employees of retail trade organizations, thou. persons 2634.6 2700.04)
1) At actual prices.2) Data source: State registration. 2014 - including data on the Crimean Federal District.3) Data source: full-scale statistical observation.4) Provisional data.
�� RUSSIA’ 2015
Trade and Services
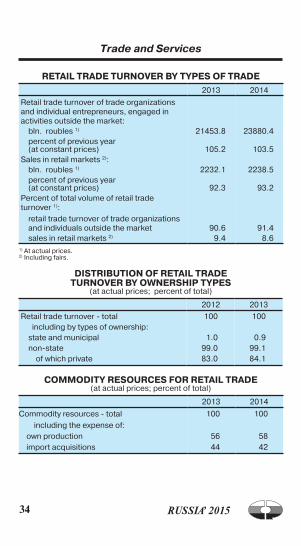
RETAIL TRADE TURNOVER BY TYPES OF TRADE
2013 2014
Retail trade turnover of trade organizations and individual entrepreneurs, engaged in activities outside the market:
bln. roubles 1) 21453.8 23880.4percent of previous year (at constant prices) 105.2 103.5
Sales in retail markets 2):bln. roubles 1) 2232.1 2238.5percent of previous year (at constant prices) 92.3 93.2
Percent of total volume of retail trade turnover 1):
retail trade turnover of trade organizations and individuals outside the market 90.6 91.4sales in retail markets 2) 9.4 8.6
1) At actual prices.2) Including fairs.
DISTRIBUTION OF RETAIL TRADE TURNOVER BY OwNERSHIP TYPES
(at actual prices; percent of total)
2012 2013
Retail trade turnover - total 100 100including by types of ownership:
state and municipal 1.0 0.9non-state 99.0 99.1
of which private 83.0 84.1
COMMODITY RESOURCES FOR RETAIL TRADE(at actual prices; percent of total)
2013 2014
Commodity resources - total 100 100
including the expense of:own production 56 58import acquisitions 44 42

��RUSSIA’ 2015
Trade and Services
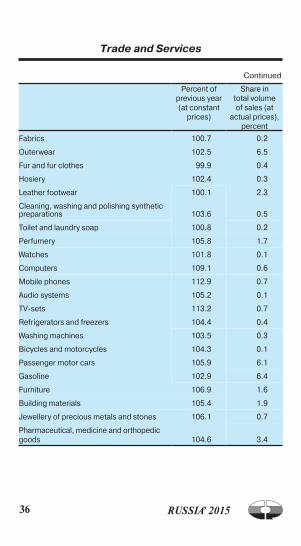
CHANGES IN RETAIL TRADE OF MAIN PRODUCTS SOLD in 2014
Percent of previous year (at constant
prices)
Share in total volume of sales (at
actual prices), percent
Animal meat 101.1 2.0
Poultry meat 106.9 1.5
Meat products 99.3 3.9
Meat cans 104.2 0.4
Fish and sea products 103.4 2.0
Butter 95.8 0.8
Vegetable oil 106.5 0.5
Margarine products 101.0 0.1
Dairy products 102.4 4.0
of which:
whole milk products 101.7 2.3
fat cheese 102.5 1.1
Eggs 102.2 0.6
Sugar 98.7 0.8
Confectionery 102.4 3.0
Flour 102.5 0.4
Groats 102.5 0.5
Pasta and macaroni products 104.2 0.5
Bread and bakery products 101.8 2.2
Fresh potatoes 97.0 0.5
Fresh vegetables 104.9 1.5
Fresh fruits 104.1 1.7
Tea 102.9 0.5
Alcoholic beverages and beer 95.9 7.3
Tobacco products 94.3 2.0
�� RUSSIA’ 2015
Trade and Services
Percent of previous year (at constant
prices)
Share in total volume of sales (at
actual prices), percent
Fabrics 100.7 0.2
Outerwear 102.5 6.5
Fur and fur clothes 99.9 0.4
Hosiery 102.4 0.3
Leather footwear 100.1 2.3
Cleaning, washing and polishing synthetic preparations 103.6 0.5
Toilet and laundry soap 100.8 0.2
Perfumery 105.8 1.7
Watches 101.8 0.1
Computers 109.1 0.6
Mobile phones 112.9 0.7
Audio systems 105.2 0.1
TV-sets 113.2 0.7
Refrigerators and freezers 104.4 0.4
Washing machines 103.5 0.3
Bicycles and motorcycles 104.3 0.1
Passenger motor cars 105.9 6.1
Gasoline 102.9 6.4
Furniture 106.9 1.6
Building materials 105.4 1.9
Jewellery of precious metals and stones 106.1 0.7
Pharmaceutical, medicine and orthopedic goods 104.6 3.4
Continued
��RUSSIA’ 2015
Trade and Services
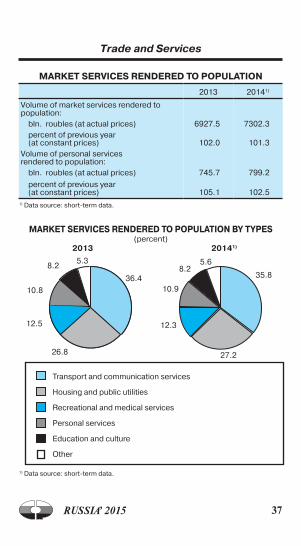
MARKET SERVICES RENDERED TO POPULATION
2013 20141)
Volume of market services rendered to population:
bln. roubles (at actual prices) 6927.5 7302.3percent of previous year (at constant prices) 102.0 101.3
Volume of personal services rendered to population:
bln. roubles (at actual prices) 745.7 799.2
percent of previous year (at constant prices) 105.1 102.5
1) Data source: short-term data.
MARKET SERVICES RENDERED TO POPULATION BY TYPES(percent)
2013 20141)
Transport and communication services
Housing and public utilities
Recreational and medical services
Personal services
Education and culture
Other
10.8
8.2
12.5
36.4
26.8
5.3
1) Data source: short-term data.
35.8
27.2
12.3
10.9
8.25.6

�� RUSSIA’ 2015
SCIENCE AND INFORMATION TECHNOLOGY
MAIN INDICATORS OF SCIENCE DEVELOPMENT1)
2012 2013Number of organizations performed research and development 3566 3605
Personnel engaged in research and development, thou. persons 726.3 727.0Intramural expenditures for research and development, bln. roubles 699.9 749.8
1) Excluding small businesses.Excluding small businesses.
MAIN INDICATORS OF POST-GRADUATE AND DOCTORAL EDUCATION
Post-graduate education
Doctoral education
2012 2013 2012 2013Number of organizations with post-graduate education (doctoral education) 1575 1557 597 585Number of post-graduate students (doctoral students) (end of year), persons 146754 132002 4554 4572Entrance to post-graduate students (doctoral students), persons 45556 38971 1632 1582Release of post-graduate students (doctoral students), persons 35162 34733 1371 1356
including PhD thesis 9195 8979 394 323
USE OF INFORMATION AND COMMUNICATION TECHNOLOGIES1)
2012 2013Share of organizations using information and communication technologies, percent 94.0 94.0Number of PC in organizations, thou. 10807.5 11438.0
of which having access to Internet 6066.5 6764.4Number of PC per 100 employees 43 44
of which having access to Internet 24 26
1) Excluding small businesses.
��RUSSIA’ 2015
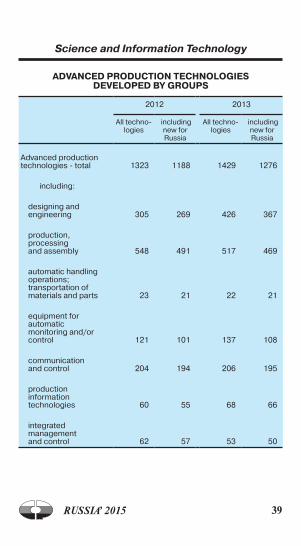
ADVANCED PRODUCTION TECHNOLOGIES DEVELOPED BY GROUPS
2012 2013
All techno-logies
including new for Russia
All techno-logies
including new for Russia
Advanced production technologies - total 1323 1188 1429 1276
including:
designing and engineering 305 269 426 367
production, processing and assembly 548 491 517 469
automatic handling operations; transportation of materials and parts 23 21 22 21
equipment for automatic monitoring and/or control 121 101 137 108
communication and control 204 194 206 195
production information technologies 60 55 68 66
integrated management and control 62 57 53 50
Science and Information Technology
�0 RUSSIA’ 2015
FINANCES
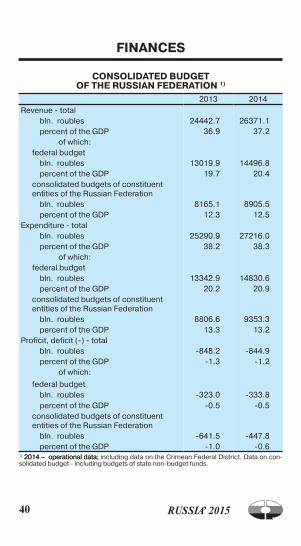
CONSOLIDATED BUDGET OF THE RUSSIAN FEDERATION 1)
2013 2014Revenue - total
bln. roubles 24442.7 26371.1percent of the GDP 36.9 37.2
of which:federal budget
bln. roubles 13019.9 14496.8percent of the GDP 19.7 20.4
consolidated budgets of constituent entities of the Russian Federation
bln. roubles 8165.1 8905.5percent of the GDP 12.3 12.5
Expenditure - totalbln. roubles 25290.9 27216.0percent of the GDP 38.2 38.3
of which:federal budget
bln. roubles 13342.9 14830.6percent of the GDP 20.2 20.9
consolidated budgets of constituent entities of the Russian Federation
bln. roubles 8806.6 9353.3percent of the GDP 13.3 13.2
Proficit, deficit (-) - totalbln. roubles -848.2 -844.9percent of the GDP -1.3 -1.2
of which:
federal budgetbln. roubles -323.0 -333.8percent of the GDP -0.5 -0.5
consolidated budgets of constituent entities of the Russian Federation
bln. roubles -641.5 -447.8percent of the GDP -1.0 -0.6
1) 2014 – operational data;2014 – operational data; including data on the Crimean Federal District. Data on con-solidated budget - including budgets of state non-budget funds.

�1RUSSIA’ 2015
Finances
MAIN INDICATORS OF MONEY CIRCULATION 1) (beginning of year; bln. roubles)
2014 2015Money supply M2 (national definition) 31404.7 32110.5
including:disposable cash outside the banking system MO 6985.6 7171.5transferable deposits 8551.0 8217.3other deposits 15868.1 16721.8
Share of disposable money MO in the total volume of money supply M2, percent 22.2 22.3
1) As of beginning of 2015 - including data on the Crimean Federal District. Money sup-ply M2 (national definition) includes all resources of non-financial and financial (except credit) institutions and individuals - residents of the Russian Federation in cash and non-cash roubles.
SELECTED INDICATORS OF CREDIT INSTITUTIONS ACTIVITY 1)
(beginning of year)
2014 2015Number of credit institutions registered on the territory of the Russian Federation 1071 1049
including those having rights for bank transactions 923 834
Number of branches of operating credit institutions registered on the territory of the Russian Federation 2005 1708Registered charter capital of operating credit institutions, bln. roubles 1463.9 1840.3Number of credit institutions with licenses (permissions) giving the right on:
involvement of deposits of population 756 690transactions with foreign currency 623 554general licenses 270 256operations with precious metals 209 203
Number of credit institutions with foreign participation in charter capital having rights for bank transactions 251 225
including:with 100 percent of foreign shares 76 75with foreign share from 50 percent up to 100 percent 46 38
1) As of beginning of 2015 - including data on the Crimean Federal District.
�2 RUSSIA’ 2015
Finances
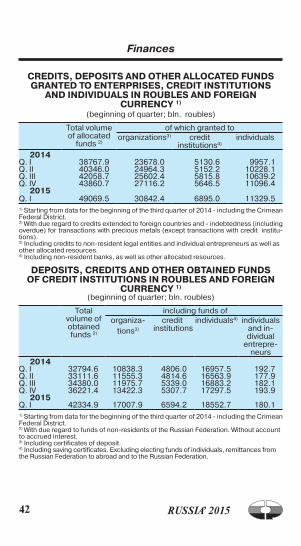
CREDITS, DEPOSITS AND OTHER ALLOCATED FUNDS GRANTED TO ENTERPRISES, CREDIT INSTITUTIONS
AND INDIVIDUALS IN ROUBLES AND FOREIGN CURRENCY 1)
(beginning of quarter; bln. roubles)
Total volume of allocated
funds 2)
of which granted toorganizations3) credit
institutions4)individuals
2014Q. I 38767.9 23678.0 5130.6 9957.1Q. II 40346.0 24964.3 5152.2 10228.1Q. III 42058.7 25602.4 5815.8 10639.2Q. IV 43860.7 27116.2 5646.5 11096.4
2015Q. I 49069.5 30842.4 6895.0 11329.51) Starting from data for the beginning of the third quarter of 2014 - including the Crimean Federal District.2) With due regard to credits extended to foreign countries and - indebtedness (including overdue) for transactions with precious metals (except transactions with credit institu-tions).3) Including credits to non-resident legal entities and individual entrepreneurs as well as other allocated resources.4) Including non-resident banks, as well as other allocated resources.
DEPOSITS, CREDITS AND OTHER OBTAINED FUNDS OF CREDIT INSTITUTIONS IN ROUBLES AND FOREIGN
CURRENCY 1)
(beginning of quarter; bln. roubles)
Total volume of obtained funds 2)
including funds oforganiza-
tions3)
credit institutions
individuals4) individuals and in-dividual
entrepre- neurs
2014Q. I 32794.6 10838.3 4806.0 16957.5 192.7Q. II 33111.6 11555.3 4814.6 16563.9 177.9Q. III 34380.0 11975.7 5339.0 16883.2 182.1Q. IV 36221.4 13422.3 5307.7 17297.5 193.9
2015Q. I 42334.9 17007.9 6594.2 18552.7 180.11) Starting from data for the beginning of the third quarter of 2014 - including the Crimean Federal District. 2) With due regard to funds of non-residents of the Russian Federation. Without account to accrued interest.3) Including certificates of deposit.4) Including saving certificates. Excluding electing funds of individuals, remittances from the Russian Federation to abroad and to the Russian Federation.
��RUSSIA’ 2015
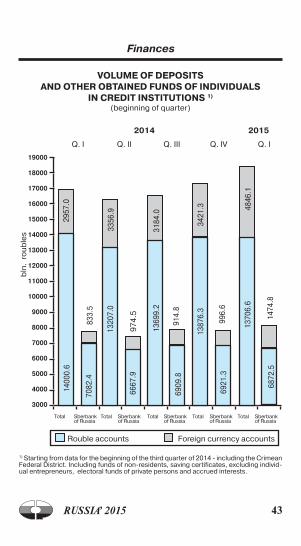
1) Starting from data for the beginning of the third quarter of 2014 - including the Crimean Federal District. Including funds of non-residents, saving certificates, excluding individ-ual entrepreneurs, electoral funds of private persons and accrued interests.
Total Sberbank Total Sberbank Total Sberbank Total Sberbank Total Sberbank of Russia of Russia of Russia of Russia of Russia
bln
. ro
ub
les
2014 2015
Rouble accounts Foreign currency accounts
19000
18000
17000
16000
15000
14000
13000
12000
11000
10000
9000
8000
7000
6000
5000
4000
3000
Q. I Q. II Q. III Q. IV Q. I
6667
.9
1320
7.0
3356
.9
97
4.5
1369
9.2
3184
.0
6909
.891
4.8
1387
6.3
3421
.3
2957
.0
6921
.3
1400
0.6
833.
570
82.4
1474
.868
72.5
4846
.113
706.
6
Finances
VOLUME OF DEPOSITS AND OTHER OBTAINED FUNDS OF INDIVIDUALS
IN CREDIT INSTITUTIONS 1)
(beginning of quarter)
996.
6
�� RUSSIA’ 2015
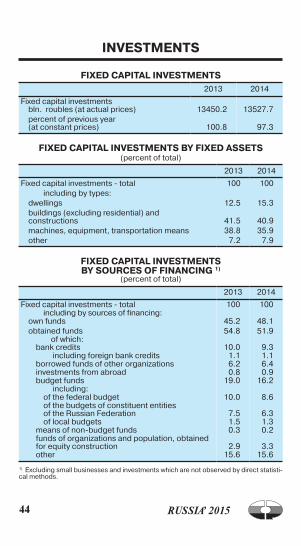
INVESTMENTS
FIXED CAPITAL INVESTMENTS
2013 2014
Fixed capital investments bln. roubles (at actual prices) 13450.2 13527.7percent of previous year (at constant prices) 100.8 97.3
FIXED CAPITAL INVESTMENTS BY FIXED ASSETS(percent of total)
2013 2014
Fixed capital investments - total 100 100including by types:
dwellings 12.5 15.3buildings (excluding residential) and constructions 41.5 40.9machines, equipment, transportation means 38.8 35.9other 7.2 7.9
FIXED CAPITAL INVESTMENTS BY SOURCES OF FINANCING 1)
(percent of total)
2013 2014
Fixed capital investments - total 100 100including by sources of financing:
own funds 45.2 48.1obtained funds 54.8 51.9
of which: bank credits 10.0 9.3
including foreign bank credits 1.1 1.1borrowed funds of other organizations 6.2 6.4investments from abroad 0.8 0.9budget funds 19.0 16.2
including:of the federal budget 10.0 8.6of the budgets of constituent entities of the Russian Federation 7.5 6.3of local budgets 1.5 1.3
means of non-budget funds 0.3 0.2funds of organizations and population, obtained for equity construction 2.9 3.3other 15.6 15.6
1) Excluding small businesses and investments which are not observed by direct statisti-cal methods.

��RUSSIA’ 2015
Investments
FIXED CAPITAL INVESTMENTS BY ECONOMIC ACTIVITY 1)
(percent of total)
2013 2014
Fixed capital investments - total 100 100
including by economic activity:
agriculture, hunting and forestry 3.2 3.2
fishing 0.1 0.1
mining and quarrying 18.4 20.4
manufacturing 16.9 17.7
electricity, gas and water supply 10.9 10.9
construction 2.4 2.0
wholesale and retail trade; repair of motor vehicles, motorcycles and personal and household goods 2.9 3.3
hotels and restaurants 0.8 0.8
transport and communications 22.7 21.0
of which communication 2.8 3.3
financial intermediation 1.8 1.4
real estate, renting and business activities 10.1 10.9
public administration and defence; compulsory social security 2.2 2.0
education 2.2 2.2
health and social work 2.1 1.6
other community, social and personal service activities 3.3 2.5
1) Excluding small businesses and investments which are not observed by direct statisti-cal methods.
�� RUSSIA’ 2015
Investments
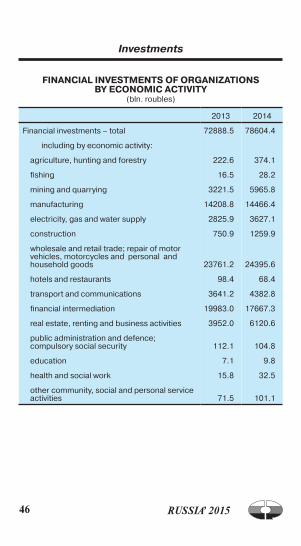
FINANCIAL INVESTMENTS OF ORGANIZATIONS BY ECONOMIC ACTIVITY
(bln. roubles)
2013 2014
Financial investments – total 72888.5 78604.4
including by economic activity:
agriculture, hunting and forestry 222.6 374.1
fishing 16.5 28.2
mining and quarrying 3221.5 5965.8
manufacturing 14208.8 14466.4
electricity, gas and water supply 2825.9 3627.1
construction 750.9 1259.9
wholesale and retail trade; repair of motor vehicles, motorcycles and personal and household goods 23761.2 24395.6
hotels and restaurants 98.4 68.4
transport and communications 3641.2 4382.8
financial intermediation 19983.0 17667.3
real estate, renting and business activities 3952.0 6120.6
public administration and defence; compulsory social security 112.1 104.8
education 7.1 9.8
health and social work 15.8 32.5
other community, social and personal service activities 71.5 101.1
��RUSSIA’ 2015
Investments
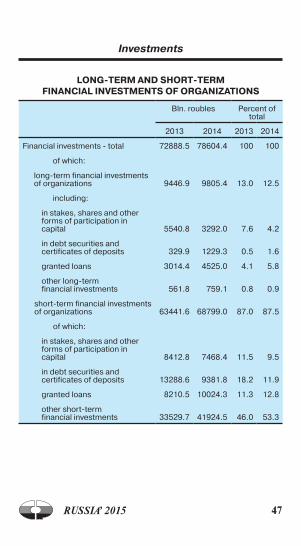
LONG-TERM AND SHORT-TERM FINANCIAL INVESTMENTS OF ORGANIZATIONS
Bln. roubles Percent of total
2013 2014 2013 2014
Financial investments - total 72888.5 78604.4 100 100
of which:
long-term financial investments of organizations 9446.9 9805.4 13.0 12.5
including:
in stakes, shares and other forms of participation in capital 5540.8 3292.0 7.6 4.2
in debt securities and certificates of deposits 329.9 1229.3 0.5 1.6
granted loans 3014.4 4525.0 4.1 5.8
other long-term financial investments 561.8 759.1 0.8 0.9
short-term financial investments of organizations 63441.6 68799.0 87.0 87.5
of which:
in stakes, shares and other forms of participation in capital 8412.8 7468.4 11.5 9.5
in debt securities and certificates of deposits 13288.6 9381.8 18.2 11.9
granted loans 8210.5 10024.3 11.3 12.8
other short-term financial investments 33529.7 41924.5 46.0 53.3
�� RUSSIA’ 2015
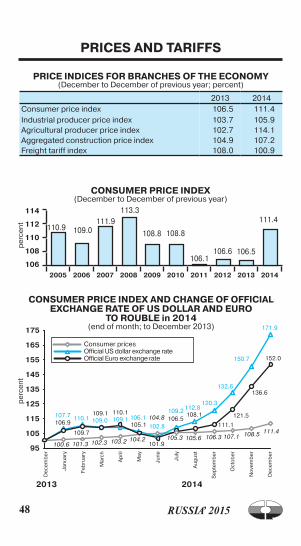
CONSUMER PRICE INDEX(December to December of previous year)
PRICES AND TARIFFS
PRICE INDICES FOR BRANCHES OF THE ECONOMY (December to December of previous year; percent)
2013 2014Consumer price index 106.5 111.4Industrial producer price index 103.7 105.9Agricultural producer price index 102.7 114.1Aggregated construction price index 104.9 107.2Freight tariff index 108.0 100.9
2005 2006 2007 2008 2009 2010 2011 2012 2013 2014
114
112
110
108
106
110.9 109.0111.9
113.3
pe
rce
nt
108.8 108.8
106.1106.6
CONSUMER PRICE INDEX AND CHANGE OF OFFICIAL EXCHANGE RATE OF US DOLLAR AND EURO
TO ROUBLE in 2014 (end of month; to December 2013)
2013 2014
De
cem
be
r
Jan
uar
y
Fe
bru
ary
Mar
ch
Ap
ril
May
Jun
e
July
Au
gu
st
Se
pte
mb
er
Oct
ob
er
No
vem
be
r
De
cem
be
r
Consumer pricesOfficial US dollar exchange rateOfficial Euro exchange rate
175
165
155
145
135
125
115
105
95
pe
rce
nt
111.4
111.4
171.9
152.0
108.5107.1106.3105.6105.3
104.8
104.2103.2102.3101.3100.6
136.6
121.5
111.1
108.1106.5
101.9
105.1
110.1109.1
109.7
106.9
150.7
132.6
120.3112.8109.2
102.8
106.1109.1109.0110.1107.7
106.5
��RUSSIA’ 2015
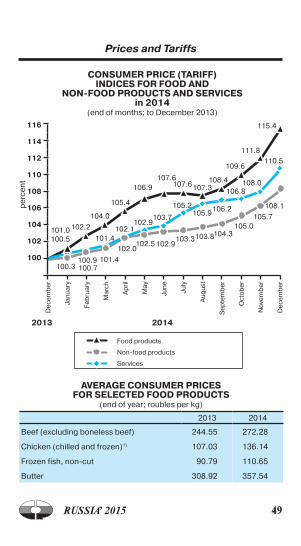
Prices and Tariffs
2013 2014
Food products
Non-food products
Services
CONSUMER PRICE (TARIFF) INDICES FOR FOOD AND
NON-FOOD PRODUCTS AND SERVICES in 2014
(end of months; to December 2013)
Dec
emb
er
Jan
uar
y
Feb
ruar
y
Mar
ch
Ap
ril
May
Jun
e
July
Au
gu
st
Sep
tem
ber
Oct
ob
er
No
vem
ber
Dec
emb
er
116
114
112
110
108
106
104
102
100100.3
106.2
103.3
110.5
111.8
109.6
108.4107.3
100.5
100.7
101.4
105.0
108.1
104.3
105.7105.9
108.0
103.8
105.4
102.5
106.9
100.9 101.4
102.0102.9
115.4
106.8
101.0 102.2
107.6107.6
105.2
102.1
pe
rce
nt
AVERAGE CONSUMER PRICES FOR SELECTED FOOD PRODUCTS
(end of year; roubles per kg)
2013 2014
Beef (excluding boneless beef) 244.55 272.28
Chicken (chilled and frozen)1) 107.03 136.14
Frozen fish, non-cut 90.79 110.65
Butter 308.92 357.54
104.0 103.7102.9
�0 RUSSIA’ 2015
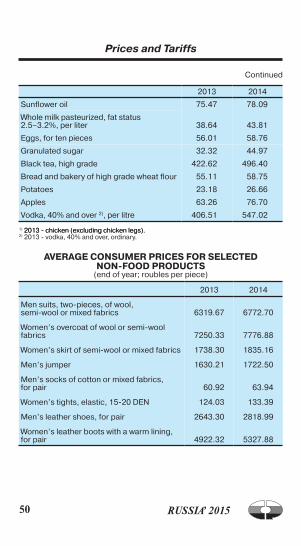
Prices and Tariffs
Continued
2013 2014
Sunflower oil 75.47 78.09
Whole milk pasteurized, fat status 2.5–3.2%, per liter 38.64 43.81
Eggs, for ten pieces 56.01 58.76
Granulated sugar 32.32 44.97
Black tea, high grade 422.62 496.40
Bread and bakery of high grade wheat flour 55.11 58.75
Potatoes 23.18 26.66
Apples 63.26 76.70
Vodka, 40% and over 2), per litre 406.51 547.02
1) 2013 - chicken (excluding chicken legs).2013 - chicken (excluding chicken legs).2) 2013 - vodka, 40% and over, ordinary.
AVERAGE CONSUMER PRICES FOR SELECTED NON-FOOD PRODUCTS
(end of year; roubles per piece)
2013 2014
Men suits, two-pieces, of wool, semi-wool or mixed fabrics 6319.67 6772.70
Women’s overcoat of wool or semi-wool fabrics 7250.33 7776.88
Women’s skirt of semi-wool or mixed fabrics 1738.30 1835.16
Men’s jumper 1630.21 1722.50
Men’s socks of cotton or mixed fabrics, for pair 60.92 63.94
Women’s tights, elastic, 15-20 DEN 124.03 133.39
Men’s leather shoes, for pair 2643.30 2818.99
Women’s leather boots with a warm lining, for pair 4922.32 5327.88
�1RUSSIA’ 2015
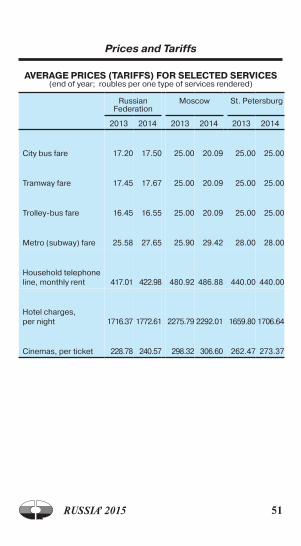
Prices and Tariffs
AVERAGE PRICES (TARIFFS) FOR SELECTED SERVICES (end of year; roubles per one type of services rendered)
Russian Federation
Moscow St. Petersburg
2013 2014 2013 2014 2013 2014
City bus fare 17.20 17.50 25.00 20.09 25.00 25.00
Tramway fare 17.45 17.67 25.00 20.09 25.00 25.00
Trolley-bus fare 16.45 16.55 25.00 20.09 25.00 25.00
Metro (subway) fare 25.58 27.65 25.90 29.42 28.00 28.00
Household telephone line, monthly rent 417.01 422.98 480.92 486.88 440.00 440.00
Hotel charges, per night 1716.37 1772.61 2275.79 2292.01 1659.80 1706.64
Cinemas, per ticket 228.78 240.57 298.32 306.60 262.47 273.37
�2 RUSSIA’ 2015
Prices and Tariffs
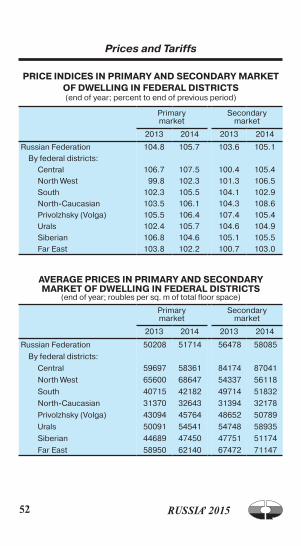
PRICE INDICES IN PRIMARY AND SECONDARY MARKET OF DwELLING IN FEDERAL DISTRICTS (end of year; percent to end of previous period)
Primary market
Secondary market
2013 2014 2013 2014
Russian Federation 104.8 105.7 103.6 105.1
By federal districts:
Central 106.7 107.5 100.4 105.4
North West 99.8 102.3 101.3 106.5
South 102.3 105.5 104.1 102.9
North-Caucasian 103.5 106.1 104.3 108.6
Privolzhsky (Volga) 105.5 106.4 107.4 105.4
Urals 102.4 105.7 104.6 104.9
Siberian 106.8 104.6 105.1 105.5
Far East 103.8 102.2 100.7 103.0
AVERAGE PRICES IN PRIMARY AND SECONDARY MARKET OF DwELLING IN FEDERAL DISTRICTS
(end of year; roubles per sq. m of total floor space)
Primary market
Secondary market
2013 2014 2013 2014
Russian Federation 50208 51714 56478 58085
By federal districts:
Central 59697 58361 84174 87041
North West 65600 68647 54337 56118
South 40715 42182 49714 51832
North-Caucasian 31370 32643 31394 32178
Privolzhsky (Volga) 43094 45764 48652 50789
Urals 50091 54541 54748 58935
Siberian 44689 47450 47751 51174
Far East 58950 62140 67472 71147
��RUSSIA’ 2015
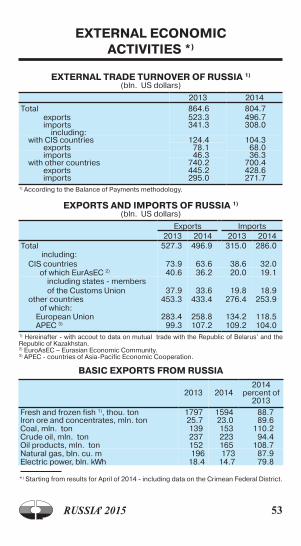
EXTERNAL ECONOMIC ACTIVITIES *)
EXTERNAL TRADE TURNOVER OF RUSSIA 1)
(bln. US dollars)
2013 2014Total 864.6 804.7
exports 523.3 496.7imports 341.3 308.0
including:with CIS countries 124.4 104.3
exports 78.1 68.0imports 46.3 36.3
with other countries 740.2 700.4exports 445.2 428.6imports 295.0 271.7
1) According to the Balance of Payments methodology.
EXPORTS AND IMPORTS OF RUSSIA 1)
(bln. US dollars)
Exports Imports2013 2014 2013 2014
Total 527.3 496.9 315.0 286.0 including:
CIS countries 73.9 63.6 38.6 32.0of which EurAsEC 2) 40.6 36.2 20.0 19.1
including states - members of the Customs Union 37.9 33.6 19.8 18.9
other countries 453.3 433.4 276.4 253.9of which:
European Union 283.4 258.8 134.2 118.5APEC 3) 99.3 107.2 109.2 104.0
1) Hereinafter - with accout to data on mutual trade with the Republic of Belarus’ and the Republic of Kazakhstan.2) EuroAsEC – Eurasian Economic Community. 3) APEC - countries of Asia-Pacific Economic Cooperation.
BASIC EXPORTS FROM RUSSIA
2013 20142014
percent of 2013
Fresh and frozen fish 1), thou. ton 1797 1594 88.7Iron ore and concentrates, mln. ton 25.7 23.0 89.6Coal, mln. ton 139 153 110.2Crude oil, mln. ton 237 223 94.4Oil products, mln. ton 152 165 108.7Natural gas, bln. cu. m 196 173 87.9Electric power, bln. kWh 18.4 14.7 79.8 *) Starting from results for April of 2014 - including data on the Crimean Federal District.
�� RUSSIA’ 2015
External Economic Activities
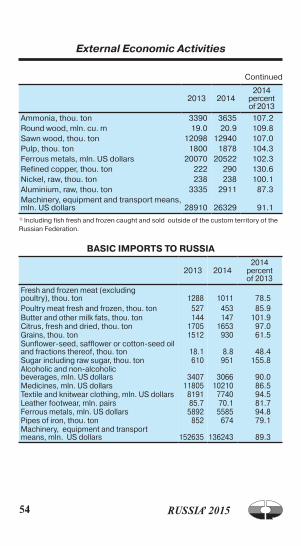
Continued
2013 20142014
percent of 2013
Ammonia, thou. ton 3390 3635 107.2Round wood, mln. cu. m 19.0 20.9 109.8Sawn wood, thou. ton 12098 12940 107.0Pulp, thou. ton 1800 1878 104.3Ferrous metals, mln. US dollars 20070 20522 102.3Refined copper, thou. ton 222 290 130.6Nickel, raw, thou. ton 238 238 100.1Aluminium, raw, thou. ton 3335 2911 87.3Machinery, equipment and transport means, mln. US dollars 28910 26329 91.1
1) Including fish fresh and frozen caught and sold outside of the custom territory of the Russian Federation.
BASIC IMPORTS TO RUSSIA
2013 20142014
percent of 2013
Fresh and frozen meat (excluding poultry), thou. ton 1288 1011 78.5Poultry meat fresh and frozen, thou. ton 527 453 85.9Butter and other milk fats, thou. ton 144 147 101.9Citrus, fresh and dried, thou. ton 1705 1653 97.0Grains, thou. ton 1512 930 61.5Sunflower-seed, safflower or cotton-seed oil and fractions thereof, thou. ton 18.1 8.8 48.4Sugar including raw sugar, thou. ton 610 951 155.8Alcoholic and non-alcoholic beverages, mln. US dollars 3407 3066 90.0Medicines, mln. US dollars 11805 10210 86.5Textile and knitwear clothing, mln. US dollars 8191 7740 94.5Leather footwear, mln. pairs 85.7 70.1 81.7Ferrous metals, mln. US dollars 5892 5585 94.8Pipes of iron, thou. ton 852 674 79.1Machinery, equipment and transport means, mln. US dollars 152635 136243 89.3
��RUSSIA’ 2015
External Economic Activities
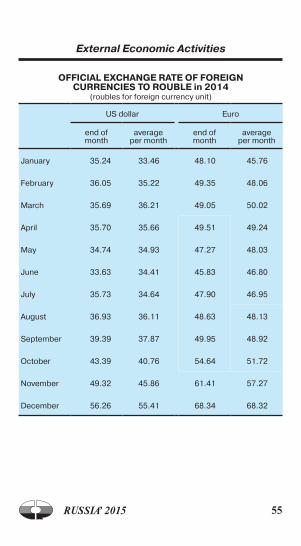
OFFICIAL EXCHANGE RATE OF FOREIGN CURRENCIES TO ROUBLE in 2014
(roubles for foreign currency unit)
US dollar Euro
end of month
average per month
end of month
average per month
January 35.24 33.46 48.10 45.76
February 36.05 35.22 49.35 48.06
March 35.69 36.21 49.05 50.02
April 35.70 35.66 49.51 49.24
May 34.74 34.93 47.27 48.03
June 33.63 34.41 45.83 46.80
July 35.73 34.64 47.90 46.95
August 36.93 36.11 48.63 48.13
September 39.39 37.87 49.95 48.92
October 43.39 40.76 54.64 51.72
November 49.32 45.86 61.41 57.27
December 56.26 55.41 68.34 68.32
�� RUSSIA’ 2015
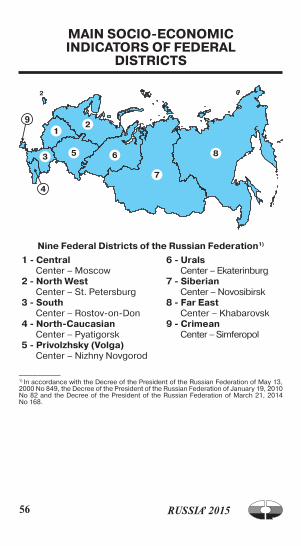
MAIN SOCIO-ECONOMIC INDICATORS OF FEDERAL
DISTRICTS
Nine Federal Districts of the Russian Federation1)
1 - Central Center – Moscow
2 - North west Center – St. Petersburg
3 - South Center – Rostov-on-Don
4 - North-Caucasian Center – Pyatigorsk
5 - Privolzhsky (Volga) Center – Nizhny Novgorod
6 - Urals Center – Ekaterinburg
7 - Siberian Center – Novosibirsk
8 - Far East Center – Khabarovsk
9 - Crimean Center – Simferopol
_________1) In accordance with the Decree of the President of the Russian Federation of May 13, 2000 No 849, the Decree of the President of the Russian Federation of January 19, 2010 No 82 and the Decree of the President of the Russian Federation of March 21, 2014 No 168.
9
��RUSSIA’ 2015
Main Socio-Economic Indicators of Federal Districts
CHARACTERISTICS OF FEDERAL DISTRICTS OF THE RUSSIAN FEDERATION
Central Federal District comprises Belgorod, Bryansk,
Vladimir, Voronezh, Ivanovo, Kaluga, Kostroma, Kursk, Lipetsk,
Moscow, Orel, Ryazan, Smolensk, Tambov, Tver, Tula and
Yaroslavl regions, the city of Moscow. It covers the territory 1) of
– 650.2 thou. sq. km .
At the beginning of 2015 the population of the district
amounted to 39.0 mln. persons, 81.8% – urban residents. As
of January 1, 2014 the share of working-age population was
59.3%. In 2013 18.9 mln. persons were employed in the econ-
omy.
In 2014 industrial production index 2) reached 101.3%,
shipment of own production goods, works and services in
the district was: for mining and quarrying – 1489 bln. roubles,
manufacturing – 9220, electricity, gas and water supply – 1325
bln. roubles.
Volume of agricultural production in 2014 was 1056.9 bln.
roubles, agricultural production index – 104.4%.
North west Federal District comprises Republic of
Karelia, Republic of Komi, Arkhangelsk, Vologda, Kaliningrad,
Leningrad, Murmansk, Novgorod and Pskov regions, the city
of Saint-Petersburg, Nenetsky autonomous area. It covers the
territory 1) of – 1687.0 thou. sq. km .
At the beginning of 2015 the population of the district
amounted to 13.8 mln. persons, 84.1% – urban residents.
As of January 1, 2014 the share of working-age population
was 59.9%. In 2013 6.8 mln. persons were employed in the
economy .
In 2014 industrial production index 2) reached 97.6%, ship-
ment of own production goods, works and services in the district
�� RUSSIA’ 2015
Main Socio-Economic Indicators of Federal Districts
was: for mining and quarrying – 554 bln. roubles, manufacturing –
4305, electricity, gas and water supply – 500 bln. roubles.
Volume of agricultural production in 2014 was 205.3 bln.
roubles, agricultural production index – 104.3%.
South Federal District comprises Republic of
Adygea, Republic of Kalmykia, Krasnodar territory, Astrakhan,
Volgograd and Rostov regions. It covers the territory 1) of –
420.9 thou. sq. km .
At the beginning of 2015 the population of the district
amounted to 14.0 mln. persons, 62.9% – urban residents.
As of January 1, 2014 the share of working-age population
was 58.4%. In 2013 6.2 mln. persons were employed in the
economy.
In 2014 industrial production index2) reached 102.7%,
shipment of own production goods, works and services in
the district was: for mining and quarrying – 196 bln. roubles,
manufacturing – 1750, electricity, gas and water supply – 307
bln. roubles.
Volume of agricultural production in 2014 was 645.3 bln.
roubles, agricultural production index – 106.4%.
North-Caucasian Federal District comprises Republic
of Dagestan, Republic of Ingushetia, Republic of Kabardino-
Balkaria, Republic of Karachaevo-Cherkessia, Republic
of Northern Osetia - Alania, Chechen Republic, Stavropol
territory. It covers the territory 1) of – 170.4 thou. sq. km .
At the beginning of 2015 the population of the district
amounted to 9.7 mln. persons , 49.1% – urban residents. As of
January 1, 2014 the share of working-age population was 9.8%.
In 2013 3.4 mln. persons were employed in the economy.
In 2014 industrial production index2) reached 98.9%,
shipment of own production goods, works and services in the
��RUSSIA’ 2015
Main Socio-Economic Indicators of Federal Districts
district was: for mining and quarrying – 21.5 bln. roubles, man-
ufacturing – 296, electricity, gas and water supply – 116 bln.
roubles.
Volume of agricultural production in 2014 was 334.4 bln.
roubles, agricultural production index – 105.3%.
Privolzhsky (Volga) Federal District comprises Republic
of Bashkortostan, Republic of Marii El, Republic of Mordovia,
Republic of Tatarstan, Republic of Udmurtia, Republic of
Chuvashia, Perm territory, Kirov, Nizhny Novgorod, Orenburg,
Penza, Samara, Saratov and Ulyanovsk regions. It covers the
territory 1) of – 1037.0 thou. sq. km .
At the beginning of 2015 the population of the district
amounted to 29.7 mln. persons, 71.5% – urban residents. As
of January 1, 2014 the share of working-age population was
58.7%. In 2013 14.2 mln. persons were employed in the econ-
omy.
In 2014 industrial production index2) reached 102.0%,
shipment of own production goods, works and services in the
district was: for mining and quarrying – 1499 bln. roubles,
manufacturing – 6229, electricity, gas and water supply – 836
bln. roubles.
Volume of agricultural production in 2014 was 994.1 bln.
roubles, agricultural production index – 103.2%.
Urals Federal District comprises Kurgan, Sverd-
lovsk, Tumen and Chelyabinsk regions, Khanty-Mansiysky
autonomous area - Yugra and Yamalo-Nenetsky autonomous
area. It covers the territory 1) of – 1818.5 thou. sq. km .
At the beginning of 2015 the population of the district
amounted to 12.3 mln. persons, 80.9% – urban residents.
As of January 1, 2014 the share of working-age population
was 59.7%. In 2013 6.1 mln. persons were employed in the
�0 RUSSIA’ 2015
Main Socio-Economic Indicators of Federal Districts
economy.
In 2014 industrial production index 2) reached 100.1%, ship-
ment of own production goods, works and services in the dis-
trict was: for mining and quarrying – 3766 bln. roubles, manu-
facturing – 3414, electricity, gas and water supply – 576 bln.
roubles .
Volume of agricultural production in 2014 was 254.4 bln.
roubles, agricultural production index – 100.5%.
Siberian Federal District comprises Republic of Altay,
Republic of Buryatia, Republic of Tyva, Republic of Khaka-
sia, Altay, Zabaikalsk and Krasnoyarsk territories, Irkutsk,
Kemerovo, Novosibirsk, Omsk and Tomsk regions. It covers the
territory 1) of – 5145.0 thou. sq. km .
At the beginning of 2015 the population of the district
amounted to 19.3 mln. persons, 72.7% – urban residents.
As of January 1, 2014 the share of working-age population
was 59.2%. In 2013 9.1 mln. persons were employed in the
economy.
In 2014 industrial production index 2) reached 101.8%,
shipment of own production goods, works and services in the
district was: for mining and quarrying – 1294 bln. roubles,
manufacturing – 3059, electricity, gas and water supply – 565
bln. roubles.
Volume of agricultural production in 2014 was 526.0 bln.
roubles, agricultural production index – 96.7%.
Far East Federal District comprises Republic of Sakha
(Yakutia), Kamchatka, Primorsky and Khabarovsk territories,
Amur, Magadan and Sakhalin regions, Jewish autonomous
area and Chukotka autonomous area. It covers the territory1) of
– 6169.3 thou. sq. km .
At the beginning of 2015 the population of the district
�1RUSSIA’ 2015
1) Area of the Federal districts is given as of 01.01.2014.2) Aggregate production index by economic activity «Mining and quarrying». «Manufacturing», «Electricity, gas and water supply». 3) Data source: Ministry of Property and Land Relations of the Republic of Crimea on the area of the Republic of Crimea as of 01.01.2014 - 26.1 thou. sq. km , Department of State Registration of Rights and Cadastre of the City of Sevastopol on the area of the City of Sevastopol as of 01.01.2014- 0.9 thou. sq. km.
Main Socio-Economic Indicators of Federal Districts
amounted to 6.2 mln. persons, 75.4% – urban residents.
As of January 1, 2014 the share of working-age population
was 61.0%. In 2013 3.3 mln. persons were employed in the
economy.
In 2014 industrial production index2) reached
105.3%, shipment of own production goods, works and
services in the district was: for mining and quarrying –
1353 bln. roubles, manufacturing – 484, electricity, gas and
water supply – 255 bln. roubles.
Volume of agricultural production in 2014 was 145.9 bln.
roubles, agricultural production index – 118.7%.
Crimean Federal District comprises Republic of Crimea
and the City of Sevastopol. It covers the territory 3) of – 26.9
thou. sq. km .
At the beginning of 2015 the population of the district
amounted to 2.3 mln. persons, 58.0% – urban residents.
Statistical information on the Republic of Crimea, the city
of Sevastopol and Crimean Federal District will be published in
the future official statistical publications of Rosstat in 2015.
�2 RUSSIA’ 2015
CONTENTS
General Characteristics ........................................................ 3
Population and Labour Market .............................................. 8
Living Standards of Population and Social Field ...................... 11
Production and Use of Gross Domestic Product ...................... 18
Industry .............................................................................. 20
Agriculture and Forestry ....................................................... 23
Fishing ................................................................................ 28
Construction ........................................................................ 29
Transport and Communications ............................................. 30
Trade and Services ............................................................... 33
Science and Information Technology .................................... 38
Finances ............................................................................. 40
Investments ......................................................................... 44
Prices and Tariffs ................................................................. 48
External Economic Activities ................................................. 53
Main Socio-Economic Indicators of Federal Districts ............... 56
RUSSIA` 2015
Statistical Pocketbook
Responsible for the issue:V. Zhitkov I. Voronina E. Selezneva
Tel.: (495) 607-4071 632-9224 632-9225
Translation and Layout: Information & Publishing Centre
«Statistics of Russia»
Signed for printing 6.05.2015 Circulation 80 copies Order No
Printed by FGNU «Rosinformagrotekh».141261, Moscow region, p.g.t. Pravdinski, Lesnaya str., 60

OFFICIAL STATISTICAL PUBLICATIONS OF ROSSTAT
2015*)
Statistical Yearbooks and Handbooks
Russia’ 2015 (in Russian)Russia in Figures (in Russian)Russia in Figures (in English)BRICS 2015 (in Russian)BRICS 2015 (in English)National Accounts of Russia in 2007-2014Investments in RussiaMarket Services in RussiaBelarus’ and RussiaRussia and Countries of the European UnionSmall and Medium Business in RussiaAgriculture, Hunting and Forestry in RussiaStatistical Yearbook of RussiaDemographic Yearbook of Russia (in Russian and English)Labour and Employment in RussiaSocial Status and Living Standard of Population in RussiaPublic Health in RussiaTrade in RussiaRegions of Russia. Social and Economic IndicatorsRegions of Russia. Basic Characteristics of Subjects of the Russian Federation
For more details on statistical publications of Rosstat and infor-mation services please contact Information & Publishing Centre «Statistics of Russia»:
39, Myasnitskaya Str.,Moscow, 107450, RussiaPhone/fax: (495) 607-4941 (495) 607-4252E-mail: [email protected]
39, Professor Popov Str.,Saint-Petersburg, 197376, Russia Phone/fax: (812) 235-8308 (812) 235-8308E-mail: [email protected]
http://www.infostat.ru
*) In 2015 official statistical publications of Rosstat, exclud-ing «Russia’ 2015», «Russia in Figures», «BRICS 2015», «Statis-tical Yearbook of Russia» and the magazine «Voprosy Statistiki» will be issued in electronic format only.