Embed Size (px)
Citation preview

Saaidia, A., Bezazi, A., Belbah, A., Bouchelaghem, H., Scarpa, F., &Amirouche, S. (2017). Mechano-physical properties and statisticaldesign of Jute Yarns. Measurement, 111, 284-294.https://doi.org/10.1016/j.measurement.2017.07.054
Peer reviewed versionLicense (if available):CC BY-NC-NDLink to published version (if available):10.1016/j.measurement.2017.07.054
Link to publication record in Explore Bristol ResearchPDF-document
This is the author accepted manuscript (AAM). The final published version (version of record) is available onlinevia Elsevier at https://www.sciencedirect.com/science/article/pii/S0263224117304931 . Please refer to anyapplicable terms of use of the publisher.
University of Bristol - Explore Bristol ResearchGeneral rights
This document is made available in accordance with publisher policies. Please cite only thepublished version using the reference above. Full terms of use are available:http://www.bristol.ac.uk/red/research-policy/pure/user-guides/ebr-terms/

1
Mechano-physical properties and statistical design of Jute Yarns
A. SAAIDIA1, A. BEZAZI1*, A. BELBAH1, H. BOUCHELAGHEM2,1,
F. SCARPA3, S. AMIROUCHE4
1Laboratoire de Mécanique Appliquée des Nouveaux Matériaux (LMANM),
Université 8 Mai 1945 Guelma, B.P.401 Guelma 24000 Algérie.
E-mails: [email protected] [email protected] [email protected]
2Université des frères Mentouri, Constantine, Département de Génie Mécanique, route de Ain El Bey
Constantine 25000, Algérie. E-mail: [email protected]
3Department of Aerospace Engineering, University of Bristol, Queens Building, University, Walk BS8
1TR Bristol UK. E-mail: [email protected]
4Université de Tizi-Ouzou –Algeria E-mail: [email protected]
Abstract:
The work describes the statistical characterization of the tensile properties of raw and treated
jute yarn fibers. The yarns are treated with various alkaline sodium hydroxide concentrations
(0.5, 2 and 5%) and different immersion times at room temperature (30 minutes, 2, 8 and 12
hours). Due to the scattering of the experimental results, statistical analysis was performed
using both two- and three-parameters Weibull, and Anova variance methods. In terms of
stress, failure strain, and Young modulus, the results obtained from uniaxial tensile yarns
show a variation that depends essentially on the immersion time and the NaOH concentration.
Optimum mechanical properties are obtained for a concentration of 2% of NaOH and an
immersion time of 2 hours. The results are further discussed in view of an extensive Fourier
Transform Infrared Spectroscopy (FTIR) analysis carried out on the different classes of yarns.
Key words:
Jute fiber, Material testing, Mechanical properties, Chemical treatment, Statistical analysis
* Corresponding author:
Prof. Abderrezak BEZAZI
Laboratoire de Mécanique Appliquée des Nouveaux Matériaux (LMANM), Université 8 Mai 1945
Guelma, B.P.401 Guelma 24000 Algérie.
E-mail : [email protected]

2
1. Introduction
The demand for commercial products that are environmentally sustainable is becoming
strong. Composite materials based on natural fibers can be considered as an ideal class of
solids for sustainability applications. Different types of plant fibers such as jute [1- 3], sisal
[4, 5], flax [6, 7], hemp [8], alfa [9] and other natural fibers [10-14] are used as reinforcement
in composite materials. Natural fibers may be considered as an interesting alternative to
synthetic fibers like glass, particularly in terms of equivalent stiffness. The short coming of
using natural fibers resides however in the non-uniformity in their mechanical and physical
characteristics (non-constant diameter of the fiber, variable length, micro-fibril angle fiber and
its cellulose ratio). This lack of uniformity leads to the dispersion and scattering of their
mechanical properties [15, 16].
Natural fibers have been the subject of various studies, starting from the production of the
crop, its spinning, the choice of the micro-fibril angle, the weaving mode and the fiber
treatment. As far as the fiber treatment is concerned, many investigations have been carried
out to improve the interface bonding between the fiber and the matrix by the application of a
chemical treatment over the fiber surface [17]. To this end, two parameters are generally
taken into consideration: (1) the sodium hydroxide concentration ratio, and (2) its effective
processing time.
Numerous research studies have been focused on the characterization of natural fibers, but
little has been focused on fiber yarns linked together, the most commonly used type of natural
fiber reinforcement consists in ropes. Fibers are constituted by a multitude of components like
cellulose, hemicellulose, pectin, lignin and wax [17, 18]. The optimization of the interface
flax fiber-unsaturated polyester resin within composites has generated a series of procedures
involving successive treatments of the flax fiber, either by using sodium hydroxide (10g/l),
acetic anhydride or formic acid. These treatments result in the increase of the bonding
3
between the fiber and the polymer matrix, and the smoothing of the surface of the fibers by
reducing its roughness [19].
A solution of NaOH with concentrations equal to 2% to 5% at an ambient temperature of
23°C was used for the treatment of date palm fibers [20]. These fibers were intended to be
used as reinforcement in polymer composites and were consequently immersed in a sodium
hydroxide solution for 2, 4, 6 and 24 hours. This treatment cleaned most of the impurities
from fiber surface. Impurities may affect the absorption properties, with particular reference
to the moisture, because the minimization of the hemicelluloses reduces the water absorption
property of the fiber [20]. The impact of the NaOH treatment on the mechanical properties of
date palm fruit branches for different immersion times has also been investigated [13]. The
results showed a net improvement of the mechanical properties for these fibers, in particular
for a NaOH concentration of 0.5% and an immersion time of 12 hours.
Studies have also been performed on the influence of the surface characteristics of jute
fabrics, along with the characterization of the mechanical properties of jute/polyester
composites [21]. Three surface treatments using alkali, silicone micro-emulsion (MS), and
fluoro-carbon agents (FA) have been considered. The results obtained show the decrease of
the fiber stiffness after each surface treatment, and the jute yarn tensile strength increasing by
10.8% after the jute alkali treatment [21]. Lyocell fibers have also been subjected to
investigation [22]. In order to find out the impact of the alkali treatment on the absorption
behavior of the cellulose II of the lyocell fibers, a continuous pre-treatment using NaOH with
concentrations ranging from 0.00 to 7.15 mol/dm3 and varying tension was applied to the
woven fabric. The process was intended to condition the samples in a 65±4% relative
humidity and at 20±2oC temperature for 48 hours before the alkali treatment. The results show
an increase of the absorption energy of the hydrolyzed reactive dyes onto cellulose II lyocell

4
fibers with higher NaOH concentrations (2.53mol/dm3to3.33mol/dm3), followed by a
decrease of the same energy with further increase of NaOH beyond 3.33mol/dm3.
The jute fiber is one of the cheapest natural fibers available, with its crop taking
approximatively four months to reach maturity, with up to two tons per hectare of yield [23].
Jute is totally biodegradable and recyclable, and it is especially used in the manufacturing of
bags used for storing agricultural products. Among the commonly used plant fibers, those
obtained from the jute crops show quite interesting properties, and the present investigation
focuses on further evaluation of the mechanical properties of the yarn jute fibers. In this work,
different NaOH concentrations (0.5, 2 and 5%) are applied at room temperature for
immersions lasting 30 minutes, 2, 8 and 12 hours. A two and three parameters Weibull
statistical method and an Anova variance analysis have also been carried out to provide a
robust statistical appraisal of the dispersion of the results. Furthermore, a Fourier transform
infrared spectroscopy (FTIR) characterization has been carried out to identify the influence of
the treatment on the fibers chemical composition, and its results are reported.
2. Experimental Approach
2.1. Material
Samples have been provided by a natural fiber ropes factory located in Bejaïa, Algeria. The
length of the fibers varies between 1m to 4m, and their diameter from 17 m to 20m. The
jute yarns are composed of many jute fibers with an average diameter of 860 m ± 125m.
They are produced with a twisted surface angle ranging between 11° and 13°, and a linear
density of 267 Tex ± 4 Tex [16]. The average mechanical properties used have been reported
in a previous work [24]. The samples are taken from a bidirectional fabric that possesses a
surface density of 400 g/m2. They are cut to a length of approximately 100 mm.

5
2.2. Alkali treatment of the jute yarns
To improve the interface fiber/matrix quality and consequently enhance the
performance of the composite material, the external surfaces of the fibers may be modified
chemically and/or physically by removing their natural and/or artificial impurities [25-27].
The jute yarns investigated in this work have been immersed, at room temperature and in
open barrels, in a NaOH solution with different concentrations (0.5%, 2% and 5%) and
immersion times (0.5, 2, 8 and 12 hours). The yarns were subsequently rinsed using tap water
before being immersed in a 1%-concentrated sulfuric acid solution (H2SO4) for 5 minutes to
neutralize the sodium ions present in the fibers during the alkali treatment. After being
washed again and immersed in distilled water for 15 minutes to reach a neutral pH, the yarns
were finally dried in an oven at a temperature of 70°C for 5 hours. The above-cited treatments
have resulted in an approximately 20% decrease of the diameter of the treated yarn.
2.3. Measurement of the fiber diameter
The original yarns jute fibers had diameters varying between 600μm and 1200μm (Fig. 1).
The measurements have been taken by using a Zeiss optical microscope equipped with a
Moticam 2500 digital camera controlled by MoticImages plus V2.0 processing image
program. The diameters of the yarns has been measured before and after the treatment. For
every sample, the measurements have been taken at nine different stations along its length.
Figure 1
2.4. Scanning Electron Microscopy
The longitudinal and transversal surfaces of the treated and untreated yarns have also been
examined using a scanning Electron Microscope type ESEM-XL30, and the results are
presented in Fig. 2. The surfaces of the treated fibers are rough compared to those which have

6
not been treated. The removal of the surface impurities including non-cellulosic substances,
inorganic substances and waxes leads to a cleaner and rougher external state of the fiber that
agrees well with the findings of Hossain et al. [28].
Figure 2
2.5. Infrared spectrometry analysis
Infrared spectrometry has been performed using a Thermo Scientific Nicolet Spectrum
iS10 FT-IR type spectrometer with proprietary analysis software. The spectra were measured
performing sampling at intervals of 125 nm within the band width 500 cm-1- 4000 cm-1.
2.6. Test machine
Monotonic tensile tests on the jute yarns have been performed using a universal testing
machine Zwick Z005 type with a 5kN capacity load at a speed of 2 mm/min at an ambient
temperature of 23°C and an approximate humidity ratio of 55%. The Young’s modulus of the
jute yarns has been determined according to the ASTM D578 standard using a 50mm gage
length. Due to the variability of natural fibers, 390 specimens divided in 13 series of 30
samples each have been tested in total.
3. Results and Discussion
3.1. Infrared Spectrometry
The FTIR spectra with the main IR bands corresponding to the whole untreated and treated
fiber jute yarns for different concentrations of NaOH and diverse immersion times, and their
different groups’ vibrations are shown in Fig. 3. The wave forms of the spectra are plotted as
Transmittance (T) versus the wave number (1/cm). The FTIR spectrum analysis of the
untreated jute fiber shows a large band at 3330cm-1 mainly due to the OH groupings existing
in the jute fiber structure, which originate from the α-cellulose present in all types of yarns.
The results are in good agreement with those obtained by Shaha et al. [29].

7
Figure 3
The peak of 2917 cm-1 corresponds to the vibrations of the CH aliphatic chains, while the
ones corresponding to 1732 cm-1, 1638 cm-1, 1314 cm-1, 1243 cm-1 and 1022 cm-1 indicate the
existence of the C═O stretching mode of the carboxylic acid, the CH3 asymmetric stretch, the
CH symmetric stretching and aromatic and C─O simple connections, respectively. The NaOH
treatment resulted in a structural alteration of the treated jute fiber surface where the peaks
1732 cm-1 and 1250 cm-1 (corresponding to the C=O stretching of the hemicelluloses and the
CH stretching of the aromatic skeleton ring vibration of the lignin) vanished. The FTIR
analysis shows that the NaOH treatment has affected the intensity of the spectra of the fibers,
as well as the peaks of the absorption bands (see Fig. 3 and Table 1), with consequent effects
on the chemical composition, the hemicelluloses and the lignin [15, 30]. The results obtained
are presented in Table1, and compared to those obtained in the literature for several classes of
fibers, like jute [28, 29], kenaf [30, 31] and sisal [32].
Table 1
3.2. Tensile strength of jute yarn
Of the total 390 jute yarn specimens assembled into 13 groups of 30 samples each that
underwent static tensile tests, 360 were subjected to diverse alkali treatments using NaOH.
The rest remained untreated.
Fig. 4(a) shows the results of the tensile tests from the 30 untreated jute yarns. A
significant dispersion of the results can be noticed, which is a phenomenon characteristic of
most natural fibers, and shows the need of performing a robust statistical analysis. Fig. 4(b)
shows a representative stress/strain curve of the thirty untreated samples presented in Fig.
4(a). The stress varies first linearly and then quasi-linearly, with the increase of the strain
until it reaches its maximum value, followed by a sudden drop in stress without total rupture

8
of the sample. This behavior is due to the topology of the jute yarns created by the fibres
twisted into a spiral. This configuration creates voids and spaces between the fibres. Fig. 4(c)
shows a comparison of the treated and untreated fibers, with representative curves of thirteen
group specimens (thirty tests by group). The results of Fig. 4(c) show that the representative
curve of the treated yarns with 2% NaOH and 2 hours immersion time has higher tensile
strength and Young’s modulus than the case related to the untreated fiber, with an equivalent
strain at failure. However, the typical curve of the specimen treated with 2% NaOH for an
immersion time of 12 hours has a tensile strength, Young’s modulus and strain at failure
lower than the untreated one (see Fig. 4(d)).
Figure 4
For a better understanding, all the results obtained are regrouped in Table 2 and plotted in
Fig. 5 with the average values of the stress, strain and the Young’s modulus for the NaOH
concentrations of 0.5%, 2% and 5% using different immersion times. The treated jute yarns
by different NaOH concentrations at different immersion times show an increase of 5% to
34% of the tensile strength, and 5% to 25% of the Young’s modulus compared to the
untreated fibers case. The strain at failure however decreased with the increase of the
treatment time. The best case is obtained for a 2% NaOH concentration and 2 hours of
immersion time and the average ultimate values at failure are found to be 178.4 MPa for the
stress, 26.4 GPa for the Young’s modulus and 4.17% for the strain. Concerning the untreated
fibers, the same properties have been measured at 117.7 MPa, 19.78 GPa and 4.39 %. An
increase of 34% and 25% for the stress and Young’s modulus respectively and a decrease of
16% for the strain, due to the treatment is noticed. Table 2 summarizes the variation of the
average values of the mechanical properties with regard to the various NaOH concentrations
and immersion times used. These values are then analysed using the Coefficient of Variation
(CoV %), which is described as the ratio between the standard deviation and the average one

9
[34]. A low value of the CoV indicates a little variation in the results. In the present case, the
results of the CoV obtained are compared to those reported in the literature (see Table 2).
Figure 5
Table 2
4. Statistical Study
4.1. Two-and three-parameter Weibull distribution
The experimental characterization of jute yarns carried out and presented above shows a
large dispersion of the stress and strain at failure, and also of the Young’s modulus. An
effective engineering use of these results needs a statistical analysis carried out through the
application of both two- and three-parameters Weibull approach, using the software
Minitab16 in this particular work.
The three mechanical properties under investigation represented by the stress, the strain
and the Young’s modulus may be described by using the two-parameter Weibull distribution
law [35, 36]:
>0, 0>0, m>0 (1)
Where m is a dimension less shape factor related directly to the dispersion of the data, 𝜒0 a
local parameter representing an average value of 𝜒, and P(𝜒) the fiber failure probability
function related to the parameter 𝜒.
When the ultimate parameter ( u) is integrated into the distribution theory, the three-
parameter Weibull distribution law is then expressed as [32]:
, > > > 0, m>0 (2)
The value of P is computed by a metric estimator represented as an average value rank
[37] as:

10
(3)
Where ‘i’ represents the ith data point and n the number of points, and the parameters m and 𝜒0
are obtained from a straight line Weibull model approach. Linear transformation of equations
(2) and (3) as function of ln (𝜒) leads to:
(4)
(5)
Fig.6 illustrates the two- and three-parameters Weibull distributions of the mechanical
properties obtained from the experiments carried out at various NaOH concentrations during a
2 hours period. It may be observed that the experimental results are close to the Weibull line,
the correlation factor varying from 0.947 to 0.996 thus indicating a good agreement between
the linear regression of the fiber mechanical properties and the experimental results.
Figure 6
The two-parameter Weibull distribution enables the estimation of the stress and the
Young’s modulus as σ0 = 193.27 MPa and E0 = 27.73 GPa, corresponding to the Weibull
shape factors of mσ = 3.89 and mE = 2.62. These results are close to the measured ones (σ =
178.39 MPa and E = 26.4 GPa). The three-parameter Weibull distribution does not provide
quite a satisfactory estimation as the two-parameter one, with σ0 = 144.97 MPa and E0 = 19.14
GPa and Weibull shape factors mσ = 2.56 and mE = 1.44. These values are significantly lower
than the experimental ones.
It may be therefore stated that, while the two-parameter Weibull approach slightly
overestimates the experimentally measured mechanical properties represented by the tensile

11
strength and the Young’s modulus, the three-parameter Weibull distribution however largely
deviates from and underestimates the actual experimental results (see table 3).
Table 3
4.2. ANOVA analysis
Applying the one-parameter Anova variance approach to all experimental results of the
stress, strain and Young’s modulus measured on untreated and treated yarn fibers with
different NaOH concentrations (0.5%, 2% and 5% at 30 min, 2 hours, 8 hours and 12 hours
immersion times) lead to different values of p, which is different than the significance level (p
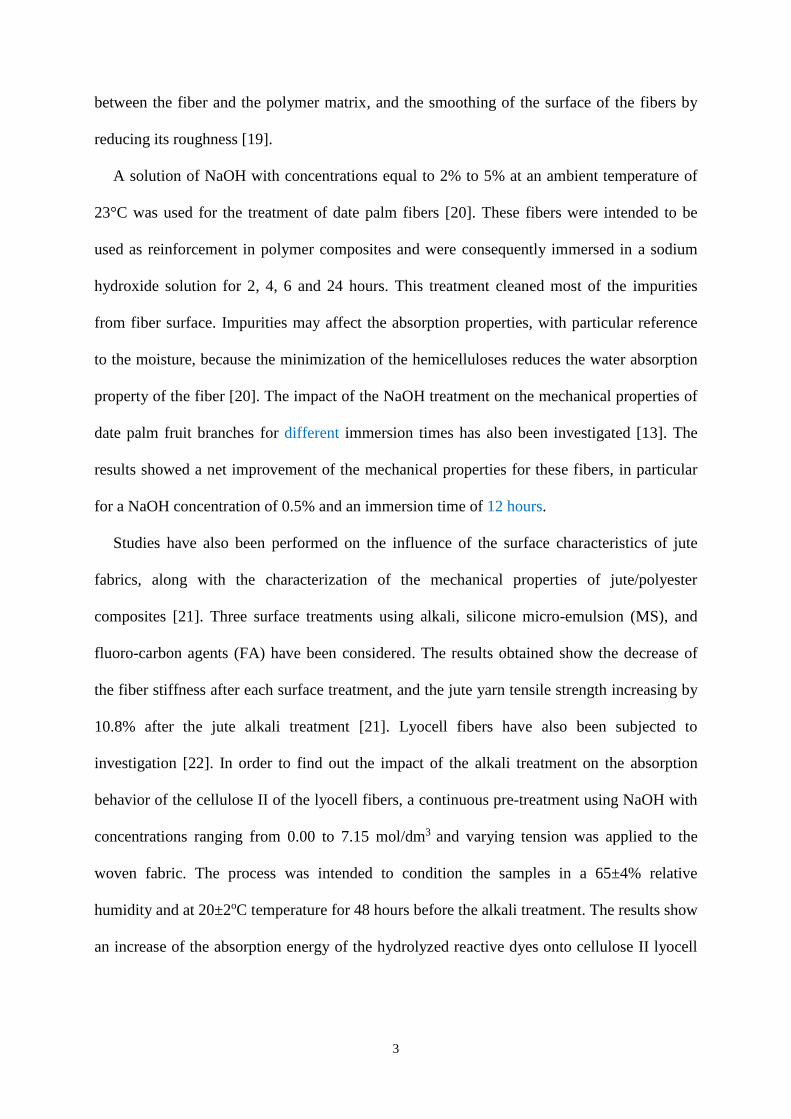
= 0.05, or 95% confidence level). Table 4 shows the degrees of freedom (DF), sum of squares
(SS), mean square (MS), Fisher modulus (F) and probability (P). The mean square (MS) is the
ratio between the sum of the squares (SS) and the degrees of freedom (DF). The F-value
represents the ratio between the mean square and the experimental error mean square. In a
robust design, the F-value can be used as a qualitative understanding of the relative factor
effects. If the F-values are greater than a critical value (F critical) the effects will be
considered to be significant. Conversely, if the F-value is less than F critical, then the effects
would be considered insignificant. The independent variable in the analysis is represented by
the concentration of the NaOH groups and the untreated one (four groups), while the
dependent variables are the stresses at failure (30 samples for each group) for an immersion
time. The same procedure is followed for the strain and Young’s modulus. For example, for
the yarns treated with 2% NaOH for an immersion time of 2 hours (which represents the best
case featuring the highest mechanical properties- see Table 2), the Fisher modulus of the
stress F = 8.90 and strain F = 4.23 are superior to their critical value Fcr = 2.60 (see Table 4).
In this case, the null hypothesis is dropped. However, the Fisher modulus of the Young’s
modulus (F = 0.62) is lower than the critical value, which means that there are non-significant

12
differences of the Young’s modulus between treatments. Moreover, the individual charts (Fig.
7) present the average values of the ultimate stresses (Fig. 7a), strains (Fig. 7b) and Young’s
modulus (Fig. 7c), for all the experimental results, differ for different NaOH concentrations at
various immersion times. The yarns treated with 2% NaOH concentration for 2 hours
immersion time shows the highest values on stress and Young’s modulus equal to σ = 178.39
MPa, and E = 26.40 GPa respectively and an equivalent strain, leading to a good agreement
with the untreated one of 117.70 MPa, 19.78 GPa and 4.39%.
Table 4
Figure 7
The residual values curves are represented in Fig. 8, and they are intended for the control
of the statistical hypotheses. The Non-uniformity diagram (Fig.8(a)) shows a nearly straight
line (known as the Henry straight line) meaning that the residuals values are uniformly
distributed. Fig.8(b) plots the residual values against the adjusted ones, and shows a random
distribution around zero. The histogram of Fig.8(c) represents the residuals and identifies
multiple peaks along with aberrant normal values and non-uniformity. The residual values
when expressed as a function of the observation order leads to identifying their chronological
dependence, presenting the random structure illustrated in Fig.8(d). The residual graphs show
no contradiction with the statistical hypotheses, and the Anova one-factor model is thus found
to be a good fit to the experimental data.
Figure 8
5. Conclusions

13
An experimental investigation is undertaken to show the influence of NaOH alkali
treatment on the mechanical properties of the yarn jute fibers. Three hundred and sixty
specimens were treated differently in terms of sodium hydroxide concentration and
immersion times, and compared to 30 untreated samples. The study included processing using
a scanning optical microscope, and further examined using the FTIR technique.
In view of the dispersion of the experimental results obtained, statistical analyses were
carried out through the application of both two- and three-parameters Weibull, and Anova
variance approaches. The comparison between results of this study leads to the following
conclusions:
1. The current research is better than the previous ones found in the literature because almost
of the authors have considered the treatment of the jute fibers with a high concentration of
NaOH (5%, 10% and 25%). However, in the present investigation it has been demonstrated
that for the jute yarns the best results leading to an enchantment of the mechanical
properties are obtained at low concentration of NaOH (2%) and low immersion times (2h)
which is more environmental friendly. In other words, the NaOH treatment improves the
mechanical properties of the jute yarns, and provides an increase of 5% to 34% of the
tensile strength, and 5% to 25% for the Young’s modulus and equivalent strain compared
to the untreated fibers, using low concentrations (0.5% and 2%). Optimum results are
obtained for a 2% NaOH concentration along with a 2 hours immersion time with 178.4
MPa for the stress, 26.4 GPa for the Young’s modulus and 4.17% for the strain.
2. The experimental results obtained are characterized by their high dispersion, leading to the
need for a statistical analysis to achieve a true estimation of the mechanical properties.
3. The two-parameter Weibull distribution analysis leads to better results compared to its
three-parameter counterpart in terms of estimation of the experimental results obtained.

14
4. The Anova approach was also applied to the experimental results, with a 95% of
confidence level. By using this statistical method one can conclude that the treatment
affects the mechanical properties of jute yarns. For the best case obtained with a 2% NaOH
treatment for an immersion time of 2 hours, the Fisher factors of the ultimate stress and
strain are valued at F = 8.90 and F = 4.23. These values are greater than their critical
threshold (Fcr = 2.60). This means that there are significant differences in stress and strain
between treatments. However, the Young’s modulus of F = 0.62 is less than the critical
value, which means there are non-significant differences of the Young’s modulus between
treatments.
5. The analysis of the spectra obtained by the FTIR technique shows that the peaks at 1732
cm-1 and 1250 cm-1 vanish for the treated jute fiber. This corresponds to the C=O stretching
bands of hemicelluloses and CH stretching of aromatic skeleton ring vibration of lignin.
Acknowledgements
The authors would like to thank Mr. Mahmoud Saidia for correcting the English language.
References
[1] A. Roy, S. Chakraborty, S.P. Kundu, R.K Basak, S.B. Majumder, B. Adhikari, Improvement in mechanical
properties of jute fibers through mild alkali treatment as demonstrated by utilisation of the Weibull
distribution model, Bio-res. Tech. 107 (2012) 222-228.
[2] A. Memon, A. Nakai, Mechanical properties of Jute spun yarn/PLA tubular braided composite by pultrusion
molding, Energy Proc. 34 (2013) 818 – 829.
[3] A.MIR, R. Zitoune, F. Collombet, B. Bezzazi, Study of mechanical and thermo mechanical properties of
jute/epoxy composite laminate, Reinf. Plas. Comp. 29 (2010) 1669-1680.
[4] A. Belaadi, A. Bezazi, M. Bourchak, F. Scarpa, Tensile static and fatigue behavior of sisal fiber, Mater. Des.
46 (2013) 76–83.
[5] F.de Andrade Silva, N. Chawla, R. D. de Toledo Filho, Tensile behavior of high performance natural (sisal)
fibers, Comp. Sci. Tech. 68 (2008) 3438-3443.
[6] C. Baley, Analysis of the flax fibers tensile behavior and analysis of the tensile stiffness increase, Appl. Sci.
Man. 33 (2002) 939-948.
[7] A.A. Abdul Nasir, A.I. Azmi, A.N.M. Khalil, Measurement and optimisation of residual tensile strength and
delamination damage of drilled flax fibre reinforced composites, Measurement.75 (2015) 298–307.
[8] G.W. Beckermann, K.L. Pickering, Engineering and evaluation of hemp fiber reinforced polypropylene
composites: Micro-mechanics and strength prediction modeling, Appl. Sci. Man.40 (2009) 210-217.

15
[9] A. Benyahia, A. Merrouche, Effect of chemical surface modifications on the properties of alfa fiber-polyester
composites, Polym. Plas. Tech. Eng.53 (2014) 403-410.
[10] A. Elsaid, M. Dawood, R. Seracino, C. Bobko, Mechanical properties of kenaf fiber reinforced concrete,
Const. Buil. Mater. 25 (2011) 1991-2001.
[11] A.N. Benítez, M.D. Monzón, I. Angulo, Z. Ortega, P.M. Hernández, M.D. Marrero, Treatment of banana
fiber for use in the reinforcement of polymeric matrices, Measurement. 46 (2013) 1065-1073.
[12] R. Chollakup, W. Smitthipong, W. Kongtud, R. Tantatherdtam, Polyethylene green composites reinforced
with cellulose fibers (coir and palm fibers): effect of fiber surface treatment and fiber content, Adh. Sci.
Tech. J. 27 (2013) 1290-1300.
[13] S. Amroune, A. Bezazi, A. Belaadi, C. Zhu, F. Scarpa, S. Rahatekar, A. Imad, Tensile mechanical
properties and surface chemical sensitivity of technical fibers from date palm fruit branches (Phoenix
dactylifera L.), Appl. Sci. Man. 71 (2015) 95-106.
[14] D. Rosa, I. M. Kenny, J. M. D Puglia, C. Santulli, F. Sarasini, Morphological, thermal and mechanical
characterization of okra (Abel moschusesculentus) fibers as potential reinforcement in polymer
composites,Comp. Sci. Tech. 70(2010) 116-122.
[15] J. Lin, L. Yu, F. Tian, N. Zhao, X. Li, F. Bian, J. Wang, Cellulose nanofibrils aerogels generated from jute
fibers, Carb. Polym. 109 (2014) 35-43.
[16] R. Codispoti, D.V. Oliveira, R.S. Olivito, P.B. Lourenço, R. Fangueiro, Mechanical performance of natural
fiber-reinforced composites for the strengthening of masonry. Comp. Part B: Eng. 77 (2015) 74-83.
[17] M. Rokbi, H. Osmani, l’effet des traitements de surface des fibres sur les propriétés mécaniques de
composites polyester- fibres alfa, 20eme Congrès Français de Mécanique ; Aout 29-Septembre 2 ;
Besançon, France.
[18] A. Alawar, A. M. Hamed, K. Al-Kaabi, Characterization of treated date palm tree fiber as composite
reinforcement, Comp. Part B: Eng. 40 (2009) 601-606.
[19] E. Balnois, F. Busnel, C. Baley, Y. Grohens, An AFM study of the effect of chemical treatments on the
surface microstructure and adhesion properties of flax fibers, Comp. Interfaces 14 (2007) 715-731.
[20] I. Taha, L. Steuernagel, G. Ziegmann, Optimization of the alkali treatment process of date palm fibers for
polymeric composites. Comp. Interfaces 14 (2007) 669-684.
[21] K. Sever, M. Sarikanat, Y. Seki, G. Erkan, Ü.H. Erdoğan, S. Erden, Surface treatments of jute fabric: the
influence of surface characteristics on jute fabrics and mechanical properties of jute/polyester composites,
Indust. crops Prod. 35 (2012) 22-30.
[22] J. Siroky, R.S. Blackburna, T. Bechtold, J. Taylor, P. White, Alkali treatment of cellulose II fibers and
effect on dye sorption, Carbo. Polymers 84 (2011) 299–307.
[23] A. Lewington, Plants for People: Eden Project Books/Transworld Publisher: London 2003.
[24] A. Saaidia, A. Bezazi, A. Belbah, S. Amroune, F. Scarpa. Evaluation of Mechanical Properties of Jute yarns
by two and three parameters Weibull Method, Structural integrity and life 15 (2015) 157–167.
[25] D. Ray, B.K. Sarkar, Characterization of alkali‐treated jute fibers for physical and mechanical properties,
Appl. Polym. Sci. J. 80 (2001) 1013-1020.
[26] H. Hamada, N. Ikuta, N. Nishida, Z. Maekawa, Effect of interfacial silane network structure on interfacial
strength in glass fiber composites, Composites 25 (1994) 512-515.
[27] V. Anggraini, A. Asadi, B.B.K. Huat, H. Nahazanan, Effects of coir fibers on tensile and compressive
strength of lime treated soft soil, Measurement 59 (2015) 372-381.
[28] M.K. Hossain, M.W. Dewan, M. Hosur, S. Jeelani, Mechanical performances of surface modified jute fiber
reinforced biopolnanophased green composites, Comp. Part B: Eng. 42(2011) 1701-1707.
[29] S. K. Shaha, S. Dyuti, Q. Ahsan, M. Hasan, Effect of Alkali Treatment on Surface Morphology and
Properties of Jute Yarns, Adv. Mat. Res. Vols 264-265 (2011) 1922-1927.
[30] N. I. Mbada1, O. Aponbiede, T. Ause, A. Alabi, Effects of Mercerization Treatment on Kenaf Fibre
(Hibiscus cannabinus L.), Int. J. Mat. Eng., 6 (2016) 8-14.

16
[31] H. Onggo, S. Pujiastuti, Effect of Weathering on Functional Group and Mechanical Properties of
Polypropylene-Kenaf Composites, Jurnal Sains Materi Indonesia, 11(2010) 1-6.
[32] A. Belaadi, A. Bezazi, M. Bourchak, F. Scarpa, C. Zhu, Thermo-chemical and statistical mechanical
properties of natural sisal fibers, Comp. Part B: Eng. 67 (2014) 481-489.
[33] A. Bezazi, S. Amroune, F. Scarpa, Statistical analysis and effect of chemical treatment on the physico-
mechanical behavior of fibres from date-palm fruit branches, Rev. Sci. Technol., Syn. 31(2015)108 -120.
[34] A.S. Virk, W. Hall, J. Summerscales, Failure strain as the key design criterion for fracture of natural fibre
composites, Comp. Sci. Tech. 70(2010) 995-999.
[35] J.M. Park, S.T. Quang, B.S. Hwang, K.L. De Vries, Interfacial evaluation of modified Jute and Hemp
fibers/polypropylene (PP)–maleic anhydride polypropylene copolymers (PP–MAPP) composites using
micromechanical technique and nondestructive acoustic emission,Comp. Sci. Tech. 66(2006) 2686 - 2699.
[36] L. Peponi, J. Biagiotti, J.M. Kenny, I. Mondragon, Statistical analysis of the mechanical properties of
natural fibers and their composite materials, II. Composite materials: Poly. Comp. 29 (2008) 321-325.
[37] M. Guo, T. H. Zhang, B. W. Chen, L. Cheng, Tensile strength analysis of palm leaf sheath fiber with
Weibull distribution, Appl. Sci. Man. 62 (2014) 45-51.

17
Figure captions
Fig. 1. (a) Bundle of 30 yarn jute fibers, (b) Measurement of the diameter using optical microscope.
Fig.2. Scanning electron microscopy (SEM) image of untreated (a,b) and treated (c,d) yarn jute fibers
Fig. 3. Spectra of jute fibers untreated and treated by different concentrations of NaOH for diverse
immersion times.
Fig. 4. Tensile strength representation:
(a) Stress/Strain curves of thirty tests on untreated yarn jute fibers;
(b) Representative stress/strain curve of the thirty tests on untreated yarn jute fibers;
(c) Comparison of representative stress/strain curves of thirteen group’s treated and untreated
yarn jute fibers;
(d) Comparison of representative stress/strain curves of treated and untreated yarn jute fibers.
Fig.5. Mechanical properties of untreated yarn jute fibers and treated by different NaOH
concentrations for diverse immersion times.
Fig.6. Two-and Three-parameter Weibull statistical analysis results of untreated yarn jute fibers and
treated by various NaOH concentrations during 2 hours immersion time.
Fig.7. Individual value diagrams of the mechanical properties of untreated yarn jute fibers and treated
by different NaOH concentrations for diverse immersion times.
Fig.8.Representation of the residual stress values
Table captions
Table 1. Peaks’ attribution with their intensities observed in FTIR spectra of jute fibers untreated and
treated by different concentrations of NaOH for diverse immersion times.
Table 2. Average values of the mechanical properties of untreated yarn jute fibers and treated by
different concentrations of NaOH for diverse immersion times.
Table 3. Average values of 2 and 3 parameters Weibull yarns jute fibers untreated and treated by
NaOH for different concentrations during 30 min, 2h, 8h and 12h immersions time.
Table4. Variance analysis of tensile strength (MPa), Young's modulus (GPa) and strain (%) versus
NaOH concentration ratio at 95% level of significance.

18
Fig. 2.Scanning electron microscopy (SEM) image of untreated (a,b) and treated (c,d) yarn jute
fibers.
13°
(b) (a)
-a- -b-
Fig. 1. (a) Bundle of 30 yarn jute fibers, (b) Measurement of the diameter using
an optical microscope.

19
500 1000 1500 2000 2500 3000 3500 400020
30
40
50
60
70
80
90
100
110
Tra
nsm
itta
nce
[%
]
Wave number [cm-1]
Raw
0,5aOH
2% NaOH
5aOH
O-H
C-H
C-O
3330
2917
C=OCH
3
CH
C-O
1022
1243
1314
1638
1732
30min
500 1000 1500 2000 2500 3000 3500 4000
50
60
70
80
90
100
110
Tra
nsm
itta
nce
[%
]
Wavenumber [%]
Raw
0,5% NaOH
2% NaOH
5% NaOH
3330
2917
1732
1638
1022
1243
1314
C-O
C-O
CH CH3
C=O
C-H
O-H
2hours
500 1000 1500 2000 2500 3000 3500 4000
20
30
40
50
60
70
80
90
100
110
Tra
nsm
itta
nce
[%
]
Wavenumber [cm-1]
Raw
0,5% NaOH
2% NaOH
5% NaOH
3330
1022
C-O
1243
1314
1638
1732
2917
O-H
C-HC=O
CH3
C-OCH
8hours
500 1000 1500 2000 2500 3000 3500 4000
30
40
50
60
70
80
90
100
110
Tra
nsm
itta
nce
[%
]
Wavenumber [cm-1]
Raw
0,5% NaOH
2% NaOH
5% NaOH
C-O
O-H
C-H
2917
33301022
C-O
CH CH3C=O
1732
1632
1314
1243
12hours
Fig. 3. FTIR spectra of jute fibers untreated and treated by different concentrations of NaOH for
diverse immersion times.

20
Fig. 4. Tensile strength representation: (a) Stress/Strain curves of thirty tests on yarn jute fibers;
(b) Representative stress/strain curve; (c) Comparison of representative stress/strain curves of
thirteen group’s treated and untreated yarn jute fibers; (d) Comparison of representative
stress/strain curves of treated and untreated yarn jute fibers.

21
Fig. 5. Mechanical properties of untreated yarn jute fibers and treated by different NaOH
concentrations for diverse immersion times.

22
1000100
99
90
80706050
40
30
20
10
5
3
2
1
Stress (MPa)
Pro
ba
bili
ty (
%)
Raw
0,5% NaOH
2% NaOH
5% NaOH
Variable
Complete Data - LSXY Estimates
2 Parameter Weibull - 95% CI
1000100101
99
90
80706050
40
30
20
10
5
3
2
1
Stress (MPa)
Pro
ba
bili
ty (
%)
Raw
0,5% NaOH
2% NaOH
5% NaOH
Variable
Complete Data - LSXY Estimates
3-Parameter Weibull - 95% CI
10010
99
90
80706050
40
30
20
10
5
3
2
1
Young's Modulus (GPa)
Pro
ba
bili
ty (
%)
Raw
0,5% NaOH
2% NaOH
5% NaOH
Variable
Complete Data - LSXY Estimates
2- Parameter Weibull - 95% CI
100101
99
90
80706050
40
30
20
10
5
3
2
1
Young's Modulus (GPa)
Pro
ba
bili
ty (
%)
Raw
0,5% NaOH
2% NaOH
5% NaOH
Variable
Complete Data - LSXY Estimates
3-Parameter Weibull - 95% CI
765432
99
90
80706050
40
30
20
10
5
3
2
1
Strain (%)
Pro
ba
bili
ty (
%)
Raw
0,5% NaOH
2% NaOH
5% NaOH
Variable
Complete Data - LSXY Estimates
2-Parameter Weibull - 95% CI
1010,10,01
99
90
80706050
40
30
20
10
5
3
2
1
Strain (%)
Pro
ba
bilit
y (
%)
Raw
0,5% NaOH
2% NaOH
5% NaOH
Variable
Complete Data - LSXY Estimates
3-Parameter Weibull - 95% CI
Fig. 6.Two-and Three-parameter Weibull statistical analysis results of
untreated yarn jute fibers and treated by various NaOH
concentrations during 2 hours immersion time

23
Raw5%2%0,5%
250
200
150
100
50
0
NaOH Treatment
Str
ess (
MP
a)
Individual Value Plot of Stress vs Treatment, 30min
Raw5%2%0,5%
250
200
150
100
50
0
NaOH Treatment
Str
ess (
MP
a)
Individual Value Plot of Stress vs Treatment, 2h
Raw5%2%0,5%
250
200
150
100
50
0
NaOH Treatment
Str
ess (
MP
a)
Individual Value Plot of stress vs Treatment, 8h
Raw5%2%0,5%
250
200
150
100
50
0
NaOH Treatment
Str
ess (
MP
a)
Individual Value Plot of stress vs Treatment, 12h
Raw5%2%0,5%
5,5
5,0
4,5
4,0
3,5
NaOH Treatment
Str
ain
(%
)
Individual Value Plot of Strain vs Treatment, 30min
Raw5%2%0,5%
5,5
5,0
4,5
4,0
3,5
3,0
NaOH Treatment
Str
ain
(%
)
Individual Value Plot of Strain vs Treatment, 2h
Raw5%2%0,5%
7
6
5
4
3
2
NaOH Treatment
Str
ain
(%
)
Individual Value Plot of Strain vs Treatment, 8h
Raw5%2%0,5%
6
5
4
3
2
1
NaOH Treatment
Str
ain
(%
)
Individual Value Plot of Strain vs Treatment, 12h
(b)
(a)

24
Raw5%2%0,5%
50
40
30
20
10
0
NaOH Treatment
You
ng
's M
odu
lus (
MP
a)
Individual Value Plot of Modulus vs Treatment, 30 min
Raw5%2%0,5%
50
40
30
20
10
0
NaOH Treatment
You
ng
's M
odu
lus (
GP
a)
Individual Value Plot of Modulus vs Treatment, 2h
Raw5%2%0,5%
40
30
20
10
0
NaOH Treatment
Yo
un
g's
Mo
du
lus (
GP
a)
Individual Value Plot of Modulus vs Treatment, 8h
Raw5%2%0,5%
40
30
20
10
0
NaOH Treatment
You
ng
's M
odu
lus (
GP
a)
Individual Value Plot of Modulus vs Treatment, 12H
Fig. 7. Individual value diagrams of the mechanical properties of untreated yarn jute fibers and treated
by different NaOH concentrations for diverse immersion times.
100500-50-100
99,9
99
90
50
10
1
0,1
Residual
Pe
rce
nt
160150140130120
100
50
0
-50
-100
Fitted Value
Re
sid
ua
l
9060300-30-60-90
0,016
0,012
0,008
0,004
0,000
Residual
De
nsit
y
1201101009080706050403020101
100
50
0
-50
-100
Observation Order
Re
sid
ua
l
Normal Probability Plot Versus Fits
Histogram Versus Order
Residual Plots for Stress [MPa], 2h
Fig. 8. Representation of the residual stress values
(c)

25
Table 1.Peaks’ attribution with their intensities observed in FTIR spectra of jute fibers untreated and treated by different concentrations of NaOH for diverse
immersion times.
1 2 3 4 5 6 7
Ref. Fiber
Treatment
(NaOH) Peak
C-O Stretching
vibration
C-O
stretching vibration
of the acetyl group in lignin
CH
symmetric
stretching and aromatic
CH3 Asymmetric
stretching
C=O Stretching vibration
of carboxylic acid
C-H Stretching of
cellulose
O-H Hydrogen bonded of OH
stretching in cellulose
Position 1022 1243 1314 1638 1732 2917 3330
Th
is w
ork
Jute
Raw Height 64.42 86.71 88.47 90.58 92.85 90.58 69.26
0.5% -30min Height 64.14 86.89 89.78 - 91.60 84.46
2% -30min Height 34.57 - 72.99 74.84 - 70.88 29.18
5% -30min Height 58.12 - 83.31 86.04 - 82.10 55.71
0.5%-2h Height 67.45 - 88.18 90.28 - 91.17 70.95
2%-2h Height 54.80 - 82.50 85.58 - 83.26 51.71
5%-2h Height 66.02 - 87.80 89.98 - 90.33 67.84
0.5%-8h Height 53.63 - 80.17 83.14 - 77.90 41.63
2%-8h Height 71.15 - 89.77 91.88 - 91.95 74.62
5%-8h Height 36.16 - 72.66 83.30 - 71.78 28.96
0.5%-12h Height 41.44 - 77.27 80.42 - 74.30 41.00
2%-12h Height 57.39 - 81.28 84.28 - 79.45 48.13
5%-12h Height 56.77 - 84.32 87.05 - 86.89 58.94
Kenaf
Raw Position 897 1045 1251 - 1420 1575 - 1737 2923 3440 3812
[30] Height 12.88 10.29 11.68 - 8.37 6.15 - 11.87 17.17 6.45 12.19
1% Position 802 1043 - - 1420 1576 - - 2932 3419 -
Height 15.42 13.13 - - 11.96 10.05 - - 14.93 10.03 -
Jute Raw Position 830 1030 1240 1370 1455 1625 1755 2900 3350 [29]
Jute 5% -2h Position - - - 1464 - 1730 2950 3400 [28]
kenaf Raw Position 899 1053 - - 1505 1595 1640 1740 2900 3400 [31]
Sisal Raw Position 1027 1236 1371 1426 1604 1736 2918 3331 [32]

26
Table 2.Average values of the mechanical properties of untreated yarn jute fibers and treated by
different concentrations of NaOH for diverse immersion times.
Experimental results
Fiber GL
mm
Concentration
[NaOH]
Stress σ
[MPa] SD
CoV
%
Young’s
Modulus
E [GPa]
SD CoV
%
Strain
ε [%] SD
CoV
% Ref.
Yar
n J
ute
Raw 117.70 27.77 23.59 19.78 4.98 25.18 4.39 0.69 15.72
Th
is w
ork
0.5%-30min 140.74 27.50 19.54 21.32 5.44 25.51 4.16 0.69 15.00
2%-30min 162.30 30.09 18.54 23.05 6.61 28.68 4.03 0.78 15.35
5%-30min 124.31 27.74 22.31 21.7 3.32 15.30 3.99 0.66 16.54
0.5%-2h 152.22 29.74 19.54 20.96 5.35 25.52 4.13 0.69 16.70
2%-2h 178.39 38.42 21.54 26.4 6.01 22.76 4.17 0.93 22.45
50 5%-2h 148.54 27.72 18.66 23.5 4.95 21.06 4.08 0.82 20.09
0.5%-8h 145.13 26.09 17.98 19.3 4.35 22.54 4.32 0.80 18.52
2%-8h 115.43 21.25 18.41 18.39 4.73 25.72 3.72 0.82 22.04
5%-8h 101.24 20.61 20.36 12.02 3.26 27.12 4.01 0.92 22.94
0.5%-12h 120.32 29.54 24.55 17.4 4.55 26.15 3.44 0.95 27.62
2%-12h 107.88 24.00 22.25 16.2 4.29 26.48 3.32 0.86 25.90
5%-12h 96.56 21.46 22.22 11.85 3.38 28.52 3.93 1.26 32.06
Jute 50 Raw 81.42 10 - 1.92 0.45 - 3.83 0.62 -
[28] 5%-2h 92.54 11 - 2.25 0.34 - 3.21 0.68 -
FPD Raw 125.97 33 26 4.52 1.58 0.35 3.44 0.8 0.23
[33] 50 2%-48h 291.9 11 28 8.96 3.14 0.35 4.10 0.6 0.15
Yarn
Jute - Raw 74.8 - 20 27. 69 - 24 0.03 - 15 [16]
Flax - Raw 198.1 - 14 59.13 - 18 3.22 - 7 [16]
Hemp - Raw 124.1 - 19 42.37 - 16 2.94 - 12 [16]
Sisal 20 Raw 424 125 - 9.69 3.02 - 6.03 2.16 - [32]
SD:Standard Deviation and CoV: Covariance
Table 3.Average values of two- and three-parameter statistical Weibull untreated yarns jute fibers and
treated by different concentrations of NaOH during diverse immersion times.
Concentration Two-parameter Weibull Three-parameter Weibull
m σ0 m E0 m ε0 m σ0 m E0 m ε0
Raw 5.74 126.51 4.08 21.67 8.48 4.63 1.09 39.95 2.22 14.03 1.23 1.45
0.5%-30min 5.95 151.65 3.94 23.21 10.13 5.42 8.46 204.30 1.27 10.73 11.04 6.56
2%-30min 6.71 173.59 3.03 25.55 8.34 5.32 2.56 82.83 1.40 16.32 2.33 1.94
5%-30min 5.67 134.09 3.8 23.82 9.40 5.25 2.64 74.74 1.64 13.71 4.22 2.68
0.5%-2h 5.95 164.03 3.94 22.82 10.24 5.39 8.46 220.97 1.27 10.55 11.04 6.56
2%-2h 3.89 193.27 2.62 27.73 6.98 5.51 2.56 144.97 1.44 19.14 3.08 2.88
5%-2h 7.34 157.88 2.81 25.32 7.72 5.39 2.14 59.17 1.55 17.26 3.55 2.87
0.5%-8h 3.65 159.76 4.34 21.13 6.39 4.63 2.11 110.36 3.04 16.31 12.54 8.32
2%-8h 3.55 128.27 2.98 20.49 5.39 4.03 4.66 156.12 2.05 16.12 4.33 3.39
5%-8h 3.85 110.93 3.51 13.30 5.40 4.34 1.83 66.18 2.07 9.39 3.07 2.82
0.5%-12h 2.11 135.96 2.98 19.45 4.11 3.78 1.99 131.91 2.48 17.27 5.14 4.47
27
2%-12h 2.77 119.91 3.98 17.85 4.34 3.63 1.65 88.19 2.76 13.81 6.11 4.73
5%-12h 2.15 109.77 2.90 13.07 3.27 4.39 3.35 143.54 1.84 9.84 5.30 6.22
Table 4. Variance analysis of tensile strength (MPa), Young's modulus (GPa) and strain (%) versus
NaOH concentration ratio at 95% level of significance.
Variations
Source Squares sum Degree of
freedom Squares mean F Probability Fcr
ANOVA test for ultimate tensile stress data (120 samples)
Between groups 55613 3 18538 8.90 0.000 2.60
Within groups 241556 116 2082
Total 297168 119
ANOVA test for Young's modulus (120 samples)
Between groups 135.2 3 45.1 0.62 0.604 2.60
Within groups 8451.9 116 72.9
Total 8587.2 119
ANOVA test for strain at failure data (120 samples)
Between groups 8.353 3 2.784 4.23 0.000 2.60
Within groups 76.373 116 0.658
Total 84.725 119
Research Highlights
• Influence of NaOH alkali treatment on the mechanical properties of yarns jute fibers.
• Micro structural analysis of untreated and treated jute fiber.
• Statistical mechanics and properties of jute yarns


![· h 2 ˚˜KJfg ˙ h ] nofg˙ h a](https://img.pdfslide.tips/doc/110x75/5b04e4607f8b9a0a548e3ea6/-2-kjfg-h-nofg-h-a-.jpg)