Embed Size (px)
Citation preview
Safety evaluation of shear capacity of
reinforced concrete bridges
Master of Science Thesis in the Master’s Programme Structural Engineering and
Building Performance Design
THOMAS ÅHNBERG
Department of Civil and Environmental Engineering
Division of Structural engineering
Concrete structures
CHALMERS UNIVERSITY OF TECHNOLOGY
Göteborg, Sweden 2011
Master’s Thesis 2011:75

MASTER’S THESIS 2011:75
Safety evaluation of shear capacity of
reinforced concrete bridges
Master of Science Thesis in the Master’s Programme Structural Engineering and
Building Performance Design
THOMAS ÅHNBERG
Department of Civil and Environmental Engineering
Division of Structural engineering
Concrete structures
CHALMERS UNIVERSITY OF TECHNOLOGY
Göteborg, Sweden 2011
Safety evaluation of shear capacity of reinforced concrete bridges
Master of Science Thesis in the Master’s Programme
THOMAS ÅHNBERG
© THOMAS ÅHNBERG, 2011
Examensarbete / Institutionen för bygg- och miljöteknik,
Chalmers tekniska högskola 2011:75
Department of Civil and Environmental Engineering
Division of Structural engineering
Concrete structures
Chalmers University of Technology
SE-412 96 Göteborg
Sweden
Telephone: + 46 (0)31-772 1000
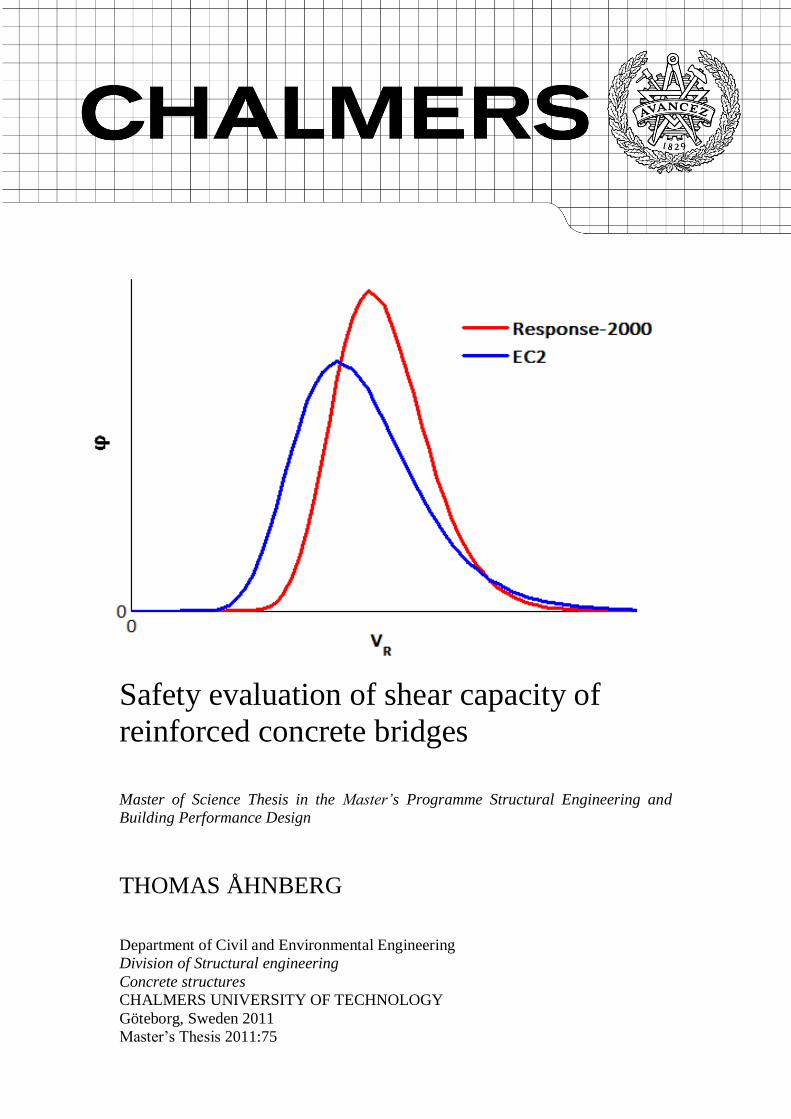
Cover:
Average predictions of shear resistance distribution for reinforced concrete beams (ρl
= 1.2 %, ρw = 0.1 %), using Response-2000 and the EC2 shear model, evaluated based
on the JCSS Probabilistic model code (JCSS, 2001) and the EC2 Basis for structural
design (CEN, 2002)
Chalmers Reproservice / Department of Civil and Environmental Engineering
Göteborg, Sweden 2011
I
Safety evaluation of shear capacity of reinforced concrete bridges
Master of Science Thesis in the Master’s Programme Structural Engineering and
Building Performance Design
THOMAS ÅHNBERG
Department of Civil and Environmental Engineering
Division of Structural engineering
Concrete structures
Chalmers University of Technology
ABSTRACT
Predicting the load carrying capacity of concrete bridges often calls for a conservative
approach which leads to high costs, especially in the maintenance of existing
structures. The need for conservativeness arises not only from natural variations but
also from inconsistency of available calculation models and safety formats. This
master thesis presents a probabilistic evaluation of analysis methods and safety
formats used to establish design shear capacity of reinforced concrete bridge girders.
An assessment is made of the relative favorableness of using either the shear analysis
procedure described in the European construction code (CEN, 2004) or the sectional
analysis tool Response-2000 (Bentz, 2000). The accuracy of the EC2 partial safety
factor format is compared to a safety format proposed by Schlune et al. (2010). The
performed evaluations are founded on a parametric study of standard beam cross
sections and the probabilistic model used in the evaluations is prepared in accordance
with the JCSS Probabilistic model code (2001) along with relevant guidance given by
the CEN (2002).
Key words: Concrete, reinforced, bridges, girder, shear, capacity, probabilistic,
Monte Carlo
II
Säkerhetsutvärdering av skjuvkapacitet för armerade betongbroar
Examensarbete inom mastersprogrammet Structural Engineering and Building
Performance Design
THOMAS ÅHNBERG
Institutionen för bygg- och miljöteknik
Avdelningen för Konstruktions teknik
Betongbyggnad
Chalmers tekniska högskola
SAMMANFATTNING
Det finns idag ca 11000 betongbroar i Sverige och det satsas i runda tal en halv miljard
kronor per år på att underhålla dessa. Samtidigt som broarna blir allt äldre öker
trafiklasterna och det ställs därmed allt högre krav på konstruktionerna. Konsekvensen
blir ofta att broar behöver förstärkas eller byggas om, vilket innebär stora kostnader. Detta
innebär att det finns ett stort ekonomiskt intresse av att finna metoder för att bättre kunna
precisera bärförmågan hos broarna.
Sedan årsskiftet 2010/2011 sker all dimensionering och bärighetsbestämning av broar i
Sverige enligt den Europeiska normen, EC2 (CEN, 2004). Med fokus på bestämning av
skjuvkapacitet har det i detta examensarbete undersökts om säkerhetsformatet som
presenteras i normen skulle kunna tänkas vara onödigt konservativt samt om det på sikt
skulle vara intressanta att introducera en alternativ skjuvmodell. En serie probabilistiska
analyser har utförts i syfte att dels jämföra hur mycket större bärförmåga som skulle
kunna påvisas med beräkningsverktyget Response-2000 (Bentz, 2000), dels utvärdera och
jämföra säkerhetsformatet i EC2 med ett alternativt säkerhetsformat som presenterats av
Schlune et al. (2010).
Utvärderingarna har gjorts genom parameterstudier på typiska balktvärsnitt. Upprättandet
av den probabilistiska modellen har i sin tur huvudsakligen gjorts enligt den vägledning
som ges i JCSS Probabilistic model code (2001) samt tillämpliga riktlinjer som ges i EC2.
En slutsats som dragits från användandet av de tillgängliga regelverken är att det
fortfarande återstår arbete med att färdigställa allmänna riktlinjer för utförandet av
probabilistisk analys. Detta gäller särskilt anvisningar för bestämning av modellosäkerhet.
De kvantitativa resultat som presenteras i denna rapport bör därför användas med viss
försiktighet men är fortfarande användbara i jämförelsesyfte.
Jämförelsen mellan beräkningsmodeller gav en indikation på att högre bärförmåga ofta
påvisas med hjälp av beräkningsmodellen i Response-2000 (Collins & Mitchell, 1991) .
Det gällde särskilt för balkar med små mängder skjuvarmering och stora mängder
böjarmering. Utifrån de använda uppskattningarna av modellosäkerhet visades också att
den dimensionerande bärförmågan som beräknas med skjuvmodellen och
säkerhetsformatet i EC2 inte är konservativa utan tvärtom leder till inkonsekventa
säkerhetsindex som underskrider det uppsatta riktvärdet i EC2. Det samma visades gälla
när samma säkerhetsformat användes för skjuvkapacitetsberäkning i Response-2000. En
jämförelse visade sedan att det säkerhetsformat som presenterats av Schlune et al. ledde
till en något högre och jämnare nivå på säkerhetsindex. Utvärderingen visade dock att det
tycks finnas en del att vinna på en vidare kalibrering av detta format.
Nyckelord: Betongbroar, armerade, balkar, skjuvkapacitet, probabilistisk, Monte
Carlo

III
IV
Contents
ABSTRACT I
SAMMANFATTNING II
CONTENTS IV
PREFACE VI
NOTATION VII
1 INTRODUCTION 1
1.1 Background 1
1.2 Aim and purpose 1
1.3 Specifications and delimitations 2
1.4 Method 2
2 UNDERLYING THEORY 3
2.1 Shear response of reinforced concrete 4
2.1.1 Shear cracking 4 2.1.2 Behaviour after cracking 4
2.1.3 Failure modes and parameters influencing shear strength 6
2.2 Shear strength modeling 6
2.2.1 Response-2000 6 2.2.2 Eurocode Shear model 7
2.3 Structural reliability 8 2.3.1 Uncertainties 9
2.3.2 Reliability methods and safety formats 10 2.3.3 The Eurocode program and the JCSS model code 18
3 ANALYSIS 20
3.1 Choice of typical cross sections 20
3.2 Choice of parameters 20
3.3 Defining cross sections 21
3.4 Calculation of resistance according to EC 2 22 3.4.1 Internal lever arm 23
3.4.2 Design resistance 23
3.5 Calculation of resistance with Response-2000 23
3.5.1 Defining cross sections 24 3.5.2 Design resistances 24
3.6 Probabilistic analysis 24 3.6.1 Modeling of uncertainties 24 3.6.2 Monte Carlo Simulation 27
3.7 Additional comments on the choice and modelling of parameters 27 3.7.1 Design of cross sections 27
3.7.2 Ratio between moment and shear 29
3.7.3 Correlation of steel parameters 29 3.7.4 Variability of stirrup spacing 31
3.7.5 Model uncertainty 31
4 RESULTS AND DISCUSSION 33
4.1 Comparison of alternative shear models 33 4.1.1 Influence of shape, material strength and loading conditions 34
4.1.2 Relative calibration of model uncertainties 34 4.1.3 Required safety margins 37
4.1.4 The effect of reducing variability of stirrup spacing 39 4.1.5 Shortcomings of Response-2000 and potential effects on results 40
4.2 Evaluation of safety formats 40 4.2.1 Evaluation of EC2 safety format when used for EC2 shear analysis 40
4.2.2 Comparison of safety formats for Response-2000 shear analysis 42
4.3 Additional comments on the results 44
5 CONCLUSIONS 46
5.1 Conclusions from the application of codes 46
5.2 Conclusions from the comparison of resistance models 46
5.3 Conclusions from the evaluation of safety formats 46
5.4 Meeting the objective 47
5.5 Further work 47
6 REFERENCES 48
7 APPENDIX A – TABLES OF RESULTS 50

VI
Preface
This Master’s thesis project is the final part of a Master of Science in Structural
Engineering and Building Performance Design at Chalmers University of Technology
in Gothenburg Sweden. It has been carried out in collaboration with the concrete
structures research group at Chalmers.
The project was supervised by Hendrik Schlune and examined by Mario Plos. The
author would like to thank them both for their valuable comments and especially
Hendrik for his support and encouragement throughout the work.
Göteborg Juni 2011
Thomas Åhnberg
Notation
Roman upper case letters
Ac Cross sectional area of concrete
As Cross sectional area of reinforcement
As,min Minimum cross sectional area of reinforcement
Asw Cross sectional area of shear reinforcement
D Diameter
E Load effect
Ed Design value of load effect
LN Lognormal distribution
M Margin (safety margin)
M Bending moment
MEd Design value of the applied bending moment
MRd Design value of moment resistance
N Normal distribution
N Number of simulations
P Probability
Pf Probability of failure
Ps Measurement of reliability
R Resistance
Rd Design value of resistance
Rµ Resistance based on mean values
RΔfc Resistance based on low concrete compressive strength
RΔfct Resistance based on low concrete tensile strength
RΔfy Resistance based on low steel strength
V Coefficient of variation
V Shear force/resistance
VEd Design value of applied shear force
VRd Design value of shear resistance
Vc Concrete contribution to shear transfer
Vf Coefficient of variation representing physical uncertainty
Vg Coefficient of variation representing geometrical uncertainty
Vm Coefficient of variation representing model uncertainty
Vn Nominal shear resistance
VIII
Vp Vertical component of prestressing force
Vs Shear reinforcement contribution to shear transfer
X Stochastic variable
X Set of stochastic variable
Roman lower case letters
a Geometrical data
anom Nominal geometrical data
bw Width of the beam web
d Effective depth of cross-section
dg Largest nominal maximum aggregate size
fc Compressive strength of concrete
fcd Design value of concrete cylinder compressive strength
fck Characteristic concrete cylinder compressive strength
fcm Mean value of concrete cylinder compressive strength
fctk Characteristic axial tensile strength of concrete
fctm Mean value of axial tensile strength of concrete
fy Yield strength of reinforcement
fyk Characteristic yield strength of reinforcement
fyd Design yield strength of reinforcement
fywd Design yield strength of shear reinforcement
g Limit state function
gu Limit state function represented in a stochastic variable space
h Overall depth of a cross-section
i Index vector
k Coefficient; Factor
qud Maximum value of combination reached in non linear analysis
s Spacing of shear reinforcement stirrups
t Thickness
t Time being considered
t0 The age of concrete at the time of loading
u Normalized stochastic variable
u Set of normalized stochastic variables
x Basic variable
x Set of basic variables
z Lever arm of internal forces
Greek upper case letters
Φ Cumulative standard normal distribution
Φ Diameter
ΦM Model bias with regard to moment resistance
ΦV Model bias with regard to shear resistance
Greek lower case letters
αE Sensitivity factor with regard to uncertainty of load effect
αR Sensitivity factor with regard to uncertainty of resistance
αcc Coefficient taking account of long term effects on compressive strength and of
unfavourable effects resulting from the way load is applied
αcw Coefficient taking account of state of stress in compression chord
β Reliability index
γ Partial factor
γc Partial factor for concrete strength
γs Partial factor for steel strength
γRd Partial factor for design resistance
θ Angle
µ Mean value
µx Mean value of variable x
ν Average shear stress
ν1 Strength reduction factor for concrete cracked in shear
ρl Longitudinal reinforcement ratio
ρw Transversal reinforcement ratio
σ Standard deviation
σx Standard deviation of variable x

CHALMERS, Civil and Environmental Engineering, Master’s Thesis 2011:7575 1
1 Introduction
1.1 Background
There are today approximately 11000 concrete bridges in Sweden and roughly half a
billion SEK is every year spent on their maintenance (Vägverket, 2001). At the same
time as the bridge population is getting older traffic loads are ever increasing,
resulting in demand for setting harder requirements for many bridges. Hence, there is
large economical interest in finding out what the capacities of the bridges actually are.
Both design and structural assessment of reinforced concrete bridges is today
conducted following the set of guidelines presented in the European construction
code, EC2 (CEN, 2004). Regarding shear capacity it has in several cases been found
that application of the code seems to imply a higher requirement for the amount of
shear reinforcement compared to when using previous construction codes. As a result
many existing bridges are deemed not to have sufficient shear capacity and need to be
strengthened or replaced before they can be allowed to accommodate stipulated traffic
loads. Since these are rather costly measures the problem has spurred the interest in
finding alternative more accurate calculation models which allow showing higher
shear capacities.
Within a research project carried out by the division of structural engineering at
Chalmers University of Technology researchers are looking at possible advantages
from using a combination of probabilistic analysis and an alternative shear strength
model implemented in Response-2000 (Bentz, 2000), based on the modified
compression field theory (Collins & Mitchell, 1991) and developed at University of
Toronto. The model itself has shown to produce results which correlate better with
test results than does the Eurocode model (Bohigas, 2002) and together with the full
probabilistic analysis, which is a more accurate way of guaranteeing acceptable
failure probability, it is expected to show a significantly higher shear capacity for
many bridges.
1.2 Aim and purpose
The overall purpose of this Master’s project is to contribute to the work on improving
the methods for structural assessment of bridges, by evaluating, and thereby
facilitating, the use of more accurate models and tools for analysis.
The principal aim of the project is to create an overview of for which types of
concrete beams the highest improvement of capacity utilization can be gained, both
from using the Toronto model instead of the EC2 shear model and from using a more
accurate reliability method, than the partial safety factor method presented in EC2. In
the latter respect the intention is to incorporate a continued evaluation of an
alternative safety format for non-linear analysis recently presented by Schlune et al.
(2010), as well as employing a full probabilistic approach for determining appropriate
design resistances. The resulting overview is meant to be used as guidance on if and
when it could be worth using an alternative safety format and or another structural
model for assessment of shear strength.
Ensuing questions to which answers are also sought include:
CHALMERS, Civil and Environmental Engineering, Master’s Thesis 2011:7575 2
What can be said about the performance of the current EC2 safety format
when used for linear and non-linear analysis of shear strength based on a full
probabilistic analysis?
What can be said about the calibration of model uncertainties intended to
indicate the accuracy of the alternative shear strength models?
1.3 Specifications and delimitations
The target group for this thesis is mainly people working with management or
assessment of concrete bridges. However, the thesis does include an introductory
description of the underlying theories on which the presented study is based, partly to
make the thesis interesting for a broader range of possible readers.
The opening chapters of the thesis are intended to serve as an introduction to the
theoretical background of the models and procedures that are dealt with in the main
study. They are not aimed at giving a comprehensive overview of e.g. other
competing shear models or safety formats.
The conducted study concerns methods of carrying out cross section analyses of
critical bridge cross sections based on given values of moment and shear forces, it
does not deal with full analysis of entire bridge structures. Furthermore, only beams
with shear reinforcement have been studied and only considering shear resistance with
regard to uni-axial shear, not shear from torsion. The effects of interacting moment
have been looked at but normal forces from prestressing are not considered.
Due to the restricted scope of the study, it also only involves a limited number of
bridge types. The focus has therefore been on assorted conventional bridge types for
which shear capacity in some cases has proven critical.
1.4 Method
In order to meet the objectives for this project both the Toronto model and the shear
strength model presented in the Eurocode, together with full probabilistic analysis,
was applied on 144 different reinforced concrete sections. The obtained results were
then compared and the evaluation presented in a set of tables and charts. These are
meant to show both the influence of the choice of shear strength model and the effect
of including the full probabilistic analysis.
The evaluation was preceded and supported by a continuous literature study. Apart
from dealing with the shear behavior of reinforced concrete and how it is modeled,
this state-of-the-art review was especially aimed at aiding the understanding of how
probabilistic theory has been implemented into safety formats for the design and
assessment of reinforced concrete structures. Particular focus was paid to the
principles behind and derivation of methods to perform full probabilistic analysis as
part of shear strength assessments.
CHALMERS, Civil and Environmental Engineering, Master’s Thesis 2011:7575 3
2 Underlying theory
According to Ryall (2001) there are generally three reasons for carrying out a strength
assessment of a bridge: First it might have been decided that the bridge should
facilitate heavier traffic loads, second the structure can have suffered from serious
damage or deterioration, third there might have been a change in design codes, setting
higher demands on the bridge.
The goal of the appraisal is to determine the safe loading capacity of the bridge. In
principle the task is much similar to that of initially designing the structure, but unlike
when still on the drawing table it is often no longer possible to idealize and therefore
usually poses a greater engineering challenge. For example the material strengths that
in design were considered as constant throughout the various members can now have
changed to the worse or better and need to be sampled and estimated. It can also be
hard to conceptualize and model structural forms that in their design are very different
from today’s norms.
Many of the codes used in construction today are specifically meant to be used when
dealing with contemporary materials and design. They are therefore often not directly
applicable on older constructions, not even when they have been constructed using
today’s methods. New codes can be used but then they must first be properly
modified, often by going back to the principles from which they were derived. One
can also, as a start, use the old codes to determine how the structures meet the original
requirements.
As outlined by Hille et al. (2005) another aspect of using design codes for the
assessment of existing structures is that it is usually tied to a fair amount of
conservatism. Due to the fact that the codes should cover a wide range of structures,
with subsequent high variability of material quality and construction practice, safety
margins are normally set high. This does not usually affect the cost of construction
significantly but can induce much unjustified cost for improvements if setting the
same requirements in a later assessment.
Furthermore, the simple rule that generally applies is that; the simpler the assessment
methods, the higher the tolerance levels needed. Some simple analyses do not always
do the bridges justice, and the result of this can be that serviceable bridges are closed
for lengthy periods in wait for further assessment and repair. Luckily the tools of
today include computer modeling programs that in combination with refined analysis
methods can help making a more fair evaluation.
Structural assessment is today conducted following a step level procedure in which
simple calculations, based on readily available data, are gradually complemented by
increasingly sophisticated methods, given both that the simpler analyses fail to show
sufficient capacity and that it is plausible to gain benefit from higher accuracy. As can
be read in the guideline from Sustainable Bridges (2007), the steps by which accuracy
can be improved involve: using models that allow showing redistribution of stresses
due to non-linear material behavior, reducing idealizations in models through
increased detailing and use of FEM applications, and finally, making increasing use of
a probabilistic approach both for the enhancement of resistance safety formats and
better modeling of loads. Out of these different research areas this thesis will, as
explained in the introduction, mainly deal with topics regarding probabilistic
modeling and reduced idealization of structural models.
CHALMERS, Civil and Environmental Engineering, Master’s Thesis 2011:7575 4
2.1 Shear response of reinforced concrete
When a structural member is subjected to transverse loading, as is typical for the main
members of a bridge superstructure, this will result in not only bending moments but
also considerable shear forces in some sections of the bridge. When enough load is
applied the shear forces in the concrete beams will give rise to diagonal cracking of
the concrete and can, if not taken proper account for, lead to premature failure of the
structure. Therefore, in order to avoid such failures, both the cross section geometries
and reinforcement of the bridge must be designed with careful consideration to shear
resistance.
2.1.1 Shear cracking
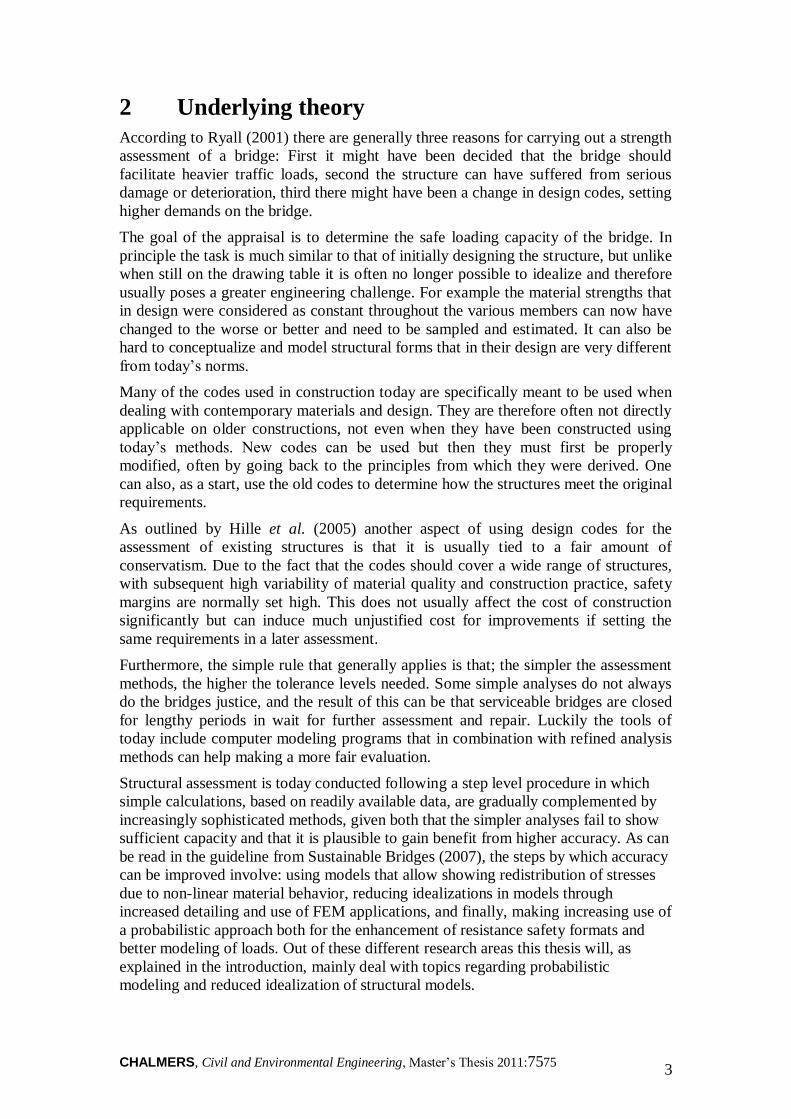
Initiation of cracking in concrete takes place when principal tensile stresses at some
point reach the tensile strength of the material. In the case of beams subjected to a
combination of shear and moment it will typically occur either at the centre line of the
beam, where the shear stresses are the greatest, or in the bottom or top layer, where
the tensile stresses due to moment are dominant (Collins & Mitchell, 1991). The
cracks which form under the influence of shear are diagonal, resulting from the
inclination of principal tensile stresses as shown in Figure 1.
Figure 1: Conversion of element shear stresses to principal stresses
Concrete cracks will form perpendicular to the tensile stresses and if starting as
flexural cracks at the bottom or top of the beam they will be almost vertical. Then, if
in a shear region, they will curve off horizontally as they progress inwards. At what
loading the shear cracks will form depends on the tensile strength of concrete, as well
as the thickness and internal lever arm of the cross section. The influence of non-
prestressed reinforcement is yet of negligible importance.
2.1.2 Behaviour after cracking
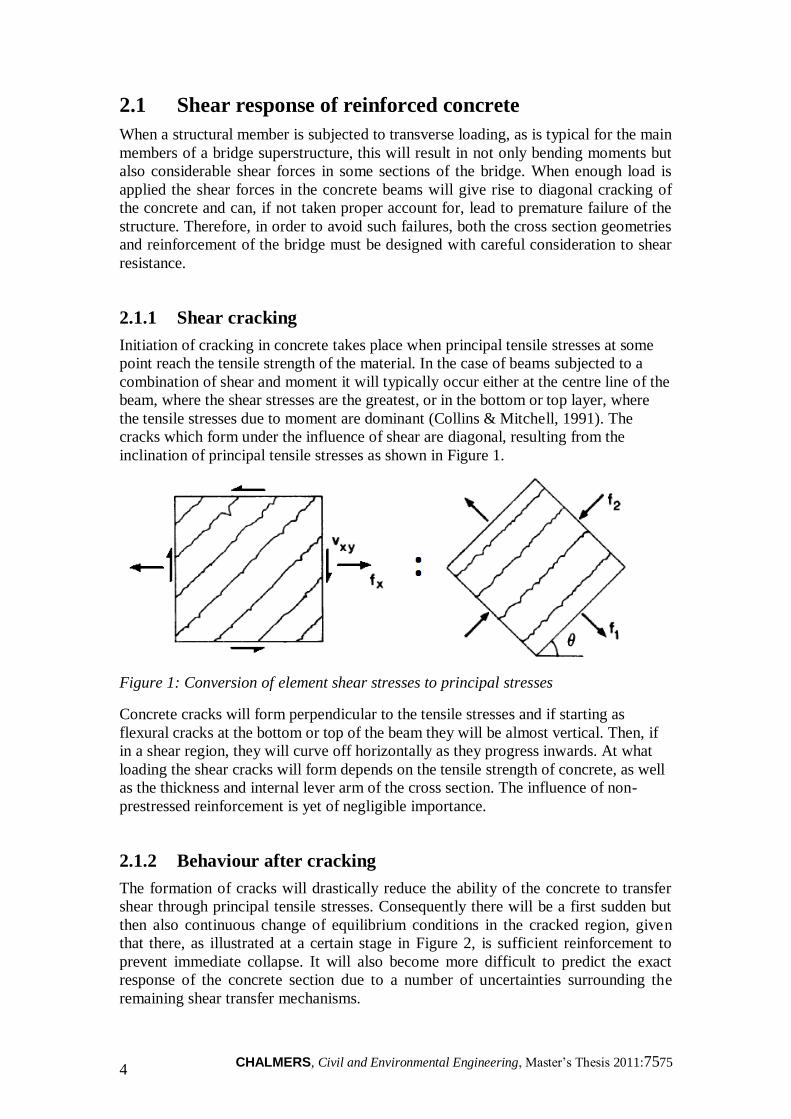
The formation of cracks will drastically reduce the ability of the concrete to transfer
shear through principal tensile stresses. Consequently there will be a first sudden but
then also continuous change of equilibrium conditions in the cracked region, given
that there, as illustrated at a certain stage in Figure 2, is sufficient reinforcement to
prevent immediate collapse. It will also become more difficult to predict the exact
response of the concrete section due to a number of uncertainties surrounding the
remaining shear transfer mechanisms.
CHALMERS, Civil and Environmental Engineering, Master’s Thesis 2011:7575 5
Figure 2: Equilibrium forces acting on a console of concrete in a cracked region
A way of treating some of these uncertainties is by saying that shear will only be
transferred through the uncracked compression zone of the beam and, if such has been
applied, by the shear reinforcement. Since the compression zone in relatively slender
beams is quite small and the corresponding shear transfer has little importance this
approach can be even further simplified into truss models consisting of exclusively
compressive concrete struts and ties of reinforcement. These models, an illustration of
which is given in Figure 4 in the following chapter, have traditionally provided a
reliable basis for design of beams with shear reinforcement, e.g. in the shear design
procedures recommended in EC2.
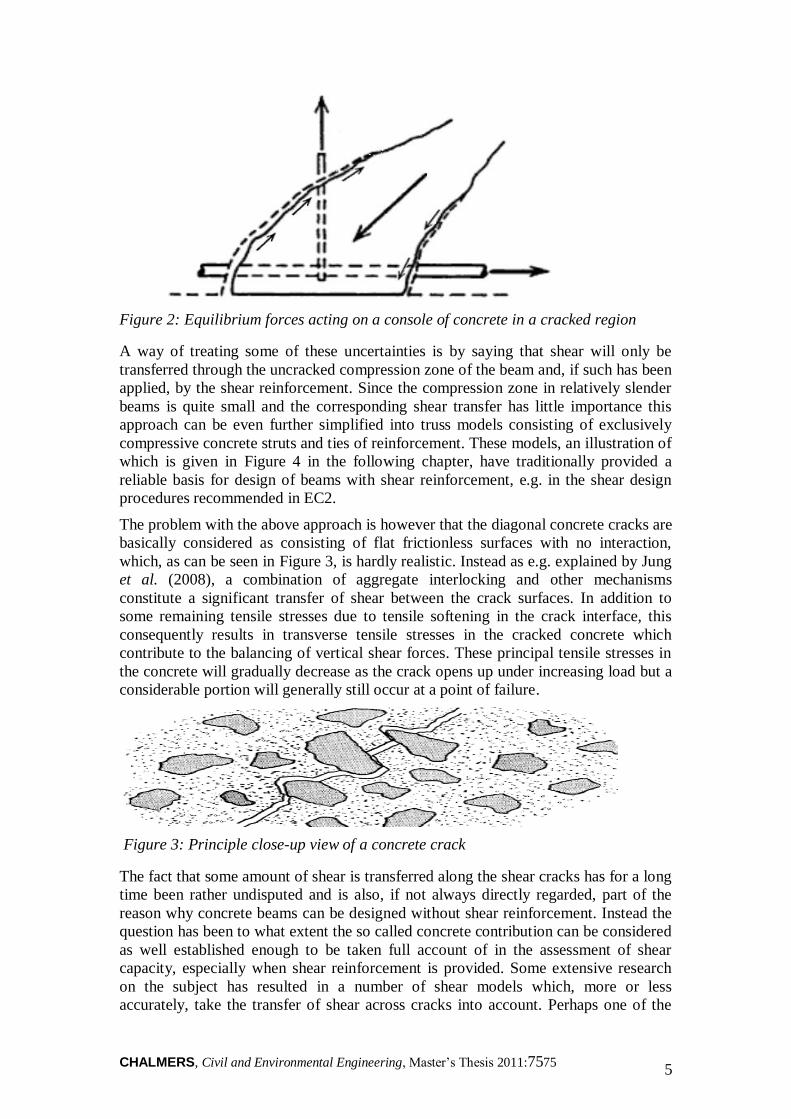
The problem with the above approach is however that the diagonal concrete cracks are
basically considered as consisting of flat frictionless surfaces with no interaction,
which, as can be seen in Figure 3, is hardly realistic. Instead as e.g. explained by Jung
et al. (2008), a combination of aggregate interlocking and other mechanisms
constitute a significant transfer of shear between the crack surfaces. In addition to
some remaining tensile stresses due to tensile softening in the crack interface, this
consequently results in transverse tensile stresses in the cracked concrete which
contribute to the balancing of vertical shear forces. These principal tensile stresses in
the concrete will gradually decrease as the crack opens up under increasing load but a
considerable portion will generally still occur at a point of failure.
Figure 3: Principle close-up view of a concrete crack
The fact that some amount of shear is transferred along the shear cracks has for a long
time been rather undisputed and is also, if not always directly regarded, part of the
reason why concrete beams can be designed without shear reinforcement. Instead the
question has been to what extent the so called concrete contribution can be considered
as well established enough to be taken full account of in the assessment of shear
capacity, especially when shear reinforcement is provided. Some extensive research
on the subject has resulted in a number of shear models which, more or less
accurately, take the transfer of shear across cracks into account. Perhaps one of the
CHALMERS, Civil and Environmental Engineering, Master’s Thesis 2011:7575 6
most notable of these models is based on the so called Modified compression field
theory developed by Collins &Vecchio (1986).
2.1.3 Failure modes and parameters influencing shear strength
As a concluding summary, and much in analogy with the strut and tie models for
shear transfer discussed earlier in this chapter; shear failure of concrete members is
generally subdivided into to two types. The first one is called sliding shear failure and
occurs when the tying and shearing capabilities of the concrete section are exceeded;
for members with shear reinforcement this happens after yielding of the reinforcement
steel. The second type of failure occurs when the compressive strength of the concrete
held up by the above forces is reached and is accordingly called crushing failure.
There are many parameters influencing the shear strength of a reinforced concrete
member, but the main ones are: concrete compressive and tensile strength (as well as
aggregate size for relatively low strength concrete), amount of longitudinal and
vertical reinforcement, the simultaneous axial forces acting on the member, possible
arch effects depending on the span to depth ratio and size effects governed by the
cross section depth. The meaning of the term shear strength in this context is the
ultimate average shear stress which a member can carry, which as a rule decreases
with increasing size, as exemplified by Shioya et al. (1989).
When assessing the capacity of a bridge cross section it is often important to note that
moment and shear are hardly ever isolated occurrences. This means that the resistance
with regard to shear is always, to a varying degree, dependent on the moment capacity
and vice versa. Consequently, although somewhat distinctly separate failure modes
can be distinguished observationally, clear definitions of corresponding resistances
are difficult to make.
2.2 Shear strength modeling
To some extent distinguished by the relative importance they place on different shear
transfer mechanisms there are as noted earlier various types of structural models used
to model shear strength. All of these models will not be discussed in this chapter;
instead focus will be on the models which are part of the study presented in this
report.
The presented shear models are both used in sectional analysis which is performed to
determine the capacity of critical sections of a structural member. In order to find
these critical sections, an analysis of the overall structural behavior must first be done
to determine not only the shear forces acting along the bridge but also the ratios
between shear and moment. This preceding, linear or non-linear, analysis can be done
analytically or numerically using finite element methods.
2.2.1 Response-2000
Following extensive testing and calibration with empirical data, it has been shown
that, as presented by Vecchio & Collins (1986), the use of a shear model based on the
so called modified compression field theory leads to analysis results that consistently
correspond well with reality. The model has also been developed into easy to use
CHALMERS, Civil and Environmental Engineering, Master’s Thesis 2011:7575 7
computer programs, such as Response-2000, which can be used to evaluate concrete
cross sections with a wide range of geometries and are applicable both for members
with and without shear reinforcement (Bentz, 2000). They furthermore incorporate the
estimation of diagonal tensile stresses in the cracked concrete, from the transfer of
shear across cracks as well as in the uncracked compression zone. However, they do
not take into account arch effects near supports and are therefore not suitable for
analysis of beams with span to depth ratios less than four.
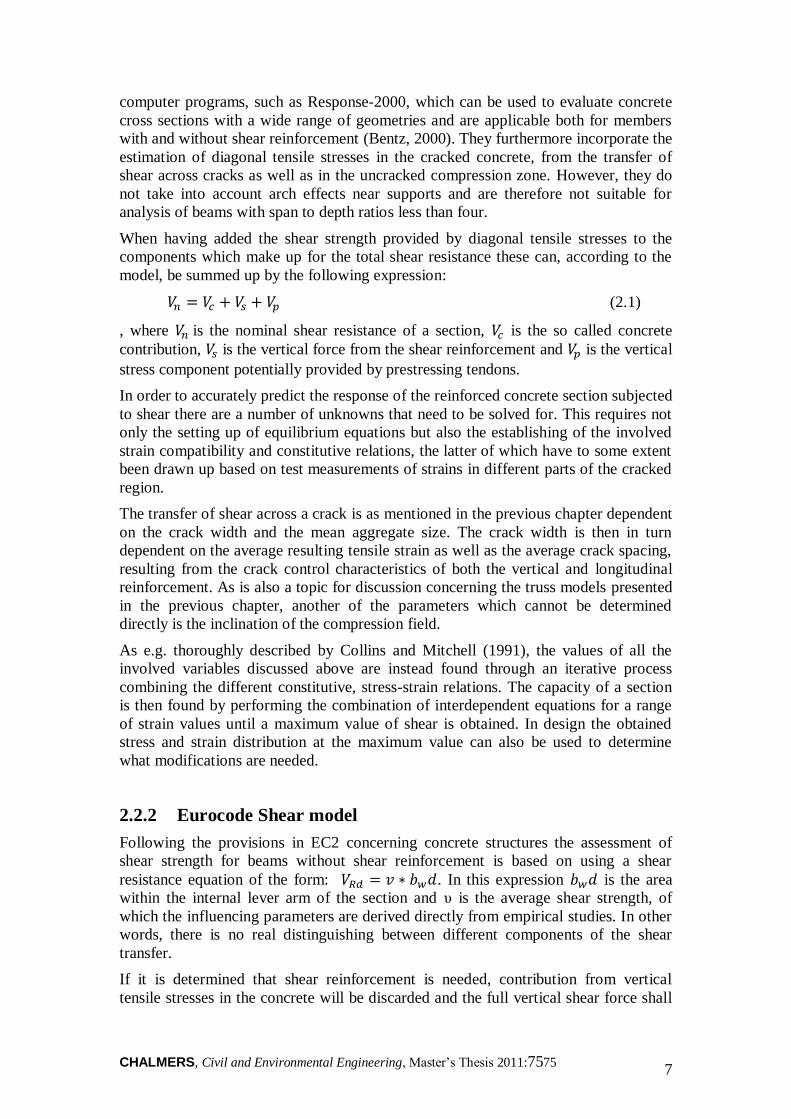
When having added the shear strength provided by diagonal tensile stresses to the
components which make up for the total shear resistance these can, according to the
model, be summed up by the following expression:
(2.1)
, where is the nominal shear resistance of a section, is the so called concrete
contribution, is the vertical force from the shear reinforcement and is the vertical
stress component potentially provided by prestressing tendons.
In order to accurately predict the response of the reinforced concrete section subjected
to shear there are a number of unknowns that need to be solved for. This requires not
only the setting up of equilibrium equations but also the establishing of the involved
strain compatibility and constitutive relations, the latter of which have to some extent
been drawn up based on test measurements of strains in different parts of the cracked
region.
The transfer of shear across a crack is as mentioned in the previous chapter dependent
on the crack width and the mean aggregate size. The crack width is then in turn
dependent on the average resulting tensile strain as well as the average crack spacing,
resulting from the crack control characteristics of both the vertical and longitudinal
reinforcement. As is also a topic for discussion concerning the truss models presented
in the previous chapter, another of the parameters which cannot be determined
directly is the inclination of the compression field.
As e.g. thoroughly described by Collins and Mitchell (1991), the values of all the
involved variables discussed above are instead found through an iterative process
combining the different constitutive, stress-strain relations. The capacity of a section
is then found by performing the combination of interdependent equations for a range
of strain values until a maximum value of shear is obtained. In design the obtained
stress and strain distribution at the maximum value can also be used to determine
what modifications are needed.
2.2.2 Eurocode Shear model
Following the provisions in EC2 concerning concrete structures the assessment of
shear strength for beams without shear reinforcement is based on using a shear
resistance equation of the form: . In this expression is the area
within the internal lever arm of the section and υ is the average shear strength, of
which the influencing parameters are derived directly from empirical studies. In other
words, there is no real distinguishing between different components of the shear
transfer.
If it is determined that shear reinforcement is needed, contribution from vertical
tensile stresses in the concrete will be discarded and the full vertical shear force shall
CHALMERS, Civil and Environmental Engineering, Master’s Thesis 2011:7575 8
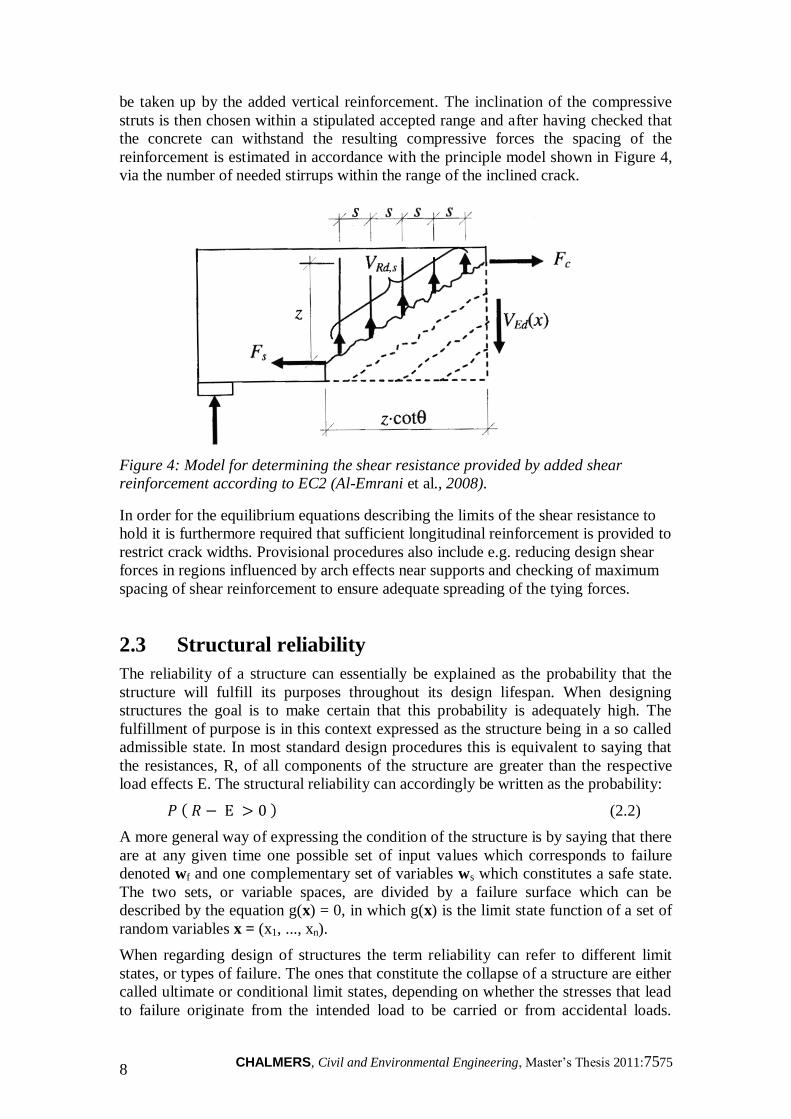
be taken up by the added vertical reinforcement. The inclination of the compressive
struts is then chosen within a stipulated accepted range and after having checked that
the concrete can withstand the resulting compressive forces the spacing of the
reinforcement is estimated in accordance with the principle model shown in Figure 4,
via the number of needed stirrups within the range of the inclined crack.
Figure 4: Model for determining the shear resistance provided by added shear
reinforcement according to EC2 (Al-Emrani et al., 2008).
In order for the equilibrium equations describing the limits of the shear resistance to
hold it is furthermore required that sufficient longitudinal reinforcement is provided to
restrict crack widths. Provisional procedures also include e.g. reducing design shear
forces in regions influenced by arch effects near supports and checking of maximum
spacing of shear reinforcement to ensure adequate spreading of the tying forces.
2.3 Structural reliability
The reliability of a structure can essentially be explained as the probability that the
structure will fulfill its purposes throughout its design lifespan. When designing
structures the goal is to make certain that this probability is adequately high. The
fulfillment of purpose is in this context expressed as the structure being in a so called
admissible state. In most standard design procedures this is equivalent to saying that
the resistances, R, of all components of the structure are greater than the respective
load effects E. The structural reliability can accordingly be written as the probability:
(2.2)
A more general way of expressing the condition of the structure is by saying that there
are at any given time one possible set of input values which corresponds to failure
denoted wf and one complementary set of variables ws which constitutes a safe state.
The two sets, or variable spaces, are divided by a failure surface which can be
described by the equation g(x) = 0, in which g(x) is the limit state function of a set of
random variables x = (x1, ..., xn).
When regarding design of structures the term reliability can refer to different limit
states, or types of failure. The ones that constitute the collapse of a structure are either
called ultimate or conditional limit states, depending on whether the stresses that lead
to failure originate from the intended load to be carried or from accidental loads.
CHALMERS, Civil and Environmental Engineering, Master’s Thesis 2011:7575 9
Serviceability limit state is the second type of failure which does not denote a collapse
but yet a failure to serve the intended purpose, caused by unacceptable performance
under normal use.
With the intention of reaching normalized, widely accepted levels of safety, target
reliabilities for structures are set according to agreed conventions. These optimal
design reliabilities should be decided based on economic decision theory, i.e. on the
ratio between the risk of failure (cost times probability) and cost of reconstruction.
Generally target reliability can be used both, as in this context, as a set lower limit and
more freely in decision making based on cost benefit estimations for maximum utility
(Sorensen, 2004).
For main bridge structures, which are ranked as class 3 structures in the European
construction standards (CEN, 2002), the target minimum reliability is 1 failure per
million during a reference period of 1 year, see marked box in Table 1.Error!
Reference source not found. Reliability in this case is the reliability of design
performed according to best practice, which is decided by a board of recognized
experts. Decisions regarding new best practices, e.g. use of new probabilistic
methods, are typically made as far as possible on the basis of existing codes.
2.3.1 Uncertainties
The reason why the performance of a structure cannot be decisively predicted is that it
is ruled by many uncertainties. These originate from the stochastic nature of the
related variables, but also from uncertainties of how they affect the state of the
structure. The various uncertainties which all add up to a joint total uncertainty of
resistance are often divided into three main categories:
Physical uncertainty mainly regards the natural randomness of material strengths,
and is therefore often also referred to as material uncertainty.
Measurement uncertainty (or geometrical uncertainty) is a term that considers the
imperfectness of measurements of quantities, e.g. geometrical forms and dimensions.
Model uncertainty refers to the lacking knowledge of how to model the behavior of
the structure, simplifications made in that process, as well as the uncertainty regarding
the probability distributions of the involved stochastic variables.
Due to the fact that models are never perfect, reliability can also never be an absolute
number. Instead, the degree to which the models can be relied upon is mainly defined
by the amount of information available from previous experience. Although neither
exact nor completely accurate the models should always be aimed at reflecting correct
mean values and it is therefore valuable when models can be continuously updated
e.g. with the help of Bayesian statistics (Sorensen, 2004).
An additional uncertainty which is often not discussed but nevertheless can have
critical impact on structural reliability is gross human error. This factor is very hard to
appreciate quantitatively and also, just as e.g. risk of terrorist actions, not reasonable
to design for. It is therefore not part of what is nominally referred to as reliability and
this measure is consequently not necessarily indicative of the actual frequency of
structural failure but rather only a quantification used for comparison between
structures. Gross errors are however treated in quality assurance, the cost of which in
turn influences the initial choice of appropriate reliability classes.
CHALMERS, Civil and Environmental Engineering, Master’s Thesis 2011:7575 10
Finally, due to the inevitable deterioration of structures, it is important to note that the
parameters that determine the structural resistance are not only variable as such, but
also time dependent, thus constituting a time dependent reliability (JCSS, 2001). This
aspect is always central when carrying out assessment and maintenance planning. It
can, as e.g. proposed in Sustainable Bridges (2007) be considered by adding a factor
which includes the influence of the actual condition of structural members when
calculating resistance. Also, for the sake of whole life management it can, as
discussed by Capriani et al. (2007), be elaborated on in different ways, to quantify the
time dependent reliability, e.g. for calculation of lifetime probabilities of failure.
2.3.2 Reliability methods and safety formats
Accounting for the many uncertainties and ensuring an intended structural safety can
be done in a number of ways, however as a principle it is done by making sure that
there is a large enough safety margin between the expected mean resistances and
mean load effects. How large the safety margin has to be is then essentially depending
both on how large and on how well known the variability of the loading and
performance is.
One way of expressing this so called safety margin is by replacing the basic variables
x in the failure function g(x) with stochastic variables X, i.e. by saying that the margin
M = g(X). This leads to the following expression for the probability of failure:
(2.3)
, where fx is the density function for the variable set x. The safety margin can then in
turn also be used to define the currently adopted standard measure of reliability called
the reliability index β.
In the fundamental case in which the failure function, and thereby the margin is
linearly dependent on two independent and normally distributed stochastic variables,
namely the resistance R and the load effect E, the margin will also be normally
distributed and β can by definition be expressed as:
(2.4)
However, the failure function is generally not a linear representation of parameters
and the safety margin is not necessarily normally distributed. Instead, a more
universal way of defining the reliability index is by the geometric interpretation that β
can be seen as the shortest distance from the failure surface
to origo in a normalized stochastic variable space,
formed by variables
. A two dimensional illustration of this
is given in Figure 5.
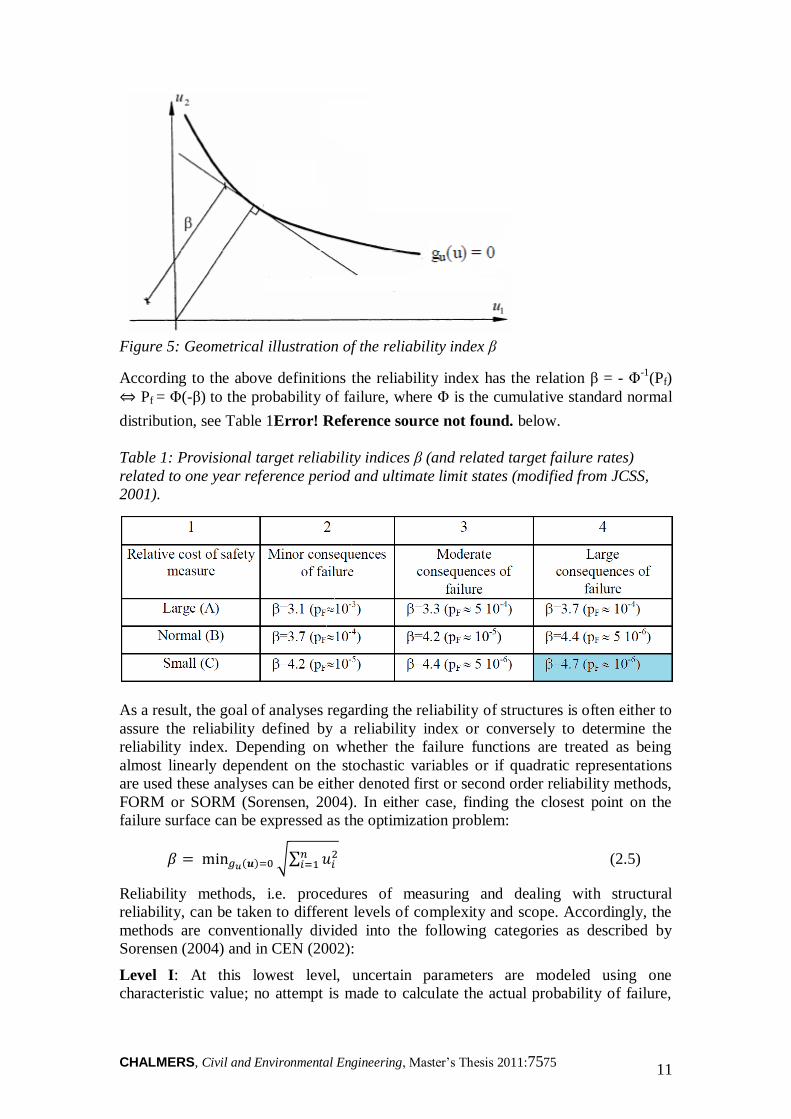
CHALMERS, Civil and Environmental Engineering, Master’s Thesis 2011:7575 11
Figure 5: Geometrical illustration of the reliability index β
According to the above definitions the reliability index has the relation β = - Φ-1
(Pf)
Pf = Φ(-β) to the probability of failure, where Φ is the cumulative standard normal
distribution, see Table 1Error! Reference source not found. below.
Table 1: Provisional target reliability indices β (and related target failure rates)
related to one year reference period and ultimate limit states (modified from JCSS,
2001).
As a result, the goal of analyses regarding the reliability of structures is often either to
assure the reliability defined by a reliability index or conversely to determine the
reliability index. Depending on whether the failure functions are treated as being
almost linearly dependent on the stochastic variables or if quadratic representations
are used these analyses can be either denoted first or second order reliability methods,
FORM or SORM (Sorensen, 2004). In either case, finding the closest point on the
failure surface can be expressed as the optimization problem:
(2.5)
Reliability methods, i.e. procedures of measuring and dealing with structural
reliability, can be taken to different levels of complexity and scope. Accordingly, the
methods are conventionally divided into the following categories as described by
Sorensen (2004) and in CEN (2002):
Level I: At this lowest level, uncertain parameters are modeled using one
characteristic value; no attempt is made to calculate the actual probability of failure,
CHALMERS, Civil and Environmental Engineering, Master’s Thesis 2011:7575 12
only that it is within the accepted limits. The way of expressing these bounds is
typically via the use of partial safety factors, as discussed in the following chapter.
Level II: In this category, parameters are represented by their mean values and
standard deviations, as well as the correlation coefficients between the stochastic
values. These are all implicitly assumed to be normally or log-normally distributed.
This is the lower level methods which can be made use of when implementing a so
called FORM or SORM.
Level III: At this level a complete analysis is made of the reliability problem.
Uncertain quantities are modeled by their joint distribution functions and, the
estimated probability of failure is used directly to quantify reliability. In doing so a
FORM or SORM can be employed, as well as different simulation techniques for full
probabilistic analysis.
Level IV: In principle the same methods are used as in level II and III, but cost
benefit analyses are also incorporated for economy based comparison of different
design alternatives. These methods are principally used for structures of major
economic importance.
The higher levels of evaluation are essentially used to calibrate the results from the
lower levels. As reminded in Sustainable Bridges (2007), the higher levels of
enhanced evaluation are only used when a bridge fails the intermediate assessments
and the cost of repair and strengthening is significant. This is also in line with the
general approach in structural assessment; as noted by Happold, et al. (1996), it is
important to keep in mind that the activities involved in the appraisal of a structure
should never be taken further than is necessary for a conclusion to be reached.
2.3.2.1 EC2 safety format - The partial safety factor method (Level 1)
As prescribed in the standard safety format of EC2 (CEN, 2002), an acceptable
reliability is achieved via the deriving of design values for all basic variables. The
resulting design load effect should be smaller than the design resistance:
(2.6)
Maximum and minimum values for the design load effect and resistance respectively
are according to the Eurocode procedures treated as separate limit states. The
corresponding separate target reliability indexes for resistance and load effect are
obtained from using fixed weight factors αR and αE, also called sensitivity factors,
which are supposed to reflect the ratio between the respective variability.
The weight factors are defined in such way that the overall target reliability index is
achieved given that the probability that the actual effect is less than the design load
effect is and likewise that The
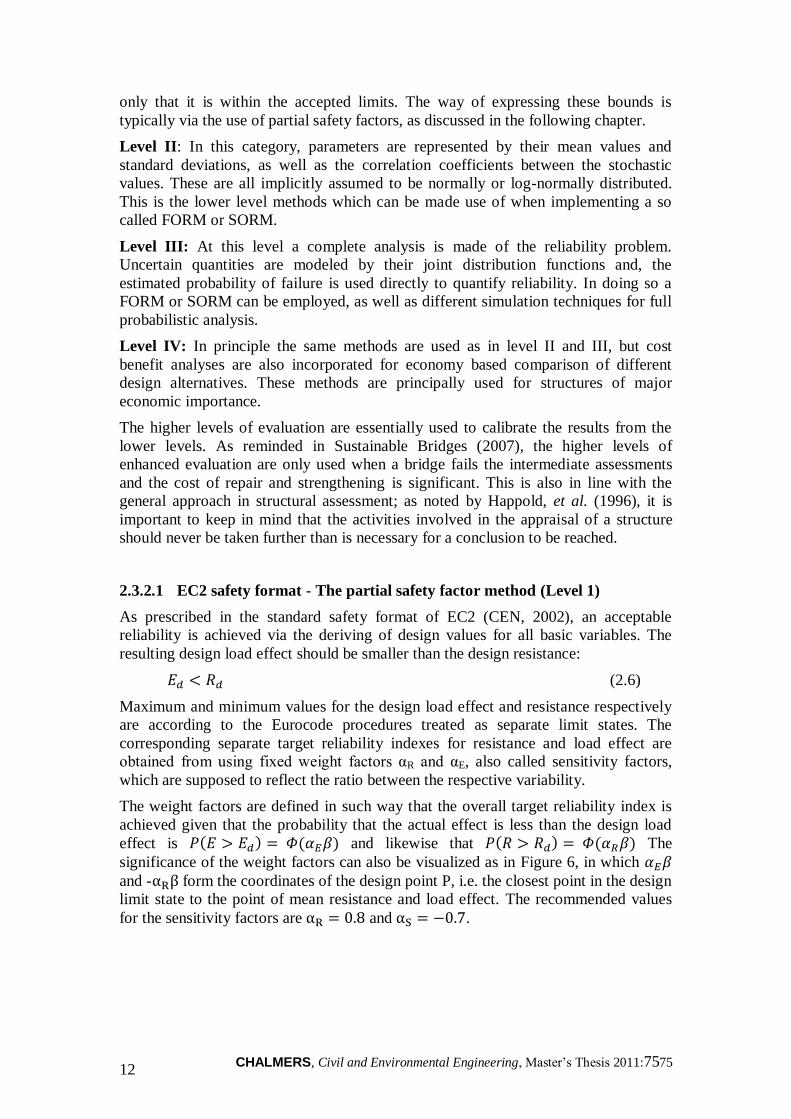
significance of the weight factors can also be visualized as in Figure 6, in which
and - form the coordinates of the design point P, i.e. the closest point in the design
limit state to the point of mean resistance and load effect. The recommended values
for the sensitivity factors are and .
CHALMERS, Civil and Environmental Engineering, Master’s Thesis 2011:7575 13
Figure 6: Design point and reliability index β for normally distributed uncorrelated
variables (CEN, 2002)
The design values of load effect and resistance are generated through the application
of partial safety factors which are used to first adjust characteristic values of input
parameters and then also to amplify or reduce the respective resulting values from
calculations to account for model uncertainty. The design resistance can be written as:
(2.7)
With regards to resistance the derivation of partial factors is based upon the
assumption that the resistance R can be calculated as a product of the nominal
resistance and factors expressing the involved material, geometrical and model
uncertainties. The uncertainties can then be measured in terms of coefficients of
variation denoted Vf, Vg and Vm respectively, which in turn can be used to express the
coefficient of variation of the resistance:
(2.8)
From this reasoning the partial safety factor for steel and the partial factor
for concrete have been derived using the following expressions:
,
The set value of β in the above expression is, 3.8, is in accordance with earlier
mentioned target reliability (reference period 50 years) and the number 1.64 is the
index of the 95th
percentile, used for determining characteristic values. The additional
factor 1.15 in the expression for concrete has been introduced to account for long-
term observations of concrete strength in real structures compared to values from
initial testing (CEN, 2004).
Estimating the values of the coefficients of variation, which in current formulations
are meant to cover a wide range of circumstances, is quite difficult and requires a
combination of considerable testing, experience and engineering judgment. It is
therefore also an open topic for discussion. As an example it was estimated by
Schlune et al. (2010) that in the case of non-linear analysis of shear type failures Vm
was in the range of 10-40 %, whereas in the Eurocode recommended values of Vm are
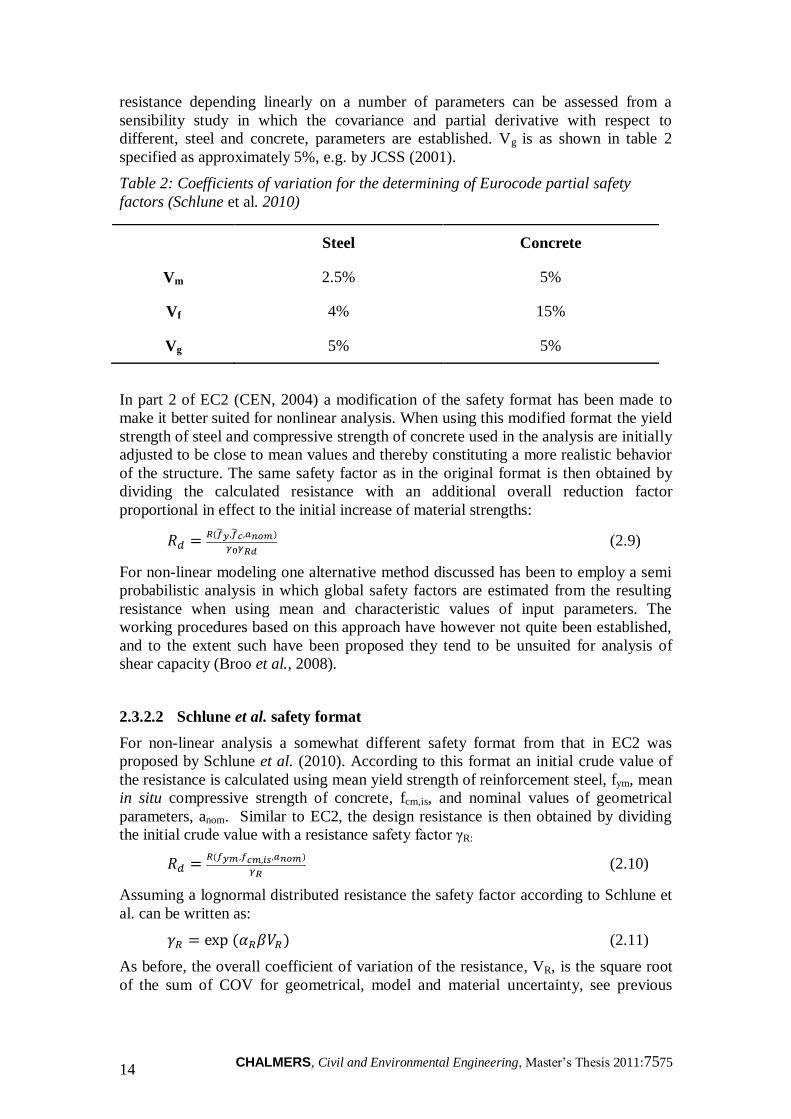
given in the range of 2.5-5% depending on the considered material, see Table 2.
Material uncertainty can for simple structures be determined directly as the COV of
the input material parameters influencing the failure load. Otherwise the COV of
CHALMERS, Civil and Environmental Engineering, Master’s Thesis 2011:7575 14
resistance depending linearly on a number of parameters can be assessed from a
sensibility study in which the covariance and partial derivative with respect to
different, steel and concrete, parameters are established. Vg is as shown in table 2
specified as approximately 5%, e.g. by JCSS (2001).
Table 2: Coefficients of variation for the determining of Eurocode partial safety
factors (Schlune et al. 2010)
Steel Concrete
Vm 2.5% 5%
Vf 4% 15%
Vg 5% 5%
In part 2 of EC2 (CEN, 2004) a modification of the safety format has been made to
make it better suited for nonlinear analysis. When using this modified format the yield
strength of steel and compressive strength of concrete used in the analysis are initially
adjusted to be close to mean values and thereby constituting a more realistic behavior
of the structure. The same safety factor as in the original format is then obtained by
dividing the calculated resistance with an additional overall reduction factor
proportional in effect to the initial increase of material strengths:
(2.9)
For non-linear modeling one alternative method discussed has been to employ a semi
probabilistic analysis in which global safety factors are estimated from the resulting
resistance when using mean and characteristic values of input parameters. The
working procedures based on this approach have however not quite been established,
and to the extent such have been proposed they tend to be unsuited for analysis of
shear capacity (Broo et al., 2008).
2.3.2.2 Schlune et al. safety format
For non-linear analysis a somewhat different safety format from that in EC2 was
proposed by Schlune et al. (2010). According to this format an initial crude value of
the resistance is calculated using mean yield strength of reinforcement steel, fym, mean
in situ compressive strength of concrete, fcm,is, and nominal values of geometrical
parameters, anom. Similar to EC2, the design resistance is then obtained by dividing
the initial crude value with a resistance safety factor γR:
(2.10)
Assuming a lognormal distributed resistance the safety factor according to Schlune et
al. can be written as:
(2.11)
As before, the overall coefficient of variation of the resistance, VR, is the square root
of the sum of COV for geometrical, model and material uncertainty, see previous
CHALMERS, Civil and Environmental Engineering, Master’s Thesis 2011:7575 15
chapter. Geometrical and model uncertainty are as in EN1990 (CEN, 2002) both
given tabulated values based on earlier testing and estimations.
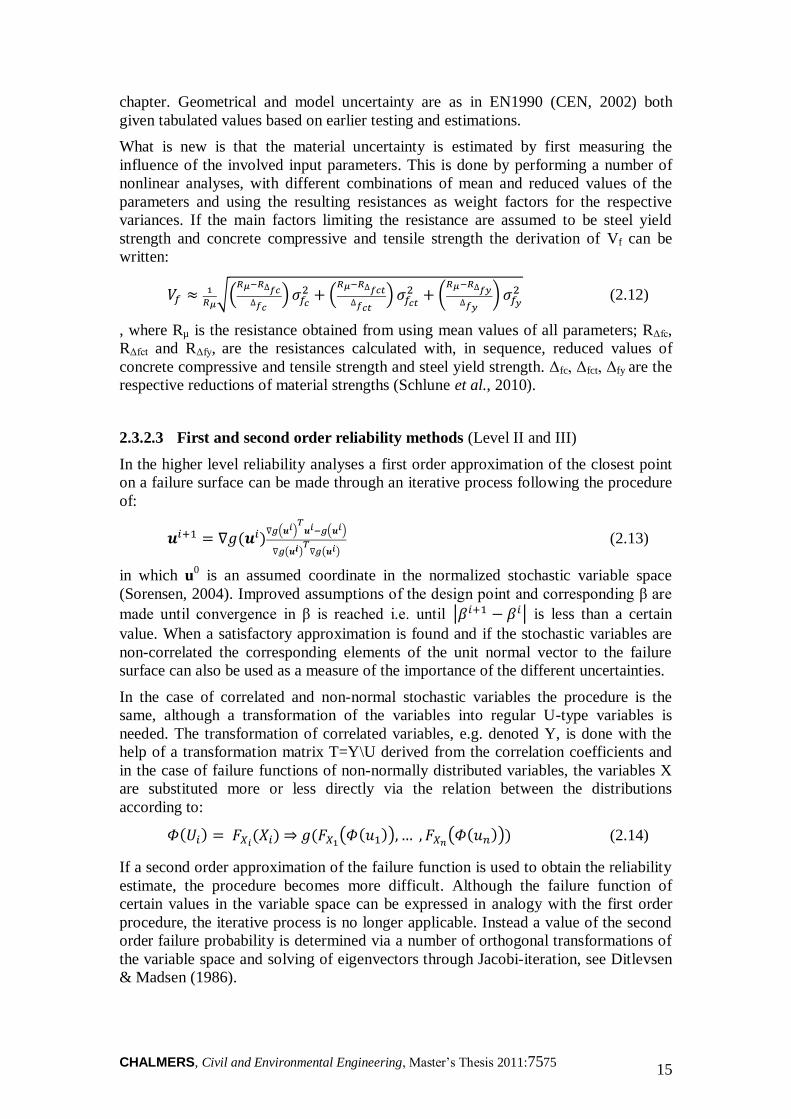
What is new is that the material uncertainty is estimated by first measuring the
influence of the involved input parameters. This is done by performing a number of
nonlinear analyses, with different combinations of mean and reduced values of the
parameters and using the resulting resistances as weight factors for the respective
variances. If the main factors limiting the resistance are assumed to be steel yield
strength and concrete compressive and tensile strength the derivation of Vf can be
written:
(2.12)
, where Rµ is the resistance obtained from using mean values of all parameters; RΔfc,
RΔfct and RΔfy, are the resistances calculated with, in sequence, reduced values of
concrete compressive and tensile strength and steel yield strength. Δfc, Δfct, Δfy are the
respective reductions of material strengths (Schlune et al., 2010).
2.3.2.3 First and second order reliability methods (Level II and III)
In the higher level reliability analyses a first order approximation of the closest point
on a failure surface can be made through an iterative process following the procedure
of:
(2.13)
in which u0 is an assumed coordinate in the normalized stochastic variable space
(Sorensen, 2004). Improved assumptions of the design point and corresponding β are
made until convergence in β is reached i.e. until is less than a certain
value. When a satisfactory approximation is found and if the stochastic variables are
non-correlated the corresponding elements of the unit normal vector to the failure
surface can also be used as a measure of the importance of the different uncertainties.
In the case of correlated and non-normal stochastic variables the procedure is the
same, although a transformation of the variables into regular U-type variables is
needed. The transformation of correlated variables, e.g. denoted Y, is done with the
help of a transformation matrix T=Y\U derived from the correlation coefficients and
in the case of failure functions of non-normally distributed variables, the variables X
are substituted more or less directly via the relation between the distributions
according to:
(2.14)
If a second order approximation of the failure function is used to obtain the reliability
estimate, the procedure becomes more difficult. Although the failure function of
certain values in the variable space can be expressed in analogy with the first order
procedure, the iterative process is no longer applicable. Instead a value of the second
order failure probability is determined via a number of orthogonal transformations of
the variable space and solving of eigenvectors through Jacobi-iteration, see Ditlevsen
& Madsen (1986).
CHALMERS, Civil and Environmental Engineering, Master’s Thesis 2011:7575 16
If the failure surface is far from linear the non-linear estimate can be expected to be
much more accurate. But also, the smaller the probability of failure is the smaller is
the difference between the first and second order approximation and when β →∞ both
the first and second order approximations converge to the exact one.
2.3.2.4 Probabilistic analysis (Level III)
In general terms probabilistic modeling can be explained as any process that employs
deduced probability distributions as input to calculate the probability distribution of a
certain output. The most widely used technique for executing these models is called
Monte Carlo simulation; reference to the famous casino comes from the random
sampling ingredient of the method. Utilizing this approach comprises running a
prescribed deterministic model a large number of times for different random input
values. Specialized software is used for this purpose, which make sure that the
random sampling is consistent with assumed relations and registers the produced
results, to be presented e.g. as histograms showing the probable distribution.
As mentioned earlier, full probabilistic modeling can be used for determining
structural reliability. The reliability is then expressed as the probability
(2.15)
, where Pf stands for the adverse portion of the sampled outcomes. The first step of
such a probabilistic analysis is to identify the basic variables and then to develop an
appropriate model based on the uncertainties that are tied to the specific limit states at
hand (CSSN, 2001).
Suitable probability distribution types and parameters for the physical variables, i.e.
the material properties and geometrical parameters should preferably be taken from
direct measurements presented in published large sample studies. If such are not
available the distribution can be chosen from an experience based set of possible
distributions, by sampling and evaluating using e.g. the method of maximum
likelihood. If two distributions fit equally well the one resulting in the lowest
reliability should be chosen.
The second step of setting up the model is to deal with the overlaying model
uncertainties, which arise not only from the physical model of structural capacity but
also from statistical uncertainty of e.g. moderately sized samples in the additional
gathering of data mentioned above. This is generally done by adding a stochastic
variable Xm to represent the model uncertainty. The statistical properties of this,
typically normally distributed variable are evaluated by comparing the results from
the used model with results from either physical experiment or other more detailed
models, such as FE models, the latter of which can ensure consistency of input.
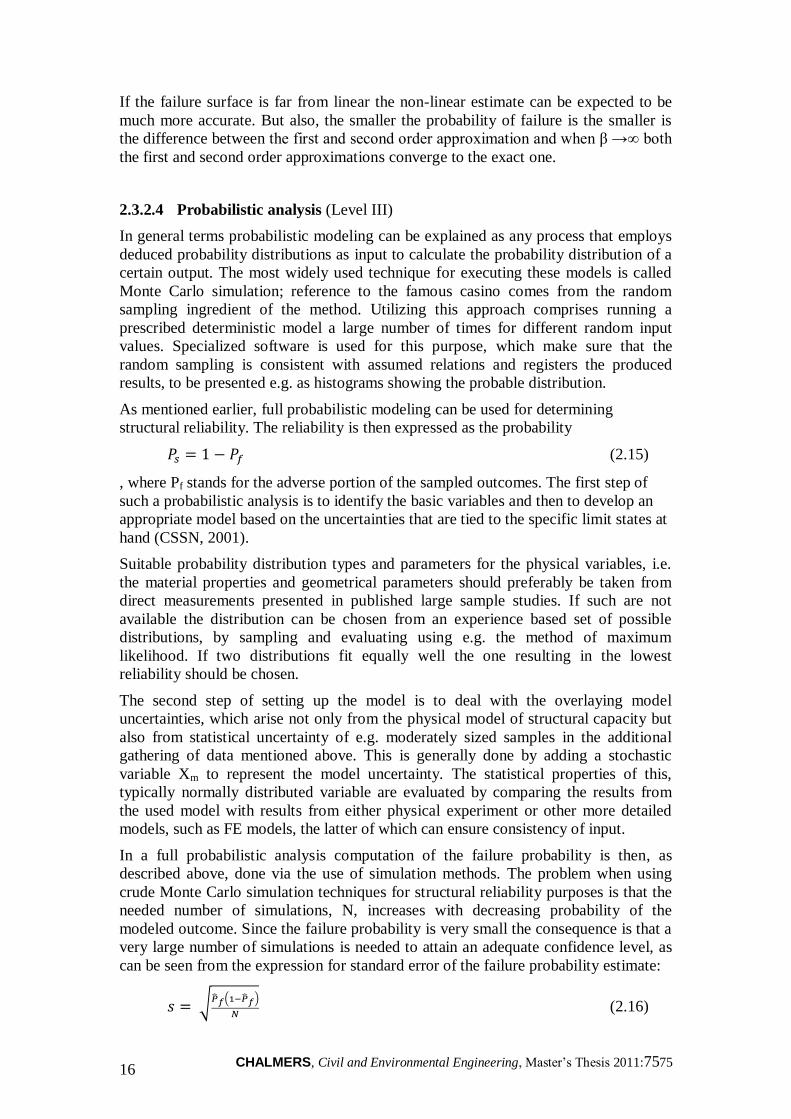
In a full probabilistic analysis computation of the failure probability is then, as
described above, done via the use of simulation methods. The problem when using
crude Monte Carlo simulation techniques for structural reliability purposes is that the
needed number of simulations, N, increases with decreasing probability of the
modeled outcome. Since the failure probability is very small the consequence is that a
very large number of simulations is needed to attain an adequate confidence level, as
can be seen from the expression for standard error of the failure probability estimate:
(2.16)
CHALMERS, Civil and Environmental Engineering, Master’s Thesis 2011:7575 17
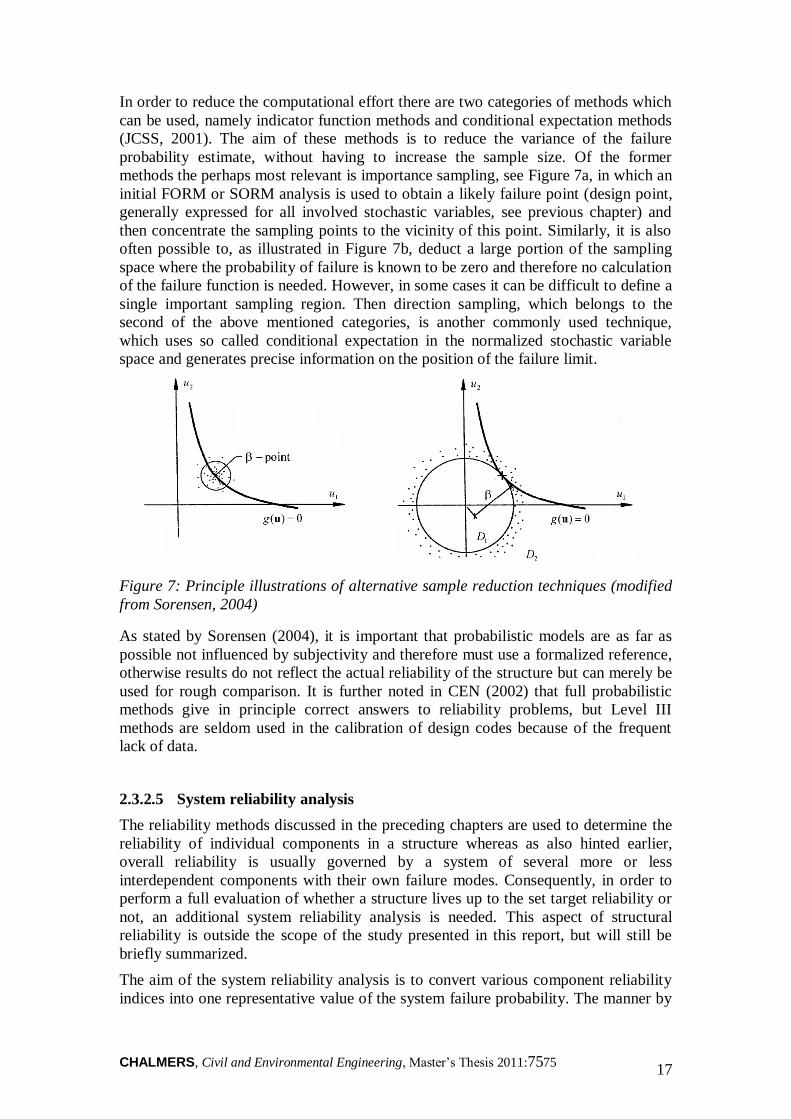
In order to reduce the computational effort there are two categories of methods which
can be used, namely indicator function methods and conditional expectation methods
(JCSS, 2001). The aim of these methods is to reduce the variance of the failure
probability estimate, without having to increase the sample size. Of the former
methods the perhaps most relevant is importance sampling, see Figure 7a, in which an
initial FORM or SORM analysis is used to obtain a likely failure point (design point,
generally expressed for all involved stochastic variables, see previous chapter) and
then concentrate the sampling points to the vicinity of this point. Similarly, it is also
often possible to, as illustrated in Figure 7b, deduct a large portion of the sampling
space where the probability of failure is known to be zero and therefore no calculation
of the failure function is needed. However, in some cases it can be difficult to define a
single important sampling region. Then direction sampling, which belongs to the
second of the above mentioned categories, is another commonly used technique,
which uses so called conditional expectation in the normalized stochastic variable
space and generates precise information on the position of the failure limit.
Figure 7: Principle illustrations of alternative sample reduction techniques (modified
from Sorensen, 2004)
As stated by Sorensen (2004), it is important that probabilistic models are as far as
possible not influenced by subjectivity and therefore must use a formalized reference,
otherwise results do not reflect the actual reliability of the structure but can merely be
used for rough comparison. It is further noted in CEN (2002) that full probabilistic
methods give in principle correct answers to reliability problems, but Level III
methods are seldom used in the calibration of design codes because of the frequent
lack of data.
2.3.2.5 System reliability analysis
The reliability methods discussed in the preceding chapters are used to determine the
reliability of individual components in a structure whereas as also hinted earlier,
overall reliability is usually governed by a system of several more or less
interdependent components with their own failure modes. Consequently, in order to
perform a full evaluation of whether a structure lives up to the set target reliability or
not, an additional system reliability analysis is needed. This aspect of structural
reliability is outside the scope of the study presented in this report, but will still be
briefly summarized.
The aim of the system reliability analysis is to convert various component reliability
indices into one representative value of the system failure probability. The manner by
CHALMERS, Civil and Environmental Engineering, Master’s Thesis 2011:7575 18
which this should be done depends on to what degree the system should be regarded
as a series or parallel system. Another way of expressing this is by saying that the
structure can be designed to have a certain redundancy. An ideally redundant
structure, constituting a parallel system, would keep fulfilling its purpose as long as
there is at least one component that had not yet failed, whereas a system with no
redundancy would fail capitally if not all involved components are intact.
Consequently, the parallel and series systems have the opposite relations both to the
number and the possible correlation of components involved in the system.
Finally, structural redundancy is also to some extent intertwined with the concept of
robustness, i.e. what possible wide spread effect local accidental actions can have on a
structure. Starossek, (2006) states that except when designing very long bridges
robustness of structures is often neglected and in the cases where recent
recommendations have been given concerning the issue these often lack general
applicability. By and large, risks of low probability-high consequence types of actions
are often left uncared for.
2.3.3 The Eurocode program and the JCSS model code
In 1975, The European Commission decided on an action program with the aim of
eliminating obstacles to trade through harmonization of technical specifications in the
field of construction. In a first stage, an initial set of uniform rules would serve as an
alternative to national standards, before ultimately replacing them. A first generation
of codes was established during the following decade, but it is only recently that the
codes have started to become fully implemented.
The European construction code comprises standard regulations on the execution of
design and assessment work within a number of sub disciplines of structural
engineering. The most particular purpose is to facilitate compliance with essential
requirements on mechanical resistance and stability, as well as safety in case of fire.
The code does not however distinguish values with regards to levels of safety used in
individual countries. These matters are included in the informative annexes of the
code and left to be decided on by the responsible national regulatory authorities.
According to note 3.5.4 and 3.5.5 in the Eurocode basis for structural design (CEN,
2002), structural reliability models used in limit state design shall be formulated either
according to the provided partial safety factor method, see chapter 2.3.2.1, or directly
based on probabilistic methods, if agreed on by the relevant authority. In case the
latter approach is used, the only governing rule is that the thereby determined design
values should, as stated in note 6.1 (5), correspond to at least the same degree of
reliability as intended by the use of partial factors given in the code.
The safety formats used in EC2, partly based on a probabilistic background, partly
calibrated for design procedures of the past, have been designed to allow for easy
application in design and assessment practice. However, as a result of the intended
general applicability, the drawback of the safety formats is that they cannot always be
entirely accurate (Vrouwenvelder, 1997).
A more consistent reliability should naturally result from using a more direct, full
probabilistic approach, which is also sometimes implemented in design and
assessment of particularly important structures. In order for such assessments, or
evaluation of the present safety formats, to be conclusive it is required that accessible
probabilistic data, on which the models should be based, is complete. As an aid to
CHALMERS, Civil and Environmental Engineering, Master’s Thesis 2011:7575 19
fulfill this requirement, with the aim of reducing the need for pragmatic and
subjective decisions in the above processes, the Joint committee on structural safety,
JCSS, has produced a comprehensive set of guidelines on how to construct stochastic
models for structural analysis.
CHALMERS, Civil and Environmental Engineering, Master’s Thesis 2011:7575 20
3 Analysis
To meet the objectives of this thesis a parametric study was conducted in which the
shear assessment methods and safety formats described in the previous chapter were
evaluated and compared. This chapter is aimed at describing the methodology used in
preparation for this evaluation.
3.1 Choice of typical cross sections
The intention of the parametric study was to conduct evaluations of concrete cross
sections which could represent conventional types of bridge girders. Considering that
there is quite a range of possible designs this can seem as a rather major task.
However, in the light of what was meant to be investigated, narrowing down the
number of cross section configurations would perhaps not only be justified by
limitations, but also did not have to significantly affect the generality of results.
It was concluded that if focusing on the design of simple horizontal concrete bridge
superstructures there are in principle only two main alternatives; the structure can
either be built as a solid slab or it can be shaped into a number of separate girders. The
girders can then in turn be formed as simple T-shaped deck girders or joined at the
bottom to form so called box girders. There are many ways by which these basic
designs can be tapered and modified, but the question was whether such changes in
configuration would have any effect on the reliability of capacity estimates and if such
differences could be modeled.
As stated in CEN (2002): “Unusual forms of construction or design conditions are not
specifically covered and additional expert consideration will be required by the
designer in such cases.” Apart from the obvious extra effort needed, it was also found
that since there was e.g. no guidance available on how this would affect variability of
geometry and concreting quality there was neither any real point in trying to evaluate
more intricately shaped beams. For that reason it was decided that the geometries used
in the analysis should be kept simple and such that standard formulas given in the
code applied.
It was assumed that in order to enable showing possible variations due to geometry in
the sensitivity to variation of different parameters it would be sufficient to model a
cross section with a distinct difference in width between top and bottom and then
alternate which of the two ends was to be in compression or tension. Accordingly, in
addition to a solid rectangular section, a regular T-section with the same web
dimensions was defined to be loaded with alternatively positive and negative moment.
3.2 Choice of parameters
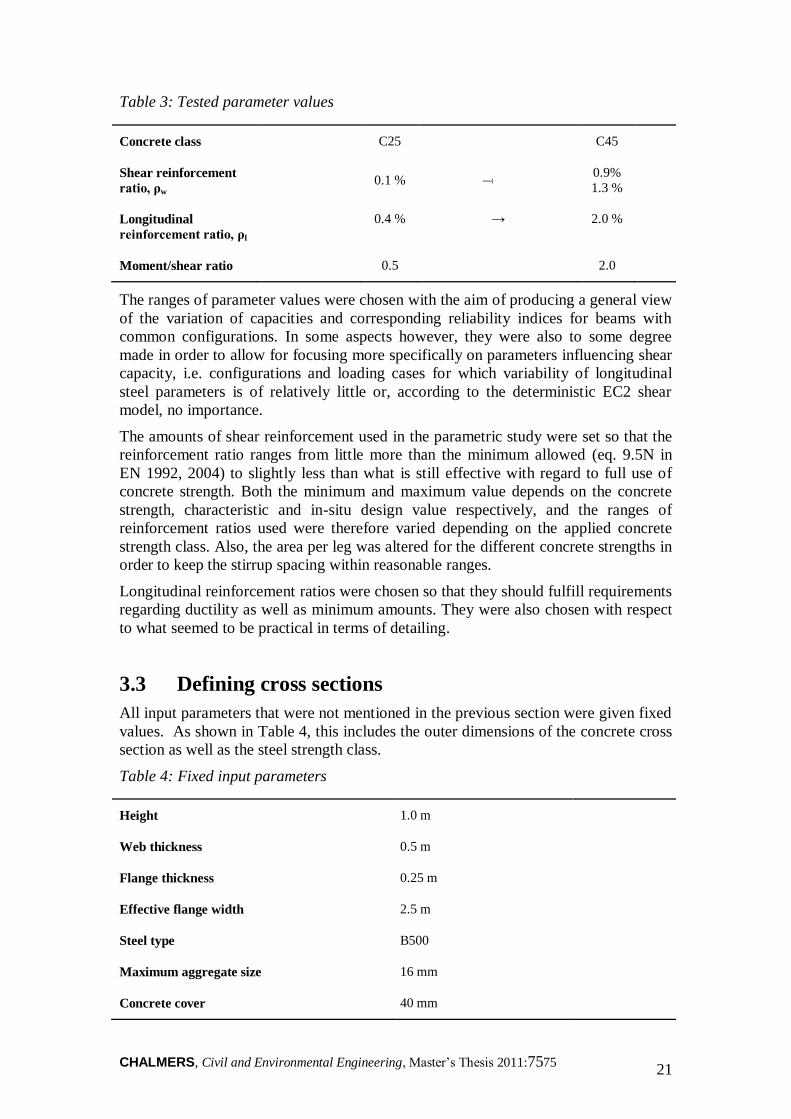
As shown in Table 3, the quantities to which primary focus was given in the
parametric study of specific cross sections were the concrete strength and the amount
of transverse and longitudinal reinforcement, reinforcement ratios ρw and ρl. Different
load cases were also defined by setting a varying ratio between moment and shear
force.
CHALMERS, Civil and Environmental Engineering, Master’s Thesis 2011:7575 21
Table 3: Tested parameter values
Concrete class C25 C45
Shear reinforcement
ratio, ρw 0.1 % →
0.9%
1.3 %
Longitudinal
reinforcement ratio, ρl
0.4 % → 2.0 %
Moment/shear ratio 0.5 2.0
The ranges of parameter values were chosen with the aim of producing a general view
of the variation of capacities and corresponding reliability indices for beams with
common configurations. In some aspects however, they were also to some degree
made in order to allow for focusing more specifically on parameters influencing shear
capacity, i.e. configurations and loading cases for which variability of longitudinal
steel parameters is of relatively little or, according to the deterministic EC2 shear
model, no importance.
The amounts of shear reinforcement used in the parametric study were set so that the
reinforcement ratio ranges from little more than the minimum allowed (eq. 9.5N in
EN 1992, 2004) to slightly less than what is still effective with regard to full use of
concrete strength. Both the minimum and maximum value depends on the concrete
strength, characteristic and in-situ design value respectively, and the ranges of
reinforcement ratios used were therefore varied depending on the applied concrete
strength class. Also, the area per leg was altered for the different concrete strengths in
order to keep the stirrup spacing within reasonable ranges.
Longitudinal reinforcement ratios were chosen so that they should fulfill requirements
regarding ductility as well as minimum amounts. They were also chosen with respect
to what seemed to be practical in terms of detailing.
3.3 Defining cross sections
All input parameters that were not mentioned in the previous section were given fixed
values. As shown in Table 4, this includes the outer dimensions of the concrete cross
section as well as the steel strength class.
Table 4: Fixed input parameters
Height 1.0 m
Web thickness 0.5 m
Flange thickness 0.25 m
Effective flange width 2.5 m
Steel type B500
Maximum aggregate size 16 mm
Concrete cover 40 mm
CHALMERS, Civil and Environmental Engineering, Master’s Thesis 2011:7575 22
In order to define realistic cross sections consideration was given to the placing of
reinforcement bars. Different reinforcement ratios require different disposition of the
reinforcement bars resulting in a shifting ratio between the height of the section and
the internal lever arm. Consequently, these two parameters could not be defined
independently, instead the option stood between defining the size of the section in
terms of either of the two. It was decided to use fixed concrete dimensions and let the
lever arm result from, in this regard, optimal steel distributions. These were based on
the most suitable longitudinal reinforcement bar dimensions within a range of 16 to 32
mm, a minimum spacing of the bars based on an assumed maximum aggregate size of
32 mm, as stipulated in the Swedish national construction code (Vägverket, 2004), an
assumed minimum nominal concrete cover of 40 mm and a stirrup dimension of 16
mm.
In the Response-2000 non-linear analysis, stress-strain relations for concrete in
compression was modeled by the standard equation given by Collins & Mitchell
(1991) and the so called tension stiffening factor was set to the Response default value
of 1.0. Softening as a result of transverse tensile strains was modeled according to
Vecchio and Collins (1986). Finally, based on the custom equation in Response-
2000, the stress-strain behavior of the reinforcing steel was modeled by a linear
relation until yielding, followed initially by a constant stress and then, at a default
strain of 7∙10-3
, a quadratic strain hardening relation until the maximum stress was
reached.
3.4 Calculation of resistance according to EC 2
As previously mentioned, in accordance with the shear model presented in EN1992-2
(CEN, 2004) the capacity of a concrete beam section is governed by separate limit
state formulations with regard to shear and bending capacity. Concerning shear there
are principally two equations describing the capacity. Assuming that vertical shear
reinforcement stirrups have been provided these can be written as:
(3.1)
The shear resistance is however connected to the moment resistance via the condition
that enough bending reinforcement should be applied to provide not only the tensile
force needed for moment resistance but also an additional force ΔFtd needed for shear
transfer. The infliction of this requirement on the shear capacity can via substitution
be described as:
(3.2)
Normally, the need for sufficient anchored bending reinforcement would be dealt with
separately and then would not be directly relevant in the shear strength assessment.
However in order to allow for comparison with results obtained from Response-2000
the two assessment procedures had to be made consistent. In other words, the moment
and shear analyses of EN 1992 had to be combined.
CHALMERS, Civil and Environmental Engineering, Master’s Thesis 2011:7575 23
3.4.1 Internal lever arm
According to CEN (2004) the internal lever arm z, governing the shear response of a
concrete cross section, can be approximated as 0.9d. There is however no specific
guidance on how to determine the value of d. For calculation of moment resistance d
is usually seen as the weighted lever arm of the bending reinforcement, but if this
approach is applied for shear resistance calculations it would mean that adding
longitudinal reinforcement would result in a reduction of the shear capacity. This did
not seem reasonable and therefore, as long as the moment resistance was not a
governing factor, the value of d was set as the height from the compressed edge of the
beam to the outer layer of tensile reinforcement, as in the case of minimum
longitudinal reinforcement. For evaluation of whether the longitudinal reinforcement
can provide the additional tensile forces needed for shear transfer, the value of d was
still treated as based on the gravity center of all the bars in tension.
3.4.2 Design resistance
Calculation of resistance according to the EC2 shear model for component check is a
deterministic, and at least calculation-wise linear, analysis. Therefore the EC safety
format for linear analysis was used. As described in chapter 2.3.2.1, the alternative
safety format for non-linear analysis could also have been used; however by definition
it should have given the same result. Design moment resistances of the cross sections
were also calculated using the basic partial safety factor format given in EN 1992-1
(CEN, 2004a). No strain hardening of the steel was allowed for and a parabola shaped
ultimate state stress distribution in the concrete compression zone was assumed.
Design in-situ concrete strengths were taken in accordance with EN 1992-2 (CEN,
2004), in which it is stated that for all strength classes in-situ strengths are derived by
multiplying the concrete cylinder strength with a correction factor αcc, taking into
account time dependent effects and unfavorable effects from specific loading
conditions. Following the EN recommendations concerning design of buildings the
value of αcc should be taken as 1.0, whereas for bridges the same value is 0.85. The
correction factor αcc is however a nationally determined parameter and it is also
treated in various ways in different countries of the EU. In the Swedish annex to EN
1992-2 the recommended value of αcc is 1.0, but since JCSS and EC2 should have the
same considerations in mind when they set their recommendations the value of αcc
was still chosen as 0.85, which also to a higher degree enables testing the consistency
of recommendations given by the two functions, in principle both intended for the
same purpose by the European Commission.
3.5 Calculation of resistance with Response-2000
The assessment of resistances using Response-2000 was done as prescribed by Bentz
(2000). As described previously, when assessing design shear resistances using
Response-2000 the acting moments and shear forces are combined in an evaluation of
equilibrium. Separate failure modes can then be distinguished from interpretation of
resulting strains, but there is no distinction between moment and shear capacity. For
comparison of design resistances the ratio between acting moment and shear was set
in accordance with the EC2 resistance analyses.
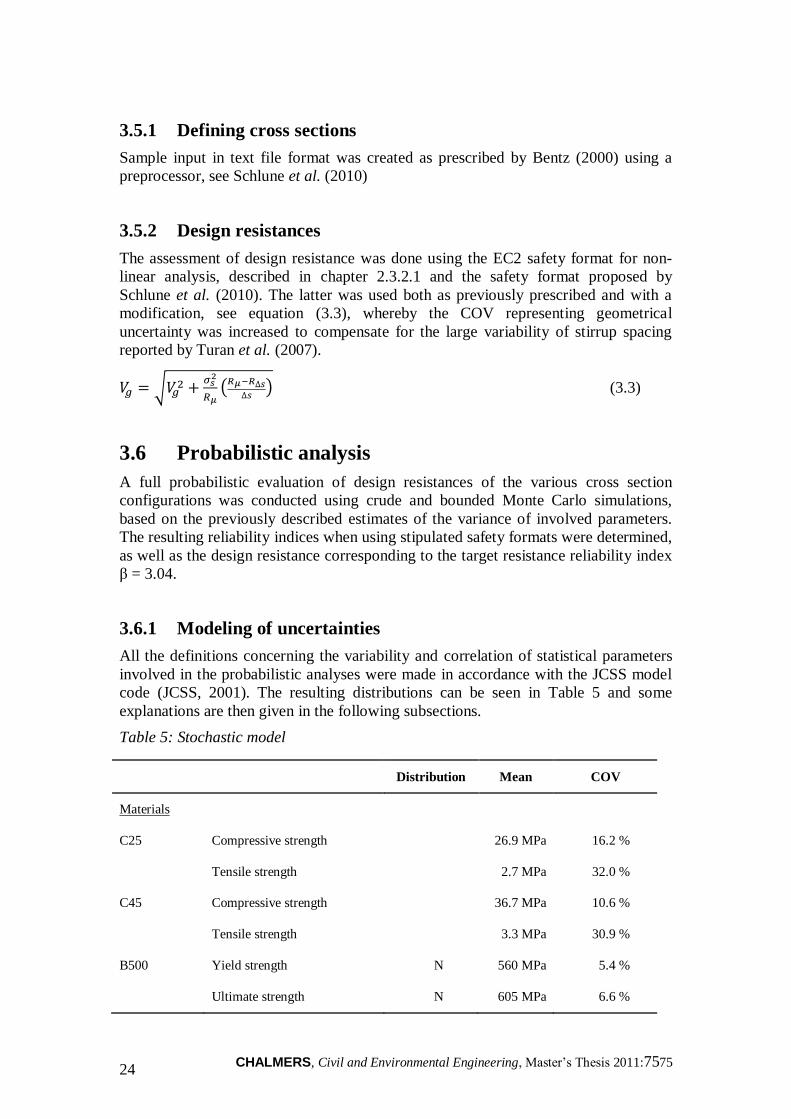
CHALMERS, Civil and Environmental Engineering, Master’s Thesis 2011:7575 24
3.5.1 Defining cross sections
Sample input in text file format was created as prescribed by Bentz (2000) using a
preprocessor, see Schlune et al. (2010)
3.5.2 Design resistances
The assessment of design resistance was done using the EC2 safety format for non-
linear analysis, described in chapter 2.3.2.1 and the safety format proposed by
Schlune et al. (2010). The latter was used both as previously prescribed and with a
modification, see equation (3.3), whereby the COV representing geometrical
uncertainty was increased to compensate for the large variability of stirrup spacing
reported by Turan et al. (2007).
(3.3)
3.6 Probabilistic analysis
A full probabilistic evaluation of design resistances of the various cross section
configurations was conducted using crude and bounded Monte Carlo simulations,
based on the previously described estimates of the variance of involved parameters.
The resulting reliability indices when using stipulated safety formats were determined,
as well as the design resistance corresponding to the target resistance reliability index
β = 3.04.
3.6.1 Modeling of uncertainties
All the definitions concerning the variability and correlation of statistical parameters
involved in the probabilistic analyses were made in accordance with the JCSS model
code (JCSS, 2001). The resulting distributions can be seen in Table 5 and some
explanations are then given in the following subsections.
Table 5: Stochastic model
Distribution Mean COV
Materials
C25 Compressive strength 26.9 MPa 16.2 %
Tensile strength 2.7 MPa 32.0 %
C45 Compressive strength 36.7 MPa 10.6 %
Tensile strength 3.3 MPa 30.9 %
B500 Yield strength N 560 MPa 5.4 %
Ultimate strength N 605 MPa 6.6 %
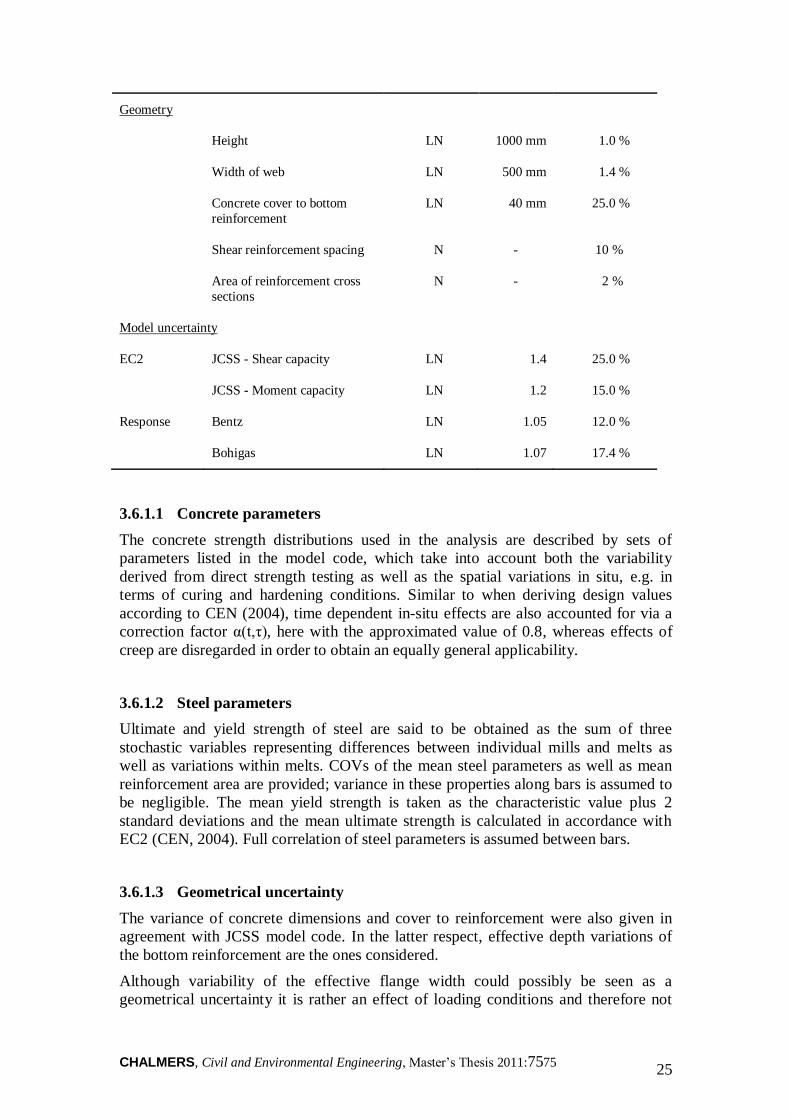
CHALMERS, Civil and Environmental Engineering, Master’s Thesis 2011:7575 25
Geometry
Height LN 1000 mm 1.0 %
Width of web LN 500 mm 1.4 %
Concrete cover to bottom
reinforcement
LN 40 mm 25.0 %
Shear reinforcement spacing N - 10 %
Area of reinforcement cross
sections
N - 2 %
Model uncertainty
EC2 JCSS - Shear capacity LN 1.4 25.0 %
JCSS - Moment capacity LN 1.2 15.0 %
Response Bentz LN 1.05 12.0 %
Bohigas LN 1.07 17.4 %
3.6.1.1 Concrete parameters
The concrete strength distributions used in the analysis are described by sets of
parameters listed in the model code, which take into account both the variability
derived from direct strength testing as well as the spatial variations in situ, e.g. in
terms of curing and hardening conditions. Similar to when deriving design values
according to CEN (2004), time dependent in-situ effects are also accounted for via a
correction factor α(t,τ), here with the approximated value of 0.8, whereas effects of
creep are disregarded in order to obtain an equally general applicability.
3.6.1.2 Steel parameters
Ultimate and yield strength of steel are said to be obtained as the sum of three
stochastic variables representing differences between individual mills and melts as
well as variations within melts. COVs of the mean steel parameters as well as mean
reinforcement area are provided; variance in these properties along bars is assumed to
be negligible. The mean yield strength is taken as the characteristic value plus 2
standard deviations and the mean ultimate strength is calculated in accordance with
EC2 (CEN, 2004). Full correlation of steel parameters is assumed between bars.
3.6.1.3 Geometrical uncertainty
The variance of concrete dimensions and cover to reinforcement were also given in
agreement with JCSS model code. In the latter respect, effective depth variations of
the bottom reinforcement are the ones considered.
Although variability of the effective flange width could possibly be seen as a
geometrical uncertainty it is rather an effect of loading conditions and therefore not
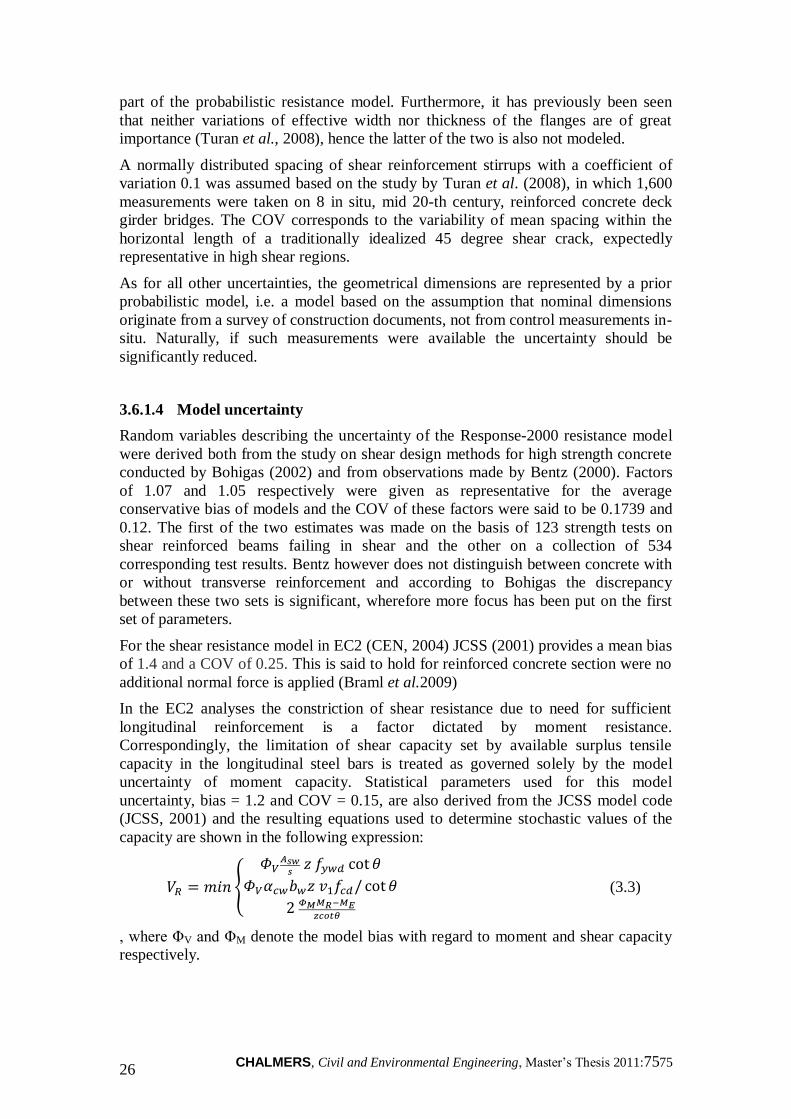
CHALMERS, Civil and Environmental Engineering, Master’s Thesis 2011:7575 26
part of the probabilistic resistance model. Furthermore, it has previously been seen
that neither variations of effective width nor thickness of the flanges are of great
importance (Turan et al., 2008), hence the latter of the two is also not modeled.
A normally distributed spacing of shear reinforcement stirrups with a coefficient of
variation 0.1 was assumed based on the study by Turan et al. (2008), in which 1,600
measurements were taken on 8 in situ, mid 20-th century, reinforced concrete deck
girder bridges. The COV corresponds to the variability of mean spacing within the
horizontal length of a traditionally idealized 45 degree shear crack, expectedly
representative in high shear regions.
As for all other uncertainties, the geometrical dimensions are represented by a prior
probabilistic model, i.e. a model based on the assumption that nominal dimensions
originate from a survey of construction documents, not from control measurements in-
situ. Naturally, if such measurements were available the uncertainty should be
significantly reduced.
3.6.1.4 Model uncertainty
Random variables describing the uncertainty of the Response-2000 resistance model
were derived both from the study on shear design methods for high strength concrete
conducted by Bohigas (2002) and from observations made by Bentz (2000). Factors
of 1.07 and 1.05 respectively were given as representative for the average
conservative bias of models and the COV of these factors were said to be 0.1739 and
0.12. The first of the two estimates was made on the basis of 123 strength tests on
shear reinforced beams failing in shear and the other on a collection of 534
corresponding test results. Bentz however does not distinguish between concrete with
or without transverse reinforcement and according to Bohigas the discrepancy
between these two sets is significant, wherefore more focus has been put on the first
set of parameters.
For the shear resistance model in EC2 (CEN, 2004) JCSS (2001) provides a mean bias
of 1.4 and a COV of 0.25. This is said to hold for reinforced concrete section were no
additional normal force is applied (Braml et al.2009)
In the EC2 analyses the constriction of shear resistance due to need for sufficient
longitudinal reinforcement is a factor dictated by moment resistance.
Correspondingly, the limitation of shear capacity set by available surplus tensile
capacity in the longitudinal steel bars is treated as governed solely by the model
uncertainty of moment capacity. Statistical parameters used for this model
uncertainty, bias = 1.2 and COV = 0.15, are also derived from the JCSS model code
(JCSS, 2001) and the resulting equations used to determine stochastic values of the
capacity are shown in the following expression:
(3.3)
, where ΦV and ΦM denote the model bias with regard to moment and shear capacity
respectively.
CHALMERS, Civil and Environmental Engineering, Master’s Thesis 2011:7575 27
3.6.2 Monte Carlo Simulation
Reliability indices and probabilistic design resistances were computed as described by
Schlune et al. (2010a, 2010b). For the deterministic EC2 shear analyses the computer
software Matlab was used while the probabilistic analyses with Response-2000 were
done using a pre- and postprocessor written in Python. The random samples of input
variables for the Response-2000 resistance evaluations were produced using
randomizing functions in the mathematical toolboxes Numpy and Scipy.
For the computationally heavy analyses using Response-2000 the number of required
function evaluations was reduced by the use of bounds, setting the limits of a safe
variable space. Since the limit function of the shear resistance is monotonous or
inverse monotonous with respect to all the involved variables, bounds could be
created using the approach of Rajabalinejad (2009). Accordingly, a certain number of
initial function evaluations were used to determine the combinations of minimum or
maximum values for which the function yields a safe result. In accordance with
Schlune et al. (2010b) the procedure of deriving the bounds was then enhanced
through shifting of the random variable distribution to center around the values
constituting the limit states, i.e. the before determined design resistances.
The number of simulations needed to achieve an acceptable confidence level was
estimated following the guidance given by Waarts (2000). When conducting the
parametric study of typical cross sections Monte Carlo simulation of random input
variables was run 200000 times, according to the formula (Waarts, 2000):
(3.4)
This corresponds to a COV of the failure probability V(Pf) = 6.5% and a standard
deviation of the beta value1 σ(β) = 0.02 at β = 3.04. Bounds were created from 3000
initial analyses, which approximately reduced the number of analyses in the
subsequent Monte Carlo simulation by a factor of 20.
The design resistance corresponding to target reliability was found via iteration
around an estimated value based on earlier determined indices obtained from using
the two safety formats.
3.7 Additional comments on the choice and modelling of
parameters
In this section a number of supplementary notes have been added to elaborate on
some considerations made when setting up the analysis. These are aimed at explaining
some personal choices and approximations as well as details on how available
guidance in literature has been interpreted.
3.7.1 Design of cross sections
When choosing which parameters were interesting to study the influence of, and
which could be treated as fixed, the focus was on enabling showing trends in the
fluctuations of obtained reliability indices and comparative strength estimates for
1 Waarts (2000) recommended value of V(β) for FEA reliability calculations is 0.05, i.e. σ(β) = 0.152
CHALMERS, Civil and Environmental Engineering, Master’s Thesis 2011:7575 28
different beams, without having to change that many parameters. It was assumed that
as long as the COV of parameters remain constant it is not so much changes in size of
parameters that result in differences, but rather changes in ratio between parameters.
3.7.1.1 Geometry and material parameters
Regarding the outer dimensions of the beam cross sections it was deduced that it is
mainly the relation between concrete and steel area, i.e. the reinforcement ratio, that is
important, not so much the size and shape of the concrete area. The exception from
this rule is the size of the flanges which in effect changes the ratio between steel and
concrete area even though it does not affect the nominal reinforcement ratios ρl and
ρw.
The relation between steel and concrete strength was also of prominent importance,
wherefore two different concrete strengths were used. An even larger span in the
relation between steel and concrete strength would have been achieved if also the steel
strength had been varied, but this was deemed superfluous.
Another reason for changing material strength parameters is that to some extent the
COV of both concrete and steel strength parameters change when the strengths
change. For concrete this fluctuation was shown to mainly regard compressive
strength, for which the COV, as prescribed by JCSS (2001) was 50 % higher for C25
concrete than for C45, see Table 5. Also according to JCSS, σ of steel should be a
fixed value. This would obviously result in larger strength variability for low strength
steel and would perhaps form a reason for including this variable in the parametric
study. It is however debatable whether it is the σ or COV that should be treated as
fixed and there have been studies presented which point in either direction (JCSS,
2001).
3.7.1.2 Amounts of reinforcement
The amounts of reinforcement used in the parametric study were set with quite large
spans within the maximum allowed ranges set by EC2 detailing rules. Although some
consideration has been given to practicality it is therefore still possible that some of
the combinations of values may not be very likely to be used in real cases.
Regarding the total amount of longitudinal reinforcement, there are recommendations
that, at the bottom side of bridge girders, 25 % of the reinforcement needed to resist
the maximum moment should be continued over intermediate supports (Vägverket,
2004). This is however, even within a certain distance from the supports, usually more
than is apparently needed with regard to moment capacity. It was therefore decided
that this recommended value makes for a good assumption of approximate ratio
between reinforcement amounts on compression and tension side in ordinary high
shear regions.
In the estimation of resulting internal lever arms when using certain amounts of steel,
bar diameters were assumed to be less than 32 mm. One reason for this choice was
that for larger sizes of bars certain additional requirements apply regarding prevention
against loss of bond through spalling of concrete cover (CEN, 2004a).
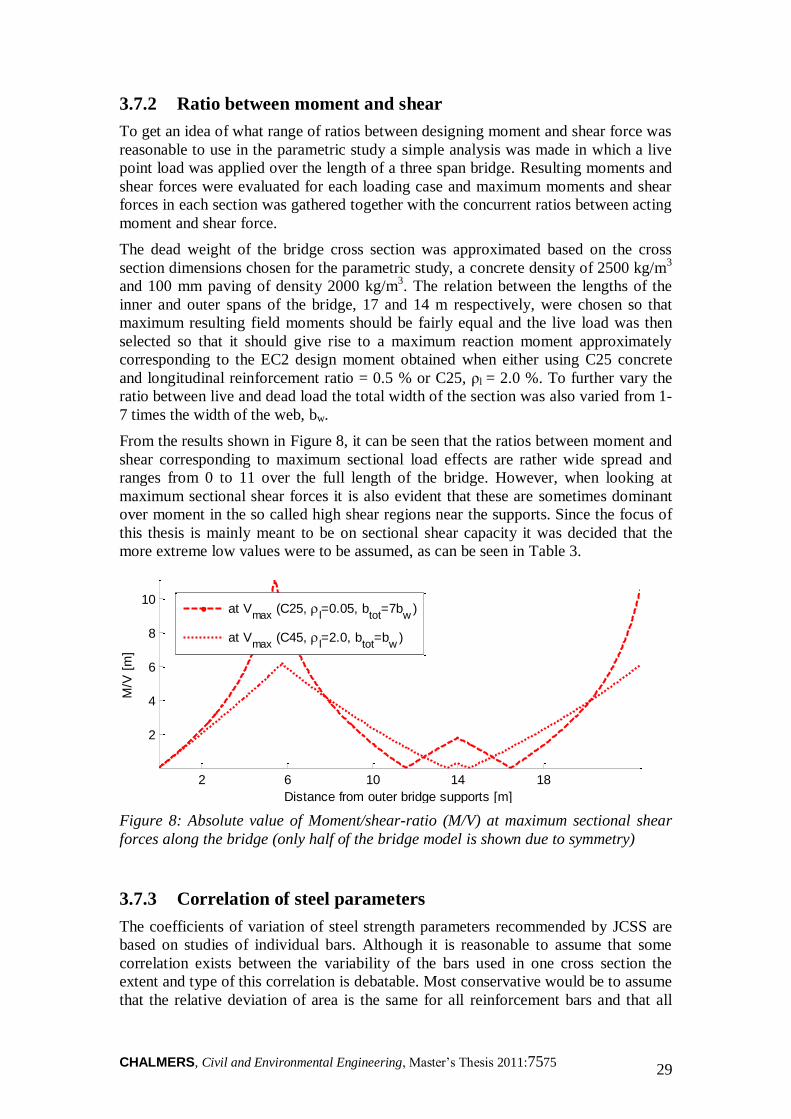
CHALMERS, Civil and Environmental Engineering, Master’s Thesis 2011:7575 29
3.7.2 Ratio between moment and shear
To get an idea of what range of ratios between designing moment and shear force was
reasonable to use in the parametric study a simple analysis was made in which a live
point load was applied over the length of a three span bridge. Resulting moments and
shear forces were evaluated for each loading case and maximum moments and shear
forces in each section was gathered together with the concurrent ratios between acting
moment and shear force.
The dead weight of the bridge cross section was approximated based on the cross
section dimensions chosen for the parametric study, a concrete density of 2500 kg/m3
and 100 mm paving of density 2000 kg/m3. The relation between the lengths of the
inner and outer spans of the bridge, 17 and 14 m respectively, were chosen so that
maximum resulting field moments should be fairly equal and the live load was then
selected so that it should give rise to a maximum reaction moment approximately
corresponding to the EC2 design moment obtained when either using C25 concrete
and longitudinal reinforcement ratio = 0.5 % or C25, ρl = 2.0 %. To further vary the
ratio between live and dead load the total width of the section was also varied from 1-
7 times the width of the web, bw.
From the results shown in Figure 8, it can be seen that the ratios between moment and
shear corresponding to maximum sectional load effects are rather wide spread and
ranges from 0 to 11 over the full length of the bridge. However, when looking at
maximum sectional shear forces it is also evident that these are sometimes dominant
over moment in the so called high shear regions near the supports. Since the focus of
this thesis is mainly meant to be on sectional shear capacity it was decided that the
more extreme low values were to be assumed, as can be seen in Table 3.
Figure 8: Absolute value of Moment/shear-ratio (M/V) at maximum sectional shear
forces along the bridge (only half of the bridge model is shown due to symmetry)
3.7.3 Correlation of steel parameters
The coefficients of variation of steel strength parameters recommended by JCSS are
based on studies of individual bars. Although it is reasonable to assume that some
correlation exists between the variability of the bars used in one cross section the
extent and type of this correlation is debatable. Most conservative would be to assume
that the relative deviation of area is the same for all reinforcement bars and that all
2 6 10 14 18
2
4
6
8
10
Distance from outer bridge supports [m]
M/V
[m
]
at Vmax
(C25, l=0.05, b
tot=7b
w)
at Vmax
(C45, l=2.0, b
tot=b
w)
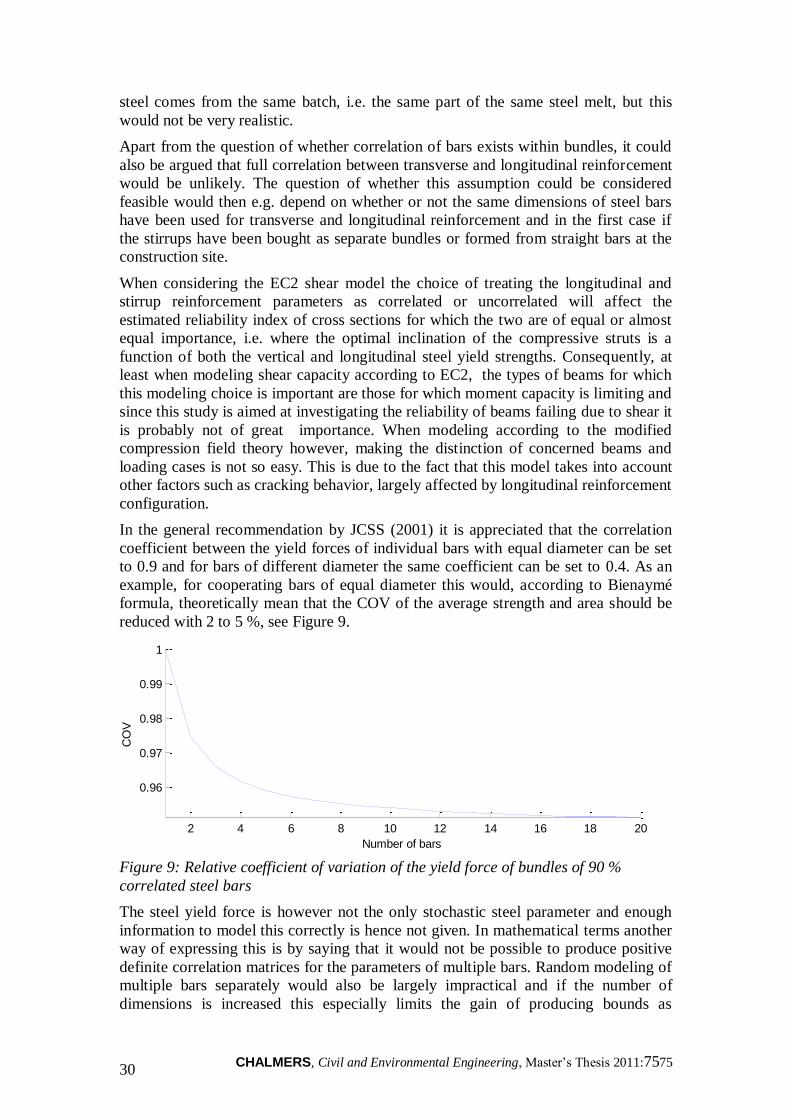
CHALMERS, Civil and Environmental Engineering, Master’s Thesis 2011:7575 30
steel comes from the same batch, i.e. the same part of the same steel melt, but this
would not be very realistic.
Apart from the question of whether correlation of bars exists within bundles, it could
also be argued that full correlation between transverse and longitudinal reinforcement
would be unlikely. The question of whether this assumption could be considered
feasible would then e.g. depend on whether or not the same dimensions of steel bars
have been used for transverse and longitudinal reinforcement and in the first case if
the stirrups have been bought as separate bundles or formed from straight bars at the
construction site.
When considering the EC2 shear model the choice of treating the longitudinal and
stirrup reinforcement parameters as correlated or uncorrelated will affect the
estimated reliability index of cross sections for which the two are of equal or almost
equal importance, i.e. where the optimal inclination of the compressive struts is a
function of both the vertical and longitudinal steel yield strengths. Consequently, at
least when modeling shear capacity according to EC2, the types of beams for which
this modeling choice is important are those for which moment capacity is limiting and
since this study is aimed at investigating the reliability of beams failing due to shear it
is probably not of great importance. When modeling according to the modified
compression field theory however, making the distinction of concerned beams and
loading cases is not so easy. This is due to the fact that this model takes into account
other factors such as cracking behavior, largely affected by longitudinal reinforcement
configuration.
In the general recommendation by JCSS (2001) it is appreciated that the correlation
coefficient between the yield forces of individual bars with equal diameter can be set
to 0.9 and for bars of different diameter the same coefficient can be set to 0.4. As an
example, for cooperating bars of equal diameter this would, according to Bienaymé
formula, theoretically mean that the COV of the average strength and area should be
reduced with 2 to 5 %, see Figure 9.
Figure 9: Relative coefficient of variation of the yield force of bundles of 90 %
correlated steel bars
The steel yield force is however not the only stochastic steel parameter and enough
information to model this correctly is hence not given. In mathematical terms another
way of expressing this is by saying that it would not be possible to produce positive
definite correlation matrices for the parameters of multiple bars. Random modeling of
multiple bars separately would also be largely impractical and if the number of
dimensions is increased this especially limits the gain of producing bounds as
2 4 6 8 10 12 14 16 18 20
0.96
0.97
0.98
0.99
1
Number of bars
CO
V
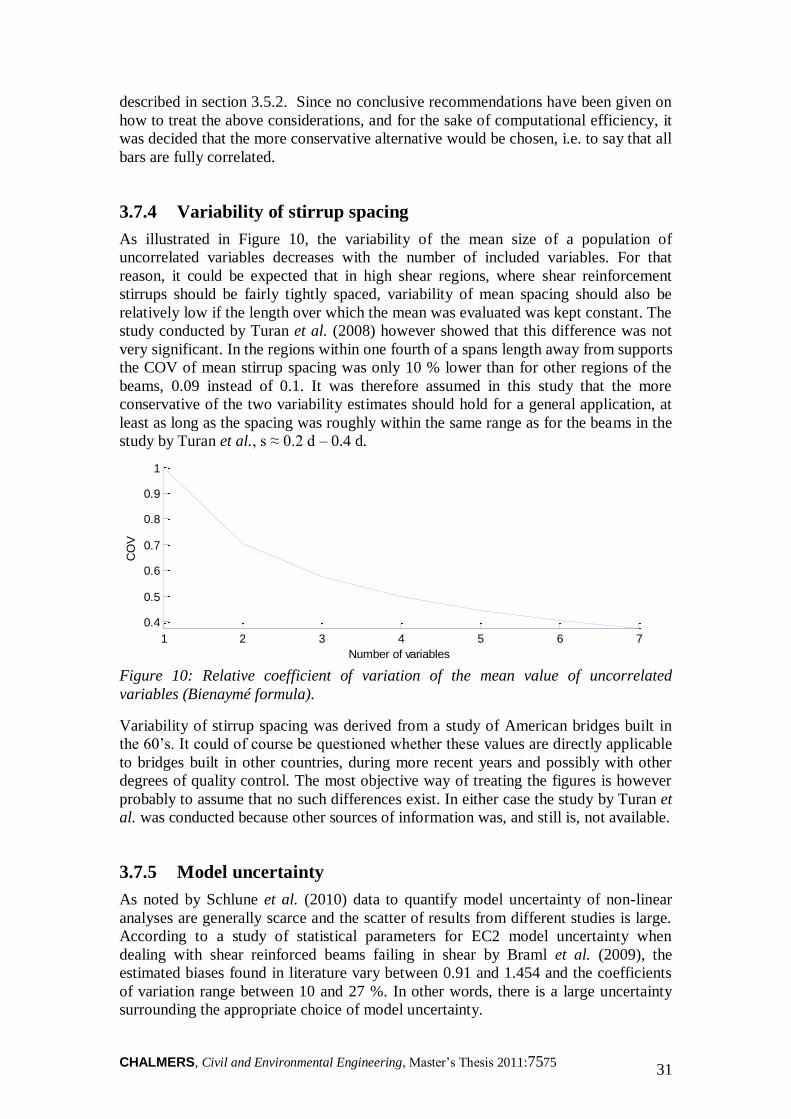
CHALMERS, Civil and Environmental Engineering, Master’s Thesis 2011:7575 31
described in section 3.5.2. Since no conclusive recommendations have been given on
how to treat the above considerations, and for the sake of computational efficiency, it
was decided that the more conservative alternative would be chosen, i.e. to say that all
bars are fully correlated.
3.7.4 Variability of stirrup spacing
As illustrated in Figure 10, the variability of the mean size of a population of
uncorrelated variables decreases with the number of included variables. For that
reason, it could be expected that in high shear regions, where shear reinforcement
stirrups should be fairly tightly spaced, variability of mean spacing should also be
relatively low if the length over which the mean was evaluated was kept constant. The
study conducted by Turan et al. (2008) however showed that this difference was not
very significant. In the regions within one fourth of a spans length away from supports
the COV of mean stirrup spacing was only 10 % lower than for other regions of the
beams, 0.09 instead of 0.1. It was therefore assumed in this study that the more
conservative of the two variability estimates should hold for a general application, at
least as long as the spacing was roughly within the same range as for the beams in the
study by Turan et al., s ≈ 0.2 d – 0.4 d.
Figure 10: Relative coefficient of variation of the mean value of uncorrelated
variables (Bienaymé formula).
Variability of stirrup spacing was derived from a study of American bridges built in
the 60’s. It could of course be questioned whether these values are directly applicable
to bridges built in other countries, during more recent years and possibly with other
degrees of quality control. The most objective way of treating the figures is however
probably to assume that no such differences exist. In either case the study by Turan et
al. was conducted because other sources of information was, and still is, not available.
3.7.5 Model uncertainty
As noted by Schlune et al. (2010) data to quantify model uncertainty of non-linear
analyses are generally scarce and the scatter of results from different studies is large.
According to a study of statistical parameters for EC2 model uncertainty when
dealing with shear reinforced beams failing in shear by Braml et al. (2009), the
estimated biases found in literature vary between 0.91 and 1.454 and the coefficients
of variation range between 10 and 27 %. In other words, there is a large uncertainty
surrounding the appropriate choice of model uncertainty.
1 2 3 4 5 6 7
0.4
0.5
0.6
0.7
0.8
0.9
1
Number of variables
CO
V
CHALMERS, Civil and Environmental Engineering, Master’s Thesis 2011:7575 32
Also, as mentioned earlier, it is essential to note that the reaction moment and shear
force arising in a cross section come as result of the same stress distribution, they are
not separate functions, and they should and cannot be treated independently. It is
therefore not straightforward to define model uncertainties as being exclusively
representative for either moment or shear capacity. One example of potential
problems related to this issue is for instance given in the report by Bohigas (2002) in
which it is stated that all the beams used to establish the estimate of model uncertainty
failed in shear. Exactly where the line was drawn between moment and shear failure
was however not defined.
It seems fairly clear that the model uncertainty is the largest factor governing the
reliability of strength estimates. Therefore, it is also reasonable that the largest portion
of efforts should be placed on defining and estimating this variable. It does not
however make it less important to establish the other parts of the probabilistic model.
In this perspective, Faber (2007) makes the fundamental point: ”Only if reliability
assessments are performed on a standardized basis is it possible to compare reliability
analysis results. Furthermore, only in this case is it possible to compare results with
given requirements to the minimum acceptable reliability.”
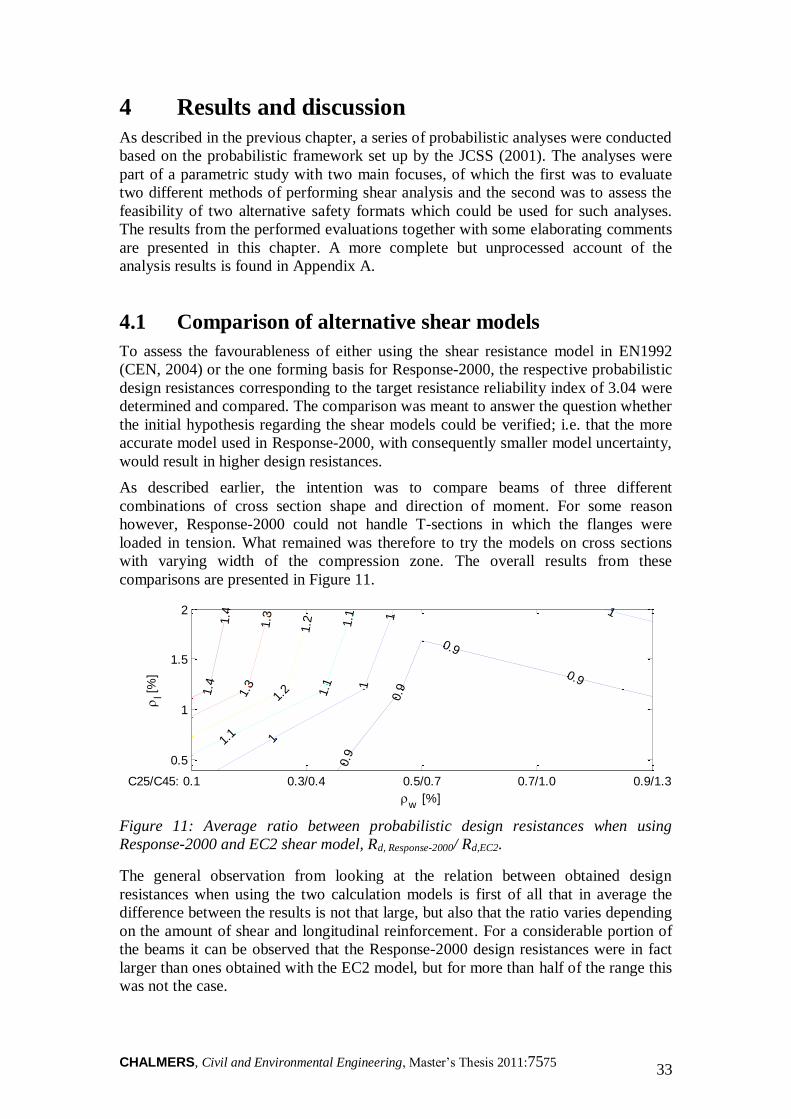
CHALMERS, Civil and Environmental Engineering, Master’s Thesis 2011:7575 33
4 Results and discussion
As described in the previous chapter, a series of probabilistic analyses were conducted
based on the probabilistic framework set up by the JCSS (2001). The analyses were
part of a parametric study with two main focuses, of which the first was to evaluate
two different methods of performing shear analysis and the second was to assess the
feasibility of two alternative safety formats which could be used for such analyses.
The results from the performed evaluations together with some elaborating comments
are presented in this chapter. A more complete but unprocessed account of the
analysis results is found in Appendix A.
4.1 Comparison of alternative shear models
To assess the favourableness of either using the shear resistance model in EN1992
(CEN, 2004) or the one forming basis for Response-2000, the respective probabilistic
design resistances corresponding to the target resistance reliability index of 3.04 were
determined and compared. The comparison was meant to answer the question whether
the initial hypothesis regarding the shear models could be verified; i.e. that the more
accurate model used in Response-2000, with consequently smaller model uncertainty,
would result in higher design resistances.
As described earlier, the intention was to compare beams of three different
combinations of cross section shape and direction of moment. For some reason
however, Response-2000 could not handle T-sections in which the flanges were
loaded in tension. What remained was therefore to try the models on cross sections
with varying width of the compression zone. The overall results from these
comparisons are presented in Figure 11.
Figure 11: Average ratio between probabilistic design resistances when using
Response-2000 and EC2 shear model, Rd, Response-2000/ Rd,EC2.
The general observation from looking at the relation between obtained design
resistances when using the two calculation models is first of all that in average the
difference between the results is not that large, but also that the ratio varies depending
on the amount of shear and longitudinal reinforcement. For a considerable portion of
the beams it can be observed that the Response-2000 design resistances were in fact
larger than ones obtained with the EC2 model, but for more than half of the range this
was not the case.
w
[%]
C25/C45:
l [
%]
0.9
0.9
0.9
0.9
1
1
1
1
1.1
1.1
1.1
1.2
1.2
1.3
1.3
1.4
1.4
0.1 0.3/0.4 0.5/0.7 0.7/1.0 0.9/1.3
0.5
1
1.5
2
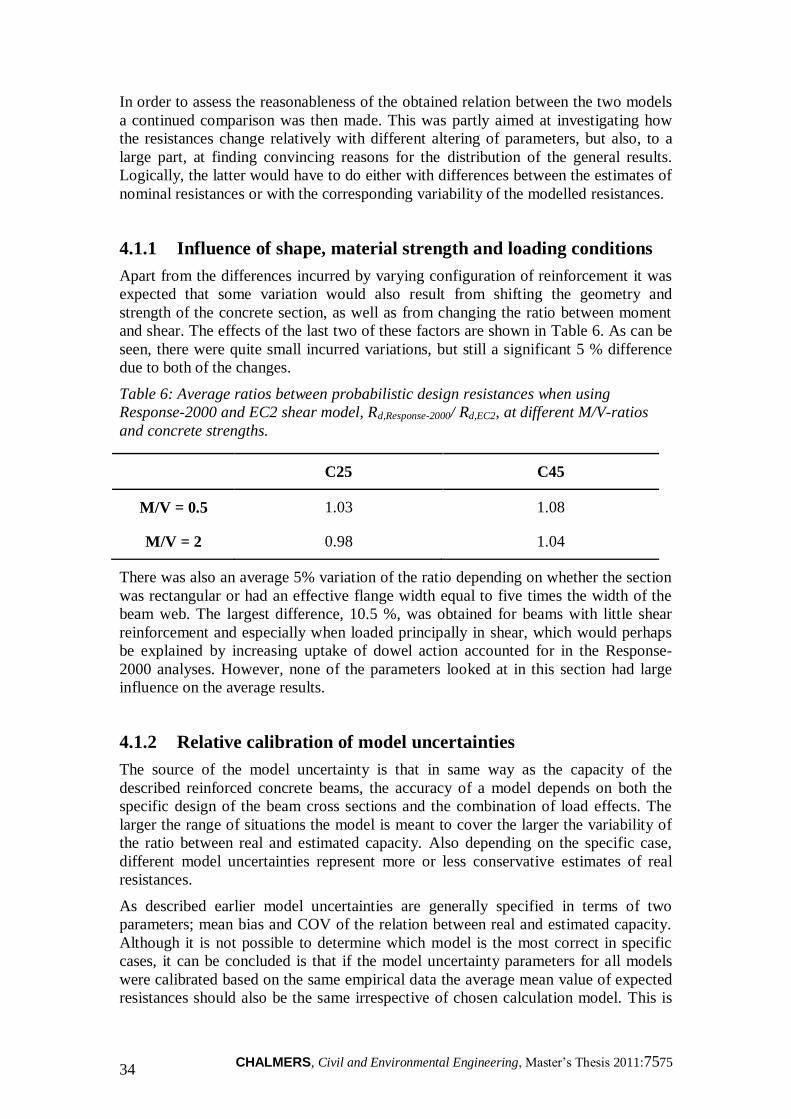
CHALMERS, Civil and Environmental Engineering, Master’s Thesis 2011:7575 34
In order to assess the reasonableness of the obtained relation between the two models
a continued comparison was then made. This was partly aimed at investigating how
the resistances change relatively with different altering of parameters, but also, to a
large part, at finding convincing reasons for the distribution of the general results.
Logically, the latter would have to do either with differences between the estimates of
nominal resistances or with the corresponding variability of the modelled resistances.
4.1.1 Influence of shape, material strength and loading conditions
Apart from the differences incurred by varying configuration of reinforcement it was
expected that some variation would also result from shifting the geometry and
strength of the concrete section, as well as from changing the ratio between moment
and shear. The effects of the last two of these factors are shown in Table 6. As can be
seen, there were quite small incurred variations, but still a significant 5 % difference
due to both of the changes.
Table 6: Average ratios between probabilistic design resistances when using
Response-2000 and EC2 shear model, Rd,Response-2000/ Rd,EC2, at different M/V-ratios
and concrete strengths.
C25 C45
M/V = 0.5 1.03 1.08
M/V = 2 0.98 1.04
There was also an average 5% variation of the ratio depending on whether the section
was rectangular or had an effective flange width equal to five times the width of the
beam web. The largest difference, 10.5 %, was obtained for beams with little shear
reinforcement and especially when loaded principally in shear, which would perhaps
be explained by increasing uptake of dowel action accounted for in the Response-
2000 analyses. However, none of the parameters looked at in this section had large
influence on the average results.
4.1.2 Relative calibration of model uncertainties
The source of the model uncertainty is that in same way as the capacity of the
described reinforced concrete beams, the accuracy of a model depends on both the
specific design of the beam cross sections and the combination of load effects. The
larger the range of situations the model is meant to cover the larger the variability of
the ratio between real and estimated capacity. Also depending on the specific case,
different model uncertainties represent more or less conservative estimates of real
resistances.
As described earlier model uncertainties are generally specified in terms of two
parameters; mean bias and COV of the relation between real and estimated capacity.
Although it is not possible to determine which model is the most correct in specific
cases, it can be concluded is that if the model uncertainty parameters for all models
were calibrated based on the same empirical data the average mean value of expected
resistances should also be the same irrespective of chosen calculation model. This is
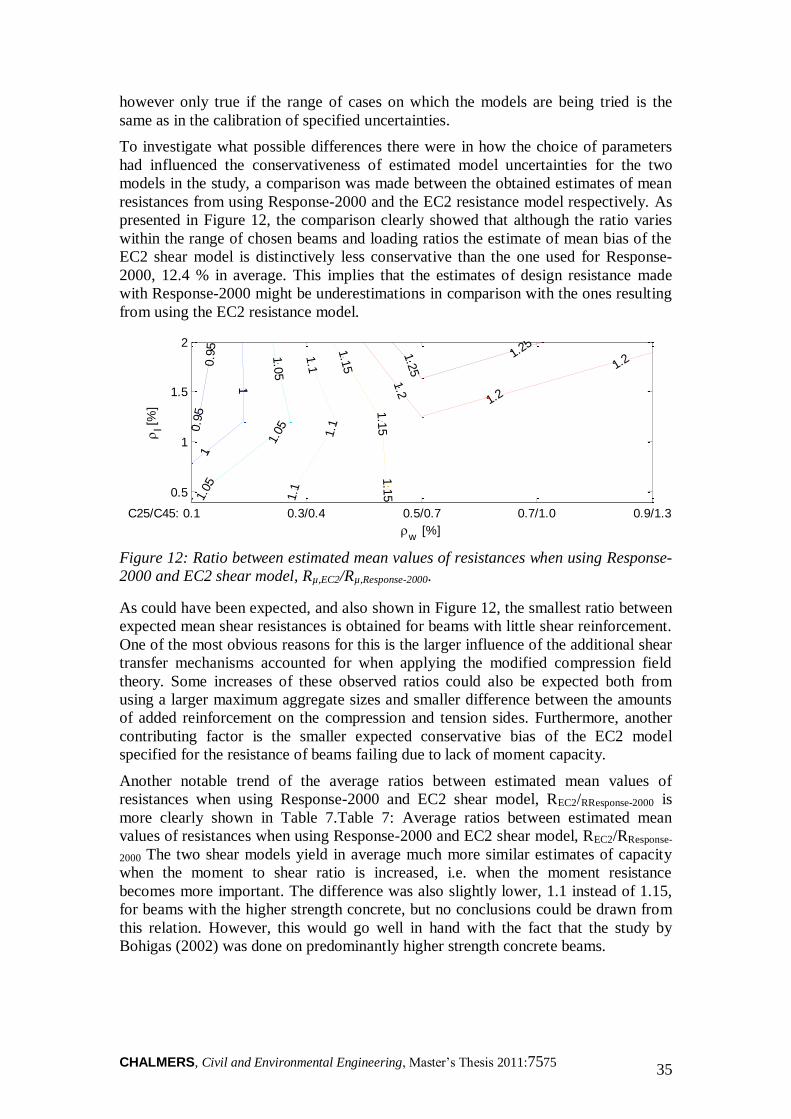
CHALMERS, Civil and Environmental Engineering, Master’s Thesis 2011:7575 35
however only true if the range of cases on which the models are being tried is the
same as in the calibration of specified uncertainties.
To investigate what possible differences there were in how the choice of parameters
had influenced the conservativeness of estimated model uncertainties for the two
models in the study, a comparison was made between the obtained estimates of mean
resistances from using Response-2000 and the EC2 resistance model respectively. As
presented in Figure 12, the comparison clearly showed that although the ratio varies
within the range of chosen beams and loading ratios the estimate of mean bias of the
EC2 shear model is distinctively less conservative than the one used for Response-
2000, 12.4 % in average. This implies that the estimates of design resistance made
with Response-2000 might be underestimations in comparison with the ones resulting
from using the EC2 resistance model.
Figure 12: Ratio between estimated mean values of resistances when using Response-
2000 and EC2 shear model, Rµ,EC2/Rµ,Response-2000.
As could have been expected, and also shown in Figure 12, the smallest ratio between
expected mean shear resistances is obtained for beams with little shear reinforcement.
One of the most obvious reasons for this is the larger influence of the additional shear
transfer mechanisms accounted for when applying the modified compression field
theory. Some increases of these observed ratios could also be expected both from
using a larger maximum aggregate sizes and smaller difference between the amounts
of added reinforcement on the compression and tension sides. Furthermore, another
contributing factor is the smaller expected conservative bias of the EC2 model
specified for the resistance of beams failing due to lack of moment capacity.
Another notable trend of the average ratios between estimated mean values of
resistances when using Response-2000 and EC2 shear model, REC2/RResponse-2000 is
more clearly shown in Table 7.Table 7: Average ratios between estimated mean
values of resistances when using Response-2000 and EC2 shear model, REC2/RResponse-
2000 The two shear models yield in average much more similar estimates of capacity
when the moment to shear ratio is increased, i.e. when the moment resistance
becomes more important. The difference was also slightly lower, 1.1 instead of 1.15,
for beams with the higher strength concrete, but no conclusions could be drawn from
this relation. However, this would go well in hand with the fact that the study by
Bohigas (2002) was done on predominantly higher strength concrete beams.
w
[%]
C25/C45:
l [
%]
0.9
5
0.9
5
1
1
1.0
5
1.05
1.05
1.1
1.1
1.1
1.1
5
1.1
51.1
51.2
1.2
1.2
1.2
5
1.25
0.1 0.3/0.4 0.5/0.7 0.7/1.0 0.9/1.3
0.5
1
1.5
2
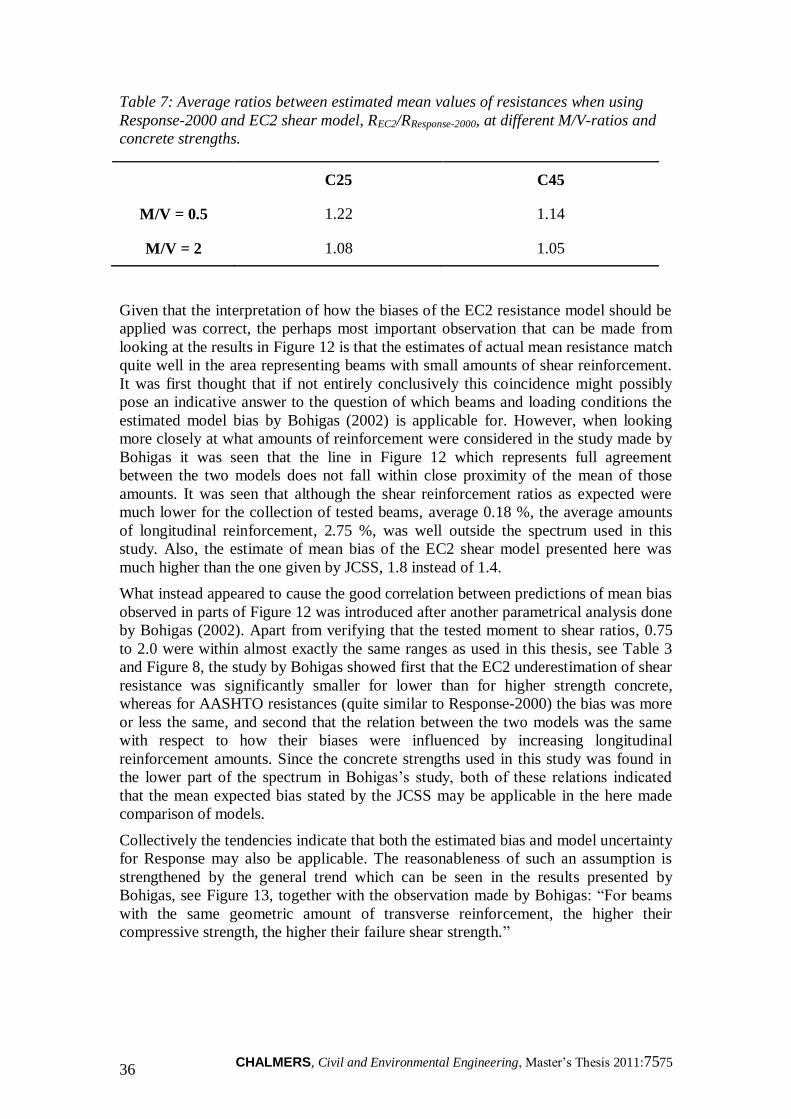
CHALMERS, Civil and Environmental Engineering, Master’s Thesis 2011:7575 36
Table 7: Average ratios between estimated mean values of resistances when using
Response-2000 and EC2 shear model, REC2/RResponse-2000, at different M/V-ratios and
concrete strengths.
C25 C45
M/V = 0.5 1.22 1.14
M/V = 2 1.08 1.05
Given that the interpretation of how the biases of the EC2 resistance model should be
applied was correct, the perhaps most important observation that can be made from
looking at the results in Figure 12 is that the estimates of actual mean resistance match
quite well in the area representing beams with small amounts of shear reinforcement.
It was first thought that if not entirely conclusively this coincidence might possibly
pose an indicative answer to the question of which beams and loading conditions the
estimated model bias by Bohigas (2002) is applicable for. However, when looking
more closely at what amounts of reinforcement were considered in the study made by
Bohigas it was seen that the line in Figure 12 which represents full agreement
between the two models does not fall within close proximity of the mean of those
amounts. It was seen that although the shear reinforcement ratios as expected were
much lower for the collection of tested beams, average 0.18 %, the average amounts
of longitudinal reinforcement, 2.75 %, was well outside the spectrum used in this
study. Also, the estimate of mean bias of the EC2 shear model presented here was
much higher than the one given by JCSS, 1.8 instead of 1.4.
What instead appeared to cause the good correlation between predictions of mean bias
observed in parts of Figure 12 was introduced after another parametrical analysis done
by Bohigas (2002). Apart from verifying that the tested moment to shear ratios, 0.75
to 2.0 were within almost exactly the same ranges as used in this thesis, see Table 3
and Figure 8, the study by Bohigas showed first that the EC2 underestimation of shear
resistance was significantly smaller for lower than for higher strength concrete,
whereas for AASHTO resistances (quite similar to Response-2000) the bias was more
or less the same, and second that the relation between the two models was the same
with respect to how their biases were influenced by increasing longitudinal
reinforcement amounts. Since the concrete strengths used in this study was found in
the lower part of the spectrum in Bohigas’s study, both of these relations indicated
that the mean expected bias stated by the JCSS may be applicable in the here made
comparison of models.
Collectively the tendencies indicate that both the estimated bias and model uncertainty
for Response may also be applicable. The reasonableness of such an assumption is
strengthened by the general trend which can be seen in the results presented by
Bohigas, see Figure 13, together with the observation made by Bohigas: “For beams
with the same geometric amount of transverse reinforcement, the higher their
compressive strength, the higher their failure shear strength.”
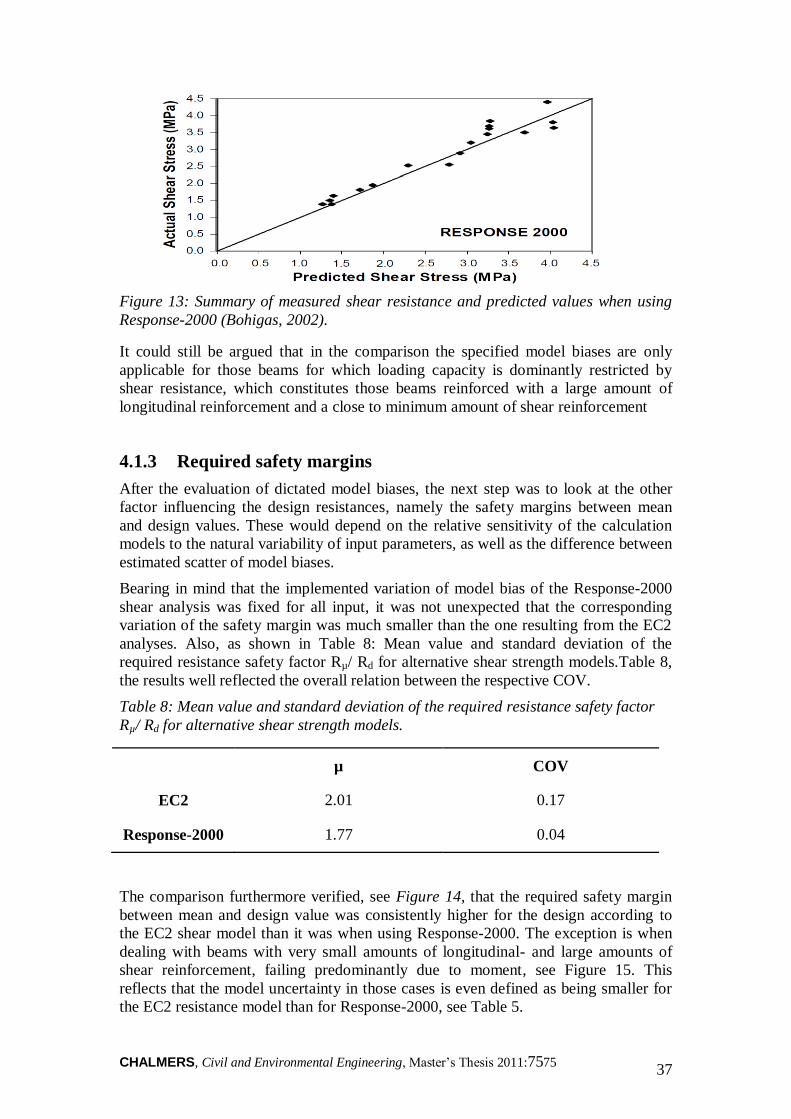
CHALMERS, Civil and Environmental Engineering, Master’s Thesis 2011:7575 37
Figure 13: Summary of measured shear resistance and predicted values when using
Response-2000 (Bohigas, 2002).
It could still be argued that in the comparison the specified model biases are only
applicable for those beams for which loading capacity is dominantly restricted by
shear resistance, which constitutes those beams reinforced with a large amount of
longitudinal reinforcement and a close to minimum amount of shear reinforcement
4.1.3 Required safety margins
After the evaluation of dictated model biases, the next step was to look at the other
factor influencing the design resistances, namely the safety margins between mean
and design values. These would depend on the relative sensitivity of the calculation
models to the natural variability of input parameters, as well as the difference between
estimated scatter of model biases.
Bearing in mind that the implemented variation of model bias of the Response-2000
shear analysis was fixed for all input, it was not unexpected that the corresponding
variation of the safety margin was much smaller than the one resulting from the EC2
analyses. Also, as shown in Table 8: Mean value and standard deviation of the
required resistance safety factor Rµ/ Rd for alternative shear strength models.Table 8,
the results well reflected the overall relation between the respective COV.
Table 8: Mean value and standard deviation of the required resistance safety factor
Rµ/ Rd for alternative shear strength models.
µ COV
EC2 2.01 0.17
Response-2000 1.77 0.04
The comparison furthermore verified, see Figure 14, that the required safety margin
between mean and design value was consistently higher for the design according to
the EC2 shear model than it was when using Response-2000. The exception is when
dealing with beams with very small amounts of longitudinal- and large amounts of
shear reinforcement, failing predominantly due to moment, see Figure 15. This
reflects that the model uncertainty in those cases is even defined as being smaller for
the EC2 resistance model than for Response-2000, see Table 5.
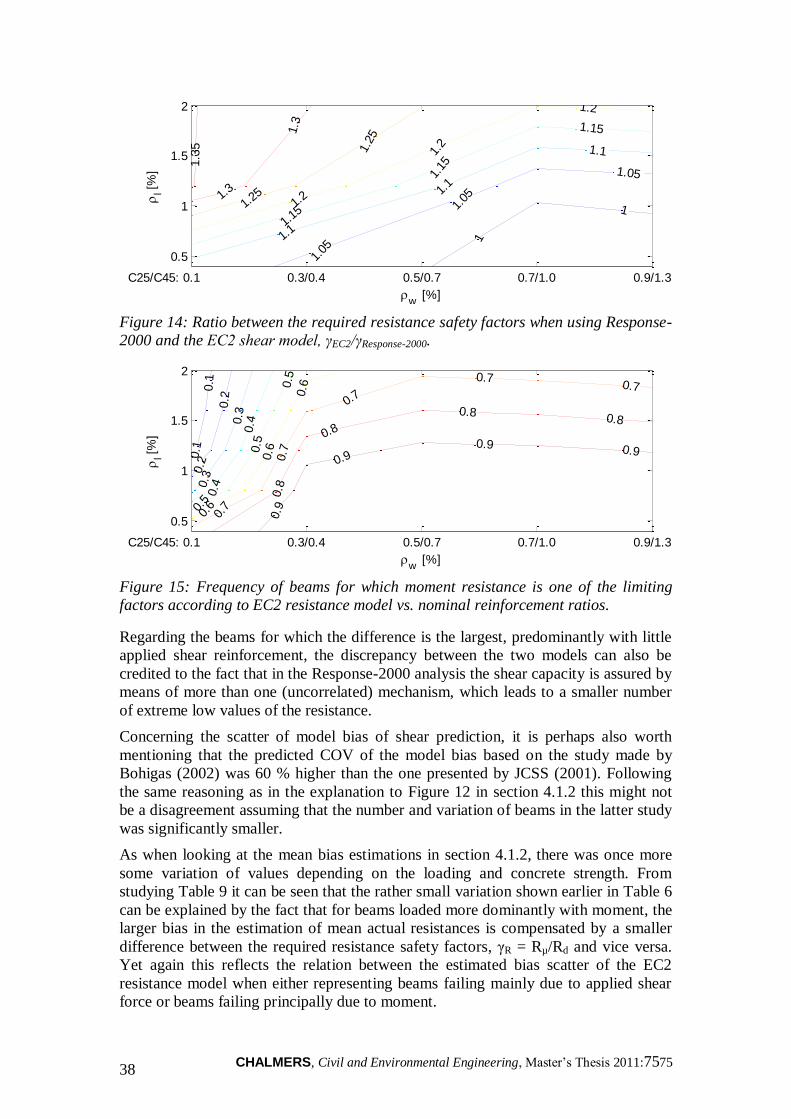
CHALMERS, Civil and Environmental Engineering, Master’s Thesis 2011:7575 38
Figure 14: Ratio between the required resistance safety factors when using Response-
2000 and the EC2 shear model, γEC2/γResponse-2000.
Figure 15: Frequency of beams for which moment resistance is one of the limiting
factors according to EC2 resistance model vs. nominal reinforcement ratios.
Regarding the beams for which the difference is the largest, predominantly with little
applied shear reinforcement, the discrepancy between the two models can also be
credited to the fact that in the Response-2000 analysis the shear capacity is assured by
means of more than one (uncorrelated) mechanism, which leads to a smaller number
of extreme low values of the resistance.
Concerning the scatter of model bias of shear prediction, it is perhaps also worth
mentioning that the predicted COV of the model bias based on the study made by
Bohigas (2002) was 60 % higher than the one presented by JCSS (2001). Following
the same reasoning as in the explanation to Figure 12 in section 4.1.2 this might not
be a disagreement assuming that the number and variation of beams in the latter study
was significantly smaller.
As when looking at the mean bias estimations in section 4.1.2, there was once more
some variation of values depending on the loading and concrete strength. From
studying Table 9 it can be seen that the rather small variation shown earlier in Table 6
can be explained by the fact that for beams loaded more dominantly with moment, the
larger bias in the estimation of mean actual resistances is compensated by a smaller
difference between the required resistance safety factors, γR = Rµ/Rd and vice versa.
Yet again this reflects the relation between the estimated bias scatter of the EC2
resistance model when either representing beams failing mainly due to applied shear
force or beams failing principally due to moment.
w
[%]
C25/C45:
l [
%]
1
1
1.05
1.05
1.05
1.1
1.1
1.1
1.15
1.15
1.15
1.2
1.2
1.2
1.25
1.25
1.3
1.3
1.3
5
0.1 0.3/0.4 0.5/0.7 0.7/1.0 0.9/1.3
0.5
1
1.5
2
w
[%]
C25/C45:
l [
%]
0.1
0.1
0.2
0.2
0.3
0.3
0.4
0.4
0.5
0.5
0.5
0.6
0.6
0.6
0.7
0.7
0.7
0.70.7
0.8
0.8
0.8 0.8
0.9
0.90.9 0.9
0.1 0.3/0.4 0.5/0.7 0.7/1.0 0.9/1.3
0.5
1
1.5
2
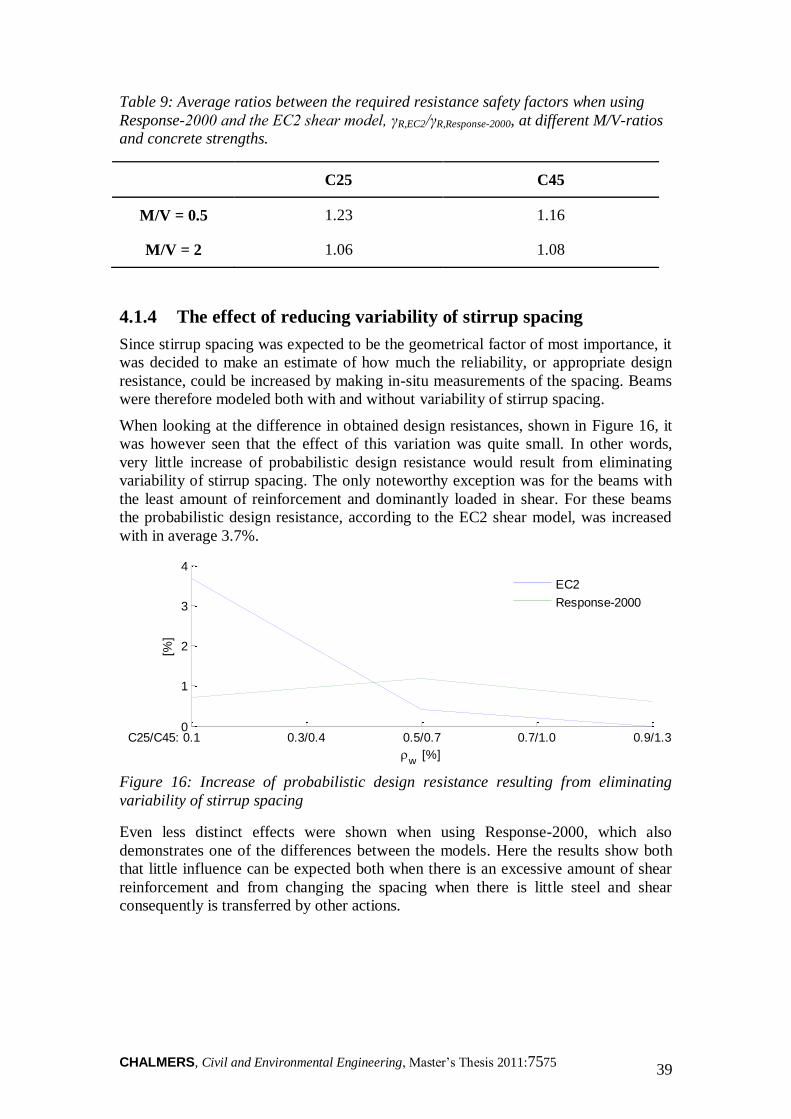
CHALMERS, Civil and Environmental Engineering, Master’s Thesis 2011:7575 39
Table 9: Average ratios between the required resistance safety factors when using
Response-2000 and the EC2 shear model, γR,EC2/γR,Response-2000, at different M/V-ratios
and concrete strengths.
C25 C45
M/V = 0.5 1.23 1.16
M/V = 2 1.06 1.08
4.1.4 The effect of reducing variability of stirrup spacing
Since stirrup spacing was expected to be the geometrical factor of most importance, it
was decided to make an estimate of how much the reliability, or appropriate design
resistance, could be increased by making in-situ measurements of the spacing. Beams
were therefore modeled both with and without variability of stirrup spacing.
When looking at the difference in obtained design resistances, shown in Figure 16, it
was however seen that the effect of this variation was quite small. In other words,
very little increase of probabilistic design resistance would result from eliminating
variability of stirrup spacing. The only noteworthy exception was for the beams with
the least amount of reinforcement and dominantly loaded in shear. For these beams
the probabilistic design resistance, according to the EC2 shear model, was increased
with in average 3.7%.
Figure 16: Increase of probabilistic design resistance resulting from eliminating
variability of stirrup spacing
Even less distinct effects were shown when using Response-2000, which also
demonstrates one of the differences between the models. Here the results show both
that little influence can be expected both when there is an excessive amount of shear
reinforcement and from changing the spacing when there is little steel and shear
consequently is transferred by other actions.
w
[%]
C25/C45:
[%]
0.1 0.3/0.4 0.5/0.7 0.7/1.0 0.9/1.30
1
2
3
4
EC2
Response-2000
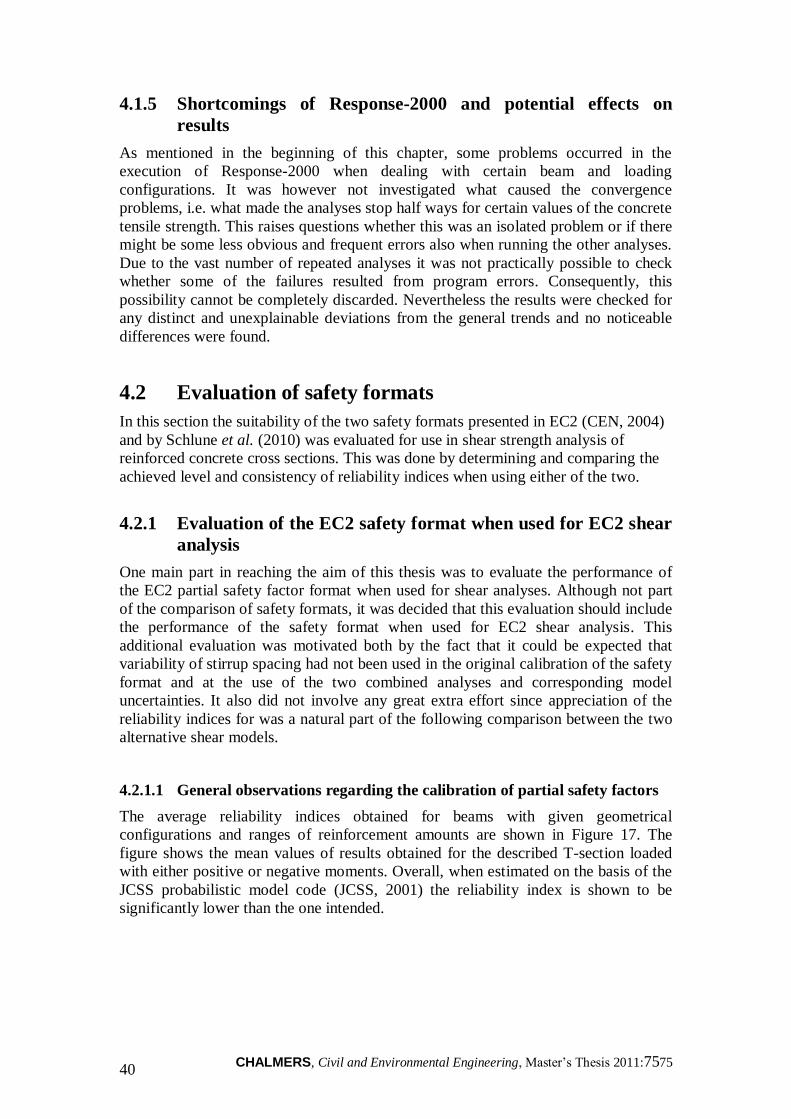
CHALMERS, Civil and Environmental Engineering, Master’s Thesis 2011:7575 40
4.1.5 Shortcomings of Response-2000 and potential effects on
results
As mentioned in the beginning of this chapter, some problems occurred in the
execution of Response-2000 when dealing with certain beam and loading
configurations. It was however not investigated what caused the convergence
problems, i.e. what made the analyses stop half ways for certain values of the concrete
tensile strength. This raises questions whether this was an isolated problem or if there
might be some less obvious and frequent errors also when running the other analyses.
Due to the vast number of repeated analyses it was not practically possible to check
whether some of the failures resulted from program errors. Consequently, this
possibility cannot be completely discarded. Nevertheless the results were checked for
any distinct and unexplainable deviations from the general trends and no noticeable
differences were found.
4.2 Evaluation of safety formats
In this section the suitability of the two safety formats presented in EC2 (CEN, 2004)
and by Schlune et al. (2010) was evaluated for use in shear strength analysis of
reinforced concrete cross sections. This was done by determining and comparing the
achieved level and consistency of reliability indices when using either of the two.
4.2.1 Evaluation of the EC2 safety format when used for EC2 shear
analysis
One main part in reaching the aim of this thesis was to evaluate the performance of
the EC2 partial safety factor format when used for shear analyses. Although not part
of the comparison of safety formats, it was decided that this evaluation should include
the performance of the safety format when used for EC2 shear analysis. This
additional evaluation was motivated both by the fact that it could be expected that
variability of stirrup spacing had not been used in the original calibration of the safety
format and at the use of the two combined analyses and corresponding model
uncertainties. It also did not involve any great extra effort since appreciation of the
reliability indices for was a natural part of the following comparison between the two
alternative shear models.
4.2.1.1 General observations regarding the calibration of partial safety factors
The average reliability indices obtained for beams with given geometrical
configurations and ranges of reinforcement amounts are shown in Figure 17. The
figure shows the mean values of results obtained for the described T-section loaded
with either positive or negative moments. Overall, when estimated on the basis of the
JCSS probabilistic model code (JCSS, 2001) the reliability index is shown to be
significantly lower than the one intended.
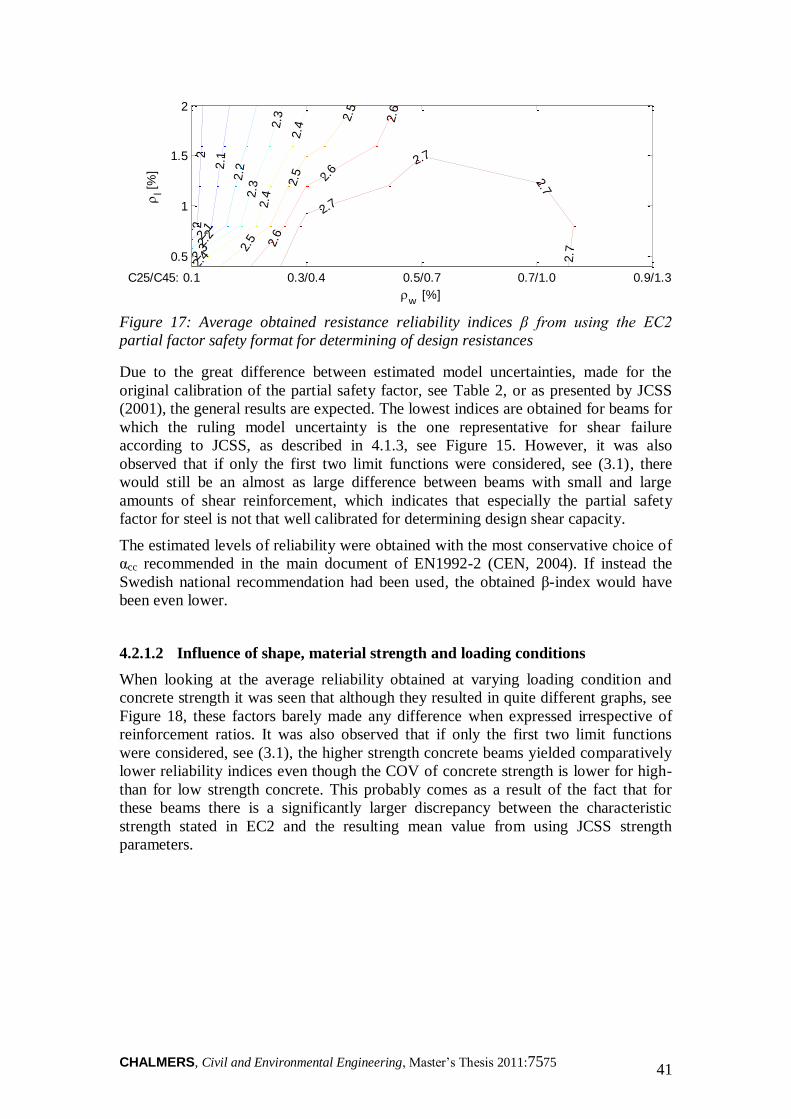
CHALMERS, Civil and Environmental Engineering, Master’s Thesis 2011:7575 41
Figure 17: Average obtained resistance reliability indices β from using the EC2
partial factor safety format for determining of design resistances
Due to the great difference between estimated model uncertainties, made for the
original calibration of the partial safety factor, see Table 2, or as presented by JCSS
(2001), the general results are expected. The lowest indices are obtained for beams for
which the ruling model uncertainty is the one representative for shear failure
according to JCSS, as described in 4.1.3, see Figure 15. However, it was also
observed that if only the first two limit functions were considered, see (3.1), there
would still be an almost as large difference between beams with small and large
amounts of shear reinforcement, which indicates that especially the partial safety
factor for steel is not that well calibrated for determining design shear capacity.
The estimated levels of reliability were obtained with the most conservative choice of
αcc recommended in the main document of EN1992-2 (CEN, 2004). If instead the
Swedish national recommendation had been used, the obtained β-index would have
been even lower.
4.2.1.2 Influence of shape, material strength and loading conditions
When looking at the average reliability obtained at varying loading condition and
concrete strength it was seen that although they resulted in quite different graphs, see
Figure 18, these factors barely made any difference when expressed irrespective of
reinforcement ratios. It was also observed that if only the first two limit functions
were considered, see (3.1), the higher strength concrete beams yielded comparatively
lower reliability indices even though the COV of concrete strength is lower for high-
than for low strength concrete. This probably comes as a result of the fact that for
these beams there is a significantly larger discrepancy between the characteristic
strength stated in EC2 and the resulting mean value from using JCSS strength
parameters.
w
[%]
C25/C45:
l [
%]
22
2.1
2.1
2.2
2.2
2.3
2.3
2.3
2.4
2.4
2.4
2.5
2.5
2.5
2.6
2.6
2.6
2.7
2.7
2.7
2.7
0.1 0.3/0.4 0.5/0.7 0.7/1.0 0.9/1.3
0.5
1
1.5
2
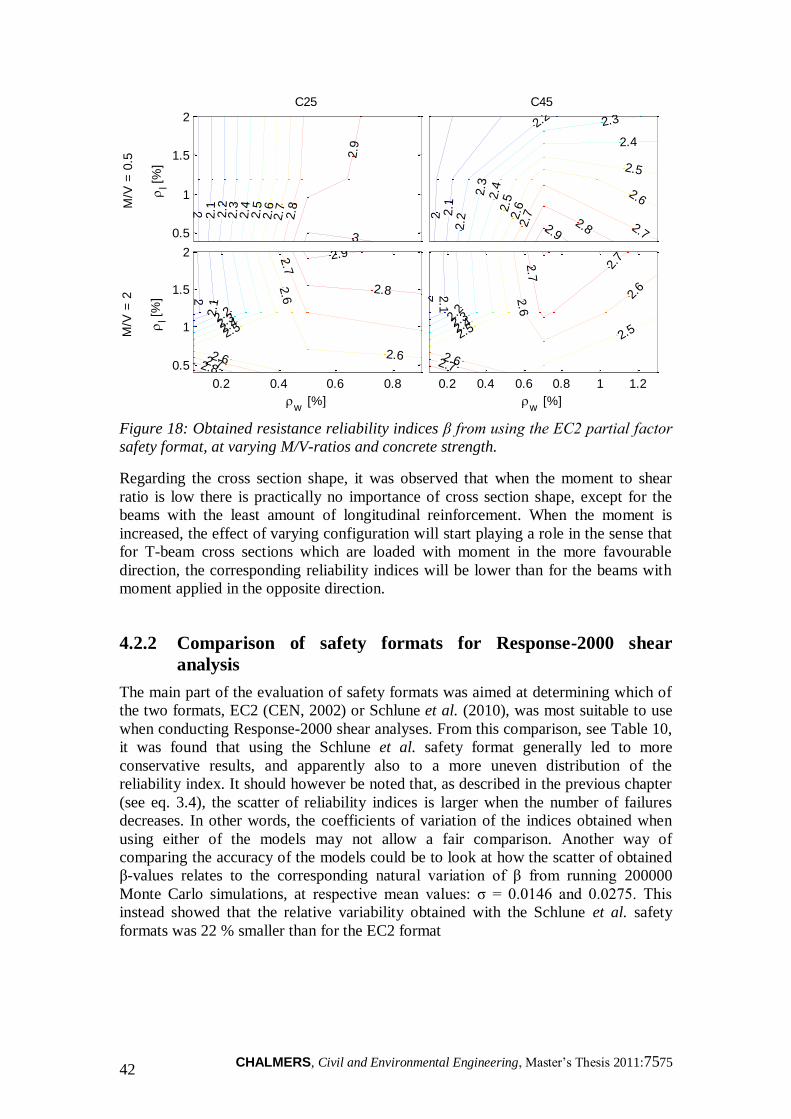
CHALMERS, Civil and Environmental Engineering, Master’s Thesis 2011:7575 42
Figure 18: Obtained resistance reliability indices β from using the EC2 partial factor
safety format, at varying M/V-ratios and concrete strength.
Regarding the cross section shape, it was observed that when the moment to shear
ratio is low there is practically no importance of cross section shape, except for the
beams with the least amount of longitudinal reinforcement. When the moment is
increased, the effect of varying configuration will start playing a role in the sense that
for T-beam cross sections which are loaded with moment in the more favourable
direction, the corresponding reliability indices will be lower than for the beams with
moment applied in the opposite direction.
4.2.2 Comparison of safety formats for Response-2000 shear
analysis
The main part of the evaluation of safety formats was aimed at determining which of
the two formats, EC2 (CEN, 2002) or Schlune et al. (2010), was most suitable to use
when conducting Response-2000 shear analyses. From this comparison, see Table 10,
it was found that using the Schlune et al. safety format generally led to more
conservative results, and apparently also to a more uneven distribution of the
reliability index. It should however be noted that, as described in the previous chapter
(see eq. 3.4), the scatter of reliability indices is larger when the number of failures
decreases. In other words, the coefficients of variation of the indices obtained when
using either of the models may not allow a fair comparison. Another way of
comparing the accuracy of the models could be to look at how the scatter of obtained
β-values relates to the corresponding natural variation of β from running 200000
Monte Carlo simulations, at respective mean values: σ = 0.0146 and 0.0275. This
instead showed that the relative variability obtained with the Schlune et al. safety
formats was 22 % smaller than for the EC2 format
M/V
= 0
.5
l [
%]
C25
2
2.1 2.2
2.3
2.4
2.5
2.6
2.7 2.8
2.9
30.5
1
1.5
2
w
[%]
M/V
= 2
l [
%] 2
2.1
2.22.32.42.5
2.6
2.62.6
2.7
2.7
2.8
2.8
2.9
0.2 0.4 0.6 0.8
0.5
1
1.5
2
C45
2 2.1
2.2
2.2
2.3
2.3
2.4
2.4
2.5
2.5
2.6
2.6
2.7
2.72.82.9
w
[%]
2
2.1
2.2
2.32.42.5 2.5
2.6
2.6
2.6
2.7 2.
7
2.7
0.2 0.4 0.6 0.8 1 1.2
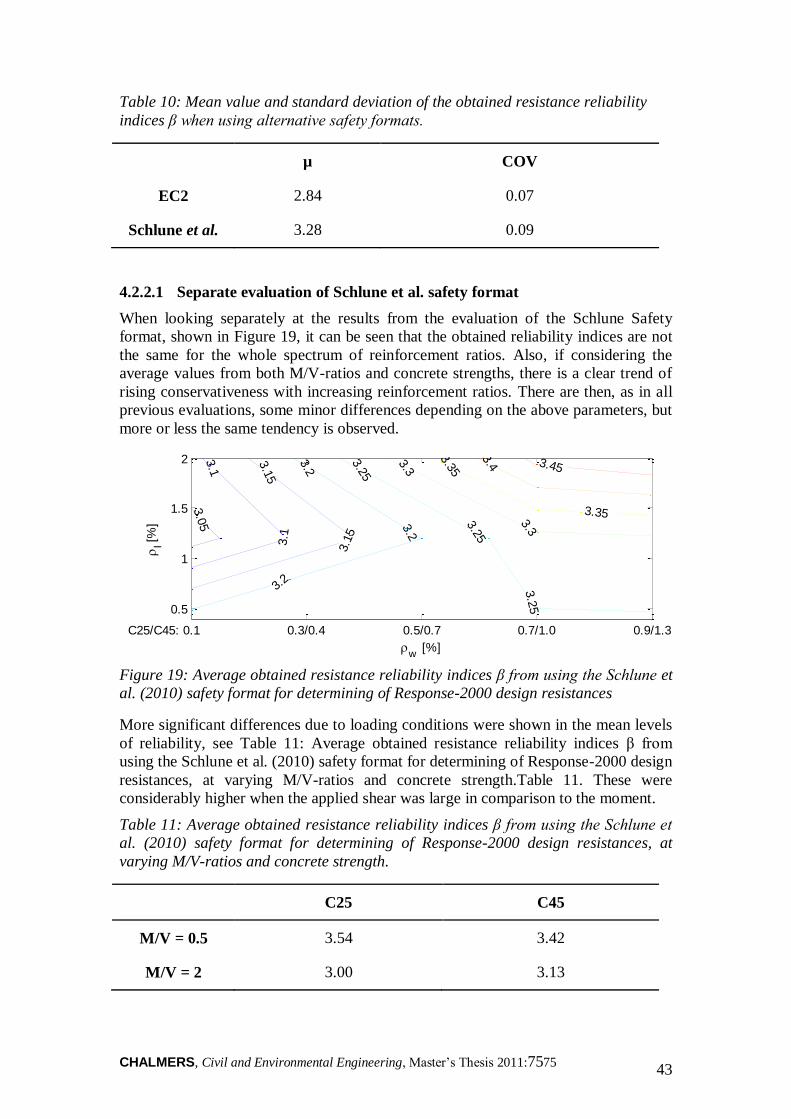
CHALMERS, Civil and Environmental Engineering, Master’s Thesis 2011:7575 43
Table 10: Mean value and standard deviation of the obtained resistance reliability
indices β when using alternative safety formats.
µ COV
EC2 2.84 0.07
Schlune et al. 3.28 0.09
4.2.2.1 Separate evaluation of Schlune et al. safety format
When looking separately at the results from the evaluation of the Schlune Safety
format, shown in Figure 19, it can be seen that the obtained reliability indices are not
the same for the whole spectrum of reinforcement ratios. Also, if considering the
average values from both M/V-ratios and concrete strengths, there is a clear trend of
rising conservativeness with increasing reinforcement ratios. There are then, as in all
previous evaluations, some minor differences depending on the above parameters, but
more or less the same tendency is observed.
Figure 19: Average obtained resistance reliability indices β from using the Schlune et
al. (2010) safety format for determining of Response-2000 design resistances
More significant differences due to loading conditions were shown in the mean levels
of reliability, see Table 11: Average obtained resistance reliability indices β from
using the Schlune et al. (2010) safety format for determining of Response-2000 design
resistances, at varying M/V-ratios and concrete strength.Table 11. These were
considerably higher when the applied shear was large in comparison to the moment.
Table 11: Average obtained resistance reliability indices β from using the Schlune et
al. (2010) safety format for determining of Response-2000 design resistances, at
varying M/V-ratios and concrete strength.
C25 C45
M/V = 0.5 3.54 3.42
M/V = 2 3.00 3.13
w
[%]
C25/C45:
l [
%]
3.0
53.1
3.1
3.1
5
3.1
5
3.2
3.2
3.2
3.25
3.25
3.2
5
3.3
3.3
3.35
3.35
3.4
3.4
3.45
0.1 0.3/0.4 0.5/0.7 0.7/1.0 0.9/1.3
0.5
1
1.5
2
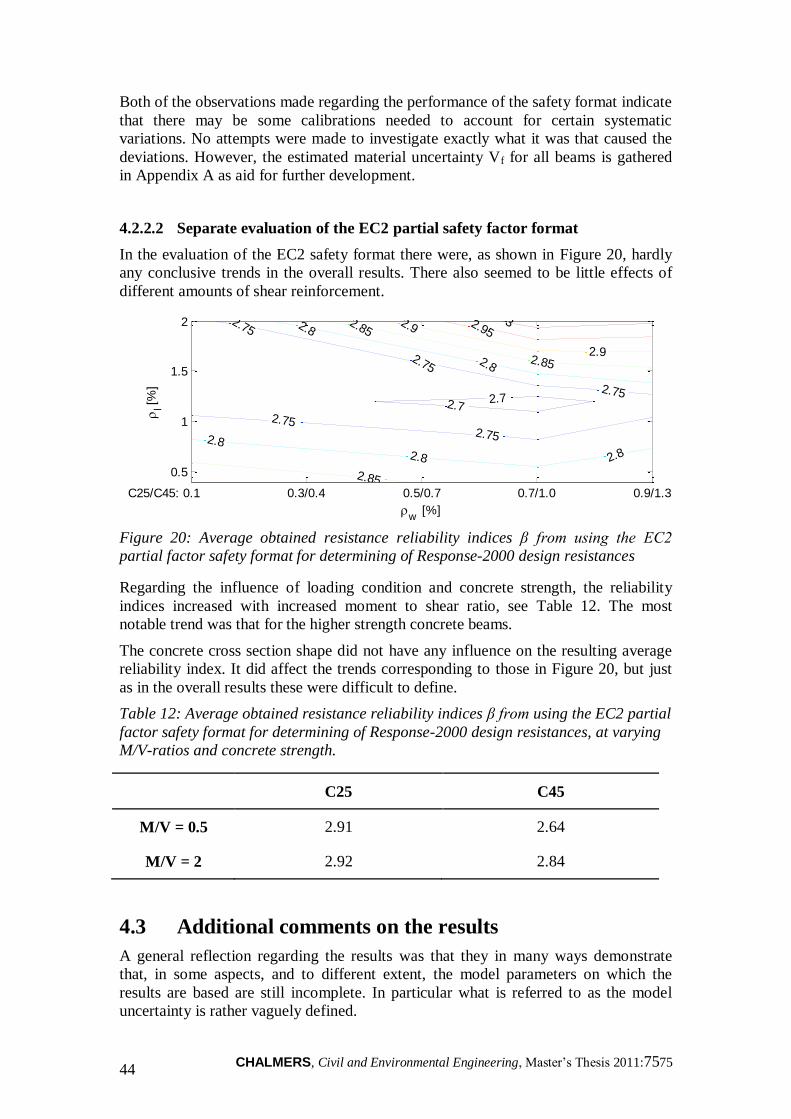
CHALMERS, Civil and Environmental Engineering, Master’s Thesis 2011:7575 44
Both of the observations made regarding the performance of the safety format indicate
that there may be some calibrations needed to account for certain systematic
variations. No attempts were made to investigate exactly what it was that caused the
deviations. However, the estimated material uncertainty Vf for all beams is gathered
in Appendix A as aid for further development.
4.2.2.2 Separate evaluation of the EC2 partial safety factor format
In the evaluation of the EC2 safety format there were, as shown in Figure 20, hardly
any conclusive trends in the overall results. There also seemed to be little effects of
different amounts of shear reinforcement.
Figure 20: Average obtained resistance reliability indices β from using the EC2
partial factor safety format for determining of Response-2000 design resistances
Regarding the influence of loading condition and concrete strength, the reliability
indices increased with increased moment to shear ratio, see Table 12. The most
notable trend was that for the higher strength concrete beams.
The concrete cross section shape did not have any influence on the resulting average
reliability index. It did affect the trends corresponding to those in Figure 20, but just
as in the overall results these were difficult to define.
Table 12: Average obtained resistance reliability indices β from using the EC2 partial
factor safety format for determining of Response-2000 design resistances, at varying
M/V-ratios and concrete strength.
C25 C45
M/V = 0.5 2.91 2.64
M/V = 2 2.92 2.84
4.3 Additional comments on the results
A general reflection regarding the results was that they in many ways demonstrate
that, in some aspects, and to different extent, the model parameters on which the
results are based are still incomplete. In particular what is referred to as the model
uncertainty is rather vaguely defined.
w
[%]
C25/C45:
l [
%]
2.72.7
2.75
2.75
2.75
2.75
2.75
2.8
2.8
2.82.8 2.8
2.85
2.85
2.85
2.9
2.9
2.953
0.1 0.3/0.4 0.5/0.7 0.7/1.0 0.9/1.3
0.5
1
1.5
2
CHALMERS, Civil and Environmental Engineering, Master’s Thesis 2011:7575 45
As e.g. described by Bohigas (2002), there has been quite a range of tests made on
reinforced concrete sections through the years. In his report he also illustrates how
these empirical results can be used to show the approximate relation between real and
estimated values of resistance based on certain geometrical-, material-, and loading
parameters. If such information is available for a wide range of beams and varying
loading conditions, this would form a relatively firm basis on which the model
uncertainty can be estimated. In other words, the model uncertainty could be treated
as a function of parameters, describing the sensitivity of the model bias to variation of
input, which should be coupled with the statistical uncertainty of the predicted model
biases originating from the limited number of tests used to establish the bias function.
Though the convenience of the above approach can be debated, it is the writer’s
opinion that it is inconsistent that, as it is at present the factor which is specified as
model uncertainty can increase with the number and diversity of tests carried out to
approximate it. Instead, it is reasonable to assume that the variability of model bias
should be appreciated as higher when the model is applied for a wider range of input,
given that no explicit information is available on how it varies.
In conclusion, it is important to note that when comparing design resistances obtained
with different models, the extent of both the test sample basis to determine model
uncertainty and the range of beams compared will affect the resulting estimations.
CHALMERS, Civil and Environmental Engineering, Master’s Thesis 2011:7575 46
5 Conclusions
In this chapter the conclusions from this master thesis are presented followed by a
couple of suggestions for further work to be done within the research area. It also
contains a discussion on how the objectives of the thesis have been met and some
thoughts regarding the potential use of results.
5.1 Conclusions from the application of codes
In order to facilitate consistency, both in general construction practice and in the
implementation of probabilistic design methods, it is in some aspects, e.g. concerning
the determining of in-situ strength parameters, still to be desired to reach greater
uniformity in the European construction code recommendations. There is also reason
to further clarify some parts of the JCSS (2001) Probabilistic model code, for instance
regarding correlation of reinforcing steel properties.
The range of conditions at which estimates of model bias is applicable could be
specified more clearly than has been done previously; the appreciation of model
uncertainty is meant to be used in the prediction of failure, not in the examination of
reasons why failures have occurred. Therefore it would be helpful if it was clarified
for what types of beams and under what loading conditions the estimates are
applicable, instead of at which resulting failure modes.
5.2 Conclusions from the comparison of resistance models
The more detailed shear model used in Response-2000 leads to a lower model
uncertainty than does the EC2 shear model and it therefore enables using higher
capacities under the same reliability criterion. This is especially true for beams with
little shear reinforcement, predominantly failing due to lack of shear resistance.
Response-2000 however still exhibits some convergence problems which have to be
rectified before the program can become a reliable commercial design tool.
Despite the large variability of stirrup spacing shown in previous studies (Turan et al.,
2008) fairly little improvement of reliability is expected to be gained from verifying
actual in-situ spacing.
5.3 Conclusions from the evaluation of safety formats
Judging from that there are bridges that do not pass assessment it was initially
assumed that, at least in some cases and certain aspects, the current design code is
more conservative than the ones used when many of the today existing constructions
were built. More importantly, it was also suggested that in some aspects the models
recommended in the code might lead to more conservative assessments of structural
capacity than what has been decided regarding target levels of reliability. In the
examination made in this thesis, based on the provisions by JCSS (2001), the second
of these hypotheses was thoroughly contradicted. Instead it was shown that with
respect to stipulated reliability requirement the partial safety factors provided for
design according to EN1992 (CEN, 2002) are non-conservative when used for
CHALMERS, Civil and Environmental Engineering, Master’s Thesis 2011:7575 47
calculation of shear capacity, both when applied on the EC2 shear model and on
Response-2000 resistance analysis.
The Schlune et al. (2010) safety format is slightly more accurate and consistent than
the EC2 safety format when used for shear analysis with Response-2000. It also leads
to more conservative estimates of the design resistance.
5.4 Meeting the objective
The principal aim of this thesis was to create an overview of for which reinforced
concrete beams the highest improvement of capacity utilization can be gained from
using the Response-2000 sectional analysis program instead of the EC2 shear model,
and from using a more accurate reliability method than the partial safety factor
method presented in EC2. In the latter respect the intention was also to incorporate a
continued evaluation of the safety format presented by Schlune et al. (2010), as well
as employing a full probabilistic approach for determining appropriate design
resistances.
Both resistance models and safety formats have been evaluated and compared based
on a series of probabilistic analyses which has been set up following standardized
guidelines presented by the JCSS (2001) and CEN (2002). The evaluations have been
done for a range of cross section configurations and loading conditions and the results
have been presented and discussed. Although the probabilistic basis for the study
allows for questioning of quantitative estimations, the presented results still form an
overview which provides indicative answers to the questions posed in the beginning
of this thesis. The author therefore believes that the objectives of the thesis have been
met.
5.5 Further work
Given that Response-2000 allows for it, the work done in this project could be
elaborated by looking at other cross section types than the ones already studied. The
evaluations could furthermore be done over the full capacity envelope of chosen
beams, i.e. for a larger range of moment-shear combinations and with the addition of
normal forces from prestressing. Also, as mentioned in the previous chapter, the
presented results indicate that, although relatively accurate and widely applicable,
some further work can still be done on improving the Schlune et al. (2010) safety
format
In a more general respect, in accordance with the comments already made in 5.1,
further work that needs to be done is primarily a continuation of the development of
the guidelines for probabilistic design. When this has been addressed, it should be
noted that the here presented study only illustrates the benefits of probabilistic
methodology in sectional analysis. This is just one of many possible applications. As
stated in Sustainable Bridges (2007), non-linear FE analysis is perhaps the structural
analysis method that has the highest potential for showing the load capacity of
bridges. It is therefore natural that further work should be done to explore the
possibility of combining probabilistic analyses with complete non-linear FE analyses.
CHALMERS, Civil and Environmental Engineering, Master’s Thesis 2011:7575 48
6 References
Al-Emrani, M., Engström, B., Johansson, M. and Johansson, P., 2008. Bärande
konstruktioner Del1. Göteborg: Chalmers tekniska högskola. ISSN 1652-9162
Bentz, E. C., 2000. Sectional Analysis of Reinforced Concrete Members. Ph. D.,
Department of Civil Engineering, University of Toronto. ISBN 10 0612498409
Bohigas, A. C., 2002. Shear design of reinforced high-strength concrete beams. Ph.
D., Universitat Politècnica de Catalunya.
Braml, T., Fischer, A., Keuser, M. and Schnell, J., 2009. Reliability of reinforced
structural elements in existing structures subjected to shear force. 7th
International
Probabilistic Workshop. Delft, The Netherlands 25-26 November 2009. ISBN: 978-
3-00-025048-4
Broo, H., Lundgren, K., Plos, M. (2008). A guide to non-linear finite element
modeling of shear and torsion in concrete bridges. Göteborg: Chalmers University of
Technology. Report 2008:18
Capriani, C. C. et al. (2007). The structural reliability of bridges subject to time-
dependent deterioration. Proceedings of the 11th
Conference on Civil, Structural and
Environmental Engineering Computing. Stirling: Civil-Comp Press. Paper No. 189,
16pp.
CEN (2002). EN 1990. Eurocode - Basis of structural design. European standard EN
1990, CEN, European Committee for Standardization. Brussels, Belgium.
CEN (2004). Eurocode 2: Design of concrete structures- Part 2: Concrete bridges-
Design and detailing rules. CEN European Committee for Standardization. Brussels,
Belgium.
Collins, P., Mitchell, D. (1991). Prestressed Concrete Structures. Englewood Cliffs:
Prentice Hall. ISBN: 0-13-691635-X
Ditlevsen, O. & Madsen, H. O. (2007). Structural Reliability Methods. Chichester:
John Wiley & Sons Ltd
Faber, Michael H. (2007). Risk and Safety in Civil Engineering. Zurich: Swiss Federal
Institute of Technology
Happold E., et al. (1996). Appraisal of existing structures. London: SETO. ISBN:
187426628
Hille, F., Rohrmann, R., Rücker, W. (2005). Guideline for the assessment of existing
structures. Bridge management 5. London: Thomas Telford. pp. 227-234. ISBN
0727733540
JCSS (2001). Probabilistic model code. Joint committee on Structural Safety, 12th
draft, Zurich
Jung, S., Kang, W., Kim, K. S., Song, J. (2008). Probabilistic shear strength models
for reinforced concrete beams without shear reinforcement. Structural Engineering
and Mechanics, Vol. 34, No. 1, 2010, pp 15-38
Madsen, H. O., Krenk, S., Lind, N. C. (1986). Methods of structural safety.
Englewood Cliffs: Prentice Hall
CHALMERS, Civil and Environmental Engineering, Master’s Thesis 2011:7575 49
Rajabalinejad, M. (2009). Reliability Methods for Finite Element Models. Delft: Delft
University of Technology.
Ryall, M. J. (2001). Bridge management. New Jersey: Butterworth-Heinemann.
ISBN: 075065077X
Schlune H., Plos M., Gylltoft K. (2011). Safety Formats for Nonlinear Analysis of
Concrete Structures. Submitted for publication to Magazine of Concrete Research
March 2011.
Schlune H., Plos M., Gylltoft K. (2011). Safety formats for nonlinear analysis tested
on concrete beams subjected to shear forces and bending moments. Engineering
Structures, 33 (8), 2350-2356.
Shioya, T., Iguro, M., Nojiri, Y., Akiyama, H. and Okada, T. (1989), Shear strength
of large reinforced concrete beams, ACI SP-118, Fracture Mechanics: Application to
Concrete, 259-280.
Sorensen, J. D. (2004). Notes in structural reliability theory and risk analysis.
Aalborg: Aalborg University
Sustainable Bridges (2007). Guideline for Inspection and Condition Assessment of
Existing European Railway Bridges: Including advices on the use of non-destructive
testing, Sustainable Bridges - Assessment for Future Traffic Demands and Longer
Lives: a project within EU:s 6th framework programme, 2007a. Available from
www.sustainablebridges.net
Starossek, U. (2006). Progressive Collapse of Structures. The 2006 Annual
Conference of the Structural Engineering Committee of the Korean Society of Civil
Engineers, Seoul, Korea, May 25, 2006
Turan O. T., Higgins, C., Rosowsky, D. V. (2008): Statistical Modeling of Coupled
Shear-Moment Resistance for RC Bridge Girders. Journal of Bridge Engineering,
Vol. 13, No. 4, pp. 351-361
Vecchio F. J. and Collins M. P. (1986): The modified compression-field theory for
reinforced concrete elements subjected to shear. Journal of the American Concrete
Institute 83(2), 219-231.
Vrouwenvelder, T. (1997). The JCSS probabilistic model code. Delft: Elsevier
Science
Vägverket (2001). Broar och tunnlar inför 2000-talet. VV Publ. 2001:18, ISSN:
1401-9612.
Vägverket (2004). Bro 2004. VV publ. 2004:56. Borlänge: Vägverkets tryckeri.
http://www.trafikverket.se/Privat/Vagar-och-jarnvagar/Sa-skoter-vi-vagar/Om-
skotsel-av-vagar/Underhall-av-broar-/.
Waarts, P. H. (2000). Structural Reliability using Finite Element Methods. Delft:
Delft University Press. ISBN 90-407-2073-8
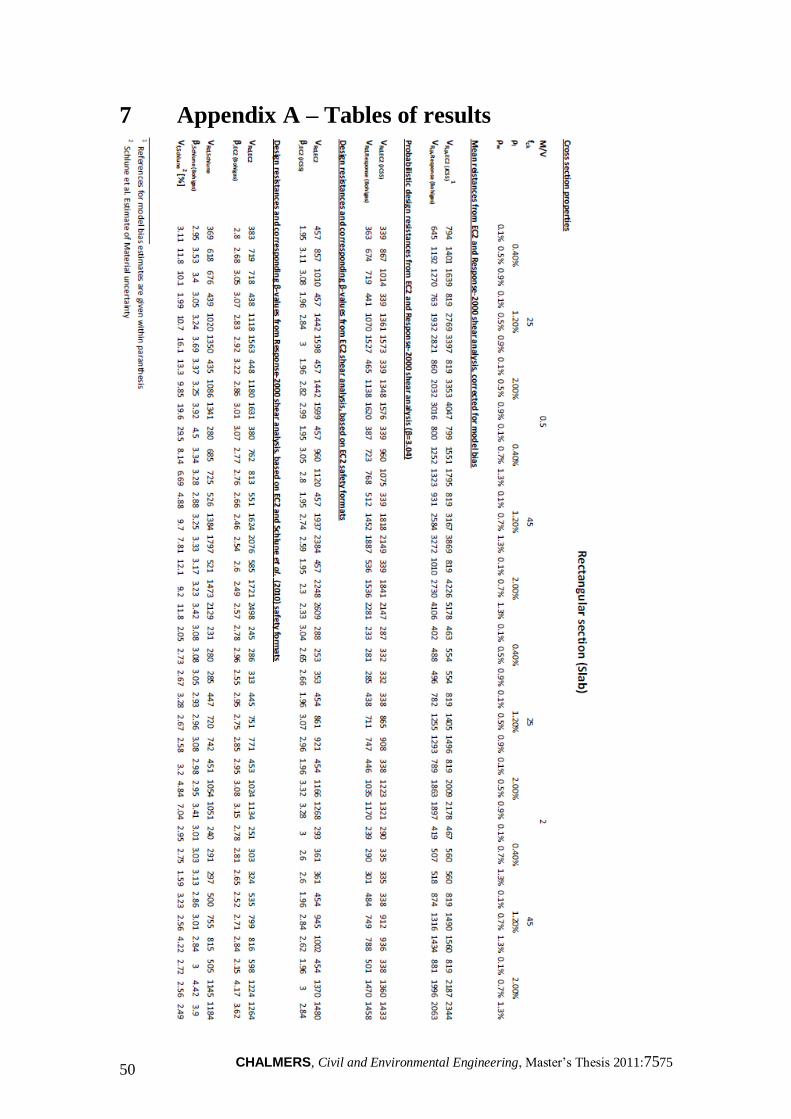
CHALMERS, Civil and Environmental Engineering, Master’s Thesis 2011:7575 50
7 Appendix A – Tables of results
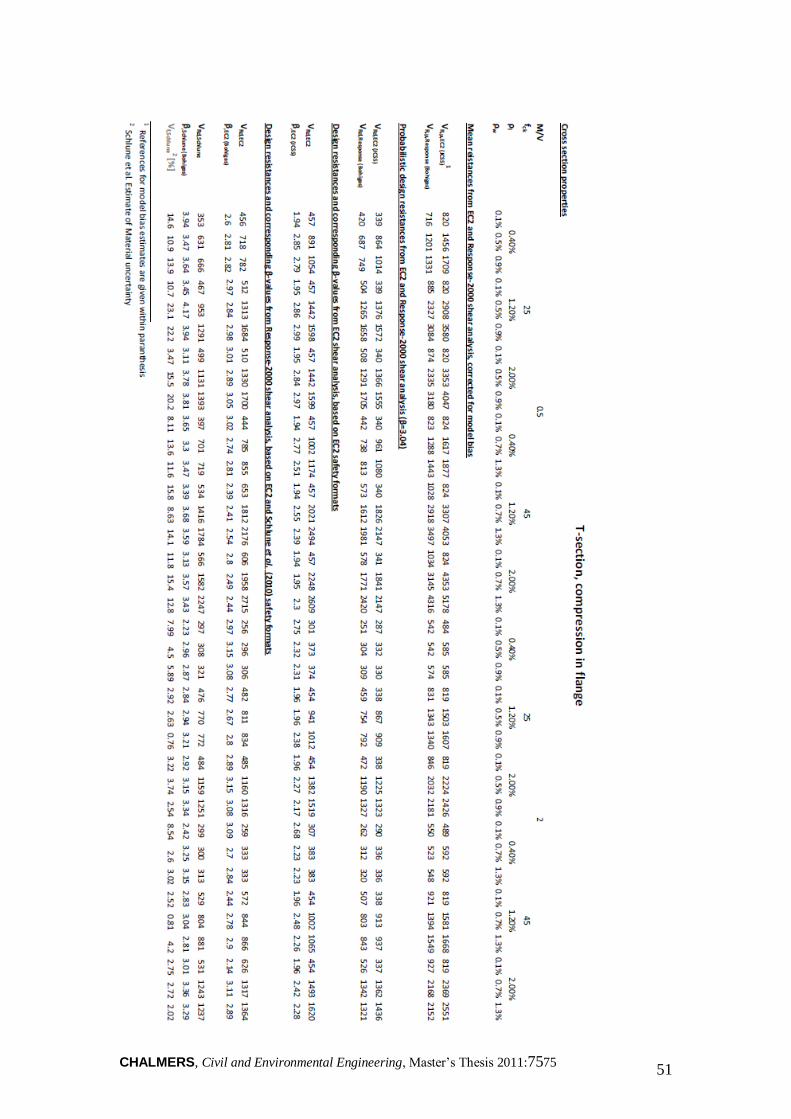
CHALMERS, Civil and Environmental Engineering, Master’s Thesis 2011:7575 51
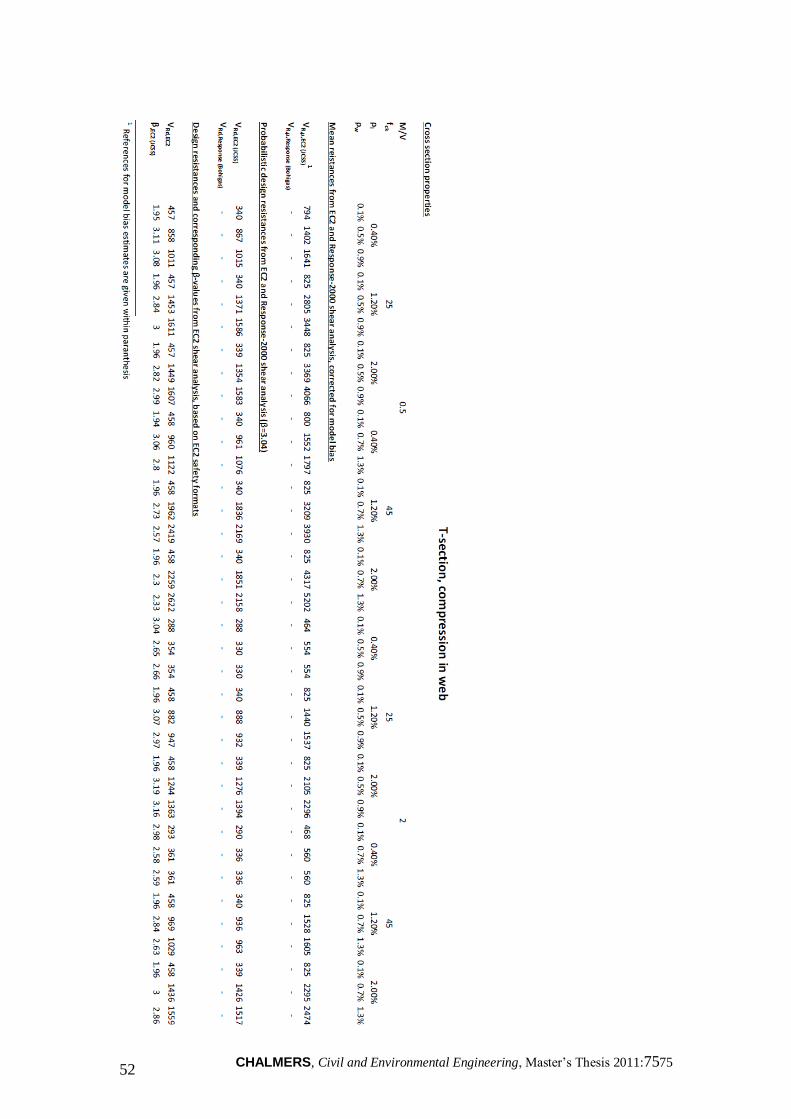
CHALMERS, Civil and Environmental Engineering, Master’s Thesis 2011:7575 52


![An Automated Workflow for Hemodynamic Computations in ... · Boussel et al. [15] suggest that aneurysm growth occurs in regions of low wall shear stress. Takao et al. [16] evaluated](https://img.pdfslide.tips/doc/110x75/6119f8e9268e81542f0476b0/an-automated-workflow-for-hemodynamic-computations-in-boussel-et-al-15-suggest.jpg)