Embed Size (px)
Citation preview
Annual Report 2015-2016
1
ANNUAL
REPORT
FISCAL YEAR ENDED
March 31, 2016
(April 1, 2015 to March 31, 2016)
Samvardhana Motherson
Automotive Systems Group BV
Annual Report 2015-2016
2
Contents
Directors’ Report…………………………………………………………………………………………….… 3
Management discussion and analysis
Operating Overview
Operating Overview…….…………………………………………………………................... 15
Group Structure…………………………………………………………………….………………….. 18
Corporate Information……………………………………………………………………………... 19
Geographical Footprint………………………………………………………………………........ 20
Order Book………….………………………….……………………………………………………….. 21
Financial Overview
Summary Financials………………………………………………………………………………….. 22
Components of Revenue & Expenses.……………………………………………..……….. 23
Net Working Capital………………………………………………………………………………. 30
Capital Expenditure………………………………………………………………………………….. 31
Cash Flow…………………………………………………………………………………………………. 33
Debt & Cash……………………………………………………………………………………………… 34
Liquidity Analysis……………………………………………………………………………………… 36
Audited Consolidated Financial Statements for the year ended March 31, 2016
Consolidated Statement of Financial Position……….…………………………………… 41
Consolidated Income Statement…..…………………………………………………………… 42
Consolidated Statement of Comprehensive Income..……………………………….. 43
Consolidated Cash Flow Statement..…………………………………………………………. 44
Consolidated Statement of Changes in Equity….……...………………………………. 46
Notes to the Consolidated Financial Statements………………………….…………… 48
Annual Report 2015-2016
3
DIRECTORS’ REPORT
To the members,
Your Directors have the pleasure in presenting annual report together with the audited accounts of
the Company for the financial year ended March 31, 2016.
A.1. BUSINESS BACKGROUND:
Samvardhana Motherson Automotive Systems Group BV together with it’s subsidiaries (hereinafter
referred as “SMRP BV Group” or “the Group”) are a leading global Tier 1 supplier of rear view vision
systems and interior and exterior modules (including door panels, instrument panels and bumpers) to
automotive original equipment manufacturers (“OEMs”) primarily for use in the production of light
vehicles. We are also a member of the Samvardhana Motherson Group (“SMG”), one of the largest
India-based global Tier 1 automotive supplier.
SMRP BV is a private company with limited liability, incorporated under the laws of the Netherlands
on October 07, 2011. Its registered office and principal place of business is situated at Hoogoorddreef
15, 1101 BA Amsterdam, The Netherlands
SMRP BV business consists of Samvardhana Motherson Reflectec Group referred to as SMR Group and
Samvardhana Motherson Peguform Group including Samvardhana Motherson Innovative
Autosystems (SMIA) together referred to as SMP Group
SMR Group represents the acquired business of Visiocorp Plc (in administration) which was acquired
in March 2009. SMP Group represents the acquired business from Peguform Group acquired in Nov
2011. SMP Group also includes acquired business of Scherer & Trier (acquired from the administrator)
in February 2015 (renamed as SMIA).
SMR Group produces a wide range of rear view vision systems primarily for light vehicles. SMR is a
leading global supplier of exterior mirrors having its headquarters in Stuttgart, Germany. SMR
operated 20 manufacturing facilities and 2 module centres with presence in 14 countries.
SMP Group produce various polymer-based interior and exterior products for light vehicles. SMP’s
product portfolio is primarily comprised of complete modules, including door panels, instrument
panels and bumpers as well as other plastic components and systems, such as centre consoles,
decorative interior trims and plastic body parts. SMP Group including SMIA operated 27
manufacturing facilities and 9 module centres in seven countries.
A.2. MANAGEMENT TEAM & EMPLOYEES
SMRP BV Group benefits from a strong professional management team, with average automotive
industry experience among senior managers of over 25 years. In addition, the group has experienced
and stable senior managers at the regional levels with significant experience and understanding of
their respective markets and regions. From time to time, the company employs staff on short-term
basis to meet the demand for the products. These employees are typically employed under fixed-term
contracts, generally of up to twelve months in duration which allows operational flexibility to meet
customer demand. As on March 31, 2016, SMRP BV Group had a total of 22,373 employees comprising
of 9,309 employees at SMR group and 13,064 employees at SMP Group.
Annual Report 2015-2016
4
A.3. EMPLOYEE INVOLVEMENT:
It is Group’s policy for the management of its subsidiaries to meet at regular intervals with
representatives of various sections of employees at which relevant information and developments are
discussed. It is also Group’s policy to ensure that any local legislative requirements for employee
representation or participation are fully adhered to.
Information on the Group is provided through internal newsletters, intranet portal and notices.
Regular meetings are held with the employees to discuss operations, sales and product development
and the financial progress of the business. Leadership assessment programs as well as succession
planning is also practiced to identify & develop potential leaders. Training programmes for staff
continue to focus on technical, consulting and people skills to meet the needs of high growth business.
An induction plan is in place for all new joiners of the Group.
Differently abled employees
The Group gives equal consideration to all applicants for employment irrespective of any disability. If
a person becomes disabled while employed by the Group, every endeavour is made to protect that
person's position. Differently abled persons have the same opportunities for training and career
development as other employees with similar skills and abilities.
A.4. FINANCIAL RESULTS :
The consolidated financial statements have been prepared in accordance with International Financial
Reporting Standards (“IFRS”) as adopted by the European Union (“IFRS EU”). These financial
statements of the Company have been prepared for the financial year beginning April 01, 2015 and
ending on March 31, 2016.
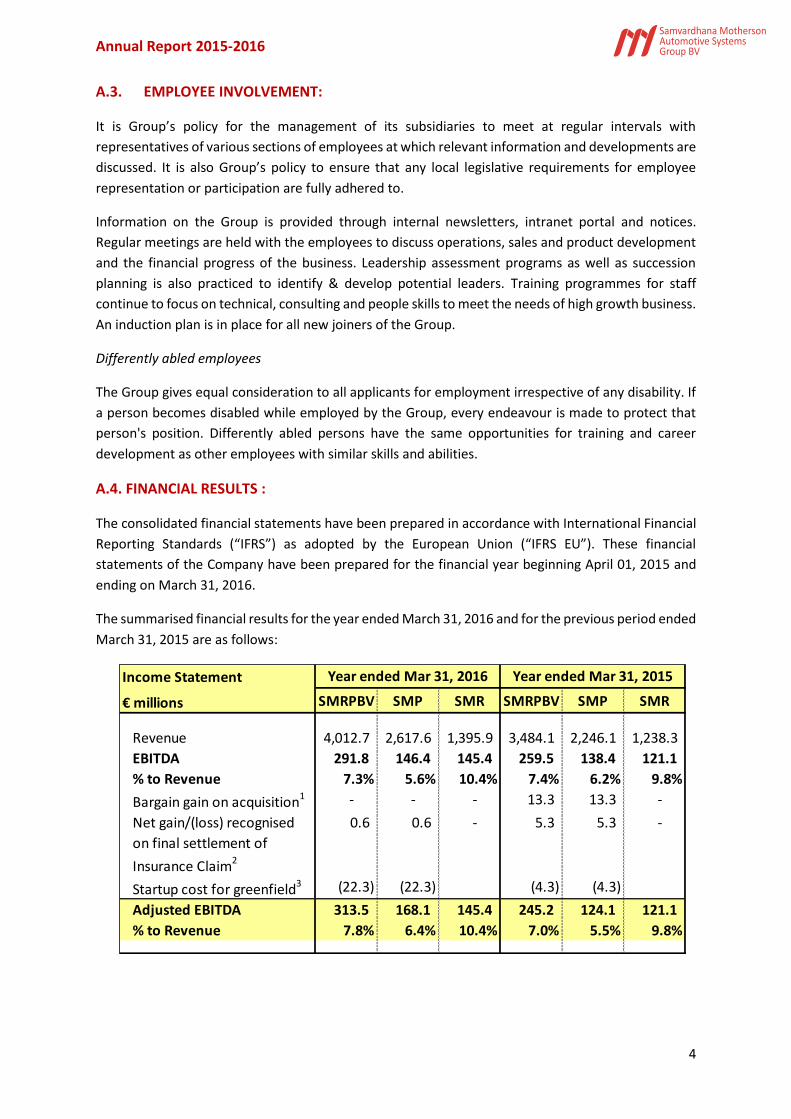
The summarised financial results for the year ended March 31, 2016 and for the previous period ended
March 31, 2015 are as follows:
Income Statement
€ millions SMRPBV SMP SMR SMRPBV SMP SMR
Revenue 4,012.7 2,617.6 1,395.9 3,484.1 2,246.1 1,238.3
EBITDA 291.8 146.4 145.4 259.5 138.4 121.1
% to Revenue 7.3% 5.6% 10.4% 7.4% 6.2% 9.8%
Bargain gain on acquisition1 - - - 13.3 13.3 -
Net gain/(loss) recognised
on final settlement of
Insurance Claim2
0.6 0.6 - 5.3 5.3 -
Startup cost for greenfield3 (22.3) (22.3) (4.3) (4.3)
Adjusted EBITDA 313.5 168.1 145.4 245.2 124.1 121.1
% to Revenue 7.8% 6.4% 10.4% 7.0% 5.5% 9.8%
Year ended Mar 31, 2016 Year ended Mar 31, 2015
Annual Report 2015-2016
5
1. Bargain gain on acquisition: For the year ended March 31, 2015, Other Operating Income of
SMP includes negative goodwill € 13.3 million arising out of acquisition of Scherer & Trier (In
administration)
2. Net gain/(loss) recognised on final settlement of insurance claim resulting from business
interruption at SMP’s paint facility in Polinya, Spain
3. Start-up cost incurred for new plants & facilities under construction
Consolidated Revenue for the year ended March 31, 2016 was € 4,012.7 Mio against revenue of €
3,484.1 Mio for the year ended March 31, 2015. This represents growth of approximately 15% over
previous year. Consolidated EBITDA was also higher at € 291.8 Mio for the year ended March 31, 2016
as compared to € 259.5 Mio for the year ended March 31, 2015. This represents growth of
approximately 12% over previous year.
However, excluding the impact of negative goodwill € 13.3 million arising out of acquisition of Scherer
& Trier during previous fiscal year ended March 31, 2015, net gain on settlement of insurance claim
and start-up cost incurred for new plants & facilities under construction (which have been charged to
income statement) adjusted EBITDA for the year ended March 31, 2016 was at € 313.5 million
representing 7.8% of revenues as compared to adjusted EBITDA of € 245.2 million representing 7.0%
of revenues for the year ended March 31, 2015. This represents growth of approximately 28% over
previous year.
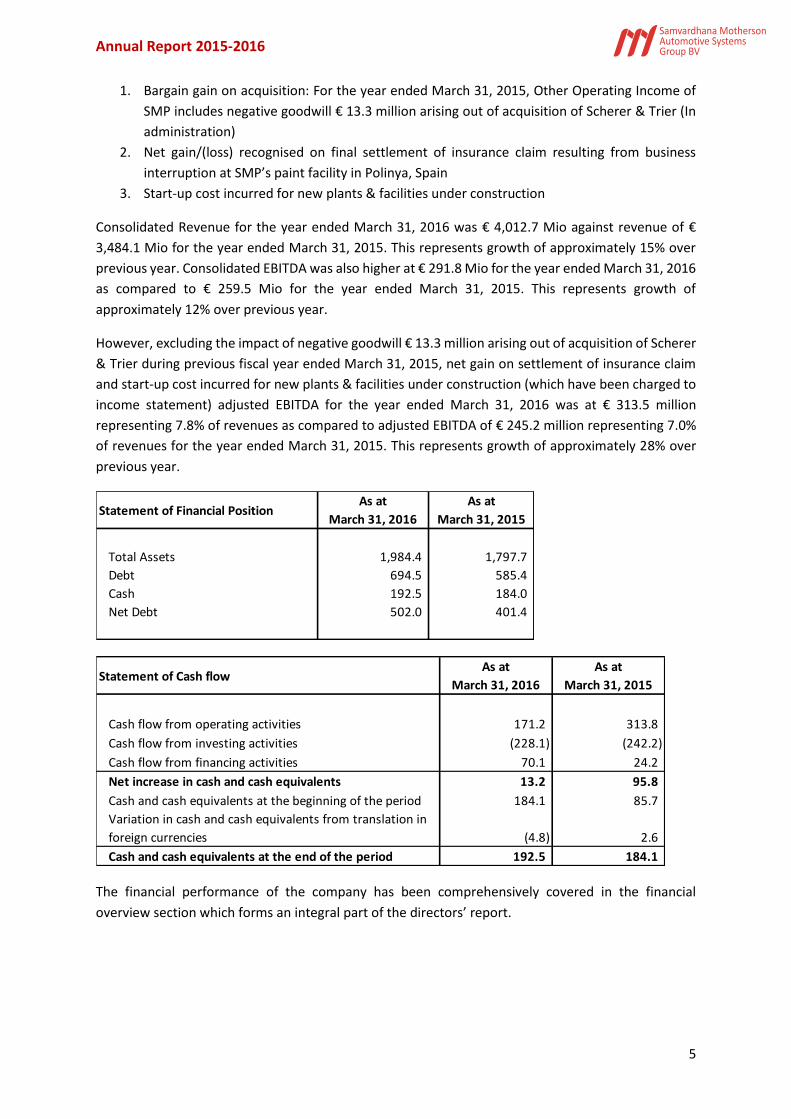
The financial performance of the company has been comprehensively covered in the financial
overview section which forms an integral part of the directors’ report.
Statement of Financial PositionAs at
March 31, 2016
As at
March 31, 2015
Total Assets 1,984.4 1,797.7
Debt 694.5 585.4
Cash 192.5 184.0
Net Debt 502.0 401.4
Statement of Cash flowAs at
March 31, 2016
As at
March 31, 2015
Cash flow from operating activities 171.2 313.8
Cash flow from investing activities (228.1) (242.2)
Cash flow from financing activities 70.1 24.2
Net increase in cash and cash equivalents 13.2 95.8
Cash and cash equivalents at the beginning of the period 184.1 85.7
Variation in cash and cash equivalents from translation in
foreign currencies (4.8) 2.6
Cash and cash equivalents at the end of the period 192.5 184.1
Annual Report 2015-2016
6
A.5. CAPITAL EXPENDITURE:
SMRP BV Group’s growth strategy includes expanding operations in line with customers’ growth and
sales order book. The company is one of the few suppliers in its product segment with a global
engineering & manufacturing footprint and this strong geographical diversification enables the
company to capitalise on global growth opportunities while mitigating the impact of any regional
demand fluctuations. The company continuously assess the need for setting up Greenfield plants or
expand capacities in existing plants to cater to new platforms with existing/new customers.
Capital expenditure incurred for the fiscal years ended March 31, 2015 and 2016 were €217.7 million
and €231.4 million, respectively. Significant capital expenditures is incurred in expanding our footprint
and enhancing our existing capacities. In the fiscal year ended March 31, 2016, SMR also completed
construction of a new plant in the United States to meet increasing customer orders. After our
acquisition of SMP, we made significant capital expenditures related to Greenfield projects in
Germany, Mexico and China, the replacement of paint facilities in Germany and Spain and capacity
expansions in Germany. In the fiscal year ended March 31, 2016, SMP started construction of two
greenfield plants at Tuscaloosa in USA and Kecskemet in Hungary.
A.6. STRATEGY:
The Group has adopted the vision of SMG, which is to be a globally preferred solutions provider in the
automotive industry. We aim to achieve this by pursuing our strategic actions that we have established
based on the philosophy of SMG, which includes focusing on consistent outstanding performance,
strengthening customer relationships built on trust, pursuing greater client engagement, increasing
the content per vehicle that we supply and developing long-term sustainable value creation.
A.7. RESEARCH AND DEVELOPMENT:
SMRP BV Group is committed to technological leadership and the development of innovative and high
quality products in order to meet both the growing demands of OEM customers with regard to product
complexity & feature content as well as increasingly stringent environmental goals and regulatory
requirements. Many of the products utilize environmentally friendly & lightweight materials and are
manufactured using state-of-the-art technologies that provide superior safety, comfort and design.
The company is maintaining a strong portfolio of over 900 patents. Design and research centres are
interconnected and share innovations & technological advancements across a global network, which
enables efficient improvement in the product quality and delivery of value added solutions on a global
scale and in a cost-efficient manner.
SMRP BV Group’s dedication to technological leadership has enabled the company to maintain a long
track record of introducing market-first products, including:
• Blind Spot Detection Systems (BSDS) designed to enhance safety and driving experience by
utilizing a sophisticated camera-based system to recognize vehicles in drivers’ blind spots;
• Telescopic Trailer Tow (TTT) mirrors with power-telescopic and power-folding functions,
designed to aid visibility when towing wide loads; and
• Door panels manufactured using innovative lightweight and recyclable natural fibre materials.
Annual Report 2015-2016
7
SMRP BV Group’s strong research & development capabilities have historically enabled the company
to develop a diversified and comprehensive product portfolio across rear view mirrors, door panels,
instrument panels, bumpers and other interior & exterior components. With the ability to offer a full
range of system solutions resulting from the vertical integration of company’s operations, including
strong in-house sourcing capabilities, there are significant opportunities to increase feature content
per vehicle across each of OEM customers’ vehicle platforms.
SMRP BV Group is focused on retaining and strengthening technological leadership through the
continued development of innovative products, which will enable the company to further diversify
the products portfolio, reinforce & leverage existing customer relationships & status as a strategic Tier
1 supplier to global OEMs and, consequently, drive increased product orders going forward. The
company intends to continue to focus research and development capabilities on four key areas:
• Performance: Improve product properties with new materials and optimised design. Enhance
usability and integrate attractive features.
• Cost Efficiency : Reduce cost by engineering best in class products. Maximise integration and
standardisation.
• Responsibility : Offer solutions for CO2 reduction and reduced energy consumption.
Application of innovative and renewable materials. Increase safety by providing solutions for
passenger & pedestrian protection.
• Emotions: Make attractive products with high class surfaces and integrate functionality (i.e.
lighting and displays).
The proven track record and reputation of technological leadership has positioned SMRP BV Group as
a preferred partner for collaborative development with leading OEMs. The company intend to
continue to pursue collaboration opportunities with existing customers, offering them full suite of
development capabilities and jointly developing innovative solutions to cater to their needs. Through
focus on technological leadership and the design & production of innovative products, the company
aims to further strengthen it’s position as the partner of choice in providing solutions which meet the
changing consumer needs.
A.8. DEVELOPMENT & OUTLOOK:
The global automotive industry designs, develops, manufactures, sells and services light vehicles and
heavy commercial vehicles. The light vehicle segment consists of passenger cars, vans and light truck
weighing less than six tons, while the heavy vehicle segment is generally defined as the market for
vehicles weighing in excess of six tons. The automotive production value chain is broken down into
OEMs and automotive part suppliers. These automotive part suppliers are further segmented into
three Tiers. Tier 1 automotive suppliers sell their products directly to OEMs. Typically these products
are larger modules or systems which integrates components, sometimes sourced from Tier 2
automotive suppliers. Tier 2 suppliers sell individual components to Tier 1 suppliers, which
components or component groups in turn typically integrate individual parts produced by and
purchased from Tier 3 suppliers. Automotive suppliers are typically further divided into sub-segments
based on their product or systems function within the car. A typical classification of automotive
supplier by vehicle function could include the following sub-segments: powertrain, body & structural,
exterior, interior, length, transmission and suspension.
Annual Report 2015-2016
8
SMRP BV Group’s revenues are primarily derived from sales of automotive components to global OEM
customers operating in the light vehicle industry and, as a result, SMRP BV Group operations are
affected by general trends in the automotive industry and global light vehicle production volume and
the content per vehicle for the components and systems produced by such suppliers. Suppliers
typically have contracts that cover the full life of a vehicle platform or model range, which usually have
an average life of five to seven years. Certain components, such as bumpers and exterior lighting, may
be updated part-way through the vehicle model lifecycle in what is referred to as a “mid-cycle refresh”
action.
The actual production volume of a given vehicle program is rarely fixed and may vary from OEM
projections depending on consumer demand. General economic conditions and consumer confidence
levels generally have a significant impact on vehicle demand, with more minor impacts resulting from
changes in regulations and government policies.
Other specific factors that can influence automotive production include changing demographics (e.g.
population growth, aging and urbanization), evolving consumer preferences, levels of consumer
disposable income, replacement requirements of old vehicles and affordability.
Globalization of platforms
OEMs are continuing to increase the number of vehicles built on a single platform in an effort to
reduce the time and resources spent on the development of new platforms. Vehicle platform-sharing
allows OEMs to build a greater variety of vehicles from one basic set of engineered components,
lowering overall costs by spreading development expenses over a greater number of units produced.
By implementing “platform-sharing” globally, OEMs are able to realize significant economies of scale.
To support this strategy, OEMs require suppliers to match the size, scale and geographic footprints of
these platforms. SMRP BV Group with a global footprint, broad product offering and the requisite
manufacturing expertise is well-positioned to benefit from such platform-sharing because there is no
restriction by the high barriers to entry associated with the global supply of a broad product portfolio
and is able to efficiently respond to customers' local needs. In addition, higher production volumes
across fewer platforms are expected to result in cost savings for suppliers, as they further standardize
and optimize their operations.
Localization of production in emerging markets
Increasing disposable income and low existing vehicle production, as well as the development of
efficient road infrastructure, are also driving the demand for light vehicles in emerging markets. As a
result of increasing local demand combined with low manufacturing costs and lack of import duties
for locally manufactured products, global OEMs are increasingly expanding their production and sales
networks in emerging markets. This has been a particularly significant trend in the premium segment,
which has been the most rapidly growing light vehicle segment in recent years. Leading global
premium car makers such as Audi, BMW, Daimler and Jaguar Land Rover have historically exported a
significant proportion of their production from Europe and North America to major emerging markets
such as China and Brazil. As sales in these markets are projected to continue their rapid growth, most
major global premium car makers have announced plans to expand their local production footprints.
SMRP BV Group is well positioned to realize growth opportunities in emerging markets by following
their customers due to strong OEM relationships.
Annual Report 2015-2016
9
Increased outsourcing leading to a high OEM dependency on external suppliers
As OEMs focus their resources on automobile final assembly, OEMs are increasingly looking to external
suppliers for content they have historically produced in-house. This trend is underpinned by OEMs’
growth outside their home markets, consumer expectations with regard to product complexity and
feature integration and an increased focus on safety and the environment. Suppliers can benefit from
economies of scale derived from serving various customers on a global scale, while OEM customers
may find more difficulty in achieving similar cost and quality levels in-house. The outsourcing trend
has led to an increase in OEM dependency on suppliers capable of managing complex projects while
maintaining high quality standards across multiple geographies. Furthermore, while know-how is still
being developed by suppliers and product design is still largely controlled by OEMs, there is an
increasing collaboration between OEMs and Tier 1 suppliers from a vehicle program’s initial stages.
These research and development partnerships between OEMs and suppliers seek to achieve long-
term strategic cooperation in line with the OEMs’ cost reduction initiatives.
Consolidation of supplier base
In order to take advantage of the operational economies of scale, OEMs are encouraging consolidation
of their supplier base with an increased focus on large, technically and financially strong global
suppliers capable of producing consistent and high-quality products across multiple production
regions. The OEMs use a number of factors to determine their preferred suppliers including, among
other things, product quality, service (including location, service interruptions and on-time delivery),
in-house research & development and technological capabilities, overall track record and quality of
relationship with the OEM, production capacity, financial stability and product price.
Connectivity and autonomous driving
Intelligent connectivity and digitization, both inside and outside the vehicle, will play an ever more
important role in the future. Connectivity is the name given to communication between one vehicle
and another, and between a vehicle and the infrastructure, for instance with traffic lights or traffic
control systems. Automated driving refers to the capability of a vehicle to drive itself at various levels
of independence from the vehicle occupants to a destination in real world traffic, using its onboard
sensors, and software intelligence, combined with navigation systems so that it can recognize its
surroundings.
SMRP BV Group believe that automotive suppliers with strong OEM relationships could play a
significant role in these new trends and the associated technologies. It could present new
opportunities business models and generates further growth potential within the automotive
industry.
A.9. RISK MANAGEMENT:
During 2016, the Group, its business and products were exposed to various risks. In its capacity as an
internationally active supplier for the automobile industry the Group is exposed to various risks with
each of its business segments and products. The global presence and decentralised management
structure with the main activities in the plants make an organised risk management system necessary.
The regulations, instructions, implementation rules and, in particular, the regular communication
throughout the tightly controlled management process consisting of planning, controlling and
Annual Report 2015-2016
10
monitoring collectively form the risk management system used to define, record and minimise
operating, financial and strategic risks.
The successful management of opportunities and risks is part of operating a business and is the
primary task of all management personnel. During the regular management meetings at all
management levels, opportunities, risks and optimisation measures are subjected to systematic
treatment. Rapid, open and unhindered communication between all levels of management on the
risks and imminent exceptional situations ensure that potential risks can be identified at an early stage
and their effects can be limited. Risk awareness and the integration of risk management into
management personnel’s on-going duties at an organisational level enable the Group to identify risks
immediately and to eliminate them or to minimise their effects on the net asset, financial and income
position.
Economic Risks
The Group may get affected by economic trends and adverse developments in the global economy
and in countries where we operate. Our business is affected by general economic conditions, in
particular levels of industrial and manufacturing output in the industries and markets that we serve,
and is susceptible to downturns in economies around the world, including major economic centres
such as the European Union and the United States, as well as emerging markets such as China, Mexico
and Brazil. General economic conditions and macroeconomic trends can affect overall demand for our
products and the markets in which we operate.
Market Risks
Cyclicality and reduced demand in the automotive industry in which the Group operate could affect
our business. Substantially all of our business is directly related to vehicle sales and production by our
customers, who consist primarily of large automotive OEMs, and demand for our products is largely
dependent on the industrial output of the automotive industry. The Group’s operations and
performance are directly related to levels of global vehicle production, particularly the light vehicle
market, and are therefore affected by factors that generally affect the automotive industry. The
automotive industry is sensitive to factors such as consumer demand, consumer confidence,
disposable income levels, employment levels, fuel prices and general economic conditions. Any
significant reduction in vehicle sales and production by our customers may have a material adverse
effect on our business, financial condition and results of operations.
Competition Risks
SMRP BV Group face global competition in its business. Competition is based on many factors,
including product quality and reliability, breadth of product range, product design and innovation,
manufacturing capabilities, distribution channels, scope and quality and reliability of service, price,
customer loyalty and brand recognition. The Group also encounter competition from similar and
alternative products, many of which are produced and marketed by major multinational or national
companies, which may have an adverse effect on our business, financial condition and results of
operations.
Annual Report 2015-2016
11
Procurement Risks
The Group depends on its suppliers for the supply of raw materials and components that are critical
to our manufacturing processes. SMRP BV Group sources its raw materials from a diversified group of
global, national and local suppliers, but still subject to supplier concentration with respect to certain
of its key inputs. Certain products use components that are only available from a limited number of
suppliers. Furthermore, some of Group’s suppliers are directed by our customers, and it is likely that
we will continue to source components from such suppliers. In some cases we purchase parts for
specific feature content sub-assemblies or modules from OEM-directed sources.
Prices of certain raw materials and pre-constructed components we rely on, such as resins (ABS and
polypropylene) and metal parts (mainly aluminium and zinc), are linked to commodity markets and
thus subject to fluctuation. Certain of our customer contracts, which typically factor in supply cost at
the time at which the contract is entered into and subsequently when it is extended or renewed, allow
for the pass-through of materials cost increases. For instance, certain of our supplier sources are
directed by our OEM customers. In cases where a supplier is directed by the OEM, our contracts
typically include provisions allowing for the pass-through of raw materials price increases to the
customer.
Personnel Risks
The Group depends on its senior management, executive officers, key employees and skilled
personnel, and the Group is unable to recruit and retain skilled management personnel, its business
and ability to operate or grow the business may be adversely affected. Its success depends to a large
extent upon the continued services of its senior management, executive officers, key employees and
other skilled personnel.
Forex Risk
The majority of our costs and incomes are denominated in local currencies, providing a “natural
hedge” against currency exchange fluctuations, and some of our contracts with OEMs allow for price
adjustments in the event of unfavorable currency exchange rate developments. Nevertheless, our
global footprint exposes us to certain currency exchange risks, arising primarily from the import of raw
materials for certain of our operations and our non-euro-denominated borrowings. SMRP BV group
do selective hedging to hedge these currency risks.
Financial risks
The Group is exposed to various financial risks due to its activities as an international production
company. These financial risks include the credit risk which is the risk of financial loss to the Group if
a customer or counterparty to a financial instrument fails to meet its contractual obligations towards
the Group and arises principally from the Group’s receivables from customers and deposits with
banking institutions.
Due to ongoing monitoring of the compliance with agreed terms of payment for all customers, risks
of bad debt losses are nearly eliminated. Monitoring of credit ratings of suppliers/non-OEM customer
take place from time to time.
Annual Report 2015-2016
12
The liquidity risk encompasses any risk that the Group cannot fully meet its financial obligations. To
manage the liquidity risk, cash flow forecasting is performed in the operating entities of the group and
aggregated by Group finance. Group finance monitors rolling forecasts of the Group’s liquidity
requirements to ensure it has sufficient cash to meet operational needs while maintaining sufficient
headroom on its undrawn committed borrowing facilities at all times so that the Group does not
breach borrowing limits or covenants (where applicable) on any of its borrowing facilities.
An overview of the main financial risks and the risk control (framework) can be found in paragraph
A.6.6.4 of the Notes to the consolidated financial statements.
A.10. FINANCIAL OUTLOOK & GOING CONCERN:
These financial statements are prepared under the assumption that the Group is a going concern. The
directors of the Group believe that, on the basis of the future business plans & cash flows and the
ability to raise funds as required, they have a reasonable expectation that the Group will continue as
a going concern.
SMRP BV Group’s liquidity requirements arise principally from operating activities, capital expenditure
for new facilities, maintenance & expansion capital expenditure, short term investments in
engineering projects for customer new product launches, repayment of borrowings and debt service
obligations. Principal source of funding includes cash from operations, committed credit lines, short-
term loans and overdraft facilities at some of the operating entities.
As at March 31, 2016 SMRP BV Group had available liquidity of € 534.5 million under committed
revolver credit facilities including cash & cash equivalent. Cash generated from operating subsidiaries
is utilised to finance growth within the operations of such subsidiary or is transferred to holding
companies through the payment of dividends or inter-company loans. In most cases there are no
significant obstacles or barriers for such transfer of funds but these are always subject to local
jurisdictions at respective country.
As at March 31, 2016 SMRP BV group had net leverage ratio of 1.8x which clearly depicts that Group
has significant headroom available for generating additional liquidity through borrowings for any
growth opportunities and business contingencies.
A.11. CREDIT RATING:
Directors are pleased to inform that the long term credit rating of BB+ as assigned to the company last
year by Standard and Poors was affirmed again during fiscal year ended 31st March 2016 with stable
outlook. Further an issue rating of “BB+” was assigned to Euro 100 million Senior Secured Notes issued
in June 2015.
A.12. SIGNIFICANT FINANCING TRANSACTIONS:
During the year ended March 31, 2016, the Company issued Euro 100,000,000 3.70% Senior Secured
Notes due 2025 (the "Notes"). The Notes bear interest at a rate of 3.70% payable annually on June 18
of each year and will mature on June 18, 2025. The Notes are listed on the Irish Stock Exchange and
trade on the Global Exchange Market of the Exchange
Annual Report 2015-2016
13
The company also entered into a new Revolving Credit Facility Agreement with a consortium of banks
around the date of issue of the Notes in order to replace the earlier Revolving Facility Agreement
entered into during financial year ended March 31, 2015. The Revolving Credit Facility Agreement
establishes revolving facility that provides for borrowing of an aggregate principal amount of up to
€350.0 million (the “Revolving Credit Facility”) available for financing working capital and general
corporate needs of SMRP BV and its subsidiaries as well as any permitted acquisitions and capital
expenditure and funding any fees, costs and expenses. Tranche A of the Revolving Facility Agreement
amounting to € 250.0 million matures in 2020 and Tranche B of the Revolving Facility Agreement
amounting to € 100.0 million matures in 2018.
The Revolving Credit Facility Agreement is guaranteed by the Guarantors, and will benefit from the
same collaterals as the Notes.
A.13. ENVIRONMENTAL POLICIES:
SMRP BV recognises its corporate responsibility to carry out its operations whilst minimising the
impact on the environment. It also aims to comply with all applicable environmental legislation to
prevent pollution and to minimise environmental damage occurring as a result of its activities.
A.14. DIRECTORS’ RESPONSIBILITY:
The directors are responsible for preparing the financial statements in accordance with applicable law
and International Financial Reporting Standards (“IFRS”) as adopted by the European Union.
In preparing these financial statements the directors should:
select suitable accounting policies and then apply them consistently;
make judgements and estimates that are reasonable and prudent;
prepare the financial statements on the going concern basis unless it is inappropriate to
presume that the Group will continue the business; and
state whether applicable accounting standards have been followed, subject to any material
departures disclosed and explained in the financial statements.
The directors confirm they have complied with all the above requirements in preparing the financial
statements.
So far as the directors are aware, there is no relevant audit information of which the Company's
auditors are unaware, and each director has taken all the steps that he ought to have taken as a
director in order to make himself aware of any relevant audit information and to establish that the
Company's auditors are aware of that information.
As of January 1, 2013 a new Dutch law requirement has been installed. The purpose of this is to attain
a balance (at least 30% of each gender) between men & women in the board of directors and the
supervisory board of large entities. In respect of this “Gender Paragraph” the Company does not fulfil
the requirement. However, the Company will take these requirements into consideration for future
decision with respect to the composition of the management & supervisory board at appropriate time.
Annual Report 2015-2016
14
A.15. ACKNOWLEDGEMENT:
Your Board of Directors would like to place on record their sincere appreciation for the wholehearted
support and contributions made by all the employees of the Company as well as customers, suppliers,
bankers, auditors and other authorities.
Approved by the Board of Directors and signed on behalf of the Board
Director
Date: May 27, 2016
Annual Report 2015-2016
15
OPERATING OVERVIEW
BUSINESS OVERVIEW
Samvardhana Motherson Automotive Systems Group BV together with it’s subsidiaries (hereinafter
referred as “SMRP BV Group” or “the Group”) are a leading global Tier 1 supplier of rear view vision
systems and interior and exterior modules (including door panels, instrument panels and bumpers) to
automotive original equipment manufacturers (“OEMs”) primarily for use in the production of light
vehicles. We are also a member of the Samvardhana Motherson Group (“SMG”), one of the largest
India-based global Tier 1 automotive supplier. We have long-term relationships with 14 of the top 15
global OEMs by 2014 production volume and our OEM customers collectively represented over 80%
of global automotive production in 2014. We currently supply our products to over 600 vehicle
programs and approximately one in every four passenger cars produced globally in 2014 contains our
products. In addition, we currently hold leading market positions in our key product segments and
geographies, particularly in the premium segment (which includes brands such as Audi, BMW, Jaguar
Land Rover, Porsche, Mercedes-Benz and others), on which we are especially focused. We are active
across the phases of our products’ lifecycles, from product conception, design, styling, prototyping
and validation to the manufacture, assembly and subsequent delivery of fully-engineered assembled
products. SMRP BV Group has presence in each major global automotive production region, with 47
production facilities and 11 module centres spread across 16 countries and strategically located in
close proximity to the manufacturing plants of the OEM customers. SMRP BV Group operate business
through following main divisions:
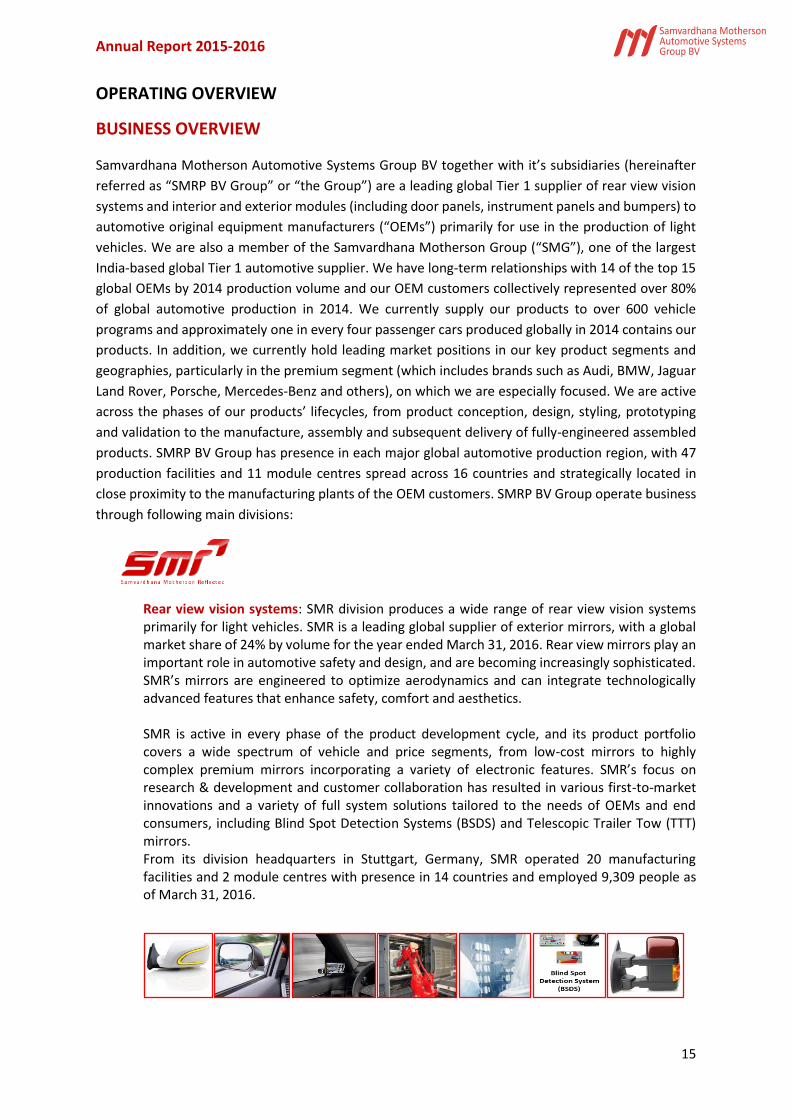
Rear view vision systems: SMR division produces a wide range of rear view vision systems primarily for light vehicles. SMR is a leading global supplier of exterior mirrors, with a global market share of 24% by volume for the year ended March 31, 2016. Rear view mirrors play an important role in automotive safety and design, and are becoming increasingly sophisticated. SMR’s mirrors are engineered to optimize aerodynamics and can integrate technologically advanced features that enhance safety, comfort and aesthetics. SMR is active in every phase of the product development cycle, and its product portfolio covers a wide spectrum of vehicle and price segments, from low-cost mirrors to highly complex premium mirrors incorporating a variety of electronic features. SMR’s focus on research & development and customer collaboration has resulted in various first-to-market innovations and a variety of full system solutions tailored to the needs of OEMs and end consumers, including Blind Spot Detection Systems (BSDS) and Telescopic Trailer Tow (TTT) mirrors. From its division headquarters in Stuttgart, Germany, SMR operated 20 manufacturing facilities and 2 module centres with presence in 14 countries and employed 9,309 people as of March 31, 2016.
Annual Report 2015-2016
16
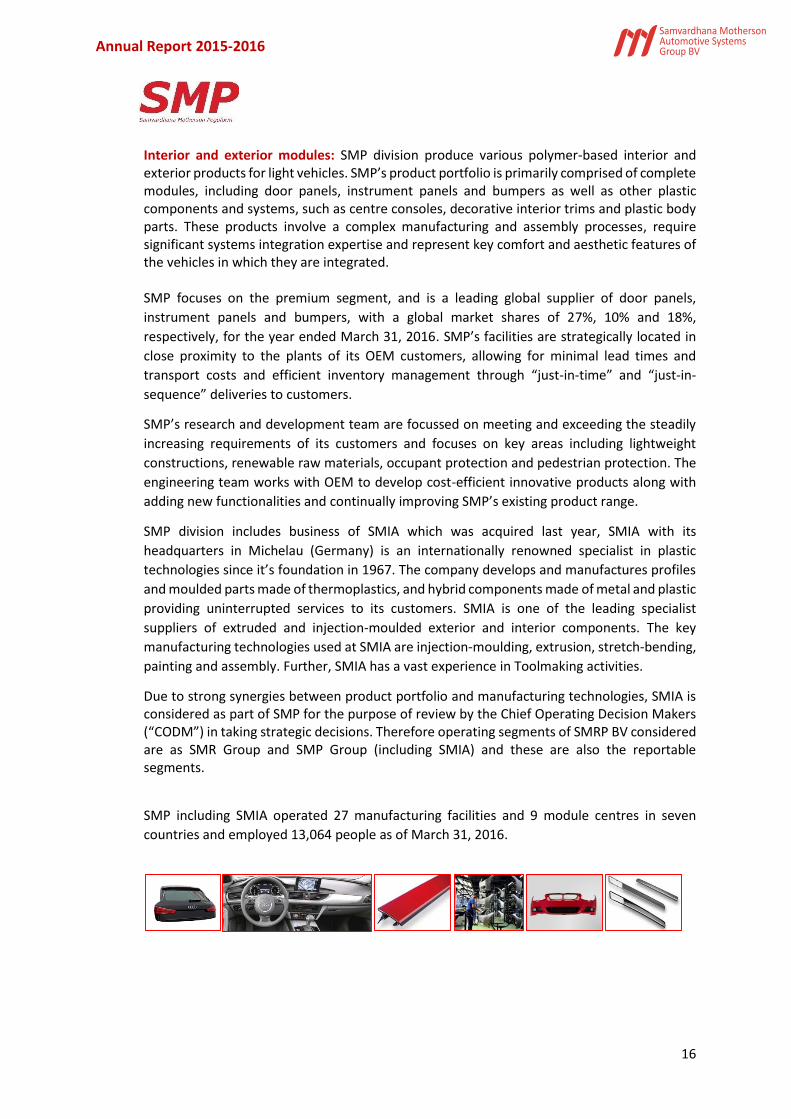
Interior and exterior modules: SMP division produce various polymer-based interior and exterior products for light vehicles. SMP’s product portfolio is primarily comprised of complete modules, including door panels, instrument panels and bumpers as well as other plastic components and systems, such as centre consoles, decorative interior trims and plastic body parts. These products involve a complex manufacturing and assembly processes, require significant systems integration expertise and represent key comfort and aesthetic features of the vehicles in which they are integrated. SMP focuses on the premium segment, and is a leading global supplier of door panels,
instrument panels and bumpers, with a global market shares of 27%, 10% and 18%,
respectively, for the year ended March 31, 2016. SMP’s facilities are strategically located in
close proximity to the plants of its OEM customers, allowing for minimal lead times and
transport costs and efficient inventory management through “just-in-time” and “just-in-
sequence” deliveries to customers.
SMP’s research and development team are focussed on meeting and exceeding the steadily
increasing requirements of its customers and focuses on key areas including lightweight
constructions, renewable raw materials, occupant protection and pedestrian protection. The
engineering team works with OEM to develop cost-efficient innovative products along with
adding new functionalities and continually improving SMP’s existing product range.
SMP division includes business of SMIA which was acquired last year, SMIA with its
headquarters in Michelau (Germany) is an internationally renowned specialist in plastic
technologies since it’s foundation in 1967. The company develops and manufactures profiles
and moulded parts made of thermoplastics, and hybrid components made of metal and plastic
providing uninterrupted services to its customers. SMIA is one of the leading specialist
suppliers of extruded and injection-moulded exterior and interior components. The key
manufacturing technologies used at SMIA are injection-moulding, extrusion, stretch-bending,
painting and assembly. Further, SMIA has a vast experience in Toolmaking activities.
Due to strong synergies between product portfolio and manufacturing technologies, SMIA is considered as part of SMP for the purpose of review by the Chief Operating Decision Makers (“CODM”) in taking strategic decisions. Therefore operating segments of SMRP BV considered are as SMR Group and SMP Group (including SMIA) and these are also the reportable segments.
SMP including SMIA operated 27 manufacturing facilities and 9 module centres in seven
countries and employed 13,064 people as of March 31, 2016.
Annual Report 2015-2016
17
MANAGEMENT TEAM & EMPLOYEES
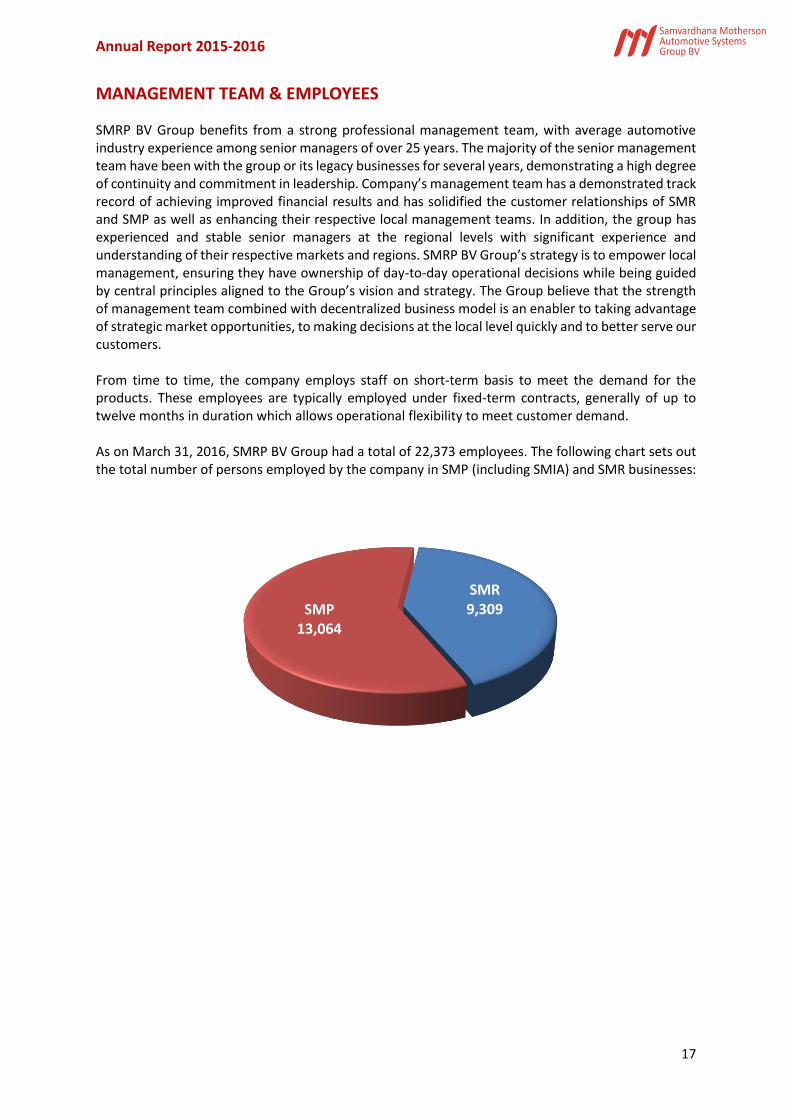
SMRP BV Group benefits from a strong professional management team, with average automotive industry experience among senior managers of over 25 years. The majority of the senior management team have been with the group or its legacy businesses for several years, demonstrating a high degree of continuity and commitment in leadership. Company’s management team has a demonstrated track record of achieving improved financial results and has solidified the customer relationships of SMR and SMP as well as enhancing their respective local management teams. In addition, the group has experienced and stable senior managers at the regional levels with significant experience and understanding of their respective markets and regions. SMRP BV Group’s strategy is to empower local management, ensuring they have ownership of day-to-day operational decisions while being guided by central principles aligned to the Group’s vision and strategy. The Group believe that the strength of management team combined with decentralized business model is an enabler to taking advantage of strategic market opportunities, to making decisions at the local level quickly and to better serve our customers. From time to time, the company employs staff on short-term basis to meet the demand for the products. These employees are typically employed under fixed-term contracts, generally of up to twelve months in duration which allows operational flexibility to meet customer demand. As on March 31, 2016, SMRP BV Group had a total of 22,373 employees. The following chart sets out the total number of persons employed by the company in SMP (including SMIA) and SMR businesses:
SMR9,309 SMP
13,064
Annual Report 2015-2016
18
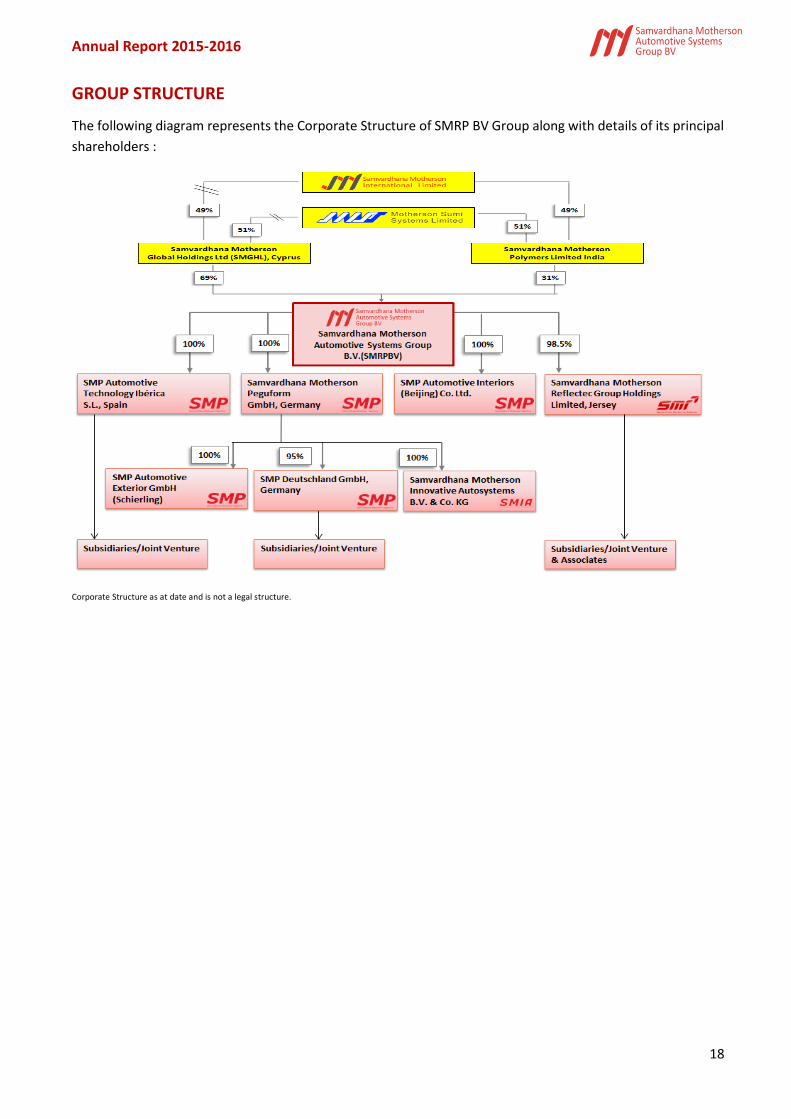
GROUP STRUCTURE
The following diagram represents the Corporate Structure of SMRP BV Group along with details of its principal
shareholders :
Corporate Structure as at date and is not a legal structure.
Annual Report 2015-2016
19
CORPORATE INFORMATION
MANAGEMENT BOARD :
The Management Board of the company is responsible for managing day to day business and to legally
represent the company in its dealing with third parties while maintaining high standards of corporate
governance and corporate responsibility. Management Board consists of following members:
1. Laksh Vaaman Sehgal Chairman and Chief Executive Officer
2. Andreas Heuser Managing Director and Head of Corporate, Europe & Americas-SMG
3. Jacob Meint Buit Resident Managing Director
4. Randolph de Cuba Resident Managing Director
SUPERVISORY BOARD :
The Supervisory Board of the company is responsible for supervising the management board’s policy and
course of action and to supervise the general conduct of the affairs of the company and any business it may be
affiliated with. The supervisory board assists the management board in an advisory capacity and have to carry
out their duties in the interest of the company. Supervisory Board consists of following members:
1. Vivek Chaand Sehgal Director and Chairman SMG
2. Bimal Dhar Director and Chief Executive Officer-SMP
3. Cezary Zawadzinski Director and Chief Operating Officer-SMR
4. G.N. Gauba Director
5. Kunal Malani Director
The above composition of Management & Supervisory Board is as on date.
AUDITORS :
The statutory auditors of the company are :
PricewaterhouseCoopers Accountants N.V. Fascinatio Boulevard 350, 3065 WB Rotterdam, P.O. Box 8800, 3009 AV Rotterdam, The Netherlands
REGISTERED OFFICE : The registered office of the company is under : Hoogoorddreef 15, 1101 BA Amsterdam The Netherlands
Annual Report 2015-2016
20
GEOGRAPHICAL FOOTPRINT
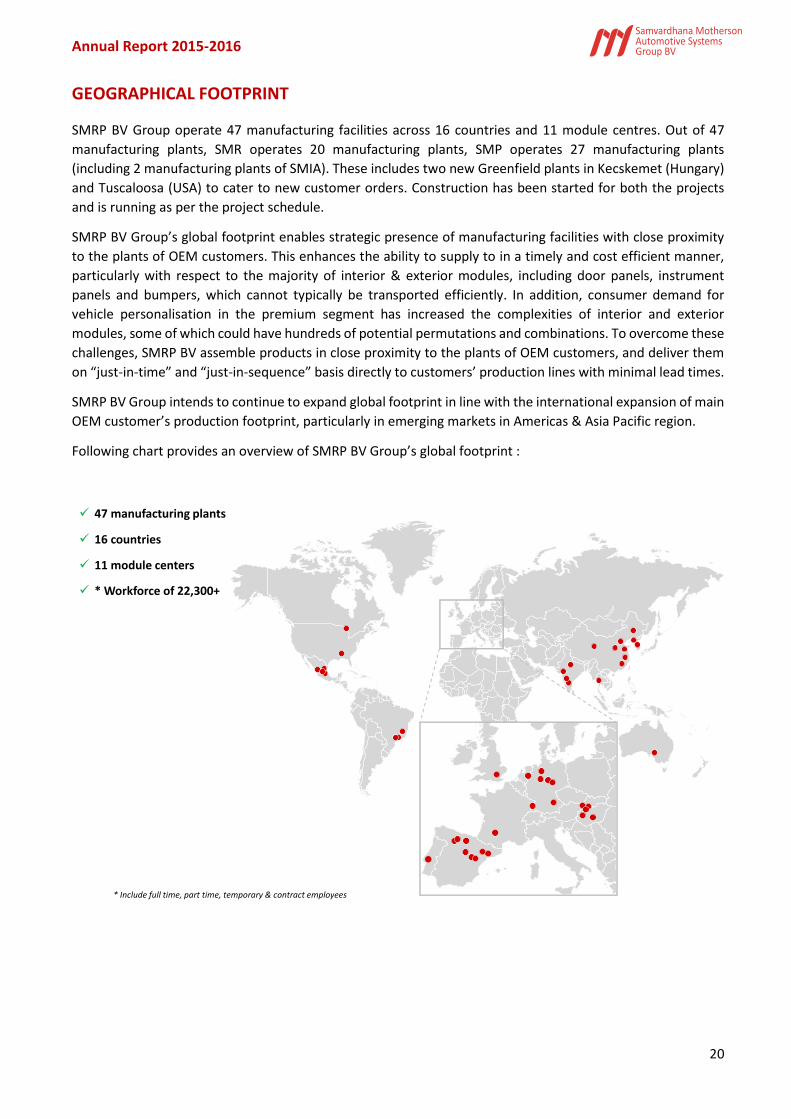
SMRP BV Group operate 47 manufacturing facilities across 16 countries and 11 module centres. Out of 47
manufacturing plants, SMR operates 20 manufacturing plants, SMP operates 27 manufacturing plants
(including 2 manufacturing plants of SMIA). These includes two new Greenfield plants in Kecskemet (Hungary)
and Tuscaloosa (USA) to cater to new customer orders. Construction has been started for both the projects
and is running as per the project schedule.
SMRP BV Group’s global footprint enables strategic presence of manufacturing facilities with close proximity
to the plants of OEM customers. This enhances the ability to supply to in a timely and cost efficient manner,
particularly with respect to the majority of interior & exterior modules, including door panels, instrument
panels and bumpers, which cannot typically be transported efficiently. In addition, consumer demand for
vehicle personalisation in the premium segment has increased the complexities of interior and exterior
modules, some of which could have hundreds of potential permutations and combinations. To overcome these
challenges, SMRP BV assemble products in close proximity to the plants of OEM customers, and deliver them
on “just-in-time” and “just-in-sequence” basis directly to customers’ production lines with minimal lead times.
SMRP BV Group intends to continue to expand global footprint in line with the international expansion of main
OEM customer’s production footprint, particularly in emerging markets in Americas & Asia Pacific region.
Following chart provides an overview of SMRP BV Group’s global footprint :
47 manufacturing plants
16 countries
11 module centers
* Workforce of 22,300+
* Include full time, part time, temporary & contract employees
Annual Report 2015-2016
21
ORDER BOOK
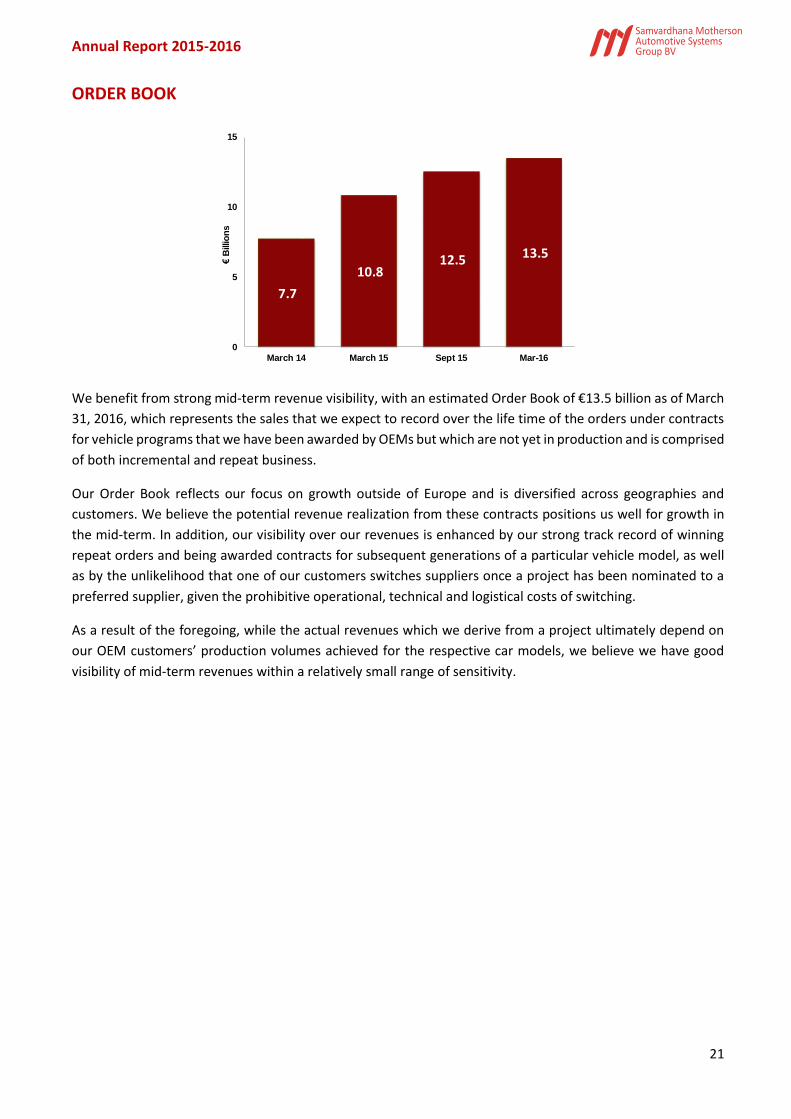
We benefit from strong mid-term revenue visibility, with an estimated Order Book of €13.5 billion as of March
31, 2016, which represents the sales that we expect to record over the life time of the orders under contracts
for vehicle programs that we have been awarded by OEMs but which are not yet in production and is comprised
of both incremental and repeat business.
Our Order Book reflects our focus on growth outside of Europe and is diversified across geographies and
customers. We believe the potential revenue realization from these contracts positions us well for growth in
the mid-term. In addition, our visibility over our revenues is enhanced by our strong track record of winning
repeat orders and being awarded contracts for subsequent generations of a particular vehicle model, as well
as by the unlikelihood that one of our customers switches suppliers once a project has been nominated to a
preferred supplier, given the prohibitive operational, technical and logistical costs of switching.
As a result of the foregoing, while the actual revenues which we derive from a project ultimately depend on
our OEM customers’ production volumes achieved for the respective car models, we believe we have good
visibility of mid-term revenues within a relatively small range of sensitivity.
7.7
10.8 12.5 13.5
0
5
10
15
March 14 March 15 Sept 15 Mar-16
€B
illio
ns
Annual Report 2015-2016
22
FINANCIAL OVERVIEW FOR THE QUARTER ENDED DECEMBER 31, 2015
Samvardhana Motherson Automotive Systems Group BV’s Board has approved its audited financial statements
for the year ended March 31, 2016.
The consolidated financial statements have been prepared in accordance with International Financial
Reporting Standards (“IFRS”) as adopted by the European Union (“IFRS EU”).
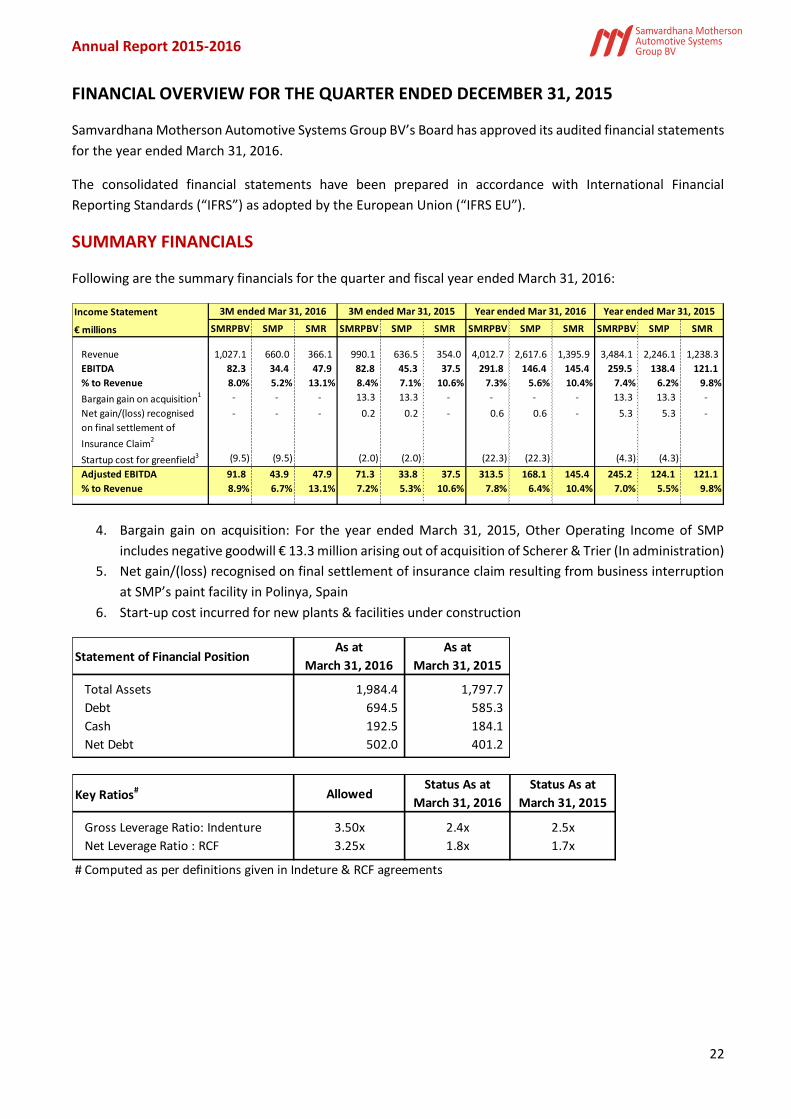
SUMMARY FINANCIALS
Following are the summary financials for the quarter and fiscal year ended March 31, 2016:
4. Bargain gain on acquisition: For the year ended March 31, 2015, Other Operating Income of SMP
includes negative goodwill € 13.3 million arising out of acquisition of Scherer & Trier (In administration)
5. Net gain/(loss) recognised on final settlement of insurance claim resulting from business interruption
at SMP’s paint facility in Polinya, Spain
6. Start-up cost incurred for new plants & facilities under construction
Income Statement
€ millions SMRPBV SMP SMR SMRPBV SMP SMR SMRPBV SMP SMR SMRPBV SMP SMR
Revenue 1,027.1 660.0 366.1 990.1 636.5 354.0 4,012.7 2,617.6 1,395.9 3,484.1 2,246.1 1,238.3
EBITDA 82.3 34.4 47.9 82.8 45.3 37.5 291.8 146.4 145.4 259.5 138.4 121.1
% to Revenue 8.0% 5.2% 13.1% 8.4% 7.1% 10.6% 7.3% 5.6% 10.4% 7.4% 6.2% 9.8%
Bargain gain on acquisition1 - - - 13.3 13.3 - - - - 13.3 13.3 -
Net gain/(loss) recognised
on final settlement of
Insurance Claim2
- - - 0.2 0.2 - 0.6 0.6 - 5.3 5.3 -
Startup cost for greenfield3 (9.5) (9.5) (2.0) (2.0) (22.3) (22.3) (4.3) (4.3)
Adjusted EBITDA 91.8 43.9 47.9 71.3 33.8 37.5 313.5 168.1 145.4 245.2 124.1 121.1
% to Revenue 8.9% 6.7% 13.1% 7.2% 5.3% 10.6% 7.8% 6.4% 10.4% 7.0% 5.5% 9.8%
3M ended Mar 31, 20153M ended Mar 31, 2016 Year ended Mar 31, 2016 Year ended Mar 31, 2015
Statement of Financial PositionAs at
March 31, 2016
As at
March 31, 2015
Total Assets 1,984.4 1,797.7
Debt 694.5 585.3
Cash 192.5 184.1
Net Debt 502.0 401.2
Key Ratios# AllowedStatus As at
March 31, 2016
Status As at
March 31, 2015
Gross Leverage Ratio: Indenture 3.50x 2.4x 2.5x
Net Leverage Ratio : RCF 3.25x 1.8x 1.7x
# Computed as per definitions given in Indeture & RCF agreements
Annual Report 2015-2016
23
COMPONENTS OF REVENUE & EXPENSES
REVENUE
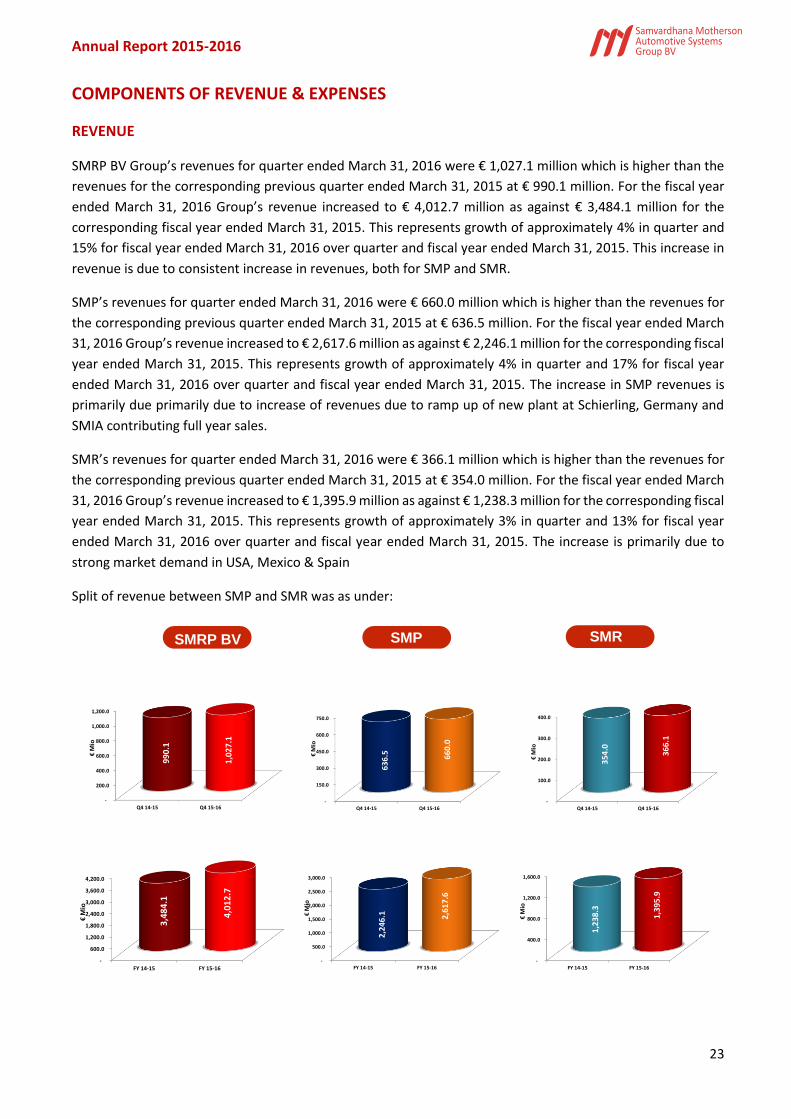
SMRP BV Group’s revenues for quarter ended March 31, 2016 were € 1,027.1 million which is higher than the
revenues for the corresponding previous quarter ended March 31, 2015 at € 990.1 million. For the fiscal year
ended March 31, 2016 Group’s revenue increased to € 4,012.7 million as against € 3,484.1 million for the
corresponding fiscal year ended March 31, 2015. This represents growth of approximately 4% in quarter and
15% for fiscal year ended March 31, 2016 over quarter and fiscal year ended March 31, 2015. This increase in
revenue is due to consistent increase in revenues, both for SMP and SMR.
SMP’s revenues for quarter ended March 31, 2016 were € 660.0 million which is higher than the revenues for
the corresponding previous quarter ended March 31, 2015 at € 636.5 million. For the fiscal year ended March
31, 2016 Group’s revenue increased to € 2,617.6 million as against € 2,246.1 million for the corresponding fiscal
year ended March 31, 2015. This represents growth of approximately 4% in quarter and 17% for fiscal year
ended March 31, 2016 over quarter and fiscal year ended March 31, 2015. The increase in SMP revenues is
primarily due primarily due to increase of revenues due to ramp up of new plant at Schierling, Germany and
SMIA contributing full year sales.
SMR’s revenues for quarter ended March 31, 2016 were € 366.1 million which is higher than the revenues for
the corresponding previous quarter ended March 31, 2015 at € 354.0 million. For the fiscal year ended March
31, 2016 Group’s revenue increased to € 1,395.9 million as against € 1,238.3 million for the corresponding fiscal
year ended March 31, 2015. This represents growth of approximately 3% in quarter and 13% for fiscal year
ended March 31, 2016 over quarter and fiscal year ended March 31, 2015. The increase is primarily due to
strong market demand in USA, Mexico & Spain
Split of revenue between SMP and SMR was as under:
SMRP BV SMP SMR
-
200.0
400.0
600.0
800.0
1,000.0
1,200.0
Q4 14-15 Q4 15-16
99
0.1
1,0
27
.1
€M
io
-
150.0
300.0
450.0
600.0
750.0
Q4 14-15 Q4 15-16
63
6.5
66
0.0
€M
io
-
100.0
200.0
300.0
400.0
Q4 14-15 Q4 15-16
35
4.0
36
6.1
€M
io
-
600.0
1,200.0
1,800.0
2,400.0
3,000.0
3,600.0
4,200.0
FY 14-15 FY 15-16
3,4
84
.1
4,0
12
.7
€M
io
-
500.0
1,000.0
1,500.0
2,000.0
2,500.0
3,000.0
FY 14-15 FY 15-16
2,2
46
.1
2,6
17
.6
€M
io
-
400.0
800.0
1,200.0
1,600.0
FY 14-15 FY 15-16
1,2
38
.3
1,3
95
.9
€M
io
Annual Report 2015-2016
24
SMP, which is the interior & exterior module business, contributed 65% of the revenues and SMR, which is
interior & exterior mirror business contributed 35% of the revenue for the fiscal year ended March 31, 2016 as
compared to 64% of the revenues from SMP business and 36% from SMR business for the corresponding fiscal
year ended March 31, 2015.
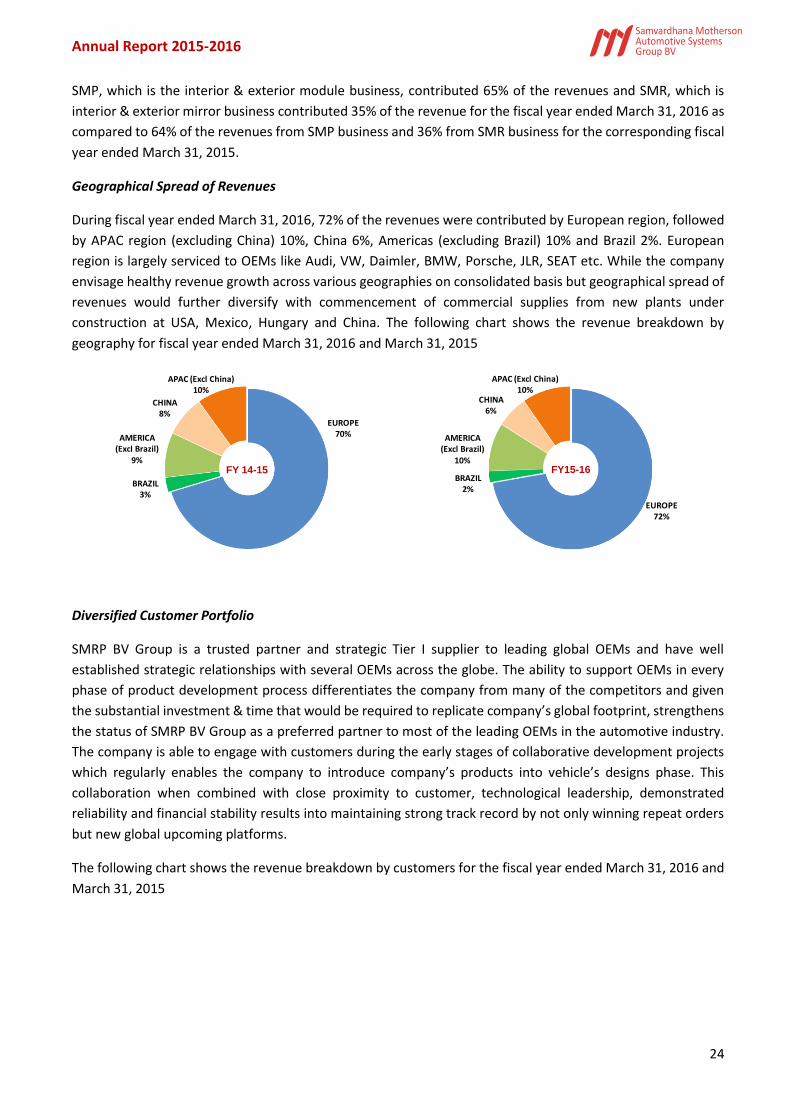
Geographical Spread of Revenues
During fiscal year ended March 31, 2016, 72% of the revenues were contributed by European region, followed
by APAC region (excluding China) 10%, China 6%, Americas (excluding Brazil) 10% and Brazil 2%. European
region is largely serviced to OEMs like Audi, VW, Daimler, BMW, Porsche, JLR, SEAT etc. While the company
envisage healthy revenue growth across various geographies on consolidated basis but geographical spread of
revenues would further diversify with commencement of commercial supplies from new plants under
construction at USA, Mexico, Hungary and China. The following chart shows the revenue breakdown by
geography for fiscal year ended March 31, 2016 and March 31, 2015
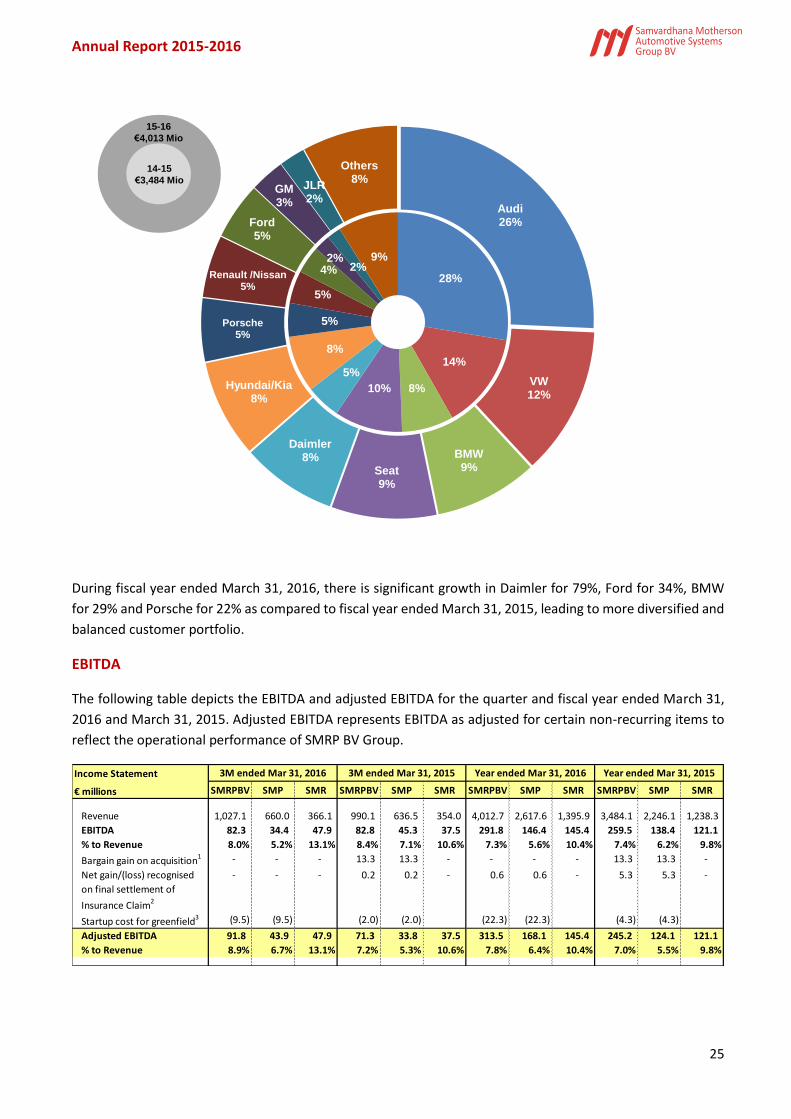
Diversified Customer Portfolio
SMRP BV Group is a trusted partner and strategic Tier I supplier to leading global OEMs and have well
established strategic relationships with several OEMs across the globe. The ability to support OEMs in every
phase of product development process differentiates the company from many of the competitors and given
the substantial investment & time that would be required to replicate company’s global footprint, strengthens
the status of SMRP BV Group as a preferred partner to most of the leading OEMs in the automotive industry.
The company is able to engage with customers during the early stages of collaborative development projects
which regularly enables the company to introduce company’s products into vehicle’s designs phase. This
collaboration when combined with close proximity to customer, technological leadership, demonstrated
reliability and financial stability results into maintaining strong track record by not only winning repeat orders
but new global upcoming platforms.
The following chart shows the revenue breakdown by customers for the fiscal year ended March 31, 2016 and
March 31, 2015
EUROPE70%
BRAZIL3%
AMERICA (Excl Brazil)
9%
CHINA8%
APAC (Excl China)10%
FY 14-15
EUROPE72%
BRAZIL2%
AMERICA (Excl Brazil)
10%
CHINA6%
APAC (Excl China)10%
FY15-16
Annual Report 2015-2016
25
During fiscal year ended March 31, 2016, there is significant growth in Daimler for 79%, Ford for 34%, BMW
for 29% and Porsche for 22% as compared to fiscal year ended March 31, 2015, leading to more diversified and
balanced customer portfolio.
EBITDA
The following table depicts the EBITDA and adjusted EBITDA for the quarter and fiscal year ended March 31,
2016 and March 31, 2015. Adjusted EBITDA represents EBITDA as adjusted for certain non-recurring items to
reflect the operational performance of SMRP BV Group.
28%
14%
8%10%
5%
8%
5%
5%
4%2%
2%9%
Audi26%
VW12%
BMW9%Seat
9%
Daimler8%
Hyundai/Kia8%
Porsche5%
Renault /Nissan5%
Ford5%
GM3%
JLR2%
Others 8%
14-15
€3,484 Mio
15-16
€4,013 Mio
Income Statement
€ millions SMRPBV SMP SMR SMRPBV SMP SMR SMRPBV SMP SMR SMRPBV SMP SMR
Revenue 1,027.1 660.0 366.1 990.1 636.5 354.0 4,012.7 2,617.6 1,395.9 3,484.1 2,246.1 1,238.3
EBITDA 82.3 34.4 47.9 82.8 45.3 37.5 291.8 146.4 145.4 259.5 138.4 121.1
% to Revenue 8.0% 5.2% 13.1% 8.4% 7.1% 10.6% 7.3% 5.6% 10.4% 7.4% 6.2% 9.8%
Bargain gain on acquisition1 - - - 13.3 13.3 - - - - 13.3 13.3 -
Net gain/(loss) recognised
on final settlement of
Insurance Claim2
- - - 0.2 0.2 - 0.6 0.6 - 5.3 5.3 -
Startup cost for greenfield3 (9.5) (9.5) (2.0) (2.0) (22.3) (22.3) (4.3) (4.3)
Adjusted EBITDA 91.8 43.9 47.9 71.3 33.8 37.5 313.5 168.1 145.4 245.2 124.1 121.1
% to Revenue 8.9% 6.7% 13.1% 7.2% 5.3% 10.6% 7.8% 6.4% 10.4% 7.0% 5.5% 9.8%
3M ended Mar 31, 20153M ended Mar 31, 2016 Year ended Mar 31, 2016 Year ended Mar 31, 2015
Annual Report 2015-2016
26
1. Negative goodwill € NIL for fiscal year ended March 31, 2016 (€ 13.3 million for fiscal year ended March
31, 2015) arising out of acquisition of Scherer & Trier (In administration) in the fiscal year ended March
31, 2015
2. Net gain/(loss) of € 0.6 million for fiscal year ended March 31, 2016 (€ 5.3 million for fiscal year ended
March 31, 2015) recognised on final settlement of insurance claim resulting from business interruption
at SMP’s paint facility in Polinya, Spain
3. Start-up cost incurred for new plants & facilities under construction € 22.3 million for fiscal year ended
March 31, 2016 (€ 4.3 million for fiscal year ended March 31, 2015). There are significant start-up cost
including project management cost, trial of new products, machine set-up cost etc. which are expensed
to income statement as conservative accounting practice. This will get normalised once the matching
revenues from the new plants will start.
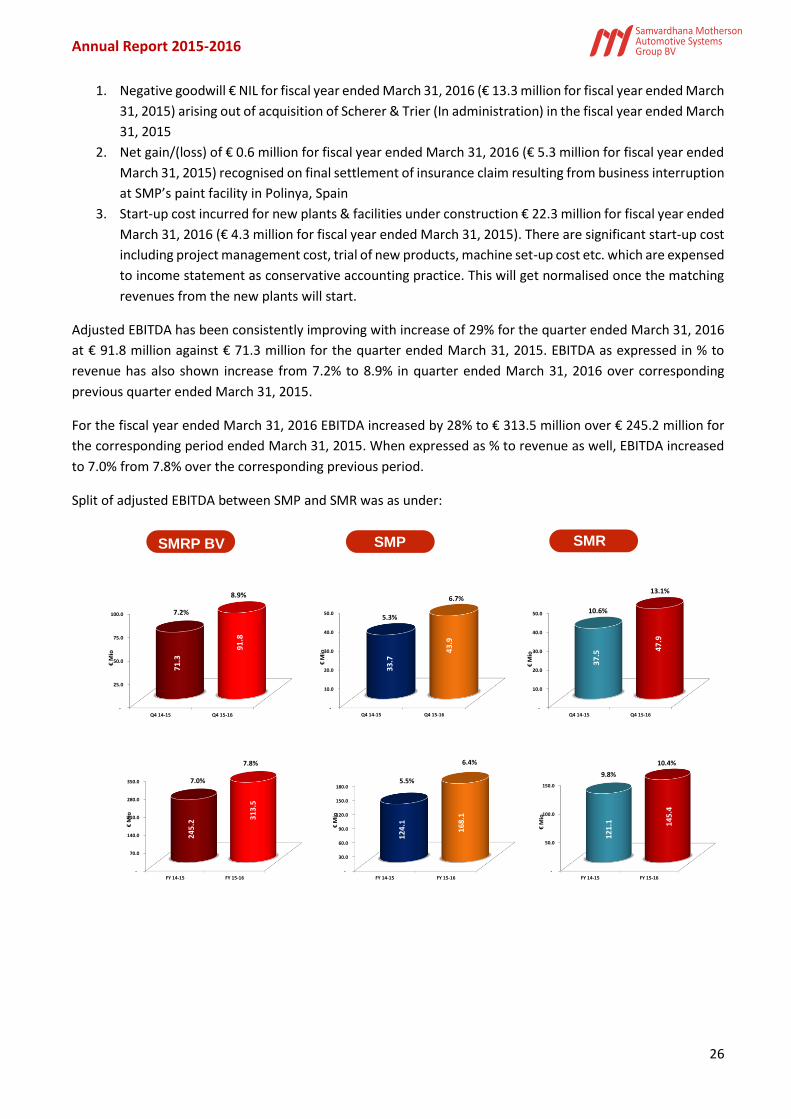
Adjusted EBITDA has been consistently improving with increase of 29% for the quarter ended March 31, 2016
at € 91.8 million against € 71.3 million for the quarter ended March 31, 2015. EBITDA as expressed in % to
revenue has also shown increase from 7.2% to 8.9% in quarter ended March 31, 2016 over corresponding
previous quarter ended March 31, 2015.
For the fiscal year ended March 31, 2016 EBITDA increased by 28% to € 313.5 million over € 245.2 million for
the corresponding period ended March 31, 2015. When expressed as % to revenue as well, EBITDA increased
to 7.0% from 7.8% over the corresponding previous period.
Split of adjusted EBITDA between SMP and SMR was as under:
SMRP BV SMP SMR
-
25.0
50.0
75.0
100.0
Q4 14-15 Q4 15-16
71
.3
91
.8
€M
io
7.2%
8.9%
-
10.0
20.0
30.0
40.0
50.0
Q4 14-15 Q4 15-16
33
.7 4
3.9
€M
io
5.3%
6.7%
-
10.0
20.0
30.0
40.0
50.0
Q4 14-15 Q4 15-16
37
.5 47
.9
€M
io
10.6%
13.1%
-
70.0
140.0
210.0
280.0
350.0
FY 14-15 FY 15-16
24
5.2
31
3.5
€M
io
7.0%
7.8%
-
30.0
60.0
90.0
120.0
150.0
180.0
FY 14-15 FY 15-16
12
4.1
16
8.1
€M
io
5.5%
6.4%
-
50.0
100.0
150.0
FY 14-15 FY 15-16
12
1.1
14
5.4
€M
io
9.8%
10.4%
Annual Report 2015-2016
27
COST OF MATERIALS
Cost of materials includes purchases of raw materials, purchases of goods and tools for resale, discounts for
prompt payment, purchase returns and similar transactions, volume discounts, changes to inventories,
consumption of other supplies and purchase of pre-constructed components. These are primarily variable in
nature based on the product mix sold during the period. Cost of material was at € 633.7 million which
accounted for 61.7% of revenues for the quarter ended March 31, 2016. This is lower as compared to €656.5
million which accounted for 66.3% of revenues for the corresponding previous quarter ended March 31, 2015.
For the fiscal year ended March 31, 2016, cost of materials stood at € 2,572.5 million representing 64.1% of
the revenues against € 2,324.4 million representing 66.7% of the revenues for the fiscal year ended March 31,
2015. These reductions in cost of materials as a percentage of revenue is primarily due to scrap reduction,
improved manufacturing efficiencies, higher margins on new orders and change in product mix
PERSONNEL COSTS
Personnel expenses include wages, salaries, paid labour rendered by third parties, employer’s social security
contributions and other welfare expenses. Personnel expenses are primarily driven by the size of our
operations, our geographical reach and customer requirements. Personnel expenses were at € 208.6 million
which accounted for 20.3% of revenues for the quarter ended March 31, 2016. This is higher as compared to
€183.5 million which accounted for 18.5% of revenues for the corresponding previous quarter ended March
31, 2015. For the fiscal year ended March 31, 2016, personnel expenses stood at € 785.4 million representing
19.6% of the revenues against € 637.2 million representing 18.3% of the revenues for the fiscal year ended
March 31, 2015. This increase was primarily due to increased capacity and production level, ramp up of
production from new facilities and headcount at new Greenfield plants during construction phase.
OTHER OPERATING EXPENSES
Other operating expenses primarily consists of general administrative expenses, energy costs, repair &
maintenance costs, rental & lease costs, freight & forwarding costs, auditors remuneration, net foreign
exchange loss and legal & professional fees. Other operating expenses for the quarter ended March 31, 2016
were at € 107.3 million as compared to € 97.9 million for the corresponding previous quarter ended March
b31, 2015. Other operating expenses includes a business interruption expense of € NIL for the quarter ended
March 31, 2016 and € 4.0 million for the quarter ended March 31, 2015 resulting from a fire at SMP’s paint
facility in Polinya, Spain (There is also a corresponding income arising out of settlement of insurance claim
accounted for under other operating income for of € NIL for the quarter ended March 31, 2016 and € 4.2 million
for the quarter ended March 31, 2015).
For the fiscal year ended March 31, 2016 other operating expenses were at € 406.2 million against € 341.1
million for the corresponding previous period. Business interruption costs of €8.6 million and € 15.2 million
were included in other operating expenses for the fiscal year ended March 31, 2016 and March 31, 2015
respectively. Increase in operating expenses is attributed primarily due to increase in variable cost of
operations due to increased capacity & production levels and start-up costs for the new plants expensed to
income statement as conservative accounting practice.
Annual Report 2015-2016
28
OTHER OPERATING INCOME
Other operating income primarily consists of income from development work & other recoveries from
customers, income from de-recognition of liabilities, recovery of proceeds from insurance claims, rental
income, royalty income and subsidies or grants. Other operating income for the quarter ended March 31, 2016
were at € 9.8 million as compared to € 30.6 million for the quarter ended March 31, 2015. This includes an
amount of € Nil for the quarter ended March 31, 2016 and € 4.2 million for the quarter ended March 31, 2015
respectively from settlement of insurance claim for fire at SMP Polinya plant.
For the fiscal year ended March 31, 2016 other operating income were € 43.3 million against € 78.1 million for
the fiscal year ended March 31, 2015. Income from settlement of insurance claim of € 9.2 million was
recognised during the fiscal year ended March 31, 2016 against € 20.5 million for the fiscal year ended March
31, 2015.
The other operating income for the quarter and year ended March 31, 2015 also include negative goodwill of
€ 13.3 million for arising out of acquisition of Scherer & Trier (In administration).
DEPRECIATION & AMORTISATION
Depreciation & Amortisation refers to the amount recognized in our income statement under this concept
reflecting the amortized value of the tangible and intangible assets on a straight-line basis over the estimated
useful life of the asset. Depreciation & Amortisation for the quarter ended March 31, 2016 were at € 38.2
million and € 23.5 million for the quarter ended March 31, 2015. For the fiscal year ended March 31, 2016 this
charge was € 121.9 million against € 87.0 million for the corresponding previous period. This increase is due to
capitalisation of new plants which started their commercial production. It also include impairment for € 11.5
million for the quarter ended March 31, 2016 and € 18.6 million for fiscal year ended March 31, 2016 at SMP
Brazil to match the carrying value of net fixed assets to future discounted cash flows.
FINANCE COSTS/(INCOME)
Finance cost consists primarily of interest expense on borrowings, finance leases and defined benefit
obligations as well as foreign exchange losses on long-term loans. Finance income consists of interest income,
return on plan assets under defined benefit obligations and foreign exchange gain. Net Finance cost for the
quarter ended March 31, 2016 was at € 8.2 million as compared to € 8.4 million for the quarter ended March
31, 2015. Finance costs for the quarter ended March 31, 2016 includes € 0.1 million towards forex loss on
reinstatement of long term foreign currency loans & € 0.7 million towards amortisation of bond issuance cost
correspondingly finance cost for the corresponding quarter last year includes € 0.5 million towards
amortisation of bond issuance cost.
For the fiscal year ended March 31, 2016 net finance costs of € 38.4 million were incurred against € 39.7 million
for the fiscal year ended March 31, 2015. However, as mentioned above finance costs for the fiscal year ended
March 31, 2016 includes € 5.7 million towards forex loss on reinstatement of long term foreign currency loans
& € 2.8 million towards amortisation of bond issuance cost and during corresponding period it includes € 5.3
million for the fiscal year ended March 31, 2015 towards write off of unamortised upfront fee and break-fee
on prepayment of various loans, € 0.2 million towards forex loss on reinstatement of long term foreign currency
loans & € 1.7 million towards amortisation of bond issuance cost
Annual Report 2015-2016
29
Excluding these exceptional costs net finance cost has reduced both during the quarter and fiscal year ended
March 31, 2016 as compared to corresponding period last year.
INCOME TAXES
Income tax represents the sum of tax currently payable and deferred tax under the laws of each jurisdiction in
which the business is conducted. Income taxes decreased by €1.1 million, or 3.6%, to € 29.1million for the fiscal
year ended March 31, 2016 from €30.2 million for the fiscal year ended March 31, 2015. Current income tax
expense for the fiscal year ended March 31, 2016 increased by €11.6 million from €38.7 million for the fiscal
year ended March 31, 2015 to €50.3 million for the fiscal year ended March 31, 2016. This increase was
primarily due to improved profitability across businesses. This was partly offsetted by recognition of additional
deferred tax asset on carried forward tax losses due to improved business conditions amounting to €12.7
million during the fiscal year ended March 31, 2016. Our effective tax rate was stable in the fiscal year ended
March 31, 2016 as compared to the fiscal year ended March 31, 2015.
Annual Report 2015-2016
30
NET WORKING CAPITAL
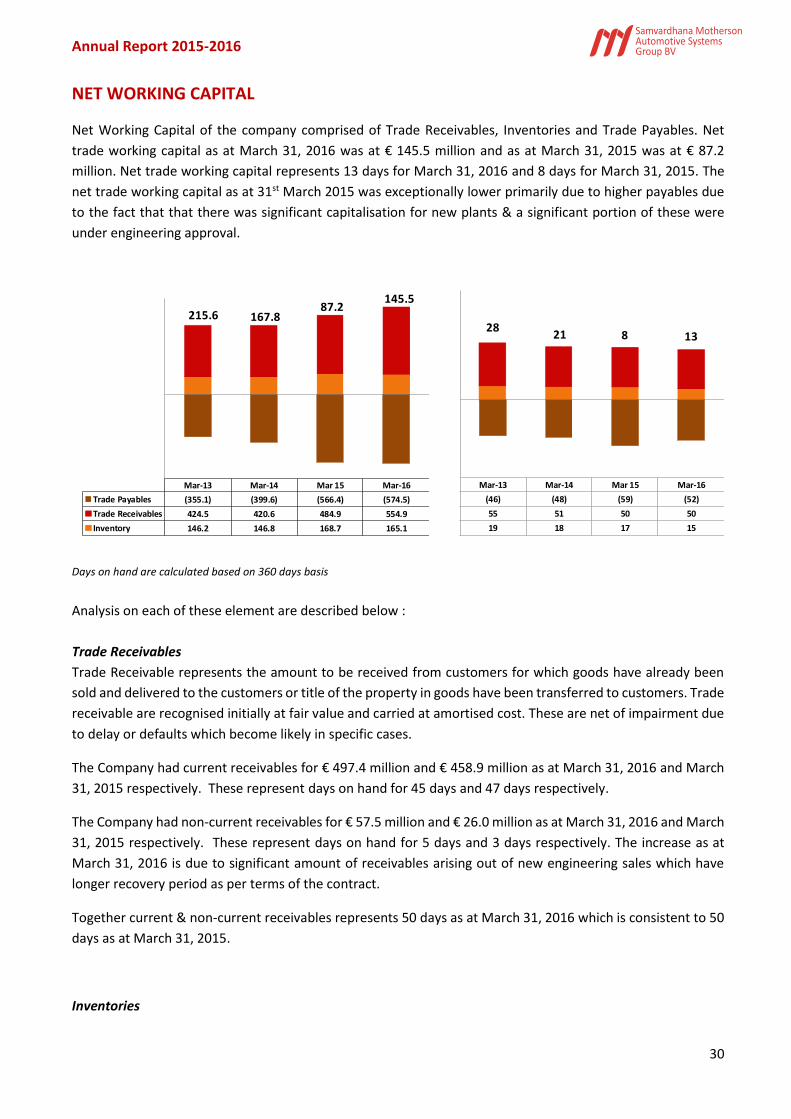
Net Working Capital of the company comprised of Trade Receivables, Inventories and Trade Payables. Net
trade working capital as at March 31, 2016 was at € 145.5 million and as at March 31, 2015 was at € 87.2
million. Net trade working capital represents 13 days for March 31, 2016 and 8 days for March 31, 2015. The
net trade working capital as at 31st March 2015 was exceptionally lower primarily due to higher payables due
to the fact that that there was significant capitalisation for new plants & a significant portion of these were
under engineering approval.
Days on hand are calculated based on 360 days basis
Analysis on each of these element are described below :
Trade Receivables
Trade Receivable represents the amount to be received from customers for which goods have already been
sold and delivered to the customers or title of the property in goods have been transferred to customers. Trade
receivable are recognised initially at fair value and carried at amortised cost. These are net of impairment due
to delay or defaults which become likely in specific cases.
The Company had current receivables for € 497.4 million and € 458.9 million as at March 31, 2016 and March
31, 2015 respectively. These represent days on hand for 45 days and 47 days respectively.
The Company had non-current receivables for € 57.5 million and € 26.0 million as at March 31, 2016 and March
31, 2015 respectively. These represent days on hand for 5 days and 3 days respectively. The increase as at
March 31, 2016 is due to significant amount of receivables arising out of new engineering sales which have
longer recovery period as per terms of the contract.
Together current & non-current receivables represents 50 days as at March 31, 2016 which is consistent to 50
days as at March 31, 2015.
Inventories
Mar-13 Mar-14 Mar 15 Mar-16
Trade Payables (46) (48) (59) (52)
Trade Receivables 55 51 50 50
Inventory 19 18 17 15
13 8 21 28
Mar-13 Mar-14 Mar 15 Mar-16
Trade Payables (355.1) (399.6) (566.4) (574.5)
Trade Receivables 424.5 420.6 484.9 554.9
Inventory 146.2 146.8 168.7 165.1
145.5 87.2
167.8 215.6
Annual Report 2015-2016
31
Inventories represent the amount of raw material, work-in-progress and finished goods held by the company
in normal course of business. Inventories are carried at the lower of the cost or net realisable value at the
reporting date. These are net of impairment due to reduced market visibility or obsolescence. The Company
had inventory for € 165.1 million and € 168.7 million as at March 31, 2016 and March 31, 2015 respectively.
These represent days on hand for 15 days and 17 days respectively. Days on hand reduced primarily due to
focussed efforts on inventory reduction at shop floor and intensify efforts on Vendor Managed Inventory to
buy Just-In-Time/Sequence inventory from the suppliers.
Payables
Payables comprise of trade payables and payables for capital goods. Trade Payables represents obligations to
pay for goods or services that have been acquired in the ordinary course of business from the suppliers. Payable
towards capital creditors represent current obligation to pay for machinery and other such items in the nature
of capital expenditure and also payables for work done by third parties in relation to assets under construction.
Payables are carried at their fair value.
The Company had Trade Payables for € 545.9 million and € 527.1 million as at March 31, 2016 and March 31,
2015 respectively. These represent days on hand for 49 days and 54 days respectively.
The company had payables of € 28.6 million and € 39.3 million towards capital creditors as at March 31, 2016
and March 31, 2015 respectively. These represent days on hand for 3 days and 4 days respectively.
As explained earlier payables were comparatively higher as at 31st March 2015 due to the fact that there was
significant payables for new plants & projects and a significant portion of these were under engineering
approval. Excluding this impact the payables are at consistent level as compared to previous quarter.
CAPITAL EXPENDITURE
SMRP BV Group’s growth strategy includes expanding operations in line with customers’ growth and sales
order book. The company is one of the few suppliers in its product segment with a global engineering &
manufacturing footprint and this strong geographical diversification enables the company to capitalise on
global growth opportunities while mitigating the impact of any regional demand fluctuations. The company
continuously assess the need for setting up Greenfield plants or expand capacities in existing plants to cater to
new platforms with existing/new customers.
SMRP BV Group is also focussed on improving the cost base by enhancing the vertical integration of the
manufacturing operations. Capital expenditure is also incurred to upgrade or replace key machineries utilised
in manufacturing & assembly process to increase production efficiencies. The establishment period for new
manufacturing facilities typically ranges between 12 and 24 months. Such capital expenditure primarily relates
to the building of new manufacturing plants or increasing the capacities in existing plants in response to new
orders from our customers. Capital expenditure is used primarily for investment in property, plant and
equipment ranging from injection moulding machines, paint line, assembly lines and various auxiliary
equipment for secondary operations.
Capital Expenditure incurred during the fiscal year ended March 31, 2016 was € 231.4 million. Break-up of
major contributors of capital expenditure is depicted in below chart:
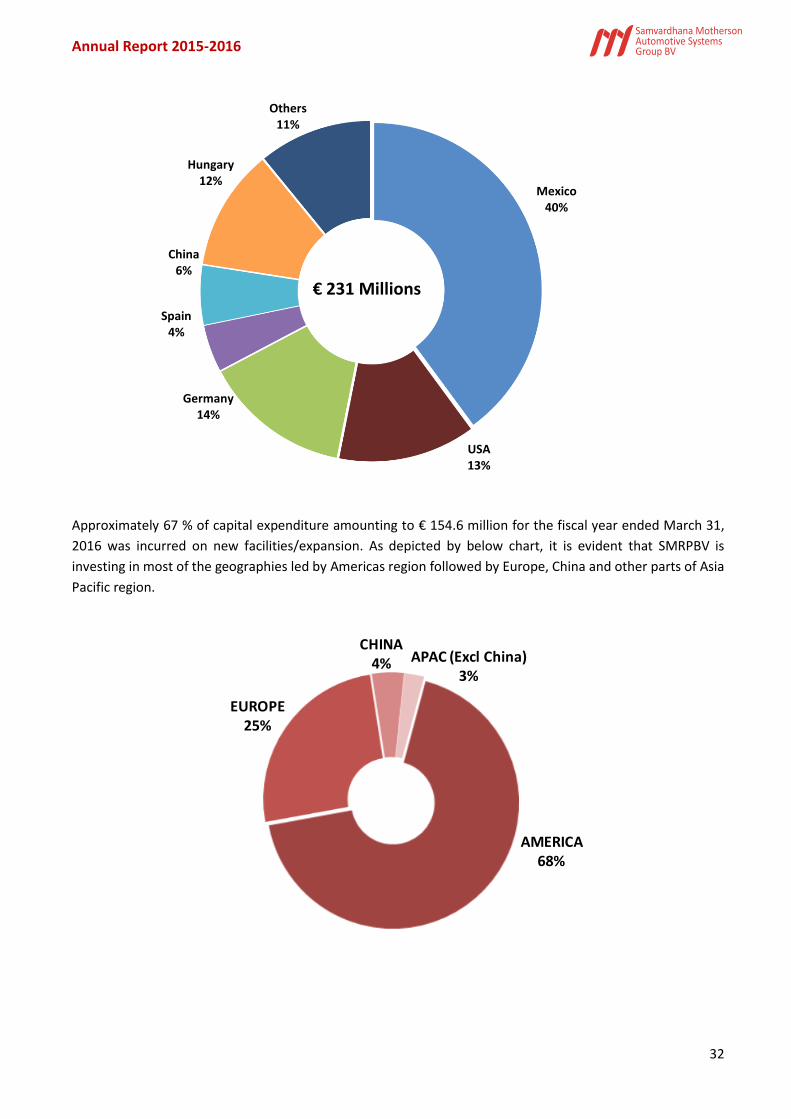
Annual Report 2015-2016
32
Approximately 67 % of capital expenditure amounting to € 154.6 million for the fiscal year ended March 31,
2016 was incurred on new facilities/expansion. As depicted by below chart, it is evident that SMRPBV is
investing in most of the geographies led by Americas region followed by Europe, China and other parts of Asia
Pacific region.
AMERICA 68%
EUROPE25%
CHINA4% APAC (Excl China)
3%
Mexico40%
USA13%
Germany 14%
Spain4%
China6%
Hungary12%
Others11%
€ 231 Millions
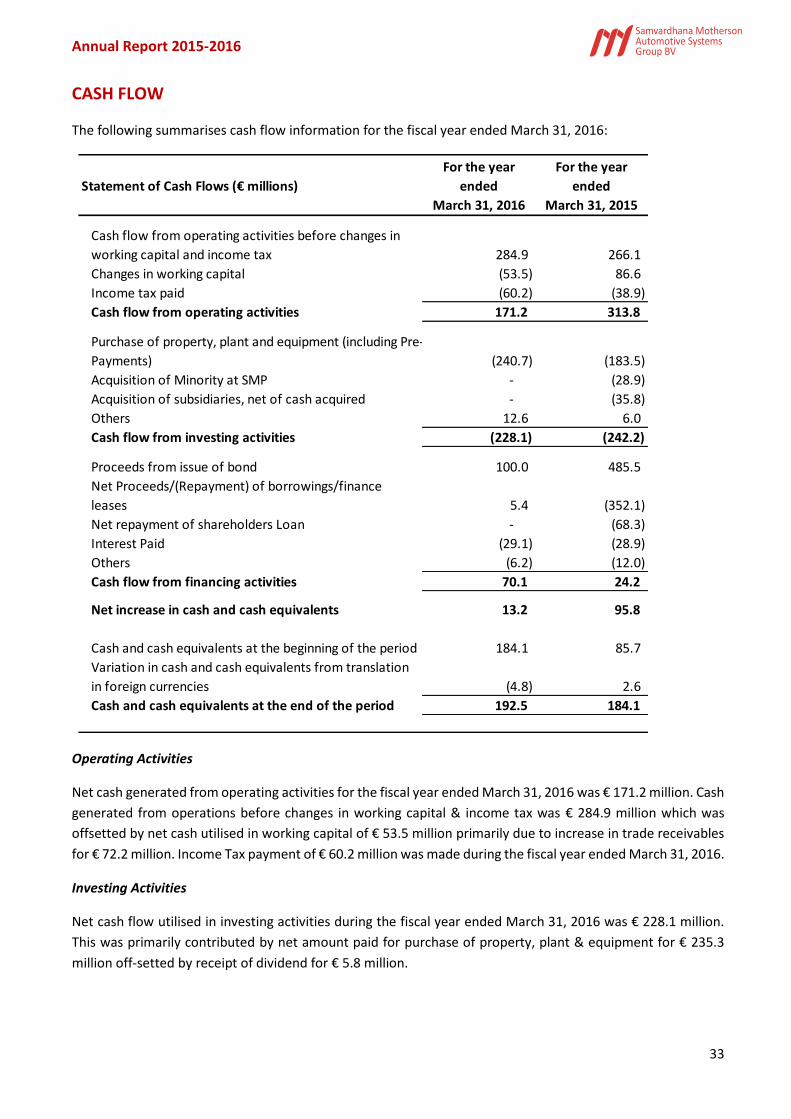
Annual Report 2015-2016
33
CASH FLOW
The following summarises cash flow information for the fiscal year ended March 31, 2016:
Operating Activities
Net cash generated from operating activities for the fiscal year ended March 31, 2016 was € 171.2 million. Cash
generated from operations before changes in working capital & income tax was € 284.9 million which was
offsetted by net cash utilised in working capital of € 53.5 million primarily due to increase in trade receivables
for € 72.2 million. Income Tax payment of € 60.2 million was made during the fiscal year ended March 31, 2016.
Investing Activities
Net cash flow utilised in investing activities during the fiscal year ended March 31, 2016 was € 228.1 million.
This was primarily contributed by net amount paid for purchase of property, plant & equipment for € 235.3
million off-setted by receipt of dividend for € 5.8 million.
Statement of Cash Flows (€ millions)
For the year
ended
March 31, 2016
For the year
ended
March 31, 2015
Cash flow from operating activities before changes in
working capital and income tax 284.9 266.1
Changes in working capital (53.5) 86.6
Income tax paid (60.2) (38.9)
Cash flow from operating activities 171.2 313.8
Purchase of property, plant and equipment (including Pre-
Payments) (240.7) (183.5)
Acquisition of Minority at SMP - (28.9)
Acquisition of subsidiaries, net of cash acquired - (35.8)
Others 12.6 6.0
Cash flow from investing activities (228.1) (242.2)
Proceeds from issue of bond 100.0 485.5
Net Proceeds/(Repayment) of borrowings/finance
leases 5.4 (352.1)
Net repayment of shareholders Loan - (68.3)
Interest Paid (29.1) (28.9)
Others (6.2) (12.0)
Cash flow from financing activities 70.1 24.2
Net increase in cash and cash equivalents 13.2 95.8
Cash and cash equivalents at the beginning of the period 184.1 85.7
Variation in cash and cash equivalents from translation
in foreign currencies (4.8) 2.6
Cash and cash equivalents at the end of the period 192.5 184.1
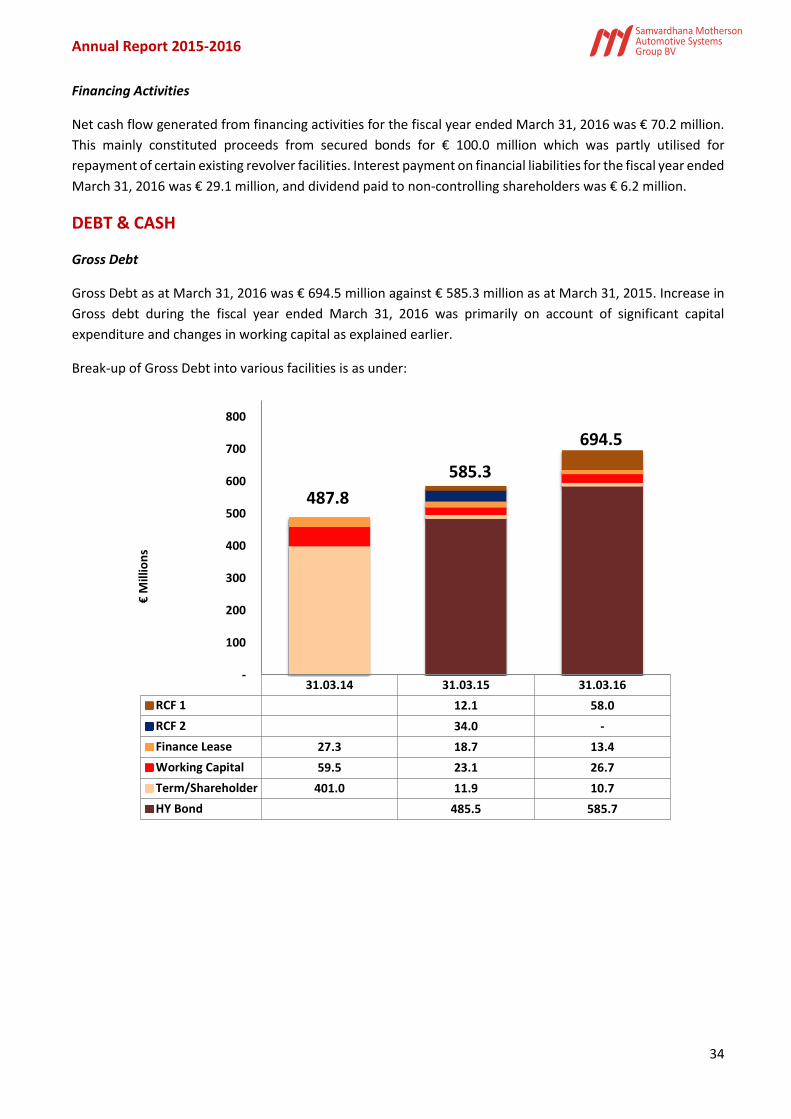
Annual Report 2015-2016
34
Financing Activities
Net cash flow generated from financing activities for the fiscal year ended March 31, 2016 was € 70.2 million.
This mainly constituted proceeds from secured bonds for € 100.0 million which was partly utilised for
repayment of certain existing revolver facilities. Interest payment on financial liabilities for the fiscal year ended
March 31, 2016 was € 29.1 million, and dividend paid to non-controlling shareholders was € 6.2 million.
DEBT & CASH
Gross Debt
Gross Debt as at March 31, 2016 was € 694.5 million against € 585.3 million as at March 31, 2015. Increase in
Gross debt during the fiscal year ended March 31, 2016 was primarily on account of significant capital
expenditure and changes in working capital as explained earlier.
Break-up of Gross Debt into various facilities is as under:
31.03.14 31.03.15 31.03.16
RCF 1 12.1 58.0
RCF 2 34.0 -
Finance Lease 27.3 18.7 13.4
Working Capital 59.5 23.1 26.7
Term/Shareholder 401.0 11.9 10.7
HY Bond 485.5 585.7
-
100
200
300
400
500
600
700
800
€M
illio
ns
694.5
585.3
487.8
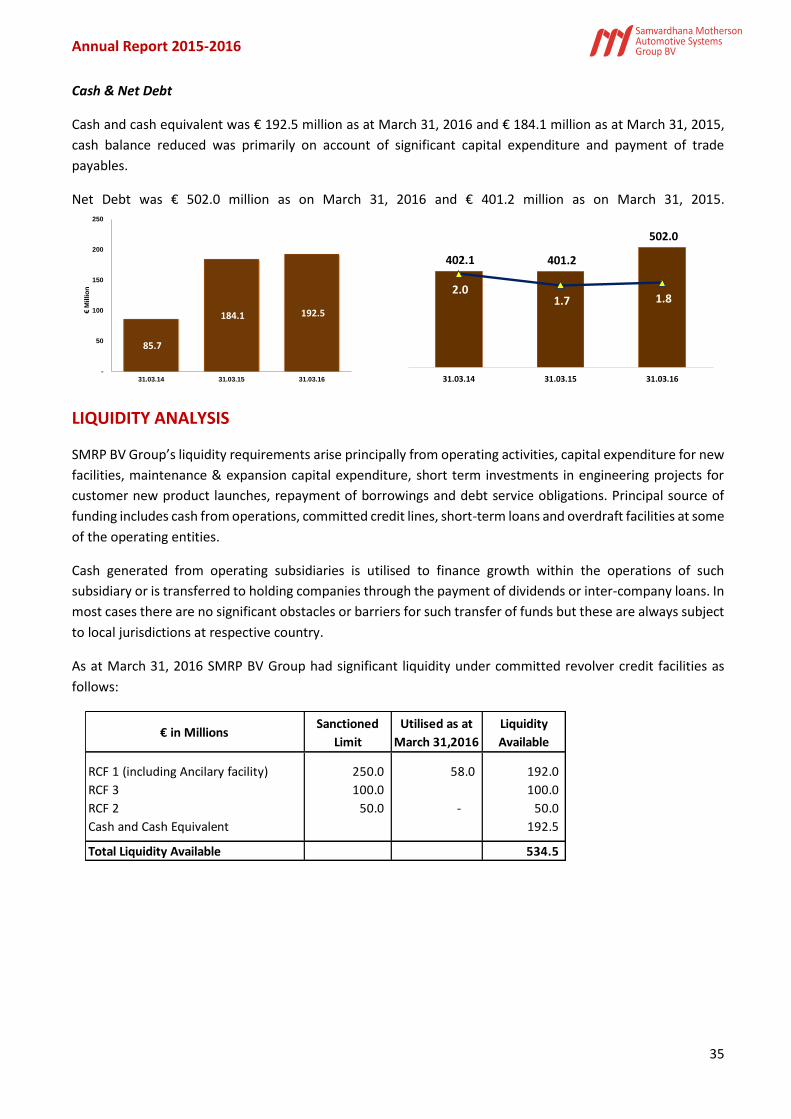
Annual Report 2015-2016
35
Cash & Net Debt
Cash and cash equivalent was € 192.5 million as at March 31, 2016 and € 184.1 million as at March 31, 2015,
cash balance reduced was primarily on account of significant capital expenditure and payment of trade
payables.
Net Debt was € 502.0 million as on March 31, 2016 and € 401.2 million as on March 31, 2015.
LIQUIDITY ANALYSIS
SMRP BV Group’s liquidity requirements arise principally from operating activities, capital expenditure for new
facilities, maintenance & expansion capital expenditure, short term investments in engineering projects for
customer new product launches, repayment of borrowings and debt service obligations. Principal source of
funding includes cash from operations, committed credit lines, short-term loans and overdraft facilities at some
of the operating entities.
Cash generated from operating subsidiaries is utilised to finance growth within the operations of such
subsidiary or is transferred to holding companies through the payment of dividends or inter-company loans. In
most cases there are no significant obstacles or barriers for such transfer of funds but these are always subject
to local jurisdictions at respective country.
As at March 31, 2016 SMRP BV Group had significant liquidity under committed revolver credit facilities as
follows:
85.7
184.1 192.5
-
50
100
150
200
250
31.03.14 31.03.15 31.03.16
€M
illi
on
402.1 401.2
502.0
2.0 1.7 1.8
31.03.14 31.03.15 31.03.16
€ in MillionsSanctioned
Limit
Utilised as at
March 31,2016
Liquidity
Available
RCF 1 (including Ancilary facility) 250.0 58.0 192.0
RCF 3 100.0 100.0
RCF 2 50.0 - 50.0
Cash and Cash Equivalent 192.5
Total Liquidity Available 534.5
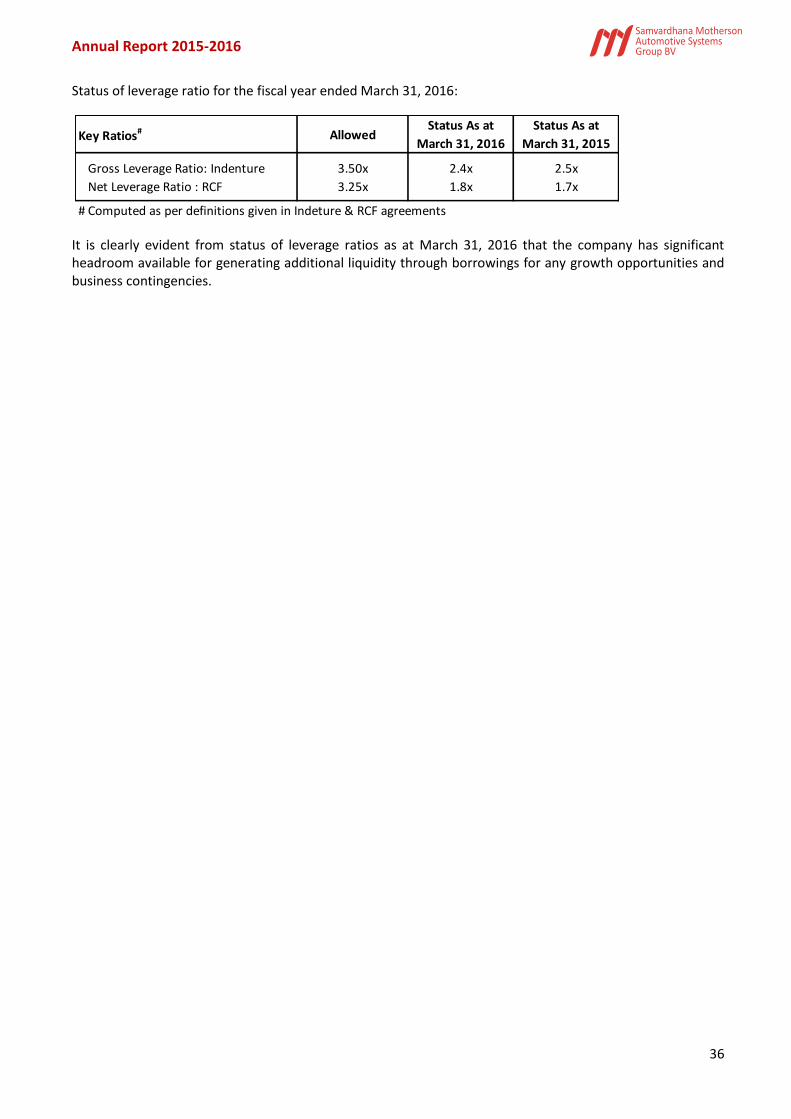
Annual Report 2015-2016
36
Status of leverage ratio for the fiscal year ended March 31, 2016:
It is clearly evident from status of leverage ratios as at March 31, 2016 that the company has significant headroom available for generating additional liquidity through borrowings for any growth opportunities and business contingencies.
Key Ratios# AllowedStatus As at
March 31, 2016
Status As at
March 31, 2015
Gross Leverage Ratio: Indenture 3.50x 2.4x 2.5x
Net Leverage Ratio : RCF 3.25x 1.8x 1.7x
# Computed as per definitions given in Indeture & RCF agreements
37
Annual Report 2015-16 Consolidated Financial Statements All amounts in Euro’000, unless otherwise stated
Samvardhana Motherson Automotive Systems
Group BV
Consolidated Financial Statements
For the year ended March 31, 2016
38
Annual Report 2015-16 Consolidated Financial Statements All amounts in Euro’000, unless otherwise stated
A. CONSOLIDATED FINANCIAL STATEMENTS............................................................... 40
A.1 Consolidated Statement of Financial Position…............................................................. 41
A.2 Consolidated Income Statement.................................................................................... 42
A.3 Consolidated Statement of Comprehensive Income...................................................... 43
A.4 Consolidated Cash Flow Statement................................................................................ 44
A.5 Consolidated Statement of Changes in Equity…….......................................................... 46
A.6 Notes to the Consolidated Financial Statements........................................................... 48
A.6.1 General information and description of the business..................................................... 48
A.6.2 Summary of significant accounting policies................................................................... 49
A.6.3 Disclosures regarding Consolidated Statement of Financial Position............................. 71
A.6.4 Disclosures regarding Consolidated Income Statement and Other Comprehensive
Income
96
A.6.5 Income Taxes.................................................................................................................. 99
A.6.6 Other Disclosures........................................................................................................... 104
A.6.8 Subsequent Events........................................................................................................ 121
39
Annual Report 2015-16 Consolidated Financial Statements All amounts in Euro’000, unless otherwise stated
ABBREVIATIONS
€ Euro (European currency) k€ Thousands of Euros $ US Dollar (US currency) IASB International Accounting Standards Board IFRS International Financial Reporting Standards EU European Union
Abbreviations used for companies
SMRP BV Group Samvardhana Motherson Automotive Systems Group B.V & its subsidiaries SMR Group Samvardhana Motherson Reflectec Group Holdings Limited & its subsidiaries SMP Group Samvardhana Motherson Peguform GmbH Germany & its subsidiaries, SMP
Automotive Technology Ibérica S.L. & its subsidiaries and SMP Automotive Interiors (Beijing) Co. Ltd.
SMP GmbH Samvardhana Motherson Peguform GmbH, Germany SMR Samvardhana Motherson Reflectec Group Holdings Limited, Jersey SMP Deutschland SMP Deutschland GmbH, Bötzingen, Germany
SMP AE SMP Automotive Exterior GmbH, Germany SMR Cyprus Samvardhana Automotive Technology Holding Cyprus Limited, Cyprus SMP Ibérica SMP Automotive Technology Ibérica S.L., Polinyà del Vallés, Spain SMR Holding Deutschland
SMR Automotive Mirror Systems Holding Deutschland
NSHAM Ningbo SMR Huaxiang Automotive Mirrors Co., Ltd, China CPAT Changchun Peguform Automotive Plastics Technology Co., Ltd., Changchun, China MRA Modulos Ribera Alta S.L.U., Zaragoza/Spain CEFA Celulosa Fabril (Cefa) S.A., Zaragoza, Spain SMPL Samvardhana Motherson Polymers Limited, India SMGHL Samvardhana Motherson Global Holdings Ltd, Cyprus MSSL Motherson Sumi Systems Limited, India SMIL India Samvardhana Motherson International Limited, India

40
A. CONSOLIDATED FINANCIAL STATEMENTS
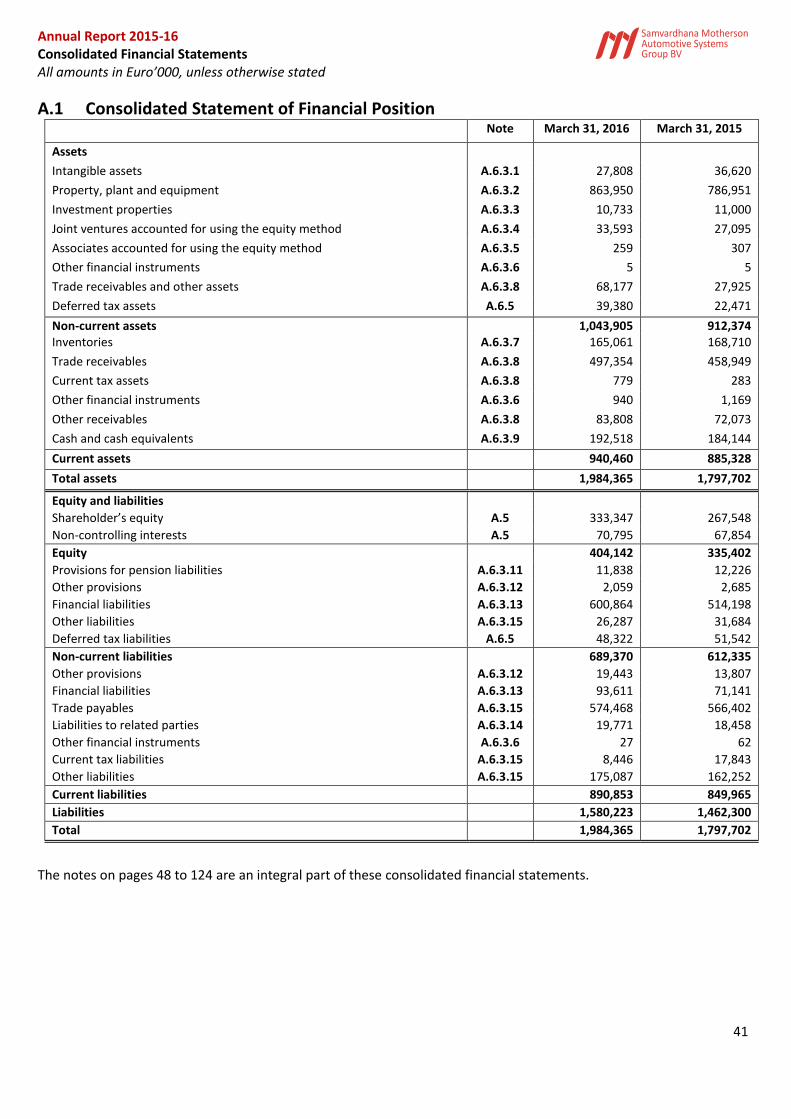
Annual Report 2015-16 Consolidated Financial Statements All amounts in Euro’000, unless otherwise stated
41
A.1 Consolidated Statement of Financial Position Note March 31, 2016 March 31, 2015
Assets
Intangible assets A.6.3.1 27,808 36,620
Property, plant and equipment A.6.3.2 863,950 786,951
Investment properties A.6.3.3 10,733 11,000
Joint ventures accounted for using the equity method A.6.3.4 33,593 27,095
Associates accounted for using the equity method A.6.3.5 259 307
Other financial instruments A.6.3.6 5 5
Trade receivables and other assets A.6.3.8 68,177 27,925
Deferred tax assets A.6.5 39,380 22,471
Non-current assets 1,043,905 912,374 Inventories A.6.3.7 165,061 168,710
Trade receivables A.6.3.8 497,354 458,949
Current tax assets A.6.3.8 779 283
Other financial instruments A.6.3.6 940 1,169
Other receivables A.6.3.8 83,808 72,073
Cash and cash equivalents A.6.3.9 192,518 184,144
Current assets 940,460 885,328
Total assets 1,984,365 1,797,702
Equity and liabilities
Shareholder’s equity A.5 333,347 267,548
Non-controlling interests A.5 70,795 67,854
Equity 404,142 335,402
Provisions for pension liabilities A.6.3.11 11,838 12,226
Other provisions A.6.3.12 2,059 2,685
Financial liabilities A.6.3.13 600,864 514,198
Other liabilities A.6.3.15 26,287 31,684
Deferred tax liabilities A.6.5 48,322 51,542
Non-current liabilities 689,370 612,335
Other provisions A.6.3.12 19,443 13,807
Financial liabilities A.6.3.13 93,611 71,141
Trade payables A.6.3.15 574,468 566,402
Liabilities to related parties A.6.3.14 19,771 18,458
Other financial instruments A.6.3.6 27 62
Current tax liabilities A.6.3.15 8,446 17,843
Other liabilities A.6.3.15 175,087 162,252
Current liabilities 890,853 849,965
Liabilities 1,580,223 1,462,300
Total 1,984,365 1,797,702
The notes on pages 48 to 124 are an integral part of these consolidated financial statements.
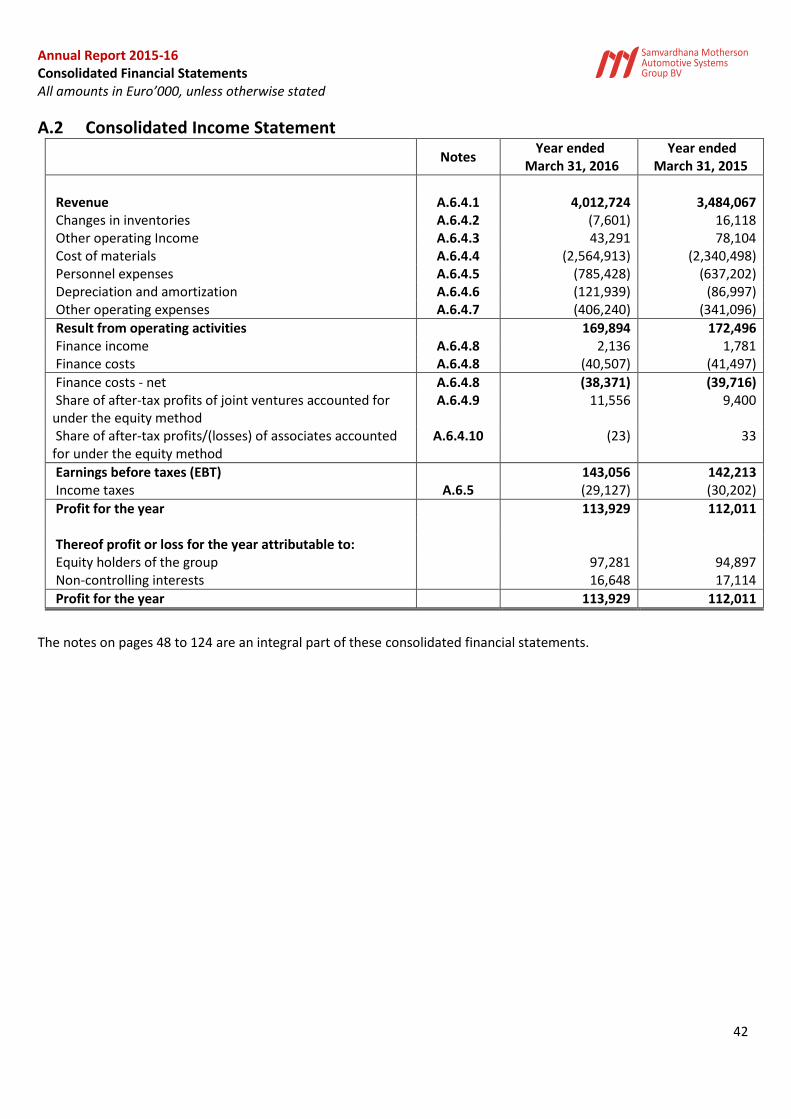
Annual Report 2015-16 Consolidated Financial Statements All amounts in Euro’000, unless otherwise stated
42
A.2 Consolidated Income Statement
Notes Year ended
March 31, 2016 Year ended
March 31, 2015
Revenue A.6.4.1 4,012,724 3,484,067 Changes in inventories A.6.4.2 (7,601) 16,118 Other operating Income A.6.4.3 43,291 78,104 Cost of materials A.6.4.4 (2,564,913) (2,340,498) Personnel expenses A.6.4.5 (785,428) (637,202) Depreciation and amortization A.6.4.6 (121,939) (86,997) Other operating expenses A.6.4.7 (406,240) (341,096)
Result from operating activities 169,894 172,496 Finance income A.6.4.8 2,136 1,781 Finance costs A.6.4.8 (40,507) (41,497)
Finance costs - net A.6.4.8 (38,371) (39,716) Share of after-tax profits of joint ventures accounted for under the equity method
A.6.4.9 11,556 9,400
Share of after-tax profits/(losses) of associates accounted for under the equity method
A.6.4.10 (23) 33
Earnings before taxes (EBT) 143,056 142,213 Income taxes A.6.5 (29,127) (30,202)
Profit for the year 113,929 112,011 Thereof profit or loss for the year attributable to: Equity holders of the group 97,281 94,897 Non-controlling interests 16,648 17,114
Profit for the year 113,929 112,011
The notes on pages 48 to 124 are an integral part of these consolidated financial statements.
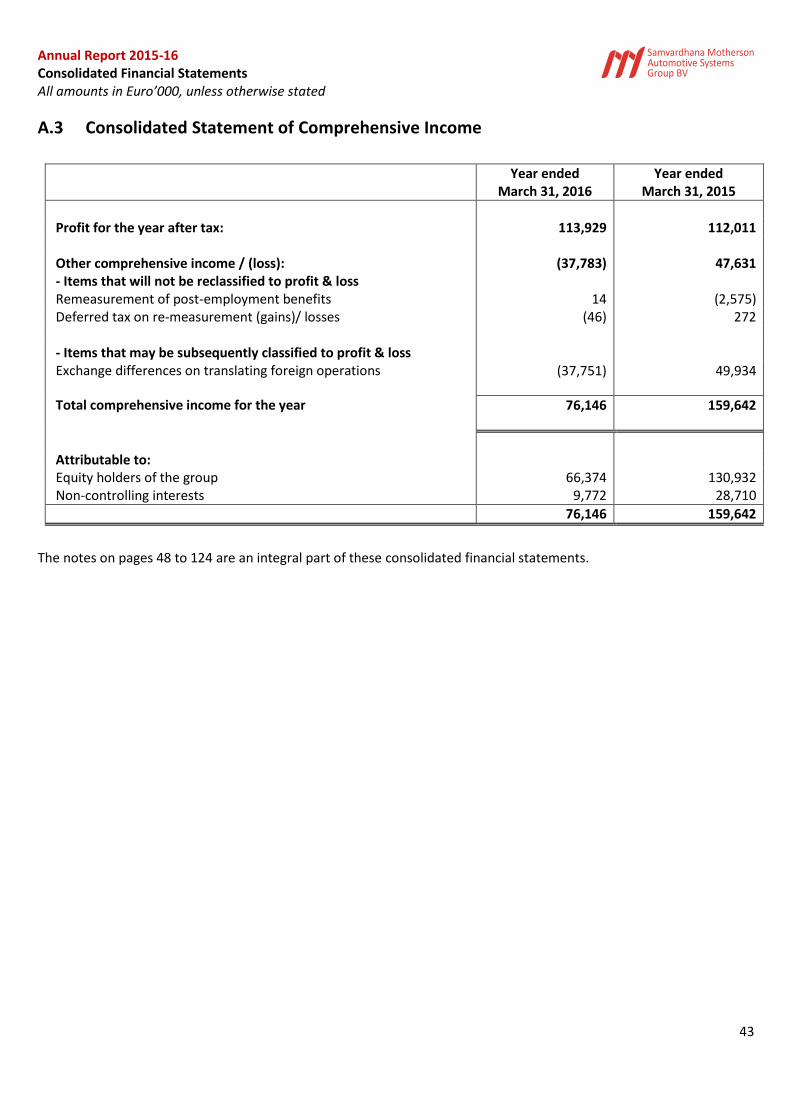
Annual Report 2015-16 Consolidated Financial Statements All amounts in Euro’000, unless otherwise stated
43
A.3 Consolidated Statement of Comprehensive Income
Year ended
March 31, 2016 Year ended
March 31, 2015
Profit for the year after tax: 113,929 112,011 Other comprehensive income / (loss): (37,783) 47,631 - Items that will not be reclassified to profit & loss Remeasurement of post-employment benefits 14 (2,575) Deferred tax on re-measurement (gains)/ losses (46) 272 - Items that may be subsequently classified to profit & loss Exchange differences on translating foreign operations (37,751) 49,934
Total comprehensive income for the year 76,146 159,642
Attributable to: Equity holders of the group 66,374 130,932 Non-controlling interests 9,772 28,710
76,146 159,642
The notes on pages 48 to 124 are an integral part of these consolidated financial statements.
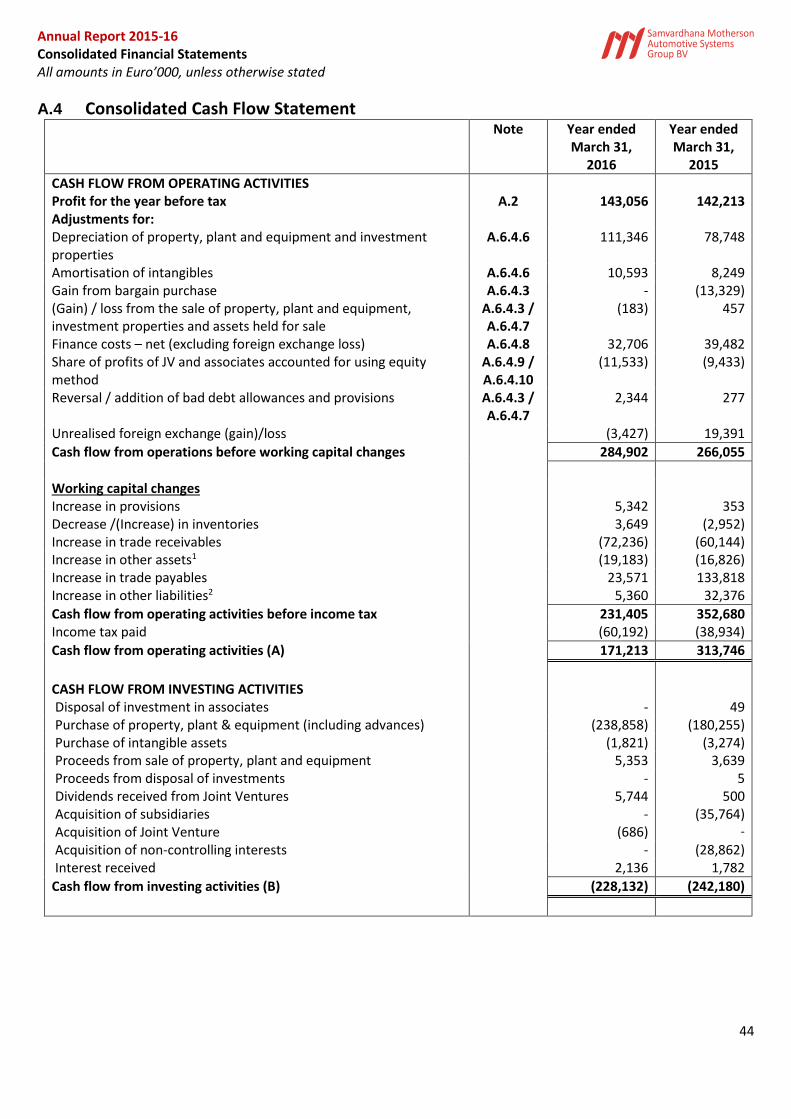
Annual Report 2015-16 Consolidated Financial Statements All amounts in Euro’000, unless otherwise stated
44
A.4 Consolidated Cash Flow Statement Note Year ended
March 31, 2016
Year ended March 31,
2015
CASH FLOW FROM OPERATING ACTIVITIES Profit for the year before tax A.2 143,056 142,213 Adjustments for: Depreciation of property, plant and equipment and investment properties
A.6.4.6 111,346 78,748
Amortisation of intangibles A.6.4.6 10,593 8,249 Gain from bargain purchase A.6.4.3 - (13,329) (Gain) / loss from the sale of property, plant and equipment, investment properties and assets held for sale
A.6.4.3 / A.6.4.7
(183) 457
Finance costs – net (excluding foreign exchange loss) A.6.4.8 32,706 39,482 Share of profits of JV and associates accounted for using equity method
A.6.4.9 / A.6.4.10
(11,533) (9,433)
Reversal / addition of bad debt allowances and provisions A.6.4.3 / A.6.4.7
2,344 277
Unrealised foreign exchange (gain)/loss (3,427) 19,391
Cash flow from operations before working capital changes 284,902 266,055
Working capital changes Increase in provisions 5,342 353 Decrease /(Increase) in inventories 3,649 (2,952) Increase in trade receivables (72,236) (60,144) Increase in other assets1 (19,183) (16,826) Increase in trade payables 23,571 133,818 Increase in other liabilities2 5,360 32,376
Cash flow from operating activities before income tax 231,405 352,680 Income tax paid (60,192) (38,934)
Cash flow from operating activities (A) 171,213 313,746
CASH FLOW FROM INVESTING ACTIVITIES Disposal of investment in associates - 49 Purchase of property, plant & equipment (including advances) (238,858) (180,255) Purchase of intangible assets (1,821) (3,274) Proceeds from sale of property, plant and equipment 5,353 3,639 Proceeds from disposal of investments - 5 Dividends received from Joint Ventures 5,744 500 Acquisition of subsidiaries - (35,764) Acquisition of Joint Venture (686) -
Acquisition of non-controlling interests - (28,862) Interest received 2,136 1,782
Cash flow from investing activities (B) (228,132) (242,180)
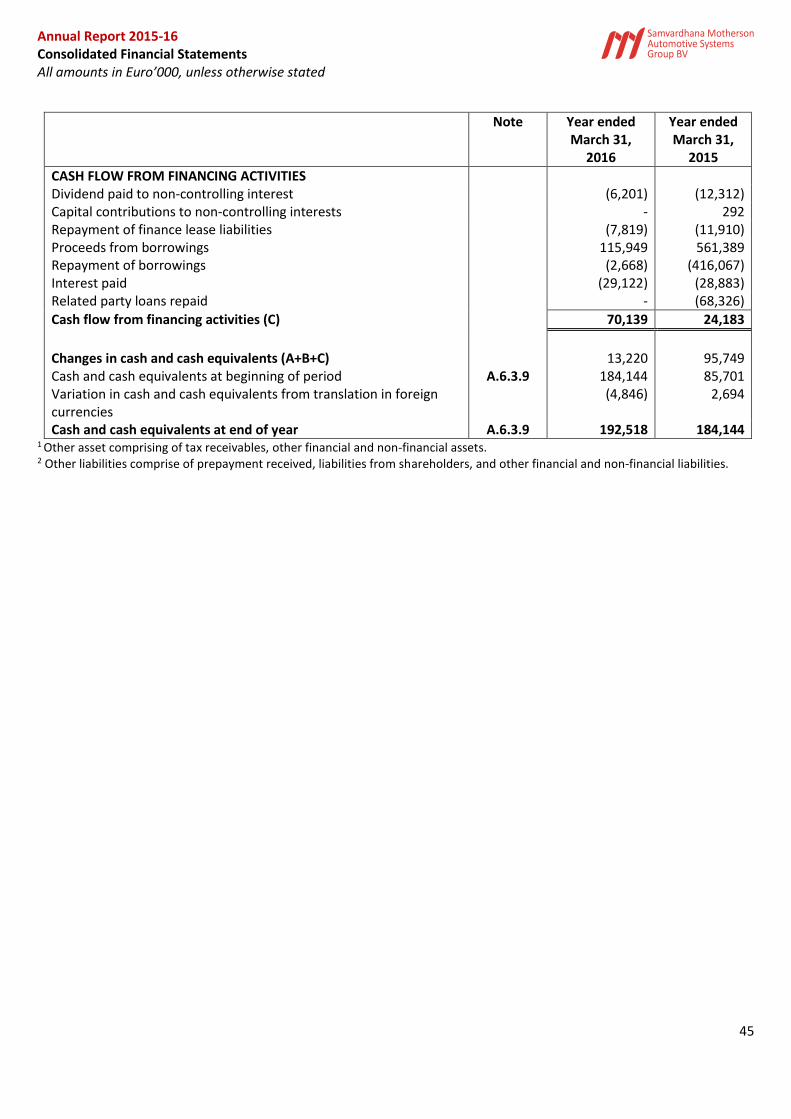
Annual Report 2015-16 Consolidated Financial Statements All amounts in Euro’000, unless otherwise stated
45
Note Year ended March 31,
2016
Year ended March 31,
2015
CASH FLOW FROM FINANCING ACTIVITIES Dividend paid to non-controlling interest (6,201) (12,312) Capital contributions to non-controlling interests - 292 Repayment of finance lease liabilities (7,819) (11,910) Proceeds from borrowings 115,949 561,389 Repayment of borrowings (2,668) (416,067) Interest paid (29,122) (28,883) Related party loans repaid - (68,326)
Cash flow from financing activities (C) 70,139 24,183
Changes in cash and cash equivalents (A+B+C) 13,220 95,749 Cash and cash equivalents at beginning of period A.6.3.9 184,144 85,701 Variation in cash and cash equivalents from translation in foreign currencies
(4,846) 2,694
Cash and cash equivalents at end of year A.6.3.9 192,518 184,144 1 Other asset comprising of tax receivables, other financial and non-financial assets. 2 Other liabilities comprise of prepayment received, liabilities from shareholders, and other financial and non-financial liabilities.
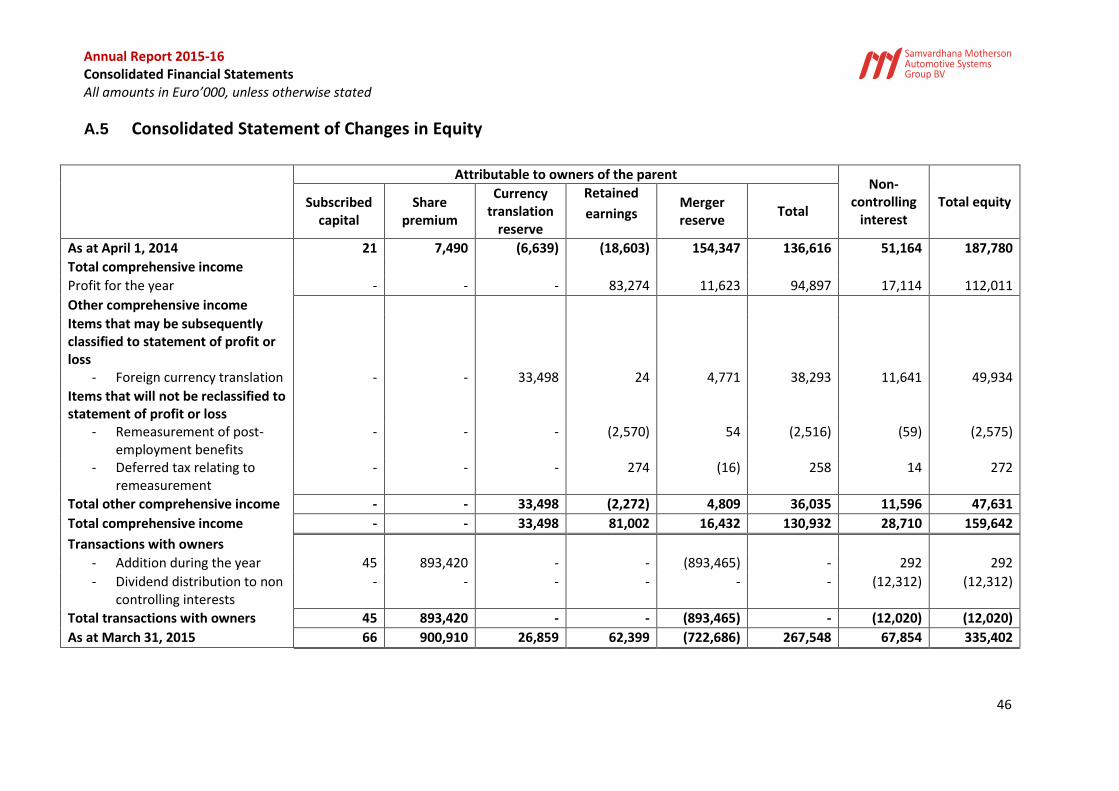
Annual Report 2015-16 Consolidated Financial Statements All amounts in Euro’000, unless otherwise stated
46
A.5 Consolidated Statement of Changes in Equity
Attributable to owners of the parent
Non-controlling
interest Total equity Subscribed
capital Share
premium
Currency translation
reserve
Retained
earnings Merger reserve
Total
As at April 1, 2014 21 7,490 (6,639) (18,603) 154,347 136,616 51,164 187,780
Total comprehensive income
Profit for the year - - - 83,274 11,623 94,897 17,114 112,011
Other comprehensive income
Items that may be subsequently classified to statement of profit or loss
- Foreign currency translation - - 33,498 24 4,771 38,293 11,641 49,934
Items that will not be reclassified to statement of profit or loss
- Remeasurement of post-employment benefits
- - - (2,570) 54 (2,516) (59) (2,575)
- Deferred tax relating to remeasurement
- - - 274 (16) 258 14 272
Total other comprehensive income - - 33,498 (2,272) 4,809 36,035 11,596 47,631
Total comprehensive income - - 33,498 81,002 16,432 130,932 28,710 159,642
Transactions with owners
- Addition during the year 45 893,420 - - (893,465) - 292 292
- Dividend distribution to non controlling interests
- - - - - - (12,312) (12,312)
Total transactions with owners 45 893,420 - - (893,465) - (12,020) (12,020)
As at March 31, 2015 66 900,910 26,859 62,399 (722,686) 267,548 67,854 335,402
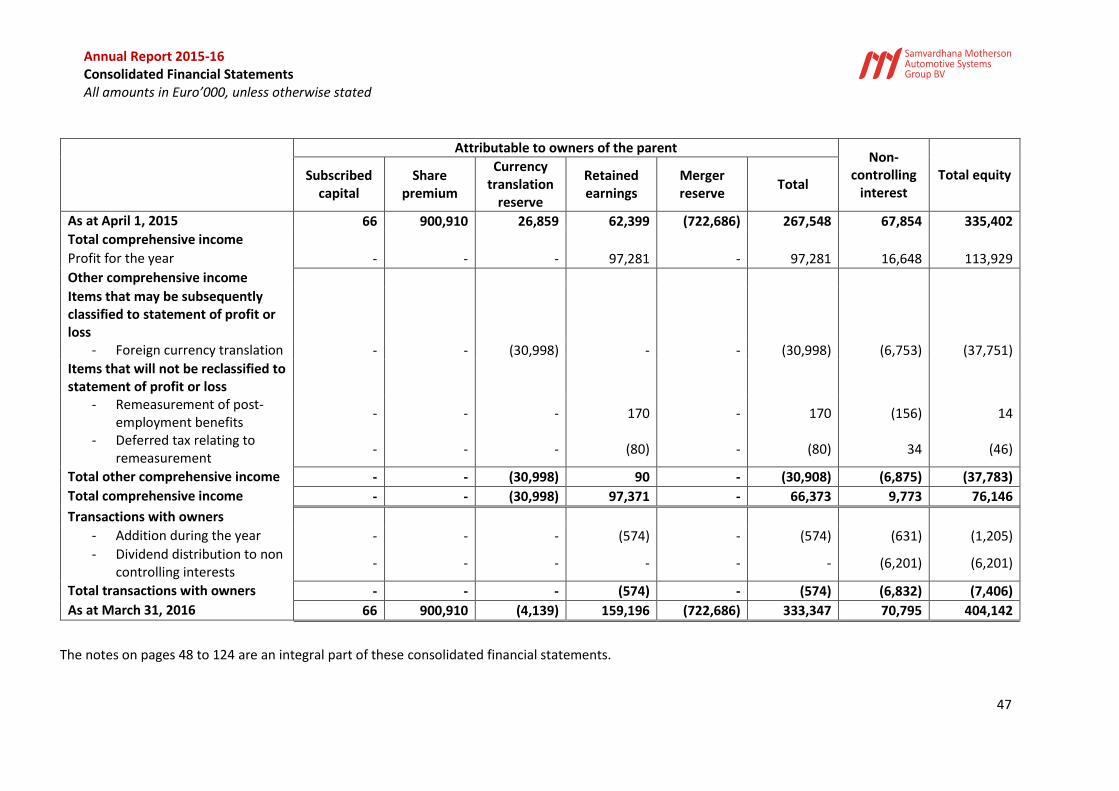
Annual Report 2015-16 Consolidated Financial Statements All amounts in Euro’000, unless otherwise stated
47
Attributable to owners of the parent Non-
controlling interest
Total equity Subscribed capital
Share premium
Currency translation
reserve
Retained earnings
Merger reserve
Total
As at April 1, 2015 66 900,910 26,859 62,399 (722,686) 267,548 67,854 335,402 Total comprehensive income
Profit for the year - - - 97,281 - 97,281 16,648 113,929
Other comprehensive income Items that may be subsequently classified to statement of profit or loss
- Foreign currency translation - - (30,998) - - (30,998) (6,753) (37,751)
Items that will not be reclassified to statement of profit or loss
- Remeasurement of post-employment benefits
- - - 170 - 170 (156) 14
- Deferred tax relating to remeasurement
- - - (80) - (80) 34 (46)
Total other comprehensive income - - (30,998) 90 - (30,908) (6,875) (37,783)
Total comprehensive income - - (30,998) 97,371 - 66,373 9,773 76,146
Transactions with owners - Addition during the year - - - (574) - (574) (631) (1,205) - Dividend distribution to non
controlling interests - - - - - - (6,201) (6,201)
Total transactions with owners - - - (574) - (574) (6,832) (7,406)
As at March 31, 2016 66 900,910 (4,139) 159,196 (722,686) 333,347 70,795 404,142
The notes on pages 48 to 124 are an integral part of these consolidated financial statements.
Annual Report 2015-16 Consolidated Financial Statements All amounts in Euro’000, unless otherwise stated
48
A.6. Notes to the Consolidated Financial Statements
A.6.1 General information and description of the business
These consolidated financial statements comprise of Samvardhana Motherson Automotive Systems Group BV (SMRP BV) and its subsidiaries (hereinafter referred to as “SMRP BV Group”or “the Group”) for the year ended March 31, 2016. MSSL is the ultimate parent of SMRP BV Group. SMRP BV is a private company with limited liability, incorporated under the laws of the Netherlands on
October 07, 2011. Its registered office and principal place of business is situated at Hoogoorddreef 15,
1101 BA Amsterdam, The Netherlands.
These consolidated financial statements have been authorised for issue by SMRP BV’s management and supervisory board on May 27, 2016. On June 13, 2014, SMRP BV acquired 98.45% shareholding of Samvardhana Motherson Reflectec Group Holdings Limited (SMR Jersey) from Samvardhana Motherson Group Holdings Limited (SMGHL), Cyprus in share exchange deal wherein SMGHL transferred its entire shareholding (including acquired on June 9, 2014 from minority shareholders) to SMRP BV in exchange of 45,676 shares of a nominal value of € 1 each issued by SMRP BV and consequently SMRP BV has become subsidiary of SMGHL. Shareholders of SMRP BV have approved allotment of shares to SMGHL in their meeting dated June 13, 2014. On June 24, 2014, SMRP BV acquired 16.28% stake held by PF Beteiligungsverwaltungs (Cross Industries AG). PF Beteiligungsverwaltungs had exercised put option for 16.28% held by them in SMP Deutschland GmbH and SMP Automotive Technology Iberica S.L. in accordance with the framework agreement. Consequent to this buy out SMRP BV along with SMGHL holds 100% in SMP Deutschland GmbH and SMP Automotive Technology Iberica S.L. SMR Group SMR Jersey was incorporated on February 16, 2009. On March 6, 2009 Samvardhana Motherson Reflectec Group Holdings Limited acquired the Visiocorp Group and with this acquisition commenced its operating business. SMR Group develops and produces a wide range of exterior mirrors from simple prismatic versions up to complex multi-function systems. In addition to the mirror technology, the Group develops and produces driver assistance systems such as detection systems in the door mirror for monitoring blind spots or mirror turn signals. It has production facilities and engineering centres in 14 countries across the globe. SMP Group SMRP BV acquired the Peguform Group as on November 23, 2011.
SMP Group supplies plastic parts and system modules for vehicle interiors and exteriors. Products for vehicle interiors include in particular interior door panels and dashboards. For exteriors, bumpers and other bodywork components are manufactured. The product range encompasses individual parts and complete modules, with engineering and tooling services also being provided. It has production facilities and engineering centres in 7 countries across the globe.
Annual Report 2015-16 Consolidated Financial Statements All amounts in Euro’000, unless otherwise stated
49
A.6.2 Summary of Significant Accounting Policies
A.6.2.1 Basis of preparation
The consolidated financial statements of the Company have been prepared for the financial year beginning April 01, 2015 and ending on March 31, 2016. On June 13, 2014, SMRP BV acquired 98.45% shareholding of Samvardhana Motherson Reflectec Group Holdings Limited (SMR Group) from Samvardhana Motherson Group Holdings Limited (SMGHL), Cyprus in share exchange deal wherein SMGHL transferred its entire shareholding (including acquired on June 9, 2014 from minority shareholders) to SMRP BV in exchange of 45,676 shares of a nominal value of € 1 each issued by SMRP BV and consequently SMRP BV has become subsidiary of SMGHL. Shareholders of SMRP BV approved allotment of shares to SMGHL in their meeting dated June 13, 2014. Prior to June 13, 2014, SMRP BV and SMR Group were jointly controlled by Motherson Sumi Systems Limited (MSSL India) and Samvardhana Motherson International Limited (SMIL India) and after this transaction SMRP BV Group comprising SMR Group continue to be jointly controlled by MSSL India and SMIL India. SMR Group’s business continues to be reviewed by the Chief Operating Decision Maker (“CODM”) as a distinct operating segment and the relevant information of segment profitability and financial position can found in Note A.6.6.3 “Operating Segment Information”. As this transaction is done under “common control” as defined by IFRS, the activities of SMR Group for the period prior to June 13, 2014 had been included in the consolidated accounts using the predecessor accounting method. This accounting treatment lead to differences on consolidation between consideration and fair value of the underlying net assets and this difference is included within equity as a merger reserve. All subsequent business combinations are accounted for using the acquisition method of accounting. The consolidated financial statements have been prepared in accordance with International Financial Reporting Standards (“IFRS”) as adopted by the European Union (“IFRS EU”). The consolidated financial statements have been prepared under the historical cost convention except for available-for-sale financial assets, and financial assets and financial liabilities (including derivative instruments) at fair value through profit or loss.
The consolidated financial statements are presented in euros and all values are rounded to the nearest thousand (€000), except when otherwise indicated.
A.6.2.2 Currency translation
A.6.2.2.1 Transactions in foreign currencies
All transactions are recorded in functional currency of the principal operating environment in which each
Group company operates. The Consolidated financial statements are presented in ‘euro’, which is also the
parent company’s functional currency.
Foreign currency transactions are translated into the functional currency using the exchange rates
prevailing at the dates of the transactions. Monetary assets and liabilities denominated in foreign

Annual Report 2015-16 Consolidated Financial Statements All amounts in Euro’000, unless otherwise stated
50
currencies at the reporting date are translated into the functional currency at the rate prevailing on this
date. Differences from foreign currency transactions are reported in the income statement. Non-monetary
assets and liabilities that are measured at historical cost in foreign currencies at the reporting date are
translated into the functional currency at the rate prevailing on the day of the transaction. Non-monetary
assets and liabilities that are measured at fair value in foreign currencies at the reporting date are
translated into the functional currency at the rate prevailing on the date on which the fair value was
determined.
This space has been intentionally left blank.
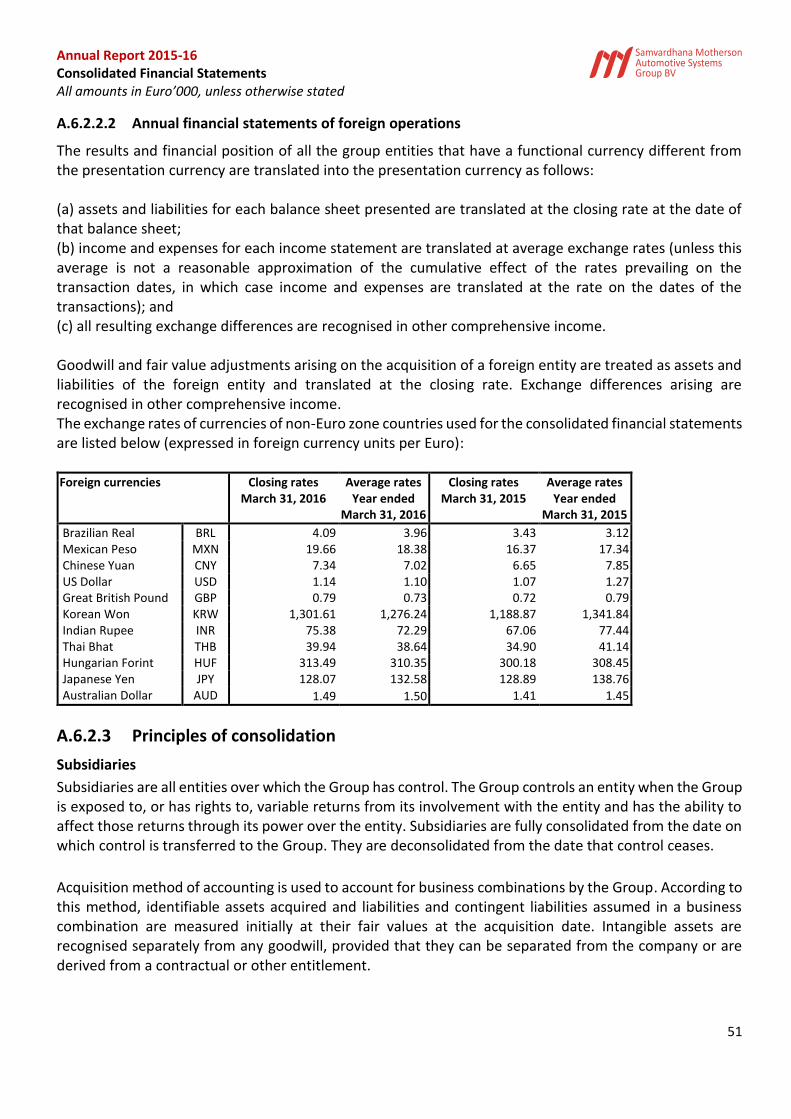
Annual Report 2015-16 Consolidated Financial Statements All amounts in Euro’000, unless otherwise stated
51
A.6.2.2.2 Annual financial statements of foreign operations
The results and financial position of all the group entities that have a functional currency different from the presentation currency are translated into the presentation currency as follows: (a) assets and liabilities for each balance sheet presented are translated at the closing rate at the date of that balance sheet; (b) income and expenses for each income statement are translated at average exchange rates (unless this average is not a reasonable approximation of the cumulative effect of the rates prevailing on the transaction dates, in which case income and expenses are translated at the rate on the dates of the transactions); and (c) all resulting exchange differences are recognised in other comprehensive income. Goodwill and fair value adjustments arising on the acquisition of a foreign entity are treated as assets and liabilities of the foreign entity and translated at the closing rate. Exchange differences arising are recognised in other comprehensive income. The exchange rates of currencies of non-Euro zone countries used for the consolidated financial statements are listed below (expressed in foreign currency units per Euro): Foreign currencies Closing rates Average rates Closing rates Average rates
March 31, 2016 Year ended March 31, 2016
March 31, 2015 Year ended March 31, 2015
Brazilian Real BRL 4.09 3.96 3.43 3.12 Mexican Peso MXN 19.66 18.38 16.37 17.34 Chinese Yuan CNY 7.34 7.02 6.65 7.85 US Dollar USD 1.14 1.10 1.07 1.27 Great British Pound GBP 0.79 0.73 0.72 0.79 Korean Won KRW 1,301.61 1,276.24 1,188.87 1,341.84 Indian Rupee INR 75.38 72.29 67.06 77.44 Thai Bhat THB 39.94 38.64 34.90 41.14 Hungarian Forint HUF 313.49 310.35 300.18 308.45 Japanese Yen JPY 128.07 132.58 128.89 138.76 Australian Dollar AUD 1.49 1.50 1.41 1.45
A.6.2.3 Principles of consolidation
Subsidiaries
Subsidiaries are all entities over which the Group has control. The Group controls an entity when the Group is exposed to, or has rights to, variable returns from its involvement with the entity and has the ability to affect those returns through its power over the entity. Subsidiaries are fully consolidated from the date on which control is transferred to the Group. They are deconsolidated from the date that control ceases.
Acquisition method of accounting is used to account for business combinations by the Group. According to this method, identifiable assets acquired and liabilities and contingent liabilities assumed in a business combination are measured initially at their fair values at the acquisition date. Intangible assets are recognised separately from any goodwill, provided that they can be separated from the company or are derived from a contractual or other entitlement.
Annual Report 2015-16 Consolidated Financial Statements All amounts in Euro’000, unless otherwise stated
52
Goodwill is initially measured as the excess of the aggregate of the consideration transferred and the amount of non-controlling interest over the net identifiable assets acquired and liabilities assumed. If this consideration and the fair value of non-controlling interest is lower than the fair value of the net assets of the subsidiary acquired, the difference is directly recognised in profit or loss. The Group recognises any non-controlling interest in the acquiree on an acquisition-by-acquisition basis, either at fair value or at the non-controlling interest’s proportionate share of the recognised amounts of acquiree’s identifiable net assets. The potential cash payments related to put options issued by the Group over the equity of subsidiary companies are accounted for as financial liabilities when such options may only be settled other than by exchange of a fixed amount of cash or another financial asset for a fixed number of shares in the subsidiary. The amount that may become payable under the option on exercise is initially recognised at fair value within liabilities with a corresponding charge directly to equity. The charge to equity is recognised separately as written put options over non-controlling interests, adjacent to non-controlling interests in the net assets of consolidated subsidiaries. The Group recognises the cost of writing such put options, determined as the excess of the fair value of the option over any consideration received, as a financing cost. Such options are subsequently measured at amortised cost, using the effective interest rate method, in order to accrete the liability up to the amount payable under the option at the date at which it first becomes exercisable. The charge arising is recorded as a financing cost. Joint ventures Joint ventures are companies over which the Group holds joint control as a result of contractual agreements. The group applies IFRS 11 to all joint arrangements. Under IFRS 11 investments in joint arrangements are classified as either joint operations or joint ventures depending on the contractual rights and obligations of each investor. The group has assessed the nature of its joint arrangements and determined them to be joint ventures. Joint ventures are accounted for using the equity method. Interest in associates Associates are all entities over which the Group has significant influence but not control, generally accompanying a shareholding of 20% to 50% of the voting rights. Investments in associate are accounted for using the equity method of accounting. Under the equity method, the investment is initially recognized at cost, and the carrying amount is increased or decreased to recognize the investor’s share of profit or loss of the investee after the date of acquisition. The Group’s investment in associates includes goodwill identified on acquisition. If the ownership interest in an associate is reduced but significant influence is retained, only a proportionate share of the amounts previously recognised in other comprehensive income is reclassified to profit or loss where appropriate.
Annual Report 2015-16 Consolidated Financial Statements All amounts in Euro’000, unless otherwise stated
53
Equity Method The Group’s share of post-acquisition profit or loss is recognised in the income statement, and its share of post-acquisition movements in other comprehensive income is recognized in other comprehensive income with a corresponding adjustment to the carrying amount of the investment. When the Group’s share of losses in the associate/joint venture equals or exceeds its interest in the associate/joint venture, including any other long-term receivables, the Group does not recognise further losses, unless it has incurred legal or constructive obligations or made payments on behalf of the associate/joint venture. The Group determines at each reporting date whether there is any objective evidence that the investment in the associate/joint ventures is impaired. If this is the case, the Group calculates the amount of impairment as the difference between the recoverable amount of the associate/joint ventures and its carrying value and recognizes the amount of impairment adjacent to share of profit/(loss) of an associate/joint ventures in the income statement. Accounting policies of the associates/joint ventures have been changed where necessary to ensure consistency with the policies adopted by the Group. Dilution gains and losses arising in investments in associates/joint ventures are recognized in the income statement. Elimination of business transactions in the course of consolidation Inter-company transactions, balances, income and expenses on transactions between group companies are eliminated. Profits and losses resulting from inter-company transactions that are recognised in assets are also eliminated. Profits and losses resulting from unrealised upstream and downstream transactions between the Group and its associate / joint ventures are recognized in the Group’s financial statements only to the extent of unrelated investor’s interests in the associates / joint ventures. Unrealised losses are eliminated unless the transaction provides evidence of an impairment of the asset transferred. Unrealised gains or losses from business transactions with joint ventures accounted for using the equity method have been eliminated from the investments in accordance with the amount of the holding.
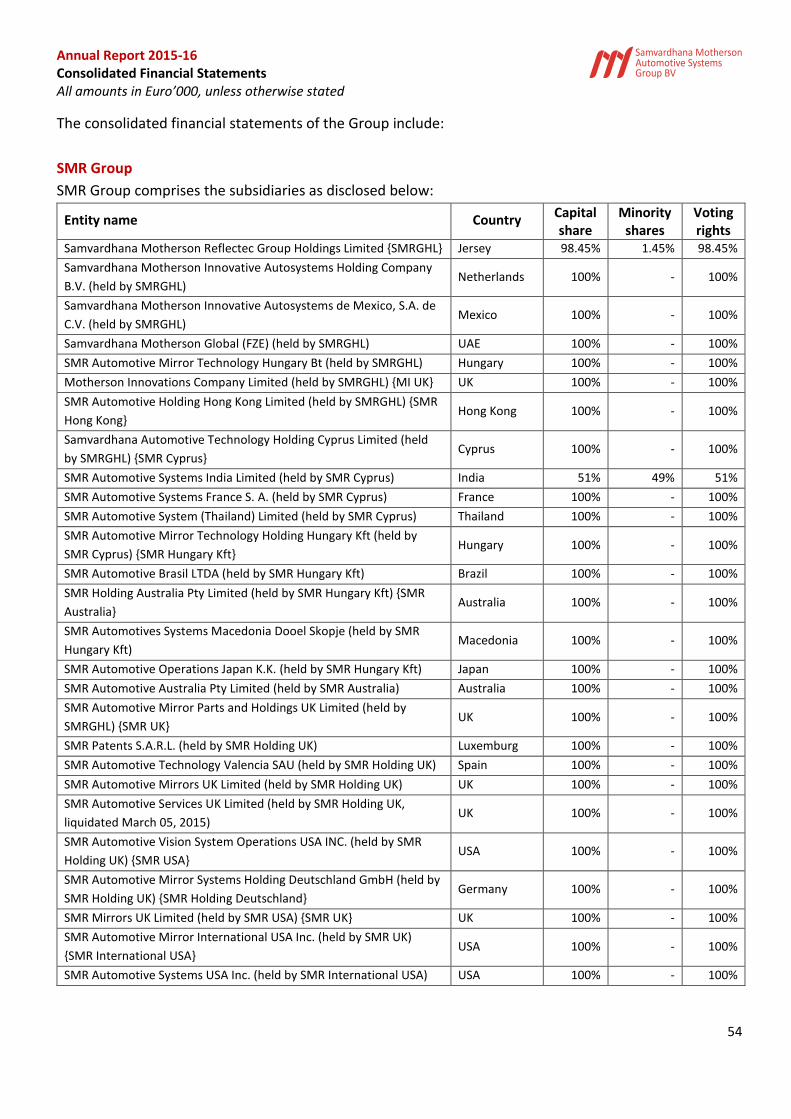
Annual Report 2015-16 Consolidated Financial Statements All amounts in Euro’000, unless otherwise stated
54
The consolidated financial statements of the Group include:
SMR Group
SMR Group comprises the subsidiaries as disclosed below:
Entity name Country Capital share
Minority shares
Voting rights
Samvardhana Motherson Reflectec Group Holdings Limited {SMRGHL} Jersey 98.45% 1.45% 98.45%
Samvardhana Motherson Innovative Autosystems Holding Company
B.V. (held by SMRGHL) Netherlands 100% - 100%
Samvardhana Motherson Innovative Autosystems de Mexico, S.A. de
C.V. (held by SMRGHL) Mexico 100% - 100%
Samvardhana Motherson Global (FZE) (held by SMRGHL) UAE 100% - 100%
SMR Automotive Mirror Technology Hungary Bt (held by SMRGHL) Hungary 100% - 100%
Motherson Innovations Company Limited (held by SMRGHL) {MI UK} UK 100% - 100%
SMR Automotive Holding Hong Kong Limited (held by SMRGHL) {SMR
Hong Kong} Hong Kong 100% - 100%
Samvardhana Automotive Technology Holding Cyprus Limited (held
by SMRGHL) {SMR Cyprus} Cyprus 100% - 100%
SMR Automotive Systems India Limited (held by SMR Cyprus) India 51% 49% 51%
SMR Automotive Systems France S. A. (held by SMR Cyprus) France 100% - 100%
SMR Automotive System (Thailand) Limited (held by SMR Cyprus) Thailand 100% - 100%
SMR Automotive Mirror Technology Holding Hungary Kft (held by
SMR Cyprus) {SMR Hungary Kft} Hungary 100% - 100%
SMR Automotive Brasil LTDA (held by SMR Hungary Kft) Brazil 100% - 100%
SMR Holding Australia Pty Limited (held by SMR Hungary Kft) {SMR
Australia} Australia 100% - 100%
SMR Automotives Systems Macedonia Dooel Skopje (held by SMR
Hungary Kft) Macedonia 100% - 100%
SMR Automotive Operations Japan K.K. (held by SMR Hungary Kft) Japan 100% - 100%
SMR Automotive Australia Pty Limited (held by SMR Australia) Australia 100% - 100%
SMR Automotive Mirror Parts and Holdings UK Limited (held by
SMRGHL) {SMR UK} UK 100% - 100%
SMR Patents S.A.R.L. (held by SMR Holding UK) Luxemburg 100% - 100%
SMR Automotive Technology Valencia SAU (held by SMR Holding UK) Spain 100% - 100%
SMR Automotive Mirrors UK Limited (held by SMR Holding UK) UK 100% - 100%
SMR Automotive Services UK Limited (held by SMR Holding UK,
liquidated March 05, 2015) UK 100% - 100%
SMR Automotive Vision System Operations USA INC. (held by SMR
Holding UK) {SMR USA} USA 100% - 100%
SMR Automotive Mirror Systems Holding Deutschland GmbH (held by
SMR Holding UK) {SMR Holding Deutschland} Germany 100% - 100%
SMR Mirrors UK Limited (held by SMR USA) {SMR UK} UK 100% - 100%
SMR Automotive Mirror International USA Inc. (held by SMR UK)
{SMR International USA} USA 100% - 100%
SMR Automotive Systems USA Inc. (held by SMR International USA) USA 100% - 100%
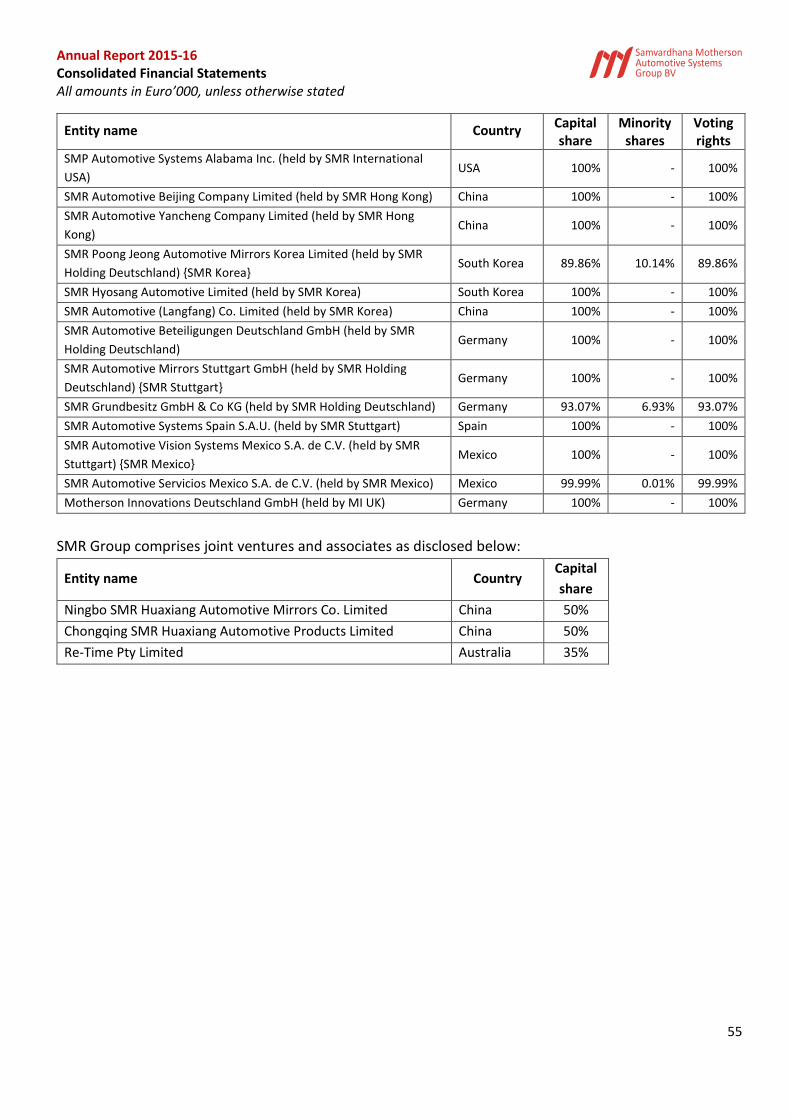
Annual Report 2015-16 Consolidated Financial Statements All amounts in Euro’000, unless otherwise stated
55
Entity name Country Capital share
Minority shares
Voting rights
SMP Automotive Systems Alabama Inc. (held by SMR International
USA) USA 100% - 100%
SMR Automotive Beijing Company Limited (held by SMR Hong Kong) China 100% - 100%
SMR Automotive Yancheng Company Limited (held by SMR Hong
Kong) China 100% - 100%
SMR Poong Jeong Automotive Mirrors Korea Limited (held by SMR
Holding Deutschland) {SMR Korea} South Korea 89.86% 10.14% 89.86%
SMR Hyosang Automotive Limited (held by SMR Korea) South Korea 100% - 100%
SMR Automotive (Langfang) Co. Limited (held by SMR Korea) China 100% - 100%
SMR Automotive Beteiligungen Deutschland GmbH (held by SMR
Holding Deutschland) Germany 100% - 100%
SMR Automotive Mirrors Stuttgart GmbH (held by SMR Holding
Deutschland) {SMR Stuttgart} Germany 100% - 100%
SMR Grundbesitz GmbH & Co KG (held by SMR Holding Deutschland) Germany 93.07% 6.93% 93.07%
SMR Automotive Systems Spain S.A.U. (held by SMR Stuttgart) Spain 100% - 100%
SMR Automotive Vision Systems Mexico S.A. de C.V. (held by SMR
Stuttgart) {SMR Mexico} Mexico 100% - 100%
SMR Automotive Servicios Mexico S.A. de C.V. (held by SMR Mexico) Mexico 99.99% 0.01% 99.99%
Motherson Innovations Deutschland GmbH (held by MI UK) Germany 100% - 100%
SMR Group comprises joint ventures and associates as disclosed below:
Entity name Country Capital
share
Ningbo SMR Huaxiang Automotive Mirrors Co. Limited China 50%
Chongqing SMR Huaxiang Automotive Products Limited China 50%
Re-Time Pty Limited Australia 35%
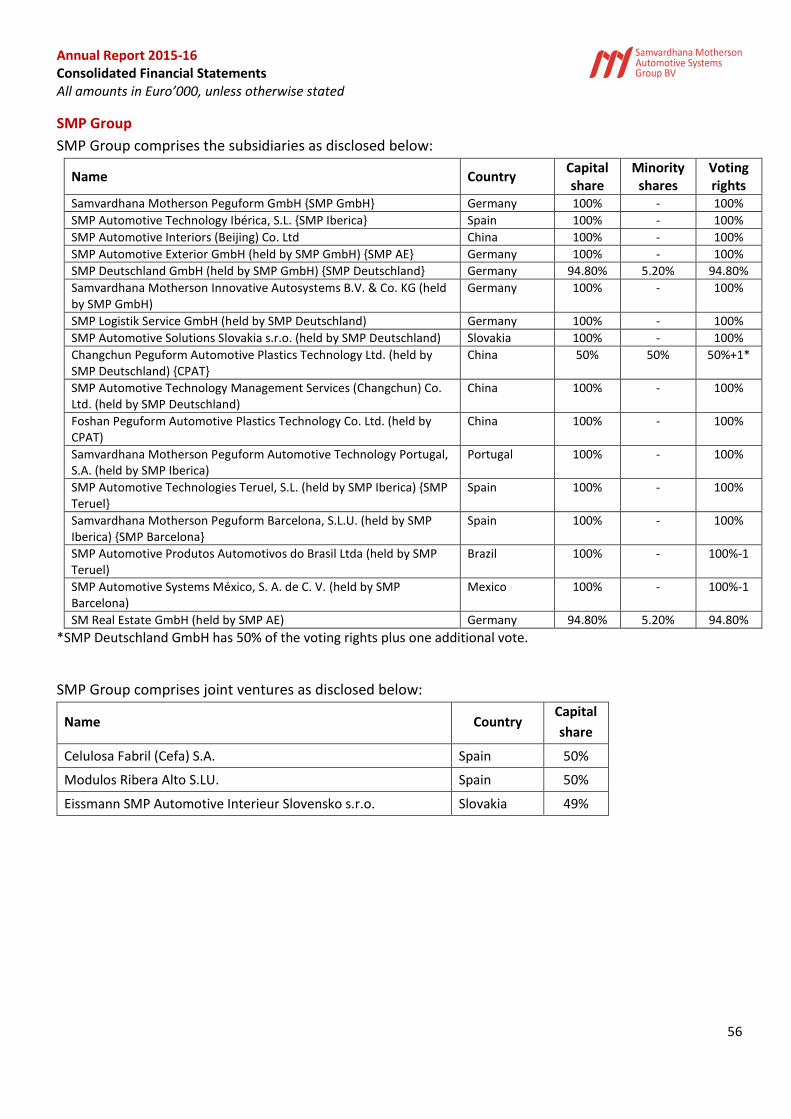
Annual Report 2015-16 Consolidated Financial Statements All amounts in Euro’000, unless otherwise stated
56
SMP Group
SMP Group comprises the subsidiaries as disclosed below:
Name Country Capital share
Minority shares
Voting rights
Samvardhana Motherson Peguform GmbH {SMP GmbH} Germany 100% - 100%
SMP Automotive Technology Ibérica, S.L. {SMP Iberica} Spain 100% - 100%
SMP Automotive Interiors (Beijing) Co. Ltd China 100% - 100%
SMP Automotive Exterior GmbH (held by SMP GmbH) {SMP AE} Germany 100% - 100%
SMP Deutschland GmbH (held by SMP GmbH) {SMP Deutschland} Germany 94.80% 5.20% 94.80%
Samvardhana Motherson Innovative Autosystems B.V. & Co. KG (held by SMP GmbH)
Germany 100% - 100%
SMP Logistik Service GmbH (held by SMP Deutschland) Germany 100% - 100%
SMP Automotive Solutions Slovakia s.r.o. (held by SMP Deutschland) Slovakia 100% - 100%
Changchun Peguform Automotive Plastics Technology Ltd. (held by SMP Deutschland) {CPAT}
China 50% 50% 50%+1*
SMP Automotive Technology Management Services (Changchun) Co. Ltd. (held by SMP Deutschland)
China 100% - 100%
Foshan Peguform Automotive Plastics Technology Co. Ltd. (held by CPAT)
China 100% - 100%
Samvardhana Motherson Peguform Automotive Technology Portugal, S.A. (held by SMP Iberica)
Portugal 100% - 100%
SMP Automotive Technologies Teruel, S.L. (held by SMP Iberica) {SMP Teruel}
Spain 100% - 100%
Samvardhana Motherson Peguform Barcelona, S.L.U. (held by SMP Iberica) {SMP Barcelona}
Spain 100% - 100%
SMP Automotive Produtos Automotivos do Brasil Ltda (held by SMP Teruel)
Brazil 100% - 100%-1
SMP Automotive Systems México, S. A. de C. V. (held by SMP Barcelona)
Mexico 100% - 100%-1
SM Real Estate GmbH (held by SMP AE) Germany 94.80% 5.20% 94.80%
*SMP Deutschland GmbH has 50% of the voting rights plus one additional vote.
SMP Group comprises joint ventures as disclosed below:
Name Country Capital
share
Celulosa Fabril (Cefa) S.A. Spain 50%
Modulos Ribera Alto S.LU. Spain 50%
Eissmann SMP Automotive Interieur Slovensko s.r.o. Slovakia 49%
Annual Report 2015-16 Consolidated Financial Statements All amounts in Euro’000, unless otherwise stated
57
A.6.2.4 Intangible assets
Intangible assets acquired separately are measured on initial recognition at cost. The cost of intangible
assets acquired in a business combination is the fair value as at the date of acquisition. Following initial
recognition, intangible assets with a finite useful life are carried at cost less accumulated amortisation and
any accumulated impairment losses.
Intangible assets with finite lives are amortised over the useful economic life and assessed for impairment
whenever there is an indication that the intangible asset may be impaired. The amortisation period and
the amortisation method for an intangible asset with a finite useful life are reviewed at least at each
financial year end. Changes in the expected useful life or the expected pattern of consumption of future
economic benefits embodied in the asset are accounted for by changing the amortisation period or
method, as appropriate, and are treated as changes in accounting estimates. The amortisation expense on
intangible assets with finite lives is recognised in the income statement.
Research and development costs
Research costs are expensed as incurred. Development expenditure on an individual project is capitalised
if it meets the definition of an intangible asset. Costs not eligible for capitalisation are expensed off and
disclosed under “Research and development costs” in the income statement.
The intangible assets are amortised on a straight-line basis over their useful lives, beginning at the time the
asset is first used and ending after a length of time usual for the asset in operation. The uniform useful lives
applied within the Group are as follows:
Description Useful life (in years) Concessions, intellectual property, software and similar rights 1-3
Contracts with customers 3-11 Patents & Technologies 5-13
The useful life of customer contracts, engineering contracts as well as technology is the result of the analyses and average useful life of the contracts. The amortisation methods, the usual useful lives and the residual values are checked annually.
A.6.2.5 Property, plant and equipment
A.6.2.5.1 Own assets
Property, plant and equipment are stated at cost less accumulated depreciation and impairment losses. Cost comprises the aggregate amount paid and the fair value of any other consideration given to acquire the asset and includes costs directly attributable to making the asset capable of operating as intended. When a major replacement is made, its cost is recognised in the carrying amount of the plant and equipment if the recognition criteria are satisfied. All other repair and maintenance costs are recognised in profit or loss as incurred.
Annual Report 2015-16 Consolidated Financial Statements All amounts in Euro’000, unless otherwise stated
58
Subsequent costs are included in the asset’s carrying amount or recognised as a separate asset, as appropriate, only when it is probable that future economic benefits associated with the item will flow to the Group and the cost of the item can be measured reliably. The carrying amount of the replaced part is derecognised. All other repairs and maintenance are charged to the income statement during the financial period in which they are incurred. General and specific borrowing costs directly attributable to the acquisition, construction or production of qualifying assets, which are assets that necessarily take a substantial period of time to get ready for their intended use or sale, are added to the cost of those assets, until such time as the assets are substantially ready for their intended use or sale.
A.6.2.5.2 Leased assets
Leasing agreements in which the Group has essentially assumed all risks and opportunities are classified as finance leases. A property acquired under finance lease needs to be capitalized at the lower of its fair value or the present value of the minimum lease payments at the beginning of the lease period. Asset acquired under finance lease is depreciated over shorter of its useful life and lease term (provided that there is no transfer of the assets at the end of the lease term) or the estimated useful life (see A.6.2.5.3). Impairments are performed as necessary (see A.6.2.7).
If, from an economic perspective, not all substantial opportunities and risks have been transferred, leasing agreements are classified as operating leases and the income and expenses derived there from are recognised in the income statement.
A.6.2.5.3 Depreciation
Depreciation is calculated on a straight-line basis over the estimated useful lives of the assets, as follows:
Description Useful life (in years)
Buildings 40 - 50 Machinery and other technical facilities 10 -15 Tooling 1-7 Other plant and office equipment 5 - 15
The residual values, useful lives and methods of depreciation of property, plant and equipment are reviewed at each financial year end and adjusted prospectively, if appropriate. No depreciation is charged on land.
A.6.2.6 Investment Properties
Investment properties are stated at cost less accumulated depreciation. Transaction costs are included on initial measurement. The fair values of investment properties are disclosed in the notes. These are assessed using internationally accepted valuation methods. The fair values are calculated based on the income method and are supported by the results of the sales comparison method which compares a subject property's characteristics with those of comparable properties which have recently sold in similar transactions and uses multiples to calculate the fair value. Comparable characteristics that are used for the multiples are the construction level and the specific rent level. Depreciation is provided on investment property other than land, on a straight-line basis over the expected useful life which is 30 years.
Annual Report 2015-16 Consolidated Financial Statements All amounts in Euro’000, unless otherwise stated
59
Investment properties are derecognized when either they have been disposed of or when the investment property is permanently withdrawn from use and no future economic benefit is expected from its disposal. The difference between the net disposal proceeds and the carrying amount of the asset is recognised in the income statement in the period of derecognition.
A.6.2.7 Impairment of non-current assets
Assets that are subject to depreciation/amortisation are reviewed for impairment whenever events or changes in circumstances indicate that the carrying amount may not be recoverable (see A.6.2.7.1). For the purposes of assessing impairment, assets are grouped at the lowest levels for which there are largely independent cash inflows (cash-generating units), generally individual business units. Prior impairments of nonfinancial assets (other than goodwill) are reviewed for possible reversal at each reporting date. Impairment is recognised if the carrying value of an asset or its cash-generating unit exceeds the recoverable amount. Impairments are reported in the income statement. The Group performed reviews at the reporting date to determine whether there were indications that assets or their cash-generating units have to be impaired. The triggering event for the impairment of technology could also be a budget that causes revenues to be reduced in the future or material changes in determination of royalty rate. The triggering event for the impairment of patent and intellectual property is change in future economic benefits embodied in the asset.
A.6.2.7.1 Recoverable amounts
The recoverable amount of an asset or a cash-generating unit is the higher of fair value less costs of disposal and the value in use. In assessing the value in use, the estimated future cash flows are discounted to their present value using a pre-tax discount rate that reflects current market assessments of the time value of money and the risks specific to the asset. For assets that primarily do not generate independent cash flows, the recoverable amount was determined for the cash-generating units to which these assets belonged.
A.6.2.7.2 Impairment reversals
In case events which caused impairment initially ceases to exist, impairments are only reversed to the extent that increased carrying amount of the asset does not exceed the carrying amount that would have been in place had there no impairment been carried out in the first place, taking into account the normal depreciation/amortization.
Annual Report 2015-16 Consolidated Financial Statements All amounts in Euro’000, unless otherwise stated
60
A.6.2.8 Financial instruments
A financial instrument is any agreement that leads to the generation of financial asset at one company and/or to a financial liability or equity instrument at another. Financial instruments can be placed into one of four categories according to their intended purpose: financial assets measured at fair value through profit or loss, financial assets held to maturity, loans and receivables, financial assets available for sale. Financial instruments include primary financial instruments such as receivables and trade liabilities, securities, debt instruments and other financial liabilities. They also include derivative financial instruments used to hedge against risks arising from changes in exchange rates and interest rates. Regular purchases and sales of financial assets are recognised on the trade-date – the date on which the group commits to purchase or sell the asset. Investments are initially recognised at fair value plus transaction costs for all financial assets not carried at fair value through profit or loss. Financial assets carried at fair value through profit or loss are initially recognised at fair value, and transaction costs are expensed in the income statement. A financial asset is derecognised in the following circumstances:
The group transfers the contractual rights to receive the cash flow it generates have expired or
have been transferred, and
The group has transferred substantially all the risk and rewards of the ownership.
As at March 31, 2016, the Group had an amount of €215.2 million (March 31, 2015 : € 151.4 million) of
receivables derecognised from its balance sheet as group had transferred the contractual right and has
substantially transferred all risks and rewards of ownership of these receivables to various financial
institutions.
Available-for-sale financial assets and financial assets at fair value through profit or loss are subsequently carried at fair value. Loans and receivables are subsequently carried at amortised cost using the effective interest method. Gains or losses arising from changes in the fair value of the ‘financial assets at fair value through profit or loss’ category are presented in the income statement within ‘Other (losses)/gains – net’ in the period in which they arise. Dividend income from financial assets at fair value through profit or loss is recognised in the income statement as part of other income when the group’s right to receive payments is established. Gains or losses arising from changes in the fair value of the ‘financial assets at fair value through profit or loss’ category are presented in the income statement within ‘Other (losses)/gains – net’ in the period in which they arise. Dividend income from financial assets at fair value through profit or loss is recognised in the income statement as part of other income when the group’s right to receive payments is established. Changes in the fair value of monetary and non-monetary securities classified as available for sale are recognised in other comprehensive income. When securities classified as available for sale are sold or impaired, the accumulated fair value adjustments recognised in equity are included in the income statement as ‘Gains and losses from investment securities’.
Annual Report 2015-16 Consolidated Financial Statements All amounts in Euro’000, unless otherwise stated
61
Interest on available-for-sale securities calculated using the effective interest method is recognised in the income statement as part of finance income. Dividends on available-for-sale equity instruments are recognised in the income statement as part of other income when the group’s right to receive payments is established. Financial assets and liabilities are offset and the net amount reported in the balance sheet when there is a legally enforceable right to offset the recognised amounts and there is an intention to settle on a net basis or realise the asset and settle the liability simultaneously. The legally enforceable right must not be contingent on future events and must be enforceable in the normal course of business and in the event of default, insolvency or bankruptcy of the company or the counterparty.
A.6.2.8.1 Primary financial instruments
Primary financial instruments are allocated to one of four categories according to their intended purpose. This allocation is re-assessed at each reporting date and it is determined whether the asset is to be reported as current or non-current. a. Financial assets carried at fair value through profit or losses are initially recognised at fair value, and transaction costs are expensed in the income statement. Changes in the fair value of financial assets measured at fair value – either because they have been reported as such upon initial recognition or are held for trading – are recognised directly in the income statement. They are also reported as current assets if they are being held for trading or it can be reasonably expected that they will be converted within twelve months from the reporting date.
b. Financial assets held to maturity are initially recognised at fair value plus transaction costs. Financial assets held to maturity which exhibit fixed or determinable payments and a fixed maturity period, and which the Group wishes and is able to hold until maturity are measured at amortised cost and reported depending on their maturity period as non-current or current assets. The amortisation and losses arising from impairments are recognised in the statement of profit or loss.
c. Loans and receivables are initially recognised at fair value plus transaction costs. Loans and receivables that have fixed or determinable payments and are not listed on an active market are measured at amortised cost using the effective interest method less any necessary write-downs arising from impairments. They are reported in the statement of financial position under other receivables and other assets unless they are trade receivables, and are recorded as non-current or current depending on their maturity period. d. Available-for-sale financial assets that have been reported as such upon initial recognition are measured at fair value, provided that this can be determined, and then reported as non-current or current assets, depending on the expected time of sale. Gains and losses from changes in fair value are recorded net, i.e. after tax, and taken directly to equity (“Other comprehensive income”) until the financial asset has been derecognised. In the event that an asset is impaired permanently, however, the loss must be recorded directly in the income statement. If it is not possible to determine the fair value, for example with holdings in non-consolidated affiliated companies or other investments in companies, these assets are measured at cost.
Annual Report 2015-16 Consolidated Financial Statements All amounts in Euro’000, unless otherwise stated
62
A.6.2.8.1 Impairment of financial assets
(a) Assets carried at amortised cost The group assesses at the end of each reporting period whether there is objective evidence that a financial asset or group of financial assets is impaired. A financial asset or a group of financial assets is impaired and impairment losses are incurred only if there is objective evidence of impairment as a result of one or more events that occurred after the initial recognition of the asset (a ‘loss event’) and that loss event (or events) has an impact on the estimated future cash flows of the financial asset or group of financial assets that can be reliably estimated. Evidence of impairment may include indications that the debtors or a group of debtors is experiencing significant financial difficulty, default or delinquency in interest or principal payments, the probability that they will enter bankruptcy or other financial reorganisation, and where observable data indicate that there is a measurable decrease in the estimated future cash flows, such as changes in arrears or economic conditions that correlate with defaults. For loans and receivables category, the amount of the loss is measured as the difference between the asset’s carrying amount and the present value of estimated future cash flows (excluding future credit losses that have not been incurred) discounted at the financial asset’s original effective interest rate. The carrying amount of the asset is reduced and the amount of the loss is recognised in the consolidated income statement. If a loan or held-to-maturity investment has a variable interest rate, the discount rate for measuring any impairment loss is the current effective interest rate determined under the contract. As a practical expedient, the group may measure impairment on the basis of an instrument’s fair value using an observable market price. If, in a subsequent period, the amount of the impairment loss decreases and the decrease can be related objectively to an event occurring after the impairment was recognised (such as an improvement in the debtor’s credit rating), the reversal of the previously recognised impairment loss is recognised in the consolidated income statement. (b) Assets classified as available for sale The group assesses at the end of each reporting period whether there is objective evidence that a financial asset or a group of financial assets is impaired Financial liabilities are initially recognised at fair value less transaction costs for liabilities not recognised at fair value through profit or loss. Subsequently financial liabilities from primary financial instruments are measured at amortised cost. The Group measures all financial liabilities except derivatives at amortised cost, which encompasses the remaining debt amount less expenses. Liabilities from finance leases are measured at the present value of the remaining minimum lease payments on the basis of the interest rate underlying the leasing agreement. Financial liabilities with fixed or determinable payments that are neither debt instruments nor derivative financial instruments listed on an active market are reported in the statement of financial position under other liabilities at amortised cost. All financial instruments are therefore measured at historical cost or amortised cost less impairments.
Annual Report 2015-16 Consolidated Financial Statements All amounts in Euro’000, unless otherwise stated
63
A.6.2.8.2 Derivative financial instruments Derivative financial instruments that are not part of a hedging relationship are carried at fair value upon initial recognition, corresponding to the fair value of the consideration received or given in return. After initial recognition, derivative financial instruments are carried at fair value, which is based on the market value of the financial instrument. Any changes in fair value are recorded directly in profit or loss.
A.6.2.9 Inventories
Inventories are initially measured at cost, which comprises those costs directly attributable to the production process and an appropriate share of production overheads based on normal operating capacity. This includes write-downs related to production and a reasonable proportion of the administrative and social security costs. Financing costs are not included in the acquisition or production costs. Costs for raw materials and supplies are determined using the moving weighted average prices.
Inventories are carried at the lower of the cost or net realisable value at the reporting date. The net realisable value is the estimated selling price that could be achieved in the course of normal business less estimated costs of completion and estimated costs necessary to make the sale.
A.6.2.10 Construction contracts
When the outcome of a construction contract can be estimated reliably and it is probable that the contract will be profitable, contract revenue is recognised over the period of the contract by reference to the stage of completion. Contract costs are recognised as expenses by reference to the stage of completion of the contract activity at the end of the reporting period. When it is probable that total contract costs will exceed total contract revenue, the expected loss is recognised as an expense immediately. The Group uses the ‘percentage-of-completion method’ to determine the appropriate amount to recognise in a given period. The Group determines the level of completion on the basis of milestones achieved to date. If it is not possible to determine the level of completion reliably, revenue is recognised only to the extent of contract costs incurred that is probable will be recoverable. Therefore, no profit is reported in such a situation (“zero profit margin method”). The costs include all expenses incurred in direct relation to the specific projects and a proportion of the fixed and variable general costs incurred on the basis of normal capacity for the Group’s construction contracts. On the balance sheet, the Group reports the net contract position for each contract as either an asset or a liability. A contract represents an asset where costs incurred plus recognised profits (less recognised losses) exceed progress billings; a contract represents a liability where the opposite is the case.
A.6.2.11 Trade receivables
Trade receivables are amounts due from customers for goods sold or services performed in the ordinary course of business. If collection is expected in one year or less (or in the normal operating cycle of the business if longer), they are classified as current assets. If not, they are presented as non-current assets. Trade receivables are recognised initially at fair value and subsequently measured at amortised cost using the effective interest method, less provision for impairment.
Annual Report 2015-16 Consolidated Financial Statements All amounts in Euro’000, unless otherwise stated
64
A.6.2.12 Cash and cash equivalents
Cash and cash equivalents consist of cash on hand and short-term deposits with an original maturity three months or less. Cash and cash equivalents are measured at cost.
A.6.2.13 Income taxes
Current taxes are those taxes foreseeably payable on a year’s taxable income in accordance with the statutory tax rates or tax rates that had been substantially adopted as of the reporting date, as well as all adjustments to payable taxes in relation to previous reporting periods. Deferred tax assets and liabilities are recognised for all temporary differences between the carrying amount as per IFRS and the relevant tax assessment basis. Deferred tax liabilities are not recognised for temporary differences (“outside-basis differences”) if the timing of the reversal of the temporary difference is controlled by the Group and it is probable that the temporary difference will not reverse in the foreseeable future. Deferred tax liabilities for dividends from subsidiaries will be recognised if the parent company determines that the profits of the respective subsidiary will be distributed in the foreseeable future. Deferred tax assets contain tax assets that are derived from the expected utilization of unused tax losses and unused tax credits, unless it is improbable that the future taxable profits will be available against which the temporary differences can be utilized. Deferred taxes are calculated on the basis of the tax rates that are expected to apply to the period when the asset is realized and the liability is settled, based on the tax rates that have been enacted or substantively enacted by the end of the reporting period in the respective country. Income taxes for the annual result reported in the income statement comprise current taxes and deferred taxes. Income taxes are recorded in the income statement unless they relate to items recognised directly in equity or in other comprehensive income. In this case, the income taxes incurred are also recognised directly in equity or in other comprehensive income.
A.6.2.14 Provisions
A.6.2.14.1 Pension provisions
Companies within the Group operate various pension schemes. The schemes are generally funded through payments to insurance companies or trustee-administered funds. The Group has both defined benefit and defined contribution plans. A defined contribution plan is a pension plan under which the Group pays fixed contributions into a separate entity. The Group has no legal or constructive obligations to pay further contributions if the fund does not hold sufficient assets to pay all employees the benefits relating to employee service in the current and prior periods. A defined benefit plan is a pension plan that is not a defined contribution plan. Typically defined benefit plans define an amount of pension benefit that an employee will receive on retirement, usually dependent on one or more factors such as age, years of service and compensation. The liability recognised in the balance sheet in respect of defined benefit pension plans is the present value of the defined benefit obligation at the end of the reporting period less the fair value of plan assets. The defined benefit obligation is calculated annually by independent actuaries using the projected unit credit
Annual Report 2015-16 Consolidated Financial Statements All amounts in Euro’000, unless otherwise stated
65
method. The present value of the defined benefit obligation is determined by discounting the estimated future cash outflows using interest rates of high-quality corporate bonds that are denominated in the currency in which the benefits will be paid, and that have terms to maturity approximating to the terms of the related pension obligation. In countries where there is no deep market in such bonds, the market rates on government bonds are used. Actuarial gains and losses arising from experience adjustments and changes in actuarial assumptions are charged or credited to equity in other comprehensive income in the period in which they arise. Past-service costs are recognised immediately in income. When a settlement or a curtailment occurs, the obligation and related plan assets are re-measured using current actuarial assumptions and the resultant gain or loss is recognised in the income statement during the period in which the settlement or curtailment occurs. The value of a net pension benefit asset is restricted to the present value of any amount the Group expects to recover by way of refunds from the plan or reductions in the future contributions after considering any legal or contractual minimum funding requirements. The minimum funding requirements stipulate a minimum amount or level of contributions that must be made to a plan over a given period and may limit the ability of the entity to reduce future contributions and considered respectively in determining the economic benefit from the plan.
For defined contribution plans, the Group pays contributions to publicly or privately administered pension
insurance plans on a mandatory, contractual or voluntary basis. The Group has no further payment
obligations once the contributions have been paid. The contributions are recognised as employee benefit
expense when they are due. Prepaid contributions are recognised as an asset to the extent that a cash
refund or a reduction in the future payments is available.
A.6.2.14.2 Warranties
A provision is recognised for expected warranty claims on products sold during the year, based on past experience of the level of repairs and returns although it is expected that most of these costs will be paid out in the next financial year. Assumptions used to calculate the provision for warranties were based on current sales levels and current information available about returns based on the warranty period for all products sold.
A.6.2.14.3 Tax provisions and other provisions
Provisions for tax and other purposes are recognised to accommodate the possibility that current legal or constructive obligations against third parties resulting from a past event exist, and that it is probable that an outflow of economic benefits will be required to settle the obligation, and that the amount of these obligations can be estimated reliably. Long-term provisions are determined by discounting the expected future cash flows at a pre-tax rate that reflects current market assessments of the time value of money. Short term provisions are carried at their redemption value and are not offset against receivables from reimbursements.
Annual Report 2015-16 Consolidated Financial Statements All amounts in Euro’000, unless otherwise stated
66
A.6.2.15 Government Grants and grants from private companies & institutions
Government grants are recognised when it is reasonable to expect that the grants will be received and that all related conditions will be met, usually on submission of a valid claim for payment. Government grants in respect of capital expenditure are credited to the acquisition costs of the respective fixed asset and thus are released as income over the expected useful lives of the relevant assets. Grants of a revenue nature are credited to income so as to match them with the expenditure to which they relate as the conditions attached to the grants are met. Grants from private companies and institutions are accounted for in a manner similar to the accounting for government grants, if the grants are comparable to government grants in their nature and the conditions related to these grants are satisfied.
A.6.2.16 Liabilities from finance lease
Liabilities from finance lease are initially carried at equal to the fair value of leased property, or if lower, the present value of minimum lease payments. The lease payments are then separated into financing costs and the redemption of the remaining liability.
A.6.2.17 Borrowings
Borrowings are recognised initially at fair value, net of transaction costs incurred. Borrowings are subsequently carried at amortized cost; any difference between the proceeds (net of transaction costs) and the redemption value is recognised in the income statement over the period of the borrowings using the effective interest method. Fees paid on the establishment of loan facilities are recognised as transaction costs of the loan to the extent that it is probable that some or all of the facility will be drawn down. In this case, the fee is deferred until the draw-down occurs. To the extent there is no evidence that it is probable that some or all of the facility will be drawn down, the fee is capitalized as a pre-payment for liquidity services and amortized over the period of the facility to which it relates. General and specific borrowing costs directly attributable to the acquisition, construction or production of qualifying assets, which are assets that necessarily take a substantial period of time to get ready for their intended use or sale, are added to the cost of those assets, until such time as the assets are substantially ready for their intended use or sale. Investment income earned on the temporary investment of specific borrowings pending their expenditure on qualifying assets is deducted from the borrowing costs eligible for capitalization.
A.6.2.18 Recognition of income and expenses
Sales revenue and other operating income is recognised when ownership of an asset changes hands or the opportunities and risks related to the property are transferred to the customer, when the amount of the income has been determined or can be determined, and when there is sufficient likelihood that the economic benefit from the sale will flow to the Group. Sales revenue from the sale of goods is measured at the fair value of the consideration received or to be received less product returns, rebates and discounts for early payment. Revenues from the sale of services are recorded with respect to the stage of completion as of the reporting date in relation to the total service to be provided in the course of the transaction.
Annual Report 2015-16 Consolidated Financial Statements All amounts in Euro’000, unless otherwise stated
67
Operating expenses are recognised when goods or services are used or when the expense is incurred. Anticipated losses from construction contracts are directly recognised as expenses. Interest is recognised using the effective interest method as an expense or income for the period in which it occurs. Interest payments for finance leases are calculated by breaking down the minimum lease payments into financing costs and redemption payments for the remainder of the liability and spreading the financing costs over the periods covered by the term of the leasing agreement. This allows a constant, periodic interest rate for the remainder of the liability to be calculated. Payments from operating leases are recognised over the term of the leasing agreement using a straight-line distribution in the income statement. Dividend income is recognised when the right to receive payment is established.
A.6.2.19 Segment reporting
Operating segments are reported in a manner consistent with the internal reporting provided to the chief operating decision-maker. The chief operating decision-maker, who is responsible for allocating resources and assessing performance of the operating segments, has been identified as the supervisory board that makes strategic decisions.
A.6.2.20 Changes in accounting policies and disclosures
The IASB has adopted the following changes to existing IFRS and adopted new IFRS standards, which have also already been adopted by the European Commission, thereby making their application mandatory as for Financial Year 2015-16 to the extent relevant for the Group.
New standards and interpretations
During the financial year ended March 31, 2016, below mentioned amendments to IFRS became applicable to the company, however these did not have any impact on the net asset, financial or income position of the Group
Defined Benefit Plans: Employee Contributions (Amendments to IAS 19)
Annual Improvements to IFRSs 2010 – 2012 Cycle
Annual Improvements to IFRSs 2011 – 2013 Cycle
IFRIC Interpretation 21 Levies
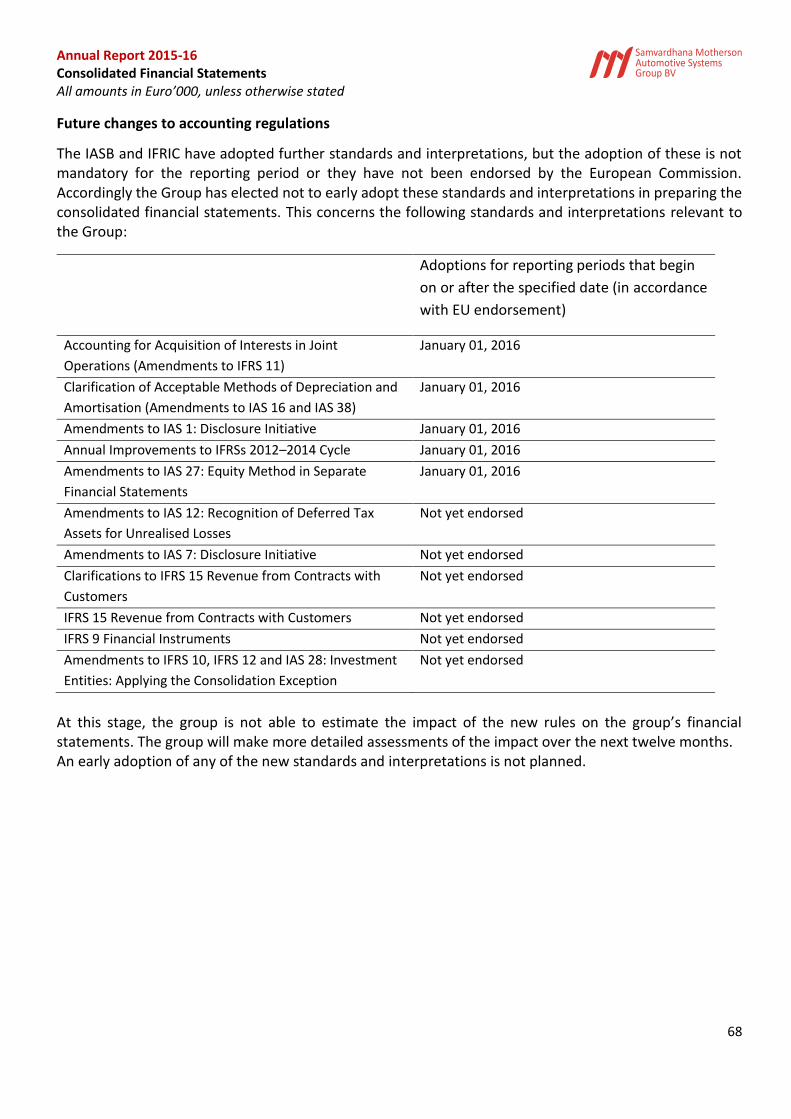
Annual Report 2015-16 Consolidated Financial Statements All amounts in Euro’000, unless otherwise stated
68
Future changes to accounting regulations
The IASB and IFRIC have adopted further standards and interpretations, but the adoption of these is not mandatory for the reporting period or they have not been endorsed by the European Commission. Accordingly the Group has elected not to early adopt these standards and interpretations in preparing the consolidated financial statements. This concerns the following standards and interpretations relevant to the Group:
At this stage, the group is not able to estimate the impact of the new rules on the group’s financial statements. The group will make more detailed assessments of the impact over the next twelve months. An early adoption of any of the new standards and interpretations is not planned.
Adoptions for reporting periods that begin
on or after the specified date (in accordance
with EU endorsement)
Accounting for Acquisition of Interests in Joint
Operations (Amendments to IFRS 11)
January 01, 2016
Clarification of Acceptable Methods of Depreciation and
Amortisation (Amendments to IAS 16 and IAS 38)
January 01, 2016
Amendments to IAS 1: Disclosure Initiative January 01, 2016
Annual Improvements to IFRSs 2012–2014 Cycle January 01, 2016
Amendments to IAS 27: Equity Method in Separate
Financial Statements
January 01, 2016
Amendments to IAS 12: Recognition of Deferred Tax
Assets for Unrealised Losses
Not yet endorsed
Amendments to IAS 7: Disclosure Initiative Not yet endorsed
Clarifications to IFRS 15 Revenue from Contracts with
Customers
Not yet endorsed
IFRS 15 Revenue from Contracts with Customers Not yet endorsed
IFRS 9 Financial Instruments Not yet endorsed
Amendments to IFRS 10, IFRS 12 and IAS 28: Investment
Entities: Applying the Consolidation Exception
Not yet endorsed
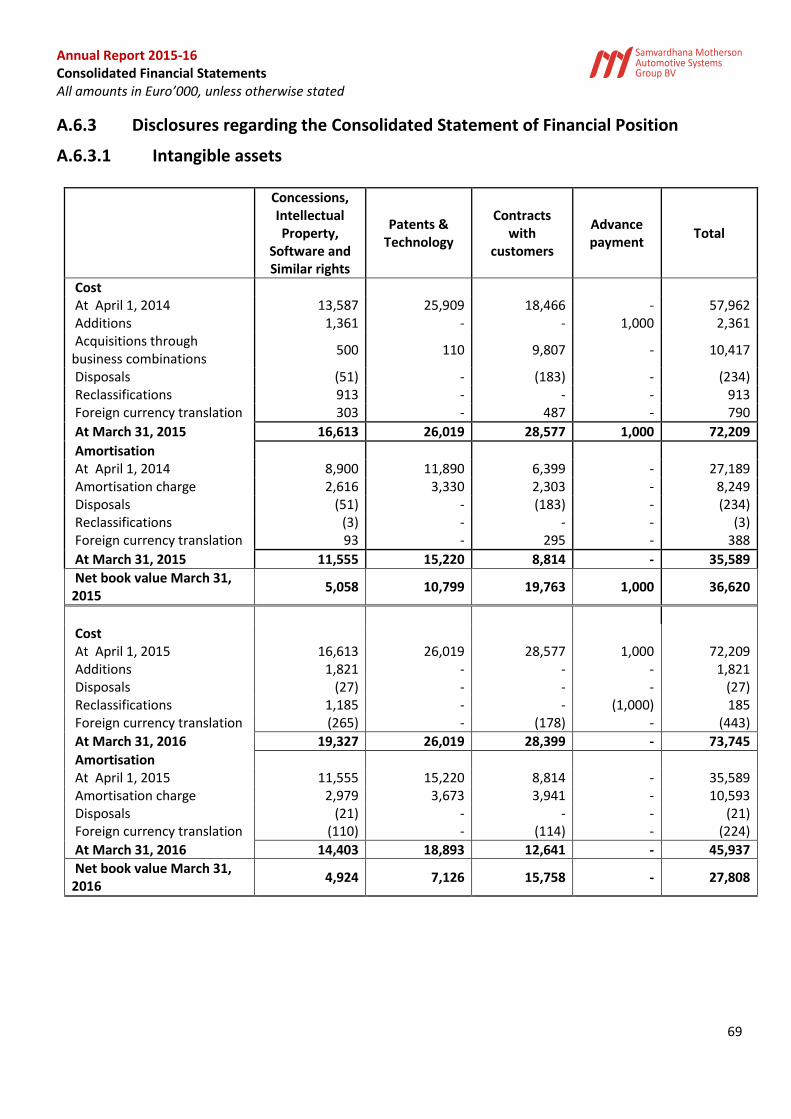
Annual Report 2015-16 Consolidated Financial Statements All amounts in Euro’000, unless otherwise stated
69
A.6.3 Disclosures regarding the Consolidated Statement of Financial Position
A.6.3.1 Intangible assets
Concessions, Intellectual Property,
Software and Similar rights
Patents & Technology
Contracts with
customers
Advance payment
Total
Cost At April 1, 2014 13,587 25,909 18,466 - 57,962 Additions 1,361 - - 1,000 2,361 Acquisitions through business combinations
500 110 9,807 - 10,417
Disposals (51) - (183) - (234) Reclassifications 913 - - - 913 Foreign currency translation 303 - 487 - 790
At March 31, 2015 16,613 26,019 28,577 1,000 72,209
Amortisation At April 1, 2014 8,900 11,890 6,399 - 27,189 Amortisation charge 2,616 3,330 2,303 - 8,249 Disposals (51) - (183) - (234) Reclassifications (3) - - - (3) Foreign currency translation 93 - 295 - 388
At March 31, 2015 11,555 15,220 8,814 - 35,589
Net book value March 31, 2015
5,058 10,799 19,763 1,000 36,620
Cost At April 1, 2015 16,613 26,019 28,577 1,000 72,209 Additions 1,821 - - - 1,821 Disposals (27) - - - (27) Reclassifications 1,185 - - (1,000) 185 Foreign currency translation (265) - (178) - (443)
At March 31, 2016 19,327 26,019 28,399 - 73,745
Amortisation At April 1, 2015 11,555 15,220 8,814 - 35,589 Amortisation charge 2,979 3,673 3,941 - 10,593 Disposals (21) - - - (21) Foreign currency translation (110) - (114) - (224)
At March 31, 2016 14,403 18,893 12,641 - 45,937
Net book value March 31, 2016
4,924 7,126 15,758 - 27,808
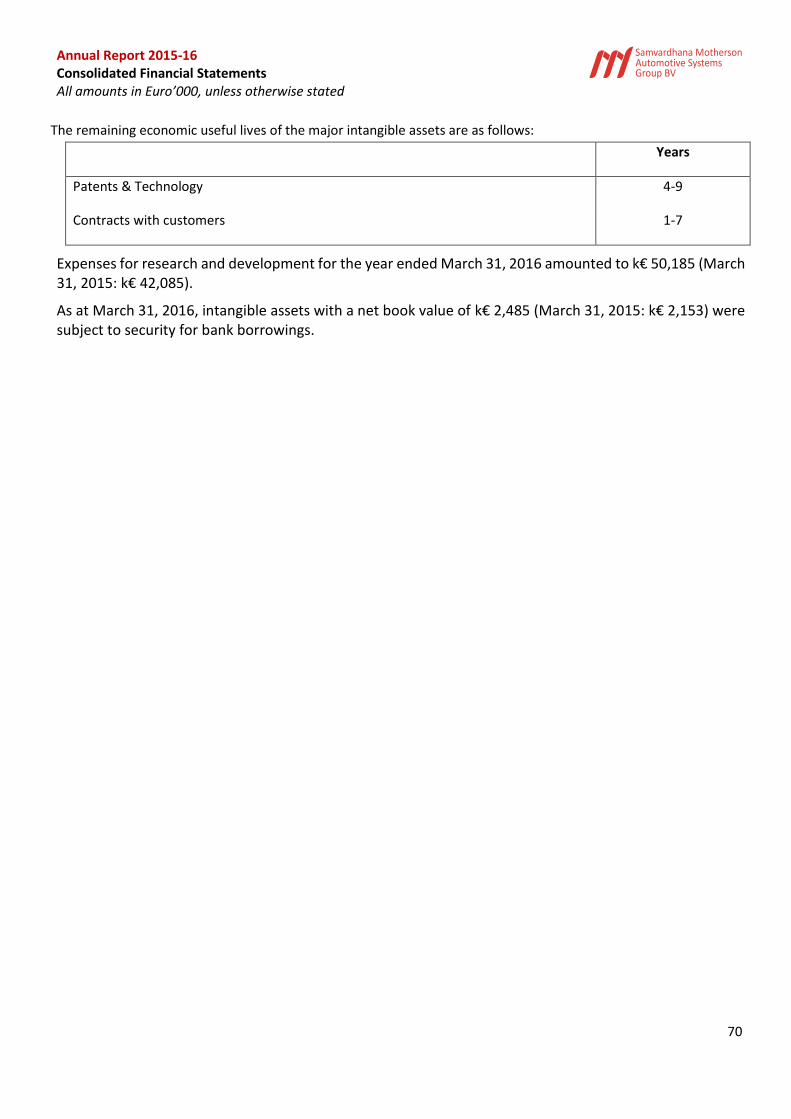
Annual Report 2015-16 Consolidated Financial Statements All amounts in Euro’000, unless otherwise stated
70
The remaining economic useful lives of the major intangible assets are as follows:
Expenses for research and development for the year ended March 31, 2016 amounted to k€ 50,185 (March 31, 2015: k€ 42,085).
As at March 31, 2016, intangible assets with a net book value of k€ 2,485 (March 31, 2015: k€ 2,153) were subject to security for bank borrowings.
Years
Patents & Technology 4-9
Contracts with customers 1-7
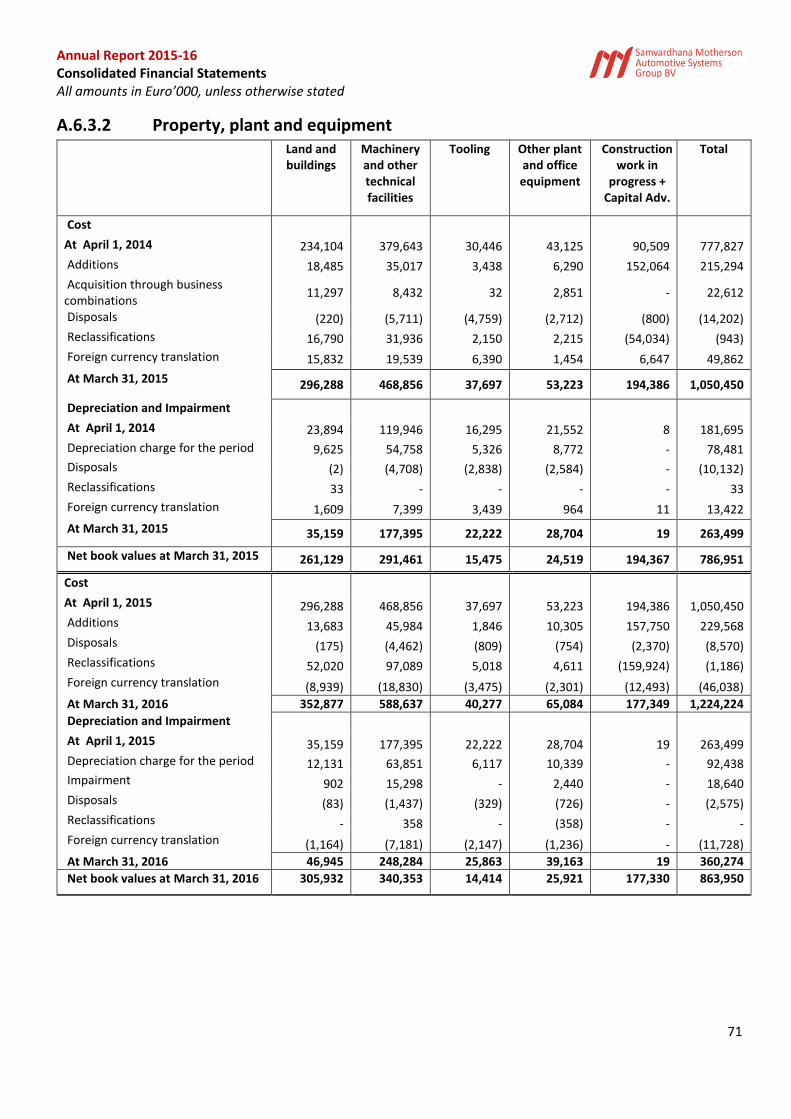
Annual Report 2015-16 Consolidated Financial Statements All amounts in Euro’000, unless otherwise stated
71
A.6.3.2 Property, plant and equipment Land and
buildings Machinery and other technical facilities
Tooling Other plant and office equipment
Construction work in
progress + Capital Adv.
Total
Cost
At April 1, 2014 234,104 379,643 30,446 43,125 90,509 777,827
Additions 18,485 35,017 3,438 6,290 152,064 215,294
Acquisition through business combinations
11,297 8,432 32 2,851 - 22,612
Disposals (220) (5,711) (4,759) (2,712) (800) (14,202)
Reclassifications 16,790 31,936 2,150 2,215 (54,034) (943)
Foreign currency translation 15,832 19,539 6,390 1,454 6,647 49,862
At March 31, 2015 296,288 468,856 37,697 53,223 194,386 1,050,450
Depreciation and Impairment At April 1, 2014 23,894 119,946 16,295 21,552 8 181,695
Depreciation charge for the period 9,625 54,758 5,326 8,772 - 78,481
Disposals (2) (4,708) (2,838) (2,584) - (10,132)
Reclassifications 33 - - - - 33
Foreign currency translation 1,609 7,399 3,439 964 11 13,422
At March 31, 2015 35,159 177,395 22,222 28,704 19 263,499
Net book values at March 31, 2015 261,129 291,461 15,475 24,519 194,367 786,951
Cost
At April 1, 2015 296,288 468,856 37,697 53,223 194,386 1,050,450 Additions 13,683 45,984 1,846 10,305 157,750 229,568 Disposals (175) (4,462) (809) (754) (2,370) (8,570) Reclassifications 52,020 97,089 5,018 4,611 (159,924) (1,186) Foreign currency translation (8,939) (18,830) (3,475) (2,301) (12,493) (46,038)
At March 31, 2016 352,877 588,637 40,277 65,084 177,349 1,224,224
Depreciation and Impairment At April 1, 2015 35,159 177,395 22,222 28,704 19 263,499 Depreciation charge for the period 12,131 63,851 6,117 10,339 - 92,438 Impairment 902 15,298 - 2,440 - 18,640 Disposals (83) (1,437) (329) (726) - (2,575) Reclassifications - 358 - (358) - - Foreign currency translation (1,164) (7,181) (2,147) (1,236) - (11,728)
At March 31, 2016 46,945 248,284 25,863 39,163 19 360,274
Net book values at March 31, 2016 305,932 340,353 14,414 25,921 177,330 863,950
Annual Report 2015-16 Consolidated Financial Statements All amounts in Euro’000, unless otherwise stated
72
As at March 31, 2016, property, plant and equipment with a net book value of k€ 386,363 (March 31, 2015: k€ 179,214) were subject to security for bank borrowings. (see note A.6.3.13).
During the year, the Group has capitalised borrowing costs amounting to k€ 3,986 (March 31, 2015: k€ 1,421) on qualifying assets. Borrowing costs were capitalised at the weighted average rate of its general borrowings of 5.05%. During the year ended March 31, 2016 one of the Group’s subsidiary SMP Automotive Produtos
Automotivos do Brasil Ltda (forming part of SMP segment) was tested for impairment. The impairment
assessment was triggered due to weak financial performance mainly due to slow down in Brazil automobile
market coupled with high inflation and exchange rate increase.
The management prepared an impairment analysis using discounted cash flow projections based on
financial budgets approved by management covering a five-year period to calculate the value in use of the
CGU. This resulted in the Group recognising an impairment loss of k€ 18,640 during the year. The analysis
was prepared using discount rate of 15%, reflecting specific risks related to Brazil, to discount the future
cash flows. The impairment loss is included under ‘Depreciation and amortisation’ in the Income Statement
under Note A.6.4.6.
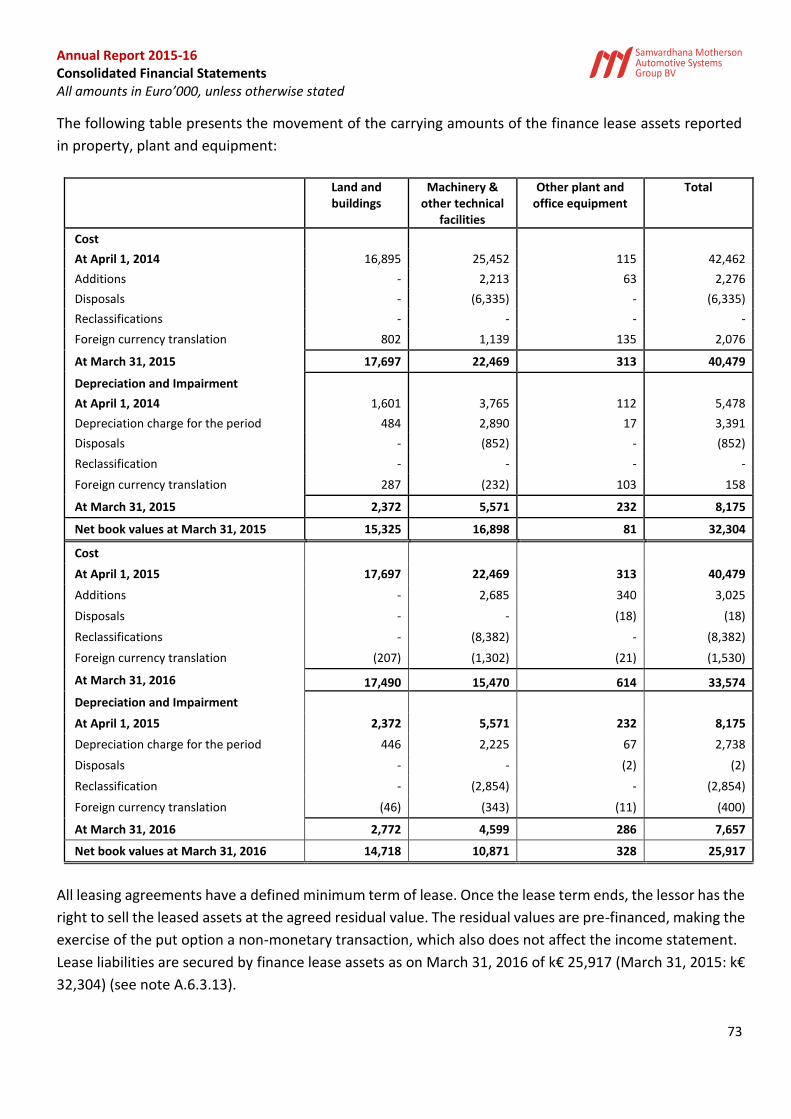
Annual Report 2015-16 Consolidated Financial Statements All amounts in Euro’000, unless otherwise stated
73
The following table presents the movement of the carrying amounts of the finance lease assets reported
in property, plant and equipment:
Land and
buildings Machinery &
other technical facilities
Other plant and office equipment
Total
Cost
At April 1, 2014 16,895 25,452 115 42,462
Additions - 2,213 63 2,276
Disposals - (6,335) - (6,335)
Reclassifications - - - -
Foreign currency translation 802 1,139 135 2,076
At March 31, 2015 17,697 22,469 313 40,479
Depreciation and Impairment
At April 1, 2014 1,601 3,765 112 5,478
Depreciation charge for the period 484 2,890 17 3,391
Disposals - (852) - (852)
Reclassification - - - -
Foreign currency translation 287 (232) 103 158
At March 31, 2015 2,372 5,571 232 8,175
Net book values at March 31, 2015 15,325 16,898 81 32,304
Cost
At April 1, 2015 17,697 22,469 313 40,479
Additions - 2,685 340 3,025
Disposals - - (18) (18)
Reclassifications - (8,382) - (8,382)
Foreign currency translation (207) (1,302) (21) (1,530)
At March 31, 2016 17,490 15,470 614 33,574
Depreciation and Impairment
At April 1, 2015 2,372 5,571 232 8,175
Depreciation charge for the period 446 2,225 67 2,738
Disposals - - (2) (2)
Reclassification - (2,854) - (2,854)
Foreign currency translation (46) (343) (11) (400)
At March 31, 2016 2,772 4,599 286 7,657
Net book values at March 31, 2016 14,718 10,871 328 25,917
All leasing agreements have a defined minimum term of lease. Once the lease term ends, the lessor has the
right to sell the leased assets at the agreed residual value. The residual values are pre-financed, making the
exercise of the put option a non-monetary transaction, which also does not affect the income statement.
Lease liabilities are secured by finance lease assets as on March 31, 2016 of k€ 25,917 (March 31, 2015: k€
32,304) (see note A.6.3.13).

Annual Report 2015-16 Consolidated Financial Statements All amounts in Euro’000, unless otherwise stated
74
A.6.3.3 Investment properties
March 31, 2016 March 31, 2015
Cost
At beginning of the year 12,637 12,637
Additions - -
At end of the year 12,637 12,637
Depreciation and Impairment
At beginning of the year 1,636 1,370
Depreciation charge 268 267
At end of the year 1,904 1,637
Net book values at end of the year 10,733 11,000
The fair value of investment properties as on March 31, 2016 is k€ 11,440 (March 31, 2015: k€ 11,440). The
fair value has been determined based on valuations performed by an accredited independent valuer and
falls in the Level 2 of financial instruments valuation hierarchy.
The investment properties comprise a number of commercial properties that are leased to third parties. The leases contain an initial non-cancellable period of 5 years and subsequent renewals are negotiated with the lessee. No contingent rents are charged.
At the year end, the future minimum lease payments under non-cancellable lease receivable are follows:
March 31, 2016 March 31, 2015
Not later than one year 541 642
Later than one year and not later than five years 86 581
627 1,223
During the year, following amounts were recognised in the statement of profit and loss in respect of investment properties:
March 31, 2016 March 31, 2015
Rental income from rented properties, all leased under operating leases
866 1,071
Other operating income 97 112
Direct operating expenses (including repairs and maintenance) arising from investment property that did not generate rental income during the period.
(750) (1,048)
Net rental income from rented properties 213 135
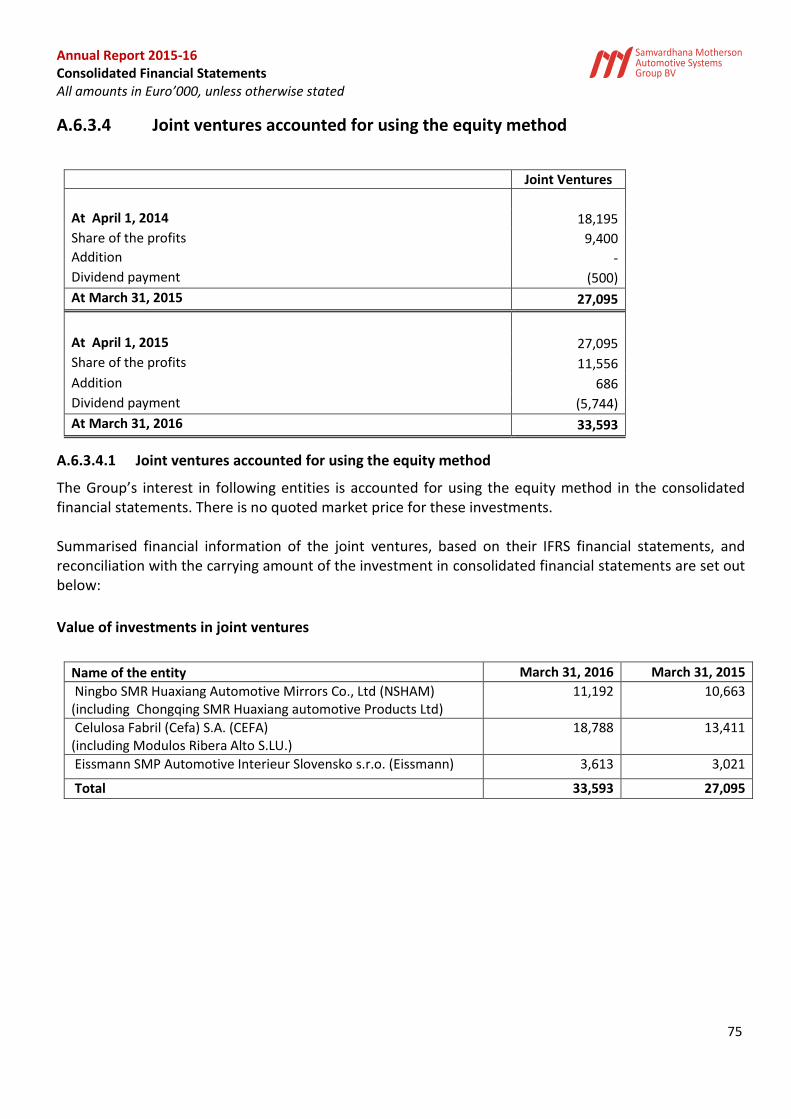
Annual Report 2015-16 Consolidated Financial Statements All amounts in Euro’000, unless otherwise stated
75
A.6.3.4 Joint ventures accounted for using the equity method
Joint Ventures
At April 1, 2014 18,195
Share of the profits 9,400
Addition -
Dividend payment (500)
At March 31, 2015 27,095
At April 1, 2015 27,095
Share of the profits 11,556
Addition 686
Dividend payment (5,744)
At March 31, 2016 33,593
A.6.3.4.1 Joint ventures accounted for using the equity method
The Group’s interest in following entities is accounted for using the equity method in the consolidated financial statements. There is no quoted market price for these investments. Summarised financial information of the joint ventures, based on their IFRS financial statements, and reconciliation with the carrying amount of the investment in consolidated financial statements are set out below:
Value of investments in joint ventures
Name of the entity March 31, 2016 March 31, 2015
Ningbo SMR Huaxiang Automotive Mirrors Co., Ltd (NSHAM) (including Chongqing SMR Huaxiang automotive Products Ltd)
11,192 10,663
Celulosa Fabril (Cefa) S.A. (CEFA) (including Modulos Ribera Alto S.LU.)
18,788 13,411
Eissmann SMP Automotive Interieur Slovensko s.r.o. (Eissmann) 3,613 3,021
Total 33,593 27,095
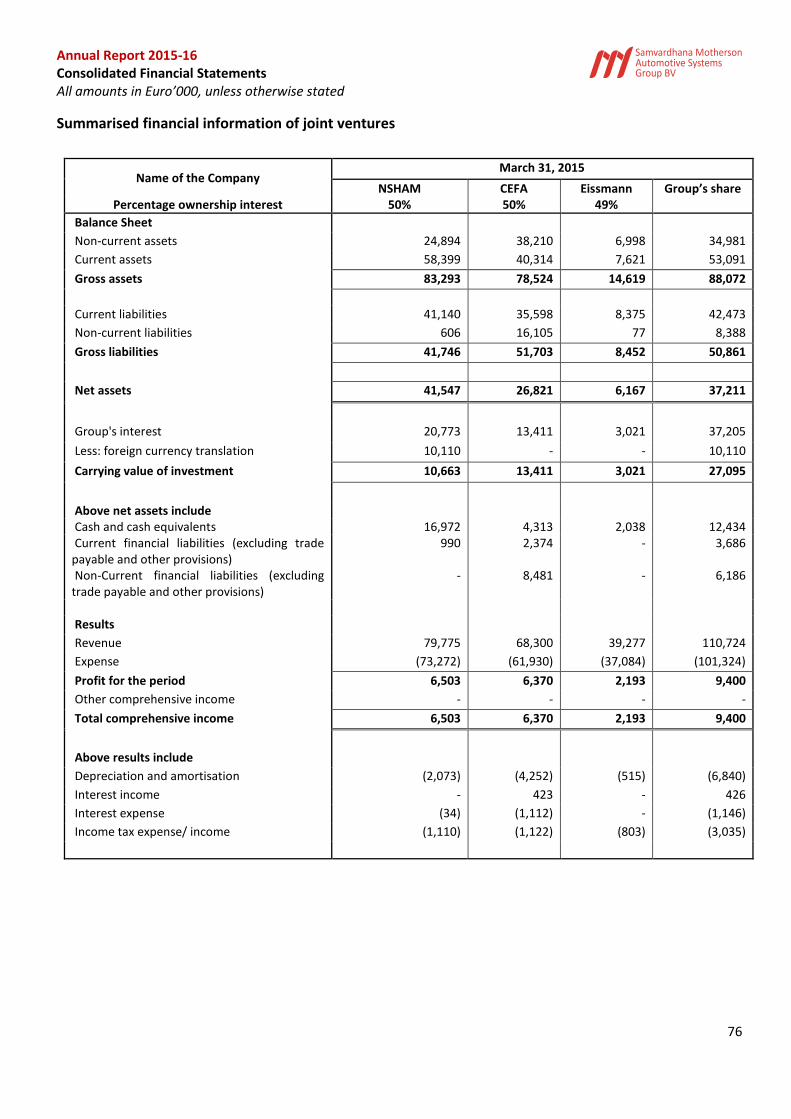
Annual Report 2015-16 Consolidated Financial Statements All amounts in Euro’000, unless otherwise stated
76
Summarised financial information of joint ventures
Name of the Company March 31, 2015
NSHAM CEFA Eissmann Group’s share Percentage ownership interest 50% 50% 49%
Balance Sheet
Non-current assets 24,894 38,210 6,998 34,981
Current assets 58,399 40,314 7,621 53,091
Gross assets 83,293 78,524 14,619 88,072
Current liabilities 41,140 35,598 8,375 42,473
Non-current liabilities 606 16,105 77 8,388
Gross liabilities 41,746 51,703 8,452 50,861
Net assets 41,547 26,821 6,167 37,211
Group's interest 20,773 13,411 3,021 37,205
Less: foreign currency translation 10,110 - - 10,110
Carrying value of investment 10,663 13,411 3,021 27,095
Above net assets include Cash and cash equivalents 16,972 4,313 2,038 12,434 Current financial liabilities (excluding trade payable and other provisions)
990 2,374 - 3,686
Non-Current financial liabilities (excluding trade payable and other provisions)
- 8,481 - 6,186
Results
Revenue 79,775 68,300 39,277 110,724
Expense (73,272) (61,930) (37,084) (101,324)
Profit for the period 6,503 6,370 2,193 9,400
Other comprehensive income - - - -
Total comprehensive income 6,503 6,370 2,193 9,400
Above results include
Depreciation and amortisation (2,073) (4,252) (515) (6,840)
Interest income - 423 - 426
Interest expense (34) (1,112) - (1,146)
Income tax expense/ income (1,110) (1,122) (803) (3,035)
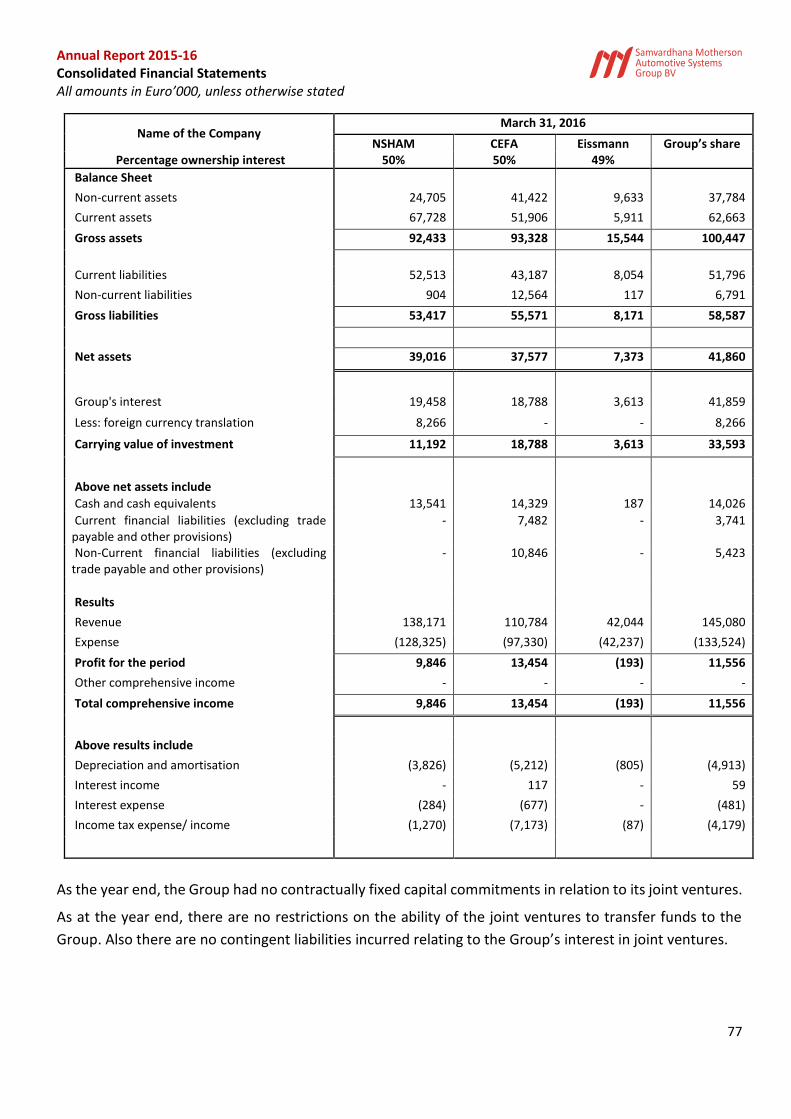
Annual Report 2015-16 Consolidated Financial Statements All amounts in Euro’000, unless otherwise stated
77
Name of the Company March 31, 2016
NSHAM CEFA Eissmann Group’s share Percentage ownership interest 50% 50% 49%
Balance Sheet
Non-current assets 24,705 41,422 9,633 37,784
Current assets 67,728 51,906 5,911 62,663
Gross assets 92,433 93,328 15,544 100,447
Current liabilities 52,513 43,187 8,054 51,796
Non-current liabilities 904 12,564 117 6,791
Gross liabilities 53,417 55,571 8,171 58,587
Net assets 39,016 37,577 7,373 41,860
Group's interest 19,458 18,788 3,613 41,859
Less: foreign currency translation 8,266 - - 8,266
Carrying value of investment 11,192 18,788 3,613 33,593
Above net assets include
Cash and cash equivalents 13,541 14,329 187 14,026
Current financial liabilities (excluding trade payable and other provisions)
- 7,482 - 3,741
Non-Current financial liabilities (excluding trade payable and other provisions)
- 10,846 - 5,423
Results
Revenue 138,171 110,784 42,044 145,080
Expense (128,325) (97,330) (42,237) (133,524)
Profit for the period 9,846 13,454 (193) 11,556
Other comprehensive income - - - -
Total comprehensive income 9,846 13,454 (193) 11,556
Above results include
Depreciation and amortisation (3,826) (5,212) (805) (4,913)
Interest income - 117 - 59
Interest expense (284) (677) - (481)
Income tax expense/ income (1,270) (7,173) (87) (4,179)
As the year end, the Group had no contractually fixed capital commitments in relation to its joint ventures.
As at the year end, there are no restrictions on the ability of the joint ventures to transfer funds to the
Group. Also there are no contingent liabilities incurred relating to the Group’s interest in joint ventures.
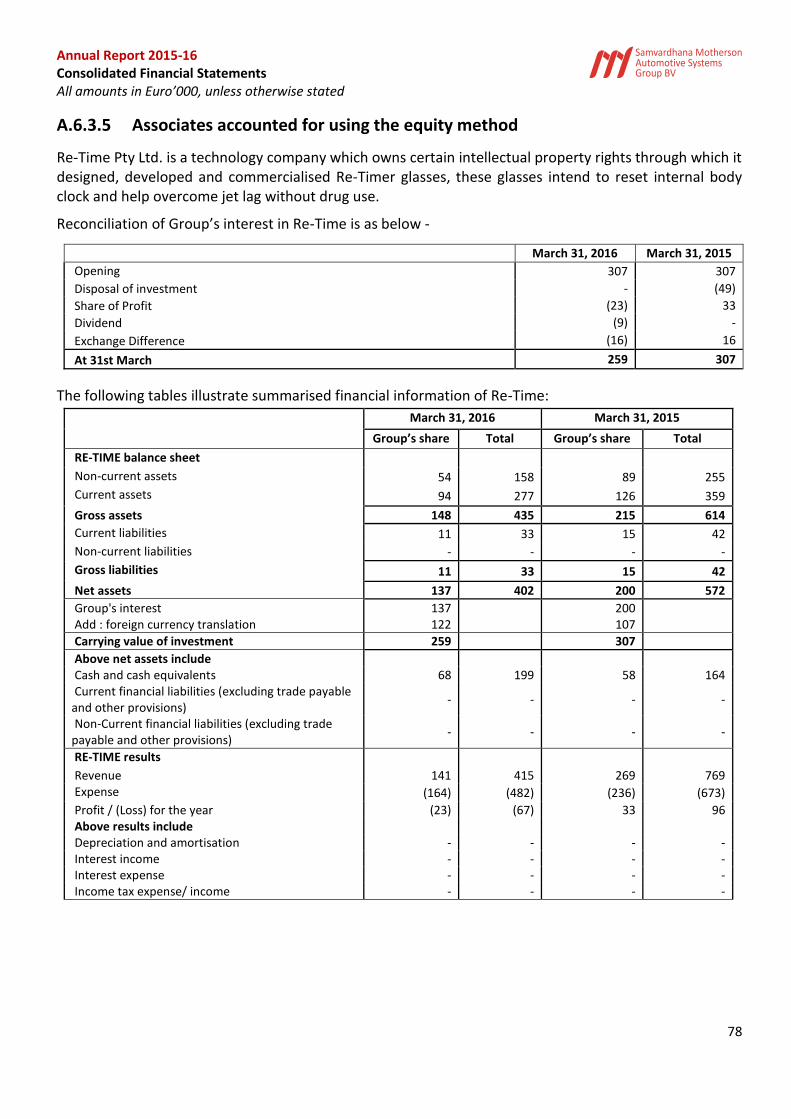
Annual Report 2015-16 Consolidated Financial Statements All amounts in Euro’000, unless otherwise stated
78
A.6.3.5 Associates accounted for using the equity method
Re-Time Pty Ltd. is a technology company which owns certain intellectual property rights through which it designed, developed and commercialised Re-Timer glasses, these glasses intend to reset internal body clock and help overcome jet lag without drug use.
Reconciliation of Group’s interest in Re-Time is as below -
March 31, 2016 March 31, 2015
Opening 307 307
Disposal of investment - (49)
Share of Profit (23) 33
Dividend (9) -
Exchange Difference (16) 16
At 31st March 259 307
The following tables illustrate summarised financial information of Re-Time:
March 31, 2016 March 31, 2015
Group’s share Total Group’s share Total
RE-TIME balance sheet
Non-current assets 54 158 89 255
Current assets 94 277 126 359
Gross assets 148 435 215 614
Current liabilities 11 33 15 42
Non-current liabilities - - - -
Gross liabilities 11 33 15 42
Net assets 137 402 200 572
Group's interest 137 200 Add : foreign currency translation 122 107
Carrying value of investment 259 307
Above net assets include Cash and cash equivalents 68 199 58 164 Current financial liabilities (excluding trade payable and other provisions)
- - - -
Non-Current financial liabilities (excluding trade payable and other provisions)
- - - -
RE-TIME results
Revenue 141 415 269 769 Expense (164) (482) (236) (673)
Profit / (Loss) for the year (23) (67) 33 96 Above results include Depreciation and amortisation - - - - Interest income - - - - Interest expense - - - - Income tax expense/ income - - - -
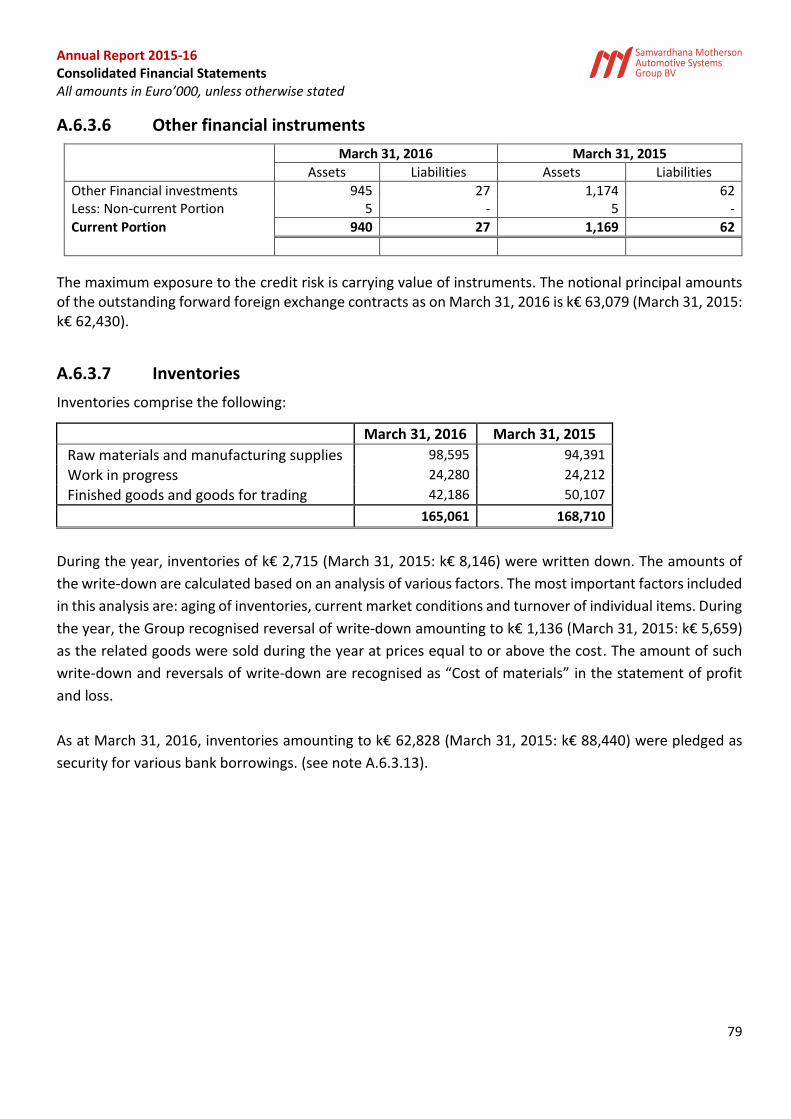
Annual Report 2015-16 Consolidated Financial Statements All amounts in Euro’000, unless otherwise stated
79
A.6.3.6 Other financial instruments
March 31, 2016 March 31, 2015
Assets Liabilities Assets Liabilities
Other Financial investments 945 27 1,174 62 Less: Non-current Portion 5 - 5 -
Current Portion 940 27 1,169 62
The maximum exposure to the credit risk is carrying value of instruments. The notional principal amounts of the outstanding forward foreign exchange contracts as on March 31, 2016 is k€ 63,079 (March 31, 2015: k€ 62,430).
A.6.3.7 Inventories
Inventories comprise the following:
March 31, 2016 March 31, 2015
Raw materials and manufacturing supplies 98,595 94,391
Work in progress 24,280 24,212
Finished goods and goods for trading 42,186 50,107
165,061 168,710
During the year, inventories of k€ 2,715 (March 31, 2015: k€ 8,146) were written down. The amounts of
the write-down are calculated based on an analysis of various factors. The most important factors included
in this analysis are: aging of inventories, current market conditions and turnover of individual items. During
the year, the Group recognised reversal of write-down amounting to k€ 1,136 (March 31, 2015: k€ 5,659)
as the related goods were sold during the year at prices equal to or above the cost. The amount of such
write-down and reversals of write-down are recognised as “Cost of materials” in the statement of profit
and loss.
As at March 31, 2016, inventories amounting to k€ 62,828 (March 31, 2015: k€ 88,440) were pledged as
security for various bank borrowings. (see note A.6.3.13).
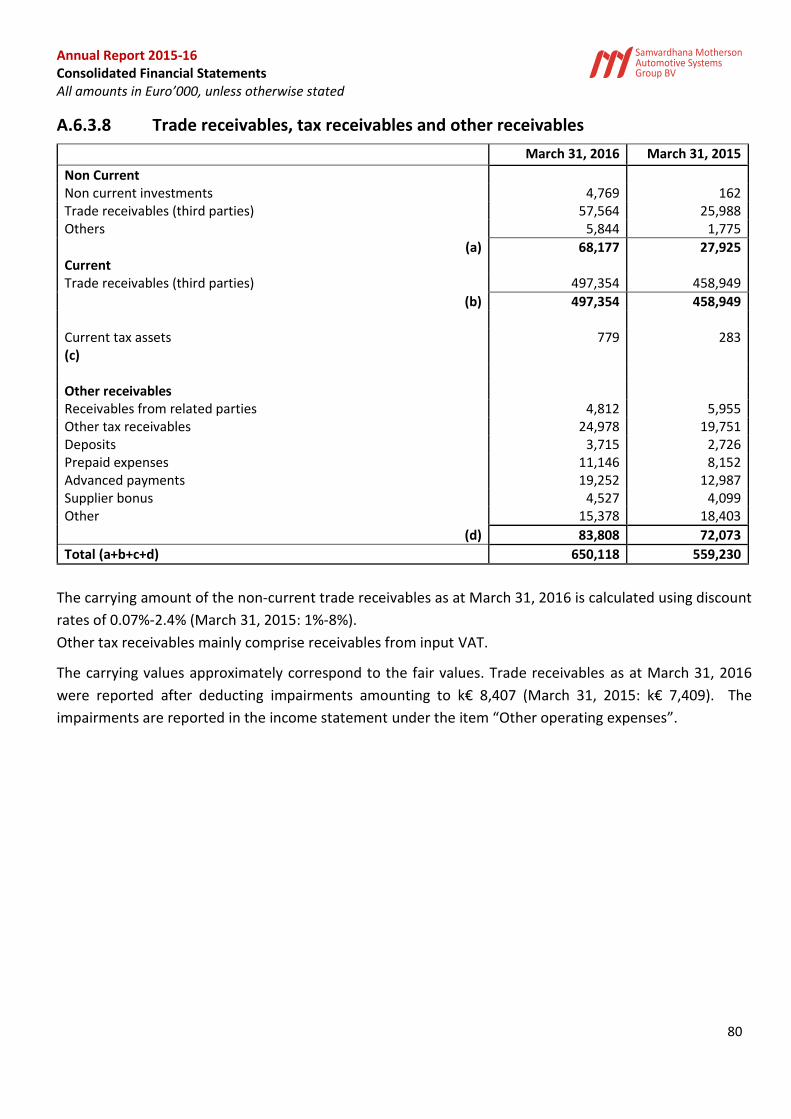
Annual Report 2015-16 Consolidated Financial Statements All amounts in Euro’000, unless otherwise stated
80
A.6.3.8 Trade receivables, tax receivables and other receivables
March 31, 2016 March 31, 2015
Non Current Non current investments 4,769 162 Trade receivables (third parties) 57,564 25,988 Others 5,844 1,775
(a) 68,177 27,925 Current Trade receivables (third parties) 497,354 458,949
(b) 497,354 458,949 Current tax assets (c)
779 283
Other receivables Receivables from related parties 4,812 5,955 Other tax receivables 24,978 19,751 Deposits 3,715 2,726 Prepaid expenses 11,146 8,152 Advanced payments 19,252 12,987 Supplier bonus 4,527 4,099 Other 15,378 18,403
(d) 83,808 72,073
Total (a+b+c+d) 650,118 559,230
The carrying amount of the non-current trade receivables as at March 31, 2016 is calculated using discount
rates of 0.07%-2.4% (March 31, 2015: 1%-8%).
Other tax receivables mainly comprise receivables from input VAT.
The carrying values approximately correspond to the fair values. Trade receivables as at March 31, 2016
were reported after deducting impairments amounting to k€ 8,407 (March 31, 2015: k€ 7,409). The
impairments are reported in the income statement under the item “Other operating expenses”.
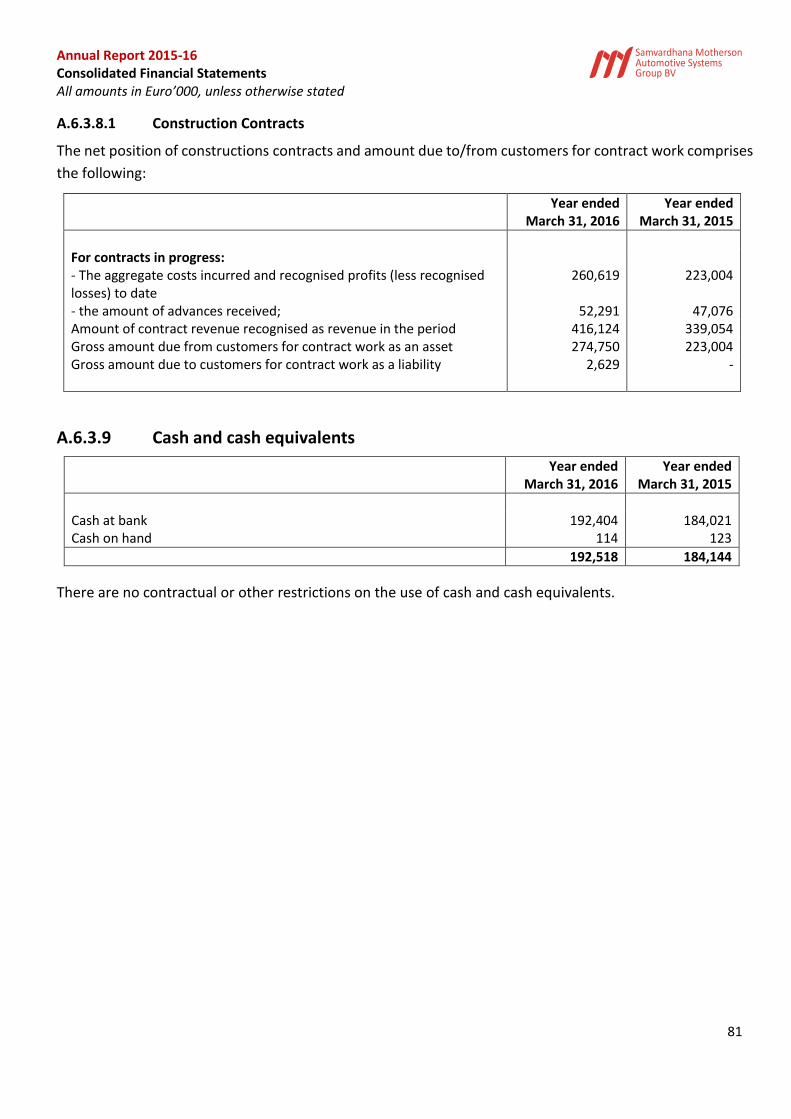
Annual Report 2015-16 Consolidated Financial Statements All amounts in Euro’000, unless otherwise stated
81
A.6.3.8.1 Construction Contracts
The net position of constructions contracts and amount due to/from customers for contract work comprises
the following:
Year ended March 31, 2016
Year ended March 31, 2015
For contracts in progress: - The aggregate costs incurred and recognised profits (less recognised losses) to date
260,619 223,004
- the amount of advances received; 52,291 47,076 Amount of contract revenue recognised as revenue in the period 416,124 339,054 Gross amount due from customers for contract work as an asset 274,750 223,004 Gross amount due to customers for contract work as a liability 2,629 -
A.6.3.9 Cash and cash equivalents
Year ended March 31, 2016
Year ended March 31, 2015
Cash at bank 192,404 184,021 Cash on hand 114 123
192,518 184,144
There are no contractual or other restrictions on the use of cash and cash equivalents.
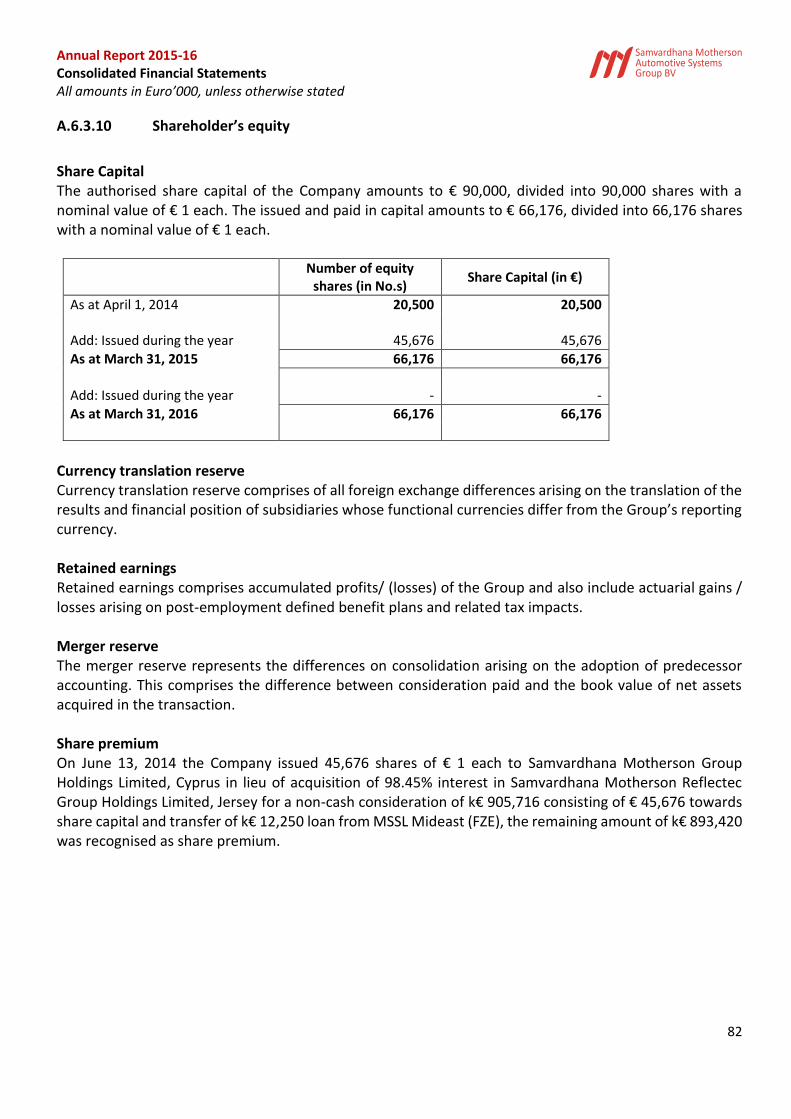
Annual Report 2015-16 Consolidated Financial Statements All amounts in Euro’000, unless otherwise stated
82
A.6.3.10 Shareholder’s equity
Share Capital The authorised share capital of the Company amounts to € 90,000, divided into 90,000 shares with a nominal value of € 1 each. The issued and paid in capital amounts to € 66,176, divided into 66,176 shares with a nominal value of € 1 each.
Number of equity
shares (in No.s) Share Capital (in €)
As at April 1, 2014 20,500 20,500 Add: Issued during the year 45,676 45,676
As at March 31, 2015 66,176 66,176
Add: Issued during the year - -
As at March 31, 2016 66,176 66,176
Currency translation reserve Currency translation reserve comprises of all foreign exchange differences arising on the translation of the results and financial position of subsidiaries whose functional currencies differ from the Group’s reporting currency. Retained earnings Retained earnings comprises accumulated profits/ (losses) of the Group and also include actuarial gains / losses arising on post-employment defined benefit plans and related tax impacts. Merger reserve The merger reserve represents the differences on consolidation arising on the adoption of predecessor accounting. This comprises the difference between consideration paid and the book value of net assets acquired in the transaction. Share premium On June 13, 2014 the Company issued 45,676 shares of € 1 each to Samvardhana Motherson Group Holdings Limited, Cyprus in lieu of acquisition of 98.45% interest in Samvardhana Motherson Reflectec Group Holdings Limited, Jersey for a non-cash consideration of k€ 905,716 consisting of € 45,676 towards share capital and transfer of k€ 12,250 loan from MSSL Mideast (FZE), the remaining amount of k€ 893,420 was recognised as share premium.
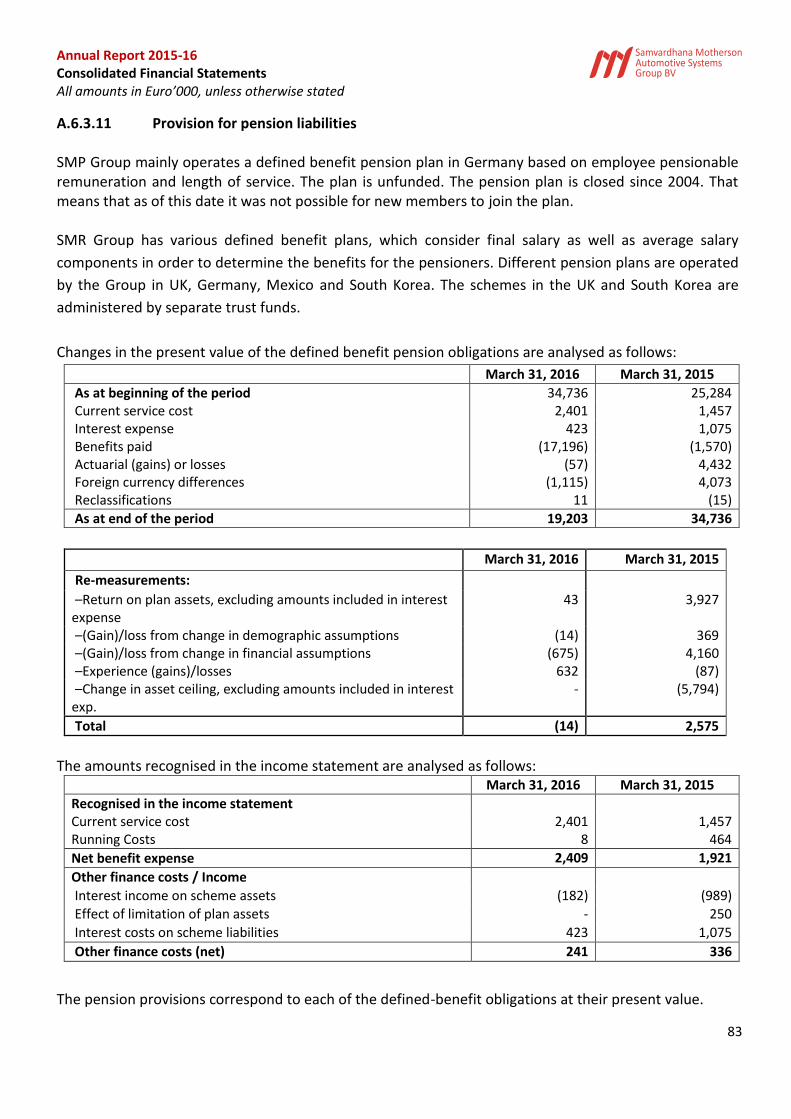
Annual Report 2015-16 Consolidated Financial Statements All amounts in Euro’000, unless otherwise stated
83
A.6.3.11 Provision for pension liabilities SMP Group mainly operates a defined benefit pension plan in Germany based on employee pensionable remuneration and length of service. The plan is unfunded. The pension plan is closed since 2004. That means that as of this date it was not possible for new members to join the plan. SMR Group has various defined benefit plans, which consider final salary as well as average salary
components in order to determine the benefits for the pensioners. Different pension plans are operated
by the Group in UK, Germany, Mexico and South Korea. The schemes in the UK and South Korea are
administered by separate trust funds.
Changes in the present value of the defined benefit pension obligations are analysed as follows:
March 31, 2016 March 31, 2015
As at beginning of the period 34,736 25,284 Current service cost 2,401 1,457 Interest expense 423 1,075 Benefits paid (17,196) (1,570) Actuarial (gains) or losses (57) 4,432 Foreign currency differences (1,115) 4,073 Reclassifications 11 (15)
As at end of the period 19,203 34,736
March 31, 2016 March 31, 2015
Re-measurements: –Return on plan assets, excluding amounts included in interest expense
43 3,927
–(Gain)/loss from change in demographic assumptions (14) 369 –(Gain)/loss from change in financial assumptions (675) 4,160 –Experience (gains)/losses 632 (87) –Change in asset ceiling, excluding amounts included in interest exp.
- (5,794)
Total (14) 2,575
The amounts recognised in the income statement are analysed as follows:
March 31, 2016 March 31, 2015
Recognised in the income statement Current service cost 2,401 1,457 Running Costs 8 464
Net benefit expense 2,409 1,921
Other finance costs / Income Interest income on scheme assets (182) (989) Effect of limitation of plan assets - 250
Interest costs on scheme liabilities 423 1,075
Other finance costs (net) 241 336
The pension provisions correspond to each of the defined-benefit obligations at their present value.
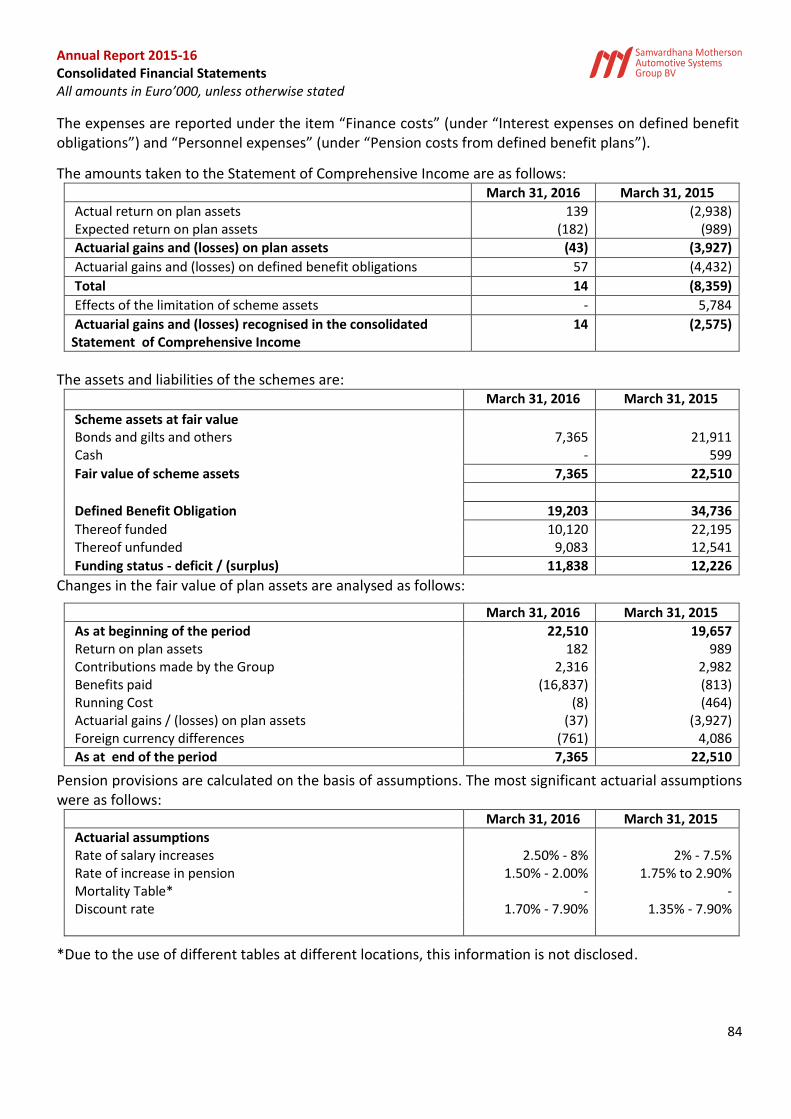
Annual Report 2015-16 Consolidated Financial Statements All amounts in Euro’000, unless otherwise stated
84
The expenses are reported under the item “Finance costs” (under “Interest expenses on defined benefit obligations”) and “Personnel expenses” (under “Pension costs from defined benefit plans”).
The amounts taken to the Statement of Comprehensive Income are as follows: March 31, 2016 March 31, 2015
Actual return on plan assets 139 (2,938) Expected return on plan assets (182) (989)
Actuarial gains and (losses) on plan assets (43) (3,927)
Actuarial gains and (losses) on defined benefit obligations 57 (4,432)
Total 14 (8,359)
Effects of the limitation of scheme assets - 5,784
Actuarial gains and (losses) recognised in the consolidated Statement of Comprehensive Income
14 (2,575)
The assets and liabilities of the schemes are: March 31, 2016 March 31, 2015
Scheme assets at fair value Bonds and gilts and others 7,365 21,911 Cash - 599
Fair value of scheme assets 7,365 22,510
Defined Benefit Obligation 19,203 34,736
Thereof funded 10,120 22,195 Thereof unfunded 9,083 12,541
Funding status - deficit / (surplus) 11,838 12,226
Changes in the fair value of plan assets are analysed as follows:
March 31, 2016 March 31, 2015
As at beginning of the period 22,510 19,657 Return on plan assets 182 989 Contributions made by the Group 2,316 2,982 Benefits paid (16,837) (813) Running Cost (8) (464) Actuarial gains / (losses) on plan assets (37) (3,927) Foreign currency differences (761) 4,086
As at end of the period 7,365 22,510
Pension provisions are calculated on the basis of assumptions. The most significant actuarial assumptions were as follows:
March 31, 2016 March 31, 2015
Actuarial assumptions Rate of salary increases 2.50% - 8% 2% - 7.5% Rate of increase in pension 1.50% - 2.00% 1.75% to 2.90% Mortality Table* - - Discount rate 1.70% - 7.90% 1.35% - 7.90%
*Due to the use of different tables at different locations, this information is not disclosed.
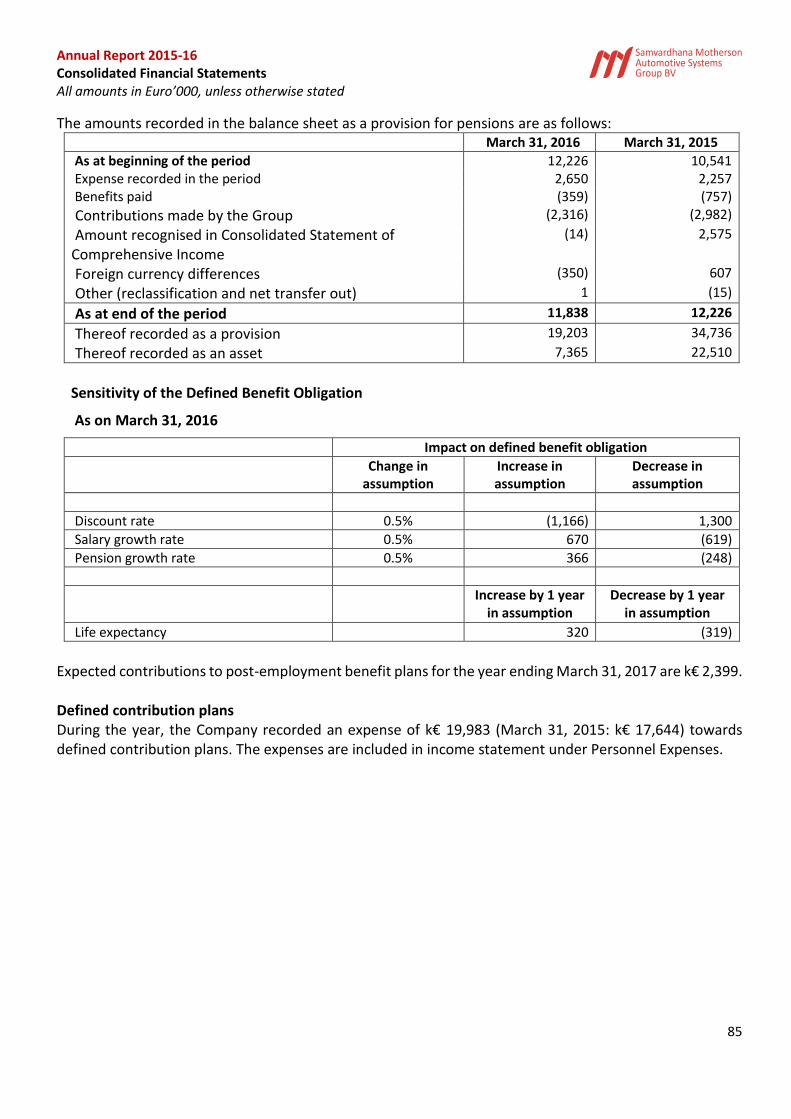
Annual Report 2015-16 Consolidated Financial Statements All amounts in Euro’000, unless otherwise stated
85
The amounts recorded in the balance sheet as a provision for pensions are as follows: March 31, 2016 March 31, 2015
As at beginning of the period 12,226 10,541 Expense recorded in the period 2,650 2,257 Benefits paid (359) (757)
Contributions made by the Group (2,316) (2,982)
Amount recognised in Consolidated Statement of Comprehensive Income
(14) 2,575
Foreign currency differences (350) 607
Other (reclassification and net transfer out) 1 (15)
As at end of the period 11,838 12,226
Thereof recorded as a provision 19,203 34,736
Thereof recorded as an asset 7,365 22,510
Sensitivity of the Defined Benefit Obligation
As on March 31, 2016
Impact on defined benefit obligation
Change in assumption
Increase in assumption
Decrease in assumption
Discount rate 0.5% (1,166) 1,300
Salary growth rate 0.5% 670 (619)
Pension growth rate 0.5% 366 (248)
Increase by 1 year in assumption
Decrease by 1 year in assumption
Life expectancy 320 (319)
Expected contributions to post-employment benefit plans for the year ending March 31, 2017 are k€ 2,399. Defined contribution plans During the year, the Company recorded an expense of k€ 19,983 (March 31, 2015: k€ 17,644) towards defined contribution plans. The expenses are included in income statement under Personnel Expenses.
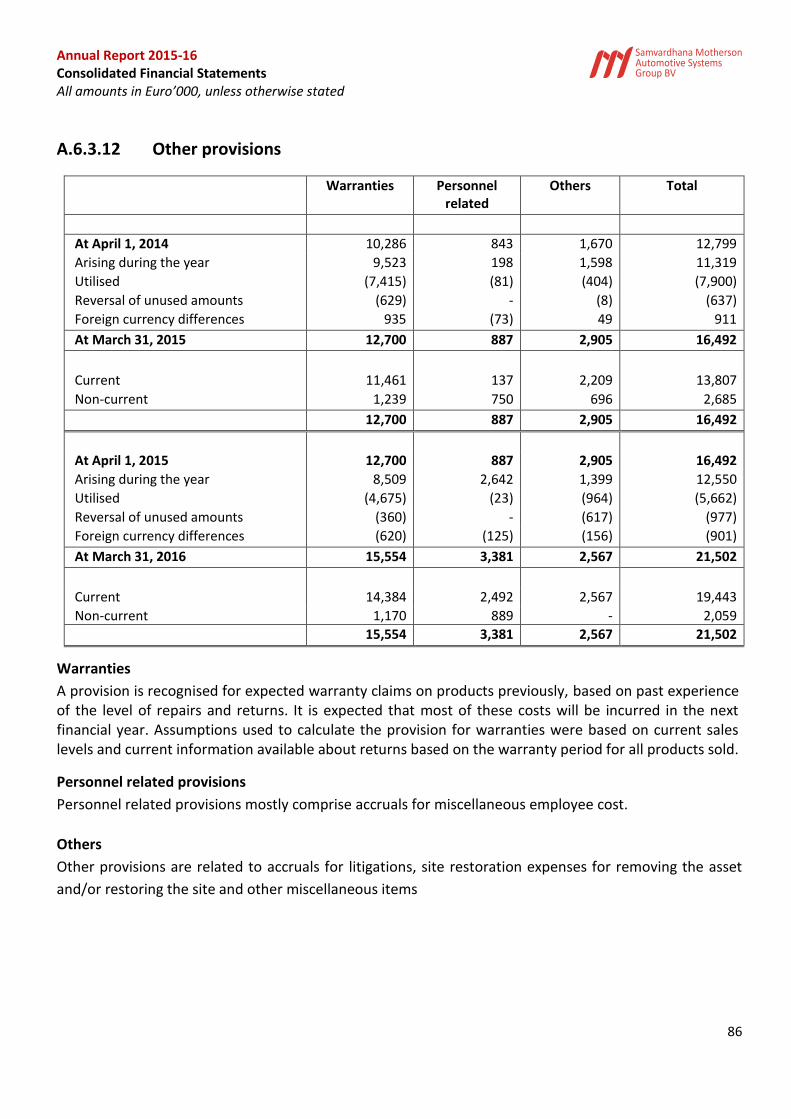
Annual Report 2015-16 Consolidated Financial Statements All amounts in Euro’000, unless otherwise stated
86
A.6.3.12 Other provisions
Warranties Personnel related
Others Total
At April 1, 2014 10,286 843 1,670 12,799
Arising during the year 9,523 198 1,598 11,319
Utilised (7,415) (81) (404) (7,900)
Reversal of unused amounts (629) - (8) (637)
Foreign currency differences 935 (73) 49 911
At March 31, 2015 12,700 887 2,905 16,492
Current 11,461 137 2,209 13,807
Non-current 1,239 750 696 2,685
12,700 887 2,905 16,492
At April 1, 2015 12,700 887 2,905 16,492
Arising during the year 8,509 2,642 1,399 12,550
Utilised (4,675) (23) (964) (5,662)
Reversal of unused amounts (360) - (617) (977)
Foreign currency differences (620) (125) (156) (901)
At March 31, 2016 15,554 3,381 2,567 21,502
Current 14,384 2,492 2,567 19,443
Non-current 1,170 889 - 2,059
15,554 3,381 2,567 21,502
Warranties
A provision is recognised for expected warranty claims on products previously, based on past experience of the level of repairs and returns. It is expected that most of these costs will be incurred in the next financial year. Assumptions used to calculate the provision for warranties were based on current sales levels and current information available about returns based on the warranty period for all products sold.
Personnel related provisions
Personnel related provisions mostly comprise accruals for miscellaneous employee cost.
Others
Other provisions are related to accruals for litigations, site restoration expenses for removing the asset
and/or restoring the site and other miscellaneous items
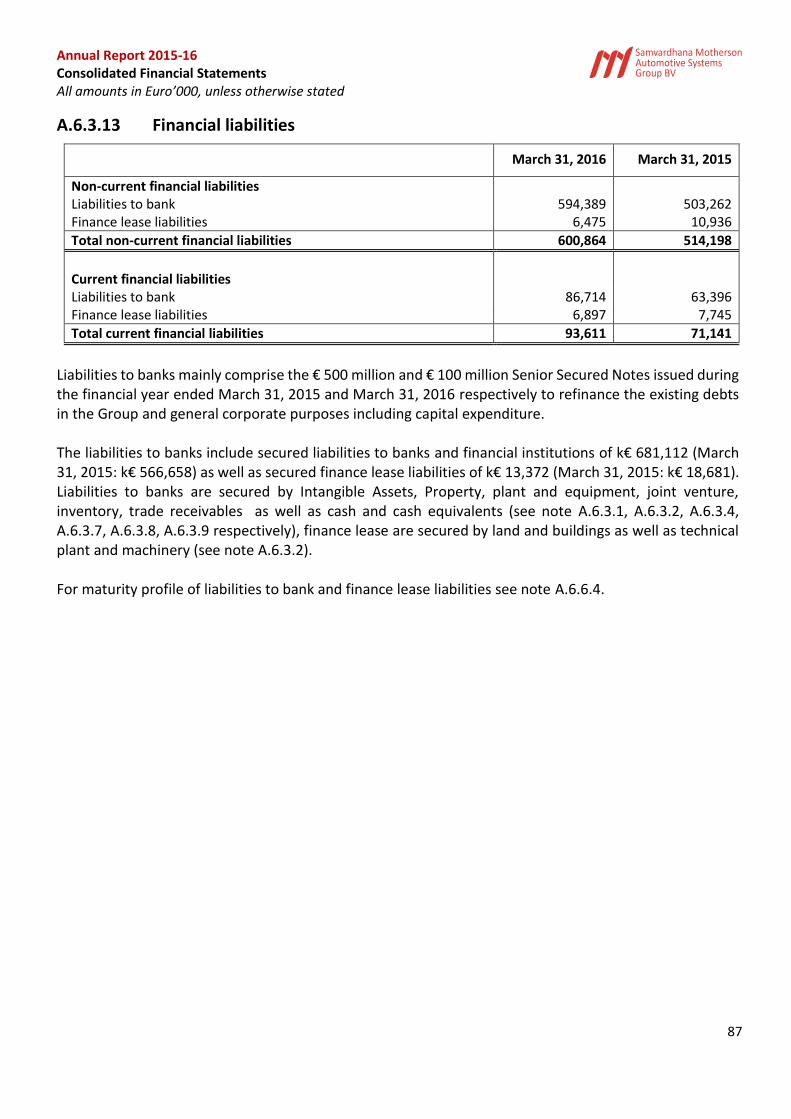
Annual Report 2015-16 Consolidated Financial Statements All amounts in Euro’000, unless otherwise stated
87
A.6.3.13 Financial liabilities
March 31, 2016 March 31, 2015
Non-current financial liabilities Liabilities to bank 594,389 503,262 Finance lease liabilities 6,475 10,936
Total non-current financial liabilities 600,864 514,198
Current financial liabilities Liabilities to bank 86,714 63,396 Finance lease liabilities 6,897 7,745
Total current financial liabilities 93,611 71,141
Liabilities to banks mainly comprise the € 500 million and € 100 million Senior Secured Notes issued during the financial year ended March 31, 2015 and March 31, 2016 respectively to refinance the existing debts in the Group and general corporate purposes including capital expenditure. The liabilities to banks include secured liabilities to banks and financial institutions of k€ 681,112 (March 31, 2015: k€ 566,658) as well as secured finance lease liabilities of k€ 13,372 (March 31, 2015: k€ 18,681). Liabilities to banks are secured by Intangible Assets, Property, plant and equipment, joint venture, inventory, trade receivables as well as cash and cash equivalents (see note A.6.3.1, A.6.3.2, A.6.3.4, A.6.3.7, A.6.3.8, A.6.3.9 respectively), finance lease are secured by land and buildings as well as technical plant and machinery (see note A.6.3.2). For maturity profile of liabilities to bank and finance lease liabilities see note A.6.6.4.
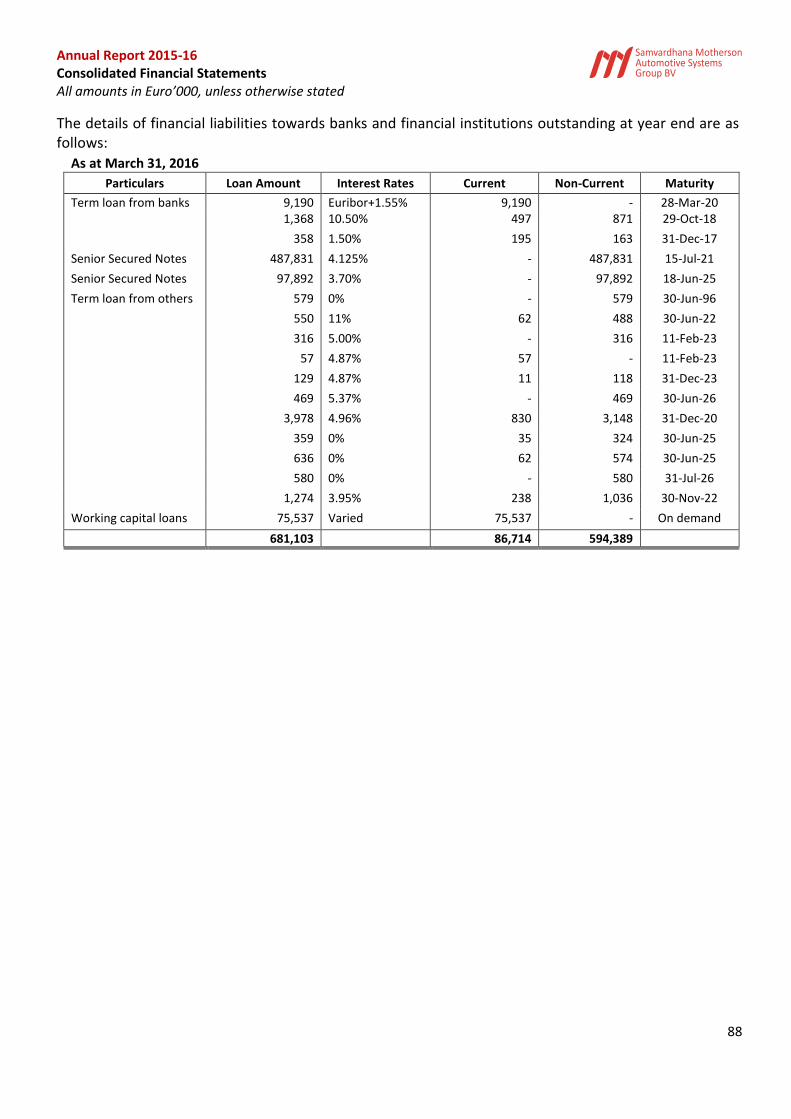
Annual Report 2015-16 Consolidated Financial Statements All amounts in Euro’000, unless otherwise stated
88
The details of financial liabilities towards banks and financial institutions outstanding at year end are as follows:
As at March 31, 2016
Particulars Loan Amount Interest Rates Current Non-Current Maturity
Term loan from banks 9,190 Euribor+1.55% 9,190 - 28-Mar-20 1,368 10.50% 497 871 29-Oct-18
358 1.50% 195 163 31-Dec-17
Senior Secured Notes 487,831 4.125% - 487,831 15-Jul-21
Senior Secured Notes 97,892 3.70% - 97,892 18-Jun-25
Term loan from others 579 0% - 579 30-Jun-96
550 11% 62 488 30-Jun-22
316 5.00% - 316 11-Feb-23
57 4.87% 57 - 11-Feb-23
129 4.87% 11 118 31-Dec-23
469 5.37% - 469 30-Jun-26
3,978 4.96% 830 3,148 31-Dec-20
359 0% 35 324 30-Jun-25
636 0% 62 574 30-Jun-25
580 0% - 580 31-Jul-26
1,274 3.95% 238 1,036 30-Nov-22
Working capital loans 75,537 Varied 75,537 - On demand
681,103 86,714 594,389
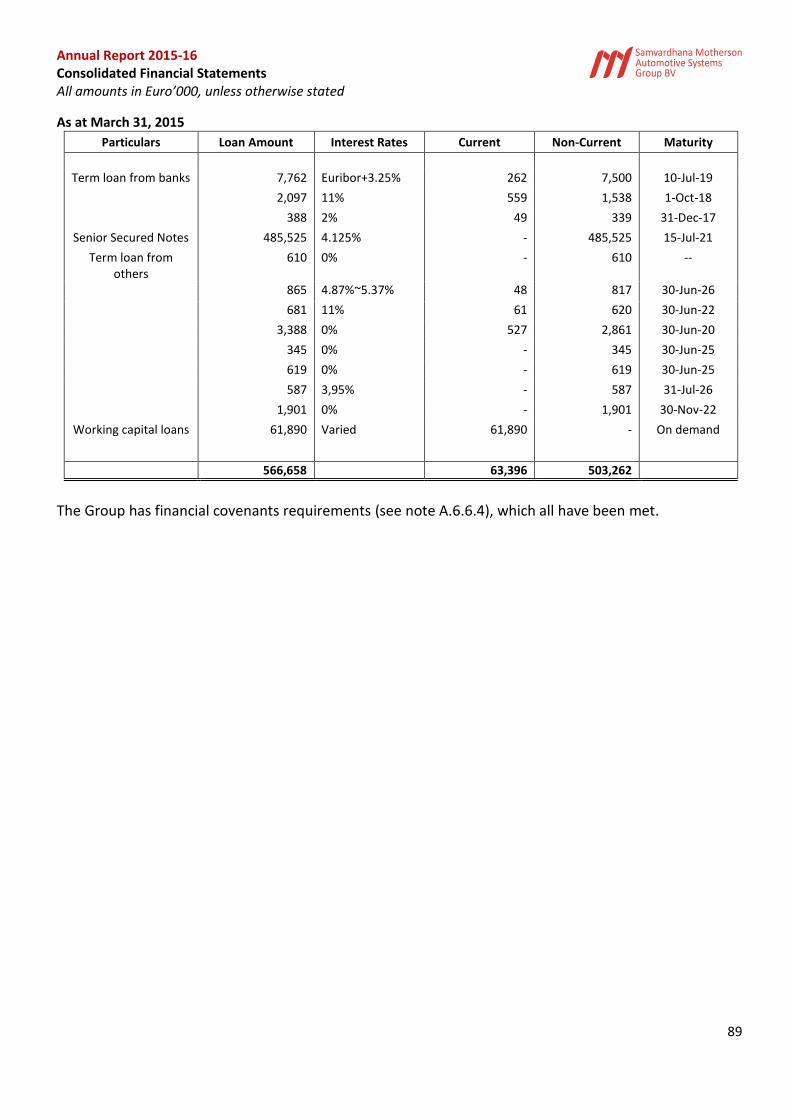
Annual Report 2015-16 Consolidated Financial Statements All amounts in Euro’000, unless otherwise stated
89
As at March 31, 2015 Particulars Loan Amount Interest Rates Current Non-Current Maturity
Term loan from banks 7,762 Euribor+3.25% 262 7,500 10-Jul-19
2,097 11% 559 1,538 1-Oct-18
388 2% 49 339 31-Dec-17
Senior Secured Notes 485,525 4.125% - 485,525 15-Jul-21
Term loan from others
610 0% - 610 --
865 4.87%~5.37% 48 817 30-Jun-26
681 11% 61 620 30-Jun-22
3,388 0% 527 2,861 30-Jun-20
345 0% - 345 30-Jun-25
619 0% - 619 30-Jun-25
587 3,95% - 587 31-Jul-26
1,901 0% - 1,901 30-Nov-22
Working capital loans 61,890 Varied 61,890 - On demand
566,658 63,396 503,262
The Group has financial covenants requirements (see note A.6.6.4), which all have been met.
Annual Report 2015-16 Consolidated Financial Statements All amounts in Euro’000, unless otherwise stated
90
Issue of Senior Secured Notes and Revolving Credit Facilities a. Issue of senior secured notes on July 15, 2014
During the year ended March 31, 2015, the Company issued Euro 500,000,000 4.125% Senior Secured Notes due 2021 (the "2021 Notes"). The Notes bear interest at a rate of 4.125% payable semi-annually on January 15 and July 15 of each year and will mature on July 15, 2021. The Notes are listed on the Irish Stock Exchange and trade on the Global Exchange Market of the Exchange. The 2021 Notes carry a prepayment option and as per the terms of the indenture the Subsidiary may at any time on or after July 15, 2017, redeem all or part of the 2021 Notes by paying the redemption prices set forth in the indenture. Prior to July 15, 2017, the Subsidiary is entitled at its option, to redeem all or a portion of the 2021 Notes by paying 100% of the principal amount of such 2021 Notes, plus accrued and unpaid interest, if any, plus a “make-whole” premium. In addition, prior to July 15, 2017, the Subsidiary may redeem, at its option, up to 35% of the Notes with the net proceeds from certain equity offerings. The 2021 Notes are structured as senior secured obligations and will rank ‘pari passu’ in right of payment with all the existing and future senior obligations of SMRP BV, including the obligations under the Revolving Credit Facility and the Secondary Revolving Credit Facility. The 2021 Notes are guaranteed on a senior secured basis by certain subsidiaries of SMRP BV and are secured by share pledge and security interests granted over certain property and assets of SMRP BV and certain of its subsidiaries. As at March 31, 2016 these bonds were trading at 98.249% (March 31, 2015 : 102.397%)
b. Issue of senior secured notes on June 18, 2015
During the year ended March 31, 2016, the Company issued Euro 100,000,000 3.70% Senior Secured Notes due 2025 (the "Notes"). The Notes bear interest at a rate of 3.70% payable annually on June 18 of each year and will mature on June 18, 2025. The Notes are listed on the Irish Stock Exchange and trade on the Global Exchange Market of the Exchange. The Notes carry a prepayment option and as per the terms of the indenture the Company may at any time on or after June 18, 2025, redeem all or a portion of the Notes by paying 100% of the principal amount of such Notes, plus accrued and unpaid interest, if any, plus a “make-whole” premium. In addition, prior to June 18, 2025, the Company may redeem, at its option, up to 35% of the Notes with the net proceeds from certain equity offerings. The Notes are structured as senior secured obligations and will rank pari passu in right of payment with all the existing and future senior obligations of SMRP BV, including the obligations under 2021 Notes and the Revolving Credit Facilities. The Notes are guaranteed on a senior secured basis by certain subsidiaries of SMRP BV and are secured by share pledge and security interests granted over certain property and assets of SMRP BV and certain of its subsidiaries. The gross proceeds from the issuance of the Notes was utilized, after meeting initial notes issue expenses, for general corporate purposes, including to make certain capital expenditures amounting to € 96.0 million. As at March 31, 2016 these bonds were trading at 86.25%.
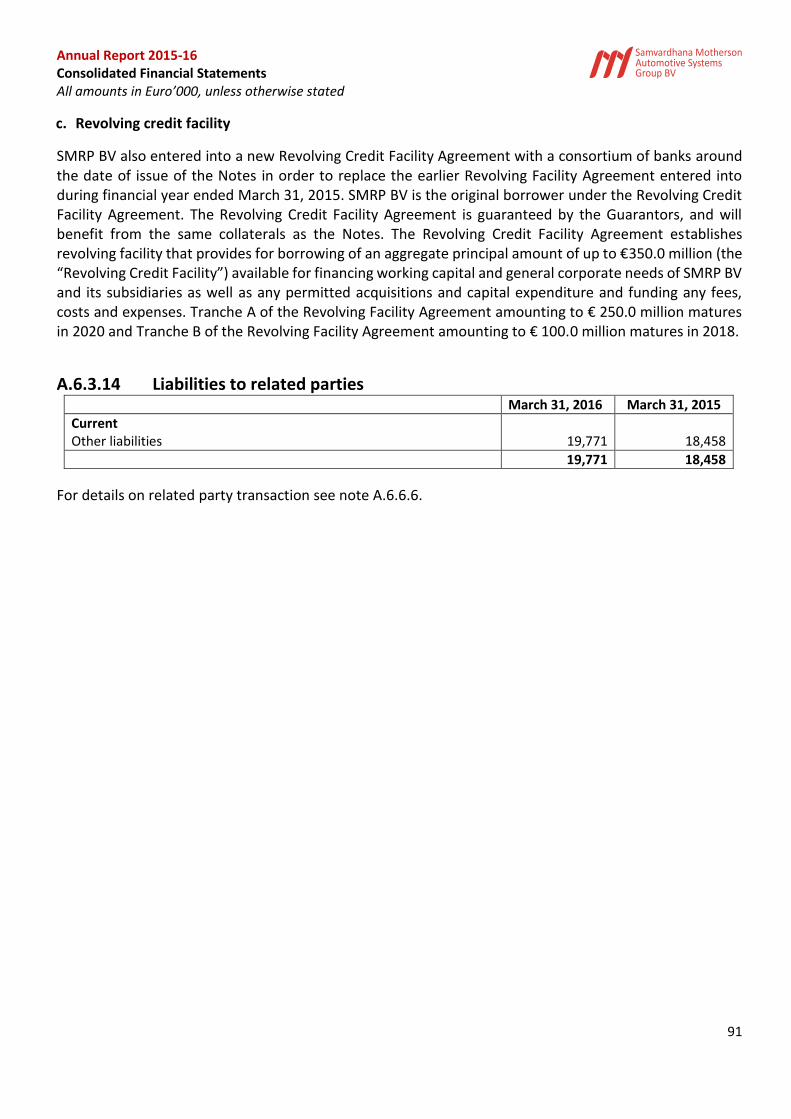
Annual Report 2015-16 Consolidated Financial Statements All amounts in Euro’000, unless otherwise stated
91
c. Revolving credit facility
SMRP BV also entered into a new Revolving Credit Facility Agreement with a consortium of banks around the date of issue of the Notes in order to replace the earlier Revolving Facility Agreement entered into during financial year ended March 31, 2015. SMRP BV is the original borrower under the Revolving Credit Facility Agreement. The Revolving Credit Facility Agreement is guaranteed by the Guarantors, and will benefit from the same collaterals as the Notes. The Revolving Credit Facility Agreement establishes revolving facility that provides for borrowing of an aggregate principal amount of up to €350.0 million (the “Revolving Credit Facility”) available for financing working capital and general corporate needs of SMRP BV and its subsidiaries as well as any permitted acquisitions and capital expenditure and funding any fees, costs and expenses. Tranche A of the Revolving Facility Agreement amounting to € 250.0 million matures in 2020 and Tranche B of the Revolving Facility Agreement amounting to € 100.0 million matures in 2018.
A.6.3.14 Liabilities to related parties March 31, 2016 March 31, 2015
Current Other liabilities 19,771 18,458
19,771 18,458
For details on related party transaction see note A.6.6.6.
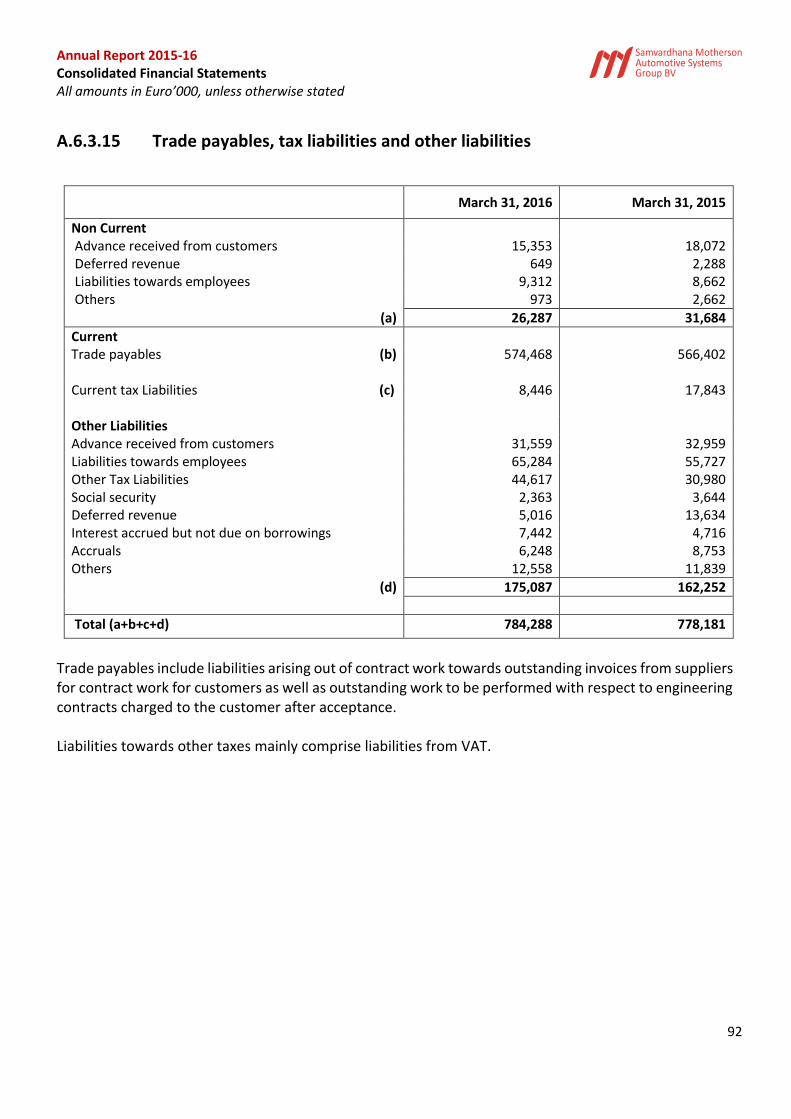
Annual Report 2015-16 Consolidated Financial Statements All amounts in Euro’000, unless otherwise stated
92
A.6.3.15 Trade payables, tax liabilities and other liabilities
March 31, 2016 March 31, 2015
Non Current Advance received from customers 15,353 18,072 Deferred revenue 649 2,288 Liabilities towards employees 9,312 8,662 Others 973 2,662
(a) 26,287 31,684
Current Trade payables (b) 574,468 566,402 Current tax Liabilities (c) 8,446 17,843 Other Liabilities Advance received from customers 31,559 32,959 Liabilities towards employees 65,284 55,727 Other Tax Liabilities 44,617 30,980 Social security 2,363 3,644 Deferred revenue 5,016 13,634 Interest accrued but not due on borrowings 7,442 4,716 Accruals 6,248 8,753 Others 12,558 11,839
(d) 175,087 162,252
Total (a+b+c+d) 784,288 778,181
Trade payables include liabilities arising out of contract work towards outstanding invoices from suppliers for contract work for customers as well as outstanding work to be performed with respect to engineering contracts charged to the customer after acceptance. Liabilities towards other taxes mainly comprise liabilities from VAT.
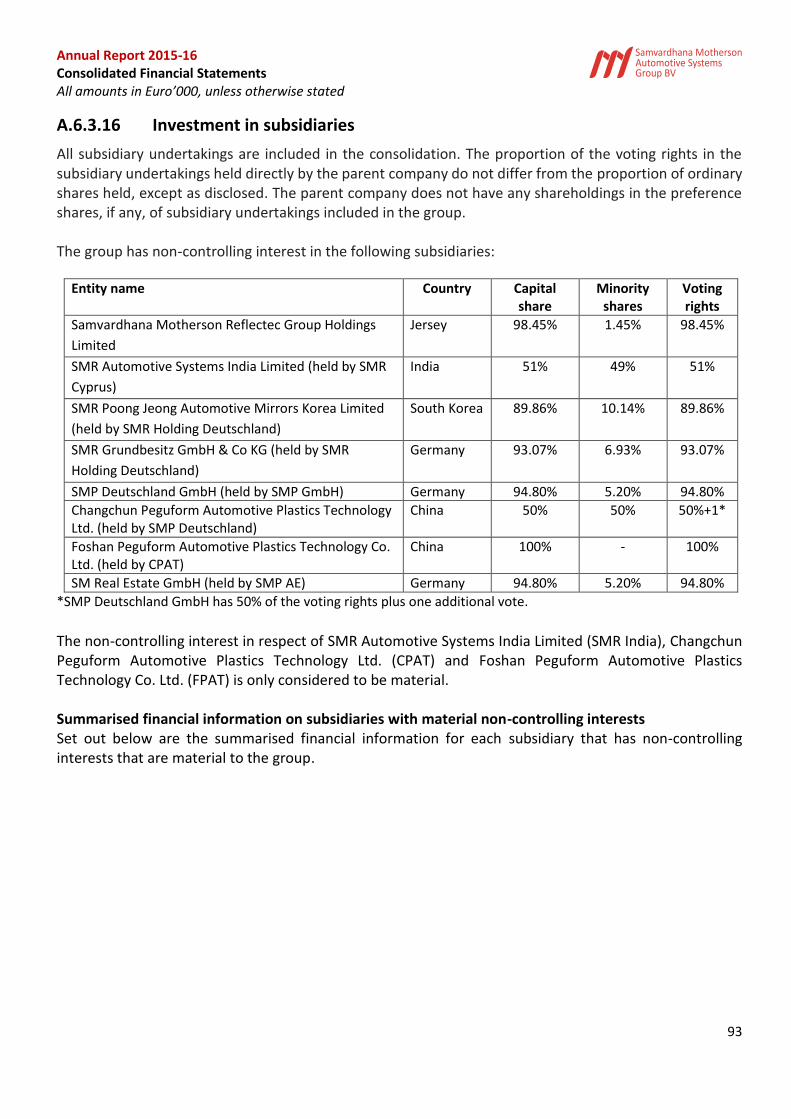
Annual Report 2015-16 Consolidated Financial Statements All amounts in Euro’000, unless otherwise stated
93
A.6.3.16 Investment in subsidiaries
All subsidiary undertakings are included in the consolidation. The proportion of the voting rights in the subsidiary undertakings held directly by the parent company do not differ from the proportion of ordinary shares held, except as disclosed. The parent company does not have any shareholdings in the preference shares, if any, of subsidiary undertakings included in the group. The group has non-controlling interest in the following subsidiaries:
Entity name Country Capital share
Minority shares
Voting rights
Samvardhana Motherson Reflectec Group Holdings
Limited
Jersey 98.45% 1.45% 98.45%
SMR Automotive Systems India Limited (held by SMR
Cyprus)
India 51% 49% 51%
SMR Poong Jeong Automotive Mirrors Korea Limited
(held by SMR Holding Deutschland)
South Korea 89.86% 10.14% 89.86%
SMR Grundbesitz GmbH & Co KG (held by SMR
Holding Deutschland)
Germany 93.07% 6.93% 93.07%
SMP Deutschland GmbH (held by SMP GmbH) Germany 94.80% 5.20% 94.80%
Changchun Peguform Automotive Plastics Technology Ltd. (held by SMP Deutschland)
China 50% 50% 50%+1*
Foshan Peguform Automotive Plastics Technology Co. Ltd. (held by CPAT)
China 100% - 100%
SM Real Estate GmbH (held by SMP AE) Germany 94.80% 5.20% 94.80%
*SMP Deutschland GmbH has 50% of the voting rights plus one additional vote.
The non-controlling interest in respect of SMR Automotive Systems India Limited (SMR India), Changchun Peguform Automotive Plastics Technology Ltd. (CPAT) and Foshan Peguform Automotive Plastics Technology Co. Ltd. (FPAT) is only considered to be material. Summarised financial information on subsidiaries with material non-controlling interests Set out below are the summarised financial information for each subsidiary that has non-controlling interests that are material to the group.
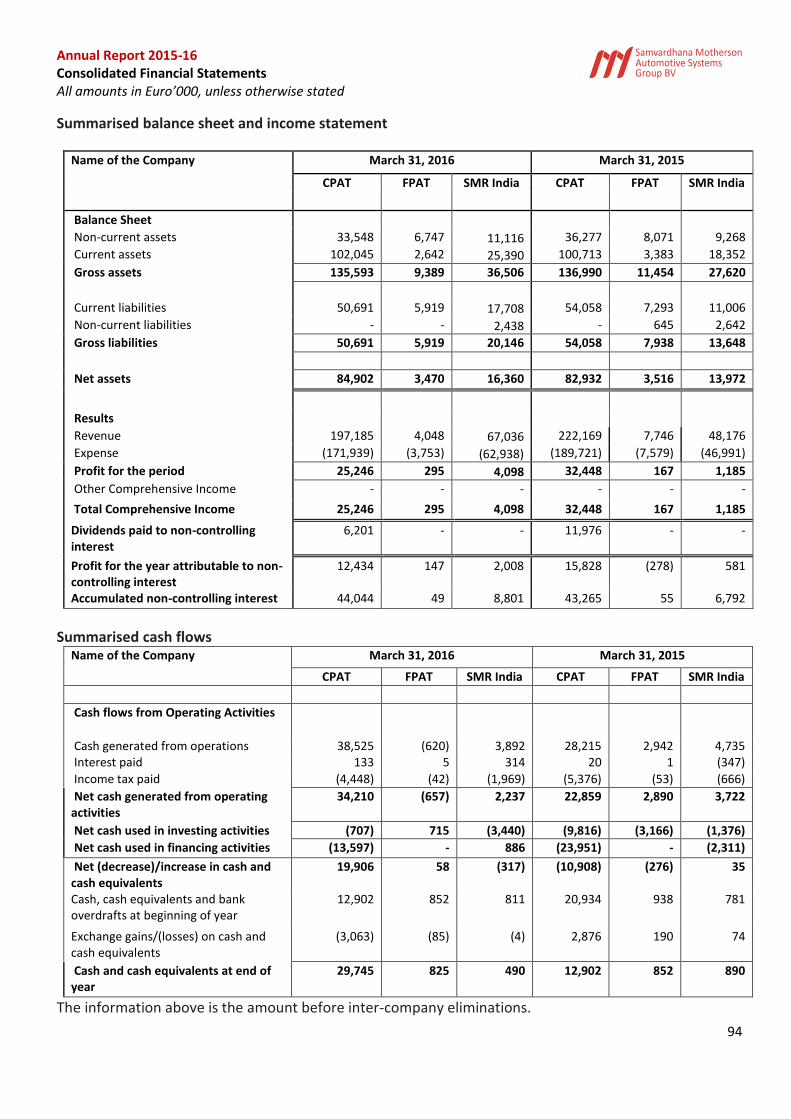
Annual Report 2015-16 Consolidated Financial Statements All amounts in Euro’000, unless otherwise stated
94
Summarised balance sheet and income statement
Name of the Company March 31, 2016 March 31, 2015
CPAT FPAT SMR India CPAT FPAT SMR India
Balance Sheet
Non-current assets 33,548 6,747 11,116 36,277 8,071 9,268
Current assets 102,045 2,642 25,390 100,713 3,383 18,352
Gross assets 135,593 9,389 36,506 136,990 11,454 27,620
Current liabilities 50,691 5,919 17,708 54,058 7,293 11,006
Non-current liabilities - - 2,438 - 645 2,642
Gross liabilities 50,691 5,919 20,146 54,058 7,938 13,648
Net assets 84,902 3,470 16,360 82,932 3,516 13,972
Results
Revenue 197,185 4,048 67,036 222,169 7,746 48,176
Expense (171,939) (3,753) (62,938) (189,721) (7,579) (46,991)
Profit for the period 25,246 295 4,098 32,448 167 1,185
Other Comprehensive Income - - - - - -
Total Comprehensive Income 25,246 295 4,098 32,448 167 1,185
Dividends paid to non-controlling interest
6,201 - - 11,976 - -
Profit for the year attributable to non-controlling interest
12,434 147 2,008 15,828 (278) 581
Accumulated non-controlling interest 44,044 49 8,801 43,265 55 6,792
Summarised cash flows Name of the Company March 31, 2016 March 31, 2015
CPAT FPAT SMR India CPAT FPAT SMR India
Cash flows from Operating Activities
Cash generated from operations 38,525 (620) 3,892 28,215 2,942 4,735 Interest paid 133 5 314 20 1 (347)
Income tax paid (4,448) (42) (1,969) (5,376) (53) (666)
Net cash generated from operating activities
34,210 (657) 2,237 22,859 2,890 3,722
Net cash used in investing activities (707) 715 (3,440) (9,816) (3,166) (1,376)
Net cash used in financing activities (13,597) - 886 (23,951) - (2,311)
Net (decrease)/increase in cash and cash equivalents
19,906 58 (317) (10,908) (276) 35
Cash, cash equivalents and bank overdrafts at beginning of year
12,902 852 811 20,934 938 781
Exchange gains/(losses) on cash and cash equivalents
(3,063) (85) (4) 2,876 190 74
Cash and cash equivalents at end of year
29,745 825 490 12,902 852 890
The information above is the amount before inter-company eliminations.
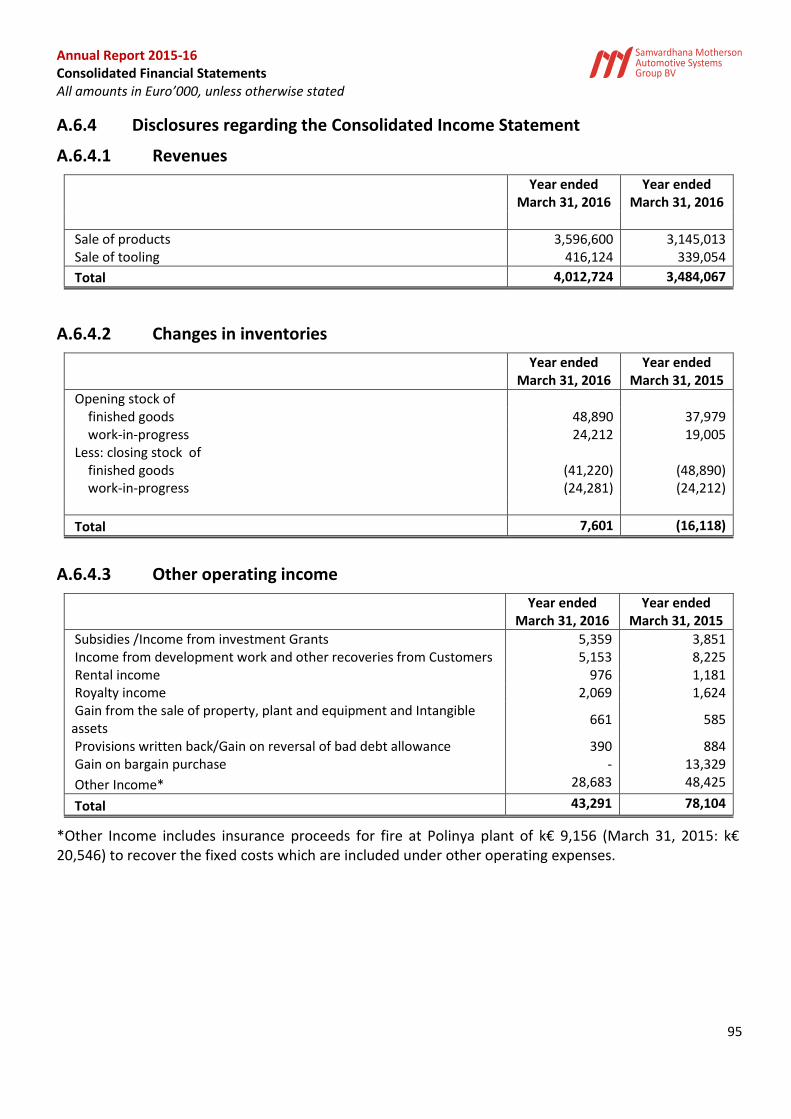
Annual Report 2015-16 Consolidated Financial Statements All amounts in Euro’000, unless otherwise stated
95
A.6.4 Disclosures regarding the Consolidated Income Statement
A.6.4.1 Revenues
Year ended
March 31, 2016 Year ended
March 31, 2016
Sale of products 3,596,600 3,145,013 Sale of tooling 416,124 339,054
Total 4,012,724 3,484,067
A.6.4.2 Changes in inventories
Year ended
March 31, 2016 Year ended
March 31, 2015
Opening stock of finished goods 48,890 37,979 work-in-progress 24,212 19,005 Less: closing stock of finished goods (41,220) (48,890) work-in-progress (24,281) (24,212)
Total 7,601 (16,118)
A.6.4.3 Other operating income
Year ended
March 31, 2016 Year ended
March 31, 2015
Subsidies /Income from investment Grants 5,359 3,851 Income from development work and other recoveries from Customers 5,153 8,225 Rental income 976 1,181 Royalty income 2,069 1,624 Gain from the sale of property, plant and equipment and Intangible assets
661 585
Provisions written back/Gain on reversal of bad debt allowance 390 884 Gain on bargain purchase - 13,329
Other Income* 28,683 48,425
Total 43,291 78,104
*Other Income includes insurance proceeds for fire at Polinya plant of k€ 9,156 (March 31, 2015: k€ 20,546) to recover the fixed costs which are included under other operating expenses.
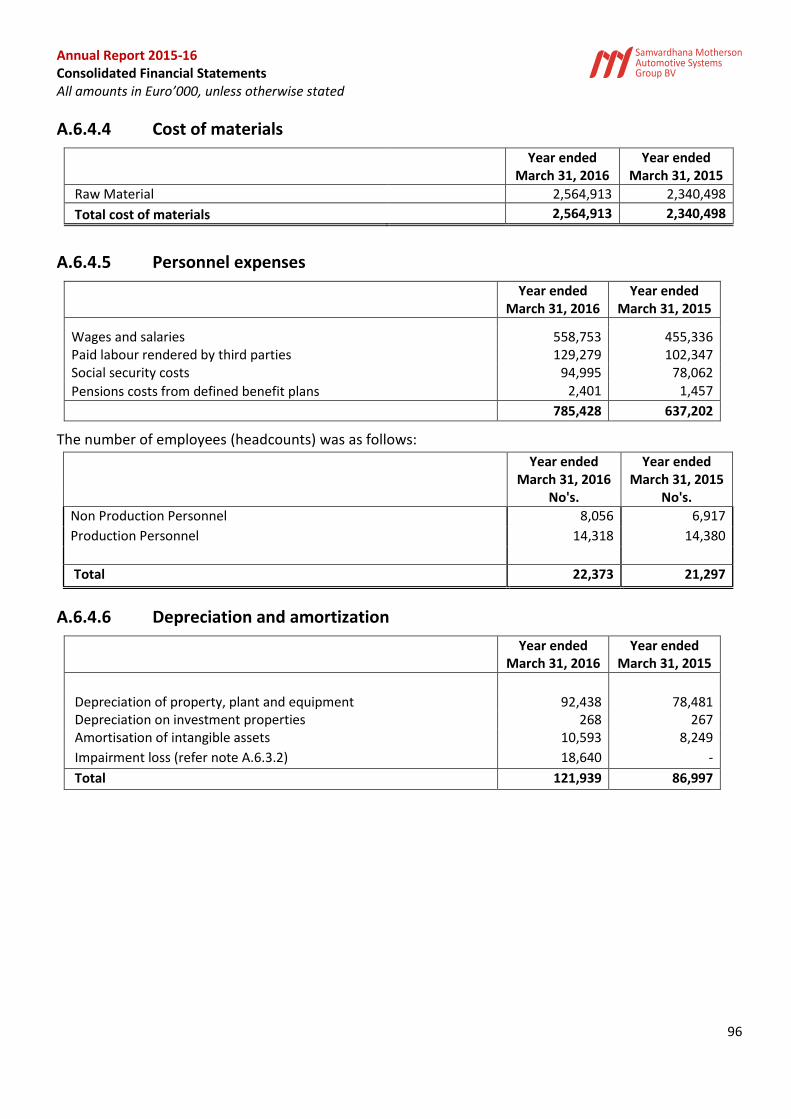
Annual Report 2015-16 Consolidated Financial Statements All amounts in Euro’000, unless otherwise stated
96
A.6.4.4 Cost of materials
Year ended
March 31, 2016 Year ended
March 31, 2015
Raw Material 2,564,913 2,340,498
Total cost of materials 2,564,913 2,340,498
A.6.4.5 Personnel expenses
Year ended
March 31, 2016 Year ended
March 31, 2015
Wages and salaries 558,753 455,336 Paid labour rendered by third parties 129,279 102,347 Social security costs 94,995 78,062
Pensions costs from defined benefit plans 2,401 1,457
785,428 637,202
The number of employees (headcounts) was as follows:
Year ended March 31, 2016
Year ended March 31, 2015
No's. No's.
Non Production Personnel 8,056 6,917
Production Personnel 14,318 14,380
Total 22,373 21,297
A.6.4.6 Depreciation and amortization
Year ended March 31, 2016
Year ended March 31, 2015
Depreciation of property, plant and equipment 92,438 78,481 Depreciation on investment properties 268 267 Amortisation of intangible assets 10,593 8,249
Impairment loss (refer note A.6.3.2) 18,640 -
Total 121,939 86,997
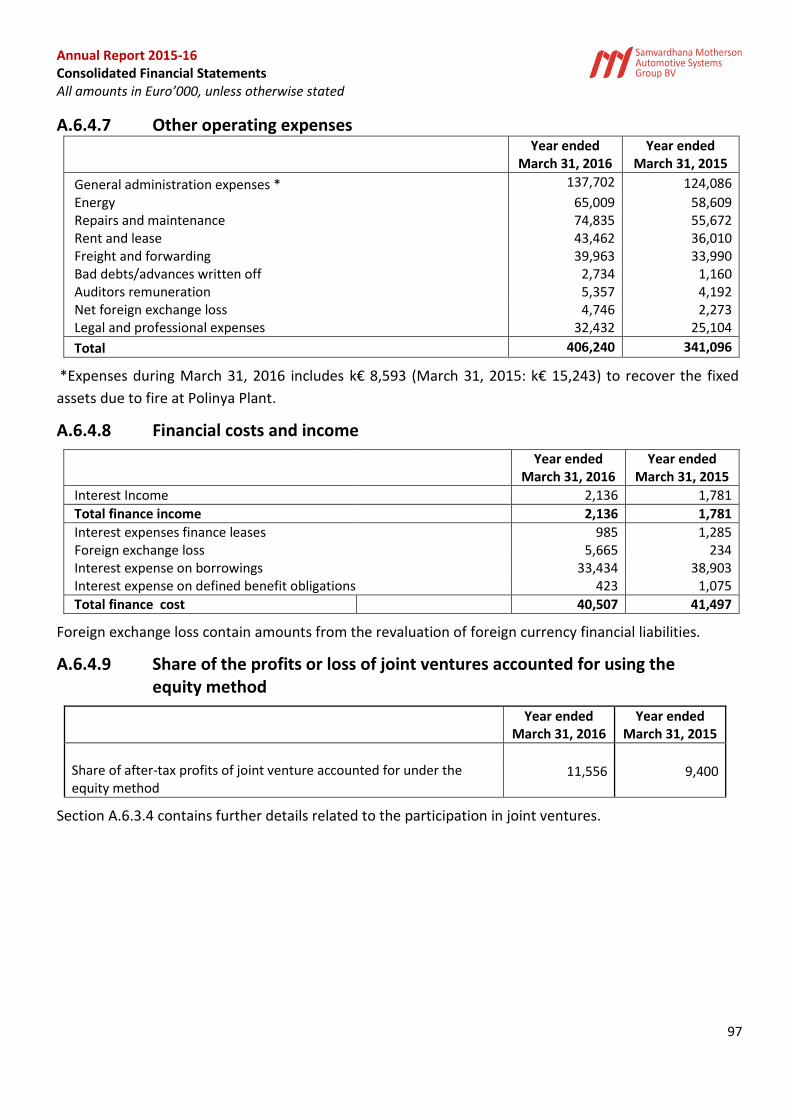
Annual Report 2015-16 Consolidated Financial Statements All amounts in Euro’000, unless otherwise stated
97
A.6.4.7 Other operating expenses
Year ended
March 31, 2016 Year ended
March 31, 2015
General administration expenses * 137,702 124,086
Energy 65,009 58,609 Repairs and maintenance 74,835 55,672 Rent and lease 43,462 36,010 Freight and forwarding 39,963 33,990 Bad debts/advances written off 2,734 1,160 Auditors remuneration 5,357 4,192 Net foreign exchange loss 4,746 2,273 Legal and professional expenses 32,432 25,104
Total 406,240 341,096
*Expenses during March 31, 2016 includes k€ 8,593 (March 31, 2015: k€ 15,243) to recover the fixed
assets due to fire at Polinya Plant.
A.6.4.8 Financial costs and income
Year ended
March 31, 2016 Year ended
March 31, 2015
Interest Income 2,136 1,781
Total finance income 2,136 1,781
Interest expenses finance leases 985 1,285 Foreign exchange loss 5,665 234 Interest expense on borrowings 33,434 38,903 Interest expense on defined benefit obligations 423 1,075
Total finance cost 40,507 41,497
Foreign exchange loss contain amounts from the revaluation of foreign currency financial liabilities.
A.6.4.9 Share of the profits or loss of joint ventures accounted for using the equity method
Year ended
March 31, 2016 Year ended
March 31, 2015
Share of after-tax profits of joint venture accounted for under the equity method
11,556 9,400
Section A.6.3.4 contains further details related to the participation in joint ventures.
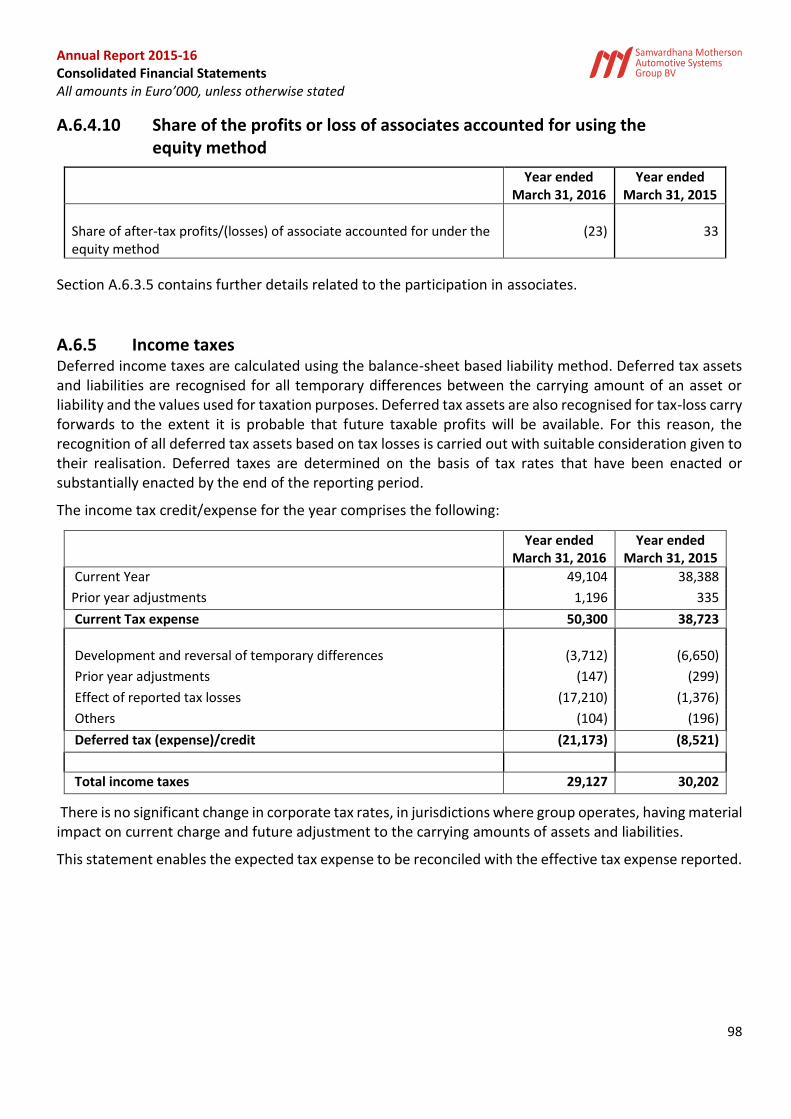
Annual Report 2015-16 Consolidated Financial Statements All amounts in Euro’000, unless otherwise stated
98
A.6.4.10 Share of the profits or loss of associates accounted for using the equity method
Year ended
March 31, 2016 Year ended
March 31, 2015
Share of after-tax profits/(losses) of associate accounted for under the equity method
(23) 33
Section A.6.3.5 contains further details related to the participation in associates.
A.6.5 Income taxes
Deferred income taxes are calculated using the balance-sheet based liability method. Deferred tax assets and liabilities are recognised for all temporary differences between the carrying amount of an asset or liability and the values used for taxation purposes. Deferred tax assets are also recognised for tax-loss carry forwards to the extent it is probable that future taxable profits will be available. For this reason, the recognition of all deferred tax assets based on tax losses is carried out with suitable consideration given to their realisation. Deferred taxes are determined on the basis of tax rates that have been enacted or substantially enacted by the end of the reporting period.
The income tax credit/expense for the year comprises the following:
Year ended March 31, 2016
Year ended March 31, 2015
Current Year 49,104 38,388
Prior year adjustments 1,196 335
Current Tax expense 50,300 38,723
Development and reversal of temporary differences (3,712) (6,650)
Prior year adjustments (147) (299)
Effect of reported tax losses (17,210) (1,376)
Others (104) (196)
Deferred tax (expense)/credit (21,173) (8,521)
Total income taxes 29,127 30,202
There is no significant change in corporate tax rates, in jurisdictions where group operates, having material impact on current charge and future adjustment to the carrying amounts of assets and liabilities.
This statement enables the expected tax expense to be reconciled with the effective tax expense reported.
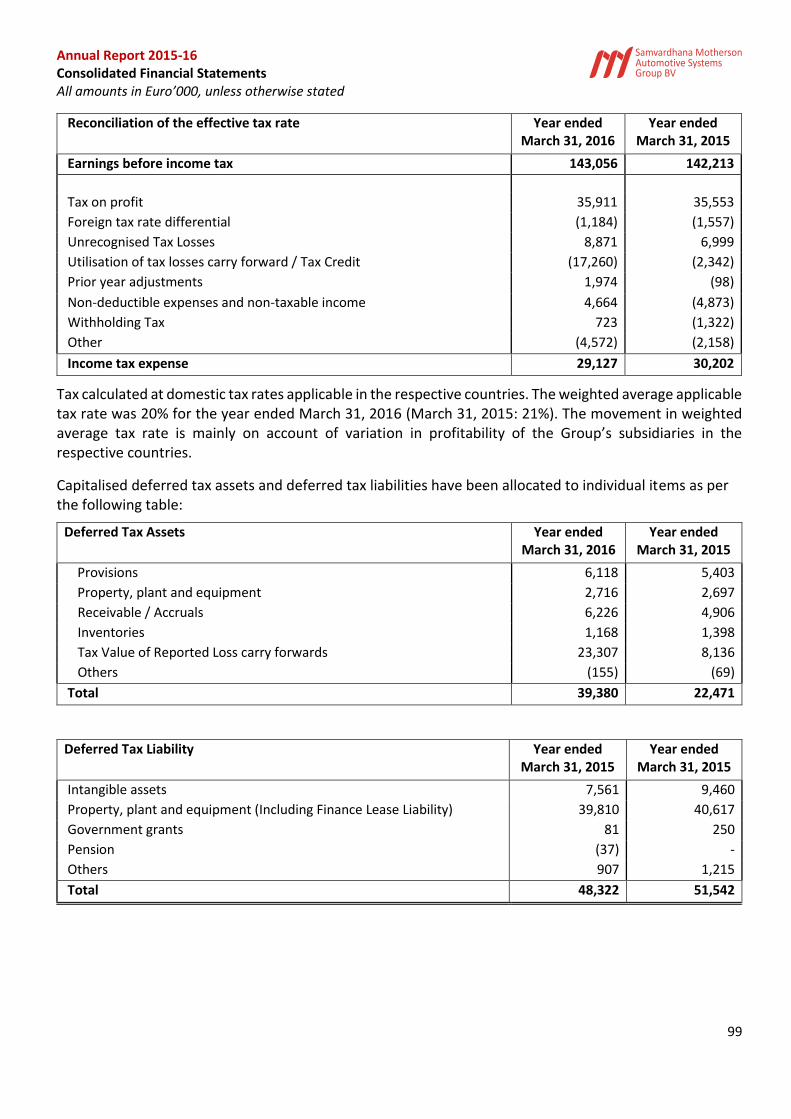
Annual Report 2015-16 Consolidated Financial Statements All amounts in Euro’000, unless otherwise stated
99
Reconciliation of the effective tax rate Year ended March 31, 2016
Year ended March 31, 2015
Earnings before income tax 143,056 142,213 Tax on profit 35,911 35,553
Foreign tax rate differential (1,184) (1,557)
Unrecognised Tax Losses 8,871 6,999
Utilisation of tax losses carry forward / Tax Credit (17,260) (2,342)
Prior year adjustments 1,974 (98)
Non-deductible expenses and non-taxable income 4,664 (4,873)
Withholding Tax 723 (1,322)
Other (4,572) (2,158)
Income tax expense 29,127 30,202
Tax calculated at domestic tax rates applicable in the respective countries. The weighted average applicable tax rate was 20% for the year ended March 31, 2016 (March 31, 2015: 21%). The movement in weighted average tax rate is mainly on account of variation in profitability of the Group’s subsidiaries in the respective countries.
Capitalised deferred tax assets and deferred tax liabilities have been allocated to individual items as per the following table:
Deferred Tax Assets Year ended March 31, 2016
Year ended March 31, 2015
Provisions 6,118 5,403
Property, plant and equipment 2,716 2,697
Receivable / Accruals 6,226 4,906
Inventories 1,168 1,398
Tax Value of Reported Loss carry forwards 23,307 8,136
Others (155) (69)
Total 39,380 22,471
Deferred Tax Liability Year ended March 31, 2015
Year ended March 31, 2015
Intangible assets 7,561 9,460
Property, plant and equipment (Including Finance Lease Liability) 39,810 40,617
Government grants 81 250
Pension (37) -
Others 907 1,215
Total 48,322 51,542
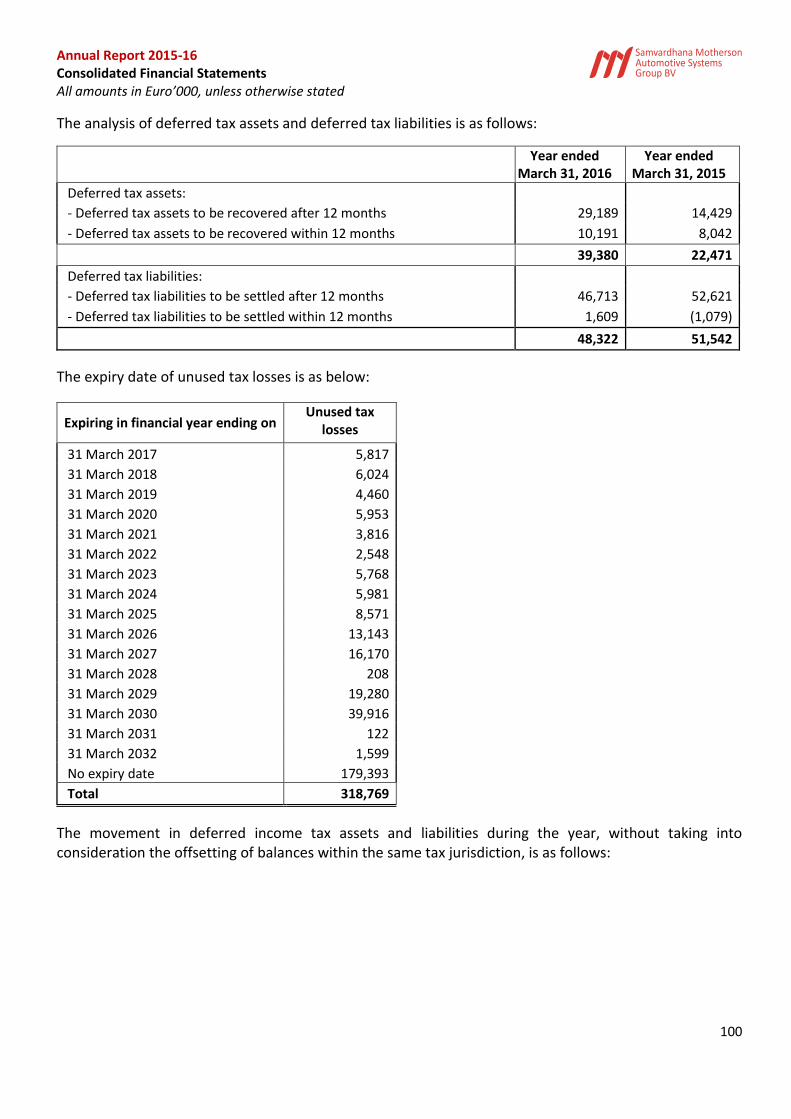
Annual Report 2015-16 Consolidated Financial Statements All amounts in Euro’000, unless otherwise stated
100
The analysis of deferred tax assets and deferred tax liabilities is as follows:
Year ended
March 31, 2016
Year ended March 31, 2015
Deferred tax assets:
- Deferred tax assets to be recovered after 12 months 29,189 14,429
- Deferred tax assets to be recovered within 12 months 10,191 8,042
39,380 22,471
Deferred tax liabilities:
- Deferred tax liabilities to be settled after 12 months 46,713 52,621
- Deferred tax liabilities to be settled within 12 months 1,609 (1,079)
48,322 51,542
The expiry date of unused tax losses is as below:
Expiring in financial year ending on Unused tax
losses
31 March 2017 5,817
31 March 2018 6,024
31 March 2019 4,460
31 March 2020 5,953
31 March 2021 3,816
31 March 2022 2,548
31 March 2023 5,768
31 March 2024 5,981
31 March 2025 8,571
31 March 2026 13,143
31 March 2027 16,170
31 March 2028 208
31 March 2029 19,280
31 March 2030 39,916
31 March 2031 122
31 March 2032 1,599
No expiry date 179,393
Total 318,769
The movement in deferred income tax assets and liabilities during the year, without taking into consideration the offsetting of balances within the same tax jurisdiction, is as follows:
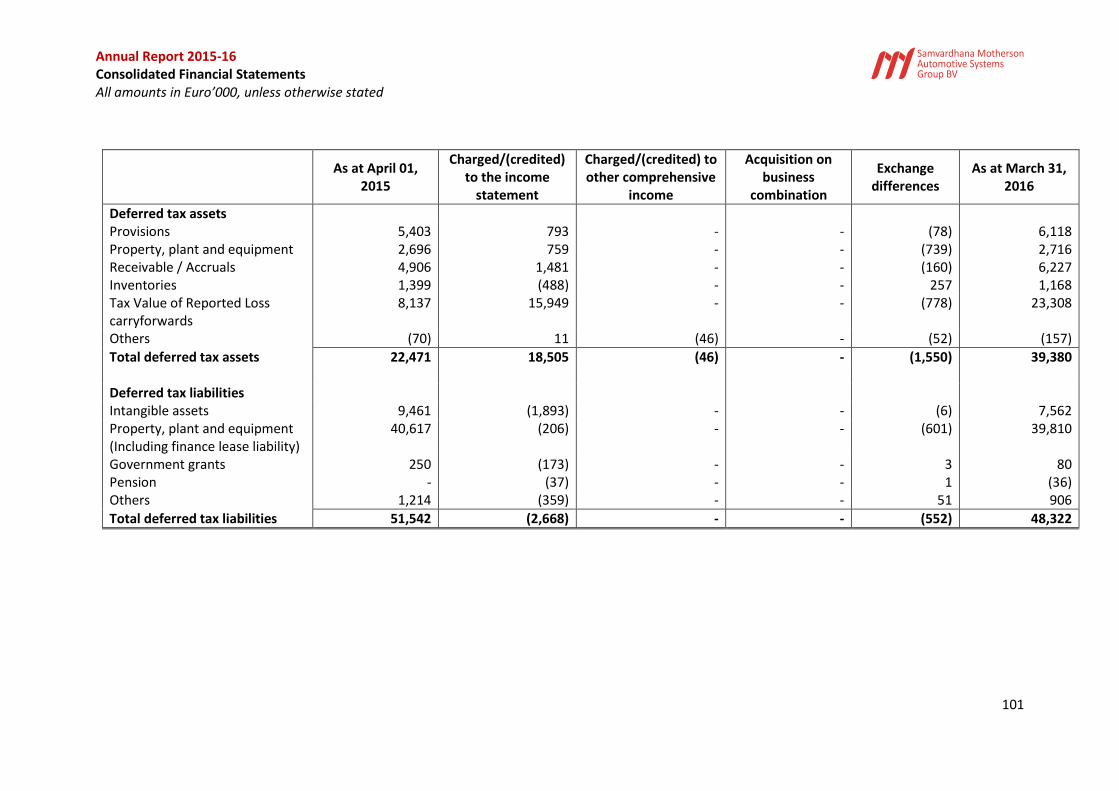
Annual Report 2015-16 Consolidated Financial Statements All amounts in Euro’000, unless otherwise stated
101
As at April 01,
2015
Charged/(credited) to the income
statement
Charged/(credited) to other comprehensive
income
Acquisition on business
combination
Exchange differences
As at March 31, 2016
Deferred tax assets Provisions 5,403 793 - - (78) 6,118 Property, plant and equipment 2,696 759 - - (739) 2,716 Receivable / Accruals 4,906 1,481 - - (160) 6,227 Inventories 1,399 (488) - - 257 1,168 Tax Value of Reported Loss carryforwards
8,137 15,949 - - (778) 23,308
Others (70) 11 (46) - (52) (157)
Total deferred tax assets 22,471 18,505 (46) - (1,550) 39,380 Deferred tax liabilities Intangible assets 9,461 (1,893) - - (6) 7,562 Property, plant and equipment (Including finance lease liability)
40,617 (206) - - (601) 39,810
Government grants 250 (173) - - 3 80 Pension - (37) - - 1 (36) Others 1,214 (359) - - 51 906
Total deferred tax liabilities 51,542 (2,668) - - (552) 48,322
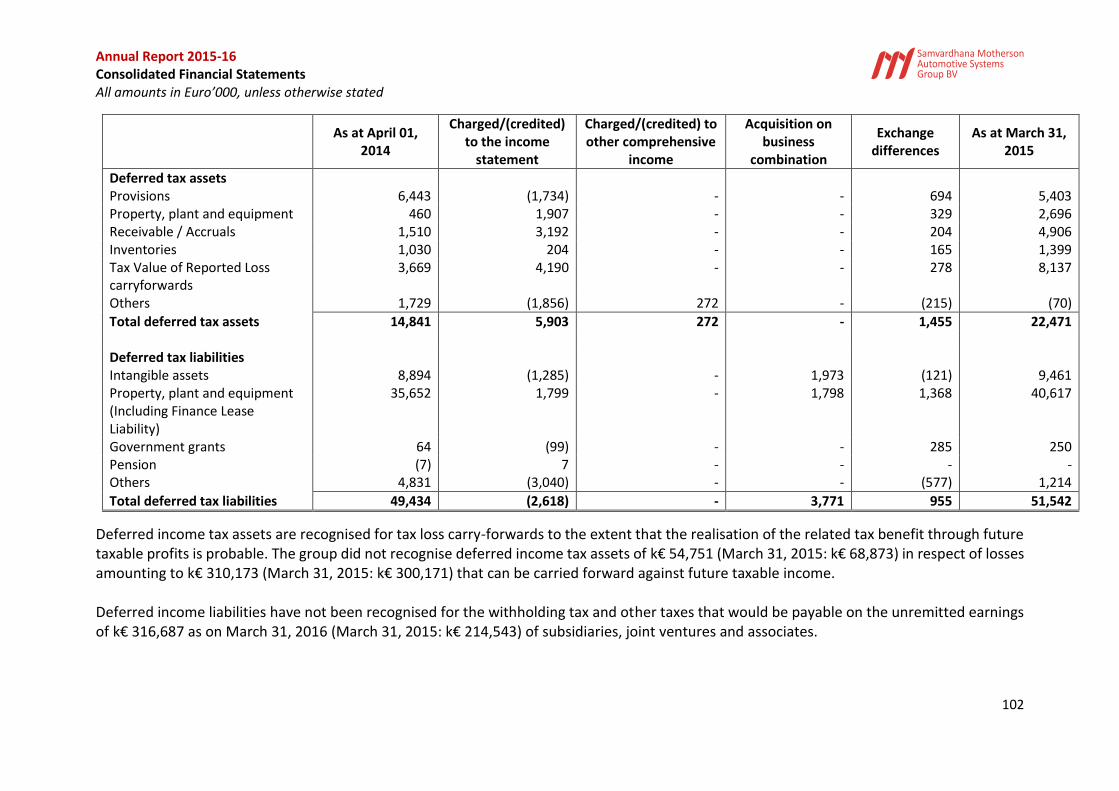
Annual Report 2015-16 Consolidated Financial Statements All amounts in Euro’000, unless otherwise stated
102
As at April 01,
2014
Charged/(credited) to the income
statement
Charged/(credited) to other comprehensive
income
Acquisition on business
combination
Exchange differences
As at March 31, 2015
Deferred tax assets Provisions 6,443 (1,734) - - 694 5,403 Property, plant and equipment 460 1,907 - - 329 2,696 Receivable / Accruals 1,510 3,192 - - 204 4,906 Inventories 1,030 204 - - 165 1,399 Tax Value of Reported Loss carryforwards
3,669 4,190 - - 278 8,137
Others 1,729 (1,856) 272 - (215) (70)
Total deferred tax assets 14,841 5,903 272 - 1,455 22,471 Deferred tax liabilities Intangible assets 8,894 (1,285) - 1,973 (121) 9,461 Property, plant and equipment (Including Finance Lease Liability)
35,652 1,799 - 1,798 1,368 40,617
Government grants 64 (99) - - 285 250 Pension (7) 7 - - - - Others 4,831 (3,040) - - (577) 1,214
Total deferred tax liabilities 49,434 (2,618) - 3,771 955 51,542
Deferred income tax assets are recognised for tax loss carry-forwards to the extent that the realisation of the related tax benefit through future taxable profits is probable. The group did not recognise deferred income tax assets of k€ 54,751 (March 31, 2015: k€ 68,873) in respect of losses amounting to k€ 310,173 (March 31, 2015: k€ 300,171) that can be carried forward against future taxable income. Deferred income liabilities have not been recognised for the withholding tax and other taxes that would be payable on the unremitted earnings of k€ 316,687 as on March 31, 2016 (March 31, 2015: k€ 214,543) of subsidiaries, joint ventures and associates.
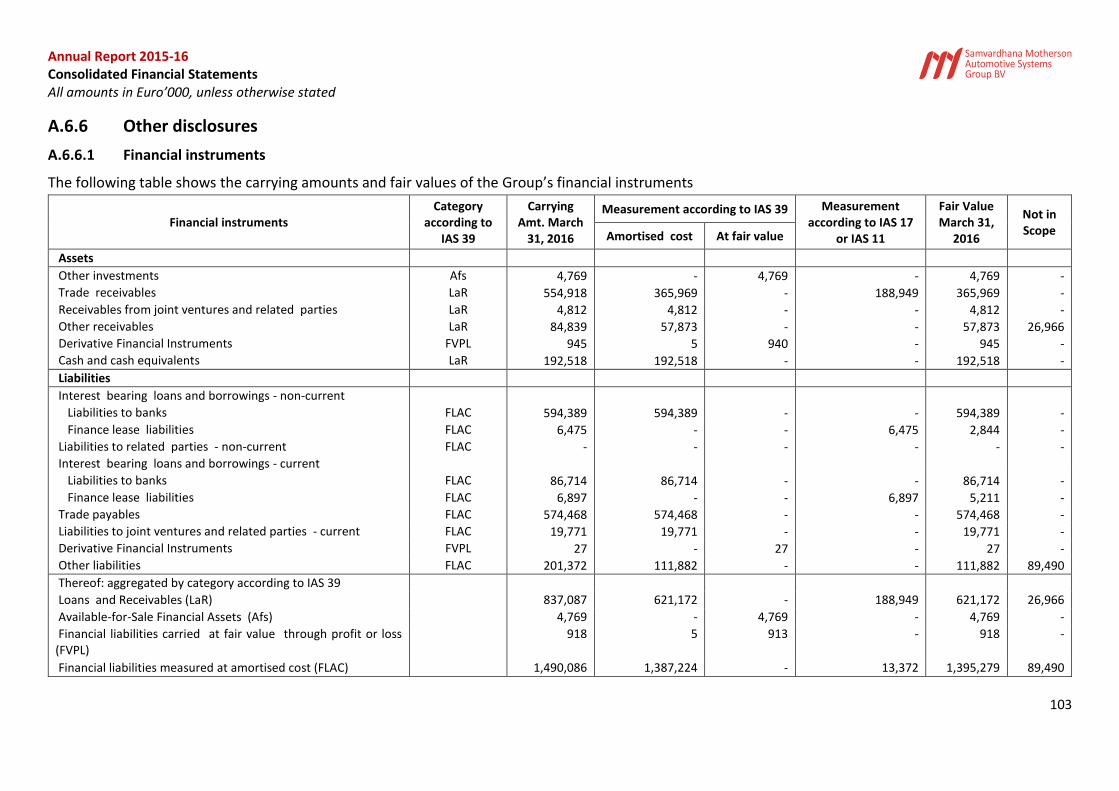
Annual Report 2015-16 Consolidated Financial Statements All amounts in Euro’000, unless otherwise stated
103
A.6.6 Other disclosures
A.6.6.1 Financial instruments
The following table shows the carrying amounts and fair values of the Group’s financial instruments
Financial instruments Category
according to IAS 39
Carrying Amt. March
31, 2016
Measurement according to IAS 39 Measurement according to IAS 17
or IAS 11
Fair Value March 31,
2016
Not in Scope Amortised cost At fair value
Assets
Other investments Afs 4,769 - 4,769 - 4,769 -
Trade receivables LaR 554,918 365,969 - 188,949 365,969 -
Receivables from joint ventures and related parties LaR 4,812 4,812 - - 4,812 -
Other receivables LaR 84,839 57,873 - - 57,873 26,966
Derivative Financial Instruments FVPL 945 5 940 - 945 -
Cash and cash equivalents LaR 192,518 192,518 - - 192,518 -
Liabilities
Interest bearing loans and borrowings - non-current
Liabilities to banks FLAC 594,389 594,389 - - 594,389 -
Finance lease liabilities FLAC 6,475 - - 6,475 2,844 -
Liabilities to related parties - non-current FLAC - - - - - -
Interest bearing loans and borrowings - current
Liabilities to banks FLAC 86,714 86,714 - - 86,714 -
Finance lease liabilities FLAC 6,897 - - 6,897 5,211 -
Trade payables FLAC 574,468 574,468 - - 574,468 -
Liabilities to joint ventures and related parties - current FLAC 19,771 19,771 - - 19,771 -
Derivative Financial Instruments FVPL 27 - 27 - 27 -
Other liabilities FLAC 201,372 111,882 - - 111,882 89,490
Thereof: aggregated by category according to IAS 39
Loans and Receivables (LaR) 837,087 621,172 - 188,949 621,172 26,966
Available-for-Sale Financial Assets (Afs) 4,769 - 4,769 - 4,769 -
Financial liabilities carried at fair value through profit or loss (FVPL)
918 5 913 - 918 -
Financial liabilities measured at amortised cost (FLAC) 1,490,086 1,387,224 - 13,372 1,395,279 89,490
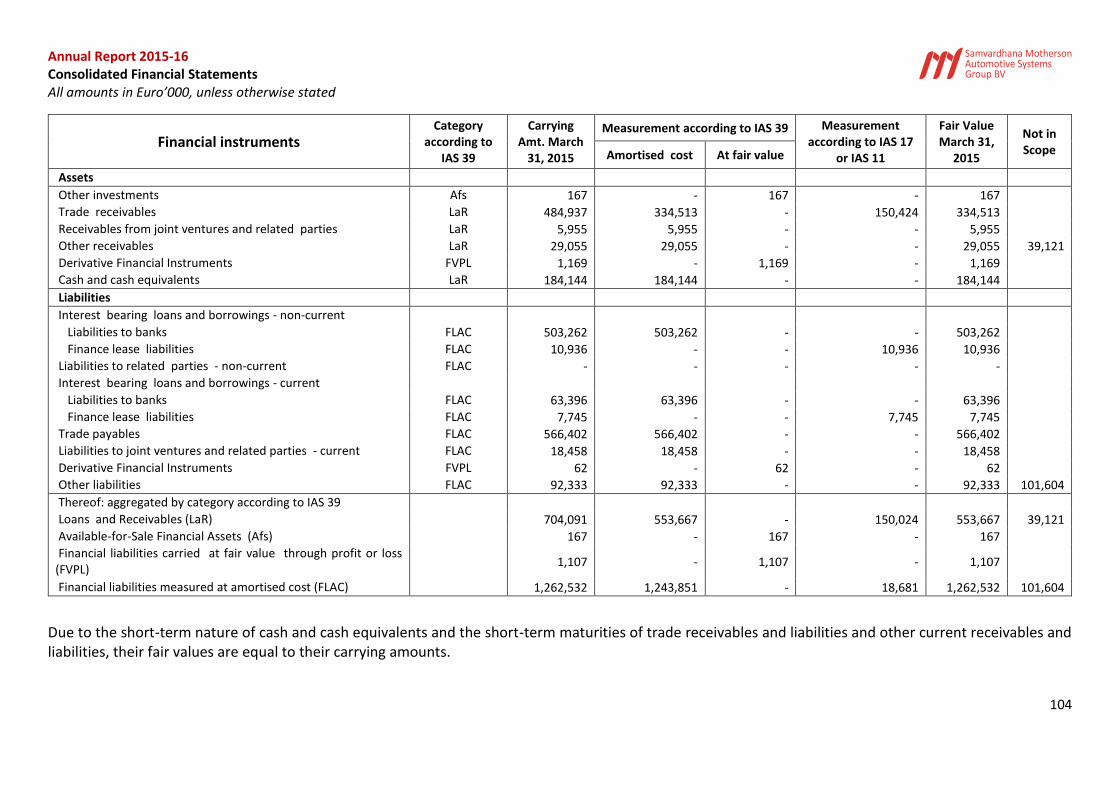
Annual Report 2015-16 Consolidated Financial Statements All amounts in Euro’000, unless otherwise stated
104
Financial instruments Category
according to IAS 39
Carrying Amt. March
31, 2015
Measurement according to IAS 39 Measurement according to IAS 17
or IAS 11
Fair Value March 31,
2015
Not in Scope Amortised cost At fair value
Assets
Other investments Afs 167 - 167 - 167
Trade receivables LaR 484,937 334,513 - 150,424 334,513
Receivables from joint ventures and related parties LaR 5,955 5,955 - - 5,955
Other receivables LaR 29,055 29,055 - - 29,055 39,121
Derivative Financial Instruments FVPL 1,169 - 1,169 - 1,169
Cash and cash equivalents LaR 184,144 184,144 - - 184,144
Liabilities
Interest bearing loans and borrowings - non-current
Liabilities to banks FLAC 503,262 503,262 - - 503,262
Finance lease liabilities FLAC 10,936 - - 10,936 10,936
Liabilities to related parties - non-current FLAC - - - - -
Interest bearing loans and borrowings - current
Liabilities to banks FLAC 63,396 63,396 - - 63,396
Finance lease liabilities FLAC 7,745 - - 7,745 7,745
Trade payables FLAC 566,402 566,402 - - 566,402
Liabilities to joint ventures and related parties - current FLAC 18,458 18,458 - - 18,458
Derivative Financial Instruments FVPL 62 - 62 - 62
Other liabilities FLAC 92,333 92,333 - - 92,333 101,604
Thereof: aggregated by category according to IAS 39
Loans and Receivables (LaR) 704,091 553,667 - 150,024 553,667 39,121
Available-for-Sale Financial Assets (Afs) 167 - 167 - 167
Financial liabilities carried at fair value through profit or loss (FVPL)
1,107 - 1,107 - 1,107
Financial liabilities measured at amortised cost (FLAC) 1,262,532 1,243,851 - 18,681 1,262,532 101,604
Due to the short-term nature of cash and cash equivalents and the short-term maturities of trade receivables and liabilities and other current receivables and liabilities, their fair values are equal to their carrying amounts.
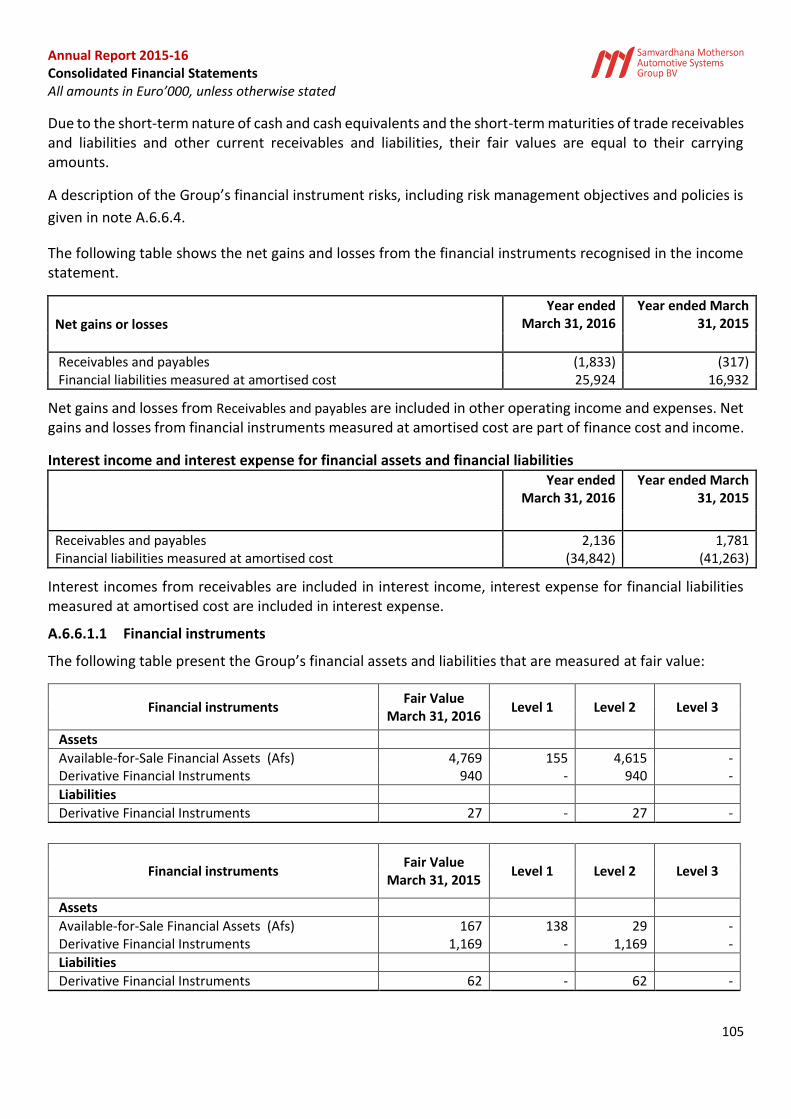
Annual Report 2015-16 Consolidated Financial Statements All amounts in Euro’000, unless otherwise stated
105
Due to the short-term nature of cash and cash equivalents and the short-term maturities of trade receivables and liabilities and other current receivables and liabilities, their fair values are equal to their carrying amounts.
A description of the Group’s financial instrument risks, including risk management objectives and policies is
given in note A.6.6.4.
The following table shows the net gains and losses from the financial instruments recognised in the income statement.
Net gains or losses
Year ended March 31, 2016
Year ended March 31, 2015
Receivables and payables (1,833) (317) Financial liabilities measured at amortised cost 25,924 16,932
Net gains and losses from Receivables and payables are included in other operating income and expenses. Net gains and losses from financial instruments measured at amortised cost are part of finance cost and income.
Interest income and interest expense for financial assets and financial liabilities
Year ended March 31, 2016
Year ended March 31, 2015
Receivables and payables 2,136 1,781 Financial liabilities measured at amortised cost (34,842) (41,263)
Interest incomes from receivables are included in interest income, interest expense for financial liabilities measured at amortised cost are included in interest expense.
A.6.6.1.1 Financial instruments
The following table present the Group’s financial assets and liabilities that are measured at fair value:
Financial instruments Fair Value
March 31, 2016 Level 1 Level 2 Level 3
Assets
Available-for-Sale Financial Assets (Afs) 4,769 155 4,615 - Derivative Financial Instruments 940 - 940 -
Liabilities
Derivative Financial Instruments 27 - 27 -
Financial instruments Fair Value
March 31, 2015 Level 1 Level 2 Level 3
Assets
Available-for-Sale Financial Assets (Afs) 167 138 29 - Derivative Financial Instruments 1,169 - 1,169 -
Liabilities
Derivative Financial Instruments 62 - 62 -
Annual Report 2015-16 Consolidated Financial Statements All amounts in Euro’000, unless otherwise stated
106
Due to the short-term nature of cash and cash equivalents and the short-term maturities of trade receivables and liabilities and other current receivables and liabilities, their fair values are equal to their carrying amounts.
Valuation of financial assets
(a) Financial instruments in Level 1
The fair value of financial instruments traded in active markets is based on quoted market prices at the balance sheet date. A market is regarded as active if quoted prices are readily and regularly available from an exchange, dealer, broker, industry group, pricing service, or regulatory agency, and those prices represent actual and regularly occurring market transactions on an arm’s length basis. The quoted market price used for financial assets held by the group is the current bid price. These instruments are included in Level 1. Instruments included in Level 1 comprise of equity instruments classified as available for sale. Quoted market prices are used to value Level 1 instruments.
(b) Financial instruments in Level 2
The fair value of financial instruments that are not traded in an active market (for example, over-the-counter derivatives) is determined by using valuation techniques. These valuation techniques maximise the use of observable market data where it is available and rely as little as possible on entity specific estimates. If all significant inputs required to fair value an instrument are observable, the instrument is included in level 2. Entity’s Level 2 instruments comprise of forward contracts relating to foreign currency and commodities. The fair value of forward foreign contracts is determined using forward rates at the balance sheet date, with the resulting value discounted back to present value.
(c) Financial instruments in Level 3
If one or more of the significant inputs is not based on observable market data, the instrument is included in level 3. Group’s Level 3 instruments represent investment in unlisted equity instruments.
Annual Report 2015-16 Consolidated Financial Statements All amounts in Euro’000, unless otherwise stated
107
A.6.6.1.2 Offsetting Financial Assets and Financial Liabilities:
The following table present the Group’s financial assets and liabilities that are subject to offsetting, enforceable master netting arrangements and similar agreements:
As on March 31, 2016 Financial Assets
Gross amounts of
recognised financial assets
Gross amounts of recognised financial
liabilities set off in the Balance sheet
Net amounts of financial assets
presented in the balance sheet
Trade receivables 604,580 49,662 554,918
As on March 31, 2015 Financial Assets
Gross amounts of
recognised financial assets
Gross amounts of recognised financial
liabilities set off in the Balance sheet
Net amounts of financial assets
presented in the balance sheet
Trade receivables 528,803 43,866 484,937
A.6.6.2 Contingent Liabilities
In the ordinary course of business activities, the Group may be contingently liable for litigation and claims with customers, suppliers, former employees and other parties. In addition, the Group may be, or could become, liable to incur environmental remediation costs to bring environmental contamination levels back within acceptable legal limits. On an on-going basis, the Group assesses the likelihood of any adverse judgments or outcomes to these matters as well as potential ranges of probable costs and losses. A determination of the provision required, if any, for these contingencies is made after analysis of each individual issue. The required provision may change in the future due to new developments in each matter or changes in approach such as a change in settlement strategy in dealing with these matters. The tax position taken by the Group with respect to certain transactions and calculations may be challenged by tax authorities for reasons including transfer pricing, the availability of deductions for interest expense and other deductible items, the treatment of acquisition, refinancing and reorganization transactions, intercompany funding arrangements, the application and effect of tax “holidays” and the calculation of deferred tax assets and liabilities. The Group does not expect any significant cash outflow in respect of these contingencies. As at the year end, the Group has following contingent liabilities:
As at March 31, 2016 As at March 31, 2015
Indirect tax matters 46 1,042 Direct tax matters 96 119 Others (refer note below) 1,772 43
Total 1,914 1,204
Annual Report 2015-16 Consolidated Financial Statements All amounts in Euro’000, unless otherwise stated
108
As at March 31, 2016 the group may be potentially liable to the fee of an amount equivalent to € 1.7 million
to the Industrial Zone as per the terms of the contract entered into by one of its subsidiary. The Industrial
Zone has so far not made any claim with respect to the fee and as per the independent legal advice obtained
by the subsidiary, any such claim may be regarding as unfair and may not be accepted in whole or part by
the competent court of law. Since it is not yet confirmed whether the subsidiary will have an obligation to
pay in the future, no liability has been recognised in respect of such amount in the books of accounts for the
year ended March 31, 2016.
Capital expenditure commitments
The group has outstanding capital expenditure commitments which represents outstanding amount of
contracts for capital expenditure against which work is yet to be executed by the contractor or supplies to
be received. Capital expenditure contracted for at the end of the year but not yet incurred is as follows:
March 31, 2016 March 31, 2015
Property, plant and equipment (net of advances) 35,352 42,589
Annual Report 2015-16 Consolidated Financial Statements All amounts in Euro’000, unless otherwise stated
109
A.6.6.3 Operating Segment Information
Management has determined the operating segments based on the reports reviewed by the Chief Operating Decision Maker (“CODM”) in taking strategic decisions. Those operating segments are SMR Group and SMP Group which are also the reportable segments.
SMR Group SMR Group develops and produces a wide range of exterior mirrors from simple prismatic versions up to complex multi-function systems. In addition to the mirror technology, the Group develops and produces driver assistance systems such as detection systems in the door mirror for monitoring blind spots or mirror turn signals. It has production facilities and engineering centres in 14 countries across the globe.
SMP Group SMP Group supplies plastic parts and system modules for vehicle interiors and exteriors. Products for vehicle interiors include in particular interior door panels and dashboards. For exteriors, bumpers and other bodywork components are manufactured. The product range encompasses individual parts and complete modules, with engineering and tooling services also being provided. It has production facilities and engineering centres in 7 countries across the globe.
SMP includes business of SMIA which was acquired last year. The company develops and manufactures profiles and moulded parts made of thermoplastics, and hybrid components made of metal and plastic providing uninterrupted services to its customers. Due to strong synergies between product portfolio and manufacturing technologies, SMIA is considered as part of SMP for the purpose of review by the Chief Operating Decision Makers (“CODM”) in taking strategic decisions.
The CODM considers revenues from external parties, EBITDA, profit before taxes and assets of each of the segments in taking strategic decisions. These amounts are measured in a manner consistent with that of the financial statements. Segment assets comprise of trade receivables, inventories and cash and cash equivalents. Geographically, the CODM considers the performance of sales in the Americas, Europe, and Asia Pacific.
Transfer prices for transactions between operating segments are on an arm’s length basis in a manner similar to transactions with third parties.
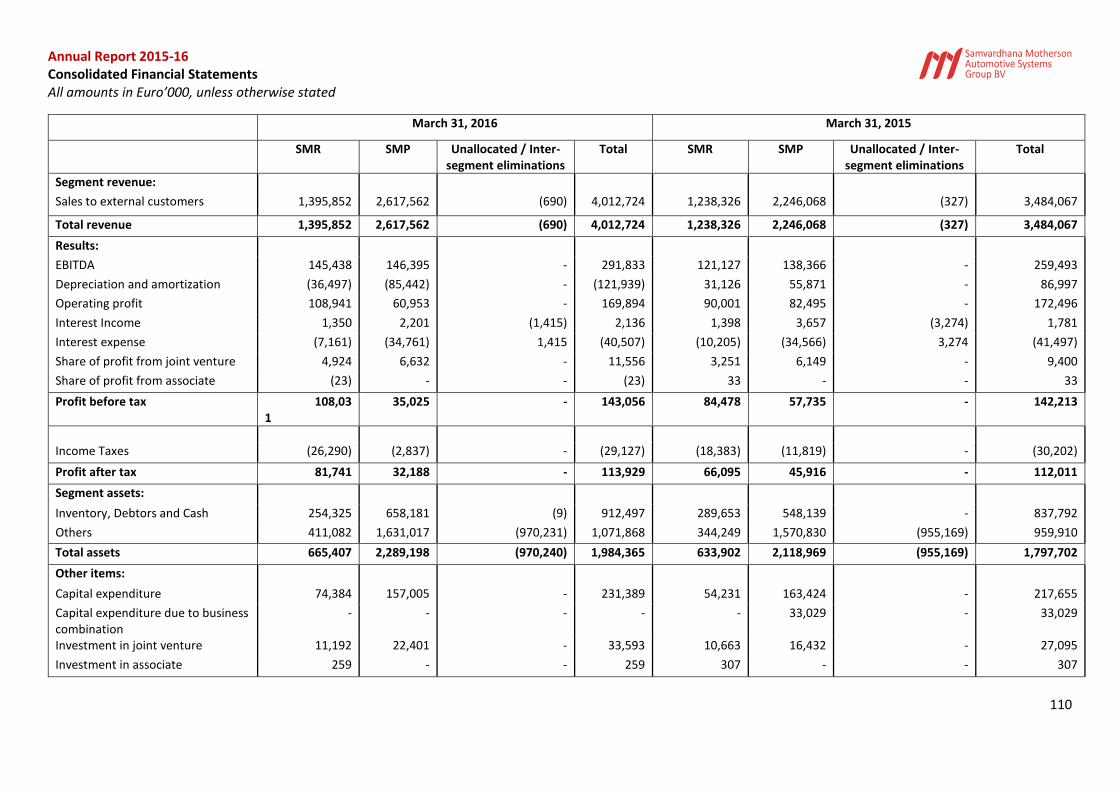
Annual Report 2015-16 Consolidated Financial Statements All amounts in Euro’000, unless otherwise stated
110
March 31, 2016 March 31, 2015
SMR SMP Unallocated / Inter-segment eliminations
Total SMR SMP Unallocated / Inter-segment eliminations
Total
Segment revenue:
Sales to external customers 1,395,852 2,617,562 (690) 4,012,724 1,238,326 2,246,068 (327) 3,484,067
Total revenue 1,395,852 2,617,562 (690) 4,012,724 1,238,326 2,246,068 (327) 3,484,067
Results:
EBITDA 145,438 146,395 - 291,833 121,127 138,366 - 259,493
Depreciation and amortization (36,497) (85,442) - (121,939) 31,126 55,871 - 86,997
Operating profit 108,941 60,953 - 169,894 90,001 82,495 - 172,496
Interest Income 1,350 2,201 (1,415) 2,136 1,398 3,657 (3,274) 1,781
Interest expense (7,161) (34,761) 1,415 (40,507) (10,205) (34,566) 3,274 (41,497)
Share of profit from joint venture 4,924 6,632 - 11,556 3,251 6,149 - 9,400
Share of profit from associate (23) - - (23) 33 - - 33
Profit before tax 108,031
35,025 - 143,056 84,478 57,735 - 142,213
Income Taxes (26,290) (2,837) - (29,127) (18,383) (11,819) - (30,202)
Profit after tax 81,741 32,188 - 113,929 66,095 45,916 - 112,011
Segment assets:
Inventory, Debtors and Cash 254,325 658,181 (9) 912,497 289,653 548,139 - 837,792
Others 411,082 1,631,017 (970,231) 1,071,868 344,249 1,570,830 (955,169) 959,910
Total assets 665,407 2,289,198 (970,240) 1,984,365 633,902 2,118,969 (955,169) 1,797,702
Other items:
Capital expenditure 74,384 157,005 - 231,389 54,231 163,424 - 217,655
Capital expenditure due to business combination
- - - - - 33,029 - 33,029
Investment in joint venture 11,192 22,401 - 33,593 10,663 16,432 - 27,095
Investment in associate 259 - - 259 307 - - 307
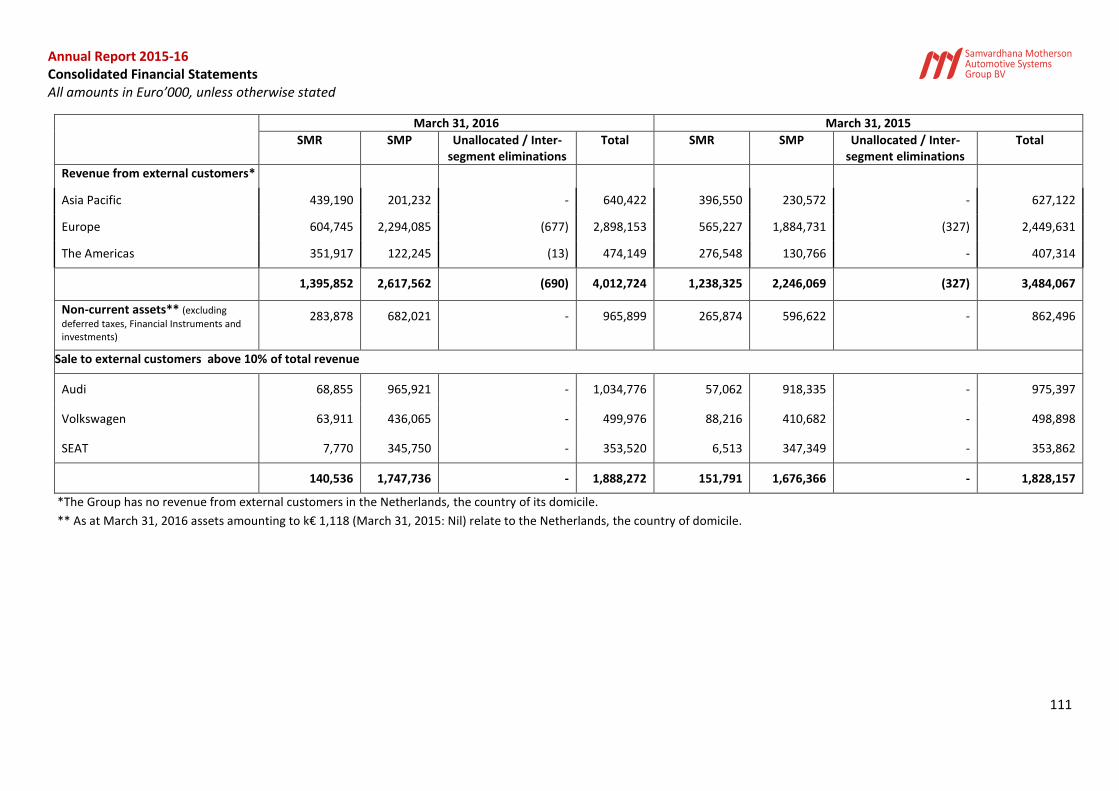
Annual Report 2015-16 Consolidated Financial Statements All amounts in Euro’000, unless otherwise stated
111
March 31, 2016 March 31, 2015
SMR SMP Unallocated / Inter-segment eliminations
Total SMR SMP Unallocated / Inter-segment eliminations
Total
Revenue from external customers*
Asia Pacific 439,190 201,232 - 640,422 396,550 230,572 - 627,122
Europe 604,745 2,294,085 (677) 2,898,153 565,227 1,884,731 (327) 2,449,631
The Americas 351,917 122,245 (13) 474,149 276,548 130,766 - 407,314
1,395,852 2,617,562 (690) 4,012,724 1,238,325 2,246,069 (327) 3,484,067
Non-current assets** (excluding
deferred taxes, Financial Instruments and investments)
283,878 682,021 - 965,899 265,874 596,622 - 862,496
Sale to external customers above 10% of total revenue
Audi 68,855 965,921 - 1,034,776 57,062 918,335 - 975,397
Volkswagen 63,911 436,065 - 499,976 88,216 410,682 - 498,898
SEAT 7,770 345,750 - 353,520 6,513 347,349 - 353,862
140,536 1,747,736 - 1,888,272 151,791 1,676,366 - 1,828,157
*The Group has no revenue from external customers in the Netherlands, the country of its domicile.
** As at March 31, 2016 assets amounting to k€ 1,118 (March 31, 2015: Nil) relate to the Netherlands, the country of domicile.
Annual Report 2015-16 Consolidated Financial Statements All amounts in Euro’000, unless otherwise stated
112
A.6.6.4 Risk management with respect to financial risks
The Group in its capacity as an internationally active supplier for the automobile industry is exposed to various risks with each of its business segments and products. The global presence and decentralised management structure with the main activities in the plants make an organised risk management system necessary. The regulations, instructions, implementation rules and, in particular, the regular communication throughout the tightly controlled management process consisting of planning, controlling and monitoring collectively form the risk management system used to define, record and minimise operating, financial and strategic risks. The successful management of opportunities and risks is part of operating a business and is the primary task of all management personnel. During the regular management meetings at all management levels, opportunities, risks and optimisation measures are subjected to systematic treatment. Rapid, open and unhindered communication between all levels of management on the risks and imminent exceptional situations ensure that potential risks can be identified at an early stage and their effects can be limited. Risk awareness and the integration of risk management into management personnel’s on-going duties at an organisational level enable the Group to identify risks immediately and to eliminate them or to minimise their effects on the net asset, financial and income position. A detailed examination has revealed that the risks detailed below are manageable for the SMRP Group. The Group is exposed in particular to credit risks with regard to trade receivables, liquidity risks and market risks from changes in interest rates and exchange rates. The Group counters customer default risks by monitoring customers continuously and carrying out regular credit checks. Liquidity is secured by means of medium-term loans, pre-emptive liquidity planning and daily liquidity reporting. Interest and currency risks are monitored on a monthly basis centrally by the finance department and the Group’s Board of Management. The Group has developed guidelines on risk controlling and the use of financial instruments. These guidelines contain a clear allocation of duties. Risks are controlled and monitored by means of operational and financial measures. The risks listed below are not so material that they would result in extraordinary concentrations of risk. Credit risk Credit risk is the risk of financial loss to the Group if a customer or counterparty to a financial instrument fails to meet its contractual obligations towards the Group and arises principally from the Group’s receivables from customers and deposits with banking institutions. The maximum amount of the credit exposure is equal to the carrying amounts of these receivables. The Group has developed guidelines for the management of credit risk from trade receivables. The Group’s primary customers are major European automobile manufacturers (OEMs) with good credit ratings. Non-OEM clients are subjected to credit assessments as a precautionary measure, and the adherence of all clients to payment due dates is monitored on an on-going basis, thereby practically eliminating the risk of default. The Group has deposited liquid funds at various banking institutions. Primary banking institutions are major international banks. In long term credit ratings these banking institutions are considered to be investment grade. Also, no impairment loss has been recorded in respect of fixed deposits that are with recognised commercial banks and are not past due.
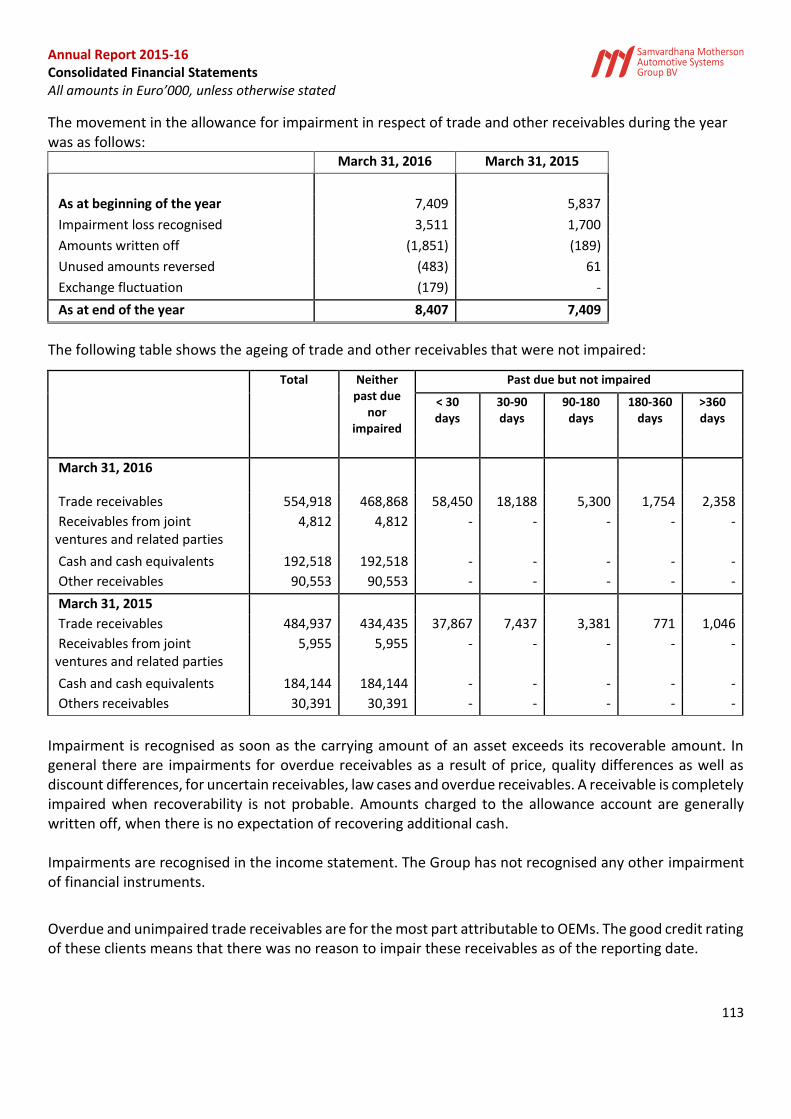
Annual Report 2015-16 Consolidated Financial Statements All amounts in Euro’000, unless otherwise stated
113
The movement in the allowance for impairment in respect of trade and other receivables during the year was as follows:
March 31, 2016 March 31, 2015
As at beginning of the year 7,409 5,837
Impairment loss recognised 3,511 1,700
Amounts written off (1,851) (189)
Unused amounts reversed (483) 61
Exchange fluctuation (179) -
As at end of the year 8,407 7,409
The following table shows the ageing of trade and other receivables that were not impaired:
Total Neither past due
nor impaired
Past due but not impaired
< 30 days
30-90 days
90-180 days
180-360 days
>360 days
March 31, 2016
Trade receivables 554,918 468,868 58,450 18,188 5,300 1,754 2,358
Receivables from joint ventures and related parties
4,812 4,812 - - - - -
Cash and cash equivalents 192,518 192,518 - - - - -
Other receivables 90,553 90,553 - - - - -
March 31, 2015
Trade receivables 484,937 434,435 37,867 7,437 3,381 771 1,046
Receivables from joint ventures and related parties
5,955 5,955 - - - - -
Cash and cash equivalents 184,144 184,144 - - - - -
Others receivables 30,391 30,391 - - - - -
Impairment is recognised as soon as the carrying amount of an asset exceeds its recoverable amount. In general there are impairments for overdue receivables as a result of price, quality differences as well as discount differences, for uncertain receivables, law cases and overdue receivables. A receivable is completely impaired when recoverability is not probable. Amounts charged to the allowance account are generally written off, when there is no expectation of recovering additional cash. Impairments are recognised in the income statement. The Group has not recognised any other impairment of financial instruments.
Overdue and unimpaired trade receivables are for the most part attributable to OEMs. The good credit rating of these clients means that there was no reason to impair these receivables as of the reporting date.
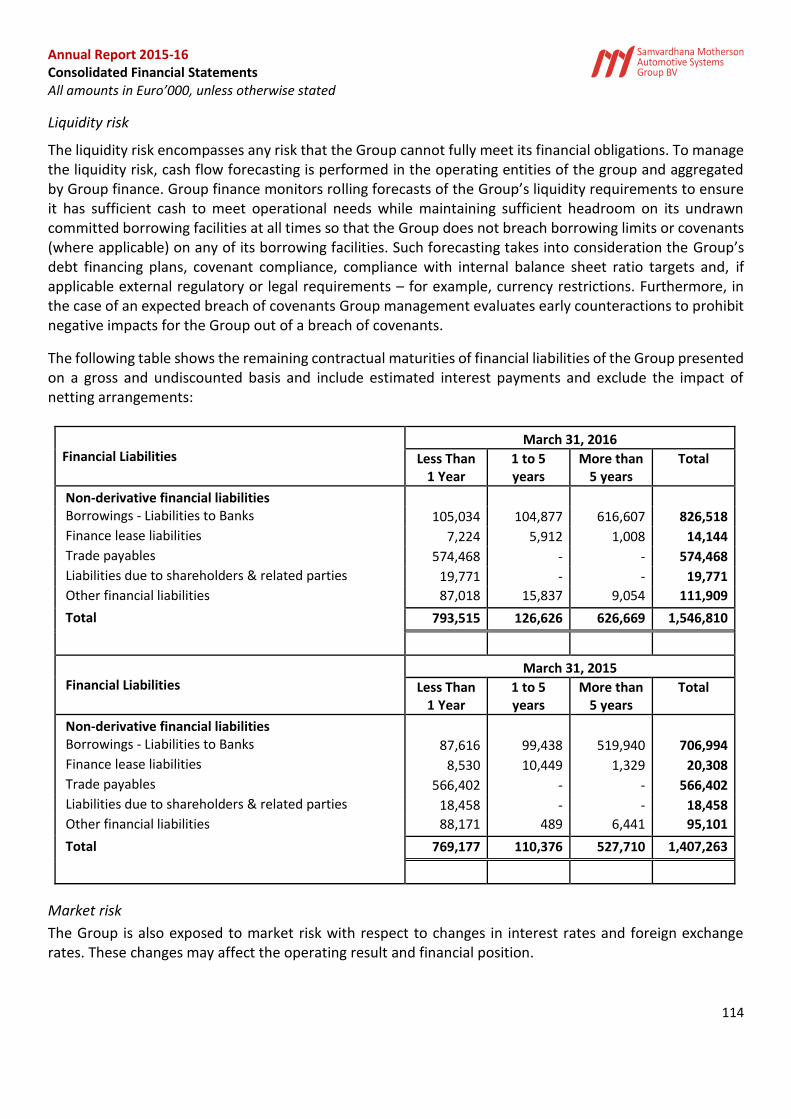
Annual Report 2015-16 Consolidated Financial Statements All amounts in Euro’000, unless otherwise stated
114
Liquidity risk
The liquidity risk encompasses any risk that the Group cannot fully meet its financial obligations. To manage the liquidity risk, cash flow forecasting is performed in the operating entities of the group and aggregated by Group finance. Group finance monitors rolling forecasts of the Group’s liquidity requirements to ensure it has sufficient cash to meet operational needs while maintaining sufficient headroom on its undrawn committed borrowing facilities at all times so that the Group does not breach borrowing limits or covenants (where applicable) on any of its borrowing facilities. Such forecasting takes into consideration the Group’s debt financing plans, covenant compliance, compliance with internal balance sheet ratio targets and, if applicable external regulatory or legal requirements – for example, currency restrictions. Furthermore, in the case of an expected breach of covenants Group management evaluates early counteractions to prohibit negative impacts for the Group out of a breach of covenants.
The following table shows the remaining contractual maturities of financial liabilities of the Group presented on a gross and undiscounted basis and include estimated interest payments and exclude the impact of netting arrangements:
Financial Liabilities March 31, 2016
Less Than 1 Year
1 to 5 years
More than 5 years
Total
Non-derivative financial liabilities
Borrowings - Liabilities to Banks 105,034 104,877 616,607 826,518
Finance lease liabilities 7,224 5,912 1,008 14,144
Trade payables 574,468 - - 574,468
Liabilities due to shareholders & related parties 19,771 - - 19,771
Other financial liabilities 87,018 15,837 9,054 111,909
Total 793,515 126,626 626,669 1,546,810
Financial Liabilities March 31, 2015
Less Than 1 Year
1 to 5 years
More than 5 years
Total
Non-derivative financial liabilities
Borrowings - Liabilities to Banks 87,616 99,438 519,940 706,994
Finance lease liabilities 8,530 10,449 1,329 20,308
Trade payables 566,402 - - 566,402
Liabilities due to shareholders & related parties 18,458 - - 18,458
Other financial liabilities 88,171 489 6,441 95,101
Total 769,177 110,376 527,710 1,407,263
Market risk
The Group is also exposed to market risk with respect to changes in interest rates and foreign exchange rates. These changes may affect the operating result and financial position.
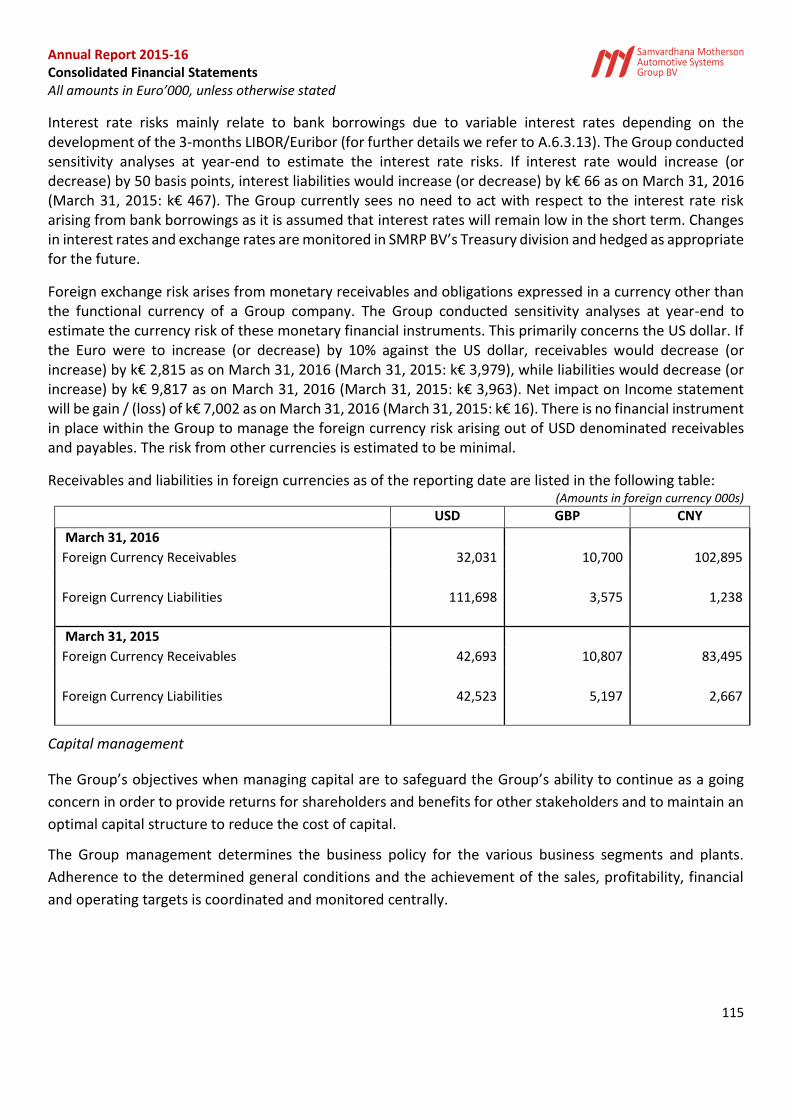
Annual Report 2015-16 Consolidated Financial Statements All amounts in Euro’000, unless otherwise stated
115
Interest rate risks mainly relate to bank borrowings due to variable interest rates depending on the development of the 3-months LIBOR/Euribor (for further details we refer to A.6.3.13). The Group conducted sensitivity analyses at year-end to estimate the interest rate risks. If interest rate would increase (or decrease) by 50 basis points, interest liabilities would increase (or decrease) by k€ 66 as on March 31, 2016 (March 31, 2015: k€ 467). The Group currently sees no need to act with respect to the interest rate risk arising from bank borrowings as it is assumed that interest rates will remain low in the short term. Changes in interest rates and exchange rates are monitored in SMRP BV’s Treasury division and hedged as appropriate for the future.
Foreign exchange risk arises from monetary receivables and obligations expressed in a currency other than the functional currency of a Group company. The Group conducted sensitivity analyses at year-end to estimate the currency risk of these monetary financial instruments. This primarily concerns the US dollar. If the Euro were to increase (or decrease) by 10% against the US dollar, receivables would decrease (or increase) by k€ 2,815 as on March 31, 2016 (March 31, 2015: k€ 3,979), while liabilities would decrease (or increase) by k€ 9,817 as on March 31, 2016 (March 31, 2015: k€ 3,963). Net impact on Income statement will be gain / (loss) of k€ 7,002 as on March 31, 2016 (March 31, 2015: k€ 16). There is no financial instrument in place within the Group to manage the foreign currency risk arising out of USD denominated receivables and payables. The risk from other currencies is estimated to be minimal.
Receivables and liabilities in foreign currencies as of the reporting date are listed in the following table: (Amounts in foreign currency 000s)
USD GBP CNY
March 31, 2016
Foreign Currency Receivables 32,031 10,700 102,895
Foreign Currency Liabilities 111,698 3,575 1,238
March 31, 2015
Foreign Currency Receivables 42,693 10,807 83,495
Foreign Currency Liabilities 42,523 5,197 2,667
Capital management
The Group’s objectives when managing capital are to safeguard the Group’s ability to continue as a going
concern in order to provide returns for shareholders and benefits for other stakeholders and to maintain an
optimal capital structure to reduce the cost of capital.
The Group management determines the business policy for the various business segments and plants.
Adherence to the determined general conditions and the achievement of the sales, profitability, financial
and operating targets is coordinated and monitored centrally.
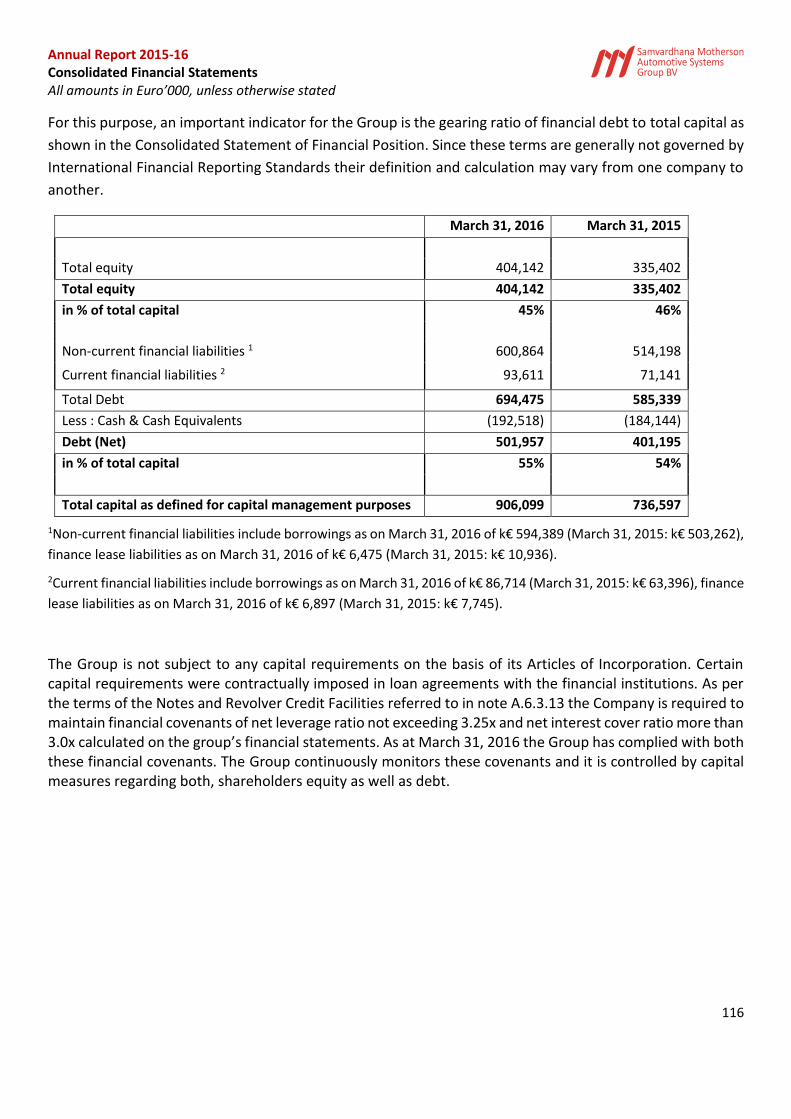
Annual Report 2015-16 Consolidated Financial Statements All amounts in Euro’000, unless otherwise stated
116
For this purpose, an important indicator for the Group is the gearing ratio of financial debt to total capital as
shown in the Consolidated Statement of Financial Position. Since these terms are generally not governed by
International Financial Reporting Standards their definition and calculation may vary from one company to
another.
March 31, 2016 March 31, 2015
Total equity 404,142 335,402
Total equity 404,142 335,402
in % of total capital 45% 46%
Non-current financial liabilities 1 600,864 514,198
Current financial liabilities 2 93,611 71,141
Total Debt 694,475 585,339
Less : Cash & Cash Equivalents (192,518) (184,144)
Debt (Net) 501,957 401,195
in % of total capital 55% 54%
Total capital as defined for capital management purposes 906,099 736,597
1Non-current financial liabilities include borrowings as on March 31, 2016 of k€ 594,389 (March 31, 2015: k€ 503,262),
finance lease liabilities as on March 31, 2016 of k€ 6,475 (March 31, 2015: k€ 10,936).
2Current financial liabilities include borrowings as on March 31, 2016 of k€ 86,714 (March 31, 2015: k€ 63,396), finance
lease liabilities as on March 31, 2016 of k€ 6,897 (March 31, 2015: k€ 7,745).
The Group is not subject to any capital requirements on the basis of its Articles of Incorporation. Certain capital requirements were contractually imposed in loan agreements with the financial institutions. As per the terms of the Notes and Revolver Credit Facilities referred to in note A.6.3.13 the Company is required to maintain financial covenants of net leverage ratio not exceeding 3.25x and net interest cover ratio more than 3.0x calculated on the group’s financial statements. As at March 31, 2016 the Group has complied with both these financial covenants. The Group continuously monitors these covenants and it is controlled by capital measures regarding both, shareholders equity as well as debt.
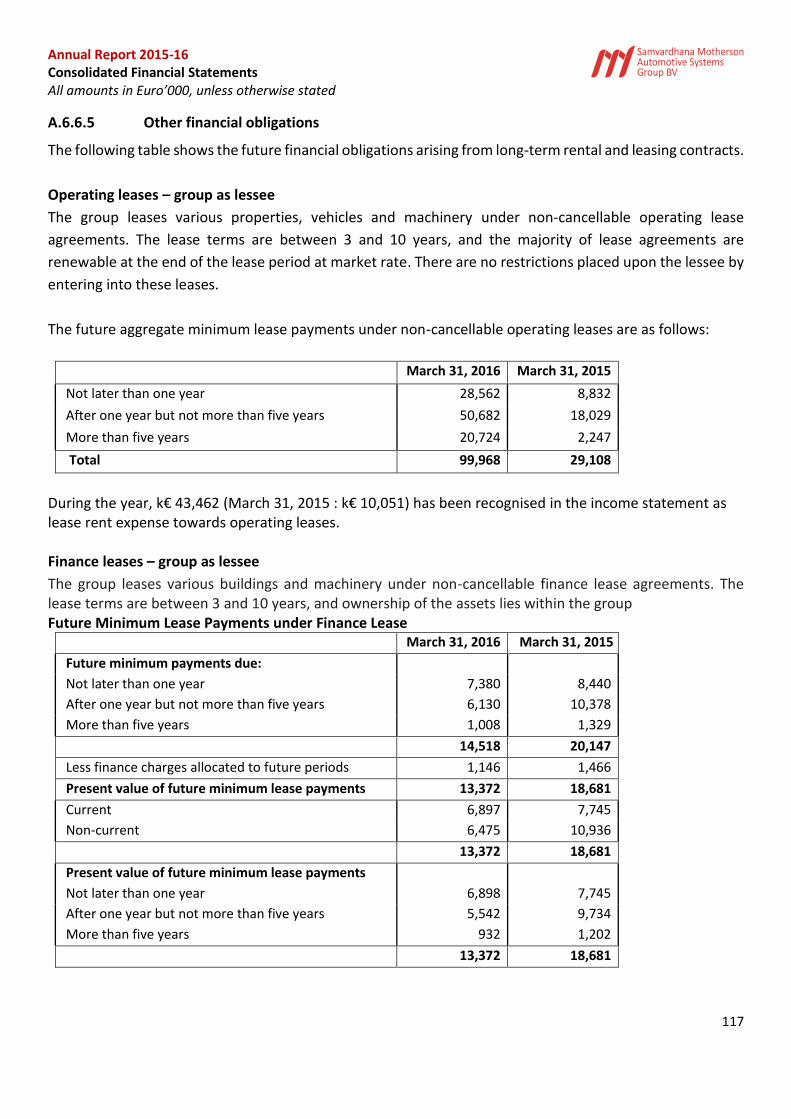
Annual Report 2015-16 Consolidated Financial Statements All amounts in Euro’000, unless otherwise stated
117
A.6.6.5 Other financial obligations
The following table shows the future financial obligations arising from long-term rental and leasing contracts.
Operating leases – group as lessee
The group leases various properties, vehicles and machinery under non-cancellable operating lease
agreements. The lease terms are between 3 and 10 years, and the majority of lease agreements are
renewable at the end of the lease period at market rate. There are no restrictions placed upon the lessee by
entering into these leases.
The future aggregate minimum lease payments under non-cancellable operating leases are as follows:
March 31, 2016 March 31, 2015
Not later than one year 28,562 8,832
After one year but not more than five years 50,682 18,029
More than five years 20,724 2,247
Total 99,968 29,108
During the year, k€ 43,462 (March 31, 2015 : k€ 10,051) has been recognised in the income statement as lease rent expense towards operating leases. Finance leases – group as lessee
The group leases various buildings and machinery under non-cancellable finance lease agreements. The lease terms are between 3 and 10 years, and ownership of the assets lies within the group Future Minimum Lease Payments under Finance Lease
March 31, 2016 March 31, 2015
Future minimum payments due:
Not later than one year 7,380 8,440
After one year but not more than five years 6,130 10,378
More than five years 1,008 1,329
14,518 20,147
Less finance charges allocated to future periods 1,146 1,466
Present value of future minimum lease payments 13,372 18,681
Current 6,897 7,745
Non-current 6,475 10,936
13,372 18,681
Present value of future minimum lease payments
Not later than one year 6,898 7,745
After one year but not more than five years 5,542 9,734
More than five years 932 1,202
13,372 18,681
Annual Report 2015-16 Consolidated Financial Statements All amounts in Euro’000, unless otherwise stated
118
A.6.6.6 Related parties
During the year the Group entered into transactions, in the ordinary course of business, with related parties. Transactions entered into, include the sale and purchase of goods and services. In addition, financing transactions have been undertaken. Entities with significant influence over the Group
SMRP BV, SMP Group and SMR Group were jointly controlled by Motherson Sumi Systems Limited and Samvardhana Motherson International Limited prior to June 13, 2014. On June 13, 2014 SMRP BV acquired the majority of the outstanding shares of SMR Group through the issuance of new shares to the shareholders of SMR Group. (see note A.6.2.1)
Samvardhana Motherson Global Holdings Limited, Cyprus, the direct parent company of Samvardhana Motherson Automotive Systems Group B.V (SMRP) (earlier known as Samvardhana Motherson B.V.) holds 69% of the voting shares of the Group.
Samvardhana Motherson Polymers Limited, India holds 31% of the voting shares of SMRP BV.
Samvardhana Motherson Global Holdings Limited and Samvardhana Motherson Polymers Limited both are indirectly held by MSSL India, which prepares financial statements available for public use and by SMIL India. MSSL and SMIL are referred to as the substantial shareholders of the Group.
SMIL is owned by Mr. V.C. Sehgal and family. SMIL holds an equity interest (36.93%) in MSSL.
As a result, MSSL and SMIL and its direct and indirect held subsidiaries, except for the companies forming the subgroup of Samvardhana Motherson Automotive Systems Group B.V are considered as related parties.
Key Management Personnel
Key management includes directors (executive and non-executive), members of the Supervisory Board. No compensation or any other benefits are paid or payable to any of the key management personnel.
Terms and conditions Transactions relating to sales and purchase of goods with related parties during the year are based on the price lists in force and terms that would be available to third parties. All other transactions were made on normal commercial terms and conditions and at market rates. There is no allowance account for impaired receivables in relation to any outstanding balances, and no expense has been recognised in respect of impaired receivables due from related parties. Outstanding balances are unsecured and are repayable in cash.
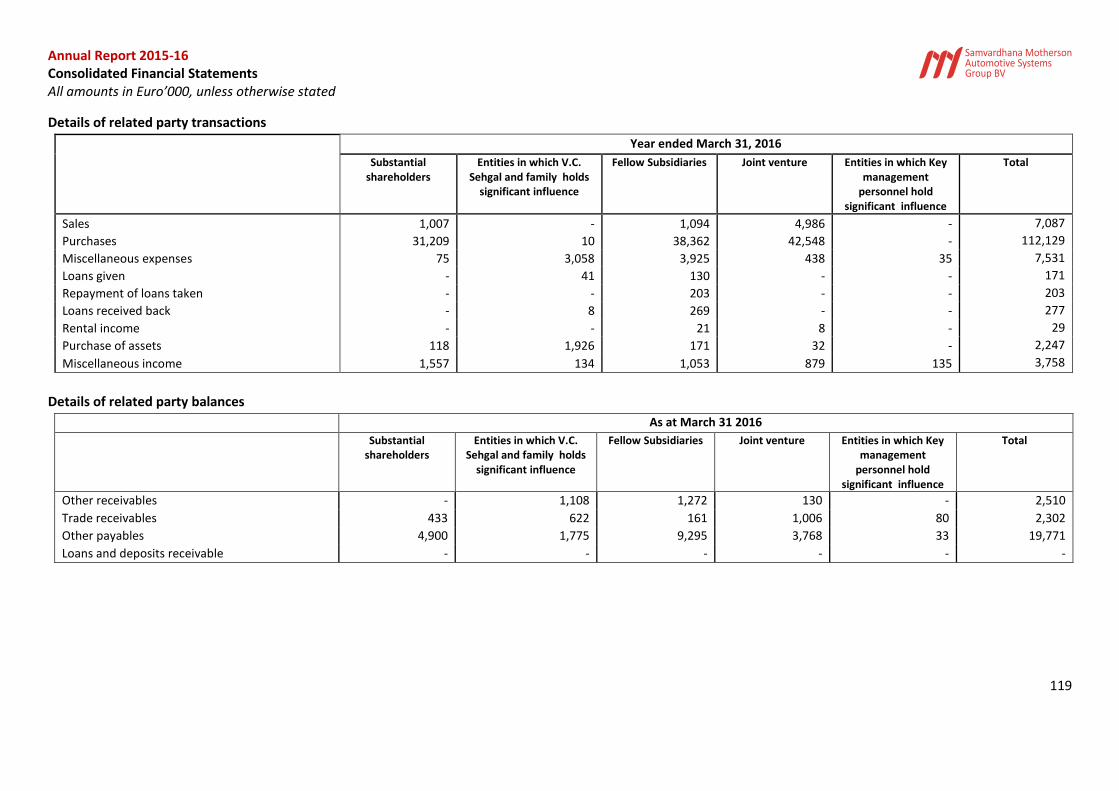
Annual Report 2015-16 Consolidated Financial Statements All amounts in Euro’000, unless otherwise stated
119
Details of related party transactions
Year ended March 31, 2016
Substantial shareholders
Entities in which V.C. Sehgal and family holds
significant influence
Fellow Subsidiaries Joint venture Entities in which Key management
personnel hold significant influence
Total
Sales 1,007 - 1,094 4,986 - 7,087
Purchases 31,209 10 38,362 42,548 - 112,129
Miscellaneous expenses 75 3,058 3,925 438 35 7,531
Loans given - 41 130 - - 171
Repayment of loans taken - - 203 - - 203
Loans received back - 8 269 - - 277
Rental income - - 21 8 - 29
Purchase of assets 118 1,926 171 32 - 2,247
Miscellaneous income 1,557 134 1,053 879 135 3,758
Details of related party balances
As at March 31 2016
Substantial shareholders
Entities in which V.C. Sehgal and family holds
significant influence
Fellow Subsidiaries Joint venture Entities in which Key management
personnel hold significant influence
Total
Other receivables - 1,108 1,272 130 - 2,510
Trade receivables 433 622 161 1,006 80 2,302
Other payables 4,900 1,775 9,295 3,768 33 19,771
Loans and deposits receivable - - - - - -
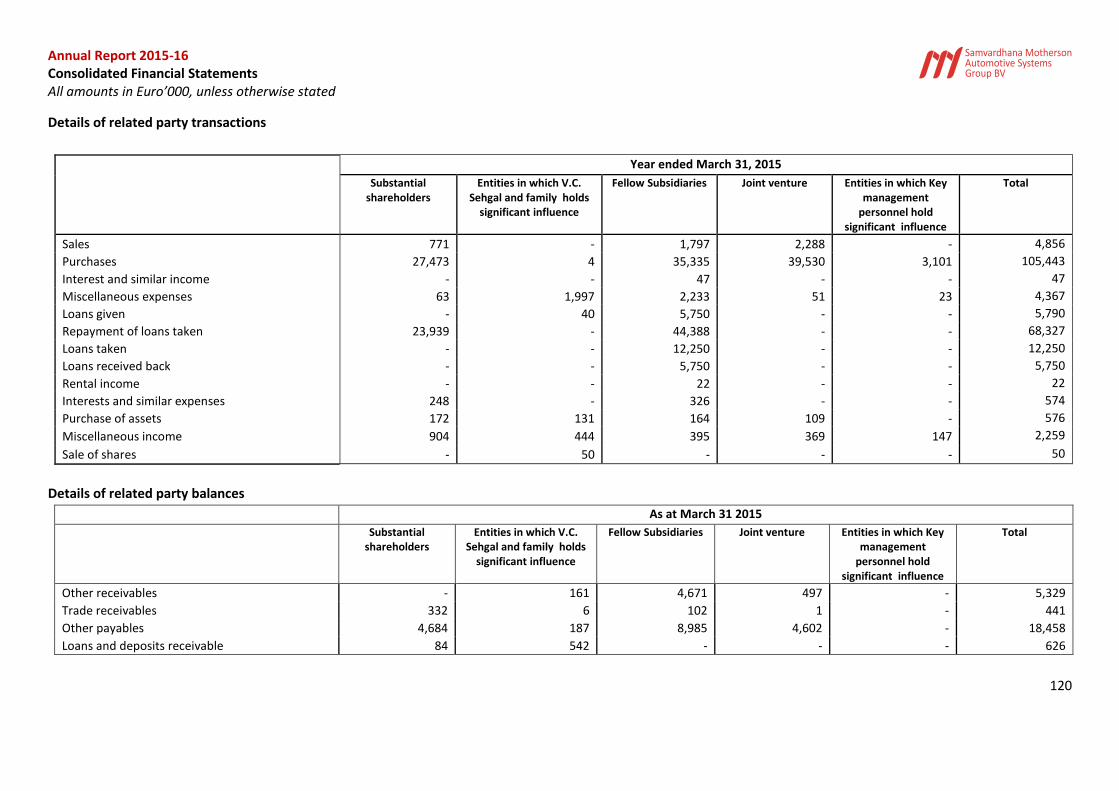
Annual Report 2015-16 Consolidated Financial Statements All amounts in Euro’000, unless otherwise stated
120
Details of related party transactions
Year ended March 31, 2015
Substantial shareholders
Entities in which V.C. Sehgal and family holds
significant influence
Fellow Subsidiaries Joint venture Entities in which Key management
personnel hold significant influence
Total
Sales 771 - 1,797 2,288 - 4,856
Purchases 27,473 4 35,335 39,530 3,101 105,443
Interest and similar income - - 47 - - 47
Miscellaneous expenses 63 1,997 2,233 51 23 4,367
Loans given - 40 5,750 - - 5,790
Repayment of loans taken 23,939 - 44,388 - - 68,327
Loans taken - - 12,250 - - 12,250
Loans received back - - 5,750 - - 5,750
Rental income - - 22 - - 22
Interests and similar expenses 248 - 326 - - 574
Purchase of assets 172 131 164 109 - 576
Miscellaneous income 904 444 395 369 147 2,259
Sale of shares - 50 - - - 50
Details of related party balances
As at March 31 2015
Substantial shareholders
Entities in which V.C. Sehgal and family holds
significant influence
Fellow Subsidiaries Joint venture Entities in which Key management
personnel hold significant influence
Total
Other receivables - 161 4,671 497 - 5,329
Trade receivables 332 6 102 1 - 441
Other payables 4,684 187 8,985 4,602 - 18,458
Loans and deposits receivable 84 542 - - - 626
Annual Report 2015-16 Consolidated Financial Statements All amounts in Euro’000, unless otherwise stated
121
A.6.6.7 Business combination
Acquisition of Scherer & Trier group (in administration):
During the year ended March 31, 2015, the Company through its subsidiaries purchased the entire German and Mexican business of Scherer & Trier group (S&T), Germany from its administrator through its step down subsidiaries on 30th January 2015.
The purchase agreement was executed between SMRP BV, through its step down subsidiaries in its capacity as Purchaser and insolvency administrator in his capacity as Seller as follows:
1. Fixed Assets excluding land & building and inventory & other receivables were acquired by Samvardhana Motherson Innovative Autosystems B.V. & Co. KG.
2. Land & building were acquired by SM Real Estate GmbH. 3. Shares of Mexican entities were acquired by Samvardhana Motherson Reflectec Group Holdings
Limited and Samvardhana Motherson Peguform GmbH in ratio of 99:1.
The purchase agreement came into effect from closing date of January 30th, 2015.
The acquisition cost amounting to Euro 35,763,684 comprises of following:
1. Purchase price of the assets including land and building & inventories for German entities. 2. 100% shares held in Mexican entities
The acquisition cost allocated to purchase price of assets including land and buildings & inventories for German Entities amounts to Euro 35,763,384 and acquisition cost allocated to purchase of shares of Mexican entities amounts to Euro 300. As a result of the acquisition, bargain gain of k€ 13,329 was recognised in other income for the year ended March 31, 2015.
A.6.6.8 Accounting estimates and evaluations
The Group makes estimates and assumptions concerning the future and makes significant judgements in the process of application of accounting policies. The resulting accounting estimates will, by definition, seldom equal the related actual results. The estimates and assumptions that have a significant risk of causing a material adjustment to the carrying amounts of assets and liabilities within the next financial year are addressed below:
Determination of the useful life of intangible assets and property, plant and equipment (see A.6.3.1 and A.6.3.2).
Valuation of customer and engineering agreements as well as technology and property, plant and equipment, particularly with regard to their underlying cash flow forecasts and discount rates (see A.6.3.1 and A.6.3.2).
Determination of the level of completion, the contract revenues and contract costs of construction contracts. The Group uses the percentage-of-completion method in accounting for its fixed price contracts to deliver design services. Use of the percentage-of-completion method requires the Group to estimate the services performed to date as a proportion of the total services to be performed. (seeA.6.3.8.1).
Annual Report 2015-16 Consolidated Financial Statements All amounts in Euro’000, unless otherwise stated
122
Valuation of recoverable income tax assets especially with respect to deferred tax assets on tax loss carry forwards. The Group is subject to income taxes in numerous jurisdictions. Significant judgement is required in determining the worldwide provision for income taxes. The Group recognises liabilities for anticipated tax audit issues based on estimates of whether additional taxes will be due. Where the final tax outcome of these matters is different from the amounts that were initially recorded, such differences will impact the current and deferred income tax assets and liabilities in the period in which such determination is made. (see A.6.3.15 and A.6.5).
Recognition and presentation of provisions and liabilities for pensions and other post-employment benefits. The present value of the pension obligations depends on a number of factors that are determined on an actuarial basis using a number of assumptions. The assumptions used in determining the net cost (income) for pensions include the discount rate. Any changes in these assumptions will impact the carrying amount of pension obligations. The Group determines the appropriate discount rate at the end of each year. This is the interest rate that should be used to determine the present value of estimated future cash outflows expected to be required to settle the pension obligations. In determining the appropriate discount rate, the Group considers the interest rates of high-quality corporate bonds that are denominated in the currency in which the benefits will be paid and that have terms to maturity approximating the terms of the related pension obligation. Other key assumptions for pension obligations are based in part on current market conditions. (see A.6.2.14.1 and A.6.3.11).
Recognition and presentation of provisions and liabilities (esp. the accrual for price differences and the liabilities out of contract work) and to the probability of expenses arising from warranty claims and claims from legal disputes. Price accruals primarily represent the amount of price down to be given to customers, the final outcome of these price accruals is dependent on negotiation with customers (see A.6.2.14).
These estimates and assumptions are based on the latest information available at the time that the consolidated financial statements were prepared. The assumptions and estimates are checked and updated regularly to accommodate any actual developments that may arise.
Annual Report 2015-16 Consolidated Financial Statements All amounts in Euro’000, unless otherwise stated
123
A.6.8 Subsequent Events
During the month of May 2016, one of the Company’s subsidiary SMR Poong Jeong Automotive Mirrors
Korea Limited bought back 81,660 shares from its minority shareholder against a consideration of KRW 12
billion (equivalent to Euro 9.2 million). Pursuant to this transaction, this subsidiary has become a 100%
subsidiary of Samvardhana Motherson Reflectec Group Holdings Limited, Jersey and of the Company.
Signing of the financial statements
Mr. Jacob Meint Buit Mr. Randolph Marie Thaddeus De Cuba (Managing Director) (Managing Director) Amsterdam, May 27, 2016 Amsterdam, May 27, 2016 Mr. Laksh Vaaman Sehgal Mr. Andreas Heuser (Managing Director) (Managing Director) Amsterdam, May 27, 2016 Amsterdam, May 27, 2016
Annual Report 2015-16 Consolidated Financial Statements All amounts in Euro’000, unless otherwise stated
124
Signing of the financial statements
Mr. Cezary Zawadzinski Mr. Bimal Dhar
(Member of Supervisory Board) (Member of Supervisory Board)
Amsterdam, May 27, 2016 Amsterdam, May 27, 2016
Mr. Kunal Malani Mr. G.N. Gauba
(Member of Supervisory Board) (Member of Supervisory Board)
Amsterdam, May 27, 2016 Amsterdam, May 27, 2016
Mr. Vivek Chaand Sehgal
(Member of Supervisory Board)
Amsterdam, May 27, 2016
125
Annual Report 2015-16 Standalone Financial Statements All amounts in Euro, unless otherwise stated
Samvardhana Motherson Automotive Systems Group BV Standalone Financial Statements For the year ended March 31, 2016
Annual Report 2015-16 Standalone Financial Statements All amounts in Euro, unless otherwise stated
126
B. STANDALONE FINANCIAL STATEMENTS
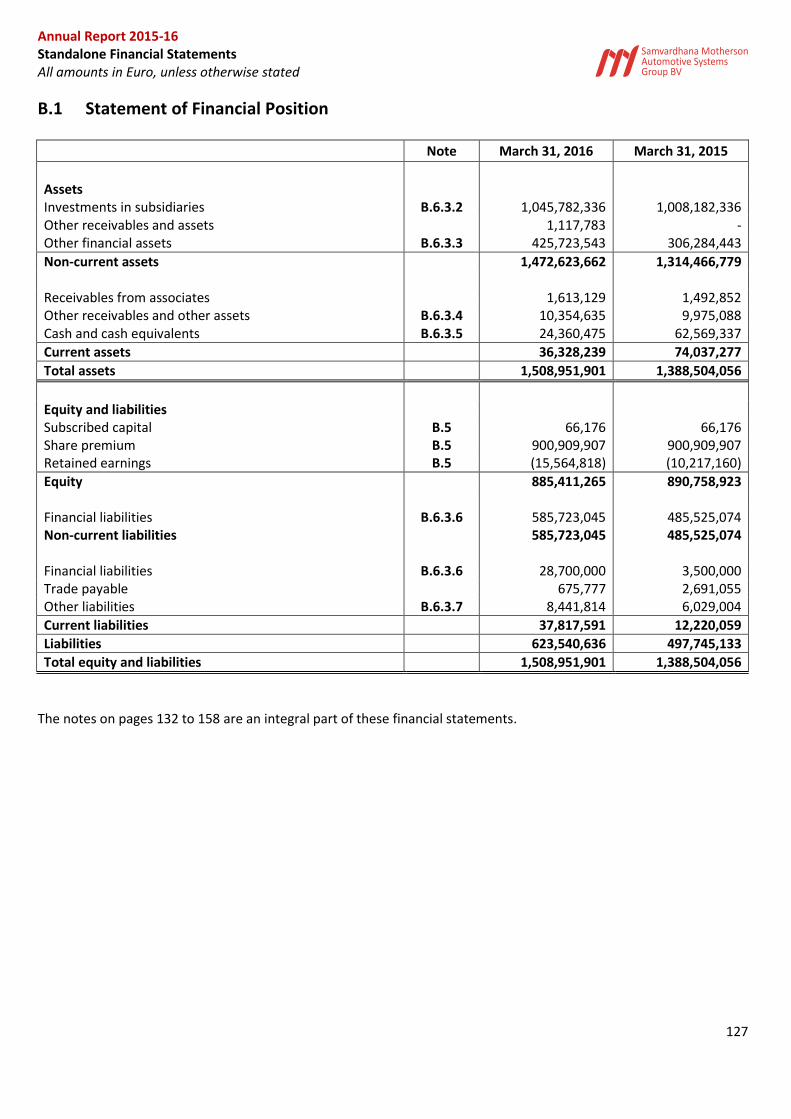
Annual Report 2015-16 Standalone Financial Statements All amounts in Euro, unless otherwise stated
127
B.1 Statement of Financial Position
Note March 31, 2016 March 31, 2015
Assets
Investments in subsidiaries B.6.3.2 1,045,782,336 1,008,182,336 Other receivables and assets
1,117,783 -
Other financial assets B.6.3.3 425,723,543 306,284,443
Non-current assets
1,472,623,662 1,314,466,779
Receivables from associates
1,613,129 1,492,852 Other receivables and other assets B.6.3.4 10,354,635 9,975,088 Cash and cash equivalents B.6.3.5 24,360,475 62,569,337
Current assets
36,328,239 74,037,277
Total assets
1,508,951,901 1,388,504,056
Equity and liabilities
Subscribed capital B.5 66,176 66,176 Share premium B.5 900,909,907 900,909,907 Retained earnings B.5 (15,564,818) (10,217,160)
Equity
885,411,265 890,758,923
Financial liabilities B.6.3.6 585,723,045 485,525,074 Non-current liabilities
585,723,045 485,525,074
Financial liabilities B.6.3.6 28,700,000 3,500,000 Trade payable
675,777 2,691,055
Other liabilities B.6.3.7 8,441,814 6,029,004
Current liabilities
37,817,591 12,220,059
Liabilities
623,540,636 497,745,133
Total equity and liabilities
1,508,951,901 1,388,504,056
The notes on pages 132 to 158 are an integral part of these financial statements.
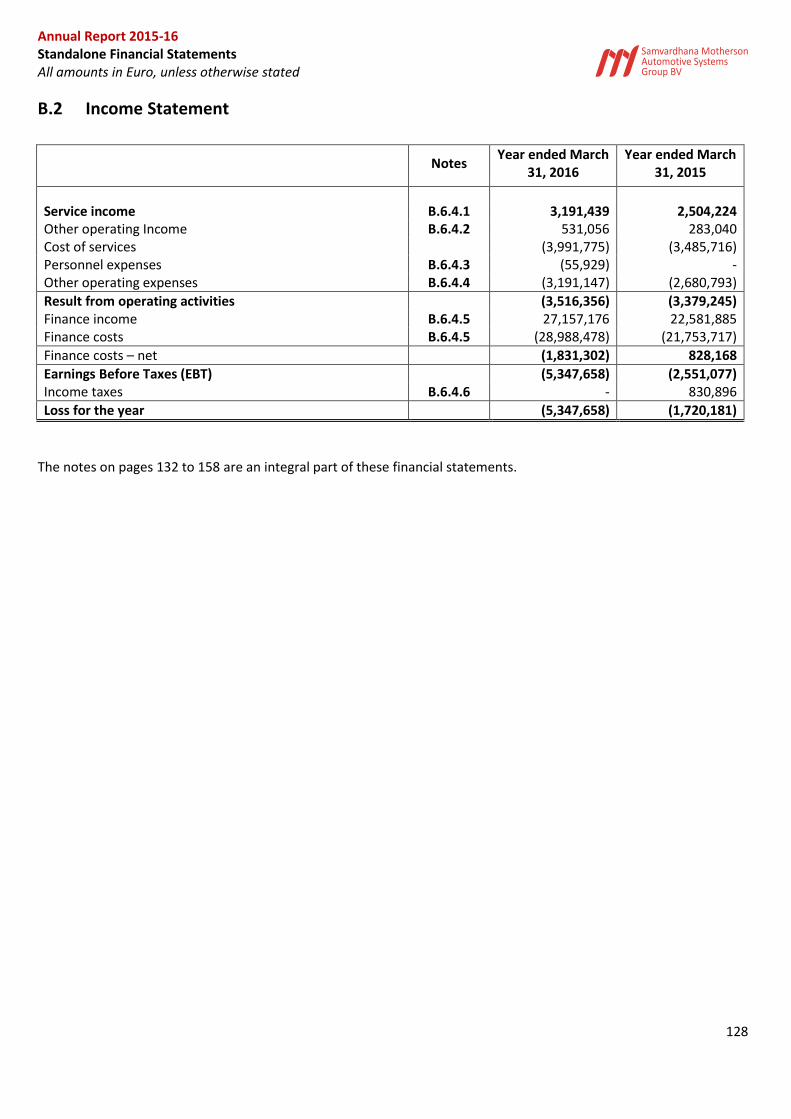
Annual Report 2015-16 Standalone Financial Statements All amounts in Euro, unless otherwise stated
128
B.2 Income Statement
Notes
Year ended March 31, 2016
Year ended March 31, 2015
Service income B.6.4.1 3,191,439 2,504,224 Other operating Income B.6.4.2 531,056 283,040 Cost of services
(3,991,775) (3,485,716)
Personnel expenses B.6.4.3 (55,929) - Other operating expenses B.6.4.4 (3,191,147) (2,680,793)
Result from operating activities
(3,516,356) (3,379,245) Finance income B.6.4.5 27,157,176 22,581,885 Finance costs B.6.4.5 (28,988,478) (21,753,717)
Finance costs – net
(1,831,302) 828,168
Earnings Before Taxes (EBT)
(5,347,658) (2,551,077) Income taxes B.6.4.6 - 830,896
Loss for the year
(5,347,658) (1,720,181)
The notes on pages 132 to 158 are an integral part of these financial statements.
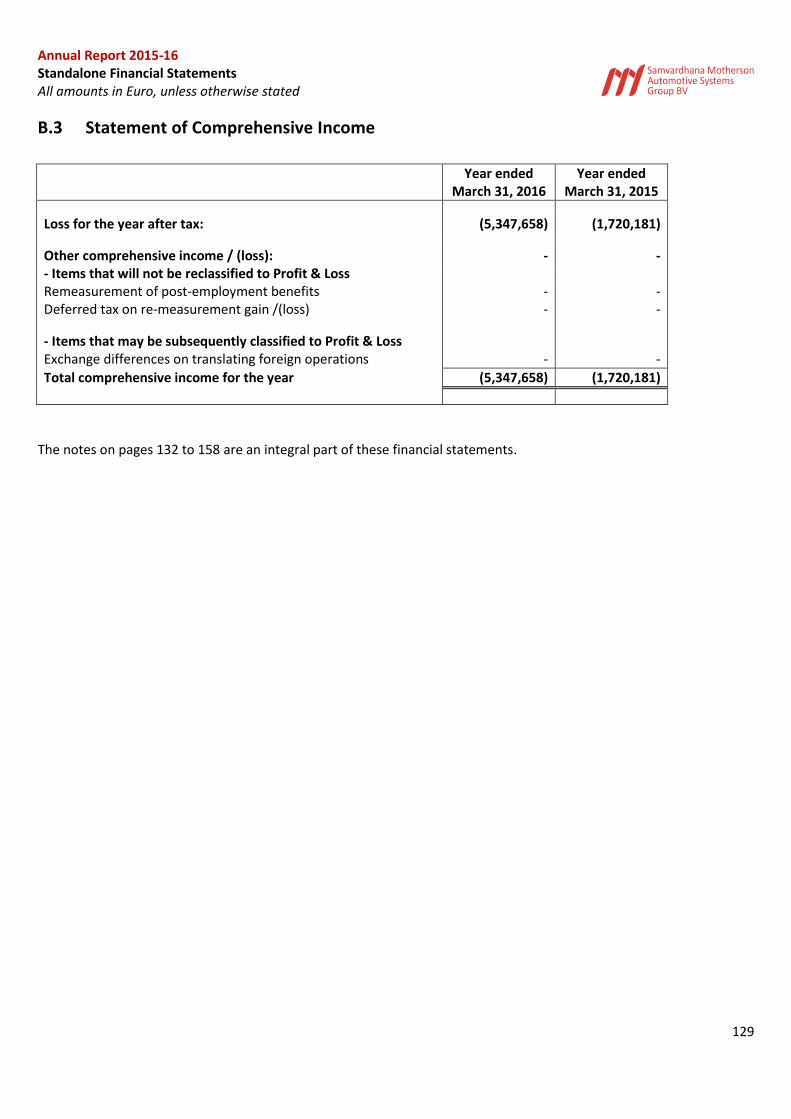
Annual Report 2015-16 Standalone Financial Statements All amounts in Euro, unless otherwise stated
129
B.3 Statement of Comprehensive Income
Year ended
March 31, 2016 Year ended
March 31, 2015
Loss for the year after tax: (5,347,658) (1,720,181)
Other comprehensive income / (loss): - - - Items that will not be reclassified to Profit & Loss
Remeasurement of post-employment benefits - - Deferred tax on re-measurement gain /(loss) - -
- Items that may be subsequently classified to Profit & Loss
Exchange differences on translating foreign operations - -
Total comprehensive income for the year (5,347,658) (1,720,181)
The notes on pages 132 to 158 are an integral part of these financial statements.
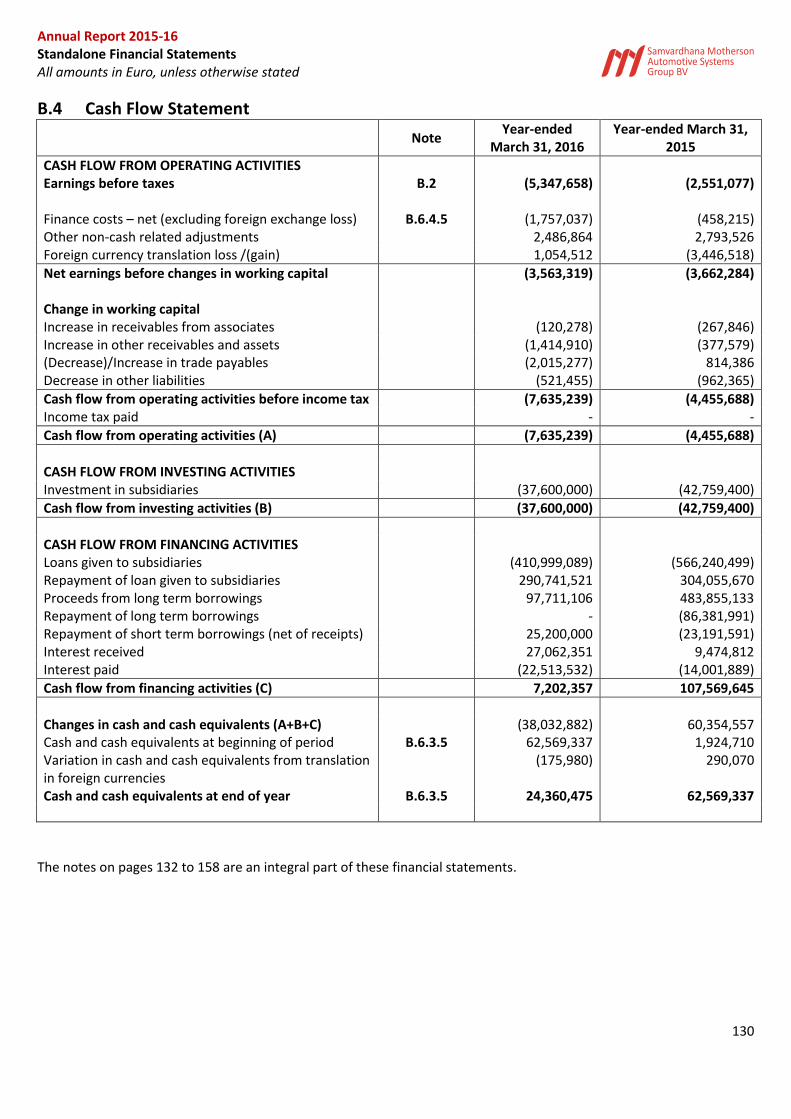
Annual Report 2015-16 Standalone Financial Statements All amounts in Euro, unless otherwise stated
130
B.4 Cash Flow Statement
Note
Year-ended March 31, 2016
Year-ended March 31, 2015
CASH FLOW FROM OPERATING ACTIVITIES
Earnings before taxes B.2 (5,347,658) (2,551,077)
Finance costs – net (excluding foreign exchange loss) B.6.4.5 (1,757,037) (458,215) Other non-cash related adjustments
2,486,864 2,793,526
Foreign currency translation loss /(gain)
1,054,512 (3,446,518)
Net earnings before changes in working capital
(3,563,319) (3,662,284)
Change in working capital
Increase in receivables from associates
(120,278) (267,846)
Increase in other receivables and assets
(1,414,910) (377,579) (Decrease)/Increase in trade payables
(2,015,277) 814,386
Decrease in other liabilities
(521,455) (962,365)
Cash flow from operating activities before income tax
(7,635,239) (4,455,688) Income tax paid
- -
Cash flow from operating activities (A)
(7,635,239) (4,455,688)
CASH FLOW FROM INVESTING ACTIVITIES
Investment in subsidiaries
(37,600,000) (42,759,400)
Cash flow from investing activities (B)
(37,600,000) (42,759,400)
CASH FLOW FROM FINANCING ACTIVITIES
Loans given to subsidiaries
(410,999,089) (566,240,499)
Repayment of loan given to subsidiaries
290,741,521 304,055,670 Proceeds from long term borrowings
97,711,106 483,855,133
Repayment of long term borrowings
- (86,381,991) Repayment of short term borrowings (net of receipts)
25,200,000 (23,191,591)
Interest received
27,062,351 9,474,812 Interest paid
(22,513,532) (14,001,889)
Cash flow from financing activities (C)
7,202,357 107,569,645
Changes in cash and cash equivalents (A+B+C)
(38,032,882) 60,354,557 Cash and cash equivalents at beginning of period B.6.3.5 62,569,337 1,924,710 Variation in cash and cash equivalents from translation in foreign currencies
(175,980) 290,070
Cash and cash equivalents at end of year B.6.3.5 24,360,475 62,569,337
The notes on pages 132 to 158 are an integral part of these financial statements.
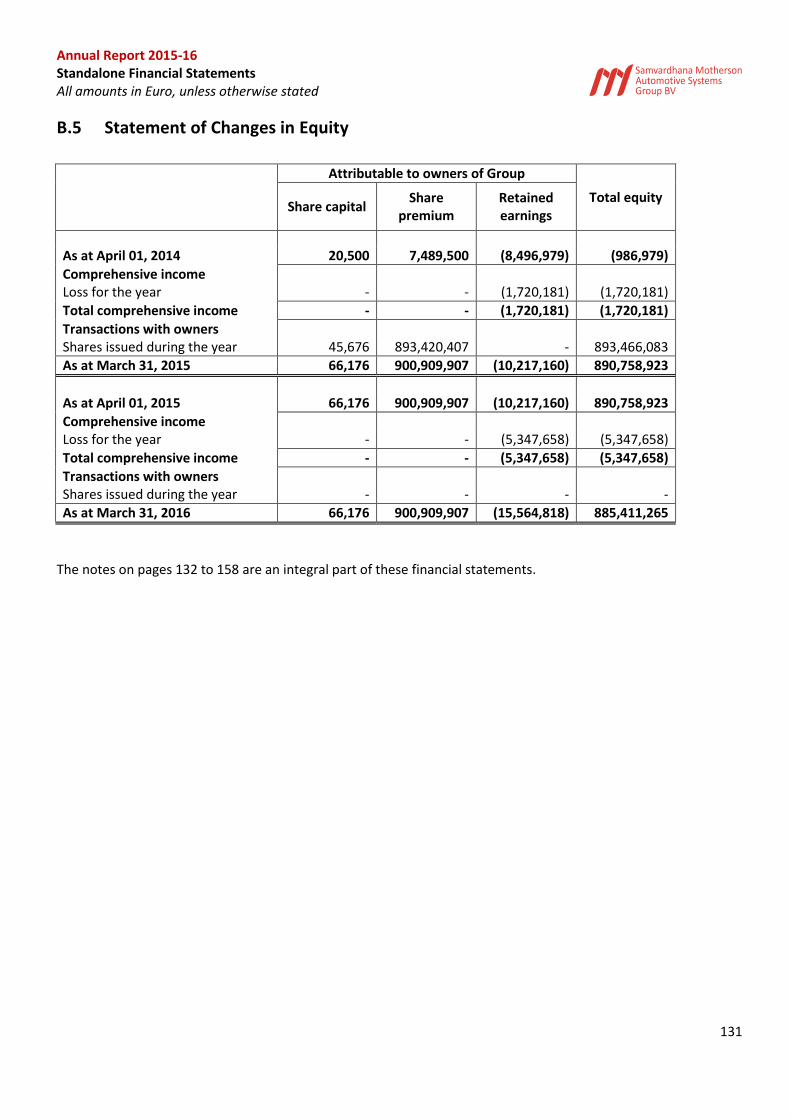
Annual Report 2015-16 Standalone Financial Statements All amounts in Euro, unless otherwise stated
131
B.5 Statement of Changes in Equity
Attributable to owners of Group
Total equity Share capital
Share premium
Retained earnings
As at April 01, 2014 20,500 7,489,500 (8,496,979) (986,979)
Comprehensive income
Loss for the year - - (1,720,181) (1,720,181)
Total comprehensive income - - (1,720,181) (1,720,181)
Transactions with owners
Shares issued during the year 45,676 893,420,407 - 893,466,083
As at March 31, 2015 66,176 900,909,907 (10,217,160) 890,758,923
As at April 01, 2015 66,176 900,909,907 (10,217,160) 890,758,923
Comprehensive income
Loss for the year - - (5,347,658) (5,347,658)
Total comprehensive income - - (5,347,658) (5,347,658)
Transactions with owners
Shares issued during the year - - - -
As at March 31, 2016 66,176 900,909,907 (15,564,818) 885,411,265
The notes on pages 132 to 158 are an integral part of these financial statements.
Annual Report 2015-16 Standalone Financial Statements All amounts in Euro, unless otherwise stated
132
B.6 Notes to the Financial Statements
B.6.1 General information and description of the business
Samvardhana Motherson Automotive Systems Group BV, Amsterdam (hereafter referred as "Company" or "SMRP BV") is a private company with limited liability, incorporated under the laws of the Netherlands on 7 October 2011, having its corporate seat at Amsterdam, with offices at Hoogoorddreef 15, 1101 BA Amsterdam, The Netherlands. The principal business activities of the Company are holding, financing and management activities.
B.6.2 Summary of Significant Accounting Policies
B.6.2.1 Basis of preparation The financial statements of the Company comprise the period April 01, 2015 to March 31, 2016. The financial statements have been prepared in accordance with International Financial Reporting Standards ("IFRS") as endorsed by the European Union, and comply with the financial reporting requirements in section 9 of Book 2 of the Netherlands Civil Code, as far as applicable. These correspond to the IFRS issued by the International Accounting Standards Board ("IASB") and interpretations issued by the International Financial Reporting Interpretations Committee ("IFRIC") or by the previous Standing Interpretations Committee ("SIC") and approved by the European Union. The financial statements have been prepared on a going concern basis and in accordance with the accrual basis of accounting. The financial statements have been prepared under the historical cost convention except for financial assets and financial liabilities (including derivative instruments) at fair value through profit or loss. In case no other policies are mentioned, refer to the accounting policies as described in the accounting policies in the consolidated financial statements of this Annual Report. For an appropriate interpretation, the parent financial statements of the Company should be read in conjunction with the consolidated financial statements.
The financial statements are presented in euros and all values are rounded to the nearest euro, except when otherwise indicated. These financial statements have been authorised for issue by SMRP BV’s management and supervisory board on May 27, 2016.
Annual Report 2015-16 Standalone Financial Statements All amounts in Euro, unless otherwise stated
133
B.6.2.3 Functional and presentation currency
The financial statements are presented in Euro (€), which is the Company's functional currency, as it is
the currency of the primary economic environment in which the Company operates.
B.6.2.4 Transactions in foreign currencies Foreign currency transactions are translated into the functional currency using the exchange rates prevailing at the dates of the transactions. Monetary assets and liabilities denominated in foreign currencies at the reporting date are translated into the functional currency at the rate prevailing on this date. Differences from foreign currency transactions are reported in the income statement. Non-monetary assets and liabilities that are measured at historical cost in foreign currencies at the reporting date are translated into the functional currency at the rate prevailing on the day of the transaction. Non-monetary assets and liabilities that are measured at fair value in foreign currencies at the reporting date are translated into the functional currency at the rate prevailing on the date on which the fair value was determined.
B.6.2.5 Investments in subsidiaries Subsidiaries are entities over which the Company has control. The Company controls an entity when the Company is exposed to, or has rights to, variable returns from its involvement with the entity and has the ability to affect those returns through its power over the entity. Joint ventures are entities over which the company exercises joint control with a third party (or parties) or co-investor(s). Associates are entities over which the company exercises neither control, nor joint control, but does have a significant influence on the financial and operating policies. In line with IAS 27.10a, the investments in subsidiaries have been valued at cost. Dividend will be recognised in the financial income when received or when the Company is legally entitled to the dividend. In general, the Company yearly performs reviews at the reporting date to determine whether there were indications that financial fixed assets or their cash-generating units have to be impaired. The amount of impairment is the difference between the asset´s carrying amount and the recoverable amount. The recoverable amount of a fixed asset or a cash-generating unit is the higher of fair value less costs to sell and the value in use. Calculation of recoverable amount is based on estimated future cash flows, discounted at an appropriate interest rate. Impairments, if any, are reported in the income statement.
B.6.2.6 Financial instruments
A financial instrument is any agreement that leads to the generation of financial asset at one company and/or to a financial liability or equity instrument at another. Financial instruments can be placed into one of four categories according to their intended purpose: financial assets measured at fair value through profit or loss, financial assets held to maturity, loans and receivables, financial assets available for sale.
Annual Report 2015-16 Standalone Financial Statements All amounts in Euro, unless otherwise stated
134
Financial instruments include primary financial instruments such as receivables and trade liabilities, securities, debt instruments and other financial liabilities. They also include derivative financial instruments used to hedge against risks arising from changes in exchange rates and interest rates. Financial assets are derecognised when the rights to receive cash flows from financial assets have expired or have been transferred and the Group has transferred substantially all risks and rewards of ownership. Financial assets and liabilities are offset and the net amount reported in the balance sheet when there is a legally enforceable right to offset the recognised amounts and there is an intention to settle on a net basis or realise the asset and settle the liability simultaneously.
Primary financial instruments Primary financial instruments are allocated to one of four categories according to their intended purpose. This allocation is re-assessed at each reporting date and it is determined whether the asset is to be reported as current or non-current. a. Financial assets carried at fair value through profit or losses are initially recognised at fair value, and transaction costs are expensed in the income statement. Changes in the fair value of financial assets measured at fair value – either because they have been reported as such upon initial recognition or are held for trading – are recognised directly in the income statement. They are also reported as current assets if they are being held for trading or it can be reasonably expected that they will be converted within twelve months from the reporting date. b. Financial assets held to maturity are initially recognised at fair value plus transaction costs. Financial assets held to maturity which exhibit fixed or determinable payments and a fixed maturity period, and which the Group wishes and is able to hold until maturity are measured at amortised cost and reported depending on their maturity period as non-current or current assets. The amortisation and losses arising from impairments are recognised in the statement of profit or loss. c. Loans and receivables are initially recognised at fair value plus transaction costs. Loans and receivables that have fixed or determinable payments and are not listed on an active market are measured at amortised cost using the effective interest method less any necessary write-downs arising from impairments. They are reported in the statement of financial position under other receivables and other assets unless they are trade receivables, and are recorded as non-current or current depending on their maturity period. d. Available-for-sale financial assets that have been reported as such upon initial recognition are measured at fair value, provided that this can be determined, and then reported as non-current or current assets, depending on the expected time of sale. Gains and losses from changes in fair value are recorded net, i.e. after tax, and taken directly to equity (“Other comprehensive income”) until the financial asset has been derecognised. In the event that an asset is impaired permanently, however, the loss must be recorded directly in the income statement. If it is not possible to determine the fair value, for example with holdings in non-consolidated affiliated companies or other investments in companies, these assets are measured at cost.
Annual Report 2015-16 Standalone Financial Statements All amounts in Euro, unless otherwise stated
135
Financial liabilities are initially recognised at fair value less transaction costs for liabilities not recognised at fair value through profit or loss. Subsequently financial liabilities from primary financial instruments are measured at amortised cost. The Company measures all financial liabilities except derivatives at amortised cost, which encompasses the remaining debt amount less expenses. Liabilities from finance leases are measured at the present value of the remaining minimum lease payments on the basis of the interest rate underlying the leasing agreement. Financial liabilities with fixed or determinable payments that are neither debt instruments nor derivative financial instruments listed on an active market are reported in the statement of financial position under other liabilities in accordance with their maturity. All financial instruments are therefore measured at historical cost or amortised cost less impairments.
B.6.2.7 Derivative financial instruments
Derivative financial instruments that are not part of a hedging relationship are carried at fair value upon initial recognition, corresponding to the fair value of the consideration received or given in return. After initial recognition, derivative financial instruments are carried at fair value, which is based on the market value of the financial instrument. Any changes in fair value are recorded directly in profit or loss.
B.6.2.8 Receivable from associates Receivables are amounts due from subsidiaries for the cost of services charged to them as per the Service Level Agreements entered into with those subsidiaries.
B.6.2.9 Cash and cash equivalents Cash and cash equivalents consist of cash on hand and short-term deposits with an original maturity three months or less.
B.6.2.10 Taxes Current taxes are those taxes foreseeably payable on a year’s taxable income in accordance with the statutory tax rates or tax rates that had been substantially adopted as of the reporting date, as well as all adjustments to payable taxes in relation to previous reporting periods. Income taxes for the annual result reported in the income statement comprise current taxes and deferred taxes. Income taxes are recorded in the income statement unless they relate to items recognised directly in equity or in other comprehensive income. In this case, the income taxes incurred are also recognised directly in equity or in other comprehensive income. Deferred tax assets and liabilities are recognised for all temporary differences between the carrying amount as per IFRS and the relevant tax assessment basis. Deferred tax liabilities are not recognised for temporary differences (“outside-basis differences”) if the timing of the reversal of the temporary difference is controlled by the Group and it is probable that the temporary difference will not reverse in the foreseeable future. Deferred tax liabilities for dividends from subsidiaries will be recognised if the parent company determines that the profits of the respective subsidiary will be distributed in the
Annual Report 2015-16 Standalone Financial Statements All amounts in Euro, unless otherwise stated
136
foreseeable future. Deferred tax assets contain tax assets that are derived from the expected utilization of unused tax losses and unused tax credits, unless it is improbable that the future taxable profits will be available against which the temporary differences can be utilized. Deferred taxes are calculated on the basis of the tax rates that are expected to apply to the period when the asset is realized and the liability is settled, based on the tax rates that have been enacted or substantively enacted by the end of the reporting period in the respective country.
B.6.2.11 Borrowings Borrowings are recognised initially at fair value, net of transaction costs incurred. Borrowings are subsequently carried at amortized cost; any difference between the proceeds (net of transaction costs) and the redemption value is recognised in the income statement over the period of the borrowings using the effective interest method. Fees paid on the establishment of loan facilities are recognised as transaction costs of the loan to the extent that it is probable that some or all of the facility will be drawn down. In this case, the fee is deferred until the draw-down occurs. To the extent there is no evidence that it is probable that some or all of the facility will be drawn down, the fee is capitalized as a pre-payment for liquidity services and amortized over the period of the facility to which it relates. General and specific borrowing costs directly attributable to the acquisition, construction or production of qualifying assets, which are assets that necessarily take a substantial period of time to get ready for their intended use or sale, are added to the cost of those assets, until such time as the assets are substantially ready for their intended use or sale. Investment income earned on the temporary investment of specific borrowings pending their expenditure on qualifying assets is deducted from the borrowing costs eligible for capitalization.
B.6.2.12 Recognition of income and expenses Service Income is income generated from services provided to associated companies based on service level agreements. Operating expenses are recognised when goods or services are used or when the expense is incurred. Interest expense is recognised using the effective interest method as an expense or income for the period in which it occurs. This allows a constant, periodic interest rate for the remainder of the liability to be calculated. Dividend income is recognised when the right to receive payment is established. Interest income is recognised on a pro-rata basis for the period funds were given to the subsidiaries using effective interest method as per the rate of interest mentioned in the loan agreements.
B.6.2.13 Changes in accounting policies and disclosures
During the financial year ended March 31, 2016, below mentioned amendments to IFRS became applicable to the company, however these did not have any impact on the net asset, financial or income position of the Group
Annual Report 2015-16 Standalone Financial Statements All amounts in Euro, unless otherwise stated
137
Defined Benefit Plans: Employee Contributions (Amendments to IAS 19)
Annual Improvements to IFRSs 2010 – 2012 Cycle
Annual Improvements to IFRSs 2011 – 2013 Cycle
IFRIC Interpretation 21 Levies
Future changes to accounting regulations
The IASB and IFRIC have adopted further standards and interpretations, but the adoption of these is not mandatory for the reporting period or they have not been endorsed by the European Commission. Accordingly the Company has elected not to early adopt these standards and interpretations in preparing the consolidated financial statements. This concerns the following standards and interpretations relevant to the Company:
At this stage, the company is not able to estimate the impact of the new rules on the group’s financial statements. The company will make more detailed assessments of the impact over the next twelve months. An early adoption of any of the new standards and interpretations is not planned.
Adoptions for reporting periods that begin
on or after the specified date (in accordance
with EU endorsement)
Accounting for Acquisition of Interests in Joint
Operations (Amendments to IFRS 11)
January 01, 2016
Clarification of Acceptable Methods of Depreciation and
Amortisation (Amendments to IAS 16 and IAS 38)
January 01, 2016
Amendments to IAS 1: Disclosure Initiative January 01, 2016
Annual Improvements to IFRSs 2012–2014 Cycle January 01, 2016
Amendments to IAS 27: Equity Method in Separate
Financial Statements
January 01, 2016
Amendments to IAS 12: Recognition of Deferred Tax
Assets for Unrealised Losses
Not yet endorsed
Amendments to IAS 7: Disclosure Initiative Not yet endorsed
Clarifications to IFRS 15 Revenue from Contracts with
Customers
Not yet endorsed
IFRS 15 Revenue from Contracts with Customers Not yet endorsed
IFRS 9 Financial Instruments Not yet endorsed
Amendments to IFRS 10, IFRS 12 and IAS 28: Investment
Entities: Applying the Consolidation Exception
Not yet endorsed
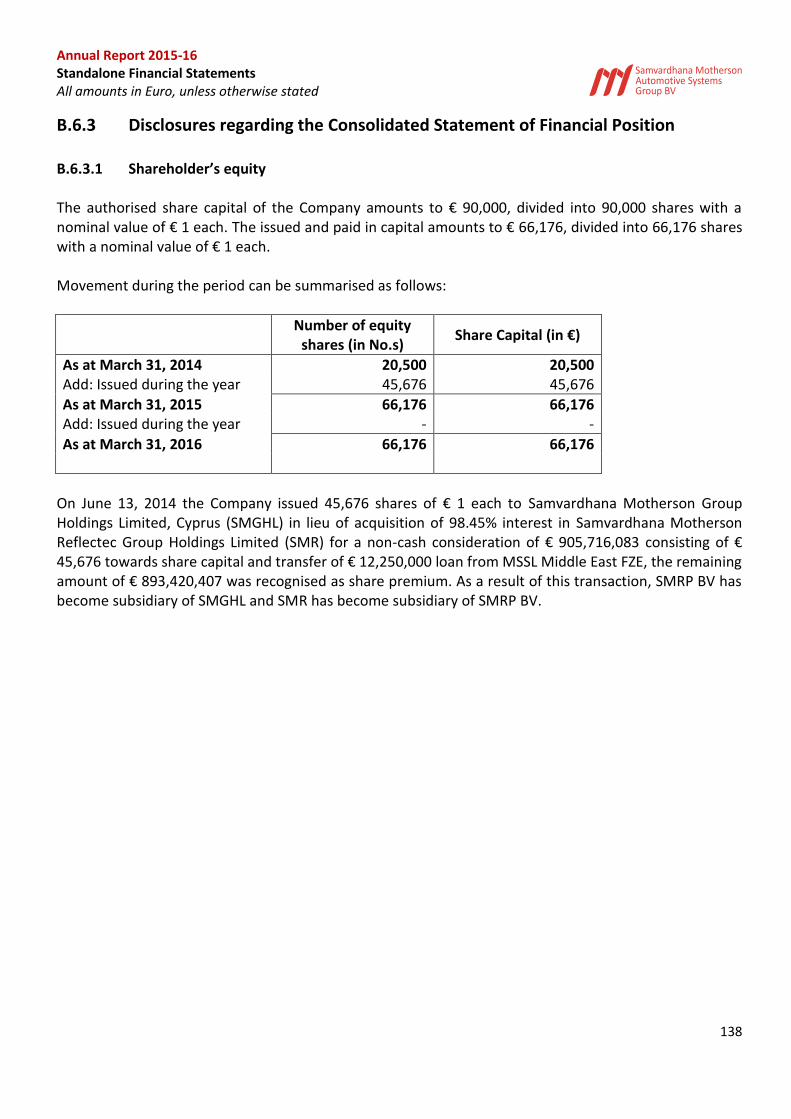
Annual Report 2015-16 Standalone Financial Statements All amounts in Euro, unless otherwise stated
138
B.6.3 Disclosures regarding the Consolidated Statement of Financial Position
B.6.3.1 Shareholder’s equity The authorised share capital of the Company amounts to € 90,000, divided into 90,000 shares with a nominal value of € 1 each. The issued and paid in capital amounts to € 66,176, divided into 66,176 shares with a nominal value of € 1 each. Movement during the period can be summarised as follows:
Number of equity
shares (in No.s) Share Capital (in €)
As at March 31, 2014 20,500 20,500 Add: Issued during the year 45,676 45,676
As at March 31, 2015 66,176 66,176 Add: Issued during the year - -
As at March 31, 2016 66,176 66,176
On June 13, 2014 the Company issued 45,676 shares of € 1 each to Samvardhana Motherson Group Holdings Limited, Cyprus (SMGHL) in lieu of acquisition of 98.45% interest in Samvardhana Motherson Reflectec Group Holdings Limited (SMR) for a non-cash consideration of € 905,716,083 consisting of € 45,676 towards share capital and transfer of € 12,250,000 loan from MSSL Middle East FZE, the remaining amount of € 893,420,407 was recognised as share premium. As a result of this transaction, SMRP BV has become subsidiary of SMGHL and SMR has become subsidiary of SMRP BV.
Annual Report 2015-16 Standalone Financial Statements All amounts in Euro, unless otherwise stated
139
B.6.3.1.1 Differences between the company equity and the group’s consolidated equity The difference between the company equity and the group’s consolidated equity is explained by the fact that the company calculates the company’s investments in subsidiaries against the net asset value; however these are accounted for at historical costs in the company financial statements. Further differences can be explained by the results on intercompany transactions. The difference between the company and group’s consolidated equity and result for the year can be
shown as follows:
As at March 31, 2016
Equity in accordance to the consolidated financial statements 404,142,424
Add: negative net asset values of consolidated subsidiary companies 73,789,340
Add: not realised cumulative intercompany results 407,479,501
Equity in accordance to the company financial statements 885,411,265
B.6.3.1.2 Difference in results
Year ended March
31, 2016
Result for the year in accordance to the consolidated financial statements 76,146,456
Result of consolidated subsidiary companies (107,106,861)
Results on Intercompany transactions 25,612,747
Result for the year in accordance to the company financial statements (5,347,658)
B.6.3.2 Investment in subsidiaries
The Company has prepared consolidated financial statements. In line with IAS 27, the investments have been valued at cost in the company’s separate financial statements. A summary of movement in the investments is presented below:
Amount in €
At March 31, 2014 58,313,743 Investments during the year 949,868,593
At March 31, 2015 1,008,182,336
Investments during the year 37,600,000
At March 31, 2016 1,045,782,336
Annual Report 2015-16 Standalone Financial Statements All amounts in Euro, unless otherwise stated
140
B.6.3.2.1 Details of investments
The carrying value of investments in subsidiaries and the percentage of shareholding are as below:
Name of the entity Share March 31, 2016 March 31, 2015
Samvardhana Motherson Reflectec Group Holdings Limited 98.45% 905,716,083 905,716,083
Samvardhana Motherson Peguform GmbH 100.00% 3,804,191 3,804,191
SMP Automotive Interiors (Beijing) Co. Ltd 100.00% 6,000,000 1,400,000
SMP Automotive Technology Ibérica, S.L. 100.00% 130,261,742 97,261,742
SMP Automotive Systems México, S. A. de C. V. 00.00% 320 320
Total 1,045,782,336 1,008,182,336
B.6.3.2.2 Impairment of investments At the end of each reporting period, the Company performs a review of the carrying value of its investments to determine whether there were indications that any of these investments may have been impaired. The amount of impairment is the difference between the investments carrying amount and the recoverable amount. The recoverable amount is the higher of fair value less costs to sell and the value in use. Calculation of recoverable amount is based on estimated future cash flows, discounted at the effective interest rate at the reporting date. As at the end of March 31, 2016 there were no indications of decline in the recoverable value and hence no impairment loss needs to be recognised in the financial statements.
B.6.3.2.3 Investments pledged as security
Shares in Samvardhana Motherson Reflectec Group Holdings Limited, Samvardhana Motherson Peguform GmbH, SMP Automotive Technology Ibérica, S.L. have been pledged as security for borrowings, refer Note B.6.5.2 for details.
B.6.3.2.4 Investment in SMR On June 13, 2014, the Company acquired 98.45% shareholding of Samvardhana Motherson Reflectec Group Holdings Limited (SMR) from Samvardhana Motherson Group Holdings Limited, Cyprus (SMGHL) in share exchange deal wherein SMGHL transferred its entire shareholding (including acquired on June 9, 2014 from minority shareholders) to SMRP BV in exchange of 45,676 shares of a nominal value of euro one each issued by SMRP BV and consequently SMRP BV has become subsidiary of SMGHL. SMRP BV Group and SMR were jointly controlled by Motherson Sumi Systems Limited and Samvardhana Motherson International Limited prior to June 13, 2014.
Annual Report 2015-16 Standalone Financial Statements All amounts in Euro, unless otherwise stated
141
B.6.3.3 Other financial assets
March 31, 2016 March 31, 2015
Non-current Loans to subsidiaries 425,723,543 306,284,443
Total 425,723,543 306,284,443
The maximum exposure to the credit risk is the carrying value of instruments. The loans given to subsidiaries currently carry interest rate from 4.30% to 7.03% determined on the basis of credit risk of the relevant subsidiary and are repayable on or before March 31, 2018.
B.6.3.4 Other receivables and assets
March 31, 2016 March 31, 2015
Interest receivable from subsidiaries 9,548,129 9,465,708 Prepaid expenses 363,216 2,824 Others 443,290 506,556
Total 10,354,635 9,975,088
The carrying values approximately correspond to the fair values.
B.6.3.5 Cash and cash equivalents
March 31, 2016 March 31, 2015
Cash at bank 24,360,475 62,569,337
Total 24,360,475 62,569,337
There are no contractual or other restrictions on the use of cash and cash equivalents.
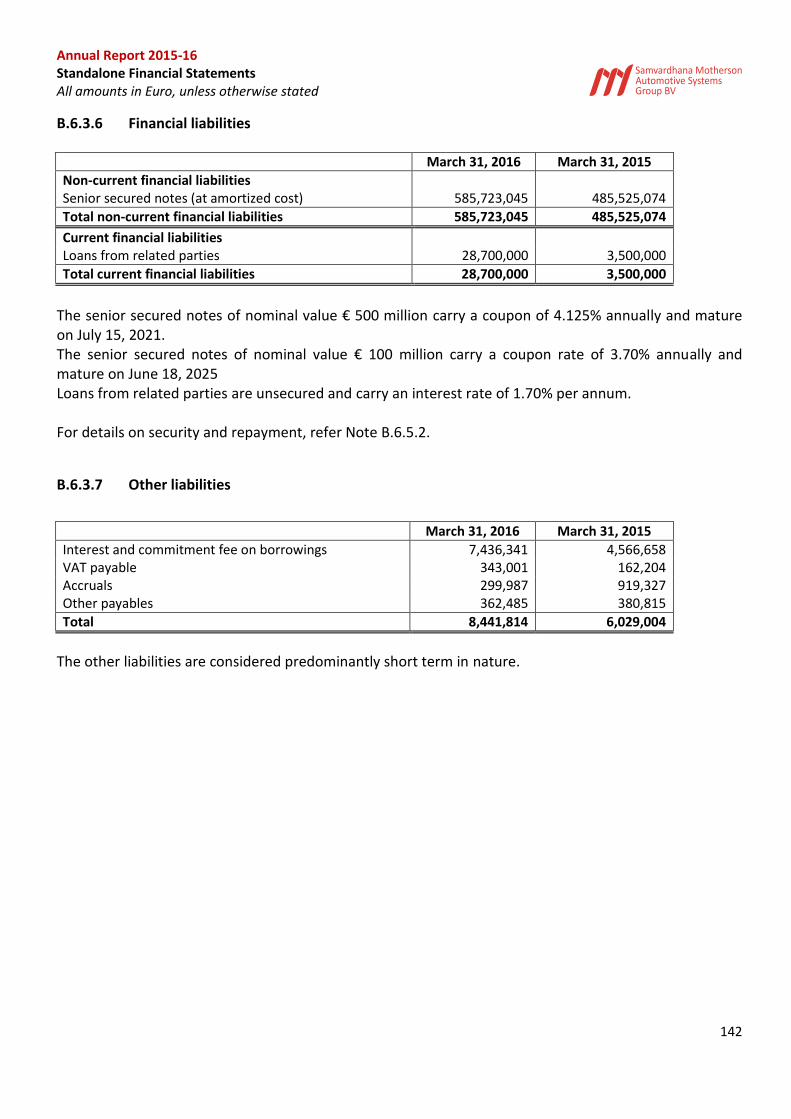
Annual Report 2015-16 Standalone Financial Statements All amounts in Euro, unless otherwise stated
142
B.6.3.6 Financial liabilities
March 31, 2016 March 31, 2015
Non-current financial liabilities Senior secured notes (at amortized cost) 585,723,045 485,525,074
Total non-current financial liabilities 585,723,045 485,525,074
Current financial liabilities Loans from related parties 28,700,000 3,500,000
Total current financial liabilities 28,700,000 3,500,000
The senior secured notes of nominal value € 500 million carry a coupon of 4.125% annually and mature on July 15, 2021. The senior secured notes of nominal value € 100 million carry a coupon rate of 3.70% annually and mature on June 18, 2025 Loans from related parties are unsecured and carry an interest rate of 1.70% per annum. For details on security and repayment, refer Note B.6.5.2.
B.6.3.7 Other liabilities
March 31, 2016 March 31, 2015
Interest and commitment fee on borrowings 7,436,341 4,566,658 VAT payable 343,001 162,204 Accruals 299,987 919,327 Other payables 362,485 380,815
Total 8,441,814 6,029,004
The other liabilities are considered predominantly short term in nature.
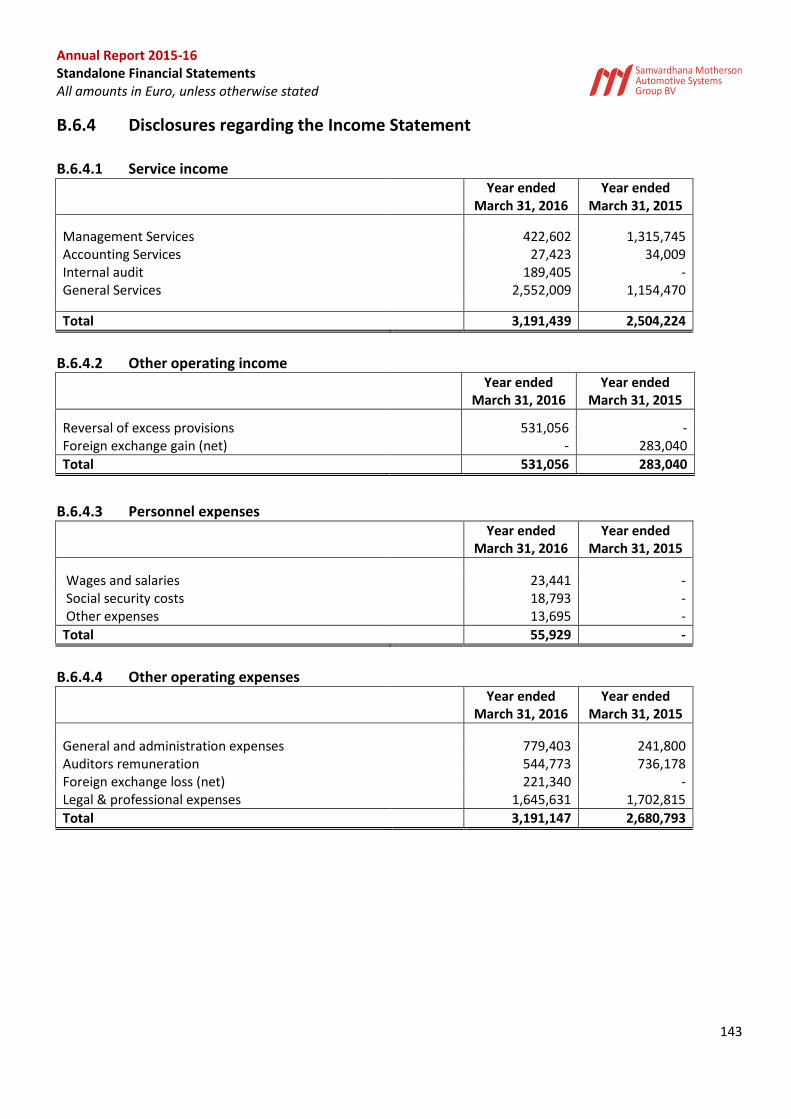
Annual Report 2015-16 Standalone Financial Statements All amounts in Euro, unless otherwise stated
143
B.6.4 Disclosures regarding the Income Statement
B.6.4.1 Service income
Year ended
March 31, 2016 Year ended
March 31, 2015
Management Services
422,602 1,315,745 Accounting Services
27,423 34,009
Internal audit 189,405 - General Services
2,552,009 1,154,470
Total
3,191,439 2,504,224
B.6.4.2 Other operating income
Year ended
March 31, 2016 Year ended
March 31, 2015
Reversal of excess provisions
531,056 - Foreign exchange gain (net) - 283,040
Total 531,056 283,040
B.6.4.3 Personnel expenses
Year ended March 31, 2016
Year ended March 31, 2015
Wages and salaries
23,441 -
Social security costs
18,793 - Other expenses
13,695 -
Total
55,929 -
B.6.4.4 Other operating expenses
Year ended March 31, 2016
Year ended March 31, 2015
General and administration expenses
779,403 241,800
Auditors remuneration
544,773 736,178 Foreign exchange loss (net)
221,340 -
Legal & professional expenses
1,645,631 1,702,815
Total
3,191,147 2,680,793
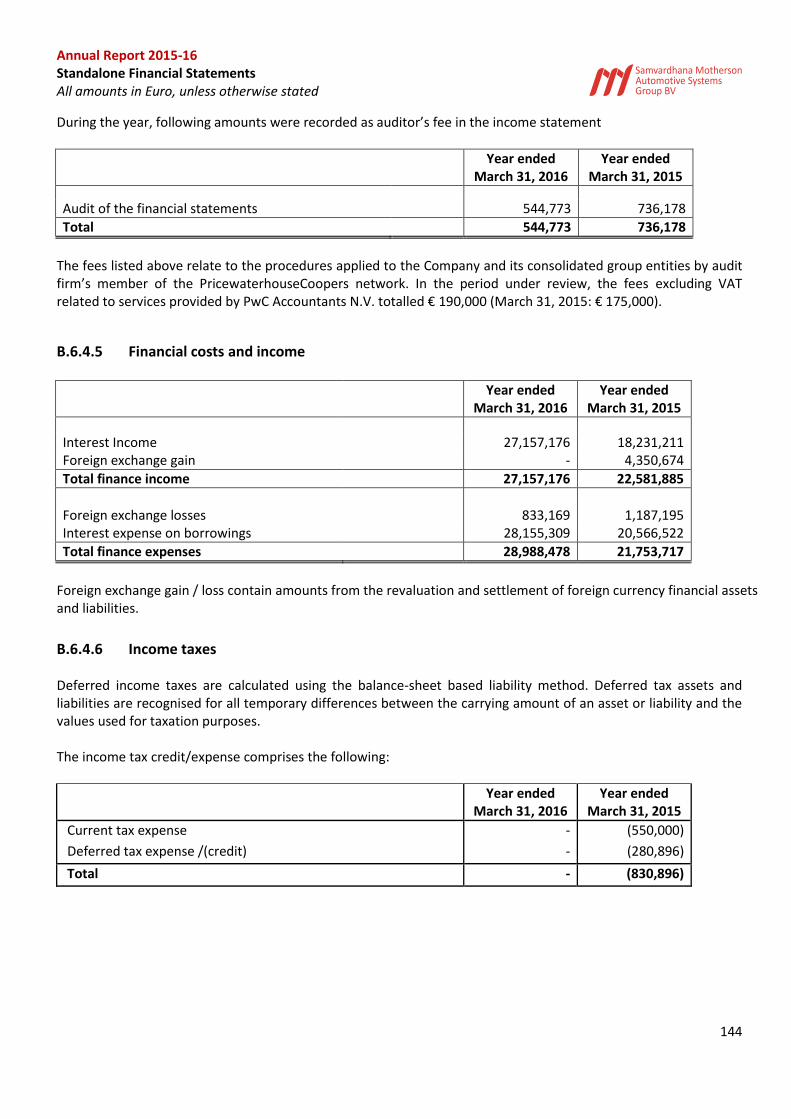
Annual Report 2015-16 Standalone Financial Statements All amounts in Euro, unless otherwise stated
144
During the year, following amounts were recorded as auditor’s fee in the income statement
Year ended March 31, 2016
Year ended March 31, 2015
Audit of the financial statements
544,773 736,178
Total
544,773 736,178
The fees listed above relate to the procedures applied to the Company and its consolidated group entities by audit firm’s member of the PricewaterhouseCoopers network. In the period under review, the fees excluding VAT related to services provided by PwC Accountants N.V. totalled € 190,000 (March 31, 2015: € 175,000).
B.6.4.5 Financial costs and income
Year ended March 31, 2016
Year ended March 31, 2015
Interest Income
27,157,176 18,231,211 Foreign exchange gain
- 4,350,674
Total finance income
27,157,176 22,581,885
Foreign exchange losses
833,169 1,187,195
Interest expense on borrowings
28,155,309 20,566,522
Total finance expenses
28,988,478 21,753,717
Foreign exchange gain / loss contain amounts from the revaluation and settlement of foreign currency financial assets and liabilities.
B.6.4.6 Income taxes Deferred income taxes are calculated using the balance-sheet based liability method. Deferred tax assets and liabilities are recognised for all temporary differences between the carrying amount of an asset or liability and the values used for taxation purposes. The income tax credit/expense comprises the following:
Year ended March 31, 2016
Year ended March 31, 2015
Current tax expense - (550,000)
Deferred tax expense /(credit) - (280,896)
Total - (830,896)
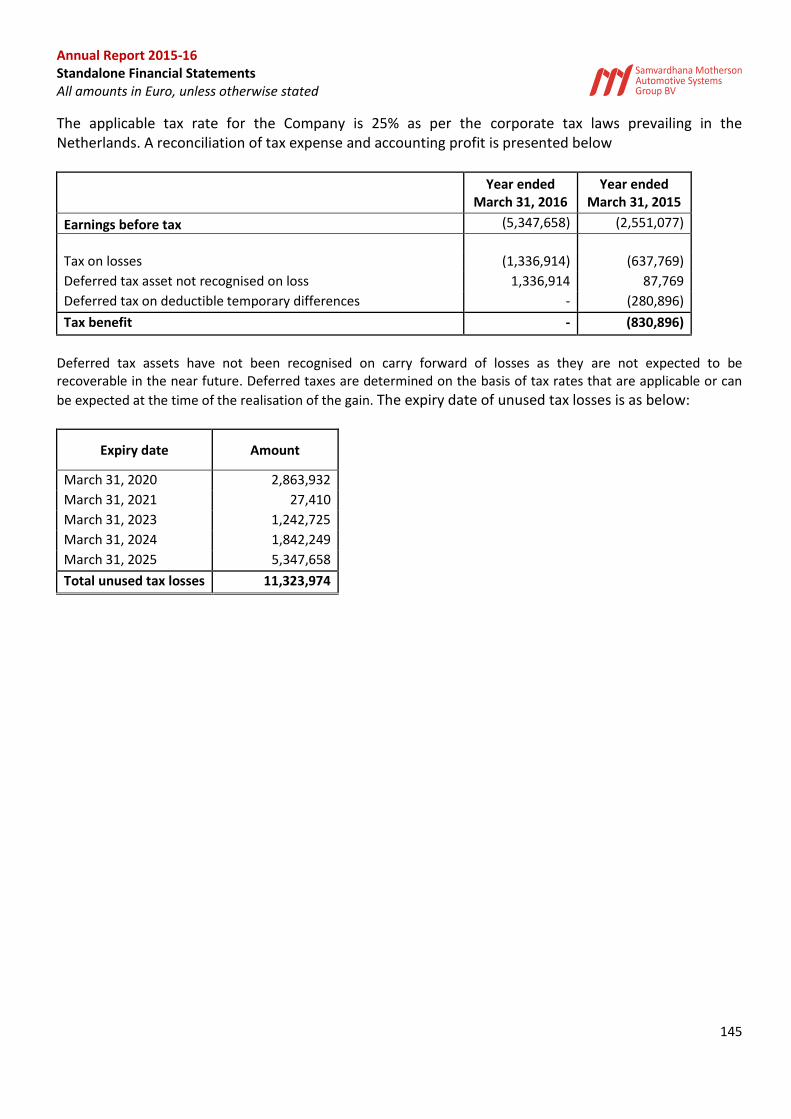
Annual Report 2015-16 Standalone Financial Statements All amounts in Euro, unless otherwise stated
145
The applicable tax rate for the Company is 25% as per the corporate tax laws prevailing in the Netherlands. A reconciliation of tax expense and accounting profit is presented below
Year ended
March 31, 2016 Year ended
March 31, 2015
Earnings before tax (5,347,658) (2,551,077)
Tax on losses (1,336,914) (637,769)
Deferred tax asset not recognised on loss 1,336,914 87,769
Deferred tax on deductible temporary differences - (280,896)
Tax benefit - (830,896)
Deferred tax assets have not been recognised on carry forward of losses as they are not expected to be recoverable in the near future. Deferred taxes are determined on the basis of tax rates that are applicable or can
be expected at the time of the realisation of the gain. The expiry date of unused tax losses is as below:
Expiry date Amount
March 31, 2020 2,863,932
March 31, 2021 27,410
March 31, 2023 1,242,725
March 31, 2024 1,842,249
March 31, 2025 5,347,658
Total unused tax losses 11,323,974
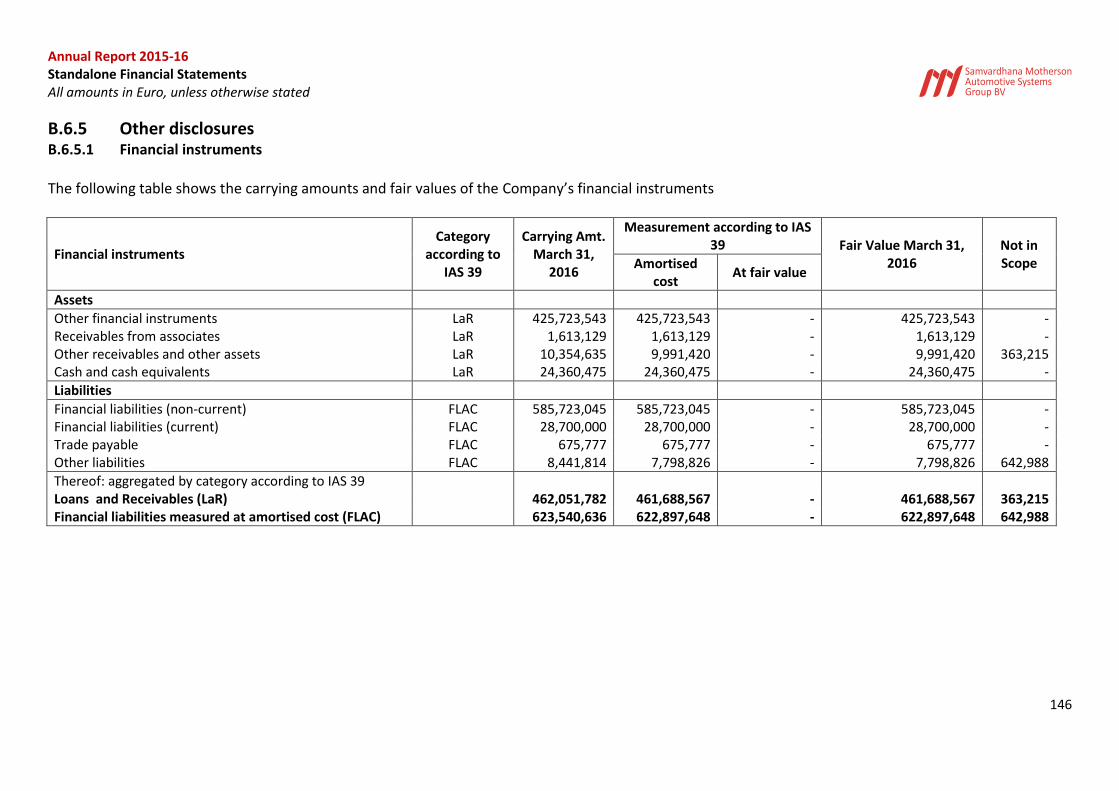
Annual Report 2015-16 Standalone Financial Statements All amounts in Euro, unless otherwise stated
146
B.6.5 Other disclosures B.6.5.1 Financial instruments
The following table shows the carrying amounts and fair values of the Company’s financial instruments
Financial instruments Category
according to IAS 39
Carrying Amt. March 31,
2016
Measurement according to IAS 39 Fair Value March 31,
2016 Not in Scope Amortised
cost At fair value
Assets
Other financial instruments LaR 425,723,543 425,723,543 - 425,723,543 - Receivables from associates LaR 1,613,129 1,613,129 - 1,613,129 - Other receivables and other assets LaR 10,354,635 9,991,420 - 9,991,420 363,215 Cash and cash equivalents LaR 24,360,475 24,360,475 - 24,360,475 -
Liabilities
Financial liabilities (non-current) FLAC 585,723,045 585,723,045 - 585,723,045 - Financial liabilities (current) FLAC 28,700,000 28,700,000 - 28,700,000 - Trade payable FLAC 675,777 675,777 - 675,777 - Other liabilities FLAC 8,441,814 7,798,826 - 7,798,826 642,988
Thereof: aggregated by category according to IAS 39
Loans and Receivables (LaR)
462,051,782 461,688,567 - 461,688,567 363,215
Financial liabilities measured at amortised cost (FLAC)
623,540,636 622,897,648 - 622,897,648 642,988
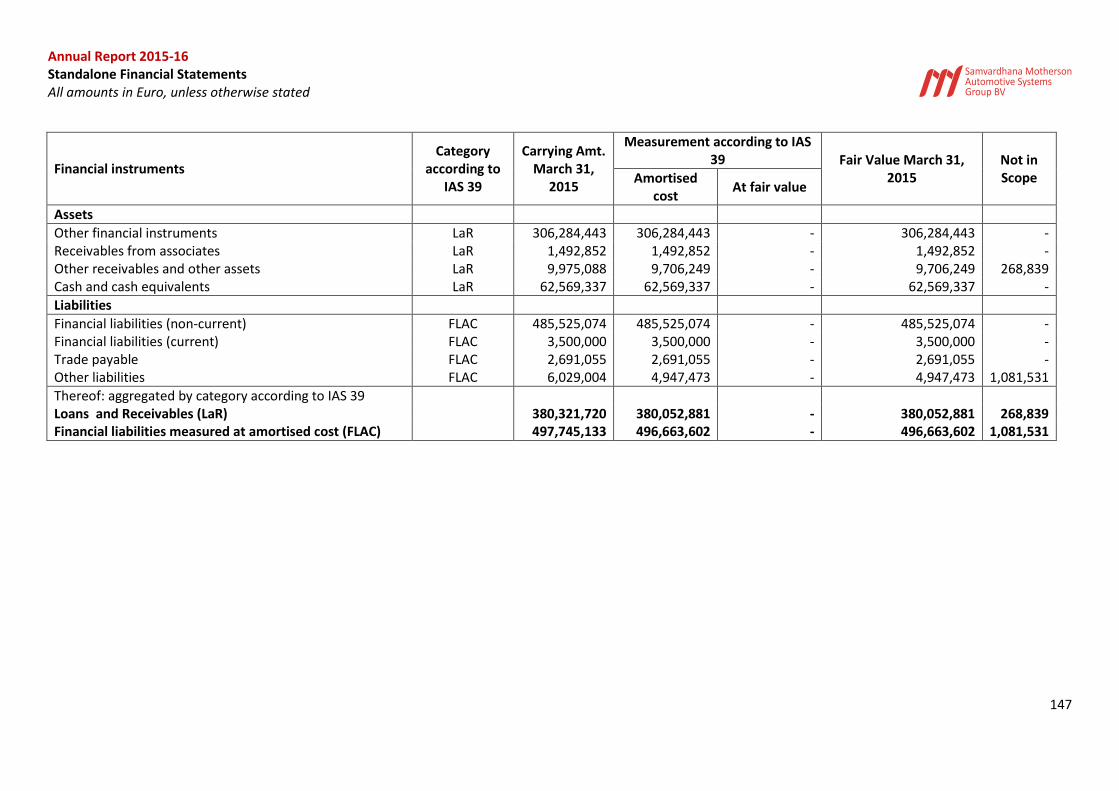
Annual Report 2015-16 Standalone Financial Statements All amounts in Euro, unless otherwise stated
147
Financial instruments Category
according to IAS 39
Carrying Amt. March 31,
2015
Measurement according to IAS 39 Fair Value March 31,
2015 Not in Scope Amortised
cost At fair value
Assets
Other financial instruments LaR 306,284,443 306,284,443 - 306,284,443 - Receivables from associates LaR 1,492,852 1,492,852 - 1,492,852 - Other receivables and other assets LaR 9,975,088 9,706,249 - 9,706,249 268,839 Cash and cash equivalents LaR 62,569,337 62,569,337 - 62,569,337 -
Liabilities
Financial liabilities (non-current) FLAC 485,525,074 485,525,074 - 485,525,074 - Financial liabilities (current) FLAC 3,500,000 3,500,000 - 3,500,000 - Trade payable FLAC 2,691,055 2,691,055 - 2,691,055 - Other liabilities FLAC 6,029,004 4,947,473 - 4,947,473 1,081,531
Thereof: aggregated by category according to IAS 39
Loans and Receivables (LaR)
380,321,720 380,052,881 - 380,052,881 268,839 Financial liabilities measured at amortised cost (FLAC)
497,745,133 496,663,602 - 496,663,602 1,081,531
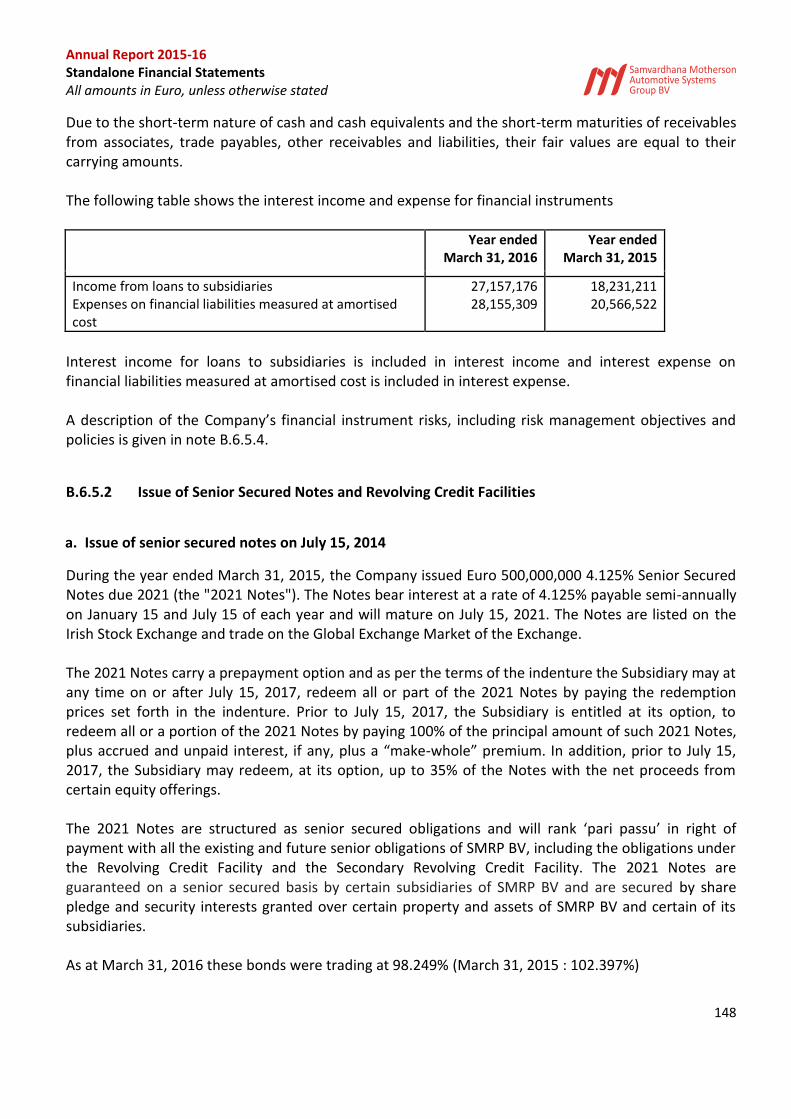
Annual Report 2015-16 Standalone Financial Statements All amounts in Euro, unless otherwise stated
148
Due to the short-term nature of cash and cash equivalents and the short-term maturities of receivables from associates, trade payables, other receivables and liabilities, their fair values are equal to their carrying amounts. The following table shows the interest income and expense for financial instruments
Year ended
March 31, 2016 Year ended
March 31, 2015
Income from loans to subsidiaries 27,157,176 18,231,211 Expenses on financial liabilities measured at amortised cost
28,155,309 20,566,522
Interest income for loans to subsidiaries is included in interest income and interest expense on financial liabilities measured at amortised cost is included in interest expense. A description of the Company’s financial instrument risks, including risk management objectives and policies is given in note B.6.5.4.
B.6.5.2 Issue of Senior Secured Notes and Revolving Credit Facilities
a. Issue of senior secured notes on July 15, 2014
During the year ended March 31, 2015, the Company issued Euro 500,000,000 4.125% Senior Secured Notes due 2021 (the "2021 Notes"). The Notes bear interest at a rate of 4.125% payable semi-annually on January 15 and July 15 of each year and will mature on July 15, 2021. The Notes are listed on the Irish Stock Exchange and trade on the Global Exchange Market of the Exchange. The 2021 Notes carry a prepayment option and as per the terms of the indenture the Subsidiary may at any time on or after July 15, 2017, redeem all or part of the 2021 Notes by paying the redemption prices set forth in the indenture. Prior to July 15, 2017, the Subsidiary is entitled at its option, to redeem all or a portion of the 2021 Notes by paying 100% of the principal amount of such 2021 Notes, plus accrued and unpaid interest, if any, plus a “make-whole” premium. In addition, prior to July 15, 2017, the Subsidiary may redeem, at its option, up to 35% of the Notes with the net proceeds from certain equity offerings. The 2021 Notes are structured as senior secured obligations and will rank ‘pari passu’ in right of payment with all the existing and future senior obligations of SMRP BV, including the obligations under the Revolving Credit Facility and the Secondary Revolving Credit Facility. The 2021 Notes are guaranteed on a senior secured basis by certain subsidiaries of SMRP BV and are secured by share pledge and security interests granted over certain property and assets of SMRP BV and certain of its subsidiaries. As at March 31, 2016 these bonds were trading at 98.249% (March 31, 2015 : 102.397%)
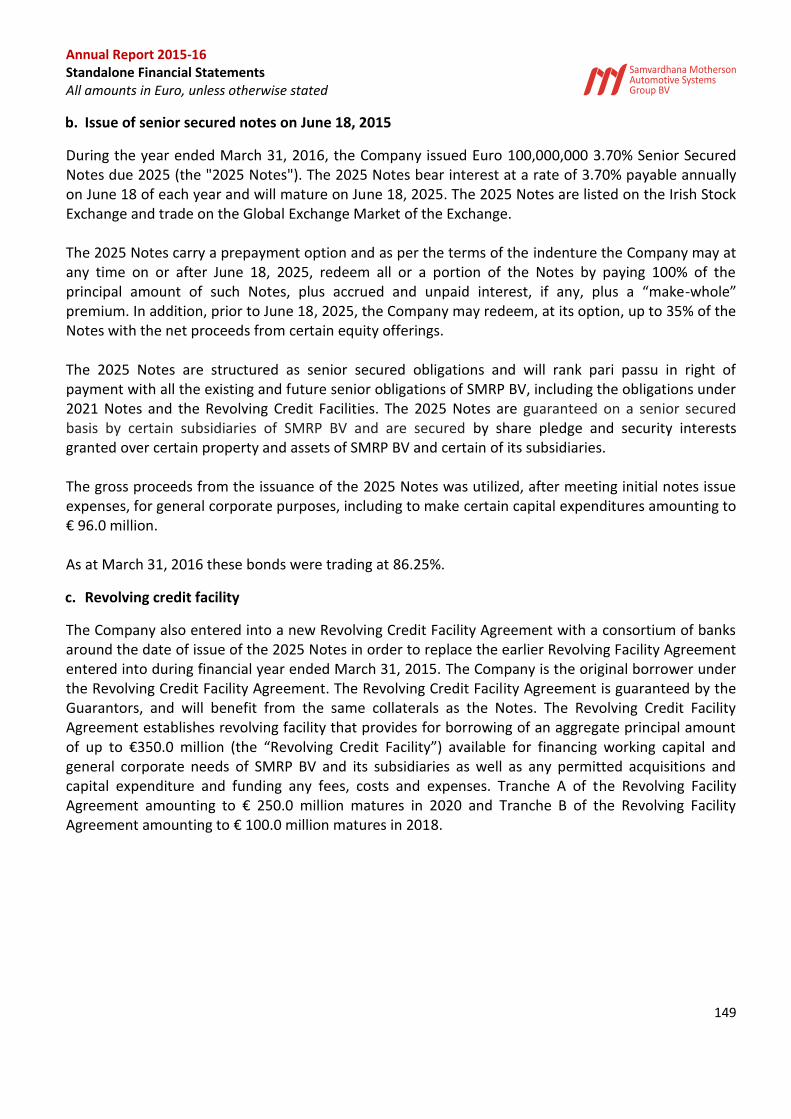
Annual Report 2015-16 Standalone Financial Statements All amounts in Euro, unless otherwise stated
149
b. Issue of senior secured notes on June 18, 2015
During the year ended March 31, 2016, the Company issued Euro 100,000,000 3.70% Senior Secured Notes due 2025 (the "2025 Notes"). The 2025 Notes bear interest at a rate of 3.70% payable annually on June 18 of each year and will mature on June 18, 2025. The 2025 Notes are listed on the Irish Stock Exchange and trade on the Global Exchange Market of the Exchange. The 2025 Notes carry a prepayment option and as per the terms of the indenture the Company may at any time on or after June 18, 2025, redeem all or a portion of the Notes by paying 100% of the principal amount of such Notes, plus accrued and unpaid interest, if any, plus a “make-whole” premium. In addition, prior to June 18, 2025, the Company may redeem, at its option, up to 35% of the Notes with the net proceeds from certain equity offerings. The 2025 Notes are structured as senior secured obligations and will rank pari passu in right of payment with all the existing and future senior obligations of SMRP BV, including the obligations under 2021 Notes and the Revolving Credit Facilities. The 2025 Notes are guaranteed on a senior secured basis by certain subsidiaries of SMRP BV and are secured by share pledge and security interests granted over certain property and assets of SMRP BV and certain of its subsidiaries. The gross proceeds from the issuance of the 2025 Notes was utilized, after meeting initial notes issue expenses, for general corporate purposes, including to make certain capital expenditures amounting to € 96.0 million. As at March 31, 2016 these bonds were trading at 86.25%.
c. Revolving credit facility
The Company also entered into a new Revolving Credit Facility Agreement with a consortium of banks around the date of issue of the 2025 Notes in order to replace the earlier Revolving Facility Agreement entered into during financial year ended March 31, 2015. The Company is the original borrower under the Revolving Credit Facility Agreement. The Revolving Credit Facility Agreement is guaranteed by the Guarantors, and will benefit from the same collaterals as the Notes. The Revolving Credit Facility Agreement establishes revolving facility that provides for borrowing of an aggregate principal amount of up to €350.0 million (the “Revolving Credit Facility”) available for financing working capital and general corporate needs of SMRP BV and its subsidiaries as well as any permitted acquisitions and capital expenditure and funding any fees, costs and expenses. Tranche A of the Revolving Facility Agreement amounting to € 250.0 million matures in 2020 and Tranche B of the Revolving Facility Agreement amounting to € 100.0 million matures in 2018.
Annual Report 2015-16 Standalone Financial Statements All amounts in Euro, unless otherwise stated
150
B.6.5.3 Contingent Liabilities
The Company has issued senior secured notes and entered into revolving credit facilities during the year. As per the terms of the agreement, the Company is the initial guarantor to these borrowings and has provided security of its assets along with assets of certain of its subsidiaries for these borrowings. Refer Note B.6.5.2 for details on the arrangement. There are no other contingent liabilities.
B.6.5.4 Risk management with respect to financial risks The Company’s primary financial assets and liabilities include loans given to its subsidiaries and borrowings from third parties. The Company’s financial assets like receivables, cash and cash equivalents arise directly out of these primary financial assets and liabilities. These financial instruments are potentially exposed to foreign currency risk, credit risk and liquidity risk. Information on how these risks arise is set out below, as are the objectives, policies and processes agreed by the board for their management and the methods used to measure each risk. The objective of the Company’s treasury is to manage the financial risk, secure cost-effective funding for the Company and its subsidiaries operations and to minimise the adverse effects of fluctuations in the financial markets on the value of the Company’s financial assets and liabilities, on reported profitability and on the cash flows of the Company. The treasury team is accountable to the board. The Company gives due consideration to its risk mitigation process and ensures that appropriate measures are taken to avoid, reduce and transfer or intentionally accept risk. During the period the Company did not enter into any complex financial instruments nor had established any hedge relationship. Credit risk Credit risk is the risk of financial loss to the Company due to counterparty’s failure to honour its obligations. Credit risk arises from cash and cash equivalents, trade and other receivables, loan to subsidiaries. For banks and financial institutions, the Company maintain relationships with only creditworthy banks which it reviews on an on-going basis. Consequently, the credit risk related to bank balances is not considered material. Loans given to subsidiaries, trade and other receivables represent balances with subsidiaries, accordingly no credit risk is perceived on these balances as well.
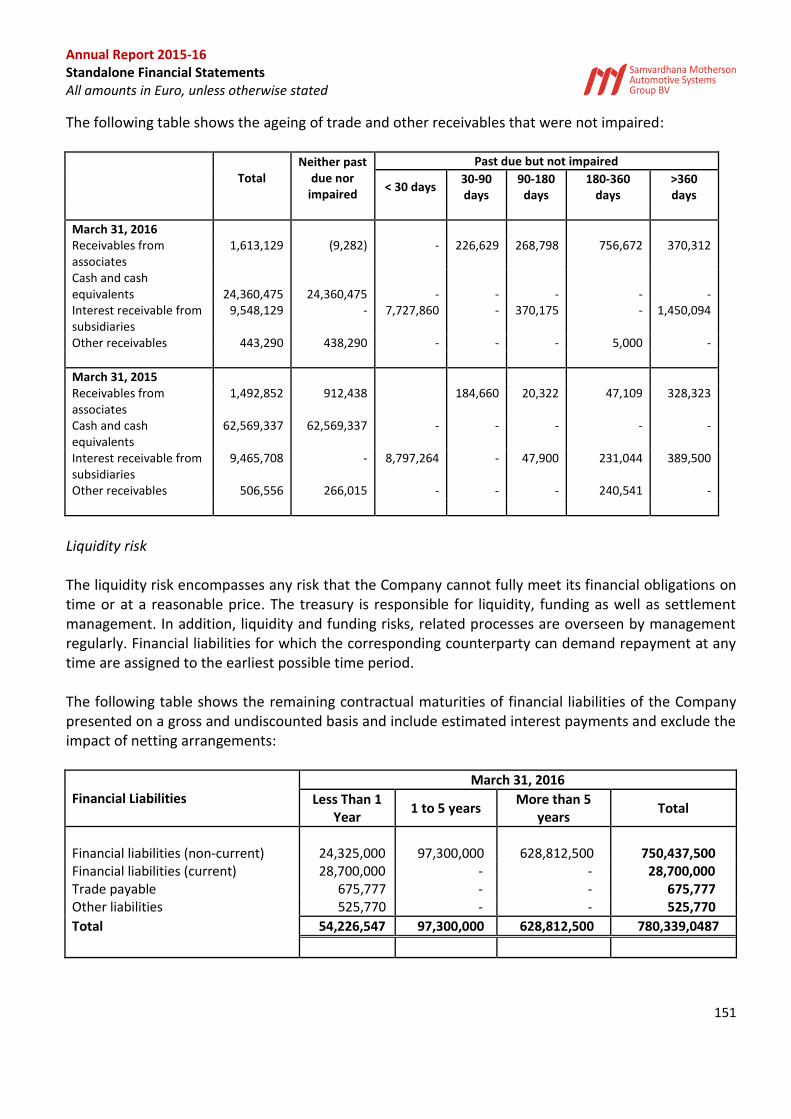
Annual Report 2015-16 Standalone Financial Statements All amounts in Euro, unless otherwise stated
151
The following table shows the ageing of trade and other receivables that were not impaired:
Total
Neither past due nor
impaired
Past due but not impaired
< 30 days 30-90 days
90-180 days
180-360 days
>360 days
March 31, 2016
Receivables from associates
1,613,129 (9,282) - 226,629 268,798 756,672 370,312
Cash and cash equivalents 24,360,475 24,360,475 - - - - - Interest receivable from subsidiaries
9,548,129 - 7,727,860 - 370,175 - 1,450,094
Other receivables 443,290 438,290 - - - 5,000 -
March 31, 2015 Receivables from associates
1,492,852 912,438 184,660 20,322 47,109 328,323
Cash and cash equivalents
62,569,337 62,569,337 - - - - -
Interest receivable from subsidiaries
9,465,708 - 8,797,264 - 47,900 231,044 389,500
Other receivables 506,556 266,015 - - - 240,541 -
Liquidity risk The liquidity risk encompasses any risk that the Company cannot fully meet its financial obligations on time or at a reasonable price. The treasury is responsible for liquidity, funding as well as settlement management. In addition, liquidity and funding risks, related processes are overseen by management regularly. Financial liabilities for which the corresponding counterparty can demand repayment at any time are assigned to the earliest possible time period. The following table shows the remaining contractual maturities of financial liabilities of the Company presented on a gross and undiscounted basis and include estimated interest payments and exclude the impact of netting arrangements:
Financial Liabilities
March 31, 2016
Less Than 1 Year
1 to 5 years More than 5
years Total
Financial liabilities (non-current) 24,325,000 97,300,000 628,812,500 750,437,500 Financial liabilities (current) 28,700,000 - - 28,700,000 Trade payable 675,777 - - 675,777 Other liabilities 525,770 - - 525,770
Total 54,226,547 97,300,000 628,812,500 780,339,0487
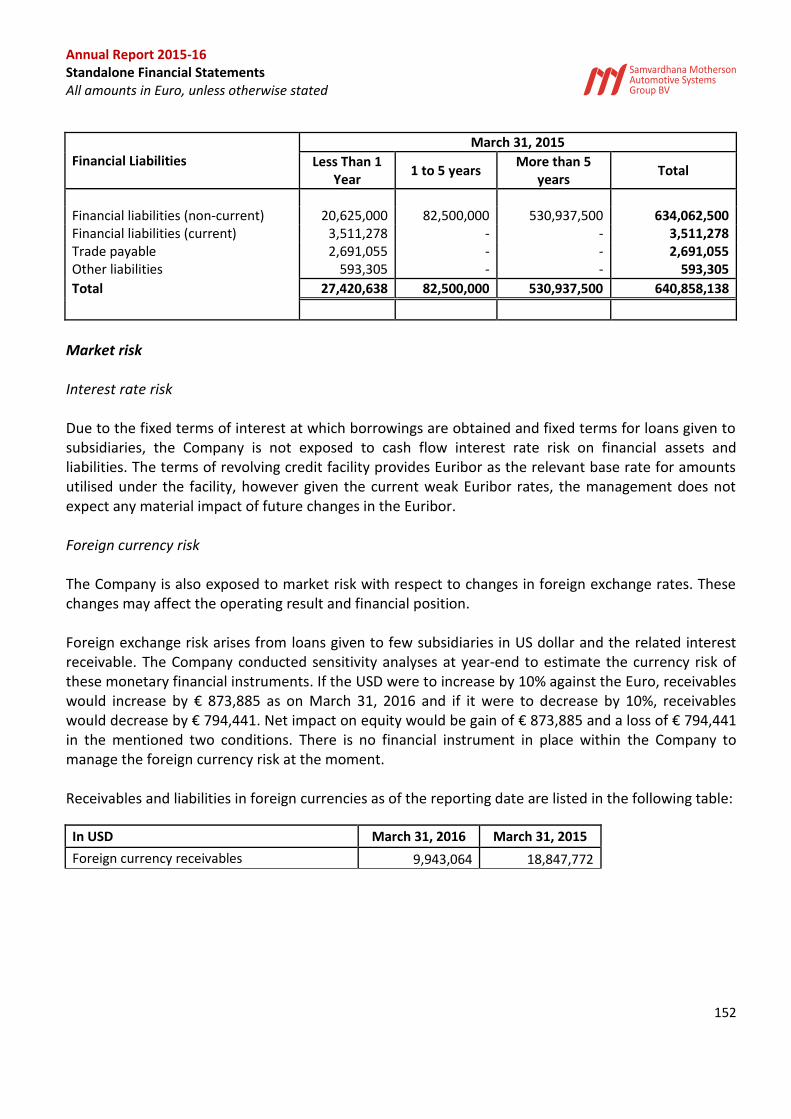
Annual Report 2015-16 Standalone Financial Statements All amounts in Euro, unless otherwise stated
152
Financial Liabilities
March 31, 2015
Less Than 1 Year
1 to 5 years More than 5
years Total
Financial liabilities (non-current) 20,625,000 82,500,000 530,937,500 634,062,500 Financial liabilities (current) 3,511,278 - - 3,511,278 Trade payable 2,691,055 - - 2,691,055 Other liabilities 593,305 - - 593,305
Total 27,420,638 82,500,000 530,937,500 640,858,138
Market risk Interest rate risk Due to the fixed terms of interest at which borrowings are obtained and fixed terms for loans given to subsidiaries, the Company is not exposed to cash flow interest rate risk on financial assets and liabilities. The terms of revolving credit facility provides Euribor as the relevant base rate for amounts utilised under the facility, however given the current weak Euribor rates, the management does not expect any material impact of future changes in the Euribor. Foreign currency risk The Company is also exposed to market risk with respect to changes in foreign exchange rates. These changes may affect the operating result and financial position. Foreign exchange risk arises from loans given to few subsidiaries in US dollar and the related interest receivable. The Company conducted sensitivity analyses at year-end to estimate the currency risk of these monetary financial instruments. If the USD were to increase by 10% against the Euro, receivables would increase by € 873,885 as on March 31, 2016 and if it were to decrease by 10%, receivables would decrease by € 794,441. Net impact on equity would be gain of € 873,885 and a loss of € 794,441 in the mentioned two conditions. There is no financial instrument in place within the Company to manage the foreign currency risk at the moment. Receivables and liabilities in foreign currencies as of the reporting date are listed in the following table:
In USD March 31, 2016 March 31, 2015
Foreign currency receivables 9,943,064 18,847,772
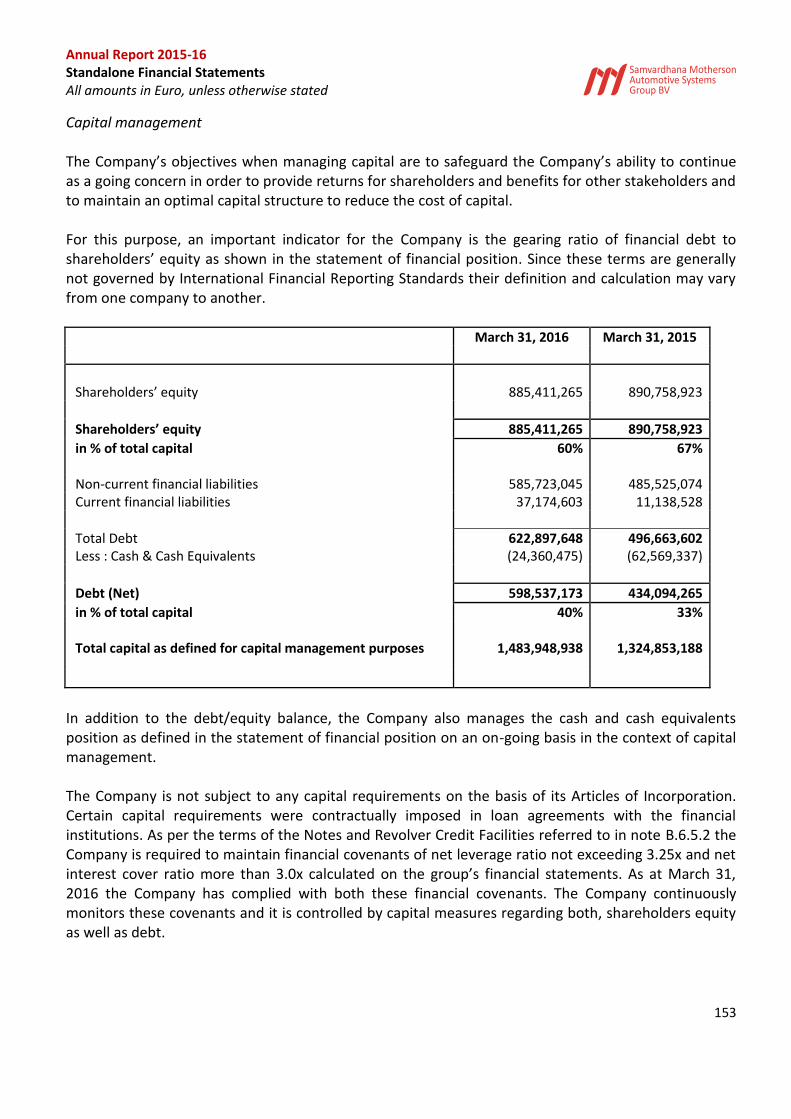
Annual Report 2015-16 Standalone Financial Statements All amounts in Euro, unless otherwise stated
153
Capital management The Company’s objectives when managing capital are to safeguard the Company’s ability to continue as a going concern in order to provide returns for shareholders and benefits for other stakeholders and to maintain an optimal capital structure to reduce the cost of capital. For this purpose, an important indicator for the Company is the gearing ratio of financial debt to shareholders’ equity as shown in the statement of financial position. Since these terms are generally not governed by International Financial Reporting Standards their definition and calculation may vary from one company to another. March 31, 2016 March 31, 2015
Shareholders’ equity 885,411,265 890,758,923
Shareholders’ equity 885,411,265 890,758,923
in % of total capital 60% 67% Non-current financial liabilities 585,723,045 485,525,074 Current financial liabilities 37,174,603 11,138,528
Total Debt 622,897,648 496,663,602 Less : Cash & Cash Equivalents (24,360,475) (62,569,337)
Debt (Net) 598,537,173 434,094,265
in % of total capital 40% 33% Total capital as defined for capital management purposes 1,483,948,938 1,324,853,188
In addition to the debt/equity balance, the Company also manages the cash and cash equivalents position as defined in the statement of financial position on an on-going basis in the context of capital management. The Company is not subject to any capital requirements on the basis of its Articles of Incorporation. Certain capital requirements were contractually imposed in loan agreements with the financial institutions. As per the terms of the Notes and Revolver Credit Facilities referred to in note B.6.5.2 the Company is required to maintain financial covenants of net leverage ratio not exceeding 3.25x and net interest cover ratio more than 3.0x calculated on the group’s financial statements. As at March 31, 2016 the Company has complied with both these financial covenants. The Company continuously monitors these covenants and it is controlled by capital measures regarding both, shareholders equity as well as debt.
Annual Report 2015-16 Standalone Financial Statements All amounts in Euro, unless otherwise stated
154
B.6.5.5 Related parties During the year the Company entered into transactions, in the ordinary course of business, with related parties. Transactions entered into, include the sale and purchase of goods and services. In addition, financing transactions have been undertaken. Entities with significant influence over the Company Samvardhana Motherson Global Holdings Limited, Cyprus, the direct parent company of Samvardhana Motherson Automotive Systems Group B.V holds 69% of the voting shares of the Company. Samvardhana Motherson Polymers Limited, India holds 31% of the voting shares of SMRP BV. Samvardhana Motherson Global Holdings Limited and Samvardhana Motherson Polymers Limited itself is indirectly held by both MSSL, India, which prepares financial statements available for public use and by SMIL India. MSSL and SMIL are referred to as the substantial shareholders of the Company. SMIL is owned by Mr. V.C. Sehgal and family. SMIL holds an equity interest (36.93%) in MSSL. As a result, MSSL and SMIL and its direct and indirect held subsidiaries, except for the companies forming the subgroup of Samvardhana Motherson Automotive Systems Group B.V are considered as related parties.
Key Management Personnel (KMP) Key management includes directors (executive and non-executive), members of the Supervisory Board.
None of the KMP receives their remuneration from the Company as they are either the shareholders of
substantial shareholders of the Company or these have operational role in other group companies and
draw their remuneration from those companies and for which no recharge is made as their services to
SMRP BV is considered incidental to their wider role.
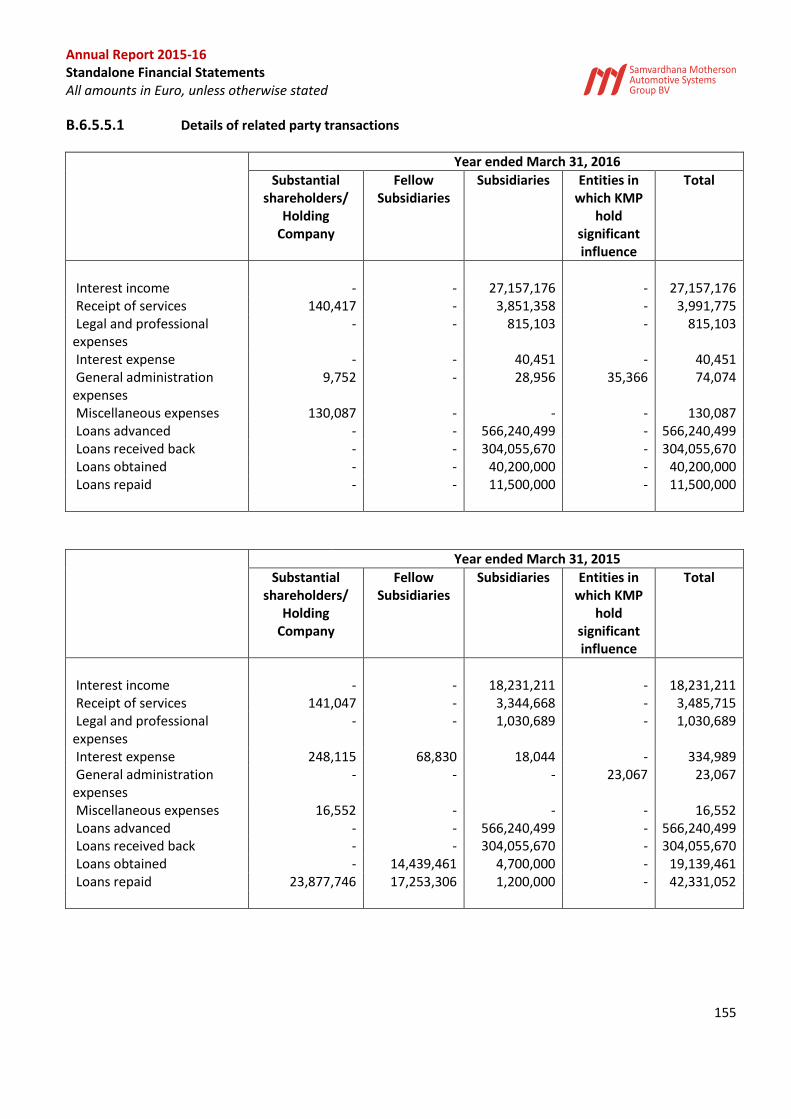
Annual Report 2015-16 Standalone Financial Statements All amounts in Euro, unless otherwise stated
155
B.6.5.5.1 Details of related party transactions
Year ended March 31, 2016
Substantial shareholders/
Holding Company
Fellow Subsidiaries
Subsidiaries Entities in which KMP
hold significant influence
Total
Interest income - - 27,157,176 - 27,157,176 Receipt of services 140,417 - 3,851,358 - 3,991,775 Legal and professional expenses
- - 815,103 - 815,103
Interest expense - - 40,451 - 40,451 General administration expenses
9,752 - 28,956 35,366 74,074
Miscellaneous expenses 130,087 - - - 130,087 Loans advanced - - 566,240,499 - 566,240,499 Loans received back - - 304,055,670 - 304,055,670 Loans obtained - - 40,200,000 - 40,200,000 Loans repaid - - 11,500,000 - 11,500,000
Year ended March 31, 2015
Substantial shareholders/
Holding Company
Fellow Subsidiaries
Subsidiaries Entities in which KMP
hold significant influence
Total
Interest income - - 18,231,211 - 18,231,211 Receipt of services 141,047 - 3,344,668 - 3,485,715 Legal and professional expenses
- - 1,030,689 - 1,030,689
Interest expense 248,115 68,830 18,044 - 334,989 General administration expenses
- - - 23,067 23,067
Miscellaneous expenses 16,552 - - - 16,552 Loans advanced - - 566,240,499 - 566,240,499 Loans received back - - 304,055,670 - 304,055,670 Loans obtained - 14,439,461 4,700,000 - 19,139,461 Loans repaid 23,877,746 17,253,306 1,200,000 - 42,331,052
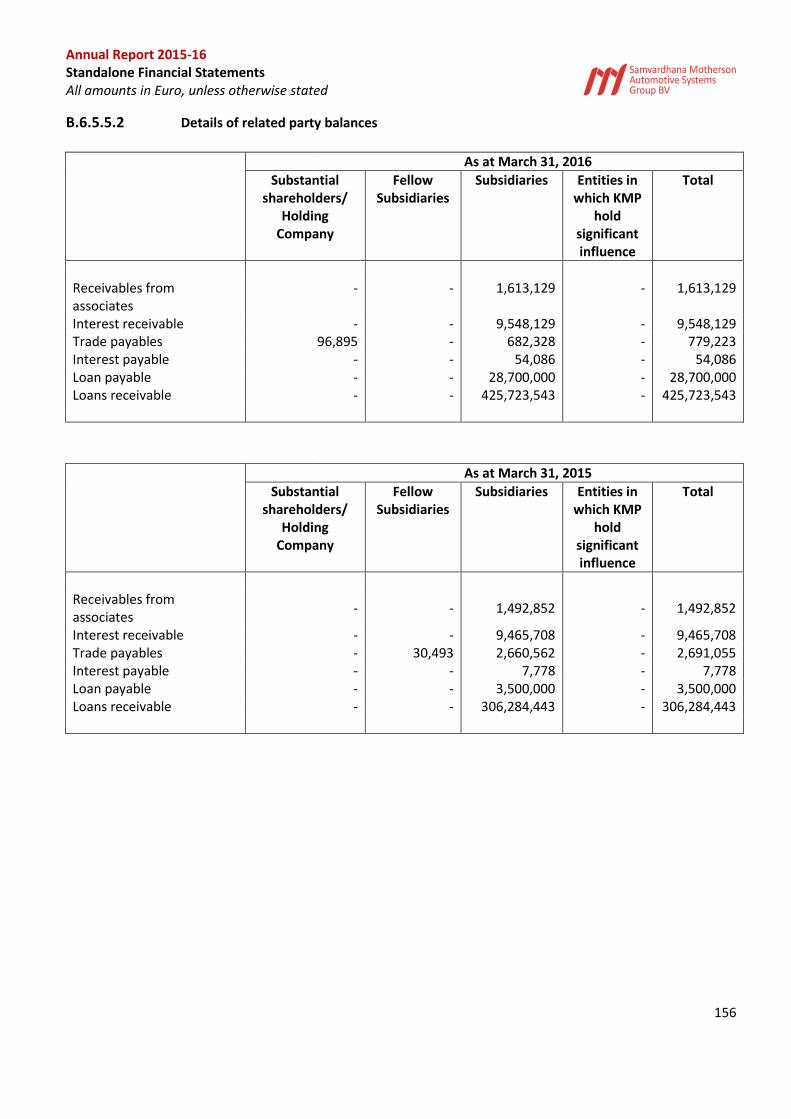
Annual Report 2015-16 Standalone Financial Statements All amounts in Euro, unless otherwise stated
156
B.6.5.5.2 Details of related party balances
As at March 31, 2016
Substantial shareholders/
Holding Company
Fellow Subsidiaries
Subsidiaries Entities in which KMP
hold significant influence
Total
Receivables from associates
- - 1,613,129 - 1,613,129
Interest receivable - - 9,548,129 - 9,548,129 Trade payables 96,895 - 682,328 - 779,223 Interest payable - - 54,086 - 54,086 Loan payable - - 28,700,000 - 28,700,000 Loans receivable - - 425,723,543 - 425,723,543
As at March 31, 2015
Substantial shareholders/
Holding Company
Fellow Subsidiaries
Subsidiaries Entities in which KMP
hold significant influence
Total
Receivables from associates
- - 1,492,852 - 1,492,852
Interest receivable - - 9,465,708 - 9,465,708 Trade payables - 30,493 2,660,562 - 2,691,055 Interest payable - - 7,778 - 7,778 Loan payable - - 3,500,000 - 3,500,000 Loans receivable - - 306,284,443 - 306,284,443
Annual Report 2015-16 Standalone Financial Statements All amounts in Euro, unless otherwise stated
157
B.6.6 Accounting estimates and evaluations
The Company makes estimates and assumptions concerning the future. The resulting accounting estimates will, by definition, seldom equal the related actual results. The estimates and assumptions that have a significant risk of causing a material adjustment to the carrying amounts of assets and liabilities within the next financial year are addressed below:
Impairment of financial fixed assets:
The company uses its judgement to perform the impairment testing on the bases of estimated discounted future cash flows. Details on the impairment testing can be found in note B.6.3.2. The actual results may differ from these estimates. The estimates and the underlying assumptions are constantly assessed. Revisions of estimates are recognised in the period in which the estimate is revised and in future periods for which the revision has consequences.
B.6.7 Subsequent Events
There is no significant/ material post balance sheet event.
Signing of the financial statements
Mr. Jacob Meint Buit
Mr. Randolph Marie Thaddeus De Cuba (Managing Director)
(Managing Director)
Amsterdam, May 27, 2016
Amsterdam, May 27, 2016
Mr. Laksh Vaaman Sehgal
Mr. Andreas Heuser (Managing Director)
(Managing Director)
Amsterdam, May 27, 2016
Amsterdam, May 27, 2016
Annual Report 2015-16 Standalone Financial Statements All amounts in Euro, unless otherwise stated
158
Signing of the financial statements
Mr. Cezary Zawadzinski
Mr. Bimal Dhar (Member of Supervisory Board)
(Member of Supervisory Board)
Amsterdam, May 27, 2016
Amsterdam, May 27, 2016
Mr. Kunal Malani
Mr. G.N. Gauba (Member of Supervisory Board)
(Member of Supervisory Board)
Amsterdam, May 27, 2016
Amsterdam, May 27, 2016
Mr. Vivek Chaand Sehgal
(Member of Supervisory Board)
Amsterdam, May 27, 2016