Embed Size (px)
Citation preview
Sector: Auto Ancillary
Sector view: Positive
Sensex: 18,902
52 Week h/l (Rs): 180 / 86
Market cap (Rscr) : 9,550
6m Avg vol (‘000Nos): 482
Bloomberg code: MSS IB
BSE code: 517334
NSE code: MOTHERSUMI
FV (Re): 1
Price as on Nov 19, 2012
Company rating grid
Low High
1 2 3 4 5
Earnings Growth
Cash Flow
B/S Strength
Valuation appeal
Risk
Share price trend
75
95
115
135
155
175
Nov‐11 Mar‐12 Jul‐12 Nov‐12
Motherson Sensex
Share holding pattern
‐
20
40
60
80
100
Dec‐11 Mar‐12 Jun‐12 Sep‐12
Promoters Institutions Others%
Change in Estimates Rating Target
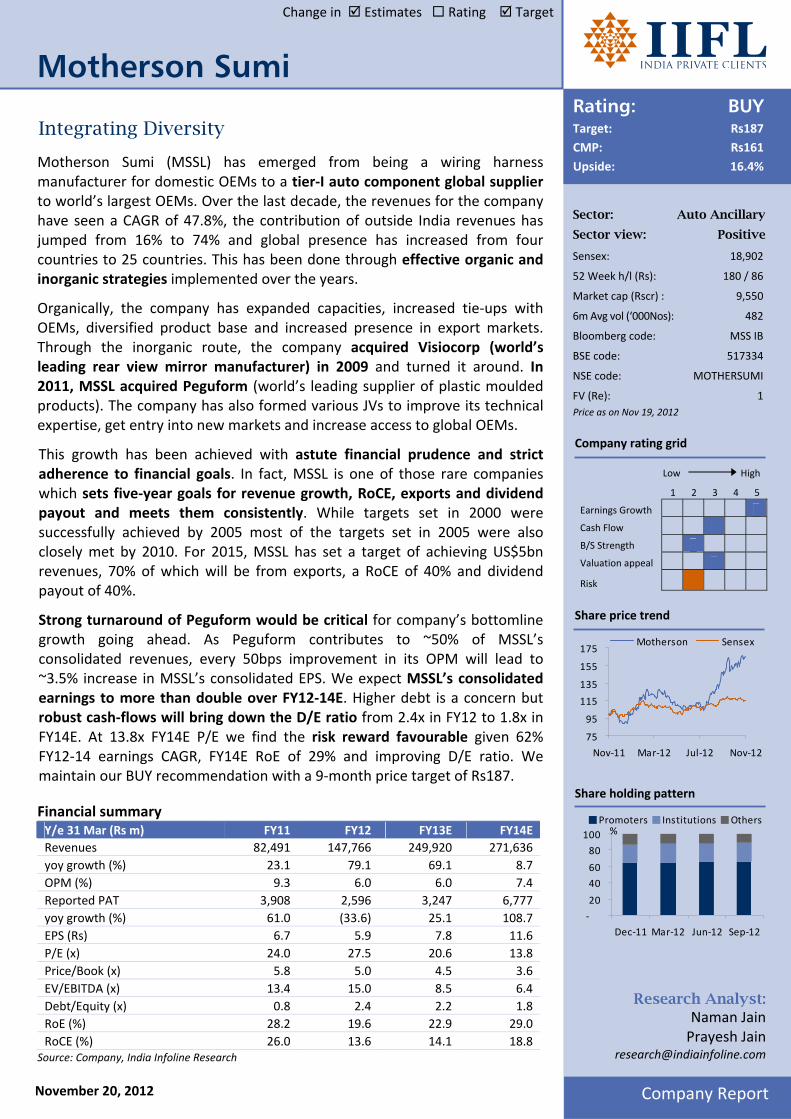
Rating: BUY Target: Rs187
CMP: Rs161
Upside: 16.4%
Company Report November 20, 2012
Research Analyst: Naman Jain Prayesh Jain
Integrating Diversity
Motherson Sumi (MSSL) has emerged from being a wiring harness manufacturer for domestic OEMs to a tier‐I auto component global supplier to world’s largest OEMs. Over the last decade, the revenues for the company have seen a CAGR of 47.8%, the contribution of outside India revenues has jumped from 16% to 74% and global presence has increased from four countries to 25 countries. This has been done through effective organic and inorganic strategies implemented over the years.
Organically, the company has expanded capacities, increased tie‐ups with OEMs, diversified product base and increased presence in export markets. Through the inorganic route, the company acquired Visiocorp (world’s leading rear view mirror manufacturer) in 2009 and turned it around. In 2011, MSSL acquired Peguform (world’s leading supplier of plastic moulded products). The company has also formed various JVs to improve its technical expertise, get entry into new markets and increase access to global OEMs.
This growth has been achieved with astute financial prudence and strict adherence to financial goals. In fact, MSSL is one of those rare companies which sets five‐year goals for revenue growth, RoCE, exports and dividend payout and meets them consistently. While targets set in 2000 were successfully achieved by 2005 most of the targets set in 2005 were also closely met by 2010. For 2015, MSSL has set a target of achieving US$5bn revenues, 70% of which will be from exports, a RoCE of 40% and dividend payout of 40%.
Strong turnaround of Peguform would be critical for company’s bottomline growth going ahead. As Peguform contributes to ~50% of MSSL’s consolidated revenues, every 50bps improvement in its OPM will lead to ~3.5% increase in MSSL’s consolidated EPS. We expect MSSL’s consolidated earnings to more than double over FY12‐14E. Higher debt is a concern but robust cash‐flows will bring down the D/E ratio from 2.4x in FY12 to 1.8x in FY14E. At 13.8x FY14E P/E we find the risk reward favourable given 62% FY12‐14 earnings CAGR, FY14E RoE of 29% and improving D/E ratio. We maintain our BUY recommendation with a 9‐month price target of Rs187.
Financial summary Y/e 31 Mar (Rs m) FY11 FY12 FY13E FY14E
Revenues 82,491 147,766 249,920 271,636
yoy growth (%) 23.1 79.1 69.1 8.7
OPM (%) 9.3 6.0 6.0 7.4
Reported PAT 3,908 2,596 3,247 6,777
yoy growth (%) 61.0 (33.6) 25.1 108.7
EPS (Rs) 6.7 5.9 7.8 11.6
P/E (x) 24.0 27.5 20.6 13.8
Price/Book (x) 5.8 5.0 4.5 3.6
EV/EBITDA (x) 13.4 15.0 8.5 6.4
Debt/Equity (x) 0.8 2.4 2.2 1.8
RoE (%) 28.2 19.6 22.9 29.0
RoCE (%) 26.0 13.6 14.1 18.8 Source: Company, India Infoline Research
Motherson Sumi
Motherson Sumi
2
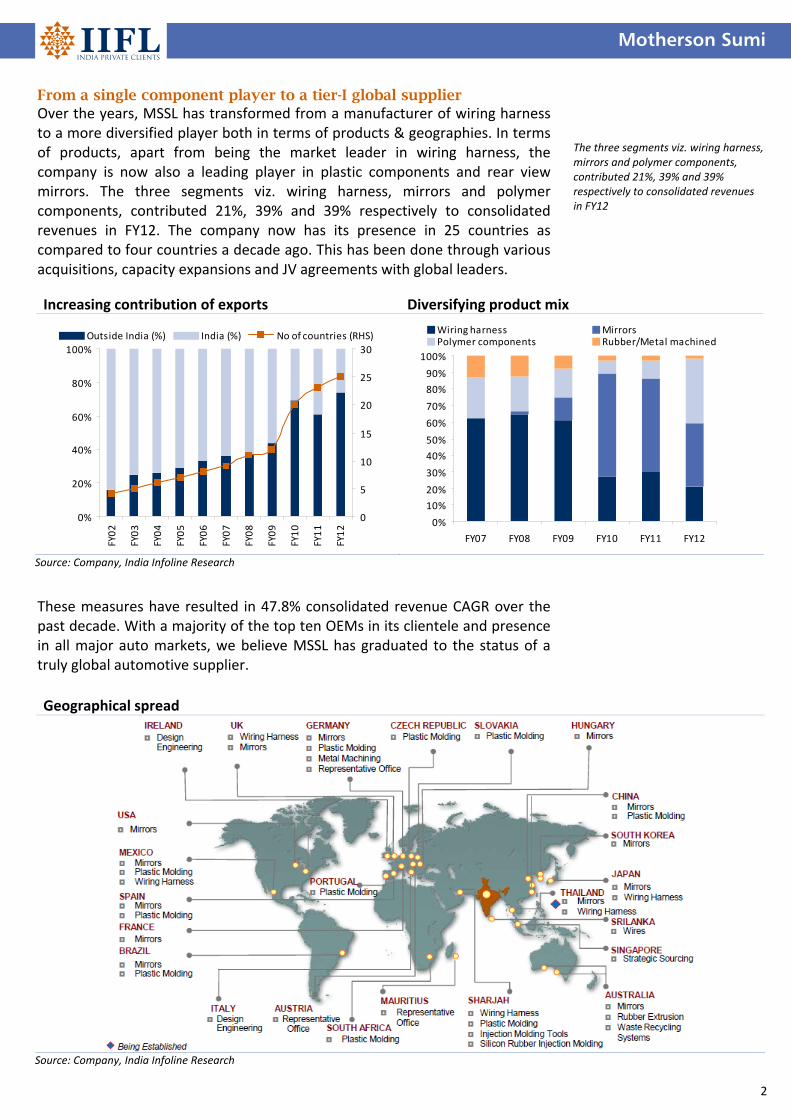
From a single component player to a tier-I global supplier Over the years, MSSL has transformed from a manufacturer of wiring harness to a more diversified player both in terms of products & geographies. In terms of products, apart from being the market leader in wiring harness, the company is now also a leading player in plastic components and rear view mirrors. The three segments viz. wiring harness, mirrors and polymer components, contributed 21%, 39% and 39% respectively to consolidated revenues in FY12. The company now has its presence in 25 countries as compared to four countries a decade ago. This has been done through various acquisitions, capacity expansions and JV agreements with global leaders.
These measures have resulted in 47.8% consolidated revenue CAGR over the past decade. With a majority of the top ten OEMs in its clientele and presence in all major auto markets, we believe MSSL has graduated to the status of a truly global automotive supplier.
The three segments viz. wiring harness, mirrors and polymer components, contributed 21%, 39% and 39% respectively to consolidated revenues in FY12
Geographical spread
Source: Company, India Infoline Research
Increasing contribution of exports Diversifying product mix
0%
20%
40%
60%
80%
100%
FY02
FY03
FY04
FY05
FY06
FY07
FY08
FY09
FY10
FY11
FY12
0
5
10
15
20
25
30
Outside India (%) India (%) No of countries (RHS)
0%
10%
20%
30%
40%
50%
60%
70%
80%
90%
100%
FY07 FY08 FY09 FY10 FY11 FY12
Wiring harness MirrorsPolymer components Rubber/Metal machined
Source: Company, India Infoline Research
Motherson Sumi
3
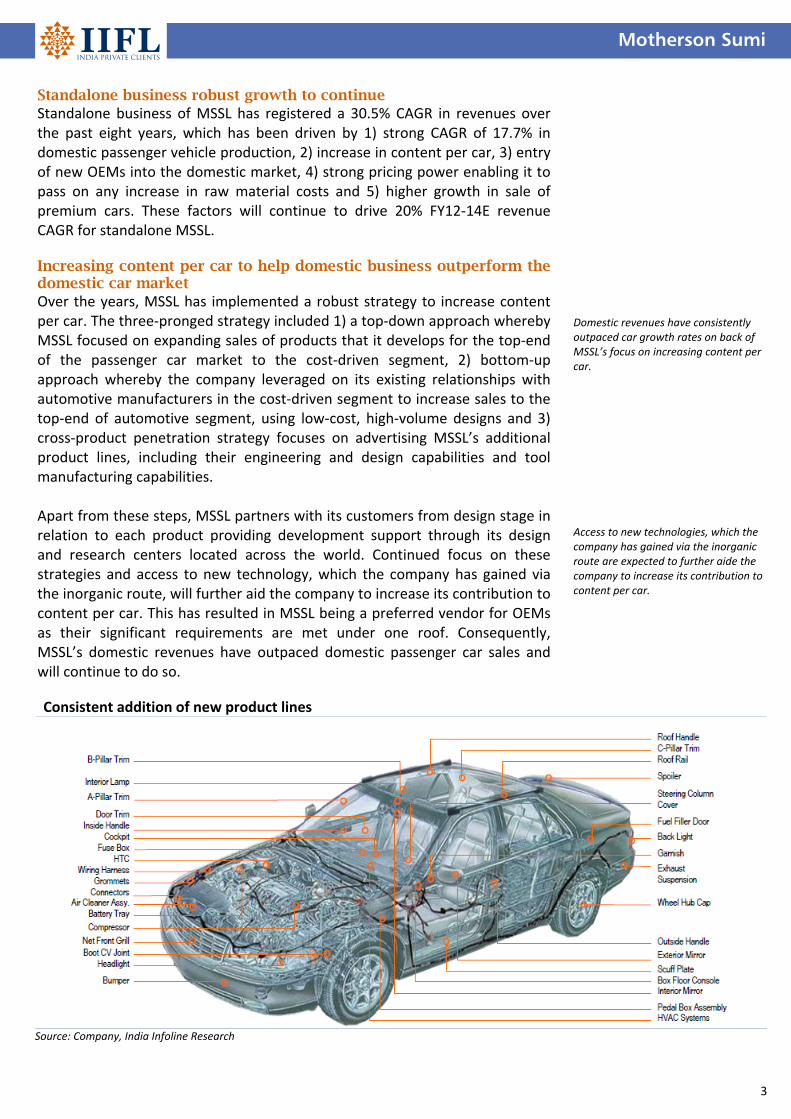
Standalone business robust growth to continue Standalone business of MSSL has registered a 30.5% CAGR in revenues over the past eight years, which has been driven by 1) strong CAGR of 17.7% in domestic passenger vehicle production, 2) increase in content per car, 3) entry of new OEMs into the domestic market, 4) strong pricing power enabling it to pass on any increase in raw material costs and 5) higher growth in sale of premium cars. These factors will continue to drive 20% FY12‐14E revenue CAGR for standalone MSSL. Increasing content per car to help domestic business outperform the domestic car market Over the years, MSSL has implemented a robust strategy to increase content per car. The three‐pronged strategy included 1) a top‐down approach whereby MSSL focused on expanding sales of products that it develops for the top‐end of the passenger car market to the cost‐driven segment, 2) bottom‐up approach whereby the company leveraged on its existing relationships with automotive manufacturers in the cost‐driven segment to increase sales to the top‐end of automotive segment, using low‐cost, high‐volume designs and 3) cross‐product penetration strategy focuses on advertising MSSL’s additional product lines, including their engineering and design capabilities and tool manufacturing capabilities. Apart from these steps, MSSL partners with its customers from design stage in relation to each product providing development support through its design and research centers located across the world. Continued focus on these strategies and access to new technology, which the company has gained via the inorganic route, will further aid the company to increase its contribution to content per car. This has resulted in MSSL being a preferred vendor for OEMs as their significant requirements are met under one roof. Consequently, MSSL’s domestic revenues have outpaced domestic passenger car sales and will continue to do so.
Domestic revenues have consistently outpaced car growth rates on back of MSSL’s focus on increasing content per car.
Access to new technologies, which the company has gained via the inorganic route are expected to further aide the company to increase its contribution to content per car.
Consistent addition of new product lines
Source: Company, India Infoline Research
Motherson Sumi
4
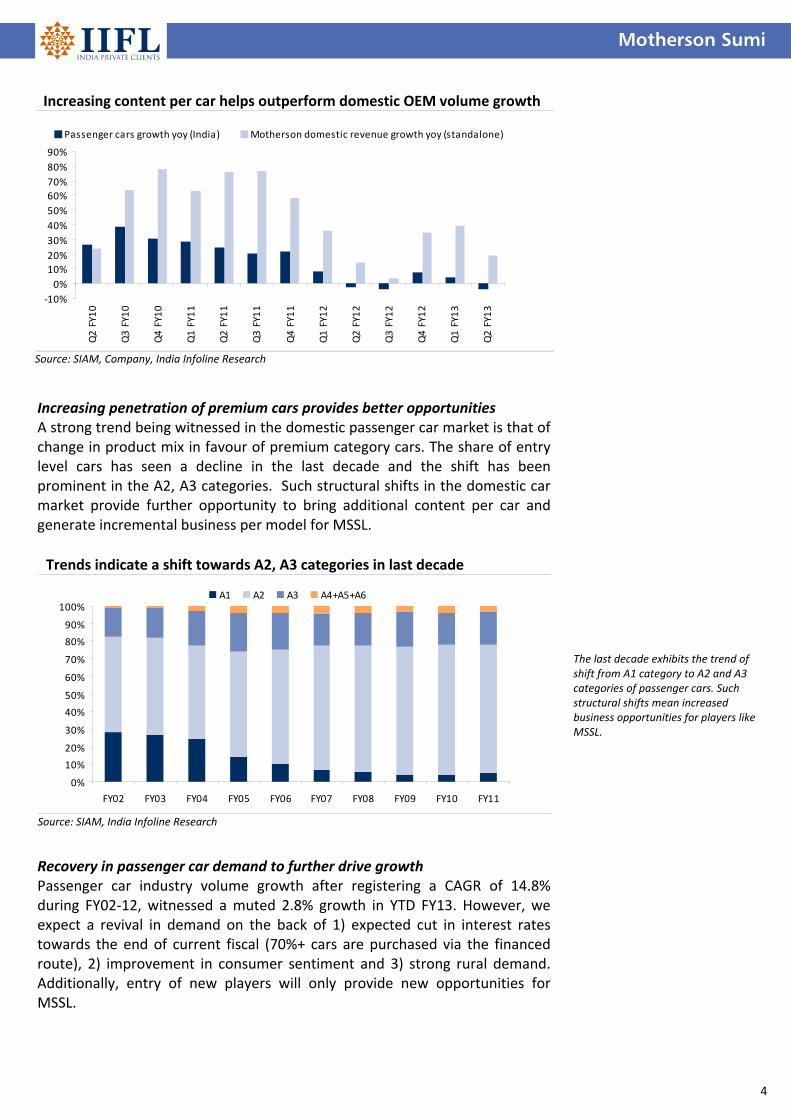
Increasing content per car helps outperform domestic OEM volume growth
‐10%
0%
10%
20%
30%
40%
50%
60%
70%
80%
90%
Q2 FY10
Q3 FY10
Q4 FY10
Q1 FY11
Q2 FY11
Q3 FY11
Q4 FY11
Q1 FY12
Q2 FY12
Q3 FY12
Q4 FY12
Q1 FY13
Q2 FY13
Passenger cars growth yoy (India) Motherson domestic revenue growth yoy (standalone)
Source: SIAM, Company, India Infoline Research
Increasing penetration of premium cars provides better opportunities A strong trend being witnessed in the domestic passenger car market is that of change in product mix in favour of premium category cars. The share of entry level cars has seen a decline in the last decade and the shift has been prominent in the A2, A3 categories. Such structural shifts in the domestic car market provide further opportunity to bring additional content per car and generate incremental business per model for MSSL.
Recovery in passenger car demand to further drive growth Passenger car industry volume growth after registering a CAGR of 14.8% during FY02‐12, witnessed a muted 2.8% growth in YTD FY13. However, we expect a revival in demand on the back of 1) expected cut in interest rates towards the end of current fiscal (70%+ cars are purchased via the financed route), 2) improvement in consumer sentiment and 3) strong rural demand. Additionally, entry of new players will only provide new opportunities for MSSL.
The last decade exhibits the trend of shift from A1 category to A2 and A3 categories of passenger cars. Such structural shifts mean increased business opportunities for players like MSSL.
Trends indicate a shift towards A2, A3 categories in last decade
0%
10%
20%
30%
40%
50%
60%
70%
80%
90%
100%
FY02 FY03 FY04 FY05 FY06 FY07 FY08 FY09 FY10 FY11
A1 A2 A3 A4+A5+A6
Source: SIAM, India Infoline Research
Motherson Sumi
5
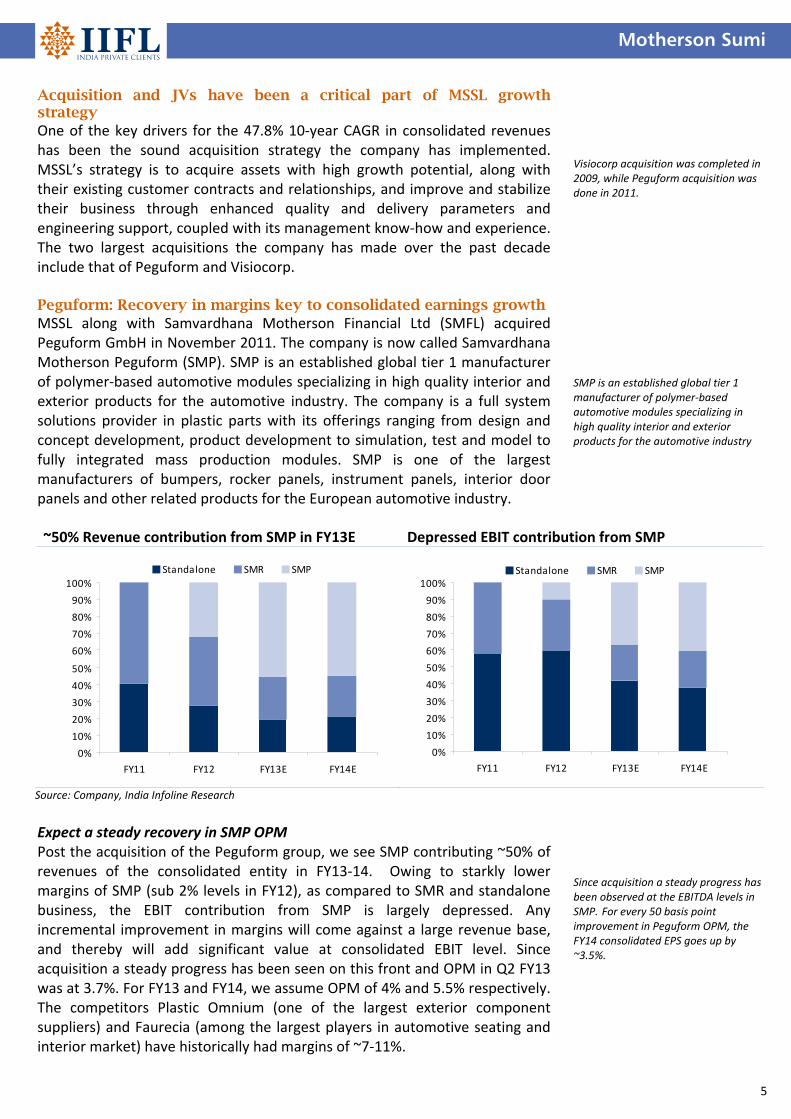
Acquisition and JVs have been a critical part of MSSL growth strategy One of the key drivers for the 47.8% 10‐year CAGR in consolidated revenues has been the sound acquisition strategy the company has implemented. MSSL’s strategy is to acquire assets with high growth potential, along with their existing customer contracts and relationships, and improve and stabilize their business through enhanced quality and delivery parameters and engineering support, coupled with its management know‐how and experience. The two largest acquisitions the company has made over the past decade include that of Peguform and Visiocorp. Peguform: Recovery in margins key to consolidated earnings growth MSSL along with Samvardhana Motherson Financial Ltd (SMFL) acquired Peguform GmbH in November 2011. The company is now called Samvardhana Motherson Peguform (SMP). SMP is an established global tier 1 manufacturer of polymer‐based automotive modules specializing in high quality interior and exterior products for the automotive industry. The company is a full system solutions provider in plastic parts with its offerings ranging from design and concept development, product development to simulation, test and model to fully integrated mass production modules. SMP is one of the largest manufacturers of bumpers, rocker panels, instrument panels, interior door panels and other related products for the European automotive industry.
Expect a steady recovery in SMP OPM Post the acquisition of the Peguform group, we see SMP contributing ~50% of revenues of the consolidated entity in FY13‐14. Owing to starkly lower margins of SMP (sub 2% levels in FY12), as compared to SMR and standalone business, the EBIT contribution from SMP is largely depressed. Any incremental improvement in margins will come against a large revenue base, and thereby will add significant value at consolidated EBIT level. Since acquisition a steady progress has been seen on this front and OPM in Q2 FY13 was at 3.7%. For FY13 and FY14, we assume OPM of 4% and 5.5% respectively. The competitors Plastic Omnium (one of the largest exterior component suppliers) and Faurecia (among the largest players in automotive seating and interior market) have historically had margins of ~7‐11%.
Visiocorp acquisition was completed in 2009, while Peguform acquisition was done in 2011. SMP is an established global tier 1 manufacturer of polymer‐based automotive modules specializing in high quality interior and exterior products for the automotive industry
Since acquisition a steady progress has been observed at the EBITDA levels in SMP. For every 50 basis point improvement in Peguform OPM, the FY14 consolidated EPS goes up by ~3.5%.
~50% Revenue contribution from SMP in FY13E Depressed EBIT contribution from SMP
0%
10%
20%
30%
40%
50%
60%
70%
80%
90%
100%
FY11 FY12 FY13E FY14E
Standalone SMR SMP
0%
10%
20%
30%
40%
50%
60%
70%
80%
90%
100%
FY11 FY12 FY13E FY14E
Standalone SMR SMP
Source: Company, India Infoline Research
Motherson Sumi
6
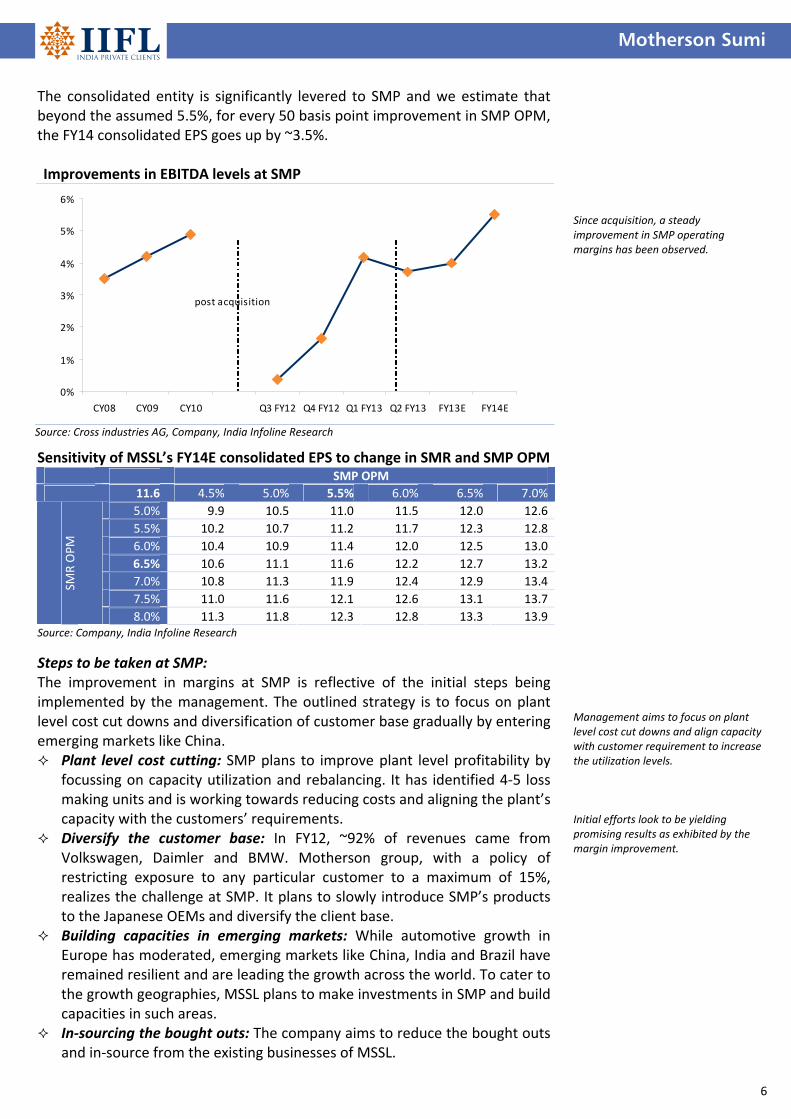
The consolidated entity is significantly levered to SMP and we estimate that beyond the assumed 5.5%, for every 50 basis point improvement in SMP OPM, the FY14 consolidated EPS goes up by ~3.5%.
Sensitivity of MSSL’s FY14E consolidated EPS to change in SMR and SMP OPM SMP OPM
11.6 4.5% 5.0% 5.5% 6.0% 6.5% 7.0%
5.0% 9.9 10.5 11.0 11.5 12.0 12.6
5.5% 10.2 10.7 11.2 11.7 12.3 12.8
6.0% 10.4 10.9 11.4 12.0 12.5 13.0
6.5% 10.6 11.1 11.6 12.2 12.7 13.2
7.0% 10.8 11.3 11.9 12.4 12.9 13.4
7.5% 11.0 11.6 12.1 12.6 13.1 13.7
SMR OPM
8.0% 11.3 11.8 12.3 12.8 13.3 13.9 Source: Company, India Infoline Research
Steps to be taken at SMP: The improvement in margins at SMP is reflective of the initial steps being implemented by the management. The outlined strategy is to focus on plant level cost cut downs and diversification of customer base gradually by entering emerging markets like China. Plant level cost cutting: SMP plans to improve plant level profitability by
focussing on capacity utilization and rebalancing. It has identified 4‐5 loss making units and is working towards reducing costs and aligning the plant’s capacity with the customers’ requirements.
Diversify the customer base: In FY12, ~92% of revenues came from Volkswagen, Daimler and BMW. Motherson group, with a policy of restricting exposure to any particular customer to a maximum of 15%, realizes the challenge at SMP. It plans to slowly introduce SMP’s products to the Japanese OEMs and diversify the client base.
Building capacities in emerging markets: While automotive growth in Europe has moderated, emerging markets like China, India and Brazil have remained resilient and are leading the growth across the world. To cater to the growth geographies, MSSL plans to make investments in SMP and build capacities in such areas.
In‐sourcing the bought outs: The company aims to reduce the bought outs and in‐source from the existing businesses of MSSL.
Since acquisition, a steady improvement in SMP operating margins has been observed. Management aims to focus on plant level cost cut downs and align capacity with customer requirement to increase the utilization levels. Initial efforts look to be yielding promising results as exhibited by the margin improvement.
Improvements in EBITDA levels at SMP
0%
1%
2%
3%
4%
5%
6%
CY08 CY09 CY10 Q3 FY12 Q4 FY12 Q1 FY13 Q2 FY13 FY13E FY14E
post acquisition
Source: Cross industries AG, Company, India Infoline Research
Motherson Sumi
7
Visiocorp: No looking back Post the acquisition of Visiocorp by MSSL and SMFL in 2009, SMR (Visiocorp business renamed) has seen steady growth in revenues driven by acquiring new clients, constant development of new products and entry into newer geographies. We believe, the demand growth trend is here to stay and SMR, with its efforts towards innovation, is well poised to serve this demand.
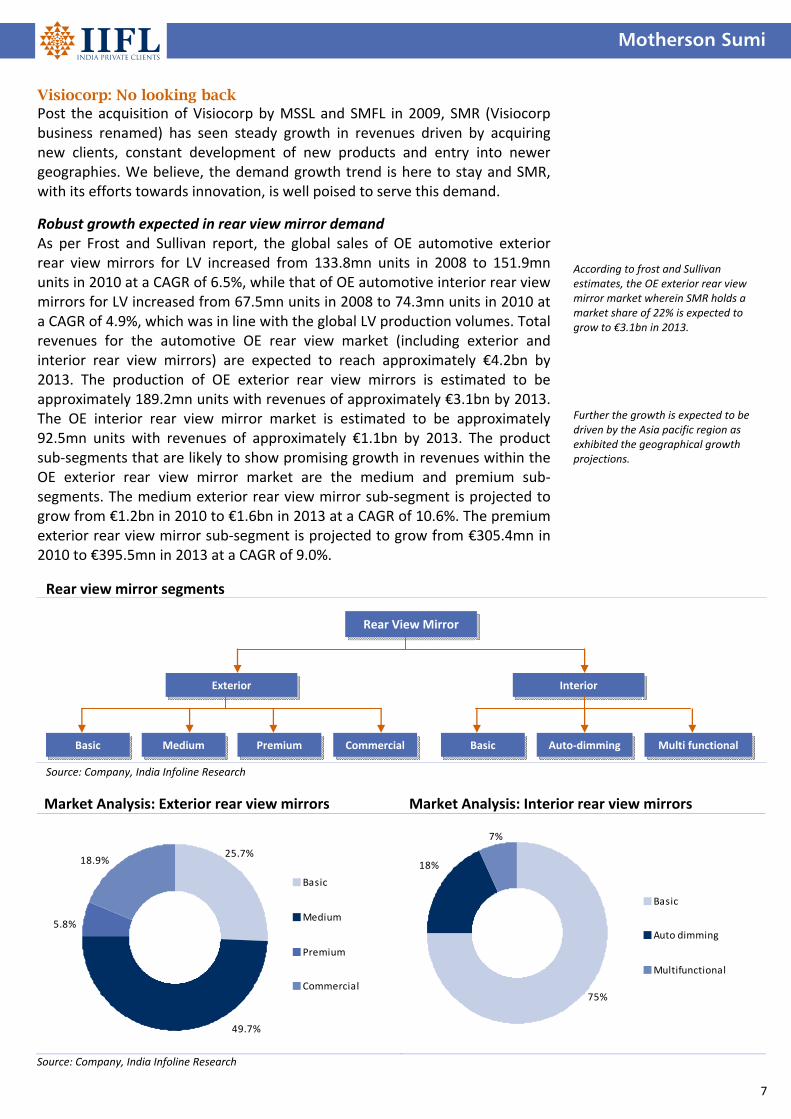
Robust growth expected in rear view mirror demand As per Frost and Sullivan report, the global sales of OE automotive exterior rear view mirrors for LV increased from 133.8mn units in 2008 to 151.9mn units in 2010 at a CAGR of 6.5%, while that of OE automotive interior rear view mirrors for LV increased from 67.5mn units in 2008 to 74.3mn units in 2010 at a CAGR of 4.9%, which was in line with the global LV production volumes. Total revenues for the automotive OE rear view market (including exterior and interior rear view mirrors) are expected to reach approximately €4.2bn by 2013. The production of OE exterior rear view mirrors is estimated to be approximately 189.2mn units with revenues of approximately €3.1bn by 2013. The OE interior rear view mirror market is estimated to be approximately 92.5mn units with revenues of approximately €1.1bn by 2013. The product sub‐segments that are likely to show promising growth in revenues within the OE exterior rear view mirror market are the medium and premium sub‐segments. The medium exterior rear view mirror sub‐segment is projected to grow from €1.2bn in 2010 to €1.6bn in 2013 at a CAGR of 10.6%. The premium exterior rear view mirror sub‐segment is projected to grow from €305.4mn in 2010 to €395.5mn in 2013 at a CAGR of 9.0%.
According to frost and Sullivan estimates, the OE exterior rear view mirror market wherein SMR holds a market share of 22% is expected to grow to €3.1bn in 2013. Further the growth is expected to be driven by the Asia pacific region as exhibited the geographical growth projections.
Market Analysis: Exterior rear view mirrors Market Analysis: Interior rear view mirrors
49.7%
5.8%
18.9%25.7%
Basic
Medium
Premium
Commercial
18%
7%
75%
Basic
Auto dimming
Multifunctional
Source: Company, India Infoline Research
Rear view mirror segments
Rear View Mirror
Exterior Interior
CommercialPremium Medium Basic Basic Auto‐dimming Multi functional
Source: Company, India Infoline Research
Motherson Sumi
8
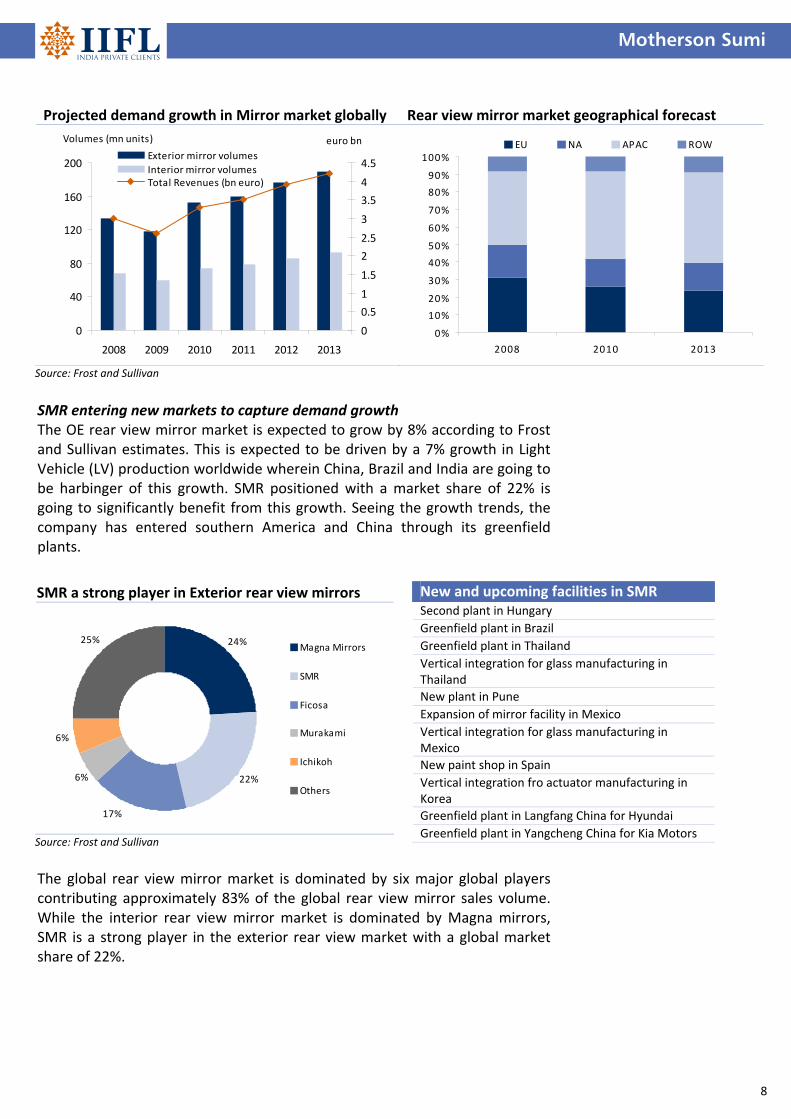
SMR entering new markets to capture demand growth The OE rear view mirror market is expected to grow by 8% according to Frost and Sullivan estimates. This is expected to be driven by a 7% growth in Light Vehicle (LV) production worldwide wherein China, Brazil and India are going to be harbinger of this growth. SMR positioned with a market share of 22% is going to significantly benefit from this growth. Seeing the growth trends, the company has entered southern America and China through its greenfield plants.
The global rear view mirror market is dominated by six major global players contributing approximately 83% of the global rear view mirror sales volume. While the interior rear view mirror market is dominated by Magna mirrors, SMR is a strong player in the exterior rear view market with a global market share of 22%.
Projected demand growth in Mirror market globally Rear view mirror market geographical forecast
0
40
80
120
160
200
2008 2009 2010 2011 2012 2013
0
0.5
1
1.5
2
2.5
3
3.5
4
4.5Exterior mirror volumes
Interior mirror volumesTotal Revenues (bn euro)
Volumes (mn units) euro bn
0%
10%
20%
30%
40%
50%
60%
70%
80%
90%
100%
2008 2010 2013
EU NA APAC ROW
Source: Frost and Sullivan
New and upcoming facilities in SMR Second plant in Hungary
Greenfield plant in Brazil
Greenfield plant in Thailand
Vertical integration for glass manufacturing in Thailand
New plant in Pune
Expansion of mirror facility in Mexico
Vertical integration for glass manufacturing in Mexico
New paint shop in Spain
Vertical integration fro actuator manufacturing in Korea
Greenfield plant in Langfang China for Hyundai
Greenfield plant in Yangcheng China for Kia Motors
SMR a strong player in Exterior rear view mirrors
17%
6%
6%
25% 24%
22%
Magna Mirrors
SMR
Ficosa
Murakami
Ichikoh
Others
Source: Frost and Sullivan
Motherson Sumi
9
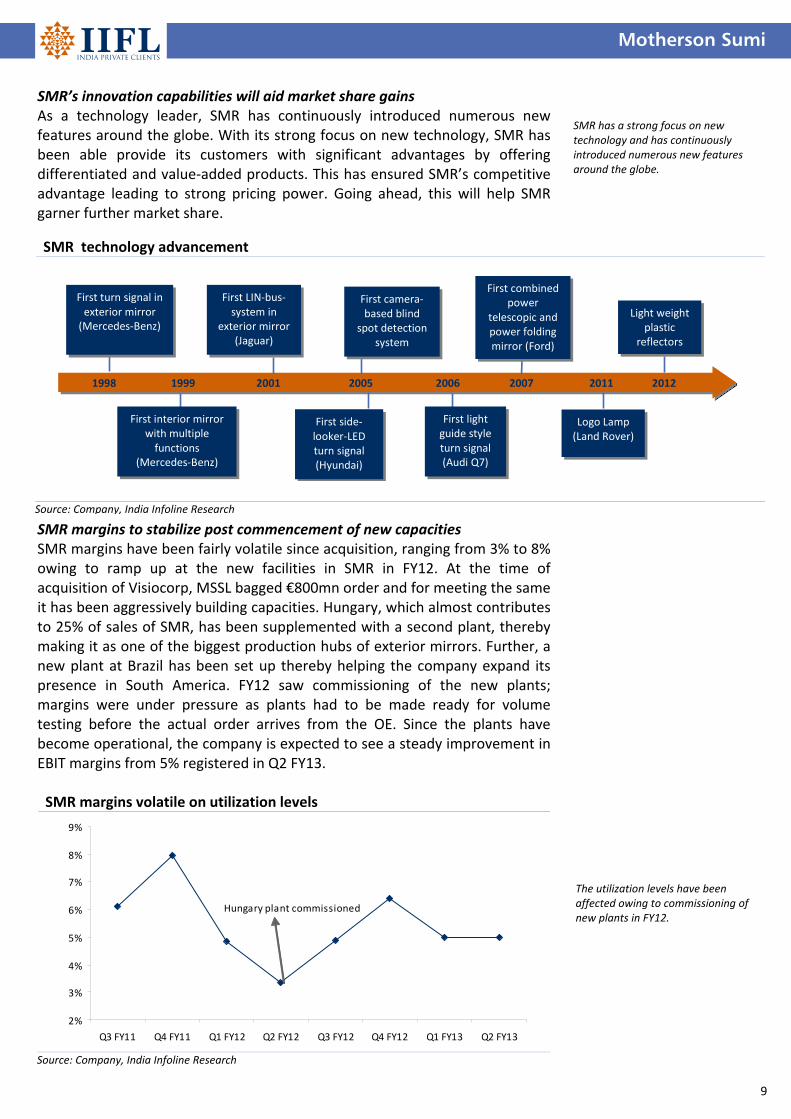
SMR’s innovation capabilities will aid market share gains As a technology leader, SMR has continuously introduced numerous new features around the globe. With its strong focus on new technology, SMR has been able provide its customers with significant advantages by offering differentiated and value‐added products. This has ensured SMR’s competitive advantage leading to strong pricing power. Going ahead, this will help SMR garner further market share.
SMR margins to stabilize post commencement of new capacities SMR margins have been fairly volatile since acquisition, ranging from 3% to 8% owing to ramp up at the new facilities in SMR in FY12. At the time of acquisition of Visiocorp, MSSL bagged €800mn order and for meeting the same it has been aggressively building capacities. Hungary, which almost contributes to 25% of sales of SMR, has been supplemented with a second plant, thereby making it as one of the biggest production hubs of exterior mirrors. Further, a new plant at Brazil has been set up thereby helping the company expand its presence in South America. FY12 saw commissioning of the new plants; margins were under pressure as plants had to be made ready for volume testing before the actual order arrives from the OE. Since the plants have become operational, the company is expected to see a steady improvement in EBIT margins from 5% registered in Q2 FY13.
SMR has a strong focus on new technology and has continuously introduced numerous new features around the globe.
The utilization levels have been affected owing to commissioning of new plants in FY12.
SMR margins volatile on utilization levels
2%
3%
4%
5%
6%
7%
8%
9%
Q3 FY11 Q4 FY11 Q1 FY12 Q2 FY12 Q3 FY12 Q4 FY12 Q1 FY13 Q2 FY13
Hungary plant commissioned
Source: Company, India Infoline Research
SMR technology advancement
1998 1999 2001 2005 2006 2007 2011 2012
First turn signal in exterior mirror (Mercedes‐Benz)
First interior mirror with multiple functions
(Mercedes‐Benz)
First LIN‐bus‐system in
exterior mirror (Jaguar)
First camera‐based blind
spot detection system
First light guide style turn signal (Audi Q7)
First side‐looker‐LED turn signal (Hyundai)
First combined power
telescopic and power folding mirror (Ford)
Logo Lamp (Land Rover)
Light weight plastic
reflectors
Source: Company, India Infoline Research
Motherson Sumi
10
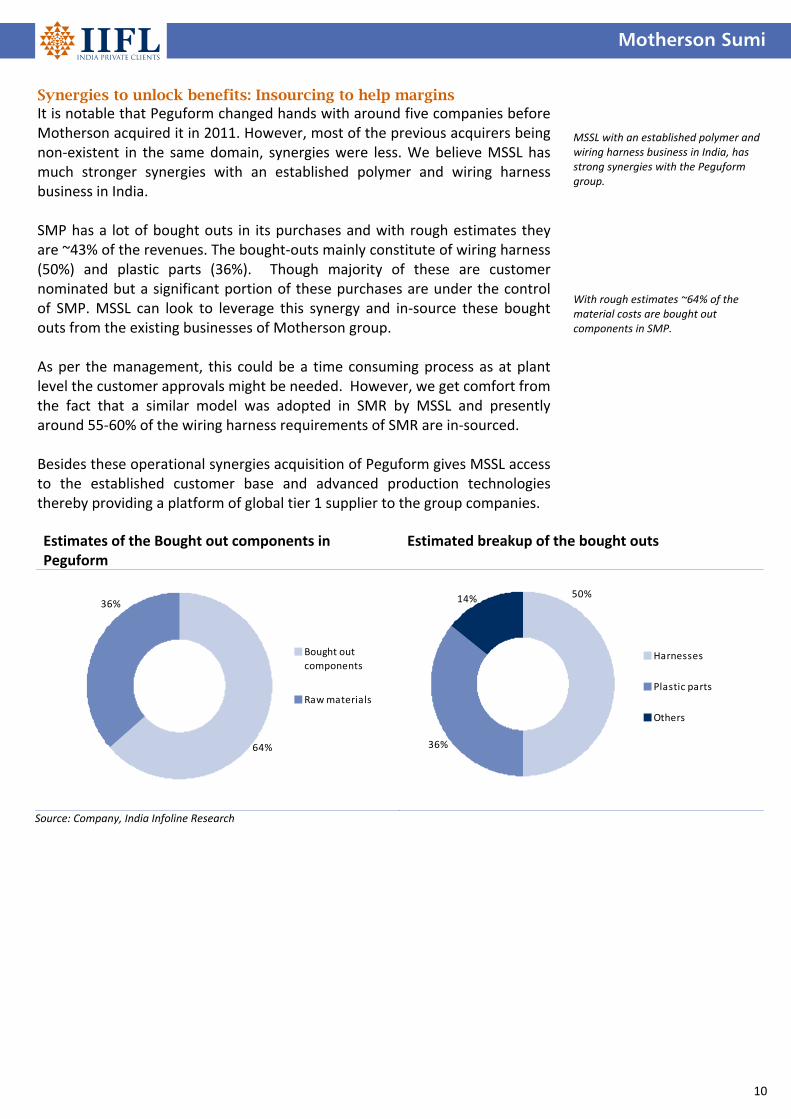
Synergies to unlock benefits: Insourcing to help margins It is notable that Peguform changed hands with around five companies before Motherson acquired it in 2011. However, most of the previous acquirers being non‐existent in the same domain, synergies were less. We believe MSSL has much stronger synergies with an established polymer and wiring harness business in India. SMP has a lot of bought outs in its purchases and with rough estimates they are ~43% of the revenues. The bought‐outs mainly constitute of wiring harness (50%) and plastic parts (36%). Though majority of these are customer nominated but a significant portion of these purchases are under the control of SMP. MSSL can look to leverage this synergy and in‐source these bought outs from the existing businesses of Motherson group. As per the management, this could be a time consuming process as at plant level the customer approvals might be needed. However, we get comfort from the fact that a similar model was adopted in SMR by MSSL and presently around 55‐60% of the wiring harness requirements of SMR are in‐sourced. Besides these operational synergies acquisition of Peguform gives MSSL access to the established customer base and advanced production technologies thereby providing a platform of global tier 1 supplier to the group companies.
MSSL with an established polymer and wiring harness business in India, has strong synergies with the Peguform group. With rough estimates ~64% of the material costs are bought out components in SMP.
Estimates of the Bought out components in Peguform
Estimated breakup of the bought outs
36%
64%
Bought out
components
Raw materials
50%14%
36%
Harnesses
Plastic parts
Others
Source: Company, India Infoline Research

Motherson Sumi
11
Clientele diversification post acquisitions Through the big acquisitions (Visiocorp, Peguform) the company has gained new set of clients, and now supplies to majority of the top ten OEs across the world. Among the major clients is the Volkswagen group (Volkswagen, Audi, Seat) which accounted for 66% of Peguform group revenues in FY11. It is also a major client for SMR and Indian standalone business, accounting for 14% and 10% of the revenues respectively. Hyundai (including Kia) is the next major customer for the group and it accounts for ~23% of SMR business and 14% of Indian standalone business. Notably in many geographies (including India, China), MSSL is responsible for doing 100% of Hyundai’s volumes. Both these players had cumulative market share gains of around 4.3% in the global car market in the past few years. The nature of the business is such that MSSL is dependent on the success of models it is supplying components to. The market share gains for Volkswagen and Hyundai augurs well for the MSSL’s business. The fact that Volkswagen is the market leader and luxury car volumes have been holding out in a weakening car market is also a healthy sign.
Market share gains for Volkswagen, Hyundai + Kia 2005 2006 2007 2008 2009 2010 Volkswagen 7.8% 8.3% 8.7% 9.3% 10.0% 9.4%
Hyundai+KIA 4.7% 5.5% 5.5% 6.0% 7.7% 7.4%
World total units (mn) 66.47 68.1 72.18 69.56 60.5 77.74 Source: OICA, India Infoline Research
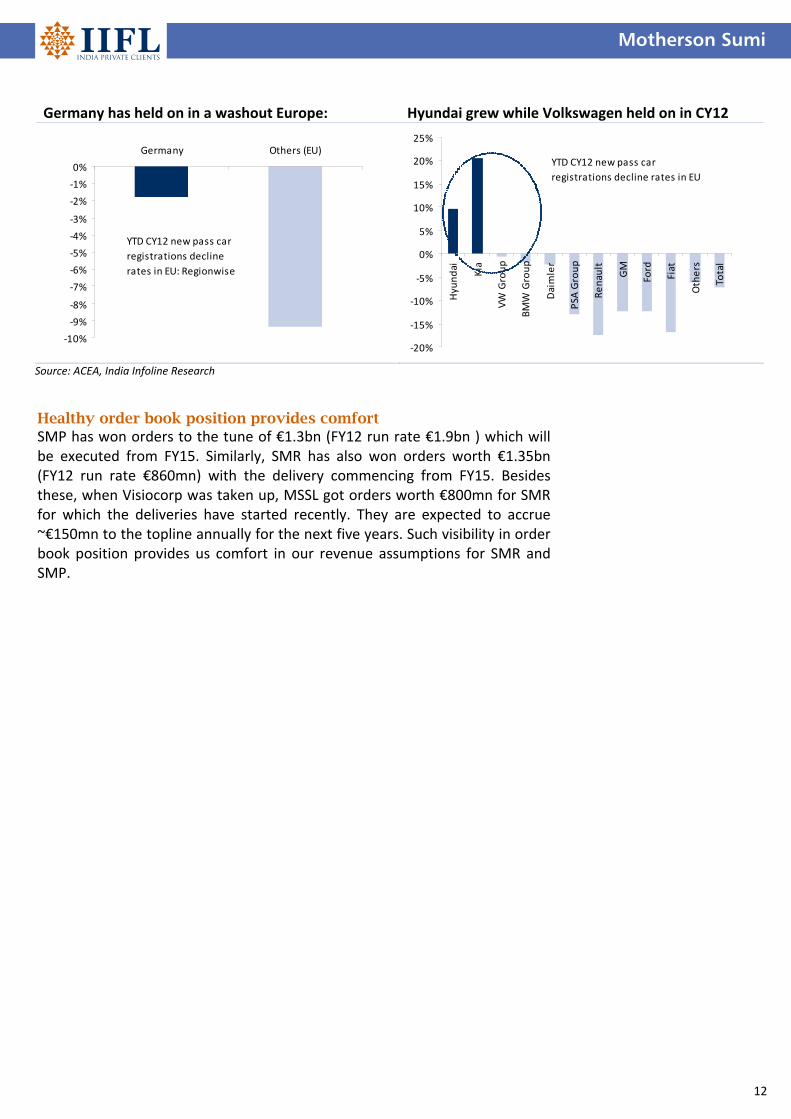
Exposure to Euro zone… not a big concern Post acquisitions, the company has a significant exposure to Europe (~40‐50%), but its major clients and markets have been fairly strong as against the weak EU trend. Germany, which is an important market for Peguform (~60% turnover) has managed to arrest the decline to ~2%, while the EU region has contracted by nearly 10% in CY12 YTD. Hyundai + KIA have grown against the tide in Europe and have grown volumes by 10‐20% YTD in an otherwise declining market. Volkswagen group also has managed to remain flattish in YTD CY12 on back of its offerings in premium categories, which have proved to be less affected. This would protect revenue growth for MSSL in case of a further slowdown in Europe.
Significant market share gains for the major clients of MSSL augur well for the company’s business. Volkswagen and Hyundia+KIa have gained 430bps market share in past few years.
Germany has arrested passenger car market declines to ~2% wherein EU has witnessed contraction of ~10%.
Major OEMs post Visiocorp and Peguform acquisitions
Before Visiocorp & Peguform (2009) Post Visiocorp & Peguform (2012)
Maruti Hyundai SumitomoVW Ford Nissan GM BMW Daimler
Source: Company, India Infoline Research
Motherson Sumi
12
Healthy order book position provides comfort SMP has won orders to the tune of €1.3bn (FY12 run rate €1.9bn ) which will be executed from FY15. Similarly, SMR has also won orders worth €1.35bn (FY12 run rate €860mn) with the delivery commencing from FY15. Besides these, when Visiocorp was taken up, MSSL got orders worth €800mn for SMR for which the deliveries have started recently. They are expected to accrue ~€150mn to the topline annually for the next five years. Such visibility in order book position provides us comfort in our revenue assumptions for SMR and SMP.
Germany has held on in a washout Europe: Hyundai grew while Volkswagen held on in CY12
‐10%
‐9%
‐8%
‐7%
‐6%
‐5%
‐4%
‐3%
‐2%
‐1%
0%
Germany Others (EU)
YTD CY12 new pass car
registrations decline
rates in EU: Regionwise
‐20%
‐15%
‐10%
‐5%
0%
5%
10%
15%
20%
25%
Hyundai
Kia
VW Group
BMW Group
Daimler
PSA
Group
Renault
GM
Ford
Fiat
Others
Total
YTD CY12 new pass car
registrations decline rates in EU
Source: ACEA, India Infoline Research
Motherson Sumi
13
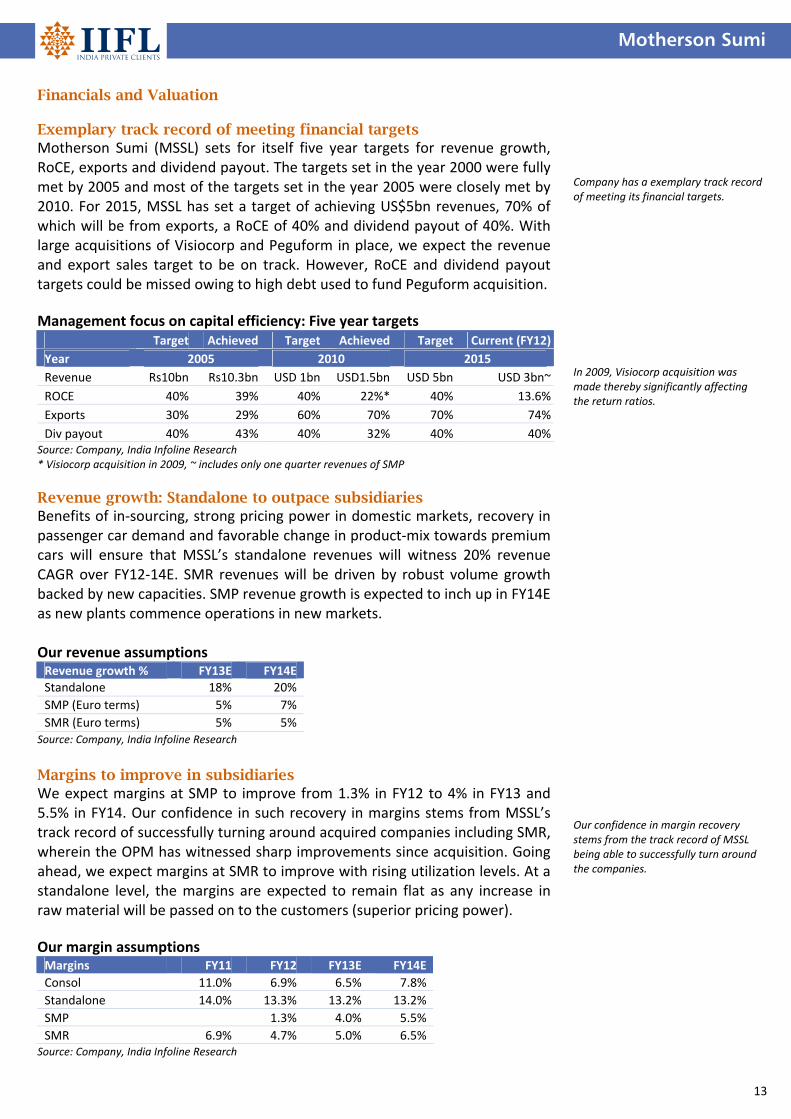
Financials and Valuation Exemplary track record of meeting financial targets Motherson Sumi (MSSL) sets for itself five year targets for revenue growth, RoCE, exports and dividend payout. The targets set in the year 2000 were fully met by 2005 and most of the targets set in the year 2005 were closely met by 2010. For 2015, MSSL has set a target of achieving US$5bn revenues, 70% of which will be from exports, a RoCE of 40% and dividend payout of 40%. With large acquisitions of Visiocorp and Peguform in place, we expect the revenue and export sales target to be on track. However, RoCE and dividend payout targets could be missed owing to high debt used to fund Peguform acquisition. Management focus on capital efficiency: Five year targets Target Achieved Target Achieved Target Current (FY12)
Year 2005 2010 2015
Revenue Rs10bn Rs10.3bn USD 1bn USD1.5bn USD 5bn USD 3bn~
ROCE 40% 39% 40% 22%* 40% 13.6%
Exports 30% 29% 60% 70% 70% 74%
Div payout 40% 43% 40% 32% 40% 40%Source: Company, India Infoline Research * Visiocorp acquisition in 2009, ~ includes only one quarter revenues of SMP Revenue growth: Standalone to outpace subsidiaries Benefits of in‐sourcing, strong pricing power in domestic markets, recovery in passenger car demand and favorable change in product‐mix towards premium cars will ensure that MSSL’s standalone revenues will witness 20% revenue CAGR over FY12‐14E. SMR revenues will be driven by robust volume growth backed by new capacities. SMP revenue growth is expected to inch up in FY14E as new plants commence operations in new markets. Our revenue assumptions Revenue growth % FY13E FY14E Standalone 18% 20%
SMP (Euro terms) 5% 7%
SMR (Euro terms) 5% 5% Source: Company, India Infoline Research Margins to improve in subsidiaries We expect margins at SMP to improve from 1.3% in FY12 to 4% in FY13 and 5.5% in FY14. Our confidence in such recovery in margins stems from MSSL’s track record of successfully turning around acquired companies including SMR, wherein the OPM has witnessed sharp improvements since acquisition. Going ahead, we expect margins at SMR to improve with rising utilization levels. At a standalone level, the margins are expected to remain flat as any increase in raw material will be passed on to the customers (superior pricing power). Our margin assumptions Margins FY11 FY12 FY13E FY14E
Consol 11.0% 6.9% 6.5% 7.8%
Standalone 14.0% 13.3% 13.2% 13.2%
SMP 1.3% 4.0% 5.5%
SMR 6.9% 4.7% 5.0% 6.5% Source: Company, India Infoline Research
Company has a exemplary track record of meeting its financial targets. In 2009, Visiocorp acquisition was made thereby significantly affecting the return ratios. Our confidence in margin recovery stems from the track record of MSSL being able to successfully turn around the companies.
Motherson Sumi
14
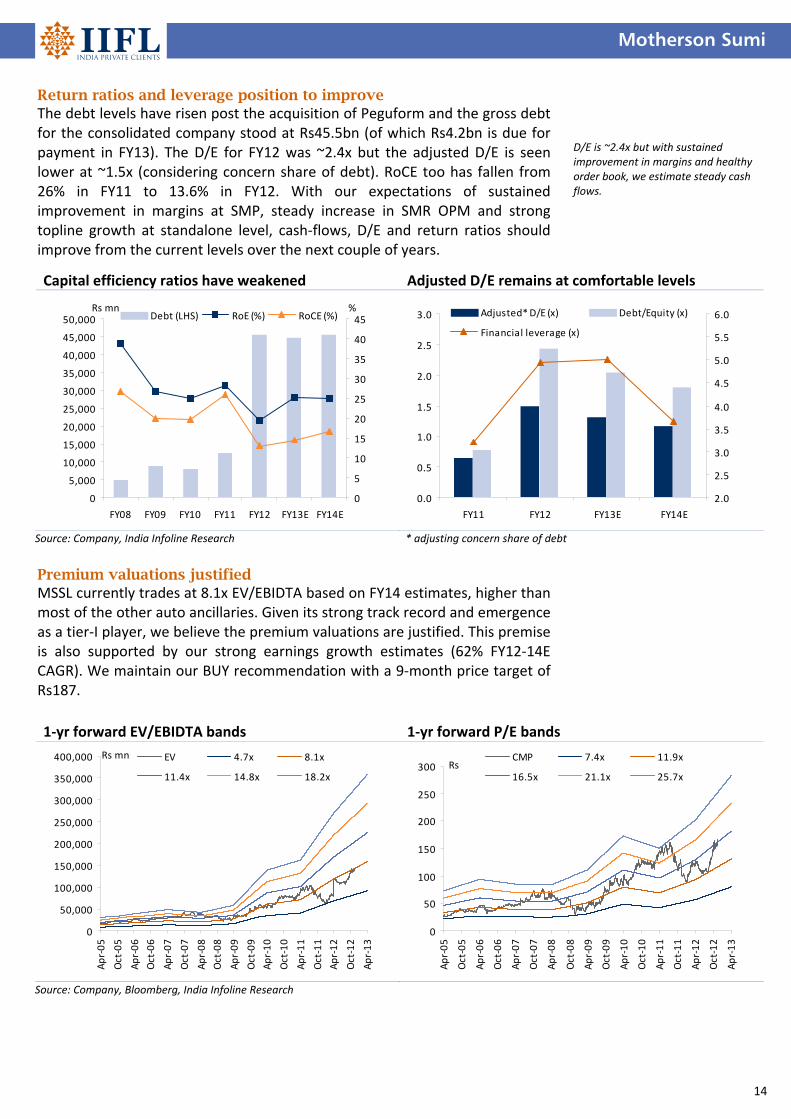
Return ratios and leverage position to improve The debt levels have risen post the acquisition of Peguform and the gross debt for the consolidated company stood at Rs45.5bn (of which Rs4.2bn is due for payment in FY13). The D/E for FY12 was ~2.4x but the adjusted D/E is seen lower at ~1.5x (considering concern share of debt). RoCE too has fallen from 26% in FY11 to 13.6% in FY12. With our expectations of sustained improvement in margins at SMP, steady increase in SMR OPM and strong topline growth at standalone level, cash‐flows, D/E and return ratios should improve from the current levels over the next couple of years.
Premium valuations justified MSSL currently trades at 8.1x EV/EBIDTA based on FY14 estimates, higher than most of the other auto ancillaries. Given its strong track record and emergence as a tier‐I player, we believe the premium valuations are justified. This premise is also supported by our strong earnings growth estimates (62% FY12‐14E CAGR). We maintain our BUY recommendation with a 9‐month price target of Rs187.
D/E is ~2.4x but with sustained improvement in margins and healthy order book, we estimate steady cash flows.
1‐yr forward EV/EBIDTA bands 1‐yr forward P/E bands
0
50,000
100,000
150,000
200,000
250,000
300,000
350,000
400,000
Apr‐05
Oct‐05
Apr‐06
Oct‐06
Apr‐07
Oct‐07
Apr‐08
Oct‐08
Apr‐09
Oct‐09
Apr‐10
Oct‐10
Apr‐11
Oct‐11
Apr‐12
Oct‐12
Apr‐13
EV 4.7x 8.1x
11.4x 14.8x 18.2x
Rs mn
0
50
100
150
200
250
300
Apr‐05
Oct‐05
Apr‐06
Oct‐06
Apr‐07
Oct‐07
Apr‐08
Oct‐08
Apr‐09
Oct‐09
Apr‐10
Oct‐10
Apr‐11
Oct‐11
Apr‐12
Oct‐12
Apr‐13
CMP 7.4x 11.9x
16.5x 21.1x 25.7xRs
Source: Company, Bloomberg, India Infoline Research
Capital efficiency ratios have weakened Adjusted D/E remains at comfortable levels
0
5,000
10,000
15,000
20,000
25,000
30,000
35,000
40,000
45,000
50,000
FY08 FY09 FY10 FY11 FY12 FY13E FY14E
0
5
10
15
20
25
30
35
40
45Debt (LHS) RoE (%) RoCE (%)Rs mn %
0.0
0.5
1.0
1.5
2.0
2.5
3.0
FY11 FY12 FY13E FY14E
2.0
2.5
3.0
3.5
4.0
4.5
5.0
5.5
6.0Adjusted* D/E (x) Debt/Equity (x)
Financial leverage (x)
Source: Company, India Infoline Research * adjusting concern share of debt
Motherson Sumi
15
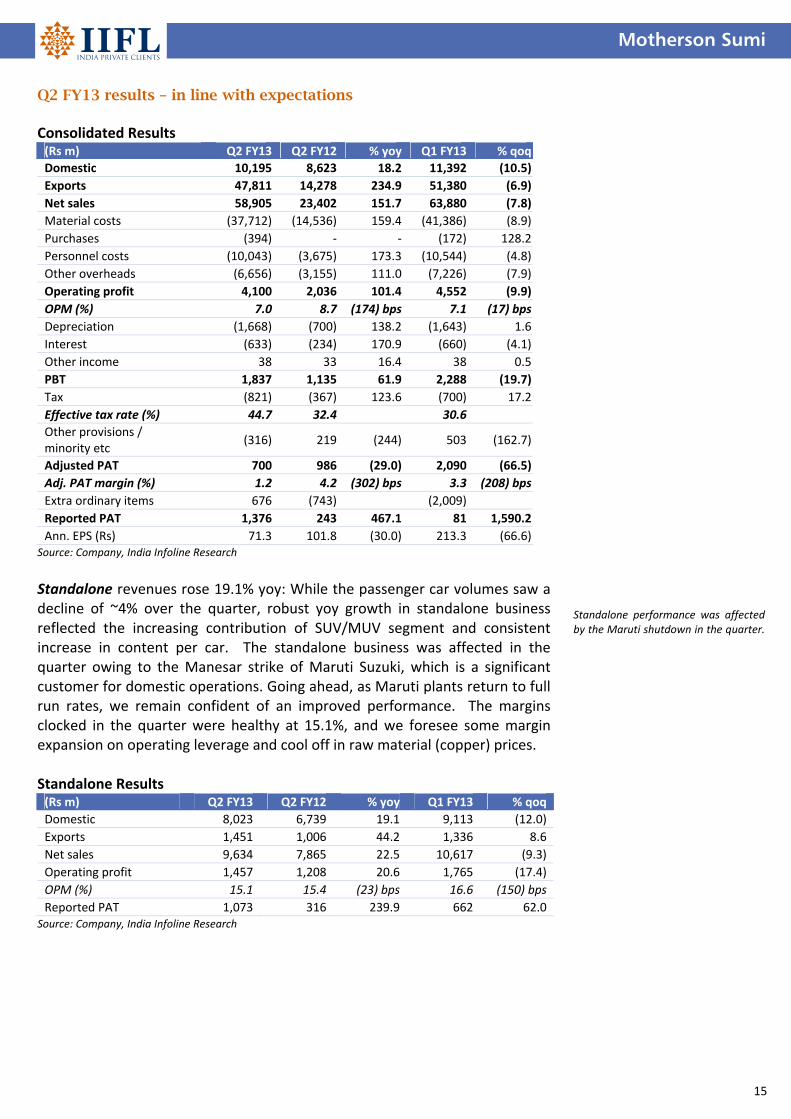
Q2 FY13 results – in line with expectations Consolidated Results (Rs m) Q2 FY13 Q2 FY12 % yoy Q1 FY13 % qoq
Domestic 10,195 8,623 18.2 11,392 (10.5)
Exports 47,811 14,278 234.9 51,380 (6.9)
Net sales 58,905 23,402 151.7 63,880 (7.8)
Material costs (37,712) (14,536) 159.4 (41,386) (8.9)
Purchases (394) ‐ ‐ (172) 128.2
Personnel costs (10,043) (3,675) 173.3 (10,544) (4.8)
Other overheads (6,656) (3,155) 111.0 (7,226) (7.9)
Operating profit 4,100 2,036 101.4 4,552 (9.9)
OPM (%) 7.0 8.7 (174) bps 7.1 (17) bps
Depreciation (1,668) (700) 138.2 (1,643) 1.6
Interest (633) (234) 170.9 (660) (4.1)
Other income 38 33 16.4 38 0.5
PBT 1,837 1,135 61.9 2,288 (19.7)
Tax (821) (367) 123.6 (700) 17.2
Effective tax rate (%) 44.7 32.4 30.6
Other provisions / minority etc
(316) 219 (244) 503 (162.7)
Adjusted PAT 700 986 (29.0) 2,090 (66.5)
Adj. PAT margin (%) 1.2 4.2 (302) bps 3.3 (208) bps
Extra ordinary items 676 (743) (2,009)
Reported PAT 1,376 243 467.1 81 1,590.2
Ann. EPS (Rs) 71.3 101.8 (30.0) 213.3 (66.6)Source: Company, India Infoline Research Standalone revenues rose 19.1% yoy: While the passenger car volumes saw a decline of ~4% over the quarter, robust yoy growth in standalone business reflected the increasing contribution of SUV/MUV segment and consistent increase in content per car. The standalone business was affected in the quarter owing to the Manesar strike of Maruti Suzuki, which is a significant customer for domestic operations. Going ahead, as Maruti plants return to full run rates, we remain confident of an improved performance. The margins clocked in the quarter were healthy at 15.1%, and we foresee some margin expansion on operating leverage and cool off in raw material (copper) prices. Standalone Results (Rs m) Q2 FY13 Q2 FY12 % yoy Q1 FY13 % qoq
Domestic 8,023 6,739 19.1 9,113 (12.0)
Exports 1,451 1,006 44.2 1,336 8.6
Net sales 9,634 7,865 22.5 10,617 (9.3)
Operating profit 1,457 1,208 20.6 1,765 (17.4)
OPM (%) 15.1 15.4 (23) bps 16.6 (150) bps
Reported PAT 1,073 316 239.9 662 62.0 Source: Company, India Infoline Research
Standalone performance was affected by the Maruti shutdown in the quarter.
Motherson Sumi
16
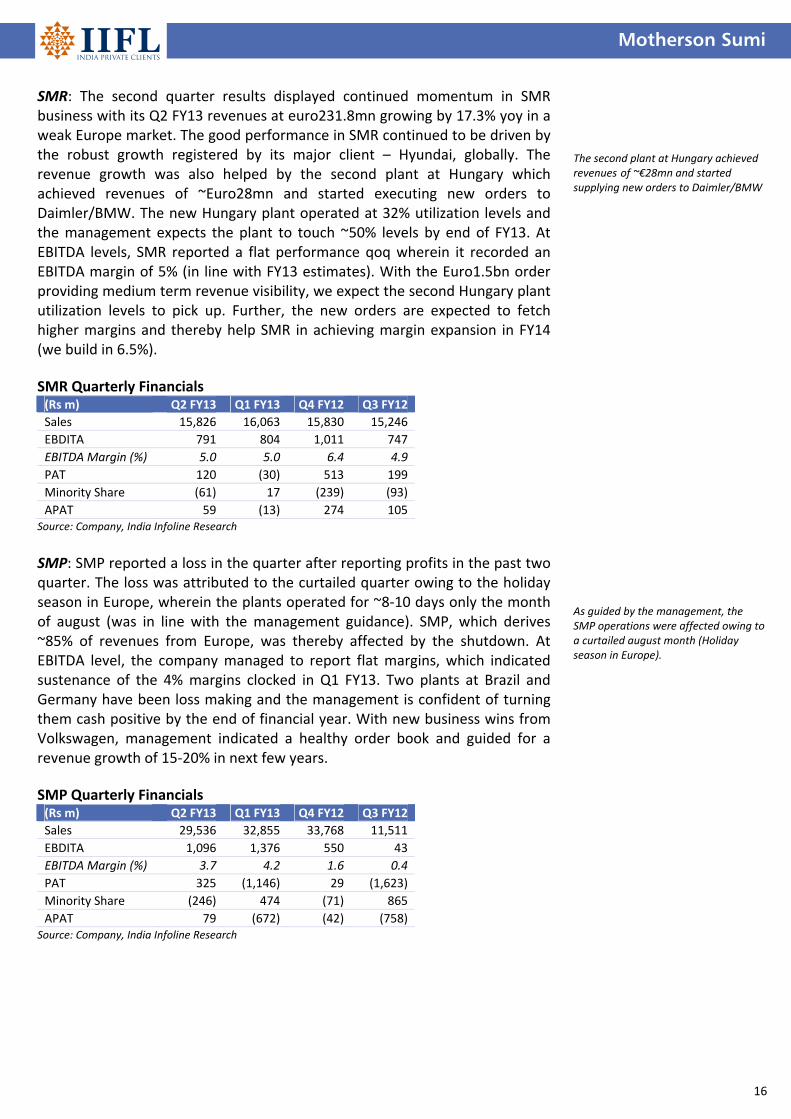
SMR: The second quarter results displayed continued momentum in SMR business with its Q2 FY13 revenues at euro231.8mn growing by 17.3% yoy in a weak Europe market. The good performance in SMR continued to be driven by the robust growth registered by its major client – Hyundai, globally. The revenue growth was also helped by the second plant at Hungary which achieved revenues of ~Euro28mn and started executing new orders to Daimler/BMW. The new Hungary plant operated at 32% utilization levels and the management expects the plant to touch ~50% levels by end of FY13. At EBITDA levels, SMR reported a flat performance qoq wherein it recorded an EBITDA margin of 5% (in line with FY13 estimates). With the Euro1.5bn order providing medium term revenue visibility, we expect the second Hungary plant utilization levels to pick up. Further, the new orders are expected to fetch higher margins and thereby help SMR in achieving margin expansion in FY14 (we build in 6.5%). SMR Quarterly Financials (Rs m) Q2 FY13 Q1 FY13 Q4 FY12 Q3 FY12
Sales 15,826 16,063 15,830 15,246
EBDITA 791 804 1,011 747
EBITDA Margin (%) 5.0 5.0 6.4 4.9
PAT 120 (30) 513 199
Minority Share (61) 17 (239) (93)
APAT 59 (13) 274 105 Source: Company, India Infoline Research SMP: SMP reported a loss in the quarter after reporting profits in the past two quarter. The loss was attributed to the curtailed quarter owing to the holiday season in Europe, wherein the plants operated for ~8‐10 days only the month of august (was in line with the management guidance). SMP, which derives ~85% of revenues from Europe, was thereby affected by the shutdown. At EBITDA level, the company managed to report flat margins, which indicated sustenance of the 4% margins clocked in Q1 FY13. Two plants at Brazil and Germany have been loss making and the management is confident of turning them cash positive by the end of financial year. With new business wins from Volkswagen, management indicated a healthy order book and guided for a revenue growth of 15‐20% in next few years. SMP Quarterly Financials (Rs m) Q2 FY13 Q1 FY13 Q4 FY12 Q3 FY12
Sales 29,536 32,855 33,768 11,511
EBDITA 1,096 1,376 550 43
EBITDA Margin (%) 3.7 4.2 1.6 0.4
PAT 325 (1,146) 29 (1,623)
Minority Share (246) 474 (71) 865
APAT 79 (672) (42) (758) Source: Company, India Infoline Research
The second plant at Hungary achieved revenues of ~€28mn and started supplying new orders to Daimler/BMW As guided by the management, the SMP operations were affected owing to a curtailed august month (Holiday season in Europe).
Motherson Sumi
17
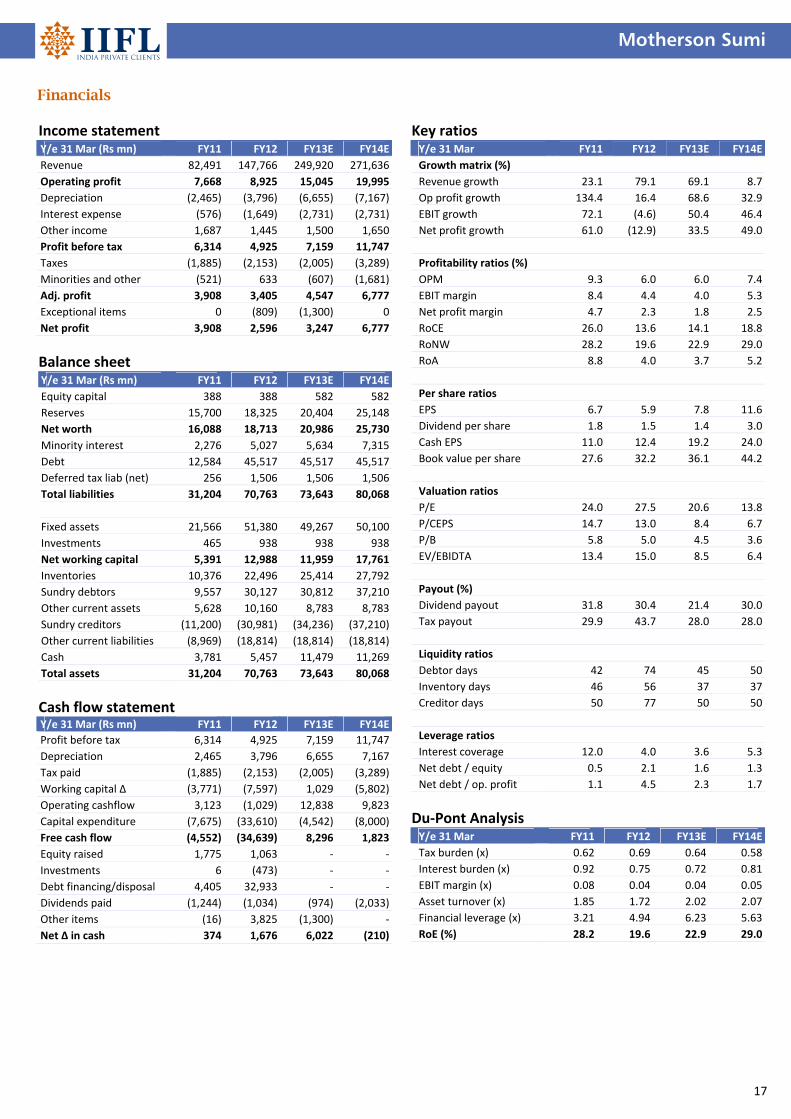
Financials Income statement Y/e 31 Mar (Rs mn) FY11 FY12 FY13E FY14E
Revenue 82,491 147,766 249,920 271,636
Operating profit 7,668 8,925 15,045 19,995
Depreciation (2,465) (3,796) (6,655) (7,167)
Interest expense (576) (1,649) (2,731) (2,731)
Other income 1,687 1,445 1,500 1,650
Profit before tax 6,314 4,925 7,159 11,747
Taxes (1,885) (2,153) (2,005) (3,289)
Minorities and other (521) 633 (607) (1,681)
Adj. profit 3,908 3,405 4,547 6,777
Exceptional items 0 (809) (1,300) 0
Net profit 3,908 2,596 3,247 6,777
Balance sheet Y/e 31 Mar (Rs mn) FY11 FY12 FY13E FY14E
Equity capital 388 388 582 582
Reserves 15,700 18,325 20,404 25,148
Net worth 16,088 18,713 20,986 25,730
Minority interest 2,276 5,027 5,634 7,315
Debt 12,584 45,517 45,517 45,517
Deferred tax liab (net) 256 1,506 1,506 1,506
Total liabilities 31,204 70,763 73,643 80,068
Fixed assets 21,566 51,380 49,267 50,100
Investments 465 938 938 938
Net working capital 5,391 12,988 11,959 17,761
Inventories 10,376 22,496 25,414 27,792
Sundry debtors 9,557 30,127 30,812 37,210
Other current assets 5,628 10,160 8,783 8,783
Sundry creditors (11,200) (30,981) (34,236) (37,210)
Other current liabilities (8,969) (18,814) (18,814) (18,814)
Cash 3,781 5,457 11,479 11,269
Total assets 31,204 70,763 73,643 80,068
Cash flow statement Y/e 31 Mar (Rs mn) FY11 FY12 FY13E FY14E
Profit before tax 6,314 4,925 7,159 11,747
Depreciation 2,465 3,796 6,655 7,167
Tax paid (1,885) (2,153) (2,005) (3,289)
Working capital ∆ (3,771) (7,597) 1,029 (5,802)
Operating cashflow 3,123 (1,029) 12,838 9,823
Capital expenditure (7,675) (33,610) (4,542) (8,000)
Free cash flow (4,552) (34,639) 8,296 1,823
Equity raised 1,775 1,063 ‐ ‐
Investments 6 (473) ‐ ‐
Debt financing/disposal 4,405 32,933 ‐ ‐
Dividends paid (1,244) (1,034) (974) (2,033)
Other items (16) 3,825 (1,300) ‐
Net ∆ in cash 374 1,676 6,022 (210)
Key ratios Y/e 31 Mar FY11 FY12 FY13E FY14E
Growth matrix (%)
Revenue growth 23.1 79.1 69.1 8.7
Op profit growth 134.4 16.4 68.6 32.9
EBIT growth 72.1 (4.6) 50.4 46.4
Net profit growth 61.0 (12.9) 33.5 49.0
Profitability ratios (%)
OPM 9.3 6.0 6.0 7.4
EBIT margin 8.4 4.4 4.0 5.3
Net profit margin 4.7 2.3 1.8 2.5
RoCE 26.0 13.6 14.1 18.8
RoNW 28.2 19.6 22.9 29.0
RoA 8.8 4.0 3.7 5.2
Per share ratios
EPS 6.7 5.9 7.8 11.6
Dividend per share 1.8 1.5 1.4 3.0
Cash EPS 11.0 12.4 19.2 24.0
Book value per share 27.6 32.2 36.1 44.2
Valuation ratios
P/E 24.0 27.5 20.6 13.8
P/CEPS 14.7 13.0 8.4 6.7
P/B 5.8 5.0 4.5 3.6
EV/EBIDTA 13.4 15.0 8.5 6.4
Payout (%)
Dividend payout 31.8 30.4 21.4 30.0
Tax payout 29.9 43.7 28.0 28.0
Liquidity ratios
Debtor days 42 74 45 50
Inventory days 46 56 37 37
Creditor days 50 77 50 50
Leverage ratios
Interest coverage 12.0 4.0 3.6 5.3
Net debt / equity 0.5 2.1 1.6 1.3
Net debt / op. profit 1.1 4.5 2.3 1.7
Du‐Pont Analysis Y/e 31 Mar FY11 FY12 FY13E FY14E
Tax burden (x) 0.62 0.69 0.64 0.58
Interest burden (x) 0.92 0.75 0.72 0.81
EBIT margin (x) 0.08 0.04 0.04 0.05
Asset turnover (x) 1.85 1.72 2.02 2.07
Financial leverage (x) 3.21 4.94 6.23 5.63
RoE (%) 28.2 19.6 22.9 29.0
Recommendation parameters for fundamental reports:
Buy – Absolute return of over +10%
Market Performer – Absolute return between ‐10% to +10%
Sell – Absolute return below ‐10%
Published in 2012. © India Infoline Ltd 2012 This report is for the personal information of the authorised recipient and is not for public distribution and should not be reproduced or redistributed without prior permission. The information provided in the document is from publicly available data and other sources, which we believe, are reliable. Efforts are made to try and ensure accuracy of data however, India Infoline and/or any of its affiliates and/or employees shall not be liable for loss or damage that may arise from use of this document. India Infoline and/or any of its affiliates and/or employees may or may not hold positions in any of the securities mentioned in the document. The report also includes analysis and views expressed by our research team. The report is purely for information purposes and does not construe to be investment recommendation/advice or an offer or solicitation of an offer to buy/sell any securities. The opinions expressed are our current opinions as of the date appearing in the material and may be subject to change from time to time without notice. Investors should not solely rely on the information contained in this document and must make investment decisions based on their own investment objectives, risk profile and financial position. The recipients of this material should take their own professional advice before acting on this information. India Infoline and/or its affiliate companies may deal in the securities mentioned herein as a broker or for any other transaction as a Market Maker, Investment Advisor, etc. to the issuer company or its connected persons. This report is published by IIFL ‘India Private Clients’ research desk. IIFL has other business units with independent research teams separated by 'Chinese walls' catering to different sets of customers having varying objectives, risk profiles, investment horizon, etc and therefore, may at times have, different and contrary views on stocks, sectors and markets. This report is not directed or intended for distribution to, or use by, any person or entity who is a citizen or resident of or located in any locality, state, country or other jurisdiction, where such distribution, publication, availability or use would be contrary to local law, regulation or which would subject IIFL and affiliates to any registration or licensing requirement within such jurisdiction. The securities described herein may or may not be eligible for sale in all jurisdictions or to certain category of investors. Persons in whose possession this document may come are required to inform themselves of and to observe such restriction. IIFL, IIFL Centre, Kamala City, Senapati Bapat Marg, Lower Parel (W), Mumbai 400 013. For Research related queries, write to: Amar Ambani, Head of Research at [email protected] or [email protected] For Sales and Account related information, write to customer care: [email protected] or call on 91‐22 4007 1000