Embed Size (px)
Citation preview

SHRP 2 S05Status update and current design
plans
SHRP 2 Safety Research SymposiumJuly 17-18, 2008Washington, DC
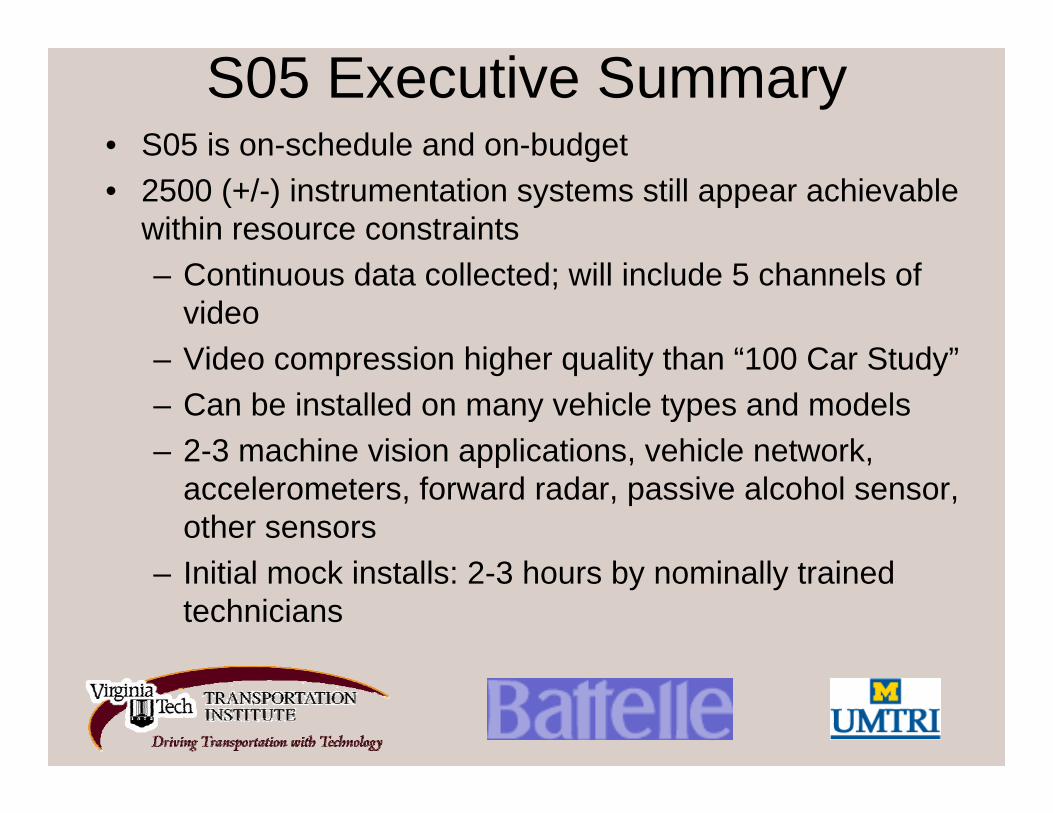
S05 Executive Summary• S05 is on-schedule and on-budget• 2500 (+/-) instrumentation systems still appear achievable
within resource constraints– Continuous data collected; will include 5 channels of
video– Video compression higher quality than “100 Car Study”– Can be installed on many vehicle types and models– 2-3 machine vision applications, vehicle network,
accelerometers, forward radar, passive alcohol sensor, other sensors
– Initial mock installs: 2-3 hours by nominally trained technicians
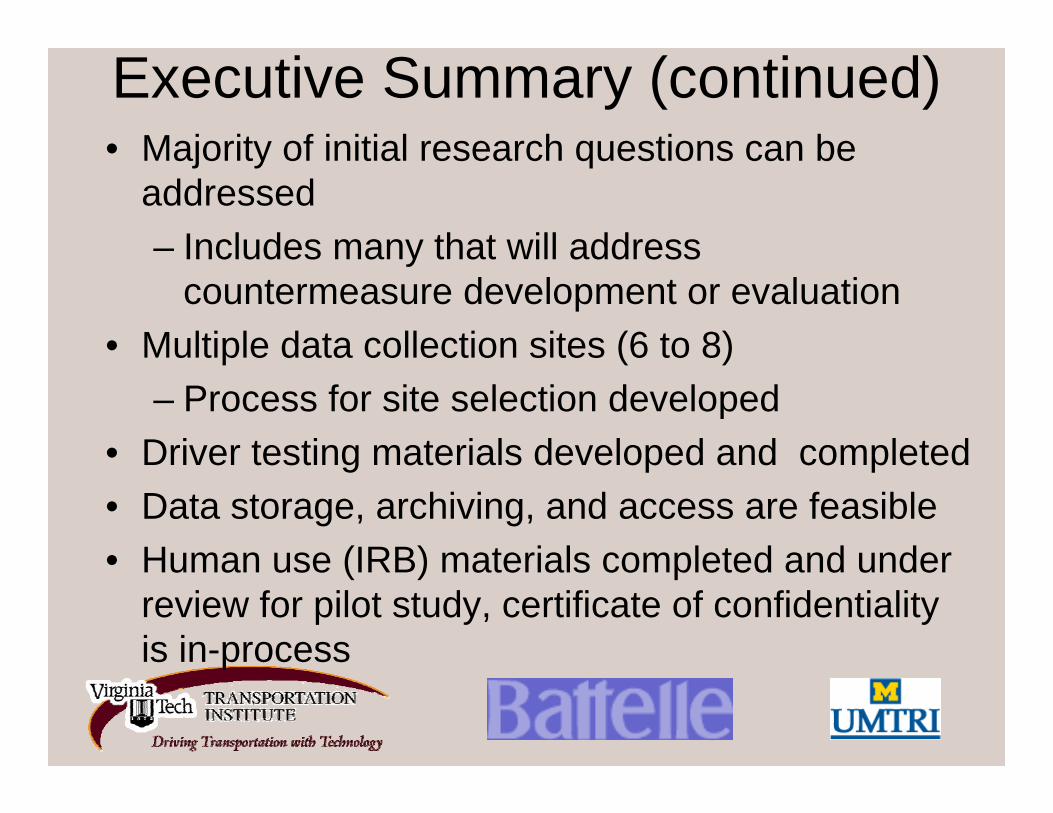
Executive Summary (continued)• Majority of initial research questions can be
addressed– Includes many that will address
countermeasure development or evaluation• Multiple data collection sites (6 to 8)
– Process for site selection developed• Driver testing materials developed and completed• Data storage, archiving, and access are feasible• Human use (IRB) materials completed and under
review for pilot study, certificate of confidentiality is in-process
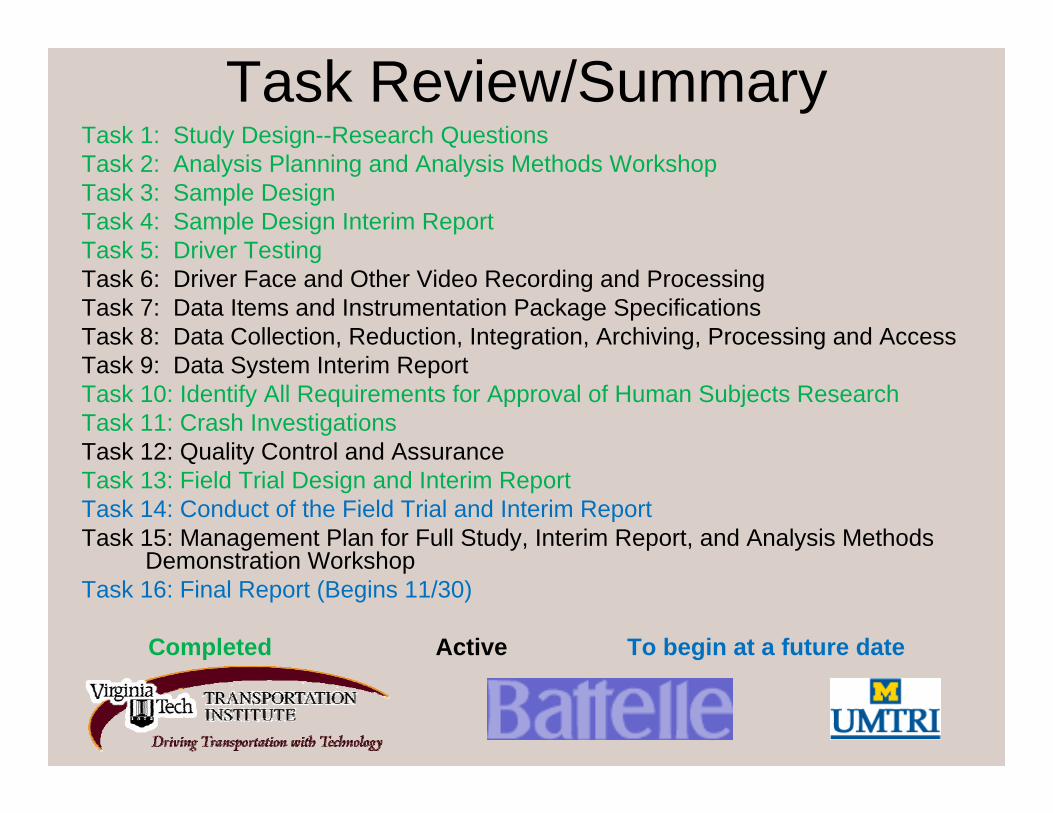
Task Review/SummaryTask 1: Study Design--Research QuestionsTask 2: Analysis Planning and Analysis Methods WorkshopTask 3: Sample DesignTask 4: Sample Design Interim ReportTask 5: Driver TestingTask 6: Driver Face and Other Video Recording and ProcessingTask 7: Data Items and Instrumentation Package SpecificationsTask 8: Data Collection, Reduction, Integration, Archiving, Processing and AccessTask 9: Data System Interim ReportTask 10: Identify All Requirements for Approval of Human Subjects ResearchTask 11: Crash InvestigationsTask 12: Quality Control and AssuranceTask 13: Field Trial Design and Interim ReportTask 14: Conduct of the Field Trial and Interim Report Task 15: Management Plan for Full Study, Interim Report, and Analysis Methods
Demonstration WorkshopTask 16: Final Report (Begins 11/30)
Completed Active To begin at a future date
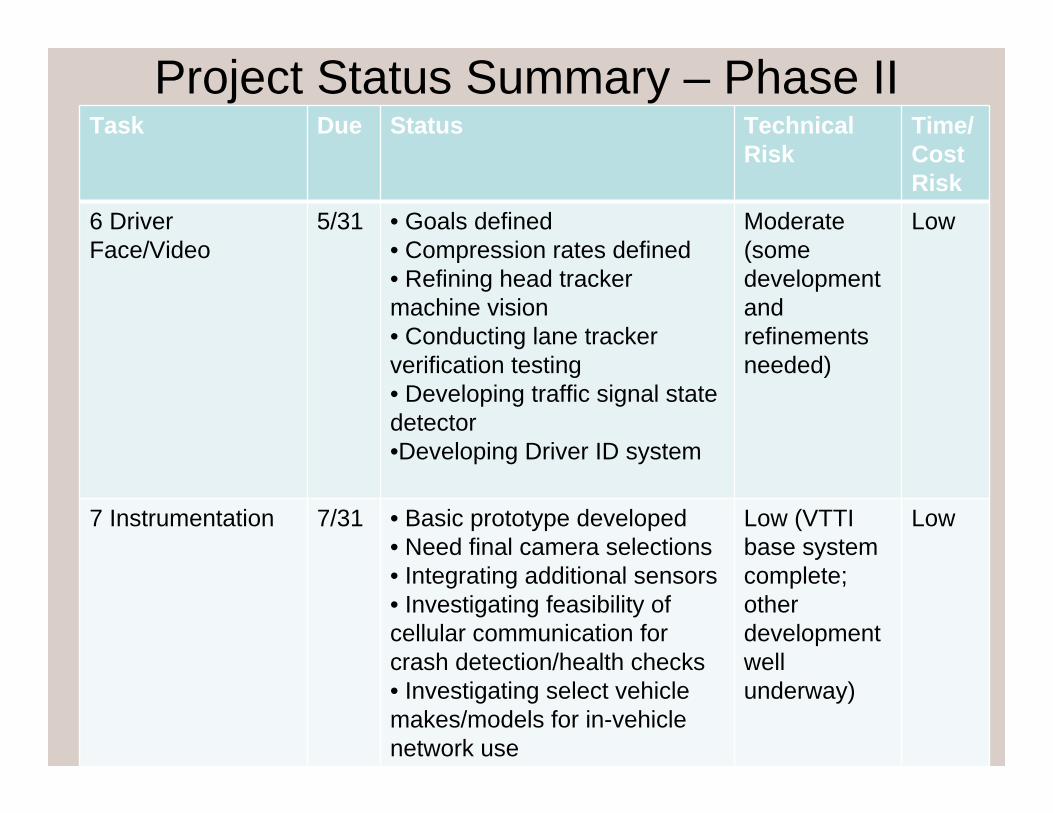
Project Status Summary – Phase IITask Due Status Technical
RiskTime/Cost Risk
6 Driver Face/Video
5/31 • Goals defined• Compression rates defined• Refining head tracker machine vision• Conducting lane tracker verification testing• Developing traffic signal state detector•Developing Driver ID system
Moderate (some development and refinements needed)
Low
7 Instrumentation 7/31 • Basic prototype developed• Need final camera selections• Integrating additional sensors• Investigating feasibility of cellular communication for crash detection/health checks• Investigating select vehicle makes/models for in-vehicle network use
Low (VTTI base system complete; other development well underway)
Low
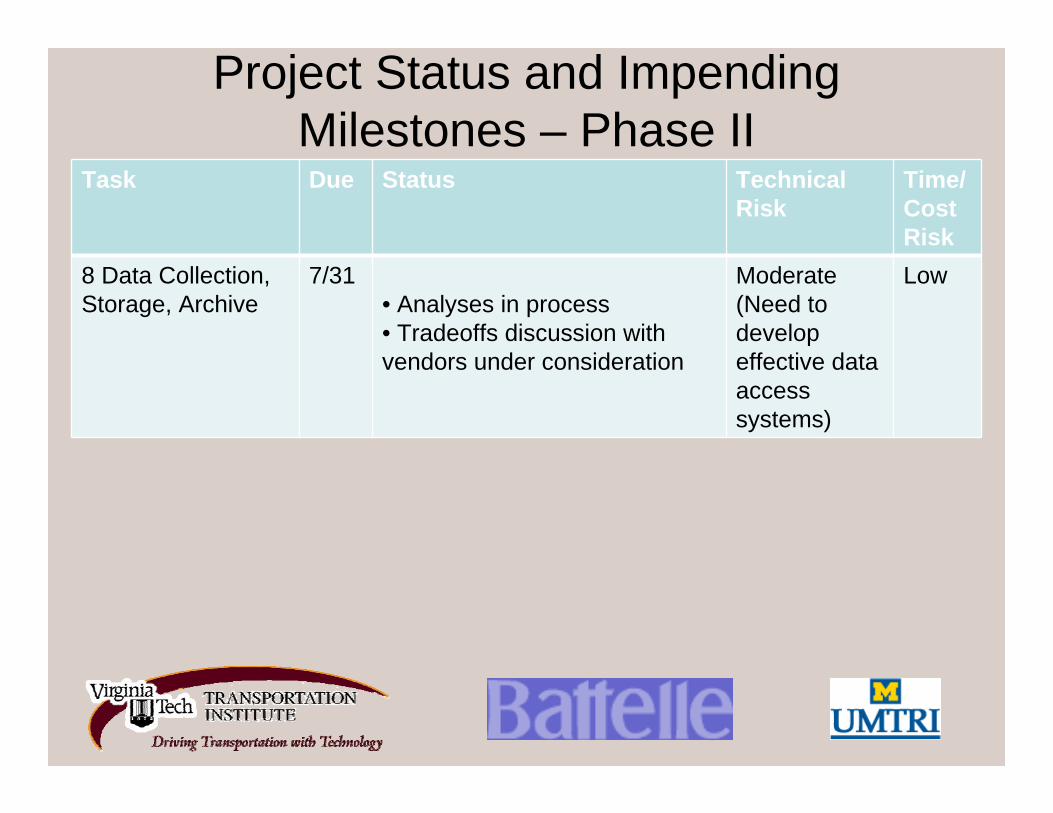
Project Status and Impending Milestones – Phase II
Task Due Status Technical Risk
Time/Cost Risk
8 Data Collection, Storage, Archive
7/31• Analyses in process • Tradeoffs discussion with vendors under consideration
Moderate(Need to develop effective data access systems)
Low
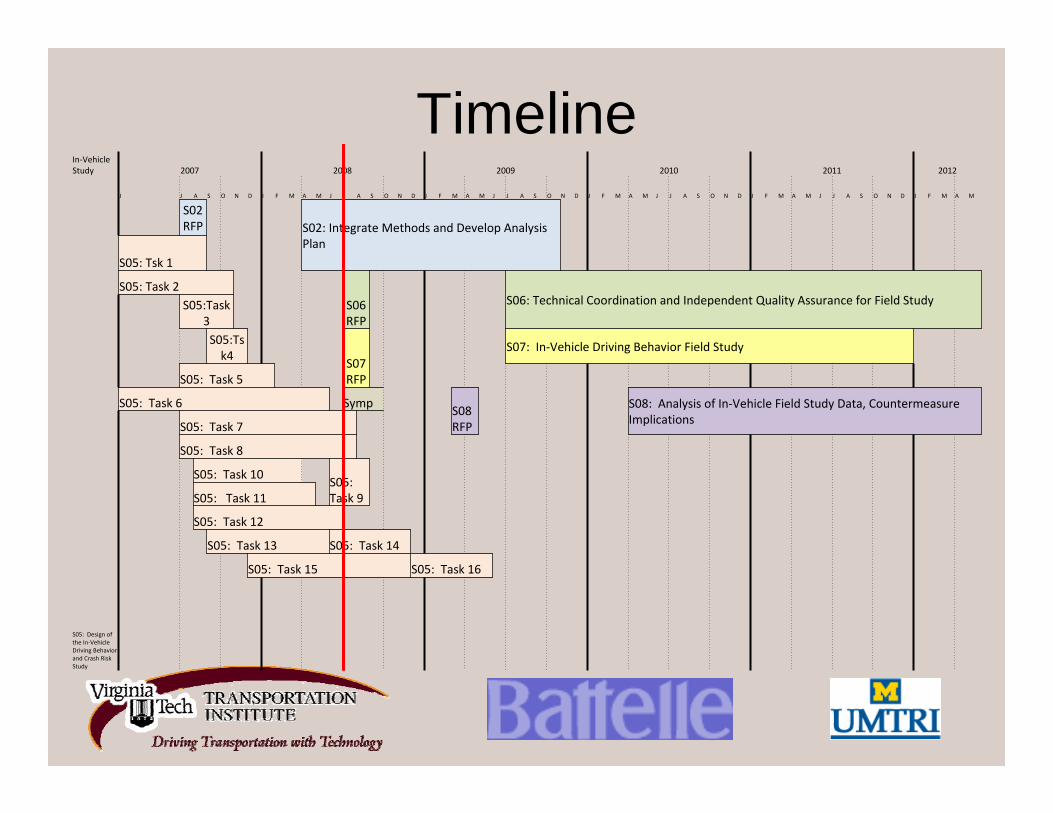
TimelineIn‐Vehicle Study 2007 2008 2009 2010 2011 2012
J J A S O N D J F M A M J J A S O N D J F M A M J J A S O N D J F M A M J J A S O N D J F M A M J J A S O N D J F M A M
S02 RFP S02: Integrate Methods and Develop Analysis
PlanS05: Tsk 1
S05: Task 2S06 RFP
S06: Technical Coordination and Independent Quality Assurance for Field StudyS05:Task 3S05:Tsk4
S07 RFP
S07: In‐Vehicle Driving Behavior Field Study
S05: Task 5
S05: Task 6 SympS08 RFP
S08: Analysis of In‐Vehicle Field Study Data, Countermeasure Implications S05: Task 7
S05: Task 8
S05: Task 10S05: Task 9S05: Task 11
S05: Task 12
S05: Task 13 S05: Task 14
S05: Task 15 S05: Task 16
S05: Design of the In‐Vehicle Driving Behavior and Crash Risk Study
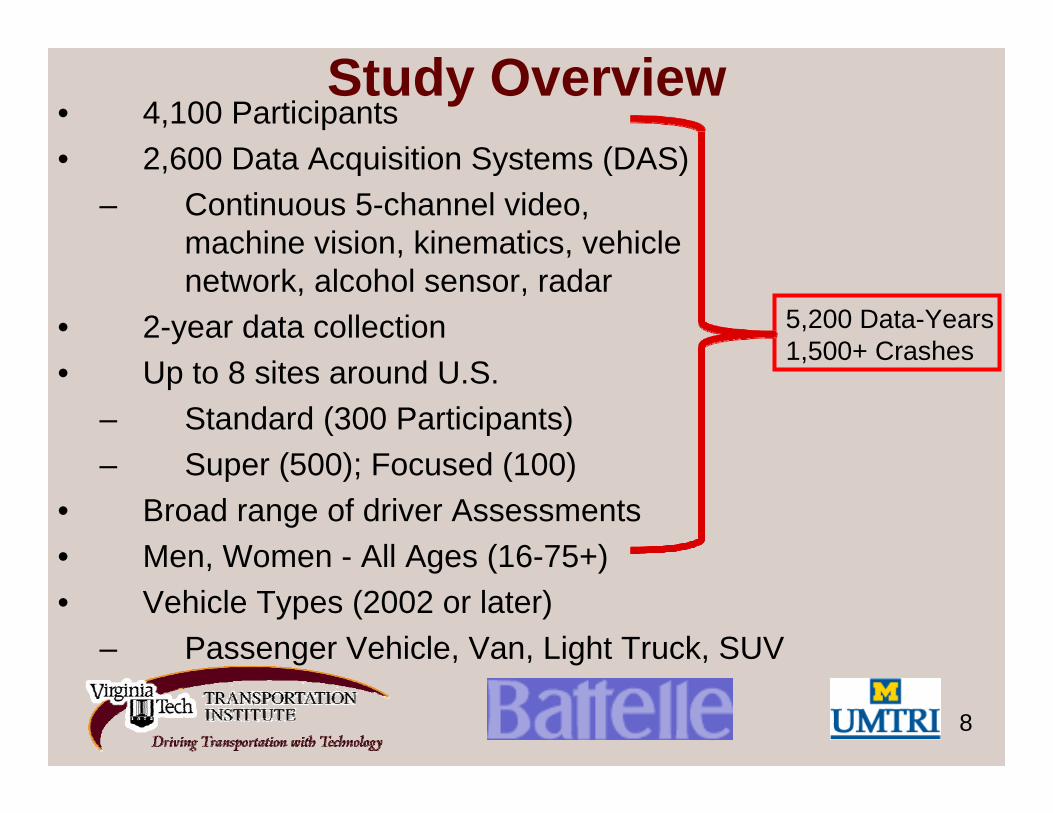
Study Overview• 4,100 Participants• 2,600 Data Acquisition Systems (DAS)
– Continuous 5-channel video, machine vision, kinematics, vehiclenetwork, alcohol sensor, radar
• 2-year data collection• Up to 8 sites around U.S.
– Standard (300 Participants)– Super (500); Focused (100)
• Broad range of driver Assessments• Men, Women - All Ages (16-75+)• Vehicle Types (2002 or later)
– Passenger Vehicle, Van, Light Truck, SUV
8
5,200 Data-Years1,500+ Crashes
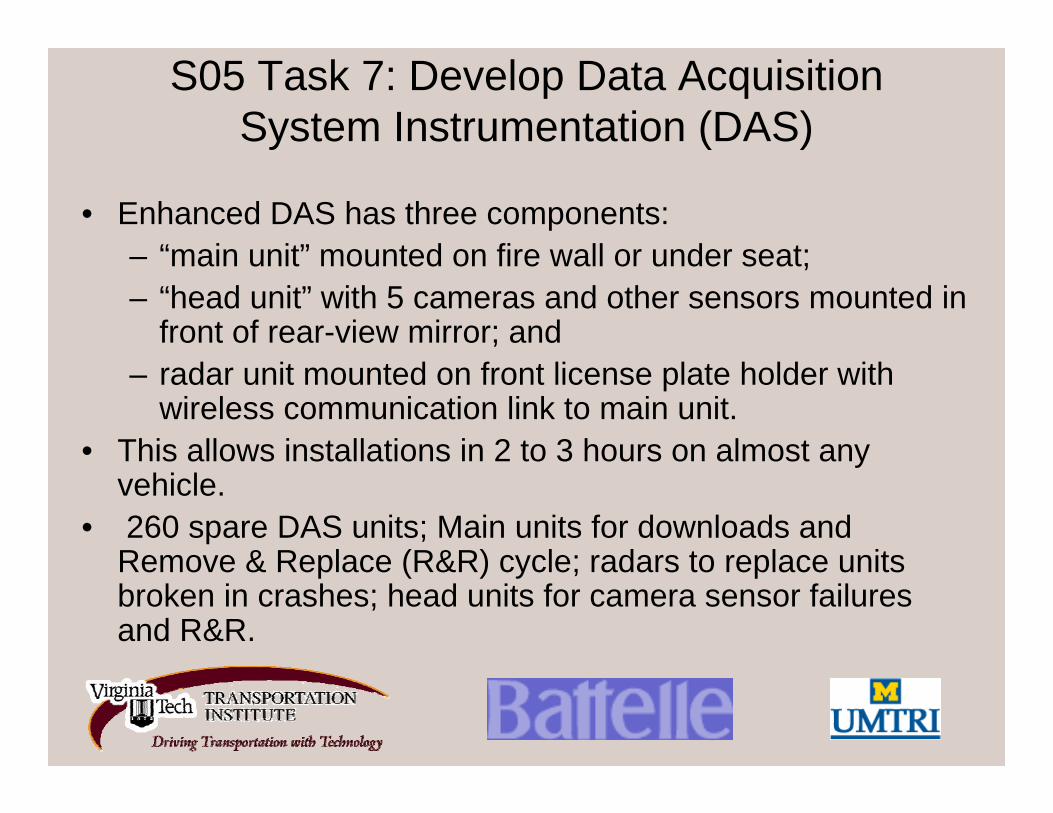
S05 Task 7: Develop Data Acquisition System Instrumentation (DAS)
• Enhanced DAS has three components: – “main unit” mounted on fire wall or under seat;– “head unit” with 5 cameras and other sensors mounted in
front of rear-view mirror; and – radar unit mounted on front license plate holder with
wireless communication link to main unit. • This allows installations in 2 to 3 hours on almost any
vehicle.• 260 spare DAS units; Main units for downloads and
Remove & Replace (R&R) cycle; radars to replace units broken in crashes; head units for camera sensor failures and R&R.
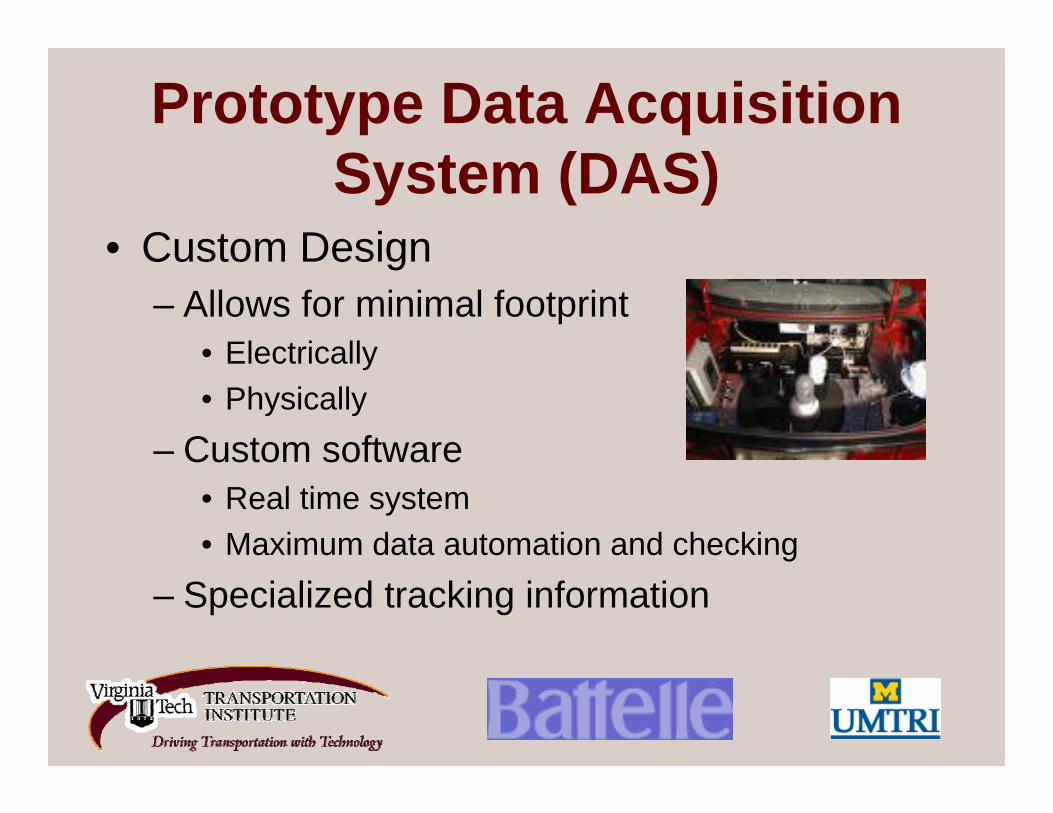
Prototype Data Acquisition System (DAS)
• Custom Design– Allows for minimal footprint
• Electrically • Physically
– Custom software• Real time system• Maximum data automation and checking
– Specialized tracking information
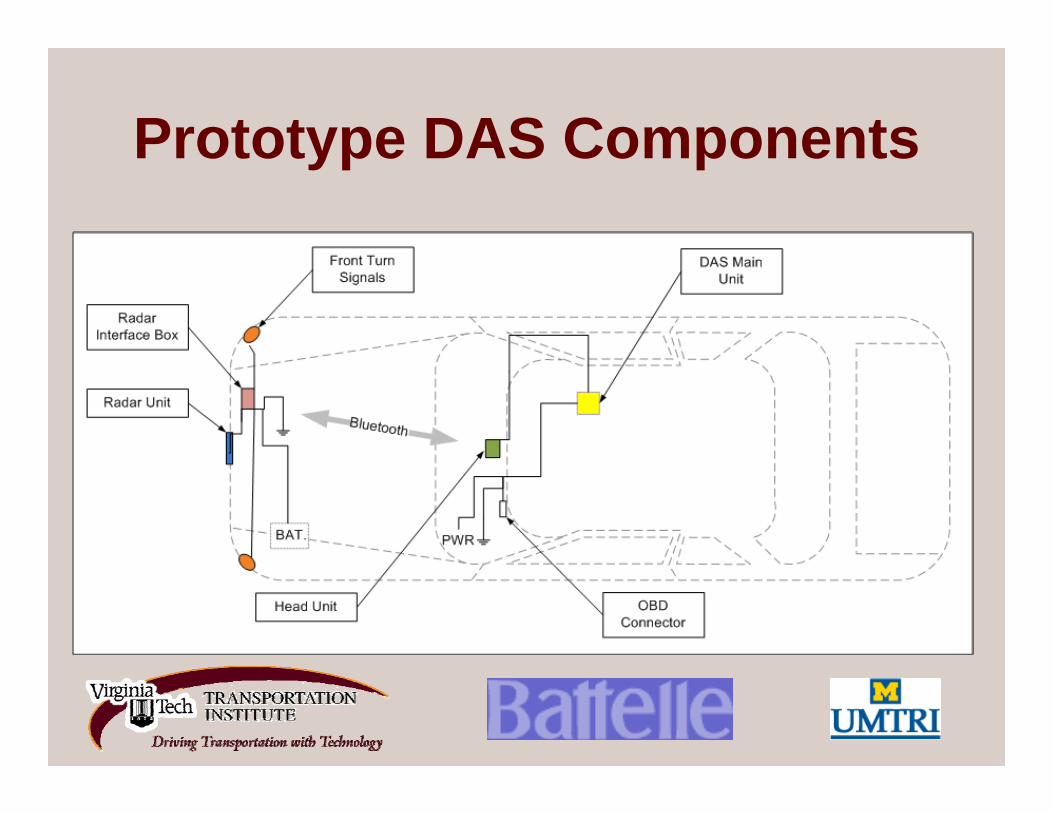
Prototype DAS Components
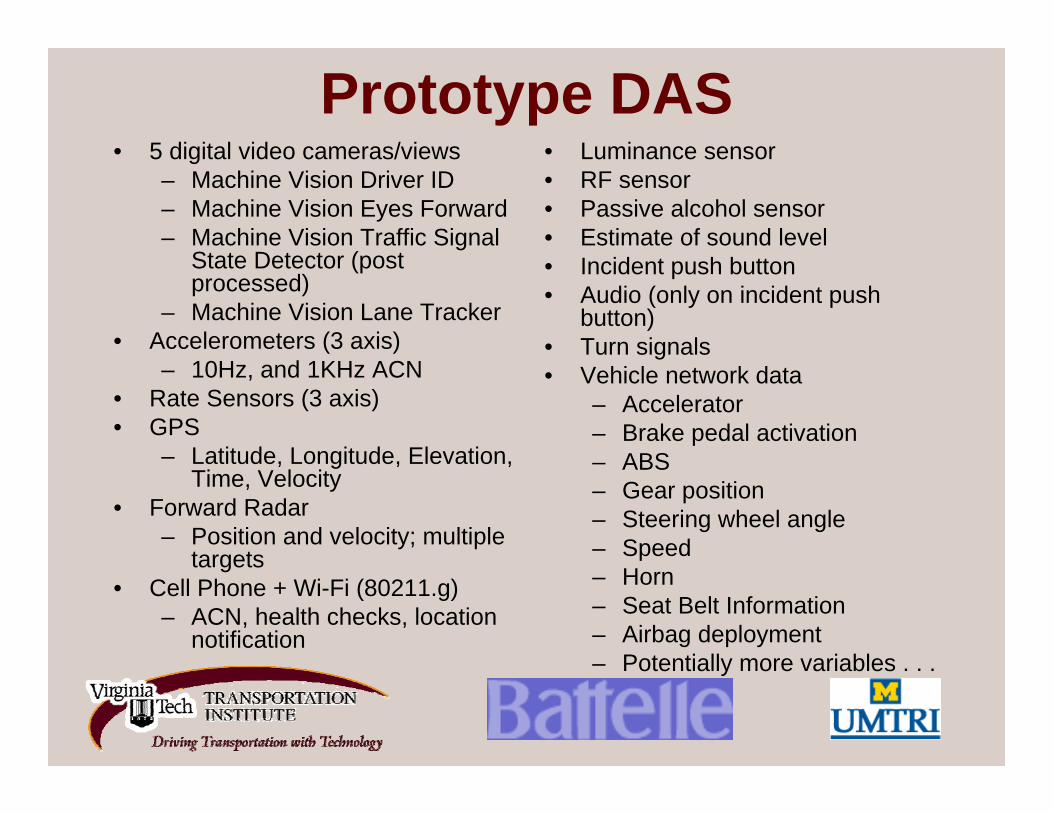
Prototype DAS• 5 digital video cameras/views
– Machine Vision Driver ID – Machine Vision Eyes Forward– Machine Vision Traffic Signal
State Detector (post processed)
– Machine Vision Lane Tracker• Accelerometers (3 axis)
– 10Hz, and 1KHz ACN• Rate Sensors (3 axis)• GPS
– Latitude, Longitude, Elevation, Time, Velocity
• Forward Radar– Position and velocity; multiple
targets• Cell Phone + Wi-Fi (80211.g)
– ACN, health checks, location notification
• Luminance sensor• RF sensor • Passive alcohol sensor• Estimate of sound level• Incident push button• Audio (only on incident push
button)• Turn signals• Vehicle network data
– Accelerator– Brake pedal activation– ABS– Gear position– Steering wheel angle– Speed– Horn– Seat Belt Information– Airbag deployment– Potentially more variables . . .
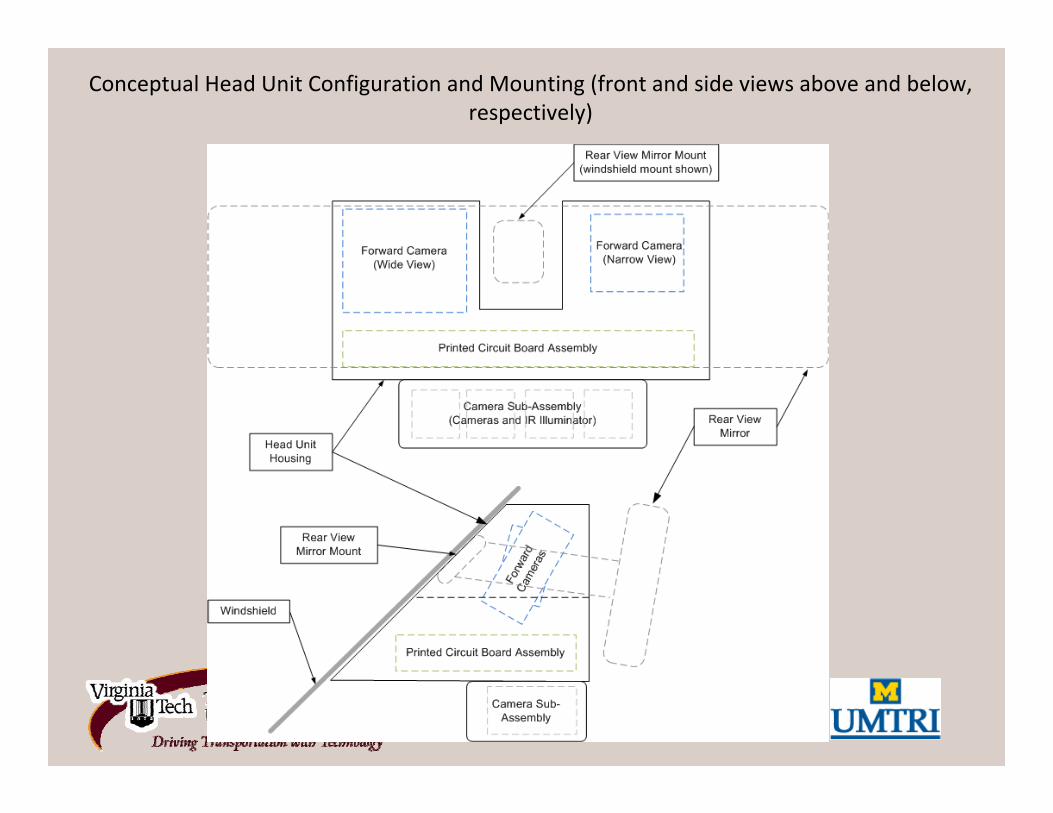
Conceptual Head Unit Configuration and Mounting (front and side views above and below, respectively)
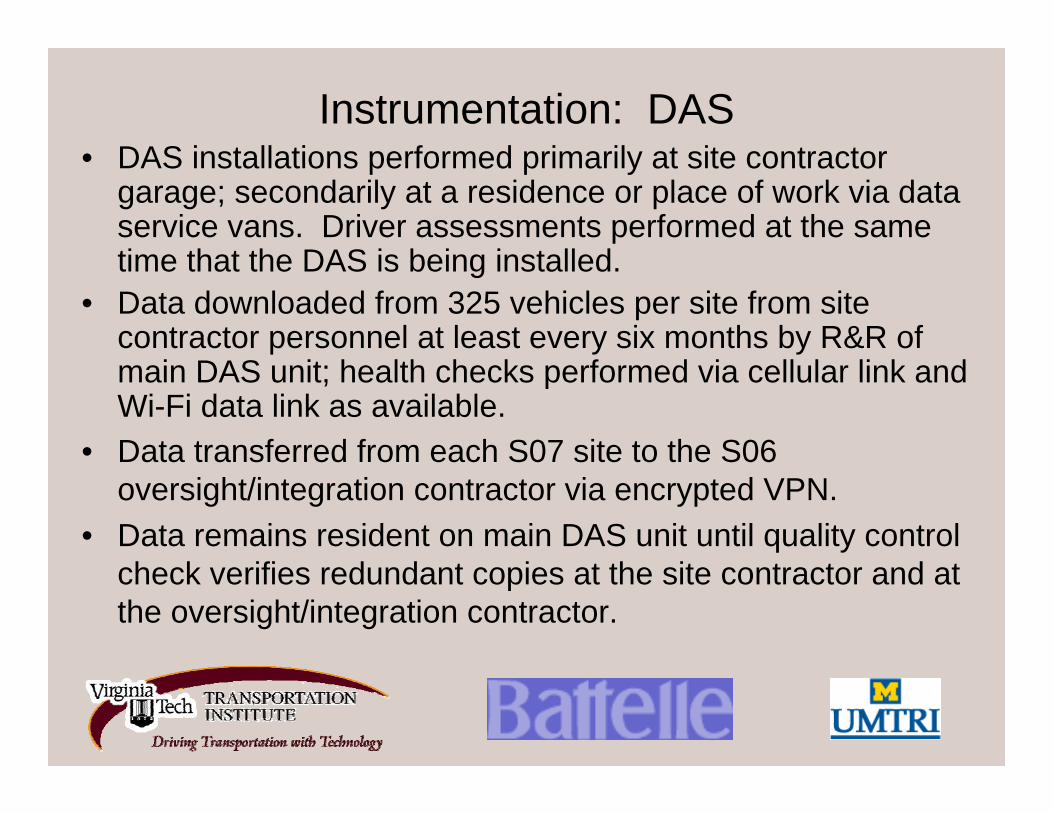
Instrumentation: DAS• DAS installations performed primarily at site contractor
garage; secondarily at a residence or place of work via data service vans. Driver assessments performed at the same time that the DAS is being installed.
• Data downloaded from 325 vehicles per site from site contractor personnel at least every six months by R&R of main DAS unit; health checks performed via cellular link and Wi-Fi data link as available.
• Data transferred from each S07 site to the S06 oversight/integration contractor via encrypted VPN.
• Data remains resident on main DAS unit until quality control check verifies redundant copies at the site contractor and at the oversight/integration contractor.
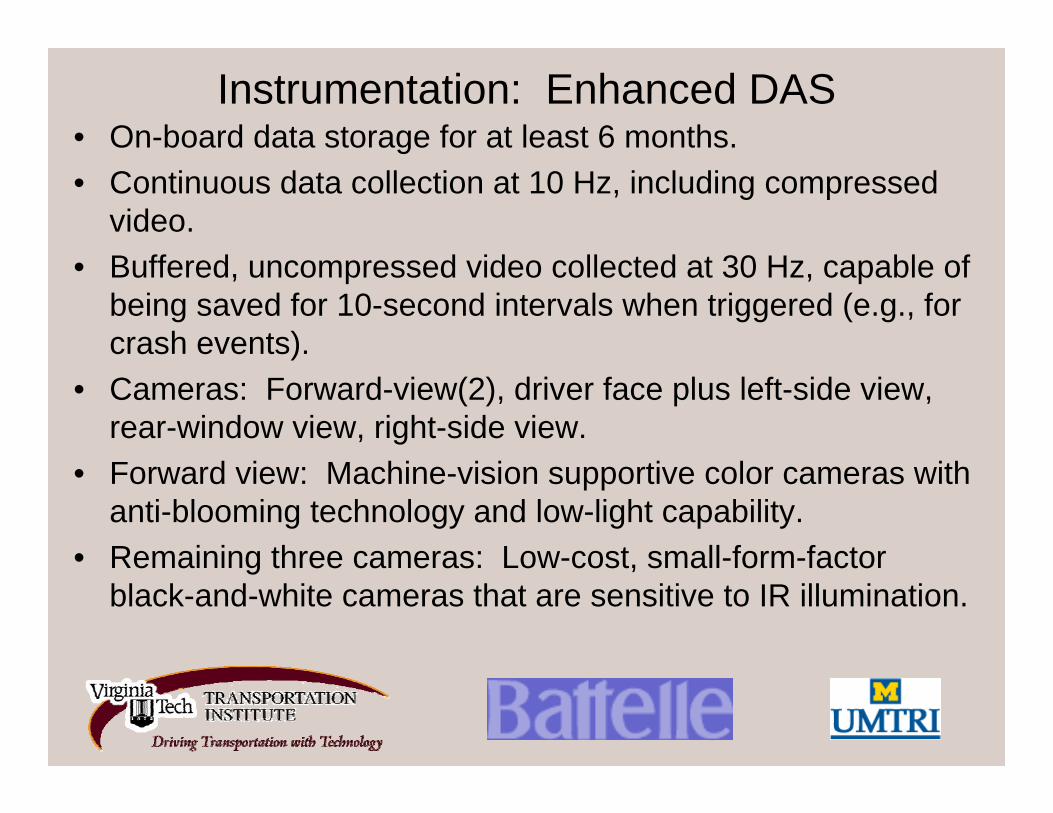
Instrumentation: Enhanced DAS• On-board data storage for at least 6 months.• Continuous data collection at 10 Hz, including compressed
video.• Buffered, uncompressed video collected at 30 Hz, capable of
being saved for 10-second intervals when triggered (e.g., for crash events).
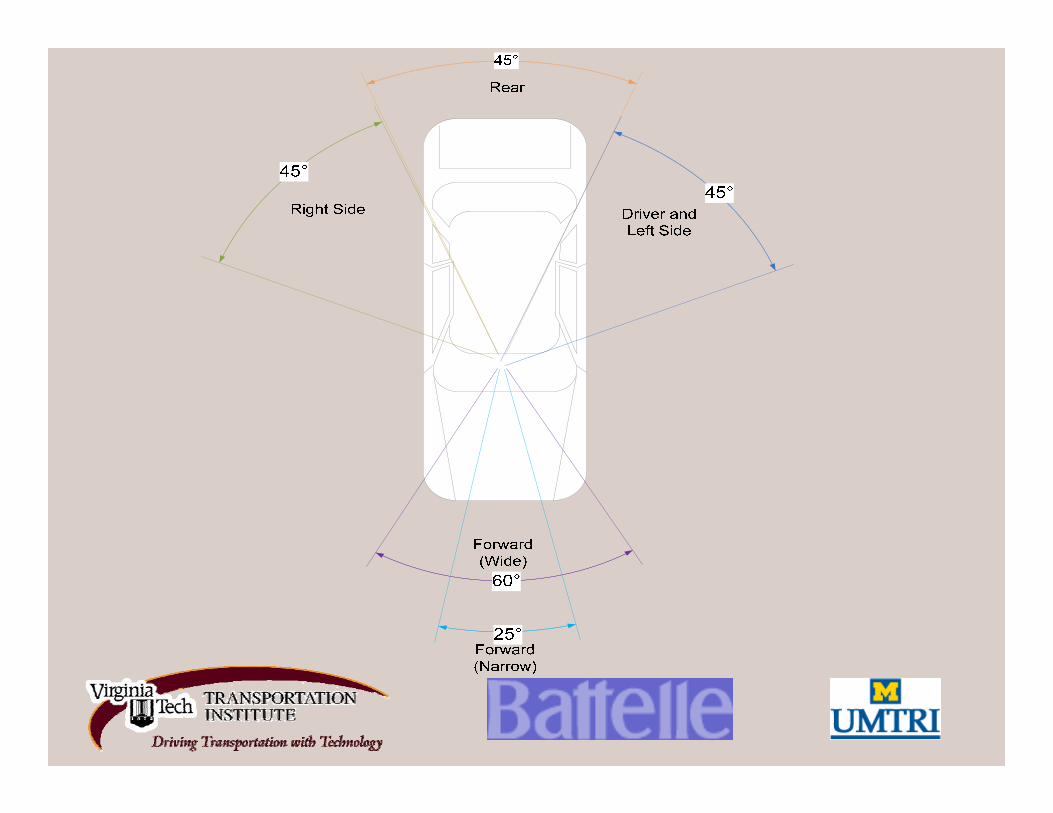
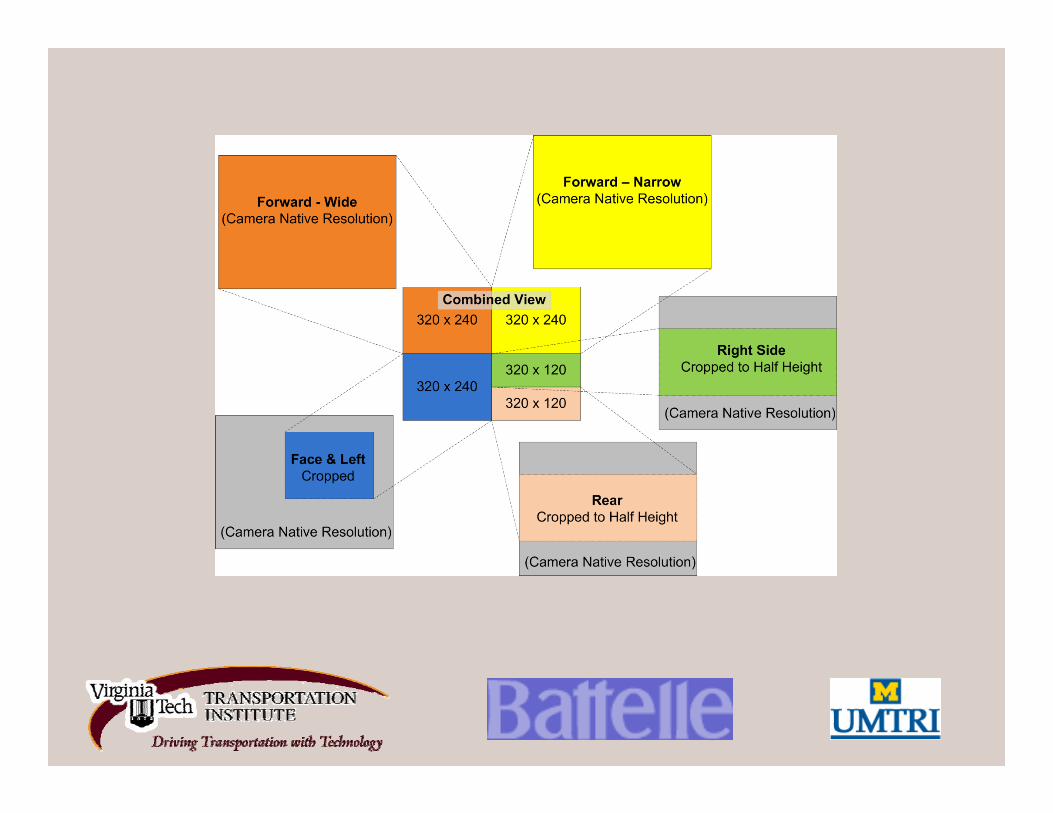
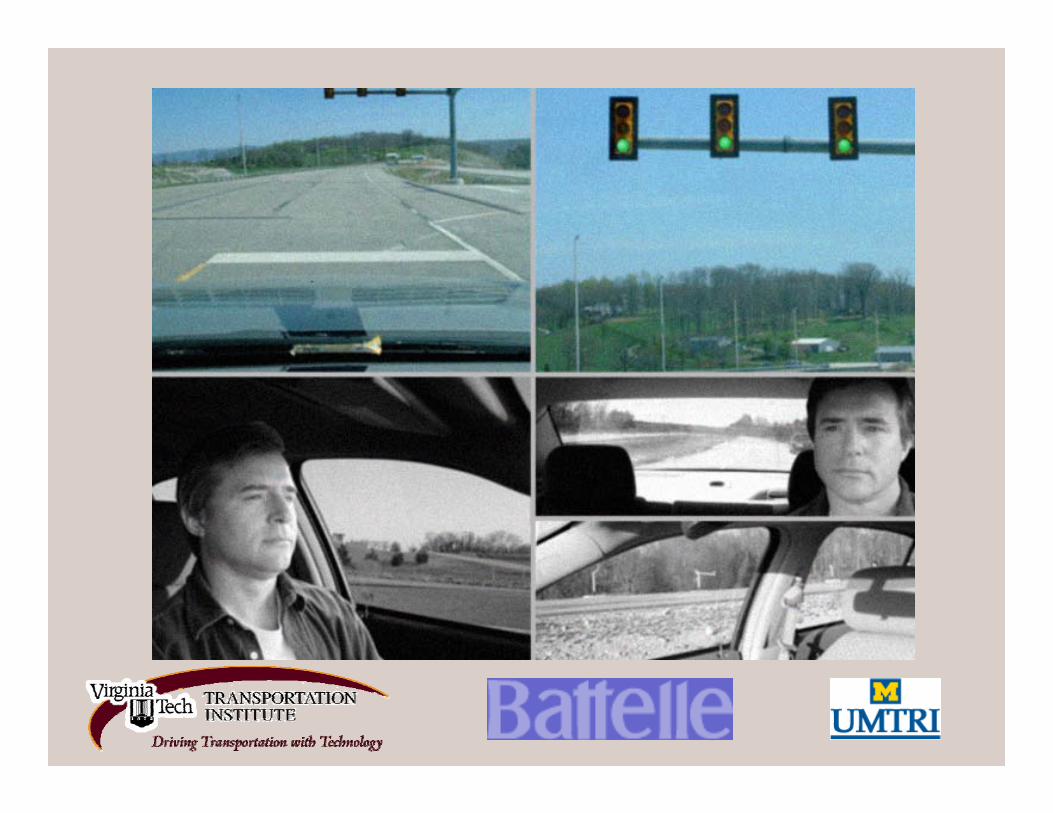
• Cameras: Forward-view(2), driver face plus left-side view, rear-window view, right-side view.
• Forward view: Machine-vision supportive color cameras with anti-blooming technology and low-light capability.
• Remaining three cameras: Low-cost, small-form-factor black-and-white cameras that are sensitive to IR illumination.
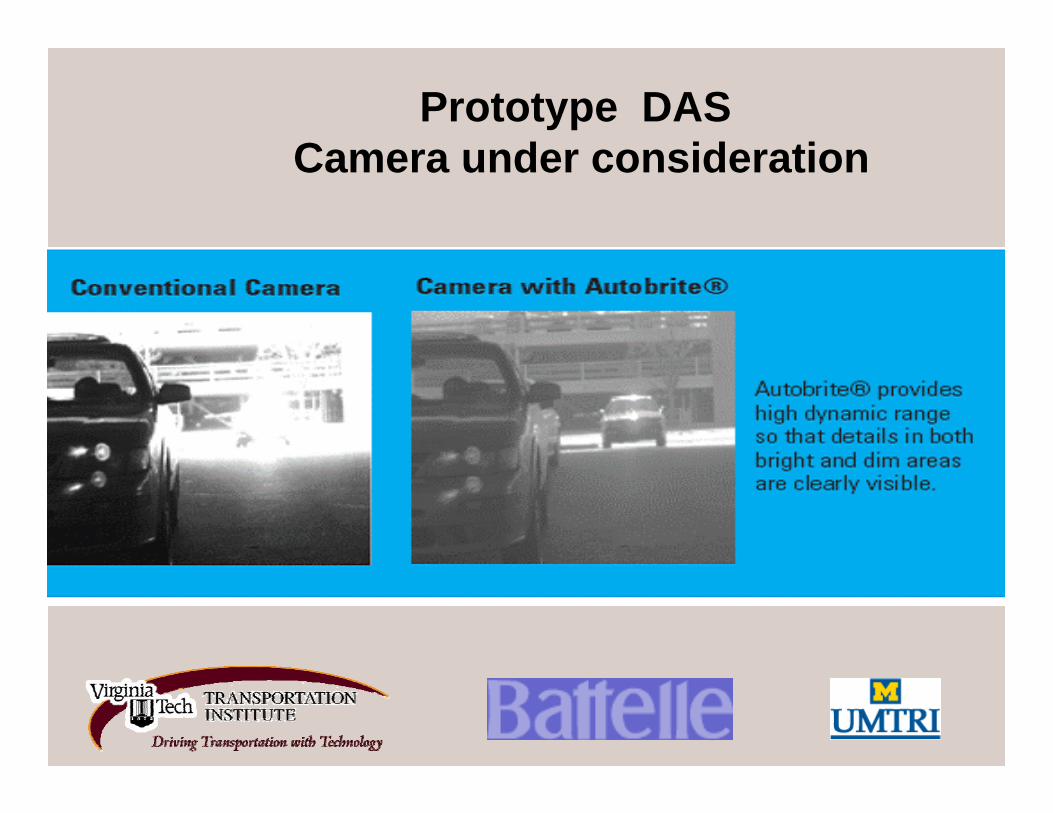
Prototype DASCamera under consideration
Prototype Lane Tracker: Current VTTI System
• Data can work in real time (full resolution) and post process (compressed, lower resolution
• Produces numeric values for use in database• Markers indicate lane changes• System distinguishes lane type (solid, dashed,
double, etc.)• System determines if camera is centered to
vehicle• System continuously calibrates and assess its
confidence levels
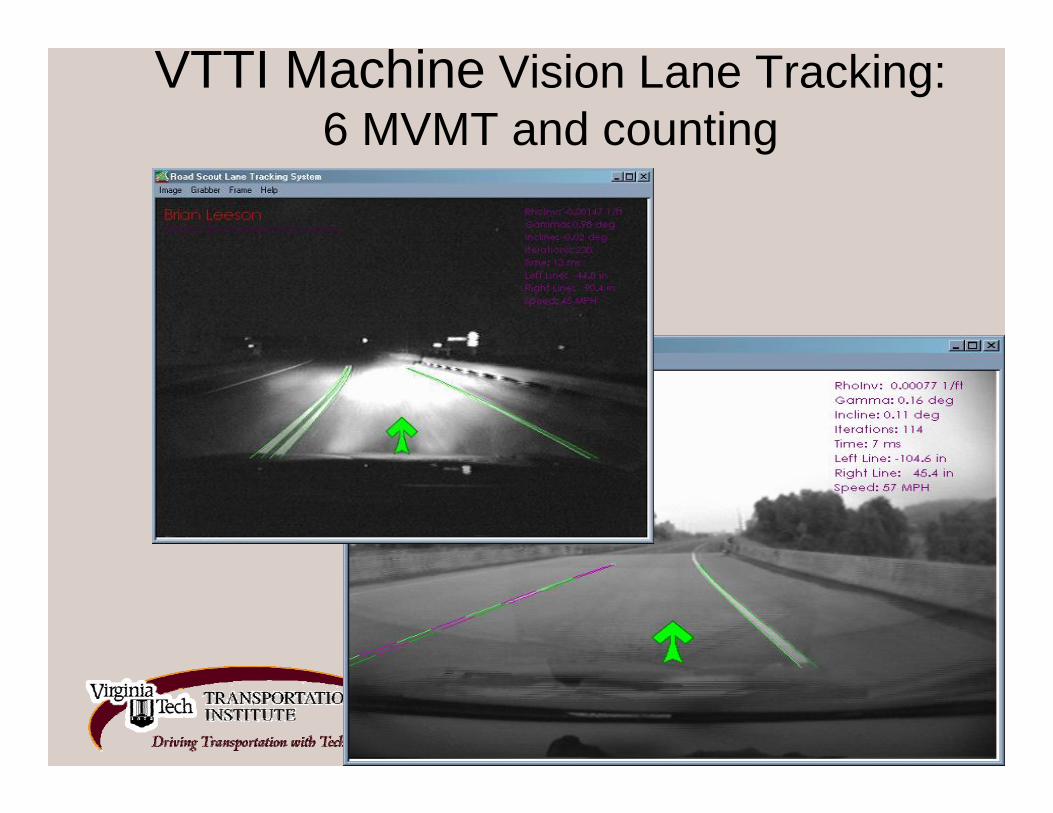
VTTI Machine Vision Lane Tracking: 6 MVMT and counting
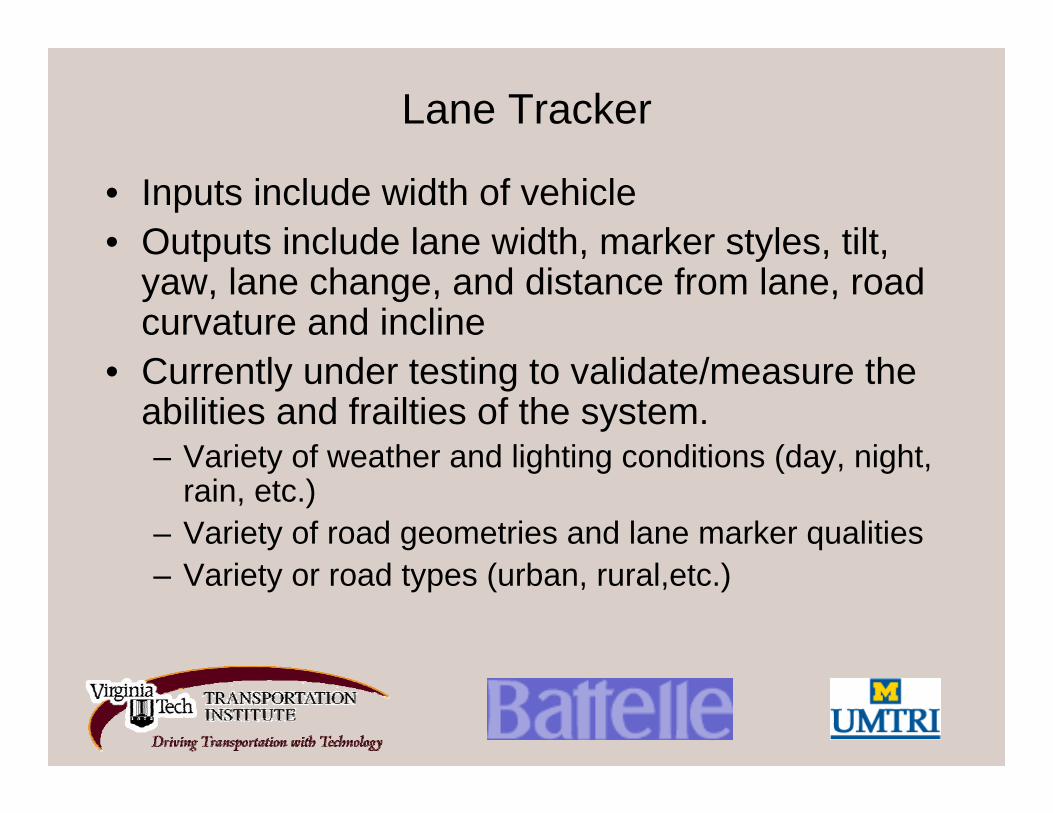
Lane Tracker
• Inputs include width of vehicle• Outputs include lane width, marker styles, tilt,
yaw, lane change, and distance from lane, road curvature and incline
• Currently under testing to validate/measure the abilities and frailties of the system.– Variety of weather and lighting conditions (day, night,
rain, etc.)– Variety of road geometries and lane marker qualities– Variety or road types (urban, rural,etc.)
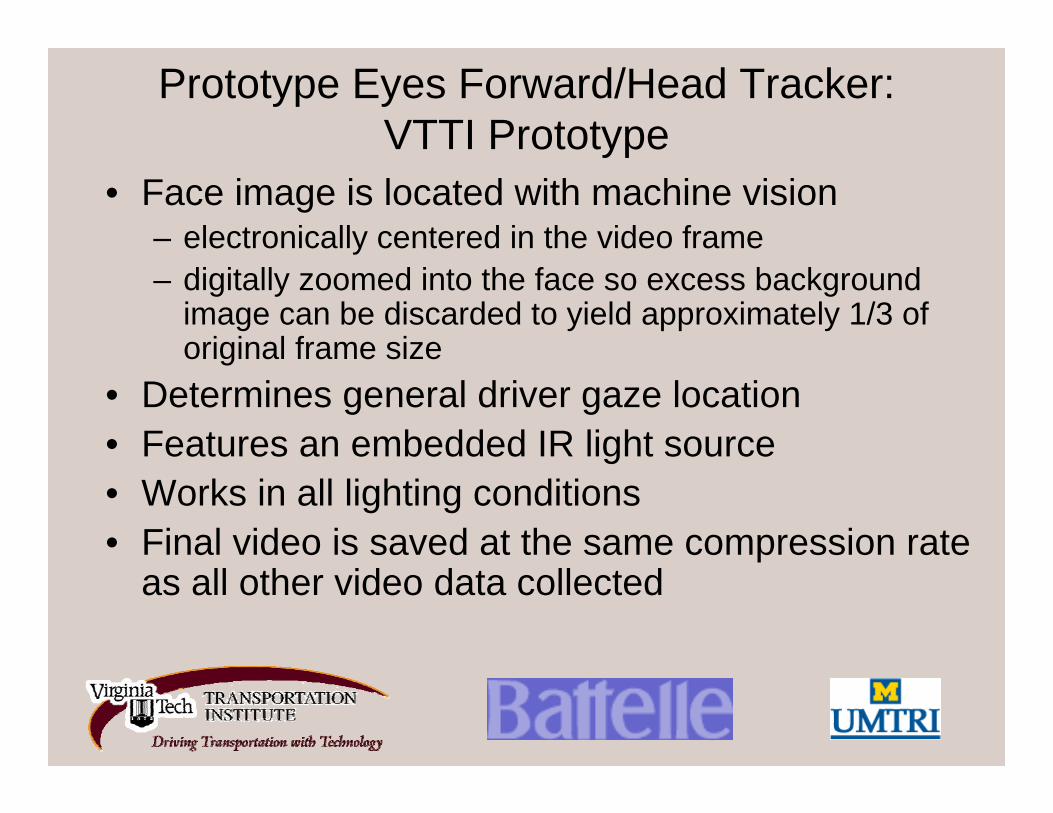
Prototype Eyes Forward/Head Tracker: VTTI Prototype
• Face image is located with machine vision– electronically centered in the video frame – digitally zoomed into the face so excess background
image can be discarded to yield approximately 1/3 of original frame size
• Determines general driver gaze location• Features an embedded IR light source • Works in all lighting conditions • Final video is saved at the same compression rate
as all other video data collected
Traffic Signal State Detector: UMTRI post-hoc system under development
• First prototype stage• Post-hoc use of compressed forward scene
images and vehicle data to determine the presence and signal state of traffic signals
• Can be used to locate vehicle with respect to the intersection
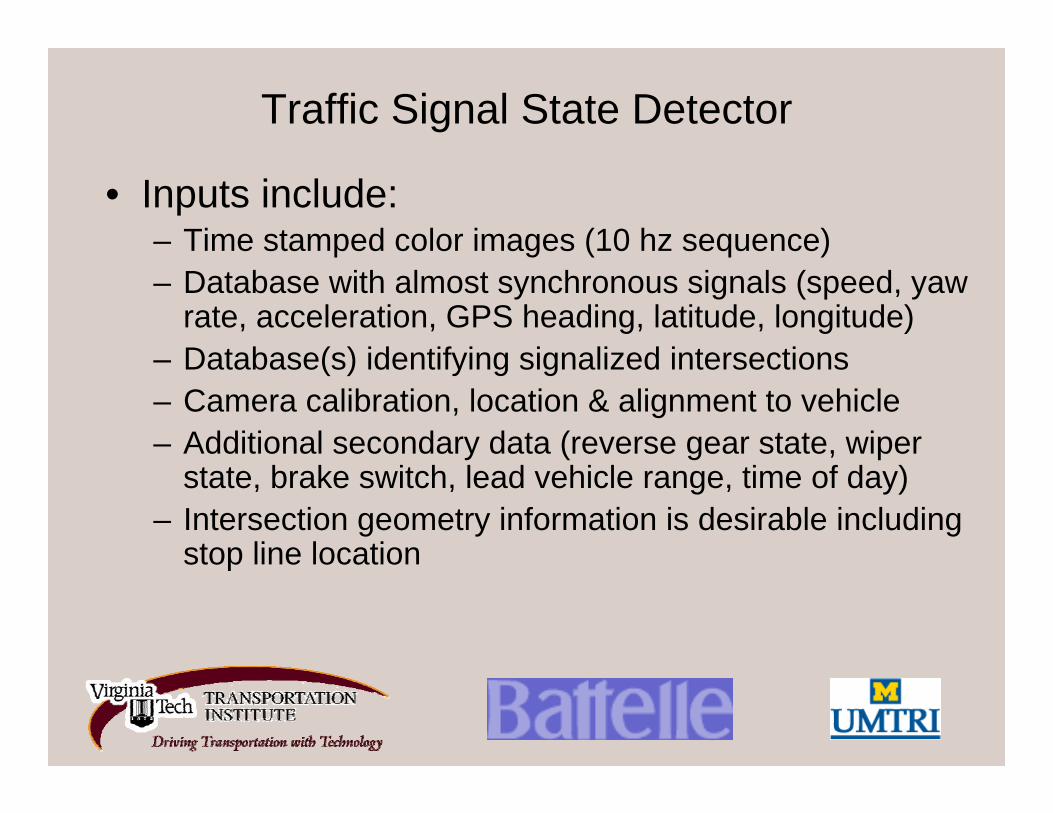
Traffic Signal State Detector
• Inputs include:– Time stamped color images (10 hz sequence)– Database with almost synchronous signals (speed, yaw
rate, acceleration, GPS heading, latitude, longitude)– Database(s) identifying signalized intersections– Camera calibration, location & alignment to vehicle– Additional secondary data (reverse gear state, wiper
state, brake switch, lead vehicle range, time of day)– Intersection geometry information is desirable including
stop line location
Traffic Signal State Detector
• Outputs include:– Log changes in signal status (Presence of traffic signal,
Signal state for vehicle’s turning movement (R, Y, G), Indicator type (flashing, arrow or circular), Confidences in allof the above)
– Associate signal faces with intersection(s) and turning movements
– Location of intersection stop line and/or point at which crossing lanes would be intruded upon
– Database tables which note epochs with different signal status values, assign indices for face intersection and turning movement, and note locations of stop lines/point of intrusion into crossing path.
One key to SHRP2’s success is access to variables from the vehicle network
• Logistically we cannot instrument the vehicles to capture all the desired information within our time/resource constraints.
• The more information that can be obtained from the vehicle network the more potential uses there are for this data– Consider this information in the context of what you are
interested in as a potential user of the system– National resource
• Request for network information was made by SHRP 2 staff to the Auto Alliances
Alliance of Auto Manufacturers• Use 2002 or newer models• Add permission to get EDR data to IRB form -- Complete• Provide radar specification – Complete• Provide accuracy timing requirements for DAS info. • It maybe difficult to get network information from any
vehicle– May need to give preference to vehicles with more critical
network information available– Potential sampling concerns doing this that will need to be
worked through
• Identify subset of desired models from each manufacturer

Association of International Auto Manufacturers
• Work with subset of vehicles• Beginning to work with individual
manufacturers to establish details of data logistics
Automatic System Health Status
• Status Information– Hard Drive Status– Measured Data Status– Camera Status
• Communicate via Wi-Fi or Cellular• Provides the ability to chart the progress of
the study
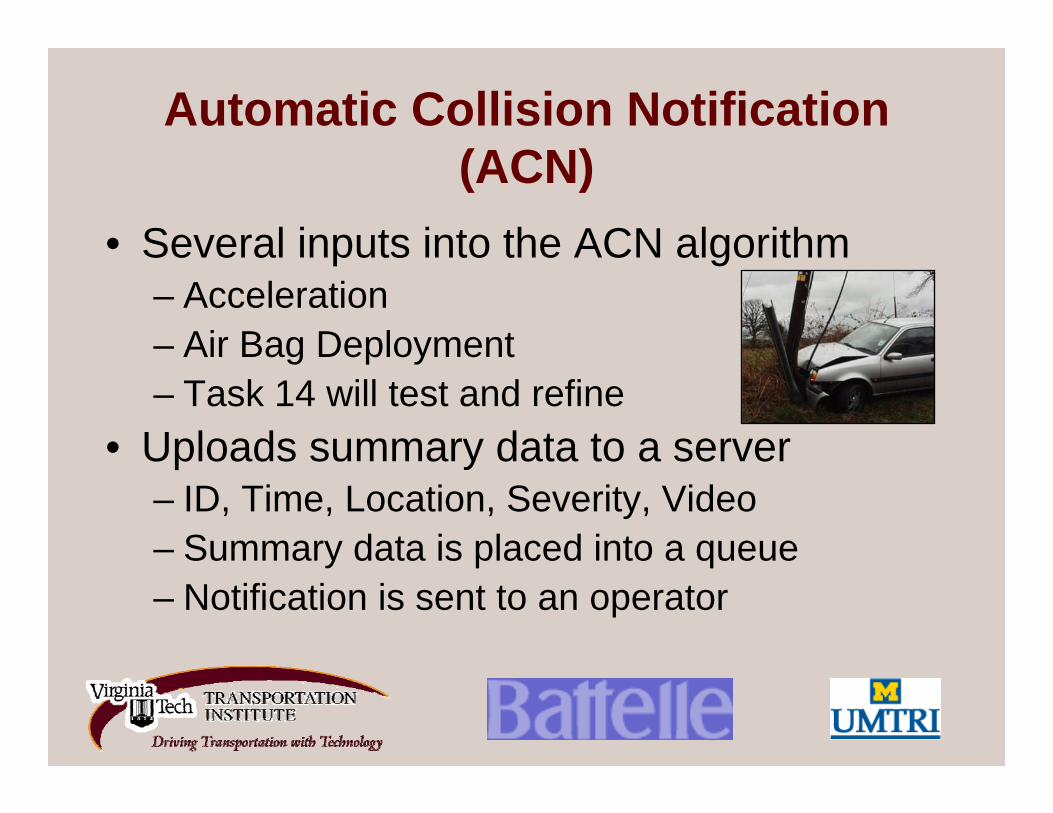
Automatic Collision Notification (ACN)
• Several inputs into the ACN algorithm– Acceleration– Air Bag Deployment– Task 14 will test and refine
• Uploads summary data to a server– ID, Time, Location, Severity, Video– Summary data is placed into a queue– Notification is sent to an operator
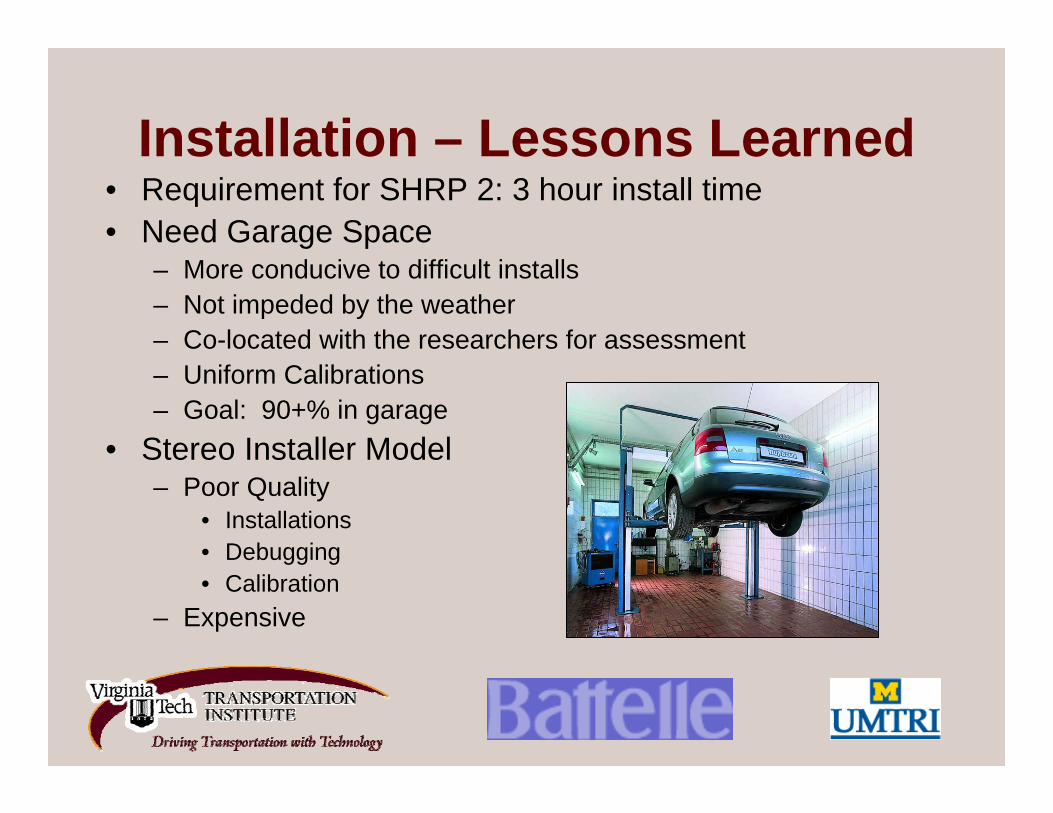
Installation – Lessons Learned• Requirement for SHRP 2: 3 hour install time• Need Garage Space
– More conducive to difficult installs– Not impeded by the weather– Co-located with the researchers for assessment– Uniform Calibrations– Goal: 90+% in garage
• Stereo Installer Model– Poor Quality
• Installations • Debugging• Calibration
– Expensive
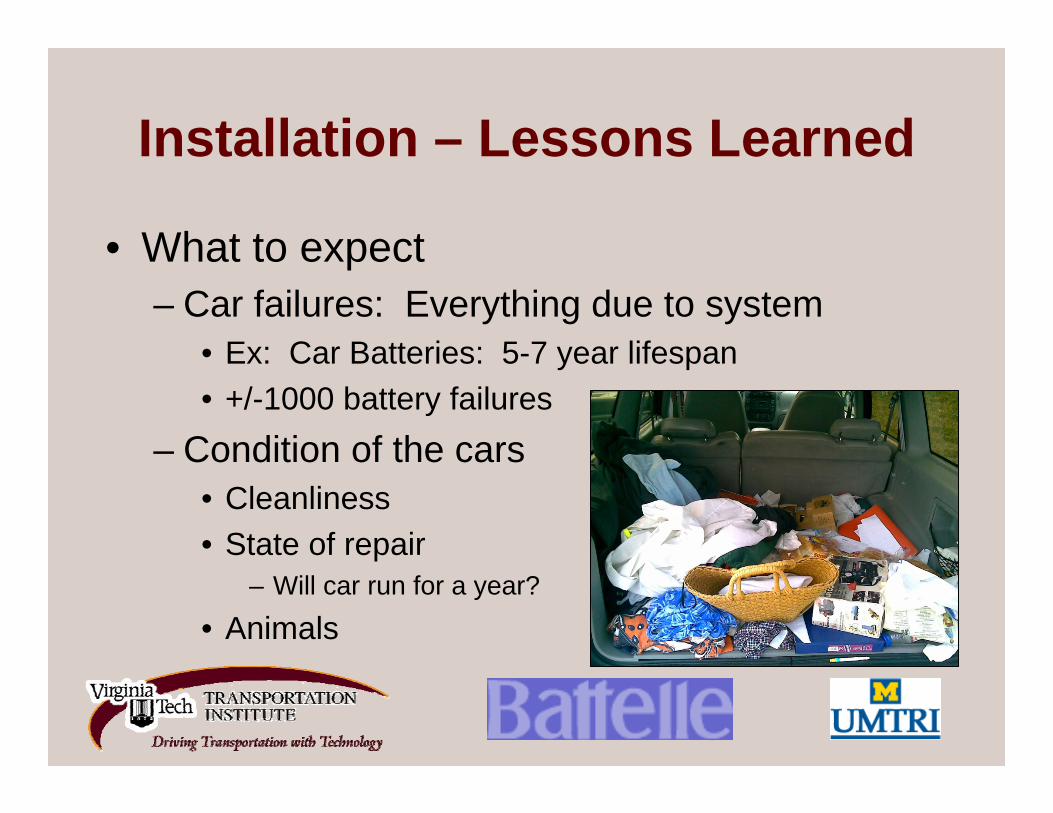
Installation – Lessons Learned
• What to expect– Car failures: Everything due to system
• Ex: Car Batteries: 5-7 year lifespan• +/-1000 battery failures
– Condition of the cars • Cleanliness • State of repair
– Will car run for a year?
• Animals
Sample Design Summary
– Task 1 (Research Questions)– Task 2 (Analysis Planning/Analysis
Methods)– Task 3 (Sample Design)– Task 4 (Sample Design Interim
Report)
S05 Sample Design Recommendation Process
• Research questions were used to generate top level requirements
• Trade-off analyses were conducted to identify projects needs/wants and feasible alternatives
• Cost estimate model was developed and used to evaluate each tradeoff
• Three sampling statisticians were added to project team to consult on each tradeoff
S05 Sample Design Recommendations • Target number of vehicles = 2,600 light vehicles of all
types in service for 2 years all with enhanced DAS; 1,500 installed in 2 sets of vehicles for 1 year; 1,100 installed in a single set of vehicles for 2 years.
– Largest sample within project resources: 4,100 primary participants; 5,200 data years; 7,600 total drivers with usable data.
– 3,600 drivers stratified equally by gender and “functionally”(e.g., “teens” or “young adults”) across all ages (16 to 75+ years).
– An additional 500 drivers specially recruited who utilize new and near-future advanced vehicle systems including safety features and telematics.
S05 Sample Design Recommendations• Continuous data collection
– Greatest data flexibility (exposure calc., etc)– Storage availability makes this feasible
• Data stored in raw form as practical– Greatest flexibility for calculating summary measures/surrogates– Video will still require some level of compression, but will be
continuous
• Only light vehicles will be used, however, all light vehicle types (passenger, light truck SUV, mini-van) will be represented.
• “Enhanced DAS” units will be used throughout and will answer the vast majority of the identified research questions.
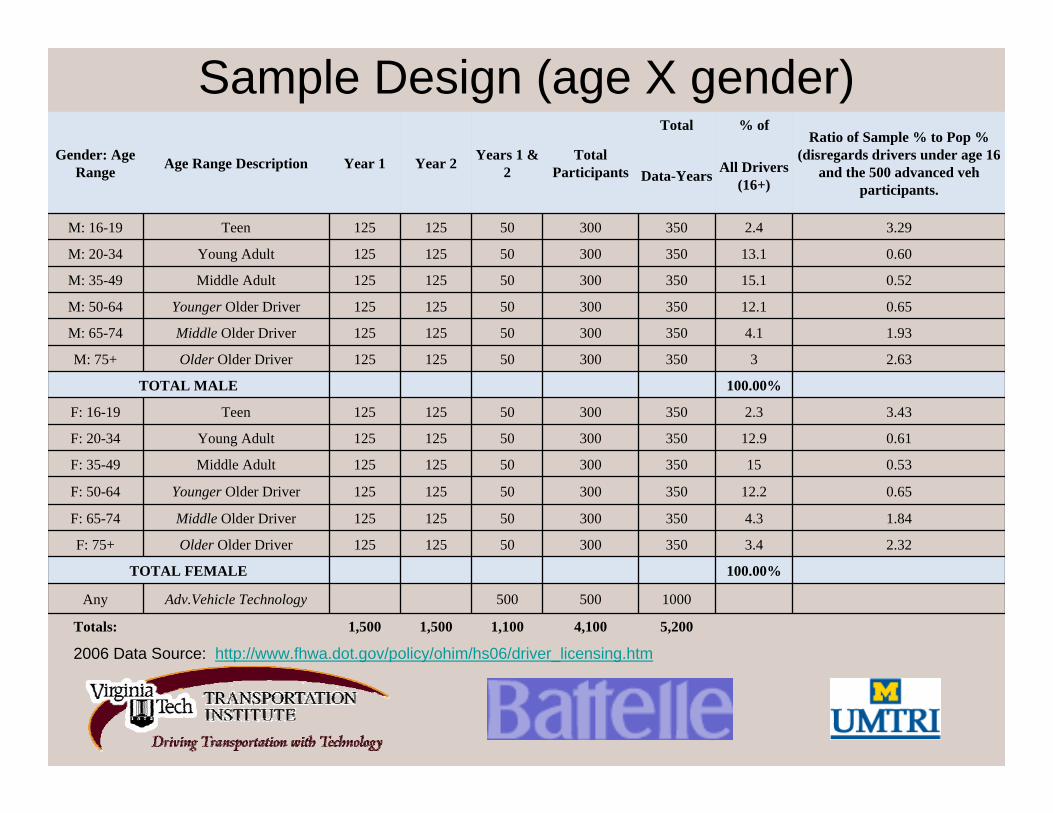
Sample Design (age X gender)
2006 Data Source: http://www.fhwa.dot.gov/policy/ohim/hs06/driver_licensing.htm
Gender: Age Range Age Range Description Year 1 Year 2 Years 1 &
2Total
Participants
Total % of Ratio of Sample % to Pop %
(disregards drivers under age 16 and the 500 advanced veh
participants.Data-Years All Drivers
(16+)
M: 16-19 Teen 125 125 50 300 350 2.4 3.29
M: 20-34 Young Adult 125 125 50 300 350 13.1 0.60
M: 35-49 Middle Adult 125 125 50 300 350 15.1 0.52
M: 50-64 Younger Older Driver 125 125 50 300 350 12.1 0.65
M: 65-74 Middle Older Driver 125 125 50 300 350 4.1 1.93
M: 75+ Older Older Driver 125 125 50 300 350 3 2.63
TOTAL MALE 100.00%
F: 16-19 Teen 125 125 50 300 350 2.3 3.43
F: 20-34 Young Adult 125 125 50 300 350 12.9 0.61
F: 35-49 Middle Adult 125 125 50 300 350 15 0.53
F: 50-64 Younger Older Driver 125 125 50 300 350 12.2 0.65
F: 65-74 Middle Older Driver 125 125 50 300 350 4.3 1.84
F: 75+ Older Older Driver 125 125 50 300 350 3.4 2.32
TOTAL FEMALE 100.00%
Any Adv.Vehicle Technology 500 500 1000
Totals: 1,500 1,500 1,100 4,100 5,200
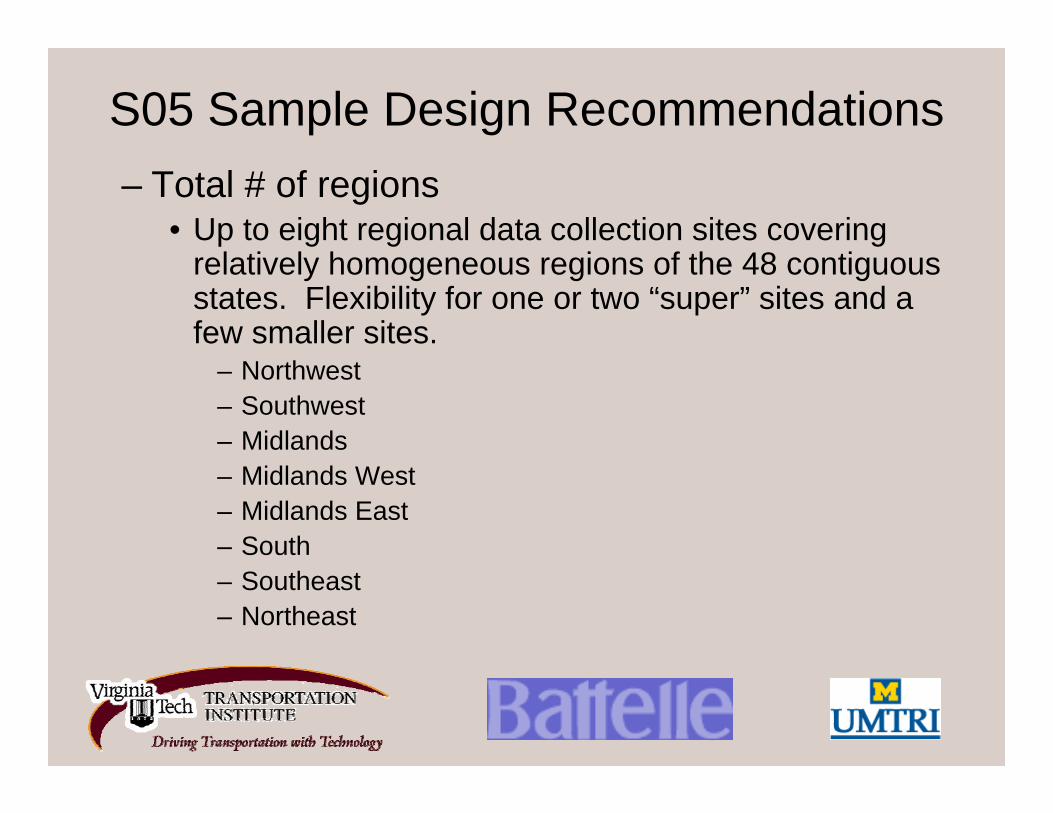
S05 Sample Design Recommendations– Total # of regions
• Up to eight regional data collection sites covering relatively homogeneous regions of the 48 contiguous states. Flexibility for one or two “super” sites and a few smaller sites.
– Northwest– Southwest– Midlands– Midlands West– Midlands East– South– Southeast– Northeast
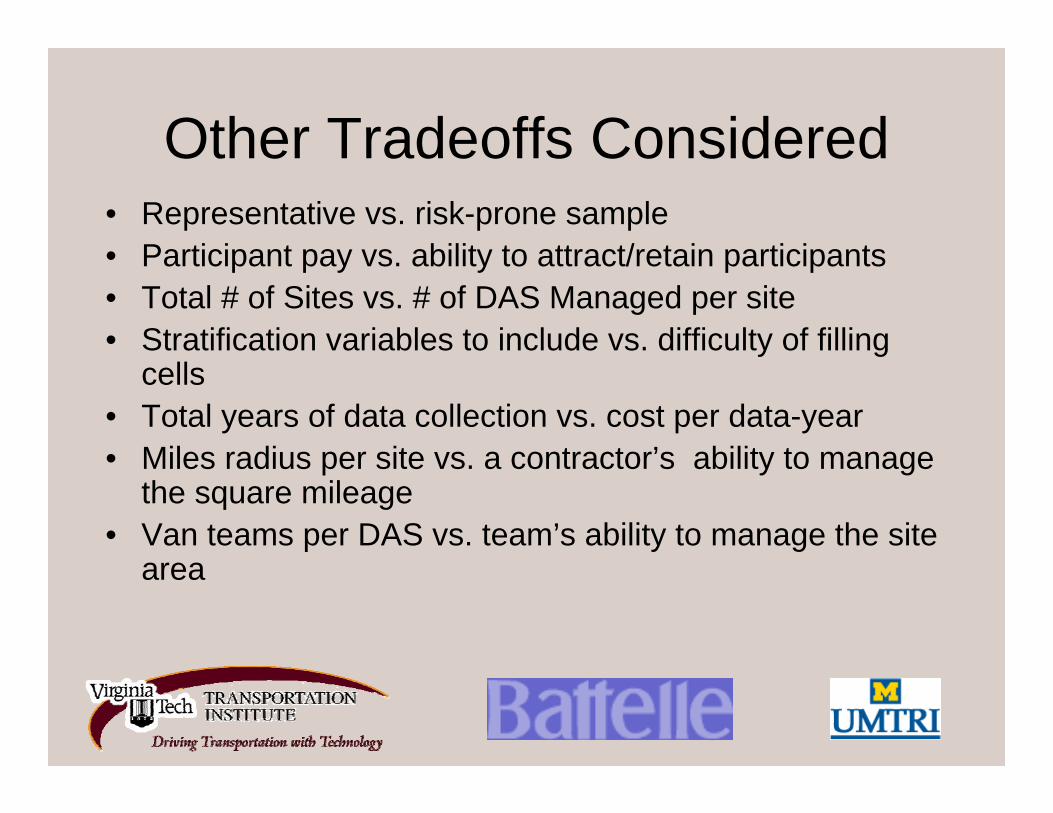
• Representative vs. risk-prone sample• Participant pay vs. ability to attract/retain participants• Total # of Sites vs. # of DAS Managed per site• Stratification variables to include vs. difficulty of filling
cells• Total years of data collection vs. cost per data-year• Miles radius per site vs. a contractor’s ability to manage
the square mileage• Van teams per DAS vs. team’s ability to manage the site
area
Other Tradeoffs Considered
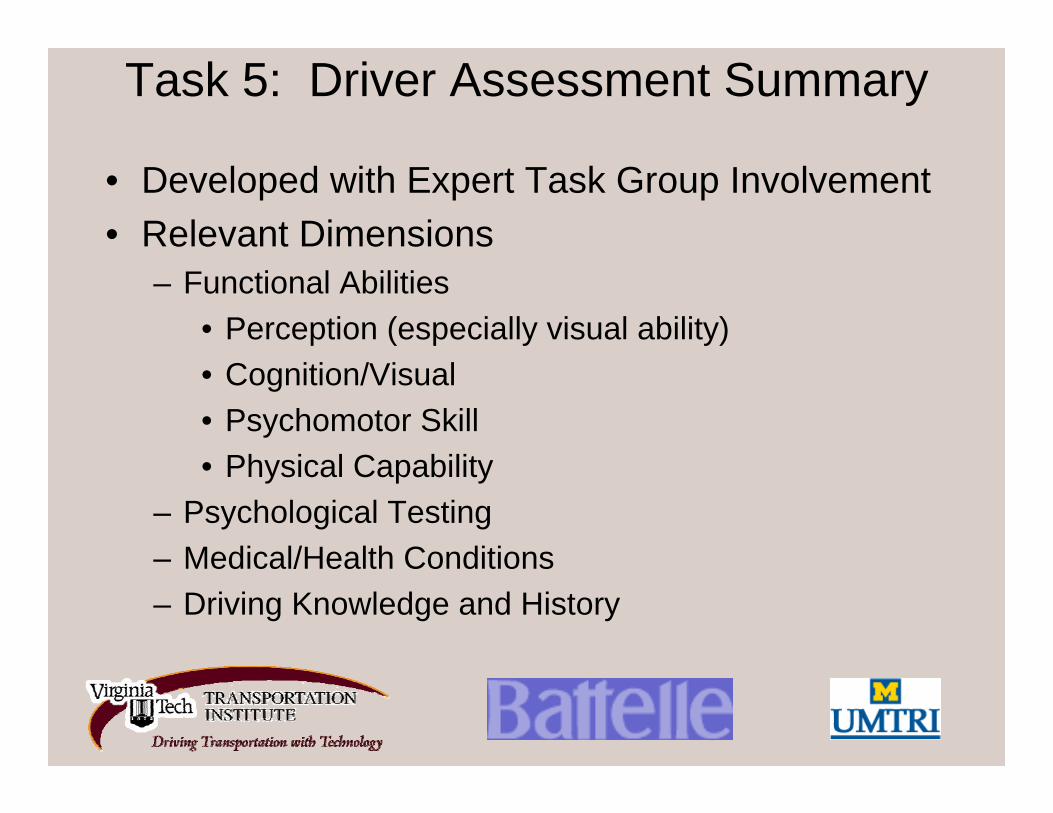
Task 5: Driver Assessment Summary
• Developed with Expert Task Group Involvement• Relevant Dimensions
– Functional Abilities• Perception (especially visual ability)• Cognition/Visual• Psychomotor Skill• Physical Capability
– Psychological Testing – Medical/Health Conditions – Driving Knowledge and History
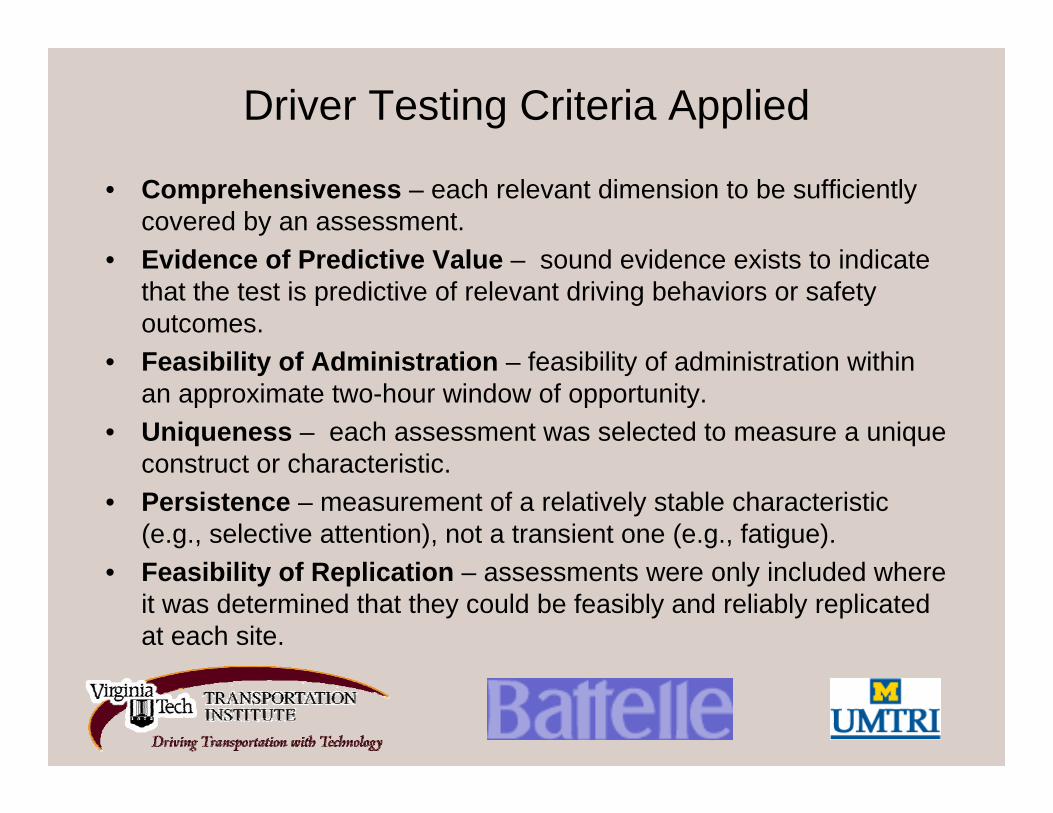
Driver Testing Criteria Applied
• Comprehensiveness – each relevant dimension to be sufficiently covered by an assessment.
• Evidence of Predictive Value – sound evidence exists to indicate that the test is predictive of relevant driving behaviors or safety outcomes.
• Feasibility of Administration – feasibility of administration within an approximate two-hour window of opportunity.
• Uniqueness – each assessment was selected to measure a unique construct or characteristic.
• Persistence – measurement of a relatively stable characteristic (e.g., selective attention), not a transient one (e.g., fatigue).
• Feasibility of Replication – assessments were only included where it was determined that they could be feasibly and reliably replicated at each site.
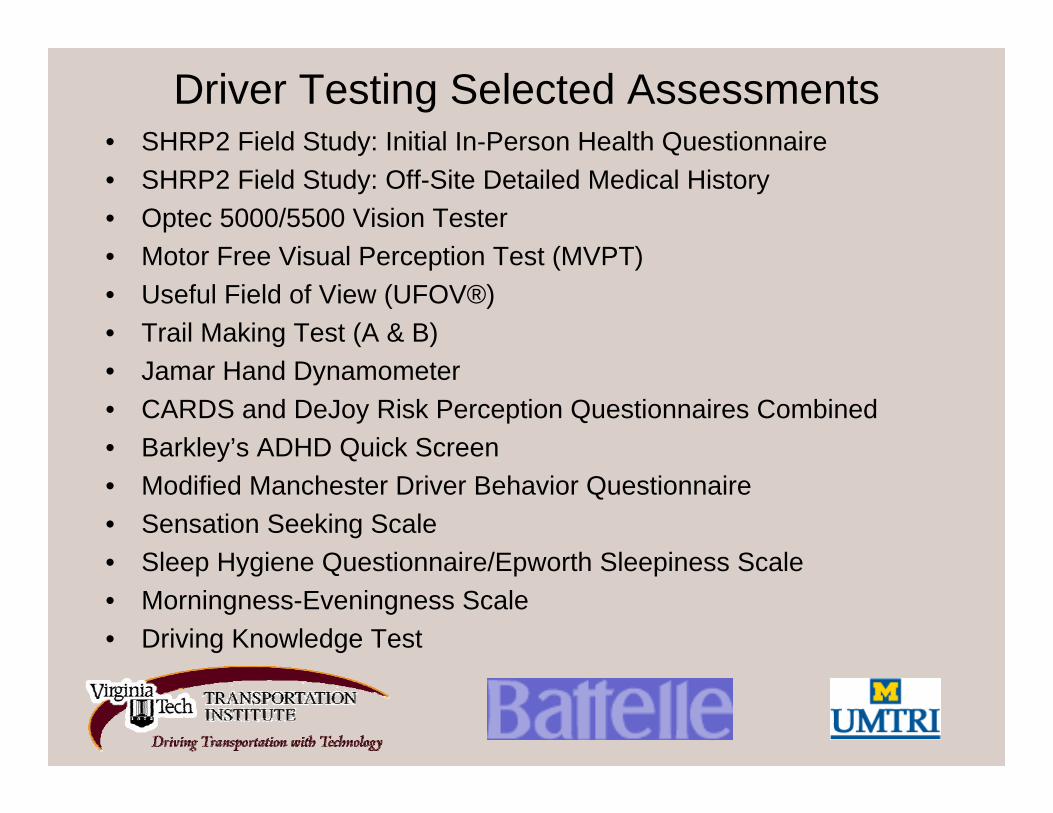
Driver Testing Selected Assessments • SHRP2 Field Study: Initial In-Person Health Questionnaire• SHRP2 Field Study: Off-Site Detailed Medical History• Optec 5000/5500 Vision Tester• Motor Free Visual Perception Test (MVPT)• Useful Field of View (UFOV®) • Trail Making Test (A & B) • Jamar Hand Dynamometer• CARDS and DeJoy Risk Perception Questionnaires Combined• Barkley’s ADHD Quick Screen• Modified Manchester Driver Behavior Questionnaire• Sensation Seeking Scale• Sleep Hygiene Questionnaire/Epworth Sleepiness Scale• Morningness-Eveningness Scale• Driving Knowledge Test
S05 Task 6 Status: Video Automation
Candidate systems operating or under development
• Lane Tracker• Eyes Forward/ Head Tracker• Traffic Signal State Detector• Driver ID
S05 Task 8
Data Collection, Reduction, Integration, Archiving, Processing
and Access
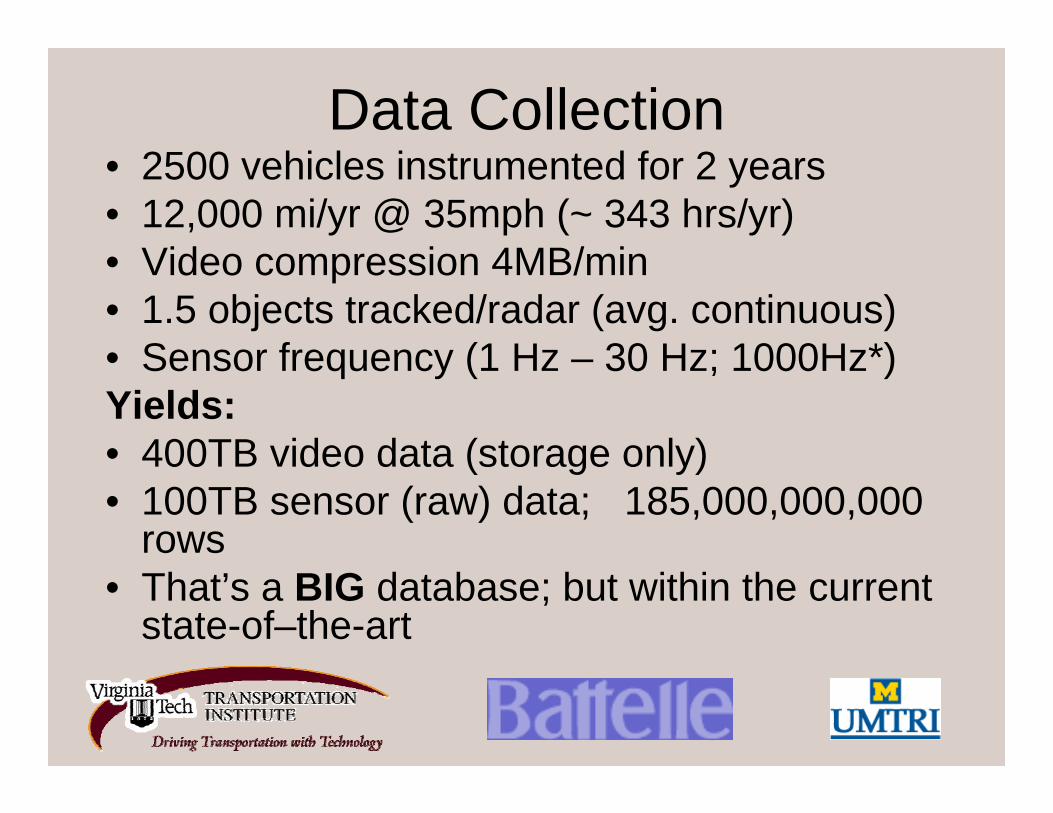
Data Collection• 2500 vehicles instrumented for 2 years• 12,000 mi/yr @ 35mph (~ 343 hrs/yr)• Video compression 4MB/min• 1.5 objects tracked/radar (avg. continuous)• Sensor frequency (1 Hz – 30 Hz; 1000Hz*)Yields:• 400TB video data (storage only)• 100TB sensor (raw) data; 185,000,000,000
rows• That’s a BIG database; but within the current
state-of–the-art
Data Reduction• Raw (sensor) data will be transformed, as
needed, to agreed units of measure and loaded into a database (approximately 500GB/day).
• SQL data access provided by ODBC/JDBC• SQL queries and custom applications will allow
researchers to identify potential events of interest.
• Video reduction may be required to confirm the event and to answer research questions.
Data Integration• Database must support spatial data (Lat/Long)
from GPS to allow integration with other data sources.
• Service-oriented architecture could allow data abstraction and integration with external sources.
• A middleware solution could intercept resource intensive queries from novice users (i.e. -SELECT * FROM 185B rows).
Data Archiving• Data’s research life-span is 30+ years• Data preservation is paramount for all data.• Rotating disks will fail as they age
– RAID (disk) arrays mitigate the risk of losing data, but are subject to catastrophic failure during the time a new disk is installed and the array is restored.
• Restoring a 100TB database from tape could take more than a month.
• Recommend: 2 data centers with data synchronization over a high-speed link.
Data Processing• A vehicle’s collected data will be processed at
one of the regional centers where a strict protocol will ensure it is:– extracted, stored and backed up on a secure
server located at the regional center.– run through a Quality Control process– transferred to the primary Data Center– verified for complete and accurate transfer– loaded into the database (sensor data) or stored on
a file server (video data) in the primary data center.
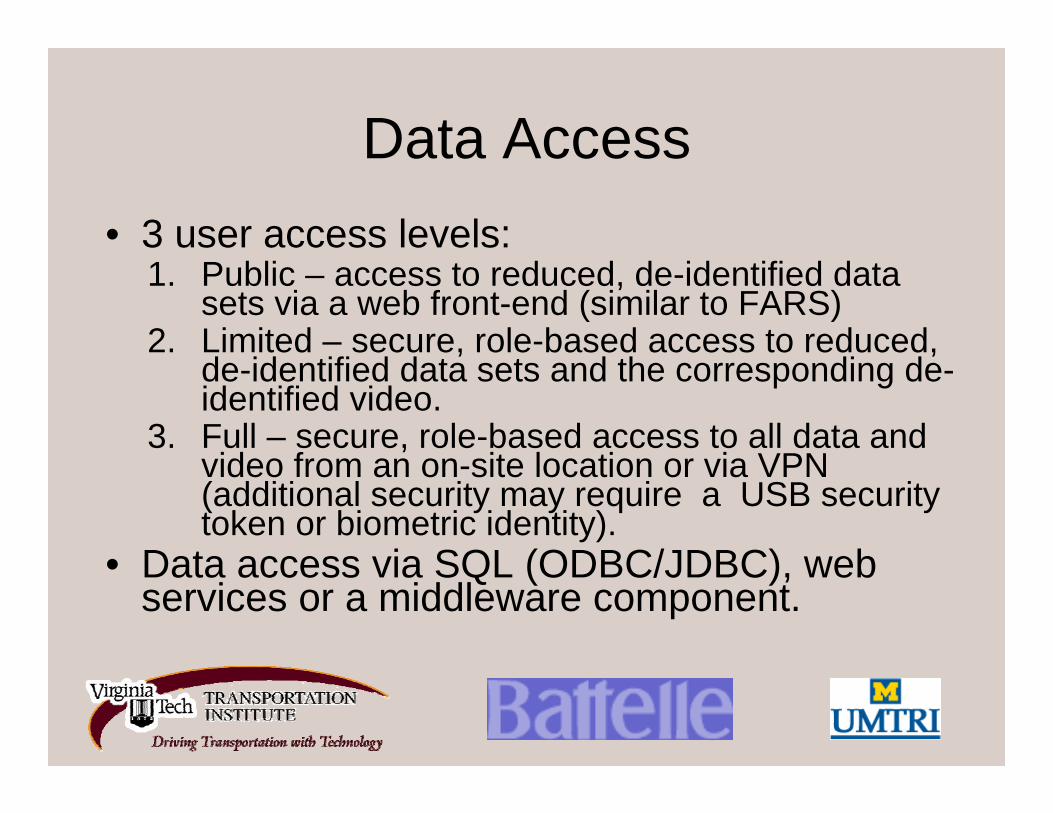
Data Access• 3 user access levels:
1. Public – access to reduced, de-identified data sets via a web front-end (similar to FARS)
2. Limited – secure, role-based access to reduced, de-identified data sets and the corresponding de-identified video.
3. Full – secure, role-based access to all data and video from an on-site location or via VPN (additional security may require a USB security token or biometric identity).
• Data access via SQL (ODBC/JDBC), web services or a middleware component.
User Characteristics• Goal is easy access for a broad range of
users:
From single researcher with minimal resources,
To
Large-scale operations with many available tools and techniques . . . .
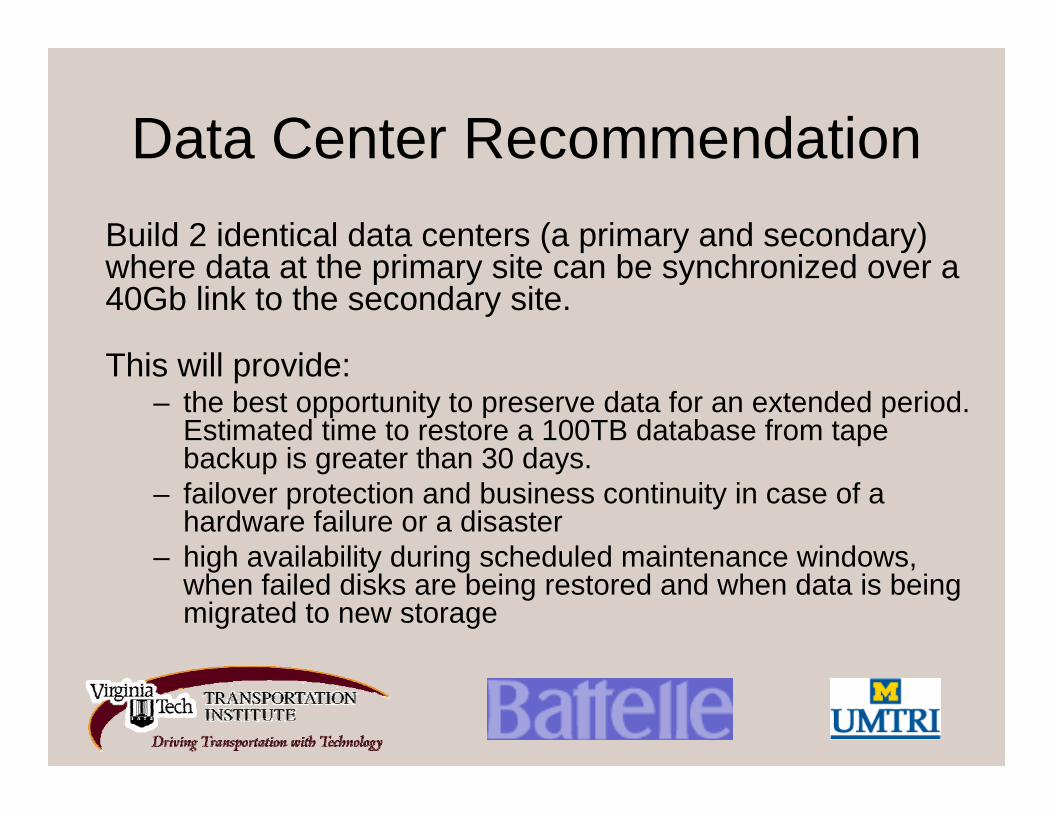
Data Center RecommendationBuild 2 identical data centers (a primary and secondary) where data at the primary site can be synchronized over a 40Gb link to the secondary site.
This will provide:– the best opportunity to preserve data for an extended period.
Estimated time to restore a 100TB database from tape backup is greater than 30 days.
– failover protection and business continuity in case of a hardware failure or a disaster
– high availability during scheduled maintenance windows, when failed disks are being restored and when data is being migrated to new storage
Questions?Task 3: Sample DesignTask 4: Sample Design Interim ReportTask 5: Driver TestingTask 6: Driver Face and Other Video Recording and
ProcessingTask 7: Data Items and Instrumentation Package
SpecificationsTask 8: Data Collection, Reduction, Integration, Archiving,
Processing and AccessTask 10: Identify All Requirements for Approval of Human
Subjects Research
Completed Active