Embed Size (px)
Citation preview

©2010 by Crain Communications Inc. All rights reserved.
Staffing Industry Report Webinar January 2011
© 2010 Crain Communications Inc.
Sponsored by:
Please note:
This webinar is broadcast
through your computer
speakers via the audio
broadcasting icon on
your screen. You may
adjust the sound volume
by using the slide bar on
the audio broadcasting
icon.
If you continue to have
trouble with the sound,
you may dial into the call
by dialing 1‐408‐600‐
3600 and using access
code
660 325 851.
For other assistance,
contact SIA customer
service at 800‐950‐9496.
Jon Osborne
VP, Research
Sona
Sharma
Sr. Research Analyst

©2010 by Crain Communications Inc. All rights reserved.
•
Listen through your computer by turning on your speakers after
you log into the event. Sound will be coming through this icon:
•
Do not
close this audio broadcast box.
•
To increase the volume of sound coming
through your computer
speakers adjust the sound bar on the
audio Broadcast box shown above.
•
If you continue to have trouble, please submit your need for
assistance in the Q&A section.
Audio for this webinar
©2010 by Crain Communications Inc. All rights reserved.
•
Questions may be submitted at any time
during the presentation. To submit a
question:
•
Click on the Question Mark icon (?) on
the floating toolbar (as shown at the
right).
•
This will open the Q&A window on your
system only.
•
Type your question into the small dialog
box and click the Send Button.
Q&A icon
Submitting Questions

©2010 by Crain Communications Inc. All rights reserved.
Thank You to Our Webinar and Executive Forum Optimum Sponsor…
Shane O’Donnell Senior Sales Director

©2010 by Crain Communications Inc. All rights reserved.
February 28‐March 3, 2011Fontainebleau Resort
Miami Beach, FLwww.SiExecutiveForum.com

©2010 by Crain Communications Inc. All rights reserved.

©2010 by Crain Communications Inc. All rights reserved.
•
Barry Asin, President, Staffing Industry
Analysts
•
John Kao, Chairman, World Economic
Forum’s Global Advisory Council on
Innovation
•
Alan Beaulieu, President, Institute for
Trend Research
•
Stephen Dubner, Award‐winning co‐
author of FREAKONOMICS and
SUPERFREAKONOMICS
Keynotes

©2010 by Crain Communications Inc. All rights reserved.
So, You Lost a Contract. Why and What to Do About It?
Speaker: Ken Allred, CEO, Primary Intelligence
Win/Loss Analysis
©2010 by Crain Communications Inc. All rights reserved.
SIA’s
Sales Compensation & Sales Job Practices 2011
Survey
Speaker: Mark Donnolo, Managing Partner,
SalesGlobe
Getting Staffing Salesforce
Compensation Right

©2010 by Crain Communications Inc. All rights reserved.
The Role of Finance in a Staffing Firm’s Strategic Planning
Panelists:
Julie Krey, VP Finance, the Americas, Manpower
Jon Neff, CFO, Hire Dynamics
Shawn Poole, EVP & CFO, Employbridge
Holding Co.
Mark Smith, EVP & CFO, SFN Group Inc.
For The CFOs …

©2010 by Crain Communications Inc. All rights reserved.
CFO Networking Lunch
Wednesday, March 2, 12:00 – 1:30 p.m.
For The First Time Ever …

©2010 by Crain Communications Inc. All rights reserved.
Implementing Staffing Technology: Best Practices from Experts
Panelists:
David Buzzell, CIO, The Sedona Group
Martin Perry, CIO, Randstad
Professionals
Rob Waddell, SVP and CIO, Apex Systems, Inc.
For the CIOs
…

©2010 by Crain Communications Inc. All rights reserved.
Be a secret shopper for…
(a) A job board(b) Application tracking system(c) Front or back office system
Email: [email protected]
Looking to Buy Support Technology or Service?

©2010 by Crain Communications Inc. All rights reserved.
•
Best Staffing Firms to Work For
As determined by a survey of
25,000+ staffing firm employees
•
Peter Yessne Staffing Innovator
Award Top mover and
shaker who has changed the
industry
Two Major Awards

©2010 by Crain Communications Inc. All rights reserved.
Industry leaders provide their insights on pressing issues
Speakers:
Carl Camden, CEO, Kelly Services
Cheryl Jones, Chairman, Impellam
Group plc
Executive Perspective

©2010 by Crain Communications Inc. All rights reserved.
Panelists:
Julia Braun, Group Manager, Contingent Staffing, Microsoft Corp
Tony Marino, Manager, GSC Indirect Procurement, Hess Company
Traci Ramsey, Global Contingent Labor Lead, Monsanto
Voice of the Customer

©2010 by Crain Communications Inc. All rights reserved.
Register for the 2011 Executive Forum at
www.siexecutiveforum.com
or by calling 800‐950‐9496 and
use promo code
‘webinar’
to save $300 on published rates!
Only valid through January 17.
Follow us on Twitter and get our updates: Follow us on Twitter and get our updates: www.twitter.com/execforumwww.twitter.com/execforum
Special offer exclusively for Webinar attendees

©2010 by Crain Communications Inc. All rights reserved.
•
Trends in economy & employment
•
Staffing trends by segment & sector
•
Buyer survey results, Part 1
•
Questions and answers
Agenda

©2010 by Crain Communications Inc. All rights reserved.
Source: Economic Cycle Research Institute (ECRI) Weekly Leading Index
ECRI gradually getting more optimistic
100
110
120
130
140
150
Dec‐00 Dec‐02 Dec‐04 Dec‐06 Dec‐08 Dec‐10
Level of W
eekly Leading Index

©2010 by Crain Communications Inc. All rights reserved.
PM Manufacturing
Index: still indicates expansion, but at a slower rate
Source: Purchasing Manager’s Manufacturing Index
25
30
35
40
45
50
55
60
65
Dec‐00 Dec‐02 Dec‐04 Dec‐06 Dec‐08 Dec‐10
Index
Recession
PMI
EI

©2010 by Crain Communications Inc. All rights reserved.
PM Non‐Manufacturing
Index: accelerating expansion but limited hiring
Source: Purchasing Manager’s Nonmanufacturing Index
25
30
35
40
45
50
55
60
65
Dec‐00 Dec‐02 Dec‐04 Dec‐06 Dec‐08 Dec‐10
Index
Recession
PMI
EI

©2010 by Crain Communications Inc. All rights reserved.
Source: U.S. Department of Labor
Initial unemployment claims finally resume downward progress
0
100,000
200,000
300,000
400,000
500,000
600,000
700,000
Dec‐00 Dec‐02 Dec‐04 Dec‐06 Dec‐08 Dec‐10 Initial Claims for Unemployment (4‐Week Average)

©2010 by Crain Communications Inc. All rights reserved.
U.S. GDP projected growth, 2011‐2012U.S. GDP growth projections 2011 2012The Conference Board
Nov. 9, 2010 1.3%Dec. 7, 2010 1.7% 2.1%
Post‐tax deal 2.3% tbd
Goldman SachsBefore tax deal 2.7% 3.6%Dec. 17, 2010 (after tax deal) 3.4% 3.8%
tax deal accounts for roughly 2/3 of upgradeMorgan Stanley
Dec. 2010 ‐ Projection without tax deal 3.0%Dec. 2010 ‐ Projection with tax deal 4.0%‐4.2%
key drivers of upgrade: stronger consumer and capital spending
key drivers of upgrade: 1 year reduction in employee Social Security tax

©2010 by Crain Communications Inc. All rights reserved.
Trends in total employment
Source: Bureau of Labor Statistics & Staffing Industry Analysts
Change in Nonfarm Employment Versus Year Earlier
‐5%‐4%‐3%‐2%‐1%0%1%2%
Dec‐08 Jun‐09 Dec‐09 Jun‐10 Dec‐10
Change in Nonfarm Employment Versus Previous Month
‐800
‐600‐400
‐200
0
200400
600
Dec‐08 Jun‐09 Dec‐09 Jun‐10 Dec‐10
Thou
sand
s
+103,000

©2010 by Crain Communications Inc. All rights reserved.
Trends in total private employment
Source: Bureau of Labor Statistics & Staffing Industry Analysts
Change in Private Employment Versus Year Earlier
‐6%‐5%‐4%‐3%‐2%‐1%0%1%2%
Dec‐08 Jun‐09 Dec‐09 Jun‐10 Dec‐10
Change in Private Employment Versus Previous Month
‐800
‐600
‐400
‐200
0
200
400
Dec‐08 Jun‐09 Dec‐09 Jun‐10 Dec‐10
Thou
sand
s
+108,453

©2010 by Crain Communications Inc. All rights reserved.
In December, which sectors gained/lost jobs?
Source: Bureau of Labor Statistics & Staffing Industry Analysts
‐16
‐14
‐10
‐9
‐4
4
4
9
10
10
12
16
44
47
Construction
Other
Government
Professional srs (excluding temp)
Information
Financial activities
Natural resources/mining
Wholesale trade
Transportation & util ities
Manufacturing
Retail trade
Temporary help
Education and health
Leisure and hospitality
Thousands of Jobs

©2010 by Crain Communications Inc. All rights reserved.
Best‐performing U.S. industry markets
Source: Bureau of Labor Statistics & Staffing Industry Analysts
Industries Job Growth ScoreLast 12 Months
Last 6 Months
Last 3 Months
Total Nonfarm Employment
1 Temporary help services 94 22.0 26.2 23.5 2,219
2 Food services and drinking places 93 14.0 26.1 20.5 9,560
3 Educational services 83 6.2 9.0 8.5 3,187
4 Motor vehicle and parts dealers 79 3.4 7.2 7.5 1,664
5 Other social assistance (NAICS 6241, 6242, 6243) 79 5.9 6.4 5.5 1,809
6 Hospitals 79 3.5 6.3 7.8 4,745
7 Support activities for mining 78 6.3 5.7 4.8 333
8 Other ambulatory health care (NAICS 6212, 6213, 6215 75 5.9 5.3 3.8 2,014
9 Durable goods 75 3.2 5.0 6.5 2,801
10 Computer systems design and related services 73 4.4 5.3 3.7 1,481
11 Home health care services 71 3.7 4.3 4.1 1,092
12 Clothing and clothing accessories stores 71 3.8 6.3 1.7 1,419
13 Fabricated metal products 70 5.7 2.5 3.3 1,329
14 State government, education only 70 4.5 4.8 1.9 2,431
15 Couriers and messengers 68 1.0 3.1 6.1 536
Average Monthly Change in Jobs Over…

©2010 by Crain Communications Inc. All rights reserved.
Employment trends in food/drinking places
Employment in thousands.
Source: Bureau of Labor Statistics & Staffing Industry Analysts
Food Services & Drinking Places Employment1990‐2010
0
2,000
4,000
6,000
8,000
10,000
12,000
1990
1991
1992
1993
1994
1995
1996
1997
1998
1999
2000
2001
2002
2003
2004
2005
2006
2007
2008
2009
2010
Food Services & Drinking Places Employment2010
9,300
9,350
9,400
9,450
9,500
9,550
9,600
Jan
Feb
Mar
Apr
May Jun
Jul
Aug Sep
Oct
Nov Dec

©2010 by Crain Communications Inc. All rights reserved.
Employment trends in private educational svcs
Private Educational Services Employment1990‐2010
0
500
1,000
1,500
2,000
2,500
3,000
3,500
1990
1991
1992
1993
1994
1995
1996
1997
1998
1999
2000
2001
2002
2003
2004
2005
2006
2007
2008
2009
2010
Private Educational Services Employment2010
3,060
3,080
3,100
3,120
3,140
3,160
3,180
3,200
Jan
Feb
Mar
Apr
May Jun
Jul
Aug Sep
Oct
Nov Dec
Employment in thousands.
Source: Bureau of Labor Statistics & Staffing Industry Analysts

©2010 by Crain Communications Inc. All rights reserved.
Employment trends in hospitals
Hospital Employment1990‐2010
0
500
1,000
1,500
2,000
2,500
3,000
3,500
4,000
4,500
5,000
1990
1991
1992
1993
1994
1995
1996
1997
1998
1999
2000
2001
2002
2003
2004
2005
2006
2007
2008
2009
2010
Hospital Employment2010
4,680
4,690
4,700
4,710
4,720
4,730
4,740
4,750
Jan
Feb
Mar
Apr
May Jun
Jul
Aug Sep
Oct
Nov Dec
Employment in thousands.
Source: Bureau of Labor Statistics & Staffing Industry Analysts

©2010 by Crain Communications Inc. All rights reserved.
Employment trends in mining/oil support activities
Support Activities for Mining/Oil Employment1990‐2010
0
50
100
150
200
250
300
350
400
1990
1991
1992
1993
1994
1995
1996
1997
1998
1999
2000
2001
2002
2003
2004
2005
2006
2007
2008
2009
2010
Support Activities for Mining/Oil Employment2010
0
50
100
150
200
250
300
350
Jan
Feb
Mar
Apr
May Jun
Jul
Aug Sep
Oct
Nov Dec
Employment in thousands.
Source: Bureau of Labor Statistics & Staffing Industry Analysts

©2010 by Crain Communications Inc. All rights reserved.
Employment trends in home healthcare
Home Healthcare Employment1990‐2010
0
200
400
600
800
1,000
1,200
1990
1991
1992
1993
1994
1995
1996
1997
1998
1999
2000
2001
2002
2003
2004
2005
2006
2007
2008
2009
2010
Home Healthcare Employment2010
1,030
1,040
1,050
1,060
1,070
1,080
1,090
1,100
Jan
Feb
Mar
Apr
May Jun
Jul
Aug Sep
Oct
Nov Dec
Employment in thousands.
Source: Bureau of Labor Statistics & Staffing Industry Analysts

©2010 by Crain Communications Inc. All rights reserved.
Employment trends in computer systems design
Computer Systems Design Employment1990‐2010
0
200
400
600
800
1,000
1,200
1,400
1,600
1990
1991
1992
1993
1994
1995
1996
1997
1998
1999
2000
2001
2002
2003
2004
2005
2006
2007
2008
2009
2010
Computer Systems Design Employment2010
1,400
1,410
1,420
1,430
1,440
1,450
1,460
1,470
1,480
1,490
Jan
Feb
Mar
Apr
May Jun
Jul
Aug Sep
Oct
Nov Dec
Employment in thousands.
Source: Bureau of Labor Statistics & Staffing Industry Analysts

©2010 by Crain Communications Inc. All rights reserved.
Worst‐performing U.S. industry markets
Source: Bureau of Labor Statistics & Staffing Industry Analysts
Industries Job Growth ScoreLast 12 Months
Last 6 Months
Last 3 Months
Total Nonfarm Employment
91 Chemicals 35 ‐1.3 ‐1.3 ‐1.2 773
92 Sporting goods, hobby, book, and music stores 35 ‐1.0 ‐2.0 ‐0.8 601
93 Services to buildings and dwellings 34 1.2 ‐1.9 ‐3.5 1,724
94 General merchandise stores 33 2.4 ‐2.1 ‐4.8 2,945
95 Rental and leasing services 33 ‐0.8 ‐1.7 ‐2.2 526
96 State government, excluding education 33 ‐3.4 ‐0.9 ‐0.5 2,753
97 Printing and related support activities 33 ‐1.3 ‐1.9 ‐1.8 485
98 U.S. Postal Service 31 ‐2.7 ‐1.8 ‐1.6 644
99 Building material and garden supply stores 29 ‐3.3 ‐2.4 ‐1.3 1,135
100 Telecommunications 28 ‐3.5 ‐1.8 ‐2.4 912
101 Residential building 27 ‐2.5 ‐2.5 ‐3.3 563
102 Health and personal care store 27 ‐1.2 ‐2.0 ‐5.1 961
103 Insurance carriers and related activities 25 ‐3.9 ‐2.5 ‐3.0 2,166
104 Local government, excluding education 12 ‐9.8 ‐9.1 ‐9.3 6,324
105 Local government, education only 10 ‐12.8 ‐13.2 ‐7.4 7,900
Average Monthly Change in Jobs Over…

©2010 by Crain Communications Inc. All rights reserved.
Manufacturing sectors with high overtime hours
Source: Bureau of Labor Statistics & Staffing Industry Analysts
Tools & vehicles Energy Food Basic materials
Rank NAICS Description Jun‐10 Jul‐10 Aug‐10 Sep‐10 Oct‐10 Nov‐10
1 3231120009 Grain and oilseed milling 7.3 8.2 6.6 7.1 8.4 9.2
2 3232411009 Petroleum refineries 7.6 7.8 8.6 8.2 9.1 9.1
3 3133110009 Iron and steel mills and ferroalloy 7.1 6.7 7.6 7.9 7.9 8.6
4 3133635009 Motor vehicle power train components 8.9 6.9 8.9 7.9 8.1 8.2
5 3133310009 Agricultural 5.7 5.6 5.9 5.9 7.3 7.4 *6 3133140009 Other nonferrous metal production 6.2 6.0 7.2 6.2 6.3 7.2
7 3231141209 Frozen specialty food 5.5 5.7 6.4 7.3 7.1 7.2 *8 3133272209 Bolts 7.2 6.0 7.7 6.8 6.7 7.0
9 3232210009 Pulp 5.6 6.1 6.2 6.8 6.2 7.0
10 3132732009 Ready‐mix concrete 6.4 7.7 7.4 6.7 7.9 6.6
11 3133240009 Boilers 5.2 5.9 6.3 6.0 5.9 6.4
12 3231141009 Frozen food 5.6 5.9 6.4 7.5 7.6 6.4
13 3232400009 Petroleum and coal products 6.4 6.1 6.7 6.6 7.0 6.4
14 3231110009 Animal food 4.2 4.3 5.7 5.5 5.8 6.2 *15 3231140009 Fruit and vegetable preserving 5.2 5.6 7.6 8.3 7.1 6.2

©2010 by Crain Communications Inc. All rights reserved.
Manufacturing sectors with high overtime hours
Source: Bureau of Labor Statistics & Staffing Industry Analysts
Tools & vehicles Energy Food Basic materials
Rank NAICS Description Jun‐10 Jul‐10 Aug‐10 Sep‐10 Oct‐10 Nov‐10
16 3133100009 Primary metals 5.6 5.5 5.7 5.5 5.9 6.1
17 3133351309 Metal cutting and forming machine tools 3.5 3.1 3.1 4.7 5.7 6.0 *18 3133610009 Motor vehicles 4.9 4.5 5.2 6.0 5.7 6.0
19 3133641109 Aircraft 4.9 5.5 5.7 5.6 5.9 6.0
20 3231142009 Fruit and vegetable canning and drying 4.9 5.3 8.5 8.9 6.7 6.0
21 3133351109 Industrial molds 5.5 5.4 5.5 4.8 6.2 5.9
22 3231190009 Other food products 4.2 4.0 4.6 4.2 5.7 5.9 *23 3232521109 Plastics material and resin 5.7 6.1 5.5 5.7 5.8 5.9
24 3132730009 Cement and concrete products 5.7 6.8 6.6 5.5 6.4 5.8
25 3133351409 Special tools 4.6 4.7 4.8 5.6 5.8 5.8
26 3231161109 Animal slaughtering and processing 6.3 5.0 6.0 6.3 6.1 5.8
27 3133231009 Plate work and fabricated structural 3.7 3.7 4.7 5.0 5.7 5.7 *28 3133272009 Turned products and screws 5.3 4.8 5.4 5.3 5.5 5.7
29 3133360009 Turbine and power transmission equip 5.8 5.3 5.1 5.1 4.2 5.7
30 3232510009 Basic chemicals 5.6 5.4 5.2 5.1 5.7 5.7

©2010 by Crain Communications Inc. All rights reserved.
Trends in hours worked
Source: Bureau of Labor Statistics & Staffing Industry Analysts
Average Weekly Hours of All Employees
33.2
33.4
33.6
33.8
34.0
34.2
34.4
34.6
34.8
Jun‐08
Sep‐08
Dec‐08
Mar‐09
Jun‐09
Sep‐09
Dec‐09
Mar‐10
Jun‐10
Sep‐10
Dec‐10
Hou
rs
Average Weekly Overtime of Production & Non‐Supervisory Employees
0.00.51.01.52.02.53.03.54.04.5
Jun‐08
Sep‐08
Dec‐08
Mar‐09
Jun‐09
Sep‐09
Dec‐09
Mar‐10
Jun‐10
Sep‐10
Dec‐10
Hou
rs

©2010 by Crain Communications Inc. All rights reserved.
Jan Feb Mar Apr May Jun
Accounting/
Bookkeeping
Accounting/
Bookkeeping
Building material
and garden
supply stores
Scenic and
sightseeing
transportation
Scenic and
sightseeing
transportation
Scenic and
sightseeing
transportation
State government
educationPerforming arts
and spectator
sports
Amusements,
gambling, and
recreation
Educational
servicesServices to
buildings and
dwellings
Heavy and civil
engineering
construction
Seasonal Peaks in Hiring—Who Hires When
Bureau of Labor Statistics & Staffing Industry Analysts

©2010 by Crain Communications Inc. All rights reserved.
Trend in total unemployment
Source: Bureau of Labor Statistics & Staffing Industry Analysts
U.S. Total Unemployment RateRate down 35 basis points in Dec, to 9.42%
5%
6%
7%
8%
9%
10%
11%
Jul‐08 Oct‐08 Jan‐09 Apr‐09 Jul‐09 Oct‐09 Jan‐10 Apr‐10 Jul‐10 Oct‐10
U.S. Total Unemployed
8,000
10,000
12,000
14,000
16,000
Jul‐08 Oct‐08 Jan‐09 Apr‐09 Jul‐09 Oct‐09 Jan‐10 Apr‐10 Jul‐10 Oct‐10

©2010 by Crain Communications Inc. All rights reserved.
Trend in college‐graduate unemployment
Source: Bureau of Labor Statistics & Staffing Industry Analysts
U.S. College‐Graduate Unemployment RateRate down 33 basis points in Dec, to 4.79%
2.0%
2.5%
3.0%
3.5%
4.0%
4.5%
5.0%
5.5%
Jul‐08 Oct‐08 Jan‐09 Apr‐09 Jul‐09 Oct‐09 Jan‐10 Apr‐09 Jul‐10 Oct‐10
U.S. College‐Graduate Unemployed
1,000
1,500
2,000
2,500
Jul‐08 Oct‐08 Jan‐09 Apr‐09 Jul‐09 Oct‐09 Jan‐10 Apr‐09 Jul‐10 Oct‐10

©2010 by Crain Communications Inc. All rights reserved.
•
Trends in economy & employment
•
Staffing trends by segment & sector
•
Buyer survey results, Part 1
•
Questions and answers
Agenda

©2010 by Crain Communications Inc. All rights reserved.
Trends in staffing employment
Source: Bureau of Labor Statistics & Staffing Industry Analysts
Change in Temp Employment Versus Previous Month
‐100
‐50
0
50
100
Dec‐08 Jun‐09 Dec‐09 Jun‐10 Dec‐10
Thou
sand
s
+15,900
Percent Change in Temp Employment Versus Year Earlier
‐30%
‐20%
‐10%
0%
10%
20%
30%
Dec‐08 Jun‐09 Dec‐09 Jun‐10 Dec‐10

©2010 by Crain Communications Inc. All rights reserved.
Temp Employment Penetration Rate
1.2%
1.4%
1.6%
1.8%
2.0%
Dec‐07
Jun‐08
Dec‐08
Jun‐09
Dec‐09
Jun‐10
Dec‐10
Temp Employment Penetration Rate
1.0%
1.2%
1.4%
1.6%
1.8%
2.0%
1990
1992
1994
1996
1998
2000
2003
2005
2007
2009
Trends in staffing employment
Source: Bureau of Labor Statistics & Staffing Industry Analysts
1.70% = 1997

©2010 by Crain Communications Inc. All rights reserved.
Trends in staffing employment
Source: Bureau of Labor Statistics & Staffing Industry Analysts
Percent Change in Exec Search Internal Employment Vs. Year Earlier
‐16%
‐10%
‐4%
2%
8%
14%
Nov‐08 May‐09 Nov‐09 May‐10 Nov‐10
Percent Change in Direct Hire Internal Employment Versus Year Earlier
‐25%‐20%‐15%‐10%
‐5%0%5%
10%
Nov‐08 May‐09 Nov‐09 May‐10 Nov‐10

©2010 by Crain Communications Inc. All rights reserved.
Trends in staffing employment
Source: Bureau of Labor Statistics & Staffing Industry Analysts
Layoffs as a Percent of Total Employment
1.0%
1.2%
1.4%
1.6%
1.8%
2.0%
Oct‐07
Apr‐08
Oct‐08
Apr‐09
Oct‐09
Apr‐10
Oct‐10
Percent Change in PEO Covered Employees Versus Year Earlier
‐30%‐25%‐20%‐15%‐10%‐5%0%5%
10%
Nov‐07
May‐08
Nov‐08
May‐09
Nov‐09
May‐10
Nov‐10

©2010 by Crain Communications Inc. All rights reserved.
Revenue trends by segment & sector
↑ Widespread Improvement
↗ Mild Improvement
‐‐ Flat ↘ Mild Deterioration
↓ Widepsread Deterioration
Source: Staffing Industry Monthly Pulse Survey
Apr to May
May to Jun
Jun to Jul
July to Aug
Aug to Sep
Sept to Oct
Oct to Nov
Nov to Dec
Dec to Jan
Jan10 to Feb
Feb to Mar
Mar to Apr
Apr to May
May to Jun
Jun to Jul
Jul to Aug
Aug to Sept
Sept to Oct
Oct to Nov
Temporary Staffing ↗ ↗ ↑ ↑ ↑ ↑ ↑ ↑ ↑ ↑ ↑ ↑ ↑ ↑ ↑ ↑ ↑ ↑ ↑
Temp‐to‐Hire ‐‐ ‐‐ ↗ ↗ ↑ ↑ ↑ ↑ ↑ ↑ ↑ ↑ ↑ ↑ ↗ ↑ ↑ ↑ ↑
Direct Hire ‐‐ ‐‐ ‐‐ ‐‐ ↗ ↗ ↗ ↗ ↑ ↑ ↑ ↑ ↑ ↑ ↑ ↑ ↑ ↑ ↑
Retained Search↘ ↓ ↘ ↘
↗ ‐‐↘
‐‐ ↑ ↑ ↑ ↑ ↑ ‐‐ ↗ ↑
PEO ↑ ↗ ‐‐ ‐‐ ‐‐ ‐‐↘
↑ ↑ ↑ ↗ ↗ ‐‐
Outplacement ‐‐ ‐‐↘ ↘ ↘
‐‐↘ ↓
‐‐ ‐‐↓
Staffing sectors month‐to‐month sequential revenue trends

©2010 by Crain Communications Inc. All rights reserved.
Revenue trends by segment & sector
↑ Widespread Improvement
↗ Mild Improvement
‐‐ Flat ↘ Mild Deterioration
↓ Widepsread Deterioration
Source: Staffing Industry Monthly Pulse Survey
Apr to May
May to Jun
Jun to Jul
July to Aug
Aug to Sep
Sept to Oct
Oct to Nov
Nov to Dec
Dec to Jan
Jan10 to Feb
Feb to Mar
Mar to Apr
Apr to May
May to Jun
Jun to Jul
Jul to Aug
Aug to Sept
Sept to Oct
Oct to Nov
Industrial ↗ ↗ ↑ ↑ ↑ ↑ ↑ ↑ ↑ ↑ ↑ ↑ ↑ ↑ ↑ ↑ ↑ ↑ ↑
IT ↗ ↑ ↑ ↗ ↑ ↑ ↑ ↑ ↑ ↑ ↑ ↑ ↑ ↑ ↑ ↑ ↑ ↑ ↑
Office/Clerical ↗ ↗ ↗ ↗ ↗ ↑ ↑ ↑ ↑ ↑ ↑ ↑ ↑ ↑ ↑ ↑ ↑ ↑ ↑
Engineering ↑ ↗ ↗ ‐‐ ↑ ↑ ↑ ↑ ↑ ↑ ↑ ↑ ↗ ↗ ↑ ↑ ↑ ↑ ↑
Fin./Accounting ‐‐ ↗ ‐‐ ‐‐ ↑ ↑ ↗ ↑ ↑ ↑ ↑ ↑ ↑ ↑ ↗ ↑ ↑ ↑ ↑
Allied/other ↘ ↗ ↑ ‐‐ ↗ ↗ ↗ ‐‐ ↑ ↑ ↑ ↑ ↑ ↑ ↑ ↑ ↑ ↑ ↗
Clincial/scientific ↗ ‐‐ ↗ ‐‐ ↗ ↗ ↗ ↑ ↗ ↗ ↑ ↑ ‐‐ ↗ ↑
Travel nurse ↘ ↘ ‐‐ ↘ ‐‐ ↗ ‐‐ ↘ ↑ ‐‐ ↑ ↘ ↗ ↑ ↑ ↑ ↑ ↑ ↑
Legal ‐‐ ‐‐ ‐‐ ‐‐ ↑ ↗ ‐‐ ‐‐ ‐‐ ↗ ↑ ↑ ↑ ↗ ‐‐ ↑
Locum tenens ‐‐ ↗ ↗ ‐‐ ‐‐ ‐‐ ↗ ‐‐ ↑ ‐‐ ↑ ↗ ↑
Per diem nurse ‐‐ ↓ ↗ ‐‐ ↗ ↗ ‐‐ ↘ ↗ ↗ ↑ ↗ ↗ ↑ ↘ ↑ ↑ ↑
Marketing/creative ↘ ‐‐ ↗ ↗ ‐‐ ‐‐ ↘ ‐‐ ‐‐ ↗ ↗ ↗ ↗ ↗
Temp staffing segments month‐to‐month sequential revenue trends

©2010 by Crain Communications Inc. All rights reserved.
Which is greater challenge—selling or recruiting?
Source: Staffing Industry Monthly Pulse Survey
Jan‐10
Feb‐10
Mar‐10
Apr‐10
May‐10
Jun‐10
Jul‐10 Aug‐10
Sep‐10
Oct‐10
Nov‐10
0%
20%
40%
60%
80%
100%
Selling
Recruiting

©2010 by Crain Communications Inc. All rights reserved.
Staffing industry balance sheet
+ ‐ •BLS reports temp gain of 15.9K
•Weak employment report, just 103K jobs
•Economic indicators trending better•Unemployment likely to stay high for forseeable future
•Pulse: Most staffing firms still reporting sequential improvement
•Selling/recruiting difficulty ratio improving over last nine months
©2010 by Crain Communications Inc. All rights reserved.
•
Trends in economy & employment
•
Staffing trends by segment & sector
•
Buyer survey results, Part 1
•
Questions and answers
Agenda
©2010 by Crain Communications Inc. All rights reserved.
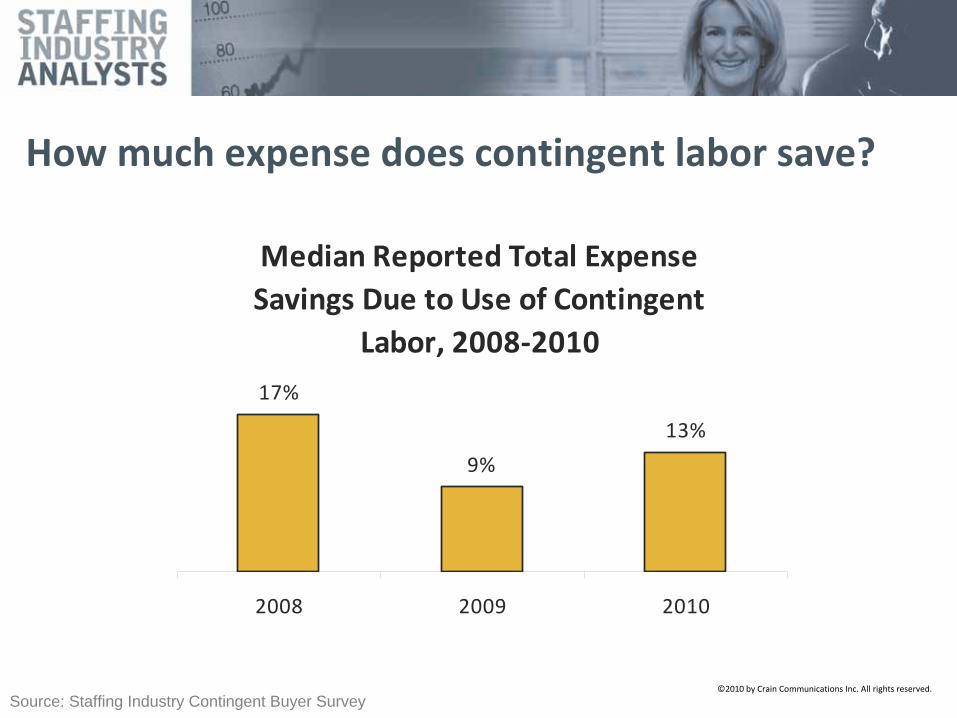
How much expense does contingent labor save?
Source: Staffing Industry Contingent Buyer Survey
Median Reported Total Expense Savings Due to Use of Contingent
Labor, 2008‐2010
17%
9%
13%
2008 2009 2010

©2010 by Crain Communications Inc. All rights reserved.
Reported savings as a function of buyer industry
Source: Staffing Industry Contingent Buyer Survey
Median Reported Expense Savings, 2008‐2010, by Industry of Buyer
7%
8%
12%
13%
13%
17%
Healthcare
Pharma/Biotech/Med
Finance/Insurance
Manufacturing
Technology/Telecom
Energy/Chemica l

©2010 by Crain Communications Inc. All rights reserved.
Polling question:
About what portion of contingent buyers are confident they are completely IC compliant?
A) Pretty much all of them
B) Most of them C) About half of them
D) About a quarter of them E) Around one in ten
F) None of them

©2010 by Crain Communications Inc. All rights reserved.
Only 1/8 buyers believe they are 100% compliant
Source: Staffing Industry Contingent Buyer Survey
In your best estimate, what percent of your 1099/independent contractors are properly classified?
<90%, 41%
Don't know, 26%
100%, 12%
95‐99%, 15%
90%‐94%, 6%

©2010 by Crain Communications Inc. All rights reserved.
Large buyers project yet more contingent usage
Source: Staffing Industry Contingent Buyer Survey
Respondent Estimates of CW Usage Rates
8% 9%7%
11%13% 12% 13% 12%
15%17%
10% 10% 10%
15%
2005 2006 2007 2008 2009 2010 2012
Median Mean

©2010 by Crain Communications Inc. All rights reserved.
How much do large buyers typically spend?
Source: Staffing Industry Contingent Buyer Survey
Industry Median
Energy/Chemcal$90‐$99.9 million
Finance/Insurance $70‐$79.9 million
Technology/Telecom $70‐$79.9 million
Manufacturing $50‐$59.9 million
Pharma/Biotech/ Medical Equipment
$50‐$59.9 million
Retail/Consumer $40‐$49.9 million
Healthcare $30‐$39.9 million
Size (employees) Median
1,000 ‐ 1,999 <$10 million
2,000 ‐ 4,999 $10‐$19.9 million
5,000 ‐ 9,999 $30‐$39.9 million
10,000 or more $100‐$149.9 million

©2010 by Crain Communications Inc. All rights reserved.
HRO, RPO usage gradually increasing
Source: Staffing Industry Contingent Buyer Survey
Trend in Percent of Buyers Using RPO
17%
22%
14%
21%
2007 2008 2009 2010
Trend in Percent of Buyers Using HRO
14%
18%
13%
16%
2007 2008 2009 2010

©2010 by Crain Communications Inc. All rights reserved.
IC compliance screening trending up
Source: Staffing Industry Contingent Buyer Survey
Do You Use a Vendor for Independent Contractor Screening/Compliance?
No, 21%
Yes, 41%
Maybe Over Next 2 Years,
34%
Don't know, 4% Trend in Percent of Buyers Using IC Screening Vendor
37%41%
2009 2010
©2010 by Crain Communications Inc. All rights reserved.
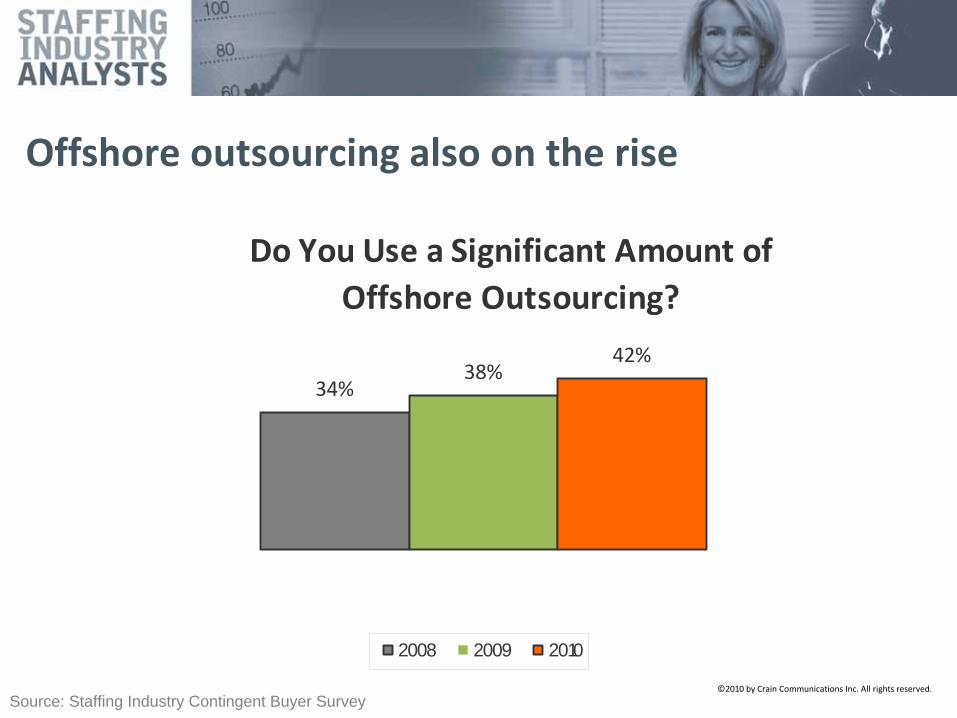
Offshore outsourcing also on the rise
Source: Staffing Industry Contingent Buyer Survey
Do You Use a Significant Amount of Offshore Outsourcing?
38%42%
34%
2008 2009 2010

©2010 by Crain Communications Inc. All rights reserved.
CW increasingly managed on a global basis
Source: Staffing Industry Contingent Buyer Survey
Trend in Percent of Buyers Managing on a Global Basis
21%24%
16%
2008 2009 2010

©2010 by Crain Communications Inc. All rights reserved.
•
Trends in economy & employment
•
Staffing trends by segment & sector
•
Buyer survey results, Part 1
•
Questions and answers
Agenda

©2010 by Crain Communications Inc. All rights reserved.
Where to find latest research: staffingindustry.com

©2010 by Crain Communications Inc. All rights reserved.
Staffing Industry Monthly Pulse Survey
Want report? Go to www.staffingindustry.com
or email Noël Calvi at [email protected].

©2010 by Crain Communications Inc. All rights reserved.
Staffing Industry Monthly Pulse Survey. It’s open now! Go to www.staffingindustry.com.
Please fill out the Pulse
survey!

©2010 by Crain Communications Inc. All rights reserved.
Next corporate member webinar: Tuesday, Feb. 8th, 10AM Pacific/1PM Eastern
To register: [email protected]
Send us your news: M&A, contract wins, C‐level people news (not ads, awards)
Got news? Email [email protected]

©2010 by Crain Communications Inc. All rights reserved.
Questions and Answers

©2010 by Crain Communications Inc. All rights reserved.
Thank You to Our Webinar and Executive Forum Optimum Sponsor…