Embed Size (px)
Citation preview
10th Grade Chemistry Chapter 10: States of Matter Lab: Constructing Heating and Cooling Curves for Sodium Thiosulfate Pentahydrate
(Na2S2O3• 5H2O) SITUATION Sodium thiosulfate pentahydrate, Na2S2O3• 5H2O, is produced and sold nationwide to photography shops, paper processing plants, and textile manufacturers. Purity is one condition of customer satisfaction, so samples of Na2S2O3• 5H2O are taken periodically from the production line and tested for purity by an outside testing facility. Your company has been tentatively chosen because your proposal was the only one based on melting and freezing points rather than a more expensive and complicated process. To make the contract final, you must convince the manufacturing firm that you can establish accurate standards for comparison. BACKGROUND As energy flows from a liquid, its temperature drops. The entropy, or random ordering of its particles, also decreases until a specific ordering of the particles results in a phase change to a solid. If energy is being released or absorbed by a substance remaining at the same temperature, this is evidence that a dramatic change in entropy, such as a phase change, is occurring. Because all of the particles of a pure substance are identical, they all freeze at the same temperature, and the temperature will not change until the phase change is complete. If a substance is impure, the impurities will not lose energy in the same way that the rest of the particles do. Therefore, the freezing point will be somewhat lower, and there will be a range of temperatures instead of a single temperature. PROBLEM To evaluate your sample, you will need a heating and cooling curve for pure Na2S2O3• 5H2O. These are plots of temperature versus heat added to a substance. (The x-axis is usually time and it is assumed that heat is flowing into the substance at a constant rate). This graph shows how the temperature of the Na2S2O3• 5H2O sample changes through phase changes. Cooling curves describe how temperature changes as heat is removed, heating curves show how temperature changes as heat is added. Procedure for Cooling Curve: Melt Sample
1. Place thermometer and 150ml of water into beaker. Heat on hot plate until water temperature reaches 85oC - turn hot plate off at this temperature.
2. Place a sample of sodium thiosulfate and LabQuest probe in a test tube. 3. Prepare 150ml cold water bath in a second beaker (~ half ice and half water). 4. Place the test tube with sodium thiosulfate and probe into hot water bath until
temperature reaches approximately 60oC. Observe the changes. Cool Sample
5. SIMULTANEOUSLY move the test tube from the hot water bath to the cold water bath press the start button on the LabQuest to begin data collection.
6. Assign one person for each job: maintain 85oC hot water bath temperature, begin and monitor LabQuest results, continually gently stir sample with probe, observations note taker.
7. When the temperature reaches 50 oC add 1-2 seed crystals of Na2S2O3• 5H2O
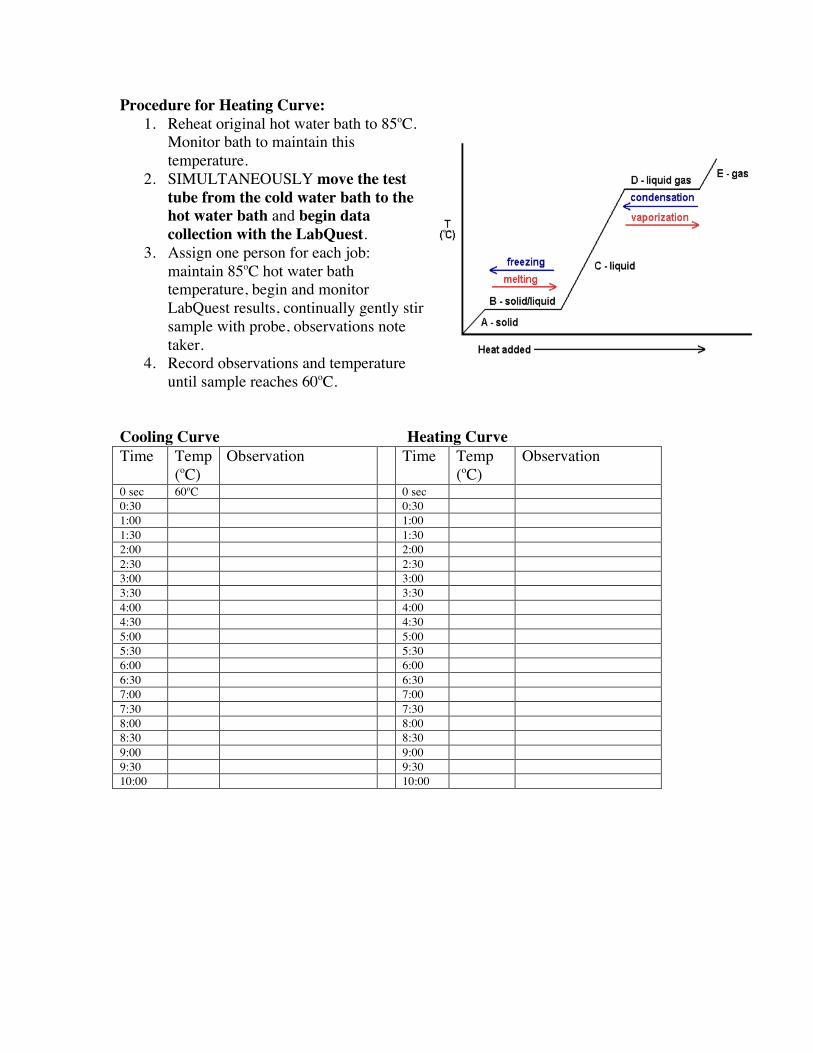
Procedure for Heating Curve: 1. Reheat original hot water bath to 85oC.
Monitor bath to maintain this temperature.
2. SIMULTANEOUSLY move the test tube from the cold water bath to the hot water bath and begin data collection with the LabQuest.
3. Assign one person for each job: maintain 85oC hot water bath temperature, begin and monitor LabQuest results, continually gently stir sample with probe, observations note taker.
4. Record observations and temperature until sample reaches 60oC.
Cooling Curve Heating Curve Time Temp
(oC) Observation Time Temp
(oC) Observation
0 sec 60oC 0 sec 0:30 0:30 1:00 1:00 1:30 1:30 2:00 2:00 2:30 2:30 3:00 3:00 3:30 3:30 4:00 4:00 4:30 4:30 5:00 5:00 5:30 5:30 6:00 6:00 6:30 6:30 7:00 7:00 7:30 7:30 8:00 8:00 8:30 8:30 9:00 9:00 9:30 9:30 10:00 10:00

Choose appropriate X and Y axis scales, label both axes (include units in parentheses) and plot both sets of data on the same graph. Choose different colors for each line. Provide a key on your graph to indicate which line is cooling and which is heating. Title: Temperature (0C) vs. Time (seconds)
Key:
Analysis: 1. Interpreting graphics: Describe and compare the shape of the cooling curve with the
shape of the heating curve _____________________________________________ __________________________________________________________________ __________________________________________________________________
2. Interpreting graphics: Locate the freezing and melting temperatures on your graph. What are the temperatures? Compare them and comment on why they have different names. _____________________________________________________ ___________________________________________________________________ ___________________________________________________________________
3. Evaluating data: Compare your melting point with that found in references for Na2S2O3• 5H2O. What is the actual melting point? ______________What is the percent error for your experimental melting point? Show your calculation below.
4. Organizing ideas: Which of the following word equations best represents the changes of phase taking place in the situations described in items 1-9 below? Place your answers in the space to the left of the numbered items. a. solid + energy -> liquid b. liquid -> solid + energy c. solid + energy -> vapor d. vapor -> solid + energy _____ 1. Ice melting at 0oC _____ 2. Water freezing at 0oC _____ 3. A particle escaping from a solid and becoming a vapor particle _____ 4. Solids subliming _____ 5. Snow melting _____ 6. Snow forming _____ 7. Dry ice forming
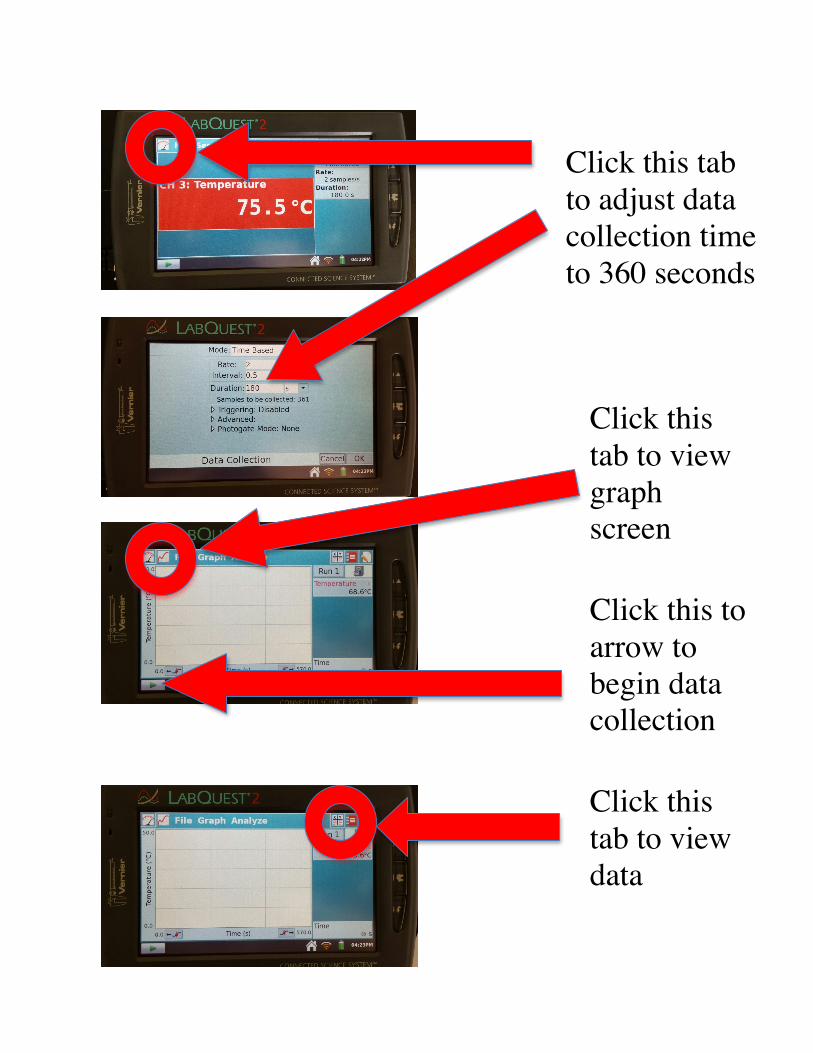
Click this tab to adjust data collection time to 360 seconds
Click this to arrow to begin data collection
Click this tab to view data
Click this tab to view graph screen