Embed Size (px)
Citation preview

Six-month report 2018 (1 Dec 2017 – 31 May 2018)
Q2
H & M Hennes & Mauritz AB Six-month report
First half-year (1 December 2017 – 31 May 2018)
• The H&M group’s sales including VAT amounted to SEK 114,017 m (113,907) during the
first half-year. Sales excluding VAT amounted to SEK 98,165 m (98,368). In local
currencies, sales including VAT were unchanged.
• Profit after financial items amounted to SEK 7,275 m (10,920). The group’s profit after
tax amounted to SEK 6,010 m (8,354), corresponding to SEK 3.63 (5.05) per share.
Second quarter (1 March 2018 — 31 May 2018)
• The group’s sales including VAT increased by 2 percent to SEK 60,463 m (59,538)
during the second quarter. Sales excluding VAT amounted to SEK 51,984 m (51,383).
In local currencies, sales including VAT were unchanged.
• Gross profit amounted to SEK 29,164 m (29,345). This corresponds to a gross margin
of 56.1 percent (57.1)
• Profit after financial items amounted to SEK 6,012 m (7,708). The group’s profit after
tax amounted to SEK 4,638 m (5,897), corresponding to SEK 2.80 (3.56) per share.
• The H&M group is going through a period of transformation to make the company
even more customer-driven, efficient and flexible. This includes necessary transitions
to new logistics systems that will allow even better availability, speed and
transparency. However, sales and profits were temporarily affected by interruptions
in connection with such transitions carried out in the second quarter in major markets
such as the USA, France, Italy and Belgium.
• AI and advanced data analytics – very good results from ongoing pilot projects, which
are now being scaled up.
• The H&M group’s ninth brand, Afound, which offers hundreds of specially selected
fashion and lifestyle brands with products at bargain prices, was launched in Sweden in
June. Afound has been very successfully received both in store and online.
• H&M Home will broaden its product range in the second half of 2018 to include lamps
and furniture.
• For 2019 Bosnia-Herzegovina is planned to become a new H&M store market and
Mexico a new H&M online market.
SEK m
Q2
2018
Q2
2017
Six months
2018
Six months
2017
Net sales 51,984 51,383 98,165 98,368
Gross profit 29,164 29,345 52,204 53,811
gross margin, % 56.1 57.1 53.2 54.7
Operating profit 6,007 7,650 7,215 10,809
operating margin, % 11.6 14.9 7.3 11.0
Net financial items 5 58 60 111
Profit after financial items 6,012 7,708 7,275 10,920
Tax -1,374 -1,811 -1,265 -2,566
Profit for the period 4,638 5,897 6,010 8,354
Earnings per share, SEK 2.80 3.56 3.63 5.05
Definitions on key figures, see annual report 2017.
First half-year 2018
SEK 114 billion Sales incl VAT
H&M
Six-month report 2018 (1 Dec 2017 – 31 May 2018)
2
Comments by Karl-Johan Persson, CEO “The rapid transformation of the fashion retail sector continues, and we are in a transitional
period that is both exciting and challenging. Challenging because it is complex, extensive
and the pace of change is fast. Exciting because we can see positive trends and big
potential in connection with our improvement work and investments.
As we signalled previously, it was going to be a tough first half-year. We went into the
second quarter carrying too much stock and we still had some imbalances in the H&M
assortment – something that we are gradually correcting. As part of our transformation
work we are transitioning our logistics systems to make our supply chain even faster, more
flexible and more efficient. These transitions are complicated and can result in temporary
interruptions, as unfortunately occurred during the second quarter in some of our major
sales markets. This negatively impacted sales in the USA, France, Italy and Belgium, as well
as online sales in the Nordic region.
Yet in a number of markets sales developed positively; in Sweden, Norway, Denmark and
Eastern Europe we grew considerably faster than the market. This shows that we are on
the right track and that our digital investments and improvement work are starting to have
results. Overall, however, total sales for the quarter were not satisfactory, which meant that
inventory levels were still too high at the end of the period.
Work on our priority action areas continues at full speed
An important focus area is to develop the core of our brands. Our highest priority is the
H&M brand, where we are continuing our improvement work on the assortment and the
customer experience in store and online – while at the same time continuing to integrate
the two channels. The utmost important thing is to improve the assortment and we are
already seeing positive results from our summer collections, which have sold better than
the corresponding collections last year.
We are continuing our investments in the supply chain, tech, advanced analytics and AI.
There are promising indications from our pilot projects within personalisation,
quantification, allocation and price setting, as well as in trend forecasting. Following on from
these positive results, we are now scaling the projects up for more markets and more
concepts.
Development of the store portfolio, new online partner and new brand
The development and optimisation of the store portfolio continues. This applies to the
number of stores, store area, rebuilds and relocations in order to ensure that we always
have the right store portfolio and best terms in each market.
In 2018 we plan to open around 390 stores and to close 150, resulting in a net addition of
240 new stores for the year. Most of the H&M store openings will be in emerging markets,
while the closures will take place in established markets. Stores for our newer brands will
open in our established markets. We still see great potential for new stores in the coming
years as our newer brands gradually come to make up an ever greater share of the store
portfolio.
In parallel with the development of our own online store, sales of H&M on Tmall have got off
to a very good start with tens of millions of visitors in the first couple of months,
contributing to increasing sales in China.
Two weeks ago we launched our latest brand, Afound, an innovative market place in
Sweden with hundreds of specially selected fashion and lifestyle brands offering products
at bargain prices. Afound has been very successfully received both in store and online.
Outlook
We can see that things are moving in the right direction, even though many challenges
remain and there is a lot of hard work still to do. The first half of the year has been
somewhat more challenging than we initially thought, but we believe that there is a gradual
improvement and that we will see a stronger second half. We have a long-term approach
and are optimistic about the future for the whole of the H&M group, with good growth in
both sales and profitability for many years to come.”
H&M Kids
Six-month report 2018 (1 Dec 2017 – 31 May 2018)
3
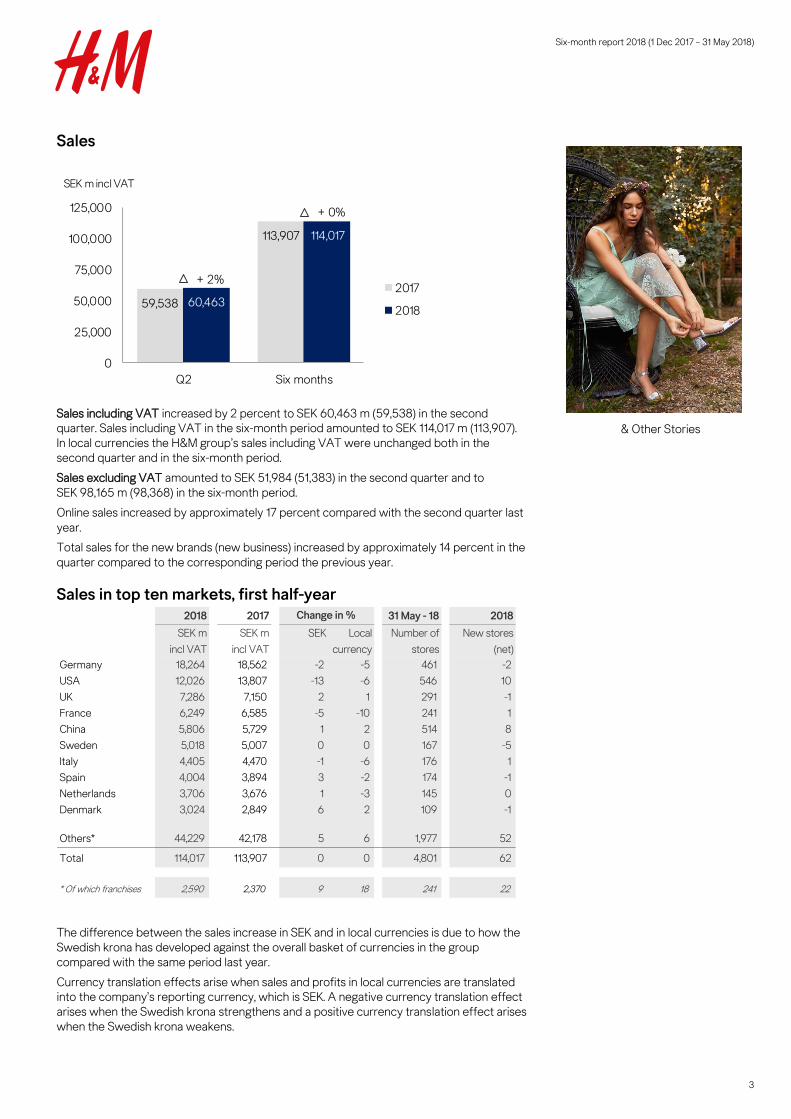
Sales
Sales including VAT increased by 2 percent to SEK 60,463 m (59,538) in the second
quarter. Sales including VAT in the six-month period amounted to SEK 114,017 m (113,907).
In local currencies the H&M group’s sales including VAT were unchanged both in the
second quarter and in the six-month period.
Sales excluding VAT amounted to SEK 51,984 (51,383) in the second quarter and to
SEK 98,165 m (98,368) in the six-month period.
Online sales increased by approximately 17 percent compared with the second quarter last
year.
Total sales for the new brands (new business) increased by approximately 14 percent in the
quarter compared to the corresponding period the previous year.
Sales in top ten markets, first half-year
The difference between the sales increase in SEK and in local currencies is due to how the
Swedish krona has developed against the overall basket of currencies in the group
compared with the same period last year.
Currency translation effects arise when sales and profits in local currencies are translated
into the company’s reporting currency, which is SEK. A negative currency translation effect
arises when the Swedish krona strengthens and a positive currency translation effect arises
when the Swedish krona weakens.
59,538
113,907
60,463
114,017
+ 2%
+ 0%
0
25,000
50,000
75,000
100,000
125,000
Q2 Six months
SEK m incl VAT
2017
2018
2018 2017 31 May - 18 2018
SEK m
incl VAT
SEK m
incl VAT
SEK Local
currency
Number of
stores
New stores
(net)
Germany 18,264 18,562 -2 -5 461 -2
USA 12,026 13,807 -13 -6 546 10
UK 7,286 7,150 2 1 291 -1
France 6,249 6,585 -5 -10 241 1
China 5,806 5,729 1 2 514 8
Sweden 5,018 5,007 0 0 167 -5
Italy 4,405 4,470 -1 -6 176 1
Spain 4,004 3,894 3 -2 174 -1
Netherlands 3,706 3,676 1 -3 145 0
Denmark 3,024 2,849 6 2 109 -1
Others* 44,229 42,178 5 6 1,977 52
Total 114,017 113,907 0 0 4,801 62
* Of which franchises 2,590 2,370 9 18 241 22
Change in %
& Other Stories
Six-month report 2018 (1 Dec 2017 – 31 May 2018)
4
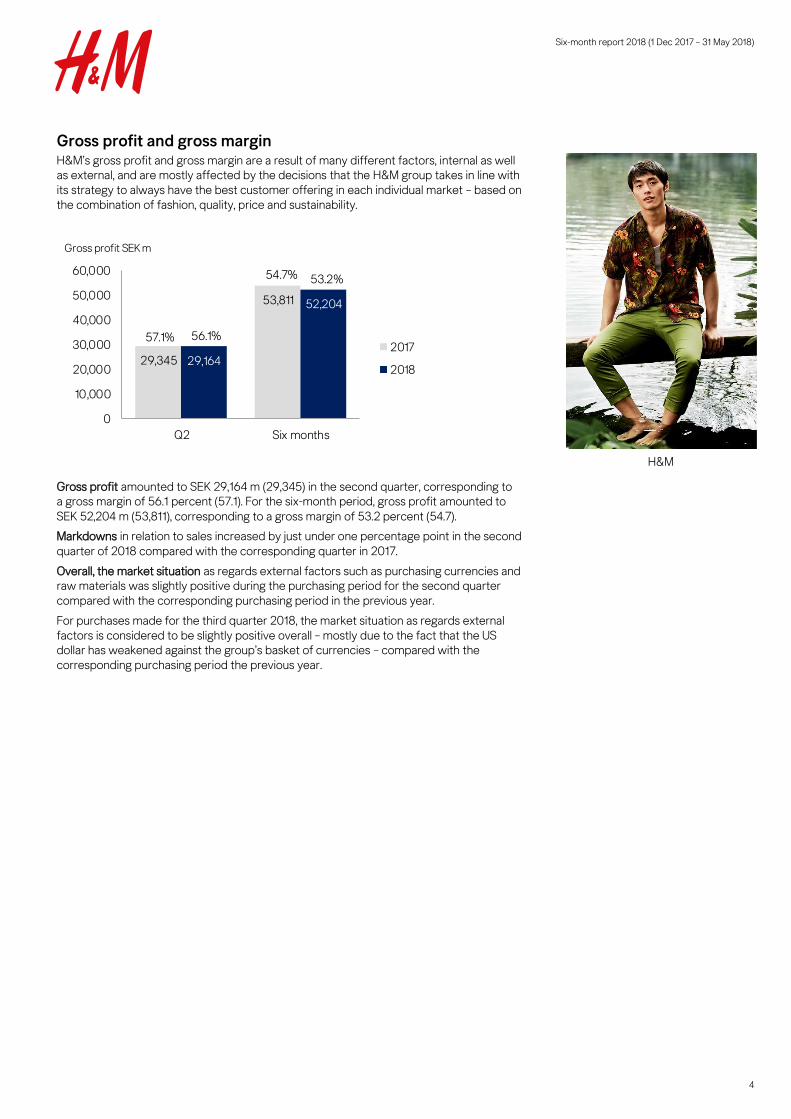
Gross profit and gross margin H&M’s gross profit and gross margin are a result of many different factors, internal as well
as external, and are mostly affected by the decisions that the H&M group takes in line with
its strategy to always have the best customer offering in each individual market – based on
the combination of fashion, quality, price and sustainability.
Gross profit amounted to SEK 29,164 m (29,345) in the second quarter, corresponding to
a gross margin of 56.1 percent (57.1). For the six-month period, gross profit amounted to
SEK 52,204 m (53,811), corresponding to a gross margin of 53.2 percent (54.7).
Markdowns in relation to sales increased by just under one percentage point in the second
quarter of 2018 compared with the corresponding quarter in 2017.
Overall, the market situation as regards external factors such as purchasing currencies and
raw materials was slightly positive during the purchasing period for the second quarter
compared with the corresponding purchasing period in the previous year.
For purchases made for the third quarter 2018, the market situation as regards external
factors is considered to be slightly positive overall – mostly due to the fact that the US
dollar has weakened against the group’s basket of currencies – compared with the
corresponding purchasing period the previous year.
29,345
53,811
29,164
52,204
0
10,000
20,000
30,000
40,000
50,000
60,000
Q2 Six months
Gross profit SEK m
2017
2018
57.1% 56.1%
54.7% 53.2%
H&M
Six-month report 2018 (1 Dec 2017 – 31 May 2018)
5
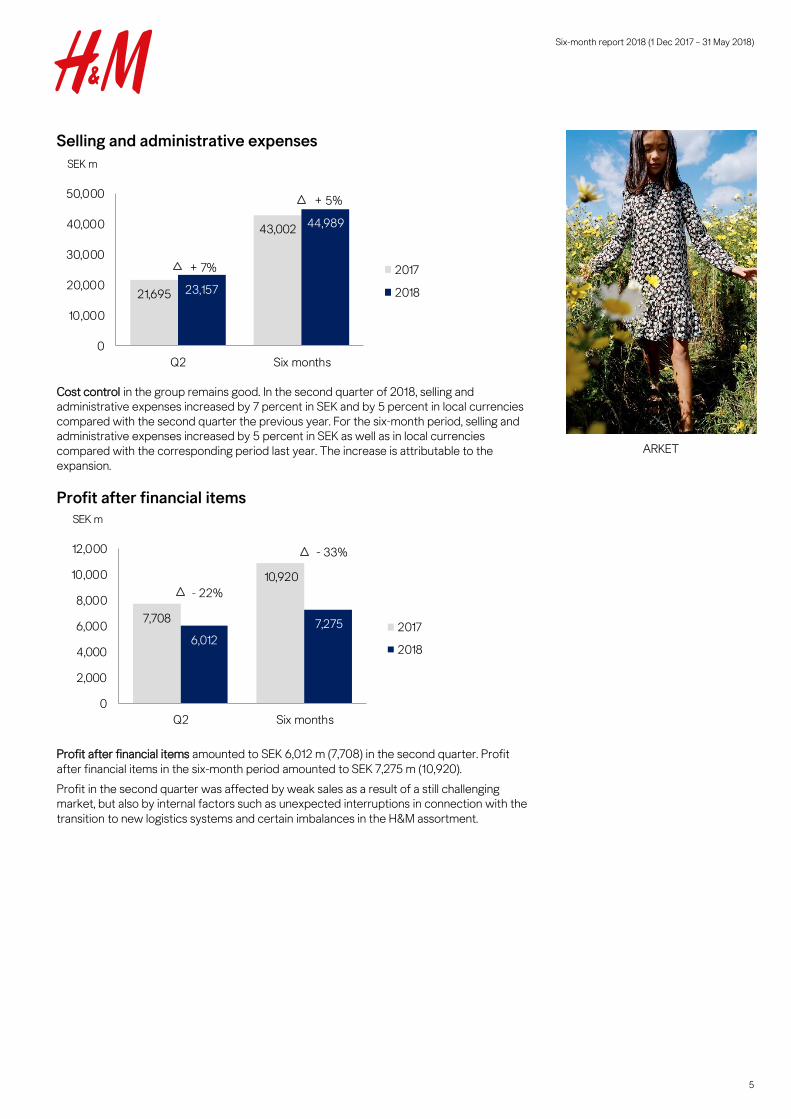
Selling and administrative expenses
Cost control in the group remains good. In the second quarter of 2018, selling and
administrative expenses increased by 7 percent in SEK and by 5 percent in local currencies
compared with the second quarter the previous year. For the six-month period, selling and
administrative expenses increased by 5 percent in SEK as well as in local currencies
compared with the corresponding period last year. The increase is attributable to the
expansion.
Profit after financial items
Profit after financial items amounted to SEK 6,012 m (7,708) in the second quarter. Profit
after financial items in the six-month period amounted to SEK 7,275 m (10,920).
Profit in the second quarter was affected by weak sales as a result of a still challenging
market, but also by internal factors such as unexpected interruptions in connection with the
transition to new logistics systems and certain imbalances in the H&M assortment.
21,695
43,002
23,157
44,989
+ 7%
+ 5%
0
10,000
20,000
30,000
40,000
50,000
Q2 Six months
SEK m
2017
2018
7,708
10,920
6,012
7,275
- 22%
- 33%
0
2,000
4,000
6,000
8,000
10,000
12,000
Q2 Six months
SEK m
2017
2018
ARKET

Six-month report 2018 (1 Dec 2017 – 31 May 2018)
6
Stock-in-trade
Stock-in-trade amounted to SEK 36,333 m (32,148), an increase of 13 percent in SEK
compared with the same point in time last year. In local currencies the increase was
11 percent.
The closing inventory level is still too high. The increase in the inventory level is due to weak
sales as a result of certain imbalances in the H&M assortment combined with the fact that
the transition caused interruptions to the flow of goods in a number of major sales markets.
The high closing inventory level will mean increased markdowns in relation to sales in the
third quarter 2018 compared with the same quarter the previous year.
Gradual improvements to the balance and precision of the H&M assortment combined with
shorter lead times which allow more and more products to be bought during the season
will result in more full-price sales and thus improved inventory levels in future.
The stock-in-trade amounted to 18.2 percent (16.1) of sales excluding VAT, rolling twelve
months and 32.3 percent (31.9) of total assets.
Expansion In spring 2018 the online expansion continued into a further three markets: India, which
opened in March, and via franchise to Saudi Arabia and the United Arab Emirates, which
opened in May. The plan for the future is to offer online shopping in all our store markets
and in other markets as well. New H&M store markets in 2018 will be Uruguay and Ukraine,
which will open in the second half of the year. For 2019 Bosnia-Herzegovina is planned to
become a new H&M store market and Mexico a new H&M online market.
Afound enjoyed a very successful launch in Sweden both in store and online.
For full-year 2018 the H&M group plans to open around 390 stores and close 150, resulting
in a net addition of around 240 new stores for the year. Most of the H&M store openings
will be in emerging markets, while the closures will take place in established markets. The
number of planned store closures has been adjusted from 170 to 150 as a result of
considerably improved lease terms. Most of the new stores in 2018 will be H&M stores, with
around 40 having an H&M Home shop-in-shop, while approximately 90 stores will be for the
brands COS, & Other Stories, Monki, Weekday, ARKET and Afound. In 2018 eight standalone
H&M Home stores are planned to open.
In parallel, the store portfolio is being optimised as regards the number of stores, store
space, rebuilds and relocations in order to continually ensure that the store portfolio is the
right fit and has the best terms in each market.
32,148
36,333
+ 13%
0
10,000
20,000
30,000
40,000
31 May
SEK m
2017
2018
H&M
Six-month report 2018 (1 Dec 2017 – 31 May 2018)
7
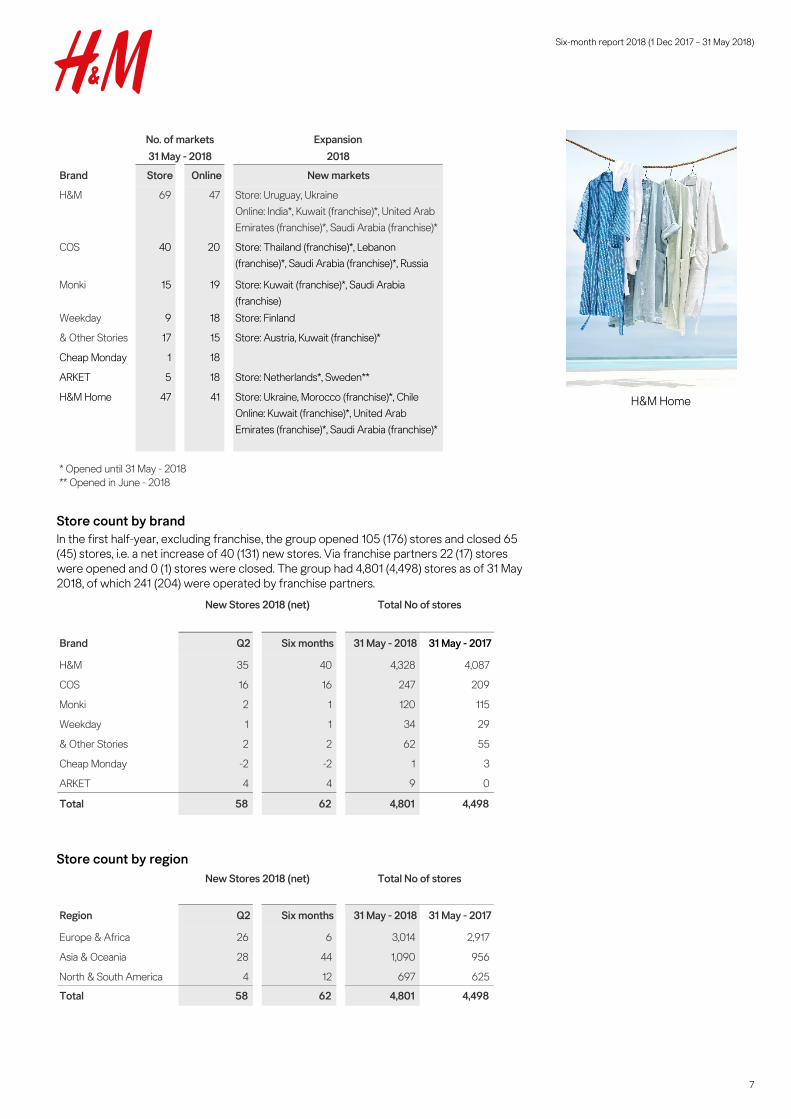
Store count by brand
In the first half-year, excluding franchise, the group opened 105 (176) stores and closed 65
(45) stores, i.e. a net increase of 40 (131) new stores. Via franchise partners 22 (17) stores
were opened and 0 (1) stores were closed. The group had 4,801 (4,498) stores as of 31 May
2018, of which 241 (204) were operated by franchise partners.
Store count by region
Expansion
2018
Brand Store Online New markets
H&M 69 47 Store: Uruguay, Ukraine
Online: India*, Kuwait (franchise)*, United Arab
Emirates (franchise)*, Saudi Arabia (franchise)*
COS 40 20 Store: Thailand (franchise)*, Lebanon
(franchise)*, Saudi Arabia (franchise)*, Russia
Monki 15 19 Store: Kuwait (franchise)*, Saudi Arabia
(franchise)
Weekday 9 18 Store: Finland
& Other Stories 17 15 Store: Austria, Kuwait (franchise)*
Cheap Monday 1 18
ARKET 5 18 Store: Netherlands*, Sweden**
H&M Home 47 41 Store: Ukraine, Morocco (franchise)*, Chile
Online: Kuwait (franchise)*, United Arab
Emirates (franchise)*, Saudi Arabia (franchise)*
** Opened in June - 2018
No. of markets
31 May - 2018
* Opened until 31 May - 2018
Brand Q2 Six months 31 May - 2018 31 May - 2017
H&M 35 40 4,328 4,087
COS 16 16 247 209
Monki 2 1 120 115
Weekday 1 1 34 29
& Other Stories 2 2 62 55
Cheap Monday -2 -2 1 3
ARKET 4 4 9 0
Total 58 62 4,801 4,498
New Stores 2018 (net) Total No of stores
Region Q2 Six months 31 May - 2018 31 May - 2017
Europe & Africa 26 6 3,014 2,917
Asia & Oceania 28 44 1,090 956
North & South America 4 12 697 625
Total 58 62 4,801 4,498
New Stores 2018 (net) Total No of stores
H&M Home

Six-month report 2018 (1 Dec 2017 – 31 May 2018)
8
Tax The US tax reform (Tax Cuts & Jobs Act) was enacted in December 2017. For H&M this
meant that deferred tax liabilities and deferred tax claims assignable to H&M’s US
subsidiary were remeasured during the first quarter 2018. The group had one-off positive
tax income of SEK 408 m in the six-month period as a result of this remeasurement. Cash
flow was not affected by this one-off effect.
The H&M group’s tax rate for the 2017/2018 financial year is expected to be approximately
22.0 – 23.0 percent excluding the one-off effect described above. In the first, second and
third quarters of 2018 a tax rate of 23.0 percent will be used to calculate tax expense on
the result of each quarter. The outcome of the tax rate for the year depends on the results
of the group’s various companies and the corporate tax rates in each country.
Financing As of 31 May 2018, the group had SEK 14,527 m (6,195) in loans from credit institutions with
a term of up to 12 months as well as SEK 1,028 m (0) in loans from credit institutions with a
term of up to 24 months.
As previously communicated, during the first quarter 2017 the H&M group signed a five-
year revolving credit facility (RCF) of EUR 700 m. The RCF has not yet been drawn down
and serves as the group’s liquidity reserve.
Net debt in relation to EBITDA amounted to 0.2.
The strong credit profile of the H&M group enables cost-effective financing. To increase
financing flexibility and cost-effectiveness, the group continuously reviews opportunities to
complement this with other sources of funding on the credit market.
Accounting principles The group applies International Financial Reporting Standards (IFRS) as adopted by the EU.
This report has been prepared according to IAS 34 Interim Financial Reporting as well as
the Swedish Annual Accounts Act.
The accounting principles and calculation methods applied in this report are unchanged
from those used in the preparation of the annual report and consolidated financial
statements for 2017 which are described in Note 1 – Accounting principles.
H & M Hennes & Mauritz AB’s financial instruments consist of accounts receivable, other
receivables, cash and cash equivalents, accounts payable, accrued trade payables, interest-
bearing securities and currency derivatives. Currency derivatives are measured at fair value
based on input data corresponding to level 2 of IFRS 13. As of 31 May 2018, forward
contracts with a positive market value amount to SEK 768 m (333), which is reported under
other current receivables. Forward contracts with a negative market value amount to SEK
938 m (897), which is reported under other current liabilities. Other financial assets and
liabilities have short terms. It is therefore judged that the fair values of these financial
instruments are approximately equal to their book values.
The parent company applies the Swedish Annual Accounts Act and the Swedish Financial
Reporting Board’s recommendation RFR 2 Accounting for Legal Entities, which essentially
involves applying IFRS. In accordance with RFR 2, the parent company does not apply IAS
39 to the measurement of financial instruments; nor does it capitalise development
expenditure.
For definitions see the annual report and consolidated accounts for 2017.
Risks and uncertainties A number of factors may affect the H&M group’s result and business. Many of these can be
dealt with through internal routines, while certain others are affected more by external
influences. There are risks and uncertainties for the H&M group related to the major shift
within the industry, fashion, weather conditions, macroeconomic and geopolitical changes,
sustainability issues, foreign currency, cyber-attacks, tax and different regulations but also
in connection with expansion into new markets, the launch of new concepts and how the
brand is managed.
For a more detailed description of risks and uncertainties, refer to the administration report
and to note 2 in the annual report and consolidated accounts for 2017.

Six-month report 2018 (1 Dec 2017 – 31 May 2018)
9
Calendar
17 September 2018 Sales development in third quarter, 1 Jun 2018 – 31 Aug
2018
27 September 2018 Nine-month report, 1 Dec 2017 – 31 Aug 2018
17 December 2018 Sales development in fourth quarter, 1 Sep 2018 – 30
November 2018
31 January 2019 Full-year report, 1 Dec 2017 – 30 Nov 2018
15 March 2019 Sales development in first quarter, 1 Dec 2018 – 28 Feb
2019
29 March 2019 Three-month report, 1 Dec 2018 – 28 Feb 2019
7 May 2019 Annual general meeting
This six-month report has not been audited by the company’s auditors.
Stockholm, 27 June 2018
Board of Directors
Communication in conjunction with the six-month report The six-month report for 2018, i.e. 1 December 2017 – 31 May 2018, will be published at
08:00 CET on 28 June 2018, followed by a press conference at 09:30 CET hosted by CEO
Karl-Johan Persson and Head of Investor Relations Nils Vinge. The press conference for the
financial market and media will be held in Swedish at H&M’s head office in Stockholm,
Ljusgården, Mäster Samuelsgatan 49, 3rd floor.
A telephone conference for the financial market and media will be held in English at 14:00
CET hosted by CEO Karl-Johan Persson, CFO Jyrki Tervonen and Head of IR Nils Vinge. The
presentation material will be available at about.hm.com/investors. For login details to the
telephone conference please register at:
http://about.hm.com/en/media/calendar/six-month-report0.html
To book interviews with CEO Karl-Johan Persson and Head of IR Nils Vinge in conjunction
with the six-month report on 28 June, please contact:
Kristina Stenvinkel, Communications Director
Telephone: +46 8 796 39 08
E-mail: [email protected]
Contact Nils Vinge, Head of IR +46 8 796 52 50
Karl-Johan Persson, CEO +46 8 796 55 00 (switchboard)
Jyrki Tervonen, CFO +46 8 796 55 00 (switchboard)
H & M Hennes & Mauritz AB (publ)
SE-106 38 Stockholm
Phone: +46-8-796 55 00, Fax: +46-8-24 80 78, E-mail: [email protected]
Registered office: Stockholm, Reg. No. 556042-7220

Six-month report 2018 (1 Dec 2017 – 31 May 2018)
10
The undersigned hereby provide an assurance that the half-year report for 1 December 2017 –
31 May 2018 provides a true and fair view of the parent company’s and the group’s business,
positions and earnings, and also describe the significant risks and uncertainties faced by the
companies making up the group.
Stockholm 27 June, 2018
Stefan Persson Stina Bergfors Anders Dahlvig
Chairman of the Board Board member Board member
Ingrid Godin Lena Patriksson Keller Alexandra Rosenqvist
Board member Board member Board member
Christian Sievert Erica Wiking Häger Niklas Zennström
Board member Board member Board member
Karl-Johan Persson
Chief Executive Officer
Information in this interim report is that which H & M Hennes & Mauritz AB (publ) is required to disclose under the EU Market Abuse Regulation
(596/2014/EU). The information was submitted for publication by the abovementioned persons at 08:00 (CET) on 28 June 2018. This interim
report and other information about H&M, is available at about.hm.com.
H & M Hennes & Mauritz AB (publ) was founded in Sweden in 1947 and is quoted on Nasdaq Stockholm. H&M’s business idea is to offer fashion and quality at the best
price in a sustainable way. In addition to H&M, the group includes the brands COS, Monki, Weekday, Cheap Monday, & Other Stories, H&M Home and ARKET as well as
Afound. The H&M group has 47 online markets and more than 4,800 stores in 69 markets including franchise markets. In 2017, sales including VAT were SEK 232 billion.
The number of employees amounts to more than 171,000. For further information, visit about.hm.com.

Six-month report 2018 (1 Dec 2017 – 31 May 2018)
11
Q2
2018
Q2
2017
Six months
2018
Six months
2017
1 Dec 2016-
30 Nov 2017
Sales including VAT 60,463 59,538 114,017 113,907 231,771
Sales excluding VAT 51,984 51,383 98,165 98,368 200,004
Cost of goods sold -22,820 -22,038 -45,961 -44,557 -91,914
GROSS PROFIT 29,164 29,345 52,204 53,811 108,090
Gross margin, % 56.1 57.1 53.2 54.7 54.0
Selling expenses -21,095 -19,924 -41,071 -39,477 -80,427
Administrative expenses -2,062 -1,771 -3,918 -3,525 -7,094
OPERATING PROFIT 6,007 7,650 7,215 10,809 20,569
Operating margin, % 11.6 14.9 7.3 11.0 10.3
Net financial items 5 58 60 111 240
PROFIT AFTER FINANCIAL ITEMS 6,012 7,708 7,275 10,920 20,809
Tax -1,374 -1,811 -1,265 -2,566 -4,625
PROFIT FOR THE PERIOD 4,638 5,897 6,010 8,354 16,184
All profit for the year is attributable to the shareholders of the parent company H & M Hennes & Mauritz AB.
Earnings per share, SEK* 2.80 3.56 3.63 5.05 9.78
Number of shares, thousands* 1,655,072 1,655,072 1,655,072 1,655,072 1,655,072
Depreciation, total 2,424 2,145 4,703 4,251 8,488
of which cost of goods sold 136 174 287 378 736
of which selling expenses 2,146 1,827 4,130 3,587 7,175
of which administrative expenses 142 144 286 286 577
* Before and after dilution.
CONSOLIDATED STATEMENT OF COMPREHENSIVE INCOME (SEK m)
Q2
2018
Q2
2017
Six months
2018
Six months
2017
1 Dec 2016-
30 Nov 2017
PROFIT FOR THE PERIOD 4,638 5,897 6,010 8,354 16,184
Other comprehensive income
Items that are or may be reclassified to profit or loss
Translation differences 1,415 -331 2,021 -833 -1,496
Change in hedging reserves 328 -467 366 -199 -179
Tax attributable to change in hedging reserves -75 112 -84 48 39
Items that will not be classified to profit or loss
Remeasurement of defined benefit pension plans - - - - 78
Tax related to the above remeasurement - - - - -19
OTHER COMPREHENSIVE INCOME 1,668 -686 2,303 -984 -1,577
TOTAL COMPREHENSIVE INCOME FOR THE PERIOD 6,306 5,211 8,313 7,370 14,607
All comprehensive income is attributable to the shareholders of the parent company H & M Hennes & Mauritz AB.
GROUP INCOME STATEMENT IN SUMMARY (SEK m)
Six-month report 2018 (1 Dec 2017 – 31 May 2018)
12
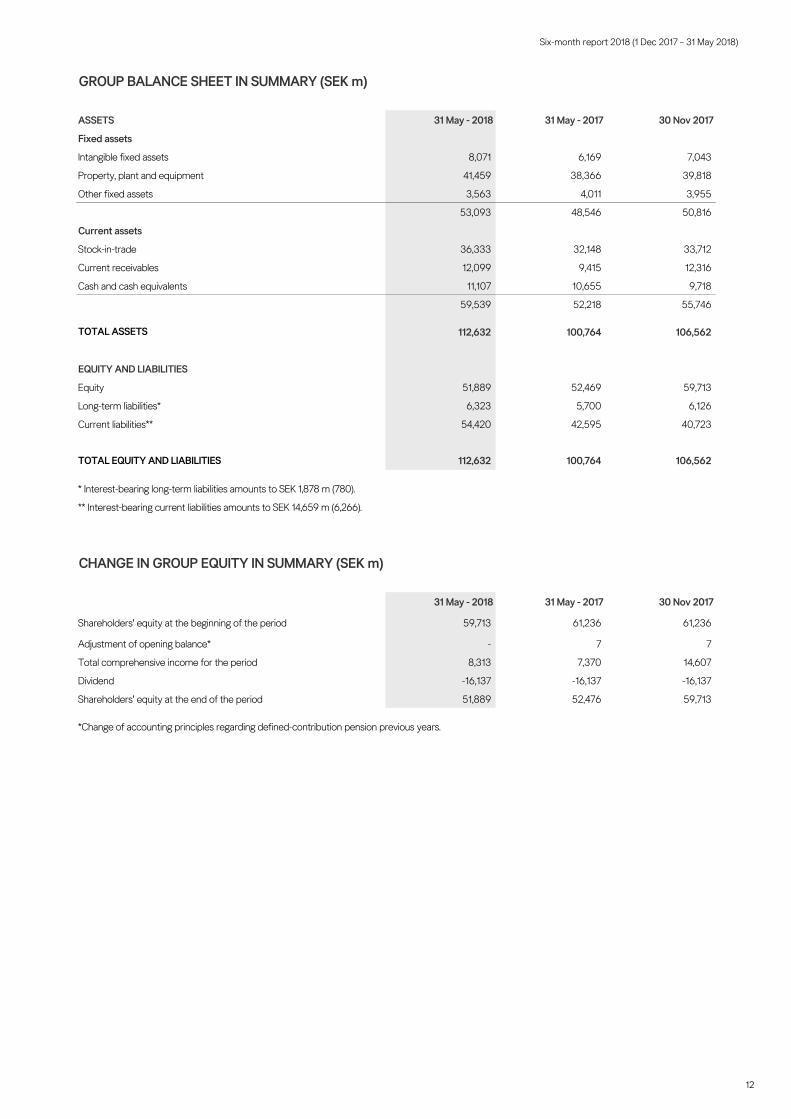
GROUP BALANCE SHEET IN SUMMARY (SEK m)
ASSETS 31 May - 2018 31 May - 2017 30 Nov 2017
Fixed assets
Intangible fixed assets 8,071 6,169 7,043
Property, plant and equipment 41,459 38,366 39,818
Other fixed assets 3,563 4,011 3,955
53,093 48,546 50,816
Current assets
Stock-in-trade 36,333 32,148 33,712
Current receivables 12,099 9,415 12,316
Cash and cash equivalents 11,107 10,655 9,718
59,539 52,218 55,746
TOTAL ASSETS 112,632 100,764 106,562
EQUITY AND LIABILITIES
Equity 51,889 52,469 59,713
Long-term liabilities* 6,323 5,700 6,126
Current liabilities** 54,420 42,595 40,723
TOTAL EQUITY AND LIABILITIES 112,632 100,764 106,562
* Interest-bearing long-term liabilities amounts to SEK 1,878 m (780).
CHANGE IN GROUP EQUITY IN SUMMARY (SEK m)
31 May - 2018 31 May - 2017 30 Nov 2017
Shareholders' equity at the beginning of the period 59,713 61,236 61,236
Adjustment of opening balance* - 7 7
Total comprehensive income for the period 8,313 7,370 14,607
Dividend -16,137 -16,137 -16,137
Shareholders' equity at the end of the period 51,889 52,476 59,713
*Change of accounting principles regarding defined-contribution pension previous years.
** Interest-bearing current liabilities amounts to SEK 14,659 m (6,266).

Six-month report 2018 (1 Dec 2017 – 31 May 2018)
13
GROUP CASH FLOW STATEMENT (SEK m)
Six months 2018 Six months 2017
Current operations
Profit after financial items* 7,275 10,920
Provisions for pensions 32 46
Depreciation 4,703 4,251
Tax paid -546 -2,507
Other 21 -11
Cash flow from current operations before changes in working capital 11,485 12,699
Cash flow from changes in working capital
Current receivables -1,164 -638
Stock-in-trade -2,019 -653
Current liabilities 831 -466
CASH FLOW FROM CURRENT OPERATIONS 9,133 10,942
Investment activities
Investment in intangible fixed assets -1,370 -1,055
Investment in tangible fixed assets -4,333 -4,473
Other investments -170 -20
CASH FLOW FROM INVESTMENT ACTIVITIES -5,873 -5,548
Financing activities
Change in interest-bearing liabilities 5,750 4,097
Dividend -8,110 -8,110
CASH FLOW FROM FINANCING ACTIVITIES -2,360 -4,013
CASH FLOW FOR THE PERIOD 900 1,381
Cash and cash equivalents at beginning of the financial year 9,718 9,446
Cash flow for the period 900 1,381
Exchange rate effect 489 -172
Cash and cash equivalents at end of the period** 11,107 10,655
* Interest paid for the group amounts to SEK 35 m (8).
** Cash and cash equivalents and short-term investments at the end of the period amounted to SEK 11,107 m (10,655).
Six-month report 2018 (1 Dec 2017 – 31 May 2018)
14
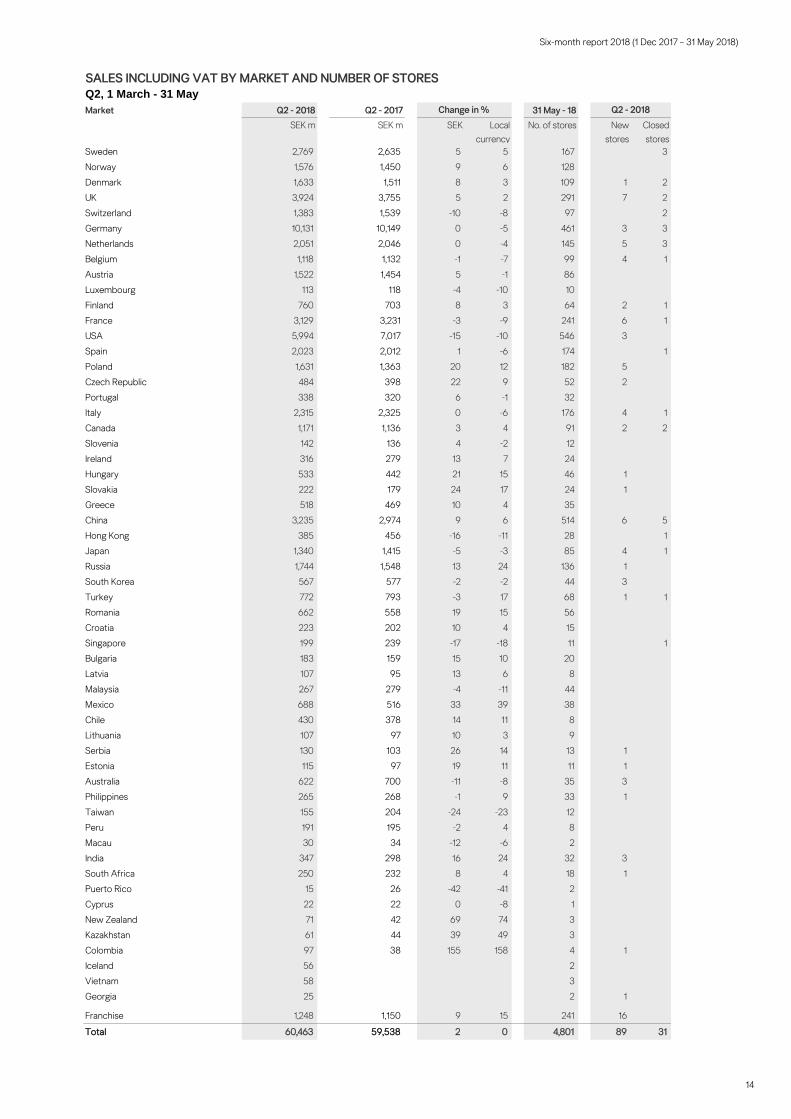
SALES INCLUDING VAT BY MARKET AND NUMBER OF STORES
Q2, 1 March - 31 May
Market Q2 - 2018 Q2 - 2017 31 May - 18
SEK m SEK m SEK Local
currency
No. of stores New
stores
Closed
stores
Sweden 2,769 2,635 5 5 167 3
Norway 1,576 1,450 9 6 128
Denmark 1,633 1,511 8 3 109 1 2
UK 3,924 3,755 5 2 291 7 2
Switzerland 1,383 1,539 -10 -8 97 2
Germany 10,131 10,149 0 -5 461 3 3
Netherlands 2,051 2,046 0 -4 145 5 3
Belgium 1,118 1,132 -1 -7 99 4 1
Austria 1,522 1,454 5 -1 86
Luxembourg 113 118 -4 -10 10
Finland 760 703 8 3 64 2 1
France 3,129 3,231 -3 -9 241 6 1
USA 5,994 7,017 -15 -10 546 3
Spain 2,023 2,012 1 -6 174 1
Poland 1,631 1,363 20 12 182 5
Czech Republic 484 398 22 9 52 2
Portugal 338 320 6 -1 32
Italy 2,315 2,325 0 -6 176 4 1
Canada 1,171 1,136 3 4 91 2 2
Slovenia 142 136 4 -2 12
Ireland 316 279 13 7 24
Hungary 533 442 21 15 46 1
Slovakia 222 179 24 17 24 1
Greece 518 469 10 4 35
China 3,235 2,974 9 6 514 6 5
Hong Kong 385 456 -16 -11 28 1
Japan 1,340 1,415 -5 -3 85 4 1
Russia 1,744 1,548 13 24 136 1
South Korea 567 577 -2 -2 44 3
Turkey 772 793 -3 17 68 1 1
Romania 662 558 19 15 56
Croatia 223 202 10 4 15
Singapore 199 239 -17 -18 11 1
Bulgaria 183 159 15 10 20
Latvia 107 95 13 6 8
Malaysia 267 279 -4 -11 44
Mexico 688 516 33 39 38
Chile 430 378 14 11 8
Lithuania 107 97 10 3 9
Serbia 130 103 26 14 13 1
Estonia 115 97 19 11 11 1
Australia 622 700 -11 -8 35 3
Philippines 265 268 -1 9 33 1
Taiwan 155 204 -24 -23 12
Peru 191 195 -2 4 8
Macau 30 34 -12 -6 2
India 347 298 16 24 32 3
South Africa 250 232 8 4 18 1
Puerto Rico 15 26 -42 -41 2
Cyprus 22 22 0 -8 1
New Zealand 71 42 69 74 3
Kazakhstan 61 44 39 49 3
Colombia 97 38 155 158 4 1
Iceland 56 2
Vietnam 58 3
Georgia 25 2 1
Franchise 1,248 1,150 9 15 241 16
Total 60,463 59,538 2 0 4,801 89 31
Change in % Q2 - 2018

Six-month report 2018 (1 Dec 2017 – 31 May 2018)
15
SALES INCLUDING VAT BY MARKET AND NUMBER OF STORES
Six months, 1 December - 31 May
Market 2018 2017 31 May - 18
SEK m SEK m SEK Local
currency
No. of stores New
stores
Closed
stores
Sweden 5,018 5,007 0 0 167 5
Norway 2,896 2,942 -2 0 128
Denmark 3,024 2,849 6 2 109 1 2
UK 7,286 7,150 2 1 291 7 8
Switzerland 2,621 3,033 -14 -10 97 3
Germany 18,264 18,562 -2 -5 461 4 6
Netherlands 3,706 3,676 1 -3 145 6 6
Belgium 2,210 2,242 -1 -6 99 4 2
Austria 2,784 2,739 2 -2 86
Luxembourg 219 229 -4 -9 10
Finland 1,445 1,391 4 0 64 2 2
France 6,249 6,585 -5 -10 241 6 5
USA 12,026 13,807 -13 -6 546 13 3
Spain 4,004 3,894 3 -2 174 2 3
Poland 3,013 2,541 19 11 182 7
Czech Republic 896 753 19 8 52 3 1
Portugal 665 637 4 0 32
Italy 4,405 4,470 -1 -6 176 4 3
Canada 2,160 2,210 -2 1 91 2 2
Slovenia 267 260 3 -2 12 1
Ireland 608 554 10 5 24
Hungary 975 834 17 13 46 1
Slovakia 419 348 20 15 24 2
Greece 994 913 9 4 35
China 5,806 5,729 1 2 514 14 6
Hong Kong 771 935 -18 -10 28 1 1
Japan 2,309 2,437 -5 -1 85 4 1
Russia 2,939 2,642 11 21 136 2
South Korea 991 1,004 -1 0 44 3
Turkey 1,455 1,460 0 18 68 1 3
Romania 1,256 1,090 15 14 56
Croatia 410 392 5 0 15
Singapore 436 512 -15 -14 11 2
Bulgaria 343 307 12 8 20
Latvia 192 178 8 3 8
Malaysia 612 625 -2 -5 44
Mexico 1,514 1,062 43 47 38 1
Chile 916 746 23 24 8
Lithuania 192 185 4 -1 9
Serbia 232 193 20 11 13 1
Estonia 209 185 13 8 11 1
Australia 1,217 1,373 -11 -7 35 3
Philippines 582 557 4 17 33 1
Taiwan 344 428 -20 -17 12
Peru 432 445 -3 5 8
Macau 62 75 -17 -7 2
India 696 586 19 26 32 5
South Africa 517 478 8 8 18 1
Puerto Rico 32 62 -48 -44 2
Cyprus 45 48 -6 -12 1
New Zealand 146 95 54 64 3
Kazakhstan 105 44 139 162 3
Colombia 220 38 479 511 4 1
Iceland 116 2
Vietnam 127 3 1
Georgia 49 2 1
Franchise 2,590 2,370 9 18 241 22
Total 114,017 113,907 0 0 4,801 127 65
Change in % Six months
Six-month report 2018 (1 Dec 2017 – 31 May 2018)
16
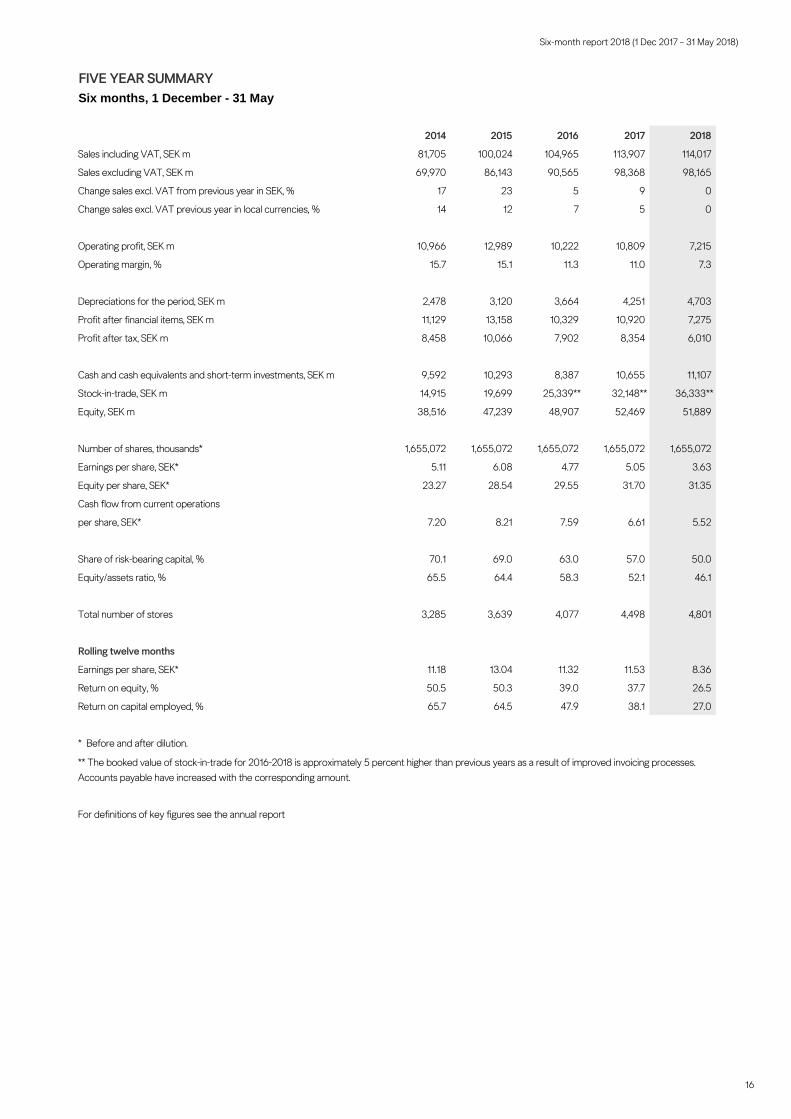
FIVE YEAR SUMMARY
Six months, 1 December - 31 May
2014 2015 2016 2017 2018
Sales including VAT, SEK m 81,705 100,024 104,965 113,907 114,017
Sales excluding VAT, SEK m 69,970 86,143 90,565 98,368 98,165
Change sales excl. VAT from previous year in SEK, % 17 23 5 9 0
Change sales excl. VAT previous year in local currencies, % 14 12 7 5 0
Operating profit, SEK m 10,966 12,989 10,222 10,809 7,215
Operating margin, % 15.7 15.1 11.3 11.0 7.3
Depreciations for the period, SEK m 2,478 3,120 3,664 4,251 4,703
Profit after financial items, SEK m 11,129 13,158 10,329 10,920 7,275
Profit after tax, SEK m 8,458 10,066 7,902 8,354 6,010
Cash and cash equivalents and short-term investments, SEK m 9,592 10,293 8,387 10,655 11,107
Stock-in-trade, SEK m 14,915 19,699 25,339** 32,148** 36,333**
Equity, SEK m 38,516 47,239 48,907 52,469 51,889
Number of shares, thousands* 1,655,072 1,655,072 1,655,072 1,655,072 1,655,072
Earnings per share, SEK* 5.11 6.08 4.77 5.05 3.63
Equity per share, SEK* 23.27 28.54 29.55 31.70 31.35
Cash flow from current operations
per share, SEK* 7.20 8.21 7.59 6.61 5.52
Share of risk-bearing capital, % 70.1 69.0 63.0 57.0 50.0
Equity/assets ratio, % 65.5 64.4 58.3 52.1 46.1
Total number of stores 3,285 3,639 4,077 4,498 4,801
Rolling twelve months
Earnings per share, SEK* 11.18 13.04 11.32 11.53 8.36
Return on equity, % 50.5 50.3 39.0 37.7 26.5
Return on capital employed, % 65.7 64.5 47.9 38.1 27.0
* Before and after dilution.
For definitions of key figures see the annual report
** The booked value of stock-in-trade for 2016-2018 is approximately 5 percent higher than previous years as a result of improved invoicing processes.
Accounts payable have increased with the corresponding amount.

Six-month report 2018 (1 Dec 2017 – 31 May 2018)
17
SEGMENT REPORTING (SEK m)
Six months 2018 Six months 2017
Asia and Oceania
External net sales 15,044 15,151
Operating profit 287 299
Operating margin, % 1.9 2.0
Europe and Africa
External net sales 67,160 66,164
Operating profit 712 406
Operating margin, % 1.1 0.6
North and South America
External net sales 15,961 17,053
Operating profit -447 -398
Operating margin, % -2.8 -2.3
Group Functions
Net sales to other segments 34,670 37,469
Operating profit 6,663 10,502
Eliminations
Net sales to other segments -34,670 -37,469
Total
External net sales 98,165 98,368
Operating profit 7,215 10,809
Operating margin, % 7.3 11.0

Six-month report 2018 (1 Dec 2017 – 31 May 2018)
18
PARENT COMPANY INCOME STATEMENT IN SUMMARY (SEK m)
Q2
2018
Q2
2017
Six months
2018
Six months
2017
1 Dec 2016-
30 Nov 2017
External sales excluding VAT 5 4 10 4 13
Internal sales excluding VAT* 1,016 1,128 2,015 2,044 4,069
GROSS PROFIT 1,021 1,132 2,025 2,048 4,082
Administrative expenses -47 -45 -89 -89 -158
OPERATING PROFIT 974 1,087 1,936 1,959 3,924
Net financial items** 2,237 2,201 2,313 2,619 12,931
PROFIT AFTER FINANCIAL ITEMS 3,211 3,288 4,249 4,578 16,855
Year-end appropriations - - - - -328
Tax -226 -234 -443 -424 -773
PROFIT FOR THE PERIOD 2,985 3,054 3,806 4,154 15,754
PARENT COMPANY STATEMENT OF COMPREHENSIVE INCOME (SEK m)
Q2
2018
Q2
2017
Six months
2018
Six months
2017
1 Dec 2016-
30 Nov 2017
PROFIT FOR THE PERIOD 2,985 3,054 3,806 4,154 15,754
Other comprehensive income
Items that have not been and will not be reclassified to profit or loss
Remeasurement of defined benefit pension plans - - - - -1
Tax related to the above remeasurement - - - - 0
OTHER COMPREHENSIVE INCOME - - - - -1
TOTAL COMPREHENSIVE INCOME FOR THE PERIOD 2,985 3,054 3,806 4,154 15,753
* Internal sales in the quarter consists of royalty of SEK 1,014 m (1,086) and other SEK 2 m (42) received from group companies and for the six-month period
of royalty of SEK 2,011 m (2,000) and other SEK 4 m (44).
** Dividend income from subsidiaries in the quarter consists of SEK 2,184 m (2,224) and in the six-month period of SEK 2,234 m (2,650).

Six-month report 2018 (1 Dec 2017 – 31 May 2018)
19
PARENT COMPANY BALANCE SHEET IN SUMMARY (SEK m)
31 May - 2018 31 May - 2017 30 Nov 2017
ASSETS
Fixed assets
Property, plant and equipment 327 408 367
Financial fixed assets 1,820 1,559 1,627
2,147 1,967 1,994
Current assets
Current receivables 21,260 12,082 19,312
Cash and cash equivalents 93 108 133
21,353 12,190 19,445
TOTAL ASSETS 23,500 14,157 21,439
EQUITY AND LIABILITIES
Equity 4,147 4,874 16,478
Untaxed reserves 417 429 417
Long-term liabilities* 182 191 182
Current liabilities** 18,754 8,663 4,362
TOTAL EQUITY AND LIABILITIES 23,500 14,157 21,439
* Relates to provisions for pensions.
** Interest-bearing current liabilities amounts to SEK 10,000 m (0). Dividend to be paid amounts to SEK 8,027 m (8,027).