Embed Size (px)
Citation preview
Six SigmaExecutive Overview
Note all information is proprietary and confidential
Association of Business Process Management Professionals
Chicago Chapter
February 10, 2010
Lilly Eng
2Note all information is proprietary and confidential
Agenda
The Evolution of Six Sigma
Deployment Strategy
What is Six Sigma?
Methodology and Tools
Q&A
3Note all information is proprietary and confidential
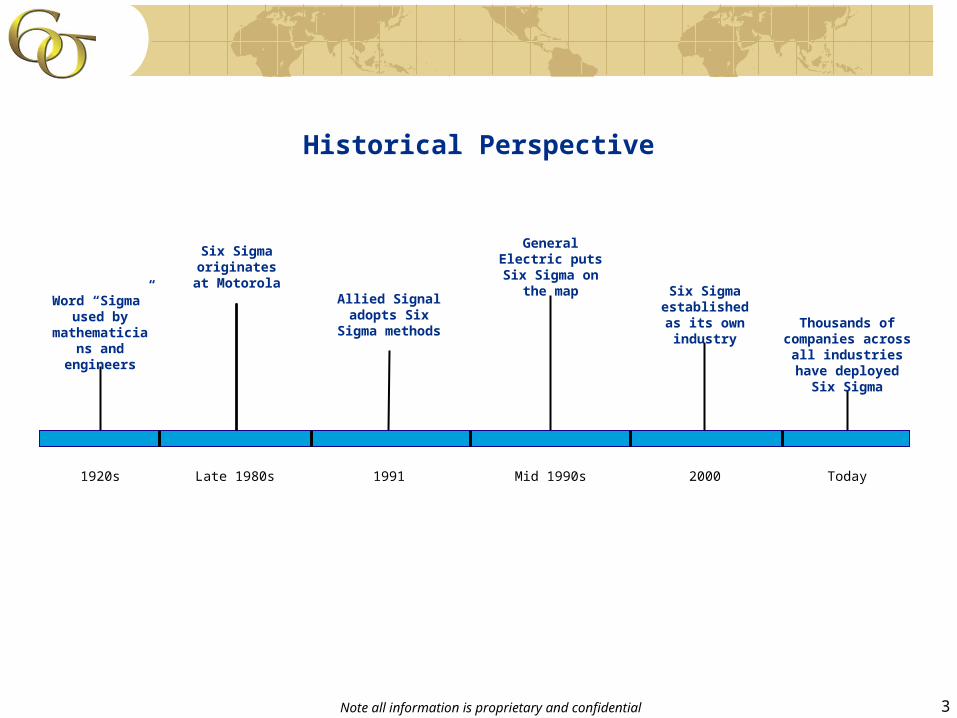
Historical Perspective
1920s Late 1980s 1991 Mid 1990s 2000
Word “Sigma” used by
mathematicians and engineers
Six Sigma originates at
MotorolaAllied Signal adopts Six
Sigma methods
General Electric puts Six Sigma
on the mapSix Sigma
established as its own industry
Today
Thousands of companies across all industries have
deployed Six Sigma
4Note all information is proprietary and confidential
5Note all information is proprietary and confidential
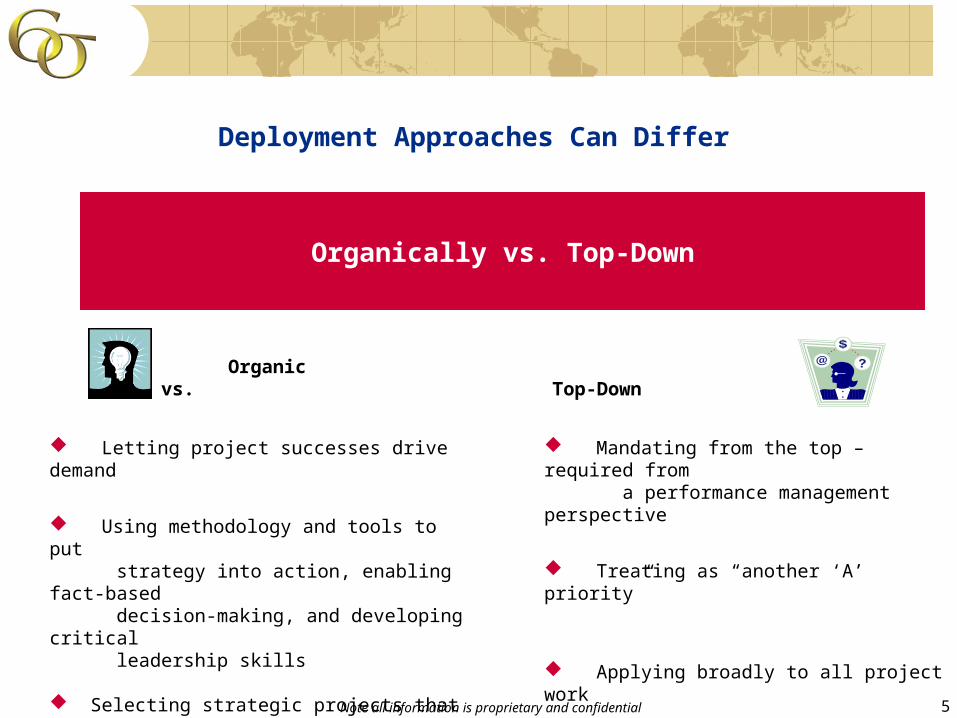
Deployment Approaches Can Differ
Organically vs. Top-Down
Letting project successes drive demand
Using methodology and tools to put strategy into action, enabling fact-based decision-making, and developing critical leadership skills
Selecting strategic projects that reduce operational risk, improve customer experience, and increase shareholder value
Organic vs. Top-Down
Mandating from the top – required from a performance management perspective
Treating as “another ‘A’ priority”
Applying broadly to all project work
6Note all information is proprietary and confidential
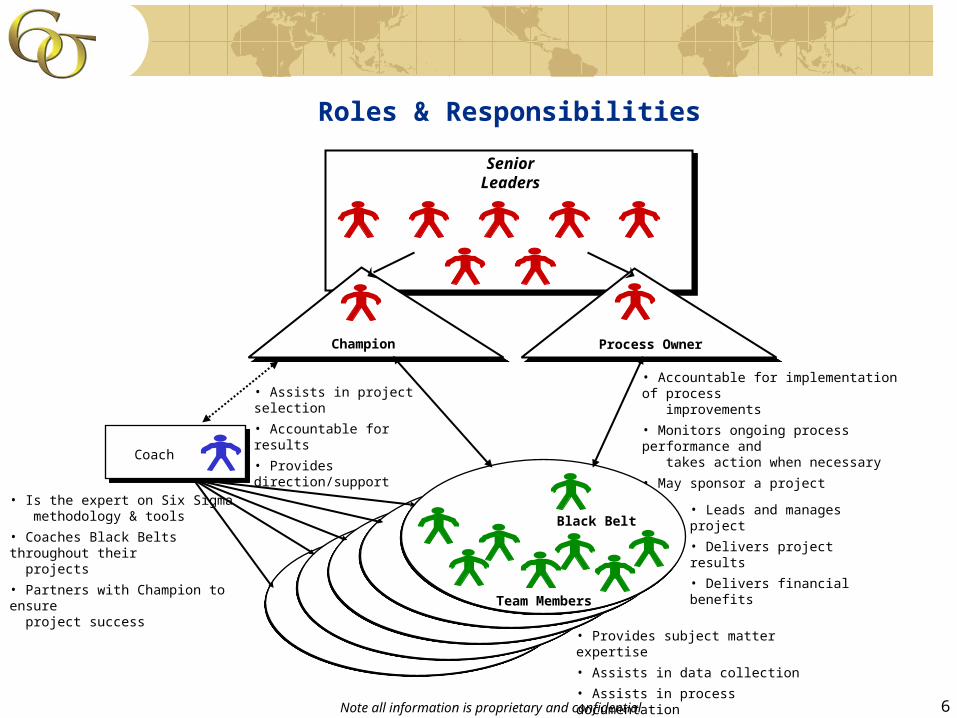
Roles & Responsibilities
SeniorLeaders
Black Belt
Team Members
Process Owner
Coach
Champion
• Assists in project selection
• Accountable for results
• Provides direction/support
• Provides subject matter expertise
• Assists in data collection
• Assists in process documentation
• Leads and manages project
• Delivers project results
• Delivers financial benefits
• Is the expert on Six Sigma methodology & tools
• Coaches Black Belts throughout their projects
• Partners with Champion to ensure project success
• Accountable for implementation of process improvements
• Monitors ongoing process performance and takes action when necessary
• May sponsor a project
7Note all information is proprietary and confidential
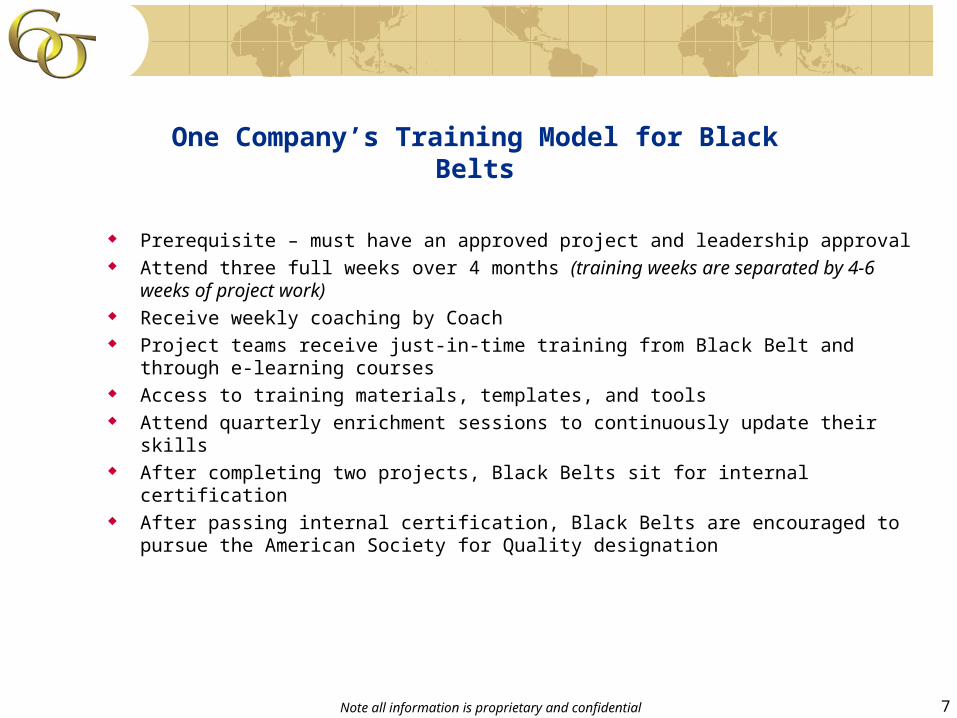
Prerequisite – must have an approved project and leadership approval Attend three full weeks over 4 months (training weeks are separated by 4-6
weeks of project work) Receive weekly coaching by Coach Project teams receive just-in-time training from Black Belt and through e-learning
courses Access to training materials, templates, and tools Attend quarterly enrichment sessions to continuously update their skills After completing two projects, Black Belts sit for internal certification After passing internal certification, Black Belts are encouraged to pursue the
American Society for Quality designation
One Company’s Training Model for Black Belts
8Note all information is proprietary and confidential
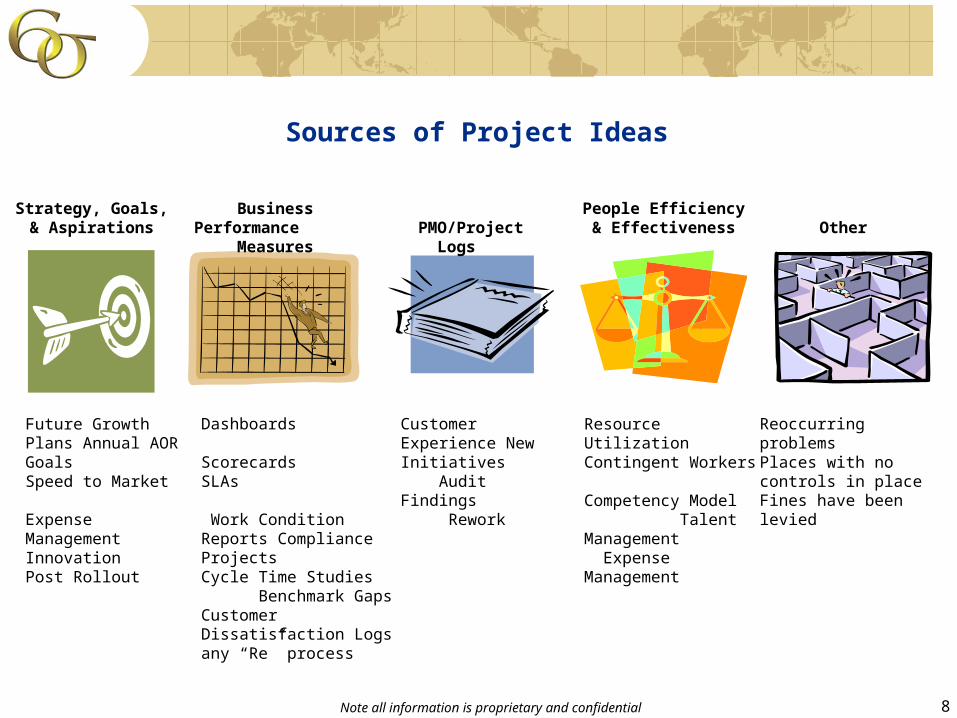
Sources of Project Ideas
Dashboards ScorecardsSLAs Work Condition Reports Compliance ProjectsCycle Time Studies Benchmark GapsCustomer Dissatisfaction Logs any “Re” process
PMO/Project Logs Business Performance
MeasuresStrategy, Goals,
& Aspirations
Future Growth Plans Annual AOR GoalsSpeed to Market Expense Management InnovationPost Rollout
Resource Utilization Contingent Workers Competency Model Talent Management Expense Management
People Efficiency& Effectiveness
Customer Experience New Initiatives Audit Findings Rework
Other
Reoccurring problemsPlaces with no controls in placeFines have been levied
9Note all information is proprietary and confidential
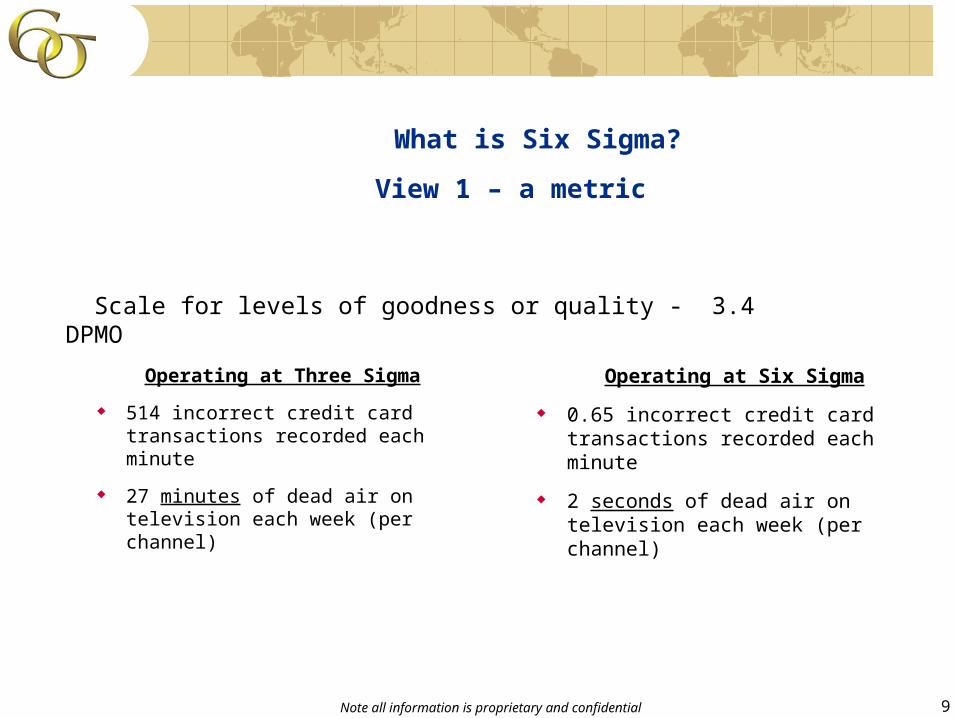
What is Six Sigma?
View 1 – a metric
Scale for levels of goodness or quality - 3.4 DPMO
Operating at Three Sigma
514 incorrect credit card transactions recorded each minute
27 minutes of dead air on television each week (per channel)
Operating at Six Sigma
0.65 incorrect credit card transactions recorded each minute
2 seconds of dead air on television each week (per channel)
10Note all information is proprietary and confidential
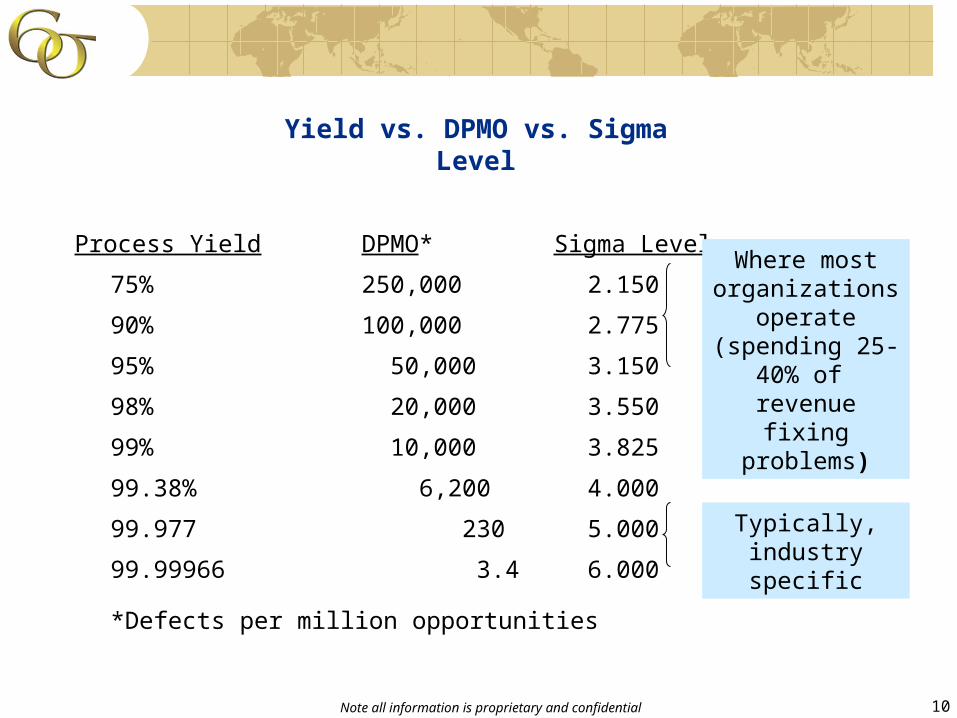
Process Yield DPMO* Sigma Level
75% 250,000 2.150
90% 100,000 2.775
95% 50,000 3.150
98% 20,000 3.550
99% 10,000 3.825
99.38% 6,200 4.000
99.977 230 5.000
99.99966 3.4 6.000
*Defects per million opportunities
Where most organizations
operate (spending 25-40% of
revenue fixing problems)
Typically, industry specific
Yield vs. DPMO vs. Sigma Level
11Note all information is proprietary and confidential
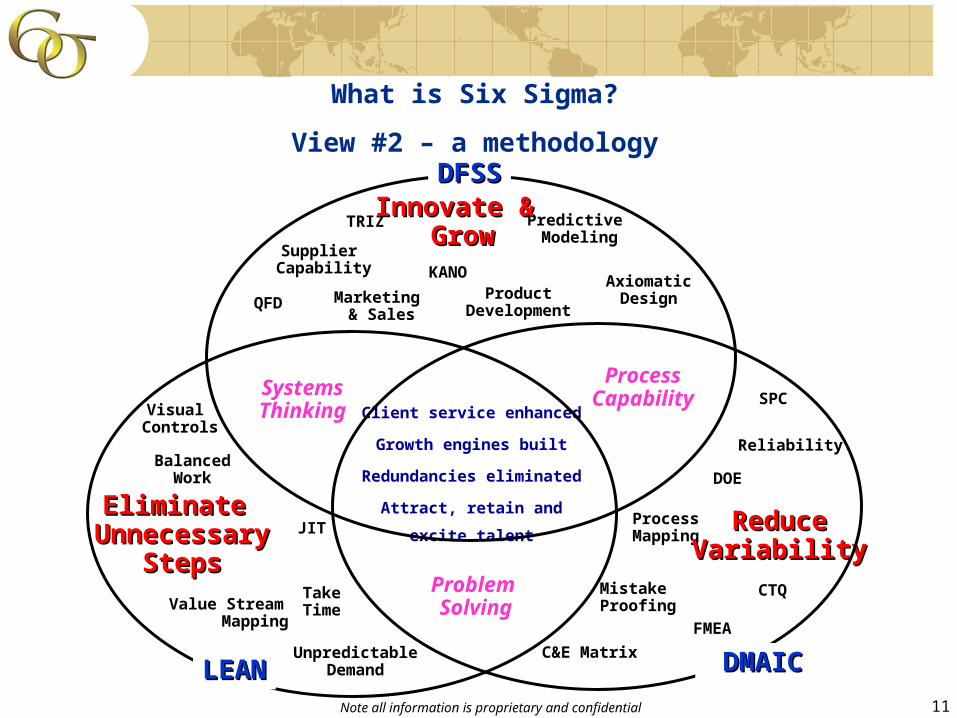
What is Six Sigma?
View #2 – a methodology
ProcessCapability
FMEA
Mistake Proofing
Reliability
SPC
ProcessMapping
DOE
C&E Matrix
Problem Solving
SystemsThinkingVisual
Controls
Value Stream Mapping
TakeTime
UnpredictableDemand
Balanced Work
JIT
Supplier Capability
QFDAxiomatic
Design
Predictive Modeling
ProductDevelopment
Marketing & Sales
TRIZ
CTQ
ReduceReduceVariabilityVariability
Innovate & Innovate & GrowGrow
Eliminate Eliminate UnnecessaryUnnecessary
StepsSteps
Client service enhanced
Growth engines built
Redundancies eliminated
Attract, retain and excite talent
DFSSDFSS
LEANLEAN DMAICDMAIC
KANO
12Note all information is proprietary and confidential
What is Six Sigma?
View 3 – a management system
High performance system for executing business strategy Drives clarity around the business strategy and the metrics
Provides framework to prioritize resources for projects to improve the metrics
Leverages leaders to manage efforts for rapid, sustainable, and improved business results
“Six Sigma is not an improvement program. It is instead a business philosophy that employs a step-by-step approach to reducing variation, increasing quality, client satisfaction, and in time, market share.”
Mikel HarryCEO, Six Sigma Academy
13Note all information is proprietary and confidential
Six Sigma Concepts and Tools
14Note all information is proprietary and confidential
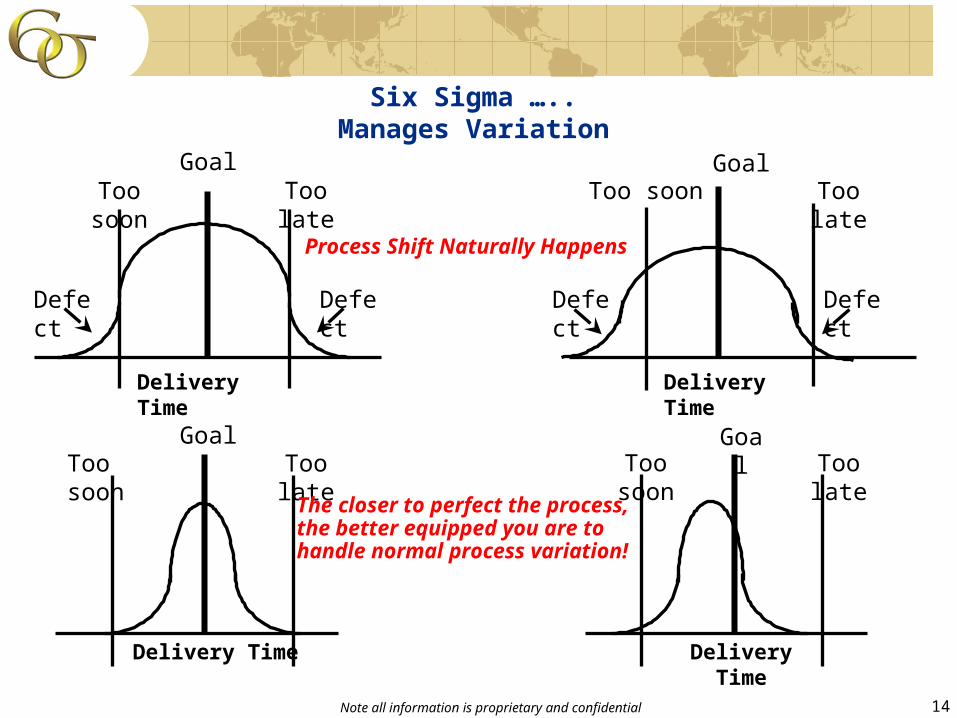
Six Sigma …..Manages Variation
Defect Defect
Too soon Too late
Delivery Time
Goal
Delivery Time
Too soon Too lateGoal
Too soon Too late
Delivery Time
Defect Defect
Delivery Time
Too soon Too late
The closer to perfect the process, the better equipped you are to handle normal process variation!
Process Shift Naturally Happens
Goal
Goal
15Note all information is proprietary and confidential
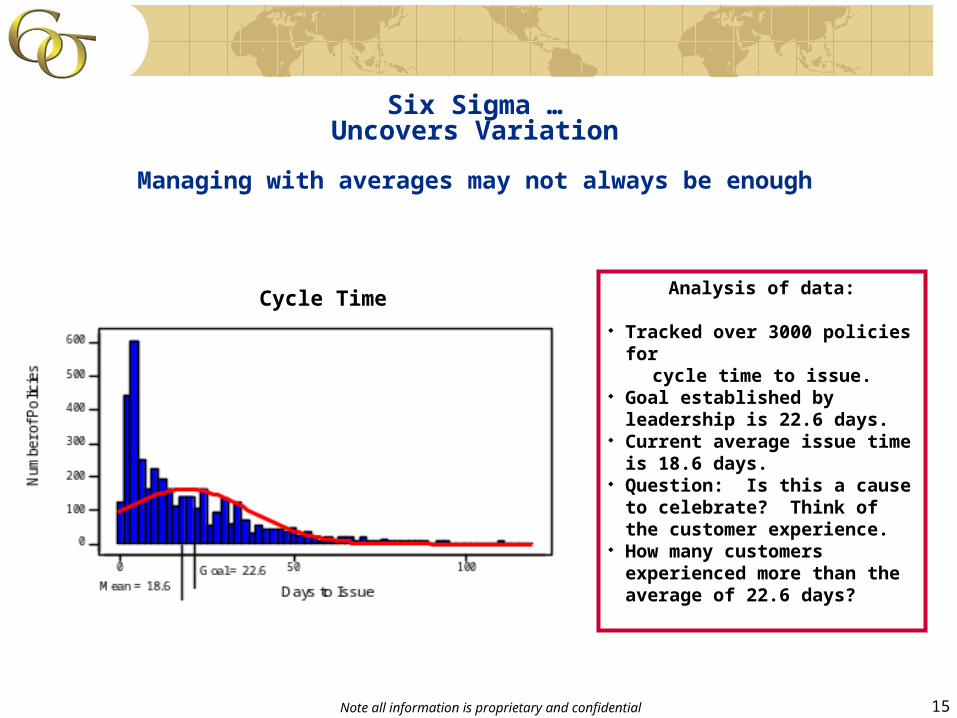
Cycle Time
Six Sigma …Uncovers Variation
Managing with averages may not always be enough
Analysis of data:
Tracked over 3000 policies for cycle time to issue. Goal established by leadership
is 22.6 days. Current average issue time is
18.6 days. Question: Is this a cause to
celebrate? Think of the customer experience.
How many customers experienced more than the average of 22.6 days?
16Note all information is proprietary and confidential
InnovationMeets Needs
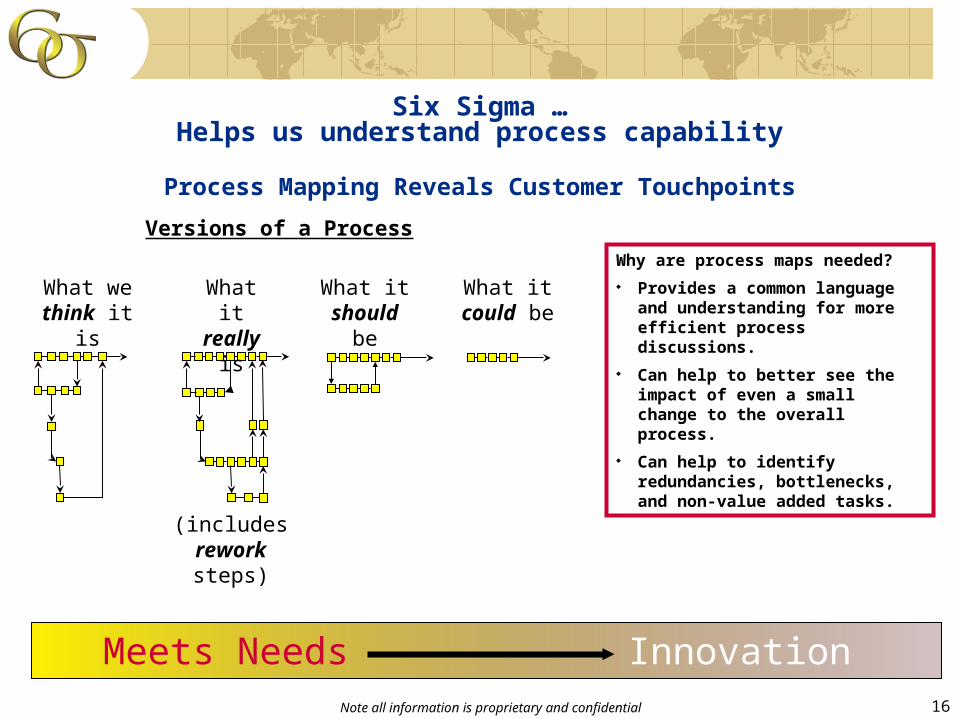
Versions of a Process
What wethink it is
What itreally is
What itshould be
(includes rework steps)
What itcould be
Six Sigma …Helps us understand process capability
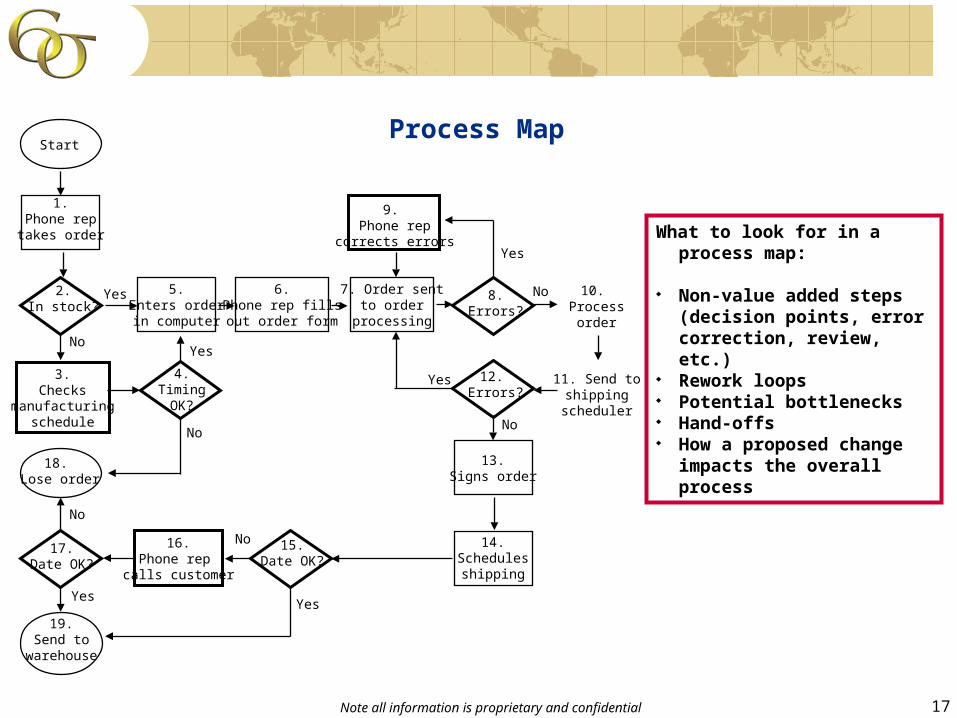
Process Mapping Reveals Customer Touchpoints
Why are process maps needed?
Provides a common language and understanding for more efficient process discussions.
Can help to better see the impact of even a small change to the overall process.
Can help to identify redundancies, bottlenecks, and non-value added tasks.
17Note all information is proprietary and confidential
What to look for in a process map:
Non-value added steps (decision points, error correction, review, etc.)
Rework loops Potential bottlenecks Hand-offs How a proposed change
impacts the overall process
No
Yes
Yes
Start
1.Phone reptakes order
4.TimingOK?
2.In stock?
3.Checks
manufacturingschedule
18. Lose order
17.Date OK?
19.Send to
warehouse
5.Enters orderin computer
16.Phone rep
calls customer
15.Date OK?
6.Phone rep fillsout order form
7. Order sentto order
processing
9. Phone rep
corrects errors
8.Errors?
12. Errors?
10. Process
order
11. Send toshipping
scheduler
13.Signs order
14.Schedulesshipping
No
Yes
No
No
No
No
Yes
Yes
Yes
Process Map
18Note all information is proprietary and confidential
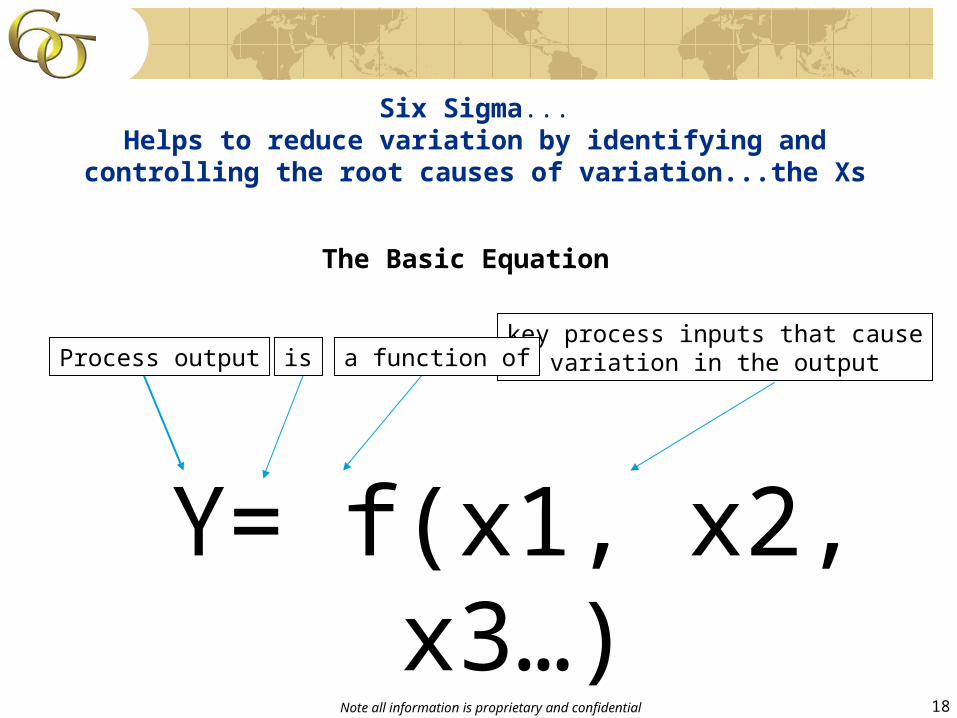
Six Sigma...Helps to reduce variation by identifying and controlling the
root causes of variation...the Xs
Y= f(x1, x2, x3…)
key process inputs that causevariation in the outputa function ofisProcess output
The Basic Equation
19Note all information is proprietary and confidential
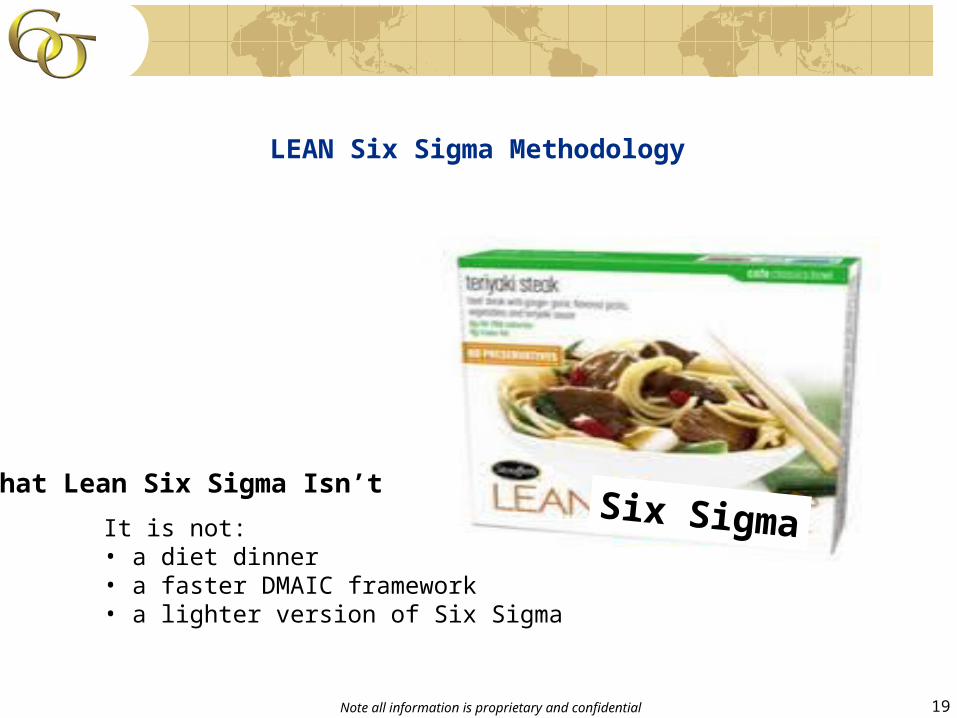
Six SigmaWhat Lean Six Sigma Isn’t
It is not:• a diet dinner• a faster DMAIC framework• a lighter version of Six Sigma
LEAN Six Sigma Methodology
20Note all information is proprietary and confidential
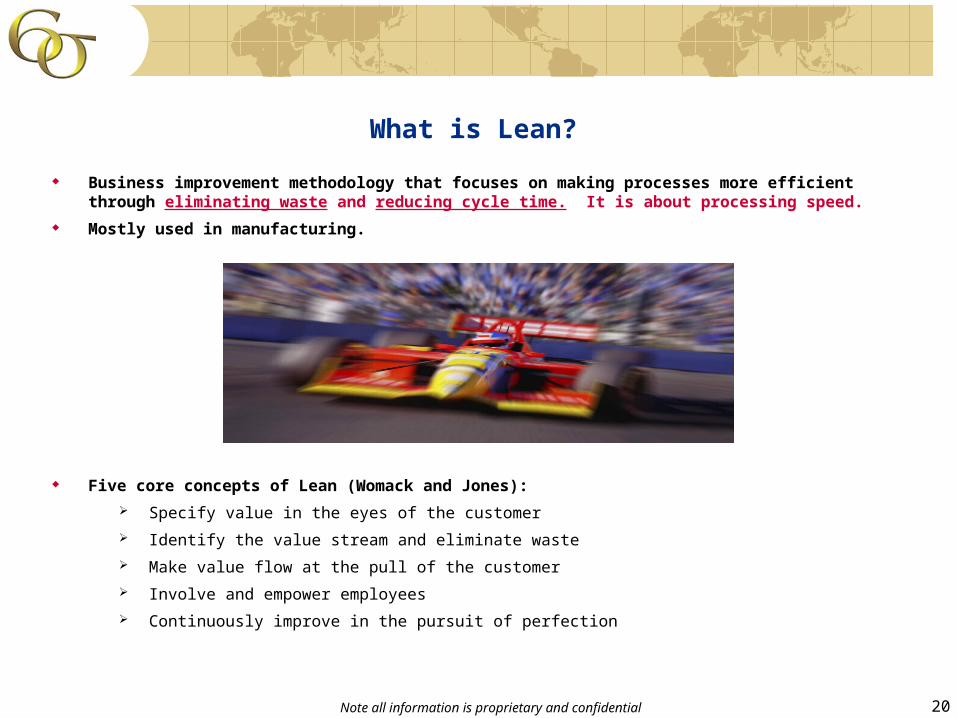
What is Lean?
Business improvement methodology that focuses on making processes more efficient through eliminating waste and reducing cycle time. It is about processing speed.
Mostly used in manufacturing.
Five core concepts of Lean (Womack and Jones):
Specify value in the eyes of the customer
Identify the value stream and eliminate waste
Make value flow at the pull of the customer
Involve and empower employees
Continuously improve in the pursuit of perfection
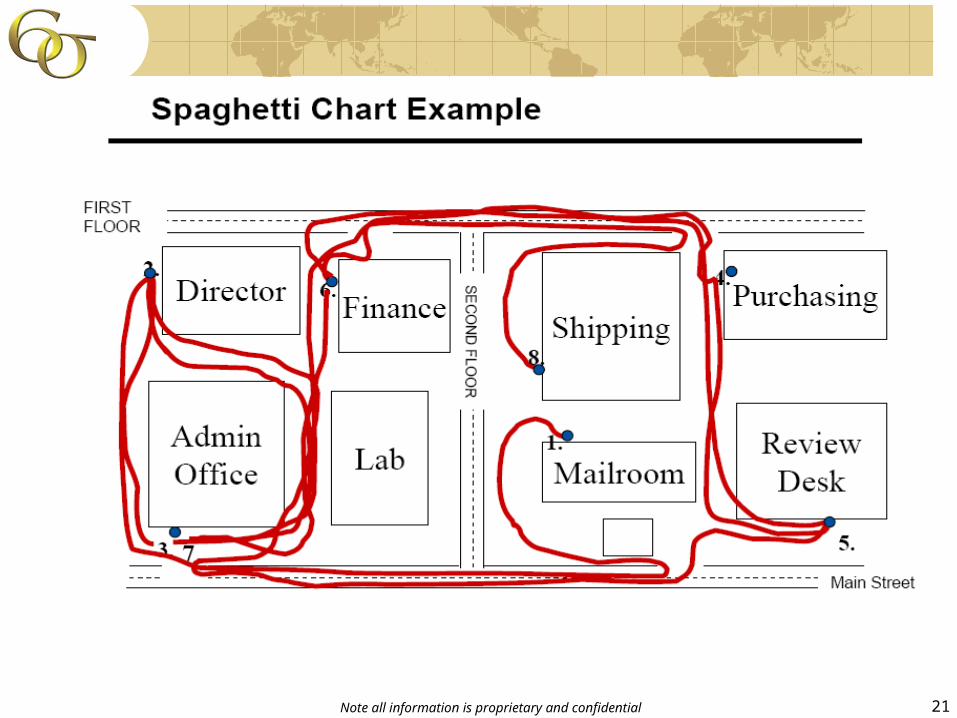
21Note all information is proprietary and confidential
22Note all information is proprietary and confidential
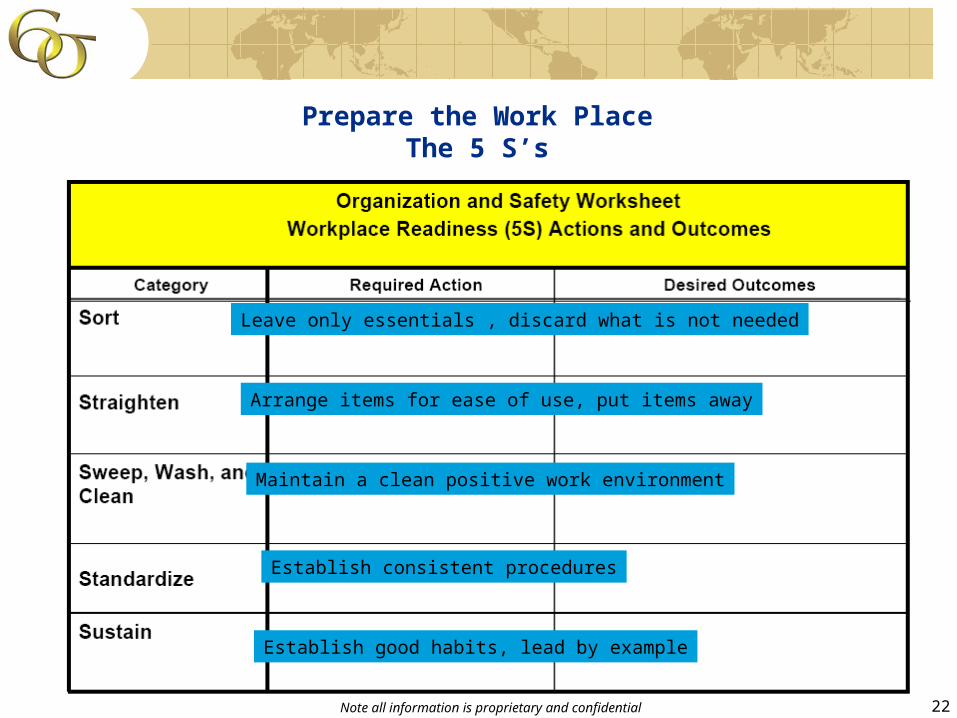
Prepare the Work PlaceThe 5 S’s
Leave only essentials , discard what is not needed
Arrange items for ease of use, put items away
Maintain a clean positive work environment
Establish consistent procedures
Establish good habits, lead by example
23Note all information is proprietary and confidential
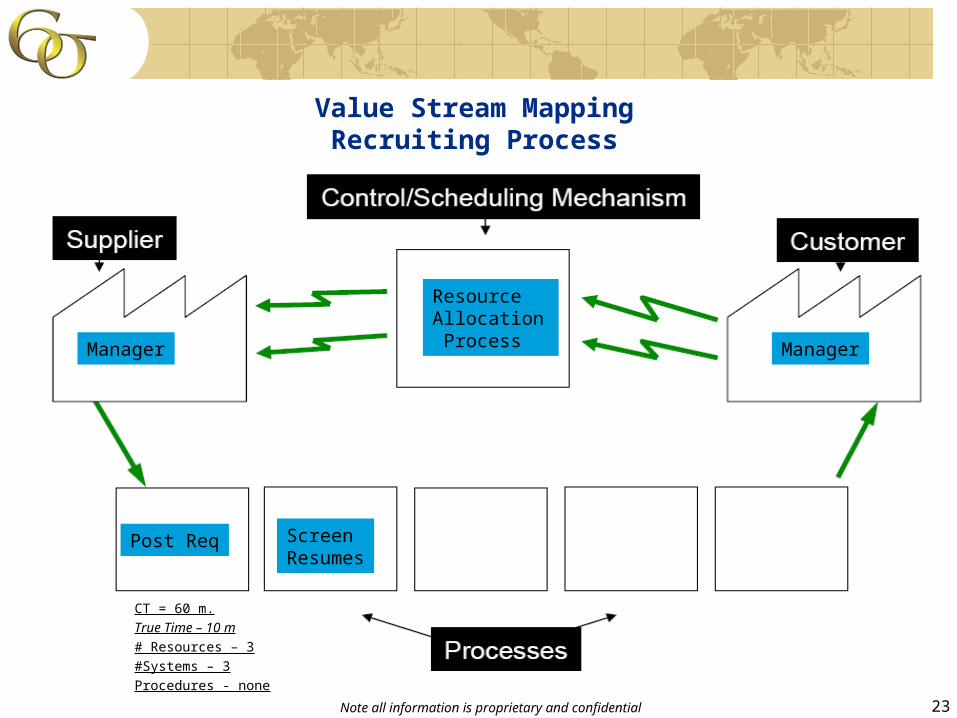
Value Stream MappingRecruiting Process
Manager Manager
Post Req ScreenResumes
Resource Allocation Process
CT = 60 m.
True Time – 10 m
# Resources – 3
#Systems – 3
Procedures - none
24Note all information is proprietary and confidential
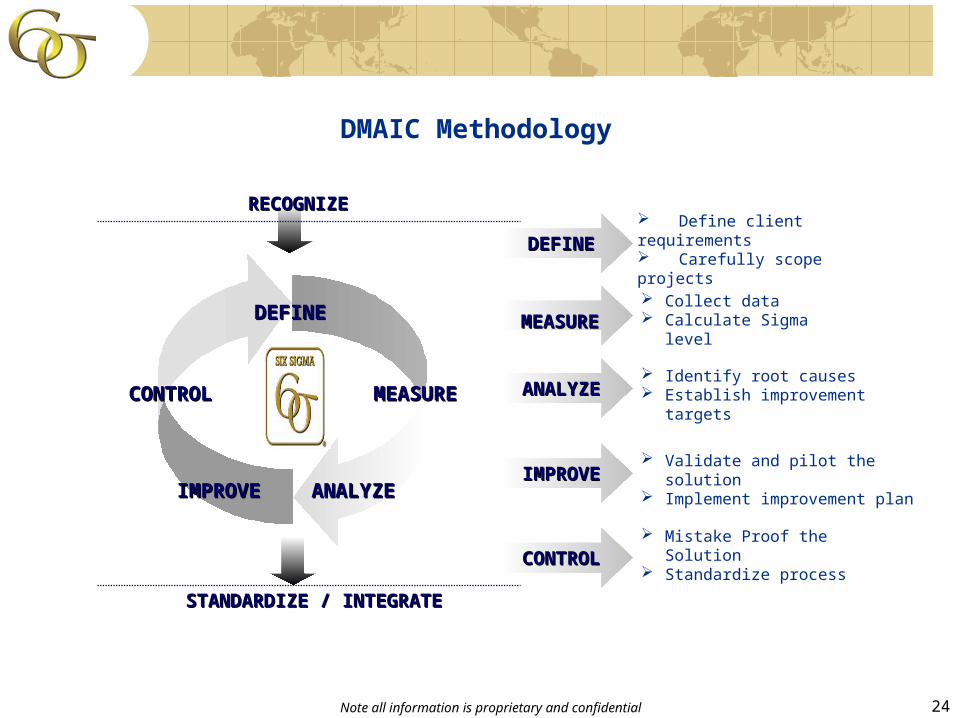
Define client requirements Carefully scope projects
DEFINEDEFINE
Mistake Proof the Solution Standardize process CONTROLCONTROL
Validate and pilot the solution Implement improvement plan
IMPROVEIMPROVE
Identify root causes Establish improvement targets
ANALYZEANALYZE
Collect data Calculate Sigma levelMEASUREMEASURE
ANALYZEANALYZE
MEASUREMEASURE
DEFINEDEFINE
CONTROLCONTROL
IMPROVEIMPROVE
RECOGNIZERECOGNIZE
STANDARDIZE / INTEGRATESTANDARDIZE / INTEGRATE
DMAIC Methodology
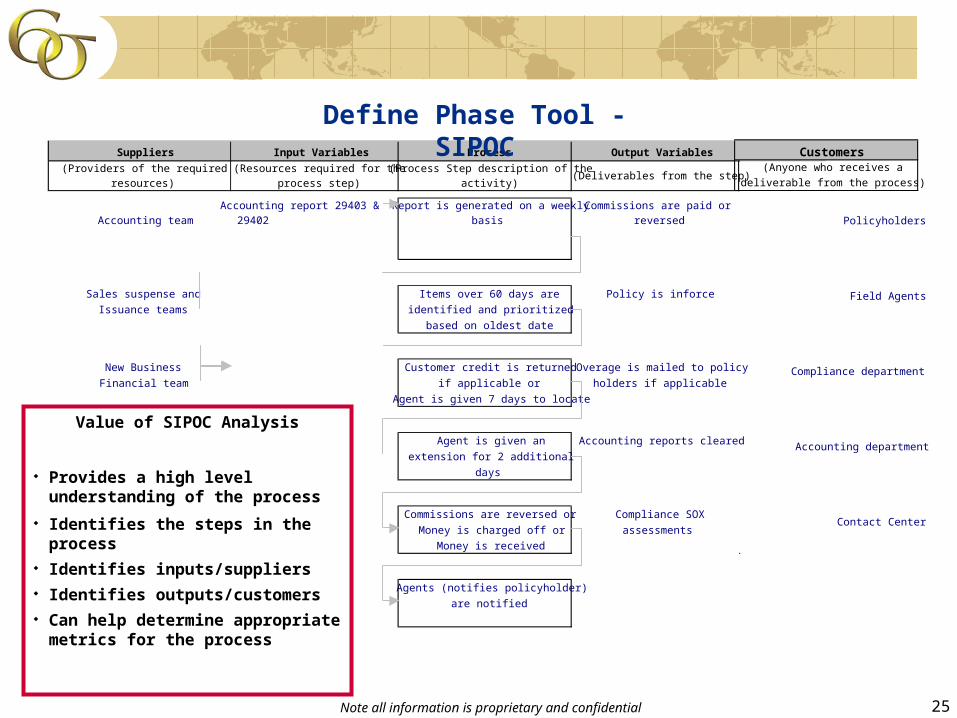
25Note all information is proprietary and confidential
SIPOC
Suppliers Input Variables Output Variables
(Providers of the required resources)
(Resources required for the process step)
(Deliverables from the step)
Accounting team
Accounting report 29403 &
29402
Commissions are paid or
reversed
Sales suspense and Policy is inforce
Issuance teams
New Business Overage is mailed to policy
Financial team holders if applicable
Accounting reports cleared
Compliance SOX
assessments
are notified
Agents (notifies policyholder)
Money is charged off or
Money is received
Commissions are reversed or
extension for 2 additional
days
Agent is given an
if applicable or
Agent is given 7 days to locate
Customer credit is returned
identified and prioritized
based on oldest date
Items over 60 days are
Report is generated on a weekly
basis
Process
(Process Step description of the activity)
Contact Center
Accounting department
Compliance department
Field Agents
Policyholders
Customers(Anyone who receives a
deliverable from the process)
Value of SIPOC Analysis
Provides a high level understanding of the process
Identifies the steps in the process
Identifies inputs/suppliers Identifies outputs/customers Can help determine appropriate
metrics for the process
Define Phase Tool - SIPOC
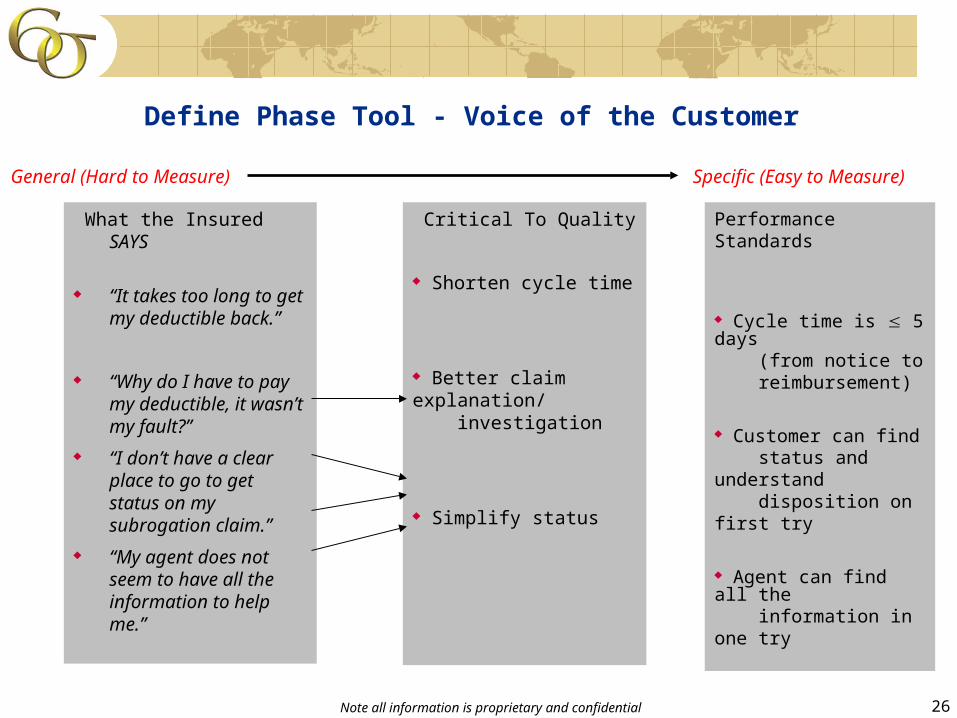
26Note all information is proprietary and confidential
Critical To Quality
Shorten cycle time
Better claim explanation/ investigation
Simplify status
What the Insured SAYS
“It takes too long to get my deductible back.”
“Why do I have to pay my deductible, it wasn’t my fault?”
“I don’t have a clear place to go to get status on my subrogation claim.”
“My agent does not seem to have all the information to help me.”
Performance Standards
Cycle time is 5 days (from notice to reimbursement)
Customer can find status and understand disposition on first try
Agent can find all the information in one try
General (Hard to Measure) Specific (Easy to Measure)
Define Phase Tool - Voice of the Customer
27Note all information is proprietary and confidential
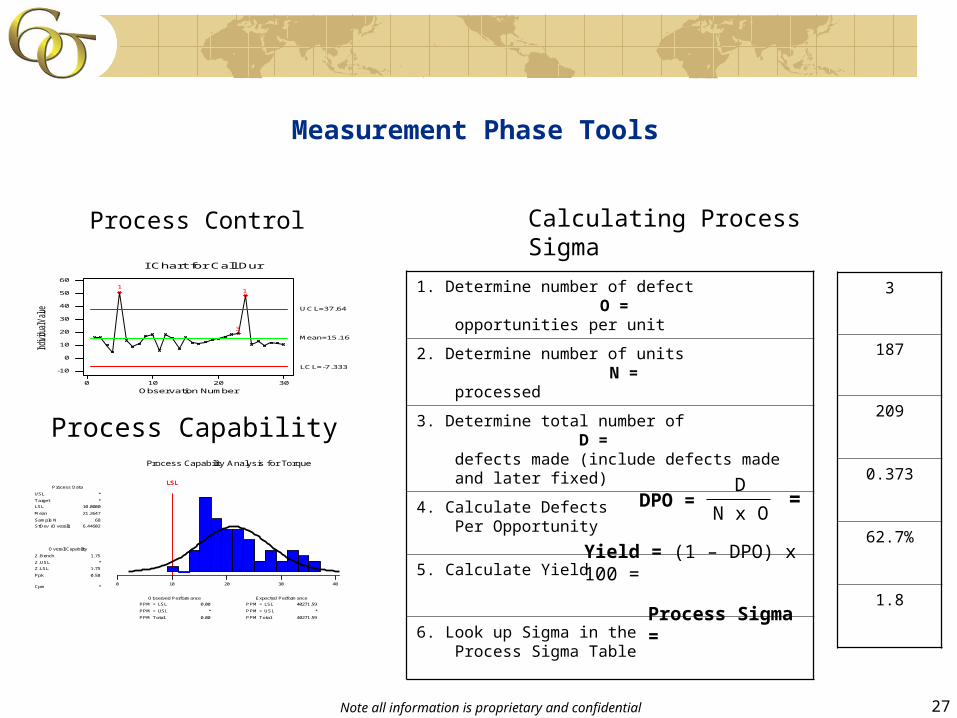
1. Determine number of defect O = opportunities per unit
2. Determine number of units N = processed
3. Determine total number of D = defects made (include defects made and later fixed)
4. Calculate Defects Per Opportunity
5. Calculate Yield
6. Look up Sigma in the Process Sigma Table
Measurement Phase Tools
Process Control
3020100
60
50
40
30
20
10
0
-10
Observation Number
Individu
al V
alue
I Chart for Call Dur
1
3
1
Mean=15.16
UCL=37.64
LCL=-7.333
Process Capability
403020100
LSLLSL
Process Capability Analysis for Torque
PPM Total
PPM > USL
PPM < LSL
PPM Total
PPM > USL
PPM < LSL
Cpm
Ppk
Z.LSL
Z.USL
Z.Bench
StDev (Overall)
Sample N
Mean
LSL
Target
USL
40271.59
*
40271.59
0.00
*
0.00
*
0.58
1.75
*
1.75
6.44602
68
21.2647
10.0000
*
*
Expected PerformanceObserved Performance
Overall Capability
Process Data
3
187
209
0.373
62.7%
1.8
DPO =
Calculating Process Sigma
D
N x O=
Yield = (1 – DPO) x 100 =
Process Sigma =
28Note all information is proprietary and confidential
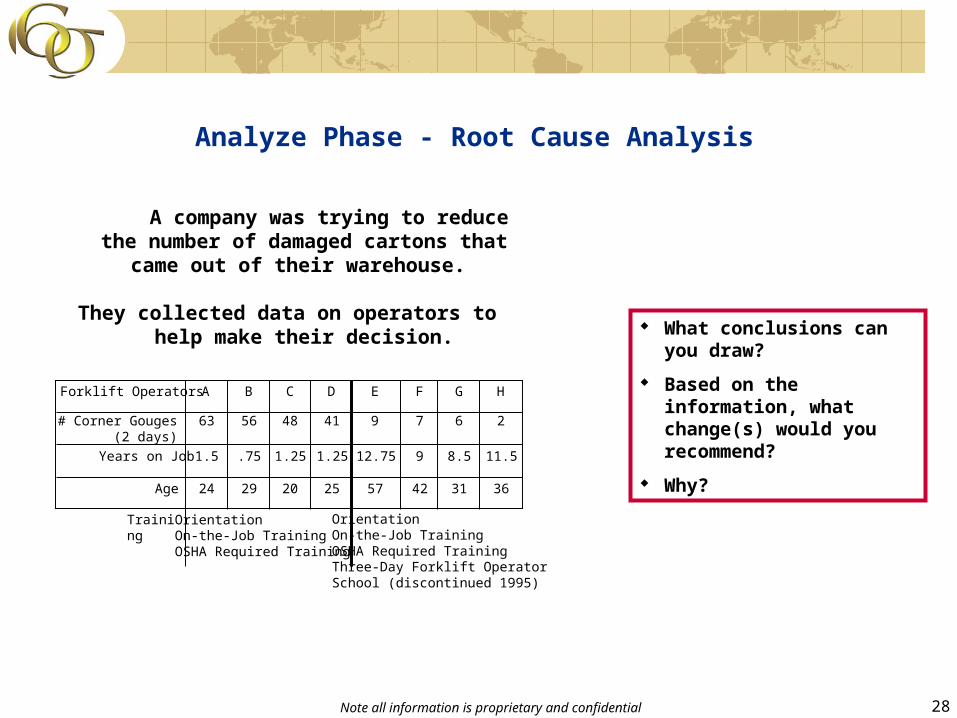
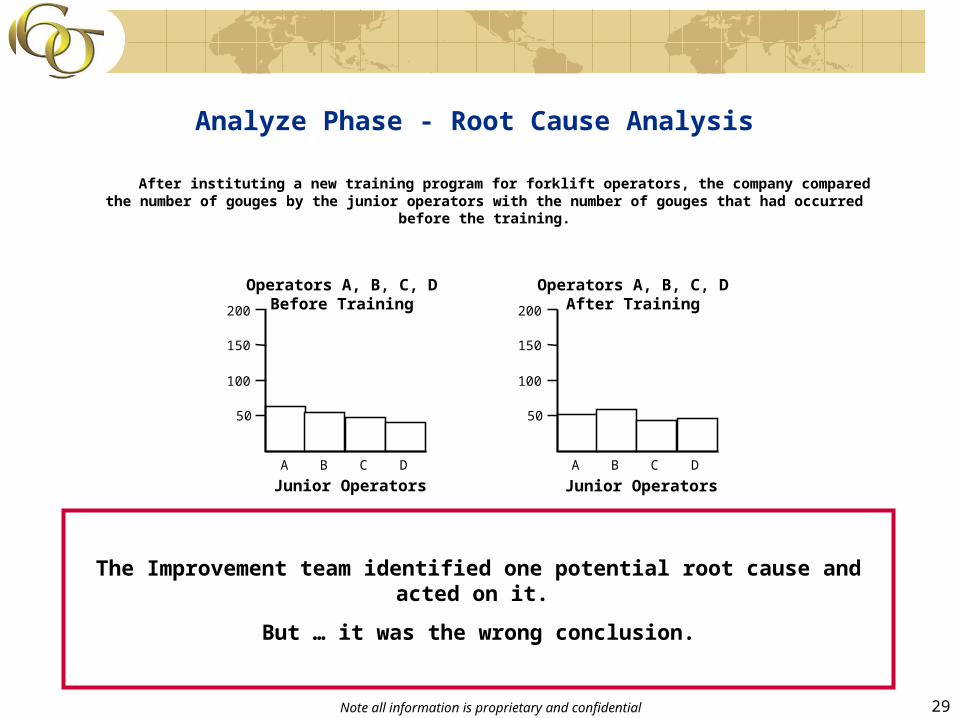
Analyze Phase - Root Cause Analysis
Forklift Operators A B C D E F G H
# Corner Gouges(2 days)
63 56 48 41 9 7 6 2
Years on Job 1.5 .75 1.25 1.25 12.75 9 8.5 11.5
Age 24 29 20 25 57 42 31 36
Training OrientationOn-the-Job TrainingOSHA Required Training
OrientationOn-the-Job TrainingOSHA Required TrainingThree-Day Forklift OperatorSchool (discontinued 1995)
A company was trying to reduce the number of damaged cartons that came
out of their warehouse.
They collected data on operators to help make their decision.
What conclusions can you draw?
Based on the information, what change(s) would you recommend?
Why?
29Note all information is proprietary and confidential
A B C D
Junior Operators
50
100
150
200
A B C D
Junior Operators
50
100
150
200
Operators A, B, C, DBefore Training
Operators A, B, C, DAfter Training
After instituting a new training program for forklift operators, the company compared the number of gouges by the junior operators with the number of gouges that had occurred before the training.
The Improvement team identified one potential root cause and acted on it.
But … it was the wrong conclusion.
Analyze Phase - Root Cause Analysis
30Note all information is proprietary and confidential
Analyze Phase Tools
Why are there
inefficiencies
in claim
processing?
SYSTEM
COMMUNICATION PROCESS
PEOPLEPRODUCT
COMPLIANCE
TRAINING
Multiple
systems#4
MULTIPLE
PROD.
#3
DOCUMEN -
TATION
Inexperienced
employees
Don’t fully
understand own
business
#2
TRAINING
#5
FEATURES
Multiple
ways to do the
same thing
#1:
TRANSCEND
Fishbone Diagram
0
1
2
3
4
5
6
7 8 9 10 11 12 13 14 15 16 17 18 19 20 21
Location A
0
1
2
3
4
5
6
7 8 9 10 11 12 13 14 15 16 17 18 19 20 21
Location B
0
1
2
3
4
5
6
7 8 9 10 11 12 13 14 15 16 17 18 19 20 21
Location C
Time to Complete(all locations)
1
2
3
4
5
6
8 9 10 11 12 13 14 15 16 17 18 19 20 21
Minutes
Data Stratification
31Note all information is proprietary and confidential
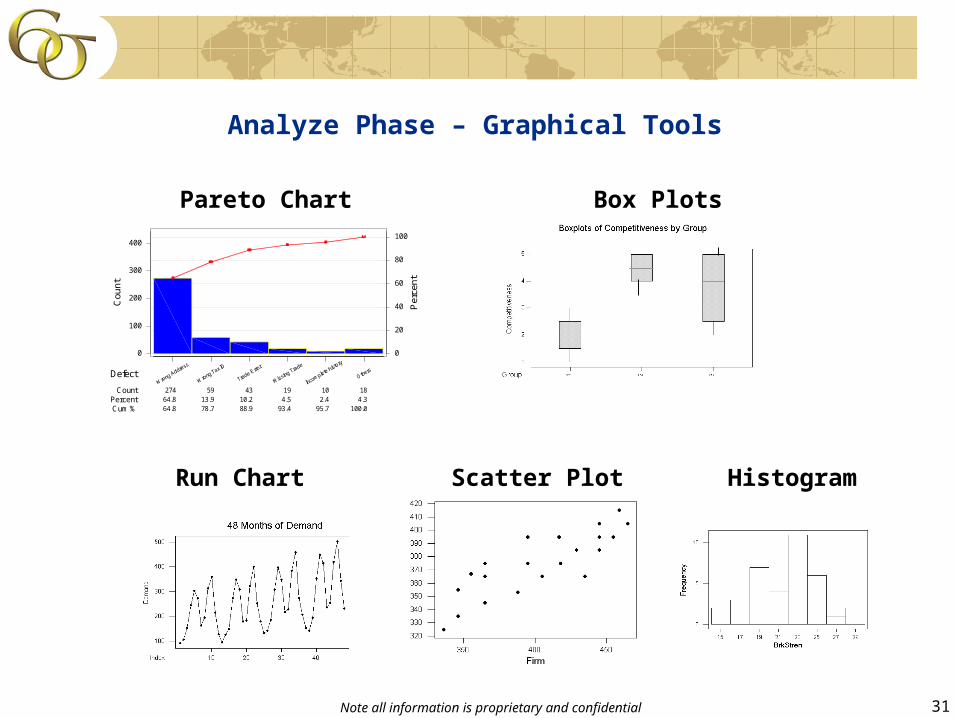
18 10 19 43 59274 4.3 2.4 4.510.213.964.8
100.0 95.7 93.4 88.9 78.7 64.8
400
300
200
100
0
100
80
60
40
20
0
Defect
CountPercentCum %
Per
cen
t
Cou
nt
Pareto Chart for DefectsPareto Chart Box Plots
Run Chart Scatter Plot Histogram
Analyze Phase – Graphical Tools
32Note all information is proprietary and confidential
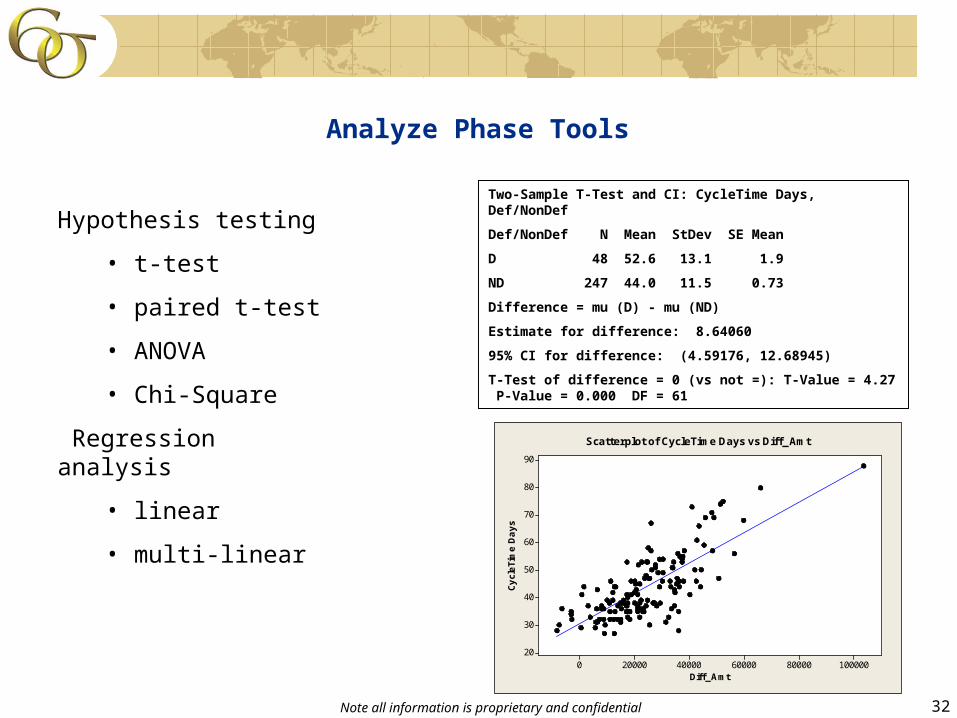
Analyze Phase Tools
Hypothesis testing
• t-test
• paired t-test
• ANOVA
• Chi-Square
Regression analysis
• linear
• multi-linear
Diff_Amt
Cycl
eTi
me D
ays
100000800006000040000200000
90
80
70
60
50
40
30
20
Scatterplot of CycleTime Days vs Diff_Amt
Two-Sample T-Test and CI: CycleTime Days, Def/NonDef
Def/NonDef N Mean StDev SE Mean
D 48 52.6 13.1 1.9
ND 247 44.0 11.5 0.73
Difference = mu (D) - mu (ND)
Estimate for difference: 8.64060
95% CI for difference: (4.59176, 12.68945)
T-Test of difference = 0 (vs not =): T-Value = 4.27 P-Value = 0.000 DF = 61
33Note all information is proprietary and confidential
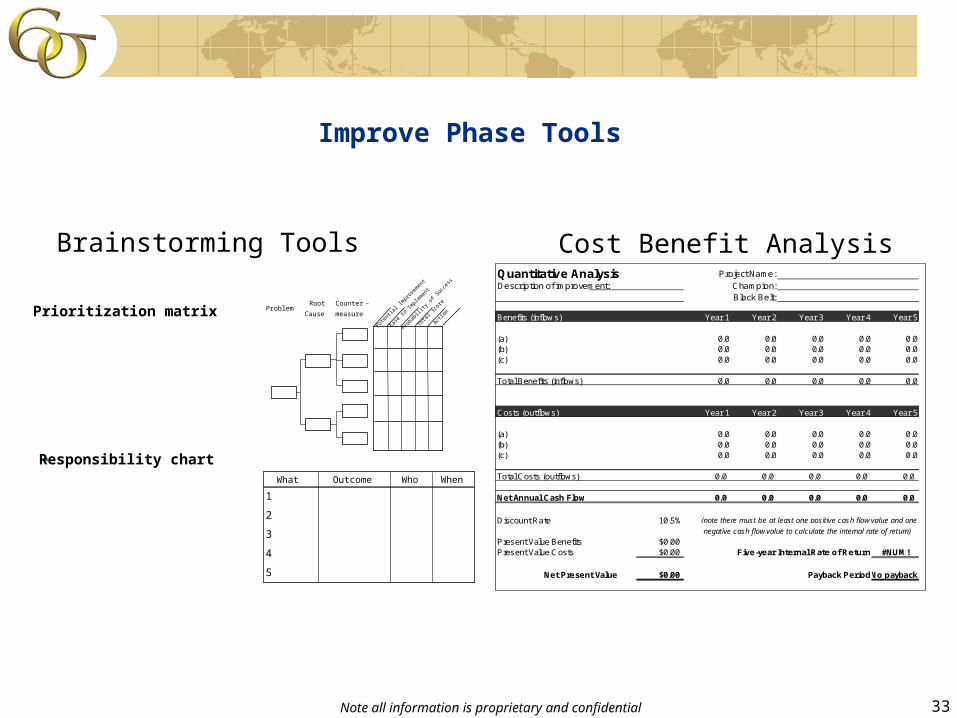
Improve Phase Tools
Cost Benefit Analysis
• Prioritization matrix
• Responsibility chart
1
2
3
4
5
Ease
to Im
plem
ent
Action
What Outcome Who When
ProblemRoot
Cause
Counter -
measure Pot
entia
l Impr
ovem
ent
Proba
bility
of S
ucce
ss
Total
scor
e
Brainstorming ToolsQuantitative Analysis Project Name:Description of improvement: Champion:
Black Belt:
Benefits (inflows) Year 1 Year 2 Year 3 Year 4 Year 5
(a) 0.0 0.0 0.0 0.0 0.0(b) 0.0 0.0 0.0 0.0 0.0(c) 0.0 0.0 0.0 0.0 0.0
Total Benefits (inflows) 0.0 0.0 0.0 0.0 0.0
Costs (outflows) Year 1 Year 2 Year 3 Year 4 Year 5
(a) 0.0 0.0 0.0 0.0 0.0(b) 0.0 0.0 0.0 0.0 0.0(c) 0.0 0.0 0.0 0.0 0.0
Total Costs (outflows) 0.0 0.0 0.0 0.0 0.0
Net Annual Cash Flow 0.0 0.0 0.0 0.0 0.0
Discount Rate 10.5% (note there must be at least one positive cash flow value and one
negative cash flow value to calculate the internal rate of return)
Present Value Benefits $0.00Present Value Costs $0.00 Five-year Internal Rate of Return #NUM!
Net Present Value $0.00 Payback PeriodNo payback
34Note all information is proprietary and confidential
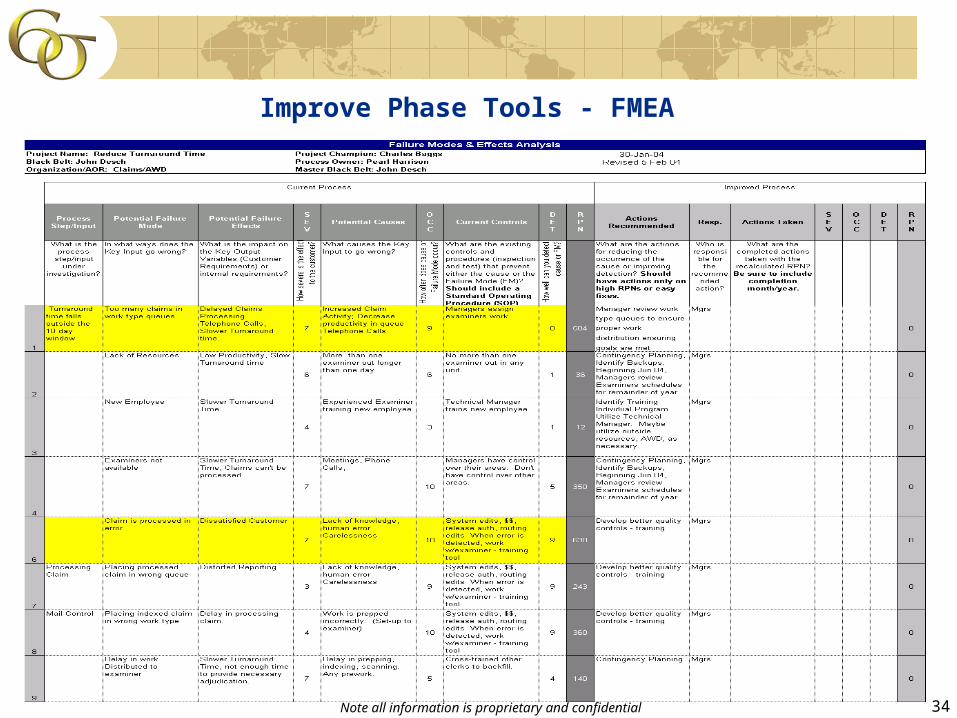
Improve
Improve Phase Tools - FMEA
35Note all information is proprietary and confidential
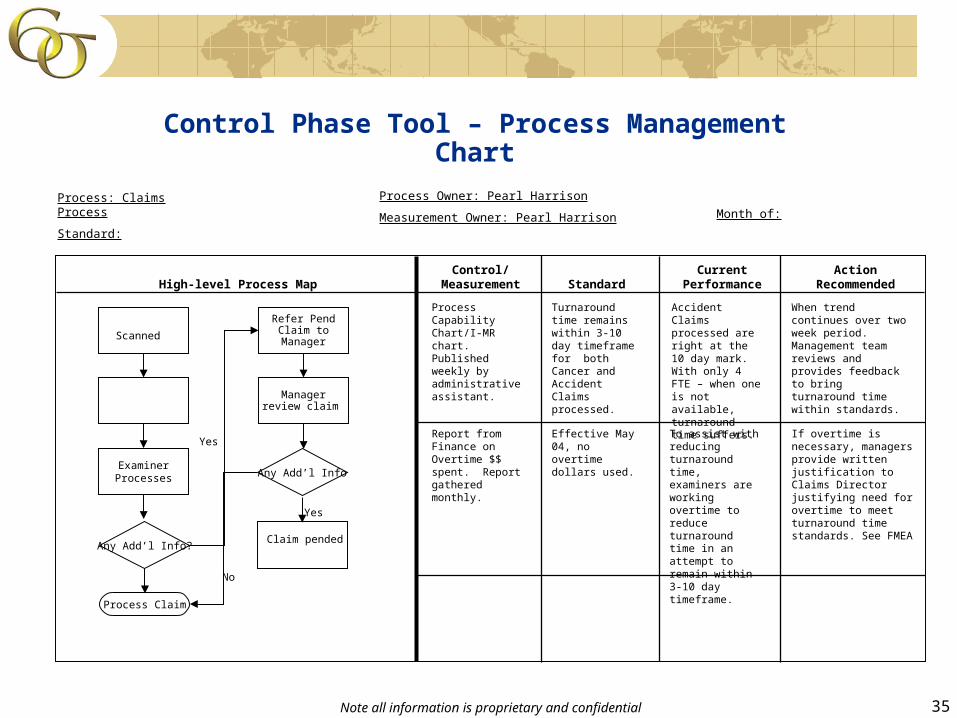
Control Phase Tool – Process Management Chart
Scanned
Process: Claims Process
Standard:
Process Owner: Pearl Harrison
Measurement Owner: Pearl Harrison
Control/ MeasurementHigh-level Process Map
Action Recommended
Current PerformanceStandard
Month of:
Examiner Processes
Refer Pend Claim to Manager
Manager review claim
Turnaround time remains within 3-10 day timeframe for both Cancer and Accident Claims processed.
Effective May 04, no overtime dollars used.
Process Capability Chart/I-MR chart. Published weekly by administrative assistant.
Accident Claims processed are right at the 10 day mark. With only 4 FTE – when one is not available, turnaround time suffers.
When trend continues over two week period. Management team reviews and provides feedback to bring turnaround time within standards.
To assist with reducing turnaround time, examiners are working overtime to reduce turnaround time in an attempt to remain within 3-10 day timeframe.
If overtime is necessary, managers provide written justification to Claims Director justifying need for overtime to meet turnaround time standards. See FMEA
Report from Finance on Overtime $$ spent. Report gathered monthly.
Any Add’l Info?
Yes
Process Claim
Any Add’l Info
Claim pended
Yes
No
36Note all information is proprietary and confidential
Q&A