Embed Size (px)
Citation preview
ADB SME DEVELOPMENT TA
BACKGROUND REPORT
SME CONSTRAINTS AND NEEDS
RESULTS OF A SURVEY IN SEMARANG AND MEDAN
WOLFGANG CLAUSS
JULY 2001
ADBS
State MinisJalan H
TelFax
e-mail: ma
Published by: Technical Assistance ME Development try for Cooperatives & SME .R. Rasuna Said Kav.3 Jakarta 12940
: ++62 21 520 15 40 : ++62 21 527 94 82 [email protected]
ADB SME DEVELOPMENTTA
I. TABLE OF CONTENTS
I. TABLE OF CONTENTS ................................................................................ I
II. LIST OF TABLES......................................................................................... II
III. LIST OF FIGURES...................................................................................... III
IV. EXECUTIVE SUMMARY ENGLISH............................................................IV
V. EXECUTIVE SUMMARY BAHASA INDONESIA.......................................VII 1 INTRODUCTION .......................................................................................... 1 2 STEREOTYPES AND REALITY - RESULTS OF THE SME SURVEY......... 2 2.1 General Characteristics of SMEs............................................................... 2 2.2 Government, Bureaucracy and Business Associations.............................. 3 2.3 Gender Issues........................................................................................... 5 2.4 Finance ..................................................................................................... 6 2.5 Business Development Services ............................................................... 7 3 CONCLUSIONS ........................................................................................... 9 4 Annex 1: Tables ........................................................................................... i 5 Annex 2: Figures.......................................................................................... i
I
ADB SME DEVELOPMENTTA
II. LIST OF TABLES
Annex 1 Page Table 1: Manager employed by Years in Business .............................................. i Table 2: Age of Manager by Years in Business ................................................... i Table 3: Past Development by Sector................................................................. ii Table 4: Future Development by Sector.............................................................. ii Table 5: Interest in expanding Enterprise by Sector............................................iii Table 6: Past Development by Age of Manager..................................................iii Table 7: Past Development by Education of Manager ....................................... iv Table 8: Business Licenses ............................................................................... iv Table 9: Tax Payment by Education of Manager ................................................ v Table 10: Credit Demand by Gender of Manager ................................................. v Table 11: Tax Payment by Gender of Manager ................................................... vi Table 12: Number of Employees by Gender of Manager ..................................... vi
II
ADB SME DEVELOPMENTTA
III. LIST OF FIGURES Annex 2 Page:
Figure 1: Years in Business ........................................................................................i Figure 2: Development of Enterprise...........................................................................i Figure 3: Age of Managers......................................................................................... ii Figure 4: Education of Managers ............................................................................... ii Figure 5: Future Business Development ................................................................... iii Figure 6: Interest in expanding Business .................................................................. iii Figure 7: Supporting Factors..................................................................................... iv Figure 8: Hampering Factors..................................................................................... iv Figure 9: Production for local market..........................................................................v Figure 10: Effects of Decentralization...........................................................................v Figure 11: Responsibilities of Government.................................................................. vi Figure 12: Performance of Government ...................................................................... vi Figure 13: Business Licenses .................................................................................... vii Figure 14: Difficulties faced........................................................................................ vii Figure 15: Knowledge of Tax Regulations................................................................. viii Figure 16: Taxes known............................................................................................ viii Figure 17: Taxes paid ................................................................................................. ix Figure 18: Reasons for not paying Taxes.................................................................... ix Figure 19: Opinions about taxes and levies..................................................................x Figure 20: Known Business Associations.....................................................................x Figure 21: Membership in Business Associations ....................................................... xi Figure 22: Advantage of Membership in Associations................................................. xi Figure 23: Representation of SME Interests............................................................... xii Figure 24: Occupation of Spouse............................................................................... xii Figure 25: Sources of Finance .................................................................................. xiii Figure 26: Credit Demand......................................................................................... xiii Figure 27: Reason for not applying for Bank Loan .................................................... xiv Figure 28: Reasons for not needing Bank Loan ........................................................ xiv Figure 29: Banks providing Loans.............................................................................. xv Figure 30: Reason for choosing Bank ........................................................................ xv Figure 31: Assistance in Problem Solving ................................................................. xvi Figure 32: Problem Solving....................................................................................... xvi Figure 33: Willingness to pay for BDS...................................................................... xvii Figure 34: Information about BDS............................................................................ xvii
III
ADB SME DEVELOPMENTTA
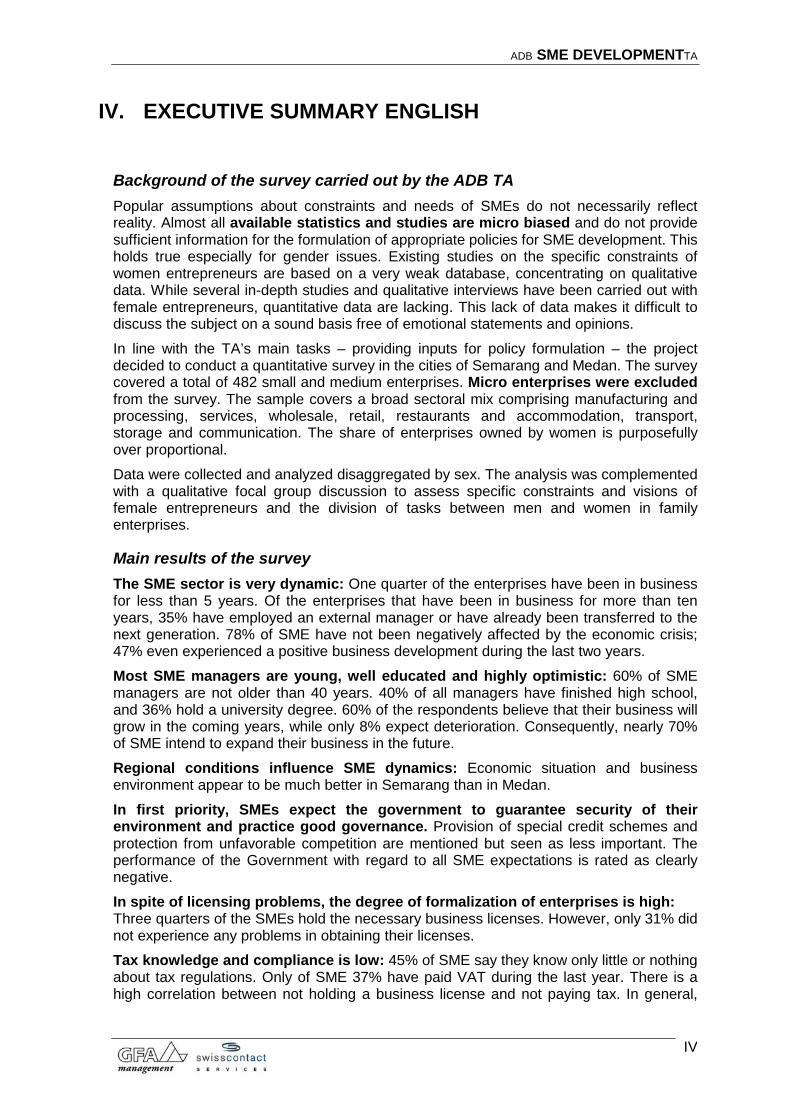
IV. EXECUTIVE SUMMARY ENGLISH
Background of the survey carried out by the ADB TA Popular assumptions about constraints and needs of SMEs do not necessarily reflect reality. Almost all available statistics and studies are micro biased and do not provide sufficient information for the formulation of appropriate policies for SME development. This holds true especially for gender issues. Existing studies on the specific constraints of women entrepreneurs are based on a very weak database, concentrating on qualitative data. While several in-depth studies and qualitative interviews have been carried out with female entrepreneurs, quantitative data are lacking. This lack of data makes it difficult to discuss the subject on a sound basis free of emotional statements and opinions. In line with the TA’s main tasks – providing inputs for policy formulation – the project decided to conduct a quantitative survey in the cities of Semarang and Medan. The survey covered a total of 482 small and medium enterprises. Micro enterprises were excluded from the survey. The sample covers a broad sectoral mix comprising manufacturing and processing, services, wholesale, retail, restaurants and accommodation, transport, storage and communication. The share of enterprises owned by women is purposefully over proportional. Data were collected and analyzed disaggregated by sex. The analysis was complemented with a qualitative focal group discussion to assess specific constraints and visions of female entrepreneurs and the division of tasks between men and women in family enterprises.
Main results of the survey The SME sector is very dynamic: One quarter of the enterprises have been in business for less than 5 years. Of the enterprises that have been in business for more than ten years, 35% have employed an external manager or have already been transferred to the next generation. 78% of SME have not been negatively affected by the economic crisis; 47% even experienced a positive business development during the last two years. Most SME managers are young, well educated and highly optimistic: 60% of SME managers are not older than 40 years. 40% of all managers have finished high school, and 36% hold a university degree. 60% of the respondents believe that their business will grow in the coming years, while only 8% expect deterioration. Consequently, nearly 70% of SME intend to expand their business in the future. Regional conditions influence SME dynamics: Economic situation and business environment appear to be much better in Semarang than in Medan. In first priority, SMEs expect the government to guarantee security of their environment and practice good governance. Provision of special credit schemes and protection from unfavorable competition are mentioned but seen as less important. The performance of the Government with regard to all SME expectations is rated as clearly negative. In spite of licensing problems, the degree of formalization of enterprises is high: Three quarters of the SMEs hold the necessary business licenses. However, only 31% did not experience any problems in obtaining their licenses. Tax knowledge and compliance is low: 45% of SME say they know only little or nothing about tax regulations. Only of SME 37% have paid VAT during the last year. There is a high correlation between not holding a business license and not paying tax. In general,
IV
ADB SME DEVELOPMENTTA
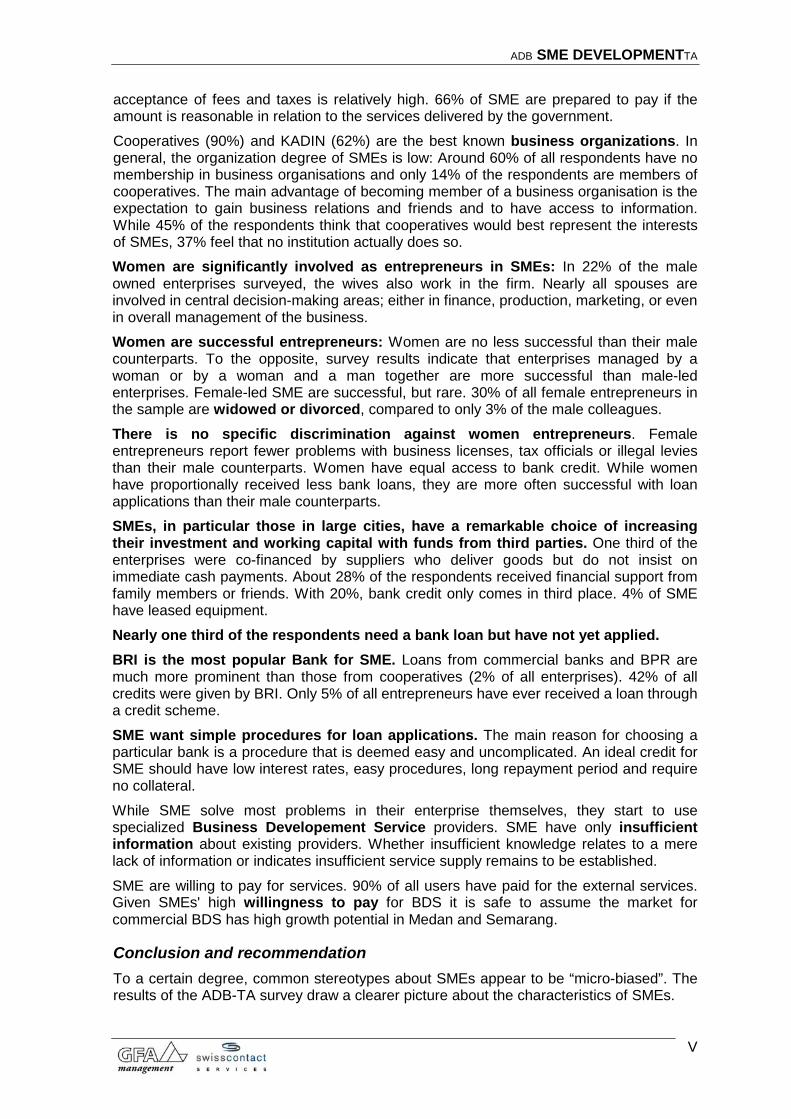
acceptance of fees and taxes is relatively high. 66% of SME are prepared to pay if the amount is reasonable in relation to the services delivered by the government. Cooperatives (90%) and KADIN (62%) are the best known business organizations. In general, the organization degree of SMEs is low: Around 60% of all respondents have no membership in business organisations and only 14% of the respondents are members of cooperatives. The main advantage of becoming member of a business organisation is the expectation to gain business relations and friends and to have access to information. While 45% of the respondents think that cooperatives would best represent the interests of SMEs, 37% feel that no institution actually does so. Women are significantly involved as entrepreneurs in SMEs: In 22% of the male owned enterprises surveyed, the wives also work in the firm. Nearly all spouses are involved in central decision-making areas; either in finance, production, marketing, or even in overall management of the business. Women are successful entrepreneurs: Women are no less successful than their male counterparts. To the opposite, survey results indicate that enterprises managed by a woman or by a woman and a man together are more successful than male-led enterprises. Female-led SME are successful, but rare. 30% of all female entrepreneurs in the sample are widowed or divorced, compared to only 3% of the male colleagues. There is no specific discrimination against women entrepreneurs. Female entrepreneurs report fewer problems with business licenses, tax officials or illegal levies than their male counterparts. Women have equal access to bank credit. While women have proportionally received less bank loans, they are more often successful with loan applications than their male counterparts. SMEs, in particular those in large cities, have a remarkable choice of increasing their investment and working capital with funds from third parties. One third of the enterprises were co-financed by suppliers who deliver goods but do not insist on immediate cash payments. About 28% of the respondents received financial support from family members or friends. With 20%, bank credit only comes in third place. 4% of SME have leased equipment. Nearly one third of the respondents need a bank loan but have not yet applied. BRI is the most popular Bank for SME. Loans from commercial banks and BPR are much more prominent than those from cooperatives (2% of all enterprises). 42% of all credits were given by BRI. Only 5% of all entrepreneurs have ever received a loan through a credit scheme. SME want simple procedures for loan applications. The main reason for choosing a particular bank is a procedure that is deemed easy and uncomplicated. An ideal credit for SME should have low interest rates, easy procedures, long repayment period and require no collateral. While SME solve most problems in their enterprise themselves, they start to use specialized Business Developement Service providers. SME have only insufficient information about existing providers. Whether insufficient knowledge relates to a mere lack of information or indicates insufficient service supply remains to be established. SME are willing to pay for services. 90% of all users have paid for the external services. Given SMEs' high willingness to pay for BDS it is safe to assume the market for commercial BDS has high growth potential in Medan and Semarang.
Conclusion and recommendation To a certain degree, common stereotypes about SMEs appear to be “micro-biased”. The results of the ADB-TA survey draw a clearer picture about the characteristics of SMEs.
V
ADB SME DEVELOPMENTTA
Regular update on SME and gender development trends is required. In order to establish a sound basis for policymaking, regular data collection and monitoring of development trends is recommended. Future surveys should clearly distinguish between micro enterprises and SME, and provide gender-disaggregated data, including data on spouses holding management functions in the husband's enterprise.
VI
ADB SME DEVELOPMENTTA
V. EXECUTIVE SUMMARY BAHASA INDONESIA
Latar belakang survey Asumsi umum tentang kendala dan kebutuhan UKM belum tentu sesuai dengan keadaan yang sebenarnya. Hampir semua data statistik dan studi yang tersedia mempunyai micro bias sehingga tidak menyediakan informasi yang dibutuhkan untuk perumusan kebijaksanaan untuk UKM yang sesuai. Hal yang sama juga berlaku khususnya mengenai masalah gender. Studi yang tersedia tentang kendala yang dihadapi oleh wanita pengusaha berdasarkan data yang terbatas dan lebih bersifat kualitatif. Sementara sejumlah studi mendalam serta wawancara kualitatif telah dilaksanakan, data kuantitatif hampir tidak tersedia. Kekurangan data ini mempersulit upaya mendiskusikan masalah jender dengan dasar yang kuat dan bebas dari opini yang emosional. Sesuaia dengan tugas utama TA ini – penyediaan masukan untuk perumusan kebijaksanaan – proyek memutuskan untuk melaksanakan sebuah survey kuantitatif di Kota Semarang dan Medan. Survey mencakup sebanyak 482 usaha kecil dan menengah. Usaha mikro (kurang dari 5 pekerja) tidak termasuk dalam survey. Sampel meliputi sektor manufaktur dan pengolahan, jasa, perdagangan, restoran dan akomodasi, serta transpor, pergudangan dan komunikasi susuai dengan kriteria BPS. Jumlah perusahaan yang dimiliki/dikelola oleh wanita adalah sebanyak 85. Data dianalisa berdasarkan gender. Analisa dilengkapi dengan sebuah focus group discussion untuk mengkaji kendala dan visi khusus wanita pengusaha serta pembagian tugas anatara pria dan wanita dalam usaha keluarga.
Penemuan Utama Sektor UKM sangat dinamis: seperempat dari perusahaan beroperasi kurang dari lima tahun. Dari perusahaan yang telah beroperasi lebih dari 10 tahun, 35% mempekerjakan seorang manajer eksternal atau telah ditransfer pada generasi muda. 78% dari UKM tidak terpengaruh negatif oleh krisis ekonomi; 47% malah mengalami peningkatan usahannya dalam dua tahun terakhir. Sebagian besar dari manajer UKM berusia muda, berpendidikan tinggi dan sangat optimis: 60% dari manajer berusia kurag dari 40 tahun. 40% telah tamat SMA, dan 36% memiliki ijazah perguruan tinggi. 60% dari responden yakin usahannya akan meningkat pada tahun mendatang, sementara hanya 8% khawatir usahanya akan merosot. Hampir 70% berminat untuk memperluas usahanya pada masa mendatang. Keadaan setempat mempengaruhi dinamika UKM: situasi ekonomi dan lingkungan usaha kelihatan lebih kondusif di Semarang daripada di Medan. Dukungan yang diharapkan dari pemerintah adalah terutama jaminan keamanan lingkungan serta pemerintahan yang bersih. Penyediaan program kredit khusus dan perlindungan terhadap persaingan yang tidak sehat juga disebutkan tetapi dianggap tidak terlalu penting. Prestasi pemerintah dalam hal-hal yang berkaitan dengan UKM dinilai sebagai sangat tidak memuaskan. Tiga per empat dari perusahaan telah memiliki Surat Ijin Usaha yang dibutuhkan. Akan tetapi, hanya 31% dari responden mengaku tidak mengalami kesulitan dalam pengurusannya. Pengetahuan tentang peraturan perpajakan dan pembayaran pajak rendah. 45% dari responden mengatakan kurang atau sama sekali tidak mengetahui peraturan perpajakan.
VII
ADB SME DEVELOPMENTTA
Hanya 37% dari UKM membayar PPN pada tahun yang lalu. 66% dari responden mengatakan tidak berkeberatan membayar pajak dan retribusi selama manfaatnya yang diperoleh sesuai dengan jumlah pembayaran. Asosiasi Usaha yang terkenal adalah koperasi (90%) dan KADIN (62%). Sekitar 60% dari pengusaha tidak terdaftar sebagai anggota asosiasi, dan hanya 14% terdaftar sebagai anggota koperasi. Keuntungan utama dari keanggotaan dalam asosiasi adalah mendapatkan teman/relasi usaha dan informasi. 45% dari responden berpendapat bahwa pihak yang memperjuangkan kepentingan UKM adalah koperasi, sementara 37% mengatakan tidak ada pihak tertentu yang melakukan hal ini. Wanita sangat berperan dalam UKM: pada 22% dari perusahaan yang dimilik oleh pria, isteri ikut bekerja. Hampir semuanya terlibat dalam pengambilan keputusan di bidang keuangan, produksi, pemasaran, ataupun dalam semua bidang. Wanita adalah pengusaha yang berhasil: hasil survey menunjukkan bahwa perusahaan yang dipimpin oleh wanita atau oleh suami-isteri secara bersama lebih berhasil daripada perusahaan yang dikepalai oleh pria. UKM yang dipimpin oleh wanita cukup berhasil, tetapi jumlahnya sedikit. 30% dari wanita pengusaha berstatus janda, sementara pria yang berstatus duda 3%. Tidak terdapat diskriminasi terhadap wanita pengusaha. Jumlah wanita pengusaha yang mengaku mengalami kesulitan dalam pengurusa surat ijin usaha, masalah perpajakan dan pungutan liar lebih sedikit dibandingkan dengan pria. Akses terhadap kredit tidak berbeda antara wanita dan pria. Walaupun jumlah wanita pengusaha yang pernah memperoleh kredit lebih rendah daripada jumlah pria, tingkat keberhasilan mereka dalam pengajuan permohonan kredit lebih tinggi. UKM, terutama yang beroperasi di kota besar, mempunyai aneka ragam sumber untuk menambah modal investasi dan operasi. Sepertiga dari responden dapat menambah modalnya melalui utang dagang atau barang konsiniasi. 28% mendapat bantuan modal dari keluarga atau teman. Dengan 20%, kredit menempati urutan ketiga. 4% dari responden telah melakukan leasing. Hampir sepertiga dari responden mengaku membutuhkan kredit, tetapi belum mengajukan permohonan. Dengan 42% dari seluruh kredit yang diterima oleh UKM, BRI adalah pemberi kredit yang paling perperan. Kredit dari Bank Umum dan BPR jauh lebih prominen daripada kredit dari koperasi (2%). Hanya 5% dari UKM pernah mendapat kredit program. UKM menghendaki prosedur yang mudah dalam pengajuan permohonan kredit. Alasan utama untuk memilih bank tertentu adalah prosedur yang mudah dan tidak berbelit. Ciri-ciri kredit yang dianggap ideal adalah: bunga ringan, prosedur dan persyaratan yang mudah, jangka waktu pembayaran lama, serta tidak membutuhkan agunan. Walaupun sebagian besar dari para pengusaha berusaha untuk menyelesaikan masalah yang timbul dalam pengelolaan usaha dengan sendiri, jasa pengembangan usaha mulai digunakan. Pengetahuan tentang ketersediaan jasa pengembangan usaha masih sangat kurang. Belum dapat dipastikan apakah kekurangan pengetahuan disebabkan oleh kekurangan informasi atau kekurangan ketersediaan. Para pengusaha bersedia membayar untuk jasa pengembangan usaha. 90% dari UKM yang telah menggunakan jasa eksternal tersebut membayar. Dengan demikian dapat disimpulkan bahwa potensi pertumbuhan pasaran untuk jasa pengembangan usaha yang komerisil sangat tinggi.
VIII
ADB SME DEVELOPMENTTA
Kesimpulan dan rekomendasi Asumsi umum tentang kendala dan kebutuhan usaha kecil dan menengah diwarnai oleh micro bias. Hasil survey yang dilaksanakan oleh ADB-TA memberi gambaran yang lebih jelas tentang ciri-ciri UKM. Pengamatan secara berkala terhadap pengembangan UKM dan aspak gender sangat dibutuhkan. Dalam rangka penyediaan landasan yang solid untuk perumusan kebijaksanaan, pengumpulan data secara kontinu serta monitoring trend perkembangan dianjurkan. Pada masa mendatang, survey yang dilaksanakan hendaknya membedakan dengan jelas antara usaha micro serta usaha kecil dan menengah. Survey ini perlu menyediakan data berdasarkan gender, termasuk informasi tentang anggota keluarga yang terlibat dalam manajemen usaha.
IX
ADB SME DEVELOPMENTTA
1 INTRODUCTION
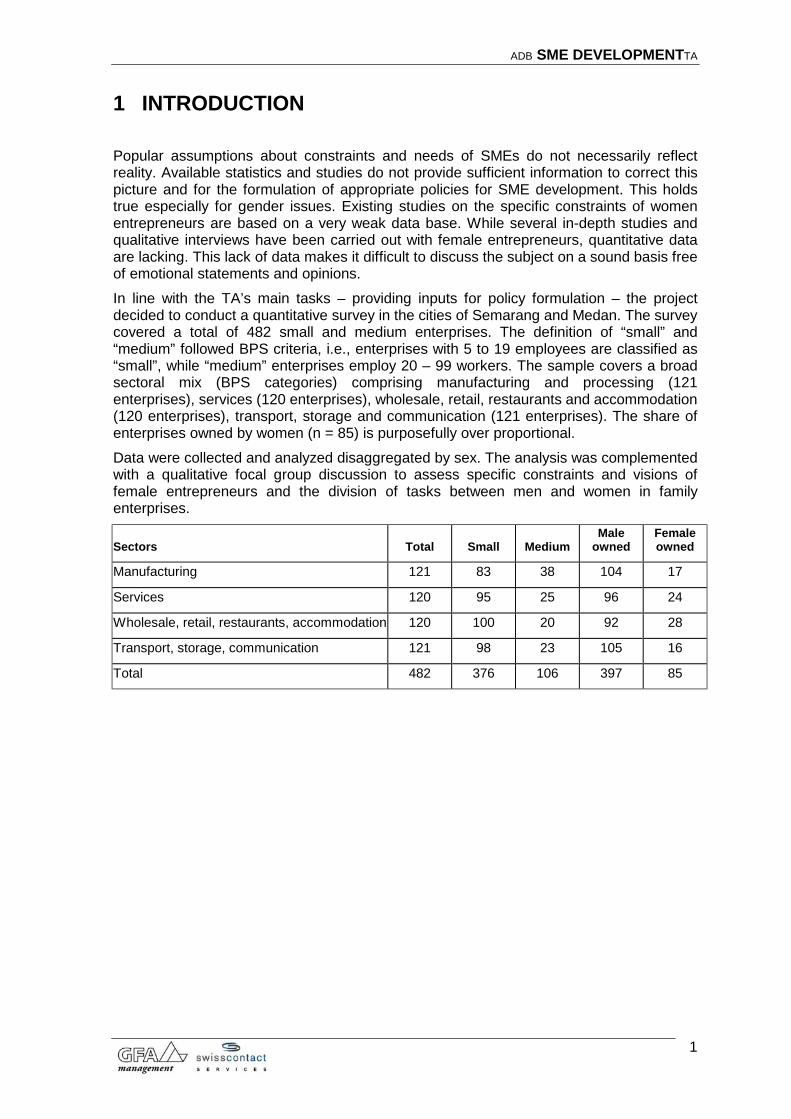
Popular assumptions about constraints and needs of SMEs do not necessarily reflect reality. Available statistics and studies do not provide sufficient information to correct this picture and for the formulation of appropriate policies for SME development. This holds true especially for gender issues. Existing studies on the specific constraints of women entrepreneurs are based on a very weak data base. While several in-depth studies and qualitative interviews have been carried out with female entrepreneurs, quantitative data are lacking. This lack of data makes it difficult to discuss the subject on a sound basis free of emotional statements and opinions. In line with the TA’s main tasks – providing inputs for policy formulation – the project decided to conduct a quantitative survey in the cities of Semarang and Medan. The survey covered a total of 482 small and medium enterprises. The definition of “small” and “medium” followed BPS criteria, i.e., enterprises with 5 to 19 employees are classified as “small”, while “medium” enterprises employ 20 – 99 workers. The sample covers a broad sectoral mix (BPS categories) comprising manufacturing and processing (121 enterprises), services (120 enterprises), wholesale, retail, restaurants and accommodation (120 enterprises), transport, storage and communication (121 enterprises). The share of enterprises owned by women (n = 85) is purposefully over proportional. Data were collected and analyzed disaggregated by sex. The analysis was complemented with a qualitative focal group discussion to assess specific constraints and visions of female entrepreneurs and the division of tasks between men and women in family enterprises.
Sectors Total Small Medium Male
owned Female owned
Manufacturing 121 83 38 104 17
Services 120 95 25 96 24
Wholesale, retail, restaurants, accommodation 120 100 20 92 28
Transport, storage, communication 121 98 23 105 16
Total 482 376 106 397 85
1
ADB SME DEVELOPMENTTA
2 STEREOTYPES AND REALITY - RESULTS OF THE SME SURVEY
To a certain degree, common stereotypes about SMEs appear to be “micro-biased”. The results of the ADB-TA survey, which did not include enterprises with less than five employees, draw a clearer picture about the characteristics of SMEs.
2.1 General Characteristics of SMEs
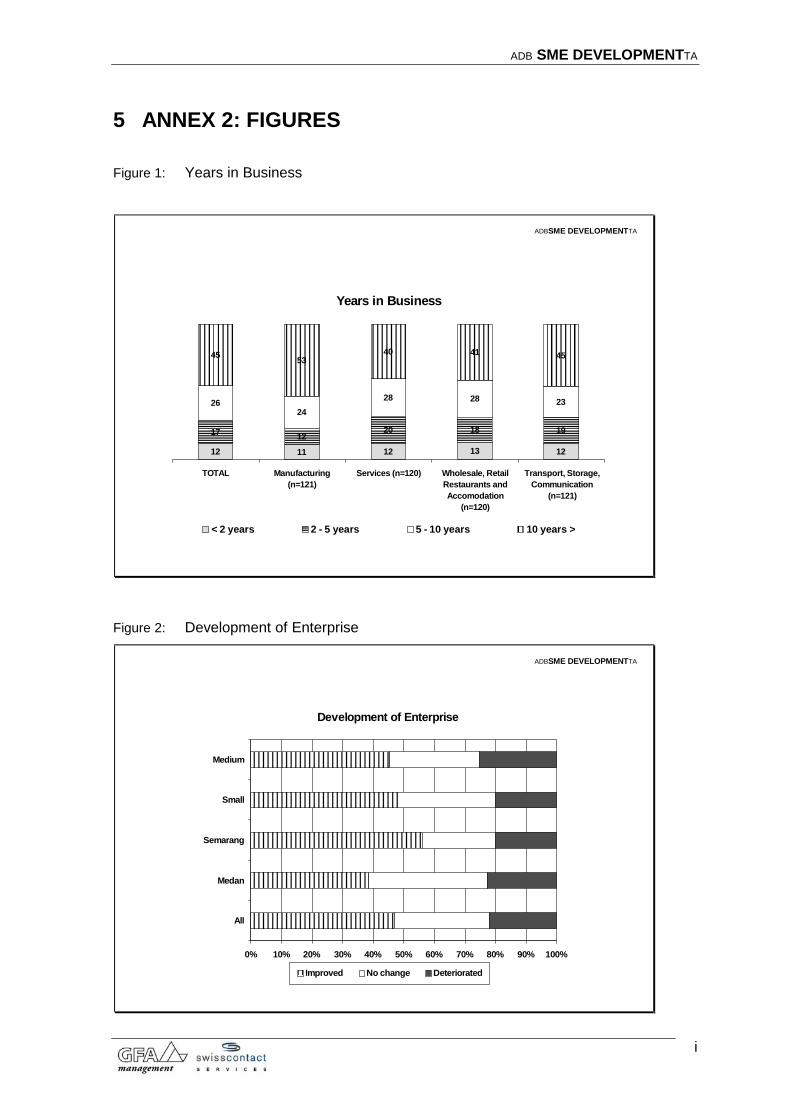
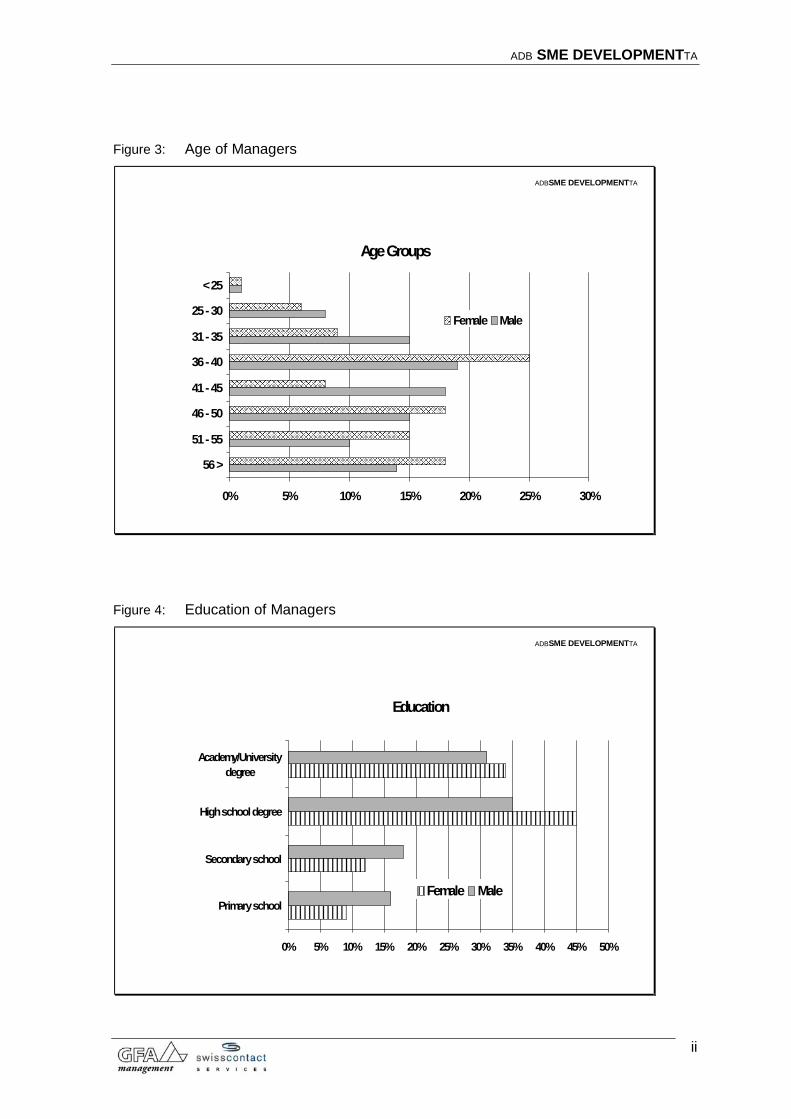
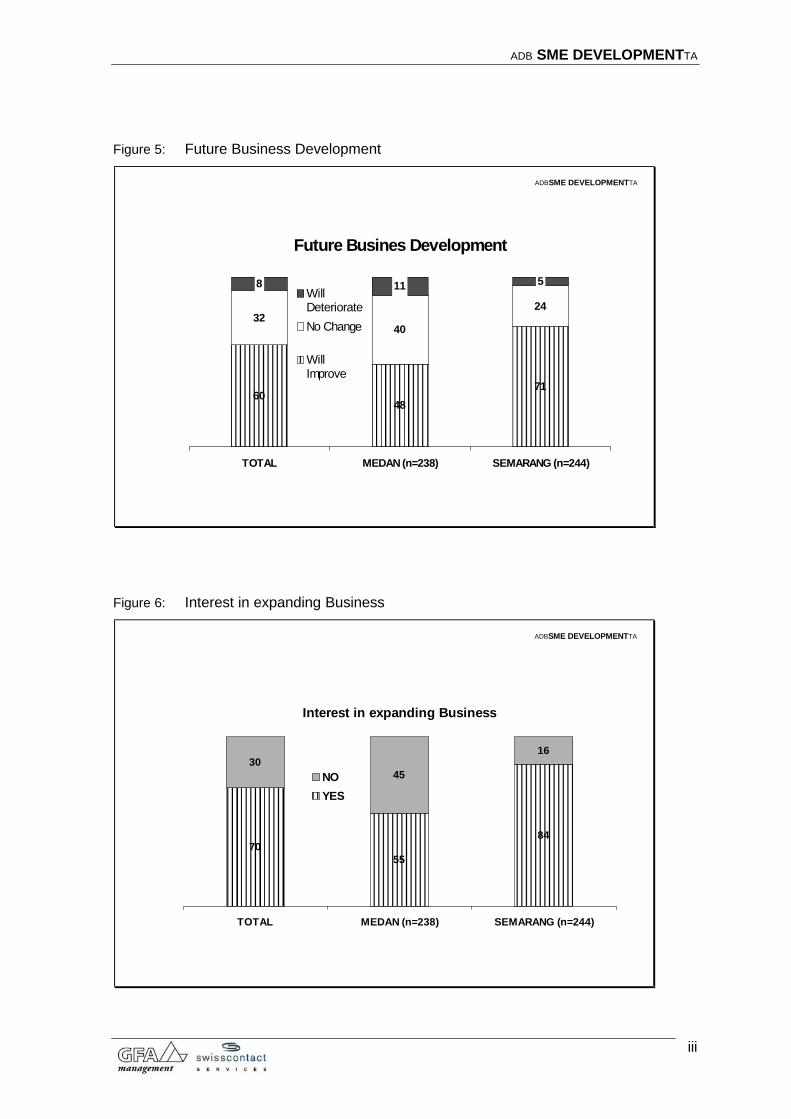
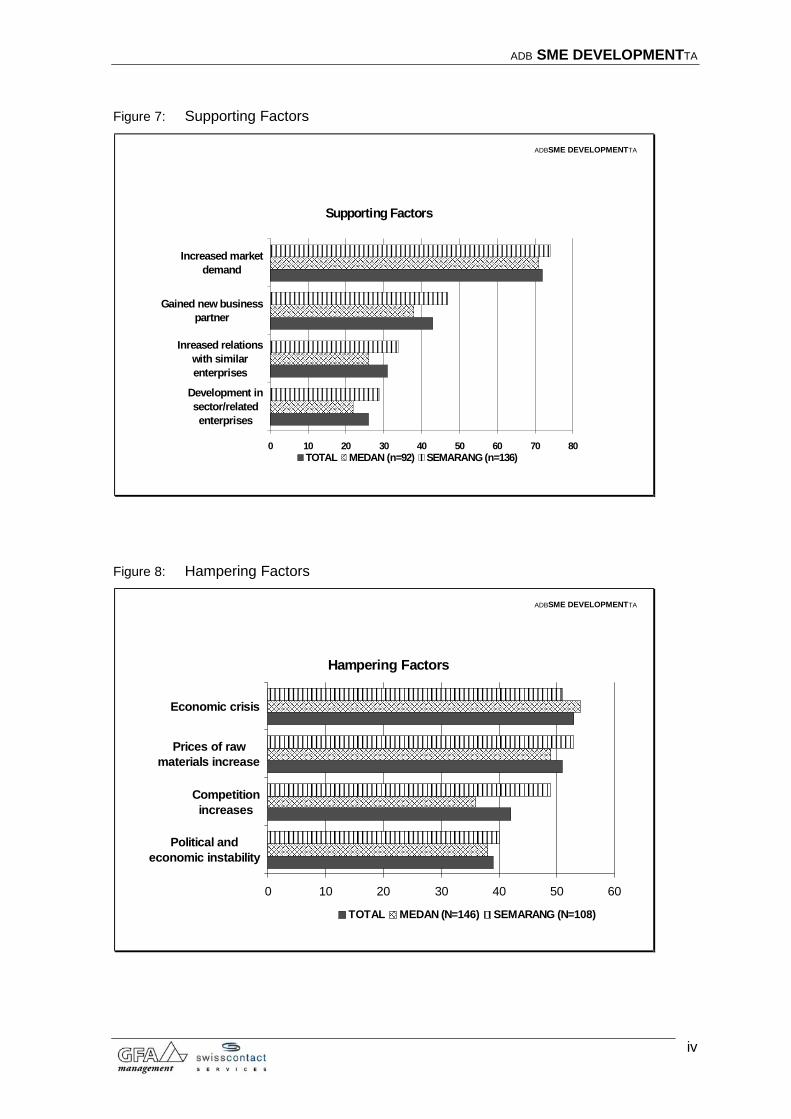
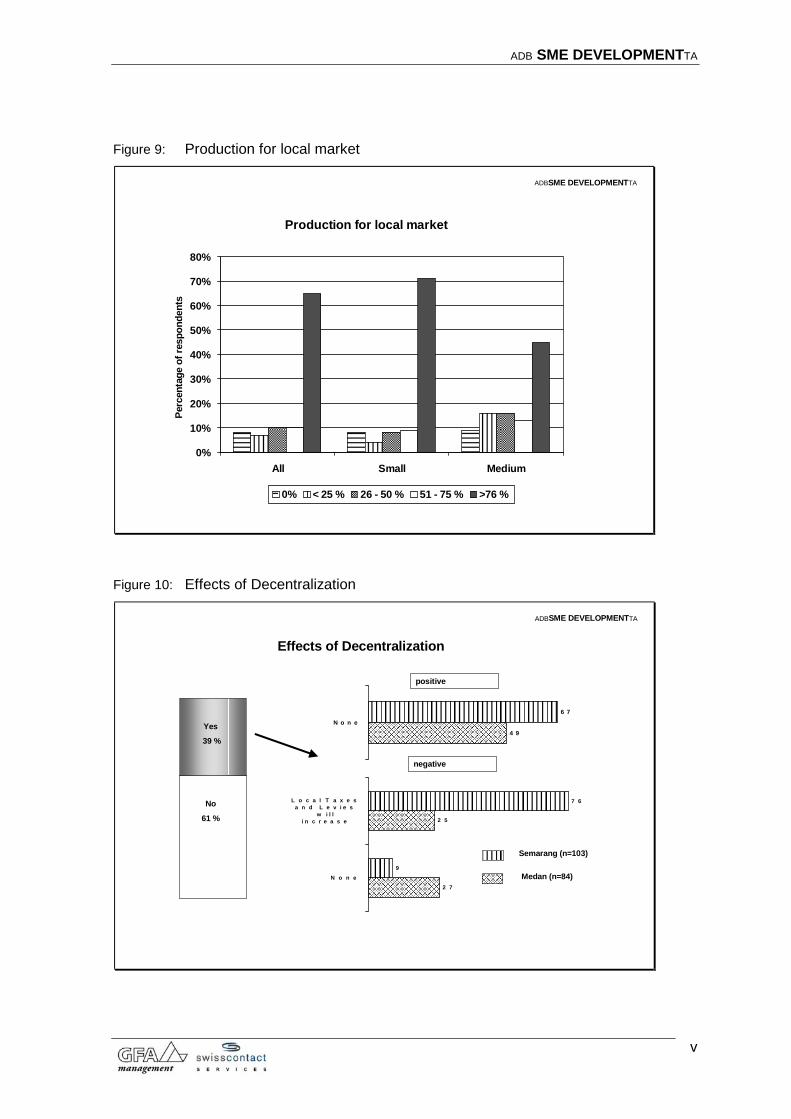
The SME sector is very dynamic: One quarter of the enterprises have been in business for less than 5 years. Of the enterprises that have been in business for more than ten years, 35% have employed an external manager or have already been transferred to the next generation. 78% of SME have not been negatively affected by the economic crisis; 47% even experienced a positive business development during the last two years. With more than 30% of enterprises in business for less than five years, and more than 50% of enterprises reporting business growth, the service sector appears to be particularly dynamic. SME in transport, storage and communication report the worst development, while the rate of young enterprises is lowest in the manufacturing sector (see Figures 1, 2 and Tables 1 – 3). Most SME managers are young, well educated and highly optimistic: 60% of SME managers are not older than 40 years. 40% of all managers have finished high school, and 36% hold a university degree. 60% of the respondents believe that their business will grow in the coming years, while only 8% expect deterioration. Consequently, nearly 70% of SME intend to expand their business in the future. Expansion desire is highest in the manufacturing and service sectors, while SME in transport, storage and communication are more sceptical, albeit still in majority optimistic for the future (see Figures 3 – 6 and Tables 4, 5 ). Apart from increasing market demand, a general upward trend in the sector/related enterprises, intensified relations with similar enterprises and cooperation with new business partners are mentioned as main supporting factors. Main hampering factors named by those whose businesses stagnated or even deteriorated are the economic crisis, increased competition and economic and political instability. However, business development was significantly better for enterprises with managers not older than forty years or with university degree, and better for enterprises that used external business services. This indicates that, aside from sector trends, management quality has considerably influenced enterprise performance (see Figures 7, 8 and Tables 6, 7). Export orientation of SMEs is low: only 10% of all manufactures have a export orientation of more than 50%, only 14% of all manufacturers have export experience (see Figure 9). Regional conditions influence SME dynamics: Economic situation and business environment appear to be much better in Semarang than in Medan. While entrepreneurs in both cities expect the government to guarantee security and practice clean governance, respondents in Medan emphasize more strongly that the government should safeguard a sound and fair legal system. This ties in with the information that many SMEs in Medan have to pay protection money and illegal levies. Business licenses are also more problematic than in Semarang.
2
ADB SME DEVELOPMENTTA
84% of all SMEs in Semarang are interested in expanding business, compared to only 55% in Medan. 71% of all respondents in Semarang expect their enterprise to actually grow within the next year, while only 48% of the respondents in Medan share their opinion. Enterprises operating in the service sector are the most optimistic, followed by manufacturing.
Medan Semarang
Govt. should guarantee Security 61% 62%
Govt. should practice Clean Governance 39% 43%
Govt. should safeguard sound and fair legal system 37% 27%
Pay protection money/illegal levies 42% 13%
Business has improved 39% 56%
Business will improve 48% 71%
Interested in expanding Business 55% 84%
Have no Business License 40% 39%
Had license problems 17% 9%
No license problems because paid 18% 10%
No problems getting license 27% 35%
61% of all respondents think that the Regional Autonomy will not affect the development of their enterprise. Of those who think there will be an influence, 67% respondents in Semarang and 49% in Medan expect no positive effects for their enterprise, while 91% (Semarang) and 63% (Medan) even expect negative influences, mainly an increase of local taxes and levies (see Figure 10).
2.2 Government, Bureaucracy and Business Associations
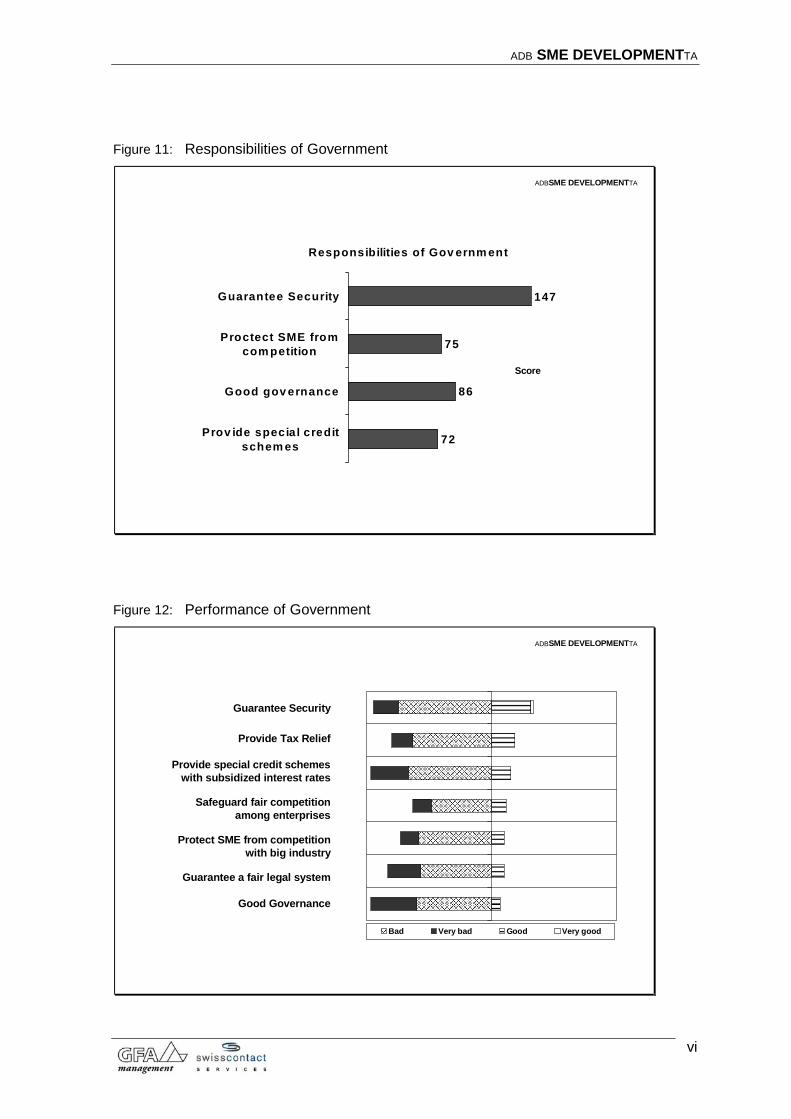
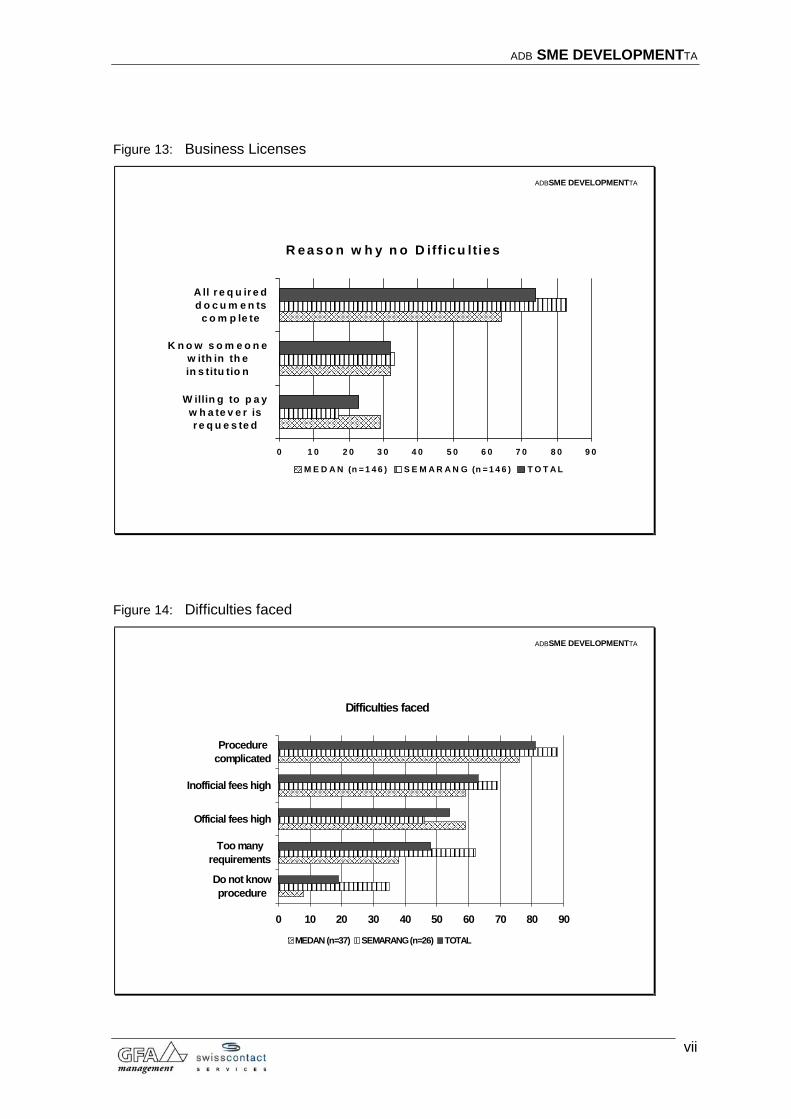
THE ROLE OF GOVERNMENT In first priority, SMEs expect the government to guarantee security of their environment and practice good governance. Provision of special credit schemes and protection from unfavorable competition are mentioned but seen as less important. The performance of the Government with regard to all SME expectations is rated as clearly negative (see Figures 11, 12). BUREAUCRACY In spite of licensing problems, the degree of formalization of enterprises is high: Three quarters of the SMEs hold the necessary business licenses. However, only 31% did not experience any problems in obtaining their licenses. The others either had personal contacts to the institutions in charge or were willing to pay what was asked for, both official as well ‘unofficial’ fees. 18% of the SME that have licenses faced difficulties. The biggest obstacle was complicated procedures, followed by high fees, official and unofficial ones (see Figures 13, 14 and Table 8).
3
ADB SME DEVELOPMENTTA
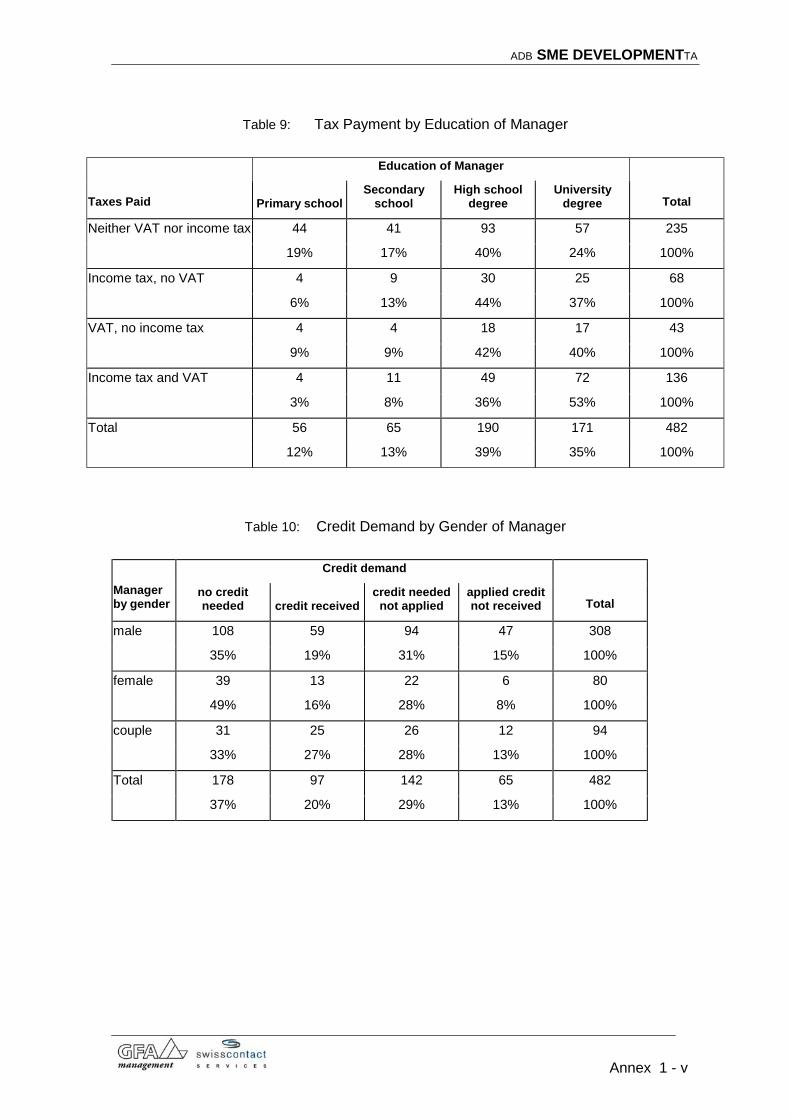
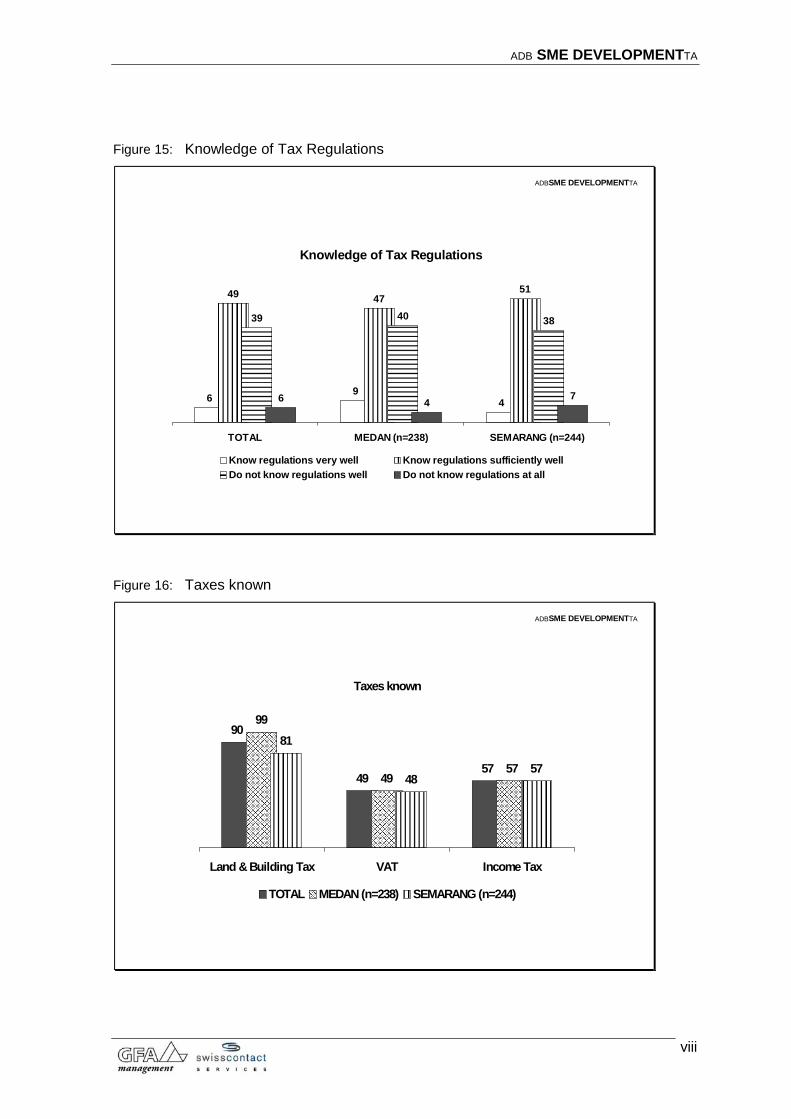
Tax knowledge and compliance is low: While some 80% of SME qualify for VAT, only 37% have paid VAT during the last year. 12% of SME think they have to pay VAT, but do
not pay, while more than 30% do not even know that they are in principle subject to VAT. For income tax, it is more difficult to make respective assessments, as the survey did not collect information on enterprise profit. However, based on turnover per
employee, it can be estimated that ratios for income tax should be similar to those for VAT. For land and building tax, tax payment is far higher at 84% (see Figures 15 – 19).
Tax payment VAT Income tax
Land tax
Taxpayers 37% 42% 84%
Do not pay, but think they have to 12% 15% 7%
Do not pay, because they do not know ~ 30% ~ 30% n.a.
Not taxable ~ 20% ~ 15% n.a.
A closer analysis yields the following insights:
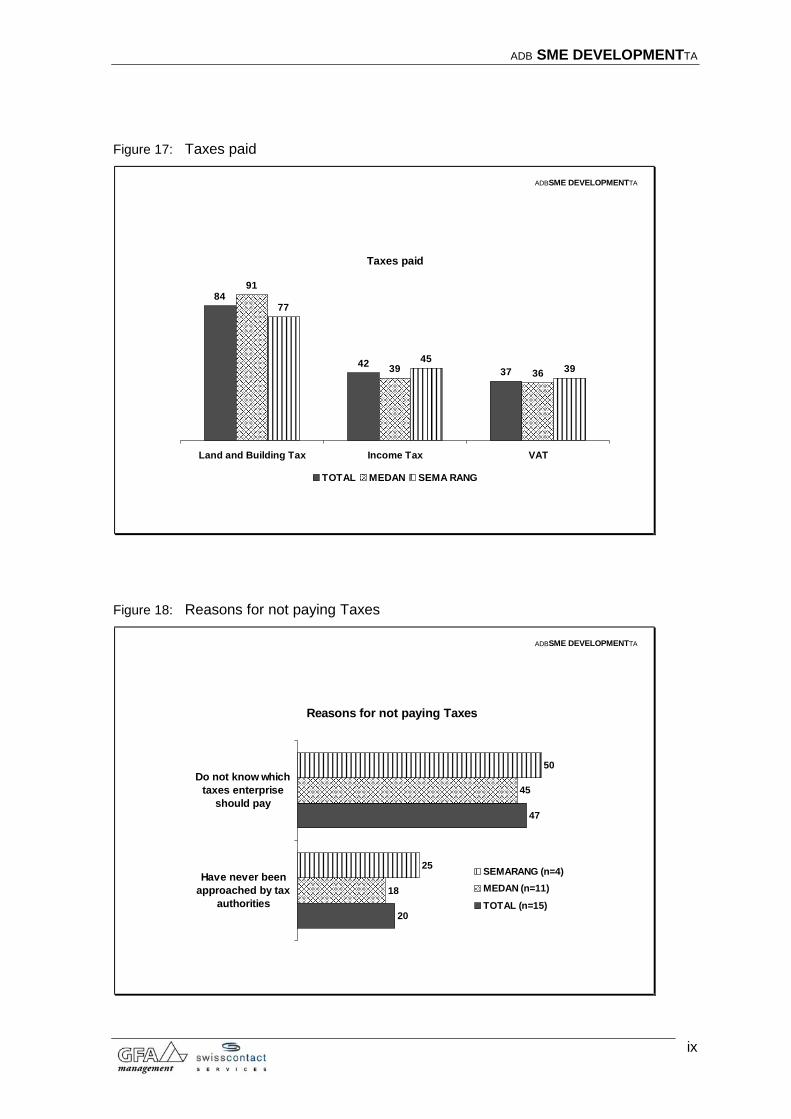
• In general, acceptance of fees and taxes is relatively high. 66% of SME are prepared to pay if the amount is reasonable in relation to the services delivered by the government. 76% find clear regulation important, and for 86% it matters that they are not connected to additional unofficial payments. Also important is that payment is used for regional development and not misappropriated by officials.
• There is a high correlation between not holding a business license and not paying tax – some 20-25% of entrepreneurs, typically those that are less educated, obviously prefer to run their business on an informal basis.
• Tax knowledge in general is low. 45% of SME say they know only little or nothing about tax regulations. This suggests that better information to SME on tax regulation and tax use could considerably increase tax morale.
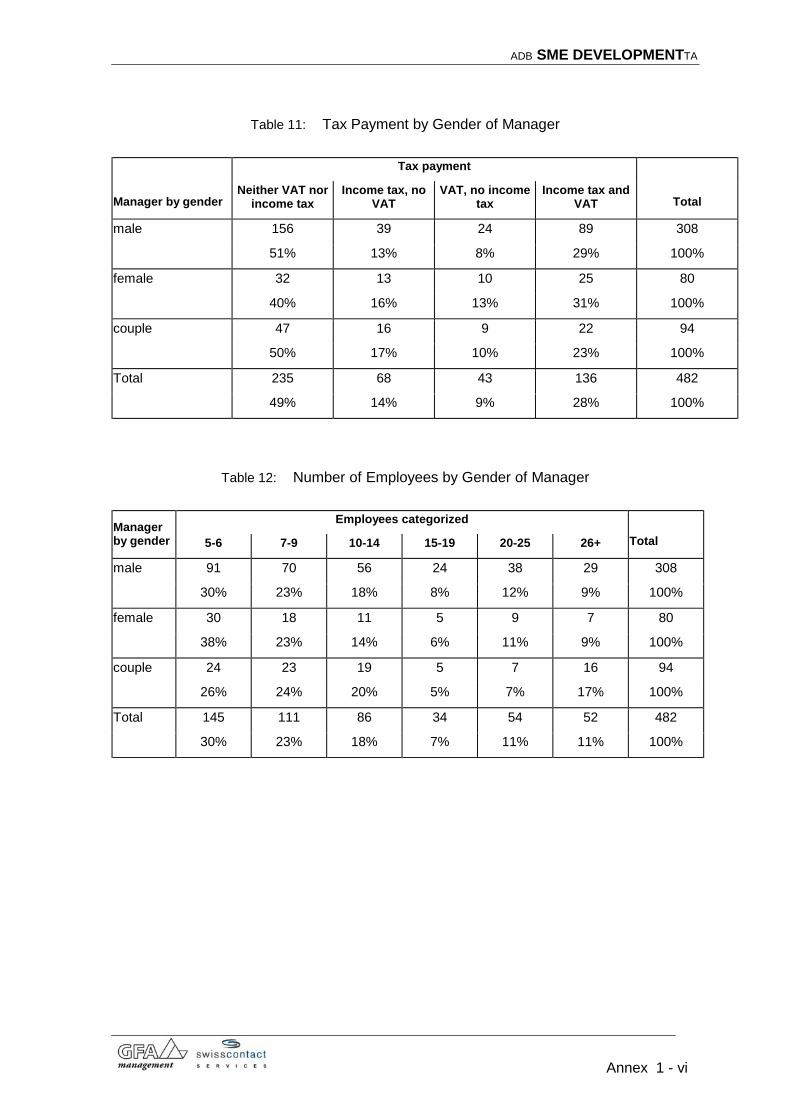
• Tax payment is strongly correlated with the education of the manager. While only 14% of managers with primary education pay income tax, 57% of university-educated managers pay income tax. This, however, is not linked to university-educated managers feeling they have a better tax knowledge. It rather seems that managers with university degree prefer to have their relations with the government in order (see Table 9).
• Relationship between the taxpayer and the tax official is good. Only 13% find it difficult to deal with tax officials – no wonder if one considers the low compliance rate. Of those who pay income tax, however, more than 17% find it difficult to deal with tax officials. In addition, some 10% of SME avoid problems with tax officials by paying more tax than they think they should.
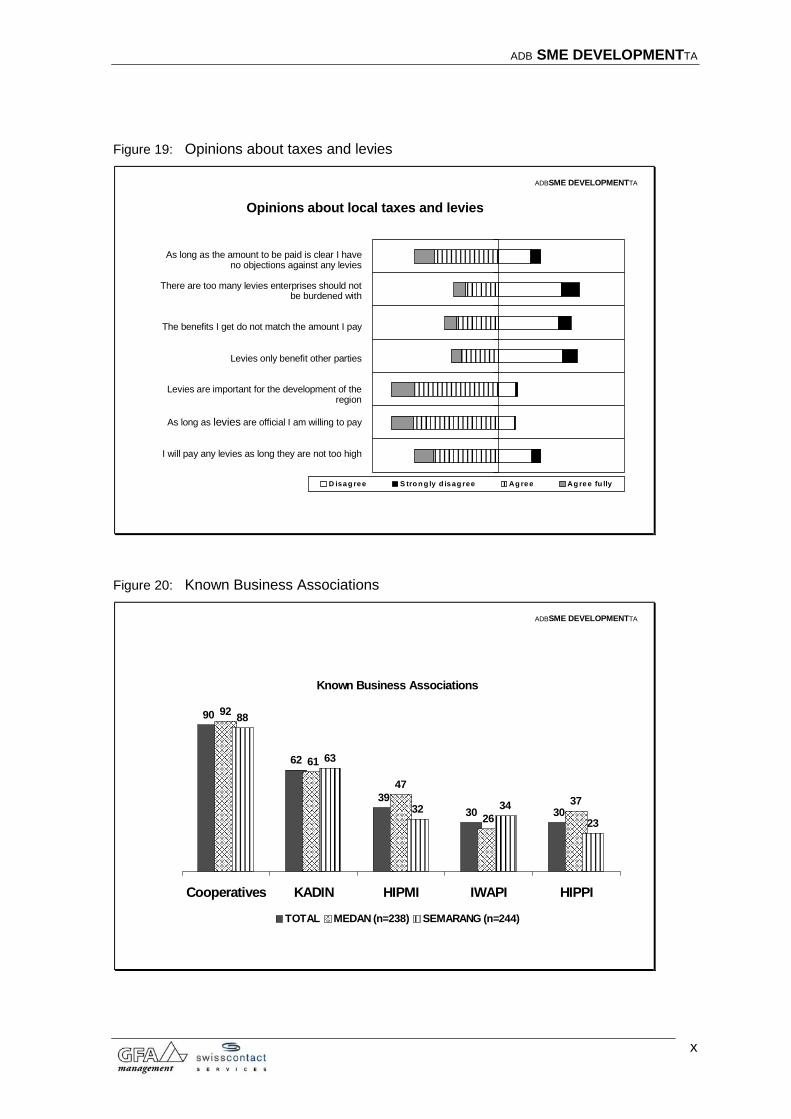
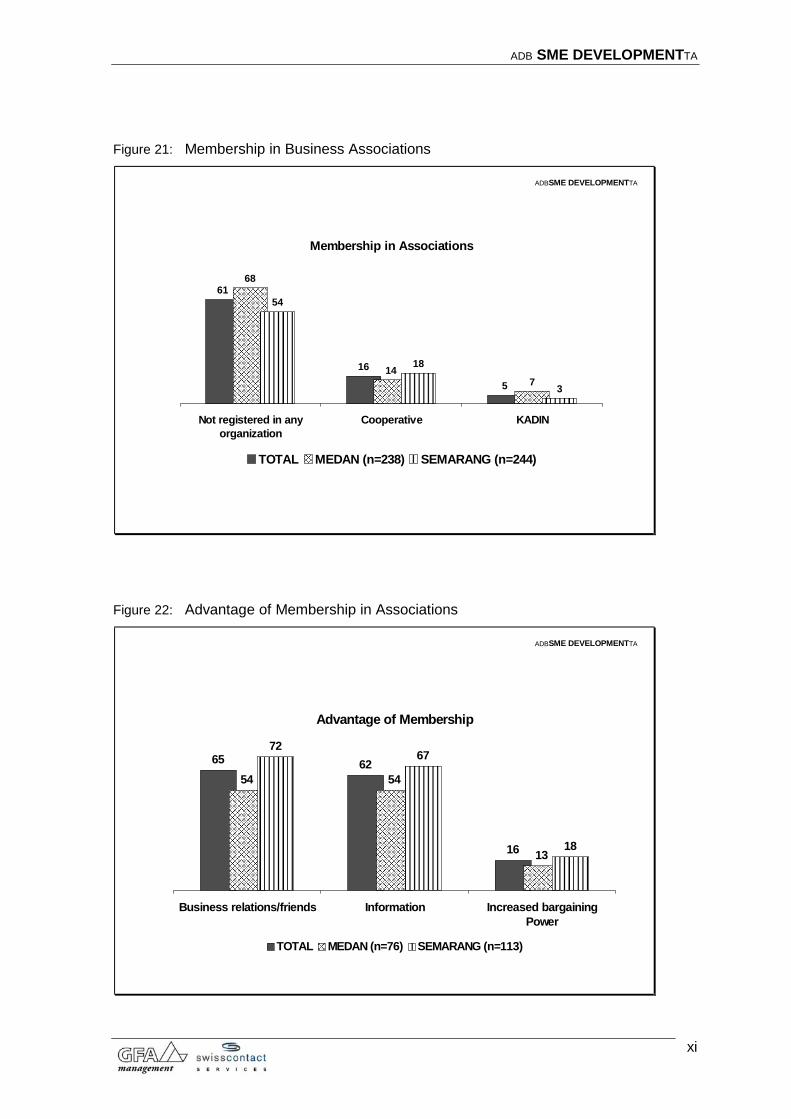
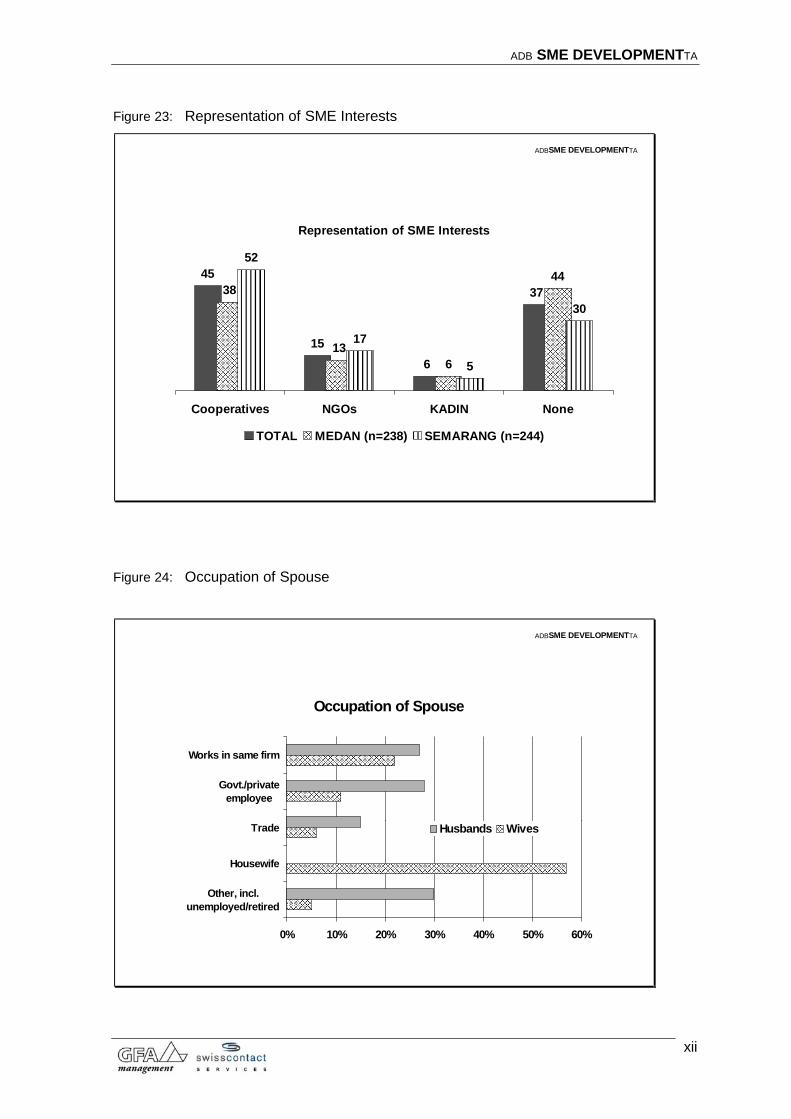
MEMBERSHIP IN BUSINESS ORGANIZATIONS Cooperatives (90%) and KADIN (62%) are the best known business organizations. In general, the organisation degree of SMEs is low: Around 60% of all respondents have no membership in business organisations and only 14% of the respondents are member of cooperatives. The main advantage of becoming member of a business organisation is the expectation to gain business relations and friends and to have access to information. While 45% of the respondents think that cooperatives would best represent the interests of SMEs, 37% feel that no institution actually does so (see Figures 20 – 23).
4
ADB SME DEVELOPMENTTA
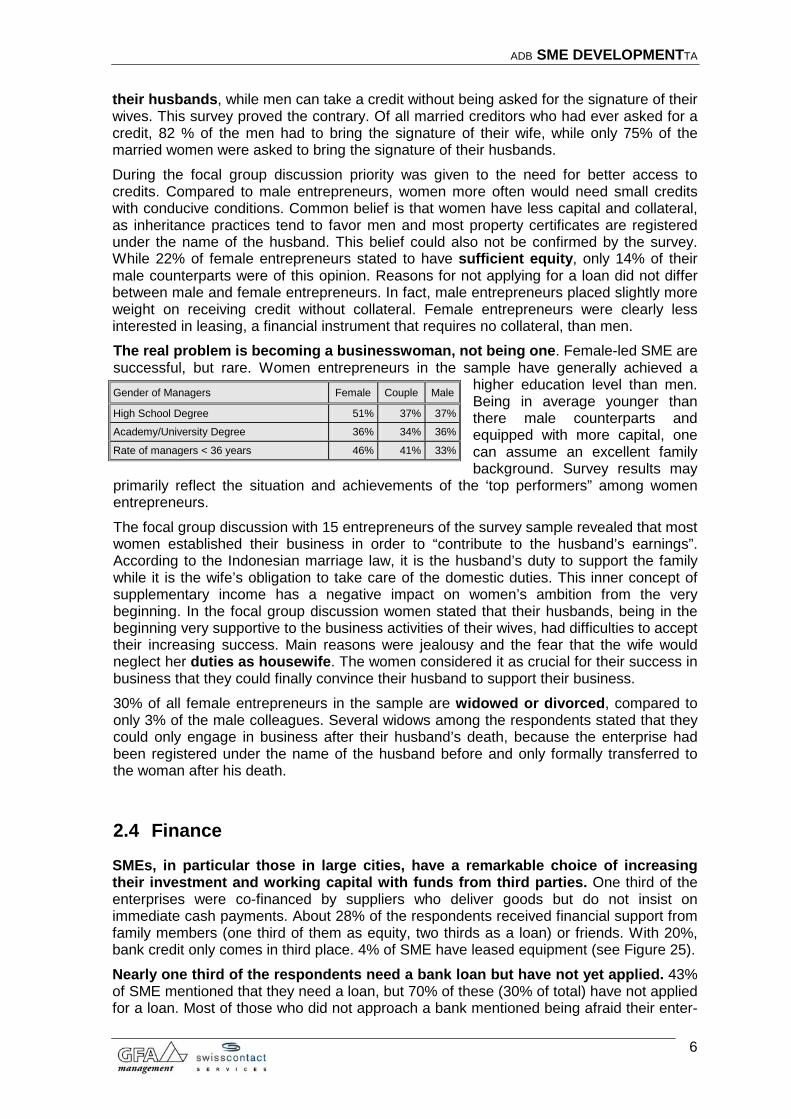
2.3 Gender Issues
Women are significantly involved as entrepreneurs in SMEs: National statistics indicate that the number of women-headed enterprises decreases with growth in scale. 44% female entrepreneurs are found in home and micro enterprises compared to only 12% in small enterprises (BPS 1998). In 22% of the male owned enterprises surveyed, however, the wives also work in the firm. Nearly all spouses are involved in central decision-making areas; either in finance, production, marketing, or even in overall management of the business. If we add these women being in the position of an “invisible entrepreneur” to the 12 % female entrepreneurs officially registered in small enterprises, the share of women being actually involved as entrepreneurs in small and medium enterprises increases substantially to more than 30% (see Figure 24). Women are successful entrepreneurs: Women are no less successful than their male counterparts. To the opposite, survey results indicate that enterprises managed by a woman or by a woman and a man together are more successful than male-led enterprises. While 51% of female-led enterprises have grown in the last two years, only 45% of male-led have. 25% of male-led enterprises have deteriorated, but only 13% of female-led. Female entrepreneurs are apparently more realistic and cautious. In the group discussion, women described themselves as being more accurate and better in planning, so that they would know exactly about risks and challenges before starting a new investment. 11% of male entrepreneurs and couples want to expand their business even though they do not expect growth for the future, but only 3% of women. Female entrepreneurs feel much less a need for bank credits than their male counterparts. Accurateness is also reflected in female-led SME being more likely to having a business license and paying VAT and/or income tax. The other side of the coin, however, is a lower dynamic of female-led SME – they are over represented in SME with 5-6 employees and less likely to have more than 10 employees (see Tables 10 – 12). There is no specific discrimination against women entrepreneurs. To the opposite,
female entrepreneurs report fewer problems with business licenses, tax officials or illegal levies than their male counterparts. This suggests that female entrepreneurs are correctly describing themselves as having better social and communicative skills than men. There is no
significant difference in the use of BDS, use of training programs or information about BDS providers.
Gender of Managers Female Couple Male
Business has improved in last years 51% 51% 45%
Business has gone down in last years 13% 19% 25%
Business will improve in next years 61% 60% 60%
Wish to expand business 64% 71% 71%
No need for bank loan 49% 33% 35%
Business license 81% 75% 72%
Do not pay VAT and income tax 40% 50% 51%
Gender of Managers Female Couple Male
Have received bank loan 16% 27% 19%
Successful loan applications 68% 68% 56%
No business license problems 43% 33% 27%
Difficulties with tax officials 6% 15% 12%
Pay more tax than I have to pay 8% 12% 18%
Have to pay protection money / illegal levies 23% 26% 29%
Women have equal access to bank credit. While women have proportionally received less bank loans, they are more often successful with loan applications than their male counterparts. As a matter of fact, survey data indicate that single men younger than 35 have the biggest problem in obtaining bank credit. The survey gives reason to do away with the common assumption of a strong gender bias in credit procedures. Many studies state that female creditors require the signature of
5
ADB SME DEVELOPMENTTA
their husbands, while men can take a credit without being asked for the signature of their wives. This survey proved the contrary. Of all married creditors who had ever asked for a credit, 82 % of the men had to bring the signature of their wife, while only 75% of the married women were asked to bring the signature of their husbands. During the focal group discussion priority was given to the need for better access to credits. Compared to male entrepreneurs, women more often would need small credits with conducive conditions. Common belief is that women have less capital and collateral, as inheritance practices tend to favor men and most property certificates are registered under the name of the husband. This belief could also not be confirmed by the survey. While 22% of female entrepreneurs stated to have sufficient equity, only 14% of their male counterparts were of this opinion. Reasons for not applying for a loan did not differ between male and female entrepreneurs. In fact, male entrepreneurs placed slightly more weight on receiving credit without collateral. Female entrepreneurs were clearly less interested in leasing, a financial instrument that requires no collateral, than men. The real problem is becoming a businesswoman, not being one. Female-led SME are successful, but rare. Women entrepreneurs in the sample have generally achieved a
higher education level than men. Being in average younger than there male counterparts and equipped with more capital, one can assume an excellent family background. Survey results may
primarily reflect the situation and achievements of the ‘top performers” among women entrepreneurs.
Gender of Managers Female Couple Male
High School Degree 51% 37% 37%
Academy/University Degree 36% 34% 36%
Rate of managers < 36 years 46% 41% 33%
The focal group discussion with 15 entrepreneurs of the survey sample revealed that most women established their business in order to “contribute to the husband’s earnings”. According to the Indonesian marriage law, it is the husband’s duty to support the family while it is the wife’s obligation to take care of the domestic duties. This inner concept of supplementary income has a negative impact on women’s ambition from the very beginning. In the focal group discussion women stated that their husbands, being in the beginning very supportive to the business activities of their wives, had difficulties to accept their increasing success. Main reasons were jealousy and the fear that the wife would neglect her duties as housewife. The women considered it as crucial for their success in business that they could finally convince their husband to support their business. 30% of all female entrepreneurs in the sample are widowed or divorced, compared to only 3% of the male colleagues. Several widows among the respondents stated that they could only engage in business after their husband’s death, because the enterprise had been registered under the name of the husband before and only formally transferred to the woman after his death.
2.4 Finance
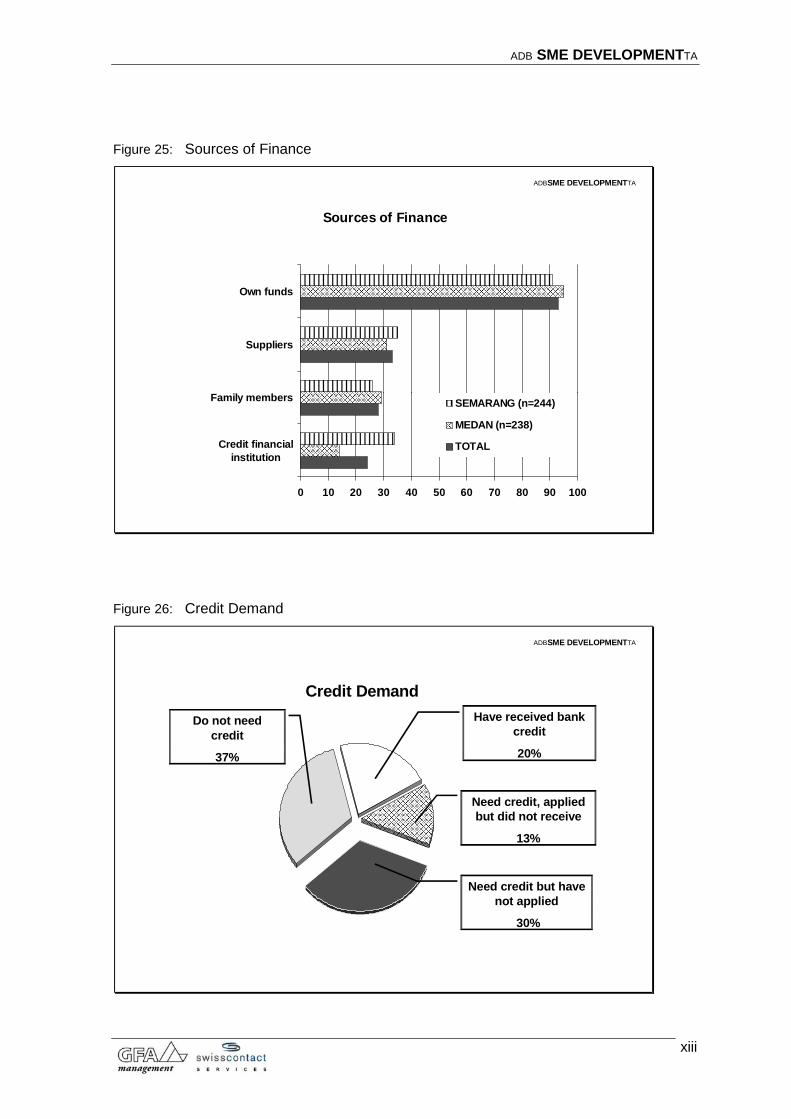
SMEs, in particular those in large cities, have a remarkable choice of increasing their investment and working capital with funds from third parties. One third of the enterprises were co-financed by suppliers who deliver goods but do not insist on immediate cash payments. About 28% of the respondents received financial support from family members (one third of them as equity, two thirds as a loan) or friends. With 20%, bank credit only comes in third place. 4% of SME have leased equipment (see Figure 25). Nearly one third of the respondents need a bank loan but have not yet applied. 43% of SME mentioned that they need a loan, but 70% of these (30% of total) have not applied for a loan. Most of those who did not approach a bank mentioned being afraid their enter-
6
ADB SME DEVELOPMENTTA
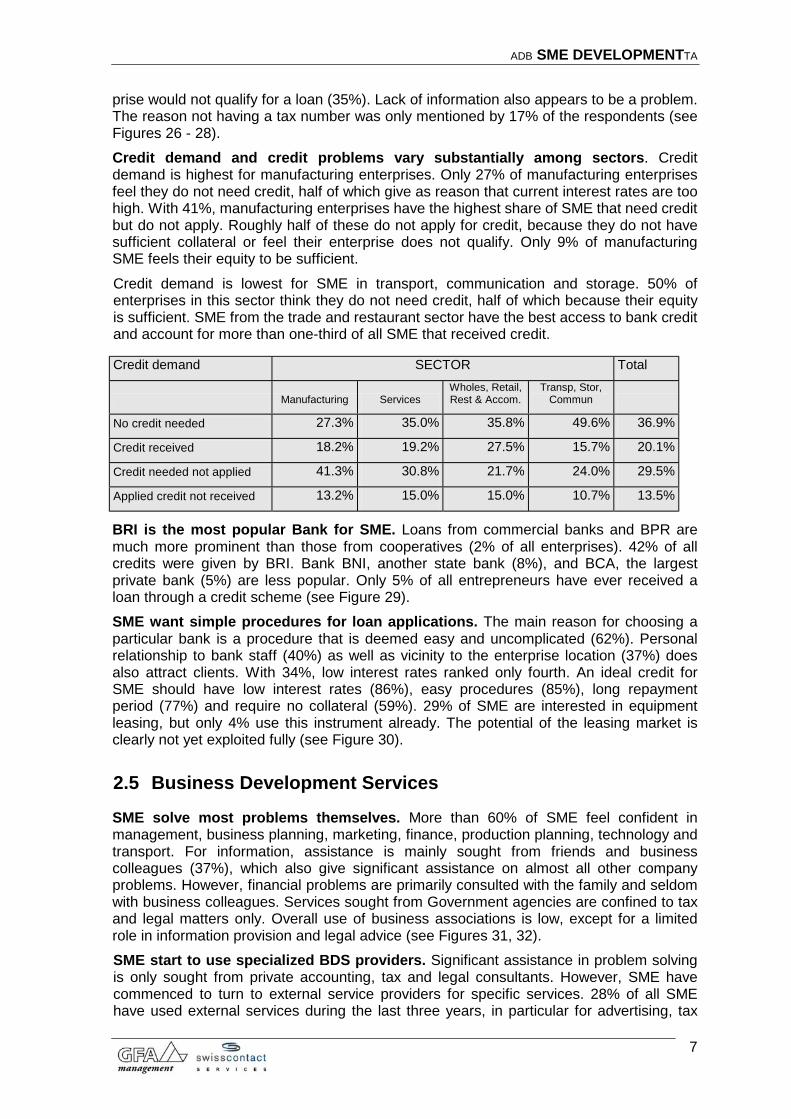
prise would not qualify for a loan (35%). Lack of information also appears to be a problem. The reason not having a tax number was only mentioned by 17% of the respondents (see Figures 26 - 28). Credit demand and credit problems vary substantially among sectors. Credit demand is highest for manufacturing enterprises. Only 27% of manufacturing enterprises feel they do not need credit, half of which give as reason that current interest rates are too high. With 41%, manufacturing enterprises have the highest share of SME that need credit but do not apply. Roughly half of these do not apply for credit, because they do not have sufficient collateral or feel their enterprise does not qualify. Only 9% of manufacturing SME feels their equity to be sufficient. Credit demand is lowest for SME in transport, communication and storage. 50% of enterprises in this sector think they do not need credit, half of which because their equity is sufficient. SME from the trade and restaurant sector have the best access to bank credit and account for more than one-third of all SME that received credit.
Credit demand SECTOR Total
Manufacturing Services Wholes, Retail, Rest & Accom.
Transp, Stor, Commun
No credit needed 27.3% 35.0% 35.8% 49.6% 36.9%
Credit received 18.2% 19.2% 27.5% 15.7% 20.1%
Credit needed not applied 41.3% 30.8% 21.7% 24.0% 29.5%
Applied credit not received 13.2% 15.0% 15.0% 10.7% 13.5%
BRI is the most popular Bank for SME. Loans from commercial banks and BPR are much more prominent than those from cooperatives (2% of all enterprises). 42% of all credits were given by BRI. Bank BNI, another state bank (8%), and BCA, the largest private bank (5%) are less popular. Only 5% of all entrepreneurs have ever received a loan through a credit scheme (see Figure 29). SME want simple procedures for loan applications. The main reason for choosing a particular bank is a procedure that is deemed easy and uncomplicated (62%). Personal relationship to bank staff (40%) as well as vicinity to the enterprise location (37%) does also attract clients. With 34%, low interest rates ranked only fourth. An ideal credit for SME should have low interest rates (86%), easy procedures (85%), long repayment period (77%) and require no collateral (59%). 29% of SME are interested in equipment leasing, but only 4% use this instrument already. The potential of the leasing market is clearly not yet exploited fully (see Figure 30).
2.5 Business Development Services
SME solve most problems themselves. More than 60% of SME feel confident in management, business planning, marketing, finance, production planning, technology and transport. For information, assistance is mainly sought from friends and business colleagues (37%), which also give significant assistance on almost all other company problems. However, financial problems are primarily consulted with the family and seldom with business colleagues. Services sought from Government agencies are confined to tax and legal matters only. Overall use of business associations is low, except for a limited role in information provision and legal advice (see Figures 31, 32). SME start to use specialized BDS providers. Significant assistance in problem solving is only sought from private accounting, tax and legal consultants. However, SME have commenced to turn to external service providers for specific services. 28% of all SME have used external services during the last three years, in particular for advertising, tax
7
ADB SME DEVELOPMENTTA
advice and computer services. Next are management and technical training, legal services and marketing assistance. 93% of survey respondents, however, did not participate in any training during the last three years. Considering the high education of most managers this is not very surprising. Less than 5% of all SME or 15% of SME that sought external professional assistance have used more than two services. Education is the key factor that influences use of external service providers. 60% of users are university graduates; high school graduates account for 31% of BDS users. Relevant other factors are: Company size: Medium-sized companies use slightly more often external service
providers than small companies; in particular for tax and legal advice. Sector: While around one third of SME in services, wholesale, retail, restaurants, and
accommodation use external services, so do only 22% of manufacturing enterprises. SME in the service sector use in particular computer and advertising services. For trade and restaurants, accounting, tax and advertisement services are most important. In the transport and communication sector, tax advice, computer services and management and technical training are most prominent. Manufacturing enterprises in particular lag behind in the use of computer services, accounting and training.
Age of manager and of enterprise: Younger SME owners/managers with an age of up to 35 years use BDS more often than entrepreneurs older than 35 years.
Age of enterprise: The user rate is highest for companies in business between 2 and 5 years. These companies have in particular invested in computer services, information, marketing assistance, management training, and legal and tax advice – in other words: looked for external assistance during the development from micro to small enterprise.
SME are willing to pay for services. Around 25% of all SMEs surveyed, that is 90% of all users, have paid for the external services. 75% of the companies have paid only fairly small fees up to Rp 1 million. However, one quarter of the companies have paid consultant fees in the range of Rp 1 to 10 million, mainly for accounting, legal, taxation and business planning services. The share of companies that are willing to pay for specific services is drastically higher than the share of companies that have actually paid for BDS. Willingness to pay for BDS differs greatly according to the type of services. It is highest for marketing, promotion and financial services. It is lowest for legal services, production advice, computer services and communication and correspondence, i.e. those areas where assistance is primarily sought from friends, business colleagues, the government (legal services) or comes free of charge from technical suppliers (see Figure 33). SME have only insufficient information about existing providers: Only around half of the SME surveyed knew about any advertising firm, marketing and financial consultants, and legal and tax advisers in their city. Only one quarter of SME knew about the existence of consultants on production and operation processes and for business planning. 14% of SME did not know about any external service provider. Knowledge about the existence of services was distinctly higher in Semarang than in Medan. Whether insufficient knowledge relates to a mere lack of information or indicates insufficient service supply remains to be established. In any case, given SMEs' high willingness to pay for BDS it is safe to assume the market for commercial BDS has high growth potential in Medan and Semarang (see Figure 34).
8
ADB SME DEVELOPMENTTA
3 CONCLUSIONS
Results of the survey, which excluded micro enterprises, shed new light on common assumptions about small and medium enterprises:
• SMEs are remarkably dynamic. The majority of managers are young and well educated. Most SME have not been affected negatively by the economic crisis. Their future outlook is extremely optimistic.
• SME do not expect preferential treatment from the government, but rather security of their environment and good governance. There is high acceptance for taxes and public levies, provided payments are reasonable in relation to services received, and funds are managed transparently and contribute to local and regional development.
• Compliance with existing regulations concerning licensing and taxation is not uniform – while some entrepreneurs seem to evade on purpose, others complain on difficult procedures and bureaucratic practice. Although informal levies are not uncommon, the majority of SME are not experiencing major problems when dealing with public officials.
• With respect to Business Development Services, SME confine government's role to information on tax and legal matters. In addition to assistance from friends, business colleagues and the family, SME start using commercial services. Willingness to pay for services is high, but SME have only insufficient information on existing services and providers. The market is still small but has high growth potential.
• While SMEs have a remarkable choice of increasing their investment and working capital with funds from third parties, there is considerable unfulfilled demand for bank loans and leasing services.
• Female-led SME have outperformed many of their male colleagues during the last years. Women entrepreneurs tend to be more realistic, accurate and cautious than their male counterparts. However, even when including the sizeable number of women co-managing their husband's enterprise, women are clearly underrepresented among SME managers and owners.
• Regarding the specific constraints female entrepreneurs face, it becomes obvious that it is not law or regulations, but the underlying cultural values, which mainly contribute to women’s disadvantaged position in SME. Women’s work is invisible; they are facing double and triple burdens, having less access and control over resources and are less involved in decision-making processes.
Regular update on SME and gender development trends is required.
In order to establish a sound basis for policymaking, regular data collection and monitoring of development trends is recommended. Future surveys should clearly distinguish between micro enterprises and SME, and provide gender-disaggregated data, including data on spouses holding management functions in the husband's enterprise. In view of the overall need to streamline and reduce licensing requirements, only basic gender data should be collected during registration. Data is better collected in the framework of specific surveys. Aside from the regular SME surveys carried out by the Indonesian statistical office, gender-specific SME surveys may be carried out in cooperation with business associations.
9
ADB SME DEVELOPMENTTA
4 ANNEX 1: TABLES
Table 1: Manager employed by Years in Business
Manager employed Years in
business No Yes Total
< 2 39 19 58
67% 33% 100%
2 - 5 56 27 83
67% 33% 100%
5 - 10 87 38 125
70% 30% 100%
10 > 149 67 216
69% 31% 100%
Total 331 151 482
69% 31% 100%
Table 2: Age of Manager by Years in Business
Age of Manager Years in
business <30 31-35 36-40 41-45 45-50 51+ Total
< 2 19 18 13 3 2 3 58
33% 31% 22% 5% 3% 5% 100%
2 - 5 30 22 15 9 5 2 83
36% 27% 19% 11% 6% 2% 100%
5 - 10 22 27 31 20 10 15 125
18% 22% 25% 16% 8% 12% 100%
10 > 30 26 35 36 44 45 216
14% 12% 16% 17% 20% 21% 100%
Total 101 93 94 68 61 65 482
21% 19% 20% 14% 13% 13% 100%
Annex 1 - i
ADB SME DEVELOPMENTTA
Table 3: Past Development by Sector
Past Development
SECTOR better no change worse Total
Manufacturing 57 34 30 121
47% 28% 25% 100%
Services 62 37 21 120
52% 31% 17% 100%
Wholes, Retail, Rest & Accom. 56 45 19 120
47% 36% 16% 100%
Transp, Stor, Commun 53 34 34 121
44% 28% 28% 100%
Total 228 150 104 482
47% 31% 22% 100%
Table 4: Future Development by Sector
SECTOR
Future development Manufacturing Services
Wholes, Retail, Rest & Accom.
Transp, Stor, Commun Total
better 70 81 73 64 288
24% 28% 25% 22% 100%
no change 38 33 40 44 155
25% 21% 26% 28% 100%
worse 13 6 7 13 39
33% 15% 18% 33% 100%
Total 121 120 120 121 482
25% 25% 25% 25% 100%
Annex 1 - ii
ADB SME DEVELOPMENTTA
Table 5: Interest in expanding Enterprise by Sector
SECTOR Interest in
expanding business Manufacturing Services
Wholes, Retail, Rest & Accom.
Transp, Stor, Commun Total
Yes 90 91 77 78 336
74% 76% 64% 64%
No 31 29 43 43 146
26% 24% 36% 36%
Total 121 120 120 121 482
100% 100% 100% 100%
Table 6: Past Development by Age of Manager
Past Development Age of Manager Better no change worse Total
<30 49 32 20 101
49% 31% 20% 100%
31-35 52 28 13 93
56% 30% 14% 100%
36-40 58 21 15 94
62% 22% 16% 100%
41-45 26 27 15 68
38% 40% 22% 100%
45-50 23 20 18 61
38% 33% 29% 100%
51+ 20 22 23 65
31% 34% 35% 100%
Total 228 150 104 482
47% 31% 22% 100%
Annex 1 - iii
ADB SME DEVELOPMENTTA
Table 7: Past Development by Education of Manager
Past Development Education of
Manager better no change worse Total
Primary school 29 12 15 56
52% 21% 27% 100%
Secondary school 25 19 21 65
39% 29% 32% 100%
High school degree 83 71 36 190
44% 37% 19% 100%
University degree 91 48 32 171
53% 28% 19% 100%
Total 228 150 104 482
47% 31% 22% 100%
Table 8: Business Licenses
Frequency Percent
No License 124 26%
License Problems 63 13%
No problems, because paid and had contacts 16 3%
No problems, because paid 52 11%
No problems, because had contacts 78 16%
No problems 149 31%
Total 482 100%
Annex 1 - iv
ADB SME DEVELOPMENTTA
Table 9: Tax Payment by Education of Manager
Education of Manager
Taxes Paid Primary school Secondary
school High school
degree University
degree Total
Neither VAT nor income tax 44 41 93 57 235
19% 17% 40% 24% 100%
Income tax, no VAT 4 9 30 25 68
6% 13% 44% 37% 100%
VAT, no income tax 4 4 18 17 43
9% 9% 42% 40% 100%
Income tax and VAT 4 11 49 72 136
3% 8% 36% 53% 100%
Total 56 65 190 171 482
12% 13% 39% 35% 100%
Table 10: Credit Demand by Gender of Manager
Credit demand
Manager by gender
no credit needed credit received
credit needed not applied
applied credit not received Total
male 108 59 94 47 308
35% 19% 31% 15% 100%
female 39 13 22 6 80
49% 16% 28% 8% 100%
couple 31 25 26 12 94
33% 27% 28% 13% 100%
Total 178 97 142 65 482
37% 20% 29% 13% 100%
Annex 1 - v
ADB SME DEVELOPMENTTA
Table 11: Tax Payment by Gender of Manager
Tax payment
Manager by gender Neither VAT nor
income tax Income tax, no
VAT VAT, no income
tax Income tax and
VAT Total
male 156 39 24 89 308
51% 13% 8% 29% 100%
female 32 13 10 25 80
40% 16% 13% 31% 100%
couple 47 16 9 22 94
50% 17% 10% 23% 100%
Total 235 68 43 136 482
49% 14% 9% 28% 100%
Table 12: Number of Employees by Gender of Manager
Employees categorized Manager by gender 5-6 7-9 10-14 15-19 20-25 26+ Total
male 91 70 56 24 38 29 308
30% 23% 18% 8% 12% 9% 100%
female 30 18 11 5 9 7 80
38% 23% 14% 6% 11% 9% 100%
couple 24 23 19 5 7 16 94
26% 24% 20% 5% 7% 17% 100%
Total 145 111 86 34 54 52 482
30% 23% 18% 7% 11% 11% 100%
Annex 1 - vi
ADB SME DEVELOPMENTTA
5 ANNEX 2: FIGURES
Figure 1: Years in Business
ADBSME DEVELOPMENTTA
������������������������������
���������������������������������������������
����������������������������
����������������������������
����������������������������
���������������������������������������������������������������������������
���������������������������������������������������������������������������
��������������������������������������������������������
��������������������������������������������������������
����������������������������������������������������������������������
Years in Business
12 11 12 13 12
17 1220 18 19
2624
28 28 23
45 5340 41 45
TOTAL Manufacturing(n=121)
Services (n=120) Wholesale, RetailRestaurants andAccomodation
(n=120)
Transport, Storage,Communication
(n=121)
< 2 years���
2 - 5 years 5 - 10 years���
10 years >
Figure 2: Development of Enterprise
ADBSME DEVELOPMENTTA
������������������������������������������������������������������������������������������������������������������
����������������������������������������������������������������������������������������������
����������������������������������������������������������������������������������������������������������������������������������������
��������������������������������������������������������������������������������������������������������������������
��������������������������������������������������������������������������������������������������������������
Development of Enterprise
0% 10% 20% 30% 40% 50% 60% 70% 80% 90% 100%
All
Medan
Semarang
Small
Medium
���Improved No change Deteriorated
i
ADB SME DEVELOPMENTTA
Figure 3: Age of Managers
ADBSME DEVELOPMENTTA
�����������������������������������������������������������������������������������������������������������
�������������������������������������������������������������������������������������������������������������������������������������������������������������������������������������������������������������������������������������������������������������������������������������������
����������������������������������������������������������������������������������������������������������������������������������������������������������������������������������������������������������������������������������������������������
Age Groups
0% 5% 10% 15% 20% 25% 30%
< 25
25 - 30
31 - 35
36 - 40
41 - 45
46 - 50
51 - 55
56 >
������Female Male
Figure 4: Education of Managers
ADBSME DEVELOPMENTTA
������������������������
��������������������������������������������������������������
������������������������������������������������������������������������������������������������������������������������������������������������������������������������������������������������������������������������������������
������������������������������������������������������������������������������������������������������������������������������������������������������������������������������
Education
0% 5% 10% 15% 20% 25% 30% 35% 40% 45% 50%
Primary school
Secondary school
High school degree
Academy/Universitydegree
������ Female Male
ii
ADB SME DEVELOPMENTTA
Figure 5: Future Business Development
ADBSME DEVELOPMENTTA
����������������������������������������������������������������������������������������������������������������������������������������������������������������������������������������
�����������������������������������������������������������������������������������������������������������������������������������������������������������������
���������������������������������������������������������������������������������������������������������������������������������������������������������������������������������������������������������������
Future Busines Development
6048
71
3240
24
8 11 5
TOTAL MEDAN (n=238) SEMARANG (n=244)
WillDeteriorateNo Change
���WillImprove
Figure 6: Interest in expanding Business
ADBSME DEVELOPMENTTA
������������������������������������������������������������������������������������������������������������������������������������������������������������������������������������������������������������������������
�����������������������������������������������������������������������������������������������������������������������������������������������������������������
������������������������������������������������������������������������������������������������������������������������������������������������������������������������������������������������������������������������������������������������������������������������
Interest in expanding Business
7055
84
3045
16
TOTAL MEDAN (n=238) SEMARANG (n=244)
NO������ YES
iii
ADB SME DEVELOPMENTTA
Figure 7: Supporting Factors
ADBSME DEVELOPMENTTA
����������������������������������
��������������������������������������������������������������������������������
��������������������������������������������������������������������������������������������������������������������
����������������������������������������������������������������������������������������������������������������������������������������������������������������������������������������������������������������������
����������������������������������������������������������������������������������������
����������������������������������������������������
�����������������������������������������������������������������������
������������������������������������������������������������������������������������������������������������������������������������������������������������������������������������������������������������������������������
Supporting Factors
0 10 20 30 40 50 60 70 80
Development insector/relatedenterprises
Inreased relationswith similarenterprises
Gained new businesspartner
Increased marketdemand
TOTAL������ MEDAN (n=92)
��������SEMARANG (n=136)
Figure 8: Hampering Factors
ADBSME DEVELOPMENTTA
���������������������������������������������������������������������������������������
����������������������������������������������������������������������������������������������������������������������������������������������������������������������
��������������������������������������������������������������������������������������������������������������������������������������������������������������������������������������������������������������������������������
��������������������������������������������������������������������������������������������������������������������������������������������������������������������������������������������������������������������������������������������������������
����������������������������������������������������������������������������������������������������������������������������������������������������������������������������������������
����������������������������������������������������������������������������������������������������������������
��������������������������������������������������������������������������������������������������������������������������������������������������������������������������������������������������������������������������������������������������
������������������������������������������������������������������������������������������������������������������������������������������������������������������������������������������������������������������������������������������
Hampering Factors
0 10 20 30 40 50 60
Political andeconomic instability
Competitionincreases
Prices of rawmaterials increase
Economic crisis
TOTAL����
MEDAN (N=146)���
SEMARANG (N=108)
iv
ADB SME DEVELOPMENTTA
Figure 9: Production for local market
ADBSME DEVELOPMENTTA
����������������
��������������
����������������
��������������
����������������
��������������������������������
������������������������
����������������
��������������������������������
Production for local market
0%
10%
20%
30%
40%
50%
60%
70%
80%
All Small Medium
Perc
enta
ge o
f res
pond
ents
��� 0% ����< 25 % ��� 26 - 50 % 51 - 75 % >76 %
Figure 10: Effects of Decentralization
ADBSME DEVELOPMENTTA
����������������������������������������������������������
���������������������������������������������������������������������������������
��������������������
��������������������������������������������������������������������������������������������������������������������������������������������������������������
2 7
2 5
9
7 6
N o n e
L o c a l T a x e sa n d L e v i e s
w i l li n c r e a s e
Semarang (n=103)
Medan (n=84)���������
����������������
positive
negative
Yes
39 %
No
61 %
��������������������������������������������������������������������������������������������������������������
���������������������������������������������������������������������������������������������������������������������������������������������������������������������������������������������������������������������������������
4 9
6 7N o n e
Effects of Decentralization
v
ADB SME DEVELOPMENTTA
Figure 11: Responsibilities of Government
ADBSME DEVELOPMENTTA
Responsibilities of Gov ernm ent
72
86
75
147
Prov ide special creditschem es
Good gov ernance
Proctect SME fromcom petition
Guarantee Security
Score
Figure 12: Performance of Government
ADBSME DEVELOPMENTTA
������������������������������������������������������������
����������������������������������������������������������
����������������������������������������������������������
�������������������������
��������������������������������������������������������������������
����������������������������������������������������������������
��������������������������������������������������������������������������
��������
������������
������������
�������
����������������
��������������������
��������������������������������
���Bad Very bad
���Good Very good
Guarantee Security
Provide Tax Relief
Provide special credit schemes with subsidized interest rates
Safeguard fair competition among enterprises
Protect SME from competition with big industry
Guarantee a fair legal system
Good Governance
vi
ADB SME DEVELOPMENTTA
Figure 13: Business Licenses
ADBSME DEVELOPMENTTA
����������������������������������������
����������������������������������������������������������������������������������������
����������������������������������������������������������������������������������������
������������������������������������������������
��������������������������������������������������������������������������������������������
����������������������������������������������������������������������������������������������������������������������������������������������������������������������������������������������������������������������������������
R e a s o n w h y n o D iffic u ltie s
0 1 0 2 0 3 0 4 0 5 0 6 0 7 0 8 0 9 0
W illin g to p a yw h a te v e r isr e q u e s te d
K n o w s o m e o n ew ith in th ein s titu tio n
A ll r e q u ir e dd o c u m e n ts
c o m p le te
���M E D A N (n = 1 4 6 )
���S E M A R A N G (n = 1 4 6 ) T O T A L
Figure 14: Difficulties faced
ADBSME DEVELOPMENTTA
����������������������
��������������������������������������������������������������������������������������������������
������������������������������������������������������������������������������������������������������������������������������������������������������
���������������������������������������������������������������������������
������������������������������������������������������������������������������������������������
������������������������������������������������������������������������������������������
�������������������������������������������������������������������������������
�����������������������������������������������������������
������������������������������������������������������������������������������������������������������������������������������������������������������������������������������
������������������������������������������������������������������������������������������������������������������������������������������������������������������������������������������������������������������������������
Difficulties faced
0 10 20 30 40 50 60 70 80 90
Do not knowprocedure
Too manyrequirements
Official fees high
Inofficial fees high
Procedurecomplicated
���MEDAN (n=37)
���SEMARANG (n=26) TOTAL
vii
ADB SME DEVELOPMENTTA
Figure 15: Knowledge of Tax Regulations
ADBSME DEVELOPMENTTA
���������������������������������������������������������������������������������������������������������������������
��������������������������������������������������������������������������������������������������������
���������������������������������������������������������������������������������������������������������������������
�������������������������������������������������������������������������������������������
�������������������������������������������������������������������������������������������
������������������������������������������������������������������������������������
Knowledge of Tax Regulations
6 94
49 4751
39 40 38
6 4 7
TOTAL MEDAN (n=238) SEMARANG (n=244)
Know regulations very well
������ Know regulations sufficiently well���
��� Do not know regulations well Do not know regulations at all
Figure 16: Taxes known
ADBSME DEVELOPMENTTA
���������������������������������������������������������������������������������������������������������������������
�����������������������������������������������������������������
������������������������������������������������������������������������������
�������������������������������������������������������������������������������������������
������������������������������������������������������������
������������������������������������������������������������������������������
Taxes known
90
4957
99
4957
81
4857
Land & Building Tax VAT Income Tax
TOTAL���
MEDAN (n=238)����
SEMARANG (n=244)
viii
ADB SME DEVELOPMENTTA
Figure 17: Taxes paid
ADBSME DEVELOPMENTTA
����������������������������������������������������������������������������������������������������������������������������������
�����������������������������������������������������������������
�����������������������������������������������������������������
������������������������������������������������������������������������������������������������������������������������������
������������������������������������������������������������������������������������
����������������������������������������������������������������������
Taxes paid
84
4237
91
39 36
77
4539
Land and Building Tax Income Tax VAT
TOTAL
������MEDAN
������ SEMA RANG
Figure 18: Reasons for not paying Taxes
ADBSME DEVELOPMENTTA
����������������������������������������������������������������������
���������������������������������������������������������������������������������������������������������������������������������������������������������������������������������������������������������������������������������������������������������������������
���������������������������������������������������������������������������������������������������������������������������������������������������
������������������������������������������������������������������������������������������������������������������������������������������������������������������������������������������������
Reasons for not paying Taxes
20
47
18
45
25
50
Have never beenapproached by tax
authorities
Do not know whichtaxes enterprise
should pay
��������SEMARANG (n=4)��������MEDAN (n=11)
TOTAL (n=15)
ix
ADB SME DEVELOPMENTTA
Figure 19: Opinions about taxes and levies
ADBSME DEVELOPMENTTA
������������������������������������������������������
�����������������������������������
��������������������������������������������������������������������
��������������������������������
������������������������������������
����������������������������
����������������������������������������������������
D isa g re e S tro n g ly d is ag ree���
Ag re e Ag re e fu lly
As long as the amount to be paid is clear I have no objections against any levies
There are too many levies enterprises should not be burdened with
The benefits I get do not match the amount I pay
Levies only benefit other parties
Levies are important for the development of the region
As long as levies are official I am willing to pay
I will pay any levies as long they are not too high
Opinions about local taxes and levies
Figure 20: Known Business Associations
ADBSME DEVELOPMENTTA
������������������������������������������������������������������������������������������
���������������������������������������������������������������
������������������������������������������������������������
���������������������������
���������������������������������������������
����������������������������������������������������������������������������������������������������
���������������������������������������������������������������
������������������������������������
����������������������������������������
���������������������������
Known Business Associations
90
62
3930 30
92
61
47
2637
88
63
32 3423
Cooperatives KADIN HIPMI IWAPI HIPPI
TOTAL������ MEDAN (n=238)
������ SEMARANG (n=244)
x
ADB SME DEVELOPMENTTA
Figure 21: Membership in Business Associations
ADBSME DEVELOPMENTTA
������������������������������������������������������������������������������������������������������������������������������
������������������������������������������
������������������������������
��������������������������������������������������������������������������������������������������
������������������������������������������
����������������������������
Membership in Associations
61
16
5
68
147
54
18
3
Not registered in anyorganization
Cooperative KADIN
TOTAL������ MEDAN (n=238)
�������� SEMARANG (n=244)
Figure 22: Advantage of Membership in Associations
ADBSME DEVELOPMENTTA
������������������������������������������������������������������������������������������������������������������������
������������������������������������������������������������������������������������������������������������������������
���������������������������������������������
����������������������������������������������������������������������������������������������������������������������������������������������������������������
������������������������������������������������������������������������������������������������������������������������������������������������������
������������������������������������������������������������
Advantage of Membership
65 62
16
54 54
13
7267
18
Business relations/friends Information Increased bargainingPower
TOTAL����
MEDAN (n=76)����
SEMARANG (n=113)
xi
ADB SME DEVELOPMENTTA
Figure 23: Representation of SME Interests
ADBSME DEVELOPMENTTA
������������������������������������������������������������������������������������
������������������������������������
����������������������
����������������������������������������������������������������������������������������
���������������������������������������������������������������������������������������������������
������������������������������������������������
������������������������
������������������������������������������������������������������������
Representation of SME Interests
45
156
3738
136
4452
17
5
30
Cooperatives NGOs KADIN None
TOTAL����
MEDAN (n=238)����
SEMARANG (n=244)
Figure 24: Occupation of Spouse
ADBSME DEVELOPMENTTA
�������������������������������������������
��������������������������������������������������������������������
��������������������������������������������������������������������������������������������������������������
����������������������
Occupation of Spouse
0% 10% 20% 30% 40% 50% 60%
Works in same firm
Govt./privateemployee
Trade
Housewife
Other, incl.unemployed/retired
Husbands������ Wives
xii
ADB SME DEVELOPMENTTA
Figure 25: Sources of Finance
ADBSME DEVELOPMENTTA
Sources of Finance
��������������������������������
������������������������������������������������������������������
�����������������������������������
����������������������������������������������������������������������������������������������������������������������������������������������������������������������������������������������������������������
��������������������������������������
����������������������������������������������������������
������������������������������������������������������������������������������
��������������������������������������������������������������������������������������������������������������������������������������������������������������������������������������������������������
0 10 20 30 40 50 60 70 80 90 100
Credit financialinstitution
Family members
Suppliers
Own funds
����SEMARANG (n=244)����MEDAN (n=238)
TOTAL
Figure 26: Credit Demand
ADBSME DEVELOPMENTTA
������
���������������������������������������������������������������������������������
�������������������������������������������������������������������������������������������������������������������������������������������������
Need credit but have not applied
30%
Need credit, applied but did not receive
13%
Have received bank credit
20%
Do not need credit
37%
Credit Demand
xiii
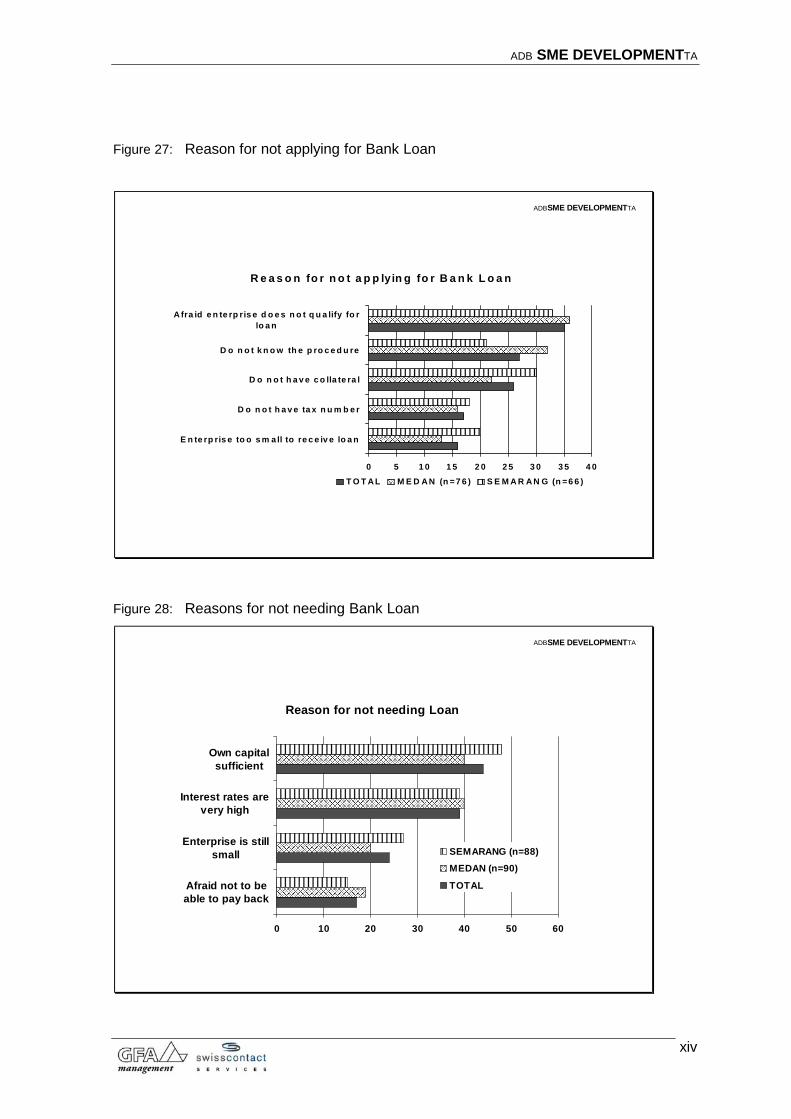
ADB SME DEVELOPMENTTA
Figure 27: Reason for not applying for Bank Loan
ADBSME DEVELOPMENTTA
�����������������������������
������������������������������������
�������������������������������������������������
����������������������������������������������������������������������������������������������������������������������������������������������
����������������������������������������������������������������������������������������������������������������������������������������������������������������
������������������������������������������������������������������������������������������
��������������������������������������������������������������������������������
������������������������������������������������������������������
�����������������������������������������������
�������������������������������������������������������������������������
R e a s o n fo r n o t a p p lyin g fo r B a n k L o a n
0 5 1 0 1 5 2 0 2 5 3 0 3 5 4 0
E n te rp ris e to o s m a ll to re c e iv e lo a n
D o n o t h a v e ta x n u m b e r
D o n o t h a v e c o lla te ra l
D o n o t k n o w th e p ro c e d u re
A fra id e n te rp ris e d o e s n o t q u a lify fo rlo a n
T O T A L����
M E D A N (n =7 6 )���
S E M A R A N G (n =6 6 )
Figure 28: Reasons for not needing Bank Loan
ADBSME DEVELOPMENTTA
������������������������������������������������������������������������
����������������������������������������������������������������������������
��������������������������������������������������������������������������
��������������������������������������������������������������������������
����������������������������
��������������������������������������������������
��������������������������������������������������������������������������������������������������������������������������������������������������
����������������������������������������������������������������������������������������������������������������������������������������������������������������������������������
Reason for not needing Loan
0 10 20 30 40 50 60
Afraid not to beable to pay back
Enterprise is stillsmall
Interest rates arevery high
Own capitalsufficient
���SEMARANG (n=88)���MEDAN (n=90)
TOTAL
xiv
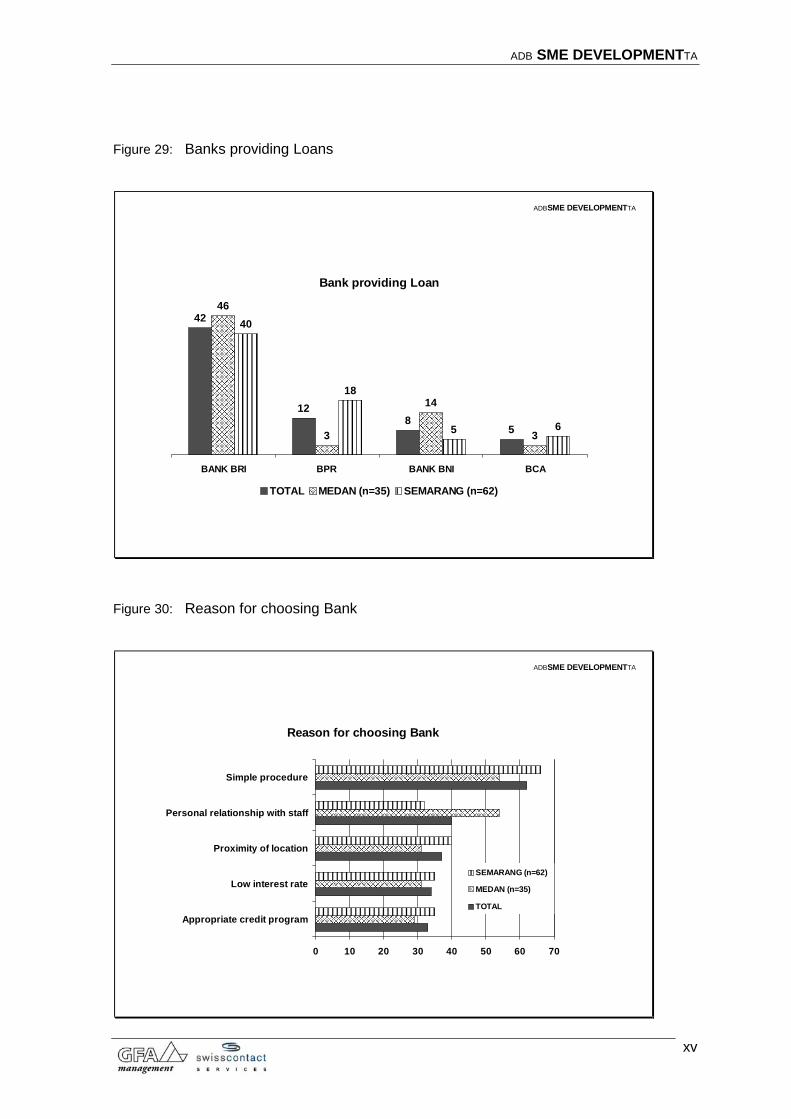
ADB SME DEVELOPMENTTA
Figure 29: Banks providing Loans
ADBSME DEVELOPMENTTA
���������������������������������������������������������������������������������������������������� ����������
���������������������������������������� �����������
���������������������������������������������������������������������������������
����������������������������������������
��������������������
��������������������
Bank providing Loan
42
128
5
46
3
14
3
40
18
5 6
BANK BRI BPR BANK BNI BCA
TOTAL
������ MEDAN (n=35)
������ SEMARANG (n=62)
Figure 30: Reason for choosing Bank
ADBSME DEVELOPMENTTA
��������������������������������������������������������������������������������
������������������������������������������
������������������������������������������
��������������������������������������������������������������������������������������������������������������������������������������������������
�������������������������������������������������������������������������
������������������������������������������������
������������������������������������������������������������������������������������������������
������������������������������������������������������������������������������������������������������������
��������������������������������������������
����������������������������������������������������������������������������������������������������������������������������������������������������������������������������������
Reason for choosing Bank
0 10 20 30 40 50 60 70
Appropriate credit program
Low interest rate
Proximity of location
Personal relationship with staff
Simple procedure
������SEMARANG (n=62)������MEDAN (n=35)
TOTAL
xv
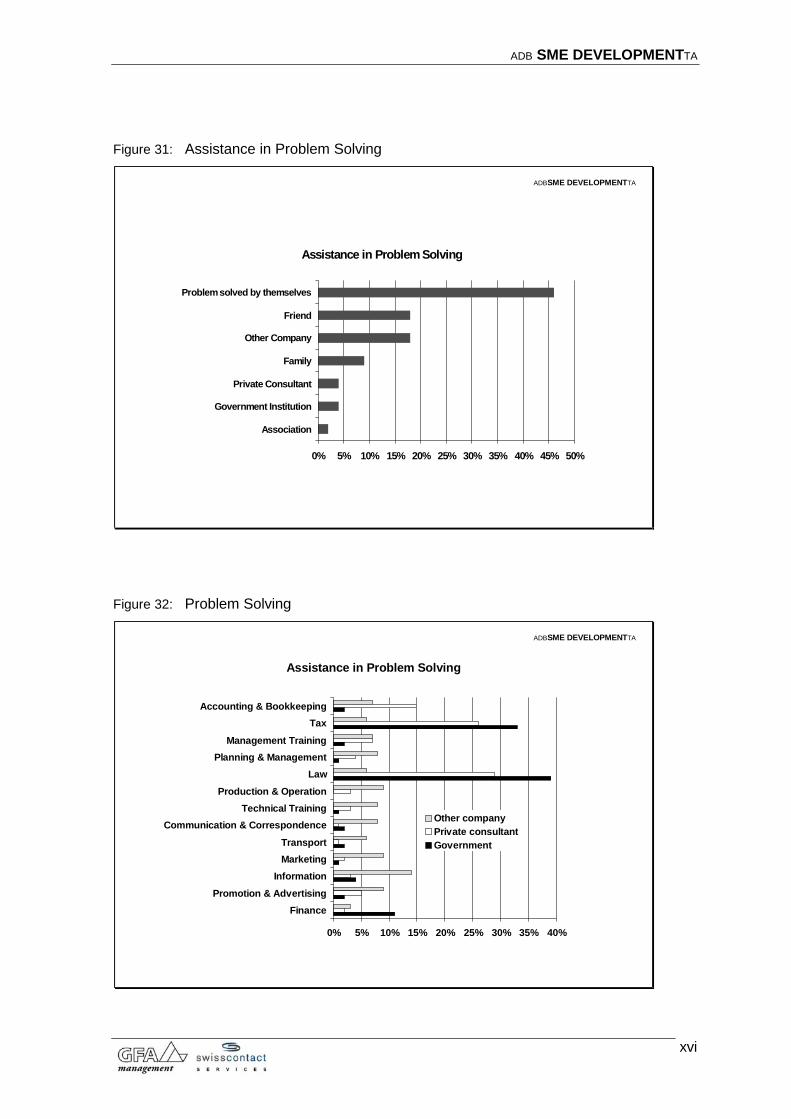
ADB SME DEVELOPMENTTA
Figure 31: Assistance in Problem Solving
ADBSME DEVELOPMENTTA
Assistance in Problem Solving
0% 5% 10% 15% 20% 25% 30% 35% 40% 45% 50%
Problem solved by themselves
Friend
Other Company
Family
Private Consultant
Government Institution
Association
Figure 32: Problem Solving
ADBSME DEVELOPMENTTA
0% 5% 10% 15% 20% 25% 30% 35% 40%
Accounting & BookkeepingTax
Management TrainingPlanning & Management
LawProduction & Operation
Technical TrainingCommunication & Correspondence
TransportMarketing
InformationPromotion & Advertising
Finance
Other companyPrivate consultantGovernment
Assistance in Problem Solving
xvi
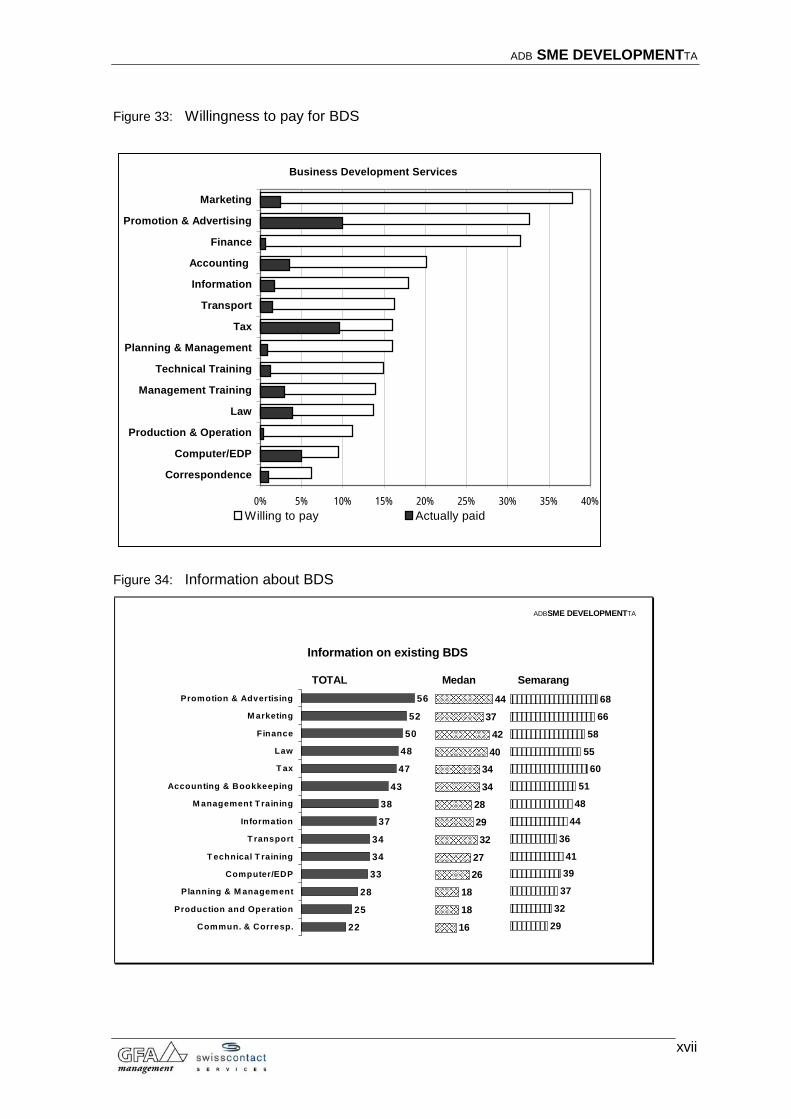
ADB SME DEVELOPMENTTA
Figure 33: Willingness to pay for BDS
Business Development Services
0% 5% 10% 15% 20% 25% 30% 35% 40%
Marketing
Promotion & Advertising
Finance
Accounting
Information
Transport
Tax
Planning & Management
Technical Training
Management Training
Law
Production & Operation
Computer/EDP
Correspondence
Willing to pay Actually paid
Figure 34: Information about BDS
ADBSME DEVELOPMENTTA
Information on existing BDS
22
25
28
33
34
34
37
38
43
47
48
50
52
56
Commun. & Corresp.
Production and Operation
Planning & M anagement
Computer/EDP
T echnical T raining
T ransport
Information
M anagement T raining
Accounting & Bookkeeping
T ax
Law
Finance
M arketing
Promotion & Advertising
�������������������
��������������������
����������������������������
������������������������������
����������������������������������
�������������������������������������������������
������������������������������������
������������������������������������������
��������������������������������������������
����������������������������������������
�����������������������
1618
182627
3229
2834
3440
4237
44
����������������
������������������������������������
����������������������������������������
������������������������������������������
��������������������������������������������
��������������������������������������
����������������������������������������������������������������������������
����������������������������������������������������������������
����������������������������������������������������������
��������������������������������������������������������������
��������������������������������������������������������������������
�����������������������������������
29
32
37
3941
36
44
48
51
6055
58
66
68
TOTAL Medan Semarang
xvii
ADB SME DEVELOPMENTTA
i