Embed Size (px)
Citation preview

SOC101YSOC101Y
Introduction to SociologyIntroduction to SociologyProfessor Adam GreenProfessor Adam Green
Lecture #15Lecture #15Health, Disability & AgingHealth, Disability & Aging
6 Feb 136 Feb 13

Population 65+, Canada, 1851-2050
0
5
10
15
20
25
1851
1871
1891
1911
1931
1951
1971
1991
1997
2001
2011
2025
Year
Per
cen
t

Canadian Age-Sex Pyramid, Canadian Age-Sex Pyramid, 1956-20561956-2056
Pyca2056.exe
You can run this program only if you have downloaded the PowerPoint version of these slides. To run the program, set PowerPoint to “Normal” view, double-click the “Pyca2056.exe” icon above, click “Yes,” and then click “Run.” The program is virus-free. (You must have Adobe Flash installed on your computer to run the program. If you want to download and install Adobe Flash, set PowerPoint to “Slide Show” view and click here for the download file and installation instructions.)

““A Very Short One”A Very Short One”
Jeanne Louise Calment died in 1997 at the age of 122. An interviewerasked her in 1995 what sort of future she expects. “A very short one,” she replied.

32 35 38 41 44 47 50 53 56 59 62 65 68 71 74 77 80 83 86 89
Europe 1600
Lesotho 2009
India 2009
China 2009
Russia 2009 USA 2009
Japan 2009
Canada 2009
Canada 2050
Canada 1867
Life Expectancy, Selected Countries and Life Expectancy, Selected Countries and YearsYears

Social Causes of Illness and Social Causes of Illness and DeathDeath
Human-environmental factors, such as industrial pollution
Lifestyle factors, such as smoking cigarettes, excessive use of alcohol and drugs, poor diet, lack of exercise, and social isolation.
Factors related to public health system (government-run programs that ensure clean drinking water, sewage and sanitation services, inoculation against infectious diseases, etc.) and healthcare system (clinics, hospitals and other facilities)
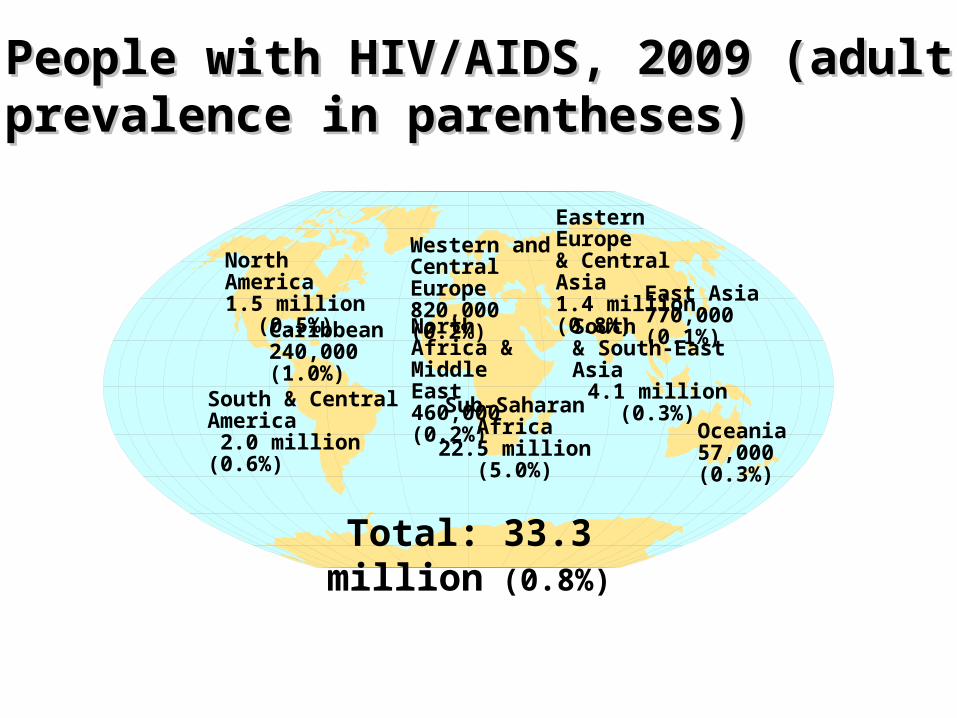
People with HIV/AIDS, 2009 (adult People with HIV/AIDS, 2009 (adult prevalence in parentheses)prevalence in parentheses)
Total: 33.3 million (0.8%)
Western andCentral Europe 820,000 (0.2%)
North Africa & Middle East460,000 (0.2%)
Sub-Saharan Africa22.5 million (5.0%)
Eastern Europe & Central Asia1.4 million (0.8%)
South & South-East Asia
4.1 million (0.3%)
Oceania57,000 (0.3%)
North America1.5 million
(0.5%)Caribbean240,000 (1.0%)
South & Central America 2.0 million (0.6%)
East Asia770,000 (0.1%)

Life expectancy varies positively Life expectancy varies positively with…with… a population’s average wealth
a population’s level of equalityPoor people die younger because Poor people die younger because
of…of… less access to health resources less knowledge about healthy lifestyles less ability to control stressGender inequality in health is due Gender inequality in health is due
to…to… gender bias in medical research gender bias in medical treatment women’s greater longevity women’s greater poverty


Three Sociological LessonsThree Sociological Lessons of of Shallow HalShallow Hal
The human body is not just a biological entity but a social fact because we employ cultural standards to evaluate people’s bodies
Much discrimination takes place against people whose bodies do not conform to cultural ideals
People with disabilities are in fact perfectly normal

Selected Social Causes and Selected Social Causes and Consequences of Height Consequences of Height
in Human Populationsin Human Populations
HeightProximate social causes
diet
disease
work intensity
Basic social causes
income
inequality
public health
personal hygiene
quality of environment
Social consequences
life expectancy
health
cognitive development
personality

Peter Paul RubensPeter Paul RubensCimone and Efigenia Cimone and Efigenia (1617)(1617)

0
10
20
30
40
50
60
70
80
Women Men
JapanS. KoreaFranceItalyCanadaGermanyUKUSA
Percent of Adults Who are Overweight, Selected Countries, 2007
Percent
1.0% increase, 2001-07 2.3% increase, 2001-07
Note: Overweight adults have a Body Mass Index (BMI) of 25 or higher (BMI = weight in kilograms divided by the square of height in metres.)

Height, Weight and Social Height, Weight and Social StatusStatus
On average, high family income results in good diet; good diet increases stature;
tall people live longer, earn more, and reach the top of their profession more quickly than short people;
overweight women complete fewer months of formal education, earn less, and are less likely to marry than women who are not overweight (overweight men are less likely to marry)

Important TermsImportant Terms
impaired = deficient in physical or mental capacity compared to the norms of society
disabled = incapable of performing within the range of “normal” human activity
ablism = prejudice and discrimination against the disabled

Societal Responses to DisabilitySocietal Responses to Disability Rehabilitation involves curing disabilities
through medical and technological intervention; trying to improve the lives of the disabled by means of care, training, and education; and integrating the disabled into "normal" society.
Elimination involves killing the disabled or sterilizing them and preventing them from having offspring.
Normalization involves disabled people asserting their autonomy and the "dignity of difference."