Embed Size (px)
Citation preview

社会生活統計指標 Social Indicators by Prefecture
-都道府県の指標-
2020
Statistics Bureau, Ministry of Internal Affairs and communications
Japan

ま え が き
社会・人口統計体系は,国民生活全般の実態を示す地域別統計データを収集・加工
し,体系的に編成したものです。
本書は,社会・人口統計体系の統計指標の中から都道府県別の主要なものを報告書
に取りまとめたものであり,「Ⅰ 社会生活統計指標」,「Ⅱ 基礎データ」,「Ⅲ 基礎デ
ータの説明」及び「Ⅳ 指標の説明」の4部から構成されています。本書が各種行政施
策,学術研究,地域分析等各方面で広く利用されることを期待します。
なお,本書の他に「統計でみる都道府県のすがた」及び「統計でみる市区町村のす
がた」も刊行しています。これら3部作に掲載されているデータは,過去のデータも
含めて政府統計の総合窓口(e-Stat)からも利用できますので,併せて御活用
いただければ幸いです。
令和2年(2020年)2月
総務省統計局長
佐 伯 修 司

Preface The System of Social and Demographic Statistics of Japan is the systematic compilation of statistical data collected and processed by districts demonstrating the real living conditions of the country’s population. This report presents major social indicators by prefecture derived from the Basic Data compiled under the system. It consists of four parts: “I Social Indicators by Prefecture”, “II Basic Data”, “III Explanation of Terms”, and “IV Explanation of Indicators”.
I hope that this report will be widely used in various fields for administrative policy, academic research, regional analysis etc.
Furthermore, we have also published the "Statistical Observations of Prefectures" and
the "Statistical Observations of Municipalities". All contents of these reports are accessible from the web site of the Statistics Bureau, Ministry of Internal Affairs and Communications or the Portal Site of Official Statistics of Japan (e-Stat).
February 2020
SAIKI Shuji Director-General Statistics Bureau Ministry of Internal Affairs and Communications Japan
本書の概要
総務省統計局では,国際連合が提唱した SSDS(社会及び人口統
計体系)の趣旨に沿って国民の暮らしの種々の側面を体系化し,
それぞれに対応する統計指標群を求め,それら全体によって国民
の暮らしの実態を把握することを目的とした社会・人口統計体系
( 注 )の整備を行っています。
社会・人口統計体系は,1976年度以来,人口・世帯,自然環境,
経済基盤,行政基盤,教育,労働,居住,健康・医療,福祉・社
会保障など国民生活全般の実態を示す地域別統計データを体系
的に編成しているもので,都道府県別及び市区町村別に整備され
ており,言わば国民生活に関する地域別統計データベースの役割
を担っています。データは,各府省庁等から「基礎データ(原数
値)」として収集するとともに,流動性のあるデータと人口や面
積などの地域を示すデータを用いて,地域別の特性を表す「指標
データ」を作成しています。
本書は社会・人口統計体系の基礎データ及び指標データの中か
ら都道府県別の主要なものを抜粋し報告書に取りまとめたもの
です。
(注)総務省統計局で作成する社会・人口統計体系は,国同士
の比較を狙いとする国際連合の SSDSとは,地域別の実態把
握を狙う点で異なります。

Outline of this report
The Statistics Bureau has organised the System of Social and Demographic Statistics of Japan (SSDS)1) for systematizing various views of people’s lives, calculating statistical indicators that correspond to the gist of SSDS suggested by the United Nations (UN), and ascertaining the real lives of the people.
SSDS has been arranged systematically since 1976 with the statistical data which signify the reality of lives in a wide range of fields including Population and Households, Natural Environment, Economic Base, Administrative Base, Education, Labour, Dwelling, Health and Medical Care, Welfare and Social Security and so on. The system serves as, so to speak, a statistical database about the people's lives in each area. The data are collected by prefectures and municipalities as Basic Data, original data, from government organisations and others. We make Social Indicators which show features by region, using fluid data such as population and area.
This report publishes the major data by prefectures which were selected from Basic Data and Social Indicators in SSDS.
1) SSDS organised by the Statistics Bureau is different from that suggested by UN. The Statistics
Bureau’s SSDS aims to ascertain real lives by region, and the other aims to compare aspects between countries.
目 次
Ⅰ 社会生活統計指標
A.人口・世帯 E.教 育
1) 人口分布………………………………………… 2 1) 教育施設………………………………………… 64
2) 人口性比………………………………………… 5 2) 教 員…………………………………………… 68
3) 年齢別構成比…………………………………… 6 3) 生 徒…………………………………………… 68
4) 配偶関係別構成比……………………………… 9 4) 短期大学・大学………………………………… 72
5) 人口動態………………………………………… 15 5) 専修学校・各種学校…………………………… 74
6) 世帯・家族……………………………………… 20 6) 教育普及度……………………………………… 75
7) 婚姻・離婚……………………………………… 23 7) 1人当たりの学校等教育費…………………… 81
B.自然環境 F.労 働
1) 面 積…………………………………………… 24 1) 労働力状態……………………………………… 84
2) 気 象…………………………………………… 26 2) 就業状態………………………………………… 86
3) 就業機会………………………………………… 88
4) 就業異動………………………………………… 93
C.経済基盤 5) 就業条件………………………………………… 95
1) 県民経済計算…………………………………… 30
2) 事業所数………………………………………… 31 G.文化・スポーツ
3) 従業者数………………………………………… 33
4) 産業別生産額等………………………………… 36 1) 社会教育施設…………………………………… 100
5) 物 価…………………………………………… 39 2) 社会教育学級・講座…………………………… 101
3) 文化・娯楽施設………………………………… 102
4) スポーツ施設…………………………………… 103
D.行政基盤 5) 行 動…………………………………………… 104
6) 旅行・宿泊……………………………………… 105
1) 財政力…………………………………………… 46
2) 歳入の財源別構成比…………………………… 48
3) 租 税…………………………………………… 49 H.居 住
4) 目的別支出の構成比…………………………… 51
5) 性質別支出の構成比…………………………… 55 1) 住宅数…………………………………………… 108
6) 住民1人当たり目的別支出…………………… 56 2) 住宅の質………………………………………… 111
7) 児童・生徒1人当たりの教育費の歳出決算額… 61 3) 住宅関係費……………………………………… 115
4) 社会的便益……………………………………… 116
i

Outline of this report
The Statistics Bureau has organised the System of Social and Demographic Statistics of Japan (SSDS)1) for systematizing various views of people’s lives, calculating statistical indicators that correspond to the gist of SSDS suggested by the United Nations (UN), and ascertaining the real lives of the people.
SSDS has been arranged systematically since 1976 with the statistical data which signify the reality of lives in a wide range of fields including Population and Households, Natural Environment, Economic Base, Administrative Base, Education, Labour, Dwelling, Health and Medical Care, Welfare and Social Security and so on. The system serves as, so to speak, a statistical database about the people's lives in each area. The data are collected by prefectures and municipalities as Basic Data, original data, from government organisations and others. We make Social Indicators which show features by region, using fluid data such as population and area.
This report publishes the major data by prefectures which were selected from Basic Data and Social Indicators in SSDS.
1) SSDS organised by the Statistics Bureau is different from that suggested by UN. The Statistics
Bureau’s SSDS aims to ascertain real lives by region, and the other aims to compare aspects between countries.
目 次
Ⅰ 社会生活統計指標
A.人口・世帯 E.教 育
1) 人口分布………………………………………… 2 1) 教育施設………………………………………… 64
2) 人口性比………………………………………… 5 2) 教 員…………………………………………… 68
3) 年齢別構成比…………………………………… 6 3) 生 徒…………………………………………… 68
4) 配偶関係別構成比……………………………… 9 4) 短期大学・大学………………………………… 72
5) 人口動態………………………………………… 15 5) 専修学校・各種学校…………………………… 74
6) 世帯・家族……………………………………… 20 6) 教育普及度……………………………………… 75
7) 婚姻・離婚……………………………………… 23 7) 1人当たりの学校等教育費…………………… 81
B.自然環境 F.労 働
1) 面 積…………………………………………… 24 1) 労働力状態……………………………………… 84
2) 気 象…………………………………………… 26 2) 就業状態………………………………………… 86
3) 就業機会………………………………………… 88
4) 就業異動………………………………………… 93
C.経済基盤 5) 就業条件………………………………………… 95
1) 県民経済計算…………………………………… 30
2) 事業所数………………………………………… 31 G.文化・スポーツ
3) 従業者数………………………………………… 33
4) 産業別生産額等………………………………… 36 1) 社会教育施設…………………………………… 100
5) 物 価…………………………………………… 39 2) 社会教育学級・講座…………………………… 101
3) 文化・娯楽施設………………………………… 102
4) スポーツ施設…………………………………… 103
D.行政基盤 5) 行 動…………………………………………… 104
6) 旅行・宿泊……………………………………… 105
1) 財政力…………………………………………… 46
2) 歳入の財源別構成比…………………………… 48
3) 租 税…………………………………………… 49 H.居 住
4) 目的別支出の構成比…………………………… 51
5) 性質別支出の構成比…………………………… 55 1) 住宅数…………………………………………… 108
6) 住民1人当たり目的別支出…………………… 56 2) 住宅の質………………………………………… 111
7) 児童・生徒1人当たりの教育費の歳出決算額… 61 3) 住宅関係費……………………………………… 115
4) 社会的便益……………………………………… 116
ii

K.安 全
5) 生活利便施設………………………………………118
6) 通 信………………………………………………122 1) 消防施設……………………………………………174
7) 交 通………………………………………………123 2) 消防活動……………………………………………176
8) 市街地の利用状況…………………………………125 3) 火 災………………………………………………176
9) 公 園………………………………………………128 4) 交通安全施設………………………………………179
5) 交通事故・違反……………………………………179
6) 防 犯………………………………………………182
I.健康・医療 7) 犯 罪………………………………………………182
8) 自然災害……………………………………………186
1) 医療施設……………………………………………130 9) 不慮の事故…………………………………………186
2) 医療施設従事者……………………………………132 10) 公 害………………………………………………187
3) 一般病院診療体制充実状況………………………133 11) 保 険………………………………………………187
4) 一般病院に占める公立の割合……………………134
5) 医療施設の地域分布………………………………134
6) 救急活動……………………………………………135 L.家 計
7) 医薬品営業施設……………………………………136
8) 一般病院診療状況…………………………………138 1) 二人以上の世帯の収入・支出……………………192
9) 精神科病院診療状況………………………………139 2) 世帯の資産…………………………………………197
10) り病率・有病率等…………………………………141
11) 死亡率・平均余命…………………………………144
12) 死因別死亡者………………………………………146 M.生活時間
13) 妊産婦・乳児の健康………………………………148
14) 保健活動……………………………………………150 1) 行動別平均時間(週全体平均時間)……………202
15) 児童・生徒の体位…………………………………151 2) 2次活動の種類別平均時間………………………205
3) 3次活動の種類別平均時間………………………206
J.福祉・社会保障
1) 社会保障対象者等…………………………………156
2) 社会福祉施設………………………………………158
3) 社会福祉施設従事者………………………………160
4) 社会福祉施設の定員数及び在所者数……………162
5) 福祉活動……………………………………………164
6) 医療保険……………………………………………166
7) 老人医療……………………………………………169
8) 年 金………………………………………………169
9) 雇用保険……………………………………………170
10) 労働災害……………………………………………171
ⅱ
Ⅱ 基礎データ
A.人口・世帯
5) 義務教育前教育………………………………… 296
1) 人口の規模・構造……………………………… 210 6) 長期欠席者数…………………………………… 297
2) 人口の自然増減………………………………… 223 7) 進学状況………………………………………… 300
3) 人口の社会移動………………………………… 224 8) 最終学歴人口…………………………………… 303
4) 世帯数・一般世帯人員………………………… 226
5) 家族構成………………………………………… 227
6) 婚姻・離婚……………………………………… 231 F.労 働
1) 労働力状態別15歳以上人口 …………………… 306
B.自然環境 2) 就業状態………………………………………… 310
3) 常住地による就業者数………………………… 311
1) 面 積…………………………………………… 232 4) 就業機会………………………………………… 313
5) 卒業者の流動状況……………………………… 319
6) 1年前との就業状態の異動………………………321
C.経済基盤 7) 就業条件………………………………………… 323
1) 県民経済計算…………………………………… 236
2) 事業所数………………………………………… 238 G.文化・スポーツ
3) 従業者数………………………………………… 241
4) 産業別生産額等………………………………… 244 1) 社会教育施設…………………………………… 324
5) 物 価…………………………………………… 249 2) 社会教育学級・講座…………………………… 325
3) 娯楽施設………………………………………… 327
4) スポーツ施設…………………………………… 327
D.行政基盤 5) 旅行・宿泊……………………………………… 329
6) その他…………………………………………… 331
1) 歳入の財源別決算額…………………………… 256
2) 国税徴収………………………………………… 259
3) 目的別歳出決算額……………………………… 260 H.居 住
4) 性質別歳出決算額……………………………… 276
1) 住宅数…………………………………………… 332
2) 住宅の質………………………………………… 337
E.教 育 3) 世帯等…………………………………………… 339
4) 住宅建設費……………………………………… 339
1) 教育施設………………………………………… 278 5) エネルギー……………………………………… 340
2) 学級数…………………………………………… 284 6) 水 道…………………………………………… 341
3) 教員数…………………………………………… 285 7) 下水道…………………………………………… 342
4) 児童・生徒・学生数…………………………… 289 8) し尿処理………………………………………… 343
ⅲii

K.安 全
5) 生活利便施設………………………………………118
6) 通 信………………………………………………122 1) 消防施設……………………………………………174
7) 交 通………………………………………………123 2) 消防活動……………………………………………176
8) 市街地の利用状況…………………………………125 3) 火 災………………………………………………176
9) 公 園………………………………………………128 4) 交通安全施設………………………………………179
5) 交通事故・違反……………………………………179
6) 防 犯………………………………………………182
I.健康・医療 7) 犯 罪………………………………………………182
8) 自然災害……………………………………………186
1) 医療施設……………………………………………130 9) 不慮の事故…………………………………………186
2) 医療施設従事者……………………………………132 10) 公 害………………………………………………187
3) 一般病院診療体制充実状況………………………133 11) 保 険………………………………………………187
4) 一般病院に占める公立の割合……………………134
5) 医療施設の地域分布………………………………134
6) 救急活動……………………………………………135 L.家 計
7) 医薬品営業施設……………………………………136
8) 一般病院診療状況…………………………………138 1) 二人以上の世帯の収入・支出……………………192
9) 精神科病院診療状況………………………………139 2) 世帯の資産…………………………………………197
10) り病率・有病率等…………………………………141
11) 死亡率・平均余命…………………………………144
12) 死因別死亡者………………………………………146 M.生活時間
13) 妊産婦・乳児の健康………………………………148
14) 保健活動……………………………………………150 1) 行動別平均時間(週全体平均時間)……………202
15) 児童・生徒の体位…………………………………151 2) 2次活動の種類別平均時間………………………205
3) 3次活動の種類別平均時間………………………206
J.福祉・社会保障
1) 社会保障対象者等…………………………………156
2) 社会福祉施設………………………………………158
3) 社会福祉施設従事者………………………………160
4) 社会福祉施設の定員数及び在所者数……………162
5) 福祉活動……………………………………………164
6) 医療保険……………………………………………166
7) 老人医療……………………………………………169
8) 年 金………………………………………………169
9) 雇用保険……………………………………………170
10) 労働災害……………………………………………171
ⅱ
Ⅱ 基礎データ
A.人口・世帯
5) 義務教育前教育………………………………… 296
1) 人口の規模・構造……………………………… 210 6) 長期欠席者数…………………………………… 297
2) 人口の自然増減………………………………… 223 7) 進学状況………………………………………… 300
3) 人口の社会移動………………………………… 224 8) 最終学歴人口…………………………………… 303
4) 世帯数・一般世帯人員………………………… 226
5) 家族構成………………………………………… 227
6) 婚姻・離婚……………………………………… 231 F.労 働
1) 労働力状態別15歳以上人口 …………………… 306
B.自然環境 2) 就業状態………………………………………… 310
3) 常住地による就業者数………………………… 311
1) 面 積…………………………………………… 232 4) 就業機会………………………………………… 313
5) 卒業者の流動状況……………………………… 319
6) 1年前との就業状態の異動………………………321
C.経済基盤 7) 就業条件………………………………………… 323
1) 県民経済計算…………………………………… 236
2) 事業所数………………………………………… 238 G.文化・スポーツ
3) 従業者数………………………………………… 241
4) 産業別生産額等………………………………… 244 1) 社会教育施設…………………………………… 324
5) 物 価…………………………………………… 249 2) 社会教育学級・講座…………………………… 325
3) 娯楽施設………………………………………… 327
4) スポーツ施設…………………………………… 327
D.行政基盤 5) 旅行・宿泊……………………………………… 329
6) その他…………………………………………… 331
1) 歳入の財源別決算額…………………………… 256
2) 国税徴収………………………………………… 259
3) 目的別歳出決算額……………………………… 260 H.居 住
4) 性質別歳出決算額……………………………… 276
1) 住宅数…………………………………………… 332
2) 住宅の質………………………………………… 337
E.教 育 3) 世帯等…………………………………………… 339
4) 住宅建設費……………………………………… 339
1) 教育施設………………………………………… 278 5) エネルギー……………………………………… 340
2) 学級数…………………………………………… 284 6) 水 道…………………………………………… 341
3) 教員数…………………………………………… 285 7) 下水道…………………………………………… 342
4) 児童・生徒・学生数…………………………… 289 8) し尿処理………………………………………… 343
ⅲ iii

9) ごみ処理………………………………………… 344 4) 交通安全施設…………………………………… 415
10) 小売店,飲食店………………………………… 346 5) 交通事故・違反………………………………… 415
11) サービス関係店舗……………………………… 349 6) 防 犯…………………………………………… 417
12) 通 信…………………………………………… 351 7) 犯 罪…………………………………………… 418
13) 道 路…………………………………………… 353 8) 自然災害………………………………………… 422
14) 都市計画区域…………………………………… 355 9) 不慮の事故……………………………………… 423
15) 公 園…………………………………………… 358 10) 公 害…………………………………………… 423
11) 保 険…………………………………………… 425
I.健康・医療
L.家 計
1) 医療施設………………………………………… 360
2) 医療施設従事者………………………………… 364 1) 二人以上の世帯の収入・支出………………… 430
3) 救急活動………………………………………… 367 2) 世帯の資産……………………………………… 437
4) 医薬品営業施設………………………………… 369
5) 患 者…………………………………………… 369
6) 死因別死亡者数………………………………… 373
7) 妊産婦・乳児の健康…………………………… 375
8) 保健活動………………………………………… 378
J.福祉・社会保障
1) 社会保障対象者等……………………………… 384
2) 社会福祉施設…………………………………… 387
3) 社会福祉施設従事者,定員及び在所者数…… 391
4) 福祉活動………………………………………… 397
5) 医療保険………………………………………… 400
6) 年 金…………………………………………… 404
7) 雇用保険………………………………………… 405
8) 労働者災害補償保険…………………………… 407
9) 児童福祉………………………………………… 409
K.安 全
1) 消防施設………………………………………… 410
2) 消防活動………………………………………… 412
3) 火 災…………………………………………… 413
ⅳ
Ⅲ 基礎データの説明
データの出典(調査,報告書等)…………………………………………………………………………… 442
A.人口・世帯………………………………………………………………………………………………… 454
B.自然環境…………………………………………………………………………………………………… 457
C.経済基盤…………………………………………………………………………………………………… 458
D.行政基盤…………………………………………………………………………………………………… 461
E.教育………………………………………………………………………………………………………… 464
F.労働………………………………………………………………………………………………………… 467
G.文化・スポーツ…………………………………………………………………………………………… 469
H.居住………………………………………………………………………………………………………… 470
I.健康・医療………………………………………………………………………………………………… 474
J.福祉・社会保障…………………………………………………………………………………………… 477
K.安全………………………………………………………………………………………………………… 480
L.家計………………………………………………………………………………………………………… 483
Ⅳ 指標の説明
A.人口・世帯………………………………………………………………………………………………… 486
B.自然環境…………………………………………………………………………………………………… 487
C.経済基盤…………………………………………………………………………………………………… 488
D.行政基盤…………………………………………………………………………………………………… 490
E.教育………………………………………………………………………………………………………… 491
F.労働………………………………………………………………………………………………………… 492
G.文化・スポーツ…………………………………………………………………………………………… 493
H.居住………………………………………………………………………………………………………… 494
I.健康・医療………………………………………………………………………………………………… 495
J.福祉・社会保障…………………………………………………………………………………………… 496
K.安全………………………………………………………………………………………………………… 497
L.家計………………………………………………………………………………………………………… 498
M.生活時間…………………………………………………………………………………………………… 499
参 考1.社会・人口統計体系の概要……………………………………………………………………………… 501
2.「社会生活統計指標 2020」のデータ掲載変更項目一覧…………………………………………… 505
項目一覧………………………………………………………………………………………………………… 507
ⅴiv
9) ごみ処理………………………………………… 344 4) 交通安全施設…………………………………… 415
10) 小売店,飲食店………………………………… 346 5) 交通事故・違反………………………………… 415
11) サービス関係店舗……………………………… 349 6) 防 犯…………………………………………… 417
12) 通 信…………………………………………… 351 7) 犯 罪…………………………………………… 418
13) 道 路…………………………………………… 353 8) 自然災害………………………………………… 422
14) 都市計画区域…………………………………… 355 9) 不慮の事故……………………………………… 423
15) 公 園…………………………………………… 358 10) 公 害…………………………………………… 423
11) 保 険…………………………………………… 425
I.健康・医療
L.家 計
1) 医療施設………………………………………… 360
2) 医療施設従事者………………………………… 364 1) 二人以上の世帯の収入・支出………………… 430
3) 救急活動………………………………………… 367 2) 世帯の資産……………………………………… 437
4) 医薬品営業施設………………………………… 369
5) 患 者…………………………………………… 369
6) 死因別死亡者数………………………………… 373
7) 妊産婦・乳児の健康…………………………… 375
8) 保健活動………………………………………… 378
J.福祉・社会保障
1) 社会保障対象者等……………………………… 384
2) 社会福祉施設…………………………………… 387
3) 社会福祉施設従事者,定員及び在所者数…… 391
4) 福祉活動………………………………………… 397
5) 医療保険………………………………………… 400
6) 年 金…………………………………………… 404
7) 雇用保険………………………………………… 405
8) 労働者災害補償保険…………………………… 407
9) 児童福祉………………………………………… 409
K.安 全
1) 消防施設………………………………………… 410
2) 消防活動………………………………………… 412
3) 火 災…………………………………………… 413
ⅳ
Ⅲ 基礎データの説明
データの出典(調査,報告書等)…………………………………………………………………………… 442
A.人口・世帯………………………………………………………………………………………………… 454
B.自然環境…………………………………………………………………………………………………… 457
C.経済基盤…………………………………………………………………………………………………… 458
D.行政基盤…………………………………………………………………………………………………… 461
E.教育………………………………………………………………………………………………………… 464
F.労働………………………………………………………………………………………………………… 467
G.文化・スポーツ…………………………………………………………………………………………… 469
H.居住………………………………………………………………………………………………………… 470
I.健康・医療………………………………………………………………………………………………… 474
J.福祉・社会保障…………………………………………………………………………………………… 477
K.安全………………………………………………………………………………………………………… 480
L.家計………………………………………………………………………………………………………… 483
Ⅳ 指標の説明
A.人口・世帯………………………………………………………………………………………………… 486
B.自然環境…………………………………………………………………………………………………… 487
C.経済基盤…………………………………………………………………………………………………… 488
D.行政基盤…………………………………………………………………………………………………… 490
E.教育………………………………………………………………………………………………………… 491
F.労働………………………………………………………………………………………………………… 492
G.文化・スポーツ…………………………………………………………………………………………… 493
H.居住………………………………………………………………………………………………………… 494
I.健康・医療………………………………………………………………………………………………… 495
J.福祉・社会保障…………………………………………………………………………………………… 496
K.安全………………………………………………………………………………………………………… 497
L.家計………………………………………………………………………………………………………… 498
M.生活時間…………………………………………………………………………………………………… 499
参 考1.社会・人口統計体系の概要……………………………………………………………………………… 501
2.「社会生活統計指標 2020」のデータ掲載変更項目一覧…………………………………………… 505
項目一覧………………………………………………………………………………………………………… 507
ⅴ v

Contents
Ⅰ Social Indicators by Prefecture
A. Population and Households 7) Education expenditure per pupil ………………… 61
1) Population distribution …………………………… 2 E. Education2) Population by sex ………………………………… 53) Population by age group ………………………… 6 1) Educational institutions…………………………… 644) Population by marital status……………………… 9 2) Teachers………………………………………… 685) Vital statistics…………………………………… 15 3) Students…………………………………………… 686) Households and families …………………………20 4) Junior colleges, colleges and7) Marriages and divorces………………………… 23 universities……………………………………… 72
5) Speciality schools and miscellaneousB. Natural Environment schools ………………………………………… 74
6) Educational diffusion rates ……………………… 751) Land area ………………………………………..24 7) Education expenditure per pupil …………..…… 812) Climate …………………………………………. 26
F. LabourC. Economic Base
1) Labour force status ……………………………… 841) Prefectural economic accounts ………………… 30 2) Employment status ……………………………… 862) Establishments……………………………………31 3) Opportunity for employment……………………… 883) Persons at work ………………………………… 33 4) Labour turnover ………………………………… 934) Production by industrial sector ………………… 36 5) Employment conditions ………………………… 955) Prices…………………………………………….39
G. Culture and SportsD. Administrative Base
1) Facilities for social education ……………………1001) Financial potential ……………………………... 46 2) Classes of social education and2) Percentage distribution by source of culture ………………………………………… 101
revenue …………………………………………48 3) Facilities for culture and recreation ………………1023) Taxes …………………………………………… 49 4) Sports facilities ……………………………………1034) Percentage distribution of expenditures 5) Activities…………………………………………104
by purpose………………………………………51 6) A travel and stay …………………………………1055) Percentage distribution of expenditures
by function ………………………………………556) Expenditures per capita ………………………… 56
ⅶ

Contents
Ⅰ Social Indicators by Prefecture
A. Population and Households 7) Education expenditure per pupil ………………… 61
1) Population distribution …………………………… 2 E. Education2) Population by sex ………………………………… 53) Population by age group ………………………… 6 1) Educational institutions…………………………… 644) Population by marital status……………………… 9 2) Teachers………………………………………… 685) Vital statistics…………………………………… 15 3) Students…………………………………………… 686) Households and families …………………………20 4) Junior colleges, colleges and7) Marriages and divorces………………………… 23 universities……………………………………… 72
5) Speciality schools and miscellaneousB. Natural Environment schools ………………………………………… 74
6) Educational diffusion rates ……………………… 751) Land area ………………………………………..24 7) Education expenditure per pupil …………..…… 812) Climate …………………………………………. 26
F. LabourC. Economic Base
1) Labour force status ……………………………… 841) Prefectural economic accounts ………………… 30 2) Employment status ……………………………… 862) Establishments……………………………………31 3) Opportunity for employment……………………… 883) Persons at work ………………………………… 33 4) Labour turnover ………………………………… 934) Production by industrial sector ………………… 36 5) Employment conditions ………………………… 955) Prices…………………………………………….39
G. Culture and SportsD. Administrative Base
1) Facilities for social education ……………………1001) Financial potential ……………………………... 46 2) Classes of social education and2) Percentage distribution by source of culture ………………………………………… 101
revenue …………………………………………48 3) Facilities for culture and recreation ………………1023) Taxes …………………………………………… 49 4) Sports facilities ……………………………………1034) Percentage distribution of expenditures 5) Activities…………………………………………104
by purpose………………………………………51 6) A travel and stay …………………………………1055) Percentage distribution of expenditures
by function ………………………………………556) Expenditures per capita ………………………… 56
ⅶvii

H. Dwelling 3) Workers at social welfare facilities………………1604) Capacity and inmates in social
1) Dwellings …………………………………………108 welfare facilities………………………………… 1622) Quality of houses …………………………………111 5) Activities for welfare………………………………1643) Cost relating to housing………………………… 115 6) Medical insurance ……………………………… 1664) Social convenience………………………………116 7) Medical care expenditure for the aged ……………1695) Convenience facilities for daily life ………………118 8) Annuity ………………………………………… 1696) Communications…………………………………122 9) Employment insurance……………………………1707) Traffics……………………………………………123 10) Industrial accidents………………………………1718) Utilization of urbanized areas……………………1259) Public parks………………………………………128 K. Safety
I. Health and Medical Care 1) Fire fighting establishments………………………1742) Fire fighting activities………………………….…176
1) Medical facilities…………………………………130 3) Fires ………………………………………………1762) Persons working at medical 4) Facilities for road traffic safety……………………179
establishments……………………………………132 5) Traffic accidents, traffic violations………………1793) Medical services system in general 6) Crime prevention…………………………………182
hospitals …………………………………………133 7) Crimes……………………………………………1824) Ratio of public hospitals …………………………134 8) Natural disasters …………………………………1865) Regional distribution of medical 9) Accidents …………………………………………186
establishments……………………………………134 10) Pollution …………………………………………1876) Emergency medical services………………………135 11) Insurance …………………………………………1877) Pharmaceutical business facilities…………………1368) Medical treatments in general L. Family Budget
hospitals …………………………………………1389) Medical treatments in mental 1) Family income and expenditure of
hospitals …………………………………………139 two-or-more-person households ……………… 19210) Morbidity rate……………………………………141 2) Household assets…………………………………19711) Mortality and life expectancy ……………………14412) Deaths by causes…………………………………146 M. Daily Time13) Health of pregnant and puerperal women
and infants ………………………………………148 1) Time spent on daily activities14) Public health service activities……………………150 (weekly average) ………………………………20215) Physique of students …………………………… 151 2) Time spent per day in secondary
activities…………………………………………205J. Welfare and Social Security 3) Time spent per day in tertiary
activities…………………………………………2061) Households and persons assisted by
social welfare system ………………………………1562) Social welfare institutions ………………………… 158
ⅷ
Ⅱ Basic Data
A. Population and Households 5) Pre-compulsory education…………………………2966) Long-term absentees …………………………… 297
1) Population structure………………………………210 7) Post-school status of graduates ………………… 3002) Population natural change ……………………… 223 8) Type of last completed3) Migrants by prefecture……………………………224 educational level ……………………………… 3034) Households and private household
members …………………………………………2265) Type of family……………………………………227 F. Labour6) Marriages and divorces……………………………231
1) Population 15 years old and over by labour force status ………………………………306
B. Natural Environment 2) Employment status ………………………………3103) Persons employed in the usual
1) Land area …………………………………………232 residence ……………………………………… 3114) Opportunity for employment………………………3135) Employment status of graduates…………………319
C. Economic Base 6) Labour turnover in the past year…………………3217) Employment conditions …………………………323
1) Prefectural economic accounts ……………………2362) Establishments……………………………………2383) Persons at work ………………………………… 241 G. Culture and Sports4) Production by industrial sector ………………… 2445) Prices………………………………………………249 1) Facilities for social education ……………………324
2) Classes of social education and culture ………………………………………325
D. Administrative Base 3) Facilities for recreation ………………………… 3274) Sports facilities ……………………………………327
1) Annual revenue……………………………………256 5) A travel and stay …………………………………3292) National tax………………………………………259 6) Others…………………………………………… 3313) Settlement of expenditure by purpose……………2604) Settlement of expenditure by function ……………276
H. Dwelling
E. Education 1) Dwellings …………………………………………3322) Quality of houses …………………………………337
1) Educational institutions……………………………278 3) Households………………………………………3392) The number of classes ……………………………284 4) Cost of construction of dwelling…………………3393) The number of teachers……………………………285 5) Energy……………………………………………3404) The number of students …………………………289
ⅸviii

H. Dwelling 3) Workers at social welfare facilities………………1604) Capacity and inmates in social
1) Dwellings …………………………………………108 welfare facilities………………………………… 1622) Quality of houses …………………………………111 5) Activities for welfare………………………………1643) Cost relating to housing………………………… 115 6) Medical insurance ……………………………… 1664) Social convenience………………………………116 7) Medical care expenditure for the aged ……………1695) Convenience facilities for daily life ………………118 8) Annuity ………………………………………… 1696) Communications…………………………………122 9) Employment insurance……………………………1707) Traffics……………………………………………123 10) Industrial accidents………………………………1718) Utilization of urbanized areas……………………1259) Public parks………………………………………128 K. Safety
I. Health and Medical Care 1) Fire fighting establishments………………………1742) Fire fighting activities………………………….…176
1) Medical facilities…………………………………130 3) Fires ………………………………………………1762) Persons working at medical 4) Facilities for road traffic safety……………………179
establishments……………………………………132 5) Traffic accidents, traffic violations………………1793) Medical services system in general 6) Crime prevention…………………………………182
hospitals …………………………………………133 7) Crimes……………………………………………1824) Ratio of public hospitals …………………………134 8) Natural disasters …………………………………1865) Regional distribution of medical 9) Accidents …………………………………………186
establishments……………………………………134 10) Pollution …………………………………………1876) Emergency medical services………………………135 11) Insurance …………………………………………1877) Pharmaceutical business facilities…………………1368) Medical treatments in general L. Family Budget
hospitals …………………………………………1389) Medical treatments in mental 1) Family income and expenditure of
hospitals …………………………………………139 two-or-more-person households ……………… 19210) Morbidity rate……………………………………141 2) Household assets…………………………………19711) Mortality and life expectancy ……………………14412) Deaths by causes…………………………………146 M. Daily Time13) Health of pregnant and puerperal women
and infants ………………………………………148 1) Time spent on daily activities14) Public health service activities……………………150 (weekly average) ………………………………20215) Physique of students …………………………… 151 2) Time spent per day in secondary
activities…………………………………………205J. Welfare and Social Security 3) Time spent per day in tertiary
activities…………………………………………2061) Households and persons assisted by
social welfare system ………………………………1562) Social welfare institutions ………………………… 158
ⅷ
Ⅱ Basic Data
A. Population and Households 5) Pre-compulsory education…………………………2966) Long-term absentees …………………………… 297
1) Population structure………………………………210 7) Post-school status of graduates ………………… 3002) Population natural change ……………………… 223 8) Type of last completed3) Migrants by prefecture……………………………224 educational level ……………………………… 3034) Households and private household
members …………………………………………2265) Type of family……………………………………227 F. Labour6) Marriages and divorces……………………………231
1) Population 15 years old and over by labour force status ………………………………306
B. Natural Environment 2) Employment status ………………………………3103) Persons employed in the usual
1) Land area …………………………………………232 residence ……………………………………… 3114) Opportunity for employment………………………3135) Employment status of graduates…………………319
C. Economic Base 6) Labour turnover in the past year…………………3217) Employment conditions …………………………323
1) Prefectural economic accounts ……………………2362) Establishments……………………………………2383) Persons at work ………………………………… 241 G. Culture and Sports4) Production by industrial sector ………………… 2445) Prices………………………………………………249 1) Facilities for social education ……………………324
2) Classes of social education and culture ………………………………………325
D. Administrative Base 3) Facilities for recreation ………………………… 3274) Sports facilities ……………………………………327
1) Annual revenue……………………………………256 5) A travel and stay …………………………………3292) National tax………………………………………259 6) Others…………………………………………… 3313) Settlement of expenditure by purpose……………2604) Settlement of expenditure by function ……………276
H. Dwelling
E. Education 1) Dwellings …………………………………………3322) Quality of houses …………………………………337
1) Educational institutions……………………………278 3) Households………………………………………3392) The number of classes ……………………………284 4) Cost of construction of dwelling…………………3393) The number of teachers……………………………285 5) Energy……………………………………………3404) The number of students ………………………… 289
ⅸ ix

6) Piped water supply……………………………… 341 K. Safety7) Sewerage…………………………………………3428) Processing of human waste ………………………343 1) Fire fighting establishments………………………4109) Garbage processing………………………………344 2) Fire fighting activities……………………………412
10) A retail store, eating and drinking 3) Fires ………………………………………………413 places……………………………………………346 4) Facilities for road traffic safety……………………415
11) Service establishments……………………………349 5) Traffic accidents, traffic violations ………………41512) Communications…………………………………351 6) Crime prevention…………………………………41713) Roads ……………………………………………353 7) Crimes……………………………………………41814) City planning area……………………………… 355 8) Natural disasters …………………………………42215) Public parks………………………………………358 9) Accidents ……………………………………… 423
10) Pollution …………………………………………423I. Health and Medical Care 11) Insurance …………………………………………425
1) Medical facilities…………………………………3602) Persons working at medical L. Family Budget
establishments……………………………………3643) Emergency medical services………………………367 1) Family income and expenditure of4) Pharmaceutical business facilities…………………369 two-or-more-person households …………………4305) Patients……………………………………………369 2) Household assets…………………………………4376) Deaths by causes…………………………………3737) Health of pregnant and puerperal women
and infants ………………………………………3758) Public health service activities……………………378
J. Welfare and Social Security
1) Households and persons assisted by social welfare system……………………………………384
2) Social welfare institutions ……………………… 3873) Persons engaged, capacity and inmates
in social welfare institutions……………………3914) Activities for welfare…………………………… 3975) Medical insurance ……………………………… 4006) Annuity ………………………………………… 4047) Employment insurance……………………………4058) Workman’s accident compensation
insurance ……………………………………… 4079) Welfare service for children………………………409
ⅹ
AppendixOutline of the System of Social and Demographic Statistics of Japan………………………………………503
ⅺx

6) Piped water supply……………………………… 341 K. Safety7) Sewerage…………………………………………3428) Processing of human waste ………………………343 1) Fire fighting establishments………………………4109) Garbage processing………………………………344 2) Fire fighting activities……………………………412
10) A retail store, eating and drinking 3) Fires ………………………………………………413 places……………………………………………346 4) Facilities for road traffic safety……………………415
11) Service establishments……………………………349 5) Traffic accidents, traffic violations ………………41512) Communications…………………………………351 6) Crime prevention…………………………………41713) Roads ……………………………………………353 7) Crimes……………………………………………41814) City planning area……………………………… 355 8) Natural disasters …………………………………42215) Public parks………………………………………358 9) Accidents ……………………………………… 423
10) Pollution …………………………………………423I. Health and Medical Care 11) Insurance …………………………………………425
1) Medical facilities…………………………………3602) Persons working at medical L. Family Budget
establishments……………………………………3643) Emergency medical services………………………367 1) Family income and expenditure of4) Pharmaceutical business facilities…………………369 two-or-more-person households …………………4305) Patients……………………………………………369 2) Household assets…………………………………4376) Deaths by causes…………………………………3737) Health of pregnant and puerperal women
and infants ………………………………………3758) Public health service activities……………………378
J. Welfare and Social Security
1) Households and persons assisted by social welfare system……………………………………384
2) Social welfare institutions ……………………… 3873) Persons engaged, capacity and inmates
in social welfare institutions……………………3914) Activities for welfare…………………………… 3975) Medical insurance ……………………………… 4006) Annuity ………………………………………… 4047) Employment insurance……………………………4058) Workman’s accident compensation
insurance ……………………………………… 4079) Welfare service for children………………………409
ⅹ
AppendixOutline of the System of Social and Demographic Statistics of Japan………………………………………503
ⅺ xi

Administrative Divisions of Japan
01
02
03
04
05
06
07
08
09
10
11
12
HOKKAIDO
AOMORI-ken
IWATE-ken
MIYAGI-ken
AKITA-ken
YAMAGATA-ken
FUKUSHIMA-ken
IBARAKI-ken
TOCHIGI-ken
GUMMA-ken
SAITAMA-ken
CHIBA-ken
13
14
15
16
17
18
19
20
21
22
23
24
TOKYO-to
KANAGAWA-ken
NIIGATA-ken
TOYAMA-ken
ISHIKAWA-ken
FUKUI-ken
YAMANASHI-ken
NAGANO-ken
GIFU-ken
SHIZUOKA-ken
AICHI-ken
MIE-ken
25
26
27
28
29
30
31
32
33
34
35
36
SHIGA-ken
KYOTO-fu
OSAKA-fu
HYOGO-ken
NARA-ken
WAKAYAMA-ken
TOTTORI-ken
SHIMANE-ken
OKAYAMA-ken
HIROSHIMA-ken
YAMAGUCHI-ken
TOKUSHIMA-ken
37
38
39
40
41
42
43
44
45
46
47
KAGAWA-ken
EHIME-ken
KOCHI-ken
FUKUOKA-ken
SAGA-ken
NAGASAKI-ken
KUMAMOTO-ken
OITA-ken
MIYAZAKI-ken
KAGOSHIMA-ken
OKINAWA-ken
01~47 Prefectures.
ⅻ
HOKKAIDOHOKKAIDO
HONSHUHONSHU
0101
0202
03030505
04040606
07071515
0808
09091010
111112121919
2020
16161717
18182121
2323 22222525
24242929
3030
262628283131
33333434
3232
3535
4040
4141
4242 43434444
4545
4646
4747
3838 39393636
2727
3737
13131414
JAPAN SEA
PACIFIC OCEANSHIKOKUSHIKOKUKYUSHUKYUSHU
利 用 上 の 注 意
1.表中下部の平均値と標準偏差は,各都道府県の指標値の単純平均値と標準偏差である。
2.掲載年度
原則として,2010年度,2015年度及び最新年度の計3年次分とする。
3.年度の表し方
年度(西暦年)は,会計年度(当該年の4月1日~翌年3月31日)を基準にしている。したがって,
掲載データは原則として,表頭年度の会計年度における特定の時点又は期間に係るものである。ただ
し,2会計年度にまたがるデータの場合は,期間の長い方の会計年度のデータとして取り扱ってい
る。
なお,「Ⅱ 基礎データ」については,調査時点又は期間(月日)が同統計表の各項目の下部「時
期」欄に示してある。
4.掲載データ
(1)基礎データは,単位未満を四捨五入することを原則としていること,不詳が含まれているこ
とがあるため,合計の数値と内訳の計とが一致しない場合がある。
(2)社会生活統計指標は,「指標計算式」を用いて算出している。(5.記号「※」を除く。)
ただし,一部については算出に使用する基礎データの違い,原数値を持たないことなどに
より,資料源が公表する割合,率等とは一致しない場合がある。
(3)掲載データを見る際は,出典における用語の定義等も御参照ください。
5.記 号
* : 都道府県庁所在地のデータを掲載していることを示している。
ただし,26~29ページにある気象に関する9項目(#B02101~#B02103,#B02201,
#B02401,#B02402,#B02301,#B02303,#B02304)については,埼玉県は熊谷市,東
京都は千代田区,滋賀県は彦根市における気象台の観測値である。さらに,#B02301
の2018年データについては,千葉県は銚子市,山口県は下関市における気象台の観
測値である。
… : データが得られないもの。
- : 「指標計算式」欄の分母のデータが「0」で計算不能のもの。
X : データが秘匿されていることを示している。
※ : 指標として資料源の指数,率等を直接掲載している。
6.本書に関する問合せ先
総務省統計局統計情報利用推進課社会生活統計指標係
電話 03-5273-1137
7.その他
(1)本書の内容を著作物等に引用(転載)する場合には,必ず本書の書名を次のように明記してく
ださい。
出典 総務省統計局刊行 「社会生活統計指標 2020」
(2)本書のインターネット掲載
「社会生活統計指標」
総務省統計局:https://www.stat.go.jp/data/shihyou/index.html政府統計の総合窓口:https://www.e-stat.go.jp/regional-statistics/ssdsview
xii

利 用 上 の 注 意
1.表中下部の平均値と標準偏差は,各都道府県の指標値の単純平均値と標準偏差である。
2.掲載年度
原則として,2010年度,2015年度及び最新年度の計3年次分とする。
3.年度の表し方
年度(西暦年)は,会計年度(当該年の4月1日~翌年3月31日)を基準にしている。したがって,
掲載データは原則として,表頭年度の会計年度における特定の時点又は期間に係るものである。ただ
し,2会計年度にまたがるデータの場合は,期間の長い方の会計年度のデータとして取り扱ってい
る。
なお,「Ⅱ 基礎データ」については,調査時点又は期間(月日)が同統計表の各項目の下部「時
期」欄に示してある。
4.掲載データ
(1)基礎データは,単位未満を四捨五入することを原則としていること,不詳が含まれているこ
とがあるため,合計の数値と内訳の計とが一致しない場合がある。
(2)社会生活統計指標は,「指標計算式」を用いて算出している。(5.記号「※」を除く。)
ただし,一部については算出に使用する基礎データの違い,原数値を持たないことなどに
より,資料源が公表する割合,率等とは一致しない場合がある。
(3)掲載データを見る際は,出典における用語の定義等も御参照ください。
5.記 号
* : 都道府県庁所在地のデータを掲載していることを示している。
ただし,26~29ページにある気象に関する9項目(#B02101~#B02103,#B02201,
#B02401,#B02402,#B02301,#B02303,#B02304)については,埼玉県は熊谷市,東
京都は千代田区,滋賀県は彦根市における気象台の観測値である。さらに,#B02301
の2018年データについては,千葉県は銚子市,山口県は下関市における気象台の観
測値である。
… : データが得られないもの。
- : 「指標計算式」欄の分母のデータが「0」で計算不能のもの。
X : データが秘匿されていることを示している。
※ : 指標として資料源の指数,率等を直接掲載している。
6.本書に関する問合せ先
総務省統計局統計情報利用推進課社会生活統計指標係
電話 03-5273-1137
7.その他
(1)本書の内容を著作物等に引用(転載)する場合には,必ず本書の書名を次のように明記してく
ださい。
出典 総務省統計局刊行 「社会生活統計指標 2020」
(2)本書のインターネット掲載
「社会生活統計指標」
総務省統計局:https://www.stat.go.jp/data/shihyou/index.html政府統計の総合窓口:https://www.e-stat.go.jp/regional-statistics/ssdsview

Notes
1. Means and standard deviations are the simple arithmetic means of the prefectural indicators and their standard
deviations. 2. Presented fiscal years
In principle, data are presented for three Japanese fiscal years: 2010, 2015 and the latest one. 3. Time span
The time span is based on the Japanese fiscal year, i.e. from 1 April to 31 March. Therefore, data on the book refer to the period or date of the fiscal year indicated at the top of the relevant table. Data for which the period extends over two fiscal years are assumed to belong to the fiscal year that occupies a longer period than the other. Each of the times of basic data are shown at the bottom of the tables of “II Basic Data.”
4. Data (1) Basic data figures may not add up to the totals due to rounding or in case of including data not available. (2) The Social Indicators by Prefecture are calculated according to “Formulae of indicators.” (5. The 「※」
symbol is excluded.) However, a part of the indicator is not necessarily equal to the ratios, the rates, etc. of the published original source, because of differences in using basic data for calculation, absence of the original figures, etc.
(3) Please refer to the explanation of terms with that of the source books in using data. 5. Symbols
* : Data refer to the cities with prefectural governments. However, for the nine items in pages 26 to 29 (Climate; #B02101–#B02103,#B02201,#B02401,#B02402,#B02301,#B02303,#B02304), Kumagaya-shi observations are used for Saitama-ken, Chiyoda-ku for Tokyo-to, and Hikone-shi for Shiga-ken. Furthermore, in regard to #B02301 in 2018, Choshi-shi is for Chiba-ken, and Shimonoseki-shi is for Yamaguchi-ken.
… : Not available - : Not applicable (Denominator is 0) X : Figures kept undisclosed ※ : Original data quoted from the source books (indices, rates, etc.) without any calculation.
6. For further information Statistics Information Utilization Promotion Division, Statistics Bureau, Ministry of Internal Affairs and Communications, Japan; Telephone: +81-3-5273-1137 (Direct)
7. Others (1) When any contents of the present issue are to be quoted or copied in other media (print or electronic), the
title is to be referred to as follows: Source: Social Indicators by Prefecture 2020, published by the Statistics Bureau, Ministry of Internal Affairs and Communications, Japan.
(2) Contents of the present issue published online at: Statistics Bureau, Ministry of Internal Affairs and Communications, Japan:
https://www.stat.go.jp/english/data/shihyou/index.html Portal Site of Official Statistics of Japan (e-Stat):
https://www.e-stat.go.jp/en/regional-statistics/ssdsview
Ⅰ 社会生活統計指標
Social Indicators by Prefecture
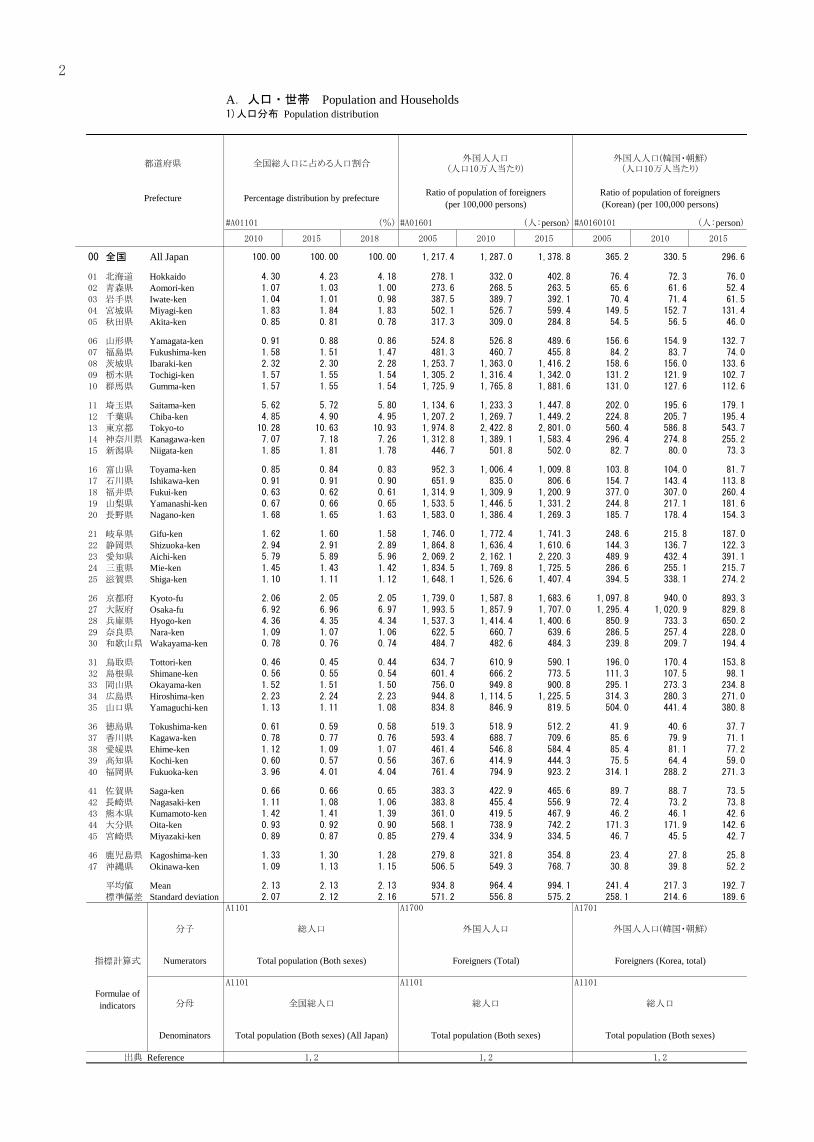
A.人口・世帯 Population and Households1)人口分布 Population distribution
都道府県 全国総人口に占める人口割合外国人人口
(人口10万人当たり)外国人人口(韓国・朝鮮)(人口10万人当たり)
外国人人口(中国)(人口10万人当たり)
Prefecture Percentage distribution by prefecture Ratio of population of foreigners(per 100,000 persons)
Ratio of population of foreigners(Korean) (per 100,000 persons)
(%) (人:person (人:person
全国 All Japan
北海道 Hokkaido青森県 Aomori-ken岩手県 Iwate-ken宮城県 Miyagi-ken秋田県 Akita-ken
山形県 Yamagata-ken福島県 Fukushima-ken茨城県 Ibaraki-ken栃木県 Tochigi-ken群馬県 Gumma-ken
埼玉県 Saitama-ken千葉県 Chiba-ken東京都 Tokyo-to神奈川県 Kanagawa-ken新潟県 Niigata-ken
富山県 Toyama-ken石川県 Ishikawa-ken福井県 Fukui-ken山梨県 Yamanashi-ken長野県 Nagano-ken
岐阜県 Gifu-ken静岡県 Shizuoka-ken愛知県 Aichi-ken三重県 Mie-ken滋賀県 Shiga-ken
京都府 Kyoto-fu大阪府 Osaka-fu兵庫県 Hyogo-ken奈良県 Nara-ken和歌山県 Wakayama-ken
鳥取県 Tottori-ken島根県 Shimane-ken岡山県 Okayama-ken広島県 Hiroshima-ken山口県 Yamaguchi-ken
徳島県 Tokushima-ken香川県 Kagawa-ken愛媛県 Ehime-ken高知県 Kochi-ken福岡県 Fukuoka-ken
佐賀県 Saga-ken長崎県 Nagasaki-ken熊本県 Kumamoto-ken大分県 Oita-ken宮崎県 Miyazaki-ken
鹿児島県 Kagoshima-ken沖縄県 Okinawa-ken
平均値 Mean標準偏差 Standard deviation
分子 総人口 外国人人口 外国人人口(韓国・朝鮮) 外国人人口(中国)
指標計算式 Numerators Total population (Both sexes) Foreigners (Total) Foreigners (Korea, total) Foreigners (China, total)
Formulae ofindicators 分母 全国総人口 総人口 総人口 総人口
Denominators Total population (Both sexes) (All Japan) Total population (Both sexes) Total population (Both sexes) Total population (Both sexes)
出典 Reference
外国人人口(中国)(人口10万人当たり)
外国人人口(アメリカ)(人口10万人当たり)
総面積1k㎡当たり人口密度
Ratio of population of foreigners(Chinese) (per 100,000 persons)
Ratio of population of foreigners(American) (per 100,000 persons) Population per 1 k㎡ of total land area
(人:person (人:person (人:personPref.Code
MeanS.D.
外国人人口(中国) 外国人人口(アメリカ) 総人口 分子
Foreigners (China, total) Foreigners (USA, total) Total population (Both sexes) 指標計算式
総人口 総人口 総面積(北方地域及び竹島を除く) 分母
Total population (Both sexes) Total population (Both sexes) Total land area (Excl. the northern territories andTakeshima)
出典
都道府県コー
ド
2

A.人口・世帯 Population and Households1)人口分布 Population distribution
都道府県 全国総人口に占める人口割合外国人人口
(人口10万人当たり)外国人人口(韓国・朝鮮)(人口10万人当たり)
外国人人口(中国)(人口10万人当たり)
Prefecture Percentage distribution by prefecture Ratio of population of foreigners(per 100,000 persons)
Ratio of population of foreigners(Korean) (per 100,000 persons)
(%) (人:person (人:person
全国 All Japan
北海道 Hokkaido青森県 Aomori-ken岩手県 Iwate-ken宮城県 Miyagi-ken秋田県 Akita-ken
山形県 Yamagata-ken福島県 Fukushima-ken茨城県 Ibaraki-ken栃木県 Tochigi-ken群馬県 Gumma-ken
埼玉県 Saitama-ken千葉県 Chiba-ken東京都 Tokyo-to神奈川県 Kanagawa-ken新潟県 Niigata-ken
富山県 Toyama-ken石川県 Ishikawa-ken福井県 Fukui-ken山梨県 Yamanashi-ken長野県 Nagano-ken
岐阜県 Gifu-ken静岡県 Shizuoka-ken愛知県 Aichi-ken三重県 Mie-ken滋賀県 Shiga-ken
京都府 Kyoto-fu大阪府 Osaka-fu兵庫県 Hyogo-ken奈良県 Nara-ken和歌山県 Wakayama-ken
鳥取県 Tottori-ken島根県 Shimane-ken岡山県 Okayama-ken広島県 Hiroshima-ken山口県 Yamaguchi-ken
徳島県 Tokushima-ken香川県 Kagawa-ken愛媛県 Ehime-ken高知県 Kochi-ken福岡県 Fukuoka-ken
佐賀県 Saga-ken長崎県 Nagasaki-ken熊本県 Kumamoto-ken大分県 Oita-ken宮崎県 Miyazaki-ken
鹿児島県 Kagoshima-ken沖縄県 Okinawa-ken
平均値 Mean標準偏差 Standard deviation
分子 総人口 外国人人口 外国人人口(韓国・朝鮮) 外国人人口(中国)
指標計算式 Numerators Total population (Both sexes) Foreigners (Total) Foreigners (Korea, total) Foreigners (China, total)
Formulae ofindicators 分母 全国総人口 総人口 総人口 総人口
Denominators Total population (Both sexes) (All Japan) Total population (Both sexes) Total population (Both sexes) Total population (Both sexes)
出典 Reference
外国人人口(中国)(人口10万人当たり)
外国人人口(アメリカ)(人口10万人当たり)
総面積1k㎡当たり人口密度
Ratio of population of foreigners(Chinese) (per 100,000 persons)
Ratio of population of foreigners(American) (per 100,000 persons) Population per 1 k㎡ of total land area
(人:person (人:person (人:personPref.Code
MeanS.D.
外国人人口(中国) 外国人人口(アメリカ) 総人口 分子
Foreigners (China, total) Foreigners (USA, total) Total population (Both sexes) 指標計算式
総人口 総人口 総面積(北方地域及び竹島を除く) 分母
Total population (Both sexes) Total population (Both sexes) Total land area (Excl. the northern territories andTakeshima)
出典
都道府県コー
ド
3
A
人口・世帯
(指標)

都道府県 可住地面積1k㎡当たり人口密度 昼夜間人口比率 人口集中地区人口比率 人口集中地区面積比率
Prefecture Population per 1 k㎡ of inhabitable area Rate of day to night population Ratio of DIDs(Densely Inhabited Districts) population
Ratio of DIDs area
(人:person (%) (%)
全国 All Japan
北海道 Hokkaido青森県 Aomori-ken岩手県 Iwate-ken宮城県 Miyagi-ken秋田県 Akita-ken
山形県 Yamagata-ken福島県 Fukushima-ken茨城県 Ibaraki-ken栃木県 Tochigi-ken群馬県 Gumma-ken
埼玉県 Saitama-ken千葉県 Chiba-ken東京都 Tokyo-to神奈川県 Kanagawa-ken新潟県 Niigata-ken
富山県 Toyama-ken石川県 Ishikawa-ken福井県 Fukui-ken山梨県 Yamanashi-ken長野県 Nagano-ken
岐阜県 Gifu-ken静岡県 Shizuoka-ken愛知県 Aichi-ken三重県 Mie-ken滋賀県 Shiga-ken
京都府 Kyoto-fu大阪府 Osaka-fu兵庫県 Hyogo-ken奈良県 Nara-ken和歌山県 Wakayama-ken
鳥取県 Tottori-ken島根県 Shimane-ken岡山県 Okayama-ken広島県 Hiroshima-ken山口県 Yamaguchi-ken
徳島県 Tokushima-ken香川県 Kagawa-ken愛媛県 Ehime-ken高知県 Kochi-ken福岡県 Fukuoka-ken
佐賀県 Saga-ken長崎県 Nagasaki-ken熊本県 Kumamoto-ken大分県 Oita-ken宮崎県 Miyazaki-ken
鹿児島県 Kagoshima-ken沖縄県 Okinawa-ken
平均値 Mean標準偏差 Standard deviation
※
分子 総人口 人口集中地区人口 人口集中地区面積
指標計算式 Numerators Total population (Both sexes) 昼夜間人口比率 2) Densely inhabited districts population Densely inhabited districts area
Formulae ofindicators 分母 可住地面積 1) Rate of day to night population 2) 総人口 可住地面積 1)
Denominators Inhabitable area 1) Total population (Both sexes) Inhabitable area
出典 Reference1)可住地面積は総務省統計局にて算出している。
“Inhabitable area” is calculated by Statistics Bureau, Ministry of Internal Affairs and Communications, Japan.2)2005年は年齢不詳除く。
For 2005, persons who were enumerated as “Age not reported” are excluded.
2)人口性比 Population by sex
人口集中地区面積比率 人口性比(総数) 人口性比(15歳未満人口)
Ratio of DIDs area Population by sex (all ages) Population by sex (under15 years old)
(%)Pref.Code
MeanS.D.
人口集中地区面積 総人口(男)×100 15歳未満人口(男)×100 分子
Densely inhabited districts area Total population (male)×100 Population (under 15, male)×100 指標計算式
可住地面積 1) 総人口(女) 15歳未満人口(女) 分母
Inhabitable area Total population (female) Population (under 15, female)
出典
都道府県コー
ド
4

都道府県 可住地面積1k㎡当たり人口密度 昼夜間人口比率 人口集中地区人口比率 人口集中地区面積比率
Prefecture Population per 1 k㎡ of inhabitable area Rate of day to night population Ratio of DIDs(Densely Inhabited Districts) population
Ratio of DIDs area
(人:person (%) (%)
全国 All Japan
北海道 Hokkaido青森県 Aomori-ken岩手県 Iwate-ken宮城県 Miyagi-ken秋田県 Akita-ken
山形県 Yamagata-ken福島県 Fukushima-ken茨城県 Ibaraki-ken栃木県 Tochigi-ken群馬県 Gumma-ken
埼玉県 Saitama-ken千葉県 Chiba-ken東京都 Tokyo-to神奈川県 Kanagawa-ken新潟県 Niigata-ken
富山県 Toyama-ken石川県 Ishikawa-ken福井県 Fukui-ken山梨県 Yamanashi-ken長野県 Nagano-ken
岐阜県 Gifu-ken静岡県 Shizuoka-ken愛知県 Aichi-ken三重県 Mie-ken滋賀県 Shiga-ken
京都府 Kyoto-fu大阪府 Osaka-fu兵庫県 Hyogo-ken奈良県 Nara-ken和歌山県 Wakayama-ken
鳥取県 Tottori-ken島根県 Shimane-ken岡山県 Okayama-ken広島県 Hiroshima-ken山口県 Yamaguchi-ken
徳島県 Tokushima-ken香川県 Kagawa-ken愛媛県 Ehime-ken高知県 Kochi-ken福岡県 Fukuoka-ken
佐賀県 Saga-ken長崎県 Nagasaki-ken熊本県 Kumamoto-ken大分県 Oita-ken宮崎県 Miyazaki-ken
鹿児島県 Kagoshima-ken沖縄県 Okinawa-ken
平均値 Mean標準偏差 Standard deviation
※
分子 総人口 人口集中地区人口 人口集中地区面積
指標計算式 Numerators Total population (Both sexes) 昼夜間人口比率 2) Densely inhabited districts population Densely inhabited districts area
Formulae ofindicators 分母 可住地面積 1) Rate of day to night population 2) 総人口 可住地面積 1)
Denominators Inhabitable area 1) Total population (Both sexes) Inhabitable area
出典 Reference1)可住地面積は総務省統計局にて算出している。
“Inhabitable area” is calculated by Statistics Bureau, Ministry of Internal Affairs and Communications, Japan.2)2005年は年齢不詳除く。
For 2005, persons who were enumerated as “Age not reported” are excluded.
2)人口性比 Population by sex
人口集中地区面積比率 人口性比(総数) 人口性比(15歳未満人口)
Ratio of DIDs area Population by sex (all ages) Population by sex (under15 years old)
(%)Pref.Code
MeanS.D.
人口集中地区面積 総人口(男)×100 15歳未満人口(男)×100 分子
Densely inhabited districts area Total population (male)×100 Population (under 15, male)×100 指標計算式
可住地面積 1) 総人口(女) 15歳未満人口(女) 分母
Inhabitable area Total population (female) Population (under 15, female)
出典
都道府県コー
ド
5

3)年齢別構成比
Population by age group
都道府県 人口性比(15~64歳人口) 人口性比(65歳以上人口) 15歳未満人口割合 15~64歳人口割合
Prefecture Population by sex (15-64 years old) Population by sex (65 years old and over) Ratio of population (under15 years old) Ratio of population (15-64 years old)
(%)
全国 All Japan
北海道 Hokkaido青森県 Aomori-ken岩手県 Iwate-ken宮城県 Miyagi-ken秋田県 Akita-ken
山形県 Yamagata-ken福島県 Fukushima-ken茨城県 Ibaraki-ken栃木県 Tochigi-ken群馬県 Gumma-ken
埼玉県 Saitama-ken千葉県 Chiba-ken東京都 Tokyo-to神奈川県 Kanagawa-ken新潟県 Niigata-ken
富山県 Toyama-ken石川県 Ishikawa-ken福井県 Fukui-ken山梨県 Yamanashi-ken長野県 Nagano-ken
岐阜県 Gifu-ken静岡県 Shizuoka-ken愛知県 Aichi-ken三重県 Mie-ken滋賀県 Shiga-ken
京都府 Kyoto-fu大阪府 Osaka-fu兵庫県 Hyogo-ken奈良県 Nara-ken和歌山県 Wakayama-ken
鳥取県 Tottori-ken島根県 Shimane-ken岡山県 Okayama-ken広島県 Hiroshima-ken山口県 Yamaguchi-ken
徳島県 Tokushima-ken香川県 Kagawa-ken愛媛県 Ehime-ken高知県 Kochi-ken福岡県 Fukuoka-ken
佐賀県 Saga-ken長崎県 Nagasaki-ken熊本県 Kumamoto-ken大分県 Oita-ken宮崎県 Miyazaki-ken
鹿児島県 Kagoshima-ken沖縄県 Okinawa-ken
平均値 Mean標準偏差 Standard deviation
※
分子 15~64歳人口(男)×100 65歳以上人口(男)×100
指標計算式 Numerators Population (15-64, male)×100 Population (65 and over, male)×100 15歳未満人口割合 15~64歳人口割合
Formulae ofindicators 分母 15~64歳人口(女) 65歳以上人口(女)
Percentage distribution of totalpopulation (under15) Percentage distribution of total population (15-64)
Denominators Population (15-64, female) Population (65 and over, female)
出典 Reference
15~64歳人口割合 65歳以上人口割合 年少人口指数
Ratio of population (15-64 years old) Ratio of population (65 years old and over) Ratio of juvenile population
(%) (%)Pref.Code
MeanS.D.
※ ※
15歳未満人口×100 分子
15~64歳人口割合 Total population (under 15)×100 指標計算式
Percentage distribution of total population (15-64) Percentage distribution of totalpopulation (65 and over) 15~64歳人口 分母
Total population (15-64)
出典
都道府県コー
ド
65歳以上人口割合
6

3)年齢別構成比
Population by age group
都道府県 人口性比(15~64歳人口) 人口性比(65歳以上人口) 15歳未満人口割合 15~64歳人口割合
Prefecture Population by sex (15-64 years old) Population by sex (65 years old and over) Ratio of population (under15 years old) Ratio of population (15-64 years old)
(%)
全国 All Japan
北海道 Hokkaido青森県 Aomori-ken岩手県 Iwate-ken宮城県 Miyagi-ken秋田県 Akita-ken
山形県 Yamagata-ken福島県 Fukushima-ken茨城県 Ibaraki-ken栃木県 Tochigi-ken群馬県 Gumma-ken
埼玉県 Saitama-ken千葉県 Chiba-ken東京都 Tokyo-to神奈川県 Kanagawa-ken新潟県 Niigata-ken
富山県 Toyama-ken石川県 Ishikawa-ken福井県 Fukui-ken山梨県 Yamanashi-ken長野県 Nagano-ken
岐阜県 Gifu-ken静岡県 Shizuoka-ken愛知県 Aichi-ken三重県 Mie-ken滋賀県 Shiga-ken
京都府 Kyoto-fu大阪府 Osaka-fu兵庫県 Hyogo-ken奈良県 Nara-ken和歌山県 Wakayama-ken
鳥取県 Tottori-ken島根県 Shimane-ken岡山県 Okayama-ken広島県 Hiroshima-ken山口県 Yamaguchi-ken
徳島県 Tokushima-ken香川県 Kagawa-ken愛媛県 Ehime-ken高知県 Kochi-ken福岡県 Fukuoka-ken
佐賀県 Saga-ken長崎県 Nagasaki-ken熊本県 Kumamoto-ken大分県 Oita-ken宮崎県 Miyazaki-ken
鹿児島県 Kagoshima-ken沖縄県 Okinawa-ken
平均値 Mean標準偏差 Standard deviation
※
分子 15~64歳人口(男)×100 65歳以上人口(男)×100
指標計算式 Numerators Population (15-64, male)×100 Population (65 and over, male)×100 15歳未満人口割合 15~64歳人口割合
Formulae ofindicators 分母 15~64歳人口(女) 65歳以上人口(女)
Percentage distribution of totalpopulation (under15) Percentage distribution of total population (15-64)
Denominators Population (15-64, female) Population (65 and over, female)
出典 Reference
15~64歳人口割合 65歳以上人口割合 年少人口指数
Ratio of population (15-64 years old) Ratio of population (65 years old and over) Ratio of juvenile population
(%) (%)Pref.Code
MeanS.D.
※ ※
15歳未満人口×100 分子
15~64歳人口割合 Total population (under 15)×100 指標計算式
Percentage distribution of total population (15-64) Percentage distribution of totalpopulation (65 and over) 15~64歳人口 分母
Total population (15-64)
出典
都道府県コー
ド
65歳以上人口割合
7

都道府県 老年人口指数 従属人口指数 老年化指数 未婚者割合(20~24歳・男)
Prefecture Ratio of aged population Ratio of dependent population Aging index
全国 All Japan
北海道 Hokkaido青森県 Aomori-ken岩手県 Iwate-ken宮城県 Miyagi-ken秋田県 Akita-ken
山形県 Yamagata-ken福島県 Fukushima-ken茨城県 Ibaraki-ken栃木県 Tochigi-ken群馬県 Gamma-ken
埼玉県 Saitama-ken千葉県 Chiba-ken東京都 Tokyo-to神奈川県 Kanagawa-ken新潟県 Niigata-ken
富山県 Toyama-ken石川県 Ishikawa-ken福井県 Fukui-ken山梨県 Yamanashi-ken長野県 Nagano-ken
岐阜県 Gifu-ken静岡県 Shizuoka-ken愛知県 Aichi-ken三重県 Mie-ken滋賀県 Shiga-ken
京都府 Kyoto-fu大阪府 Osaka-fu兵庫県 Hyogo-ken奈良県 Nara-ken和歌山県 Wakayama-ken
鳥取県 Tottori-ken島根県 Shimane-ken岡山県 Okayama-ken広島県 Hiroshima-ken山口県 Yamaguchi-ken
徳島県 Tokushima-ken香川県 Kagawa-ken愛媛県 Ehime-ken高知県 Kochi-ken福岡県 Fukuoka-ken
佐賀県 Saga-ken長崎県 Nagasaki-ken熊本県 Kumamoto-ken大分県 Oita-ken宮崎県 Miyazaki-ken
鹿児島県 Kagoshima-ken沖縄県 Okinawa-ken
平均値 Mean標準偏差 Standard deviation
分子 65歳以上人口×100 (15歳未満人口+65歳以上人口)×100 65歳以上人口×100 未婚人口(20~24歳)(男)
指標計算式 Numerators Total population (65 and over) × 100 Total population (under 15) +Total population (65 and over) × 100 Total population (65 and over) ×100 Never-married population (20-24, male)
Formulae ofindicators 分母 15~64歳人口 15~64歳人口 15歳未満人口 20~24歳人口(男)
Denominators Total population (15-64) Total population (15-64) Total population (under 15) Population (20-24, male)
出典 Reference
4)配偶関係別構成比 Population by marital status
未婚者割合(20~24歳・男) 未婚者割合(20~24歳・女) 未婚者割合(25~29歳・男)
Ratio of never-married population(20-24 years old, male)
Ratio of never-married population(20-24 years old, female)
Ratio of never-married population(25-29 years old, male)
(%) (%) (%)Pref.Code
MeanS.D.
未婚人口(20~24歳)(男) 未婚人口(20~24歳)(女) 未婚人口(25~29歳)(男) 分子
Never-married population (20-24, male) Never-married population (20-24, female) Never-married population (25-29, male) 指標計算式
20~24歳人口(男) 20~24歳人口(女) 25~29歳人口(男) 分母
Population (20-24, male) Population (20-24, female) Population (25-29, male)
出典
都道府県コー
ド
8

都道府県 老年人口指数 従属人口指数 老年化指数 未婚者割合(20~24歳・男)
Prefecture Ratio of aged population Ratio of dependent population Aging index
全国 All Japan
北海道 Hokkaido青森県 Aomori-ken岩手県 Iwate-ken宮城県 Miyagi-ken秋田県 Akita-ken
山形県 Yamagata-ken福島県 Fukushima-ken茨城県 Ibaraki-ken栃木県 Tochigi-ken群馬県 Gamma-ken
埼玉県 Saitama-ken千葉県 Chiba-ken東京都 Tokyo-to神奈川県 Kanagawa-ken新潟県 Niigata-ken
富山県 Toyama-ken石川県 Ishikawa-ken福井県 Fukui-ken山梨県 Yamanashi-ken長野県 Nagano-ken
岐阜県 Gifu-ken静岡県 Shizuoka-ken愛知県 Aichi-ken三重県 Mie-ken滋賀県 Shiga-ken
京都府 Kyoto-fu大阪府 Osaka-fu兵庫県 Hyogo-ken奈良県 Nara-ken和歌山県 Wakayama-ken
鳥取県 Tottori-ken島根県 Shimane-ken岡山県 Okayama-ken広島県 Hiroshima-ken山口県 Yamaguchi-ken
徳島県 Tokushima-ken香川県 Kagawa-ken愛媛県 Ehime-ken高知県 Kochi-ken福岡県 Fukuoka-ken
佐賀県 Saga-ken長崎県 Nagasaki-ken熊本県 Kumamoto-ken大分県 Oita-ken宮崎県 Miyazaki-ken
鹿児島県 Kagoshima-ken沖縄県 Okinawa-ken
平均値 Mean標準偏差 Standard deviation
分子 65歳以上人口×100 (15歳未満人口+65歳以上人口)×100 65歳以上人口×100 未婚人口(20~24歳)(男)
指標計算式 Numerators Total population (65 and over) × 100 Total population (under 15) +Total population (65 and over) × 100 Total population (65 and over) ×100 Never-married population (20-24, male)
Formulae ofindicators 分母 15~64歳人口 15~64歳人口 15歳未満人口 20~24歳人口(男)
Denominators Total population (15-64) Total population (15-64) Total population (under 15) Population (20-24, male)
出典 Reference
4)配偶関係別構成比 Population by marital status
未婚者割合(20~24歳・男) 未婚者割合(20~24歳・女) 未婚者割合(25~29歳・男)
Ratio of never-married population(20-24 years old, male)
Ratio of never-married population(20-24 years old, female)
Ratio of never-married population(25-29 years old, male)
(%) (%) (%)Pref.Code
MeanS.D.
未婚人口(20~24歳)(男) 未婚人口(20~24歳)(女) 未婚人口(25~29歳)(男) 分子
Never-married population (20-24, male) Never-married population (20-24, female) Never-married population (25-29, male) 指標計算式
20~24歳人口(男) 20~24歳人口(女) 25~29歳人口(男) 分母
Population (20-24, male) Population (20-24, female) Population (25-29, male)
出典
都道府県コー
ド
9

都道府県 未婚者割合(25~29歳・女) 未婚者割合(30~34歳・男) 未婚者割合(30~34歳・女) 未婚者割合(35~39歳・男)
Prefecture Ratio of never-married population(25-29 years old, female)
Ratio of never-married population(30-34 years old, male)
Ratio of never-married population(30-34 years old, female)
(%) (%) (%)
全国 All Japan
北海道 Hokkaido青森県 Aomori-ken岩手県 Iwate-ken宮城県 Miyagi-ken秋田県 Akita-ken
山形県 Yamagata-ken福島県 Fukushima-ken茨城県 Ibaraki-ken栃木県 Tochigi-ken群馬県 Gamma-ken
埼玉県 Saitama-ken千葉県 Chiba-ken東京都 Tokyo-to神奈川県 Kanagawa-ken新潟県 Niigata-ken
富山県 Toyama-ken石川県 Ishikawa-ken福井県 Fukui-ken山梨県 Yamanashi-ken長野県 Nagano-ken
岐阜県 Gifu-ken静岡県 Shizuoka-ken愛知県 Aichi-ken三重県 Mie-ken滋賀県 Shiga-ken
京都府 Kyoto-fu大阪府 Osaka-fu兵庫県 Hyogo-ken奈良県 Nara-ken和歌山県 Wakayama-ken
鳥取県 Tottori-ken島根県 Shimane-ken岡山県 Okayama-ken広島県 Hiroshima-ken山口県 Yamaguchi-ken
徳島県 Tokushima-ken香川県 Kagawa-ken愛媛県 Ehime-ken高知県 Kochi-ken福岡県 Fukuoka-ken
佐賀県 Saga-ken長崎県 Nagasaki-ken熊本県 Kumamoto-ken大分県 Oita-ken宮崎県 Miyazaki-ken
鹿児島県 Kagoshima-ken沖縄県 Okinawa-ken
平均値 Mean標準偏差 Standard deviation
分子 未婚人口(25~29歳)(女) 未婚人口(30~34歳)(男) 未婚人口(30~34歳)(女) 未婚人口(35~39歳)(男)
指標計算式 Numerators Never-married population (25-29, female) Never-married population (30-34, female) Never-married population (35-39, male)
Formulae ofindicators 分母 25~29歳人口(女) 30~34歳人口(男) 30~34歳人口(女) 35~39歳人口(男)
Denominators Population (25-29, female) Population (30-34, male) Population (30-34, female) Population (35-39, male)
出典 Reference
Never-married population (30-34, male)
未婚者割合(35~39歳・男) 未婚者割合(35~39歳・女) 未婚者割合(40~44歳・男)
Ratio of never-married population(35-39 years old, male)
Ratio of never-married population(35-39 years old, female)
Ratio of never-married population(40-44 years old, male)
(%) (%) (%)Pref.Code
MeanS.D.
未婚人口(35~39歳)(男) 未婚人口(35~39歳)(女) 未婚人口(40~44歳)(男) 分子
Never-married population (35-39, male) Never-married population (35-39, female) Never-married population (40-44, male) 指標計算式
35~39歳人口(男) 35~39歳人口(女) 40~44歳人口(男) 分母
Population (35-39, male) Population (35-39, female) Population (40-44, male)
出典
都道府県コー
ド
10

都道府県 未婚者割合(25~29歳・女) 未婚者割合(30~34歳・男) 未婚者割合(30~34歳・女) 未婚者割合(35~39歳・男)
Prefecture Ratio of never-married population(25-29 years old, female)
Ratio of never-married population(30-34 years old, male)
Ratio of never-married population(30-34 years old, female)
(%) (%) (%)
全国 All Japan
北海道 Hokkaido青森県 Aomori-ken岩手県 Iwate-ken宮城県 Miyagi-ken秋田県 Akita-ken
山形県 Yamagata-ken福島県 Fukushima-ken茨城県 Ibaraki-ken栃木県 Tochigi-ken群馬県 Gamma-ken
埼玉県 Saitama-ken千葉県 Chiba-ken東京都 Tokyo-to神奈川県 Kanagawa-ken新潟県 Niigata-ken
富山県 Toyama-ken石川県 Ishikawa-ken福井県 Fukui-ken山梨県 Yamanashi-ken長野県 Nagano-ken
岐阜県 Gifu-ken静岡県 Shizuoka-ken愛知県 Aichi-ken三重県 Mie-ken滋賀県 Shiga-ken
京都府 Kyoto-fu大阪府 Osaka-fu兵庫県 Hyogo-ken奈良県 Nara-ken和歌山県 Wakayama-ken
鳥取県 Tottori-ken島根県 Shimane-ken岡山県 Okayama-ken広島県 Hiroshima-ken山口県 Yamaguchi-ken
徳島県 Tokushima-ken香川県 Kagawa-ken愛媛県 Ehime-ken高知県 Kochi-ken福岡県 Fukuoka-ken
佐賀県 Saga-ken長崎県 Nagasaki-ken熊本県 Kumamoto-ken大分県 Oita-ken宮崎県 Miyazaki-ken
鹿児島県 Kagoshima-ken沖縄県 Okinawa-ken
平均値 Mean標準偏差 Standard deviation
分子 未婚人口(25~29歳)(女) 未婚人口(30~34歳)(男) 未婚人口(30~34歳)(女) 未婚人口(35~39歳)(男)
指標計算式 Numerators Never-married population (25-29, female) Never-married population (30-34, female) Never-married population (35-39, male)
Formulae ofindicators 分母 25~29歳人口(女) 30~34歳人口(男) 30~34歳人口(女) 35~39歳人口(男)
Denominators Population (25-29, female) Population (30-34, male) Population (30-34, female) Population (35-39, male)
出典 Reference
Never-married population (30-34, male)
未婚者割合(35~39歳・男) 未婚者割合(35~39歳・女) 未婚者割合(40~44歳・男)
Ratio of never-married population(35-39 years old, male)
Ratio of never-married population(35-39 years old, female)
Ratio of never-married population(40-44 years old, male)
(%) (%) (%)Pref.Code
MeanS.D.
未婚人口(35~39歳)(男) 未婚人口(35~39歳)(女) 未婚人口(40~44歳)(男) 分子
Never-married population (35-39, male) Never-married population (35-39, female) Never-married population (40-44, male) 指標計算式
35~39歳人口(男) 35~39歳人口(女) 40~44歳人口(男) 分母
Population (35-39, male) Population (35-39, female) Population (40-44, male)
出典
都道府県コー
ド
11

都道府県 未婚者割合(40~44歳・女) 未婚者割合(45~49歳・男) 未婚者割合(45~49歳・女) 死別者割合(60歳以上・男)
Prefecture Ratio of never-married population(40-44 years old, female)
Ratio of never-married population(45-49 years old, male)
Ratio of never-married population(45-49 years old, female)
(%) (%) (%)
全国 All Japan
北海道 Hokkaido青森県 Aomori-ken岩手県 Iwate-ken宮城県 Miyagi-ken秋田県 Akita-ken
山形県 Yamagata-ken福島県 Fukushima-ken茨城県 Ibaraki-ken栃木県 Tochigi-ken群馬県 Gumma-ken
埼玉県 Saitama-ken千葉県 Chiba-ken東京都 Tokyo-to神奈川県 Kanagawa-ken新潟県 Niigata-ken
富山県 Toyama-ken石川県 Ishikawa-ken福井県 Fukui-ken山梨県 Yamanashi-ken長野県 Nagano-ken
岐阜県 Gifu-ken静岡県 Shizuoka-ken愛知県 Aichi-ken三重県 Mie-ken滋賀県 Shiga-ken
京都府 Kyoto-fu大阪府 Osaka-fu兵庫県 Hyogo-ken奈良県 Nara-ken和歌山県 Wakayama-ken
鳥取県 Tottori-ken島根県 Shimane-ken岡山県 Okayama-ken広島県 Hiroshima-ken山口県 Yamaguchi-ken
徳島県 Tokushima-ken香川県 Kagawa-ken愛媛県 Ehime-ken高知県 Kochi-ken福岡県 Fukuoka-ken
佐賀県 Saga-ken長崎県 Nagasaki-ken熊本県 Kumamoto-ken大分県 Oita-ken宮崎県 Miyazaki-ken
鹿児島県 Kagoshima-ken沖縄県 Okinawa-ken
平均値 Mean標準偏差 Standard deviation
分子 未婚人口(40~44歳)(女) 未婚人口(45~49歳)(男) 未婚人口(45~49歳)(女) 死別人口60歳以上(男)
指標計算式 Numerators Never-married population (40-44, female) Never-married population (45-49, male) Never-married population (45-49, female) Widowed population (60 and over, male)
Formulae ofindicators 分母 40~44歳人口(女) 45~49歳人口(男) 45~49歳人口(女) 60歳以上人口(男)
Denominators Population (40-44, female) Population (45-49, male) Population (45-49, female) Population (60 and over, male)
出典 Reference
死別者割合(60歳以上・男) 死別者割合(60歳以上・女) 離別者割合(40~49歳・男)
Ratio of widowed population(60 years old and over, male)
Ratio of widowed population(60 years old and over, female)
Ratio of divorced population(40-49 years old, male)
(%) (%) (%)Pref.Code
MeanS.D.
A1603101~A1603151 A1603102~A1603152
死別人口60歳以上(男) 死別人口60歳以上(女) 離別人口40~49歳(男) 分子
Widowed population (60 and over, male) Widowed population (60 and over, female) Divorced population (40-49, male) 指標計算式
60歳以上人口(男) 60歳以上人口(女) 40~49歳人口(男) 分母
Population (60 and over, male) Population (60 and over, female) Population (40-49, male)
出典
都道府県コー
ド
12

都道府県 未婚者割合(40~44歳・女) 未婚者割合(45~49歳・男) 未婚者割合(45~49歳・女) 死別者割合(60歳以上・男)
Prefecture Ratio of never-married population(40-44 years old, female)
Ratio of never-married population(45-49 years old, male)
Ratio of never-married population(45-49 years old, female)
(%) (%) (%)
全国 All Japan
北海道 Hokkaido青森県 Aomori-ken岩手県 Iwate-ken宮城県 Miyagi-ken秋田県 Akita-ken
山形県 Yamagata-ken福島県 Fukushima-ken茨城県 Ibaraki-ken栃木県 Tochigi-ken群馬県 Gumma-ken
埼玉県 Saitama-ken千葉県 Chiba-ken東京都 Tokyo-to神奈川県 Kanagawa-ken新潟県 Niigata-ken
富山県 Toyama-ken石川県 Ishikawa-ken福井県 Fukui-ken山梨県 Yamanashi-ken長野県 Nagano-ken
岐阜県 Gifu-ken静岡県 Shizuoka-ken愛知県 Aichi-ken三重県 Mie-ken滋賀県 Shiga-ken
京都府 Kyoto-fu大阪府 Osaka-fu兵庫県 Hyogo-ken奈良県 Nara-ken和歌山県 Wakayama-ken
鳥取県 Tottori-ken島根県 Shimane-ken岡山県 Okayama-ken広島県 Hiroshima-ken山口県 Yamaguchi-ken
徳島県 Tokushima-ken香川県 Kagawa-ken愛媛県 Ehime-ken高知県 Kochi-ken福岡県 Fukuoka-ken
佐賀県 Saga-ken長崎県 Nagasaki-ken熊本県 Kumamoto-ken大分県 Oita-ken宮崎県 Miyazaki-ken
鹿児島県 Kagoshima-ken沖縄県 Okinawa-ken
平均値 Mean標準偏差 Standard deviation
分子 未婚人口(40~44歳)(女) 未婚人口(45~49歳)(男) 未婚人口(45~49歳)(女) 死別人口60歳以上(男)
指標計算式 Numerators Never-married population (40-44, female) Never-married population (45-49, male) Never-married population (45-49, female) Widowed population (60 and over, male)
Formulae ofindicators 分母 40~44歳人口(女) 45~49歳人口(男) 45~49歳人口(女) 60歳以上人口(男)
Denominators Population (40-44, female) Population (45-49, male) Population (45-49, female) Population (60 and over, male)
出典 Reference
死別者割合(60歳以上・男) 死別者割合(60歳以上・女) 離別者割合(40~49歳・男)
Ratio of widowed population(60 years old and over, male)
Ratio of widowed population(60 years old and over, female)
Ratio of divorced population(40-49 years old, male)
(%) (%) (%)Pref.Code
MeanS.D.
A1603101~A1603151 A1603102~A1603152
死別人口60歳以上(男) 死別人口60歳以上(女) 離別人口40~49歳(男) 分子
Widowed population (60 and over, male) Widowed population (60 and over, female) Divorced population (40-49, male) 指標計算式
60歳以上人口(男) 60歳以上人口(女) 40~49歳人口(男) 分母
Population (60 and over, male) Population (60 and over, female) Population (40-49, male)
出典
都道府県コー
ド
13

都道府県 離別者割合(40~49歳・女) 離別者割合(50~59歳・男) 離別者割合(50~59歳・女) 人口増減率
Prefecture Ratio of divorced population(40-49 years old, female)
Ratio of divorced population(50-59 years old, male)
Ratio of divorced population(50-59 years old, female)
Rates of population change
(%) (%) (%)
全国 All Japan
北海道 Hokkaido青森県 Aomori-ken岩手県 Iwate-ken宮城県 Miyagi-ken秋田県 Akita-ken
山形県 Yamagata-ken福島県 Fukushima-ken茨城県 Ibaraki-ken栃木県 Tochigi-ken群馬県 Gumma-ken
埼玉県 Saitama-ken千葉県 Chiba-ken東京都 Tokyo-to神奈川県 Kanagawa-ken新潟県 Niigata-ken
富山県 Toyama-ken石川県 Ishikawa-ken福井県 Fukui-ken山梨県 Yamanashi-ken長野県 Nagano-ken
岐阜県 Gifu-ken静岡県 Shizuoka-ken愛知県 Aichi-ken三重県 Mie-ken滋賀県 Shiga-ken
京都府 Kyoto-fu大阪府 Osaka-fu兵庫県 Hyogo-ken奈良県 Nara-ken和歌山県 Wakayama-ken
鳥取県 Tottori-ken島根県 Shimane-ken岡山県 Okayama-ken広島県 Hiroshima-ken山口県 Yamaguchi-ken
徳島県 Tokushima-ken香川県 Kagawa-ken愛媛県 Ehime-ken高知県 Kochi-ken福岡県 Fukuoka-ken
佐賀県 Saga-ken長崎県 Nagasaki-ken熊本県 Kumamoto-ken大分県 Oita-ken宮崎県 Miyazaki-ken
鹿児島県 Kagoshima-ken沖縄県 Okinawa-ken
平均値 Mean標準偏差 Standard deviation
分子 離別人口40~49歳(女) 離別人口50~59歳(男) 離別人口50~59歳(女) 総人口-総人口(前年)
指標計算式 Numerators Divorced population (40-49, female) Divorced population (50-59, male) Divorced population (50-59, female)
Formulae ofindicators 分母 40~49歳人口(女) 50~59歳人口(男) 50~59歳人口(女) 総人口(前年)
Denominators Population (40-49, female) Population (50-59, male) Population (50-59, female) Total population (Both sexes) (previous year)
出典 Reference
5)人口動態 Vital statistics
人口増減率 自然増減率 粗出生率(人口千人当たり)
Rates of population change Rates of natural change Crude birth rate (per 1,000 persons)
(%) (%)Pref.Code
MeanS.D.
総人口-総人口(前年) 出生数-死亡数 出生数 分子
Total population (Both sexes) -Total population (Both sexes) (previous year)
Live births - Deaths Live births 指標計算式
総人口(前年) 総人口 総人口 分母
Total population (Both sexes) (previous year) Total population (Both sexes) Total population (Both sexes)
出典
都道府県コー
ド
14

都道府県 離別者割合(40~49歳・女) 離別者割合(50~59歳・男) 離別者割合(50~59歳・女) 人口増減率
Prefecture Ratio of divorced population(40-49 years old, female)
Ratio of divorced population(50-59 years old, male)
Ratio of divorced population(50-59 years old, female)
Rates of population change
(%) (%) (%)
全国 All Japan
北海道 Hokkaido青森県 Aomori-ken岩手県 Iwate-ken宮城県 Miyagi-ken秋田県 Akita-ken
山形県 Yamagata-ken福島県 Fukushima-ken茨城県 Ibaraki-ken栃木県 Tochigi-ken群馬県 Gumma-ken
埼玉県 Saitama-ken千葉県 Chiba-ken東京都 Tokyo-to神奈川県 Kanagawa-ken新潟県 Niigata-ken
富山県 Toyama-ken石川県 Ishikawa-ken福井県 Fukui-ken山梨県 Yamanashi-ken長野県 Nagano-ken
岐阜県 Gifu-ken静岡県 Shizuoka-ken愛知県 Aichi-ken三重県 Mie-ken滋賀県 Shiga-ken
京都府 Kyoto-fu大阪府 Osaka-fu兵庫県 Hyogo-ken奈良県 Nara-ken和歌山県 Wakayama-ken
鳥取県 Tottori-ken島根県 Shimane-ken岡山県 Okayama-ken広島県 Hiroshima-ken山口県 Yamaguchi-ken
徳島県 Tokushima-ken香川県 Kagawa-ken愛媛県 Ehime-ken高知県 Kochi-ken福岡県 Fukuoka-ken
佐賀県 Saga-ken長崎県 Nagasaki-ken熊本県 Kumamoto-ken大分県 Oita-ken宮崎県 Miyazaki-ken
鹿児島県 Kagoshima-ken沖縄県 Okinawa-ken
平均値 Mean標準偏差 Standard deviation
分子 離別人口40~49歳(女) 離別人口50~59歳(男) 離別人口50~59歳(女) 総人口-総人口(前年)
指標計算式 Numerators Divorced population (40-49, female) Divorced population (50-59, male) Divorced population (50-59, female)
Formulae ofindicators 分母 40~49歳人口(女) 50~59歳人口(男) 50~59歳人口(女) 総人口(前年)
Denominators Population (40-49, female) Population (50-59, male) Population (50-59, female) Total population (Both sexes) (previous year)
出典 Reference
5)人口動態 Vital statistics
人口増減率 自然増減率 粗出生率(人口千人当たり)
Rates of population change Rates of natural change Crude birth rate (per 1,000 persons)
(%) (%)Pref.Code
MeanS.D.
総人口-総人口(前年) 出生数-死亡数 出生数 分子
Total population (Both sexes) -Total population (Both sexes) (previous year)
Live births - Deaths Live births 指標計算式
総人口(前年) 総人口 総人口 分母
Total population (Both sexes) (previous year) Total population (Both sexes) Total population (Both sexes)
出典
都道府県コー
ド
15

都道府県 合計特殊出生率 粗死亡率(人口千人当たり) 粗死亡率(男)(人口千人当たり) 粗死亡率(女)(人口千人当たり)
Prefecture Total fertility rate Crude death rate (per 1,000 persons) Crude death rate (male)(per 1,000 persons)
Crude death rate (female)(per 1,000 persons)
全国 All Japan
北海道 Hokkaido青森県 Aomori-ken岩手県 Iwate-ken宮城県 Miyagi-ken秋田県 Akita-ken
山形県 Yamagata-ken福島県 Fukushima-ken茨城県 Ibaraki-ken栃木県 Tochigi-ken群馬県 Gumma-ken
埼玉県 Saitama-ken千葉県 Chiba-ken東京都 Tokyo-to神奈川県 Kanagawa-ken新潟県 Niigata-ken
富山県 Toyama-ken石川県 Ishikawa-ken福井県 Fukui-ken山梨県 Yamanashi-ken長野県 Nagano-ken
岐阜県 Gifu-ken静岡県 Shizuoka-ken愛知県 Aichi-ken三重県 Mie-ken滋賀県 Shiga-ken
京都府 Kyoto-fu大阪府 Osaka-fu兵庫県 Hyogo-ken奈良県 Nara-ken和歌山県 Wakayama-ken
鳥取県 Tottori-ken島根県 Shimane-ken岡山県 Okayama-ken広島県 Hiroshima-ken山口県 Yamaguchi-ken
徳島県 Tokushima-ken香川県 Kagawa-ken愛媛県 Ehime-ken高知県 Kochi-ken福岡県 Fukuoka-ken
佐賀県 Saga-ken長崎県 Nagasaki-ken熊本県 Kumamoto-ken大分県 Oita-ken宮崎県 Miyazaki-ken
鹿児島県 Kagoshima-ken沖縄県 Okinawa-ken
平均値 Mean標準偏差 Standard deviation
※
分子 死亡数 死亡数(男) 死亡数(女)
指標計算式 Numerators 合計特殊出生率 Deaths Deaths (male) Deaths (female)
Formulae ofindicators 分母 Total fertility rate 総人口 総人口(男) 総人口(女)
Denominators Total population (Both sexes) Total population (male) Total population (female)
出典 Reference
粗死亡率(女)(人口千人当たり) 年齢別死亡率(0~4歳)(人口千人当たり) 年齢別死亡率(65歳以上)(人口千人当たり)
Crude death rate (female)(per 1,000 persons)
Death rate of 0-4 years old(per 1,000 persons)
Death rate of 65 years old andover (per 1,000 persons)
Pref.Code
MeanS.D.
死亡数(女) 死亡数(0~4歳) 死亡数(65歳以上) 分子
Deaths (female) Deaths (0-4, total) Deaths (65 and over, total) 指標計算式
総人口(女) 0~4歳人口 65歳以上人口 分母
Total population (female) Population (0-4, total) Total population (65 and over)
出典
都道府県コー
ド
16

都道府県 合計特殊出生率 粗死亡率(人口千人当たり) 粗死亡率(男)(人口千人当たり) 粗死亡率(女)(人口千人当たり)
Prefecture Total fertility rate Crude death rate (per 1,000 persons) Crude death rate (male)(per 1,000 persons)
Crude death rate (female)(per 1,000 persons)
全国 All Japan
北海道 Hokkaido青森県 Aomori-ken岩手県 Iwate-ken宮城県 Miyagi-ken秋田県 Akita-ken
山形県 Yamagata-ken福島県 Fukushima-ken茨城県 Ibaraki-ken栃木県 Tochigi-ken群馬県 Gumma-ken
埼玉県 Saitama-ken千葉県 Chiba-ken東京都 Tokyo-to神奈川県 Kanagawa-ken新潟県 Niigata-ken
富山県 Toyama-ken石川県 Ishikawa-ken福井県 Fukui-ken山梨県 Yamanashi-ken長野県 Nagano-ken
岐阜県 Gifu-ken静岡県 Shizuoka-ken愛知県 Aichi-ken三重県 Mie-ken滋賀県 Shiga-ken
京都府 Kyoto-fu大阪府 Osaka-fu兵庫県 Hyogo-ken奈良県 Nara-ken和歌山県 Wakayama-ken
鳥取県 Tottori-ken島根県 Shimane-ken岡山県 Okayama-ken広島県 Hiroshima-ken山口県 Yamaguchi-ken
徳島県 Tokushima-ken香川県 Kagawa-ken愛媛県 Ehime-ken高知県 Kochi-ken福岡県 Fukuoka-ken
佐賀県 Saga-ken長崎県 Nagasaki-ken熊本県 Kumamoto-ken大分県 Oita-ken宮崎県 Miyazaki-ken
鹿児島県 Kagoshima-ken沖縄県 Okinawa-ken
平均値 Mean標準偏差 Standard deviation
※
分子 死亡数 死亡数(男) 死亡数(女)
指標計算式 Numerators 合計特殊出生率 Deaths Deaths (male) Deaths (female)
Formulae ofindicators 分母 Total fertility rate 総人口 総人口(男) 総人口(女)
Denominators Total population (Both sexes) Total population (male) Total population (female)
出典 Reference
粗死亡率(女)(人口千人当たり) 年齢別死亡率(0~4歳)(人口千人当たり) 年齢別死亡率(65歳以上)(人口千人当たり)
Crude death rate (female)(per 1,000 persons)
Death rate of 0-4 years old(per 1,000 persons)
Death rate of 65 years old andover (per 1,000 persons)
Pref.Code
MeanS.D.
死亡数(女) 死亡数(0~4歳) 死亡数(65歳以上) 分子
Deaths (female) Deaths (0-4, total) Deaths (65 and over, total) 指標計算式
総人口(女) 0~4歳人口 65歳以上人口 分母
Total population (female) Population (0-4, total) Total population (65 and over)
出典
都道府県コー
ド
17
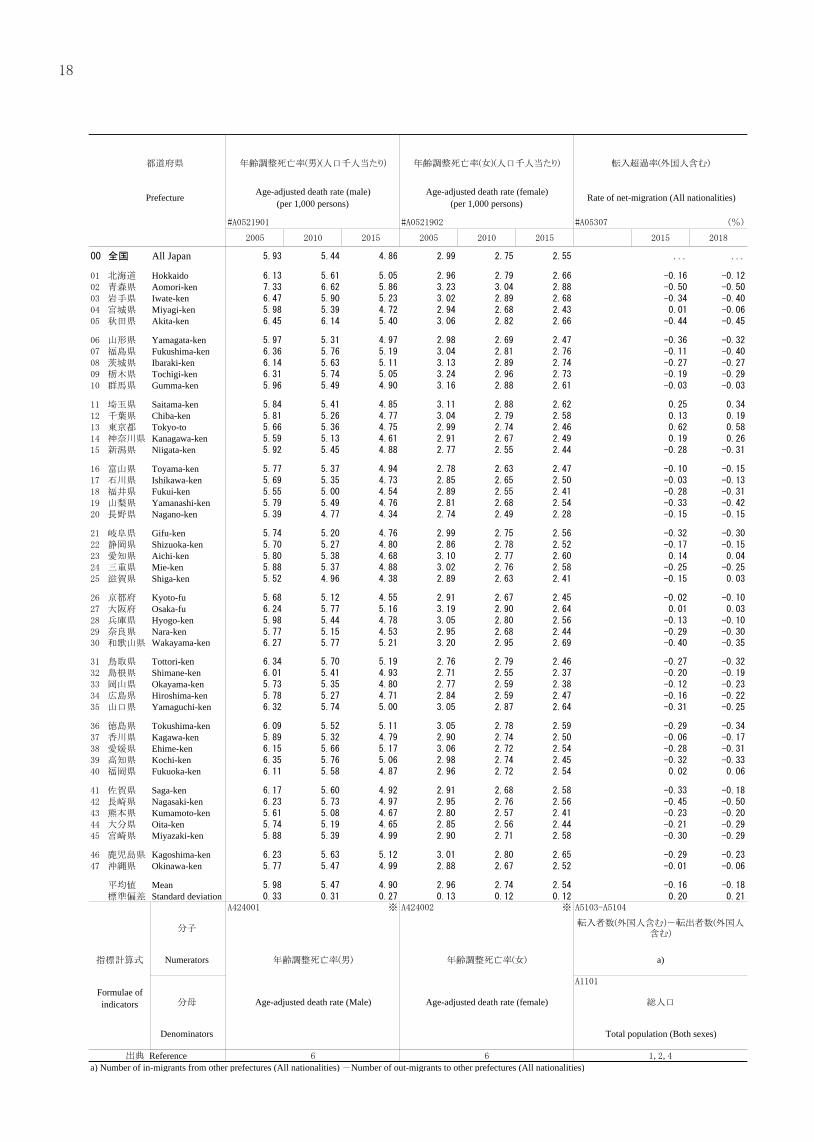
転入率(外国人含む) 転出率(外国人含む) 流入人口比率
Rate of In-migrants from other prefectures(All nationalities)
Rate of Out-migrants to other prefectures(All nationalities)
Ratio of in flow population
(%) (%) (%)Pref.Code
MeanS.D.
転入者数(外国人含む) 転出者数(外国人含む) 流入人口(従業地・通学地人口) 分子
Number of in-migrants from other prefectures (Allnationalities)
Number of out-migrants to other prefectures (Allnationalities)
Inflow population(Population living in another prefecture) 指標計算式
総人口 総人口 総人口 分母
Total population (Both sexes) Total population (Both sexes) Total population (Both sexes)
出典
都道府県コー
ド
都道府県 年齢調整死亡率(男)(人口千人当たり) 年齢調整死亡率(女)(人口千人当たり) 転入超過率(外国人含む)
Prefecture Age-adjusted death rate (male)(per 1,000 persons)
Age-adjusted death rate (female)(per 1,000 persons) Rate of net-migration (All nationalities)
#A0521901 #A0521902 #A05307 (%)
2005 2010 2015 2005 2010 2015 2015 2018
00 全国 All Japan 5.93 5.44 4.86 2.99 2.75 2.55 ... ...
01 北海道 Hokkaido 6.13 5.61 5.05 2.96 2.79 2.66 -0.16 -0.1202 青森県 Aomori-ken 7.33 6.62 5.86 3.23 3.04 2.88 -0.50 -0.5003 岩手県 Iwate-ken 6.47 5.90 5.23 3.02 2.89 2.68 -0.34 -0.4004 宮城県 Miyagi-ken 5.98 5.39 4.72 2.94 2.68 2.43 0.01 -0.0605 秋田県 Akita-ken 6.45 6.14 5.40 3.06 2.82 2.66 -0.44 -0.45
06 山形県 Yamagata-ken 5.97 5.31 4.97 2.98 2.69 2.47 -0.36 -0.3207 福島県 Fukushima-ken 6.36 5.76 5.19 3.04 2.81 2.76 -0.11 -0.4008 茨城県 Ibaraki-ken 6.14 5.63 5.11 3.13 2.89 2.74 -0.27 -0.2709 栃木県 Tochigi-ken 6.31 5.74 5.05 3.24 2.96 2.73 -0.19 -0.2910 群馬県 Gumma-ken 5.96 5.49 4.90 3.16 2.88 2.61 -0.03 -0.03
11 埼玉県 Saitama-ken 5.84 5.41 4.85 3.11 2.88 2.62 0.25 0.3412 千葉県 Chiba-ken 5.81 5.26 4.77 3.04 2.79 2.58 0.13 0.1913 東京都 Tokyo-to 5.66 5.36 4.75 2.99 2.74 2.46 0.62 0.5814 神奈川県 Kanagawa-ken 5.59 5.13 4.61 2.91 2.67 2.49 0.19 0.2615 新潟県 Niigata-ken 5.92 5.45 4.88 2.77 2.55 2.44 -0.28 -0.31
16 富山県 Toyama-ken 5.77 5.37 4.94 2.78 2.63 2.47 -0.10 -0.1517 石川県 Ishikawa-ken 5.69 5.35 4.73 2.85 2.65 2.50 -0.03 -0.1318 福井県 Fukui-ken 5.55 5.00 4.54 2.89 2.55 2.41 -0.28 -0.3119 山梨県 Yamanashi-ken 5.79 5.49 4.76 2.81 2.68 2.54 -0.33 -0.4220 長野県 Nagano-ken 5.39 4.77 4.34 2.74 2.49 2.28 -0.15 -0.15
21 岐阜県 Gifu-ken 5.74 5.20 4.76 2.99 2.75 2.56 -0.32 -0.3022 静岡県 Shizuoka-ken 5.70 5.27 4.80 2.86 2.78 2.52 -0.17 -0.1523 愛知県 Aichi-ken 5.80 5.38 4.68 3.10 2.77 2.60 0.14 0.0424 三重県 Mie-ken 5.88 5.37 4.88 3.02 2.76 2.58 -0.25 -0.2525 滋賀県 Shiga-ken 5.52 4.96 4.38 2.89 2.63 2.41 -0.15 0.03
26 京都府 Kyoto-fu 5.68 5.12 4.55 2.91 2.67 2.45 -0.02 -0.1027 大阪府 Osaka-fu 6.24 5.77 5.16 3.19 2.90 2.64 0.01 0.0328 兵庫県 Hyogo-ken 5.98 5.44 4.78 3.05 2.80 2.56 -0.13 -0.1029 奈良県 Nara-ken 5.77 5.15 4.53 2.95 2.68 2.44 -0.29 -0.3030 和歌山県 Wakayama-ken 6.27 5.77 5.21 3.20 2.95 2.69 -0.40 -0.35
31 鳥取県 Tottori-ken 6.34 5.70 5.19 2.76 2.79 2.46 -0.27 -0.3232 島根県 Shimane-ken 6.01 5.41 4.93 2.71 2.55 2.37 -0.20 -0.1933 岡山県 Okayama-ken 5.73 5.35 4.80 2.77 2.59 2.38 -0.12 -0.2334 広島県 Hiroshima-ken 5.78 5.27 4.71 2.84 2.59 2.47 -0.16 -0.2235 山口県 Yamaguchi-ken 6.32 5.74 5.00 3.05 2.87 2.64 -0.31 -0.25
36 徳島県 Tokushima-ken 6.09 5.52 5.11 3.05 2.78 2.59 -0.29 -0.3437 香川県 Kagawa-ken 5.89 5.32 4.79 2.90 2.74 2.50 -0.06 -0.1738 愛媛県 Ehime-ken 6.15 5.66 5.17 3.06 2.72 2.54 -0.28 -0.3139 高知県 Kochi-ken 6.35 5.76 5.06 2.98 2.74 2.45 -0.32 -0.3340 福岡県 Fukuoka-ken 6.11 5.58 4.87 2.96 2.72 2.54 0.02 0.06
41 佐賀県 Saga-ken 6.17 5.60 4.92 2.91 2.68 2.58 -0.33 -0.1842 長崎県 Nagasaki-ken 6.23 5.73 4.97 2.95 2.76 2.56 -0.45 -0.5043 熊本県 Kumamoto-ken 5.61 5.08 4.67 2.80 2.57 2.41 -0.23 -0.2044 大分県 Oita-ken 5.74 5.19 4.65 2.85 2.56 2.44 -0.21 -0.2945 宮崎県 Miyazaki-ken 5.88 5.39 4.99 2.90 2.71 2.58 -0.30 -0.29
46 鹿児島県 Kagoshima-ken 6.23 5.63 5.12 3.01 2.80 2.65 -0.29 -0.2347 沖縄県 Okinawa-ken 5.77 5.47 4.99 2.88 2.67 2.52 -0.01 -0.06
平均値 Mean 5.98 5.47 4.90 2.96 2.74 2.54 -0.16 -0.18標準偏差 Standard deviation 0.33 0.31 0.27 0.13 0.12 0.12 0.20 0.21
A424001 ※ A424002 ※ A5103-A5104
分子転入者数(外国人含む)-転出者数(外国人
含む)
指標計算式 Numerators 年齢調整死亡率(男) 年齢調整死亡率(女) a)
A1101Formulae ofindicators 分母 Age-adjusted death rate (Male) Age-adjusted death rate (female) 総人口
Denominators Total population (Both sexes)
出典 Reference 6 6 1,2,4a) Number of in-migrants from other prefectures (All nationalities) -Number of out-migrants to other prefectures (All nationalities)
18

転入率(外国人含む) 転出率(外国人含む) 流入人口比率
Rate of In-migrants from other prefectures(All nationalities)
Rate of Out-migrants to other prefectures(All nationalities)
Ratio of in flow population
(%) (%) (%)Pref.Code
MeanS.D.
転入者数(外国人含む) 転出者数(外国人含む) 流入人口(従業地・通学地人口) 分子
Number of in-migrants from other prefectures (Allnationalities)
Number of out-migrants to other prefectures (Allnationalities)
Inflow population(Population living in another prefecture) 指標計算式
総人口 総人口 総人口 分母
Total population (Both sexes) Total population (Both sexes) Total population (Both sexes)
出典
都道府県コー
ド
都道府県 年齢調整死亡率(男)(人口千人当たり) 年齢調整死亡率(女)(人口千人当たり) 転入超過率(外国人含む)
Prefecture Age-adjusted death rate (male)(per 1,000 persons)
Age-adjusted death rate (female)(per 1,000 persons) Rate of net-migration (All nationalities)
#A0521901 #A0521902 #A05307 (%)
2005 2010 2015 2005 2010 2015 2015 2018
00 全国 All Japan 5.93 5.44 4.86 2.99 2.75 2.55 ... ...
01 北海道 Hokkaido 6.13 5.61 5.05 2.96 2.79 2.66 -0.16 -0.1202 青森県 Aomori-ken 7.33 6.62 5.86 3.23 3.04 2.88 -0.50 -0.5003 岩手県 Iwate-ken 6.47 5.90 5.23 3.02 2.89 2.68 -0.34 -0.4004 宮城県 Miyagi-ken 5.98 5.39 4.72 2.94 2.68 2.43 0.01 -0.0605 秋田県 Akita-ken 6.45 6.14 5.40 3.06 2.82 2.66 -0.44 -0.45
06 山形県 Yamagata-ken 5.97 5.31 4.97 2.98 2.69 2.47 -0.36 -0.3207 福島県 Fukushima-ken 6.36 5.76 5.19 3.04 2.81 2.76 -0.11 -0.4008 茨城県 Ibaraki-ken 6.14 5.63 5.11 3.13 2.89 2.74 -0.27 -0.2709 栃木県 Tochigi-ken 6.31 5.74 5.05 3.24 2.96 2.73 -0.19 -0.2910 群馬県 Gumma-ken 5.96 5.49 4.90 3.16 2.88 2.61 -0.03 -0.03
11 埼玉県 Saitama-ken 5.84 5.41 4.85 3.11 2.88 2.62 0.25 0.3412 千葉県 Chiba-ken 5.81 5.26 4.77 3.04 2.79 2.58 0.13 0.1913 東京都 Tokyo-to 5.66 5.36 4.75 2.99 2.74 2.46 0.62 0.5814 神奈川県 Kanagawa-ken 5.59 5.13 4.61 2.91 2.67 2.49 0.19 0.2615 新潟県 Niigata-ken 5.92 5.45 4.88 2.77 2.55 2.44 -0.28 -0.31
16 富山県 Toyama-ken 5.77 5.37 4.94 2.78 2.63 2.47 -0.10 -0.1517 石川県 Ishikawa-ken 5.69 5.35 4.73 2.85 2.65 2.50 -0.03 -0.1318 福井県 Fukui-ken 5.55 5.00 4.54 2.89 2.55 2.41 -0.28 -0.3119 山梨県 Yamanashi-ken 5.79 5.49 4.76 2.81 2.68 2.54 -0.33 -0.4220 長野県 Nagano-ken 5.39 4.77 4.34 2.74 2.49 2.28 -0.15 -0.15
21 岐阜県 Gifu-ken 5.74 5.20 4.76 2.99 2.75 2.56 -0.32 -0.3022 静岡県 Shizuoka-ken 5.70 5.27 4.80 2.86 2.78 2.52 -0.17 -0.1523 愛知県 Aichi-ken 5.80 5.38 4.68 3.10 2.77 2.60 0.14 0.0424 三重県 Mie-ken 5.88 5.37 4.88 3.02 2.76 2.58 -0.25 -0.2525 滋賀県 Shiga-ken 5.52 4.96 4.38 2.89 2.63 2.41 -0.15 0.03
26 京都府 Kyoto-fu 5.68 5.12 4.55 2.91 2.67 2.45 -0.02 -0.1027 大阪府 Osaka-fu 6.24 5.77 5.16 3.19 2.90 2.64 0.01 0.0328 兵庫県 Hyogo-ken 5.98 5.44 4.78 3.05 2.80 2.56 -0.13 -0.1029 奈良県 Nara-ken 5.77 5.15 4.53 2.95 2.68 2.44 -0.29 -0.3030 和歌山県 Wakayama-ken 6.27 5.77 5.21 3.20 2.95 2.69 -0.40 -0.35
31 鳥取県 Tottori-ken 6.34 5.70 5.19 2.76 2.79 2.46 -0.27 -0.3232 島根県 Shimane-ken 6.01 5.41 4.93 2.71 2.55 2.37 -0.20 -0.1933 岡山県 Okayama-ken 5.73 5.35 4.80 2.77 2.59 2.38 -0.12 -0.2334 広島県 Hiroshima-ken 5.78 5.27 4.71 2.84 2.59 2.47 -0.16 -0.2235 山口県 Yamaguchi-ken 6.32 5.74 5.00 3.05 2.87 2.64 -0.31 -0.25
36 徳島県 Tokushima-ken 6.09 5.52 5.11 3.05 2.78 2.59 -0.29 -0.3437 香川県 Kagawa-ken 5.89 5.32 4.79 2.90 2.74 2.50 -0.06 -0.1738 愛媛県 Ehime-ken 6.15 5.66 5.17 3.06 2.72 2.54 -0.28 -0.3139 高知県 Kochi-ken 6.35 5.76 5.06 2.98 2.74 2.45 -0.32 -0.3340 福岡県 Fukuoka-ken 6.11 5.58 4.87 2.96 2.72 2.54 0.02 0.06
41 佐賀県 Saga-ken 6.17 5.60 4.92 2.91 2.68 2.58 -0.33 -0.1842 長崎県 Nagasaki-ken 6.23 5.73 4.97 2.95 2.76 2.56 -0.45 -0.5043 熊本県 Kumamoto-ken 5.61 5.08 4.67 2.80 2.57 2.41 -0.23 -0.2044 大分県 Oita-ken 5.74 5.19 4.65 2.85 2.56 2.44 -0.21 -0.2945 宮崎県 Miyazaki-ken 5.88 5.39 4.99 2.90 2.71 2.58 -0.30 -0.29
46 鹿児島県 Kagoshima-ken 6.23 5.63 5.12 3.01 2.80 2.65 -0.29 -0.2347 沖縄県 Okinawa-ken 5.77 5.47 4.99 2.88 2.67 2.52 -0.01 -0.06
平均値 Mean 5.98 5.47 4.90 2.96 2.74 2.54 -0.16 -0.18標準偏差 Standard deviation 0.33 0.31 0.27 0.13 0.12 0.12 0.20 0.21
A424001 ※ A424002 ※ A5103-A5104
分子転入者数(外国人含む)-転出者数(外国人
含む)
指標計算式 Numerators 年齢調整死亡率(男) 年齢調整死亡率(女) a)
A1101Formulae ofindicators 分母 Age-adjusted death rate (Male) Age-adjusted death rate (female) 総人口
Denominators Total population (Both sexes)
出典 Reference 6 6 1,2,4a) Number of in-migrants from other prefectures (All nationalities) -Number of out-migrants to other prefectures (All nationalities)
19

6)世帯・家族 Households and families
都道府県 流出人口比率 全国一般世帯に占める一般世帯割合 一般世帯の平均人員 核家族世帯割合
Prefecture Ratio of out flow population Percentage distribution ofprivate households
Members per private household Ratio of family nuclei households
(%) (%) (人:person
全国 All Japan
北海道 Hokkaido青森県 Aomori-ken岩手県 Iwate-ken宮城県 Miyagi-ken秋田県 Akita-ken
山形県 Yamagata-ken福島県 Fukushima-ken茨城県 Ibaraki-ken栃木県 Tochigi-ken群馬県 Gumma-ken
埼玉県 Saitama-ken千葉県 Chiba-ken東京都 Tokyo-to神奈川県 Kanagawa-ken新潟県 Niigata-ken
富山県 Toyama-ken石川県 Ishikawa-ken福井県 Fukui-ken山梨県 Yamanashi-ken長野県 Nagano-ken
岐阜県 Gifu-ken静岡県 Shizuoka-ken愛知県 Aichi-ken三重県 Mie-ken滋賀県 Shiga-ken
京都府 Kyoto-fu大阪府 Osaka-fu兵庫県 Hyogo-ken奈良県 Nara-ken和歌山県 Wakayama-ken
鳥取県 Tottori-ken島根県 Shimane-ken岡山県 Okayama-ken広島県 Hiroshima-ken山口県 Yamaguchi-ken
徳島県 Tokushima-ken香川県 Kagawa-ken愛媛県 Ehime-ken高知県 Kochi-ken福岡県 Fukuoka-ken
佐賀県 Saga-ken長崎県 Nagasaki-ken熊本県 Kumamoto-ken大分県 Oita-ken宮崎県 Miyazaki-ken
鹿児島県 Kagoshima-ken沖縄県 Okinawa-ken
平均値 Mean標準偏差 Standard deviation
分子 流出人口(従業地・通学地人口) 一般世帯数 一般世帯人員 核家族世帯数
指標計算式 Numerators Outflow population (Population working orschooling in other prefecture)
Number of private households No. of private household members Nuclear families
Formulae ofindicators 分母 総人口 全国一般世帯数 一般世帯数 一般世帯数
Denominators Total population (Both sexes) Number of private households (All Japan) Number of private households Number of private households
出典 Reference
核家族世帯割合 共働き世帯割合 単独世帯割合
Ratio of family nuclei households Ratio of dual-income households Ratio of one-person households
(%) (%) (%)Pref.Code
MeanS.D.
核家族世帯数 共働き世帯数 単独世帯数 分子
Nuclear families Dual-income households One-person households
一般世帯数 一般世帯数 一般世帯数 分母
Number of private households Number of private households Number of private households
出典
都道府県コー
ド
20
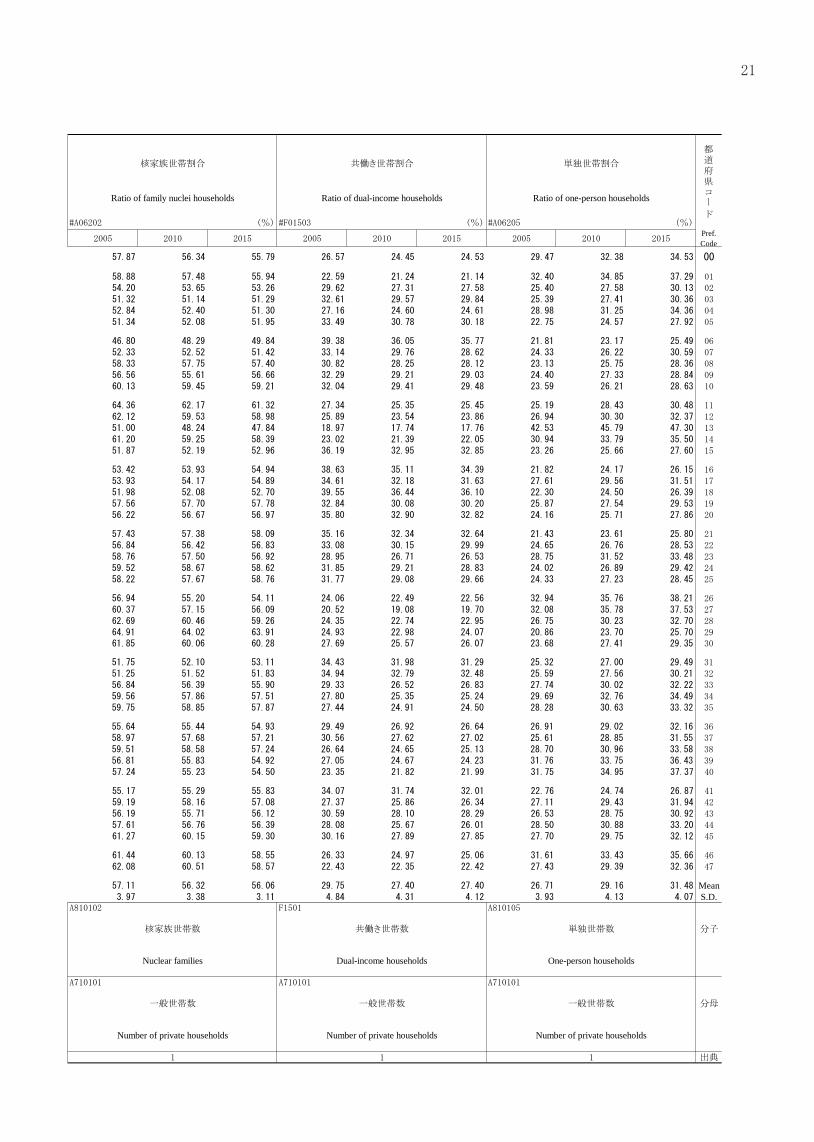
6)世帯・家族 Households and families
都道府県 流出人口比率 全国一般世帯に占める一般世帯割合 一般世帯の平均人員 核家族世帯割合
Prefecture Ratio of out flow population Percentage distribution ofprivate households
Members per private household Ratio of family nuclei households
(%) (%) (人:person
全国 All Japan
北海道 Hokkaido青森県 Aomori-ken岩手県 Iwate-ken宮城県 Miyagi-ken秋田県 Akita-ken
山形県 Yamagata-ken福島県 Fukushima-ken茨城県 Ibaraki-ken栃木県 Tochigi-ken群馬県 Gumma-ken
埼玉県 Saitama-ken千葉県 Chiba-ken東京都 Tokyo-to神奈川県 Kanagawa-ken新潟県 Niigata-ken
富山県 Toyama-ken石川県 Ishikawa-ken福井県 Fukui-ken山梨県 Yamanashi-ken長野県 Nagano-ken
岐阜県 Gifu-ken静岡県 Shizuoka-ken愛知県 Aichi-ken三重県 Mie-ken滋賀県 Shiga-ken
京都府 Kyoto-fu大阪府 Osaka-fu兵庫県 Hyogo-ken奈良県 Nara-ken和歌山県 Wakayama-ken
鳥取県 Tottori-ken島根県 Shimane-ken岡山県 Okayama-ken広島県 Hiroshima-ken山口県 Yamaguchi-ken
徳島県 Tokushima-ken香川県 Kagawa-ken愛媛県 Ehime-ken高知県 Kochi-ken福岡県 Fukuoka-ken
佐賀県 Saga-ken長崎県 Nagasaki-ken熊本県 Kumamoto-ken大分県 Oita-ken宮崎県 Miyazaki-ken
鹿児島県 Kagoshima-ken沖縄県 Okinawa-ken
平均値 Mean標準偏差 Standard deviation
分子 流出人口(従業地・通学地人口) 一般世帯数 一般世帯人員 核家族世帯数
指標計算式 Numerators Outflow population (Population working orschooling in other prefecture)
Number of private households No. of private household members Nuclear families
Formulae ofindicators 分母 総人口 全国一般世帯数 一般世帯数 一般世帯数
Denominators Total population (Both sexes) Number of private households (All Japan) Number of private households Number of private households
出典 Reference
核家族世帯割合 共働き世帯割合 単独世帯割合
Ratio of family nuclei households Ratio of dual-income households Ratio of one-person households
(%) (%) (%)Pref.Code
MeanS.D.
核家族世帯数 共働き世帯数 単独世帯数 分子
Nuclear families Dual-income households One-person households
一般世帯数 一般世帯数 一般世帯数 分母
Number of private households Number of private households Number of private households
出典
都道府県コー
ド
21

都道府県 65歳以上の世帯員のいる世帯割合 高齢夫婦のみの世帯の割合 高齢単身世帯の割合 婚姻率(人口千人当たり)
Prefecture Ratio of households with members65 years old and over
Ratio of aged-couple households Ratio of aged-single person households Rate of marriages (per 1,000 persons)
(%) (%) (%)
全国 All Japan
北海道 Hokkaido青森県 Aomori-ken岩手県 Iwate-ken宮城県 Miyagi-ken秋田県 Akita-ken
山形県 Yamagata-ken福島県 Fukushima-ken茨城県 Ibaraki-ken栃木県 Tochigi-ken群馬県 Gumma-ken
埼玉県 Saitama-ken千葉県 Chiba-ken東京都 Tokyo-to神奈川県 Kanagawa-ken新潟県 Niigata-ken
富山県 Toyama-ken石川県 Ishikawa-ken福井県 Fukui-ken山梨県 Yamanashi-ken長野県 Nagano-ken
岐阜県 Gifu-ken静岡県 Shizuoka-ken愛知県 Aichi-ken三重県 Mie-ken滋賀県 Shiga-ken
京都府 Kyoto-fu大阪府 Osaka-fu兵庫県 Hyogo-ken奈良県 Nara-ken和歌山県 Wakayama-ken
鳥取県 Tottori-ken島根県 Shimane-ken岡山県 Okayama-ken広島県 Hiroshima-ken山口県 Yamaguchi-ken
徳島県 Tokushima-ken香川県 Kagawa-ken愛媛県 Ehime-ken高知県 Kochi-ken福岡県 Fukuoka-ken
佐賀県 Saga-ken長崎県 Nagasaki-ken熊本県 Kumamoto-ken大分県 Oita-ken宮崎県 Miyazaki-ken
鹿児島県 Kagoshima-ken沖縄県 Okinawa-ken
平均値 Mean標準偏差 Standard deviation
分子 65歳以上の世帯員のいる世帯数 高齢夫婦世帯数(高齢夫婦のみ) 高齢単身世帯数 婚姻件数
指標計算式 Numerators No. of households with household members65 years of age and over
No. of aged-couple households(Only aged couple)
No. of aged-single-person households(Aged 65 and over)
Marriages
Formulae ofindicators 分母 一般世帯数 一般世帯数 一般世帯数 総人口
Denominators Number of private households Number of private households Number of private households Total population (Both sexes)
出典 Reference
7)婚姻・離婚 Marriages and divorces
婚姻率(人口千人当たり) 離婚率(人口千人当たり)
Rate of marriages (per 1,000 persons) Rate of divorces (per 1,000 persons)
Pref.Code
MeanS.D.
婚姻件数 離婚件数 分子
Marriages Divorces
総人口 総人口 分母
Total population (Both sexes) Total population (Both sexes)
出典
都道府県コー
ド
22

都道府県 65歳以上の世帯員のいる世帯割合 高齢夫婦のみの世帯の割合 高齢単身世帯の割合 婚姻率(人口千人当たり)
Prefecture Ratio of households with members65 years old and over
Ratio of aged-couple households Ratio of aged-single person households Rate of marriages (per 1,000 persons)
(%) (%) (%)
全国 All Japan
北海道 Hokkaido青森県 Aomori-ken岩手県 Iwate-ken宮城県 Miyagi-ken秋田県 Akita-ken
山形県 Yamagata-ken福島県 Fukushima-ken茨城県 Ibaraki-ken栃木県 Tochigi-ken群馬県 Gumma-ken
埼玉県 Saitama-ken千葉県 Chiba-ken東京都 Tokyo-to神奈川県 Kanagawa-ken新潟県 Niigata-ken
富山県 Toyama-ken石川県 Ishikawa-ken福井県 Fukui-ken山梨県 Yamanashi-ken長野県 Nagano-ken
岐阜県 Gifu-ken静岡県 Shizuoka-ken愛知県 Aichi-ken三重県 Mie-ken滋賀県 Shiga-ken
京都府 Kyoto-fu大阪府 Osaka-fu兵庫県 Hyogo-ken奈良県 Nara-ken和歌山県 Wakayama-ken
鳥取県 Tottori-ken島根県 Shimane-ken岡山県 Okayama-ken広島県 Hiroshima-ken山口県 Yamaguchi-ken
徳島県 Tokushima-ken香川県 Kagawa-ken愛媛県 Ehime-ken高知県 Kochi-ken福岡県 Fukuoka-ken
佐賀県 Saga-ken長崎県 Nagasaki-ken熊本県 Kumamoto-ken大分県 Oita-ken宮崎県 Miyazaki-ken
鹿児島県 Kagoshima-ken沖縄県 Okinawa-ken
平均値 Mean標準偏差 Standard deviation
分子 65歳以上の世帯員のいる世帯数 高齢夫婦世帯数(高齢夫婦のみ) 高齢単身世帯数 婚姻件数
指標計算式 Numerators No. of households with household members65 years of age and over
No. of aged-couple households(Only aged couple)
No. of aged-single-person households(Aged 65 and over)
Marriages
Formulae ofindicators 分母 一般世帯数 一般世帯数 一般世帯数 総人口
Denominators Number of private households Number of private households Number of private households Total population (Both sexes)
出典 Reference
7)婚姻・離婚 Marriages and divorces
婚姻率(人口千人当たり) 離婚率(人口千人当たり)
Rate of marriages (per 1,000 persons) Rate of divorces (per 1,000 persons)
Pref.Code
MeanS.D.
婚姻件数 離婚件数 分子
Marriages Divorces
総人口 総人口 分母
Total population (Both sexes) Total population (Both sexes)
出典
都道府県コー
ド
23

B.自然環境 Natural Environment1)面積 Land area
都道府県 面積割合(全国面積に占める割合) 森林面積割合 自然公園面積割合 可住地面積割合
Prefecture Ratio of total land area, all Japan Ratio of forest area Ratio of natural park area Ratio of inhabitable area
(%) (%) (%)
全国 All Japan
北海道 Hokkaido青森県 Aomori-ken岩手県 Iwate-ken宮城県 Miyagi-ken秋田県 Akita-ken
山形県 Yamagata-ken福島県 Fukushima-ken茨城県 Ibaraki-ken栃木県 Tochigi-ken群馬県 Gumma-ken
埼玉県 Saitama-ken千葉県 Chiba-ken東京都 Tokyo-to神奈川県 Kanagawa-ken新潟県 Niigata-ken
富山県 Toyama-ken石川県 Ishikawa-ken福井県 Fukui-ken山梨県 Yamanashi-ken長野県 Nagano-ken
岐阜県 Gifu-ken静岡県 Shizuoka-ken愛知県 Aichi-ken三重県 Mie-ken滋賀県 Shiga-ken
京都府 Kyoto-fu大阪府 Osaka-fu兵庫県 Hyogo-ken奈良県 Nara-ken和歌山県 Wakayama-ken
鳥取県 Tottori-ken島根県 Shimane-ken岡山県 Okayama-ken広島県 Hiroshima-ken山口県 Yamaguchi-ken
徳島県 Tokushima-ken香川県 Kagawa-ken愛媛県 Ehime-ken高知県 Kochi-ken福岡県 Fukuoka-ken
佐賀県 Saga-ken長崎県 Nagasaki-ken熊本県 Kumamoto-ken大分県 Oita-ken宮崎県 Miyazaki-ken
鹿児島県 Kagoshima-ken沖縄県 Okinawa-ken
平均値 Mean標準偏差 Standard deviation
分子 総面積(北方地域及び竹島を除く) 森林面積 自然公園面積 可住地面積 1)
指標計算式 Numerators Total land area (Excl. the northern territoriesand Takeshima) Forest area Natural park area
Formulae ofindicators 分母 全国総面積(北方地域及び竹島を除く) 総面積(北方地域及び竹島を除く) 総面積(北方地域及び竹島を除く) 総面積(北方地域及び竹島を除く)
Denominators Total land area (Excl. the northern territoriesand Takeshima) (All Japan)
Total land area (Excl. the northern territoriesand Takeshima)
Total land area (Excl. the northern territoriesand Takeshima)
出典 Reference1)可住地面積は総務省統計局にて算出している。
1 “Inhabitable area” is calculated by Statistics Bureau, Ministry of Internal Affairs and Communications, Japan.
可住地面積割合 評価総地積割合(課税対象土地) 評価総地積割合(田)
Ratio of inhabitable area Ratio of evaluated land tract (taxable land area) Ratio of evaluated land tract (paddy fields)
(%) (%) (%)Pref.Code
MeanS.D.
可住地面積 1) 評価総地積(課税対象土地) 評価総地積(田) 分子
Inhabitable area 1) Evaluated land tract (taxable land area) Evaluated land tract (paddy fields) 指標計算式
総面積(北方地域及び竹島を除く) 総面積(北方地域及び竹島を除く) 評価総地積(課税対象土地) 分母
Total land area(Excl. the northern territories and Takeshima)
Total land area(Excl. the northern territories and Takeshima) Evaluated land tract (taxable land area)
出典
都道府県コー
ド
24

B.自然環境 Natural Environment1)面積 Land area
都道府県 面積割合(全国面積に占める割合) 森林面積割合 自然公園面積割合 可住地面積割合
Prefecture Ratio of total land area, all Japan Ratio of forest area Ratio of natural park area Ratio of inhabitable area
(%) (%) (%)
全国 All Japan
北海道 Hokkaido青森県 Aomori-ken岩手県 Iwate-ken宮城県 Miyagi-ken秋田県 Akita-ken
山形県 Yamagata-ken福島県 Fukushima-ken茨城県 Ibaraki-ken栃木県 Tochigi-ken群馬県 Gumma-ken
埼玉県 Saitama-ken千葉県 Chiba-ken東京都 Tokyo-to神奈川県 Kanagawa-ken新潟県 Niigata-ken
富山県 Toyama-ken石川県 Ishikawa-ken福井県 Fukui-ken山梨県 Yamanashi-ken長野県 Nagano-ken
岐阜県 Gifu-ken静岡県 Shizuoka-ken愛知県 Aichi-ken三重県 Mie-ken滋賀県 Shiga-ken
京都府 Kyoto-fu大阪府 Osaka-fu兵庫県 Hyogo-ken奈良県 Nara-ken和歌山県 Wakayama-ken
鳥取県 Tottori-ken島根県 Shimane-ken岡山県 Okayama-ken広島県 Hiroshima-ken山口県 Yamaguchi-ken
徳島県 Tokushima-ken香川県 Kagawa-ken愛媛県 Ehime-ken高知県 Kochi-ken福岡県 Fukuoka-ken
佐賀県 Saga-ken長崎県 Nagasaki-ken熊本県 Kumamoto-ken大分県 Oita-ken宮崎県 Miyazaki-ken
鹿児島県 Kagoshima-ken沖縄県 Okinawa-ken
平均値 Mean標準偏差 Standard deviation
分子 総面積(北方地域及び竹島を除く) 森林面積 自然公園面積 可住地面積 1)
指標計算式 Numerators Total land area (Excl. the northern territoriesand Takeshima) Forest area Natural park area
Formulae ofindicators 分母 全国総面積(北方地域及び竹島を除く) 総面積(北方地域及び竹島を除く) 総面積(北方地域及び竹島を除く) 総面積(北方地域及び竹島を除く)
Denominators Total land area (Excl. the northern territoriesand Takeshima) (All Japan)
Total land area (Excl. the northern territoriesand Takeshima)
Total land area (Excl. the northern territoriesand Takeshima)
出典 Reference1)可住地面積は総務省統計局にて算出している。
1 “Inhabitable area” is calculated by Statistics Bureau, Ministry of Internal Affairs and Communications, Japan.
可住地面積割合 評価総地積割合(課税対象土地) 評価総地積割合(田)
Ratio of inhabitable area Ratio of evaluated land tract (taxable land area) Ratio of evaluated land tract (paddy fields)
(%) (%) (%)Pref.Code
MeanS.D.
可住地面積 1) 評価総地積(課税対象土地) 評価総地積(田) 分子
Inhabitable area 1) Evaluated land tract (taxable land area) Evaluated land tract (paddy fields) 指標計算式
総面積(北方地域及び竹島を除く) 総面積(北方地域及び竹島を除く) 評価総地積(課税対象土地) 分母
Total land area(Excl. the northern territories and Takeshima)
Total land area(Excl. the northern territories and Takeshima) Evaluated land tract (taxable land area)
出典
都道府県コー
ド
25
B
自然環境
(指標)

2)気象 Climate
都道府県 評価総地積割合(畑) 評価総地積割合(宅地) 年平均気温 最高気温(日最高気温の月平均の最高値)
Prefecture Ratio of evaluated land tract (fields) Ratio of evaluated land tract(land of building)
Yearly average of air temperature
(%) (%) (゚C)
全国 All Japan
北海道 Hokkaido青森県 Aomori-ken岩手県 Iwate-ken宮城県 Miyagi-ken秋田県 Akita-ken
山形県 Yamagata-ken福島県 Fukushima-ken茨城県 Ibaraki-ken栃木県 Tochigi-ken群馬県 Gumma-ken
埼玉県 Saitama-ken千葉県 Chiba-ken東京都 Tokyo-to神奈川県 Kanagawa-ken新潟県 Niigata-ken
富山県 Toyama-ken石川県 Ishikawa-ken福井県 Fukui-ken山梨県 Yamanashi-ken長野県 Nagano-ken
岐阜県 Gifu-ken静岡県 Shizuoka-ken愛知県 Aichi-ken三重県 Mie-ken滋賀県 Shiga-ken
京都府 Kyoto-fu大阪府 Osaka-fu兵庫県 Hyogo-ken奈良県 Nara-ken和歌山県 Wakayama-ken
鳥取県 Tottori-ken島根県 Shimane-ken岡山県 Okayama-ken広島県 Hiroshima-ken山口県 Yamaguchi-ken
徳島県 Tokushima-ken香川県 Kagawa-ken愛媛県 Ehime-ken高知県 Kochi-ken福岡県 Fukuoka-ken
佐賀県 Saga-ken長崎県 Nagasaki-ken熊本県 Kumamoto-ken大分県 Oita-ken宮崎県 Miyazaki-ken
鹿児島県 Kagoshima-ken沖縄県 Okinawa-ken
平均値 Mean標準偏差 Standard deviation
※
分子 評価総地積(畑) 評価総地積(宅地)
指標計算式 Numerators Evaluated land tract (paddy fields) Evaluated land tract (land of building) 年平均気温 最高気温(日最高気温の月平均の最高値)
Formulae ofindicators 分母 評価総地積(課税対象土地) 評価総地積(課税対象土地) Yearly average of air temperature
Denominators Evaluated land tract (taxable land area) Evaluated land tract (taxable land area)
出典 Reference(注)項目欄に「*」の付されている項目は,都道府県庁所在地のデータである。
2) ただし,上記の気象項目については,埼玉県は熊谷市,東京都は千代田区,滋賀県は彦根市における気象台の観測値である。
最高気温(日最高気温の月平均の最高値) 最低気温(日最低気温の月平均の最低値) 年平均相対湿度
Highest temperature among monthly averages ofdaily highest
Lowest temperature among monthly averages ofdaily lowest
Yearly average of relative humidity
(゚C) (゚C) (%)Pref.Code
MeanS.D.
※ ※ ※
分子
最高気温(日最高気温の月平均の最高値) 最低気温(日最低気温の月平均の最低値) 年平均相対湿度 指標計算式
Highest temperature among monthlyaverages of daily highest
Lowest temperature among monthlyaverages of daily lowest Yearly average of relative humidity 分母
出典
Note:Items with * refer to the cities with prefectural governments.2) However, with regard to weather information, Kumagaya-shi observations are used for Saitama-ken, Chiyoda-ku for Tokyo-to, and Hikone-shi for Shiga-ken.
都道府県コー
ド
26

2)気象 Climate
都道府県 評価総地積割合(畑) 評価総地積割合(宅地) 年平均気温 最高気温(日最高気温の月平均の最高値)
Prefecture Ratio of evaluated land tract (fields) Ratio of evaluated land tract(land of building)
Yearly average of air temperature
(%) (%) (゚C)
全国 All Japan
北海道 Hokkaido青森県 Aomori-ken岩手県 Iwate-ken宮城県 Miyagi-ken秋田県 Akita-ken
山形県 Yamagata-ken福島県 Fukushima-ken茨城県 Ibaraki-ken栃木県 Tochigi-ken群馬県 Gumma-ken
埼玉県 Saitama-ken千葉県 Chiba-ken東京都 Tokyo-to神奈川県 Kanagawa-ken新潟県 Niigata-ken
富山県 Toyama-ken石川県 Ishikawa-ken福井県 Fukui-ken山梨県 Yamanashi-ken長野県 Nagano-ken
岐阜県 Gifu-ken静岡県 Shizuoka-ken愛知県 Aichi-ken三重県 Mie-ken滋賀県 Shiga-ken
京都府 Kyoto-fu大阪府 Osaka-fu兵庫県 Hyogo-ken奈良県 Nara-ken和歌山県 Wakayama-ken
鳥取県 Tottori-ken島根県 Shimane-ken岡山県 Okayama-ken広島県 Hiroshima-ken山口県 Yamaguchi-ken
徳島県 Tokushima-ken香川県 Kagawa-ken愛媛県 Ehime-ken高知県 Kochi-ken福岡県 Fukuoka-ken
佐賀県 Saga-ken長崎県 Nagasaki-ken熊本県 Kumamoto-ken大分県 Oita-ken宮崎県 Miyazaki-ken
鹿児島県 Kagoshima-ken沖縄県 Okinawa-ken
平均値 Mean標準偏差 Standard deviation
※
分子 評価総地積(畑) 評価総地積(宅地)
指標計算式 Numerators Evaluated land tract (paddy fields) Evaluated land tract (land of building) 年平均気温 最高気温(日最高気温の月平均の最高値)
Formulae ofindicators 分母 評価総地積(課税対象土地) 評価総地積(課税対象土地) Yearly average of air temperature
Denominators Evaluated land tract (taxable land area) Evaluated land tract (taxable land area)
出典 Reference(注)項目欄に「*」の付されている項目は,都道府県庁所在地のデータである。
2) ただし,上記の気象項目については,埼玉県は熊谷市,東京都は千代田区,滋賀県は彦根市における気象台の観測値である。
最高気温(日最高気温の月平均の最高値) 最低気温(日最低気温の月平均の最低値) 年平均相対湿度
Highest temperature among monthly averages ofdaily highest
Lowest temperature among monthly averages ofdaily lowest
Yearly average of relative humidity
(゚C) (゚C) (%)Pref.Code
MeanS.D.
※ ※ ※
分子
最高気温(日最高気温の月平均の最高値) 最低気温(日最低気温の月平均の最低値) 年平均相対湿度 指標計算式
Highest temperature among monthlyaverages of daily highest
Lowest temperature among monthlyaverages of daily lowest Yearly average of relative humidity 分母
出典
Note:Items with * refer to the cities with prefectural governments.2) However, with regard to weather information, Kumagaya-shi observations are used for Saitama-ken, Chiyoda-ku for Tokyo-to, and Hikone-shi for Shiga-ken.
都道府県コー
ド
27
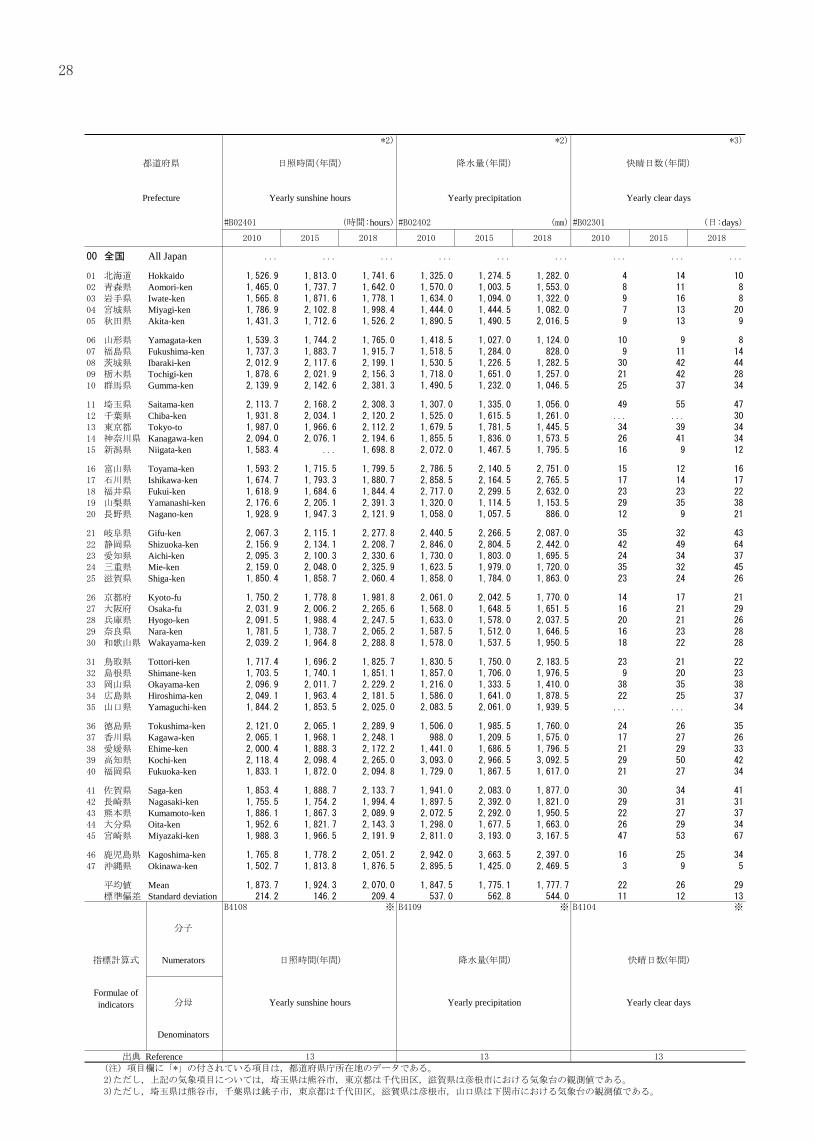
都道府県 日照時間(年間) 降水量(年間) 快晴日数(年間) 降水日数(年間)
Prefecture Yearly sunshine hours Yearly precipitation Yearly clear days Yearly rainy days
(時間:hours (日:days
全国 All Japan
北海道 Hokkaido青森県 Aomori-ken岩手県 Iwate-ken宮城県 Miyagi-ken秋田県 Akita-ken
山形県 Yamagata-ken福島県 Fukushima-ken茨城県 Ibaraki-ken栃木県 Tochigi-ken群馬県 Gumma-ken
埼玉県 Saitama-ken千葉県 Chiba-ken東京都 Tokyo-to神奈川県 Kanagawa-ken新潟県 Niigata-ken
富山県 Toyama-ken石川県 Ishikawa-ken福井県 Fukui-ken山梨県 Yamanashi-ken長野県 Nagano-ken
岐阜県 Gifu-ken静岡県 Shizuoka-ken愛知県 Aichi-ken三重県 Mie-ken滋賀県 Shiga-ken
京都府 Kyoto-fu大阪府 Osaka-fu兵庫県 Hyogo-ken奈良県 Nara-ken和歌山県 Wakayama-ken
鳥取県 Tottori-ken島根県 Shimane-ken岡山県 Okayama-ken広島県 Hiroshima-ken山口県 Yamaguchi-ken
徳島県 Tokushima-ken香川県 Kagawa-ken愛媛県 Ehime-ken高知県 Kochi-ken福岡県 Fukuoka-ken
佐賀県 Saga-ken長崎県 Nagasaki-ken熊本県 Kumamoto-ken大分県 Oita-ken宮崎県 Miyazaki-ken
鹿児島県 Kagoshima-ken沖縄県 Okinawa-ken
平均値 Mean標準偏差 Standard deviation
※ ※ ※
分子
指標計算式 Numerators 日照時間(年間) 降水量(年間) 快晴日数(年間) 降水日数(年間)
Formulae ofindicators 分母 Yearly sunshine hours Yearly precipitation Yearly clear days
Denominators
出典 Reference(注)項目欄に「*」の付されている項目は,都道府県庁所在地のデータである。
2)ただし,上記の気象項目については,埼玉県は熊谷市,東京都は千代田区,滋賀県は彦根市における気象台の観測値である。
3)ただし,埼玉県は熊谷市,千葉県は銚子市,東京都は千代田区,滋賀県は彦根市,山口県は下関市における気象台の観測値である。
降水日数(年間) 雪日数(年間)
Yearly rainy days Yearly snowy days
(日:days (日:daysPref.Code
MeanS.D.
※ ※
分子
降水日数(年間) 雪日数(年間)
Yearly rainy days Yearly snowy days 分母
出典
Note:Items with * refer to the cities with prefectural governments.2) However, Kumagaya-shi observations are used for Saitama-ken, Chiyoda-ku for Tokyo-to, and Hikone-shi for Shiga-ken.3) However, Kumagaya-shi observation is used for Saitama-ken, Choshi-shi for Chiba-ken, Chiyoda-ku for Tokyo-to, Hikone-shi for Shiga-ken,and Shimonoseki-shi for Yamaguchi-ken.
都道府県コー
ド
28

都道府県 日照時間(年間) 降水量(年間) 快晴日数(年間) 降水日数(年間)
Prefecture Yearly sunshine hours Yearly precipitation Yearly clear days Yearly rainy days
(時間:hours (日:days
全国 All Japan
北海道 Hokkaido青森県 Aomori-ken岩手県 Iwate-ken宮城県 Miyagi-ken秋田県 Akita-ken
山形県 Yamagata-ken福島県 Fukushima-ken茨城県 Ibaraki-ken栃木県 Tochigi-ken群馬県 Gumma-ken
埼玉県 Saitama-ken千葉県 Chiba-ken東京都 Tokyo-to神奈川県 Kanagawa-ken新潟県 Niigata-ken
富山県 Toyama-ken石川県 Ishikawa-ken福井県 Fukui-ken山梨県 Yamanashi-ken長野県 Nagano-ken
岐阜県 Gifu-ken静岡県 Shizuoka-ken愛知県 Aichi-ken三重県 Mie-ken滋賀県 Shiga-ken
京都府 Kyoto-fu大阪府 Osaka-fu兵庫県 Hyogo-ken奈良県 Nara-ken和歌山県 Wakayama-ken
鳥取県 Tottori-ken島根県 Shimane-ken岡山県 Okayama-ken広島県 Hiroshima-ken山口県 Yamaguchi-ken
徳島県 Tokushima-ken香川県 Kagawa-ken愛媛県 Ehime-ken高知県 Kochi-ken福岡県 Fukuoka-ken
佐賀県 Saga-ken長崎県 Nagasaki-ken熊本県 Kumamoto-ken大分県 Oita-ken宮崎県 Miyazaki-ken
鹿児島県 Kagoshima-ken沖縄県 Okinawa-ken
平均値 Mean標準偏差 Standard deviation
※ ※ ※
分子
指標計算式 Numerators 日照時間(年間) 降水量(年間) 快晴日数(年間) 降水日数(年間)
Formulae ofindicators 分母 Yearly sunshine hours Yearly precipitation Yearly clear days
Denominators
出典 Reference(注)項目欄に「*」の付されている項目は,都道府県庁所在地のデータである。
2)ただし,上記の気象項目については,埼玉県は熊谷市,東京都は千代田区,滋賀県は彦根市における気象台の観測値である。
3)ただし,埼玉県は熊谷市,千葉県は銚子市,東京都は千代田区,滋賀県は彦根市,山口県は下関市における気象台の観測値である。
降水日数(年間) 雪日数(年間)
Yearly rainy days Yearly snowy days
(日:days (日:daysPref.Code
MeanS.D.
※ ※
分子
降水日数(年間) 雪日数(年間)
Yearly rainy days Yearly snowy days 分母
出典
Note:Items with * refer to the cities with prefectural governments.2) However, Kumagaya-shi observations are used for Saitama-ken, Chiyoda-ku for Tokyo-to, and Hikone-shi for Shiga-ken.3) However, Kumagaya-shi observation is used for Saitama-ken, Choshi-shi for Chiba-ken, Chiyoda-ku for Tokyo-to, Hikone-shi for Shiga-ken,and Shimonoseki-shi for Yamaguchi-ken.
都道府県コー
ド
29

C.経済基盤 Economic Base1)県民経済計算 Prefectural economic accounts
都道府県 1人当たり県民所得 県内総生産額対前年増加率 県民所得対前年増加率 県民総所得対前年増加率(名目)
Prefecture Prefectural income per person Annual increase rate of grossprefectural product
Annual increase rate ofprefectural income
(千円:thousand yen (%) (%)
全国 All Japan
北海道 Hokkaido青森県 Aomori-ken岩手県 Iwate-ken宮城県 Miyagi-ken秋田県 Akita-ken
山形県 Yamagata-ken福島県 Fukushima-ken茨城県 Ibaraki-ken栃木県 Tochigi-ken群馬県 Gumma-ken
埼玉県 Saitama-ken千葉県 Chiba-ken東京都 Tokyo-to神奈川県 Kanagawa-ken新潟県 Niigata-ken
富山県 Toyama-ken石川県 Ishikawa-ken福井県 Fukui-ken山梨県 Yamanashi-ken長野県 Nagano-ken
岐阜県 Gifu-ken静岡県 Shizuoka-ken愛知県 Aichi-ken三重県 Mie-ken滋賀県 Shiga-ken
京都府 Kyoto-fu大阪府 Osaka-fu兵庫県 Hyogo-ken奈良県 Nara-ken和歌山県 Wakayama-ken
鳥取県 Tottori-ken島根県 Shimane-ken岡山県 Okayama-ken広島県 Hiroshima-ken山口県 Yamaguchi-ken
徳島県 Tokushima-ken香川県 Kagawa-ken愛媛県 Ehime-ken高知県 Kochi-ken福岡県 Fukuoka-ken
佐賀県 Saga-ken長崎県 Nagasaki-ken熊本県 Kumamoto-ken大分県 Oita-ken宮崎県 Miyazaki-ken
鹿児島県 Kagoshima-ken沖縄県 Okinawa-ken
平均値 Mean標準偏差 Standard deviation
※
分子 県内総生産額-県内総生産額(前年度) 県民所得-県民所得(前年度) 名目県民総所得-名目県民総所得(前年度)
指標計算式 Numerators 1人当たり県民所得Gross prefectural product - Gross prefectural
product (previous fiscal year)Prefectural income -
Prefectural income (previous fiscal year)
Formulae ofindicators 分母 Prefectural income per person 県内総生産額(前年度) 県民所得(前年度) 名目県民総所得(前年度)
Denominators Gross prefectural product(previous fiscal year)
Prefectural income(previous fiscal year)
出典 Reference
2)事業所数 Establishments
県民総所得対前年増加率(名目) 第2次産業事業所数構成比 第3次産業事業所数構成比
Annual increase rate of grossprefectural income (nominal)
Ratio of secondary industry establishments Ratio of tertiary industry establishments
(%) (%) (%)Pref.Code
MeanS.D.
名目県民総所得-名目県民総所得(前年度) 第2次産業事業所数 第3次産業事業所数 分子
(Nominal) Gross prefectural income - (Nominal) Grossprefectural income (previous fiscal year) Number of establishments (Secondary industry) Number of establishments (Tertiary industry) 指標計算式
名目県民総所得(前年度) 事業所数 事業所数 分母
(Nominal) Gross prefectural income(previous fiscal year) Number of establishments
出典
Number of establishments
都道府県コー
ド
30
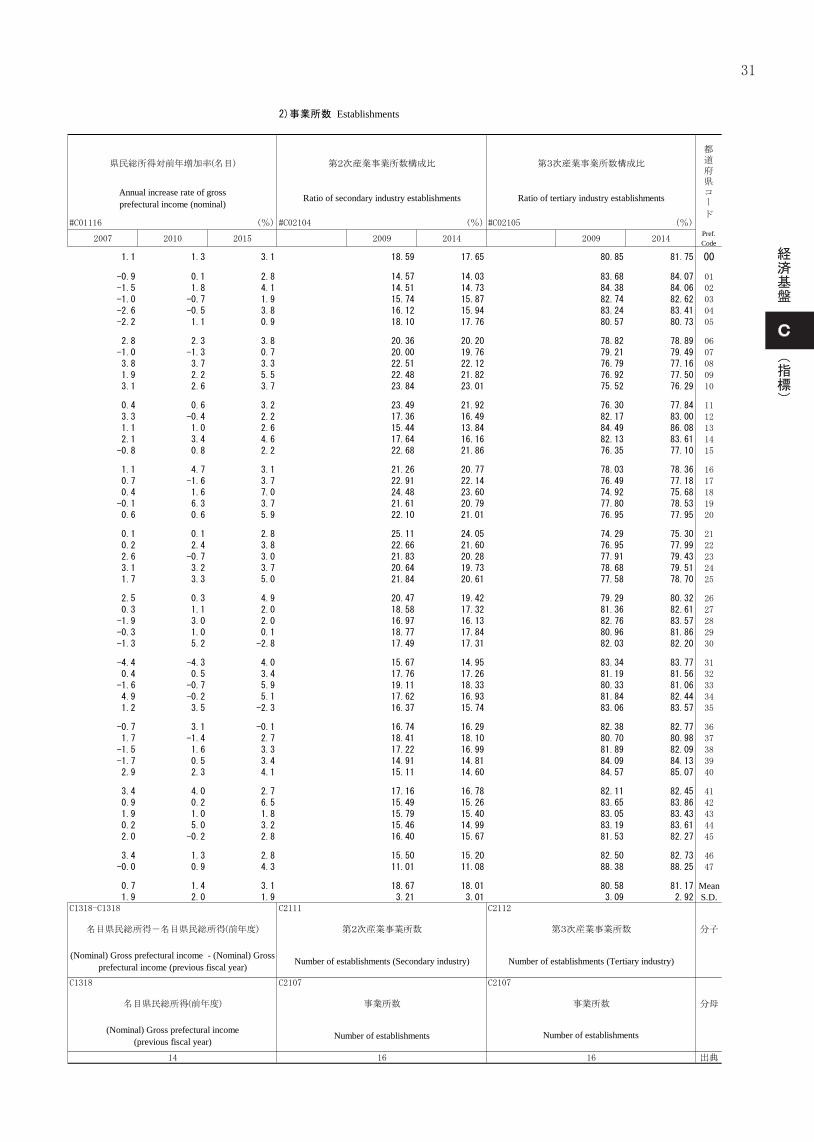
C.経済基盤 Economic Base1)県民経済計算 Prefectural economic accounts
都道府県 1人当たり県民所得 県内総生産額対前年増加率 県民所得対前年増加率 県民総所得対前年増加率(名目)
Prefecture Prefectural income per person Annual increase rate of grossprefectural product
Annual increase rate ofprefectural income
(千円:thousand yen (%) (%)
全国 All Japan
北海道 Hokkaido青森県 Aomori-ken岩手県 Iwate-ken宮城県 Miyagi-ken秋田県 Akita-ken
山形県 Yamagata-ken福島県 Fukushima-ken茨城県 Ibaraki-ken栃木県 Tochigi-ken群馬県 Gumma-ken
埼玉県 Saitama-ken千葉県 Chiba-ken東京都 Tokyo-to神奈川県 Kanagawa-ken新潟県 Niigata-ken
富山県 Toyama-ken石川県 Ishikawa-ken福井県 Fukui-ken山梨県 Yamanashi-ken長野県 Nagano-ken
岐阜県 Gifu-ken静岡県 Shizuoka-ken愛知県 Aichi-ken三重県 Mie-ken滋賀県 Shiga-ken
京都府 Kyoto-fu大阪府 Osaka-fu兵庫県 Hyogo-ken奈良県 Nara-ken和歌山県 Wakayama-ken
鳥取県 Tottori-ken島根県 Shimane-ken岡山県 Okayama-ken広島県 Hiroshima-ken山口県 Yamaguchi-ken
徳島県 Tokushima-ken香川県 Kagawa-ken愛媛県 Ehime-ken高知県 Kochi-ken福岡県 Fukuoka-ken
佐賀県 Saga-ken長崎県 Nagasaki-ken熊本県 Kumamoto-ken大分県 Oita-ken宮崎県 Miyazaki-ken
鹿児島県 Kagoshima-ken沖縄県 Okinawa-ken
平均値 Mean標準偏差 Standard deviation
※
分子 県内総生産額-県内総生産額(前年度) 県民所得-県民所得(前年度) 名目県民総所得-名目県民総所得(前年度)
指標計算式 Numerators 1人当たり県民所得Gross prefectural product - Gross prefectural
product (previous fiscal year)Prefectural income -
Prefectural income (previous fiscal year)
Formulae ofindicators 分母 Prefectural income per person 県内総生産額(前年度) 県民所得(前年度) 名目県民総所得(前年度)
Denominators Gross prefectural product(previous fiscal year)
Prefectural income(previous fiscal year)
出典 Reference
2)事業所数 Establishments
県民総所得対前年増加率(名目) 第2次産業事業所数構成比 第3次産業事業所数構成比
Annual increase rate of grossprefectural income (nominal)
Ratio of secondary industry establishments Ratio of tertiary industry establishments
(%) (%) (%)Pref.Code
MeanS.D.
名目県民総所得-名目県民総所得(前年度) 第2次産業事業所数 第3次産業事業所数 分子
(Nominal) Gross prefectural income - (Nominal) Grossprefectural income (previous fiscal year) Number of establishments (Secondary industry) Number of establishments (Tertiary industry) 指標計算式
名目県民総所得(前年度) 事業所数 事業所数 分母
(Nominal) Gross prefectural income(previous fiscal year) Number of establishments
出典
Number of establishments
都道府県コー
ド
31
C
経済基盤
(指標)

都道府県 従業者1~4人の事業所割合(民営) 従業者5~9人の事業所割合(民営) 従業者10~29人の事業所割合(民営) 従業者100~299人の事業所割合(民営)
Prefecture Ratio of private establishmentswith 1-4 persons
Ratio of private establishmentswith 5-9 persons
Ratio of private establishmentswith 10-29 persons
Ratio of private establishmentswith 100-299 persons
(%) (%) (%)
全国 All Japan
北海道 Hokkaido青森県 Aomori-ken岩手県 Iwate-ken宮城県 Miyagi-ken秋田県 Akita-ken
山形県 Yamagata-ken福島県 Fukushima-ken茨城県 Ibaraki-ken栃木県 Tochigi-ken群馬県 Gumma-ken
埼玉県 Saitama-ken千葉県 Chiba-ken東京都 Tokyo-to神奈川県 Kanagawa-ken新潟県 Niigata-ken
富山県 Toyama-ken石川県 Ishikawa-ken福井県 Fukui-ken山梨県 Yamanashi-ken長野県 Nagano-ken
岐阜県 Gifu-ken静岡県 Shizuoka-ken愛知県 Aichi-ken三重県 Mie-ken滋賀県 Shiga-ken
京都府 Kyoto-fu大阪府 Osaka-fu兵庫県 Hyogo-ken奈良県 Nara-ken和歌山県 Wakayama-ken
鳥取県 Tottori-ken島根県 Shimane-ken岡山県 Okayama-ken広島県 Hiroshima-ken山口県 Yamaguchi-ken
徳島県 Tokushima-ken香川県 Kagawa-ken愛媛県 Ehime-ken高知県 Kochi-ken福岡県 Fukuoka-ken
佐賀県 Saga-ken長崎県 Nagasaki-ken熊本県 Kumamoto-ken大分県 Oita-ken宮崎県 Miyazaki-ken
鹿児島県 Kagoshima-ken沖縄県 Okinawa-ken
平均値 Mean標準偏差 Standard deviation
分子 従業者1~4人の民営事業所数 従業者5~9人の民営事業所数 従業者10~29人の民営事業所数 従業者100~299人の民営事業所数
指標計算式 Numerators Number of privately owned establishments(1-4 employees)
Number of privately owned establishments(5-9 employees)
Number of privately owned establishments(10-29 employees)
Formulae ofindicators 分母 民営事業所数 民営事業所数 民営事業所数 民営事業所数
Denominators Number of establishments(privately owned)
Number of establishments (privately owned)
Number of establishments(privately owned)
Number of establishments(privately owned)
出典 Reference
3)従業者数 Persons at work
従業者100~299人の事業所割合(民営) 従業者300人以上の事業所割合(民営)従業者1~4人の事業所の従業者割合
(民営)
Ratio of private establishmentswith 100-299 persons
Ratio of private establishmentswith 300 persons and over
Ratio of persons in privateestablishments with 1-4 persons
(%) (%) (%)Pref.Code
MeanS.D.
従業者100~299人の民営事業所数 従業者300人以上の民営事業所数 従業者1~4人の民営事業所の従業者数 分子
Number of privately owned establishments(100-299 employees)
Number of privately owned establishments(300 and over employees)
Number of persons engaged(privately owned, 1-4 employees) 指標計算式
民営事業所数 民営事業所数 民営事業所従業者数 分母
Number of establishments(privately owned)
Number of establishments(privately owned)
Number of persons engaged(privately owned establishments)
出典
都道府県コー
ド
32

都道府県 従業者1~4人の事業所割合(民営) 従業者5~9人の事業所割合(民営) 従業者10~29人の事業所割合(民営) 従業者100~299人の事業所割合(民営)
Prefecture Ratio of private establishmentswith 1-4 persons
Ratio of private establishmentswith 5-9 persons
Ratio of private establishmentswith 10-29 persons
Ratio of private establishmentswith 100-299 persons
(%) (%) (%)
全国 All Japan
北海道 Hokkaido青森県 Aomori-ken岩手県 Iwate-ken宮城県 Miyagi-ken秋田県 Akita-ken
山形県 Yamagata-ken福島県 Fukushima-ken茨城県 Ibaraki-ken栃木県 Tochigi-ken群馬県 Gumma-ken
埼玉県 Saitama-ken千葉県 Chiba-ken東京都 Tokyo-to神奈川県 Kanagawa-ken新潟県 Niigata-ken
富山県 Toyama-ken石川県 Ishikawa-ken福井県 Fukui-ken山梨県 Yamanashi-ken長野県 Nagano-ken
岐阜県 Gifu-ken静岡県 Shizuoka-ken愛知県 Aichi-ken三重県 Mie-ken滋賀県 Shiga-ken
京都府 Kyoto-fu大阪府 Osaka-fu兵庫県 Hyogo-ken奈良県 Nara-ken和歌山県 Wakayama-ken
鳥取県 Tottori-ken島根県 Shimane-ken岡山県 Okayama-ken広島県 Hiroshima-ken山口県 Yamaguchi-ken
徳島県 Tokushima-ken香川県 Kagawa-ken愛媛県 Ehime-ken高知県 Kochi-ken福岡県 Fukuoka-ken
佐賀県 Saga-ken長崎県 Nagasaki-ken熊本県 Kumamoto-ken大分県 Oita-ken宮崎県 Miyazaki-ken
鹿児島県 Kagoshima-ken沖縄県 Okinawa-ken
平均値 Mean標準偏差 Standard deviation
分子 従業者1~4人の民営事業所数 従業者5~9人の民営事業所数 従業者10~29人の民営事業所数 従業者100~299人の民営事業所数
指標計算式 Numerators Number of privately owned establishments(1-4 employees)
Number of privately owned establishments(5-9 employees)
Number of privately owned establishments(10-29 employees)
Formulae ofindicators 分母 民営事業所数 民営事業所数 民営事業所数 民営事業所数
Denominators Number of establishments(privately owned)
Number of establishments (privately owned)
Number of establishments(privately owned)
Number of establishments(privately owned)
出典 Reference
3)従業者数 Persons at work
従業者100~299人の事業所割合(民営) 従業者300人以上の事業所割合(民営)従業者1~4人の事業所の従業者割合
(民営)
Ratio of private establishmentswith 100-299 persons
Ratio of private establishmentswith 300 persons and over
Ratio of persons in privateestablishments with 1-4 persons
(%) (%) (%)Pref.Code
MeanS.D.
従業者100~299人の民営事業所数 従業者300人以上の民営事業所数 従業者1~4人の民営事業所の従業者数 分子
Number of privately owned establishments(100-299 employees)
Number of privately owned establishments(300 and over employees)
Number of persons engaged(privately owned, 1-4 employees) 指標計算式
民営事業所数 民営事業所数 民営事業所従業者数 分母
Number of establishments(privately owned)
Number of establishments(privately owned)
Number of persons engaged(privately owned establishments)
出典
都道府県コー
ド
33

都道府県従業者5~9人の事業所の従業者割合
(民営)従業者10~29人の事業所の従業者割合
(民営)従業者100~299人の事業所の従業者割合
(民営)従業者300人以上の事業所の従業者割合
(民営)
Prefecture Ratio of persons in privateestablishments with 5-9 persons
Ratio of persons in privateestablishments with 10-29 persons
Ratio of persons in privateestablishments with 100-299 persons
(%) (%) (%)
全国 All Japan
北海道 Hokkaido青森県 Aomori-ken岩手県 Iwate-ken宮城県 Miyagi-ken秋田県 Akita-ken
山形県 Yamagata-ken福島県 Fukushima-ken茨城県 Ibaraki-ken栃木県 Tochigi-ken群馬県 Gumma-ken
埼玉県 Saitama-ken千葉県 Chiba-ken東京都 Tokyo-to神奈川県 Kanagawa-ken新潟県 Niigata-ken
富山県 Toyama-ken石川県 Ishikawa-ken福井県 Fukui-ken山梨県 Yamanashi-ken長野県 Nagano-ken
岐阜県 Gifu-ken静岡県 Shizuoka-ken愛知県 Aichi-ken三重県 Mie-ken滋賀県 Shiga-ken
京都府 Kyoto-fu大阪府 Osaka-fu兵庫県 Hyogo-ken奈良県 Nara-ken和歌山県 Wakayama-ken
鳥取県 Tottori-ken島根県 Shimane-ken岡山県 Okayama-ken広島県 Hiroshima-ken山口県 Yamaguchi-ken
徳島県 Tokushima-ken香川県 Kagawa-ken愛媛県 Ehime-ken高知県 Kochi-ken福岡県 Fukuoka-ken
佐賀県 Saga-ken長崎県 Nagasaki-ken熊本県 Kumamoto-ken大分県 Oita-ken宮崎県 Miyazaki-ken
鹿児島県 Kagoshima-ken沖縄県 Okinawa-ken
平均値 Mean標準偏差 Standard deviation
分子 従業者5~9人の民営事業所の従業者数 従業者10~29人の民営事業所の従業者数従業者100~299人の民営事業所の従業者
数従業者300人以上の民営事業所の従業者数
指標計算式 Numerators Number of persons engaged(privately owned, 5-9 employees)
Number of persons engaged(privately owned, 10-29 employees)
Number of persons engaged(privately owned, 100-299 employees)
Formulae ofindicators 分母 民営事業所従業者数 民営事業所従業者数 民営事業所従業者数 民営事業所従業者数
Denominators Number of persons engaged(privately owned establishments)
Number of persons engaged(privately owned establishments)
Number of persons engaged(privately owned establishments)
出典 Reference
従業者300人以上の事業所の従業者割合(民営)
第2次産業従業者数(1事業所当たり) 第3次産業従業者数(1事業所当たり)
Ratio of persons in privateestablishments with 300 persons and over
Persons in secondary industry (per establishment) Persons in tertiary industry eating anddrinking places, etc. (per establishment)
(%) (人:person (人:personPref.Code
MeanS.D.
従業者300人以上の民営事業所の従業者数 第2次産業従業者数 第3次産業従業者数 分子
Number of persons engaged(privately owned, 300 and over employees) Number of persons engaged (Secondary industry) Number of persons engaged (Tertiary industry) 指標計算式
民営事業所従業者数 第2次産業事業所数 第3次産業事業所数 分母
Number of persons engaged(privately owned establishments) Number of establishments (Secondary industry) Number of establishments (Tertiary industry)
出典
都道府県コー
ド
34

都道府県従業者5~9人の事業所の従業者割合
(民営)従業者10~29人の事業所の従業者割合
(民営)従業者100~299人の事業所の従業者割合
(民営)従業者300人以上の事業所の従業者割合
(民営)
Prefecture Ratio of persons in privateestablishments with 5-9 persons
Ratio of persons in privateestablishments with 10-29 persons
Ratio of persons in privateestablishments with 100-299 persons
(%) (%) (%)
全国 All Japan
北海道 Hokkaido青森県 Aomori-ken岩手県 Iwate-ken宮城県 Miyagi-ken秋田県 Akita-ken
山形県 Yamagata-ken福島県 Fukushima-ken茨城県 Ibaraki-ken栃木県 Tochigi-ken群馬県 Gumma-ken
埼玉県 Saitama-ken千葉県 Chiba-ken東京都 Tokyo-to神奈川県 Kanagawa-ken新潟県 Niigata-ken
富山県 Toyama-ken石川県 Ishikawa-ken福井県 Fukui-ken山梨県 Yamanashi-ken長野県 Nagano-ken
岐阜県 Gifu-ken静岡県 Shizuoka-ken愛知県 Aichi-ken三重県 Mie-ken滋賀県 Shiga-ken
京都府 Kyoto-fu大阪府 Osaka-fu兵庫県 Hyogo-ken奈良県 Nara-ken和歌山県 Wakayama-ken
鳥取県 Tottori-ken島根県 Shimane-ken岡山県 Okayama-ken広島県 Hiroshima-ken山口県 Yamaguchi-ken
徳島県 Tokushima-ken香川県 Kagawa-ken愛媛県 Ehime-ken高知県 Kochi-ken福岡県 Fukuoka-ken
佐賀県 Saga-ken長崎県 Nagasaki-ken熊本県 Kumamoto-ken大分県 Oita-ken宮崎県 Miyazaki-ken
鹿児島県 Kagoshima-ken沖縄県 Okinawa-ken
平均値 Mean標準偏差 Standard deviation
分子 従業者5~9人の民営事業所の従業者数 従業者10~29人の民営事業所の従業者数従業者100~299人の民営事業所の従業者
数従業者300人以上の民営事業所の従業者数
指標計算式 Numerators Number of persons engaged(privately owned, 5-9 employees)
Number of persons engaged(privately owned, 10-29 employees)
Number of persons engaged(privately owned, 100-299 employees)
Formulae ofindicators 分母 民営事業所従業者数 民営事業所従業者数 民営事業所従業者数 民営事業所従業者数
Denominators Number of persons engaged(privately owned establishments)
Number of persons engaged(privately owned establishments)
Number of persons engaged(privately owned establishments)
出典 Reference
従業者300人以上の事業所の従業者割合(民営)
第2次産業従業者数(1事業所当たり) 第3次産業従業者数(1事業所当たり)
Ratio of persons in privateestablishments with 300 persons and over
Persons in secondary industry (per establishment) Persons in tertiary industry eating anddrinking places, etc. (per establishment)
(%) (人:person (人:personPref.Code
MeanS.D.
従業者300人以上の民営事業所の従業者数 第2次産業従業者数 第3次産業従業者数 分子
Number of persons engaged(privately owned, 300 and over employees) Number of persons engaged (Secondary industry) Number of persons engaged (Tertiary industry) 指標計算式
民営事業所従業者数 第2次産業事業所数 第3次産業事業所数 分母
Number of persons engaged(privately owned establishments) Number of establishments (Secondary industry) Number of establishments (Tertiary industry)
出典
都道府県コー
ド
35

4)産業別生産額等 Production by industrial sector
都道府県 就業者1人当たり農業産出額(販売農家) 耕地面積比率土地生産性
(耕地面積1ヘクタール当たり)耕地面積(農家1戸当たり)
Prefecture Gross agricultural product per agriculturalworker (commercial farm households)
Ratio of cultivated land area Land productivity (per hectare of cultivatedland area) Cultivated land area (per farm household)
(万円:10 thousand yen (%) (万円:10 thousand yen
全国 All Japan
北海道 Hokkaido青森県 Aomori-ken岩手県 Iwate-ken宮城県 Miyagi-ken秋田県 Akita-ken
山形県 Yamagata-ken福島県 Fukushima-ken茨城県 Ibaraki-ken栃木県 Tochigi-ken群馬県 Gumma-ken
埼玉県 Saitama-ken千葉県 Chiba-ken東京都 Tokyo-to神奈川県 Kanagawa-ken新潟県 Niigata-ken
富山県 Toyama-ken石川県 Ishikawa-ken福井県 Fukui-ken山梨県 Yamanashi-ken長野県 Nagano-ken
岐阜県 Gifu-ken静岡県 Shizuoka-ken愛知県 Aichi-ken三重県 Mie-ken滋賀県 Shiga-ken
京都府 Kyoto-fu大阪府 Osaka-fu兵庫県 Hyogo-ken奈良県 Nara-ken和歌山県 Wakayama-ken
鳥取県 Tottori-ken島根県 Shimane-ken岡山県 Okayama-ken広島県 Hiroshima-ken山口県 Yamaguchi-ken
徳島県 Tokushima-ken香川県 Kagawa-ken愛媛県 Ehime-ken高知県 Kochi-ken福岡県 Fukuoka-ken
佐賀県 Saga-ken長崎県 Nagasaki-ken熊本県 Kumamoto-ken大分県 Oita-ken宮崎県 Miyazaki-ken
鹿児島県 Kagoshima-ken沖縄県 Okinawa-ken
平均値 Mean標準偏差 Standard deviation
分子 農業産出額 耕地面積 農業産出額 耕地面積
指標計算式 Numerators Gross agricultural product Cultivated land area Gross agricultural product Cultivated land area
Formulae ofindicators 分母 農業就業人口(販売農家) 総面積(北方地域及び竹島を除く) 耕地面積 農家数
Denominators Population engaged in farming(Commercial farm households)
Total land area (Excl. the northern territoriesand Takeshima)
Cultivated land area No. of farm households
出典 Reference
耕地面積(農家1戸当たり) 製造品出荷額等(従業者1人当たり) 製造品出荷額等(1事業所当たり)
Cultivated land area (per farm household) Shipments of manufactured goods (per employee) Value of manufactured goods shipments,etc. (per establishment)
(㎡) (万円:10 thousand yen (百万円:million yenPref.Code
MeanS.D.
耕地面積 製造品出荷額等 製造品出荷額等 分子
Cultivated land area Value of manufactured goods shipments, etc. Value of manufactured goods shipments, etc. 指標計算式
農家数 製造業従業者数 製造業事業所数 分母
No. of farm households Number of manufacturing employees Number of manufacturing establishments
出典
都道府県コー
ド
36
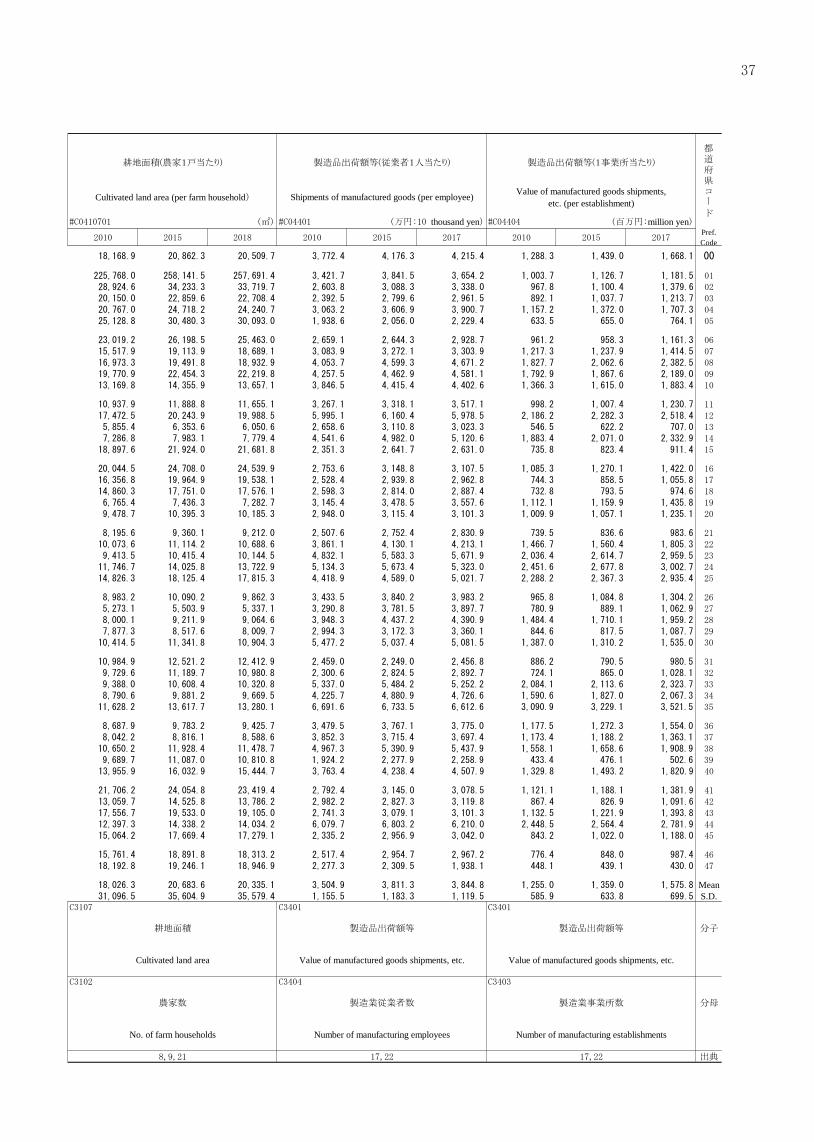
4)産業別生産額等 Production by industrial sector
都道府県 就業者1人当たり農業産出額(販売農家) 耕地面積比率土地生産性
(耕地面積1ヘクタール当たり)耕地面積(農家1戸当たり)
Prefecture Gross agricultural product per agriculturalworker (commercial farm households)
Ratio of cultivated land area Land productivity (per hectare of cultivatedland area) Cultivated land area (per farm household)
(万円:10 thousand yen (%) (万円:10 thousand yen
全国 All Japan
北海道 Hokkaido青森県 Aomori-ken岩手県 Iwate-ken宮城県 Miyagi-ken秋田県 Akita-ken
山形県 Yamagata-ken福島県 Fukushima-ken茨城県 Ibaraki-ken栃木県 Tochigi-ken群馬県 Gumma-ken
埼玉県 Saitama-ken千葉県 Chiba-ken東京都 Tokyo-to神奈川県 Kanagawa-ken新潟県 Niigata-ken
富山県 Toyama-ken石川県 Ishikawa-ken福井県 Fukui-ken山梨県 Yamanashi-ken長野県 Nagano-ken
岐阜県 Gifu-ken静岡県 Shizuoka-ken愛知県 Aichi-ken三重県 Mie-ken滋賀県 Shiga-ken
京都府 Kyoto-fu大阪府 Osaka-fu兵庫県 Hyogo-ken奈良県 Nara-ken和歌山県 Wakayama-ken
鳥取県 Tottori-ken島根県 Shimane-ken岡山県 Okayama-ken広島県 Hiroshima-ken山口県 Yamaguchi-ken
徳島県 Tokushima-ken香川県 Kagawa-ken愛媛県 Ehime-ken高知県 Kochi-ken福岡県 Fukuoka-ken
佐賀県 Saga-ken長崎県 Nagasaki-ken熊本県 Kumamoto-ken大分県 Oita-ken宮崎県 Miyazaki-ken
鹿児島県 Kagoshima-ken沖縄県 Okinawa-ken
平均値 Mean標準偏差 Standard deviation
分子 農業産出額 耕地面積 農業産出額 耕地面積
指標計算式 Numerators Gross agricultural product Cultivated land area Gross agricultural product Cultivated land area
Formulae ofindicators 分母 農業就業人口(販売農家) 総面積(北方地域及び竹島を除く) 耕地面積 農家数
Denominators Population engaged in farming(Commercial farm households)
Total land area (Excl. the northern territoriesand Takeshima)
Cultivated land area No. of farm households
出典 Reference
耕地面積(農家1戸当たり) 製造品出荷額等(従業者1人当たり) 製造品出荷額等(1事業所当たり)
Cultivated land area (per farm household) Shipments of manufactured goods (per employee) Value of manufactured goods shipments,etc. (per establishment)
(㎡) (万円:10 thousand yen (百万円:million yenPref.Code
MeanS.D.
耕地面積 製造品出荷額等 製造品出荷額等 分子
Cultivated land area Value of manufactured goods shipments, etc. Value of manufactured goods shipments, etc. 指標計算式
農家数 製造業従業者数 製造業事業所数 分母
No. of farm households Number of manufacturing employees Number of manufacturing establishments
出典
都道府県コー
ド
37

都道府県商業年間商品販売額(卸売業+小売業)
(従業者1人当たり)商業年間商品販売額(卸売業+小売業)
(事業所当たり)郵便貯金残高(人口1人当たり) 国内銀行預金残高(人口1人当たり)
Prefecture Annual sales of commercial goods(wholesale and retail trade) (per employee)
Annual sales of commercial goods (wholesale andretail trade) (per establishment) Outstanding post-office savings (per capita)
(万円:10 thousand yen (百万円:million yen (万円:10 thousand yen
全国 All Japan
北海道 Hokkaido青森県 Aomori-ken岩手県 Iwate-ken宮城県 Miyagi-ken秋田県 Akita-ken
山形県 Yamagata-ken福島県 Fukushima-ken茨城県 Ibaraki-ken栃木県 Tochigi-ken群馬県 Gumma-ken
埼玉県 Saitama-ken千葉県 Chiba-ken東京都 Tokyo-to神奈川県 Kanagawa-ken新潟県 Niigata-ken
富山県 Toyama-ken石川県 Ishikawa-ken福井県 Fukui-ken山梨県 Yamanashi-ken長野県 Nagano-ken
岐阜県 Gifu-ken静岡県 Shizuoka-ken愛知県 Aichi-ken三重県 Mie-ken滋賀県 Shiga-ken
京都府 Kyoto-fu大阪府 Osaka-fu兵庫県 Hyogo-ken奈良県 Nara-ken和歌山県 Wakayama-ken
鳥取県 Tottori-ken島根県 Shimane-ken岡山県 Okayama-ken広島県 Hiroshima-ken山口県 Yamaguchi-ken
徳島県 Tokushima-ken香川県 Kagawa-ken愛媛県 Ehime-ken高知県 Kochi-ken福岡県 Fukuoka-ken
佐賀県 Saga-ken長崎県 Nagasaki-ken熊本県 Kumamoto-ken大分県 Oita-ken宮崎県 Miyazaki-ken
鹿児島県 Kagoshima-ken沖縄県 Okinawa-ken
平均値 Mean標準偏差 Standard deviation
分子 商業年間商品販売額(卸売業+小売業) 商業年間商品販売額(卸売業+小売業) 郵便貯金残高 国内銀行預金残高
指標計算式 Numerators Annual sales of commercial goods(wholesale and retail trade)
Annual sales of commercial goods(wholesale and retail trade)
Outstanding post-office savings
Formulae ofindicators 分母 商業従業者数(卸売業+小売業) 商業事業所数(卸売業+小売業) 総人口 総人口
Denominators Total number of employees(wholesale and retail trade)
Number of establishments(wholesale and retail trade) Total population (Both sexes) Total population (Both sexes)
出典 Reference(注)項目欄に「*」の付されている項目は,都道府県庁所在市のデータである。
Note:Items with * refer to the cities with prefectural governments.
5)物価 Prices
国内銀行預金残高(人口1人当たり) 消費者物価指数対前年変化率(総合)消費者物価指数対前年変化率(総合:持ち家の帰属家賃を除く)
Outstanding of deposits ofdomestically licensed banks (per capita)
Rate of Change in CPI(all items)
Rate of Change in CPI(all items, less imputed rent)
(万円:10 thousand yen (%) (%)Pref.Code
MeanS.D.
※ ※
国内銀行預金残高 分子
Outstanding of deposits of domestically licensed banks 消費者物価指数変化率(総合)
消費者物価指数変化率(総合:持ち家の帰属家賃を除く)
指標計算式
総人口(Changes from the previous year (%))
Consumer Price Index (All items)(Changes from the previous year (%)) Consumer Price Index
(All items, less imputed rent) 分母
Total population (Both sexes)
出典
都道府県コー
ド
38

都道府県商業年間商品販売額(卸売業+小売業)
(従業者1人当たり)商業年間商品販売額(卸売業+小売業)
(事業所当たり)郵便貯金残高(人口1人当たり) 国内銀行預金残高(人口1人当たり)
Prefecture Annual sales of commercial goods(wholesale and retail trade) (per employee)
Annual sales of commercial goods (wholesale andretail trade) (per establishment) Outstanding post-office savings (per capita)
(万円:10 thousand yen (百万円:million yen (万円:10 thousand yen
全国 All Japan
北海道 Hokkaido青森県 Aomori-ken岩手県 Iwate-ken宮城県 Miyagi-ken秋田県 Akita-ken
山形県 Yamagata-ken福島県 Fukushima-ken茨城県 Ibaraki-ken栃木県 Tochigi-ken群馬県 Gumma-ken
埼玉県 Saitama-ken千葉県 Chiba-ken東京都 Tokyo-to神奈川県 Kanagawa-ken新潟県 Niigata-ken
富山県 Toyama-ken石川県 Ishikawa-ken福井県 Fukui-ken山梨県 Yamanashi-ken長野県 Nagano-ken
岐阜県 Gifu-ken静岡県 Shizuoka-ken愛知県 Aichi-ken三重県 Mie-ken滋賀県 Shiga-ken
京都府 Kyoto-fu大阪府 Osaka-fu兵庫県 Hyogo-ken奈良県 Nara-ken和歌山県 Wakayama-ken
鳥取県 Tottori-ken島根県 Shimane-ken岡山県 Okayama-ken広島県 Hiroshima-ken山口県 Yamaguchi-ken
徳島県 Tokushima-ken香川県 Kagawa-ken愛媛県 Ehime-ken高知県 Kochi-ken福岡県 Fukuoka-ken
佐賀県 Saga-ken長崎県 Nagasaki-ken熊本県 Kumamoto-ken大分県 Oita-ken宮崎県 Miyazaki-ken
鹿児島県 Kagoshima-ken沖縄県 Okinawa-ken
平均値 Mean標準偏差 Standard deviation
分子 商業年間商品販売額(卸売業+小売業) 商業年間商品販売額(卸売業+小売業) 郵便貯金残高 国内銀行預金残高
指標計算式 Numerators Annual sales of commercial goods(wholesale and retail trade)
Annual sales of commercial goods(wholesale and retail trade)
Outstanding post-office savings
Formulae ofindicators 分母 商業従業者数(卸売業+小売業) 商業事業所数(卸売業+小売業) 総人口 総人口
Denominators Total number of employees(wholesale and retail trade)
Number of establishments(wholesale and retail trade) Total population (Both sexes) Total population (Both sexes)
出典 Reference(注)項目欄に「*」の付されている項目は,都道府県庁所在市のデータである。
Note:Items with * refer to the cities with prefectural governments.
5)物価 Prices
国内銀行預金残高(人口1人当たり) 消費者物価指数対前年変化率(総合)消費者物価指数対前年変化率(総合:持ち家の帰属家賃を除く)
Outstanding of deposits ofdomestically licensed banks (per capita)
Rate of Change in CPI(all items)
Rate of Change in CPI(all items, less imputed rent)
(万円:10 thousand yen (%) (%)Pref.Code
MeanS.D.
※ ※
国内銀行預金残高 分子
Outstanding of deposits of domestically licensed banks 消費者物価指数変化率(総合)
消費者物価指数変化率(総合:持ち家の帰属家賃を除く)
指標計算式
総人口(Changes from the previous year (%))
Consumer Price Index (All items)(Changes from the previous year (%)) Consumer Price Index
(All items, less imputed rent) 分母
Total population (Both sexes)
出典
都道府県コー
ド
39

都道府県消費者物価指数対前年変化率
(総合:生鮮食品を除く)消費者物価指数対前年変化率
(総合:生鮮食品及びエネルギーを除く)
消費者物価指数対前年変化率(総合:食料(酒類を除く)及びエネルギー
を除く)消費者物価指数対前年変化率(食料)
Prefecture Rate of Change in CPI(all items, less fresh food)
Rate of Change in CPI(All items, less fresh food and energy)
Rate of Change in CPI(all items, less food(less alcoholic beverages) and energy)
Rate of Change in CPI(food)
(%) (%) (%)
全国 All Japan
北海道 Hokkaido青森県 Aomori-ken岩手県 Iwate-ken宮城県 Miyagi-ken秋田県 Akita-ken
山形県 Yamagata-ken福島県 Fukushima-ken茨城県 Ibaraki-ken栃木県 Tochigi-ken群馬県 Gumma-ken
埼玉県 Saitama-ken千葉県 Chiba-ken東京都 Tokyo-to神奈川県 Kanagawa-ken新潟県 Niigata-ken
富山県 Toyama-ken石川県 Ishikawa-ken福井県 Fukui-ken山梨県 Yamanashi-ken長野県 Nagano-ken
岐阜県 Gifu-ken静岡県 Shizuoka-ken愛知県 Aichi-ken三重県 Mie-ken滋賀県 Shiga-ken
京都府 Kyoto-fu大阪府 Osaka-fu兵庫県 Hyogo-ken奈良県 Nara-ken和歌山県 Wakayama-ken
鳥取県 Tottori-ken島根県 Shimane-ken岡山県 Okayama-ken広島県 Hiroshima-ken山口県 Yamaguchi-ken
徳島県 Tokushima-ken香川県 Kagawa-ken愛媛県 Ehime-ken高知県 Kochi-ken福岡県 Fukuoka-ken
佐賀県 Saga-ken長崎県 Nagasaki-ken熊本県 Kumamoto-ken大分県 Oita-ken宮崎県 Miyazaki-ken
鹿児島県 Kagoshima-ken沖縄県 Okinawa-ken
平均値 Mean標準偏差 Standard deviation
※ ※ ※
分子
指標計算式 Numerators 消費者物価指数変化率(総合:生鮮食品を除く)
消費者物価指数変化率(総合:生鮮食品及びエネルギーを除く)
消費者物価指数変化率(総合:食料(酒類を除く)及びエネルギーを除
く)
消費者物価指数変化率食料
Formulae ofindicators 分母
(Changes from the previous year (%)) ConsumerPrice Index (All items, less fresh food)
(Changes from the previous year (%)) ConsumerPrice Index (All items, less fresh food and energy)
(Changes from the previous year (%))Consumer Price Index (All items, less food (less
alcoholic beverages) and energy)
Denominators
出典 Reference(注)項目欄に「*」の付されている項目は,都道府県庁所在市のデータである。
Note:Items with * refer to the cities with prefectural governments.
消費者物価指数対前年変化率(食料) 消費者物価指数対前年変化率(住居)消費者物価指数対前年変化率
(光熱・水道)
Rate of Change in CPI(food)
Rate of Change in CPI(housing)
Rate of Change in CPI(fuel, light & water charges)
(%) (%) (%)Pref.Code
MeanS.D.
※ ※ ※
分子
消費者物価指数変化率食料
消費者物価指数変化率住居
消費者物価指数変化率光熱・水道
指標計算式
(Changes from the previous year (%))Consumer Price Index (Food)
(Changes from the previous year (%))Consumer Price Index (Housing, more imputed rent)
(Changes from the previous year (%)) Consumer Price Index(Fuel, light & water charges) 分母
出典
都道府県コー
ド
40

都道府県消費者物価指数対前年変化率
(総合:生鮮食品を除く)消費者物価指数対前年変化率
(総合:生鮮食品及びエネルギーを除く)
消費者物価指数対前年変化率(総合:食料(酒類を除く)及びエネルギー
を除く)消費者物価指数対前年変化率(食料)
Prefecture Rate of Change in CPI(all items, less fresh food)
Rate of Change in CPI(All items, less fresh food and energy)
Rate of Change in CPI(all items, less food(less alcoholic beverages) and energy)
Rate of Change in CPI(food)
(%) (%) (%)
全国 All Japan
北海道 Hokkaido青森県 Aomori-ken岩手県 Iwate-ken宮城県 Miyagi-ken秋田県 Akita-ken
山形県 Yamagata-ken福島県 Fukushima-ken茨城県 Ibaraki-ken栃木県 Tochigi-ken群馬県 Gumma-ken
埼玉県 Saitama-ken千葉県 Chiba-ken東京都 Tokyo-to神奈川県 Kanagawa-ken新潟県 Niigata-ken
富山県 Toyama-ken石川県 Ishikawa-ken福井県 Fukui-ken山梨県 Yamanashi-ken長野県 Nagano-ken
岐阜県 Gifu-ken静岡県 Shizuoka-ken愛知県 Aichi-ken三重県 Mie-ken滋賀県 Shiga-ken
京都府 Kyoto-fu大阪府 Osaka-fu兵庫県 Hyogo-ken奈良県 Nara-ken和歌山県 Wakayama-ken
鳥取県 Tottori-ken島根県 Shimane-ken岡山県 Okayama-ken広島県 Hiroshima-ken山口県 Yamaguchi-ken
徳島県 Tokushima-ken香川県 Kagawa-ken愛媛県 Ehime-ken高知県 Kochi-ken福岡県 Fukuoka-ken
佐賀県 Saga-ken長崎県 Nagasaki-ken熊本県 Kumamoto-ken大分県 Oita-ken宮崎県 Miyazaki-ken
鹿児島県 Kagoshima-ken沖縄県 Okinawa-ken
平均値 Mean標準偏差 Standard deviation
※ ※ ※
分子
指標計算式 Numerators 消費者物価指数変化率(総合:生鮮食品を除く)
消費者物価指数変化率(総合:生鮮食品及びエネルギーを除く)
消費者物価指数変化率(総合:食料(酒類を除く)及びエネルギーを除
く)
消費者物価指数変化率食料
Formulae ofindicators 分母
(Changes from the previous year (%)) ConsumerPrice Index (All items, less fresh food)
(Changes from the previous year (%)) ConsumerPrice Index (All items, less fresh food and energy)
(Changes from the previous year (%))Consumer Price Index (All items, less food (less
alcoholic beverages) and energy)
Denominators
出典 Reference(注)項目欄に「*」の付されている項目は,都道府県庁所在市のデータである。
Note:Items with * refer to the cities with prefectural governments.
消費者物価指数対前年変化率(食料) 消費者物価指数対前年変化率(住居)消費者物価指数対前年変化率
(光熱・水道)
Rate of Change in CPI(food)
Rate of Change in CPI(housing)
Rate of Change in CPI(fuel, light & water charges)
(%) (%) (%)Pref.Code
MeanS.D.
※ ※ ※
分子
消費者物価指数変化率食料
消費者物価指数変化率住居
消費者物価指数変化率光熱・水道
指標計算式
(Changes from the previous year (%))Consumer Price Index (Food)
(Changes from the previous year (%))Consumer Price Index (Housing, more imputed rent)
(Changes from the previous year (%)) Consumer Price Index(Fuel, light & water charges) 分母
出典
都道府県コー
ド
41

都道府県消費者物価指数対前年変化率
(家具・家事用品)消費者物価指数対前年変化率
(被服及び履物)消費者物価指数対前年変化率
(保健医療)消費者物価指数対前年変化率(交通・通信)
Prefecture Rate of Change in CPI(furniture & household utensils)
Rate of Change in CPI(clothes & footwear)
Rate of Change in CPI(medical care)
(%) (%) (%)
全国 All Japan
北海道 Hokkaido青森県 Aomori-ken岩手県 Iwate-ken宮城県 Miyagi-ken秋田県 Akita-ken
山形県 Yamagata-ken福島県 Fukushima-ken茨城県 Ibaraki-ken栃木県 Tochigi-ken群馬県 Gumma-ken
埼玉県 Saitama-ken千葉県 Chiba-ken東京都 Tokyo-to神奈川県 Kanagawa-ken新潟県 Niigata-ken
富山県 Toyama-ken石川県 Ishikawa-ken福井県 Fukui-ken山梨県 Yamanashi-ken長野県 Nagano-ken
岐阜県 Gifu-ken静岡県 Shizuoka-ken愛知県 Aichi-ken三重県 Mie-ken滋賀県 Shiga-ken
京都府 Kyoto-fu大阪府 Osaka-fu兵庫県 Hyogo-ken奈良県 Nara-ken和歌山県 Wakayama-ken
鳥取県 Tottori-ken島根県 Shimane-ken岡山県 Okayama-ken広島県 Hiroshima-ken山口県 Yamaguchi-ken
徳島県 Tokushima-ken香川県 Kagawa-ken愛媛県 Ehime-ken高知県 Kochi-ken福岡県 Fukuoka-ken
佐賀県 Saga-ken長崎県 Nagasaki-ken熊本県 Kumamoto-ken大分県 Oita-ken宮崎県 Miyazaki-ken
鹿児島県 Kagoshima-ken沖縄県 Okinawa-ken
平均値 Mean標準偏差 Standard deviation
※ ※ ※
分子
指標計算式 Numerators 消費者物価指数変化率家具・家事用品
消費者物価指数変化率被服及び履物
消費者物価指数変化率保健医療
消費者物価指数変化率交通・通信
Formulae ofindicators 分母
(Changes from the previous year (%)) ConsumerPrice Index (Furniture & household utensils)
(Changes from the previous year (%)) ConsumerPrice Index (Clothes & footwear)
(Changes from the previous year (%))Consumer Price Index (Medical care)
Denominators
出典 Reference(注)項目欄に「*」の付されている項目は,都道府県庁所在市のデータである。
Note:Items with * refer to the cities with prefectural governments.
消費者物価指数対前年変化率(交通・通信) 消費者物価指数対前年変化率(教育) 消費者物価指数対前年変化率(教養娯楽)
Rate of Change in CPI (transportation & communication)
Rate of Change in CPI(education)
Rate of Change in CPI(reading & recreation)
(%) (%) (%)Pref.Code
MeanS.D.
※ ※ ※
分子
消費者物価指数変化率交通・通信
消費者物価指数変化率教育
消費者物価指数変化率教養娯楽
指標計算式
(Changes from the previous year (%)) Consumer PriceIndex (Transportation & communication)
(Changes from the previous year (%)) Consumer PriceIndex (Education)
(Changes from the previous year (%)) Consumer PriceIndex (Culture & recreation) 分母
出典
都道府県コー
ド
42

都道府県消費者物価指数対前年変化率
(家具・家事用品)消費者物価指数対前年変化率
(被服及び履物)消費者物価指数対前年変化率
(保健医療)消費者物価指数対前年変化率(交通・通信)
Prefecture Rate of Change in CPI(furniture & household utensils)
Rate of Change in CPI(clothes & footwear)
Rate of Change in CPI(medical care)
(%) (%) (%)
全国 All Japan
北海道 Hokkaido青森県 Aomori-ken岩手県 Iwate-ken宮城県 Miyagi-ken秋田県 Akita-ken
山形県 Yamagata-ken福島県 Fukushima-ken茨城県 Ibaraki-ken栃木県 Tochigi-ken群馬県 Gumma-ken
埼玉県 Saitama-ken千葉県 Chiba-ken東京都 Tokyo-to神奈川県 Kanagawa-ken新潟県 Niigata-ken
富山県 Toyama-ken石川県 Ishikawa-ken福井県 Fukui-ken山梨県 Yamanashi-ken長野県 Nagano-ken
岐阜県 Gifu-ken静岡県 Shizuoka-ken愛知県 Aichi-ken三重県 Mie-ken滋賀県 Shiga-ken
京都府 Kyoto-fu大阪府 Osaka-fu兵庫県 Hyogo-ken奈良県 Nara-ken和歌山県 Wakayama-ken
鳥取県 Tottori-ken島根県 Shimane-ken岡山県 Okayama-ken広島県 Hiroshima-ken山口県 Yamaguchi-ken
徳島県 Tokushima-ken香川県 Kagawa-ken愛媛県 Ehime-ken高知県 Kochi-ken福岡県 Fukuoka-ken
佐賀県 Saga-ken長崎県 Nagasaki-ken熊本県 Kumamoto-ken大分県 Oita-ken宮崎県 Miyazaki-ken
鹿児島県 Kagoshima-ken沖縄県 Okinawa-ken
平均値 Mean標準偏差 Standard deviation
※ ※ ※
分子
指標計算式 Numerators 消費者物価指数変化率家具・家事用品
消費者物価指数変化率被服及び履物
消費者物価指数変化率保健医療
消費者物価指数変化率交通・通信
Formulae ofindicators 分母
(Changes from the previous year (%)) ConsumerPrice Index (Furniture & household utensils)
(Changes from the previous year (%)) ConsumerPrice Index (Clothes & footwear)
(Changes from the previous year (%))Consumer Price Index (Medical care)
Denominators
出典 Reference(注)項目欄に「*」の付されている項目は,都道府県庁所在市のデータである。
Note:Items with * refer to the cities with prefectural governments.
消費者物価指数対前年変化率(交通・通信) 消費者物価指数対前年変化率(教育) 消費者物価指数対前年変化率(教養娯楽)
Rate of Change in CPI (transportation & communication)
Rate of Change in CPI(education)
Rate of Change in CPI(reading & recreation)
(%) (%) (%)Pref.Code
MeanS.D.
※ ※ ※
分子
消費者物価指数変化率交通・通信
消費者物価指数変化率教育
消費者物価指数変化率教養娯楽
指標計算式
(Changes from the previous year (%)) Consumer PriceIndex (Transportation & communication)
(Changes from the previous year (%)) Consumer PriceIndex (Education)
(Changes from the previous year (%)) Consumer PriceIndex (Culture & recreation) 分母
出典
都道府県コー
ド
43

都道府県 消費者物価指数対前年変化率(諸雑費) 標準価格対前年平均変動率(住宅地) 標準価格対前年平均変動率(商業地) 標準価格対前年平均変動率(工業地)
Prefecture Rate of Change in CPI(miscellaneous)
Annual increase rate of land prices(residential)
Annual increase rate of land prices(commercial)
Annual increase rate of land prices(industrial)
(%) (%) (%)
全国 All Japan
北海道 Hokkaido青森県 Aomori-ken岩手県 Iwate-ken宮城県 Miyagi-ken秋田県 Akita-ken
山形県 Yamagata-ken福島県 Fukushima-ken茨城県 Ibaraki-ken栃木県 Tochigi-ken群馬県 Gumma-ken
埼玉県 Saitama-ken千葉県 Chiba-ken東京都 Tokyo-to神奈川県 Kanagawa-ken新潟県 Niigata-ken
富山県 Toyama-ken石川県 Ishikawa-ken福井県 Fukui-ken山梨県 Yamanashi-ken長野県 Nagano-ken
岐阜県 Gifu-ken静岡県 Shizuoka-ken愛知県 Aichi-ken三重県 Mie-ken滋賀県 Shiga-ken
京都府 Kyoto-fu大阪府 Osaka-fu兵庫県 Hyogo-ken奈良県 Nara-ken和歌山県 Wakayama-ken
鳥取県 Tottori-ken島根県 Shimane-ken岡山県 Okayama-ken広島県 Hiroshima-ken山口県 Yamaguchi-ken
徳島県 Tokushima-ken香川県 Kagawa-ken愛媛県 Ehime-ken高知県 Kochi-ken福岡県 Fukuoka-ken
佐賀県 Saga-ken長崎県 Nagasaki-ken熊本県 Kumamoto-ken大分県 Oita-ken宮崎県 Miyazaki-ken
鹿児島県 Kagoshima-ken沖縄県 Okinawa-ken
平均値 Mean標準偏差 Standard deviation
※ ※ ※
分子
指標計算式 Numerators 消費者物価指数変化率諸雑費
標準価格(対前年平均変動率)住宅地
標準価格(対前年平均変動率)商業地
標準価格(対前年平均変動率)工業地
Formulae ofindicators 分母
(Changes from the previous year (%)) ConsumerPrice Index (Miscellaneous)
Annual increase rate of land prices(Residential)
Annual increase rate of land prices(Commercial) Annual increase rate of land prices (Industrial)
Denominators
出典 Reference(注)項目欄に「*」の付されている項目は,都道府県庁所在市のデータである。
Note:Items with * refer to the cities with prefectural governments.
標準価格対前年平均変動率(工業地)
Annual increase rate of land prices(industrial)
(%)Pref.Code
MeanS.D.
※
分子
標準価格(対前年平均変動率)工業地
Annual increase rate of land prices (Industrial) 分母
出典
都道府県コー
ド
44

都道府県 消費者物価指数対前年変化率(諸雑費) 標準価格対前年平均変動率(住宅地) 標準価格対前年平均変動率(商業地) 標準価格対前年平均変動率(工業地)
Prefecture Rate of Change in CPI(miscellaneous)
Annual increase rate of land prices(residential)
Annual increase rate of land prices(commercial)
Annual increase rate of land prices(industrial)
(%) (%) (%)
全国 All Japan
北海道 Hokkaido青森県 Aomori-ken岩手県 Iwate-ken宮城県 Miyagi-ken秋田県 Akita-ken
山形県 Yamagata-ken福島県 Fukushima-ken茨城県 Ibaraki-ken栃木県 Tochigi-ken群馬県 Gumma-ken
埼玉県 Saitama-ken千葉県 Chiba-ken東京都 Tokyo-to神奈川県 Kanagawa-ken新潟県 Niigata-ken
富山県 Toyama-ken石川県 Ishikawa-ken福井県 Fukui-ken山梨県 Yamanashi-ken長野県 Nagano-ken
岐阜県 Gifu-ken静岡県 Shizuoka-ken愛知県 Aichi-ken三重県 Mie-ken滋賀県 Shiga-ken
京都府 Kyoto-fu大阪府 Osaka-fu兵庫県 Hyogo-ken奈良県 Nara-ken和歌山県 Wakayama-ken
鳥取県 Tottori-ken島根県 Shimane-ken岡山県 Okayama-ken広島県 Hiroshima-ken山口県 Yamaguchi-ken
徳島県 Tokushima-ken香川県 Kagawa-ken愛媛県 Ehime-ken高知県 Kochi-ken福岡県 Fukuoka-ken
佐賀県 Saga-ken長崎県 Nagasaki-ken熊本県 Kumamoto-ken大分県 Oita-ken宮崎県 Miyazaki-ken
鹿児島県 Kagoshima-ken沖縄県 Okinawa-ken
平均値 Mean標準偏差 Standard deviation
※ ※ ※
分子
指標計算式 Numerators 消費者物価指数変化率諸雑費
標準価格(対前年平均変動率)住宅地
標準価格(対前年平均変動率)商業地
標準価格(対前年平均変動率)工業地
Formulae ofindicators 分母
(Changes from the previous year (%)) ConsumerPrice Index (Miscellaneous)
Annual increase rate of land prices(Residential)
Annual increase rate of land prices(Commercial) Annual increase rate of land prices (Industrial)
Denominators
出典 Reference(注)項目欄に「*」の付されている項目は,都道府県庁所在市のデータである。
Note:Items with * refer to the cities with prefectural governments.
標準価格対前年平均変動率(工業地)
Annual increase rate of land prices(industrial)
(%)Pref.Code
MeanS.D.
※
分子
標準価格(対前年平均変動率)工業地
Annual increase rate of land prices (Industrial) 分母
出典
都道府県コー
ド
45

D.行政基盤 Administrative Base1)財政力 Financial potential
都道府県財政力指数
(都道府県財政)実質収支比率(都道府県財政)
自主財源の割合(都道府県財政)
地方債現在高の割合(都道府県財政)
Prefecture Index of financial potential(prefecture)
Real term balance of revenue to expenditure(prefecture)
Ratio of self-financial resources(prefecture)
(%) (%)
全国 All Japan
北海道 Hokkaido青森県 Aomori-ken岩手県 Iwate-ken宮城県 Miyagi-ken秋田県 Akita-ken
山形県 Yamagata-ken福島県 Fukushima-ken茨城県 Ibaraki-ken栃木県 Tochigi-ken群馬県 Gumma-ken
埼玉県 Saitama-ken千葉県 Chiba-ken東京都 Tokyo-to神奈川県 Kanagawa-ken新潟県 Niigata-ken
富山県 Toyama-ken石川県 Ishikawa-ken福井県 Fukui-ken山梨県 Yamanashi-ken長野県 Nagano-ken
岐阜県 Gifu-ken静岡県 Shizuoka-ken愛知県 Aichi-ken三重県 Mie-ken滋賀県 Shiga-ken
京都府 Kyoto-fu大阪府 Osaka-fu兵庫県 Hyogo-ken奈良県 Nara-ken和歌山県 Wakayama-ken
鳥取県 Tottori-ken島根県 Shimane-ken岡山県 Okayama-ken広島県 Hiroshima-ken山口県 Yamaguchi-ken
徳島県 Tokushima-ken香川県 Kagawa-ken愛媛県 Ehime-ken高知県 Kochi-ken福岡県 Fukuoka-ken
佐賀県 Saga-ken長崎県 Nagasaki-ken熊本県 Kumamoto-ken大分県 Oita-ken宮崎県 Miyazaki-ken
鹿児島県 Kagoshima-ken沖縄県 Okinawa-ken
平均値 Mean標準偏差 Standard deviation
※ ※
分子 自主財源額(都道府県財政)
指標計算式 Numerators 財政力指数(都道府県財政)
Amount of self-financial resources(prefecture)
Formulae ofindicators 分母
Financial strength index (prefecture)
Real term balance of revenue to expenditure(prefecture) 歳出決算総額(都道府県財政) 歳出決算総額(都道府県財政)
Denominators Settlement of total expenditure(prefecture) Settlement of total expenditure (prefecture)
出典 Reference
実質収支比率(都道府県財政)
地方債現在高の割合(都道府県財政)
経常収支比率(都道府県財政)
投資的経費の割合(都道府県財政)
Ratio of outstanding amount of local government bondto expenditure (prefecture)
Real term of current balance(prefecture)
Ratio of investment expenditure(prefecture)
(%) (%) (%)Pref.Code
MeanS.D.
※
地方債現在高(都道府県財政) 投資的経費(都道府県財政) 分子
Outstanding amount of local government bond(prefecture)
経常収支比率(都道府県財政)
Investment expenditure (prefecture) 指標計算式
歳出決算総額(都道府県財政) Real term of current balance (prefecture) 歳出決算総額(都道府県財政) 分母
Settlement of total expenditure (prefecture) Settlement of total expenditure (prefecture)
出典
都道府県コー
ド
46

D.行政基盤 Administrative Base1)財政力 Financial potential
都道府県財政力指数
(都道府県財政)実質収支比率(都道府県財政)
自主財源の割合(都道府県財政)
地方債現在高の割合(都道府県財政)
Prefecture Index of financial potential(prefecture)
Real term balance of revenue to expenditure(prefecture)
Ratio of self-financial resources(prefecture)
(%) (%)
全国 All Japan
北海道 Hokkaido青森県 Aomori-ken岩手県 Iwate-ken宮城県 Miyagi-ken秋田県 Akita-ken
山形県 Yamagata-ken福島県 Fukushima-ken茨城県 Ibaraki-ken栃木県 Tochigi-ken群馬県 Gumma-ken
埼玉県 Saitama-ken千葉県 Chiba-ken東京都 Tokyo-to神奈川県 Kanagawa-ken新潟県 Niigata-ken
富山県 Toyama-ken石川県 Ishikawa-ken福井県 Fukui-ken山梨県 Yamanashi-ken長野県 Nagano-ken
岐阜県 Gifu-ken静岡県 Shizuoka-ken愛知県 Aichi-ken三重県 Mie-ken滋賀県 Shiga-ken
京都府 Kyoto-fu大阪府 Osaka-fu兵庫県 Hyogo-ken奈良県 Nara-ken和歌山県 Wakayama-ken
鳥取県 Tottori-ken島根県 Shimane-ken岡山県 Okayama-ken広島県 Hiroshima-ken山口県 Yamaguchi-ken
徳島県 Tokushima-ken香川県 Kagawa-ken愛媛県 Ehime-ken高知県 Kochi-ken福岡県 Fukuoka-ken
佐賀県 Saga-ken長崎県 Nagasaki-ken熊本県 Kumamoto-ken大分県 Oita-ken宮崎県 Miyazaki-ken
鹿児島県 Kagoshima-ken沖縄県 Okinawa-ken
平均値 Mean標準偏差 Standard deviation
※ ※
分子 自主財源額(都道府県財政)
指標計算式 Numerators 財政力指数(都道府県財政)
Amount of self-financial resources(prefecture)
Formulae ofindicators 分母
Financial strength index (prefecture)
Real term balance of revenue to expenditure(prefecture) 歳出決算総額(都道府県財政) 歳出決算総額(都道府県財政)
Denominators Settlement of total expenditure(prefecture) Settlement of total expenditure (prefecture)
出典 Reference
実質収支比率(都道府県財政)
地方債現在高の割合(都道府県財政)
経常収支比率(都道府県財政)
投資的経費の割合(都道府県財政)
Ratio of outstanding amount of local government bondto expenditure (prefecture)
Real term of current balance(prefecture)
Ratio of investment expenditure(prefecture)
(%) (%) (%)Pref.Code
MeanS.D.
※
地方債現在高(都道府県財政) 投資的経費(都道府県財政) 分子
Outstanding amount of local government bond(prefecture)
経常収支比率(都道府県財政)
Investment expenditure (prefecture) 指標計算式
歳出決算総額(都道府県財政) Real term of current balance (prefecture) 歳出決算総額(都道府県財政) 分母
Settlement of total expenditure (prefecture) Settlement of total expenditure (prefecture)
出典
都道府県コー
ド
47
D
行政基盤
(指標)

2)歳入の財源別構成比 Percentage distribution by source of revenue
都道府県一般財源の割合(都道府県財政)
地方税割合(都道府県財政)
地方交付税割合(都道府県財政)
国庫支出金割合(都道府県財政)
Prefecture Ratio of revenues from local taxes and grants(prefecture)
Ratio of local taxes(prefecture)
Ratio of grants to local governments(prefecture)
Ratio of national disbursements(prefecture)
(%) (%) (%)
全国 All Japan
北海道 Hokkaido青森県 Aomori-ken岩手県 Iwate-ken宮城県 Miyagi-ken秋田県 Akita-ken
山形県 Yamagata-ken福島県 Fukushima-ken茨城県 Ibaraki-ken栃木県 Tochigi-ken群馬県 Gumma-ken
埼玉県 Saitama-ken千葉県 Chiba-ken東京都 Tokyo-to神奈川県 Kanagawa-ken新潟県 Niigata-ken
富山県 Toyama-ken石川県 Ishikawa-ken福井県 Fukui-ken山梨県 Yamanashi-ken長野県 Nagano-ken
岐阜県 Gifu-ken静岡県 Shizuoka-ken愛知県 Aichi-ken三重県 Mie-ken滋賀県 Shiga-ken
京都府 Kyoto-fu大阪府 Osaka-fu兵庫県 Hyogo-ken奈良県 Nara-ken和歌山県 Wakayama-ken
鳥取県 Tottori-ken島根県 Shimane-ken岡山県 Okayama-ken広島県 Hiroshima-ken山口県 Yamaguchi-ken
徳島県 Tokushima-ken香川県 Kagawa-ken愛媛県 Ehime-ken高知県 Kochi-ken福岡県 Fukuoka-ken
佐賀県 Saga-ken長崎県 Nagasaki-ken熊本県 Kumamoto-ken大分県 Oita-ken宮崎県 Miyazaki-ken
鹿児島県 Kagoshima-ken沖縄県 Okinawa-ken
平均値 Mean標準偏差 Standard deviation
分子 一般財源(都道府県財政) 地方税(都道府県財政) 地方交付税(都道府県財政) 国庫支出金(都道府県財政)
指標計算式 Numerators Revenues from local taxes and grants(prefecture) Local taxes (prefecture) Grants to local governments (prefecture) National disbursements (prefecture)
Formulae ofindicators 分母 歳出決算総額(都道府県財政) 歳入決算総額(都道府県財政) 歳入決算総額(都道府県財政) 歳入決算総額(都道府県財政)
Denominators Settlement of total expenditure(prefecture) Settlement of total revenue (prefecture) Settlement of total revenue (prefecture) Settlement of total revenue (prefecture)
出典 Reference
3)租税 Taxes
国庫支出金割合(都道府県財政)
人口1人当たり住民税(都道府県・市町村財政合計)
人口1人当たり固定資産税(都道府県・市町村財政合計)
Ratio of national disbursements(prefecture)
Resident tax per capita(prefecture + municipality)
Fixed assets tax per capita(prefecture + municipality)
(%) (千円:thousand yen (千円:thousand yenPref.Code
MeanS.D.
国庫支出金(都道府県財政) 住民税収入額(都道府県,市町村財政合計) 固定資産税収入額(都道府県,市町村財政合計) 分子
National disbursements (prefecture) Resident tax (prefectural taxes and municipal taxes) Fixed asset tax (prefectural taxes) +Fixed asset tax (municipal taxes) 指標計算式
歳入決算総額(都道府県財政) 総人口 総人口 分母
Settlement of total revenue (prefecture) Total population (Both sexes) Total population (Both sexes)
出典
都道府県コー
ド
48

2)歳入の財源別構成比 Percentage distribution by source of revenue
都道府県一般財源の割合(都道府県財政)
地方税割合(都道府県財政)
地方交付税割合(都道府県財政)
国庫支出金割合(都道府県財政)
Prefecture Ratio of revenues from local taxes and grants(prefecture)
Ratio of local taxes(prefecture)
Ratio of grants to local governments(prefecture)
Ratio of national disbursements(prefecture)
(%) (%) (%)
全国 All Japan
北海道 Hokkaido青森県 Aomori-ken岩手県 Iwate-ken宮城県 Miyagi-ken秋田県 Akita-ken
山形県 Yamagata-ken福島県 Fukushima-ken茨城県 Ibaraki-ken栃木県 Tochigi-ken群馬県 Gumma-ken
埼玉県 Saitama-ken千葉県 Chiba-ken東京都 Tokyo-to神奈川県 Kanagawa-ken新潟県 Niigata-ken
富山県 Toyama-ken石川県 Ishikawa-ken福井県 Fukui-ken山梨県 Yamanashi-ken長野県 Nagano-ken
岐阜県 Gifu-ken静岡県 Shizuoka-ken愛知県 Aichi-ken三重県 Mie-ken滋賀県 Shiga-ken
京都府 Kyoto-fu大阪府 Osaka-fu兵庫県 Hyogo-ken奈良県 Nara-ken和歌山県 Wakayama-ken
鳥取県 Tottori-ken島根県 Shimane-ken岡山県 Okayama-ken広島県 Hiroshima-ken山口県 Yamaguchi-ken
徳島県 Tokushima-ken香川県 Kagawa-ken愛媛県 Ehime-ken高知県 Kochi-ken福岡県 Fukuoka-ken
佐賀県 Saga-ken長崎県 Nagasaki-ken熊本県 Kumamoto-ken大分県 Oita-ken宮崎県 Miyazaki-ken
鹿児島県 Kagoshima-ken沖縄県 Okinawa-ken
平均値 Mean標準偏差 Standard deviation
分子 一般財源(都道府県財政) 地方税(都道府県財政) 地方交付税(都道府県財政) 国庫支出金(都道府県財政)
指標計算式 Numerators Revenues from local taxes and grants(prefecture) Local taxes (prefecture) Grants to local governments (prefecture) National disbursements (prefecture)
Formulae ofindicators 分母 歳出決算総額(都道府県財政) 歳入決算総額(都道府県財政) 歳入決算総額(都道府県財政) 歳入決算総額(都道府県財政)
Denominators Settlement of total expenditure(prefecture) Settlement of total revenue (prefecture) Settlement of total revenue (prefecture) Settlement of total revenue (prefecture)
出典 Reference
3)租税 Taxes
国庫支出金割合(都道府県財政)
人口1人当たり住民税(都道府県・市町村財政合計)
人口1人当たり固定資産税(都道府県・市町村財政合計)
Ratio of national disbursements(prefecture)
Resident tax per capita(prefecture + municipality)
Fixed assets tax per capita(prefecture + municipality)
(%) (千円:thousand yen (千円:thousand yenPref.Code
MeanS.D.
国庫支出金(都道府県財政) 住民税収入額(都道府県,市町村財政合計) 固定資産税収入額(都道府県,市町村財政合計) 分子
National disbursements (prefecture) Resident tax (prefectural taxes and municipal taxes) Fixed asset tax (prefectural taxes) +Fixed asset tax (municipal taxes) 指標計算式
歳入決算総額(都道府県財政) 総人口 総人口 分母
Settlement of total revenue (prefecture) Total population (Both sexes) Total population (Both sexes)
出典
都道府県コー
ド
49

都道府県国税徴収決定済額(人口1人当たり)
課税対象所得(納税義務者1人当たり)
納税義務者割合民生費割合
(都道府県財政)
Prefecture Amount of national tax(per capita)
Taxable income(per tax debtor)
Percentage of tax payer Ratio of welfare expenditure(prefecture)
(千円:thousand yen (千円:thousand yen (%)
全国 All Japan
北海道 Hokkaido青森県 Aomori-ken岩手県 Iwate-ken宮城県 Miyagi-ken秋田県 Akita-ken
山形県 Yamagata-ken福島県 Fukushima-ken茨城県 Ibaraki-ken栃木県 Tochigi-ken群馬県 Gumma-ken
埼玉県 Saitama-ken千葉県 Chiba-ken東京都 Tokyo-to神奈川県 Kanagawa-ken新潟県 Niigata-ken
富山県 Toyama-ken石川県 Ishikawa-ken福井県 Fukui-ken山梨県 Yamanashi-ken長野県 Nagano-ken
岐阜県 Gifu-ken静岡県 Shizuoka-ken愛知県 Aichi-ken三重県 Mie-ken滋賀県 Shiga-ken
京都府 Kyoto-fu大阪府 Osaka-fu兵庫県 Hyogo-ken奈良県 Nara-ken和歌山県 Wakayama-ken
鳥取県 Tottori-ken島根県 Shimane-ken岡山県 Okayama-ken広島県 Hiroshima-ken山口県 Yamaguchi-ken
徳島県 Tokushima-ken香川県 Kagawa-ken愛媛県 Ehime-ken高知県 Kochi-ken福岡県 Fukuoka-ken
佐賀県 Saga-ken長崎県 Nagasaki-ken熊本県 Kumamoto-ken大分県 Oita-ken宮崎県 Miyazaki-ken
鹿児島県 Kagoshima-ken沖縄県 Okinawa-ken
平均値 Mean標準偏差 Standard deviation
分子 国税徴収決定済額 課税対象所得 納税義務者数(所得割) 民生費(都道府県財政)
指標計算式 Numerators Amount of national tax Taxable income Tax debtors (per income) Total welfare expenditure (prefecture)
Formulae ofindicators 分母 総人口 納税義務者数(所得割) 総人口 歳出決算総額(都道府県財政)
Denominators Total population (Both sexes) Tax debtors (per income) Total population (Both sexes) Settlement of total expenditure (prefecture)
出典 Reference
4)目的別支出の構成比 Percentage distribution of expenditures by purpose
民生費割合(都道府県財政)
社会福祉費割合(都道府県財政)
老人福祉費割合(都道府県財政)
Ratio of welfare expenditure(prefecture)
Ratio of social welfare expenditure(prefecture)
Ratio of welfare expenditure for the aged(prefecture)
(%) (%) (%)Pref.Code
MeanS.D.
民生費(都道府県財政) 社会福祉費(都道府県財政) 老人福祉費(都道府県財政) 分子
Total welfare expenditure (prefecture) Social welfare expenditure(prefecture) Social welfare expenditure for the aged (prefecture) 指標計算式
歳出決算総額(都道府県財政) 歳出決算総額(都道府県財政) 歳出決算総額(都道府県財政) 分母
Settlement of total expenditure (prefecture) Settlement of total expenditure (prefecture) Settlement of total expenditure (prefecture)
出典
都道府県コー
ド
50

都道府県国税徴収決定済額(人口1人当たり)
課税対象所得(納税義務者1人当たり)
納税義務者割合民生費割合
(都道府県財政)
Prefecture Amount of national tax(per capita)
Taxable income(per tax debtor)
Percentage of tax payer Ratio of welfare expenditure(prefecture)
(千円:thousand yen (千円:thousand yen (%)
全国 All Japan
北海道 Hokkaido青森県 Aomori-ken岩手県 Iwate-ken宮城県 Miyagi-ken秋田県 Akita-ken
山形県 Yamagata-ken福島県 Fukushima-ken茨城県 Ibaraki-ken栃木県 Tochigi-ken群馬県 Gumma-ken
埼玉県 Saitama-ken千葉県 Chiba-ken東京都 Tokyo-to神奈川県 Kanagawa-ken新潟県 Niigata-ken
富山県 Toyama-ken石川県 Ishikawa-ken福井県 Fukui-ken山梨県 Yamanashi-ken長野県 Nagano-ken
岐阜県 Gifu-ken静岡県 Shizuoka-ken愛知県 Aichi-ken三重県 Mie-ken滋賀県 Shiga-ken
京都府 Kyoto-fu大阪府 Osaka-fu兵庫県 Hyogo-ken奈良県 Nara-ken和歌山県 Wakayama-ken
鳥取県 Tottori-ken島根県 Shimane-ken岡山県 Okayama-ken広島県 Hiroshima-ken山口県 Yamaguchi-ken
徳島県 Tokushima-ken香川県 Kagawa-ken愛媛県 Ehime-ken高知県 Kochi-ken福岡県 Fukuoka-ken
佐賀県 Saga-ken長崎県 Nagasaki-ken熊本県 Kumamoto-ken大分県 Oita-ken宮崎県 Miyazaki-ken
鹿児島県 Kagoshima-ken沖縄県 Okinawa-ken
平均値 Mean標準偏差 Standard deviation
分子 国税徴収決定済額 課税対象所得 納税義務者数(所得割) 民生費(都道府県財政)
指標計算式 Numerators Amount of national tax Taxable income Tax debtors (per income) Total welfare expenditure (prefecture)
Formulae ofindicators 分母 総人口 納税義務者数(所得割) 総人口 歳出決算総額(都道府県財政)
Denominators Total population (Both sexes) Tax debtors (per income) Total population (Both sexes) Settlement of total expenditure (prefecture)
出典 Reference
4)目的別支出の構成比 Percentage distribution of expenditures by purpose
民生費割合(都道府県財政)
社会福祉費割合(都道府県財政)
老人福祉費割合(都道府県財政)
Ratio of welfare expenditure(prefecture)
Ratio of social welfare expenditure(prefecture)
Ratio of welfare expenditure for the aged(prefecture)
(%) (%) (%)Pref.Code
MeanS.D.
民生費(都道府県財政) 社会福祉費(都道府県財政) 老人福祉費(都道府県財政) 分子
Total welfare expenditure (prefecture) Social welfare expenditure(prefecture) Social welfare expenditure for the aged (prefecture) 指標計算式
歳出決算総額(都道府県財政) 歳出決算総額(都道府県財政) 歳出決算総額(都道府県財政) 分母
Settlement of total expenditure (prefecture) Settlement of total expenditure (prefecture) Settlement of total expenditure (prefecture)
出典
都道府県コー
ド
51

都道府県児童福祉費割合(都道府県財政)
生活保護費割合(都道府県財政)
衛生費割合(都道府県財政)
労働費割合(都道府県財政)
Prefecture Ratio of welfare expenditure for children(prefecture)
Ratio of expenditure for livelihood protection(prefecture)
Ratio of health expenditure(prefecture)
Ratio of labour expenditure(prefecture)
(%) (%) (%)
全国 All Japan
北海道 Hokkaido青森県 Aomori-ken岩手県 Iwate-ken宮城県 Miyagi-ken秋田県 Akita-ken
山形県 Yamagata-ken福島県 Fukushima-ken茨城県 Ibaraki-ken栃木県 Tochigi-ken群馬県 Gumma-ken
埼玉県 Saitama-ken千葉県 Chiba-ken東京都 Tokyo-to神奈川県 Kanagawa-ken新潟県 Niigata-ken
富山県 Toyama-ken石川県 Ishikawa-ken福井県 Fukui-ken山梨県 Yamanashi-ken長野県 Nagano-ken
岐阜県 Gifu-ken静岡県 Shizuoka-ken愛知県 Aichi-ken三重県 Mie-ken滋賀県 Shiga-ken
京都府 Kyoto-fu大阪府 Osaka-fu兵庫県 Hyogo-ken奈良県 Nara-ken和歌山県 Wakayama-ken
鳥取県 Tottori-ken島根県 Shimane-ken岡山県 Okayama-ken広島県 Hiroshima-ken山口県 Yamaguchi-ken
徳島県 Tokushima-ken香川県 Kagawa-ken愛媛県 Ehime-ken高知県 Kochi-ken福岡県 Fukuoka-ken
佐賀県 Saga-ken長崎県 Nagasaki-ken熊本県 Kumamoto-ken大分県 Oita-ken宮崎県 Miyazaki-ken
鹿児島県 Kagoshima-ken沖縄県 Okinawa-ken
平均値 Mean標準偏差 Standard deviation
分子 児童福祉費(都道府県財政) 生活保護費(都道府県財政) 衛生費(都道府県財政) 労働費(都道府県財政)
指標計算式 Numerators Welfare expenditure for children(prefecture)
Expenditure for livelihood protection(prefecture)
Health expenditure(prefecture) Labour expenditure (prefecture)
Formulae ofindicators 分母 歳出決算総額(都道府県財政) 歳出決算総額(都道府県財政) 歳出決算総額(都道府県財政) 歳出決算総額(都道府県財政)
Denominators Settlement of total expenditure(prefecture)
Settlement of total expenditure(prefecture)
Settlement of total expenditure(prefecture) Settlement of total expenditure (prefecture)
出典 Reference
労働費割合(都道府県財政)
農林水産業費割合(都道府県財政)
商工費割合(都道府県財政)
Ratio of labour expenditure(prefecture)
Ratio of agriculture, forestry and fishery expenditure(prefecture)
Ratio of commerce and manufacturing expenditure(prefecture)
(%) (%) (%)Pref.Code
MeanS.D.
労働費(都道府県財政) 農林水産業費(都道府県財政) 商工費(都道府県財政) 分子
Labour expenditure (prefecture) Agriculture, forestry and fishery expenditure(prefecture)
Commerce and manufacturing expenditure(prefecture) 指標計算式
歳出決算総額(都道府県財政) 歳出決算総額(都道府県財政) 歳出決算総額(都道府県財政) 分母
Settlement of total expenditure (prefecture) Settlement of total expenditure (prefecture) Settlement of total expenditure (prefecture)
出典
都道府県コー
ド
52

都道府県児童福祉費割合(都道府県財政)
生活保護費割合(都道府県財政)
衛生費割合(都道府県財政)
労働費割合(都道府県財政)
Prefecture Ratio of welfare expenditure for children(prefecture)
Ratio of expenditure for livelihood protection(prefecture)
Ratio of health expenditure(prefecture)
Ratio of labour expenditure(prefecture)
(%) (%) (%)
全国 All Japan
北海道 Hokkaido青森県 Aomori-ken岩手県 Iwate-ken宮城県 Miyagi-ken秋田県 Akita-ken
山形県 Yamagata-ken福島県 Fukushima-ken茨城県 Ibaraki-ken栃木県 Tochigi-ken群馬県 Gumma-ken
埼玉県 Saitama-ken千葉県 Chiba-ken東京都 Tokyo-to神奈川県 Kanagawa-ken新潟県 Niigata-ken
富山県 Toyama-ken石川県 Ishikawa-ken福井県 Fukui-ken山梨県 Yamanashi-ken長野県 Nagano-ken
岐阜県 Gifu-ken静岡県 Shizuoka-ken愛知県 Aichi-ken三重県 Mie-ken滋賀県 Shiga-ken
京都府 Kyoto-fu大阪府 Osaka-fu兵庫県 Hyogo-ken奈良県 Nara-ken和歌山県 Wakayama-ken
鳥取県 Tottori-ken島根県 Shimane-ken岡山県 Okayama-ken広島県 Hiroshima-ken山口県 Yamaguchi-ken
徳島県 Tokushima-ken香川県 Kagawa-ken愛媛県 Ehime-ken高知県 Kochi-ken福岡県 Fukuoka-ken
佐賀県 Saga-ken長崎県 Nagasaki-ken熊本県 Kumamoto-ken大分県 Oita-ken宮崎県 Miyazaki-ken
鹿児島県 Kagoshima-ken沖縄県 Okinawa-ken
平均値 Mean標準偏差 Standard deviation
分子 児童福祉費(都道府県財政) 生活保護費(都道府県財政) 衛生費(都道府県財政) 労働費(都道府県財政)
指標計算式 Numerators Welfare expenditure for children(prefecture)
Expenditure for livelihood protection(prefecture)
Health expenditure(prefecture) Labour expenditure (prefecture)
Formulae ofindicators 分母 歳出決算総額(都道府県財政) 歳出決算総額(都道府県財政) 歳出決算総額(都道府県財政) 歳出決算総額(都道府県財政)
Denominators Settlement of total expenditure(prefecture)
Settlement of total expenditure(prefecture)
Settlement of total expenditure(prefecture) Settlement of total expenditure (prefecture)
出典 Reference
労働費割合(都道府県財政)
農林水産業費割合(都道府県財政)
商工費割合(都道府県財政)
Ratio of labour expenditure(prefecture)
Ratio of agriculture, forestry and fishery expenditure(prefecture)
Ratio of commerce and manufacturing expenditure(prefecture)
(%) (%) (%)Pref.Code
MeanS.D.
労働費(都道府県財政) 農林水産業費(都道府県財政) 商工費(都道府県財政) 分子
Labour expenditure (prefecture) Agriculture, forestry and fishery expenditure(prefecture)
Commerce and manufacturing expenditure(prefecture) 指標計算式
歳出決算総額(都道府県財政) 歳出決算総額(都道府県財政) 歳出決算総額(都道府県財政) 分母
Settlement of total expenditure (prefecture) Settlement of total expenditure (prefecture) Settlement of total expenditure (prefecture)
出典
都道府県コー
ド
53

都道府県土木費割合
(都道府県財政)警察費割合
(都道府県財政)消防費割合
(都・市町村財政合計)教育費割合
(都道府県財政)
Prefecture Ratio of public works expenditure(prefecture)
Ratio of police expenditure(prefecture)
Ratio of fire service expenditure(Tokyo-to + municipality)
Ratio of education expenditure(prefecture)
(%) (%) (%)
全国 All Japan
北海道 Hokkaido青森県 Aomori-ken岩手県 Iwate-ken宮城県 Miyagi-ken秋田県 Akita-ken
山形県 Yamagata-ken福島県 Fukushima-ken茨城県 Ibaraki-ken栃木県 Tochigi-ken群馬県 Gumma-ken
埼玉県 Saitama-ken千葉県 Chiba-ken東京都 Tokyo-to神奈川県 Kanagawa-ken新潟県 Niigata-ken
富山県 Toyama-ken石川県 Ishikawa-ken福井県 Fukui-ken山梨県 Yamanashi-ken長野県 Nagano-ken
岐阜県 Gifu-ken静岡県 Shizuoka-ken愛知県 Aichi-ken三重県 Mie-ken滋賀県 Shiga-ken
京都府 Kyoto-fu大阪府 Osaka-fu兵庫県 Hyogo-ken奈良県 Nara-ken和歌山県 Wakayama-ken
鳥取県 Tottori-ken島根県 Shimane-ken岡山県 Okayama-ken広島県 Hiroshima-ken山口県 Yamaguchi-ken
徳島県 Tokushima-ken香川県 Kagawa-ken愛媛県 Ehime-ken高知県 Kochi-ken福岡県 Fukuoka-ken
佐賀県 Saga-ken長崎県 Nagasaki-ken熊本県 Kumamoto-ken大分県 Oita-ken宮崎県 Miyazaki-ken
鹿児島県 Kagoshima-ken沖縄県 Okinawa-ken
平均値 Mean標準偏差 Standard deviation
分子 土木費(都道府県財政) 警察費(都道府県財政) 消防費(都・市町村財政合計) 教育費(都道府県財政)
指標計算式 Numerators Public-works expenditure (prefecture) Police expenditure (prefecture) Fire protection expenditure(Tokyo-to + municipalities) Education expenditure (prefecture)
Formulae ofindicators 分母 歳出決算総額(都道府県財政) 歳出決算総額(都道府県財政)
歳出決算総額(市町村財政・東京都分含む)
歳出決算総額(都道府県財政)
Denominators Settlement of total expenditure(prefecture) Settlement of total expenditure (prefecture) a) Settlement of total expenditure (prefecture)
出典 Referencea) Settlement of total expenditure (municipalities) + Amount of settled expenditures (incl. municipal and Tokyo)
5)性質別支出の構成比
Percentage distribution of expenditures by function
教育費割合(都道府県財政)
災害復旧費割合(都道府県財政)
人件費割合(都道府県財政)
Ratio of education expenditure(prefecture)
Ratio of disaster relief expenditure(prefecture)
Ratio of personnel expenses(prefecture)
(%) (%) (%)Pref.Code
MeanS.D.
教育費(都道府県財政) 災害復旧費(都道府県財政) 人件費(都道府県財政) 分子
Education expenditure (prefecture) Disaster relief expenditure (prefecture) Personnel expenses (prefecture) 指標計算式
歳出決算総額(都道府県財政) 歳出決算総額(都道府県財政) 歳出決算総額(都道府県財政) 分母
Settlement of total expenditure (prefecture) Settlement of total expenditure (prefecture) Settlement of total expenditure (prefecture)
出典
都道府県コー
ド
54

都道府県土木費割合
(都道府県財政)警察費割合
(都道府県財政)消防費割合
(都・市町村財政合計)教育費割合
(都道府県財政)
Prefecture Ratio of public works expenditure(prefecture)
Ratio of police expenditure(prefecture)
Ratio of fire service expenditure(Tokyo-to + municipality)
Ratio of education expenditure(prefecture)
(%) (%) (%)
全国 All Japan
北海道 Hokkaido青森県 Aomori-ken岩手県 Iwate-ken宮城県 Miyagi-ken秋田県 Akita-ken
山形県 Yamagata-ken福島県 Fukushima-ken茨城県 Ibaraki-ken栃木県 Tochigi-ken群馬県 Gumma-ken
埼玉県 Saitama-ken千葉県 Chiba-ken東京都 Tokyo-to神奈川県 Kanagawa-ken新潟県 Niigata-ken
富山県 Toyama-ken石川県 Ishikawa-ken福井県 Fukui-ken山梨県 Yamanashi-ken長野県 Nagano-ken
岐阜県 Gifu-ken静岡県 Shizuoka-ken愛知県 Aichi-ken三重県 Mie-ken滋賀県 Shiga-ken
京都府 Kyoto-fu大阪府 Osaka-fu兵庫県 Hyogo-ken奈良県 Nara-ken和歌山県 Wakayama-ken
鳥取県 Tottori-ken島根県 Shimane-ken岡山県 Okayama-ken広島県 Hiroshima-ken山口県 Yamaguchi-ken
徳島県 Tokushima-ken香川県 Kagawa-ken愛媛県 Ehime-ken高知県 Kochi-ken福岡県 Fukuoka-ken
佐賀県 Saga-ken長崎県 Nagasaki-ken熊本県 Kumamoto-ken大分県 Oita-ken宮崎県 Miyazaki-ken
鹿児島県 Kagoshima-ken沖縄県 Okinawa-ken
平均値 Mean標準偏差 Standard deviation
分子 土木費(都道府県財政) 警察費(都道府県財政) 消防費(都・市町村財政合計) 教育費(都道府県財政)
指標計算式 Numerators Public-works expenditure (prefecture) Police expenditure (prefecture) Fire protection expenditure(Tokyo-to + municipalities) Education expenditure (prefecture)
Formulae ofindicators 分母 歳出決算総額(都道府県財政) 歳出決算総額(都道府県財政)
歳出決算総額(市町村財政・東京都分含む)
歳出決算総額(都道府県財政)
Denominators Settlement of total expenditure(prefecture) Settlement of total expenditure (prefecture) a) Settlement of total expenditure (prefecture)
出典 Referencea) Settlement of total expenditure (municipalities) + Amount of settled expenditures (incl. municipal and Tokyo)
5)性質別支出の構成比
Percentage distribution of expenditures by function
教育費割合(都道府県財政)
災害復旧費割合(都道府県財政)
人件費割合(都道府県財政)
Ratio of education expenditure(prefecture)
Ratio of disaster relief expenditure(prefecture)
Ratio of personnel expenses(prefecture)
(%) (%) (%)Pref.Code
MeanS.D.
教育費(都道府県財政) 災害復旧費(都道府県財政) 人件費(都道府県財政) 分子
Education expenditure (prefecture) Disaster relief expenditure (prefecture) Personnel expenses (prefecture) 指標計算式
歳出決算総額(都道府県財政) 歳出決算総額(都道府県財政) 歳出決算総額(都道府県財政) 分母
Settlement of total expenditure (prefecture) Settlement of total expenditure (prefecture) Settlement of total expenditure (prefecture)
出典
都道府県コー
ド
55

6)住民1人当たり目的別支出
Expenditures per capita
都道府県扶助費割合
(都道府県財政)普通建設事業費割合
(都道府県財政)人口1人当たり歳出決算総額(都道府県・市町村財政合計)
人口1人当たり民生費(都道府県・市町村財政合計)
Prefecture Ratio of allowances(prefecture)
Ratio of ordinary construction expenses(prefecture)
Total expenditure per capita(prefecture + municipality)
(%) (%) (千円:thousand yen
全国 All Japan
北海道 Hokkaido青森県 Aomori-ken岩手県 Iwate-ken宮城県 Miyagi-ken秋田県 Akita-ken
山形県 Yamagata-ken福島県 Fukushima-ken茨城県 Ibaraki-ken栃木県 Tochigi-ken群馬県 Gumma-ken
埼玉県 Saitama-ken千葉県 Chiba-ken東京都 Tokyo-to神奈川県 Kanagawa-ken新潟県 Niigata-ken
富山県 Toyama-ken石川県 Ishikawa-ken福井県 Fukui-ken山梨県 Yamanashi-ken長野県 Nagano-ken
岐阜県 Gifu-ken静岡県 Shizuoka-ken愛知県 Aichi-ken三重県 Mie-ken滋賀県 Shiga-ken
京都府 Kyoto-fu大阪府 Osaka-fu兵庫県 Hyogo-ken奈良県 Nara-ken和歌山県 Wakayama-ken
鳥取県 Tottori-ken島根県 Shimane-ken岡山県 Okayama-ken広島県 Hiroshima-ken山口県 Yamaguchi-ken
徳島県 Tokushima-ken香川県 Kagawa-ken愛媛県 Ehime-ken高知県 Kochi-ken福岡県 Fukuoka-ken
佐賀県 Saga-ken長崎県 Nagasaki-ken熊本県 Kumamoto-ken大分県 Oita-ken宮崎県 Miyazaki-ken
鹿児島県 Kagoshima-ken沖縄県 Okinawa-ken
平均値 Mean標準偏差 Standard deviation
分子 扶助費(都道府県財政) 普通建設事業費(都道府県財政) 歳出決算総額(都道府県・市町村財政合計) 民生費(都道府県・市町村財政合計)
指標計算式 Numerators Allowances (prefecture) Construction expenses (prefecture) Settlement of total expenditure (prefecture) +Settlement of total expenditure (municipalities)
Formulae ofindicators 分母 歳出決算総額(都道府県財政) 歳出決算総額(都道府県財政) 総人口 総人口
Denominators Settlement of total expenditure (prefecture) Settlement of total expenditure (prefecture) Total population (Both sexes) Total population (Both sexes)
出典 Reference
人口1人当たり民生費(都道府県・市町村財政合計)
人口1人当たり社会福祉費(都道府県・市町村財政合計)
65歳以上人口1人当たり老人福祉費(都道府県・市町村財政合計)
Welfare expenditure per capita(prefecture + municipality)
Social welfare expenditure per capita(prefecture + municipality)
Social welfare expenditure for aged persons per capita65 years old and over (prefecture + municipality)
(千円:thousand yen (千円:thousand yen (千円:thousand yenPref.Code
MeanS.D.
民生費(都道府県・市町村財政合計) 社会福祉費(都道府県・市町村財政合計) 老人福祉費(都道府県・市町村財政合計) 分子
Total welfare expenditure (prefecture) + Total welfare expenditure (municipalities)
Social welfare expenditure (prefecture) +Social welfare expenditure (municipalities)
Social welfare expenditure for the aged (prefecture) +Social welfare expenditure for the aged (municipalities) 指標計算式
総人口 総人口 65歳以上人口 分母
Total population (Both sexes) Total population (Both sexes) Total population (65 and over)
出典
都道府県コー
ド
56

6)住民1人当たり目的別支出
Expenditures per capita
都道府県扶助費割合
(都道府県財政)普通建設事業費割合
(都道府県財政)人口1人当たり歳出決算総額(都道府県・市町村財政合計)
人口1人当たり民生費(都道府県・市町村財政合計)
Prefecture Ratio of allowances(prefecture)
Ratio of ordinary construction expenses(prefecture)
Total expenditure per capita(prefecture + municipality)
(%) (%) (千円:thousand yen
全国 All Japan
北海道 Hokkaido青森県 Aomori-ken岩手県 Iwate-ken宮城県 Miyagi-ken秋田県 Akita-ken
山形県 Yamagata-ken福島県 Fukushima-ken茨城県 Ibaraki-ken栃木県 Tochigi-ken群馬県 Gumma-ken
埼玉県 Saitama-ken千葉県 Chiba-ken東京都 Tokyo-to神奈川県 Kanagawa-ken新潟県 Niigata-ken
富山県 Toyama-ken石川県 Ishikawa-ken福井県 Fukui-ken山梨県 Yamanashi-ken長野県 Nagano-ken
岐阜県 Gifu-ken静岡県 Shizuoka-ken愛知県 Aichi-ken三重県 Mie-ken滋賀県 Shiga-ken
京都府 Kyoto-fu大阪府 Osaka-fu兵庫県 Hyogo-ken奈良県 Nara-ken和歌山県 Wakayama-ken
鳥取県 Tottori-ken島根県 Shimane-ken岡山県 Okayama-ken広島県 Hiroshima-ken山口県 Yamaguchi-ken
徳島県 Tokushima-ken香川県 Kagawa-ken愛媛県 Ehime-ken高知県 Kochi-ken福岡県 Fukuoka-ken
佐賀県 Saga-ken長崎県 Nagasaki-ken熊本県 Kumamoto-ken大分県 Oita-ken宮崎県 Miyazaki-ken
鹿児島県 Kagoshima-ken沖縄県 Okinawa-ken
平均値 Mean標準偏差 Standard deviation
分子 扶助費(都道府県財政) 普通建設事業費(都道府県財政) 歳出決算総額(都道府県・市町村財政合計) 民生費(都道府県・市町村財政合計)
指標計算式 Numerators Allowances (prefecture) Construction expenses (prefecture) Settlement of total expenditure (prefecture) +Settlement of total expenditure (municipalities)
Formulae ofindicators 分母 歳出決算総額(都道府県財政) 歳出決算総額(都道府県財政) 総人口 総人口
Denominators Settlement of total expenditure (prefecture) Settlement of total expenditure (prefecture) Total population (Both sexes) Total population (Both sexes)
出典 Reference
人口1人当たり民生費(都道府県・市町村財政合計)
人口1人当たり社会福祉費(都道府県・市町村財政合計)
65歳以上人口1人当たり老人福祉費(都道府県・市町村財政合計)
Welfare expenditure per capita(prefecture + municipality)
Social welfare expenditure per capita(prefecture + municipality)
Social welfare expenditure for aged persons per capita65 years old and over (prefecture + municipality)
(千円:thousand yen (千円:thousand yen (千円:thousand yenPref.Code
MeanS.D.
民生費(都道府県・市町村財政合計) 社会福祉費(都道府県・市町村財政合計) 老人福祉費(都道府県・市町村財政合計) 分子
Total welfare expenditure (prefecture) + Total welfare expenditure (municipalities)
Social welfare expenditure (prefecture) +Social welfare expenditure (municipalities)
Social welfare expenditure for the aged (prefecture) +Social welfare expenditure for the aged (municipalities) 指標計算式
総人口 総人口 65歳以上人口 分母
Total population (Both sexes) Total population (Both sexes) Total population (65 and over)
出典
都道府県コー
ド
57

都道府県17歳以下人口1人当たり児童福祉費
(都道府県・市町村財政合計)被保護実人員1人当たり生活保護費
(都道府県・市町村財政合計)人口1人当たり衛生費
(都道府県・市町村財政合計)人口1人当たり土木費
(都道府県・市町村財政合計)
Prefecture
(千円:thousand yen (千円:thousand yen (千円:thousand yen
全国 All Japan
北海道 Hokkaido青森県 Aomori-ken岩手県 Iwate-ken宮城県 Miyagi-ken秋田県 Akita-ken
山形県 Yamagata-ken福島県 Fukushima-ken茨城県 Ibaraki-ken栃木県 Tochigi-ken群馬県 Gumma-ken
埼玉県 Saitama-ken千葉県 Chiba-ken東京都 Tokyo-to神奈川県 Kanagawa-ken新潟県 Niigata-ken
富山県 Toyama-ken石川県 Ishikawa-ken福井県 Fukui-ken山梨県 Yamanashi-ken長野県 Nagano-ken
岐阜県 Gifu-ken静岡県 Shizuoka-ken愛知県 Aichi-ken三重県 Mie-ken滋賀県 Shiga-ken
京都府 Kyoto-fu大阪府 Osaka-fu兵庫県 Hyogo-ken奈良県 Nara-ken和歌山県 Wakayama-ken
鳥取県 Tottori-ken島根県 Shimane-ken岡山県 Okayama-ken広島県 Hiroshima-ken山口県 Yamaguchi-ken
徳島県 Tokushima-ken香川県 Kagawa-ken愛媛県 Ehime-ken高知県 Kochi-ken福岡県 Fukuoka-ken
佐賀県 Saga-ken長崎県 Nagasaki-ken熊本県 Kumamoto-ken大分県 Oita-ken宮崎県 Miyazaki-ken
鹿児島県 Kagoshima-ken沖縄県 Okinawa-ken
平均値 Mean標準偏差 Standard deviation
分子 児童福祉費(都道府県・市町村財政合計) 生活保護費(都道府県・市町村財政合計) 衛生費(都道府県・市町村財政合計) 土木費(都道府県・市町村財政合計)
指標計算式 Numerators Welfare expenditure for children (prefecture) + Welfare expenditure for children (municipalities)
Expenditure for livelihood protection (prefecture) +Expenditure for livelihood protection
(municipalities)
Health expenditure (prefecture) +Health expenditure (municipalities)
Formulae ofindicators 分母 0~17歳人口 生活保護被保護実人員 総人口 総人口
Denominators Population (0-17, total) Persons assisted by livelihood protection Total population (Both sexes) Total population (Both sexes)
出典 Reference
Welfare expenditure for children per capita 0-17 years old (prefecture + municipality)
Welfare expenditure for livelihood protection perperson assisted by livelihood protection
(prefecture + municipality)
Health expenditure per capita(prefecture + municipality)
人口1人当たり土木費(都道府県・市町村財政合計)
人口1人当たり警察費(都道府県財政)
人口1人当たり消防費(都・市町村財政合計)
Public works expenditure per capita(prefecture + municipality)
Police expenditure per capita(prefecture)
Fire protection expenditure per capita(Tokyo-to + municipality)
(千円:thousand yen (千円:thousand yen (千円:thousand yenPref.Code
MeanS.D.
土木費(都道府県・市町村財政合計) 警察費(都道府県財政) 消防費(都・市町村財政) 分子
Police expenditure (prefecture) Fire protection expenditure(Tokyo-to + municipalities) 指標計算式
総人口 総人口 総人口 分母
Total population (Both sexes) Total population (Both sexes) Total population (Both sexes)
出典
都道府県コー
ド
Public-works expenditure (prefecture) +Public-works expenditure (municipalities)
58

都道府県17歳以下人口1人当たり児童福祉費
(都道府県・市町村財政合計)被保護実人員1人当たり生活保護費
(都道府県・市町村財政合計)人口1人当たり衛生費
(都道府県・市町村財政合計)人口1人当たり土木費
(都道府県・市町村財政合計)
Prefecture
(千円:thousand yen (千円:thousand yen (千円:thousand yen
全国 All Japan
北海道 Hokkaido青森県 Aomori-ken岩手県 Iwate-ken宮城県 Miyagi-ken秋田県 Akita-ken
山形県 Yamagata-ken福島県 Fukushima-ken茨城県 Ibaraki-ken栃木県 Tochigi-ken群馬県 Gumma-ken
埼玉県 Saitama-ken千葉県 Chiba-ken東京都 Tokyo-to神奈川県 Kanagawa-ken新潟県 Niigata-ken
富山県 Toyama-ken石川県 Ishikawa-ken福井県 Fukui-ken山梨県 Yamanashi-ken長野県 Nagano-ken
岐阜県 Gifu-ken静岡県 Shizuoka-ken愛知県 Aichi-ken三重県 Mie-ken滋賀県 Shiga-ken
京都府 Kyoto-fu大阪府 Osaka-fu兵庫県 Hyogo-ken奈良県 Nara-ken和歌山県 Wakayama-ken
鳥取県 Tottori-ken島根県 Shimane-ken岡山県 Okayama-ken広島県 Hiroshima-ken山口県 Yamaguchi-ken
徳島県 Tokushima-ken香川県 Kagawa-ken愛媛県 Ehime-ken高知県 Kochi-ken福岡県 Fukuoka-ken
佐賀県 Saga-ken長崎県 Nagasaki-ken熊本県 Kumamoto-ken大分県 Oita-ken宮崎県 Miyazaki-ken
鹿児島県 Kagoshima-ken沖縄県 Okinawa-ken
平均値 Mean標準偏差 Standard deviation
分子 児童福祉費(都道府県・市町村財政合計) 生活保護費(都道府県・市町村財政合計) 衛生費(都道府県・市町村財政合計) 土木費(都道府県・市町村財政合計)
指標計算式 Numerators Welfare expenditure for children (prefecture) + Welfare expenditure for children (municipalities)
Expenditure for livelihood protection (prefecture) +Expenditure for livelihood protection
(municipalities)
Health expenditure (prefecture) +Health expenditure (municipalities)
Formulae ofindicators 分母 0~17歳人口 生活保護被保護実人員 総人口 総人口
Denominators Population (0-17, total) Persons assisted by livelihood protection Total population (Both sexes) Total population (Both sexes)
出典 Reference
Welfare expenditure for children per capita 0-17 years old (prefecture + municipality)
Welfare expenditure for livelihood protection perperson assisted by livelihood protection
(prefecture + municipality)
Health expenditure per capita(prefecture + municipality)
人口1人当たり土木費(都道府県・市町村財政合計)
人口1人当たり警察費(都道府県財政)
人口1人当たり消防費(都・市町村財政合計)
Public works expenditure per capita(prefecture + municipality)
Police expenditure per capita(prefecture)
Fire protection expenditure per capita(Tokyo-to + municipality)
(千円:thousand yen (千円:thousand yen (千円:thousand yenPref.Code
MeanS.D.
土木費(都道府県・市町村財政合計) 警察費(都道府県財政) 消防費(都・市町村財政) 分子
Police expenditure (prefecture) Fire protection expenditure(Tokyo-to + municipalities) 指標計算式
総人口 総人口 総人口 分母
Total population (Both sexes) Total population (Both sexes) Total population (Both sexes)
出典
都道府県コー
ド
Public-works expenditure (prefecture) +Public-works expenditure (municipalities)
59

都道府県人口1人当たり教育費
(都道府県・市町村財政合計)人口1人当たり社会教育費(都道府県・市町村財政合計)
人口1人当たり災害復旧費(都道府県・市町村財政合計)
Prefecture Education expenditure per capita(prefecture + municipality)
Social education expenditure per capita(prefecture + municipality)
Disaster relief expenditure per capita (prefecture + municipality)
(千円:thousand yen (千円:thousand yen (千円:thousand yen
全国 All Japan
北海道 Hokkaido青森県 Aomori-ken岩手県 Iwate-ken宮城県 Miyagi-ken秋田県 Akita-ken
山形県 Yamagata-ken福島県 Fukushima-ken茨城県 Ibaraki-ken栃木県 Tochigi-ken群馬県 Gumma-ken
埼玉県 Saitama-ken千葉県 Chiba-ken東京都 Tokyo-to神奈川県 Kanagawa-ken新潟県 Niigata-ken
富山県 Toyama-ken石川県 Ishikawa-ken福井県 Fukui-ken山梨県 Yamanashi-ken長野県 Nagano-ken
岐阜県 Gifu-ken静岡県 Shizuoka-ken愛知県 Aichi-ken三重県 Mie-ken滋賀県 Shiga-ken
京都府 Kyoto-fu大阪府 Osaka-fu兵庫県 Hyogo-ken奈良県 Nara-ken和歌山県 Wakayama-ken
鳥取県 Tottori-ken島根県 Shimane-ken岡山県 Okayama-ken広島県 Hiroshima-ken山口県 Yamaguchi-ken
徳島県 Tokushima-ken香川県 Kagawa-ken愛媛県 Ehime-ken高知県 Kochi-ken福岡県 Fukuoka-ken
佐賀県 Saga-ken長崎県 Nagasaki-ken熊本県 Kumamoto-ken大分県 Oita-ken宮崎県 Miyazaki-ken
鹿児島県 Kagoshima-ken沖縄県 Okinawa-ken
平均値 Mean標準偏差 Standard deviation
分子 教育費(都道府県・市町村財政合計) 社会教育費(都道府県・市町村財政合計) 災害復旧費(都道府県・市町村財政合計) 小学校費(都道府県・市町村財政合計)
指標計算式 Numerators Education expenditure (prefecture) +Education expenditure (municipalities)
Social education expenditure (prefecture) +Social education expenditure (municipalities)
Disaster relief expenditure (prefecture) +Disaster relief expenditure (municipalities) a)
Formulae ofindicators 分母 総人口 総人口 総人口 小学校児童数(公立)
Denominators Total population (Both sexes) Total population (Both sexes) Total population (Both sexes) Number of elementary school students(Public)
出典 Reference
7)児童・生徒1人当たりの教育費の歳出決算額 Education expenditure per pupil
児童1人当たり公立小学校費(都道府県・市町村財政合計)
生徒1人当たり公立中学校費(都道府県・市町村財政合計)
生徒1人当たり公立高等学校費(都道府県・市町村財政合計)
Elementary school expenditure per pupil(prefecture + municipality)
Junior high school expenditure per pupil(prefecture + municipality)
Senior high school expenditure per pupil(prefecture + municipality)
(千円:thousand yen (千円:thousand yen (千円:thousand yenPref.Code
MeanS.D.
小学校費(都道府県・市町村財政合計) 中学校費(都道府県・市町村財政合計) 高等学校費(都道府県・市町村財政合計) 分子
a) b) c) 指標計算式
小学校児童数(公立) 中学校生徒数(公立) 高等学校生徒数(公立) 分母
Number of elementary school students(Public)
Number of lower secondary school students (Public)
Number of upper secondary school students (Public)
出典a) Education expenditure for elementary schools (prefecture) + Education expenditure for elementary schools (municipalities)b) Education expenditure for junior high schools (prefecture) + Education expenditure for junior high schools (municipalities)c) Education expenditure for senior high schools (prefecture) + Education expenditure for senior high schools (municipalities)
都道府県コー
ド
60

都道府県人口1人当たり教育費
(都道府県・市町村財政合計)人口1人当たり社会教育費(都道府県・市町村財政合計)
人口1人当たり災害復旧費(都道府県・市町村財政合計)
Prefecture Education expenditure per capita(prefecture + municipality)
Social education expenditure per capita(prefecture + municipality)
Disaster relief expenditure per capita (prefecture + municipality)
(千円:thousand yen (千円:thousand yen (千円:thousand yen
全国 All Japan
北海道 Hokkaido青森県 Aomori-ken岩手県 Iwate-ken宮城県 Miyagi-ken秋田県 Akita-ken
山形県 Yamagata-ken福島県 Fukushima-ken茨城県 Ibaraki-ken栃木県 Tochigi-ken群馬県 Gumma-ken
埼玉県 Saitama-ken千葉県 Chiba-ken東京都 Tokyo-to神奈川県 Kanagawa-ken新潟県 Niigata-ken
富山県 Toyama-ken石川県 Ishikawa-ken福井県 Fukui-ken山梨県 Yamanashi-ken長野県 Nagano-ken
岐阜県 Gifu-ken静岡県 Shizuoka-ken愛知県 Aichi-ken三重県 Mie-ken滋賀県 Shiga-ken
京都府 Kyoto-fu大阪府 Osaka-fu兵庫県 Hyogo-ken奈良県 Nara-ken和歌山県 Wakayama-ken
鳥取県 Tottori-ken島根県 Shimane-ken岡山県 Okayama-ken広島県 Hiroshima-ken山口県 Yamaguchi-ken
徳島県 Tokushima-ken香川県 Kagawa-ken愛媛県 Ehime-ken高知県 Kochi-ken福岡県 Fukuoka-ken
佐賀県 Saga-ken長崎県 Nagasaki-ken熊本県 Kumamoto-ken大分県 Oita-ken宮崎県 Miyazaki-ken
鹿児島県 Kagoshima-ken沖縄県 Okinawa-ken
平均値 Mean標準偏差 Standard deviation
分子 教育費(都道府県・市町村財政合計) 社会教育費(都道府県・市町村財政合計) 災害復旧費(都道府県・市町村財政合計) 小学校費(都道府県・市町村財政合計)
指標計算式 Numerators Education expenditure (prefecture) +Education expenditure (municipalities)
Social education expenditure (prefecture) +Social education expenditure (municipalities)
Disaster relief expenditure (prefecture) +Disaster relief expenditure (municipalities) a)
Formulae ofindicators 分母 総人口 総人口 総人口 小学校児童数(公立)
Denominators Total population (Both sexes) Total population (Both sexes) Total population (Both sexes) Number of elementary school students(Public)
出典 Reference
7)児童・生徒1人当たりの教育費の歳出決算額 Education expenditure per pupil
児童1人当たり公立小学校費(都道府県・市町村財政合計)
生徒1人当たり公立中学校費(都道府県・市町村財政合計)
生徒1人当たり公立高等学校費(都道府県・市町村財政合計)
Elementary school expenditure per pupil(prefecture + municipality)
Junior high school expenditure per pupil(prefecture + municipality)
Senior high school expenditure per pupil(prefecture + municipality)
(千円:thousand yen (千円:thousand yen (千円:thousand yenPref.Code
MeanS.D.
小学校費(都道府県・市町村財政合計) 中学校費(都道府県・市町村財政合計) 高等学校費(都道府県・市町村財政合計) 分子
a) b) c) 指標計算式
小学校児童数(公立) 中学校生徒数(公立) 高等学校生徒数(公立) 分母
Number of elementary school students(Public)
Number of lower secondary school students (Public)
Number of upper secondary school students (Public)
出典a) Education expenditure for elementary schools (prefecture) + Education expenditure for elementary schools (municipalities)b) Education expenditure for junior high schools (prefecture) + Education expenditure for junior high schools (municipalities)c) Education expenditure for senior high schools (prefecture) + Education expenditure for senior high schools (municipalities)
都道府県コー
ド
61

都道府県児童・生徒1人当たり特別支援学校費
(都道府県・市町村財政合計)児童1人当たり幼稚園費
(都道府県・市町村財政合計)
Prefecture Expenditure for Schools for special needs educationper pupil (prefecture + municipality)
Kindergarten expenditure per pupil(prefecture + municipality)
(千円:thousand yen (千円:thousand yen
全国 All Japan
北海道 Hokkaido青森県 Aomori-ken岩手県 Iwate-ken宮城県 Miyagi-ken秋田県 Akita-ken
山形県 Yamagata-ken福島県 Fukushima-ken茨城県 Ibaraki-ken栃木県 Tochigi-ken群馬県 Gumma-ken
埼玉県 Saitama-ken千葉県 Chiba-ken東京都 Tokyo-to神奈川県 Kanagawa-ken新潟県 Niigata-ken
富山県 Toyama-ken石川県 Ishikawa-ken福井県 Fukui-ken山梨県 Yamanashi-ken長野県 Nagano-ken
岐阜県 Gifu-ken静岡県 Shizuoka-ken愛知県 Aichi-ken三重県 Mie-ken滋賀県 Shiga-ken
京都府 Kyoto-fu大阪府 Osaka-fu兵庫県 Hyogo-ken奈良県 Nara-ken和歌山県 Wakayama-ken
鳥取県 Tottori-ken島根県 Shimane-ken岡山県 Okayama-ken広島県 Hiroshima-ken山口県 Yamaguchi-ken
徳島県 Tokushima-ken香川県 Kagawa-ken愛媛県 Ehime-ken高知県 Kochi-ken福岡県 Fukuoka-ken
佐賀県 Saga-ken長崎県 Nagasaki-ken熊本県 Kumamoto-ken大分県 Oita-ken宮崎県 Miyazaki-ken
鹿児島県 Kagoshima-ken沖縄県 Okinawa-ken
平均値 Mean標準偏差 Standard deviation
分子特別支援学校費(都道府県・市町村財政合
計)幼稚園費(都道府県・市町村財政合計)
指標計算式 Numerators a) b)
Formulae ofindicators 分母 特別支援学校生徒数(公立) 幼稚園在園者数
Denominators Number of students (Schools for special needseducation, public) Number of Kindergarten students
出典 Referencea) Expenditure for Schools for special needs education (prefecture) + Expenditure for Schools for special needs education (municipalities) b) Education expenditure for kindergartens (prefecture) + Education expenditure for kindergartens (municipalities)
62

都道府県児童・生徒1人当たり特別支援学校費
(都道府県・市町村財政合計)児童1人当たり幼稚園費
(都道府県・市町村財政合計)
Prefecture Expenditure for Schools for special needs educationper pupil (prefecture + municipality)
Kindergarten expenditure per pupil(prefecture + municipality)
(千円:thousand yen (千円:thousand yen
全国 All Japan
北海道 Hokkaido青森県 Aomori-ken岩手県 Iwate-ken宮城県 Miyagi-ken秋田県 Akita-ken
山形県 Yamagata-ken福島県 Fukushima-ken茨城県 Ibaraki-ken栃木県 Tochigi-ken群馬県 Gumma-ken
埼玉県 Saitama-ken千葉県 Chiba-ken東京都 Tokyo-to神奈川県 Kanagawa-ken新潟県 Niigata-ken
富山県 Toyama-ken石川県 Ishikawa-ken福井県 Fukui-ken山梨県 Yamanashi-ken長野県 Nagano-ken
岐阜県 Gifu-ken静岡県 Shizuoka-ken愛知県 Aichi-ken三重県 Mie-ken滋賀県 Shiga-ken
京都府 Kyoto-fu大阪府 Osaka-fu兵庫県 Hyogo-ken奈良県 Nara-ken和歌山県 Wakayama-ken
鳥取県 Tottori-ken島根県 Shimane-ken岡山県 Okayama-ken広島県 Hiroshima-ken山口県 Yamaguchi-ken
徳島県 Tokushima-ken香川県 Kagawa-ken愛媛県 Ehime-ken高知県 Kochi-ken福岡県 Fukuoka-ken
佐賀県 Saga-ken長崎県 Nagasaki-ken熊本県 Kumamoto-ken大分県 Oita-ken宮崎県 Miyazaki-ken
鹿児島県 Kagoshima-ken沖縄県 Okinawa-ken
平均値 Mean標準偏差 Standard deviation
分子特別支援学校費(都道府県・市町村財政合
計)幼稚園費(都道府県・市町村財政合計)
指標計算式 Numerators a) b)
Formulae ofindicators 分母 特別支援学校生徒数(公立) 幼稚園在園者数
Denominators Number of students (Schools for special needseducation, public) Number of Kindergarten students
出典 Referencea) Expenditure for Schools for special needs education (prefecture) + Expenditure for Schools for special needs education (municipalities) b) Education expenditure for kindergartens (prefecture) + Education expenditure for kindergartens (municipalities)
63

E.教育 Education1)教育施設 Educational institutions
都道府県 小学校数(6~11歳人口10万人当たり) 中学校数(12~14歳人口10万人当たり) 高等学校数(15~17歳人口10万人当たり) 幼稚園数(3~5歳人口10万人当たり)
Prefecture Elementary schools(per 100,000 population 6-11 years)
Junior high schools(per 100,000 population 12-14 years)
Senior high schools(per 100,000 population 15-17 years)
Kindergartens (per 100,000 population 3-5 years)
(校:number of schools (校:number of schools (校:number of schools
全国 All Japan
北海道 Hokkaido青森県 Aomori-ken岩手県 Iwate-ken宮城県 Miyagi-ken秋田県 Akita-ken
山形県 Yamagata-ken福島県 Fukushima-ken茨城県 Ibaraki-ken栃木県 Tochigi-ken群馬県 Gumma-ken
埼玉県 Saitama-ken千葉県 Chiba-ken東京都 Tokyo-to神奈川県 Kanagawa-ken新潟県 Niigata-ken
富山県 Toyama-ken石川県 Ishikawa-ken福井県 Fukui-ken山梨県 Yamanashi-ken長野県 Nagano-ken
岐阜県 Gifu-ken静岡県 Shizuoka-ken愛知県 Aichi-ken三重県 Mie-ken滋賀県 Shiga-ken
京都府 Kyoto-fu大阪府 Osaka-fu兵庫県 Hyogo-ken奈良県 Nara-ken和歌山県 Wakayama-ken
鳥取県 Tottori-ken島根県 Shimane-ken岡山県 Okayama-ken広島県 Hiroshima-ken山口県 Yamaguchi-ken
徳島県 Tokushima-ken香川県 Kagawa-ken愛媛県 Ehime-ken高知県 Kochi-ken福岡県 Fukuoka-ken
佐賀県 Saga-ken長崎県 Nagasaki-ken熊本県 Kumamoto-ken大分県 Oita-ken宮崎県 Miyazaki-ken
鹿児島県 Kagoshima-ken沖縄県 Okinawa-ken
平均値 Mean標準偏差 Standard deviation
分子 小学校数 中学校数 高等学校数 幼稚園数
指標計算式 Numerators Number of elementary schools Number of lower secondary schools Number of upper secondary schools Number of kindergartens
Formulae ofindicators 分母 6~11歳人口 12~14歳人口 15~17歳人口 3~5歳人口
Denominators Population (6-11, total) Population (12-14, total) Population (15-17, total) Population (0-3, total)
出典 Reference
幼稚園数(3~5歳人口10万人当たり) 保育所等数(0~5歳人口10万人当たり) 認定こども園数(0~5歳人口10万人当たり)
Kindergartens (per 100,000 population 3-5 years) Day nurseries (per 100,000 population 0-5 years) Authorized child centers (per 100,000 population 0-5years)
(園:number of kindergartens (所:number of day nurseries (園:number of centersPref.Code
MeanS.D.
幼稚園数 保育所等数 認定こども園数 分子
Number of kindergartens Number of nursery centers Number of authorized child centers 指標計算式
3~5歳人口 0~5歳人口 0~5歳人口 分母
Population (0-3, total) Population (0-5, total) Population (0-5, total)
出典
都道府県コー
ド
64

E.教育 Education1)教育施設 Educational institutions
都道府県 小学校数(6~11歳人口10万人当たり) 中学校数(12~14歳人口10万人当たり) 高等学校数(15~17歳人口10万人当たり) 幼稚園数(3~5歳人口10万人当たり)
Prefecture Elementary schools(per 100,000 population 6-11 years)
Junior high schools(per 100,000 population 12-14 years)
Senior high schools(per 100,000 population 15-17 years)
Kindergartens (per 100,000 population 3-5 years)
(校:number of schools (校:number of schools (校:number of schools
全国 All Japan
北海道 Hokkaido青森県 Aomori-ken岩手県 Iwate-ken宮城県 Miyagi-ken秋田県 Akita-ken
山形県 Yamagata-ken福島県 Fukushima-ken茨城県 Ibaraki-ken栃木県 Tochigi-ken群馬県 Gumma-ken
埼玉県 Saitama-ken千葉県 Chiba-ken東京都 Tokyo-to神奈川県 Kanagawa-ken新潟県 Niigata-ken
富山県 Toyama-ken石川県 Ishikawa-ken福井県 Fukui-ken山梨県 Yamanashi-ken長野県 Nagano-ken
岐阜県 Gifu-ken静岡県 Shizuoka-ken愛知県 Aichi-ken三重県 Mie-ken滋賀県 Shiga-ken
京都府 Kyoto-fu大阪府 Osaka-fu兵庫県 Hyogo-ken奈良県 Nara-ken和歌山県 Wakayama-ken
鳥取県 Tottori-ken島根県 Shimane-ken岡山県 Okayama-ken広島県 Hiroshima-ken山口県 Yamaguchi-ken
徳島県 Tokushima-ken香川県 Kagawa-ken愛媛県 Ehime-ken高知県 Kochi-ken福岡県 Fukuoka-ken
佐賀県 Saga-ken長崎県 Nagasaki-ken熊本県 Kumamoto-ken大分県 Oita-ken宮崎県 Miyazaki-ken
鹿児島県 Kagoshima-ken沖縄県 Okinawa-ken
平均値 Mean標準偏差 Standard deviation
分子 小学校数 中学校数 高等学校数 幼稚園数
指標計算式 Numerators Number of elementary schools Number of lower secondary schools Number of upper secondary schools Number of kindergartens
Formulae ofindicators 分母 6~11歳人口 12~14歳人口 15~17歳人口 3~5歳人口
Denominators Population (6-11, total) Population (12-14, total) Population (15-17, total) Population (0-3, total)
出典 Reference
幼稚園数(3~5歳人口10万人当たり) 保育所等数(0~5歳人口10万人当たり) 認定こども園数(0~5歳人口10万人当たり)
Kindergartens (per 100,000 population 3-5 years) Day nurseries (per 100,000 population 0-5 years) Authorized child centers (per 100,000 population 0-5years)
(園:number of kindergartens (所:number of day nurseries (園:number of centersPref.Code
MeanS.D.
幼稚園数 保育所等数 認定こども園数 分子
Number of kindergartens Number of nursery centers Number of authorized child centers 指標計算式
3~5歳人口 0~5歳人口 0~5歳人口 分母
Population (0-3, total) Population (0-5, total) Population (0-5, total)
出典
都道府県コー
ド
65
E
教
育
(指標)

都道府県 小学校数(可住地面積100k㎡当たり) 中学校数(可住地面積100k㎡当たり) 高等学校数(可住地面積100k㎡当たり) 公立高等学校割合
Prefecture Elementary schools (per inhabitable area 100k㎡)
Junior high schools(per inhabitable area 100 k㎡)
Senior high schools(per inhabitable area 100 k㎡)
Ratio of public senior high schools
(校:number of schools (校:number of schools (校:number of schools
全国 All Japan
北海道 Hokkaido青森県 Aomori-ken岩手県 Iwate-ken宮城県 Miyagi-ken秋田県 Akita-ken
山形県 Yamagata-ken福島県 Fukushima-ken茨城県 Ibaraki-ken栃木県 Tochigi-ken群馬県 Gumma-ken
埼玉県 Saitama-ken千葉県 Chiba-ken東京都 Tokyo-to神奈川県 Kanagawa-ken新潟県 Niigata-ken
富山県 Toyama-ken石川県 Ishikawa-ken福井県 Fukui-ken山梨県 Yamanashi-ken長野県 Nagano-ken
岐阜県 Gifu-ken静岡県 Shizuoka-ken愛知県 Aichi-ken三重県 Mie-ken滋賀県 Shiga-ken
京都府 Kyoto-fu大阪府 Osaka-fu兵庫県 Hyogo-ken奈良県 Nara-ken和歌山県 Wakayama-ken
鳥取県 Tottori-ken島根県 Shimane-ken岡山県 Okayama-ken広島県 Hiroshima-ken山口県 Yamaguchi-ken
徳島県 Tokushima-ken香川県 Kagawa-ken愛媛県 Ehime-ken高知県 Kochi-ken福岡県 Fukuoka-ken
佐賀県 Saga-ken長崎県 Nagasaki-ken熊本県 Kumamoto-ken大分県 Oita-ken宮崎県 Miyazaki-ken
鹿児島県 Kagoshima-ken沖縄県 Okinawa-ken
平均値 Mean標準偏差 Standard deviation
分子 小学校数 中学校数 高等学校数 公立高等学校数
指標計算式 Numerators Number of elementary schools Number of lower secondary schools Number of upper secondary school Number of upper secondary schools(Public)
Formulae ofindicators 分母 可住地面積 1) 可住地面積 1) 可住地面積 1) 高等学校数
Denominators Inhabitable area 1) Inhabitable area 1) Inhabitable area 1) Number of upper secondary school
出典 Reference1)可住地面積は総務省統計局にて算出している。1) “Inhabitable area” is calculated by Statistics Bureau, Ministry of Internal Affairs and Communications, Japan.
公立高等学校割合 公立幼稚園割合 公営保育所等割合
Ratio of public senior high schools Ratio of public kindergartens Ratio of public day nurseries
(%) (%) (%)Pref.Code
MeanS.D.
公立高等学校数 公立幼稚園数 公営保育所等数 分子
Number of upper secondary schools(Public)
Number of kindergartens (Public) No. of public nursery centers 指標計算式
高等学校数 幼稚園数 保育所等数 分母
Number of upper secondary school Number of kindergartens Number of nursery centers
出典
都道府県コー
ド
66

都道府県 小学校数(可住地面積100k㎡当たり) 中学校数(可住地面積100k㎡当たり) 高等学校数(可住地面積100k㎡当たり) 公立高等学校割合
Prefecture Elementary schools (per inhabitable area 100k㎡)
Junior high schools(per inhabitable area 100 k㎡)
Senior high schools(per inhabitable area 100 k㎡)
Ratio of public senior high schools
(校:number of schools (校:number of schools (校:number of schools
全国 All Japan
北海道 Hokkaido青森県 Aomori-ken岩手県 Iwate-ken宮城県 Miyagi-ken秋田県 Akita-ken
山形県 Yamagata-ken福島県 Fukushima-ken茨城県 Ibaraki-ken栃木県 Tochigi-ken群馬県 Gumma-ken
埼玉県 Saitama-ken千葉県 Chiba-ken東京都 Tokyo-to神奈川県 Kanagawa-ken新潟県 Niigata-ken
富山県 Toyama-ken石川県 Ishikawa-ken福井県 Fukui-ken山梨県 Yamanashi-ken長野県 Nagano-ken
岐阜県 Gifu-ken静岡県 Shizuoka-ken愛知県 Aichi-ken三重県 Mie-ken滋賀県 Shiga-ken
京都府 Kyoto-fu大阪府 Osaka-fu兵庫県 Hyogo-ken奈良県 Nara-ken和歌山県 Wakayama-ken
鳥取県 Tottori-ken島根県 Shimane-ken岡山県 Okayama-ken広島県 Hiroshima-ken山口県 Yamaguchi-ken
徳島県 Tokushima-ken香川県 Kagawa-ken愛媛県 Ehime-ken高知県 Kochi-ken福岡県 Fukuoka-ken
佐賀県 Saga-ken長崎県 Nagasaki-ken熊本県 Kumamoto-ken大分県 Oita-ken宮崎県 Miyazaki-ken
鹿児島県 Kagoshima-ken沖縄県 Okinawa-ken
平均値 Mean標準偏差 Standard deviation
分子 小学校数 中学校数 高等学校数 公立高等学校数
指標計算式 Numerators Number of elementary schools Number of lower secondary schools Number of upper secondary school Number of upper secondary schools(Public)
Formulae ofindicators 分母 可住地面積 1) 可住地面積 1) 可住地面積 1) 高等学校数
Denominators Inhabitable area 1) Inhabitable area 1) Inhabitable area 1) Number of upper secondary school
出典 Reference1)可住地面積は総務省統計局にて算出している。1) “Inhabitable area” is calculated by Statistics Bureau, Ministry of Internal Affairs and Communications, Japan.
公立高等学校割合 公立幼稚園割合 公営保育所等割合
Ratio of public senior high schools Ratio of public kindergartens Ratio of public day nurseries
(%) (%) (%)Pref.Code
MeanS.D.
公立高等学校数 公立幼稚園数 公営保育所等数 分子
Number of upper secondary schools(Public)
Number of kindergartens (Public) No. of public nursery centers 指標計算式
高等学校数 幼稚園数 保育所等数 分母
Number of upper secondary school Number of kindergartens Number of nursery centers
出典
都道府県コー
ド
67

2)教員 Teachers 3)生徒 Students
都道府県 小学校教員割合(女) 中学校教員割合(女) 小学校児童数(教員1人当たり) 中学校生徒数(教員1人当たり)
Prefecture Ratio of elementary school teachers (Female)Ratio of junior high school teachers
(Female) Elementary school pupils (per teacher) Junior high school students (per teacher)
(%) (%) (人:person
全国 All Japan
北海道 Hokkaido青森県 Aomori-ken岩手県 Iwate-ken宮城県 Miyagi-ken秋田県 Akita-ken
山形県 Yamagata-ken福島県 Fukushima-ken茨城県 Ibaraki-ken栃木県 Tochigi-ken群馬県 Gumma-ken
埼玉県 Saitama-ken千葉県 Chiba-ken東京都 Tokyo-to神奈川県 Kanagawa-ken新潟県 Niigata-ken
富山県 Toyama-ken石川県 Ishikawa-ken福井県 Fukui-ken山梨県 Yamanashi-ken長野県 Nagano-ken
岐阜県 Gifu-ken静岡県 Shizuoka-ken愛知県 Aichi-ken三重県 Mie-ken滋賀県 Shiga-ken
京都府 Kyoto-fu大阪府 Osaka-fu兵庫県 Hyogo-ken奈良県 Nara-ken和歌山県 Wakayama-ken
鳥取県 Tottori-ken島根県 Shimane-ken岡山県 Okayama-ken広島県 Hiroshima-ken山口県 Yamaguchi-ken
徳島県 Tokushima-ken香川県 Kagawa-ken愛媛県 Ehime-ken高知県 Kochi-ken福岡県 Fukuoka-ken
佐賀県 Saga-ken長崎県 Nagasaki-ken熊本県 Kumamoto-ken大分県 Oita-ken宮崎県 Miyazaki-ken
鹿児島県 Kagoshima-ken沖縄県 Okinawa-ken
平均値 Mean標準偏差 Standard deviation
分子 小学校児童数 中学校生徒数
指標計算式 Numerators
小学校教員数(女)
Number of elementary school teachers(Female)
中学校教員数(女)
Number of lower secondary school teachers(Female) Elementary school students Lower secondary school students
Formulae ofindicators 分母 小学校教員数 中学校教員数 小学校教員数 中学校教員数
Denominators Number of elementary school teachers Number of lower secondary school teachers Number of elementary school teachers Number of lower secondary school teachers
出典 Reference
中学校生徒数(教員1人当たり) 高等学校生徒数(教員1人当たり) 幼稚園在園者数(教員1人当たり)
Junior high school students (per teacher) Senior high school students (per teacher) Kindergarten pupils (per teacher)
(人:person (人:person (人:personPref.Code
MeanS.D.
中学校生徒数 高等学校生徒数 幼稚園在園者数 分子
Lower secondary school students Upper secondary school students Number of Kindergarten students 指標計算式
中学校教員数 高等学校教員数 幼稚園教員数 分母
Number of lower secondary school teachers Number of upper secondary school teachers Number of kindergarten teachers (Total)
出典
都道府県コー
ド
68

2)教員 Teachers 3)生徒 Students
都道府県 女子教員割合(小学校) 女子教員割合(中学校) 小学校児童数(教員1人当たり) 中学校生徒数(教員1人当たり)
Prefecture Ratio of female teachers (elementary school) Ratio of female teachers(junior high school)
Elementary school pupils (per teacher) Junior high school students (per teacher)
(%) (%) (人:person
全国 All Japan
北海道 Hokkaido青森県 Aomori-ken岩手県 Iwate-ken宮城県 Miyagi-ken秋田県 Akita-ken
山形県 Yamagata-ken福島県 Fukushima-ken茨城県 Ibaraki-ken栃木県 Tochigi-ken群馬県 Gumma-ken
埼玉県 Saitama-ken千葉県 Chiba-ken東京都 Tokyo-to神奈川県 Kanagawa-ken新潟県 Niigata-ken
富山県 Toyama-ken石川県 Ishikawa-ken福井県 Fukui-ken山梨県 Yamanashi-ken長野県 Nagano-ken
岐阜県 Gifu-ken静岡県 Shizuoka-ken愛知県 Aichi-ken三重県 Mie-ken滋賀県 Shiga-ken
京都府 Kyoto-fu大阪府 Osaka-fu兵庫県 Hyogo-ken奈良県 Nara-ken和歌山県 Wakayama-ken
鳥取県 Tottori-ken島根県 Shimane-ken岡山県 Okayama-ken広島県 Hiroshima-ken山口県 Yamaguchi-ken
徳島県 Tokushima-ken香川県 Kagawa-ken愛媛県 Ehime-ken高知県 Kochi-ken福岡県 Fukuoka-ken
佐賀県 Saga-ken長崎県 Nagasaki-ken熊本県 Kumamoto-ken大分県 Oita-ken宮崎県 Miyazaki-ken
鹿児島県 Kagoshima-ken沖縄県 Okinawa-ken
平均値 Mean標準偏差 Standard deviation
分子 小学校女子教員数 中学校女子教員数 小学校児童数 中学校生徒数
指標計算式 Numerators Number of elementary school teachers(Female)
Number of lower secondary school teachers(Female)
Elementary school students Lower secondary school students
Formulae ofindicators 分母 小学校教員数 中学校教員数 小学校教員数 中学校教員数
Denominators Number of elementary school teachers Number of lower secondary school teachers Number of elementary school teachers Number of lower secondary school teachers
出典 Reference
中学校生徒数(教員1人当たり) 高等学校生徒数(教員1人当たり) 幼稚園在園者数(教員1人当たり)
Junior high school students (per teacher) Senior high school students (per teacher) Kindergarten pupils (per teacher)
(人:person (人:person (人:personPref.Code
MeanS.D.
中学校生徒数 高等学校生徒数 幼稚園在園者数 分子
Lower secondary school students Upper secondary school students Number of Kindergarten students 指標計算式
中学校教員数 高等学校教員数 幼稚園教員数 分母
Number of lower secondary school teachers Number of upper secondary school teachers Number of kindergarten teachers (Total)
出典
都道府県コー
ド
69

都道府県 保育所等在所児数(保育士1人当たり) 公立高等学校生徒比率 公立幼稚園在園者比率 公営保育所等在所児比率
Prefecture Day nursery pupils (per nurse) Ratio of public senior high school students Ratio of public kindergarteners Ratio of public day nursery children
(人:person (%) (%)
全国 All Japan
北海道 Hokkaido青森県 Aomori-ken岩手県 Iwate-ken宮城県 Miyagi-ken秋田県 Akita-ken
山形県 Yamagata-ken福島県 Fukushima-ken茨城県 Ibaraki-ken栃木県 Tochigi-ken群馬県 Gumma-ken
埼玉県 Saitama-ken千葉県 Chiba-ken東京都 Tokyo-to神奈川県 Kanagawa-ken新潟県 Niigata-ken
富山県 Toyama-ken石川県 Ishikawa-ken福井県 Fukui-ken山梨県 Yamanashi-ken長野県 Nagano-ken
岐阜県 Gifu-ken静岡県 Shizuoka-ken愛知県 Aichi-ken三重県 Mie-ken滋賀県 Shiga-ken
京都府 Kyoto-fu大阪府 Osaka-fu兵庫県 Hyogo-ken奈良県 Nara-ken和歌山県 Wakayama-ken
鳥取県 Tottori-ken島根県 Shimane-ken岡山県 Okayama-ken広島県 Hiroshima-ken山口県 Yamaguchi-ken
徳島県 Tokushima-ken香川県 Kagawa-ken愛媛県 Ehime-ken高知県 Kochi-ken福岡県 Fukuoka-ken
佐賀県 Saga-ken長崎県 Nagasaki-ken熊本県 Kumamoto-ken大分県 Oita-ken宮崎県 Miyazaki-ken
鹿児島県 Kagoshima-ken沖縄県 Okinawa-ken
平均値 Mean標準偏差 Standard deviation
分子 保育所等在所児数 公立高等学校生徒数 公立幼稚園在園者数 公営保育所等在所児数
指標計算式 Numerators Number of infants enrolled in nursery centers Number of upper secondary school students(Public)
Number of kindergarten students (Public) No. of infants enrolled inpublic nursery centers
Formulae ofindicators 分母 保育所等保育士数 高等学校生徒数 幼稚園在園者数 保育所等在所児数
Denominators No. of nursery teachers in nursery centers Upper secondary school students Number of Kindergarten students Number of infants enrolled innursery centers
出典 Reference
公営保育所等在所児比率 小学校児童数(1学級当たり) 中学校生徒数(1学級当たり)
Ratio of public day nursery children Elementary school pupils (per class) Junior high school students (per class)
(%) (人:person (人:personPref.Code
MeanS.D.
公営保育所等在所児数 小学校児童数 中学校生徒数 分子
No. of infants enrolled inpublic nursery centers
Elementary school students Lower secondary school students 指標計算式
保育所等在所児数 小学校学級数 中学校学級数 分母
Number of infants enrolled innursery centers
Number of elementary school classes Number of lower secondary school classes
出典
都道府県コー
ド
70

都道府県 保育所等在所児数(保育士1人当たり) 公立高等学校生徒比率 公立幼稚園在園者比率 公営保育所等在所児比率
Prefecture Day nursery pupils (per nurse) Ratio of public senior high school students Ratio of public kindergarteners Ratio of public day nursery children
(人:person (%) (%)
全国 All Japan
北海道 Hokkaido青森県 Aomori-ken岩手県 Iwate-ken宮城県 Miyagi-ken秋田県 Akita-ken
山形県 Yamagata-ken福島県 Fukushima-ken茨城県 Ibaraki-ken栃木県 Tochigi-ken群馬県 Gumma-ken
埼玉県 Saitama-ken千葉県 Chiba-ken東京都 Tokyo-to神奈川県 Kanagawa-ken新潟県 Niigata-ken
富山県 Toyama-ken石川県 Ishikawa-ken福井県 Fukui-ken山梨県 Yamanashi-ken長野県 Nagano-ken
岐阜県 Gifu-ken静岡県 Shizuoka-ken愛知県 Aichi-ken三重県 Mie-ken滋賀県 Shiga-ken
京都府 Kyoto-fu大阪府 Osaka-fu兵庫県 Hyogo-ken奈良県 Nara-ken和歌山県 Wakayama-ken
鳥取県 Tottori-ken島根県 Shimane-ken岡山県 Okayama-ken広島県 Hiroshima-ken山口県 Yamaguchi-ken
徳島県 Tokushima-ken香川県 Kagawa-ken愛媛県 Ehime-ken高知県 Kochi-ken福岡県 Fukuoka-ken
佐賀県 Saga-ken長崎県 Nagasaki-ken熊本県 Kumamoto-ken大分県 Oita-ken宮崎県 Miyazaki-ken
鹿児島県 Kagoshima-ken沖縄県 Okinawa-ken
平均値 Mean標準偏差 Standard deviation
分子 保育所等在所児数 公立高等学校生徒数 公立幼稚園在園者数 公営保育所等在所児数
指標計算式 Numerators Number of infants enrolled in nursery centers Number of upper secondary school students(Public)
Number of kindergarten students (Public) No. of infants enrolled inpublic nursery centers
Formulae ofindicators 分母 保育所等保育士数 高等学校生徒数 幼稚園在園者数 保育所等在所児数
Denominators No. of nursery teachers in nursery centers Upper secondary school students Number of Kindergarten students Number of infants enrolled innursery centers
出典 Reference
公営保育所等在所児比率 小学校児童数(1学級当たり) 中学校生徒数(1学級当たり)
Ratio of public day nursery children Elementary school pupils (per class) Junior high school students (per class)
(%) (人:person (人:personPref.Code
MeanS.D.
公営保育所等在所児数 小学校児童数 中学校生徒数 分子
No. of infants enrolled inpublic nursery centers
Elementary school students Lower secondary school students 指標計算式
保育所等在所児数 小学校学級数 中学校学級数 分母
Number of infants enrolled innursery centers
Number of elementary school classes Number of lower secondary school classes
出典
都道府県コー
ド
71

4)短期大学・大学
Junior colleges, colleges and universities
都道府県 短期大学数(人口10万人当たり) 大学数(人口10万人当たり) 短期大学収容力指数 大学収容力指数
Prefecture Junior colleges (per 100,000 persons) Colleges and universities(per 100,000 persons) Entrance capacity index of junior colleges Entrance capacity index of colleges and universities
(校:number of schools (校:number of schools
全国 All Japan
北海道 Hokkaido青森県 Aomori-ken岩手県 Iwate-ken宮城県 Miyagi-ken秋田県 Akita-ken
山形県 Yamagata-ken福島県 Fukushima-ken茨城県 Ibaraki-ken栃木県 Tochigi-ken群馬県 Gumma-ken
埼玉県 Saitama-ken千葉県 Chiba-ken東京都 Tokyo-to神奈川県 Kanagawa-ken新潟県 Niigata-ken
富山県 Toyama-ken石川県 Ishikawa-ken福井県 Fukui-ken山梨県 Yamanashi-ken長野県 Nagano-ken
岐阜県 Gifu-ken静岡県 Shizuoka-ken愛知県 Aichi-ken三重県 Mie-ken滋賀県 Shiga-ken
京都府 Kyoto-fu大阪府 Osaka-fu兵庫県 Hyogo-ken奈良県 Nara-ken和歌山県 Wakayama-ken
鳥取県 Tottori-ken島根県 Shimane-ken岡山県 Okayama-ken広島県 Hiroshima-ken山口県 Yamaguchi-ken
徳島県 Tokushima-ken香川県 Kagawa-ken愛媛県 Ehime-ken高知県 Kochi-ken福岡県 Fukuoka-ken
佐賀県 Saga-ken長崎県 Nagasaki-ken熊本県 Kumamoto-ken大分県 Oita-ken宮崎県 Miyazaki-ken
鹿児島県 Kagoshima-ken沖縄県 Okinawa-ken
平均値 Mean標準偏差 Standard deviation
分子 短期大学数 大学数 短期大学入学者数 × 100 大学入学者数 × 100
指標計算式 Numerators Number of junior colleges Colleges and universities Number of new students enrolled(Junior colleges)×100
Number of new students enrolled(Universities) ×100
Formulae ofindicators 分母 総人口 総人口 高卒者のうち短期大学進学者数(前年度) 高卒者のうち大学進学者数(前年度)
Denominators Total population (Both sexes) Total population (Both sexes) Number of upper secondary school graduatesgoing to junior colleges (previous fiscal year)
出典 Reference
大学収容力指数 国立大学学生数割合 公立大学学生数割合
Entrance capacity index of colleges and universities Ratio of students of national colleges and universities toall students
Ratio of students of public colleges and universities toall students
(%) (%)Pref.Code
MeanS.D.
大学入学者数 × 100 国立大学学生数 公立大学学生数 分子
Number of new students enrolled(Universities) ×100
Number of university students (National) Number of university students (Public) 指標計算式
高卒者のうち大学進学者数(前年度) 大学学生数 大学学生数 分母
Number of upper secondary school graduates going touniversities (previous fiscal year) Number of university students Number of university students
出典
都道府県コー
ド
72

4)短期大学・大学
Junior colleges, colleges and universities
都道府県 短期大学数(人口10万人当たり) 大学数(人口10万人当たり) 短期大学収容力指数 大学収容力指数
Prefecture Junior colleges (per 100,000 persons) Colleges and universities(per 100,000 persons) Entrance capacity index of junior colleges Entrance capacity index of colleges and universities
(校:number of schools (校:number of schools
全国 All Japan
北海道 Hokkaido青森県 Aomori-ken岩手県 Iwate-ken宮城県 Miyagi-ken秋田県 Akita-ken
山形県 Yamagata-ken福島県 Fukushima-ken茨城県 Ibaraki-ken栃木県 Tochigi-ken群馬県 Gumma-ken
埼玉県 Saitama-ken千葉県 Chiba-ken東京都 Tokyo-to神奈川県 Kanagawa-ken新潟県 Niigata-ken
富山県 Toyama-ken石川県 Ishikawa-ken福井県 Fukui-ken山梨県 Yamanashi-ken長野県 Nagano-ken
岐阜県 Gifu-ken静岡県 Shizuoka-ken愛知県 Aichi-ken三重県 Mie-ken滋賀県 Shiga-ken
京都府 Kyoto-fu大阪府 Osaka-fu兵庫県 Hyogo-ken奈良県 Nara-ken和歌山県 Wakayama-ken
鳥取県 Tottori-ken島根県 Shimane-ken岡山県 Okayama-ken広島県 Hiroshima-ken山口県 Yamaguchi-ken
徳島県 Tokushima-ken香川県 Kagawa-ken愛媛県 Ehime-ken高知県 Kochi-ken福岡県 Fukuoka-ken
佐賀県 Saga-ken長崎県 Nagasaki-ken熊本県 Kumamoto-ken大分県 Oita-ken宮崎県 Miyazaki-ken
鹿児島県 Kagoshima-ken沖縄県 Okinawa-ken
平均値 Mean標準偏差 Standard deviation
分子 短期大学数 大学数 短期大学入学者数 × 100 大学入学者数 × 100
指標計算式 Numerators Number of junior colleges Colleges and universities Number of new students enrolled(Junior colleges)×100
Number of new students enrolled(Universities) ×100
Formulae ofindicators 分母 総人口 総人口 高卒者のうち短期大学進学者数(前年度) 高卒者のうち大学進学者数(前年度)
Denominators Total population (Both sexes) Total population (Both sexes) Number of upper secondary school graduatesgoing to junior colleges (previous fiscal year)
出典 Reference
大学収容力指数 国立大学学生数割合 公立大学学生数割合
Entrance capacity index of colleges and universities Ratio of students of national colleges and universities toall students
Ratio of students of public colleges and universities toall students
(%) (%)Pref.Code
MeanS.D.
大学入学者数 × 100 国立大学学生数 公立大学学生数 分子
Number of new students enrolled(Universities) ×100
Number of university students (National) Number of university students (Public) 指標計算式
高卒者のうち大学進学者数(前年度) 大学学生数 大学学生数 分母
Number of upper secondary school graduates going touniversities (previous fiscal year) Number of university students Number of university students
出典
都道府県コー
ド
73

5)専修学校・各種学校 Speciality schools and miscellaneous schools
都道府県 私立大学学生数割合 専修学校数(人口10万人当たり) 各種学校数(人口10万人当たり) 専修学校生徒数(人口千人当たり)
Prefecture Ratio of students of private colleges anduniversities to all students
Speciality schools (per 100,000 persons) Miscellaneous schools (per 100,000 persons)
(%) (校:number of schools (校:number of schools
全国 All Japan
北海道 Hokkaido青森県 Aomori-ken岩手県 Iwate-ken宮城県 Miyagi-ken秋田県 Akita-ken
山形県 Yamagata-ken福島県 Fukushima-ken茨城県 Ibaraki-ken栃木県 Tochigi-ken群馬県 Gumma-ken
埼玉県 Saitama-ken千葉県 Chiba-ken東京都 Tokyo-to神奈川県 Kanagawa-ken新潟県 Niigata-ken
富山県 Toyama-ken石川県 Ishikawa-ken福井県 Fukui-ken山梨県 Yamanashi-ken長野県 Nagano-ken
岐阜県 Gifu-ken静岡県 Shizuoka-ken愛知県 Aichi-ken三重県 Mie-ken滋賀県 Shiga-ken
京都府 Kyoto-fu大阪府 Osaka-fu兵庫県 Hyogo-ken奈良県 Nara-ken和歌山県 Wakayama-ken
鳥取県 Tottori-ken島根県 Shimane-ken岡山県 Okayama-ken広島県 Hiroshima-ken山口県 Yamaguchi-ken
徳島県 Tokushima-ken香川県 Kagawa-ken愛媛県 Ehime-ken高知県 Kochi-ken福岡県 Fukuoka-ken
佐賀県 Saga-ken長崎県 Nagasaki-ken熊本県 Kumamoto-ken大分県 Oita-ken宮崎県 Miyazaki-ken
鹿児島県 Kagoshima-ken沖縄県 Okinawa-ken
平均値 Mean標準偏差 Standard deviation
分子 私立大学学生数 専修学校数 各種学校数 専修学校生徒数
指標計算式 Numerators Number of university students (Private) Number of specialized training colleges Number of miscellaneous schools Number of specialized training collegestudents
Formulae ofindicators 分母 大学学生数 総人口 総人口 総人口
Denominators Number of university students Total population (Both sexes) Total population (Both sexes) Total population (Both sexes)
出典 Reference
6)教育普及度 Educational diffusion rates
専修学校生徒数(人口千人当たり) 各種学校生徒数(人口千人当たり) 教育普及度(幼稚園)
Students enrolled in speciality schools(per 1,000 persons)
Students enrolled in miscellaneous schools(per 1,000 persons)
Educational diffusion rate (kindergartens)
(人:person (人:person (%)Pref.Code
MeanS.D.
専修学校生徒数 各種学校生徒数 幼稚園修了者数 分子
Number of specialized training collegestudents
Number of miscellaneous school students Number of kindergarten graduates 指標計算式
総人口 総人口 小学校児童数(第1学年児童数) 分母
Total population (Both sexes) Total population (Both sexes) Number of first graders of elementary schools
出典
都道府県コー
ド
74

5)専修学校・各種学校 Speciality schools and miscellaneous schools
都道府県 私立大学学生数割合 専修学校数(人口10万人当たり) 各種学校数(人口10万人当たり) 専修学校生徒数(人口千人当たり)
Prefecture Ratio of students of private colleges anduniversities to all students
Speciality schools (per 100,000 persons) Miscellaneous schools (per 100,000 persons)
(%) (校:number of schools (校:number of schools
全国 All Japan
北海道 Hokkaido青森県 Aomori-ken岩手県 Iwate-ken宮城県 Miyagi-ken秋田県 Akita-ken
山形県 Yamagata-ken福島県 Fukushima-ken茨城県 Ibaraki-ken栃木県 Tochigi-ken群馬県 Gumma-ken
埼玉県 Saitama-ken千葉県 Chiba-ken東京都 Tokyo-to神奈川県 Kanagawa-ken新潟県 Niigata-ken
富山県 Toyama-ken石川県 Ishikawa-ken福井県 Fukui-ken山梨県 Yamanashi-ken長野県 Nagano-ken
岐阜県 Gifu-ken静岡県 Shizuoka-ken愛知県 Aichi-ken三重県 Mie-ken滋賀県 Shiga-ken
京都府 Kyoto-fu大阪府 Osaka-fu兵庫県 Hyogo-ken奈良県 Nara-ken和歌山県 Wakayama-ken
鳥取県 Tottori-ken島根県 Shimane-ken岡山県 Okayama-ken広島県 Hiroshima-ken山口県 Yamaguchi-ken
徳島県 Tokushima-ken香川県 Kagawa-ken愛媛県 Ehime-ken高知県 Kochi-ken福岡県 Fukuoka-ken
佐賀県 Saga-ken長崎県 Nagasaki-ken熊本県 Kumamoto-ken大分県 Oita-ken宮崎県 Miyazaki-ken
鹿児島県 Kagoshima-ken沖縄県 Okinawa-ken
平均値 Mean標準偏差 Standard deviation
分子 私立大学学生数 専修学校数 各種学校数 専修学校生徒数
指標計算式 Numerators Number of university students (Private) Number of specialized training colleges Number of miscellaneous schools Number of specialized training collegestudents
Formulae ofindicators 分母 大学学生数 総人口 総人口 総人口
Denominators Number of university students Total population (Both sexes) Total population (Both sexes) Total population (Both sexes)
出典 Reference
6)教育普及度 Educational diffusion rates
専修学校生徒数(人口千人当たり) 各種学校生徒数(人口千人当たり) 教育普及度(幼稚園)
Students enrolled in speciality schools(per 1,000 persons)
Students enrolled in miscellaneous schools(per 1,000 persons)
Educational diffusion rate (kindergartens)
(人:person (人:person (%)Pref.Code
MeanS.D.
専修学校生徒数 各種学校生徒数 幼稚園修了者数 分子
Number of specialized training collegestudents
Number of miscellaneous school students Number of kindergarten graduates 指標計算式
総人口 総人口 小学校児童数(第1学年児童数) 分母
Total population (Both sexes) Total population (Both sexes) Number of first graders of elementary schools
出典
都道府県コー
ド
75
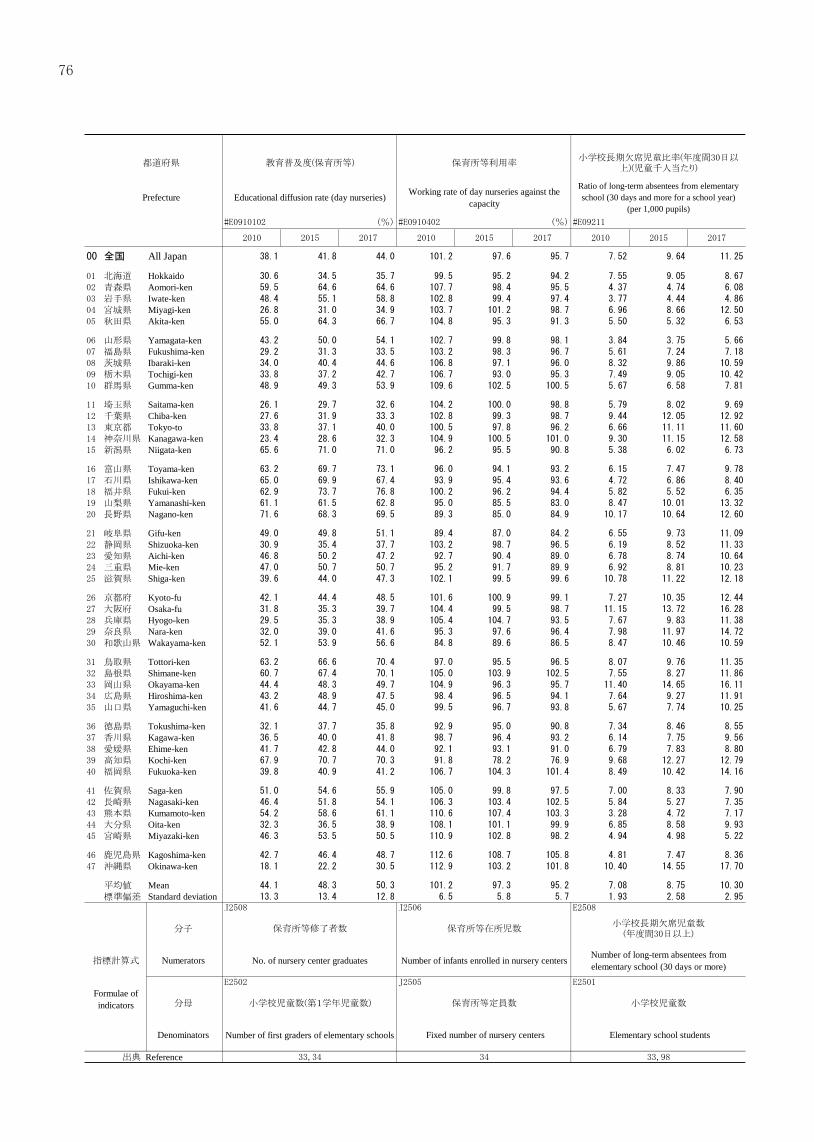
都道府県 教育普及度(保育所等) 保育所等利用率小学校長期欠席児童比率(年度間30日以
上)(児童千人当たり)
Prefecture Educational diffusion rate (day nurseries) Working rate of day nurseries against thecapacity
Ratio of long-term absentees from elementaryschool (30 days and more for a school year)
(per 1,000 pupils)(%) (%)
全国 All Japan
北海道 Hokkaido青森県 Aomori-ken岩手県 Iwate-ken宮城県 Miyagi-ken秋田県 Akita-ken
山形県 Yamagata-ken福島県 Fukushima-ken茨城県 Ibaraki-ken栃木県 Tochigi-ken群馬県 Gumma-ken
埼玉県 Saitama-ken千葉県 Chiba-ken東京都 Tokyo-to神奈川県 Kanagawa-ken新潟県 Niigata-ken
富山県 Toyama-ken石川県 Ishikawa-ken福井県 Fukui-ken山梨県 Yamanashi-ken長野県 Nagano-ken
岐阜県 Gifu-ken静岡県 Shizuoka-ken愛知県 Aichi-ken三重県 Mie-ken滋賀県 Shiga-ken
京都府 Kyoto-fu大阪府 Osaka-fu兵庫県 Hyogo-ken奈良県 Nara-ken和歌山県 Wakayama-ken
鳥取県 Tottori-ken島根県 Shimane-ken岡山県 Okayama-ken広島県 Hiroshima-ken山口県 Yamaguchi-ken
徳島県 Tokushima-ken香川県 Kagawa-ken愛媛県 Ehime-ken高知県 Kochi-ken福岡県 Fukuoka-ken
佐賀県 Saga-ken長崎県 Nagasaki-ken熊本県 Kumamoto-ken大分県 Oita-ken宮崎県 Miyazaki-ken
鹿児島県 Kagoshima-ken沖縄県 Okinawa-ken
平均値 Mean標準偏差 Standard deviation
分子 保育所等修了者数 保育所等在所児数小学校長期欠席児童数(年度間30日以上)
中学校長期欠席生徒数(年度間30日以上)
指標計算式 Numerators No. of nursery center graduates Number of infants enrolled in nursery centers Number of long-term absentees fromelementary school (30 days or more)
Formulae ofindicators 分母 小学校児童数(第1学年児童数) 保育所等定員数 小学校児童数 中学校生徒数
Denominators Number of first graders of elementary schools Fixed number of nursery centers Elementary school students Lower secondary school students
出典 Reference
中学校長期欠席生徒比率(年度間30日以上)(生徒千人当たり)
病気による小学校長期欠席児童比率(年度間30日以上)(児童千人当たり)
病気による中学校長期欠席生徒比率(年度間30日以上)(生徒千人当たり)
Ratio of long-term absentees from junior high school (30days and more for a school year)
(per 1,000 students)
elementary school due to diseases(30 days and more for a school year)(per 1,000 pupils)
junior high school due to diseases (30 days and morefor a school year) (per 1,000 students)
Pref.Code
MeanS.D.
中学校長期欠席生徒数(年度間30日以上)
病気による小学校長期欠席児童数(年度間30日以上)
病気による中学校長期欠席生徒数(年度間30日以上)
分子
Number of long-term absentees from lower secondaryschool (30 days or more)
Number of long-term absentees from elementary school(Disease) (30 days or more)
Number of long-term absentees from lower secondaryschool (Disease) (30 days or more) 指標計算式
中学校生徒数 小学校児童数 中学校生徒数 分母
Lower secondary school students Elementary school students Lower secondary school students
出典
都道府県コー
ド
76

都道府県 教育普及度(保育所等) 保育所等利用率小学校長期欠席児童比率(年度間30日以
上)(児童千人当たり)
Prefecture Educational diffusion rate (day nurseries) Working rate of day nurseries against thecapacity
Ratio of long-term absentees from elementaryschool (30 days and more for a school year)
(per 1,000 pupils)(%) (%)
全国 All Japan
北海道 Hokkaido青森県 Aomori-ken岩手県 Iwate-ken宮城県 Miyagi-ken秋田県 Akita-ken
山形県 Yamagata-ken福島県 Fukushima-ken茨城県 Ibaraki-ken栃木県 Tochigi-ken群馬県 Gumma-ken
埼玉県 Saitama-ken千葉県 Chiba-ken東京都 Tokyo-to神奈川県 Kanagawa-ken新潟県 Niigata-ken
富山県 Toyama-ken石川県 Ishikawa-ken福井県 Fukui-ken山梨県 Yamanashi-ken長野県 Nagano-ken
岐阜県 Gifu-ken静岡県 Shizuoka-ken愛知県 Aichi-ken三重県 Mie-ken滋賀県 Shiga-ken
京都府 Kyoto-fu大阪府 Osaka-fu兵庫県 Hyogo-ken奈良県 Nara-ken和歌山県 Wakayama-ken
鳥取県 Tottori-ken島根県 Shimane-ken岡山県 Okayama-ken広島県 Hiroshima-ken山口県 Yamaguchi-ken
徳島県 Tokushima-ken香川県 Kagawa-ken愛媛県 Ehime-ken高知県 Kochi-ken福岡県 Fukuoka-ken
佐賀県 Saga-ken長崎県 Nagasaki-ken熊本県 Kumamoto-ken大分県 Oita-ken宮崎県 Miyazaki-ken
鹿児島県 Kagoshima-ken沖縄県 Okinawa-ken
平均値 Mean標準偏差 Standard deviation
分子 保育所等修了者数 保育所等在所児数小学校長期欠席児童数(年度間30日以上)
中学校長期欠席生徒数(年度間30日以上)
指標計算式 Numerators No. of nursery center graduates Number of infants enrolled in nursery centers Number of long-term absentees fromelementary school (30 days or more)
Formulae ofindicators 分母 小学校児童数(第1学年児童数) 保育所等定員数 小学校児童数 中学校生徒数
Denominators Number of first graders of elementary schools Fixed number of nursery centers Elementary school students Lower secondary school students
出典 Reference
中学校長期欠席生徒比率(年度間30日以上)(生徒千人当たり)
病気による小学校長期欠席児童比率(年度間30日以上)(児童千人当たり)
病気による中学校長期欠席生徒比率(年度間30日以上)(生徒千人当たり)
Ratio of long-term absentees from junior high school (30days and more for a school year)
(per 1,000 students)
elementary school due to diseases(30 days and more for a school year)(per 1,000 pupils)
junior high school due to diseases (30 days and morefor a school year) (per 1,000 students)
Pref.Code
MeanS.D.
中学校長期欠席生徒数(年度間30日以上)
病気による小学校長期欠席児童数(年度間30日以上)
病気による中学校長期欠席生徒数(年度間30日以上)
分子
Number of long-term absentees from lower secondaryschool (30 days or more)
Number of long-term absentees from elementary school(Disease) (30 days or more)
Number of long-term absentees from lower secondaryschool (Disease) (30 days or more) 指標計算式
中学校生徒数 小学校児童数 中学校生徒数 分母
Lower secondary school students Elementary school students Lower secondary school students
出典
都道府県コー
ド
77

都道府県不登校による小学校長期欠席児童比率(年度間30日以上)(児童千人当たり)
不登校による中学校長期欠席生徒比率(年度間30日以上)(生徒千人当たり)
中学校卒業者の進学率 高等学校卒業者の進学率
PrefectureRatio of long-term absentees from elementaryschool pupils due to refusal to attend school
(per 1,000 pupils) a)
Ratio of long-term absentees from junior highschool students due to refusal to attend school(per
1,000 students) a)
Ratio of junior high graduates going to furthereducation
(%)
全国 All Japan
北海道 Hokkaido青森県 Aomori-ken岩手県 Iwate-ken宮城県 Miyagi-ken秋田県 Akita-ken
山形県 Yamagata-ken福島県 Fukushima-ken茨城県 Ibaraki-ken栃木県 Tochigi-ken群馬県 Gumma-ken
埼玉県 Saitama-ken千葉県 Chiba-ken東京都 Tokyo-to神奈川県 Kanagawa-ken新潟県 Niigata-ken
富山県 Toyama-ken石川県 Ishikawa-ken福井県 Fukui-ken山梨県 Yamanashi-ken長野県 Nagano-ken
岐阜県 Gifu-ken静岡県 Shizuoka-ken愛知県 Aichi-ken三重県 Mie-ken滋賀県 Shiga-ken
京都府 Kyoto-fu大阪府 Osaka-fu兵庫県 Hyogo-ken奈良県 Nara-ken和歌山県 Wakayama-ken
鳥取県 Tottori-ken島根県 Shimane-ken岡山県 Okayama-ken広島県 Hiroshima-ken山口県 Yamaguchi-ken
徳島県 Tokushima-ken香川県 Kagawa-ken愛媛県 Ehime-ken高知県 Kochi-ken福岡県 Fukuoka-ken
佐賀県 Saga-ken長崎県 Nagasaki-ken熊本県 Kumamoto-ken大分県 Oita-ken宮崎県 Miyazaki-ken
鹿児島県 Kagoshima-ken沖縄県 Okinawa-ken
平均値 Mean標準偏差 Standard deviation
※
分子不登校による小学校長期欠席児童数
(年度間30日以上)不登校による中学校長期欠席生徒数
(年度間30日以上)
指標計算式 Numerators Number of long-term absentees from elementaryschool (Refusal to attend school) (30 days or more)
Number of long-term absentees from lowersecondary school (Refusal to attend school)
(30 days or more)中学校卒業者の進学率 高等学校卒業者の進学率
Formulae ofindicators 分母 小学校児童数 中学校生徒数
Ratio of lower secondary school graduatesgoing to further education
Denominators Elementary school students Lower secondary school students
出典 Referencea) (30 days and more for a school year)
高等学校卒業者の進学率出身高校所在地県の県内大学への入学者割合
(対大学入学者数)最終学歴が小学・中学卒の者の割合
Ratio of senior high graduates going to furthereducation
Ratio of high school graduates entering colleges anduniversities in the same prefecture
Ratio of people having completed up to elementary orjunior high school only
(%) (%) (%)Pref.Code
MeanS.D.
※
当該県の高校出身者で当該県の大学入学者数 最終学歴人口(小学校・中学校) 分子
高等学校卒業者の進学率Number of new students enrolled (universities) from upper
secondary school graduates in the same prefecturePopulation by last school completed
(Elementary school, lower secondary school) 指標計算式
Ratio of upper secondary school graduates going on tofurther education 当該県の高校出身者である大学入学者数 最終学歴人口(卒業者総数) 分母
Number of upper secondary school graduatesentering universities
Population by last school completed(Graduates) (Total)
出典
都道府県コー
ド
78

都道府県不登校による小学校長期欠席児童比率(年度間30日以上)(児童千人当たり)
不登校による中学校長期欠席生徒比率(年度間30日以上)(生徒千人当たり)
中学校卒業者の進学率 高等学校卒業者の進学率
PrefectureRatio of long-term absentees from elementaryschool pupils due to refusal to attend school
(per 1,000 pupils) a)
Ratio of long-term absentees from junior highschool students due to refusal to attend school(per
1,000 students) a)
Ratio of junior high graduates going to furthereducation
(%)
全国 All Japan
北海道 Hokkaido青森県 Aomori-ken岩手県 Iwate-ken宮城県 Miyagi-ken秋田県 Akita-ken
山形県 Yamagata-ken福島県 Fukushima-ken茨城県 Ibaraki-ken栃木県 Tochigi-ken群馬県 Gumma-ken
埼玉県 Saitama-ken千葉県 Chiba-ken東京都 Tokyo-to神奈川県 Kanagawa-ken新潟県 Niigata-ken
富山県 Toyama-ken石川県 Ishikawa-ken福井県 Fukui-ken山梨県 Yamanashi-ken長野県 Nagano-ken
岐阜県 Gifu-ken静岡県 Shizuoka-ken愛知県 Aichi-ken三重県 Mie-ken滋賀県 Shiga-ken
京都府 Kyoto-fu大阪府 Osaka-fu兵庫県 Hyogo-ken奈良県 Nara-ken和歌山県 Wakayama-ken
鳥取県 Tottori-ken島根県 Shimane-ken岡山県 Okayama-ken広島県 Hiroshima-ken山口県 Yamaguchi-ken
徳島県 Tokushima-ken香川県 Kagawa-ken愛媛県 Ehime-ken高知県 Kochi-ken福岡県 Fukuoka-ken
佐賀県 Saga-ken長崎県 Nagasaki-ken熊本県 Kumamoto-ken大分県 Oita-ken宮崎県 Miyazaki-ken
鹿児島県 Kagoshima-ken沖縄県 Okinawa-ken
平均値 Mean標準偏差 Standard deviation
※
分子不登校による小学校長期欠席児童数
(年度間30日以上)不登校による中学校長期欠席生徒数
(年度間30日以上)
指標計算式 Numerators Number of long-term absentees from elementaryschool (Refusal to attend school) (30 days or more)
Number of long-term absentees from lowersecondary school (Refusal to attend school)
(30 days or more)中学校卒業者の進学率 高等学校卒業者の進学率
Formulae ofindicators 分母 小学校児童数 中学校生徒数
Ratio of lower secondary school graduatesgoing to further education
Denominators Elementary school students Lower secondary school students
出典 Referencea) (30 days and more for a school year)
高等学校卒業者の進学率出身高校所在地県の県内大学への入学者割合
(対大学入学者数)最終学歴が小学・中学卒の者の割合
Ratio of senior high graduates going to furthereducation
Ratio of high school graduates entering colleges anduniversities in the same prefecture
Ratio of people having completed up to elementary orjunior high school only
(%) (%) (%)Pref.Code
MeanS.D.
※
当該県の高校出身者で当該県の大学入学者数 最終学歴人口(小学校・中学校) 分子
高等学校卒業者の進学率Number of new students enrolled (universities) from upper
secondary school graduates in the same prefecturePopulation by last school completed
(Elementary school, lower secondary school) 指標計算式
Ratio of upper secondary school graduates going on tofurther education 当該県の高校出身者である大学入学者数 最終学歴人口(卒業者総数) 分母
Number of upper secondary school graduatesentering universities
Population by last school completed(Graduates) (Total)
出典
都道府県コー
ド
79
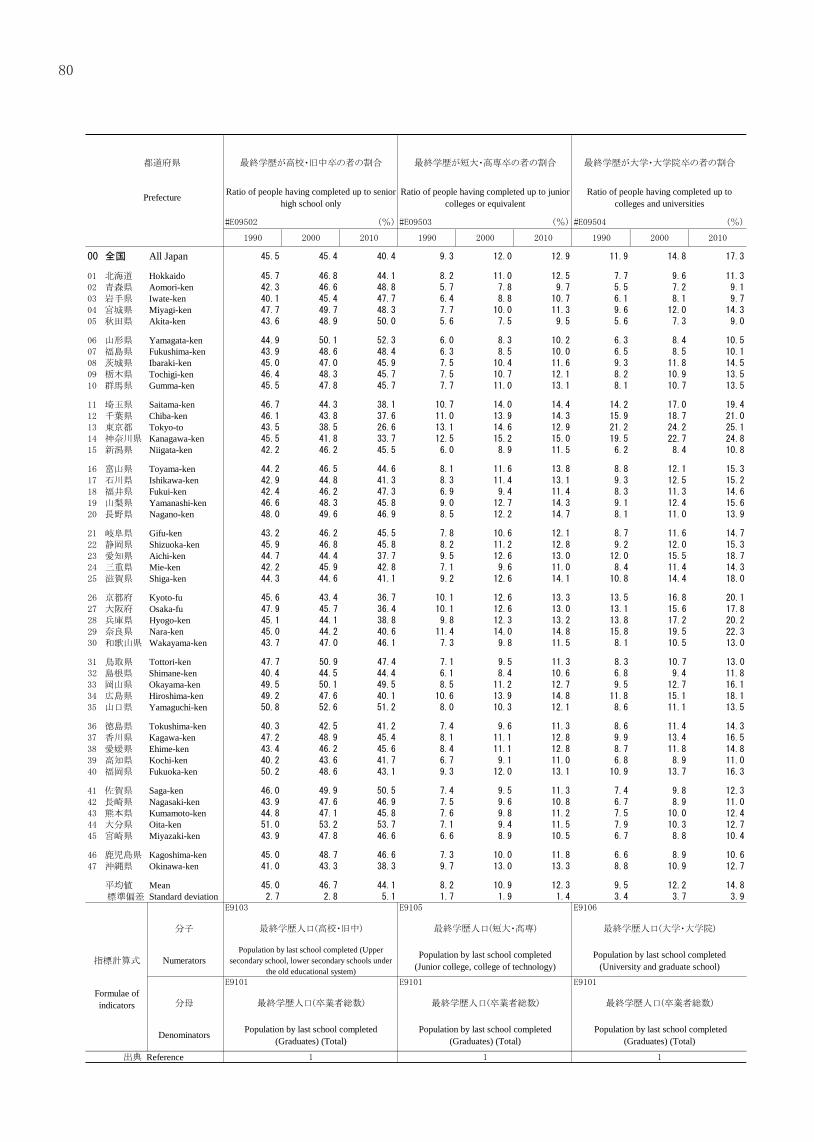
都道府県 最終学歴が高校・旧中卒の者の割合 最終学歴が短大・高専卒の者の割合 最終学歴が大学・大学院卒の者の割合 小学校教育費(児童1人当たり)
Prefecture Ratio of people having completed up to seniorhigh school only
Ratio of people having completed up to juniorcolleges or equivalent
Ratio of people having completed up tocolleges and universities
Elementary school educational expenses(per pupils)
(%) (%) (%)
全国 All Japan
北海道 Hokkaido青森県 Aomori-ken岩手県 Iwate-ken宮城県 Miyagi-ken秋田県 Akita-ken
山形県 Yamagata-ken福島県 Fukushima-ken茨城県 Ibaraki-ken栃木県 Tochigi-ken群馬県 Gumma-ken
埼玉県 Saitama-ken千葉県 Chiba-ken東京都 Tokyo-to神奈川県 Kanagawa-ken新潟県 Niigata-ken
富山県 Toyama-ken石川県 Ishikawa-ken福井県 Fukui-ken山梨県 Yamanashi-ken長野県 Nagano-ken
岐阜県 Gifu-ken静岡県 Shizuoka-ken愛知県 Aichi-ken三重県 Mie-ken滋賀県 Shiga-ken
京都府 Kyoto-fu大阪府 Osaka-fu兵庫県 Hyogo-ken奈良県 Nara-ken和歌山県 Wakayama-ken
鳥取県 Tottori-ken島根県 Shimane-ken岡山県 Okayama-ken広島県 Hiroshima-ken山口県 Yamaguchi-ken
徳島県 Tokushima-ken香川県 Kagawa-ken愛媛県 Ehime-ken高知県 Kochi-ken福岡県 Fukuoka-ken
佐賀県 Saga-ken長崎県 Nagasaki-ken熊本県 Kumamoto-ken大分県 Oita-ken宮崎県 Miyazaki-ken
鹿児島県 Kagoshima-ken沖縄県 Okinawa-ken
平均値 Mean標準偏差 Standard deviation
分子 最終学歴人口(高校・旧中) 最終学歴人口(短大・高専) 最終学歴人口(大学・大学院)
指標計算式 NumeratorsPopulation by last school completed (Upper
secondary school, lower secondary schools underthe old educational system)
Population by last school completed(Junior college, college of technology)
Population by last school completed(University and graduate school) 在学者1人当たりの学校教育費(小学校)
Formulae ofindicators 分母 最終学歴人口(卒業者総数) 最終学歴人口(卒業者総数) 最終学歴人口(卒業者総数)
Denominators Population by last school completed(Graduates) (Total)
Population by last school completed(Graduates) (Total)
Population by last school completed(Graduates) (Total)
出典 Reference
7)1人当たりの学校等教育費
Education expenditure per pupil
小学校教育費(児童1人当たり) 中学校教育費(生徒1人当たり) 高等学校教育費(全日制)(生徒1人当たり)
Elementary school educational expenses(per pupils) Junior high school educational expenses (per students) High school educational expenses (Full-time senior)
(per students)
(円:yen (円:yen (円:yenPref.Code
MeanS.D.
※ ※ ※
分子
在学者1人当たりの学校教育費(小学校)在学者1人当たりの学校教育費
(中学校)在学者1人当たりの学校教育費
(高等学校・全日制)指標計算式
School education expenditure per student(Elementary school)
School education expenditure per student(Lower secondary school)
School education expenditure per student (Upper secondary school, full-day course) 分母
出典
都道府県コー
ド
80

都道府県 最終学歴が高校・旧中卒の者の割合 最終学歴が短大・高専卒の者の割合 最終学歴が大学・大学院卒の者の割合 小学校教育費(児童1人当たり)
Prefecture Ratio of people having completed up to seniorhigh school only
Ratio of people having completed up to juniorcolleges or equivalent
Ratio of people having completed up tocolleges and universities
Elementary school educational expenses(per pupils)
(%) (%) (%)
全国 All Japan
北海道 Hokkaido青森県 Aomori-ken岩手県 Iwate-ken宮城県 Miyagi-ken秋田県 Akita-ken
山形県 Yamagata-ken福島県 Fukushima-ken茨城県 Ibaraki-ken栃木県 Tochigi-ken群馬県 Gumma-ken
埼玉県 Saitama-ken千葉県 Chiba-ken東京都 Tokyo-to神奈川県 Kanagawa-ken新潟県 Niigata-ken
富山県 Toyama-ken石川県 Ishikawa-ken福井県 Fukui-ken山梨県 Yamanashi-ken長野県 Nagano-ken
岐阜県 Gifu-ken静岡県 Shizuoka-ken愛知県 Aichi-ken三重県 Mie-ken滋賀県 Shiga-ken
京都府 Kyoto-fu大阪府 Osaka-fu兵庫県 Hyogo-ken奈良県 Nara-ken和歌山県 Wakayama-ken
鳥取県 Tottori-ken島根県 Shimane-ken岡山県 Okayama-ken広島県 Hiroshima-ken山口県 Yamaguchi-ken
徳島県 Tokushima-ken香川県 Kagawa-ken愛媛県 Ehime-ken高知県 Kochi-ken福岡県 Fukuoka-ken
佐賀県 Saga-ken長崎県 Nagasaki-ken熊本県 Kumamoto-ken大分県 Oita-ken宮崎県 Miyazaki-ken
鹿児島県 Kagoshima-ken沖縄県 Okinawa-ken
平均値 Mean標準偏差 Standard deviation
分子 最終学歴人口(高校・旧中) 最終学歴人口(短大・高専) 最終学歴人口(大学・大学院)
指標計算式 NumeratorsPopulation by last school completed (Upper
secondary school, lower secondary schools underthe old educational system)
Population by last school completed(Junior college, college of technology)
Population by last school completed(University and graduate school) 在学者1人当たりの学校教育費(小学校)
Formulae ofindicators 分母 最終学歴人口(卒業者総数) 最終学歴人口(卒業者総数) 最終学歴人口(卒業者総数)
Denominators Population by last school completed(Graduates) (Total)
Population by last school completed(Graduates) (Total)
Population by last school completed(Graduates) (Total)
出典 Reference
7)1人当たりの学校等教育費
Education expenditure per pupil
小学校教育費(児童1人当たり) 中学校教育費(生徒1人当たり) 高等学校教育費(全日制)(生徒1人当たり)
Elementary school educational expenses(per pupils) Junior high school educational expenses (per students) High school educational expenses (Full-time senior)
(per students)
(円:yen (円:yen (円:yenPref.Code
MeanS.D.
※ ※ ※
分子
在学者1人当たりの学校教育費(小学校)在学者1人当たりの学校教育費
(中学校)在学者1人当たりの学校教育費
(高等学校・全日制)指標計算式
School education expenditure per student(Elementary school)
School education expenditure per student(Lower secondary school)
School education expenditure per student (Upper secondary school, full-day course) 分母
出典
都道府県コー
ド
81

都道府県 幼稚園教育費(在園者1人当たり)幼保連携型認定こども園教育費(在園者1人
当たり)
Prefecture Kindergarten educational expenses(per Kindergarten pupils )
Authorized child centers educationalexpenses(Kindergarten-and-day-care center
type) (per pupils)(円:yen (円:yen)
全国 All Japan
北海道 Hokkaido青森県 Aomori-ken岩手県 Iwate-ken宮城県 Miyagi-ken秋田県 Akita-ken
山形県 Yamagata-ken福島県 Fukushima-ken茨城県 Ibaraki-ken栃木県 Tochigi-ken群馬県 Gumma-ken
埼玉県 Saitama-ken千葉県 Chiba-ken東京都 Tokyo-to神奈川県 Kanagawa-ken新潟県 Niigata-ken
富山県 Toyama-ken石川県 Ishikawa-ken福井県 Fukui-ken山梨県 Yamanashi-ken長野県 Nagano-ken
岐阜県 Gifu-ken静岡県 Shizuoka-ken愛知県 Aichi-ken三重県 Mie-ken滋賀県 Shiga-ken
京都府 Kyoto-fu大阪府 Osaka-fu兵庫県 Hyogo-ken奈良県 Nara-ken和歌山県 Wakayama-ken
鳥取県 Tottori-ken島根県 Shimane-ken岡山県 Okayama-ken広島県 Hiroshima-ken山口県 Yamaguchi-ken
徳島県 Tokushima-ken香川県 Kagawa-ken愛媛県 Ehime-ken高知県 Kochi-ken福岡県 Fukuoka-ken
佐賀県 Saga-ken長崎県 Nagasaki-ken熊本県 Kumamoto-ken大分県 Oita-ken宮崎県 Miyazaki-ken
鹿児島県 Kagoshima-ken沖縄県 Okinawa-ken
平均値 Mean標準偏差 Standard deviation
※ ※
分子
指標計算式 Numerators 在学者1人当たりの学校教育費(幼稚園)
在学者1人当たりの学校教育費(幼保連携型認定こども園)
Formulae ofindicators 分母
School education expenditure per student(Kindergarten)
School education expenditure per student(authorized child centers (Kindergarten-and-day-
care center type))
Denominators
出典 Reference
82

都道府県 幼稚園教育費(在園者1人当たり)幼保連携型認定こども園教育費(在園者1人
当たり)
Prefecture Kindergarten educational expenses(per Kindergarten pupils )
Authorized child centers educationalexpenses(Kindergarten-and-day-care center
type) (per pupils)(円:yen (円:yen)
全国 All Japan
北海道 Hokkaido青森県 Aomori-ken岩手県 Iwate-ken宮城県 Miyagi-ken秋田県 Akita-ken
山形県 Yamagata-ken福島県 Fukushima-ken茨城県 Ibaraki-ken栃木県 Tochigi-ken群馬県 Gumma-ken
埼玉県 Saitama-ken千葉県 Chiba-ken東京都 Tokyo-to神奈川県 Kanagawa-ken新潟県 Niigata-ken
富山県 Toyama-ken石川県 Ishikawa-ken福井県 Fukui-ken山梨県 Yamanashi-ken長野県 Nagano-ken
岐阜県 Gifu-ken静岡県 Shizuoka-ken愛知県 Aichi-ken三重県 Mie-ken滋賀県 Shiga-ken
京都府 Kyoto-fu大阪府 Osaka-fu兵庫県 Hyogo-ken奈良県 Nara-ken和歌山県 Wakayama-ken
鳥取県 Tottori-ken島根県 Shimane-ken岡山県 Okayama-ken広島県 Hiroshima-ken山口県 Yamaguchi-ken
徳島県 Tokushima-ken香川県 Kagawa-ken愛媛県 Ehime-ken高知県 Kochi-ken福岡県 Fukuoka-ken
佐賀県 Saga-ken長崎県 Nagasaki-ken熊本県 Kumamoto-ken大分県 Oita-ken宮崎県 Miyazaki-ken
鹿児島県 Kagoshima-ken沖縄県 Okinawa-ken
平均値 Mean標準偏差 Standard deviation
※ ※
分子
指標計算式 Numerators 在学者1人当たりの学校教育費(幼稚園)
在学者1人当たりの学校教育費(幼保連携型認定こども園)
Formulae ofindicators 分母
School education expenditure per student(Kindergarten)
School education expenditure per student(authorized child centers (Kindergarten-and-day-
care center type))
Denominators
出典 Reference
83

F.労働 Labour1)労働力状態 Labour force status
都道府県 労働力人口比率(男) 労働力人口比率(女) 第1次産業就業者比率 第2次産業就業者比率
Prefecture Labour force participation rate (male) Labour force participation rate(female)
Ratio of persons employed in theprimary industry
Ratio of persons employed inthe secondary industry
(%) (%) (%)
全国 All Japan
北海道 Hokkaido青森県 Aomori-ken岩手県 Iwate-ken宮城県 Miyagi-ken秋田県 Akita-ken
山形県 Yamagata-ken福島県 Fukushima-ken茨城県 Ibaraki-ken栃木県 Tochigi-ken群馬県 Gumma-ken
埼玉県 Saitama-ken千葉県 Chiba-ken東京都 Tokyo-to神奈川県 Kanagawa-ken新潟県 Niigata-ken
富山県 Toyama-ken石川県 Ishikawa-ken福井県 Fukui-ken山梨県 Yamanashi-ken長野県 Nagano-ken
岐阜県 Gifu-ken静岡県 Shizuoka-ken愛知県 Aichi-ken三重県 Mie-ken滋賀県 Shiga-ken
京都府 Kyoto-fu大阪府 Osaka-fu兵庫県 Hyogo-ken奈良県 Nara-ken和歌山県 Wakayama-ken
鳥取県 Tottori-ken島根県 Shimane-ken岡山県 Okayama-ken広島県 Hiroshima-ken山口県 Yamaguchi-ken
徳島県 Tokushima-ken香川県 Kagawa-ken愛媛県 Ehime-ken高知県 Kochi-ken福岡県 Fukuoka-ken
佐賀県 Saga-ken長崎県 Nagasaki-ken熊本県 Kumamoto-ken大分県 Oita-ken宮崎県 Miyazaki-ken
鹿児島県 Kagoshima-ken沖縄県 Okinawa-ken
平均値 Mean標準偏差 Standard deviation
分子 労働力人口(男) 労働力人口(女) 第1次産業就業者数 第2次産業就業者数
指標計算式 Numerators Population in labour force(male)
Population in labour force(female)
Persons employed inprimary industry
Persons employed insecondary industry
Formulae ofindicators 分母 15歳以上人口(男) 15歳以上人口(女) 就業者数 就業者数
Denominators Population (15 and over, male) Population (15 and over, female) Employed persons Employed persons
出典 Reference
第2次産業就業者比率 第3次産業就業者比率 完全失業率
Ratio of persons employed inthe secondary industry
Ratio of persons employed in the tertiary industry Unemployment rate (both sexes)
(%) (%) (%)Pref.Code
MeanS.D.
第2次産業就業者数 第3次産業就業者数 完全失業者数 分子
Persons employed insecondary industry
Persons employed intertiary industry Unemployed persons 指標計算式
就業者数 就業者数 労働力人口 分母
Employed persons Employed persons Population in labour force
出典
都道府県コー
ド
84

F.労働 Labour1)労働力状態 Labour force status
都道府県 労働力人口比率(男) 労働力人口比率(女) 第1次産業就業者比率 第2次産業就業者比率
Prefecture Labour force participation rate (male) Labour force participation rate(female)
Ratio of persons employed in theprimary industry
Ratio of persons employed inthe secondary industry
(%) (%) (%)
全国 All Japan
北海道 Hokkaido青森県 Aomori-ken岩手県 Iwate-ken宮城県 Miyagi-ken秋田県 Akita-ken
山形県 Yamagata-ken福島県 Fukushima-ken茨城県 Ibaraki-ken栃木県 Tochigi-ken群馬県 Gumma-ken
埼玉県 Saitama-ken千葉県 Chiba-ken東京都 Tokyo-to神奈川県 Kanagawa-ken新潟県 Niigata-ken
富山県 Toyama-ken石川県 Ishikawa-ken福井県 Fukui-ken山梨県 Yamanashi-ken長野県 Nagano-ken
岐阜県 Gifu-ken静岡県 Shizuoka-ken愛知県 Aichi-ken三重県 Mie-ken滋賀県 Shiga-ken
京都府 Kyoto-fu大阪府 Osaka-fu兵庫県 Hyogo-ken奈良県 Nara-ken和歌山県 Wakayama-ken
鳥取県 Tottori-ken島根県 Shimane-ken岡山県 Okayama-ken広島県 Hiroshima-ken山口県 Yamaguchi-ken
徳島県 Tokushima-ken香川県 Kagawa-ken愛媛県 Ehime-ken高知県 Kochi-ken福岡県 Fukuoka-ken
佐賀県 Saga-ken長崎県 Nagasaki-ken熊本県 Kumamoto-ken大分県 Oita-ken宮崎県 Miyazaki-ken
鹿児島県 Kagoshima-ken沖縄県 Okinawa-ken
平均値 Mean標準偏差 Standard deviation
分子 労働力人口(男) 労働力人口(女) 第1次産業就業者数 第2次産業就業者数
指標計算式 Numerators Population in labour force(male)
Population in labour force(female)
Persons employed inprimary industry
Persons employed insecondary industry
Formulae ofindicators 分母 15歳以上人口(男) 15歳以上人口(女) 就業者数 就業者数
Denominators Population (15 and over, male) Population (15 and over, female) Employed persons Employed persons
出典 Reference
第2次産業就業者比率 第3次産業就業者比率 完全失業率
Ratio of persons employed inthe secondary industry
Ratio of persons employed in the tertiary industry Unemployment rate (both sexes)
(%) (%) (%)Pref.Code
MeanS.D.
第2次産業就業者数 第3次産業就業者数 完全失業者数 分子
Persons employed insecondary industry
Persons employed intertiary industry Unemployed persons 指標計算式
就業者数 就業者数 労働力人口 分母
Employed persons Employed persons Population in labour force
出典
都道府県コー
ド
85
F
労
働
(指標)

2)就業状態 Employment status
都道府県 完全失業率(男) 完全失業率(女) 雇用者比率 県内就業者比率
Prefecture Unemployment rate (male) Unemployment rate (female) Ratio of employees to all workers
(%) (%) (%)
全国 All Japan
北海道 Hokkaido青森県 Aomori-ken岩手県 Iwate-ken宮城県 Miyagi-ken秋田県 Akita-ken
山形県 Yamagata-ken福島県 Fukushima-ken茨城県 Ibaraki-ken栃木県 Tochigi-ken群馬県 Gumma-ken
埼玉県 Saitama-ken千葉県 Chiba-ken東京都 Tokyo-to神奈川県 Kanagawa-ken新潟県 Niigata-ken
富山県 Toyama-ken石川県 Ishikawa-ken福井県 Fukui-ken山梨県 Yamanashi-ken長野県 Nagano-ken
岐阜県 Gifu-ken静岡県 Shizuoka-ken愛知県 Aichi-ken三重県 Mie-ken滋賀県 Shiga-ken
京都府 Kyoto-fu大阪府 Osaka-fu兵庫県 Hyogo-ken奈良県 Nara-ken和歌山県 Wakayama-ken
鳥取県 Tottori-ken島根県 Shimane-ken岡山県 Okayama-ken広島県 Hiroshima-ken山口県 Yamaguchi-ken
徳島県 Tokushima-ken香川県 Kagawa-ken愛媛県 Ehime-ken高知県 Kochi-ken福岡県 Fukuoka-ken
佐賀県 Saga-ken長崎県 Nagasaki-ken熊本県 Kumamoto-ken大分県 Oita-ken宮崎県 Miyazaki-ken
鹿児島県 Kagoshima-ken沖縄県 Okinawa-ken
平均値 Mean標準偏差 Standard deviation
分子 完全失業者数(男) 完全失業者数(女) 雇用者数 県内就業者数
指標計算式 Numerators Unemployed persons (male) Unemployed persons (female) No. of employees Persons living and workingin the same prefecture
Formulae ofindicators 分母 労働力人口(男) 労働力人口(女) 就業者数 就業者数
Denominators Population in labour force (male) Population in labour force (female) Employed persons Employed persons
出典 Reference
県内就業者比率 他市区町村への通勤者比率 他市区町村からの通勤者比率
Ratio of persons living andworking in the same prefecture
Ratio of workers commuting to other municipalities Ratio of workers commuting from other municipalities
(%) (%) (%)Pref.Code
MeanS.D.
県内就業者数 他市区町村への通勤者数 他市区町村からの通勤者数 分子
Persons living and workingin the same prefecture Commuters to other municipality Workers commuting from other municipalities 指標計算式
就業者数 就業者数 就業者数 分母
Employed persons Employed persons Employed persons
出典
都道府県コー
ド
86

2)就業状態 Employment status
都道府県 完全失業率(男) 完全失業率(女) 雇用者比率 県内就業者比率
Prefecture Unemployment rate (male) Unemployment rate (female) Ratio of employees to all workers
(%) (%) (%)
全国 All Japan
北海道 Hokkaido青森県 Aomori-ken岩手県 Iwate-ken宮城県 Miyagi-ken秋田県 Akita-ken
山形県 Yamagata-ken福島県 Fukushima-ken茨城県 Ibaraki-ken栃木県 Tochigi-ken群馬県 Gumma-ken
埼玉県 Saitama-ken千葉県 Chiba-ken東京都 Tokyo-to神奈川県 Kanagawa-ken新潟県 Niigata-ken
富山県 Toyama-ken石川県 Ishikawa-ken福井県 Fukui-ken山梨県 Yamanashi-ken長野県 Nagano-ken
岐阜県 Gifu-ken静岡県 Shizuoka-ken愛知県 Aichi-ken三重県 Mie-ken滋賀県 Shiga-ken
京都府 Kyoto-fu大阪府 Osaka-fu兵庫県 Hyogo-ken奈良県 Nara-ken和歌山県 Wakayama-ken
鳥取県 Tottori-ken島根県 Shimane-ken岡山県 Okayama-ken広島県 Hiroshima-ken山口県 Yamaguchi-ken
徳島県 Tokushima-ken香川県 Kagawa-ken愛媛県 Ehime-ken高知県 Kochi-ken福岡県 Fukuoka-ken
佐賀県 Saga-ken長崎県 Nagasaki-ken熊本県 Kumamoto-ken大分県 Oita-ken宮崎県 Miyazaki-ken
鹿児島県 Kagoshima-ken沖縄県 Okinawa-ken
平均値 Mean標準偏差 Standard deviation
分子 完全失業者数(男) 完全失業者数(女) 雇用者数 県内就業者数
指標計算式 Numerators Unemployed persons (male) Unemployed persons (female) No. of employees Persons living and workingin the same prefecture
Formulae ofindicators 分母 労働力人口(男) 労働力人口(女) 就業者数 就業者数
Denominators Population in labour force (male) Population in labour force (female) Employed persons Employed persons
出典 Reference
県内就業者比率 他市区町村への通勤者比率 他市区町村からの通勤者比率
Ratio of persons living andworking in the same prefecture
Ratio of workers commuting to other municipalities Ratio of workers commuting from other municipalities
(%) (%) (%)Pref.Code
MeanS.D.
県内就業者数 他市区町村への通勤者数 他市区町村からの通勤者数 分子
Persons living and workingin the same prefecture Commuters to other municipality Workers commuting from other municipalities 指標計算式
就業者数 就業者数 就業者数 分母
Employed persons Employed persons Employed persons
出典
都道府県コー
ド
87

3)就業機会 Opportunity for employment
都道府県 就職率 県外就職者比率 有効求人倍率 充足率
Prefecture Ratio of new employment Ratio of new employment in the establishmentnot located in their living prefecture Ratio of job vacancies to application Ratio of newly filled vacancies
(%) (%) (倍:times
全国 All Japan
北海道 Hokkaido青森県 Aomori-ken岩手県 Iwate-ken宮城県 Miyagi-ken秋田県 Akita-ken
山形県 Yamagata-ken福島県 Fukushima-ken茨城県 Ibaraki-ken栃木県 Tochigi-ken群馬県 Gumma-ken
埼玉県 Saitama-ken千葉県 Chiba-ken東京都 Tokyo-to神奈川県 Kanagawa-ken新潟県 Niigata-ken
富山県 Toyama-ken石川県 Ishikawa-ken福井県 Fukui-ken山梨県 Yamanashi-ken長野県 Nagano-ken
岐阜県 Gifu-ken静岡県 Shizuoka-ken愛知県 Aichi-ken三重県 Mie-ken滋賀県 Shiga-ken
京都府 Kyoto-fu大阪府 Osaka-fu兵庫県 Hyogo-ken奈良県 Nara-ken和歌山県 Wakayama-ken
鳥取県 Tottori-ken島根県 Shimane-ken岡山県 Okayama-ken広島県 Hiroshima-ken山口県 Yamaguchi-ken
徳島県 Tokushima-ken香川県 Kagawa-ken愛媛県 Ehime-ken高知県 Kochi-ken福岡県 Fukuoka-ken
佐賀県 Saga-ken長崎県 Nagasaki-ken熊本県 Kumamoto-ken大分県 Oita-ken宮崎県 Miyazaki-ken
鹿児島県 Kagoshima-ken沖縄県 Okinawa-ken
平均値 Mean標準偏差 Standard deviation
分子 就職件数(一般)(年度計)就職件数(一般)(年度計)-県内就職件数(一般)(年度計)
月間有効求人数(一般)(年度計) 就職件数(一般)(年度計)
指標計算式 Numerators No. of persons who found employment(General works) (YTD)
No. of monthly active job openings(General works) (YTD)
Formulae ofindicators 分母 月間有効求職者数(一般)(年度計) 就職件数(一般)(年度計) 月間有効求職者数(一般)(年度計) 月間有効求人数(一般)(年度計)
Denominators No. of monthly active applications(General works) (YTD)
No. of persons who found employment(General works) (YTD)
No. of monthly active applications(General works) (YTD)
出典 Referencea) No. of persons who found employment (General works) (YTD) - No. of new employments in the establishment located in the same prefecture (General works) (YTD)
a)
充足率 パートタイム就職率(常用) 高卒者に占める就職者の割合
Ratio of newly filled vacancies Ratio of employment to part-time jobapplications (regular)
Ratio of new employment tosenior high school graduates
(%) (%) (%)Pref.Code
MeanS.D.
就職件数(一般)(年度計) パートタイム就職件数(常用) 高校卒業者のうち就職者数 分子
No. of persons who found employment(General works) (YTD)
No. of persons who found employment of part-time job(regular)
Number of new upper secondary school graduatesgetting jobs 指標計算式
月間有効求人数(一般)(年度計) パートタイム月間有効求職者数(常用)(年度計) 高校卒業者数 分母
No. of monthly active job openings(General works) (YTD)
No. of monthly active applications of part-time job(regular) (YTD) Number of upper secondary school graduates
出典
都道府県コー
ド
88

3)就業機会 Opportunity for employment
都道府県 就職率 県外就職者比率 有効求人倍率 充足率
Prefecture Ratio of new employment Ratio of new employment in the establishmentnot located in their living prefecture Ratio of job vacancies to application Ratio of newly filled vacancies
(%) (%) (倍:times
全国 All Japan
北海道 Hokkaido青森県 Aomori-ken岩手県 Iwate-ken宮城県 Miyagi-ken秋田県 Akita-ken
山形県 Yamagata-ken福島県 Fukushima-ken茨城県 Ibaraki-ken栃木県 Tochigi-ken群馬県 Gumma-ken
埼玉県 Saitama-ken千葉県 Chiba-ken東京都 Tokyo-to神奈川県 Kanagawa-ken新潟県 Niigata-ken
富山県 Toyama-ken石川県 Ishikawa-ken福井県 Fukui-ken山梨県 Yamanashi-ken長野県 Nagano-ken
岐阜県 Gifu-ken静岡県 Shizuoka-ken愛知県 Aichi-ken三重県 Mie-ken滋賀県 Shiga-ken
京都府 Kyoto-fu大阪府 Osaka-fu兵庫県 Hyogo-ken奈良県 Nara-ken和歌山県 Wakayama-ken
鳥取県 Tottori-ken島根県 Shimane-ken岡山県 Okayama-ken広島県 Hiroshima-ken山口県 Yamaguchi-ken
徳島県 Tokushima-ken香川県 Kagawa-ken愛媛県 Ehime-ken高知県 Kochi-ken福岡県 Fukuoka-ken
佐賀県 Saga-ken長崎県 Nagasaki-ken熊本県 Kumamoto-ken大分県 Oita-ken宮崎県 Miyazaki-ken
鹿児島県 Kagoshima-ken沖縄県 Okinawa-ken
平均値 Mean標準偏差 Standard deviation
分子 就職件数(一般)(年度計)就職件数(一般)(年度計)-県内就職件数(一般)(年度計)
月間有効求人数(一般)(年度計) 就職件数(一般)(年度計)
指標計算式 Numerators No. of persons who found employment(General works) (YTD)
No. of monthly active job openings(General works) (YTD)
Formulae ofindicators 分母 月間有効求職者数(一般)(年度計) 就職件数(一般)(年度計) 月間有効求職者数(一般)(年度計) 月間有効求人数(一般)(年度計)
Denominators No. of monthly active applications(General works) (YTD)
No. of persons who found employment(General works) (YTD)
No. of monthly active applications(General works) (YTD)
出典 Referencea) No. of persons who found employment (General works) (YTD) - No. of new employments in the establishment located in the same prefecture (General works) (YTD)
a)
充足率 パートタイム就職率(常用) 高卒者に占める就職者の割合
Ratio of newly filled vacancies Ratio of employment to part-time jobapplications (regular)
Ratio of new employment tosenior high school graduates
(%) (%) (%)Pref.Code
MeanS.D.
就職件数(一般)(年度計) パートタイム就職件数(常用) 高校卒業者のうち就職者数 分子
No. of persons who found employment(General works) (YTD)
No. of persons who found employment of part-time job(regular)
Number of new upper secondary school graduatesgetting jobs 指標計算式
月間有効求人数(一般)(年度計) パートタイム月間有効求職者数(常用)(年度計) 高校卒業者数 分母
No. of monthly active job openings(General works) (YTD)
No. of monthly active applications of part-time job(regular) (YTD) Number of upper secondary school graduates
出典
都道府県コー
ド
89

都道府県 高卒者に占める県外就職者の割合 高等学校新規卒業者の就職率 高等学校新規卒業者の求人倍率 短大新規卒業者の無業者率
Prefecture Ratio of high school graduates getting jobsoutside the prefecture
Rate of new high school graduatesgetting jobs
Job vacancies rate ofnew high school graduates
Ratio of new junior college graduatesnot working
(%) (%) (倍:times
全国 All Japan
北海道 Hokkaido青森県 Aomori-ken岩手県 Iwate-ken宮城県 Miyagi-ken秋田県 Akita-ken
山形県 Yamagata-ken福島県 Fukushima-ken茨城県 Ibaraki-ken栃木県 Tochigi-ken群馬県 Gumma-ken
埼玉県 Saitama-ken千葉県 Chiba-ken東京都 Tokyo-to神奈川県 Kanagawa-ken新潟県 Niigata-ken
富山県 Toyama-ken石川県 Ishikawa-ken福井県 Fukui-ken山梨県 Yamanashi-ken長野県 Nagano-ken
岐阜県 Gifu-ken静岡県 Shizuoka-ken愛知県 Aichi-ken三重県 Mie-ken滋賀県 Shiga-ken
京都府 Kyoto-fu大阪府 Osaka-fu兵庫県 Hyogo-ken奈良県 Nara-ken和歌山県 Wakayama-ken
鳥取県 Tottori-ken島根県 Shimane-ken岡山県 Okayama-ken広島県 Hiroshima-ken山口県 Yamaguchi-ken
徳島県 Tokushima-ken香川県 Kagawa-ken愛媛県 Ehime-ken高知県 Kochi-ken福岡県 Fukuoka-ken
佐賀県 Saga-ken長崎県 Nagasaki-ken熊本県 Kumamoto-ken大分県 Oita-ken宮崎県 Miyazaki-ken
鹿児島県 Kagoshima-ken沖縄県 Okinawa-ken
平均値 Mean標準偏差 Standard deviation
分子高校卒業者のうち就職者数-高校卒業者のうち県内就職者数
新規学卒者就職者数(高校) 新規学卒者求人数(高校) 短期大学卒業者のうち無業者数
指標計算式 Numerators No. of new upper secondary school graduatesgetting jobs
No. of new upper secondary schoolgraduates openings
Formulae ofindicators 分母 高校卒業者のうち就職者数 新規学卒者求職者数(高校) 新規学卒者求職者数(高校) 短期大学卒業者数
Denominators Number of new upper secondary schoolgraduates getting jobs
No. of new upper secondary school graduatesseeking a job
No. of new upper secondary school graduatesseeking a job Number of junior colleges graduates
出典 Referencea) Number of new upper secondary school graduates getting jobs - Number of upper secondary school graduates getting jobs in the same prefecture
a)
短大新規卒業者の無業者率 大学卒業者に占める就職者の割合 大学新規卒業者の無業者率
Ratio of new junior college graduatesnot working
Ratio of new employment to college or university graduates
Ratio of new college or universitygraduates not working
(%) (%) (%)Pref.Code
MeanS.D.
短期大学卒業者のうち無業者数 大学卒業者のうち就職者数 大学卒業者のうち無業者数 分子
Number of junior college graduates going to dohousework or undetermined on next step Number of new university graduates getting jobs Number of university graduates going to do housework
or undetermined on next step 指標計算式
短期大学卒業者数 大学卒業者数 大学卒業者数 分母
Number of junior colleges graduates Number of university graduates Number of university graduates
出典
都道府県コー
ド
90
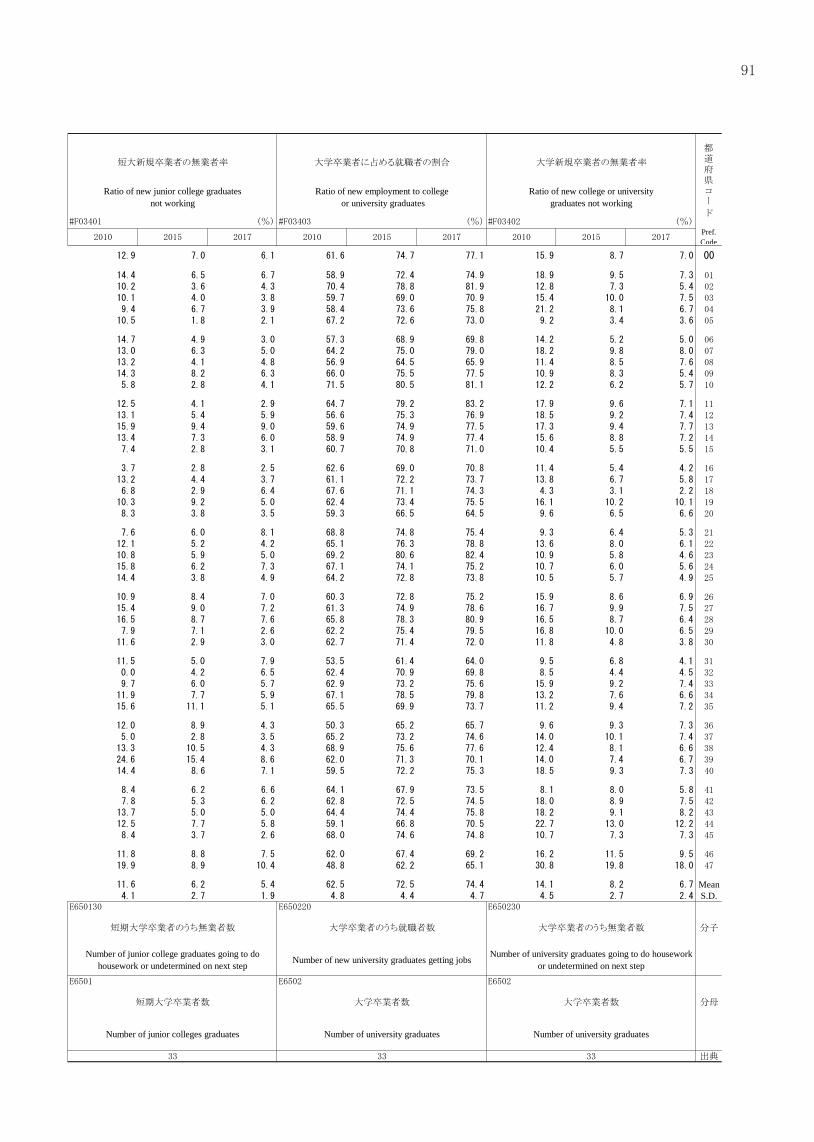
都道府県 高卒者に占める県外就職者の割合 高等学校新規卒業者の就職率 高等学校新規卒業者の求人倍率 短大新規卒業者の無業者率
Prefecture Ratio of high school graduates getting jobsoutside the prefecture
Rate of new high school graduatesgetting jobs
Job vacancies rate ofnew high school graduates
Ratio of new junior college graduatesnot working
(%) (%) (倍:times
全国 All Japan
北海道 Hokkaido青森県 Aomori-ken岩手県 Iwate-ken宮城県 Miyagi-ken秋田県 Akita-ken
山形県 Yamagata-ken福島県 Fukushima-ken茨城県 Ibaraki-ken栃木県 Tochigi-ken群馬県 Gumma-ken
埼玉県 Saitama-ken千葉県 Chiba-ken東京都 Tokyo-to神奈川県 Kanagawa-ken新潟県 Niigata-ken
富山県 Toyama-ken石川県 Ishikawa-ken福井県 Fukui-ken山梨県 Yamanashi-ken長野県 Nagano-ken
岐阜県 Gifu-ken静岡県 Shizuoka-ken愛知県 Aichi-ken三重県 Mie-ken滋賀県 Shiga-ken
京都府 Kyoto-fu大阪府 Osaka-fu兵庫県 Hyogo-ken奈良県 Nara-ken和歌山県 Wakayama-ken
鳥取県 Tottori-ken島根県 Shimane-ken岡山県 Okayama-ken広島県 Hiroshima-ken山口県 Yamaguchi-ken
徳島県 Tokushima-ken香川県 Kagawa-ken愛媛県 Ehime-ken高知県 Kochi-ken福岡県 Fukuoka-ken
佐賀県 Saga-ken長崎県 Nagasaki-ken熊本県 Kumamoto-ken大分県 Oita-ken宮崎県 Miyazaki-ken
鹿児島県 Kagoshima-ken沖縄県 Okinawa-ken
平均値 Mean標準偏差 Standard deviation
分子高校卒業者のうち就職者数-高校卒業者のうち県内就職者数
新規学卒者就職者数(高校) 新規学卒者求人数(高校) 短期大学卒業者のうち無業者数
指標計算式 Numerators No. of new upper secondary school graduatesgetting jobs
No. of new upper secondary schoolgraduates openings
Formulae ofindicators 分母 高校卒業者のうち就職者数 新規学卒者求職者数(高校) 新規学卒者求職者数(高校) 短期大学卒業者数
Denominators Number of new upper secondary schoolgraduates getting jobs
No. of new upper secondary school graduatesseeking a job
No. of new upper secondary school graduatesseeking a job Number of junior colleges graduates
出典 Referencea) Number of new upper secondary school graduates getting jobs - Number of upper secondary school graduates getting jobs in the same prefecture
a)
短大新規卒業者の無業者率 大学卒業者に占める就職者の割合 大学新規卒業者の無業者率
Ratio of new junior college graduatesnot working
Ratio of new employment to college or university graduates
Ratio of new college or universitygraduates not working
(%) (%) (%)Pref.Code
MeanS.D.
短期大学卒業者のうち無業者数 大学卒業者のうち就職者数 大学卒業者のうち無業者数 分子
Number of junior college graduates going to dohousework or undetermined on next step Number of new university graduates getting jobs Number of university graduates going to do housework
or undetermined on next step 指標計算式
短期大学卒業者数 大学卒業者数 大学卒業者数 分母
Number of junior colleges graduates Number of university graduates Number of university graduates
出典
都道府県コー
ド
91

都道府県 中高年齢者就職率(45歳以上)就職者に占める中高年齢者の比率
(45歳以上)高齢就業者割合(65歳以上) 高齢一般労働者割合(65歳以上)
Prefecture Rate of persons 45 years oldand over getting jobs
Ratio of employment for persons45 years old and over
Ratio of the aged employee(65 years old and over)
(%) (%) (%)
全国 All Japan
北海道 Hokkaido青森県 Aomori-ken岩手県 Iwate-ken宮城県 Miyagi-ken秋田県 Akita-ken
山形県 Yamagata-ken福島県 Fukushima-ken茨城県 Ibaraki-ken栃木県 Tochigi-ken群馬県 Gumma-ken
埼玉県 Saitama-ken千葉県 Chiba-ken東京都 Tokyo-to神奈川県 Kanagawa-ken新潟県 Niigata-ken
富山県 Toyama-ken石川県 Ishikawa-ken福井県 Fukui-ken山梨県 Yamanashi-ken長野県 Nagano-ken
岐阜県 Gifu-ken静岡県 Shizuoka-ken愛知県 Aichi-ken三重県 Mie-ken滋賀県 Shiga-ken
京都府 Kyoto-fu大阪府 Osaka-fu兵庫県 Hyogo-ken奈良県 Nara-ken和歌山県 Wakayama-ken
鳥取県 Tottori-ken島根県 Shimane-ken岡山県 Okayama-ken広島県 Hiroshima-ken山口県 Yamaguchi-ken
徳島県 Tokushima-ken香川県 Kagawa-ken愛媛県 Ehime-ken高知県 Kochi-ken福岡県 Fukuoka-ken
佐賀県 Saga-ken長崎県 Nagasaki-ken熊本県 Kumamoto-ken大分県 Oita-ken宮崎県 Miyazaki-ken
鹿児島県 Kagoshima-ken沖縄県 Okinawa-ken
平均値 Mean標準偏差 Standard deviation
分子 中高年齢者(45歳以上)就職件数 中高年齢者(45歳以上)就職件数 就業者数(65歳以上) 一般労働者数(65歳以上)
指標計算式 Numerators No. of persons who found employment(Age 45 and over)
No. of persons who found employment(Age 45 and over) Employed persons (Age 65 or over, total) No. of workers (Age 65 and over)
Formulae ofindicators 分母
中高年齢者(45歳以上)月間有効求職者数(月平均) × 12
就職件数(一般)(年度計) 65歳以上人口 65歳以上人口
Denominators No. of active applications (Age 45 and over)(monthly average) × 12
No. of persons who found employment (General works) (YTD) Total population (65 and over) Total population (65 and over)
出典 Reference
4)就業異動 Labour turnover
高齢一般労働者割合(65歳以上)就職者に占める身体障害者の比率
(就職件数千件当たり)転職率
Ratio of the aged general worker(65 years old and over)
Ratio of employment for the disabled(per 1,000 employments)
Ratio of persons who changed jobs
(%) (%)Pref.Code
MeanS.D.
一般労働者数(65歳以上) 身体障害者就職件数 転職者数 分子
No. of workers (Age 65 and over) No. of new employments (Physically disabled persons) Persons who changed their job 指標計算式
65歳以上人口 就職件数(一般)(年度計) 有業者数 分母
Total population (65 and over) No. of persons who found employment(General works) (YTD) Persons with a job
出典
都道府県コー
ド
92

都道府県 中高年齢者就職率(45歳以上)就職者に占める中高年齢者の比率
(45歳以上)高齢就業者割合(65歳以上) 高齢一般労働者割合(65歳以上)
Prefecture Rate of persons 45 years oldand over getting jobs
Ratio of employment for persons45 years old and over
Ratio of the aged employee(65 years old and over)
(%) (%) (%)
全国 All Japan
北海道 Hokkaido青森県 Aomori-ken岩手県 Iwate-ken宮城県 Miyagi-ken秋田県 Akita-ken
山形県 Yamagata-ken福島県 Fukushima-ken茨城県 Ibaraki-ken栃木県 Tochigi-ken群馬県 Gumma-ken
埼玉県 Saitama-ken千葉県 Chiba-ken東京都 Tokyo-to神奈川県 Kanagawa-ken新潟県 Niigata-ken
富山県 Toyama-ken石川県 Ishikawa-ken福井県 Fukui-ken山梨県 Yamanashi-ken長野県 Nagano-ken
岐阜県 Gifu-ken静岡県 Shizuoka-ken愛知県 Aichi-ken三重県 Mie-ken滋賀県 Shiga-ken
京都府 Kyoto-fu大阪府 Osaka-fu兵庫県 Hyogo-ken奈良県 Nara-ken和歌山県 Wakayama-ken
鳥取県 Tottori-ken島根県 Shimane-ken岡山県 Okayama-ken広島県 Hiroshima-ken山口県 Yamaguchi-ken
徳島県 Tokushima-ken香川県 Kagawa-ken愛媛県 Ehime-ken高知県 Kochi-ken福岡県 Fukuoka-ken
佐賀県 Saga-ken長崎県 Nagasaki-ken熊本県 Kumamoto-ken大分県 Oita-ken宮崎県 Miyazaki-ken
鹿児島県 Kagoshima-ken沖縄県 Okinawa-ken
平均値 Mean標準偏差 Standard deviation
分子 中高年齢者(45歳以上)就職件数 中高年齢者(45歳以上)就職件数 就業者数(65歳以上) 一般労働者数(65歳以上)
指標計算式 Numerators No. of persons who found employment(Age 45 and over)
No. of persons who found employment(Age 45 and over) Employed persons (Age 65 or over, total) No. of workers (Age 65 and over)
Formulae ofindicators 分母
中高年齢者(45歳以上)月間有効求職者数(月平均) × 12
就職件数(一般)(年度計) 65歳以上人口 65歳以上人口
Denominators No. of active applications (Age 45 and over)(monthly average) × 12
No. of persons who found employment (General works) (YTD) Total population (65 and over) Total population (65 and over)
出典 Reference
4)就業異動 Labour turnover
高齢一般労働者割合(65歳以上)就職者に占める身体障害者の比率
(就職件数千件当たり)転職率
Ratio of the aged general worker(65 years old and over)
Ratio of employment for the disabled(per 1,000 employments)
Ratio of persons who changed jobs
(%) (%)Pref.Code
MeanS.D.
一般労働者数(65歳以上) 身体障害者就職件数 転職者数 分子
No. of workers (Age 65 and over) No. of new employments (Physically disabled persons) Persons who changed their job 指標計算式
65歳以上人口 就職件数(一般)(年度計) 有業者数 分母
Total population (65 and over) No. of persons who found employment(General works) (YTD) Persons with a job
出典
都道府県コー
ド
93

都道府県 離職率 新規就業率 就業異動率 月間平均実労働時間数(男)
Prefecture Ratio of persons who left jobs Ratio of newly employed Ratio of job changes Hours worked (monthly average, male)
(%) (%) (%)
全国 All Japan
北海道 Hokkaido青森県 Aomori-ken岩手県 Iwate-ken宮城県 Miyagi-ken秋田県 Akita-ken
山形県 Yamagata-ken福島県 Fukushima-ken茨城県 Ibaraki-ken栃木県 Tochigi-ken群馬県 Gumma-ken
埼玉県 Saitama-ken千葉県 Chiba-ken東京都 Tokyo-to神奈川県 Kanagawa-ken新潟県 Niigata-ken
富山県 Toyama-ken石川県 Ishikawa-ken福井県 Fukui-ken山梨県 Yamanashi-ken長野県 Nagano-ken
岐阜県 Gifu-ken静岡県 Shizuoka-ken愛知県 Aichi-ken三重県 Mie-ken滋賀県 Shiga-ken
京都府 Kyoto-fu大阪府 Osaka-fu兵庫県 Hyogo-ken奈良県 Nara-ken和歌山県 Wakayama-ken
鳥取県 Tottori-ken島根県 Shimane-ken岡山県 Okayama-ken広島県 Hiroshima-ken山口県 Yamaguchi-ken
徳島県 Tokushima-ken香川県 Kagawa-ken愛媛県 Ehime-ken高知県 Kochi-ken福岡県 Fukuoka-ken
佐賀県 Saga-ken長崎県 Nagasaki-ken熊本県 Kumamoto-ken大分県 Oita-ken宮崎県 Miyazaki-ken
鹿児島県 Kagoshima-ken沖縄県 Okinawa-ken
平均値 Mean標準偏差 Standard deviation
分子 離職者数 新規就業者数 転職者数+離職者数+新規就業者数
指標計算式 Numerators Persons who quit their job Persons who began work in the past year b) 所定内実労働時間数(男)+超過実労働時間数(男)
Formulae ofindicators 分母 継続就業者数+転職者数+離職者数 有業者数 15歳以上人口
Denominators a) Persons with a job Population (15 and over, total)
出典 Referencea) No. of persons who continue present job + Persons who changed their job + Persons who quit their jobb) Persons who changed their job + Persons who quit their job + Persons who began work in the past year
5)就業条件 Employment conditions
月間平均実労働時間数(男) 月間平均実労働時間数(女) きまって支給する現金給与月額(男)
Hours worked (monthly average, male) Hours worked (monthly average, female) Wages regularly paid (monthly average, male)
(時間:hours (時間:hours (千円:thousand yenPref.Code
MeanS.D.
※
分子
所定内実労働時間数(男)+超過実労働時間数(男) 所定内実労働時間数(女)+超過実労働時間数(女) きまって支給する現金給与額(男) 指標計算式
Scheduled actual working hours (male) +Actual overtime working hours (male)
Scheduled actual working hours (female) +Actual overtime working hours (female) Contractual cash earnings (male) 分母
出典
都道府県コー
ド
94

都道府県 離職率 新規就業率 就業異動率 月間平均実労働時間数(男)
Prefecture Ratio of persons who left jobs Ratio of newly employed Ratio of job changes Hours worked (monthly average, male)
(%) (%) (%)
全国 All Japan
北海道 Hokkaido青森県 Aomori-ken岩手県 Iwate-ken宮城県 Miyagi-ken秋田県 Akita-ken
山形県 Yamagata-ken福島県 Fukushima-ken茨城県 Ibaraki-ken栃木県 Tochigi-ken群馬県 Gumma-ken
埼玉県 Saitama-ken千葉県 Chiba-ken東京都 Tokyo-to神奈川県 Kanagawa-ken新潟県 Niigata-ken
富山県 Toyama-ken石川県 Ishikawa-ken福井県 Fukui-ken山梨県 Yamanashi-ken長野県 Nagano-ken
岐阜県 Gifu-ken静岡県 Shizuoka-ken愛知県 Aichi-ken三重県 Mie-ken滋賀県 Shiga-ken
京都府 Kyoto-fu大阪府 Osaka-fu兵庫県 Hyogo-ken奈良県 Nara-ken和歌山県 Wakayama-ken
鳥取県 Tottori-ken島根県 Shimane-ken岡山県 Okayama-ken広島県 Hiroshima-ken山口県 Yamaguchi-ken
徳島県 Tokushima-ken香川県 Kagawa-ken愛媛県 Ehime-ken高知県 Kochi-ken福岡県 Fukuoka-ken
佐賀県 Saga-ken長崎県 Nagasaki-ken熊本県 Kumamoto-ken大分県 Oita-ken宮崎県 Miyazaki-ken
鹿児島県 Kagoshima-ken沖縄県 Okinawa-ken
平均値 Mean標準偏差 Standard deviation
分子 離職者数 新規就業者数 転職者数+離職者数+新規就業者数
指標計算式 Numerators Persons who quit their job Persons who began work in the past year b) 所定内実労働時間数(男)+超過実労働時間数(男)
Formulae ofindicators 分母 継続就業者数+転職者数+離職者数 有業者数 15歳以上人口
Denominators a) Persons with a job Population (15 and over, total)
出典 Referencea) No. of persons who continue present job + Persons who changed their job + Persons who quit their jobb) Persons who changed their job + Persons who quit their job + Persons who began work in the past year
5)就業条件 Employment conditions
月間平均実労働時間数(男) 月間平均実労働時間数(女) きまって支給する現金給与月額(男)
Hours worked (monthly average, male) Hours worked (monthly average, female) Wages regularly paid (monthly average, male)
(時間:hours (時間:hours (千円:thousand yenPref.Code
MeanS.D.
※
分子
所定内実労働時間数(男)+超過実労働時間数(男) 所定内実労働時間数(女)+超過実労働時間数(女) きまって支給する現金給与額(男) 指標計算式
Scheduled actual working hours (male) +Actual overtime working hours (male)
Scheduled actual working hours (female) +Actual overtime working hours (female) Contractual cash earnings (male) 分母
出典
都道府県コー
ド
95

都道府県 きまって支給する現金給与月額(女) 男性パートタイムの給与(1時間当たり) 女性パートタイムの給与(1時間当たり) 高等学校新規卒業者初任給(男)
Prefecture Wages regularly paid(monthly average, female)
Salary of part-time worker(hour, male)
Salary of part-time worker(hour, female)
(千円:thousand yen (円:yen (円:yen
全国 All Japan
北海道 Hokkaido青森県 Aomori-ken岩手県 Iwate-ken宮城県 Miyagi-ken秋田県 Akita-ken
山形県 Yamagata-ken福島県 Fukushima-ken茨城県 Ibaraki-ken栃木県 Tochigi-ken群馬県 Gumma-ken
埼玉県 Saitama-ken千葉県 Chiba-ken東京都 Tokyo-to神奈川県 Kanagawa-ken新潟県 Niigata-ken
富山県 Toyama-ken石川県 Ishikawa-ken福井県 Fukui-ken山梨県 Yamanashi-ken長野県 Nagano-ken
岐阜県 Gifu-ken静岡県 Shizuoka-ken愛知県 Aichi-ken三重県 Mie-ken滋賀県 Shiga-ken
京都府 Kyoto-fu大阪府 Osaka-fu兵庫県 Hyogo-ken奈良県 Nara-ken和歌山県 Wakayama-ken
鳥取県 Tottori-ken島根県 Shimane-ken岡山県 Okayama-ken広島県 Hiroshima-ken山口県 Yamaguchi-ken
徳島県 Tokushima-ken香川県 Kagawa-ken愛媛県 Ehime-ken高知県 Kochi-ken福岡県 Fukuoka-ken
佐賀県 Saga-ken長崎県 Nagasaki-ken熊本県 Kumamoto-ken大分県 Oita-ken宮崎県 Miyazaki-ken
鹿児島県 Kagoshima-ken沖縄県 Okinawa-ken
平均値 Mean標準偏差 Standard deviation
※ ※ ※
分子
指標計算式 Numerators きまって支給する現金給与額(女) 男性パートタイムの給与 女性パートタイムの給与 新規学卒者初任給(高校・男)
Formulae ofindicators 分母 Contractual cash earnings (female) Salary of part-time workers (male) Salary of part-time workers (female)
Denominators
出典 Reference
高等学校新規卒業者初任給(男) 高等学校新規卒業者初任給(女) 大学新規卒業者初任給(男)
Starting salary, senior highschool graduates (month, male)
Starting salary, senior highschool graduates (month, female)
Starting salary, college or universitygraduates (month, male)
(千円:thousand yen (千円:thousand yen (千円:thousand yenPref.Code
MeanS.D.
※ ※ ※
分子
新規学卒者初任給(高校・男) 新規学卒者初任給(高校・女) 新規学卒者初任給(大学・男) 指標計算式
Starting salary, upper secondaryschool graduates (male)
Starting salary, upper secondaryschool graduates (Female) Starting salary of university graduates (male) 分母
出典
都道府県コー
ド
96

都道府県 きまって支給する現金給与月額(女) 男性パートタイムの給与(1時間当たり) 女性パートタイムの給与(1時間当たり) 高等学校新規卒業者初任給(男)
Prefecture Wages regularly paid(monthly average, female)
Salary of part-time worker(hour, male)
Salary of part-time worker(hour, female)
(千円:thousand yen (円:yen (円:yen
全国 All Japan
北海道 Hokkaido青森県 Aomori-ken岩手県 Iwate-ken宮城県 Miyagi-ken秋田県 Akita-ken
山形県 Yamagata-ken福島県 Fukushima-ken茨城県 Ibaraki-ken栃木県 Tochigi-ken群馬県 Gumma-ken
埼玉県 Saitama-ken千葉県 Chiba-ken東京都 Tokyo-to神奈川県 Kanagawa-ken新潟県 Niigata-ken
富山県 Toyama-ken石川県 Ishikawa-ken福井県 Fukui-ken山梨県 Yamanashi-ken長野県 Nagano-ken
岐阜県 Gifu-ken静岡県 Shizuoka-ken愛知県 Aichi-ken三重県 Mie-ken滋賀県 Shiga-ken
京都府 Kyoto-fu大阪府 Osaka-fu兵庫県 Hyogo-ken奈良県 Nara-ken和歌山県 Wakayama-ken
鳥取県 Tottori-ken島根県 Shimane-ken岡山県 Okayama-ken広島県 Hiroshima-ken山口県 Yamaguchi-ken
徳島県 Tokushima-ken香川県 Kagawa-ken愛媛県 Ehime-ken高知県 Kochi-ken福岡県 Fukuoka-ken
佐賀県 Saga-ken長崎県 Nagasaki-ken熊本県 Kumamoto-ken大分県 Oita-ken宮崎県 Miyazaki-ken
鹿児島県 Kagoshima-ken沖縄県 Okinawa-ken
平均値 Mean標準偏差 Standard deviation
※ ※ ※
分子
指標計算式 Numerators きまって支給する現金給与額(女) 男性パートタイムの給与 女性パートタイムの給与 新規学卒者初任給(高校・男)
Formulae ofindicators 分母 Contractual cash earnings (female) Salary of part-time workers (male) Salary of part-time workers (female)
Denominators
出典 Reference
高等学校新規卒業者初任給(男) 高等学校新規卒業者初任給(女) 大学新規卒業者初任給(男)
Starting salary, senior highschool graduates (month, male)
Starting salary, senior highschool graduates (month, female)
Starting salary, college or universitygraduates (month, male)
(千円:thousand yen (千円:thousand yen (千円:thousand yenPref.Code
MeanS.D.
※ ※ ※
分子
新規学卒者初任給(高校・男) 新規学卒者初任給(高校・女) 新規学卒者初任給(大学・男) 指標計算式
Starting salary, upper secondaryschool graduates (male)
Starting salary, upper secondaryschool graduates (Female) Starting salary of university graduates (male) 分母
出典
都道府県コー
ド
97

都道府県 短大新規卒業者初任給(女)
Prefecture Starting salary, junior collegegraduates (month, female)
(千円:thousand yen
全国 All Japan
北海道 Hokkaido青森県 Aomori-ken岩手県 Iwate-ken宮城県 Miyagi-ken秋田県 Akita-ken
山形県 Yamagata-ken福島県 Fukushima-ken茨城県 Ibaraki-ken栃木県 Tochigi-ken群馬県 Gumma-ken
埼玉県 Saitama-ken千葉県 Chiba-ken東京都 Tokyo-to神奈川県 Kanagawa-ken新潟県 Niigata-ken
富山県 Toyama-ken石川県 Ishikawa-ken福井県 Fukui-ken山梨県 Yamanashi-ken長野県 Nagano-ken
岐阜県 Gifu-ken静岡県 Shizuoka-ken愛知県 Aichi-ken三重県 Mie-ken滋賀県 Shiga-ken
京都府 Kyoto-fu大阪府 Osaka-fu兵庫県 Hyogo-ken奈良県 Nara-ken和歌山県 Wakayama-ken
鳥取県 Tottori-ken島根県 Shimane-ken岡山県 Okayama-ken広島県 Hiroshima-ken山口県 Yamaguchi-ken
徳島県 Tokushima-ken香川県 Kagawa-ken愛媛県 Ehime-ken高知県 Kochi-ken福岡県 Fukuoka-ken
佐賀県 Saga-ken長崎県 Nagasaki-ken熊本県 Kumamoto-ken大分県 Oita-ken宮崎県 Miyazaki-ken
鹿児島県 Kagoshima-ken沖縄県 Okinawa-ken
平均値 Mean標準偏差 Standard deviation
※
分子
指標計算式 Numerators 新規学卒者初任給(高専・短大・女)
Formulae ofindicators 分母
Starting salary of technical college and juniorcollege graduates (female)
Denominators
出典 Reference
98

都道府県 短大新規卒業者初任給(女)
Prefecture Starting salary, junior collegegraduates (month, female)
(千円:thousand yen
全国 All Japan
北海道 Hokkaido青森県 Aomori-ken岩手県 Iwate-ken宮城県 Miyagi-ken秋田県 Akita-ken
山形県 Yamagata-ken福島県 Fukushima-ken茨城県 Ibaraki-ken栃木県 Tochigi-ken群馬県 Gumma-ken
埼玉県 Saitama-ken千葉県 Chiba-ken東京都 Tokyo-to神奈川県 Kanagawa-ken新潟県 Niigata-ken
富山県 Toyama-ken石川県 Ishikawa-ken福井県 Fukui-ken山梨県 Yamanashi-ken長野県 Nagano-ken
岐阜県 Gifu-ken静岡県 Shizuoka-ken愛知県 Aichi-ken三重県 Mie-ken滋賀県 Shiga-ken
京都府 Kyoto-fu大阪府 Osaka-fu兵庫県 Hyogo-ken奈良県 Nara-ken和歌山県 Wakayama-ken
鳥取県 Tottori-ken島根県 Shimane-ken岡山県 Okayama-ken広島県 Hiroshima-ken山口県 Yamaguchi-ken
徳島県 Tokushima-ken香川県 Kagawa-ken愛媛県 Ehime-ken高知県 Kochi-ken福岡県 Fukuoka-ken
佐賀県 Saga-ken長崎県 Nagasaki-ken熊本県 Kumamoto-ken大分県 Oita-ken宮崎県 Miyazaki-ken
鹿児島県 Kagoshima-ken沖縄県 Okinawa-ken
平均値 Mean標準偏差 Standard deviation
※
分子
指標計算式 Numerators 新規学卒者初任給(高専・短大・女)
Formulae ofindicators 分母
Starting salary of technical college and juniorcollege graduates (female)
Denominators
出典 Reference
99

G.文化・スポーツ Culture and Sports1)社会教育施設 Facilities for social education
都道府県 公民館数(人口100万人当たり) 図書館数(人口100万人当たり) 博物館数(人口100万人当たり) 青少年教育施設数(人口100万人当たり)
Prefecture Public halls (per 1,000,000 persons) Libraries (per 1,000,000 persons) Museums(per 1,000,000 persons)
(館:number of community centers) (館:number of community centers) (館:number of community centers)
全国 All Japan
北海道 Hokkaido青森県 Aomori-ken岩手県 Iwate-ken宮城県 Miyagi-ken秋田県 Akita-ken
山形県 Yamagata-ken福島県 Fukushima-ken茨城県 Ibaraki-ken栃木県 Tochigi-ken群馬県 Gumma-ken
埼玉県 Saitama-ken千葉県 Chiba-ken東京都 Tokyo-to神奈川県 Kanagawa-ken新潟県 Niigata-ken
富山県 Toyama-ken石川県 Ishikawa-ken福井県 Fukui-ken山梨県 Yamanashi-ken長野県 Nagano-ken
岐阜県 Gifu-ken静岡県 Shizuoka-ken愛知県 Aichi-ken三重県 Mie-ken滋賀県 Shiga-ken
京都府 Kyoto-fu大阪府 Osaka-fu兵庫県 Hyogo-ken奈良県 Nara-ken和歌山県 Wakayama-ken
鳥取県 Tottori-ken島根県 Shimane-ken岡山県 Okayama-ken広島県 Hiroshima-ken山口県 Yamaguchi-ken
徳島県 Tokushima-ken香川県 Kagawa-ken愛媛県 Ehime-ken高知県 Kochi-ken福岡県 Fukuoka-ken
佐賀県 Saga-ken長崎県 Nagasaki-ken熊本県 Kumamoto-ken大分県 Oita-ken宮崎県 Miyazaki-ken
鹿児島県 Kagoshima-ken沖縄県 Okinawa-ken
平均値 Mean標準偏差 Standard deviation
分子 公民館数 図書館数 博物館数 青少年教育施設数
指標計算式 Numerators No. of public halls No. of libraries No. of museums No. of educational facilities for youth and children
Formulae ofindicators 分母 総人口 総人口 総人口 総人口
Denominators Total population (Both sexes) Total population (Both sexes) Total population (Both sexes) Total population (Both sexes)
出典 Reference
2)社会教育学級・講座 Classes of social education and culture
青少年教育施設数(人口100万人当たり) 青少年学級・講座数(人口100万人当たり) 成人一般学級・講座数(人口100万人当たり)
Educational facilities for youth and children(per 1,000,000 persons)
Youth education classes(per 1,000,000 persons)
General adults education classes(per 1,000,000 persons)
(所:number of facilities (学級・講座:number of classes (学級・講座:number of classesPref.Code
MeanS.D.
青少年教育施設数 青少年学級・講座数 成人一般学級・講座数 分子
No. of educational facilities for youth and children No.of youth education classes No. of general adults education classes 指標計算式
総人口 総人口 総人口 分母
Total population (Both sexes) Total population (Both sexes) Total population (Both sexes)
出典
都道府県コー
ド
100

G.文化・スポーツ Culture and Sports1)社会教育施設 Facilities for social education
都道府県 公民館数(人口100万人当たり) 図書館数(人口100万人当たり) 博物館数(人口100万人当たり) 青少年教育施設数(人口100万人当たり)
Prefecture Public halls (per 1,000,000 persons) Libraries (per 1,000,000 persons) Museums(per 1,000,000 persons)
(館:number of community centers) (館:number of community centers) (館:number of community centers)
全国 All Japan
北海道 Hokkaido青森県 Aomori-ken岩手県 Iwate-ken宮城県 Miyagi-ken秋田県 Akita-ken
山形県 Yamagata-ken福島県 Fukushima-ken茨城県 Ibaraki-ken栃木県 Tochigi-ken群馬県 Gumma-ken
埼玉県 Saitama-ken千葉県 Chiba-ken東京都 Tokyo-to神奈川県 Kanagawa-ken新潟県 Niigata-ken
富山県 Toyama-ken石川県 Ishikawa-ken福井県 Fukui-ken山梨県 Yamanashi-ken長野県 Nagano-ken
岐阜県 Gifu-ken静岡県 Shizuoka-ken愛知県 Aichi-ken三重県 Mie-ken滋賀県 Shiga-ken
京都府 Kyoto-fu大阪府 Osaka-fu兵庫県 Hyogo-ken奈良県 Nara-ken和歌山県 Wakayama-ken
鳥取県 Tottori-ken島根県 Shimane-ken岡山県 Okayama-ken広島県 Hiroshima-ken山口県 Yamaguchi-ken
徳島県 Tokushima-ken香川県 Kagawa-ken愛媛県 Ehime-ken高知県 Kochi-ken福岡県 Fukuoka-ken
佐賀県 Saga-ken長崎県 Nagasaki-ken熊本県 Kumamoto-ken大分県 Oita-ken宮崎県 Miyazaki-ken
鹿児島県 Kagoshima-ken沖縄県 Okinawa-ken
平均値 Mean標準偏差 Standard deviation
分子 公民館数 図書館数 博物館数 青少年教育施設数
指標計算式 Numerators No. of public halls No. of libraries No. of museums No. of educational facilities for youth and children
Formulae ofindicators 分母 総人口 総人口 総人口 総人口
Denominators Total population (Both sexes) Total population (Both sexes) Total population (Both sexes) Total population (Both sexes)
出典 Reference
2)社会教育学級・講座 Classes of social education and culture
青少年教育施設数(人口100万人当たり) 青少年学級・講座数(人口100万人当たり) 成人一般学級・講座数(人口100万人当たり)
Educational facilities for youth and children(per 1,000,000 persons)
Youth education classes(per 1,000,000 persons)
General adults education classes(per 1,000,000 persons)
(所:number of facilities (学級・講座:number of classes (学級・講座:number of classesPref.Code
MeanS.D.
青少年教育施設数 青少年学級・講座数 成人一般学級・講座数 分子
No. of educational facilities for youth and children No.of youth education classes No. of general adults education classes 指標計算式
総人口 総人口 総人口 分母
Total population (Both sexes) Total population (Both sexes) Total population (Both sexes)
出典
都道府県コー
ド
101
G
文化・スポーツ
(指標)

3)文化・娯楽施設
Facilities for culture and recreation
都道府県女性学級・講座数
(女性人口100万人当たり)高齢者学級・講座数(人口100万人当たり) 常設映画館数(人口100万人当たり) 社会体育施設数(人口100万人当たり)
Prefecture Women education classes(per 1,000,000 persons) (female)
Education classes for ages(per 1,000,000 persons)
Movie theaters (per 1,000,000 persons) Sports facilities (per 1,000,000 persons)
(学級・講座:number of classes (学級・講座:number of classes (館:number of theaters
全国 All Japan
北海道 Hokkaido青森県 Aomori-ken岩手県 Iwate-ken宮城県 Miyagi-ken秋田県 Akita-ken
山形県 Yamagata-ken福島県 Fukushima-ken茨城県 Ibaraki-ken栃木県 Tochigi-ken群馬県 Gumma-ken
埼玉県 Saitama-ken千葉県 Chiba-ken東京都 Tokyo-to神奈川県 Kanagawa-ken新潟県 Niigata-ken
富山県 Toyama-ken石川県 Ishikawa-ken福井県 Fukui-ken山梨県 Yamanashi-ken長野県 Nagano-ken
岐阜県 Gifu-ken静岡県 Shizuoka-ken愛知県 Aichi-ken三重県 Mie-ken滋賀県 Shiga-ken
京都府 Kyoto-fu大阪府 Osaka-fu兵庫県 Hyogo-ken奈良県 Nara-ken和歌山県 Wakayama-ken
鳥取県 Tottori-ken島根県 Shimane-ken岡山県 Okayama-ken広島県 Hiroshima-ken山口県 Yamaguchi-ken
徳島県 Tokushima-ken香川県 Kagawa-ken愛媛県 Ehime-ken高知県 Kochi-ken福岡県 Fukuoka-ken
佐賀県 Saga-ken長崎県 Nagasaki-ken熊本県 Kumamoto-ken大分県 Oita-ken宮崎県 Miyazaki-ken
鹿児島県 Kagoshima-ken沖縄県 Okinawa-ken
平均値 Mean標準偏差 Standard deviation
分子 女性学級・講座数 高齢者学級・講座数 常設映画館数 社会体育施設数
指標計算式 Numerators No. of women education classes No. of education classes for the aged No. of movie theaters No. of sports facilities
Formulae ofindicators 分母 総人口(女) 総人口 総人口 総人口
Denominators Total population (female) Total population (Both sexes) Total population (Both sexes) Total population (Both sexes)
出典 Reference
4)スポーツ施設 Sports facilities
社会体育施設数(人口100万人当たり) 多目的運動広場数(人口100万人当たり) 体育館数(人口100万人当たり)
Sports facilities (per 1,000,000 persons) Multi-purpose playgrounds (per 1,000,000 persons) Gymnasiums (per 1,000,000 persons)
(施設:number of facilities) (施設:number of purpose) (施設:number of gymnasiums)Pref.Code
MeanS.D.
社会体育施設数 多目的運動広場数 体育館数 分子
No. of sports facilities No. of multi-purpose playgrounds No. of gymnasiums 指標計算式
総人口 総人口 総人口 分母
Total population (Both sexes) Total population (Both sexes) Total population (Both sexes)
出典
都道府県コー
ド
102

3)文化・娯楽施設
Facilities for culture and recreation
都道府県女性学級・講座数
(女性人口100万人当たり)高齢者学級・講座数(人口100万人当たり) 常設映画館数(人口100万人当たり) 社会体育施設数(人口100万人当たり)
Prefecture Women education classes(per 1,000,000 persons) (female)
Education classes for ages(per 1,000,000 persons)
Movie theaters (per 1,000,000 persons) Sports facilities (per 1,000,000 persons)
(学級・講座:number of classes (学級・講座:number of classes (館:number of theaters
全国 All Japan
北海道 Hokkaido青森県 Aomori-ken岩手県 Iwate-ken宮城県 Miyagi-ken秋田県 Akita-ken
山形県 Yamagata-ken福島県 Fukushima-ken茨城県 Ibaraki-ken栃木県 Tochigi-ken群馬県 Gumma-ken
埼玉県 Saitama-ken千葉県 Chiba-ken東京都 Tokyo-to神奈川県 Kanagawa-ken新潟県 Niigata-ken
富山県 Toyama-ken石川県 Ishikawa-ken福井県 Fukui-ken山梨県 Yamanashi-ken長野県 Nagano-ken
岐阜県 Gifu-ken静岡県 Shizuoka-ken愛知県 Aichi-ken三重県 Mie-ken滋賀県 Shiga-ken
京都府 Kyoto-fu大阪府 Osaka-fu兵庫県 Hyogo-ken奈良県 Nara-ken和歌山県 Wakayama-ken
鳥取県 Tottori-ken島根県 Shimane-ken岡山県 Okayama-ken広島県 Hiroshima-ken山口県 Yamaguchi-ken
徳島県 Tokushima-ken香川県 Kagawa-ken愛媛県 Ehime-ken高知県 Kochi-ken福岡県 Fukuoka-ken
佐賀県 Saga-ken長崎県 Nagasaki-ken熊本県 Kumamoto-ken大分県 Oita-ken宮崎県 Miyazaki-ken
鹿児島県 Kagoshima-ken沖縄県 Okinawa-ken
平均値 Mean標準偏差 Standard deviation
分子 女性学級・講座数 高齢者学級・講座数 常設映画館数 社会体育施設数
指標計算式 Numerators No. of women education classes No. of education classes for the aged No. of movie theaters No. of sports facilities
Formulae ofindicators 分母 総人口(女) 総人口 総人口 総人口
Denominators Total population (female) Total population (Both sexes) Total population (Both sexes) Total population (Both sexes)
出典 Reference
4)スポーツ施設 Sports facilities
社会体育施設数(人口100万人当たり) 多目的運動広場数(人口100万人当たり) 体育館数(人口100万人当たり)
Sports facilities (per 1,000,000 persons) Multi-purpose playgrounds (per 1,000,000 persons) Gymnasiums (per 1,000,000 persons)
(施設:number of facilities) (施設:number of purpose) (施設:number of gymnasiums)Pref.Code
MeanS.D.
社会体育施設数 多目的運動広場数 体育館数 分子
No. of sports facilities No. of multi-purpose playgrounds No. of gymnasiums 指標計算式
総人口 総人口 総人口 分母
Total population (Both sexes) Total population (Both sexes) Total population (Both sexes)
出典
都道府県コー
ド
103

5)行動 Activities
都道府県水泳プール数(屋内,屋外)(人口100万人当たり)
ボランティア活動の年間行動者率(10歳以上)
スポーツの年間行動者率(10歳以上) 旅行・行楽の年間行動者率(10歳以上)
Prefecture Swimming pools (indoor and outdoor)(per 1,000,000 persons)
Participation rate of volunteer activities(10 years and over)
Participation rate of sports(10 years and over)
(施設:number of pools (%) (%)
全国 All Japan
北海道 Hokkaido青森県 Aomori-ken岩手県 Iwate-ken宮城県 Miyagi-ken秋田県 Akita-ken
山形県 Yamagata-ken福島県 Fukushima-ken茨城県 Ibaraki-ken栃木県 Tochigi-ken群馬県 Gumma-ken
埼玉県 Saitama-ken千葉県 Chiba-ken東京都 Tokyo-to神奈川県 Kanagawa-ken新潟県 Niigata-ken
富山県 Toyama-ken石川県 Ishikawa-ken福井県 Fukui-ken山梨県 Yamanashi-ken長野県 Nagano-ken
岐阜県 Gifu-ken静岡県 Shizuoka-ken愛知県 Aichi-ken三重県 Mie-ken滋賀県 Shiga-ken
京都府 Kyoto-fu大阪府 Osaka-fu兵庫県 Hyogo-ken奈良県 Nara-ken和歌山県 Wakayama-ken
鳥取県 Tottori-ken島根県 Shimane-ken岡山県 Okayama-ken広島県 Hiroshima-ken山口県 Yamaguchi-ken
徳島県 Tokushima-ken香川県 Kagawa-ken愛媛県 Ehime-ken高知県 Kochi-ken福岡県 Fukuoka-ken
佐賀県 Saga-ken長崎県 Nagasaki-ken熊本県 Kumamoto-ken大分県 Oita-ken宮崎県 Miyazaki-ken
鹿児島県 Kagoshima-ken沖縄県 Okinawa-ken
平均値 Mean標準偏差 Standard deviation
※ ※
分子 水泳プール数(屋内,屋外)
指標計算式 Numerators No. of swimming pools (Indoor and outdoor) ボランティア活動(年間の行動者率)(10歳以上)
スポーツ年間行動者率(10歳以上) 旅行・行楽年間行動者率(10歳以上)
Formulae ofindicators 分母 総人口
Participation rate (Volunteer activities, 10 yrs.old and over)
Participation rate (Sports, 10 yrs. old andover)
Denominators Total population (Both sexes)
出典 Reference
6)旅行・宿泊 A travel and stay
旅行・行楽の年間行動者率(10歳以上) 海外旅行の年間行動者率(10歳以上) 客室稼働率
Participation rate of travels and day excursion(10 years and over)
Participation rate of travel outside Japan(10 years and over)
Hotel occupancy rate
(%) (%) (%)Pref.Code
MeanS.D.
※ ※ ※
分子
旅行・行楽年間行動者率(10歳以上) 海外旅行年間行動者率(10歳以上) 客室稼働率 指標計算式
Participation rate(Travel and excursion, 10 yrs. old and over)
Participation rate(Travel outside Japan, 10 yrs. old and over) Hotel room occupancy rate 分母
出典
都道府県コー
ド
104

5)行動 Activities
都道府県水泳プール数(屋内,屋外)(人口100万人当たり)
ボランティア活動の年間行動者率(10歳以上)
スポーツの年間行動者率(10歳以上) 旅行・行楽の年間行動者率(10歳以上)
Prefecture Swimming pools (indoor and outdoor)(per 1,000,000 persons)
Participation rate of volunteer activities(10 years and over)
Participation rate of sports(10 years and over)
(施設:number of pools (%) (%)
全国 All Japan
北海道 Hokkaido青森県 Aomori-ken岩手県 Iwate-ken宮城県 Miyagi-ken秋田県 Akita-ken
山形県 Yamagata-ken福島県 Fukushima-ken茨城県 Ibaraki-ken栃木県 Tochigi-ken群馬県 Gumma-ken
埼玉県 Saitama-ken千葉県 Chiba-ken東京都 Tokyo-to神奈川県 Kanagawa-ken新潟県 Niigata-ken
富山県 Toyama-ken石川県 Ishikawa-ken福井県 Fukui-ken山梨県 Yamanashi-ken長野県 Nagano-ken
岐阜県 Gifu-ken静岡県 Shizuoka-ken愛知県 Aichi-ken三重県 Mie-ken滋賀県 Shiga-ken
京都府 Kyoto-fu大阪府 Osaka-fu兵庫県 Hyogo-ken奈良県 Nara-ken和歌山県 Wakayama-ken
鳥取県 Tottori-ken島根県 Shimane-ken岡山県 Okayama-ken広島県 Hiroshima-ken山口県 Yamaguchi-ken
徳島県 Tokushima-ken香川県 Kagawa-ken愛媛県 Ehime-ken高知県 Kochi-ken福岡県 Fukuoka-ken
佐賀県 Saga-ken長崎県 Nagasaki-ken熊本県 Kumamoto-ken大分県 Oita-ken宮崎県 Miyazaki-ken
鹿児島県 Kagoshima-ken沖縄県 Okinawa-ken
平均値 Mean標準偏差 Standard deviation
※ ※
分子 水泳プール数(屋内,屋外)
指標計算式 Numerators No. of swimming pools (Indoor and outdoor) ボランティア活動(年間の行動者率)(10歳以上)
スポーツ年間行動者率(10歳以上) 旅行・行楽年間行動者率(10歳以上)
Formulae ofindicators 分母 総人口
Participation rate (Volunteer activities, 10 yrs.old and over)
Participation rate (Sports, 10 yrs. old andover)
Denominators Total population (Both sexes)
出典 Reference
6)旅行・宿泊 A travel and stay
旅行・行楽の年間行動者率(10歳以上) 海外旅行の年間行動者率(10歳以上) 客室稼働率
Participation rate of travels and day excursion(10 years and over)
Participation rate of travel outside Japan(10 years and over)
Hotel occupancy rate
(%) (%) (%)Pref.Code
MeanS.D.
※ ※ ※
分子
旅行・行楽年間行動者率(10歳以上) 海外旅行年間行動者率(10歳以上) 客室稼働率 指標計算式
Participation rate(Travel and excursion, 10 yrs. old and over)
Participation rate(Travel outside Japan, 10 yrs. old and over) Hotel room occupancy rate 分母
出典
都道府県コー
ド
105

都道府県 一般旅券発行件数(人口千人当たり)
Prefecture Passports issued (per 1,000 persons)
(件:number of cases
全国 All Japan
北海道 Hokkaido青森県 Aomori-ken岩手県 Iwate-ken宮城県 Miyagi-ken秋田県 Akita-ken
山形県 Yamagata-ken福島県 Fukushima-ken茨城県 Ibaraki-ken栃木県 Tochigi-ken群馬県 Gumma-ken
埼玉県 Saitama-ken千葉県 Chiba-ken東京都 Tokyo-to神奈川県 Kanagawa-ken新潟県 Niigata-ken
富山県 Toyama-ken石川県 Ishikawa-ken福井県 Fukui-ken山梨県 Yamanashi-ken長野県 Nagano-ken
岐阜県 Gifu-ken静岡県 Shizuoka-ken愛知県 Aichi-ken三重県 Mie-ken滋賀県 Shiga-ken
京都府 Kyoto-fu大阪府 Osaka-fu兵庫県 Hyogo-ken奈良県 Nara-ken和歌山県 Wakayama-ken
鳥取県 Tottori-ken島根県 Shimane-ken岡山県 Okayama-ken広島県 Hiroshima-ken山口県 Yamaguchi-ken
徳島県 Tokushima-ken香川県 Kagawa-ken愛媛県 Ehime-ken高知県 Kochi-ken福岡県 Fukuoka-ken
佐賀県 Saga-ken長崎県 Nagasaki-ken熊本県 Kumamoto-ken大分県 Oita-ken宮崎県 Miyazaki-ken
鹿児島県 Kagoshima-ken沖縄県 Okinawa-ken
平均値 Mean標準偏差 Standard deviation
分子 一般旅券発行件数
指標計算式 Numerators No. of passports issued
Formulae ofindicators 分母 総人口
Denominators Total population (Both sexes)
出典 Reference
106

都道府県 一般旅券発行件数(人口千人当たり)
Prefecture Passports issued (per 1,000 persons)
(件:number of cases
全国 All Japan
北海道 Hokkaido青森県 Aomori-ken岩手県 Iwate-ken宮城県 Miyagi-ken秋田県 Akita-ken
山形県 Yamagata-ken福島県 Fukushima-ken茨城県 Ibaraki-ken栃木県 Tochigi-ken群馬県 Gumma-ken
埼玉県 Saitama-ken千葉県 Chiba-ken東京都 Tokyo-to神奈川県 Kanagawa-ken新潟県 Niigata-ken
富山県 Toyama-ken石川県 Ishikawa-ken福井県 Fukui-ken山梨県 Yamanashi-ken長野県 Nagano-ken
岐阜県 Gifu-ken静岡県 Shizuoka-ken愛知県 Aichi-ken三重県 Mie-ken滋賀県 Shiga-ken
京都府 Kyoto-fu大阪府 Osaka-fu兵庫県 Hyogo-ken奈良県 Nara-ken和歌山県 Wakayama-ken
鳥取県 Tottori-ken島根県 Shimane-ken岡山県 Okayama-ken広島県 Hiroshima-ken山口県 Yamaguchi-ken
徳島県 Tokushima-ken香川県 Kagawa-ken愛媛県 Ehime-ken高知県 Kochi-ken福岡県 Fukuoka-ken
佐賀県 Saga-ken長崎県 Nagasaki-ken熊本県 Kumamoto-ken大分県 Oita-ken宮崎県 Miyazaki-ken
鹿児島県 Kagoshima-ken沖縄県 Okinawa-ken
平均値 Mean標準偏差 Standard deviation
分子 一般旅券発行件数
指標計算式 Numerators No. of passports issued
Formulae ofindicators 分母 総人口
Denominators Total population (Both sexes)
出典 Reference
107

H.居住 Dwelling1)住宅数 Dwellings
都道府県 持ち家比率 借家比率 民営借家比率 空き家比率
Prefecture Ratio of owned houses Ratio of rented houses Ratio of rented houses owned byprivate sector
Ratio of vacant house
(%) (%) (%)
全国 All Japan
北海道 Hokkaido青森県 Aomori-ken岩手県 Iwate-ken宮城県 Miyagi-ken秋田県 Akita-ken
山形県 Yamagata-ken福島県 Fukushima-ken茨城県 Ibaraki-ken栃木県 Tochigi-ken群馬県 Gumma-ken
埼玉県 Saitama-ken千葉県 Chiba-ken東京都 Tokyo-to神奈川県 Kanagawa-ken新潟県 Niigata-ken
富山県 Toyama-ken石川県 Ishikawa-ken福井県 Fukui-ken山梨県 Yamanashi-ken長野県 Nagano-ken
岐阜県 Gifu-ken静岡県 Shizuoka-ken愛知県 Aichi-ken三重県 Mie-ken滋賀県 Shiga-ken
京都府 Kyoto-fu大阪府 Osaka-fu兵庫県 Hyogo-ken奈良県 Nara-ken和歌山県 Wakayama-ken
鳥取県 Tottori-ken島根県 Shimane-ken岡山県 Okayama-ken広島県 Hiroshima-ken山口県 Yamaguchi-ken
徳島県 Tokushima-ken香川県 Kagawa-ken愛媛県 Ehime-ken高知県 Kochi-ken福岡県 Fukuoka-ken
佐賀県 Saga-ken長崎県 Nagasaki-ken熊本県 Kumamoto-ken大分県 Oita-ken宮崎県 Miyazaki-ken
鹿児島県 Kagoshima-ken沖縄県 Okinawa-ken
平均値 Mean標準偏差 Standard deviation
分子 持ち家数 借家数 民営借家数 空き家数
指標計算式 Numerators No. of owned houses No. of rented houses No. of rented houses owned privately No. of vacant houses
Formulae ofindicators 分母 居住世帯あり住宅数 居住世帯あり住宅数 居住世帯あり住宅数 総住宅数
Denominators Number of dwellings withoccupying households
Number of dwellings withoccupying households
Number of dwellings withoccupying households
Number of dwellings
出典 Reference
空き家比率 着工新設住宅比率 着工新設持ち家比率
Ratio of vacant house Ratio of new constructions of houses to dwellingsoccupied by households
Ratio of new constructions of owned houses
(%) (%) (%)Pref.Code
MeanS.D.
空き家数 着工新設住宅戸数 着工新設持ち家数 分子
No. of vacant houses New construction starts ofdwellings (Total)
New construction starts of dwellings(Owned) 指標計算式
総住宅数 居住世帯あり住宅数 着工新設住宅戸数 分母
Number of dwellings Number of dwellings withoccupying households
New construction starts of dwellings(Total)
出典
都道府県コー
ド
108

H.居住 Dwelling1)住宅数 Dwellings
都道府県 持ち家比率 借家比率 民営借家比率 空き家比率
Prefecture Ratio of owned houses Ratio of rented houses Ratio of rented houses owned byprivate sector
Ratio of vacant house
(%) (%) (%)
全国 All Japan
北海道 Hokkaido青森県 Aomori-ken岩手県 Iwate-ken宮城県 Miyagi-ken秋田県 Akita-ken
山形県 Yamagata-ken福島県 Fukushima-ken茨城県 Ibaraki-ken栃木県 Tochigi-ken群馬県 Gumma-ken
埼玉県 Saitama-ken千葉県 Chiba-ken東京都 Tokyo-to神奈川県 Kanagawa-ken新潟県 Niigata-ken
富山県 Toyama-ken石川県 Ishikawa-ken福井県 Fukui-ken山梨県 Yamanashi-ken長野県 Nagano-ken
岐阜県 Gifu-ken静岡県 Shizuoka-ken愛知県 Aichi-ken三重県 Mie-ken滋賀県 Shiga-ken
京都府 Kyoto-fu大阪府 Osaka-fu兵庫県 Hyogo-ken奈良県 Nara-ken和歌山県 Wakayama-ken
鳥取県 Tottori-ken島根県 Shimane-ken岡山県 Okayama-ken広島県 Hiroshima-ken山口県 Yamaguchi-ken
徳島県 Tokushima-ken香川県 Kagawa-ken愛媛県 Ehime-ken高知県 Kochi-ken福岡県 Fukuoka-ken
佐賀県 Saga-ken長崎県 Nagasaki-ken熊本県 Kumamoto-ken大分県 Oita-ken宮崎県 Miyazaki-ken
鹿児島県 Kagoshima-ken沖縄県 Okinawa-ken
平均値 Mean標準偏差 Standard deviation
分子 持ち家数 借家数 民営借家数 空き家数
指標計算式 Numerators No. of owned houses No. of rented houses No. of rented houses owned privately No. of vacant houses
Formulae ofindicators 分母 居住世帯あり住宅数 居住世帯あり住宅数 居住世帯あり住宅数 総住宅数
Denominators Number of dwellings withoccupying households
Number of dwellings withoccupying households
Number of dwellings withoccupying households
Number of dwellings
出典 Reference
空き家比率 着工新設住宅比率 着工新設持ち家比率
Ratio of vacant house Ratio of new constructions of houses to dwellingsoccupied by households
Ratio of new constructions of owned houses
(%) (%) (%)Pref.Code
MeanS.D.
空き家数 着工新設住宅戸数 着工新設持ち家数 分子
No. of vacant houses New construction starts ofdwellings (Total)
New construction starts of dwellings(Owned) 指標計算式
総住宅数 居住世帯あり住宅数 着工新設住宅戸数 分母
Number of dwellings Number of dwellings withoccupying households
New construction starts of dwellings(Total)
出典
都道府県コー
ド
109
H
居
住
(指標)

都道府県 着工新設貸家比率 一戸建住宅比率 長屋建住宅比率 共同住宅比率
Prefecture Ratio of new constructions of rented houses Ratio of detached houses Ratio of tenement-houses Ratio of apartments
(%) (%) (%)
全国 All Japan
北海道 Hokkaido青森県 Aomori-ken岩手県 Iwate-ken宮城県 Miyagi-ken秋田県 Akita-ken
山形県 Yamagata-ken福島県 Fukushima-ken茨城県 Ibaraki-ken栃木県 Tochigi-ken群馬県 Gumma-ken
埼玉県 Saitama-ken千葉県 Chiba-ken東京都 Tokyo-to神奈川県 Kanagawa-ken新潟県 Niigata-ken
富山県 Toyama-ken石川県 Ishikawa-ken福井県 Fukui-ken山梨県 Yamanashi-ken長野県 Nagano-ken
岐阜県 Gifu-ken静岡県 Shizuoka-ken愛知県 Aichi-ken三重県 Mie-ken滋賀県 Shiga-ken
京都府 Kyoto-fu大阪府 Osaka-fu兵庫県 Hyogo-ken奈良県 Nara-ken和歌山県 Wakayama-ken
鳥取県 Tottori-ken島根県 Shimane-ken岡山県 Okayama-ken広島県 Hiroshima-ken山口県 Yamaguchi-ken
徳島県 Tokushima-ken香川県 Kagawa-ken愛媛県 Ehime-ken高知県 Kochi-ken福岡県 Fukuoka-ken
佐賀県 Saga-ken長崎県 Nagasaki-ken熊本県 Kumamoto-ken大分県 Oita-ken宮崎県 Miyazaki-ken
鹿児島県 Kagoshima-ken沖縄県 Okinawa-ken
平均値 Mean標準偏差 Standard deviation
分子 着工新設貸家数 一戸建住宅数 長屋建住宅数 共同住宅数
指標計算式 Numerators New construction starts of dwellings(Rented)
No. of detached houses (Total) No. of tenement houses (Total) No. of apartments (Total)
Formulae ofindicators 分母 着工新設住宅戸数 居住世帯あり住宅数 居住世帯あり住宅数 居住世帯あり住宅数
Denominators New construction starts of dwellings(Total)
Number of dwellings withoccupying households
Number of dwellings withoccupying households
Number of dwellings withoccupying households
出典 Reference
2)住宅の質 Quality of houses
共同住宅比率 1住宅当たりの敷地面積 持ち家住宅の延べ面積(1住宅当たり)
Ratio of apartments Building area per dwelling Floor area of owned houses (per dwelling)
(%) (㎡) (㎡)Pref.Code
MeanS.D.
※ ※
共同住宅数 分子
No. of apartments (Total) 1住宅当たり敷地面積 1住宅当たり延べ面積(持ち家) 指標計算式
居住世帯あり住宅数 Site area per dwelling Area of floor space per dwelling (Owned houses) 分母
Number of dwellings withoccupying households
出典
都道府県コー
ド
110

都道府県 着工新設貸家比率 一戸建住宅比率 長屋建住宅比率 共同住宅比率
Prefecture Ratio of new constructions of rented houses Ratio of detached houses Ratio of tenement-houses Ratio of apartments
(%) (%) (%)
全国 All Japan
北海道 Hokkaido青森県 Aomori-ken岩手県 Iwate-ken宮城県 Miyagi-ken秋田県 Akita-ken
山形県 Yamagata-ken福島県 Fukushima-ken茨城県 Ibaraki-ken栃木県 Tochigi-ken群馬県 Gumma-ken
埼玉県 Saitama-ken千葉県 Chiba-ken東京都 Tokyo-to神奈川県 Kanagawa-ken新潟県 Niigata-ken
富山県 Toyama-ken石川県 Ishikawa-ken福井県 Fukui-ken山梨県 Yamanashi-ken長野県 Nagano-ken
岐阜県 Gifu-ken静岡県 Shizuoka-ken愛知県 Aichi-ken三重県 Mie-ken滋賀県 Shiga-ken
京都府 Kyoto-fu大阪府 Osaka-fu兵庫県 Hyogo-ken奈良県 Nara-ken和歌山県 Wakayama-ken
鳥取県 Tottori-ken島根県 Shimane-ken岡山県 Okayama-ken広島県 Hiroshima-ken山口県 Yamaguchi-ken
徳島県 Tokushima-ken香川県 Kagawa-ken愛媛県 Ehime-ken高知県 Kochi-ken福岡県 Fukuoka-ken
佐賀県 Saga-ken長崎県 Nagasaki-ken熊本県 Kumamoto-ken大分県 Oita-ken宮崎県 Miyazaki-ken
鹿児島県 Kagoshima-ken沖縄県 Okinawa-ken
平均値 Mean標準偏差 Standard deviation
分子 着工新設貸家数 一戸建住宅数 長屋建住宅数 共同住宅数
指標計算式 Numerators New construction starts of dwellings(Rented)
No. of detached houses (Total) No. of tenement houses (Total) No. of apartments (Total)
Formulae ofindicators 分母 着工新設住宅戸数 居住世帯あり住宅数 居住世帯あり住宅数 居住世帯あり住宅数
Denominators New construction starts of dwellings(Total)
Number of dwellings withoccupying households
Number of dwellings withoccupying households
Number of dwellings withoccupying households
出典 Reference
2)住宅の質 Quality of houses
共同住宅比率 1住宅当たりの敷地面積 持ち家住宅の延べ面積(1住宅当たり)
Ratio of apartments Building area per dwelling Floor area of owned houses (per dwelling)
(%) (㎡) (㎡)Pref.Code
MeanS.D.
※ ※
共同住宅数 分子
No. of apartments (Total) 1住宅当たり敷地面積 1住宅当たり延べ面積(持ち家) 指標計算式
居住世帯あり住宅数 Site area per dwelling Area of floor space per dwelling (Owned houses) 分母
Number of dwellings withoccupying households
出典
都道府県コー
ド
111

都道府県 借家住宅の延べ面積(1住宅当たり)着工新設持ち家住宅の床面積
(1住宅当たり)着工新設貸家住宅の床面積
(1住宅当たり)居住室数(1住宅当たり)
Prefecture Floor area of rented houses (per dwelling) Floor area of newly constructedowned houses (per dwelling)
Floor area of newly constructedrented houses (per dwelling)
Dwelling rooms (per dwelling)
(㎡) (㎡) (㎡)
全国 All Japan
北海道 Hokkaido青森県 Aomori-ken岩手県 Iwate-ken宮城県 Miyagi-ken秋田県 Akita-ken
山形県 Yamagata-ken福島県 Fukushima-ken茨城県 Ibaraki-ken栃木県 Tochigi-ken群馬県 Gumma-ken
埼玉県 Saitama-ken千葉県 Chiba-ken東京都 Tokyo-to神奈川県 Kanagawa-ken新潟県 Niigata-ken
富山県 Toyama-ken石川県 Ishikawa-ken福井県 Fukui-ken山梨県 Yamanashi-ken長野県 Nagano-ken
岐阜県 Gifu-ken静岡県 Shizuoka-ken愛知県 Aichi-ken三重県 Mie-ken滋賀県 Shiga-ken
京都府 Kyoto-fu大阪府 Osaka-fu兵庫県 Hyogo-ken奈良県 Nara-ken和歌山県 Wakayama-ken
鳥取県 Tottori-ken島根県 Shimane-ken岡山県 Okayama-ken広島県 Hiroshima-ken山口県 Yamaguchi-ken
徳島県 Tokushima-ken香川県 Kagawa-ken愛媛県 Ehime-ken高知県 Kochi-ken福岡県 Fukuoka-ken
佐賀県 Saga-ken長崎県 Nagasaki-ken熊本県 Kumamoto-ken大分県 Oita-ken宮崎県 Miyazaki-ken
鹿児島県 Kagoshima-ken沖縄県 Okinawa-ken
平均値 Mean標準偏差 Standard deviation
※
分子 着工新設持ち家床面積 着工新設貸家床面積
指標計算式 Numerators 1住宅当たり延べ面積(借家)Floor area of newly constructed dwellings
(Owned dwellings)Floor area of newly constructed dwellings
(Rented dwellings) 1住宅当たり居住室数
Formulae ofindicators 分母
Area of floor space per dwelling(Rented houses) 着工新設持ち家数 着工新設貸家数 No. of dwelling rooms per dwelling
Denominators New construction starts of dwellings(Owned)
New construction starts of dwellings(Rented)
出典 Reference
居住室数(1住宅当たり) 居住室数(1住宅当たり)(持ち家) 居住室数(1住宅当たり)(借家)
Dwelling rooms (per dwelling) Dwelling rooms of owned houses (per dwelling) Dwelling rooms of rented houses (per dwelling)
(室:number of rooms (室:number of rooms (室:number of roomsPref.Code
MeanS.D.
※ ※ ※
分子
1住宅当たり居住室数 1住宅当たり居住室数(持ち家) 1住宅当たり居住室数(借家) 指標計算式
No. of dwelling rooms per dwelling No. of dwelling rooms per dwelling(Owned houses)
No. of dwelling rooms per dwelling (Rented houses) 分母
出典
都道府県コー
ド
112

都道府県 借家住宅の延べ面積(1住宅当たり)着工新設持ち家住宅の床面積
(1住宅当たり)着工新設貸家住宅の床面積
(1住宅当たり)居住室数(1住宅当たり)
Prefecture Floor area of rented houses (per dwelling) Floor area of newly constructedowned houses (per dwelling)
Floor area of newly constructedrented houses (per dwelling)
Dwelling rooms (per dwelling)
(㎡) (㎡) (㎡)
全国 All Japan
北海道 Hokkaido青森県 Aomori-ken岩手県 Iwate-ken宮城県 Miyagi-ken秋田県 Akita-ken
山形県 Yamagata-ken福島県 Fukushima-ken茨城県 Ibaraki-ken栃木県 Tochigi-ken群馬県 Gumma-ken
埼玉県 Saitama-ken千葉県 Chiba-ken東京都 Tokyo-to神奈川県 Kanagawa-ken新潟県 Niigata-ken
富山県 Toyama-ken石川県 Ishikawa-ken福井県 Fukui-ken山梨県 Yamanashi-ken長野県 Nagano-ken
岐阜県 Gifu-ken静岡県 Shizuoka-ken愛知県 Aichi-ken三重県 Mie-ken滋賀県 Shiga-ken
京都府 Kyoto-fu大阪府 Osaka-fu兵庫県 Hyogo-ken奈良県 Nara-ken和歌山県 Wakayama-ken
鳥取県 Tottori-ken島根県 Shimane-ken岡山県 Okayama-ken広島県 Hiroshima-ken山口県 Yamaguchi-ken
徳島県 Tokushima-ken香川県 Kagawa-ken愛媛県 Ehime-ken高知県 Kochi-ken福岡県 Fukuoka-ken
佐賀県 Saga-ken長崎県 Nagasaki-ken熊本県 Kumamoto-ken大分県 Oita-ken宮崎県 Miyazaki-ken
鹿児島県 Kagoshima-ken沖縄県 Okinawa-ken
平均値 Mean標準偏差 Standard deviation
※
分子 着工新設持ち家床面積 着工新設貸家床面積
指標計算式 Numerators 1住宅当たり延べ面積(借家)Floor area of newly constructed dwellings
(Owned dwellings)Floor area of newly constructed dwellings
(Rented dwellings) 1住宅当たり居住室数
Formulae ofindicators 分母
Area of floor space per dwelling(Rented houses) 着工新設持ち家数 着工新設貸家数 No. of dwelling rooms per dwelling
Denominators New construction starts of dwellings(Owned)
New construction starts of dwellings(Rented)
出典 Reference
居住室数(1住宅当たり) 居住室数(1住宅当たり)(持ち家) 居住室数(1住宅当たり)(借家)
Dwelling rooms (per dwelling) Dwelling rooms of owned houses (per dwelling) Dwelling rooms of rented houses (per dwelling)
(室:number of rooms (室:number of rooms (室:number of roomsPref.Code
MeanS.D.
※ ※ ※
分子
1住宅当たり居住室数 1住宅当たり居住室数(持ち家) 1住宅当たり居住室数(借家) 指標計算式
No. of dwelling rooms per dwelling No. of dwelling rooms per dwelling(Owned houses)
No. of dwelling rooms per dwelling (Rented houses) 分母
出典
都道府県コー
ド
113

都道府県 持ち家住宅の畳数(1人当たり) 借家住宅の畳数(1人当たり)持ち家住宅の居住室の畳数
(1住宅当たり)借家住宅の居住室の畳数(1住宅当たり)
Prefecture Number of tatami of ownedhouses (per capita)
Number of tatami of rentedhouses (per capita)
Tatami units of dwelling rooms of ownedhouses (per dwelling)
(畳:number of tatami units (畳:number of tatami units (畳:number of tatami units
全国 All Japan
北海道 Hokkaido青森県 Aomori-ken岩手県 Iwate-ken宮城県 Miyagi-ken秋田県 Akita-ken
山形県 Yamagata-ken福島県 Fukushima-ken茨城県 Ibaraki-ken栃木県 Tochigi-ken群馬県 Gumma-ken
埼玉県 Saitama-ken千葉県 Chiba-ken東京都 Tokyo-to神奈川県 Kanagawa-ken新潟県 Niigata-ken
富山県 Toyama-ken石川県 Ishikawa-ken福井県 Fukui-ken山梨県 Yamanashi-ken長野県 Nagano-ken
岐阜県 Gifu-ken静岡県 Shizuoka-ken愛知県 Aichi-ken三重県 Mie-ken滋賀県 Shiga-ken
京都府 Kyoto-fu大阪府 Osaka-fu兵庫県 Hyogo-ken奈良県 Nara-ken和歌山県 Wakayama-ken
鳥取県 Tottori-ken島根県 Shimane-ken岡山県 Okayama-ken広島県 Hiroshima-ken山口県 Yamaguchi-ken
徳島県 Tokushima-ken香川県 Kagawa-ken愛媛県 Ehime-ken高知県 Kochi-ken福岡県 Fukuoka-ken
佐賀県 Saga-ken長崎県 Nagasaki-ken熊本県 Kumamoto-ken大分県 Oita-ken宮崎県 Miyazaki-ken
鹿児島県 Kagoshima-ken沖縄県 Okinawa-ken
平均値 Mean標準偏差 Standard deviation
※ ※ ※
分子
指標計算式 Numerators 1人当たり畳数(持ち家・主世帯) 1人当たり畳数(借家・主世帯) 1住宅当たり居住室の畳数(持ち家) 1住宅当たり居住室の畳数(借家)
Formulae ofindicators 分母
Tatami units per person(Owned houses, principal households)
Tatami units per person(Rented houses, principal households)
Tatami units of dwelling rooms per dwelling (Owned houses)
Denominators
出典 Reference(注)項目欄に「*」の付されている項目は,都道府県庁所在市のデータである。
Note:Items with * refer to the cities with prefectural governments.
3)住宅関係費 Cost relating to housing
借家住宅の居住室の畳数(1住宅当たり) 最低居住面積水準以上世帯割合 民営賃貸住宅の家賃(1か月3.3㎡当たり)
Tatami units of dwelling rooms of rentedhouses (per dwelling)
Ratio of households exceeding minimumhousing area standard
Monthly rent, owned by privatecorporations (per 3.3㎡)
(畳:number of tatami units (%) (円:yenPref.Code
MeanS.D.
※ ※
最低居住水準以上の主世帯数 分子
1住宅当たり居住室の畳数(借家)No. of principal households exceeding
minimum housing area standard 3.3㎡当たり家賃(民営賃貸住宅) 指標計算式
Tatami units of dwelling rooms per dwelling(Rented houses) 主世帯数
Monthly rent, owned by private corporations(per 3.3m2) 分母
No. of principal households
出典
都道府県コー
ド
114

都道府県 持ち家住宅の畳数(1人当たり) 借家住宅の畳数(1人当たり)持ち家住宅の居住室の畳数
(1住宅当たり)借家住宅の居住室の畳数(1住宅当たり)
Prefecture Number of tatami of ownedhouses (per capita)
Number of tatami of rentedhouses (per capita)
Tatami units of dwelling rooms of ownedhouses (per dwelling)
(畳:number of tatami units (畳:number of tatami units (畳:number of tatami units
全国 All Japan
北海道 Hokkaido青森県 Aomori-ken岩手県 Iwate-ken宮城県 Miyagi-ken秋田県 Akita-ken
山形県 Yamagata-ken福島県 Fukushima-ken茨城県 Ibaraki-ken栃木県 Tochigi-ken群馬県 Gumma-ken
埼玉県 Saitama-ken千葉県 Chiba-ken東京都 Tokyo-to神奈川県 Kanagawa-ken新潟県 Niigata-ken
富山県 Toyama-ken石川県 Ishikawa-ken福井県 Fukui-ken山梨県 Yamanashi-ken長野県 Nagano-ken
岐阜県 Gifu-ken静岡県 Shizuoka-ken愛知県 Aichi-ken三重県 Mie-ken滋賀県 Shiga-ken
京都府 Kyoto-fu大阪府 Osaka-fu兵庫県 Hyogo-ken奈良県 Nara-ken和歌山県 Wakayama-ken
鳥取県 Tottori-ken島根県 Shimane-ken岡山県 Okayama-ken広島県 Hiroshima-ken山口県 Yamaguchi-ken
徳島県 Tokushima-ken香川県 Kagawa-ken愛媛県 Ehime-ken高知県 Kochi-ken福岡県 Fukuoka-ken
佐賀県 Saga-ken長崎県 Nagasaki-ken熊本県 Kumamoto-ken大分県 Oita-ken宮崎県 Miyazaki-ken
鹿児島県 Kagoshima-ken沖縄県 Okinawa-ken
平均値 Mean標準偏差 Standard deviation
※ ※ ※
分子
指標計算式 Numerators 1人当たり畳数(持ち家・主世帯) 1人当たり畳数(借家・主世帯) 1住宅当たり居住室の畳数(持ち家) 1住宅当たり居住室の畳数(借家)
Formulae ofindicators 分母
Tatami units per person(Owned houses, principal households)
Tatami units per person(Rented houses, principal households)
Tatami units of dwelling rooms per dwelling (Owned houses)
Denominators
出典 Reference(注)項目欄に「*」の付されている項目は,都道府県庁所在市のデータである。
Note:Items with * refer to the cities with prefectural governments.
3)住宅関係費 Cost relating to housing
借家住宅の居住室の畳数(1住宅当たり) 最低居住面積水準以上世帯割合 民営賃貸住宅の家賃(1か月3.3㎡当たり)
Tatami units of dwelling rooms of rentedhouses (per dwelling)
Ratio of households exceeding minimumhousing area standard
Monthly rent, owned by privatecorporations (per 3.3㎡)
(畳:number of tatami units (%) (円:yenPref.Code
MeanS.D.
※ ※
最低居住水準以上の主世帯数 分子
1住宅当たり居住室の畳数(借家)No. of principal households exceeding
minimum housing area standard 3.3㎡当たり家賃(民営賃貸住宅) 指標計算式
Tatami units of dwelling rooms per dwelling(Rented houses) 主世帯数
Monthly rent, owned by private corporations(per 3.3m2) 分母
No. of principal households
出典
都道府県コー
ド
115

4)社会的便益 Social convenience
都道府県着工居住用建築物工事費予定額
(床面積1㎡当たり)上水道給水人口比率 下水道普及率 し尿処理人口比率
Prefecture Planned cost of new dwellingconstructions (per 1㎡)
Ratio of households covered bypiped water supply system
Diffusion rate of sewerage
(千円:thousand yen (%) (%)
全国 All Japan
北海道 Hokkaido青森県 Aomori-ken岩手県 Iwate-ken宮城県 Miyagi-ken秋田県 Akita-ken
山形県 Yamagata-ken福島県 Fukushima-ken茨城県 Ibaraki-ken栃木県 Tochigi-ken群馬県 Gumma-ken
埼玉県 Saitama-ken千葉県 Chiba-ken東京都 Tokyo-to神奈川県 Kanagawa-ken新潟県 Niigata-ken
富山県 Toyama-ken石川県 Ishikawa-ken福井県 Fukui-ken山梨県 Yamanashi-ken長野県 Nagano-ken
岐阜県 Gifu-ken静岡県 Shizuoka-ken愛知県 Aichi-ken三重県 Mie-ken滋賀県 Shiga-ken
京都府 Kyoto-fu大阪府 Osaka-fu兵庫県 Hyogo-ken奈良県 Nara-ken和歌山県 Wakayama-ken
鳥取県 Tottori-ken島根県 Shimane-ken岡山県 Okayama-ken広島県 Hiroshima-ken山口県 Yamaguchi-ken
徳島県 Tokushima-ken香川県 Kagawa-ken愛媛県 Ehime-ken高知県 Kochi-ken福岡県 Fukuoka-ken
佐賀県 Saga-ken長崎県 Nagasaki-ken熊本県 Kumamoto-ken大分県 Oita-ken宮崎県 Miyazaki-ken
鹿児島県 Kagoshima-ken沖縄県 Okinawa-ken
平均値 Mean標準偏差 Standard deviation
分子 着工居住用建築物工事費予定額給水人口
(上水道+簡易水道+専用水道)下水道排水区域人口 非水洗化人口
指標計算式 Numerators Planned construction cost ofconstruction-started residential buildings
Population covered by water supply system, servedby simplified waterworks and exclusive waterworks Population in area covered by sewage system Population covered by waste processing service
Formulae ofindicators 分母 着工居住用建築物床面積 住民基本台帳人口(総数) 住民基本台帳人口(総数) 住民基本台帳人口(総数)
Denominators Floor area of construction-startedresidential buildings
Basic resident register population (Total) Basic resident register population (Total) Basic resident register population (Total)
出典 Reference
し尿処理人口比率 ごみのリサイクル率 ごみ埋立率
Ratio of population covered bywaste processing service
Rate of recycled Ratio of garbage reclamation
(%) (%) (%)Pref.Code
MeanS.D.
※
非水洗化人口 ごみ最終処分量 分子
Population covered by waste processing service ごみのリサイクル率 Final disposal 指標計算式
住民基本台帳人口(総数) Rate of recycled ごみ総排出量 分母
Basic resident register population (Total) Total volume of waste matter (Total)
出典
都道府県コー
ド
116

4)社会的便益 Social convenience
都道府県着工居住用建築物工事費予定額
(床面積1㎡当たり)上水道給水人口比率 下水道普及率 し尿処理人口比率
Prefecture Planned cost of new dwellingconstructions (per 1㎡)
Ratio of households covered bypiped water supply system
Diffusion rate of sewerage
(千円:thousand yen (%) (%)
全国 All Japan
北海道 Hokkaido青森県 Aomori-ken岩手県 Iwate-ken宮城県 Miyagi-ken秋田県 Akita-ken
山形県 Yamagata-ken福島県 Fukushima-ken茨城県 Ibaraki-ken栃木県 Tochigi-ken群馬県 Gumma-ken
埼玉県 Saitama-ken千葉県 Chiba-ken東京都 Tokyo-to神奈川県 Kanagawa-ken新潟県 Niigata-ken
富山県 Toyama-ken石川県 Ishikawa-ken福井県 Fukui-ken山梨県 Yamanashi-ken長野県 Nagano-ken
岐阜県 Gifu-ken静岡県 Shizuoka-ken愛知県 Aichi-ken三重県 Mie-ken滋賀県 Shiga-ken
京都府 Kyoto-fu大阪府 Osaka-fu兵庫県 Hyogo-ken奈良県 Nara-ken和歌山県 Wakayama-ken
鳥取県 Tottori-ken島根県 Shimane-ken岡山県 Okayama-ken広島県 Hiroshima-ken山口県 Yamaguchi-ken
徳島県 Tokushima-ken香川県 Kagawa-ken愛媛県 Ehime-ken高知県 Kochi-ken福岡県 Fukuoka-ken
佐賀県 Saga-ken長崎県 Nagasaki-ken熊本県 Kumamoto-ken大分県 Oita-ken宮崎県 Miyazaki-ken
鹿児島県 Kagoshima-ken沖縄県 Okinawa-ken
平均値 Mean標準偏差 Standard deviation
分子 着工居住用建築物工事費予定額給水人口
(上水道+簡易水道+専用水道)下水道排水区域人口 非水洗化人口
指標計算式 Numerators Planned construction cost ofconstruction-started residential buildings
Population covered by water supply system, servedby simplified waterworks and exclusive waterworks Population in area covered by sewage system Population covered by waste processing service
Formulae ofindicators 分母 着工居住用建築物床面積 住民基本台帳人口(総数) 住民基本台帳人口(総数) 住民基本台帳人口(総数)
Denominators Floor area of construction-startedresidential buildings
Basic resident register population (Total) Basic resident register population (Total) Basic resident register population (Total)
出典 Reference
し尿処理人口比率 ごみのリサイクル率 ごみ埋立率
Ratio of population covered bywaste processing service
Rate of recycled Ratio of garbage reclamation
(%) (%) (%)Pref.Code
MeanS.D.
※
非水洗化人口 ごみ最終処分量 分子
Population covered by waste processing service ごみのリサイクル率 Final disposal 指標計算式
住民基本台帳人口(総数) Rate of recycled ごみ総排出量 分母
Basic resident register population (Total) Total volume of waste matter (Total)
出典
都道府県コー
ド
117

5)生活利便施設 Convenience facilities for daily life
都道府県 小売店数(人口千人当たり)織物・衣服・身の回り品小売店数
(人口千人当たり)飲食料品小売店数(人口千人当たり) 大型小売店数(人口10万人当たり)
Prefecture Retail stores (per 1,000 persons) Dry goods, apparel and accessory retailstores (per 1,000 persons)
Food and drink stores (per 1,000 persons) Large-scale retail stores (per 100,000 persons)
(店:number of stores) (店:number of stores) (店:number of stores)
全国 All Japan
北海道 Hokkaido青森県 Aomori-ken岩手県 Iwate-ken宮城県 Miyagi-ken秋田県 Akita-ken
山形県 Yamagata-ken福島県 Fukushima-ken茨城県 Ibaraki-ken栃木県 Tochigi-ken群馬県 Gumma-ken
埼玉県 Saitama-ken千葉県 Chiba-ken東京都 Tokyo-to神奈川県 Kanagawa-ken新潟県 Niigata-ken
富山県 Toyama-ken石川県 Ishikawa-ken福井県 Fukui-ken山梨県 Yamanashi-ken長野県 Nagano-ken
岐阜県 Gifu-ken静岡県 Shizuoka-ken愛知県 Aichi-ken三重県 Mie-ken滋賀県 Shiga-ken
京都府 Kyoto-fu大阪府 Osaka-fu兵庫県 Hyogo-ken奈良県 Nara-ken和歌山県 Wakayama-ken
鳥取県 Tottori-ken島根県 Shimane-ken岡山県 Okayama-ken広島県 Hiroshima-ken山口県 Yamaguchi-ken
徳島県 Tokushima-ken香川県 Kagawa-ken愛媛県 Ehime-ken高知県 Kochi-ken福岡県 Fukuoka-ken
佐賀県 Saga-ken長崎県 Nagasaki-ken熊本県 Kumamoto-ken大分県 Oita-ken宮崎県 Miyazaki-ken
鹿児島県 Kagoshima-ken沖縄県 Okinawa-ken
平均値 Mean標準偏差 Standard deviation
分子 小売店数 織物・衣服・身の回り品小売店数 飲食料品小売店数 大型小売店数
指標計算式 Numerators No. of retail stores No. of dry goods, apparel andaccessory retail stores
No. of food and drink stores No. of large-scale retail stores
Formulae ofindicators 分母 総人口 総人口 総人口 総人口
Denominators Total population (Both sexes) Total population (Both sexes) Total population (Both sexes) Total population (Both sexes)
出典 Reference
大型小売店数(人口10万人当たり) 百貨店,総合スーパー数(人口10万人当たり)セルフサービス事業所数(人口10万人当たり)
Large-scale retail stores (per 100,000 persons) Department stores and general merchandisestore (per 100,000 persons)
Self-service stores (per 100,000 persons)
(店:number of stores) (店:number of stores) (所:number of storesPref.Code
MeanS.D.
大型小売店数 百貨店,総合スーパー数 セルフサービス事業所数 分子
No. of large-scale retail stores No. of department stores andgeneral merchandise store
No. of self-service stores 指標計算式
総人口 総人口 総人口 分母
Total population (Both sexes) Total population (Both sexes) Total population (Both sexes)
出典
都道府県コー
ド
118

5)生活利便施設 Convenience facilities for daily life
都道府県 小売店数(人口千人当たり)織物・衣服・身の回り品小売店数
(人口千人当たり)飲食料品小売店数(人口千人当たり) 大型小売店数(人口10万人当たり)
Prefecture Retail stores (per 1,000 persons) Dry goods, apparel and accessory retailstores (per 1,000 persons)
Food and drink stores (per 1,000 persons) Large-scale retail stores (per 100,000 persons)
(店:number of stores) (店:number of stores) (店:number of stores)
全国 All Japan
北海道 Hokkaido青森県 Aomori-ken岩手県 Iwate-ken宮城県 Miyagi-ken秋田県 Akita-ken
山形県 Yamagata-ken福島県 Fukushima-ken茨城県 Ibaraki-ken栃木県 Tochigi-ken群馬県 Gumma-ken
埼玉県 Saitama-ken千葉県 Chiba-ken東京都 Tokyo-to神奈川県 Kanagawa-ken新潟県 Niigata-ken
富山県 Toyama-ken石川県 Ishikawa-ken福井県 Fukui-ken山梨県 Yamanashi-ken長野県 Nagano-ken
岐阜県 Gifu-ken静岡県 Shizuoka-ken愛知県 Aichi-ken三重県 Mie-ken滋賀県 Shiga-ken
京都府 Kyoto-fu大阪府 Osaka-fu兵庫県 Hyogo-ken奈良県 Nara-ken和歌山県 Wakayama-ken
鳥取県 Tottori-ken島根県 Shimane-ken岡山県 Okayama-ken広島県 Hiroshima-ken山口県 Yamaguchi-ken
徳島県 Tokushima-ken香川県 Kagawa-ken愛媛県 Ehime-ken高知県 Kochi-ken福岡県 Fukuoka-ken
佐賀県 Saga-ken長崎県 Nagasaki-ken熊本県 Kumamoto-ken大分県 Oita-ken宮崎県 Miyazaki-ken
鹿児島県 Kagoshima-ken沖縄県 Okinawa-ken
平均値 Mean標準偏差 Standard deviation
分子 小売店数 織物・衣服・身の回り品小売店数 飲食料品小売店数 大型小売店数
指標計算式 Numerators No. of retail stores No. of dry goods, apparel andaccessory retail stores
No. of food and drink stores No. of large-scale retail stores
Formulae ofindicators 分母 総人口 総人口 総人口 総人口
Denominators Total population (Both sexes) Total population (Both sexes) Total population (Both sexes) Total population (Both sexes)
出典 Reference
大型小売店数(人口10万人当たり) 百貨店,総合スーパー数(人口10万人当たり)セルフサービス事業所数(人口10万人当たり)
Large-scale retail stores (per 100,000 persons) Department stores and general merchandisestore (per 100,000 persons)
Self-service stores (per 100,000 persons)
(店:number of stores) (店:number of stores) (所:number of storesPref.Code
MeanS.D.
大型小売店数 百貨店,総合スーパー数 セルフサービス事業所数 分子
No. of large-scale retail stores No. of department stores andgeneral merchandise store
No. of self-service stores 指標計算式
総人口 総人口 総人口 分母
Total population (Both sexes) Total population (Both sexes) Total population (Both sexes)
出典
都道府県コー
ド
119

都道府県コンビニエンスストア数(人口10万人当たり)
給油所数(道路実延長100km当たり) 飲食店数(人口千人当たり) 理容・美容所数(人口10万人当たり)
Prefecture Convenience stores (per 100,000 persons) Gas stations(per 100km of real length of roads)
Eating and drinking places (per 1,000 persons) Barbers and beauty shops (per 100,000 persons)
(所:number of stores (箇所:number of gas stations (店:number of places
全国 All Japan
北海道 Hokkaido青森県 Aomori-ken岩手県 Iwate-ken宮城県 Miyagi-ken秋田県 Akita-ken
山形県 Yamagata-ken福島県 Fukushima-ken茨城県 Ibaraki-ken栃木県 Tochigi-ken群馬県 Gumma-ken
埼玉県 Saitama-ken千葉県 Chiba-ken東京都 Tokyo-to神奈川県 Kanagawa-ken新潟県 Niigata-ken
富山県 Toyama-ken石川県 Ishikawa-ken福井県 Fukui-ken山梨県 Yamanashi-ken長野県 Nagano-ken
岐阜県 Gifu-ken静岡県 Shizuoka-ken愛知県 Aichi-ken三重県 Mie-ken滋賀県 Shiga-ken
京都府 Kyoto-fu大阪府 Osaka-fu兵庫県 Hyogo-ken奈良県 Nara-ken和歌山県 Wakayama-ken
鳥取県 Tottori-ken島根県 Shimane-ken岡山県 Okayama-ken広島県 Hiroshima-ken山口県 Yamaguchi-ken
徳島県 Tokushima-ken香川県 Kagawa-ken愛媛県 Ehime-ken高知県 Kochi-ken福岡県 Fukuoka-ken
佐賀県 Saga-ken長崎県 Nagasaki-ken熊本県 Kumamoto-ken大分県 Oita-ken宮崎県 Miyazaki-ken
鹿児島県 Kagoshima-ken沖縄県 Okinawa-ken
平均値 Mean標準偏差 Standard deviation
分子 コンビニエンスストア数 給油所数 飲食店数 理容・美容所数
指標計算式 Numerators Convenience stores No. of gas stations No. of eating and drinking places No. of barbers and beauty shops
Formulae ofindicators 分母 総人口 道路実延長 総人口 総人口
Denominators Total population (Both sexes) Total real length of roads Total population (Both sexes) Total population (Both sexes)
出典 Reference
理容・美容所数(人口10万人当たり) クリーニング所数(人口10万人当たり) 公衆浴場数(人口10万人当たり)
Barbers and beauty shops (per 100,000 persons) Laundries (per 100,000 persons) Public bathhouses (per 100,000 persons)
(所:number of shops (所:number of laundries (所:number of public bathhousesPref.Code
MeanS.D.
理容・美容所数 クリーニング所数 公衆浴場数 分子
No. of barbers and beauty shops No. of laundries No. of public bathhouses 指標計算式
総人口 総人口 総人口 分母
Total population (Both sexes) Total population (Both sexes) Total population (Both sexes)
出典
都道府県コー
ド
120

都道府県コンビニエンスストア数(人口10万人当たり)
給油所数(道路実延長100km当たり) 飲食店数(人口千人当たり) 理容・美容所数(人口10万人当たり)
Prefecture Convenience stores (per 100,000 persons) Gas stations(per 100km of real length of roads)
Eating and drinking places (per 1,000 persons) Barbers and beauty shops (per 100,000 persons)
(所:number of stores (箇所:number of gas stations (店:number of places
全国 All Japan
北海道 Hokkaido青森県 Aomori-ken岩手県 Iwate-ken宮城県 Miyagi-ken秋田県 Akita-ken
山形県 Yamagata-ken福島県 Fukushima-ken茨城県 Ibaraki-ken栃木県 Tochigi-ken群馬県 Gumma-ken
埼玉県 Saitama-ken千葉県 Chiba-ken東京都 Tokyo-to神奈川県 Kanagawa-ken新潟県 Niigata-ken
富山県 Toyama-ken石川県 Ishikawa-ken福井県 Fukui-ken山梨県 Yamanashi-ken長野県 Nagano-ken
岐阜県 Gifu-ken静岡県 Shizuoka-ken愛知県 Aichi-ken三重県 Mie-ken滋賀県 Shiga-ken
京都府 Kyoto-fu大阪府 Osaka-fu兵庫県 Hyogo-ken奈良県 Nara-ken和歌山県 Wakayama-ken
鳥取県 Tottori-ken島根県 Shimane-ken岡山県 Okayama-ken広島県 Hiroshima-ken山口県 Yamaguchi-ken
徳島県 Tokushima-ken香川県 Kagawa-ken愛媛県 Ehime-ken高知県 Kochi-ken福岡県 Fukuoka-ken
佐賀県 Saga-ken長崎県 Nagasaki-ken熊本県 Kumamoto-ken大分県 Oita-ken宮崎県 Miyazaki-ken
鹿児島県 Kagoshima-ken沖縄県 Okinawa-ken
平均値 Mean標準偏差 Standard deviation
分子 コンビニエンスストア数 給油所数 飲食店数 理容・美容所数
指標計算式 Numerators Convenience stores No. of gas stations No. of eating and drinking places No. of barbers and beauty shops
Formulae ofindicators 分母 総人口 道路実延長 総人口 総人口
Denominators Total population (Both sexes) Total real length of roads Total population (Both sexes) Total population (Both sexes)
出典 Reference
理容・美容所数(人口10万人当たり) クリーニング所数(人口10万人当たり) 公衆浴場数(人口10万人当たり)
Barbers and beauty shops (per 100,000 persons) Laundries (per 100,000 persons) Public bathhouses (per 100,000 persons)
(所:number of shops (所:number of laundries (所:number of public bathhousesPref.Code
MeanS.D.
理容・美容所数 クリーニング所数 公衆浴場数 分子
No. of barbers and beauty shops No. of laundries No. of public bathhouses 指標計算式
総人口 総人口 総人口 分母
Total population (Both sexes) Total population (Both sexes) Total population (Both sexes)
出典
都道府県コー
ド
121

6)通信 Communications
都道府県 郵便局数(可住地面積100k㎡当たり) 電話加入数(人口千人当たり) 住宅用電話加入数(人口千人当たり) 公衆電話施設数(人口千人当たり)
Prefecture Post offices (per inhabitable area 100k㎡) Telephones subscribed (per 1,000 persons) Telephones for residence (per 1,000 persons) Public telephones (per 1,000 persons)
(局:number of post offices (加入:subscribers (加入:subscribers
全国 All Japan
北海道 Hokkaido青森県 Aomori-ken岩手県 Iwate-ken宮城県 Miyagi-ken秋田県 Akita-ken
山形県 Yamagata-ken福島県 Fukushima-ken茨城県 Ibaraki-ken栃木県 Tochigi-ken群馬県 Gumma-ken
埼玉県 Saitama-ken千葉県 Chiba-ken東京都 Tokyo-to神奈川県 Kanagawa-ken新潟県 Niigata-ken
富山県 Toyama-ken石川県 Ishikawa-ken福井県 Fukui-ken山梨県 Yamanashi-ken長野県 Nagano-ken
岐阜県 Gifu-ken静岡県 Shizuoka-ken愛知県 Aichi-ken三重県 Mie-ken滋賀県 Shiga-ken
京都府 Kyoto-fu大阪府 Osaka-fu兵庫県 Hyogo-ken奈良県 Nara-ken和歌山県 Wakayama-ken
鳥取県 Tottori-ken島根県 Shimane-ken岡山県 Okayama-ken広島県 Hiroshima-ken山口県 Yamaguchi-ken
徳島県 Tokushima-ken香川県 Kagawa-ken愛媛県 Ehime-ken高知県 Kochi-ken福岡県 Fukuoka-ken
佐賀県 Saga-ken長崎県 Nagasaki-ken熊本県 Kumamoto-ken大分県 Oita-ken宮崎県 Miyazaki-ken
鹿児島県 Kagoshima-ken沖縄県 Okinawa-ken
平均値 Mean標準偏差 Standard deviation
分子 郵便局数 電話加入数 住宅用電話加入数 公衆電話施設数
指標計算式 Numerators No. of post offices No. of telephones subscribed No. of telephones for residence No. of public telephones
Formulae ofindicators 分母 可住地面積 1) 総人口 総人口 総人口
Denominators Inhabitable area 1) Total population (Both sexes) Total population (Both sexes) Total population (Both sexes)
出典 Reference1)可住地面積は総務省統計局にて算出している。1) “Inhabitable area” is calculated by Statistics Bureau, Ministry of Internal Affairs and Communications, Japan.
7)交通 Traffics
公衆電話施設数(人口千人当たり) 携帯電話契約数(人口千人当たり) 道路実延長(総面積1k㎡当たり)
Public telephones (per 1,000 persons) Portable telephone contracts (per 1,000 persons) Total real length of roads (per 1k㎡)
(個:number of public telephones (契約:contractsPref.Code
MeanS.D.
公衆電話施設数 携帯電話契約数 道路実延長 分子
No. of public telephones No. of portable telephone contracts Total real length of roads 指標計算式
総人口 総人口 総面積(北方地域及び竹島を除く) 分母
Total population (Both sexes) Total population (Both sexes) Total land area (Excl. the northern territories andTakeshima)
出典
都道府県コー
ド
122
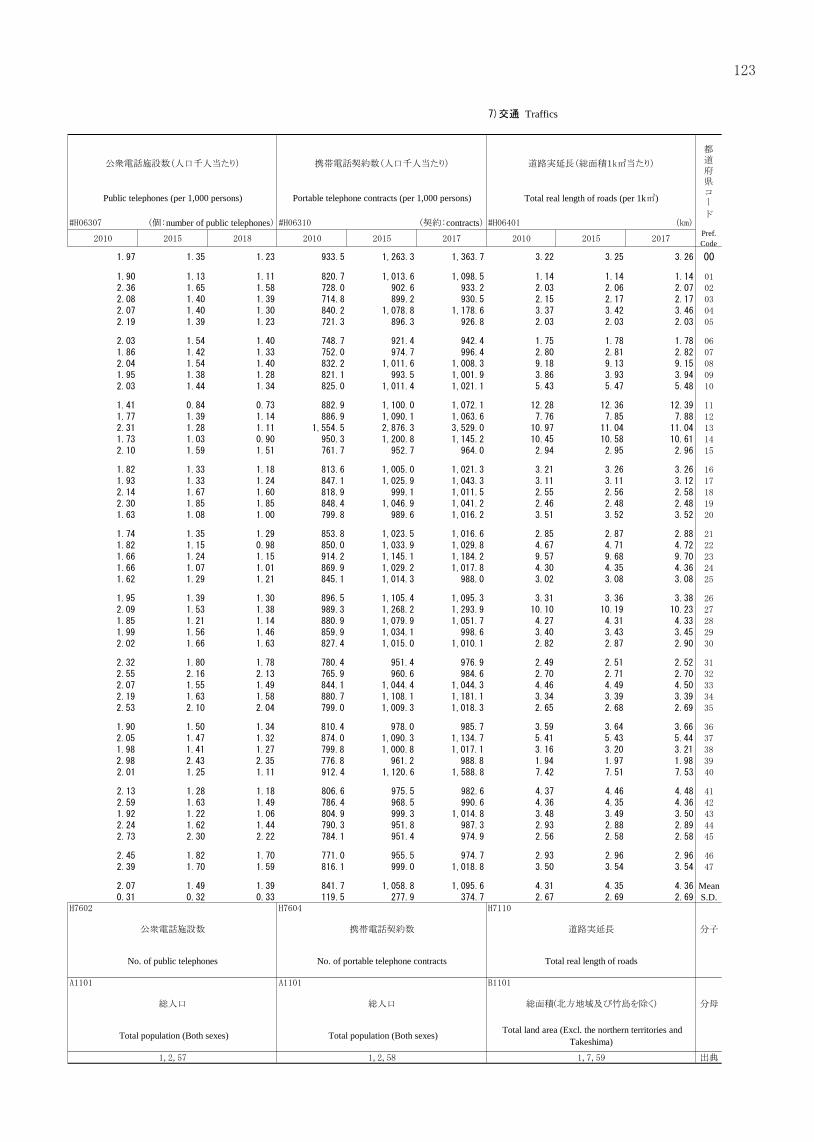
6)通信 Communications
都道府県 郵便局数(可住地面積100k㎡当たり) 電話加入数(人口千人当たり) 住宅用電話加入数(人口千人当たり) 公衆電話施設数(人口千人当たり)
Prefecture Post offices (per inhabitable area 100k㎡) Telephones subscribed (per 1,000 persons) Telephones for residence (per 1,000 persons) Public telephones (per 1,000 persons)
(局:number of post offices (加入:subscribers (加入:subscribers
全国 All Japan
北海道 Hokkaido青森県 Aomori-ken岩手県 Iwate-ken宮城県 Miyagi-ken秋田県 Akita-ken
山形県 Yamagata-ken福島県 Fukushima-ken茨城県 Ibaraki-ken栃木県 Tochigi-ken群馬県 Gumma-ken
埼玉県 Saitama-ken千葉県 Chiba-ken東京都 Tokyo-to神奈川県 Kanagawa-ken新潟県 Niigata-ken
富山県 Toyama-ken石川県 Ishikawa-ken福井県 Fukui-ken山梨県 Yamanashi-ken長野県 Nagano-ken
岐阜県 Gifu-ken静岡県 Shizuoka-ken愛知県 Aichi-ken三重県 Mie-ken滋賀県 Shiga-ken
京都府 Kyoto-fu大阪府 Osaka-fu兵庫県 Hyogo-ken奈良県 Nara-ken和歌山県 Wakayama-ken
鳥取県 Tottori-ken島根県 Shimane-ken岡山県 Okayama-ken広島県 Hiroshima-ken山口県 Yamaguchi-ken
徳島県 Tokushima-ken香川県 Kagawa-ken愛媛県 Ehime-ken高知県 Kochi-ken福岡県 Fukuoka-ken
佐賀県 Saga-ken長崎県 Nagasaki-ken熊本県 Kumamoto-ken大分県 Oita-ken宮崎県 Miyazaki-ken
鹿児島県 Kagoshima-ken沖縄県 Okinawa-ken
平均値 Mean標準偏差 Standard deviation
分子 郵便局数 電話加入数 住宅用電話加入数 公衆電話施設数
指標計算式 Numerators No. of post offices No. of telephones subscribed No. of telephones for residence No. of public telephones
Formulae ofindicators 分母 可住地面積 1) 総人口 総人口 総人口
Denominators Inhabitable area 1) Total population (Both sexes) Total population (Both sexes) Total population (Both sexes)
出典 Reference1)可住地面積は総務省統計局にて算出している。1) “Inhabitable area” is calculated by Statistics Bureau, Ministry of Internal Affairs and Communications, Japan.
7)交通 Traffics
公衆電話施設数(人口千人当たり) 携帯電話契約数(人口千人当たり) 道路実延長(総面積1k㎡当たり)
Public telephones (per 1,000 persons) Portable telephone contracts (per 1,000 persons) Total real length of roads (per 1k㎡)
(個:number of public telephones (契約:contractsPref.Code
MeanS.D.
公衆電話施設数 携帯電話契約数 道路実延長 分子
No. of public telephones No. of portable telephone contracts Total real length of roads 指標計算式
総人口 総人口 総面積(北方地域及び竹島を除く) 分母
Total population (Both sexes) Total population (Both sexes) Total land area (Excl. the northern territories andTakeshima)
出典
都道府県コー
ド
123

都道府県 主要道路実延長(総面積1k㎡当たり) 主要道路舗装率 市町村道舗装率 道路平均交通量
Prefecture Total real length of major roads (per 1k㎡) Ratio of major roads paved Ratio of local roads paved The volume of average traffic
(%) (%)
全国 All Japan
北海道 Hokkaido青森県 Aomori-ken岩手県 Iwate-ken宮城県 Miyagi-ken秋田県 Akita-ken
山形県 Yamagata-ken福島県 Fukushima-ken茨城県 Ibaraki-ken栃木県 Tochigi-ken群馬県 Gumma-ken
埼玉県 Saitama-ken千葉県 Chiba-ken東京都 Tokyo-to神奈川県 Kanagawa-ken新潟県 Niigata-ken
富山県 Toyama-ken石川県 Ishikawa-ken福井県 Fukui-ken山梨県 Yamanashi-ken長野県 Nagano-ken
岐阜県 Gifu-ken静岡県 Shizuoka-ken愛知県 Aichi-ken三重県 Mie-ken滋賀県 Shiga-ken
京都府 Kyoto-fu大阪府 Osaka-fu兵庫県 Hyogo-ken奈良県 Nara-ken和歌山県 Wakayama-ken
鳥取県 Tottori-ken島根県 Shimane-ken岡山県 Okayama-ken広島県 Hiroshima-ken山口県 Yamaguchi-ken
徳島県 Tokushima-ken香川県 Kagawa-ken愛媛県 Ehime-ken高知県 Kochi-ken福岡県 Fukuoka-ken
佐賀県 Saga-ken長崎県 Nagasaki-ken熊本県 Kumamoto-ken大分県 Oita-ken宮崎県 Miyazaki-ken
鹿児島県 Kagoshima-ken沖縄県 Okinawa-ken
平均値 Mean標準偏差 Standard deviation
分子 主要道路実延長 主要道路舗装道路実延長 市町村道舗装道路実延長
指標計算式 Numerators Total real length of roads (Main roads) Total real length of paved roads (Main roads)
Total real length of paved roads (Municipalroads) 道路平均交通量
Formulae ofindicators 分母 総面積(北方地域及び竹島を除く) 主要道路実延長 市町村道実延長 The volume of average traffic
Denominators Total land area (Excl. the northern territoriesand Takeshima)
Total real length of roads (Main roads) Total real length of roads (Municipal roads)
出典 Reference
8)市街地の利用状況 Utilization of urbanized areas
道路平均交通量家計を主に支える者が雇用者である普通世帯比率(通勤時間90分以上)
(普通世帯千世帯当たり)市街化調整区域面積比率
The volume of average traffic Ratio of ordinary households of which main earner is an employee commuting for 90 minutes and over
Ratio of area underrestricted urbanization
(台/12h:quantities/12hour (%)Pref.Code
MeanS.D.
※
家計を主に支える者が雇用者である普通世帯数(通勤時間90分以上)
市街化調整区域面積 分子
道路平均交通量No. of ordinary households of which main earner is an
employee (Commuting for 90 minutes or more)Urbanization control area 指標計算式
The volume of average traffic 普通世帯数 都市計画区域指定面積 分母
No. of ordinary households City planning area
出典
都道府県コー
ド
124

都道府県 主要道路実延長(総面積1k㎡当たり) 主要道路舗装率 市町村道舗装率 道路平均交通量
Prefecture Total real length of major roads (per 1k㎡) Ratio of major roads paved Ratio of local roads paved The volume of average traffic
(%) (%)
全国 All Japan
北海道 Hokkaido青森県 Aomori-ken岩手県 Iwate-ken宮城県 Miyagi-ken秋田県 Akita-ken
山形県 Yamagata-ken福島県 Fukushima-ken茨城県 Ibaraki-ken栃木県 Tochigi-ken群馬県 Gumma-ken
埼玉県 Saitama-ken千葉県 Chiba-ken東京都 Tokyo-to神奈川県 Kanagawa-ken新潟県 Niigata-ken
富山県 Toyama-ken石川県 Ishikawa-ken福井県 Fukui-ken山梨県 Yamanashi-ken長野県 Nagano-ken
岐阜県 Gifu-ken静岡県 Shizuoka-ken愛知県 Aichi-ken三重県 Mie-ken滋賀県 Shiga-ken
京都府 Kyoto-fu大阪府 Osaka-fu兵庫県 Hyogo-ken奈良県 Nara-ken和歌山県 Wakayama-ken
鳥取県 Tottori-ken島根県 Shimane-ken岡山県 Okayama-ken広島県 Hiroshima-ken山口県 Yamaguchi-ken
徳島県 Tokushima-ken香川県 Kagawa-ken愛媛県 Ehime-ken高知県 Kochi-ken福岡県 Fukuoka-ken
佐賀県 Saga-ken長崎県 Nagasaki-ken熊本県 Kumamoto-ken大分県 Oita-ken宮崎県 Miyazaki-ken
鹿児島県 Kagoshima-ken沖縄県 Okinawa-ken
平均値 Mean標準偏差 Standard deviation
分子 主要道路実延長 主要道路舗装道路実延長 市町村道舗装道路実延長
指標計算式 Numerators Total real length of roads (Main roads) Total real length of paved roads (Main roads)
Total real length of paved roads (Municipalroads) 道路平均交通量
Formulae ofindicators 分母 総面積(北方地域及び竹島を除く) 主要道路実延長 市町村道実延長 The volume of average traffic
Denominators Total land area (Excl. the northern territoriesand Takeshima)
Total real length of roads (Main roads) Total real length of roads (Municipal roads)
出典 Reference
8)市街地の利用状況 Utilization of urbanized areas
道路平均交通量家計を主に支える者が雇用者である普通世帯比率(通勤時間90分以上)
(普通世帯千世帯当たり)市街化調整区域面積比率
The volume of average traffic Ratio of ordinary households of which main earner is an employee commuting for 90 minutes and over
Ratio of area underrestricted urbanization
(台/12h:quantities/12hour (%)Pref.Code
MeanS.D.
※
家計を主に支える者が雇用者である普通世帯数(通勤時間90分以上)
市街化調整区域面積 分子
道路平均交通量No. of ordinary households of which main earner is an
employee (Commuting for 90 minutes or more)Urbanization control area 指標計算式
The volume of average traffic 普通世帯数 都市計画区域指定面積 分母
No. of ordinary households City planning area
出典
都道府県コー
ド
125

都道府県 住居専用・住居地域面積比率 住居専用地域面積比率 商業・近隣商業地域面積比率 近隣商業地域面積比率
Prefecture Ratio of exclusive residentialarea and residential area
Ratio of exclusive residential area Ratio of commercial and neighboringcommercial area
Ratio of neighboring commercial area
(%) (%) (%)
全国 All Japan
北海道 Hokkaido青森県 Aomori-ken岩手県 Iwate-ken宮城県 Miyagi-ken秋田県 Akita-ken
山形県 Yamagata-ken福島県 Fukushima-ken茨城県 Ibaraki-ken栃木県 Tochigi-ken群馬県 Gumma-ken
埼玉県 Saitama-ken千葉県 Chiba-ken東京都 Tokyo-to神奈川県 Kanagawa-ken新潟県 Niigata-ken
富山県 Toyama-ken石川県 Ishikawa-ken福井県 Fukui-ken山梨県 Yamanashi-ken長野県 Nagano-ken
岐阜県 Gifu-ken静岡県 Shizuoka-ken愛知県 Aichi-ken三重県 Mie-ken滋賀県 Shiga-ken
京都府 Kyoto-fu大阪府 Osaka-fu兵庫県 Hyogo-ken奈良県 Nara-ken和歌山県 Wakayama-ken
鳥取県 Tottori-ken島根県 Shimane-ken岡山県 Okayama-ken広島県 Hiroshima-ken山口県 Yamaguchi-ken
徳島県 Tokushima-ken香川県 Kagawa-ken愛媛県 Ehime-ken高知県 Kochi-ken福岡県 Fukuoka-ken
佐賀県 Saga-ken長崎県 Nagasaki-ken熊本県 Kumamoto-ken大分県 Oita-ken宮崎県 Miyazaki-ken
鹿児島県 Kagoshima-ken沖縄県 Okinawa-ken
平均値 Mean標準偏差 Standard deviation
分子 住居専用・住居地域面積 住居専用地域面積 商業・近隣商業地域面積 近隣商業地域面積
指標計算式 Numerators Exclusive residential area andresidential area
Exclusive residential area Commercial and neighbouring commercialarea
Neighbouring commercial area
Formulae ofindicators 分母 用途地域面積 用途地域面積 用途地域面積 用途地域面積
Denominators Use district area Use district area Use district area Use district area
出典 Reference
近隣商業地域面積比率 工業・準工業地域面積比率 工業専用地域面積比率
Ratio of neighboring commercial area Ratio of industrial and quasi-industrial area Ratio of exclusive industrial area
(%) (%) (%)Pref.Code
MeanS.D.
近隣商業地域面積 工業・準工業地域面積 工業専用地域面積 分子
Neighbouring commercial area Industrial and quasi-industrial area Exclusive industrial area
用途地域面積 用途地域面積 用途地域面積 分母
Use district area Use district area Use district area
出典
都道府県コー
ド
126

都道府県 住居専用・住居地域面積比率 住居専用地域面積比率 商業・近隣商業地域面積比率 近隣商業地域面積比率
Prefecture Ratio of exclusive residentialarea and residential area
Ratio of exclusive residential area Ratio of commercial and neighboringcommercial area
Ratio of neighboring commercial area
(%) (%) (%)
全国 All Japan
北海道 Hokkaido青森県 Aomori-ken岩手県 Iwate-ken宮城県 Miyagi-ken秋田県 Akita-ken
山形県 Yamagata-ken福島県 Fukushima-ken茨城県 Ibaraki-ken栃木県 Tochigi-ken群馬県 Gumma-ken
埼玉県 Saitama-ken千葉県 Chiba-ken東京都 Tokyo-to神奈川県 Kanagawa-ken新潟県 Niigata-ken
富山県 Toyama-ken石川県 Ishikawa-ken福井県 Fukui-ken山梨県 Yamanashi-ken長野県 Nagano-ken
岐阜県 Gifu-ken静岡県 Shizuoka-ken愛知県 Aichi-ken三重県 Mie-ken滋賀県 Shiga-ken
京都府 Kyoto-fu大阪府 Osaka-fu兵庫県 Hyogo-ken奈良県 Nara-ken和歌山県 Wakayama-ken
鳥取県 Tottori-ken島根県 Shimane-ken岡山県 Okayama-ken広島県 Hiroshima-ken山口県 Yamaguchi-ken
徳島県 Tokushima-ken香川県 Kagawa-ken愛媛県 Ehime-ken高知県 Kochi-ken福岡県 Fukuoka-ken
佐賀県 Saga-ken長崎県 Nagasaki-ken熊本県 Kumamoto-ken大分県 Oita-ken宮崎県 Miyazaki-ken
鹿児島県 Kagoshima-ken沖縄県 Okinawa-ken
平均値 Mean標準偏差 Standard deviation
分子 住居専用・住居地域面積 住居専用地域面積 商業・近隣商業地域面積 近隣商業地域面積
指標計算式 Numerators Exclusive residential area andresidential area
Exclusive residential area Commercial and neighbouring commercialarea
Neighbouring commercial area
Formulae ofindicators 分母 用途地域面積 用途地域面積 用途地域面積 用途地域面積
Denominators Use district area Use district area Use district area Use district area
出典 Reference
近隣商業地域面積比率 工業・準工業地域面積比率 工業専用地域面積比率
Ratio of neighboring commercial area Ratio of industrial and quasi-industrial area Ratio of exclusive industrial area
(%) (%) (%)Pref.Code
MeanS.D.
近隣商業地域面積 工業・準工業地域面積 工業専用地域面積 分子
Neighbouring commercial area Industrial and quasi-industrial area Exclusive industrial area
用途地域面積 用途地域面積 用途地域面積 分母
Use district area Use district area Use district area
出典
都道府県コー
ド
127

9)公園 Public parks
都道府県 都市公園面積(人口1人当たり) 都市公園数(可住地面積100k㎡当たり) 街区公園数(可住地面積100k㎡当たり) 近隣公園数(可住地面積100k㎡当たり)
Prefecture Area of public parks per capita Public parks per inhabitable area 100k㎡ Parks for inhabitantsper inhabitable area 100k㎡
Neighborhood parksper inhabitable area 100k㎡
(㎡) (所:parks (所:parks
全国 All Japan
北海道 Hokkaido青森県 Aomori-ken岩手県 Iwate-ken宮城県 Miyagi-ken秋田県 Akita-ken
山形県 Yamagata-ken福島県 Fukushima-ken茨城県 Ibaraki-ken栃木県 Tochigi-ken群馬県 Gumma-ken
埼玉県 Saitama-ken千葉県 Chiba-ken東京都 Tokyo-to神奈川県 Kanagawa-ken新潟県 Niigata-ken
富山県 Toyama-ken石川県 Ishikawa-ken福井県 Fukui-ken山梨県 Yamanashi-ken長野県 Nagano-ken
岐阜県 Gifu-ken静岡県 Shizuoka-ken愛知県 Aichi-ken三重県 Mie-ken滋賀県 Shiga-ken
京都府 Kyoto-fu大阪府 Osaka-fu兵庫県 Hyogo-ken奈良県 Nara-ken和歌山県 Wakayama-ken
鳥取県 Tottori-ken島根県 Shimane-ken岡山県 Okayama-ken広島県 Hiroshima-ken山口県 Yamaguchi-ken
徳島県 Tokushima-ken香川県 Kagawa-ken愛媛県 Ehime-ken高知県 Kochi-ken福岡県 Fukuoka-ken
佐賀県 Saga-ken長崎県 Nagasaki-ken熊本県 Kumamoto-ken大分県 Oita-ken宮崎県 Miyazaki-ken
鹿児島県 Kagoshima-ken沖縄県 Okinawa-ken
平均値 Mean標準偏差 Standard deviation
分子 都市公園面積 都市公園数 街区公園数 近隣公園数
指標計算式 Numerators Area of public parks No. of public parks No. of parks for inhabitants No. of neighbourhood parks
Formulae ofindicators 分母 総人口 可住地面積 1) 可住地面積 1) 可住地面積 1)
Denominators Total population (Both sexes) Inhabitable area 1) Inhabitable area 1) Inhabitable area 1)
出典 Reference1)可住地面積は総務省統計局にて算出している。1) “Inhabitable area” is calculated by Statistics Bureau, Ministry of Internal Affairs and Communications, Japan.
近隣公園数(可住地面積100k㎡当たり) 運動公園数(可住地面積100k㎡当たり)
Neighborhood parksper inhabitable area 100k㎡
Parks for exerciseper inhabitable area 100k㎡
(所:parks (所:parksPref.Code
MeanS.D.
近隣公園数 運動公園数 分子
No. of neighbourhood parks No. of parks for exercise
可住地面積 1) 可住地面積 1) 分母
Inhabitable area 1) Inhabitable area 1)
出典
都道府県コー
ド
128
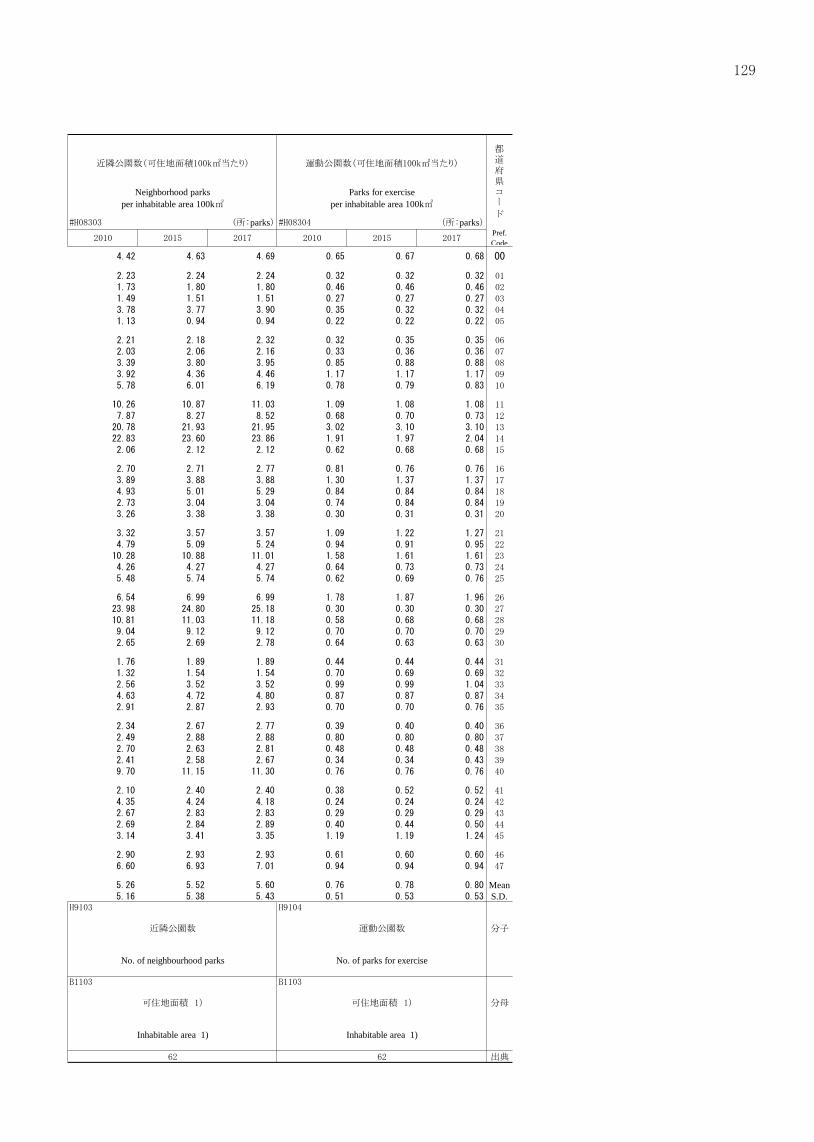
9)公園 Public parks
都道府県 都市公園面積(人口1人当たり) 都市公園数(可住地面積100k㎡当たり) 街区公園数(可住地面積100k㎡当たり) 近隣公園数(可住地面積100k㎡当たり)
Prefecture Area of public parks per capita Public parks per inhabitable area 100k㎡ Parks for inhabitantsper inhabitable area 100k㎡
Neighborhood parksper inhabitable area 100k㎡
(㎡) (所:parks (所:parks
全国 All Japan
北海道 Hokkaido青森県 Aomori-ken岩手県 Iwate-ken宮城県 Miyagi-ken秋田県 Akita-ken
山形県 Yamagata-ken福島県 Fukushima-ken茨城県 Ibaraki-ken栃木県 Tochigi-ken群馬県 Gumma-ken
埼玉県 Saitama-ken千葉県 Chiba-ken東京都 Tokyo-to神奈川県 Kanagawa-ken新潟県 Niigata-ken
富山県 Toyama-ken石川県 Ishikawa-ken福井県 Fukui-ken山梨県 Yamanashi-ken長野県 Nagano-ken
岐阜県 Gifu-ken静岡県 Shizuoka-ken愛知県 Aichi-ken三重県 Mie-ken滋賀県 Shiga-ken
京都府 Kyoto-fu大阪府 Osaka-fu兵庫県 Hyogo-ken奈良県 Nara-ken和歌山県 Wakayama-ken
鳥取県 Tottori-ken島根県 Shimane-ken岡山県 Okayama-ken広島県 Hiroshima-ken山口県 Yamaguchi-ken
徳島県 Tokushima-ken香川県 Kagawa-ken愛媛県 Ehime-ken高知県 Kochi-ken福岡県 Fukuoka-ken
佐賀県 Saga-ken長崎県 Nagasaki-ken熊本県 Kumamoto-ken大分県 Oita-ken宮崎県 Miyazaki-ken
鹿児島県 Kagoshima-ken沖縄県 Okinawa-ken
平均値 Mean標準偏差 Standard deviation
分子 都市公園面積 都市公園数 街区公園数 近隣公園数
指標計算式 Numerators Area of public parks No. of public parks No. of parks for inhabitants No. of neighbourhood parks
Formulae ofindicators 分母 総人口 可住地面積 1) 可住地面積 1) 可住地面積 1)
Denominators Total population (Both sexes) Inhabitable area 1) Inhabitable area 1) Inhabitable area 1)
出典 Reference1)可住地面積は総務省統計局にて算出している。1) “Inhabitable area” is calculated by Statistics Bureau, Ministry of Internal Affairs and Communications, Japan.
近隣公園数(可住地面積100k㎡当たり) 運動公園数(可住地面積100k㎡当たり)
Neighborhood parksper inhabitable area 100k㎡
Parks for exerciseper inhabitable area 100k㎡
(所:parks (所:parksPref.Code
MeanS.D.
近隣公園数 運動公園数 分子
No. of neighbourhood parks No. of parks for exercise
可住地面積 1) 可住地面積 1) 分母
Inhabitable area 1) Inhabitable area 1)
出典
都道府県コー
ド
129
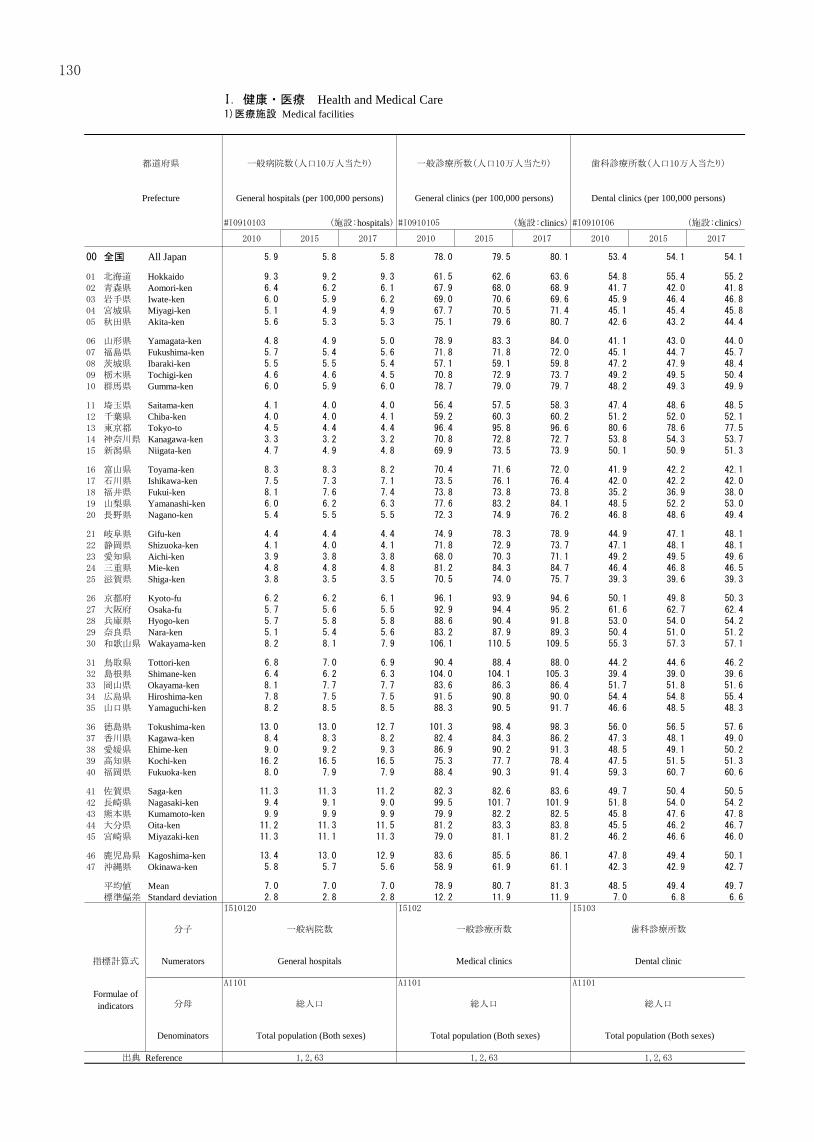
I.健康・医療 Health and Medical Care1)医療施設 Medical facilities
都道府県 一般病院数(人口10万人当たり) 一般診療所数(人口10万人当たり) 歯科診療所数(人口10万人当たり) 精神科病院数(人口10万人当たり)
Prefecture General hospitals (per 100,000 persons) General clinics (per 100,000 persons) Dental clinics (per 100,000 persons) Mental hospitals (per 100,000 persons)
(施設:hospitals (施設:clinics (施設:clinics
全国 All Japan
北海道 Hokkaido青森県 Aomori-ken岩手県 Iwate-ken宮城県 Miyagi-ken秋田県 Akita-ken
山形県 Yamagata-ken福島県 Fukushima-ken茨城県 Ibaraki-ken栃木県 Tochigi-ken群馬県 Gumma-ken
埼玉県 Saitama-ken千葉県 Chiba-ken東京都 Tokyo-to神奈川県 Kanagawa-ken新潟県 Niigata-ken
富山県 Toyama-ken石川県 Ishikawa-ken福井県 Fukui-ken山梨県 Yamanashi-ken長野県 Nagano-ken
岐阜県 Gifu-ken静岡県 Shizuoka-ken愛知県 Aichi-ken三重県 Mie-ken滋賀県 Shiga-ken
京都府 Kyoto-fu大阪府 Osaka-fu兵庫県 Hyogo-ken奈良県 Nara-ken和歌山県 Wakayama-ken
鳥取県 Tottori-ken島根県 Shimane-ken岡山県 Okayama-ken広島県 Hiroshima-ken山口県 Yamaguchi-ken
徳島県 Tokushima-ken香川県 Kagawa-ken愛媛県 Ehime-ken高知県 Kochi-ken福岡県 Fukuoka-ken
佐賀県 Saga-ken長崎県 Nagasaki-ken熊本県 Kumamoto-ken大分県 Oita-ken宮崎県 Miyazaki-ken
鹿児島県 Kagoshima-ken沖縄県 Okinawa-ken
平均値 Mean標準偏差 Standard deviation
分子 一般病院数 一般診療所数 歯科診療所数 精神科病院数
指標計算式 Numerators General hospitals Medical clinics Dental clinic Psychiatric hospitals
Formulae ofindicators 分母 総人口 総人口 総人口 総人口
Denominators Total population (Both sexes) Total population (Both sexes) Total population (Both sexes) Total population (Both sexes)
出典 Reference
精神科病院数(人口10万人当たり) 一般病院病床数(人口10万人当たり) 精神病床数(人口10万人当たり)
Mental hospitals (per 100,000 persons) Beds in general hospitals (per 100,000 persons) Beds for mental diseases (per 100,000 persons)
(施設:hospitals (床:beds (床:bedsPref.Code
MeanS.D.
精神科病院数 一般病院病床数 精神病床数 分子
Psychiatric hospitals No. of beds in general hospitals No. of beds for mental illness 指標計算式
総人口 総人口 総人口 分母
Total population (Both sexes) Total population (Both sexes) Total population (Both sexes)
出典
都道府県コー
ド
130

I.健康・医療 Health and Medical Care1)医療施設 Medical facilities
都道府県 一般病院数(人口10万人当たり) 一般診療所数(人口10万人当たり) 歯科診療所数(人口10万人当たり) 精神科病院数(人口10万人当たり)
Prefecture General hospitals (per 100,000 persons) General clinics (per 100,000 persons) Dental clinics (per 100,000 persons) Mental hospitals (per 100,000 persons)
(施設:hospitals (施設:clinics (施設:clinics
全国 All Japan
北海道 Hokkaido青森県 Aomori-ken岩手県 Iwate-ken宮城県 Miyagi-ken秋田県 Akita-ken
山形県 Yamagata-ken福島県 Fukushima-ken茨城県 Ibaraki-ken栃木県 Tochigi-ken群馬県 Gumma-ken
埼玉県 Saitama-ken千葉県 Chiba-ken東京都 Tokyo-to神奈川県 Kanagawa-ken新潟県 Niigata-ken
富山県 Toyama-ken石川県 Ishikawa-ken福井県 Fukui-ken山梨県 Yamanashi-ken長野県 Nagano-ken
岐阜県 Gifu-ken静岡県 Shizuoka-ken愛知県 Aichi-ken三重県 Mie-ken滋賀県 Shiga-ken
京都府 Kyoto-fu大阪府 Osaka-fu兵庫県 Hyogo-ken奈良県 Nara-ken和歌山県 Wakayama-ken
鳥取県 Tottori-ken島根県 Shimane-ken岡山県 Okayama-ken広島県 Hiroshima-ken山口県 Yamaguchi-ken
徳島県 Tokushima-ken香川県 Kagawa-ken愛媛県 Ehime-ken高知県 Kochi-ken福岡県 Fukuoka-ken
佐賀県 Saga-ken長崎県 Nagasaki-ken熊本県 Kumamoto-ken大分県 Oita-ken宮崎県 Miyazaki-ken
鹿児島県 Kagoshima-ken沖縄県 Okinawa-ken
平均値 Mean標準偏差 Standard deviation
分子 一般病院数 一般診療所数 歯科診療所数 精神科病院数
指標計算式 Numerators General hospitals Medical clinics Dental clinic Psychiatric hospitals
Formulae ofindicators 分母 総人口 総人口 総人口 総人口
Denominators Total population (Both sexes) Total population (Both sexes) Total population (Both sexes) Total population (Both sexes)
出典 Reference
精神科病院数(人口10万人当たり) 一般病院病床数(人口10万人当たり) 精神病床数(人口10万人当たり)
Mental hospitals (per 100,000 persons) Beds in general hospitals (per 100,000 persons) Beds for mental diseases (per 100,000 persons)
(施設:hospitals (床:beds (床:bedsPref.Code
MeanS.D.
精神科病院数 一般病院病床数 精神病床数 分子
Psychiatric hospitals No. of beds in general hospitals No. of beds for mental illness 指標計算式
総人口 総人口 総人口 分母
Total population (Both sexes) Total population (Both sexes) Total population (Both sexes)
出典
都道府県コー
ド
131
I
健康・医療
(指標)

2)医療施設従事者 Persons working at medical establishments
都道府県介護療養型医療施設数
(65歳以上人口10万人当たり)医療施設に従事する医師数
(人口10万人当たり)医療施設に従事する歯科医師数
(人口10万人当たり)
PrefectureNursing and medical treatment homes for theaged (per 100,000 persons 65 years old and
over)
Physicians working at medical establishments(per 100,000 persons)
Dentists working at medical establishments(per 100,000 persons)
(所:number of facilities (人:person (人:person
全国 All Japan
北海道 Hokkaido青森県 Aomori-ken岩手県 Iwate-ken宮城県 Miyagi-ken秋田県 Akita-ken
山形県 Yamagata-ken福島県 Fukushima-ken茨城県 Ibaraki-ken栃木県 Tochigi-ken群馬県 Gumma-ken
埼玉県 Saitama-ken千葉県 Chiba-ken東京都 Tokyo-to神奈川県 Kanagawa-ken新潟県 Niigata-ken
富山県 Toyama-ken石川県 Ishikawa-ken福井県 Fukui-ken山梨県 Yamanashi-ken長野県 Nagano-ken
岐阜県 Gifu-ken静岡県 Shizuoka-ken愛知県 Aichi-ken三重県 Mie-ken滋賀県 Shiga-ken
京都府 Kyoto-fu大阪府 Osaka-fu兵庫県 Hyogo-ken奈良県 Nara-ken和歌山県 Wakayama-ken
鳥取県 Tottori-ken島根県 Shimane-ken岡山県 Okayama-ken広島県 Hiroshima-ken山口県 Yamaguchi-ken
徳島県 Tokushima-ken香川県 Kagawa-ken愛媛県 Ehime-ken高知県 Kochi-ken福岡県 Fukuoka-ken
佐賀県 Saga-ken長崎県 Nagasaki-ken熊本県 Kumamoto-ken大分県 Oita-ken宮崎県 Miyazaki-ken
鹿児島県 Kagoshima-ken沖縄県 Okinawa-ken
平均値 Mean標準偏差 Standard deviation
分子 介護療養型医療施設数 医療施設医師数 医療施設歯科医師数 看護師数+准看護師数(医療従事者)
指標計算式 Numerators No. of nursing and medical treatmenthomes for the aged No. of physicians at medical care institutions No. of dentists at medical facilities
Formulae ofindicators 分母 65歳以上人口 総人口 総人口 総人口
Denominators Total population (65 and over) Total population (Both sexes) Total population (Both sexes) Total population (Both sexes)
出典 Reference
3)一般病院診療体制充実状況 Medical services system in general hospitals
医療施設に従事する看護師・准看護師数(人口10万人当たり)
一般病院常勤医師数(100病床当たり) 一般病院看護師・准看護師数(100病床当たり)
Nurses and assistant nurses working at medicalestablishments
(per 100,000 persons)
Full-time physicians in general hospitals(per 100 beds)
Nurses and assistant nurses in general hospitals (per100 beds)
(人:person (人:person (人:personPref.Code
MeanS.D.
看護師数+准看護師数(医療従事者) 一般病院常勤医師数 一般病院看護師数+一般病院准看護師数 分子
No. of full-time physicians in general hospitals No. of nurses (General hospitals) +No. of assistant nurses (General hospitals) 指標計算式
総人口 一般病院病床数 一般病院病床数 分母
Total population (Both sexes) No. of beds in general hospitals No. of beds in general hospitals
出典
都道府県コー
ド
No. of nurses (Medical establishments) +No. of assistant nurses (Medical establishments)
132

2)医療施設従事者 Persons working at medical establishments
都道府県介護療養型医療施設数
(65歳以上人口10万人当たり)医療施設に従事する医師数
(人口10万人当たり)医療施設に従事する歯科医師数
(人口10万人当たり)
PrefectureNursing and medical treatment homes for theaged (per 100,000 persons 65 years old and
over)
Physicians working at medical establishments(per 100,000 persons)
Dentists working at medical establishments(per 100,000 persons)
(所:number of facilities (人:person (人:person
全国 All Japan
北海道 Hokkaido青森県 Aomori-ken岩手県 Iwate-ken宮城県 Miyagi-ken秋田県 Akita-ken
山形県 Yamagata-ken福島県 Fukushima-ken茨城県 Ibaraki-ken栃木県 Tochigi-ken群馬県 Gumma-ken
埼玉県 Saitama-ken千葉県 Chiba-ken東京都 Tokyo-to神奈川県 Kanagawa-ken新潟県 Niigata-ken
富山県 Toyama-ken石川県 Ishikawa-ken福井県 Fukui-ken山梨県 Yamanashi-ken長野県 Nagano-ken
岐阜県 Gifu-ken静岡県 Shizuoka-ken愛知県 Aichi-ken三重県 Mie-ken滋賀県 Shiga-ken
京都府 Kyoto-fu大阪府 Osaka-fu兵庫県 Hyogo-ken奈良県 Nara-ken和歌山県 Wakayama-ken
鳥取県 Tottori-ken島根県 Shimane-ken岡山県 Okayama-ken広島県 Hiroshima-ken山口県 Yamaguchi-ken
徳島県 Tokushima-ken香川県 Kagawa-ken愛媛県 Ehime-ken高知県 Kochi-ken福岡県 Fukuoka-ken
佐賀県 Saga-ken長崎県 Nagasaki-ken熊本県 Kumamoto-ken大分県 Oita-ken宮崎県 Miyazaki-ken
鹿児島県 Kagoshima-ken沖縄県 Okinawa-ken
平均値 Mean標準偏差 Standard deviation
分子 介護療養型医療施設数 医療施設医師数 医療施設歯科医師数 看護師数+准看護師数(医療従事者)
指標計算式 Numerators No. of nursing and medical treatmenthomes for the aged No. of physicians at medical care institutions No. of dentists at medical facilities
Formulae ofindicators 分母 65歳以上人口 総人口 総人口 総人口
Denominators Total population (65 and over) Total population (Both sexes) Total population (Both sexes) Total population (Both sexes)
出典 Reference
3)一般病院診療体制充実状況 Medical services system in general hospitals
医療施設に従事する看護師・准看護師数(人口10万人当たり)
一般病院常勤医師数(100病床当たり) 一般病院看護師・准看護師数(100病床当たり)
Nurses and assistant nurses working at medicalestablishments
(per 100,000 persons)
Full-time physicians in general hospitals(per 100 beds)
Nurses and assistant nurses in general hospitals (per100 beds)
(人:person (人:person (人:personPref.Code
MeanS.D.
看護師数+准看護師数(医療従事者) 一般病院常勤医師数 一般病院看護師数+一般病院准看護師数 分子
No. of full-time physicians in general hospitals No. of nurses (General hospitals) +No. of assistant nurses (General hospitals) 指標計算式
総人口 一般病院病床数 一般病院病床数 分母
Total population (Both sexes) No. of beds in general hospitals No. of beds in general hospitals
出典
都道府県コー
ド
No. of nurses (Medical establishments) +No. of assistant nurses (Medical establishments)
133

5)医療施設の地域分布
4)一般病院に占める公立の割合 Ratio of public hospitals Regional distribution of medical establishments
都道府県 公立一般病院数の割合 公立一般病院病床数の割合 一般病院数(可住地面積100k㎡当たり) 一般診療所数(可住地面積100k㎡当たり)
Prefecture Ratio of public general hospitals Ratio of beds in public general hospital General hospitals (per 100k㎡ of inhabitable area) General clinics (per 100k㎡ of inhabitable area)
(%) (%) (施設:hospitals
全国 All Japan
北海道 Hokkaido青森県 Aomori-ken岩手県 Iwate-ken宮城県 Miyagi-ken秋田県 Akita-ken
山形県 Yamagata-ken福島県 Fukushima-ken茨城県 Ibaraki-ken栃木県 Tochigi-ken群馬県 Gumma-ken
埼玉県 Saitama-ken千葉県 Chiba-ken東京都 Tokyo-to神奈川県 Kanagawa-ken新潟県 Niigata-ken
富山県 Toyama-ken石川県 Ishikawa-ken福井県 Fukui-ken山梨県 Yamanashi-ken長野県 Nagano-ken
岐阜県 Gifu-ken静岡県 Shizuoka-ken愛知県 Aichi-ken三重県 Mie-ken滋賀県 Shiga-ken
京都府 Kyoto-fu大阪府 Osaka-fu兵庫県 Hyogo-ken奈良県 Nara-ken和歌山県 Wakayama-ken
鳥取県 Tottori-ken島根県 Shimane-ken岡山県 Okayama-ken広島県 Hiroshima-ken山口県 Yamaguchi-ken
徳島県 Tokushima-ken香川県 Kagawa-ken愛媛県 Ehime-ken高知県 Kochi-ken福岡県 Fukuoka-ken
佐賀県 Saga-ken長崎県 Nagasaki-ken熊本県 Kumamoto-ken大分県 Oita-ken宮崎県 Miyazaki-ken
鹿児島県 Kagoshima-ken沖縄県 Okinawa-ken
平均値 Mean標準偏差 Standard deviation
分子 公立一般病院数 公立一般病院病床数 一般病院数 一般診療所数
指標計算式 Numerators No. of general hospitals (Public) No. of beds in general hospitals (Public) General hospitals Medical clinics
Formulae ofindicators 分母 一般病院数 一般病院病床数 可住地面積 1) 可住地面積 1)
Denominators General hospitals No. of beds in general hospitals Inhabitable area 1) Inhabitable area 1)
出典 Reference1)可住地面積は総務省統計局にて算出している。1) “Inhabitable area” is calculated by Statistics Bureau, Ministry of Internal Affairs and Communications, Japan.
6)救急活動 Emergency medical services
一般診療所数(可住地面積100k㎡当たり) 歯科診療所数(可住地面積100k㎡当たり) 救急告示病院・一般診療所数(人口10万人当たり)
General clinics (per 100k㎡ of inhabitable area) Dental clinics (per 100k㎡ of inhabitable area) Emergency hospitals and general clinics(per 100,000 persons)
(施設:clinics (施設:clinics (施設:number of facilitiesPref.Code
MeanS.D.
一般診療所数 歯科診療所数 救急告示病院数+救急告示一般診療所数 分子
Medical clinics Dental clinic No. of emergency notification hospitals +No. of emergency notification general clinics 指標計算式
可住地面積 1) 可住地面積 1) 総人口 分母
Inhabitable area 1) Inhabitable area 1) Total population (Both sexes)
出典
都道府県コー
ド
134

5)医療施設の地域分布
4)一般病院に占める公立の割合 Ratio of public hospitals Regional distribution of medical establishments
都道府県 公立一般病院数の割合 公立一般病院病床数の割合 一般病院数(可住地面積100k㎡当たり) 一般診療所数(可住地面積100k㎡当たり)
Prefecture Ratio of public general hospitals Ratio of beds in public general hospital General hospitals (per 100k㎡ of inhabitable area) General clinics (per 100k㎡ of inhabitable area)
(%) (%) (施設:hospitals
全国 All Japan
北海道 Hokkaido青森県 Aomori-ken岩手県 Iwate-ken宮城県 Miyagi-ken秋田県 Akita-ken
山形県 Yamagata-ken福島県 Fukushima-ken茨城県 Ibaraki-ken栃木県 Tochigi-ken群馬県 Gumma-ken
埼玉県 Saitama-ken千葉県 Chiba-ken東京都 Tokyo-to神奈川県 Kanagawa-ken新潟県 Niigata-ken
富山県 Toyama-ken石川県 Ishikawa-ken福井県 Fukui-ken山梨県 Yamanashi-ken長野県 Nagano-ken
岐阜県 Gifu-ken静岡県 Shizuoka-ken愛知県 Aichi-ken三重県 Mie-ken滋賀県 Shiga-ken
京都府 Kyoto-fu大阪府 Osaka-fu兵庫県 Hyogo-ken奈良県 Nara-ken和歌山県 Wakayama-ken
鳥取県 Tottori-ken島根県 Shimane-ken岡山県 Okayama-ken広島県 Hiroshima-ken山口県 Yamaguchi-ken
徳島県 Tokushima-ken香川県 Kagawa-ken愛媛県 Ehime-ken高知県 Kochi-ken福岡県 Fukuoka-ken
佐賀県 Saga-ken長崎県 Nagasaki-ken熊本県 Kumamoto-ken大分県 Oita-ken宮崎県 Miyazaki-ken
鹿児島県 Kagoshima-ken沖縄県 Okinawa-ken
平均値 Mean標準偏差 Standard deviation
分子 公立一般病院数 公立一般病院病床数 一般病院数 一般診療所数
指標計算式 Numerators No. of general hospitals (Public) No. of beds in general hospitals (Public) General hospitals Medical clinics
Formulae ofindicators 分母 一般病院数 一般病院病床数 可住地面積 1) 可住地面積 1)
Denominators General hospitals No. of beds in general hospitals Inhabitable area 1) Inhabitable area 1)
出典 Reference1)可住地面積は総務省統計局にて算出している。1) “Inhabitable area” is calculated by Statistics Bureau, Ministry of Internal Affairs and Communications, Japan.
6)救急活動 Emergency medical services
一般診療所数(可住地面積100k㎡当たり) 歯科診療所数(可住地面積100k㎡当たり) 救急告示病院・一般診療所数(人口10万人当たり)
General clinics (per 100k㎡ of inhabitable area) Dental clinics (per 100k㎡ of inhabitable area) Emergency hospitals and general clinics(per 100,000 persons)
(施設:clinics (施設:clinics (施設:number of facilitiesPref.Code
MeanS.D.
一般診療所数 歯科診療所数 救急告示病院数+救急告示一般診療所数 分子
Medical clinics Dental clinic No. of emergency notification hospitals +No. of emergency notification general clinics 指標計算式
可住地面積 1) 可住地面積 1) 総人口 分母
Inhabitable area 1) Inhabitable area 1) Total population (Both sexes)
出典
都道府県コー
ド
135

7)医薬品営業施設
Pharmaceutical business facilities
都道府県 救急自動車数(人口10万人当たり) 年間救急出動件数(人口千人当たり) 薬局数(人口10万人当たり) 医薬品販売業数(人口10万人当たり)
Prefecture Ambulances clinics(per 100,000 persons)
Frequency of dispatches of ambulances(per 1,000 persons)
Pharmacies (per 100,000 persons) Drug sellers (per 100,000 persons)
(台:ambulances (件:number of times (所:pharmacies
全国 All Japan
北海道 Hokkaido青森県 Aomori-ken岩手県 Iwate-ken宮城県 Miyagi-ken秋田県 Akita-ken
山形県 Yamagata-ken福島県 Fukushima-ken茨城県 Ibaraki-ken栃木県 Tochigi-ken群馬県 Gumma-ken
埼玉県 Saitama-ken千葉県 Chiba-ken東京都 Tokyo-to神奈川県 Kanagawa-ken新潟県 Niigata-ken
富山県 Toyama-ken石川県 Ishikawa-ken福井県 Fukui-ken山梨県 Yamanashi-ken長野県 Nagano-ken
岐阜県 Gifu-ken静岡県 Shizuoka-ken愛知県 Aichi-ken三重県 Mie-ken滋賀県 Shiga-ken
京都府 Kyoto-fu大阪府 Osaka-fu兵庫県 Hyogo-ken奈良県 Nara-ken和歌山県 Wakayama-ken
鳥取県 Tottori-ken島根県 Shimane-ken岡山県 Okayama-ken広島県 Hiroshima-ken山口県 Yamaguchi-ken
徳島県 Tokushima-ken香川県 Kagawa-ken愛媛県 Ehime-ken高知県 Kochi-ken福岡県 Fukuoka-ken
佐賀県 Saga-ken長崎県 Nagasaki-ken熊本県 Kumamoto-ken大分県 Oita-ken宮崎県 Miyazaki-ken
鹿児島県 Kagoshima-ken沖縄県 Okinawa-ken
平均値 Mean標準偏差 Standard deviation
分子 救急自動車数 救急出動件数 薬局数 医薬品販売業数
指標計算式 Numerators No. of ambulances No. of dispatches of ambulances No. of pharmacies No. of drug sellers
Formulae ofindicators 分母 総人口 総人口 総人口 総人口
Denominators Total population (Both sexes) Total population (Both sexes) Total population (Both sexes) Total population (Both sexes)
出典 Reference1)可住地面積は総務省統計局にて算出している。1) “Inhabitable area” is calculated by Statistics Bureau, Ministry of Internal Affairs and Communications, Japan.
医薬品販売業数(人口10万人当たり) 薬局数(可住地面積100k㎡当たり) 医薬品販売業数(可住地面積100k㎡当たり)
Drug sellers (per 100,000 persons) Pharmacies (per 100k㎡ inhabitable area) Drug sellers (per 100k㎡ inhabitable area)
(所:number of establishments (所:pharmacies (所:number of establishmentsPref.Code
MeanS.D.
医薬品販売業数 薬局数 医薬品販売業数 分子
No. of drug sellers No. of pharmacies No. of drug sellers 指標計算式
総人口 可住地面積 1) 可住地面積 1) 分母
Total population (Both sexes) Inhabitable area 1) Inhabitable area 1)
出典
都道府県コー
ド
136

7)医薬品営業施設
Pharmaceutical business facilities
都道府県 救急自動車数(人口10万人当たり) 年間救急出動件数(人口千人当たり) 薬局数(人口10万人当たり) 医薬品販売業数(人口10万人当たり)
Prefecture Ambulances clinics(per 100,000 persons)
Frequency of dispatches of ambulances(per 1,000 persons)
Pharmacies (per 100,000 persons) Drug sellers (per 100,000 persons)
(台:ambulances (件:number of times (所:pharmacies
全国 All Japan
北海道 Hokkaido青森県 Aomori-ken岩手県 Iwate-ken宮城県 Miyagi-ken秋田県 Akita-ken
山形県 Yamagata-ken福島県 Fukushima-ken茨城県 Ibaraki-ken栃木県 Tochigi-ken群馬県 Gumma-ken
埼玉県 Saitama-ken千葉県 Chiba-ken東京都 Tokyo-to神奈川県 Kanagawa-ken新潟県 Niigata-ken
富山県 Toyama-ken石川県 Ishikawa-ken福井県 Fukui-ken山梨県 Yamanashi-ken長野県 Nagano-ken
岐阜県 Gifu-ken静岡県 Shizuoka-ken愛知県 Aichi-ken三重県 Mie-ken滋賀県 Shiga-ken
京都府 Kyoto-fu大阪府 Osaka-fu兵庫県 Hyogo-ken奈良県 Nara-ken和歌山県 Wakayama-ken
鳥取県 Tottori-ken島根県 Shimane-ken岡山県 Okayama-ken広島県 Hiroshima-ken山口県 Yamaguchi-ken
徳島県 Tokushima-ken香川県 Kagawa-ken愛媛県 Ehime-ken高知県 Kochi-ken福岡県 Fukuoka-ken
佐賀県 Saga-ken長崎県 Nagasaki-ken熊本県 Kumamoto-ken大分県 Oita-ken宮崎県 Miyazaki-ken
鹿児島県 Kagoshima-ken沖縄県 Okinawa-ken
平均値 Mean標準偏差 Standard deviation
分子 救急自動車数 救急出動件数 薬局数 医薬品販売業数
指標計算式 Numerators No. of ambulances No. of dispatches of ambulances No. of pharmacies No. of drug sellers
Formulae ofindicators 分母 総人口 総人口 総人口 総人口
Denominators Total population (Both sexes) Total population (Both sexes) Total population (Both sexes) Total population (Both sexes)
出典 Reference1)可住地面積は総務省統計局にて算出している。1) “Inhabitable area” is calculated by Statistics Bureau, Ministry of Internal Affairs and Communications, Japan.
医薬品販売業数(人口10万人当たり) 薬局数(可住地面積100k㎡当たり) 医薬品販売業数(可住地面積100k㎡当たり)
Drug sellers (per 100,000 persons) Pharmacies (per 100k㎡ inhabitable area) Drug sellers (per 100k㎡ inhabitable area)
(所:number of establishments (所:pharmacies (所:number of establishmentsPref.Code
MeanS.D.
医薬品販売業数 薬局数 医薬品販売業数 分子
No. of drug sellers No. of pharmacies No. of drug sellers 指標計算式
総人口 可住地面積 1) 可住地面積 1) 分母
Total population (Both sexes) Inhabitable area 1) Inhabitable area 1)
出典
都道府県コー
ド
137

8)一般病院診療状況 Medical treatments in general hospitals
都道府県一般病院外来患者数
(常勤医師1人1日当たり)一般病院在院患者数
(常勤医師1人1日当たり)一般病院在院患者数
(看護師・准看護師1人1日当たり)一般病院病床利用率
Prefecture Daily outpatients in generalhospitals (per physician)
Daily inpatients in generalhospitals (per physician)
Daily inpatients ingeneral hospitals (per nurse and assistant
nurse)Ratio of daily occupied beds in general hospitals
(人:person (人:person (人:person
全国 All Japan
北海道 Hokkaido青森県 Aomori-ken岩手県 Iwate-ken宮城県 Miyagi-ken秋田県 Akita-ken
山形県 Yamagata-ken福島県 Fukushima-ken茨城県 Ibaraki-ken栃木県 Tochigi-ken群馬県 Gumma-ken
埼玉県 Saitama-ken千葉県 Chiba-ken東京都 Tokyo-to神奈川県 Kanagawa-ken新潟県 Niigata-ken
富山県 Toyama-ken石川県 Ishikawa-ken福井県 Fukui-ken山梨県 Yamanashi-ken長野県 Nagano-ken
岐阜県 Gifu-ken静岡県 Shizuoka-ken愛知県 Aichi-ken三重県 Mie-ken滋賀県 Shiga-ken
京都府 Kyoto-fu大阪府 Osaka-fu兵庫県 Hyogo-ken奈良県 Nara-ken和歌山県 Wakayama-ken
鳥取県 Tottori-ken島根県 Shimane-ken岡山県 Okayama-ken広島県 Hiroshima-ken山口県 Yamaguchi-ken
徳島県 Tokushima-ken香川県 Kagawa-ken愛媛県 Ehime-ken高知県 Kochi-ken福岡県 Fukuoka-ken
佐賀県 Saga-ken長崎県 Nagasaki-ken熊本県 Kumamoto-ken大分県 Oita-ken宮崎県 Miyazaki-ken
鹿児島県 Kagoshima-ken沖縄県 Okinawa-ken
平均値 Mean標準偏差 Standard deviation
分子 一般病院外来患者延数 一般病院在院患者延数 一般病院在院患者延数 一般病院在院患者延数
指標計算式 Numerators Cumulative total No. of outpatients(General hospitals)
Cumulative total No. of inpatients(General hospitals)
Cumulative total No. of inpatients(General hospitals)
Cumulative total No. of inpatients(General hospitals)
Formulae ofindicators 分母 一般病院常勤医師数×365日 一般病院常勤医師数×365日
(一般病院看護師数+一般病院准看護師数)×365日
一般病院病床数×365日
Denominators No. of full-time physicians in general hospitals×365 days
No. of full-time physicians in generalhospitals ×365 days
(No. of nurses (General hospitals) +No. of assistant nurses (General hospitals)) ×365
days No. of beds in general hospitals ×365 days
出典 Reference
9)精神科病院診療状況
Medical treatments in mental hospitals
一般病院病床利用率 一般病院平均在院日数 精神科病院外来患者数(常勤医師1人1日当たり)
Ratio of daily occupied beds in general hospitals Average length of stay in general hospitals Outpatients in mentalhospitals (per full-time physician)
(%) (日:day (人:personPref.Code
MeanS.D.
一般病院在院患者延数 一般病院在院患者延数 精神科病院外来患者延数 分子
Cumulative total No. of inpatients(General hospitals)
Cumulative total No. of inpatients (General hospitals)
Cumulative total No. of outpatients(Psychiatric hospitals) 指標計算式
一般病院病床数×365日 (一般病院新入院+退院患者数)/2 精神科病院医師数(常勤)×365日 分母
No. of beds in general hospitals ×365 days (No. of new inpatients (General hospitals) +No. of leaving patients (General hospitals))/2
No. of full-time physicians engaged inpsychiatric hospitals ×365 days
出典
都道府県コー
ド
138

8)一般病院診療状況 Medical treatments in general hospitals
都道府県一般病院外来患者数
(常勤医師1人1日当たり)一般病院在院患者数
(常勤医師1人1日当たり)一般病院在院患者数
(看護師・准看護師1人1日当たり)一般病院病床利用率
Prefecture Daily outpatients in generalhospitals (per physician)
Daily inpatients in generalhospitals (per physician)
Daily inpatients ingeneral hospitals (per nurse and assistant
nurse)Ratio of daily occupied beds in general hospitals
(人:person (人:person (人:person
全国 All Japan
北海道 Hokkaido青森県 Aomori-ken岩手県 Iwate-ken宮城県 Miyagi-ken秋田県 Akita-ken
山形県 Yamagata-ken福島県 Fukushima-ken茨城県 Ibaraki-ken栃木県 Tochigi-ken群馬県 Gumma-ken
埼玉県 Saitama-ken千葉県 Chiba-ken東京都 Tokyo-to神奈川県 Kanagawa-ken新潟県 Niigata-ken
富山県 Toyama-ken石川県 Ishikawa-ken福井県 Fukui-ken山梨県 Yamanashi-ken長野県 Nagano-ken
岐阜県 Gifu-ken静岡県 Shizuoka-ken愛知県 Aichi-ken三重県 Mie-ken滋賀県 Shiga-ken
京都府 Kyoto-fu大阪府 Osaka-fu兵庫県 Hyogo-ken奈良県 Nara-ken和歌山県 Wakayama-ken
鳥取県 Tottori-ken島根県 Shimane-ken岡山県 Okayama-ken広島県 Hiroshima-ken山口県 Yamaguchi-ken
徳島県 Tokushima-ken香川県 Kagawa-ken愛媛県 Ehime-ken高知県 Kochi-ken福岡県 Fukuoka-ken
佐賀県 Saga-ken長崎県 Nagasaki-ken熊本県 Kumamoto-ken大分県 Oita-ken宮崎県 Miyazaki-ken
鹿児島県 Kagoshima-ken沖縄県 Okinawa-ken
平均値 Mean標準偏差 Standard deviation
分子 一般病院外来患者延数 一般病院在院患者延数 一般病院在院患者延数 一般病院在院患者延数
指標計算式 Numerators Cumulative total No. of outpatients(General hospitals)
Cumulative total No. of inpatients(General hospitals)
Cumulative total No. of inpatients(General hospitals)
Cumulative total No. of inpatients(General hospitals)
Formulae ofindicators 分母 一般病院常勤医師数×365日 一般病院常勤医師数×365日
(一般病院看護師数+一般病院准看護師数)×365日
一般病院病床数×365日
Denominators No. of full-time physicians in general hospitals×365 days
No. of full-time physicians in generalhospitals ×365 days
(No. of nurses (General hospitals) +No. of assistant nurses (General hospitals)) ×365
days No. of beds in general hospitals ×365 days
出典 Reference
9)精神科病院診療状況
Medical treatments in mental hospitals
一般病院病床利用率 一般病院平均在院日数 精神科病院外来患者数(常勤医師1人1日当たり)
Ratio of daily occupied beds in general hospitals Average length of stay in general hospitals Outpatients in mentalhospitals (per full-time physician)
(%) (日:day (人:personPref.Code
MeanS.D.
一般病院在院患者延数 一般病院在院患者延数 精神科病院外来患者延数 分子
Cumulative total No. of inpatients(General hospitals)
Cumulative total No. of inpatients (General hospitals)
Cumulative total No. of outpatients(Psychiatric hospitals) 指標計算式
一般病院病床数×365日 (一般病院新入院+退院患者数)/2 精神科病院医師数(常勤)×365日 分母
No. of beds in general hospitals ×365 days (No. of new inpatients (General hospitals) +No. of leaving patients (General hospitals))/2
No. of full-time physicians engaged inpsychiatric hospitals ×365 days
出典
都道府県コー
ド
139

都道府県精神科病院在院患者数(常勤医師1人1日当たり)
精神科病院在院患者数(看護師・准看護師1人1日当たり)
精神科病院病床利用率 精神科病院平均在院日数
Prefecture Inpatients in mental hospitals(per full-time physician)
Daily inpatients inmental hospitals (per nurse and assistant
nurses)
Ratio of daily occupiedbeds in mental hospitals
(人:person (人:person (%)
全国 All Japan
北海道 Hokkaido青森県 Aomori-ken岩手県 Iwate-ken宮城県 Miyagi-ken秋田県 Akita-ken
山形県 Yamagata-ken福島県 Fukushima-ken茨城県 Ibaraki-ken栃木県 Tochigi-ken群馬県 Gumma-ken
埼玉県 Saitama-ken千葉県 Chiba-ken東京都 Tokyo-to神奈川県 Kanagawa-ken新潟県 Niigata-ken
富山県 Toyama-ken石川県 Ishikawa-ken福井県 Fukui-ken山梨県 Yamanashi-ken長野県 Nagano-ken
岐阜県 Gifu-ken静岡県 Shizuoka-ken愛知県 Aichi-ken三重県 Mie-ken滋賀県 Shiga-ken
京都府 Kyoto-fu大阪府 Osaka-fu兵庫県 Hyogo-ken奈良県 Nara-ken和歌山県 Wakayama-ken
鳥取県 Tottori-ken島根県 Shimane-ken岡山県 Okayama-ken広島県 Hiroshima-ken山口県 Yamaguchi-ken
徳島県 Tokushima-ken香川県 Kagawa-ken愛媛県 Ehime-ken高知県 Kochi-ken福岡県 Fukuoka-ken
佐賀県 Saga-ken長崎県 Nagasaki-ken熊本県 Kumamoto-ken大分県 Oita-ken宮崎県 Miyazaki-ken
鹿児島県 Kagoshima-ken沖縄県 Okinawa-ken
平均値 Mean標準偏差 Standard deviation
分子 精神科病院在院患者延数 精神科病院在院患者延数 精神科病院在院患者延数 精神科病院在院患者延数
指標計算式 Numerators Cumulative total No. of inpatients(Psychiatric hospitals)
Cumulative total No. of inpatients(Psychiatric hospitals)
Cumulative total No. of inpatients(Psychiatric hospitals)
Formulae ofindicators 分母 精神科病院医師数(常勤)×365日 (精神科病院看護師数+准看護師数)×365日 精神科病院病床数×365日 (精神科病院新入院+退院患者数)/2
Denominators No. of full-time physicians engaged inpsychiatric hospitals ×365 days
(No. of nurses (Psychiatric hospitals) + No. ofassistant nurses (Psychiatric hospitals))
×365 days
No. of beds in psychiatric hospitals ×365days
出典 Reference
10)り病率・有病率等 Morbidity rate
精神科病院平均在院日数 有訴者率(人口千人当たり) 通院者率(人口千人当たり)
Average length of stay inmental hospitals (per inpatient)
Persons who have subjective symptom(per 1,000 persons)
Outpatients(per 1,000 persons)
(日:dayPref.Code
MeanS.D.
※ ※
精神科病院在院患者延数 分子
Cumulative total No. of inpatients(Psychiatric hospitals) 有訴者率 通院者率 指標計算式
(精神科病院新入院+退院患者数)/2 Ratio of persons who have subjective symptoms Ratio of outpatients 分母
(No. of new inpatients (Psychiatric hospitals) +No. of leaving patients (Psychiatric hospitals))/2
出典
都道府県コー
ド
140

都道府県精神科病院在院患者数(常勤医師1人1日当たり)
精神科病院在院患者数(看護師・准看護師1人1日当たり)
精神科病院病床利用率 精神科病院平均在院日数
Prefecture Inpatients in mental hospitals(per full-time physician)
Daily inpatients inmental hospitals (per nurse and assistant
nurses)
Ratio of daily occupiedbeds in mental hospitals
(人:person (人:person (%)
全国 All Japan
北海道 Hokkaido青森県 Aomori-ken岩手県 Iwate-ken宮城県 Miyagi-ken秋田県 Akita-ken
山形県 Yamagata-ken福島県 Fukushima-ken茨城県 Ibaraki-ken栃木県 Tochigi-ken群馬県 Gumma-ken
埼玉県 Saitama-ken千葉県 Chiba-ken東京都 Tokyo-to神奈川県 Kanagawa-ken新潟県 Niigata-ken
富山県 Toyama-ken石川県 Ishikawa-ken福井県 Fukui-ken山梨県 Yamanashi-ken長野県 Nagano-ken
岐阜県 Gifu-ken静岡県 Shizuoka-ken愛知県 Aichi-ken三重県 Mie-ken滋賀県 Shiga-ken
京都府 Kyoto-fu大阪府 Osaka-fu兵庫県 Hyogo-ken奈良県 Nara-ken和歌山県 Wakayama-ken
鳥取県 Tottori-ken島根県 Shimane-ken岡山県 Okayama-ken広島県 Hiroshima-ken山口県 Yamaguchi-ken
徳島県 Tokushima-ken香川県 Kagawa-ken愛媛県 Ehime-ken高知県 Kochi-ken福岡県 Fukuoka-ken
佐賀県 Saga-ken長崎県 Nagasaki-ken熊本県 Kumamoto-ken大分県 Oita-ken宮崎県 Miyazaki-ken
鹿児島県 Kagoshima-ken沖縄県 Okinawa-ken
平均値 Mean標準偏差 Standard deviation
分子 精神科病院在院患者延数 精神科病院在院患者延数 精神科病院在院患者延数 精神科病院在院患者延数
指標計算式 Numerators Cumulative total No. of inpatients(Psychiatric hospitals)
Cumulative total No. of inpatients(Psychiatric hospitals)
Cumulative total No. of inpatients(Psychiatric hospitals)
Formulae ofindicators 分母 精神科病院医師数(常勤)×365日 (精神科病院看護師数+准看護師数)×365日 精神科病院病床数×365日 (精神科病院新入院+退院患者数)/2
Denominators No. of full-time physicians engaged inpsychiatric hospitals ×365 days
(No. of nurses (Psychiatric hospitals) + No. ofassistant nurses (Psychiatric hospitals))
×365 days
No. of beds in psychiatric hospitals ×365days
出典 Reference
10)り病率・有病率等 Morbidity rate
精神科病院平均在院日数 有訴者率(人口千人当たり) 通院者率(人口千人当たり)
Average length of stay inmental hospitals (per inpatient)
Persons who have subjective symptom(per 1,000 persons)
Outpatients(per 1,000 persons)
(日:dayPref.Code
MeanS.D.
※ ※
精神科病院在院患者延数 分子
Cumulative total No. of inpatients(Psychiatric hospitals) 有訴者率 通院者率 指標計算式
(精神科病院新入院+退院患者数)/2 Ratio of persons who have subjective symptoms Ratio of outpatients 分母
(No. of new inpatients (Psychiatric hospitals) +No. of leaving patients (Psychiatric hospitals))/2
出典
都道府県コー
ド
141
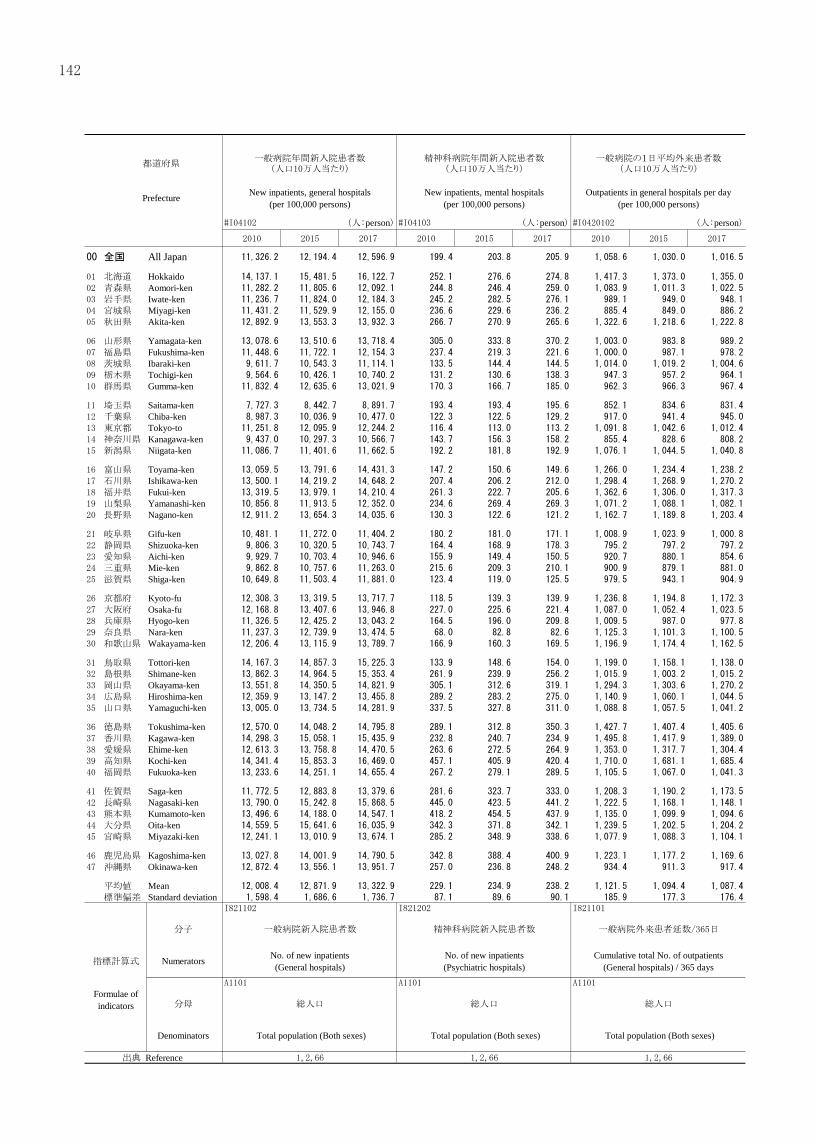
都道府県一般病院年間新入院患者数
(人口10万人当たり)精神科病院年間新入院患者数
(人口10万人当たり)一般病院の1日平均外来患者数
(人口10万人当たり)
Prefecture New inpatients, general hospitals(per 100,000 persons)
New inpatients, mental hospitals(per 100,000 persons)
Outpatients in general hospitals per day(per 100,000 persons)
(人:person (人:person (人:person
全国 All Japan
北海道 Hokkaido青森県 Aomori-ken岩手県 Iwate-ken宮城県 Miyagi-ken秋田県 Akita-ken
山形県 Yamagata-ken福島県 Fukushima-ken茨城県 Ibaraki-ken栃木県 Tochigi-ken群馬県 Gumma-ken
埼玉県 Saitama-ken千葉県 Chiba-ken東京都 Tokyo-to神奈川県 Kanagawa-ken新潟県 Niigata-ken
富山県 Toyama-ken石川県 Ishikawa-ken福井県 Fukui-ken山梨県 Yamanashi-ken長野県 Nagano-ken
岐阜県 Gifu-ken静岡県 Shizuoka-ken愛知県 Aichi-ken三重県 Mie-ken滋賀県 Shiga-ken
京都府 Kyoto-fu大阪府 Osaka-fu兵庫県 Hyogo-ken奈良県 Nara-ken和歌山県 Wakayama-ken
鳥取県 Tottori-ken島根県 Shimane-ken岡山県 Okayama-ken広島県 Hiroshima-ken山口県 Yamaguchi-ken
徳島県 Tokushima-ken香川県 Kagawa-ken愛媛県 Ehime-ken高知県 Kochi-ken福岡県 Fukuoka-ken
佐賀県 Saga-ken長崎県 Nagasaki-ken熊本県 Kumamoto-ken大分県 Oita-ken宮崎県 Miyazaki-ken
鹿児島県 Kagoshima-ken沖縄県 Okinawa-ken
平均値 Mean標準偏差 Standard deviation
分子 一般病院新入院患者数 精神科病院新入院患者数 一般病院外来患者延数/365日 精神科病院外来患者延数/365日
指標計算式 Numerators No. of new inpatients(General hospitals)
No. of new inpatients(Psychiatric hospitals)
Cumulative total No. of outpatients(General hospitals) / 365 days
Formulae ofindicators 分母 総人口 総人口 総人口 総人口
Denominators Total population (Both sexes) Total population (Both sexes) Total population (Both sexes) Total population (Both sexes)
出典 Reference
精神科病院の1日平均外来患者数(人口10万人当たり)
一般病院の1日平均在院患者数(人口10万人当たり)
精神科病院の1日平均在院患者数(人口10万人当たり)
Outpatients in mental hospitals per day(per 100,000 persons)
Inpatients in general hospitals per day(per 100,000 persons)
Inpatients in mental hospitals per day(per 100,000 persons)
(人:person (人:person (人:personPref.Code
MeanS.D.
精神科病院外来患者延数/365日 一般病院在院患者延数/365日 精神科病院在院患者延数/365日 分子
Cumulative total No. of outpatients(Psychiatric hospitals) / 365 days
Cumulative total No. of inpatients(General hospitals) / 365 days
Cumulative total No. of inpatients(Psychiatric hospitals) / 365 days 指標計算式
総人口 総人口 総人口 分母
Total population (Both sexes) Total population (Both sexes) Total population (Both sexes)
出典
都道府県コー
ド
142
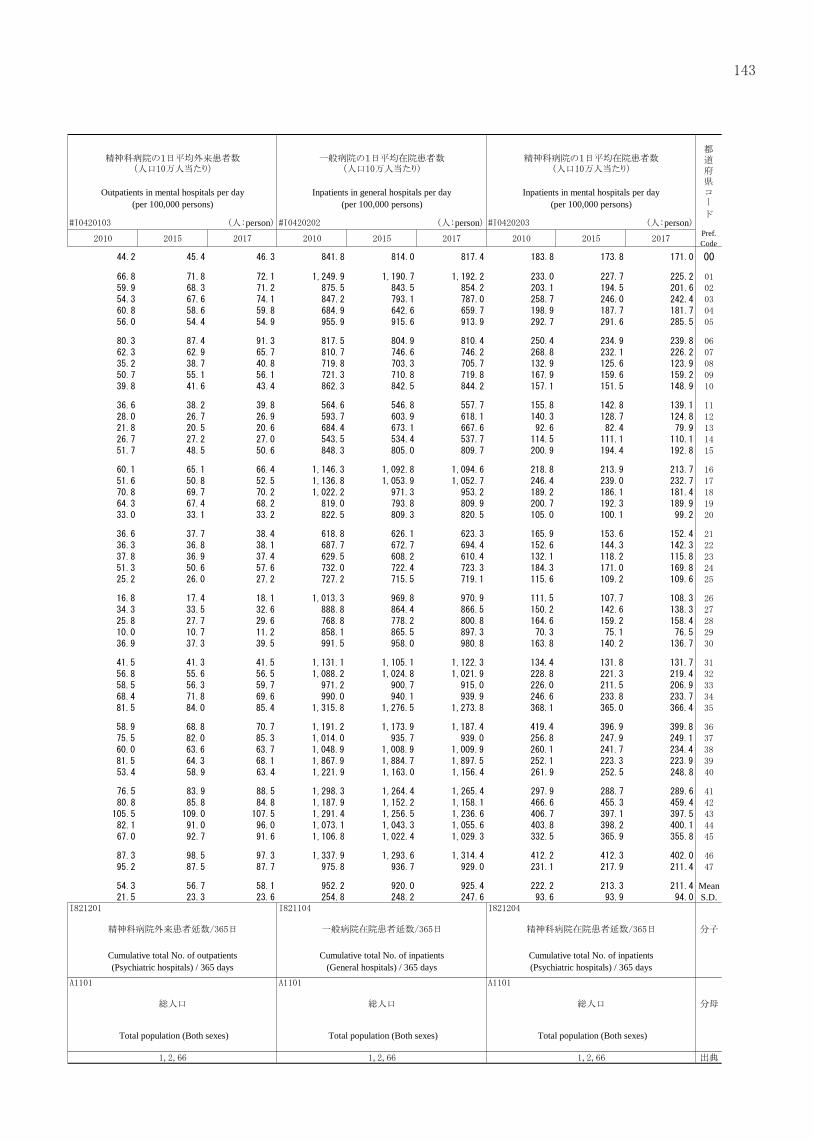
都道府県一般病院年間新入院患者数
(人口10万人当たり)精神科病院年間新入院患者数
(人口10万人当たり)一般病院の1日平均外来患者数
(人口10万人当たり)
Prefecture New inpatients, general hospitals(per 100,000 persons)
New inpatients, mental hospitals(per 100,000 persons)
Outpatients in general hospitals per day(per 100,000 persons)
(人:person (人:person (人:person
全国 All Japan
北海道 Hokkaido青森県 Aomori-ken岩手県 Iwate-ken宮城県 Miyagi-ken秋田県 Akita-ken
山形県 Yamagata-ken福島県 Fukushima-ken茨城県 Ibaraki-ken栃木県 Tochigi-ken群馬県 Gumma-ken
埼玉県 Saitama-ken千葉県 Chiba-ken東京都 Tokyo-to神奈川県 Kanagawa-ken新潟県 Niigata-ken
富山県 Toyama-ken石川県 Ishikawa-ken福井県 Fukui-ken山梨県 Yamanashi-ken長野県 Nagano-ken
岐阜県 Gifu-ken静岡県 Shizuoka-ken愛知県 Aichi-ken三重県 Mie-ken滋賀県 Shiga-ken
京都府 Kyoto-fu大阪府 Osaka-fu兵庫県 Hyogo-ken奈良県 Nara-ken和歌山県 Wakayama-ken
鳥取県 Tottori-ken島根県 Shimane-ken岡山県 Okayama-ken広島県 Hiroshima-ken山口県 Yamaguchi-ken
徳島県 Tokushima-ken香川県 Kagawa-ken愛媛県 Ehime-ken高知県 Kochi-ken福岡県 Fukuoka-ken
佐賀県 Saga-ken長崎県 Nagasaki-ken熊本県 Kumamoto-ken大分県 Oita-ken宮崎県 Miyazaki-ken
鹿児島県 Kagoshima-ken沖縄県 Okinawa-ken
平均値 Mean標準偏差 Standard deviation
分子 一般病院新入院患者数 精神科病院新入院患者数 一般病院外来患者延数/365日 精神科病院外来患者延数/365日
指標計算式 Numerators No. of new inpatients(General hospitals)
No. of new inpatients(Psychiatric hospitals)
Cumulative total No. of outpatients(General hospitals) / 365 days
Formulae ofindicators 分母 総人口 総人口 総人口 総人口
Denominators Total population (Both sexes) Total population (Both sexes) Total population (Both sexes) Total population (Both sexes)
出典 Reference
精神科病院の1日平均外来患者数(人口10万人当たり)
一般病院の1日平均在院患者数(人口10万人当たり)
精神科病院の1日平均在院患者数(人口10万人当たり)
Outpatients in mental hospitals per day(per 100,000 persons)
Inpatients in general hospitals per day(per 100,000 persons)
Inpatients in mental hospitals per day(per 100,000 persons)
(人:person (人:person (人:personPref.Code
MeanS.D.
精神科病院外来患者延数/365日 一般病院在院患者延数/365日 精神科病院在院患者延数/365日 分子
Cumulative total No. of outpatients(Psychiatric hospitals) / 365 days
Cumulative total No. of inpatients(General hospitals) / 365 days
Cumulative total No. of inpatients(Psychiatric hospitals) / 365 days 指標計算式
総人口 総人口 総人口 分母
Total population (Both sexes) Total population (Both sexes) Total population (Both sexes)
出典
都道府県コー
ド
143

11)死亡率・平均余命 Mortality and life expectancy
都道府県標準化死亡率
(基準人口=昭和5年)(人口千人当たり)
平均余命(0歳・男) 平均余命(0歳・女) 平均余命(20歳・男)
Prefecture Standardized death rate (Base periodpopulation = 1930) (per 1,000 persons)
Life expectancy (0 years old, male) Life expectancy (0 years old, female) Life expectancy (20 years old, male)
(年:years (年:years
全国 All Japan
北海道 Hokkaido青森県 Aomori-ken岩手県 Iwate-ken宮城県 Miyagi-ken秋田県 Akita-ken
山形県 Yamagata-ken福島県 Fukushima-ken茨城県 Ibaraki-ken栃木県 Tochigi-ken群馬県 Gumma-ken
埼玉県 Saitama-ken千葉県 Chiba-ken東京都 Tokyo-to神奈川県 Kanagawa-ken新潟県 Niigata-ken
富山県 Toyama-ken石川県 Ishikawa-ken福井県 Fukui-ken山梨県 Yamanashi-ken長野県 Nagano-ken
岐阜県 Gifu-ken静岡県 Shizuoka-ken愛知県 Aichi-ken三重県 Mie-ken滋賀県 Shiga-ken
京都府 Kyoto-fu大阪府 Osaka-fu兵庫県 Hyogo-ken奈良県 Nara-ken和歌山県 Wakayama-ken
鳥取県 Tottori-ken島根県 Shimane-ken岡山県 Okayama-ken広島県 Hiroshima-ken山口県 Yamaguchi-ken
徳島県 Tokushima-ken香川県 Kagawa-ken愛媛県 Ehime-ken高知県 Kochi-ken福岡県 Fukuoka-ken
佐賀県 Saga-ken長崎県 Nagasaki-ken熊本県 Kumamoto-ken大分県 Oita-ken宮崎県 Miyazaki-ken
鹿児島県 Kagoshima-ken沖縄県 Okinawa-ken
平均値 Mean標準偏差 Standard deviation
※ ※ ※
分子
指標計算式 Numerators 標準化死亡率(日本人) 平均余命(0歳)(男) 平均余命(0歳)(女) 平均余命(20歳)(男)
Formulae ofindicators 分母 Standardized death rate (Japanese) Life expectancy (0 yrs., male) Life expectancy (0 yrs., female) Life expectancy (20 yrs., male)
Denominators
出典 Reference
平均余命(20歳・男) 平均余命(20歳・女) 平均余命(65歳・男)
Life expectancy (20 years old, male) Life expectancy (20 years old, female) Life expectancy (65 years old, male)
(年:years (年:years (年:yearsPref.Code
MeanS.D.
※ ※ ※
分子
平均余命(20歳)(男) 平均余命(20歳)(女) 平均余命(65歳)(男) 指標計算式
Life expectancy (20 yrs., male) Life expectancy (20 yrs., female) Life expectancy (65 yrs., male) 分母
出典
都道府県コー
ド
144
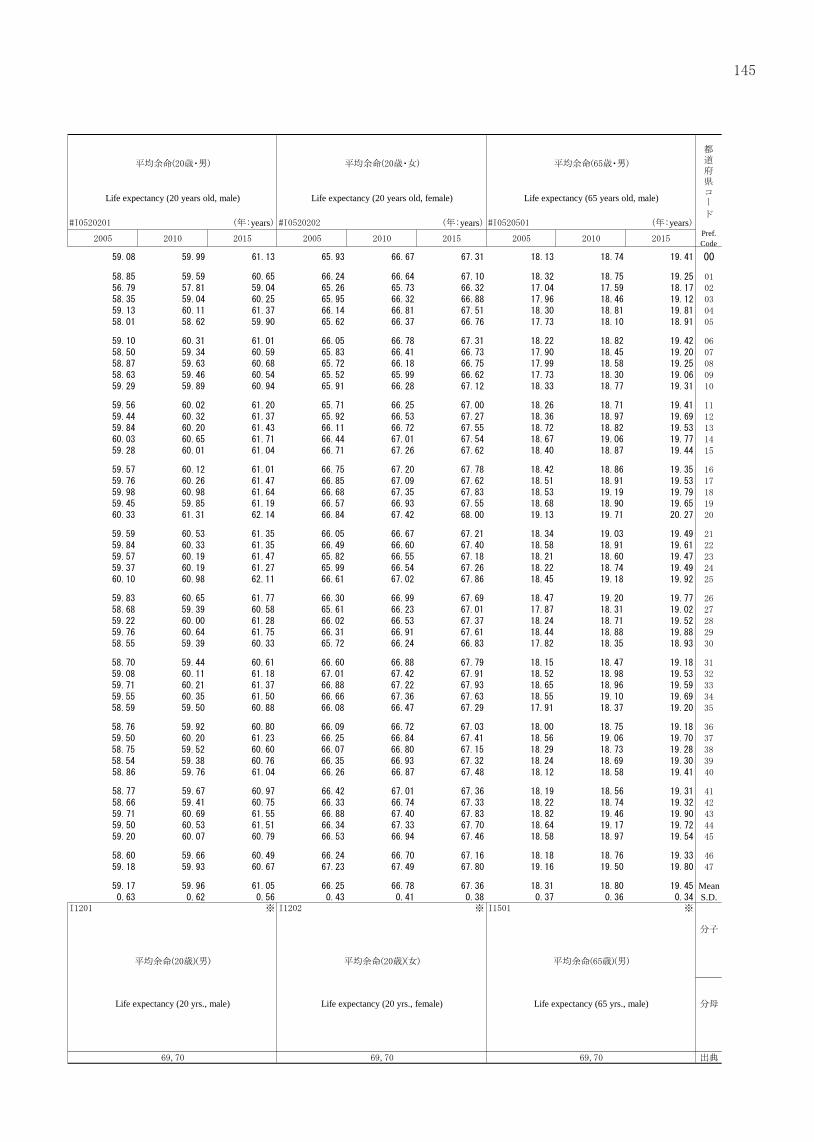
11)死亡率・平均余命 Mortality and life expectancy
都道府県標準化死亡率
(基準人口=昭和5年)(人口千人当たり)
平均余命(0歳・男) 平均余命(0歳・女) 平均余命(20歳・男)
Prefecture Standardized death rate (Base periodpopulation = 1930) (per 1,000 persons)
Life expectancy (0 years old, male) Life expectancy (0 years old, female) Life expectancy (20 years old, male)
(年:years (年:years
全国 All Japan
北海道 Hokkaido青森県 Aomori-ken岩手県 Iwate-ken宮城県 Miyagi-ken秋田県 Akita-ken
山形県 Yamagata-ken福島県 Fukushima-ken茨城県 Ibaraki-ken栃木県 Tochigi-ken群馬県 Gumma-ken
埼玉県 Saitama-ken千葉県 Chiba-ken東京都 Tokyo-to神奈川県 Kanagawa-ken新潟県 Niigata-ken
富山県 Toyama-ken石川県 Ishikawa-ken福井県 Fukui-ken山梨県 Yamanashi-ken長野県 Nagano-ken
岐阜県 Gifu-ken静岡県 Shizuoka-ken愛知県 Aichi-ken三重県 Mie-ken滋賀県 Shiga-ken
京都府 Kyoto-fu大阪府 Osaka-fu兵庫県 Hyogo-ken奈良県 Nara-ken和歌山県 Wakayama-ken
鳥取県 Tottori-ken島根県 Shimane-ken岡山県 Okayama-ken広島県 Hiroshima-ken山口県 Yamaguchi-ken
徳島県 Tokushima-ken香川県 Kagawa-ken愛媛県 Ehime-ken高知県 Kochi-ken福岡県 Fukuoka-ken
佐賀県 Saga-ken長崎県 Nagasaki-ken熊本県 Kumamoto-ken大分県 Oita-ken宮崎県 Miyazaki-ken
鹿児島県 Kagoshima-ken沖縄県 Okinawa-ken
平均値 Mean標準偏差 Standard deviation
※ ※ ※
分子
指標計算式 Numerators 標準化死亡率(日本人) 平均余命(0歳)(男) 平均余命(0歳)(女) 平均余命(20歳)(男)
Formulae ofindicators 分母 Standardized death rate (Japanese) Life expectancy (0 yrs., male) Life expectancy (0 yrs., female) Life expectancy (20 yrs., male)
Denominators
出典 Reference
平均余命(20歳・男) 平均余命(20歳・女) 平均余命(65歳・男)
Life expectancy (20 years old, male) Life expectancy (20 years old, female) Life expectancy (65 years old, male)
(年:years (年:years (年:yearsPref.Code
MeanS.D.
※ ※ ※
分子
平均余命(20歳)(男) 平均余命(20歳)(女) 平均余命(65歳)(男) 指標計算式
Life expectancy (20 yrs., male) Life expectancy (20 yrs., female) Life expectancy (65 yrs., male) 分母
出典
都道府県コー
ド
145

12)死因別死亡者 Deaths by causes
都道府県 平均余命(65歳・女)生活習慣病による死亡者数
(人口10万人当たり)悪性新生物(腫瘍)による死亡者数
(人口10万人当たり)糖尿病による死亡者数(人口10万人当たり)
Prefecture Life expectancy(65 years old, female)
Deaths caused by geriatric diseases(per 100,000 persons)
Deaths caused by malignant neoplasms(per 100,000 persons)
(年:years (人:person (人:person
全国 All Japan
北海道 Hokkaido青森県 Aomori-ken岩手県 Iwate-ken宮城県 Miyagi-ken秋田県 Akita-ken
山形県 Yamagata-ken福島県 Fukushima-ken茨城県 Ibaraki-ken栃木県 Tochigi-ken群馬県 Gumma-ken
埼玉県 Saitama-ken千葉県 Chiba-ken東京都 Tokyo-to神奈川県 Kanagawa-ken新潟県 Niigata-ken
富山県 Toyama-ken石川県 Ishikawa-ken福井県 Fukui-ken山梨県 Yamanashi-ken長野県 Nagano-ken
岐阜県 Gifu-ken静岡県 Shizuoka-ken愛知県 Aichi-ken三重県 Mie-ken滋賀県 Shiga-ken
京都府 Kyoto-fu大阪府 Osaka-fu兵庫県 Hyogo-ken奈良県 Nara-ken和歌山県 Wakayama-ken
鳥取県 Tottori-ken島根県 Shimane-ken岡山県 Okayama-ken広島県 Hiroshima-ken山口県 Yamaguchi-ken
徳島県 Tokushima-ken香川県 Kagawa-ken愛媛県 Ehime-ken高知県 Kochi-ken福岡県 Fukuoka-ken
佐賀県 Saga-ken長崎県 Nagasaki-ken熊本県 Kumamoto-ken大分県 Oita-ken宮崎県 Miyazaki-ken
鹿児島県 Kagoshima-ken沖縄県 Okinawa-ken
平均値 Mean標準偏差 Standard deviation
※
分子 生活習慣病による死亡者数 悪性新生物(腫瘍)による死亡者数 糖尿病による死亡者数
指標計算式 Numerators Lifestyle diseases Malignant neoplasms Diabetes mellitus
Formulae ofindicators 分母 Life expectancy (65 yrs., female) 日本人人口 日本人人口 日本人人口
Denominators Japanese population (Both sexes) Japanese population (Both sexes) Japanese population (Both sexes)
出典 Reference
平均余命(65歳)(女)
糖尿病による死亡者数(人口10万人当たり)
高血圧性疾患による死亡者数(人口10万人当たり)
心疾患(高血圧性を除く)による死亡者数(人口10万人当たり)
Deaths caused by diabetes mellitus(per 100,000 persons)
Deaths caused by hypertensive diseases(per 100,000 persons)
Deaths caused by heart diseases (excludinghypertensive heart diseases) (per 100,000 persons)
(人:person (人:person (人:personPref.Code
MeanS.D.
糖尿病による死亡者数 高血圧性疾患による死亡者数 心疾患(高血圧性を除く)による死亡者数 分子
Diabetes mellitus Hypertensive diseases Heart diseases (Excl. hypertensive) 指標計算式
日本人人口 日本人人口 日本人人口 分母
Japanese population (Both sexes) Japanese population (Both sexes) Japanese population (Both sexes)
出典
都道府県コー
ド
146

12)死因別死亡者 Deaths by causes
都道府県 平均余命(65歳・女)生活習慣病による死亡者数
(人口10万人当たり)悪性新生物(腫瘍)による死亡者数
(人口10万人当たり)糖尿病による死亡者数(人口10万人当たり)
Prefecture Life expectancy(65 years old, female)
Deaths caused by geriatric diseases(per 100,000 persons)
Deaths caused by malignant neoplasms(per 100,000 persons)
(年:years (人:person (人:person
全国 All Japan
北海道 Hokkaido青森県 Aomori-ken岩手県 Iwate-ken宮城県 Miyagi-ken秋田県 Akita-ken
山形県 Yamagata-ken福島県 Fukushima-ken茨城県 Ibaraki-ken栃木県 Tochigi-ken群馬県 Gumma-ken
埼玉県 Saitama-ken千葉県 Chiba-ken東京都 Tokyo-to神奈川県 Kanagawa-ken新潟県 Niigata-ken
富山県 Toyama-ken石川県 Ishikawa-ken福井県 Fukui-ken山梨県 Yamanashi-ken長野県 Nagano-ken
岐阜県 Gifu-ken静岡県 Shizuoka-ken愛知県 Aichi-ken三重県 Mie-ken滋賀県 Shiga-ken
京都府 Kyoto-fu大阪府 Osaka-fu兵庫県 Hyogo-ken奈良県 Nara-ken和歌山県 Wakayama-ken
鳥取県 Tottori-ken島根県 Shimane-ken岡山県 Okayama-ken広島県 Hiroshima-ken山口県 Yamaguchi-ken
徳島県 Tokushima-ken香川県 Kagawa-ken愛媛県 Ehime-ken高知県 Kochi-ken福岡県 Fukuoka-ken
佐賀県 Saga-ken長崎県 Nagasaki-ken熊本県 Kumamoto-ken大分県 Oita-ken宮崎県 Miyazaki-ken
鹿児島県 Kagoshima-ken沖縄県 Okinawa-ken
平均値 Mean標準偏差 Standard deviation
※
分子 生活習慣病による死亡者数 悪性新生物(腫瘍)による死亡者数 糖尿病による死亡者数
指標計算式 Numerators Lifestyle diseases Malignant neoplasms Diabetes mellitus
Formulae ofindicators 分母 Life expectancy (65 yrs., female) 日本人人口 日本人人口 日本人人口
Denominators Japanese population (Both sexes) Japanese population (Both sexes) Japanese population (Both sexes)
出典 Reference
平均余命(65歳)(女)
糖尿病による死亡者数(人口10万人当たり)
高血圧性疾患による死亡者数(人口10万人当たり)
心疾患(高血圧性を除く)による死亡者数(人口10万人当たり)
Deaths caused by diabetes mellitus(per 100,000 persons)
Deaths caused by hypertensive diseases(per 100,000 persons)
Deaths caused by heart diseases (excludinghypertensive heart diseases) (per 100,000 persons)
(人:person (人:person (人:personPref.Code
MeanS.D.
糖尿病による死亡者数 高血圧性疾患による死亡者数 心疾患(高血圧性を除く)による死亡者数 分子
Diabetes mellitus Hypertensive diseases Heart diseases (Excl. hypertensive) 指標計算式
日本人人口 日本人人口 日本人人口 分母
Japanese population (Both sexes) Japanese population (Both sexes) Japanese population (Both sexes)
出典
都道府県コー
ド
147
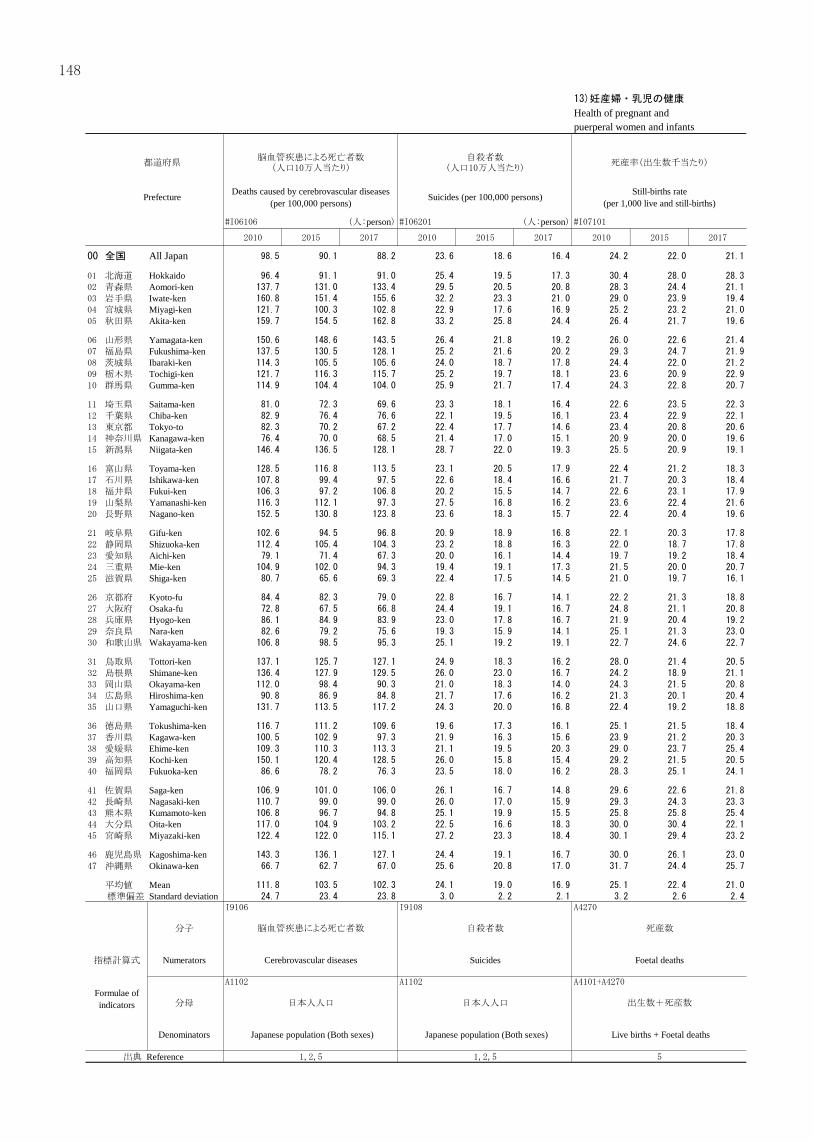
13)妊産婦・乳児の健康
Health of pregnant and puerperal women and infants
都道府県脳血管疾患による死亡者数
(人口10万人当たり)自殺者数
(人口10万人当たり)死産率(出生数千当たり) 新生児死亡率(出生数千当たり)
Prefecture Deaths caused by cerebrovascular diseases(per 100,000 persons)
Suicides (per 100,000 persons) Still-births rate(per 1,000 live and still-births)
Neonatal death rate (per 1,000 live births)
(人:person (人:person
全国 All Japan
北海道 Hokkaido青森県 Aomori-ken岩手県 Iwate-ken宮城県 Miyagi-ken秋田県 Akita-ken
山形県 Yamagata-ken福島県 Fukushima-ken茨城県 Ibaraki-ken栃木県 Tochigi-ken群馬県 Gumma-ken
埼玉県 Saitama-ken千葉県 Chiba-ken東京都 Tokyo-to神奈川県 Kanagawa-ken新潟県 Niigata-ken
富山県 Toyama-ken石川県 Ishikawa-ken福井県 Fukui-ken山梨県 Yamanashi-ken長野県 Nagano-ken
岐阜県 Gifu-ken静岡県 Shizuoka-ken愛知県 Aichi-ken三重県 Mie-ken滋賀県 Shiga-ken
京都府 Kyoto-fu大阪府 Osaka-fu兵庫県 Hyogo-ken奈良県 Nara-ken和歌山県 Wakayama-ken
鳥取県 Tottori-ken島根県 Shimane-ken岡山県 Okayama-ken広島県 Hiroshima-ken山口県 Yamaguchi-ken
徳島県 Tokushima-ken香川県 Kagawa-ken愛媛県 Ehime-ken高知県 Kochi-ken福岡県 Fukuoka-ken
佐賀県 Saga-ken長崎県 Nagasaki-ken熊本県 Kumamoto-ken大分県 Oita-ken宮崎県 Miyazaki-ken
鹿児島県 Kagoshima-ken沖縄県 Okinawa-ken
平均値 Mean標準偏差 Standard deviation
分子 脳血管疾患による死亡者数 自殺者数 死産数 新生児死亡数
指標計算式 Numerators Cerebrovascular diseases Suicides Foetal deaths Neonatal deaths
Formulae ofindicators 分母 日本人人口 日本人人口 出生数+死産数 出生数
Denominators Japanese population (Both sexes) Japanese population (Both sexes) Live births + Foetal deaths Live births
出典 Reference
新生児死亡率(出生数千当たり) 周産期死亡率(出生数千当たり) 乳児死亡率(出生数千当たり)
Neonatal death rate (per 1,000 live births) Prenatal death rate (per 1,000 live births) Infant death rate (per 1,000 live births)
Pref.Code
MeanS.D.
新生児死亡数 死産数(妊娠満22週以後)+早期新生児死亡数 乳児死亡数 分子
Neonatal deaths Infant deaths
出生数 出生数 + 死産数(妊娠満22週以後) 出生数 分母
Live births Live births + Foetal deaths(after 22 weeks pregnant)
Live births
出典
都道府県コー
ド
Foetal deaths (after 22 weeks pregnant) +Preterm neonatal deaths
148

13)妊産婦・乳児の健康
Health of pregnant and puerperal women and infants
都道府県脳血管疾患による死亡者数
(人口10万人当たり)自殺者数
(人口10万人当たり)死産率(出生数千当たり) 新生児死亡率(出生数千当たり)
Prefecture Deaths caused by cerebrovascular diseases(per 100,000 persons)
Suicides (per 100,000 persons) Still-births rate(per 1,000 live and still-births)
Neonatal death rate (per 1,000 live births)
(人:person (人:person
全国 All Japan
北海道 Hokkaido青森県 Aomori-ken岩手県 Iwate-ken宮城県 Miyagi-ken秋田県 Akita-ken
山形県 Yamagata-ken福島県 Fukushima-ken茨城県 Ibaraki-ken栃木県 Tochigi-ken群馬県 Gumma-ken
埼玉県 Saitama-ken千葉県 Chiba-ken東京都 Tokyo-to神奈川県 Kanagawa-ken新潟県 Niigata-ken
富山県 Toyama-ken石川県 Ishikawa-ken福井県 Fukui-ken山梨県 Yamanashi-ken長野県 Nagano-ken
岐阜県 Gifu-ken静岡県 Shizuoka-ken愛知県 Aichi-ken三重県 Mie-ken滋賀県 Shiga-ken
京都府 Kyoto-fu大阪府 Osaka-fu兵庫県 Hyogo-ken奈良県 Nara-ken和歌山県 Wakayama-ken
鳥取県 Tottori-ken島根県 Shimane-ken岡山県 Okayama-ken広島県 Hiroshima-ken山口県 Yamaguchi-ken
徳島県 Tokushima-ken香川県 Kagawa-ken愛媛県 Ehime-ken高知県 Kochi-ken福岡県 Fukuoka-ken
佐賀県 Saga-ken長崎県 Nagasaki-ken熊本県 Kumamoto-ken大分県 Oita-ken宮崎県 Miyazaki-ken
鹿児島県 Kagoshima-ken沖縄県 Okinawa-ken
平均値 Mean標準偏差 Standard deviation
分子 脳血管疾患による死亡者数 自殺者数 死産数 新生児死亡数
指標計算式 Numerators Cerebrovascular diseases Suicides Foetal deaths Neonatal deaths
Formulae ofindicators 分母 日本人人口 日本人人口 出生数+死産数 出生数
Denominators Japanese population (Both sexes) Japanese population (Both sexes) Live births + Foetal deaths Live births
出典 Reference
新生児死亡率(出生数千当たり) 周産期死亡率(出生数千当たり) 乳児死亡率(出生数千当たり)
Neonatal death rate (per 1,000 live births) Prenatal death rate (per 1,000 live births) Infant death rate (per 1,000 live births)
Pref.Code
MeanS.D.
新生児死亡数 死産数(妊娠満22週以後)+早期新生児死亡数 乳児死亡数 分子
Neonatal deaths Infant deaths
出生数 出生数 + 死産数(妊娠満22週以後) 出生数 分母
Live births Live births + Foetal deaths(after 22 weeks pregnant)
Live births
出典
都道府県コー
ド
Foetal deaths (after 22 weeks pregnant) +Preterm neonatal deaths
149

14)保健活動
Public health service activities
都道府県妊娠,分娩及び産じょくによる死亡率
(出産数10万当たり)2,500g未満の出生率(出生数千当たり) 保健師数(人口10万人当たり) 食品営業施設処分件数(千施設当たり)
Prefecture Pregnancy childbirth and the puerperium(per 100,000 live and still births)
Birth rate of babies weighting under 2,500g(per 1,000 live births)
Public health nurses (per 100,000 persons) Cases of penalties (per 1,000 food business places)
(人:person
全国 All Japan
北海道 Hokkaido青森県 Aomori-ken岩手県 Iwate-ken宮城県 Miyagi-ken秋田県 Akita-ken
山形県 Yamagata-ken福島県 Fukushima-ken茨城県 Ibaraki-ken栃木県 Tochigi-ken群馬県 Gumma-ken
埼玉県 Saitama-ken千葉県 Chiba-ken東京都 Tokyo-to神奈川県 Kanagawa-ken新潟県 Niigata-ken
富山県 Toyama-ken石川県 Ishikawa-ken福井県 Fukui-ken山梨県 Yamanashi-ken長野県 Nagano-ken
岐阜県 Gifu-ken静岡県 Shizuoka-ken愛知県 Aichi-ken三重県 Mie-ken滋賀県 Shiga-ken
京都府 Kyoto-fu大阪府 Osaka-fu兵庫県 Hyogo-ken奈良県 Nara-ken和歌山県 Wakayama-ken
鳥取県 Tottori-ken島根県 Shimane-ken岡山県 Okayama-ken広島県 Hiroshima-ken山口県 Yamaguchi-ken
徳島県 Tokushima-ken香川県 Kagawa-ken愛媛県 Ehime-ken高知県 Kochi-ken福岡県 Fukuoka-ken
佐賀県 Saga-ken長崎県 Nagasaki-ken熊本県 Kumamoto-ken大分県 Oita-ken宮崎県 Miyazaki-ken
鹿児島県 Kagoshima-ken沖縄県 Okinawa-ken
平均値 Mean標準偏差 Standard deviation
分子 妊娠,分娩及び産じょくによる死亡数 2,500g未満の出生数 保健師数 食品営業施設処分件数
指標計算式 Numerators Pregnancy, childbirth and the puerperium fatalities Births weighing under 2,500g No. of public health nurses No. of cases of penalties to food business places
Formulae ofindicators 分母 出生数+死産数 出生数 総人口 食品営業施設数
Denominators Live births + Foetal deaths Live births Total population (Both sexes) No. of food business places
出典 Reference
15)児童・生徒の体位 Physique of students
食品営業施設処分件数(千施設当たり) 平均身長(小学5年・男) 平均身長(小学5年・女)
Cases of penalties (per 1,000 food business places) Height, male of the fifth grade (elementary school) Height, female of the fifth grade (elementary school)
(件:number of casesPref.Code
MeanS.D.
※ ※
食品営業施設処分件数 分子
No. of cases of penalties to food business places 身長(小学5年)(男) 身長(小学5年)(女) 指標計算式
食品営業施設数 Height (Male of the fifth grade (elementary school)) Height (Female of the fifth grade (elementary school)) 分母
No. of food business places
出典
都道府県コー
ド
150

14)保健活動
Public health service activities
都道府県妊娠,分娩及び産じょくによる死亡率
(出産数10万当たり)2,500g未満の出生率(出生数千当たり) 保健師数(人口10万人当たり) 食品営業施設処分件数(千施設当たり)
Prefecture Pregnancy childbirth and the puerperium(per 100,000 live and still births)
Birth rate of babies weighting under 2,500g(per 1,000 live births)
Public health nurses (per 100,000 persons) Cases of penalties (per 1,000 food business places)
(人:person
全国 All Japan
北海道 Hokkaido青森県 Aomori-ken岩手県 Iwate-ken宮城県 Miyagi-ken秋田県 Akita-ken
山形県 Yamagata-ken福島県 Fukushima-ken茨城県 Ibaraki-ken栃木県 Tochigi-ken群馬県 Gumma-ken
埼玉県 Saitama-ken千葉県 Chiba-ken東京都 Tokyo-to神奈川県 Kanagawa-ken新潟県 Niigata-ken
富山県 Toyama-ken石川県 Ishikawa-ken福井県 Fukui-ken山梨県 Yamanashi-ken長野県 Nagano-ken
岐阜県 Gifu-ken静岡県 Shizuoka-ken愛知県 Aichi-ken三重県 Mie-ken滋賀県 Shiga-ken
京都府 Kyoto-fu大阪府 Osaka-fu兵庫県 Hyogo-ken奈良県 Nara-ken和歌山県 Wakayama-ken
鳥取県 Tottori-ken島根県 Shimane-ken岡山県 Okayama-ken広島県 Hiroshima-ken山口県 Yamaguchi-ken
徳島県 Tokushima-ken香川県 Kagawa-ken愛媛県 Ehime-ken高知県 Kochi-ken福岡県 Fukuoka-ken
佐賀県 Saga-ken長崎県 Nagasaki-ken熊本県 Kumamoto-ken大分県 Oita-ken宮崎県 Miyazaki-ken
鹿児島県 Kagoshima-ken沖縄県 Okinawa-ken
平均値 Mean標準偏差 Standard deviation
分子 妊娠,分娩及び産じょくによる死亡数 2,500g未満の出生数 保健師数 食品営業施設処分件数
指標計算式 Numerators Pregnancy, childbirth and the puerperium fatalities Births weighing under 2,500g No. of public health nurses No. of cases of penalties to food business places
Formulae ofindicators 分母 出生数+死産数 出生数 総人口 食品営業施設数
Denominators Live births + Foetal deaths Live births Total population (Both sexes) No. of food business places
出典 Reference
15)児童・生徒の体位 Physique of students
食品営業施設処分件数(千施設当たり) 平均身長(小学5年・男) 平均身長(小学5年・女)
Cases of penalties (per 1,000 food business places) Height, male of the fifth grade (elementary school) Height, female of the fifth grade (elementary school)
(件:number of casesPref.Code
MeanS.D.
※ ※
食品営業施設処分件数 分子
No. of cases of penalties to food business places 身長(小学5年)(男) 身長(小学5年)(女) 指標計算式
食品営業施設数 Height (Male of the fifth grade (elementary school)) Height (Female of the fifth grade (elementary school)) 分母
No. of food business places
出典
都道府県コー
ド
151

都道府県 平均身長(中学2年・男) 平均身長(中学2年・女) 平均身長(高校2年・男) 平均身長(高校2年・女)
Prefecture Height, male of the second grade(junior high school)
Height, female of the second grade(junior high school)
Height, male of the second grade(senior high school)
全国 All Japan
北海道 Hokkaido青森県 Aomori-ken岩手県 Iwate-ken宮城県 Miyagi-ken秋田県 Akita-ken
山形県 Yamagata-ken福島県 Fukushima-ken茨城県 Ibaraki-ken栃木県 Tochigi-ken群馬県 Gumma-ken
埼玉県 Saitama-ken千葉県 Chiba-ken東京都 Tokyo-to神奈川県 Kanagawa-ken新潟県 Niigata-ken
富山県 Toyama-ken石川県 Ishikawa-ken福井県 Fukui-ken山梨県 Yamanashi-ken長野県 Nagano-ken
岐阜県 Gifu-ken静岡県 Shizuoka-ken愛知県 Aichi-ken三重県 Mie-ken滋賀県 Shiga-ken
京都府 Kyoto-fu大阪府 Osaka-fu兵庫県 Hyogo-ken奈良県 Nara-ken和歌山県 Wakayama-ken
鳥取県 Tottori-ken島根県 Shimane-ken岡山県 Okayama-ken広島県 Hiroshima-ken山口県 Yamaguchi-ken
徳島県 Tokushima-ken香川県 Kagawa-ken愛媛県 Ehime-ken高知県 Kochi-ken福岡県 Fukuoka-ken
佐賀県 Saga-ken長崎県 Nagasaki-ken熊本県 Kumamoto-ken大分県 Oita-ken宮崎県 Miyazaki-ken
鹿児島県 Kagoshima-ken沖縄県 Okinawa-ken
平均値 Mean標準偏差 Standard deviation
※ ※ ※
分子
指標計算式 Numerators 身長(中学2年)(男) 身長(中学2年)(女) 身長(高校2年)(男) 身長(高校2年)(女)
Formulae ofindicators 分母
Height (Male of the second grade (lowersecondary school))
Height (Female of the second grade (lowersecondary school))
Height (Male of the second grade (uppersecondary school))
Denominators
出典 Reference
平均身長(高校2年・女) 平均体重(小学5年・男) 平均体重(小学5年・女)
Height, female of the second grade(senior high school)
Weight, male of the fifth grade(elementary school)
Weight, female of the fifth grade(elementary school)
Pref.Code
MeanS.D.
※ ※ ※
分子
身長(高校2年)(女) 体重(小学5年)(男) 体重(小学5年)(女) 指標計算式
Height (Female of the second grade(upper secondary school))
Weight (Male of the fifth grade(elementary school))
Weight (Female of the fifth grade(elementary school)) 分母
出典
都道府県コー
ド
152

都道府県 平均身長(中学2年・男) 平均身長(中学2年・女) 平均身長(高校2年・男) 平均身長(高校2年・女)
Prefecture Height, male of the second grade(junior high school)
Height, female of the second grade(junior high school)
Height, male of the second grade(senior high school)
全国 All Japan
北海道 Hokkaido青森県 Aomori-ken岩手県 Iwate-ken宮城県 Miyagi-ken秋田県 Akita-ken
山形県 Yamagata-ken福島県 Fukushima-ken茨城県 Ibaraki-ken栃木県 Tochigi-ken群馬県 Gumma-ken
埼玉県 Saitama-ken千葉県 Chiba-ken東京都 Tokyo-to神奈川県 Kanagawa-ken新潟県 Niigata-ken
富山県 Toyama-ken石川県 Ishikawa-ken福井県 Fukui-ken山梨県 Yamanashi-ken長野県 Nagano-ken
岐阜県 Gifu-ken静岡県 Shizuoka-ken愛知県 Aichi-ken三重県 Mie-ken滋賀県 Shiga-ken
京都府 Kyoto-fu大阪府 Osaka-fu兵庫県 Hyogo-ken奈良県 Nara-ken和歌山県 Wakayama-ken
鳥取県 Tottori-ken島根県 Shimane-ken岡山県 Okayama-ken広島県 Hiroshima-ken山口県 Yamaguchi-ken
徳島県 Tokushima-ken香川県 Kagawa-ken愛媛県 Ehime-ken高知県 Kochi-ken福岡県 Fukuoka-ken
佐賀県 Saga-ken長崎県 Nagasaki-ken熊本県 Kumamoto-ken大分県 Oita-ken宮崎県 Miyazaki-ken
鹿児島県 Kagoshima-ken沖縄県 Okinawa-ken
平均値 Mean標準偏差 Standard deviation
※ ※ ※
分子
指標計算式 Numerators 身長(中学2年)(男) 身長(中学2年)(女) 身長(高校2年)(男) 身長(高校2年)(女)
Formulae ofindicators 分母
Height (Male of the second grade (lowersecondary school))
Height (Female of the second grade (lowersecondary school))
Height (Male of the second grade (uppersecondary school))
Denominators
出典 Reference
平均身長(高校2年・女) 平均体重(小学5年・男) 平均体重(小学5年・女)
Height, female of the second grade(senior high school)
Weight, male of the fifth grade(elementary school)
Weight, female of the fifth grade(elementary school)
Pref.Code
MeanS.D.
※ ※ ※
分子
身長(高校2年)(女) 体重(小学5年)(男) 体重(小学5年)(女) 指標計算式
Height (Female of the second grade(upper secondary school))
Weight (Male of the fifth grade(elementary school))
Weight (Female of the fifth grade(elementary school)) 分母
出典
都道府県コー
ド
153

都道府県 平均体重(中学2年・男) 平均体重(中学2年・女) 平均体重(高校2年・男) 平均体重(高校2年・女)
Prefecture Weight, male of the second grade(junior high school)
Weight, female of the second grade(junior high school)
Weight, male of the second grade(senior high school)
全国 All Japan
北海道 Hokkaido青森県 Aomori-ken岩手県 Iwate-ken宮城県 Miyagi-ken秋田県 Akita-ken
山形県 Yamagata-ken福島県 Fukushima-ken茨城県 Ibaraki-ken栃木県 Tochigi-ken群馬県 Gumma-ken
埼玉県 Saitama-ken千葉県 Chiba-ken東京都 Tokyo-to神奈川県 Kanagawa-ken新潟県 Niigata-ken
富山県 Toyama-ken石川県 Ishikawa-ken福井県 Fukui-ken山梨県 Yamanashi-ken長野県 Nagano-ken
岐阜県 Gifu-ken静岡県 Shizuoka-ken愛知県 Aichi-ken三重県 Mie-ken滋賀県 Shiga-ken
京都府 Kyoto-fu大阪府 Osaka-fu兵庫県 Hyogo-ken奈良県 Nara-ken和歌山県 Wakayama-ken
鳥取県 Tottori-ken島根県 Shimane-ken岡山県 Okayama-ken広島県 Hiroshima-ken山口県 Yamaguchi-ken
徳島県 Tokushima-ken香川県 Kagawa-ken愛媛県 Ehime-ken高知県 Kochi-ken福岡県 Fukuoka-ken
佐賀県 Saga-ken長崎県 Nagasaki-ken熊本県 Kumamoto-ken大分県 Oita-ken宮崎県 Miyazaki-ken
鹿児島県 Kagoshima-ken沖縄県 Okinawa-ken
平均値 Mean標準偏差 Standard deviation
※ ※ ※
分子
指標計算式 Numerators 体重(中学2年)(男) 体重(中学2年)(女) 体重(高校2年)(男) 体重(高校2年)(女)
Formulae ofindicators 分母
Weight (Male of the second grade (lowersecondary school))
Weight (Female of the second grade (lowersecondary school))
Weight (Male of the second grade (uppersecondary school))
Denominators
出典 Reference
平均体重(高校2年・女)
Weight, female of the second grade(senior high school)
Pref.Code
MeanS.D.
※
分子
体重(高校2年)(女)
Weight (Female of the second grade (upper secondaryschool)) 分母
出典
都道府県コー
ド
154

都道府県 平均体重(中学2年・男) 平均体重(中学2年・女) 平均体重(高校2年・男) 平均体重(高校2年・女)
Prefecture Weight, male of the second grade(junior high school)
Weight, female of the second grade(junior high school)
Weight, male of the second grade(senior high school)
全国 All Japan
北海道 Hokkaido青森県 Aomori-ken岩手県 Iwate-ken宮城県 Miyagi-ken秋田県 Akita-ken
山形県 Yamagata-ken福島県 Fukushima-ken茨城県 Ibaraki-ken栃木県 Tochigi-ken群馬県 Gumma-ken
埼玉県 Saitama-ken千葉県 Chiba-ken東京都 Tokyo-to神奈川県 Kanagawa-ken新潟県 Niigata-ken
富山県 Toyama-ken石川県 Ishikawa-ken福井県 Fukui-ken山梨県 Yamanashi-ken長野県 Nagano-ken
岐阜県 Gifu-ken静岡県 Shizuoka-ken愛知県 Aichi-ken三重県 Mie-ken滋賀県 Shiga-ken
京都府 Kyoto-fu大阪府 Osaka-fu兵庫県 Hyogo-ken奈良県 Nara-ken和歌山県 Wakayama-ken
鳥取県 Tottori-ken島根県 Shimane-ken岡山県 Okayama-ken広島県 Hiroshima-ken山口県 Yamaguchi-ken
徳島県 Tokushima-ken香川県 Kagawa-ken愛媛県 Ehime-ken高知県 Kochi-ken福岡県 Fukuoka-ken
佐賀県 Saga-ken長崎県 Nagasaki-ken熊本県 Kumamoto-ken大分県 Oita-ken宮崎県 Miyazaki-ken
鹿児島県 Kagoshima-ken沖縄県 Okinawa-ken
平均値 Mean標準偏差 Standard deviation
※ ※ ※
分子
指標計算式 Numerators 体重(中学2年)(男) 体重(中学2年)(女) 体重(高校2年)(男) 体重(高校2年)(女)
Formulae ofindicators 分母
Weight (Male of the second grade (lowersecondary school))
Weight (Female of the second grade (lowersecondary school))
Weight (Male of the second grade (uppersecondary school))
Denominators
出典 Reference
平均体重(高校2年・女)
Weight, female of the second grade(senior high school)
Pref.Code
MeanS.D.
※
分子
体重(高校2年)(女)
Weight (Female of the second grade (upper secondaryschool)) 分母
出典
都道府県コー
ド
155

J.福祉・社会保障 Welfare and Social Security1)社会保障対象者等 Households and persons assisted by social welfare system
都道府県生活保護被保護実世帯数
(月平均一般世帯千世帯当たり)生活保護被保護実人員(月平均人口千人当たり)
生活保護住宅扶助人員(月平均人口千人当たり)
生活保護介護扶助人員(月平均人口千人当たり)
Prefecture Households assisted by livelihood protectionper 1,000 households (monthly average)
Persons assisted by livelihood protectionper 1,000 persons (monthly average)
Households recipients assisted by livelihoodprotection per 1,000 persons (monthly average)
(世帯:household (人:person (人:person
全国 All Japan
北海道 Hokkaido青森県 Aomori-ken岩手県 Iwate-ken宮城県 Miyagi-ken秋田県 Akita-ken
山形県 Yamagata-ken福島県 Fukushima-ken茨城県 Ibaraki-ken栃木県 Tochigi-ken群馬県 Gumma-ken
埼玉県 Saitama-ken千葉県 Chiba-ken東京都 Tokyo-to神奈川県 Kanagawa-ken新潟県 Niigata-ken
富山県 Toyama-ken石川県 Ishikawa-ken福井県 Fukui-ken山梨県 Yamanashi-ken長野県 Nagano-ken
岐阜県 Gifu-ken静岡県 Shizuoka-ken愛知県 Aichi-ken三重県 Mie-ken滋賀県 Shiga-ken
京都府 Kyoto-fu大阪府 Osaka-fu兵庫県 Hyogo-ken奈良県 Nara-ken和歌山県 Wakayama-ken
鳥取県 Tottori-ken島根県 Shimane-ken岡山県 Okayama-ken広島県 Hiroshima-ken山口県 Yamaguchi-ken
徳島県 Tokushima-ken香川県 Kagawa-ken愛媛県 Ehime-ken高知県 Kochi-ken福岡県 Fukuoka-ken
佐賀県 Saga-ken長崎県 Nagasaki-ken熊本県 Kumamoto-ken大分県 Oita-ken宮崎県 Miyazaki-ken
鹿児島県 Kagoshima-ken沖縄県 Okinawa-ken
平均値 Mean標準偏差 Standard deviation
分子 生活保護被保護実世帯数 生活保護被保護実人員 生活保護住宅扶助人員 生活保護介護扶助人員
指標計算式 Numerators No. of households assisted by livelihoodprotection Persons assisted by livelihood protection Housing recipients assisted by livelihood
protection
Formulae ofindicators 分母 一般世帯数 総人口 総人口 総人口
Denominators Number of private households Total population (Both sexes) Total population (Both sexes) Total population (Both sexes)
出典 Reference
生活保護介護扶助人員(月平均人口千人当たり)
生活保護教育扶助人員(月平均人口千人当たり)
生活保護医療扶助人員(月平均人口千人当たり)
Nursing-care recipients assisted by livelihoodprotection per 1,000 persons (monthly average)
Educational recipients assisted by livelihoodprotection per 1,000 persons (monthly average)
Medical recipients assisted by livelihood protectionper 1,000 persons (monthly average)
(人:person (人:person (人:personPref.Code
MeanS.D.
生活保護介護扶助人員 生活保護教育扶助人員 生活保護医療扶助人員 分子
Nursing-care recipients assisted by livelihoodprotection Educational recipients assisted by livelihood protection Medical recipients assisted by livelihood protection 指標計算式
総人口 総人口 総人口 分母
Total population (Both sexes) Total population (Both sexes) Total population (Both sexes)
出典
都道府県コー
ド
156

J.福祉・社会保障 Welfare and Social Security1)社会保障対象者等 Households and persons assisted by social welfare system
都道府県生活保護被保護実世帯数
(月平均一般世帯千世帯当たり)生活保護被保護実人員(月平均人口千人当たり)
生活保護住宅扶助人員(月平均人口千人当たり)
生活保護介護扶助人員(月平均人口千人当たり)
Prefecture Households assisted by livelihood protectionper 1,000 households (monthly average)
Persons assisted by livelihood protectionper 1,000 persons (monthly average)
Households recipients assisted by livelihoodprotection per 1,000 persons (monthly average)
(世帯:household (人:person (人:person
全国 All Japan
北海道 Hokkaido青森県 Aomori-ken岩手県 Iwate-ken宮城県 Miyagi-ken秋田県 Akita-ken
山形県 Yamagata-ken福島県 Fukushima-ken茨城県 Ibaraki-ken栃木県 Tochigi-ken群馬県 Gumma-ken
埼玉県 Saitama-ken千葉県 Chiba-ken東京都 Tokyo-to神奈川県 Kanagawa-ken新潟県 Niigata-ken
富山県 Toyama-ken石川県 Ishikawa-ken福井県 Fukui-ken山梨県 Yamanashi-ken長野県 Nagano-ken
岐阜県 Gifu-ken静岡県 Shizuoka-ken愛知県 Aichi-ken三重県 Mie-ken滋賀県 Shiga-ken
京都府 Kyoto-fu大阪府 Osaka-fu兵庫県 Hyogo-ken奈良県 Nara-ken和歌山県 Wakayama-ken
鳥取県 Tottori-ken島根県 Shimane-ken岡山県 Okayama-ken広島県 Hiroshima-ken山口県 Yamaguchi-ken
徳島県 Tokushima-ken香川県 Kagawa-ken愛媛県 Ehime-ken高知県 Kochi-ken福岡県 Fukuoka-ken
佐賀県 Saga-ken長崎県 Nagasaki-ken熊本県 Kumamoto-ken大分県 Oita-ken宮崎県 Miyazaki-ken
鹿児島県 Kagoshima-ken沖縄県 Okinawa-ken
平均値 Mean標準偏差 Standard deviation
分子 生活保護被保護実世帯数 生活保護被保護実人員 生活保護住宅扶助人員 生活保護介護扶助人員
指標計算式 Numerators No. of households assisted by livelihoodprotection Persons assisted by livelihood protection Housing recipients assisted by livelihood
protection
Formulae ofindicators 分母 一般世帯数 総人口 総人口 総人口
Denominators Number of private households Total population (Both sexes) Total population (Both sexes) Total population (Both sexes)
出典 Reference
生活保護介護扶助人員(月平均人口千人当たり)
生活保護教育扶助人員(月平均人口千人当たり)
生活保護医療扶助人員(月平均人口千人当たり)
Nursing-care recipients assisted by livelihoodprotection per 1,000 persons (monthly average)
Educational recipients assisted by livelihoodprotection per 1,000 persons (monthly average)
Medical recipients assisted by livelihood protectionper 1,000 persons (monthly average)
(人:person (人:person (人:personPref.Code
MeanS.D.
生活保護介護扶助人員 生活保護教育扶助人員 生活保護医療扶助人員 分子
Nursing-care recipients assisted by livelihoodprotection Educational recipients assisted by livelihood protection Medical recipients assisted by livelihood protection 指標計算式
総人口 総人口 総人口 分母
Total population (Both sexes) Total population (Both sexes) Total population (Both sexes)
出典
都道府県コー
ド
157
J
福祉・社会保障
(指標)

2)社会福祉施設
Social welfare institutions
都道府県生活保護被保護高齢者数
(月平均65歳以上人口千人当たり)身体障害者手帳交付数
(人口千人当たり)保護施設数
(生活保護被保護実人員10万人当たり) 1)老人ホーム数(65歳以上人口10万人当たり)
PrefectureAged persons assisted by livelihood protection
per 1,000 persons 65 years old and over(monthly average)
Certificates issued for physically disabledpersons per 1,000 persons
Institutions for livelihood protection (per 100,000 persons assisted) 1)
(人:person (人:person (所:number of establishments
全国 All Japan
北海道 Hokkaido青森県 Aomori-ken岩手県 Iwate-ken宮城県 Miyagi-ken秋田県 Akita-ken
山形県 Yamagata-ken福島県 Fukushima-ken茨城県 Ibaraki-ken栃木県 Tochigi-ken群馬県 Gumma-ken
埼玉県 Saitama-ken千葉県 Chiba-ken東京都 Tokyo-to神奈川県 Kanagawa-ken新潟県 Niigata-ken
富山県 Toyama-ken石川県 Ishikawa-ken福井県 Fukui-ken山梨県 Yamanashi-ken長野県 Nagano-ken
岐阜県 Gifu-ken静岡県 Shizuoka-ken愛知県 Aichi-ken三重県 Mie-ken滋賀県 Shiga-ken
京都府 Kyoto-fu大阪府 Osaka-fu兵庫県 Hyogo-ken奈良県 Nara-ken和歌山県 Wakayama-ken
鳥取県 Tottori-ken島根県 Shimane-ken岡山県 Okayama-ken広島県 Hiroshima-ken山口県 Yamaguchi-ken
徳島県 Tokushima-ken香川県 Kagawa-ken愛媛県 Ehime-ken高知県 Kochi-ken福岡県 Fukuoka-ken
佐賀県 Saga-ken長崎県 Nagasaki-ken熊本県 Kumamoto-ken大分県 Oita-ken宮崎県 Miyazaki-ken
鹿児島県 Kagoshima-ken沖縄県 Okinawa-ken
平均値 Mean標準偏差 Standard deviation
分子 生活保護被保護高齢者数(65歳以上) 身体障害者手帳交付数 保護施設数(医療保護施設を除く)
指標計算式 Numerators No. of aged persons assisted by livelihoodprotection (65 yrs. old and over)
No. of certificates issued for the physicallydisabled
No. of institutions for livelihood protection(Excl. medical care)
Formulae ofindicators 分母 65歳以上人口 総人口 生活保護被保護実人員 65歳以上人口
Denominators Population (65 years old and over) Total population (Both sexes) Persons assisted by livelihood protection Population (65 years old and over)
出典 Reference1) 2012年以降については,医療保護施設を除く。
1) The medical facility for persons requiring public assistance are excluded since 2012.
老人ホーム数(65歳以上人口10万人当たり) 有料老人ホーム数(65歳以上人口10万人当たり) 老人福祉センター数(65歳以上人口10万人当たり)
Homes for the aged(per 100,000 persons 65 years old and over)
Fee-charging homes for the aged(per 100,000 persons 65 years old and over)
Welfare centers for the aged(per 100,000 persons 65 years old and over)
(所:number of establishments (所:number of establishments (所:number of establishmentsPref.Code
MeanS.D.
養護老人ホーム数+介護老人福祉施設数+軽費老人ホーム数+有料老人ホーム数
有料老人ホーム数 老人福祉センター数 分子
Nursing homes for the aged + Elderly nursing facilities +Low-cost homes for the aged + Fee-charging homes for the
agedFee-charging homes for the aged Welfare centers for the aged 指標計算式
65歳以上人口 65歳以上人口 65歳以上人口 分母
Population (65 years old and over) Population (65 years old and over) Population (65 years old and over)
出典
都道府県コー
ド
158

2)社会福祉施設
Social welfare institutions
都道府県生活保護被保護高齢者数
(月平均65歳以上人口千人当たり)身体障害者手帳交付数
(人口千人当たり)保護施設数
(生活保護被保護実人員10万人当たり) 1)老人ホーム数(65歳以上人口10万人当たり)
PrefectureAged persons assisted by livelihood protection
per 1,000 persons 65 years old and over(monthly average)
Certificates issued for physically disabledpersons per 1,000 persons
Institutions for livelihood protection (per 100,000 persons assisted) 1)
(人:person (人:person (所:number of establishments
全国 All Japan
北海道 Hokkaido青森県 Aomori-ken岩手県 Iwate-ken宮城県 Miyagi-ken秋田県 Akita-ken
山形県 Yamagata-ken福島県 Fukushima-ken茨城県 Ibaraki-ken栃木県 Tochigi-ken群馬県 Gumma-ken
埼玉県 Saitama-ken千葉県 Chiba-ken東京都 Tokyo-to神奈川県 Kanagawa-ken新潟県 Niigata-ken
富山県 Toyama-ken石川県 Ishikawa-ken福井県 Fukui-ken山梨県 Yamanashi-ken長野県 Nagano-ken
岐阜県 Gifu-ken静岡県 Shizuoka-ken愛知県 Aichi-ken三重県 Mie-ken滋賀県 Shiga-ken
京都府 Kyoto-fu大阪府 Osaka-fu兵庫県 Hyogo-ken奈良県 Nara-ken和歌山県 Wakayama-ken
鳥取県 Tottori-ken島根県 Shimane-ken岡山県 Okayama-ken広島県 Hiroshima-ken山口県 Yamaguchi-ken
徳島県 Tokushima-ken香川県 Kagawa-ken愛媛県 Ehime-ken高知県 Kochi-ken福岡県 Fukuoka-ken
佐賀県 Saga-ken長崎県 Nagasaki-ken熊本県 Kumamoto-ken大分県 Oita-ken宮崎県 Miyazaki-ken
鹿児島県 Kagoshima-ken沖縄県 Okinawa-ken
平均値 Mean標準偏差 Standard deviation
分子 生活保護被保護高齢者数(65歳以上) 身体障害者手帳交付数 保護施設数(医療保護施設を除く)
指標計算式 Numerators No. of aged persons assisted by livelihoodprotection (65 yrs. old and over)
No. of certificates issued for the physicallydisabled
No. of institutions for livelihood protection(Excl. medical care)
Formulae ofindicators 分母 65歳以上人口 総人口 生活保護被保護実人員 65歳以上人口
Denominators Population (65 years old and over) Total population (Both sexes) Persons assisted by livelihood protection Population (65 years old and over)
出典 Reference1) 2012年以降については,医療保護施設を除く。
1) The medical facility for persons requiring public assistance are excluded since 2012.
老人ホーム数(65歳以上人口10万人当たり) 有料老人ホーム数(65歳以上人口10万人当たり) 老人福祉センター数(65歳以上人口10万人当たり)
Homes for the aged(per 100,000 persons 65 years old and over)
Fee-charging homes for the aged(per 100,000 persons 65 years old and over)
Welfare centers for the aged(per 100,000 persons 65 years old and over)
(所:number of establishments (所:number of establishments (所:number of establishmentsPref.Code
MeanS.D.
養護老人ホーム数+介護老人福祉施設数+軽費老人ホーム数+有料老人ホーム数
有料老人ホーム数 老人福祉センター数 分子
Nursing homes for the aged + Elderly nursing facilities +Low-cost homes for the aged + Fee-charging homes for the
agedFee-charging homes for the aged Welfare centers for the aged 指標計算式
65歳以上人口 65歳以上人口 65歳以上人口 分母
Population (65 years old and over) Population (65 years old and over) Population (65 years old and over)
出典
都道府県コー
ド
159
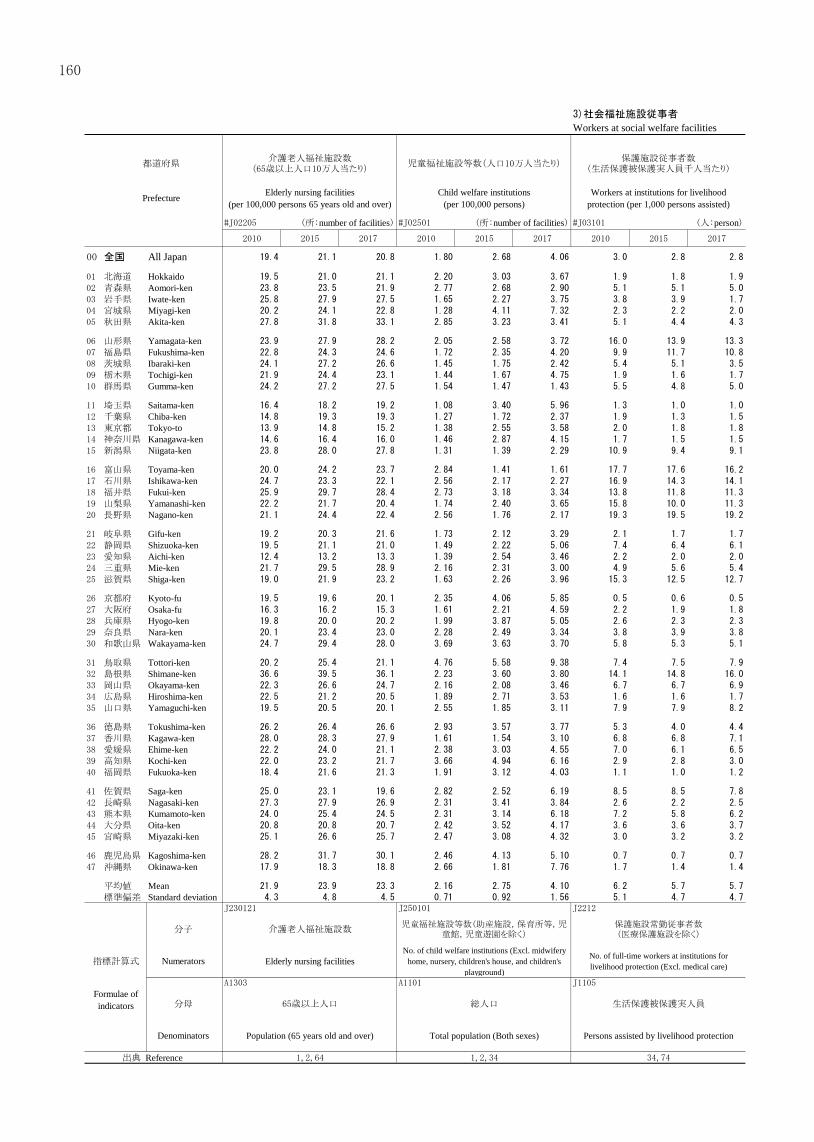
3)社会福祉施設従事者
Workers at social welfare facilities
都道府県介護老人福祉施設数
(65歳以上人口10万人当たり)児童福祉施設等数(人口10万人当たり)
保護施設従事者数(生活保護被保護実人員千人当たり)
老人ホーム従事者数(65歳以上人口10万人当たり)
Prefecture Elderly nursing facilities(per 100,000 persons 65 years old and over)
Child welfare institutions(per 100,000 persons)
Workers at institutions for livelihoodprotection (per 1,000 persons assisted)
(所:number of facilities (所:number of facilities (人:person
全国 All Japan
北海道 Hokkaido青森県 Aomori-ken岩手県 Iwate-ken宮城県 Miyagi-ken秋田県 Akita-ken
山形県 Yamagata-ken福島県 Fukushima-ken茨城県 Ibaraki-ken栃木県 Tochigi-ken群馬県 Gumma-ken
埼玉県 Saitama-ken千葉県 Chiba-ken東京都 Tokyo-to神奈川県 Kanagawa-ken新潟県 Niigata-ken
富山県 Toyama-ken石川県 Ishikawa-ken福井県 Fukui-ken山梨県 Yamanashi-ken長野県 Nagano-ken
岐阜県 Gifu-ken静岡県 Shizuoka-ken愛知県 Aichi-ken三重県 Mie-ken滋賀県 Shiga-ken
京都府 Kyoto-fu大阪府 Osaka-fu兵庫県 Hyogo-ken奈良県 Nara-ken和歌山県 Wakayama-ken
鳥取県 Tottori-ken島根県 Shimane-ken岡山県 Okayama-ken広島県 Hiroshima-ken山口県 Yamaguchi-ken
徳島県 Tokushima-ken香川県 Kagawa-ken愛媛県 Ehime-ken高知県 Kochi-ken福岡県 Fukuoka-ken
佐賀県 Saga-ken長崎県 Nagasaki-ken熊本県 Kumamoto-ken大分県 Oita-ken宮崎県 Miyazaki-ken
鹿児島県 Kagoshima-ken沖縄県 Okinawa-ken
平均値 Mean標準偏差 Standard deviation
分子 介護老人福祉施設数児童福祉施設等数(助産施設,保育所等,児
童館,児童遊園を除く)保護施設常勤従事者数(医療保護施設を除く)
指標計算式 Numerators Elderly nursing facilitiesNo. of child welfare institutions (Excl. midwifery
home, nursery, children's house, and children'splayground)
No. of full-time workers at institutions forlivelihood protection (Excl. medical care) a)
Formulae ofindicators 分母 65歳以上人口 総人口 生活保護被保護実人員 65歳以上人口
Denominators Population (65 years old and over) Total population (Both sexes) Persons assisted by livelihood protection Population (65 years old and over)
出典 Reference
老人ホーム従事者数(65歳以上人口10万人当たり)
老人福祉センター従事者数(65歳以上人口10万人当たり)
児童福祉施設等従事者数(人口10万人当たり)
Workers at homes for the aged(per 100,000 persons 65 years old and over)
Workers at welfare centers for the aged(per 100,000 persons 65 years old and over)
Workers at child welfare institutions(per 100,000 persons)
(人:person (人:person (人:personPref.Code
MeanS.D.
養護老人ホーム常勤従事者数+介護老人福祉施設従事者数+軽費老人ホーム常勤従事者数+有料老人ホーム常勤従
事者数老人福祉センター常勤従事者数
児童福祉施設等常勤従事者数(助産施設,保育所等,児童館,児童遊園を除く)
分子
a) Personnel of welfare centers for the aged (Full-time) b) 指標計算式
65歳以上人口 65歳以上人口 総人口 分母
Population (65 years old and over) Population (65 years old and over) Total population (Both sexes)
出典
a) Personnel of nursing homes for the aged (Full-time) + No. of workers at elderly nursing facilities + Personnel of low-cost homes for the aged (Full-time) +No. of workers at fee-charging homes for the aged (Full-time)b) No. of workers at child welfare institutions (Excl. midwifery home, nursery, children's house, and children's playground) (Full-time)
都道府県コー
ド
160

3)社会福祉施設従事者
Workers at social welfare facilities
都道府県介護老人福祉施設数
(65歳以上人口10万人当たり)児童福祉施設等数(人口10万人当たり)
保護施設従事者数(生活保護被保護実人員千人当たり)
老人ホーム従事者数(65歳以上人口10万人当たり)
Prefecture Elderly nursing facilities(per 100,000 persons 65 years old and over)
Child welfare institutions(per 100,000 persons)
Workers at institutions for livelihoodprotection (per 1,000 persons assisted)
(所:number of facilities (所:number of facilities (人:person
全国 All Japan
北海道 Hokkaido青森県 Aomori-ken岩手県 Iwate-ken宮城県 Miyagi-ken秋田県 Akita-ken
山形県 Yamagata-ken福島県 Fukushima-ken茨城県 Ibaraki-ken栃木県 Tochigi-ken群馬県 Gumma-ken
埼玉県 Saitama-ken千葉県 Chiba-ken東京都 Tokyo-to神奈川県 Kanagawa-ken新潟県 Niigata-ken
富山県 Toyama-ken石川県 Ishikawa-ken福井県 Fukui-ken山梨県 Yamanashi-ken長野県 Nagano-ken
岐阜県 Gifu-ken静岡県 Shizuoka-ken愛知県 Aichi-ken三重県 Mie-ken滋賀県 Shiga-ken
京都府 Kyoto-fu大阪府 Osaka-fu兵庫県 Hyogo-ken奈良県 Nara-ken和歌山県 Wakayama-ken
鳥取県 Tottori-ken島根県 Shimane-ken岡山県 Okayama-ken広島県 Hiroshima-ken山口県 Yamaguchi-ken
徳島県 Tokushima-ken香川県 Kagawa-ken愛媛県 Ehime-ken高知県 Kochi-ken福岡県 Fukuoka-ken
佐賀県 Saga-ken長崎県 Nagasaki-ken熊本県 Kumamoto-ken大分県 Oita-ken宮崎県 Miyazaki-ken
鹿児島県 Kagoshima-ken沖縄県 Okinawa-ken
平均値 Mean標準偏差 Standard deviation
分子 介護老人福祉施設数児童福祉施設等数(助産施設,保育所等,児
童館,児童遊園を除く)保護施設常勤従事者数(医療保護施設を除く)
指標計算式 Numerators Elderly nursing facilitiesNo. of child welfare institutions (Excl. midwifery
home, nursery, children's house, and children'splayground)
No. of full-time workers at institutions forlivelihood protection (Excl. medical care) a)
Formulae ofindicators 分母 65歳以上人口 総人口 生活保護被保護実人員 65歳以上人口
Denominators Population (65 years old and over) Total population (Both sexes) Persons assisted by livelihood protection Population (65 years old and over)
出典 Reference
老人ホーム従事者数(65歳以上人口10万人当たり)
老人福祉センター従事者数(65歳以上人口10万人当たり)
児童福祉施設等従事者数(人口10万人当たり)
Workers at homes for the aged(per 100,000 persons 65 years old and over)
Workers at welfare centers for the aged(per 100,000 persons 65 years old and over)
Workers at child welfare institutions(per 100,000 persons)
(人:person (人:person (人:personPref.Code
MeanS.D.
養護老人ホーム常勤従事者数+介護老人福祉施設従事者数+軽費老人ホーム常勤従事者数+有料老人ホーム常勤従
事者数老人福祉センター常勤従事者数
児童福祉施設等常勤従事者数(助産施設,保育所等,児童館,児童遊園を除く)
分子
a) Personnel of welfare centers for the aged (Full-time) b) 指標計算式
65歳以上人口 65歳以上人口 総人口 分母
Population (65 years old and over) Population (65 years old and over) Total population (Both sexes)
出典
a) Personnel of nursing homes for the aged (Full-time) + No. of workers at elderly nursing facilities + Personnel of low-cost homes for the aged (Full-time) +No. of workers at fee-charging homes for the aged (Full-time)b) No. of workers at child welfare institutions (Excl. midwifery home, nursery, children's house, and children's playground) (Full-time)
都道府県コー
ド
161

4)社会福祉施設の定員数及び在所者数 Capacity and inmates in social welfare facilities
都道府県生活保護施設定員数
(被保護実人員千人当たり)生活保護施設在所者数
(被保護実人員千人当たり)老人ホーム定員数
(65歳以上人口千人当たり)老人ホーム在所者数
(65歳以上人口千人当たり)
Prefecture Capacity of institutions for livelihoodprotection (per 1,000 persons assisted)
Inmates in institutions for livelihoodprotection (per 1,000 persons assisted)
Capacity of homes for the aged(per 1,000 persons 65 years old and over)
(人:person (人:person (人:person
全国 All Japan
北海道 Hokkaido青森県 Aomori-ken岩手県 Iwate-ken宮城県 Miyagi-ken秋田県 Akita-ken
山形県 Yamagata-ken福島県 Fukushima-ken茨城県 Ibaraki-ken栃木県 Tochigi-ken群馬県 Gumma-ken
埼玉県 Saitama-ken千葉県 Chiba-ken東京都 Tokyo-to神奈川県 Kanagawa-ken新潟県 Niigata-ken
富山県 Toyama-ken石川県 Ishikawa-ken福井県 Fukui-ken山梨県 Yamanashi-ken長野県 Nagano-ken
岐阜県 Gifu-ken静岡県 Shizuoka-ken愛知県 Aichi-ken三重県 Mie-ken滋賀県 Shiga-ken
京都府 Kyoto-fu大阪府 Osaka-fu兵庫県 Hyogo-ken奈良県 Nara-ken和歌山県 Wakayama-ken
鳥取県 Tottori-ken島根県 Shimane-ken岡山県 Okayama-ken広島県 Hiroshima-ken山口県 Yamaguchi-ken
徳島県 Tokushima-ken香川県 Kagawa-ken愛媛県 Ehime-ken高知県 Kochi-ken福岡県 Fukuoka-ken
佐賀県 Saga-ken長崎県 Nagasaki-ken熊本県 Kumamoto-ken大分県 Oita-ken宮崎県 Miyazaki-ken
鹿児島県 Kagoshima-ken沖縄県 Okinawa-ken
平均値 Mean標準偏差 Standard deviation
分子 保護施設定員数(医療保護施設を除く) 保護施設在所者数(医療保護施設を除く)養護老人ホーム定員数+介護老人福祉施設定員数+軽費老人ホーム定員数+有料老人ホーム定員
数
指標計算式 Numerators Capacity of institutions for livelihoodprotection (Excl. medical care)
Inmates in institutions for livelihoodprotection (Excl. medical care) a) b)
Formulae ofindicators 分母 生活保護被保護実人員 生活保護被保護実人員 65歳以上人口 65歳以上人口
Denominators Persons assisted by livelihood protection Persons assisted by livelihood protection Population (65 years old and over) Population (65 years old and over)
出典 Referencea) Capacity of nursing homes for the aged + Capacity of elderly nursing facilities + Capacity of low-cost homes for the aged + Capacity of fee-charging homes for the aged
老人ホーム在所者数(65歳以上人口千人当たり)
有料老人ホーム定員数(65歳以上人口千人当たり)
有料老人ホーム在所者数(65歳以上人口千人当たり)
Inmates in homes for the aged(per 1,000 persons 65 years old and over)
Capacity of fee-charging homes for the aged(per 1,000 persons 65 years old and over)
Inmates in fee-charging homes for the aged(per 1,000 persons 65 years old and over)
(人:person (人:person (人:personPref.Code
MeanS.D.
養護老人ホーム在所者数+介護老人福祉施設在所者数+軽費老人ホーム在所者数+有料老人ホーム在所者数
有料老人ホーム定員数 有料老人ホーム在所者数 分子
b) Capacity of fee-charging homes for the aged No. of inmates in fee-charging homes for the aged 指標計算式
65歳以上人口 65歳以上人口 65歳以上人口 分母
Population (65 years old and over) Population (65 years old and over) Population (65 years old and over)
出典
b) No. of inmates in nursing homes for the aged + No. of inmates of elderly nursing facilities + No. of inmates in low-cost homes for the aged +No. of inmates in fee-charging homes for the aged
都道府県コー
ド
162

4)社会福祉施設の定員数及び在所者数 Capacity and inmates in social welfare facilities
都道府県生活保護施設定員数
(被保護実人員千人当たり)生活保護施設在所者数
(被保護実人員千人当たり)老人ホーム定員数
(65歳以上人口千人当たり)老人ホーム在所者数
(65歳以上人口千人当たり)
Prefecture Capacity of institutions for livelihoodprotection (per 1,000 persons assisted)
Inmates in institutions for livelihoodprotection (per 1,000 persons assisted)
Capacity of homes for the aged(per 1,000 persons 65 years old and over)
(人:person (人:person (人:person
全国 All Japan
北海道 Hokkaido青森県 Aomori-ken岩手県 Iwate-ken宮城県 Miyagi-ken秋田県 Akita-ken
山形県 Yamagata-ken福島県 Fukushima-ken茨城県 Ibaraki-ken栃木県 Tochigi-ken群馬県 Gumma-ken
埼玉県 Saitama-ken千葉県 Chiba-ken東京都 Tokyo-to神奈川県 Kanagawa-ken新潟県 Niigata-ken
富山県 Toyama-ken石川県 Ishikawa-ken福井県 Fukui-ken山梨県 Yamanashi-ken長野県 Nagano-ken
岐阜県 Gifu-ken静岡県 Shizuoka-ken愛知県 Aichi-ken三重県 Mie-ken滋賀県 Shiga-ken
京都府 Kyoto-fu大阪府 Osaka-fu兵庫県 Hyogo-ken奈良県 Nara-ken和歌山県 Wakayama-ken
鳥取県 Tottori-ken島根県 Shimane-ken岡山県 Okayama-ken広島県 Hiroshima-ken山口県 Yamaguchi-ken
徳島県 Tokushima-ken香川県 Kagawa-ken愛媛県 Ehime-ken高知県 Kochi-ken福岡県 Fukuoka-ken
佐賀県 Saga-ken長崎県 Nagasaki-ken熊本県 Kumamoto-ken大分県 Oita-ken宮崎県 Miyazaki-ken
鹿児島県 Kagoshima-ken沖縄県 Okinawa-ken
平均値 Mean標準偏差 Standard deviation
分子 保護施設定員数(医療保護施設を除く) 保護施設在所者数(医療保護施設を除く)養護老人ホーム定員数+介護老人福祉施設定員数+軽費老人ホーム定員数+有料老人ホーム定員
数
指標計算式 Numerators Capacity of institutions for livelihoodprotection (Excl. medical care)
Inmates in institutions for livelihoodprotection (Excl. medical care) a) b)
Formulae ofindicators 分母 生活保護被保護実人員 生活保護被保護実人員 65歳以上人口 65歳以上人口
Denominators Persons assisted by livelihood protection Persons assisted by livelihood protection Population (65 years old and over) Population (65 years old and over)
出典 Referencea) Capacity of nursing homes for the aged + Capacity of elderly nursing facilities + Capacity of low-cost homes for the aged + Capacity of fee-charging homes for the aged
老人ホーム在所者数(65歳以上人口千人当たり)
有料老人ホーム定員数(65歳以上人口千人当たり)
有料老人ホーム在所者数(65歳以上人口千人当たり)
Inmates in homes for the aged(per 1,000 persons 65 years old and over)
Capacity of fee-charging homes for the aged(per 1,000 persons 65 years old and over)
Inmates in fee-charging homes for the aged(per 1,000 persons 65 years old and over)
(人:person (人:person (人:personPref.Code
MeanS.D.
養護老人ホーム在所者数+介護老人福祉施設在所者数+軽費老人ホーム在所者数+有料老人ホーム在所者数
有料老人ホーム定員数 有料老人ホーム在所者数 分子
b) Capacity of fee-charging homes for the aged No. of inmates in fee-charging homes for the aged 指標計算式
65歳以上人口 65歳以上人口 65歳以上人口 分母
Population (65 years old and over) Population (65 years old and over) Population (65 years old and over)
出典
b) No. of inmates in nursing homes for the aged + No. of inmates of elderly nursing facilities + No. of inmates in low-cost homes for the aged +No. of inmates in fee-charging homes for the aged
都道府県コー
ド
163
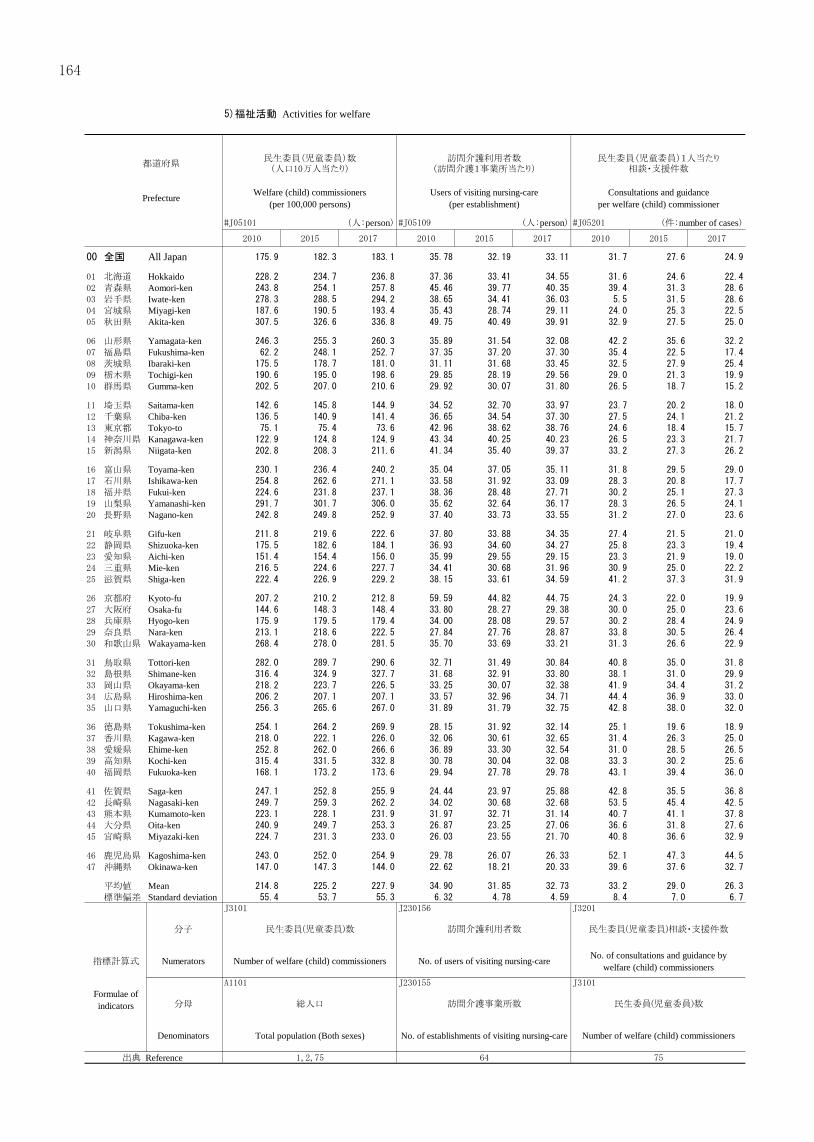
5)福祉活動 Activities for welfare
都道府県民生委員(児童委員)数(人口10万人当たり)
訪問介護利用者数(訪問介護1事業所当たり)
民生委員(児童委員)1人当たり相談・支援件数
Prefecture Welfare (child) commissioners(per 100,000 persons)
Users of visiting nursing-care(per establishment)
Consultations and guidanceper welfare (child) commissioner
(人:person (人:person (件:number of cases
全国 All Japan
北海道 Hokkaido青森県 Aomori-ken岩手県 Iwate-ken宮城県 Miyagi-ken秋田県 Akita-ken
山形県 Yamagata-ken福島県 Fukushima-ken茨城県 Ibaraki-ken栃木県 Tochigi-ken群馬県 Gumma-ken
埼玉県 Saitama-ken千葉県 Chiba-ken東京都 Tokyo-to神奈川県 Kanagawa-ken新潟県 Niigata-ken
富山県 Toyama-ken石川県 Ishikawa-ken福井県 Fukui-ken山梨県 Yamanashi-ken長野県 Nagano-ken
岐阜県 Gifu-ken静岡県 Shizuoka-ken愛知県 Aichi-ken三重県 Mie-ken滋賀県 Shiga-ken
京都府 Kyoto-fu大阪府 Osaka-fu兵庫県 Hyogo-ken奈良県 Nara-ken和歌山県 Wakayama-ken
鳥取県 Tottori-ken島根県 Shimane-ken岡山県 Okayama-ken広島県 Hiroshima-ken山口県 Yamaguchi-ken
徳島県 Tokushima-ken香川県 Kagawa-ken愛媛県 Ehime-ken高知県 Kochi-ken福岡県 Fukuoka-ken
佐賀県 Saga-ken長崎県 Nagasaki-ken熊本県 Kumamoto-ken大分県 Oita-ken宮崎県 Miyazaki-ken
鹿児島県 Kagoshima-ken沖縄県 Okinawa-ken
平均値 Mean標準偏差 Standard deviation
分子 民生委員(児童委員)数 訪問介護利用者数 民生委員(児童委員)相談・支援件数 福祉事務所生活保護申請件数
指標計算式 Numerators Number of welfare (child) commissioners No. of users of visiting nursing-care No. of consultations and guidance bywelfare (child) commissioners
Formulae ofindicators 分母 総人口 訪問介護事業所数 民生委員(児童委員)数 生活保護被保護実世帯数
Denominators Total population (Both sexes) No. of establishments of visiting nursing-care Number of welfare (child) commissioners No. of households assisted by livelihood protection
出典 Reference
福祉事務所生活保護申請件数(被保護世帯千世帯当たり)
身体障害者更生相談所取扱実人員(人口千人当たり)
知的障害者更生相談所取扱実人員(人口10万人当たり)
Applications for livelihood protection to welfare offices(per 1,000 households assisted)
Actual number of physically disabled personstreated at rehabilitation offices (per 1,000 persons)
Actual number of people with mental retardationtreated at rehabilitation offices (per 100,000 persons)
(件:number of cases (人:person (人:personPref.Code
MeanS.D.
福祉事務所生活保護申請件数 身体障害者更生相談所取扱実人員 知的障害者更生相談所取扱実人員 分子
No. of applications of livelihood protectionto welfare offices
Actual number of physically disabled persons treated atrehabilitation offices
Actual number of people with mental retardationtreated at rehabilitation offices 指標計算式
生活保護被保護実世帯数 総人口 総人口 分母
No. of households assisted by livelihood protection Total population (Both sexes) Total population (Both sexes)
出典
都道府県コー
ド
164

5)福祉活動 Activities for welfare
都道府県民生委員(児童委員)数(人口10万人当たり)
訪問介護利用者数(訪問介護1事業所当たり)
民生委員(児童委員)1人当たり相談・支援件数
Prefecture Welfare (child) commissioners(per 100,000 persons)
Users of visiting nursing-care(per establishment)
Consultations and guidanceper welfare (child) commissioner
(人:person (人:person (件:number of cases
全国 All Japan
北海道 Hokkaido青森県 Aomori-ken岩手県 Iwate-ken宮城県 Miyagi-ken秋田県 Akita-ken
山形県 Yamagata-ken福島県 Fukushima-ken茨城県 Ibaraki-ken栃木県 Tochigi-ken群馬県 Gumma-ken
埼玉県 Saitama-ken千葉県 Chiba-ken東京都 Tokyo-to神奈川県 Kanagawa-ken新潟県 Niigata-ken
富山県 Toyama-ken石川県 Ishikawa-ken福井県 Fukui-ken山梨県 Yamanashi-ken長野県 Nagano-ken
岐阜県 Gifu-ken静岡県 Shizuoka-ken愛知県 Aichi-ken三重県 Mie-ken滋賀県 Shiga-ken
京都府 Kyoto-fu大阪府 Osaka-fu兵庫県 Hyogo-ken奈良県 Nara-ken和歌山県 Wakayama-ken
鳥取県 Tottori-ken島根県 Shimane-ken岡山県 Okayama-ken広島県 Hiroshima-ken山口県 Yamaguchi-ken
徳島県 Tokushima-ken香川県 Kagawa-ken愛媛県 Ehime-ken高知県 Kochi-ken福岡県 Fukuoka-ken
佐賀県 Saga-ken長崎県 Nagasaki-ken熊本県 Kumamoto-ken大分県 Oita-ken宮崎県 Miyazaki-ken
鹿児島県 Kagoshima-ken沖縄県 Okinawa-ken
平均値 Mean標準偏差 Standard deviation
分子 民生委員(児童委員)数 訪問介護利用者数 民生委員(児童委員)相談・支援件数 福祉事務所生活保護申請件数
指標計算式 Numerators Number of welfare (child) commissioners No. of users of visiting nursing-care No. of consultations and guidance bywelfare (child) commissioners
Formulae ofindicators 分母 総人口 訪問介護事業所数 民生委員(児童委員)数 生活保護被保護実世帯数
Denominators Total population (Both sexes) No. of establishments of visiting nursing-care Number of welfare (child) commissioners No. of households assisted by livelihood protection
出典 Reference
福祉事務所生活保護申請件数(被保護世帯千世帯当たり)
身体障害者更生相談所取扱実人員(人口千人当たり)
知的障害者更生相談所取扱実人員(人口10万人当たり)
Applications for livelihood protection to welfare offices(per 1,000 households assisted)
Actual number of physically disabled personstreated at rehabilitation offices (per 1,000 persons)
Actual number of people with mental retardationtreated at rehabilitation offices (per 100,000 persons)
(件:number of cases (人:person (人:personPref.Code
MeanS.D.
福祉事務所生活保護申請件数 身体障害者更生相談所取扱実人員 知的障害者更生相談所取扱実人員 分子
No. of applications of livelihood protectionto welfare offices
Actual number of physically disabled persons treated atrehabilitation offices
Actual number of people with mental retardationtreated at rehabilitation offices 指標計算式
生活保護被保護実世帯数 総人口 総人口 分母
No. of households assisted by livelihood protection Total population (Both sexes) Total population (Both sexes)
出典
都道府県コー
ド
165

6)医療保険 Medical insurance
都道府県 児童相談所受付件数(人口千人当たり) 1人当たりの国民医療費国民健康保険被保険者数
(人口千人当たり)国民健康保険受診率(被保険者千人当たり)
Prefecture The number of receipt of child consultationcenter (per 1,000 persons)
National medical expenses per person Persons insured by national health insurance(per 1,000 persons)
(件:number of cases (千円:thousand yen (人:person
全国 All Japan
北海道 Hokkaido青森県 Aomori-ken岩手県 Iwate-ken宮城県 Miyagi-ken秋田県 Akita-ken
山形県 Yamagata-ken福島県 Fukushima-ken茨城県 Ibaraki-ken栃木県 Tochigi-ken群馬県 Gumma-ken
埼玉県 Saitama-ken千葉県 Chiba-ken東京都 Tokyo-to神奈川県 Kanagawa-ken新潟県 Niigata-ken
富山県 Toyama-ken石川県 Ishikawa-ken福井県 Fukui-ken山梨県 Yamanashi-ken長野県 Nagano-ken
岐阜県 Gifu-ken静岡県 Shizuoka-ken愛知県 Aichi-ken三重県 Mie-ken滋賀県 Shiga-ken
京都府 Kyoto-fu大阪府 Osaka-fu兵庫県 Hyogo-ken奈良県 Nara-ken和歌山県 Wakayama-ken
鳥取県 Tottori-ken島根県 Shimane-ken岡山県 Okayama-ken広島県 Hiroshima-ken山口県 Yamaguchi-ken
徳島県 Tokushima-ken香川県 Kagawa-ken愛媛県 Ehime-ken高知県 Kochi-ken福岡県 Fukuoka-ken
佐賀県 Saga-ken長崎県 Nagasaki-ken熊本県 Kumamoto-ken大分県 Oita-ken宮崎県 Miyazaki-ken
鹿児島県 Kagoshima-ken沖縄県 Okinawa-ken
平均値 Mean標準偏差 Standard deviation
※
分子 児童相談所受付件数 国民健康保険被保険者数
指標計算式 Numerators Number of receipt of child consultation center Persons insured by national health insurance 国民健康保険被保険者受診率
Formulae ofindicators 分母 総人口 Medical expenses per person 総人口
Denominators Total population (Both sexes) Total population (Both sexes)
出典 Reference
1人当たりの医療費
国民健康保険受診率(被保険者千人当たり) 国民健康保険診療費(被保険者1人当たり)全国健康保険協会管掌健康保険加入者数
(人口千人当たり)
Cases of benefits paid(per 1,000 persons insured of national health insurance)
Amount of benefits paid(per case of national health insurance)
Persons covered Japan health insurance associationhealth insurance (per 1,000 persons)
(円:yen (人:personPref.Code
MeanS.D.
※ ※
全国健康保険協会管掌健康保険加入者数(被保険者数+被扶養者数)
分子
国民健康保険被保険者受診率 国民健康保険被保険者1人当たり診療費Persons insured of Japan health insurance association health
insurance + Dependents of Japan health insurance associationhealth insurance
指標計算式
Rate of medical examination of persons insured bynational health insurance (Per 1,000 persons)
Medical consultation fee of persons insured by nationalhealth insurance (Per person) 総人口 分母
Total population (Both sexes)
出典
都道府県コー
ド
166

6)医療保険 Medical insurance
都道府県 児童相談所受付件数(人口千人当たり) 1人当たりの国民医療費国民健康保険被保険者数
(人口千人当たり)国民健康保険受診率(被保険者千人当たり)
Prefecture The number of receipt of child consultationcenter (per 1,000 persons)
National medical expenses per person Persons insured by national health insurance(per 1,000 persons)
(件:number of cases (千円:thousand yen (人:person
全国 All Japan
北海道 Hokkaido青森県 Aomori-ken岩手県 Iwate-ken宮城県 Miyagi-ken秋田県 Akita-ken
山形県 Yamagata-ken福島県 Fukushima-ken茨城県 Ibaraki-ken栃木県 Tochigi-ken群馬県 Gumma-ken
埼玉県 Saitama-ken千葉県 Chiba-ken東京都 Tokyo-to神奈川県 Kanagawa-ken新潟県 Niigata-ken
富山県 Toyama-ken石川県 Ishikawa-ken福井県 Fukui-ken山梨県 Yamanashi-ken長野県 Nagano-ken
岐阜県 Gifu-ken静岡県 Shizuoka-ken愛知県 Aichi-ken三重県 Mie-ken滋賀県 Shiga-ken
京都府 Kyoto-fu大阪府 Osaka-fu兵庫県 Hyogo-ken奈良県 Nara-ken和歌山県 Wakayama-ken
鳥取県 Tottori-ken島根県 Shimane-ken岡山県 Okayama-ken広島県 Hiroshima-ken山口県 Yamaguchi-ken
徳島県 Tokushima-ken香川県 Kagawa-ken愛媛県 Ehime-ken高知県 Kochi-ken福岡県 Fukuoka-ken
佐賀県 Saga-ken長崎県 Nagasaki-ken熊本県 Kumamoto-ken大分県 Oita-ken宮崎県 Miyazaki-ken
鹿児島県 Kagoshima-ken沖縄県 Okinawa-ken
平均値 Mean標準偏差 Standard deviation
※
分子 児童相談所受付件数 国民健康保険被保険者数
指標計算式 Numerators Number of receipt of child consultation center Persons insured by national health insurance 国民健康保険被保険者受診率
Formulae ofindicators 分母 総人口 Medical expenses per person 総人口
Denominators Total population (Both sexes) Total population (Both sexes)
出典 Reference
1人当たりの医療費
国民健康保険受診率(被保険者千人当たり) 国民健康保険診療費(被保険者1人当たり)全国健康保険協会管掌健康保険加入者数
(人口千人当たり)
Cases of benefits paid(per 1,000 persons insured of national health insurance)
Amount of benefits paid(per case of national health insurance)
Persons covered Japan health insurance associationhealth insurance (per 1,000 persons)
(円:yen (人:personPref.Code
MeanS.D.
※ ※
全国健康保険協会管掌健康保険加入者数(被保険者数+被扶養者数)
分子
国民健康保険被保険者受診率 国民健康保険被保険者1人当たり診療費Persons insured of Japan health insurance association health
insurance + Dependents of Japan health insurance associationhealth insurance
指標計算式
Rate of medical examination of persons insured bynational health insurance (Per 1,000 persons)
Medical consultation fee of persons insured by nationalhealth insurance (Per person) 総人口 分母
Total population (Both sexes)
出典
都道府県コー
ド
167
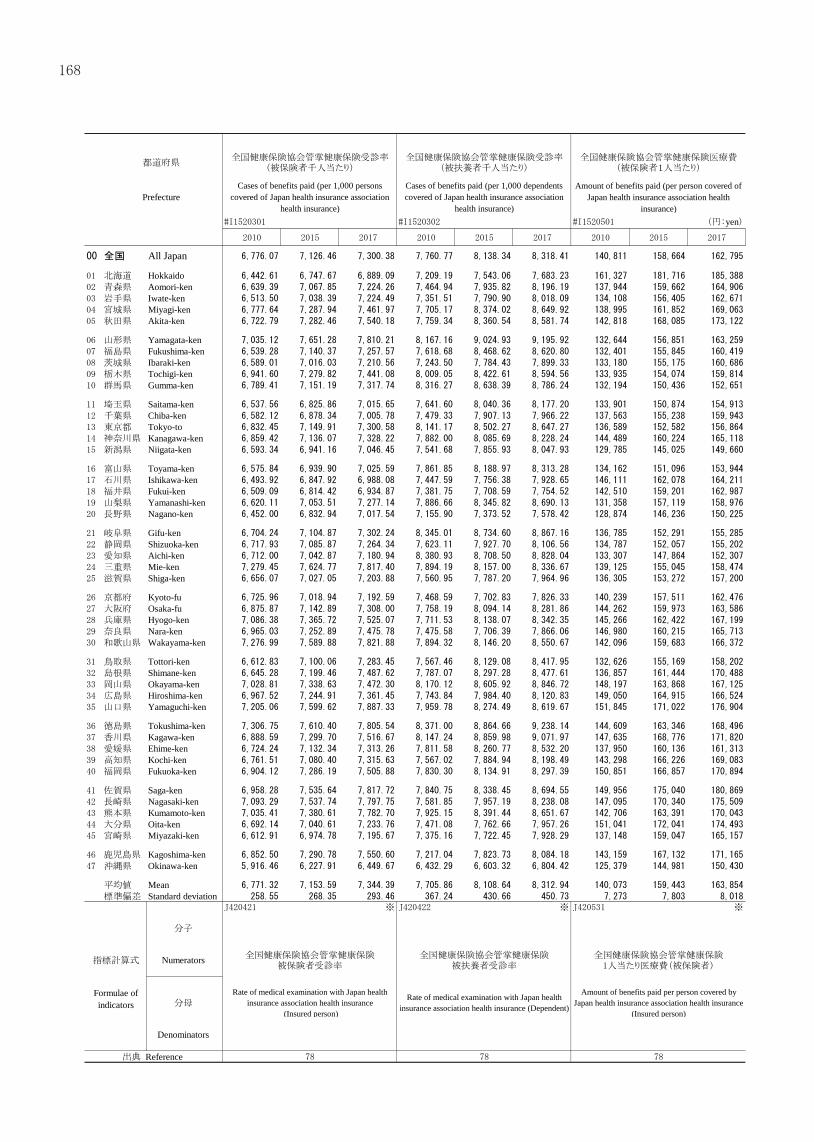
都道府県全国健康保険協会管掌健康保険受診率
(被保険者千人当たり)全国健康保険協会管掌健康保険受診率
(被扶養者千人当たり)全国健康保険協会管掌健康保険医療費
(被保険者1人当たり)
PrefectureCases of benefits paid (per 1,000 persons
covered of Japan health insurance associationhealth insurance)
Cases of benefits paid (per 1,000 dependentscovered of Japan health insurance association
health insurance)
Amount of benefits paid (per person covered ofJapan health insurance association health
insurance)(円:yen
全国 All Japan
北海道 Hokkaido青森県 Aomori-ken岩手県 Iwate-ken宮城県 Miyagi-ken秋田県 Akita-ken
山形県 Yamagata-ken福島県 Fukushima-ken茨城県 Ibaraki-ken栃木県 Tochigi-ken群馬県 Gumma-ken
埼玉県 Saitama-ken千葉県 Chiba-ken東京都 Tokyo-to神奈川県 Kanagawa-ken新潟県 Niigata-ken
富山県 Toyama-ken石川県 Ishikawa-ken福井県 Fukui-ken山梨県 Yamanashi-ken長野県 Nagano-ken
岐阜県 Gifu-ken静岡県 Shizuoka-ken愛知県 Aichi-ken三重県 Mie-ken滋賀県 Shiga-ken
京都府 Kyoto-fu大阪府 Osaka-fu兵庫県 Hyogo-ken奈良県 Nara-ken和歌山県 Wakayama-ken
鳥取県 Tottori-ken島根県 Shimane-ken岡山県 Okayama-ken広島県 Hiroshima-ken山口県 Yamaguchi-ken
徳島県 Tokushima-ken香川県 Kagawa-ken愛媛県 Ehime-ken高知県 Kochi-ken福岡県 Fukuoka-ken
佐賀県 Saga-ken長崎県 Nagasaki-ken熊本県 Kumamoto-ken大分県 Oita-ken宮崎県 Miyazaki-ken
鹿児島県 Kagoshima-ken沖縄県 Okinawa-ken
平均値 Mean標準偏差 Standard deviation
※ ※ ※
分子
指標計算式 Numerators 全国健康保険協会管掌健康保険被保険者受診率
全国健康保険協会管掌健康保険被扶養者受診率
全国健康保険協会管掌健康保険1人当たり医療費(被保険者)
Formulae ofindicators 分母
Rate of medical examination with Japan healthinsurance association health insurance
(Insured person)
Rate of medical examination with Japan healthinsurance association health insurance (Dependent)
Amount of benefits paid per person covered byJapan health insurance association health insurance
(Insured person)
Denominators
出典 Reference
7)老人医療 8)年金 AnnuityMedical care expenditure for the aged
全国健康保険協会管掌健康保険医療費(被扶養者1人当たり)
後期高齢者医療費(被保険者1人当たり)国民年金被保険者数(第1号)(20~59歳人口千人当たり)
Amount of benefits paid (per dependents covered ofJapan health insurance association health insurance)
Medical care expenditure for elderly in the latter oflife (per person insured )
Insured persons of national annuity (Class 1)(per 1,000 persons of 20-59 years old)
(円:yen (円:yen (人:personPref.Code
MeanS.D.
※ ※
国民年金被保険者数(第1号) 分子
全国健康保険協会管掌健康保険1人当たり医療費(被扶養者)
No. of insured persons of national pension(Class 1) 指標計算式
Amount of benefits paid per person covered by Japan healthinsurance association health insurance (Dependent)
Medical care expenditure for elderly in the latter of lifeper person 20~59歳人口 分母
Population (15-64, total) - Population (15-19, total) -Population (60-64, total)
出典
都道府県コー
ド
1人当たり後期高齢者医療費
168

都道府県全国健康保険協会管掌健康保険受診率
(被保険者千人当たり)全国健康保険協会管掌健康保険受診率
(被扶養者千人当たり)全国健康保険協会管掌健康保険医療費
(被保険者1人当たり)
PrefectureCases of benefits paid (per 1,000 persons
covered of Japan health insurance associationhealth insurance)
Cases of benefits paid (per 1,000 dependentscovered of Japan health insurance association
health insurance)
Amount of benefits paid (per person covered ofJapan health insurance association health
insurance)(円:yen
全国 All Japan
北海道 Hokkaido青森県 Aomori-ken岩手県 Iwate-ken宮城県 Miyagi-ken秋田県 Akita-ken
山形県 Yamagata-ken福島県 Fukushima-ken茨城県 Ibaraki-ken栃木県 Tochigi-ken群馬県 Gumma-ken
埼玉県 Saitama-ken千葉県 Chiba-ken東京都 Tokyo-to神奈川県 Kanagawa-ken新潟県 Niigata-ken
富山県 Toyama-ken石川県 Ishikawa-ken福井県 Fukui-ken山梨県 Yamanashi-ken長野県 Nagano-ken
岐阜県 Gifu-ken静岡県 Shizuoka-ken愛知県 Aichi-ken三重県 Mie-ken滋賀県 Shiga-ken
京都府 Kyoto-fu大阪府 Osaka-fu兵庫県 Hyogo-ken奈良県 Nara-ken和歌山県 Wakayama-ken
鳥取県 Tottori-ken島根県 Shimane-ken岡山県 Okayama-ken広島県 Hiroshima-ken山口県 Yamaguchi-ken
徳島県 Tokushima-ken香川県 Kagawa-ken愛媛県 Ehime-ken高知県 Kochi-ken福岡県 Fukuoka-ken
佐賀県 Saga-ken長崎県 Nagasaki-ken熊本県 Kumamoto-ken大分県 Oita-ken宮崎県 Miyazaki-ken
鹿児島県 Kagoshima-ken沖縄県 Okinawa-ken
平均値 Mean標準偏差 Standard deviation
※ ※ ※
分子
指標計算式 Numerators 全国健康保険協会管掌健康保険被保険者受診率
全国健康保険協会管掌健康保険被扶養者受診率
全国健康保険協会管掌健康保険1人当たり医療費(被保険者)
Formulae ofindicators 分母
Rate of medical examination with Japan healthinsurance association health insurance
(Insured person)
Rate of medical examination with Japan healthinsurance association health insurance (Dependent)
Amount of benefits paid per person covered byJapan health insurance association health insurance
(Insured person)
Denominators
出典 Reference
7)老人医療 8)年金 AnnuityMedical care expenditure for the aged
全国健康保険協会管掌健康保険医療費(被扶養者1人当たり)
後期高齢者医療費(被保険者1人当たり)国民年金被保険者数(第1号)(20~59歳人口千人当たり)
Amount of benefits paid (per dependents covered ofJapan health insurance association health insurance)
Medical care expenditure for elderly in the latter oflife (per person insured )
Insured persons of national annuity (Class 1)(per 1,000 persons of 20-59 years old)
(円:yen (円:yen (人:personPref.Code
MeanS.D.
※ ※
国民年金被保険者数(第1号) 分子
全国健康保険協会管掌健康保険1人当たり医療費(被扶養者)
No. of insured persons of national pension(Class 1) 指標計算式
Amount of benefits paid per person covered by Japan healthinsurance association health insurance (Dependent)
Medical care expenditure for elderly in the latter of lifeper person 20~59歳人口 分母
Population (15-64, total) - Population (15-19, total) -Population (60-64, total)
出典
都道府県コー
ド
1人当たり後期高齢者医療費
169

9)雇用保険 Employment insurance
都道府県国民年金被保険者数(第3号)(20~59歳人口千人当たり)
雇用保険受給率 雇用保険基本手当平均支給額 雇用保険(日雇)受給率
Prefecture Insured persons of national annuity (Class 3)(per 1,000 persons of 20-59 years old)
Ratio of recipients of benefits ofemployment insurance
Average of basic benefit ofemployment insurance
(人:person (%) (千円:thousand yen
全国 All Japan
北海道 Hokkaido青森県 Aomori-ken岩手県 Iwate-ken宮城県 Miyagi-ken秋田県 Akita-ken
山形県 Yamagata-ken福島県 Fukushima-ken茨城県 Ibaraki-ken栃木県 Tochigi-ken群馬県 Gumma-ken
埼玉県 Saitama-ken千葉県 Chiba-ken東京都 Tokyo-to神奈川県 Kanagawa-ken新潟県 Niigata-ken
富山県 Toyama-ken石川県 Ishikawa-ken福井県 Fukui-ken山梨県 Yamanashi-ken長野県 Nagano-ken
岐阜県 Gifu-ken静岡県 Shizuoka-ken愛知県 Aichi-ken三重県 Mie-ken滋賀県 Shiga-ken
京都府 Kyoto-fu大阪府 Osaka-fu兵庫県 Hyogo-ken奈良県 Nara-ken和歌山県 Wakayama-ken
鳥取県 Tottori-ken島根県 Shimane-ken岡山県 Okayama-ken広島県 Hiroshima-ken山口県 Yamaguchi-ken
徳島県 Tokushima-ken香川県 Kagawa-ken愛媛県 Ehime-ken高知県 Kochi-ken福岡県 Fukuoka-ken
佐賀県 Saga-ken長崎県 Nagasaki-ken熊本県 Kumamoto-ken大分県 Oita-ken宮崎県 Miyazaki-ken
鹿児島県 Kagoshima-ken沖縄県 Okinawa-ken
平均値 Mean標準偏差 Standard deviation
分子 国民年金被保険者数(第3号) 雇用保険基本手当受給者実人員 雇用保険基本手当支給額 日雇労働保険受給者実人員
指標計算式 Numerators No. of insured persons of national pension(Class 3)
Recipients of benefits of employmentinsurance
Total amount of paid basic benefit ofemployment insurance
Formulae ofindicators 分母 20~59歳人口 雇用保険被保険者数 雇用保険基本手当受給者実人員 日雇労働保険被保険者数
Denominators Population (15-64, total) - Population (15-19,total) - Population (60-64, total)
No. of persons insured by employmentinsurance
Recipients of benefits of employmentinsurance
出典 Reference
10)労働災害 Industrial accidents
雇用保険(日雇)受給率 雇用保険(日雇)基本手当平均支給額 労働者災害補償保険給付率
Ratio of day labourers receiving employmentinsurance benefits
Average of basic benefit of employmentinsurance for day labourers
Rate of workers receiving labour accidentcompensation insurance
(%) (千円:thousand yen (%)Pref.Code
MeanS.D.
日雇労働保険受給者実人員 日雇労働保険給付支給額 労働者災害補償保険給付件数 分子
Actual No. of persons receiving employment insurancebenefits (Daily employment)
Benefits from employment insurance (Dailyemployment)
Number of benefit payments by labour accidentcompensation insurance 指標計算式
日雇労働保険被保険者数 日雇労働保険受給者実人員 労働者災害補償保険適用労働者数 分母
No. of persons insured by employment insurance (Daily employment)
Actual No. of persons receiving employment insurancebenefits (Daily employment)
No. of workers receiving labour accident compensationinsurance
出典
都道府県コー
ド
170

9)雇用保険 Employment insurance
都道府県国民年金被保険者数(第3号)(20~59歳人口千人当たり)
雇用保険受給率 雇用保険基本手当平均支給額 雇用保険(日雇)受給率
Prefecture Insured persons of national annuity (Class 3)(per 1,000 persons of 20-59 years old)
Ratio of recipients of benefits ofemployment insurance
Average of basic benefit ofemployment insurance
(人:person (%) (千円:thousand yen
全国 All Japan
北海道 Hokkaido青森県 Aomori-ken岩手県 Iwate-ken宮城県 Miyagi-ken秋田県 Akita-ken
山形県 Yamagata-ken福島県 Fukushima-ken茨城県 Ibaraki-ken栃木県 Tochigi-ken群馬県 Gumma-ken
埼玉県 Saitama-ken千葉県 Chiba-ken東京都 Tokyo-to神奈川県 Kanagawa-ken新潟県 Niigata-ken
富山県 Toyama-ken石川県 Ishikawa-ken福井県 Fukui-ken山梨県 Yamanashi-ken長野県 Nagano-ken
岐阜県 Gifu-ken静岡県 Shizuoka-ken愛知県 Aichi-ken三重県 Mie-ken滋賀県 Shiga-ken
京都府 Kyoto-fu大阪府 Osaka-fu兵庫県 Hyogo-ken奈良県 Nara-ken和歌山県 Wakayama-ken
鳥取県 Tottori-ken島根県 Shimane-ken岡山県 Okayama-ken広島県 Hiroshima-ken山口県 Yamaguchi-ken
徳島県 Tokushima-ken香川県 Kagawa-ken愛媛県 Ehime-ken高知県 Kochi-ken福岡県 Fukuoka-ken
佐賀県 Saga-ken長崎県 Nagasaki-ken熊本県 Kumamoto-ken大分県 Oita-ken宮崎県 Miyazaki-ken
鹿児島県 Kagoshima-ken沖縄県 Okinawa-ken
平均値 Mean標準偏差 Standard deviation
分子 国民年金被保険者数(第3号) 雇用保険基本手当受給者実人員 雇用保険基本手当支給額 日雇労働保険受給者実人員
指標計算式 Numerators No. of insured persons of national pension(Class 3)
Recipients of benefits of employmentinsurance
Total amount of paid basic benefit ofemployment insurance
Formulae ofindicators 分母 20~59歳人口 雇用保険被保険者数 雇用保険基本手当受給者実人員 日雇労働保険被保険者数
Denominators Population (15-64, total) - Population (15-19,total) - Population (60-64, total)
No. of persons insured by employmentinsurance
Recipients of benefits of employmentinsurance
出典 Reference
10)労働災害 Industrial accidents
雇用保険(日雇)受給率 雇用保険(日雇)基本手当平均支給額 労働者災害補償保険給付率
Ratio of day labourers receiving employmentinsurance benefits
Average of basic benefit of employmentinsurance for day labourers
Rate of workers receiving labour accidentcompensation insurance
(%) (千円:thousand yen (%)Pref.Code
MeanS.D.
日雇労働保険受給者実人員 日雇労働保険給付支給額 労働者災害補償保険給付件数 分子
Actual No. of persons receiving employment insurancebenefits (Daily employment)
Benefits from employment insurance (Dailyemployment)
Number of benefit payments by labour accidentcompensation insurance 指標計算式
日雇労働保険被保険者数 日雇労働保険受給者実人員 労働者災害補償保険適用労働者数 分母
No. of persons insured by employment insurance (Daily employment)
Actual No. of persons receiving employment insurancebenefits (Daily employment)
No. of workers receiving labour accident compensationinsurance
出典
都道府県コー
ド
171

都道府県 労働者災害補償保険給付平均支給額 労働災害発生の頻度 労働災害の重さの程度
Prefecture Average of benefits of labour accidentcompensation insurance
Frequency rate of occurrence ofindustrial accidents
Severity rate of occurrence ofindustrial accidents
(千円:thousand yen
全国 All Japan
北海道 Hokkaido青森県 Aomori-ken岩手県 Iwate-ken宮城県 Miyagi-ken秋田県 Akita-ken
山形県 Yamagata-ken福島県 Fukushima-ken茨城県 Ibaraki-ken栃木県 Tochigi-ken群馬県 Gumma-ken
埼玉県 Saitama-ken千葉県 Chiba-ken東京都 Tokyo-to神奈川県 Kanagawa-ken新潟県 Niigata-ken
富山県 Toyama-ken石川県 Ishikawa-ken福井県 Fukui-ken山梨県 Yamanashi-ken長野県 Nagano-ken
岐阜県 Gifu-ken静岡県 Shizuoka-ken愛知県 Aichi-ken三重県 Mie-ken滋賀県 Shiga-ken
京都府 Kyoto-fu大阪府 Osaka-fu兵庫県 Hyogo-ken奈良県 Nara-ken和歌山県 Wakayama-ken
鳥取県 Tottori-ken島根県 Shimane-ken岡山県 Okayama-ken広島県 Hiroshima-ken山口県 Yamaguchi-ken
徳島県 Tokushima-ken香川県 Kagawa-ken愛媛県 Ehime-ken高知県 Kochi-ken福岡県 Fukuoka-ken
佐賀県 Saga-ken長崎県 Nagasaki-ken熊本県 Kumamoto-ken大分県 Oita-ken宮崎県 Miyazaki-ken
鹿児島県 Kagoshima-ken沖縄県 Okinawa-ken
平均値 Mean標準偏差 Standard deviation
※ ※
分子 労働者災害補償保険給付支給額
指標計算式 Numerators Amount of paid benefits by labour accidentcompensation insurance 労働災害度数率 労働災害強度率
Formulae ofindicators 分母 労働者災害補償保険給付件数
Frequency rate of occurrence ofindustrial accidents
Severity rate of occurrence of industrialaccidents
Denominators Number of benefit payments by labouraccident compensation insurance
出典 Reference
172

都道府県 労働者災害補償保険給付平均支給額 労働災害発生の頻度 労働災害の重さの程度
Prefecture Average of benefits of labour accidentcompensation insurance
Frequency rate of occurrence ofindustrial accidents
Severity rate of occurrence ofindustrial accidents
(千円:thousand yen
全国 All Japan
北海道 Hokkaido青森県 Aomori-ken岩手県 Iwate-ken宮城県 Miyagi-ken秋田県 Akita-ken
山形県 Yamagata-ken福島県 Fukushima-ken茨城県 Ibaraki-ken栃木県 Tochigi-ken群馬県 Gumma-ken
埼玉県 Saitama-ken千葉県 Chiba-ken東京都 Tokyo-to神奈川県 Kanagawa-ken新潟県 Niigata-ken
富山県 Toyama-ken石川県 Ishikawa-ken福井県 Fukui-ken山梨県 Yamanashi-ken長野県 Nagano-ken
岐阜県 Gifu-ken静岡県 Shizuoka-ken愛知県 Aichi-ken三重県 Mie-ken滋賀県 Shiga-ken
京都府 Kyoto-fu大阪府 Osaka-fu兵庫県 Hyogo-ken奈良県 Nara-ken和歌山県 Wakayama-ken
鳥取県 Tottori-ken島根県 Shimane-ken岡山県 Okayama-ken広島県 Hiroshima-ken山口県 Yamaguchi-ken
徳島県 Tokushima-ken香川県 Kagawa-ken愛媛県 Ehime-ken高知県 Kochi-ken福岡県 Fukuoka-ken
佐賀県 Saga-ken長崎県 Nagasaki-ken熊本県 Kumamoto-ken大分県 Oita-ken宮崎県 Miyazaki-ken
鹿児島県 Kagoshima-ken沖縄県 Okinawa-ken
平均値 Mean標準偏差 Standard deviation
※ ※
分子 労働者災害補償保険給付支給額
指標計算式 Numerators Amount of paid benefits by labour accidentcompensation insurance 労働災害度数率 労働災害強度率
Formulae ofindicators 分母 労働者災害補償保険給付件数
Frequency rate of occurrence ofindustrial accidents
Severity rate of occurrence of industrialaccidents
Denominators Number of benefit payments by labouraccident compensation insurance
出典 Reference
173

K.安全 Safety1)消防施設 Fire fighting establishments
都道府県 消防署数(可住地面積100k㎡当たり) 消防団・分団数(可住地面積100k㎡当たり)消防ポンプ自動車等現有数
(人口10万人当たり)消防水利数(人口10万人当たり)
Prefecture Fire stations(inhabitable area 100k㎡)
Fire fighting units and sub-units(inhabitable area 100k㎡)
Fire engines and cars existing(per 100,000 persons)
(署:number of fire stations (団:number of fire companies (台:quantities
全国 All Japan
北海道 Hokkaido青森県 Aomori-ken岩手県 Iwate-ken宮城県 Miyagi-ken秋田県 Akita-ken
山形県 Yamagata-ken福島県 Fukushima-ken茨城県 Ibaraki-ken栃木県 Tochigi-ken群馬県 Gumma-ken
埼玉県 Saitama-ken千葉県 Chiba-ken東京都 Tokyo-to神奈川県 Kanagawa-ken新潟県 Niigata-ken
富山県 Toyama-ken石川県 Ishikawa-ken福井県 Fukui-ken山梨県 Yamanashi-ken長野県 Nagano-ken
岐阜県 Gifu-ken静岡県 Shizuoka-ken愛知県 Aichi-ken三重県 Mie-ken滋賀県 Shiga-ken
京都府 Kyoto-fu大阪府 Osaka-fu兵庫県 Hyogo-ken奈良県 Nara-ken和歌山県 Wakayama-ken
鳥取県 Tottori-ken島根県 Shimane-ken岡山県 Okayama-ken広島県 Hiroshima-ken山口県 Yamaguchi-ken
徳島県 Tokushima-ken香川県 Kagawa-ken愛媛県 Ehime-ken高知県 Kochi-ken福岡県 Fukuoka-ken
佐賀県 Saga-ken長崎県 Nagasaki-ken熊本県 Kumamoto-ken大分県 Oita-ken宮崎県 Miyazaki-ken
鹿児島県 Kagoshima-ken沖縄県 Okinawa-ken
平均値 Mean標準偏差 Standard deviation
分子 消防本部・署数 消防団・分団数 消防ポンプ自動車等現有数 消防水利数
指標計算式 Numerators No. of fire defence headquarters andfire stations No. of fire fighting units and sub-units Fire engines and cars existing No. of water facilities for fire fighting
Formulae ofindicators 分母 可住地面積 1) 可住地面積 1) 総人口 総人口
Denominators Inhabitable area 1) Inhabitable area 1) Total population (Both sexes) Total population (Both sexes)
出典 Reference1)可住地面積は総務省統計局にて算出している。1) “Inhabitable area” is calculated by Statistics Bureau, Ministry of Internal Affairs and Communications, Japan.
消防水利数(人口10万人当たり) 消防関係人員数(人口10万人当たり) 消防吏員数(人口10万人当たり)
Water facilities for fire fighting(per 100,000 persons)
Firemen in stations and units(per 100,000 persons)
Firemen in stations (per 100,000 persons)
(所:number of facilities (人:person (人:personPref.Code
MeanS.D.
消防水利数 消防吏員数+消防団員数 消防吏員数 分子
No. of water facilities for fire fighting No. of firemen in stations +No. of volunteer firefighters No. of firemen in stations 指標計算式
総人口 総人口 総人口 分母
Total population (Both sexes) Total population (Both sexes) Total population (Both sexes)
出典
都道府県コー
ド
174

K.安全 Safety1)消防施設 Fire fighting establishments
都道府県 消防署数(可住地面積100k㎡当たり) 消防団・分団数(可住地面積100k㎡当たり)消防ポンプ自動車等現有数
(人口10万人当たり)消防水利数(人口10万人当たり)
Prefecture Fire stations(inhabitable area 100k㎡)
Fire fighting units and sub-units(inhabitable area 100k㎡)
Fire engines and cars existing(per 100,000 persons)
(署:number of fire stations (団:number of fire companies (台:quantities
全国 All Japan
北海道 Hokkaido青森県 Aomori-ken岩手県 Iwate-ken宮城県 Miyagi-ken秋田県 Akita-ken
山形県 Yamagata-ken福島県 Fukushima-ken茨城県 Ibaraki-ken栃木県 Tochigi-ken群馬県 Gumma-ken
埼玉県 Saitama-ken千葉県 Chiba-ken東京都 Tokyo-to神奈川県 Kanagawa-ken新潟県 Niigata-ken
富山県 Toyama-ken石川県 Ishikawa-ken福井県 Fukui-ken山梨県 Yamanashi-ken長野県 Nagano-ken
岐阜県 Gifu-ken静岡県 Shizuoka-ken愛知県 Aichi-ken三重県 Mie-ken滋賀県 Shiga-ken
京都府 Kyoto-fu大阪府 Osaka-fu兵庫県 Hyogo-ken奈良県 Nara-ken和歌山県 Wakayama-ken
鳥取県 Tottori-ken島根県 Shimane-ken岡山県 Okayama-ken広島県 Hiroshima-ken山口県 Yamaguchi-ken
徳島県 Tokushima-ken香川県 Kagawa-ken愛媛県 Ehime-ken高知県 Kochi-ken福岡県 Fukuoka-ken
佐賀県 Saga-ken長崎県 Nagasaki-ken熊本県 Kumamoto-ken大分県 Oita-ken宮崎県 Miyazaki-ken
鹿児島県 Kagoshima-ken沖縄県 Okinawa-ken
平均値 Mean標準偏差 Standard deviation
分子 消防本部・署数 消防団・分団数 消防ポンプ自動車等現有数 消防水利数
指標計算式 Numerators No. of fire defence headquarters andfire stations No. of fire fighting units and sub-units Fire engines and cars existing No. of water facilities for fire fighting
Formulae ofindicators 分母 可住地面積 1) 可住地面積 1) 総人口 総人口
Denominators Inhabitable area 1) Inhabitable area 1) Total population (Both sexes) Total population (Both sexes)
出典 Reference1)可住地面積は総務省統計局にて算出している。1) “Inhabitable area” is calculated by Statistics Bureau, Ministry of Internal Affairs and Communications, Japan.
消防水利数(人口10万人当たり) 消防関係人員数(人口10万人当たり) 消防吏員数(人口10万人当たり)
Water facilities for fire fighting(per 100,000 persons)
Firemen in stations and units(per 100,000 persons)
Firemen in stations (per 100,000 persons)
(所:number of facilities (人:person (人:personPref.Code
2,029.7
1,239.6
2,424.7 Mean631.4 S.D.
消防水利数 消防吏員数+消防団員数 消防吏員数 分子
No. of water facilities for fire fighting No. of firemen in stations +No. of volunteer firefighters No. of firemen in stations 指標計算式
総人口 総人口 総人口 分母
Total population (Both sexes) Total population (Both sexes) Total population (Both sexes)
出典
都道府県コー
ド
175
K
安
全
(指標)
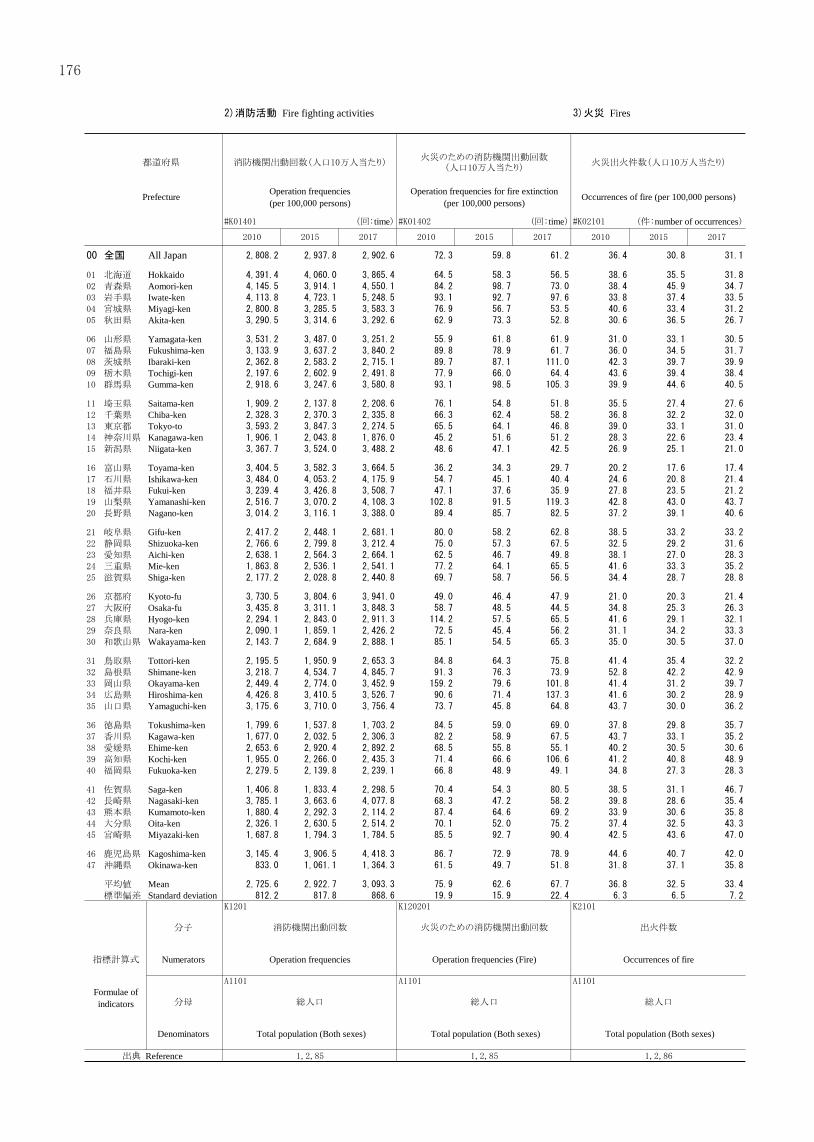
2)消防活動 Fire fighting activities 3)火災 Fires
都道府県 消防機関出動回数(人口10万人当たり)火災のための消防機関出動回数
(人口10万人当たり)火災出火件数(人口10万人当たり) 建物火災出火件数(人口10万人当たり)
Prefecture Operation frequencies(per 100,000 persons)
Operation frequencies for fire extinction(per 100,000 persons)
Occurrences of fire (per 100,000 persons) Occurrences of building fires (per 100,000 persons)
(回:time (回:time (件:number of occurrences
全国 All Japan
北海道 Hokkaido青森県 Aomori-ken岩手県 Iwate-ken宮城県 Miyagi-ken秋田県 Akita-ken
山形県 Yamagata-ken福島県 Fukushima-ken茨城県 Ibaraki-ken栃木県 Tochigi-ken群馬県 Gumma-ken
埼玉県 Saitama-ken千葉県 Chiba-ken東京都 Tokyo-to神奈川県 Kanagawa-ken新潟県 Niigata-ken
富山県 Toyama-ken石川県 Ishikawa-ken福井県 Fukui-ken山梨県 Yamanashi-ken長野県 Nagano-ken
岐阜県 Gifu-ken静岡県 Shizuoka-ken愛知県 Aichi-ken三重県 Mie-ken滋賀県 Shiga-ken
京都府 Kyoto-fu大阪府 Osaka-fu兵庫県 Hyogo-ken奈良県 Nara-ken和歌山県 Wakayama-ken
鳥取県 Tottori-ken島根県 Shimane-ken岡山県 Okayama-ken広島県 Hiroshima-ken山口県 Yamaguchi-ken
徳島県 Tokushima-ken香川県 Kagawa-ken愛媛県 Ehime-ken高知県 Kochi-ken福岡県 Fukuoka-ken
佐賀県 Saga-ken長崎県 Nagasaki-ken熊本県 Kumamoto-ken大分県 Oita-ken宮崎県 Miyazaki-ken
鹿児島県 Kagoshima-ken沖縄県 Okinawa-ken
平均値 Mean標準偏差 Standard deviation
分子 消防機関出動回数 火災のための消防機関出動回数 出火件数 建物火災出火件数
指標計算式 Numerators Operation frequencies Operation frequencies (Fire) Occurrences of fire Occurrences of building fires
Formulae ofindicators 分母 総人口 総人口 総人口 総人口
Denominators Total population (Both sexes) Total population (Both sexes) Total population (Both sexes) Total population (Both sexes)
出典 Reference
建物火災出火件数(人口10万人当たり) 火災死傷者数(人口10万人当たり) 建物火災損害額(人口1人当たり)
Occurrences of building fires (per 100,000 persons) Persons killed or injured by fires (per 100,000 persons)
Estimated value of loss by building fires(per capita)
(件:number of occurrences (人:person (円:yenPref.Code
MeanS.D.
建物火災出火件数 火災死傷者数 建物火災損害額 分子
Occurrences of building fires No. of persons killed or injured by fires Estimated value of loss by building fires 指標計算式
総人口 総人口 総人口 分母
Total population (Both sexes) Total population (Both sexes) Total population (Both sexes)
出典
都道府県コー
ド
176

2)消防活動 Fire fighting activities 3)火災 Fires
都道府県 消防機関出動回数(人口10万人当たり)火災のための消防機関出動回数
(人口10万人当たり)火災出火件数(人口10万人当たり) 建物火災出火件数(人口10万人当たり)
Prefecture Operation frequencies(per 100,000 persons)
Operation frequencies for fire extinction(per 100,000 persons)
Occurrences of fire (per 100,000 persons) Occurrences of building fires (per 100,000 persons)
(回:time (回:time (件:number of occurrences
全国 All Japan
北海道 Hokkaido青森県 Aomori-ken岩手県 Iwate-ken宮城県 Miyagi-ken秋田県 Akita-ken
山形県 Yamagata-ken福島県 Fukushima-ken茨城県 Ibaraki-ken栃木県 Tochigi-ken群馬県 Gumma-ken
埼玉県 Saitama-ken千葉県 Chiba-ken東京都 Tokyo-to神奈川県 Kanagawa-ken新潟県 Niigata-ken
富山県 Toyama-ken石川県 Ishikawa-ken福井県 Fukui-ken山梨県 Yamanashi-ken長野県 Nagano-ken
岐阜県 Gifu-ken静岡県 Shizuoka-ken愛知県 Aichi-ken三重県 Mie-ken滋賀県 Shiga-ken
京都府 Kyoto-fu大阪府 Osaka-fu兵庫県 Hyogo-ken奈良県 Nara-ken和歌山県 Wakayama-ken
鳥取県 Tottori-ken島根県 Shimane-ken岡山県 Okayama-ken広島県 Hiroshima-ken山口県 Yamaguchi-ken
徳島県 Tokushima-ken香川県 Kagawa-ken愛媛県 Ehime-ken高知県 Kochi-ken福岡県 Fukuoka-ken
佐賀県 Saga-ken長崎県 Nagasaki-ken熊本県 Kumamoto-ken大分県 Oita-ken宮崎県 Miyazaki-ken
鹿児島県 Kagoshima-ken沖縄県 Okinawa-ken
平均値 Mean標準偏差 Standard deviation
分子 消防機関出動回数 火災のための消防機関出動回数 出火件数 建物火災出火件数
指標計算式 Numerators Operation frequencies Operation frequencies (Fire) Occurrences of fire Occurrences of building fires
Formulae ofindicators 分母 総人口 総人口 総人口 総人口
Denominators Total population (Both sexes) Total population (Both sexes) Total population (Both sexes) Total population (Both sexes)
出典 Reference
建物火災出火件数(人口10万人当たり) 火災死傷者数(人口10万人当たり) 建物火災損害額(人口1人当たり)
Occurrences of building fires (per 100,000 persons) Persons killed or injured by fires (per 100,000 persons)
Estimated value of loss by building fires(per capita)
(件:number of occurrences (人:person (円:yenPref.Code
MeanS.D.
建物火災出火件数 火災死傷者数 建物火災損害額 分子
Occurrences of building fires No. of persons killed or injured by fires Estimated value of loss by building fires 指標計算式
総人口 総人口 総人口 分母
Total population (Both sexes) Total population (Both sexes) Total population (Both sexes)
出典
都道府県コー
ド
177

都道府県 火災り災世帯数(建物火災100件当たり) 火災死傷者数(建物火災100件当たり) 建物火災損害額(建物火災1件当たり) 立体横断施設数(道路実延長千km当たり)
Prefecture Households suffered by fires(per 100 building fire cases)
Persons killed or injured by fires(per 100 building fire cases)
Estimated value of loss by building fires(per fire case)
(世帯:households (人:person (万円:10 thousand yen
全国 All Japan
北海道 Hokkaido青森県 Aomori-ken岩手県 Iwate-ken宮城県 Miyagi-ken秋田県 Akita-ken
山形県 Yamagata-ken福島県 Fukushima-ken茨城県 Ibaraki-ken栃木県 Tochigi-ken群馬県 Gumma-ken
埼玉県 Saitama-ken千葉県 Chiba-ken東京都 Tokyo-to神奈川県 Kanagawa-ken新潟県 Niigata-ken
富山県 Toyama-ken石川県 Ishikawa-ken福井県 Fukui-ken山梨県 Yamanashi-ken長野県 Nagano-ken
岐阜県 Gifu-ken静岡県 Shizuoka-ken愛知県 Aichi-ken三重県 Mie-ken滋賀県 Shiga-ken
京都府 Kyoto-fu大阪府 Osaka-fu兵庫県 Hyogo-ken奈良県 Nara-ken和歌山県 Wakayama-ken
鳥取県 Tottori-ken島根県 Shimane-ken岡山県 Okayama-ken広島県 Hiroshima-ken山口県 Yamaguchi-ken
徳島県 Tokushima-ken香川県 Kagawa-ken愛媛県 Ehime-ken高知県 Kochi-ken福岡県 Fukuoka-ken
佐賀県 Saga-ken長崎県 Nagasaki-ken熊本県 Kumamoto-ken大分県 Oita-ken宮崎県 Miyazaki-ken
鹿児島県 Kagoshima-ken沖縄県 Okinawa-ken
平均値 Mean標準偏差 Standard deviation
分子 火災り災世帯数 火災死傷者数 建物火災損害額 立体横断施設数
指標計算式 Numerators No. of households suffered by fires No. of persons killed or injured by fires Estimated value of loss by building fires No. of elevated crossings
Formulae ofindicators 分母 建物火災出火件数 建物火災出火件数 建物火災出火件数 道路実延長
Denominators Occurrences of building fires Occurrences of building fires Occurrences of building fires Total real length of roads
出典 Reference
4)交通安全施設 5)交通事故・違反 Traffic accidents , traffic violations Facilities for road traffic safety
立体横断施設数(道路実延長千km当たり) 交通事故発生件数(道路実延長千km当たり) 交通事故発生件数(人口10万人当たり)
Elevated crossings(per 1,000km of real length of roads)
Traffic accidents (per 1,000km real length of roads) Traffic accidents (per 100,000 persons)
(所:number of facilities (件:number of cases (件:number of casesPref.Code
MeanS.D.
立体横断施設数 交通事故発生件数 交通事故発生件数 分子
No. of elevated crossings No. of traffic accidents No. of traffic accidents 指標計算式
道路実延長 道路実延長 総人口 分母
Total real length of roads Total real length of roads Total population (Both sexes)
出典
都道府県コー
ド
178

都道府県 火災り災世帯数(建物火災100件当たり) 火災死傷者数(建物火災100件当たり) 建物火災損害額(建物火災1件当たり) 立体横断施設数(道路実延長千km当たり)
Prefecture Households suffered by fires(per 100 building fire cases)
Persons killed or injured by fires(per 100 building fire cases)
Estimated value of loss by building fires(per fire case)
(世帯:households (人:person (万円:10 thousand yen
全国 All Japan
北海道 Hokkaido青森県 Aomori-ken岩手県 Iwate-ken宮城県 Miyagi-ken秋田県 Akita-ken
山形県 Yamagata-ken福島県 Fukushima-ken茨城県 Ibaraki-ken栃木県 Tochigi-ken群馬県 Gumma-ken
埼玉県 Saitama-ken千葉県 Chiba-ken東京都 Tokyo-to神奈川県 Kanagawa-ken新潟県 Niigata-ken
富山県 Toyama-ken石川県 Ishikawa-ken福井県 Fukui-ken山梨県 Yamanashi-ken長野県 Nagano-ken
岐阜県 Gifu-ken静岡県 Shizuoka-ken愛知県 Aichi-ken三重県 Mie-ken滋賀県 Shiga-ken
京都府 Kyoto-fu大阪府 Osaka-fu兵庫県 Hyogo-ken奈良県 Nara-ken和歌山県 Wakayama-ken
鳥取県 Tottori-ken島根県 Shimane-ken岡山県 Okayama-ken広島県 Hiroshima-ken山口県 Yamaguchi-ken
徳島県 Tokushima-ken香川県 Kagawa-ken愛媛県 Ehime-ken高知県 Kochi-ken福岡県 Fukuoka-ken
佐賀県 Saga-ken長崎県 Nagasaki-ken熊本県 Kumamoto-ken大分県 Oita-ken宮崎県 Miyazaki-ken
鹿児島県 Kagoshima-ken沖縄県 Okinawa-ken
平均値 Mean標準偏差 Standard deviation
分子 火災り災世帯数 火災死傷者数 建物火災損害額 立体横断施設数
指標計算式 Numerators No. of households suffered by fires No. of persons killed or injured by fires Estimated value of loss by building fires No. of elevated crossings
Formulae ofindicators 分母 建物火災出火件数 建物火災出火件数 建物火災出火件数 道路実延長
Denominators Occurrences of building fires Occurrences of building fires Occurrences of building fires Total real length of roads
出典 Reference
4)交通安全施設 5)交通事故・違反 Traffic accidents , traffic violations Facilities for road traffic safety
立体横断施設数(道路実延長千km当たり) 交通事故発生件数(道路実延長千km当たり) 交通事故発生件数(人口10万人当たり)
Elevated crossings(per 1,000km of real length of roads)
Traffic accidents (per 1,000km real length of roads) Traffic accidents (per 100,000 persons)
(所:number of facilities (件:number of cases (件:number of casesPref.Code
MeanS.D.
立体横断施設数 交通事故発生件数 交通事故発生件数 分子
No. of elevated crossings No. of traffic accidents No. of traffic accidents 指標計算式
道路実延長 道路実延長 総人口 分母
Total real length of roads Total real length of roads Total population (Both sexes)
出典
都道府県コー
ド
179

都道府県 交通事故死傷者数(人口10万人当たり) 交通事故死者数(人口10万人当たり) 交通事故負傷者数(人口10万人当たり) 交通事故死傷者数(交通事故100件当たり)
Prefecture Persons killed or injured by traffic accidents(per 100,000 persons)
Persons killed by traffic accidents(per 100,000 persons)
Persons injured by traffic accidents(per 100,000 persons)
Persons killed or injured(per 100 traffic accidents)
(人:person (人:person (人:person
全国 All Japan
北海道 Hokkaido青森県 Aomori-ken岩手県 Iwate-ken宮城県 Miyagi-ken秋田県 Akita-ken
山形県 Yamagata-ken福島県 Fukushima-ken茨城県 Ibaraki-ken栃木県 Tochigi-ken群馬県 Gumma-ken
埼玉県 Saitama-ken千葉県 Chiba-ken東京都 Tokyo-to神奈川県 Kanagawa-ken新潟県 Niigata-ken
富山県 Toyama-ken石川県 Ishikawa-ken福井県 Fukui-ken山梨県 Yamanashi-ken長野県 Nagano-ken
岐阜県 Gifu-ken静岡県 Shizuoka-ken愛知県 Aichi-ken三重県 Mie-ken滋賀県 Shiga-ken
京都府 Kyoto-fu大阪府 Osaka-fu兵庫県 Hyogo-ken奈良県 Nara-ken和歌山県 Wakayama-ken
鳥取県 Tottori-ken島根県 Shimane-ken岡山県 Okayama-ken広島県 Hiroshima-ken山口県 Yamaguchi-ken
徳島県 Tokushima-ken香川県 Kagawa-ken愛媛県 Ehime-ken高知県 Kochi-ken福岡県 Fukuoka-ken
佐賀県 Saga-ken長崎県 Nagasaki-ken熊本県 Kumamoto-ken大分県 Oita-ken宮崎県 Miyazaki-ken
鹿児島県 Kagoshima-ken沖縄県 Okinawa-ken
平均値 Mean標準偏差 Standard deviation
分子 交通事故死傷者数 交通事故死者数 交通事故負傷者数 交通事故死傷者数
指標計算式 Numerators No. of persons killed or injured bytraffic accidents No. of persons killed by traffic accidents No. of persons injured by traffic accidents No. of persons killed or injured by traffic accidents
Formulae ofindicators 分母 総人口 総人口 総人口 交通事故発生件数
Denominators Total population (Both sexes) Total population (Both sexes) Total population (Both sexes) No. of traffic accidents
出典 Reference
交通事故死傷者数(交通事故100件当たり) 交通事故死者数(交通事故100件当たり) 道路交通法違反検挙件数(人口千人当たり)
Persons killed or injured(per 100 traffic accidents)
Persons killed (per 100 traffic accidents) Arrests for traffic violations (per 1,000 persons)
(人:person (人:person (件:number of casesPref.Code
MeanS.D.
交通事故死傷者数 交通事故死者数 道路交通法違反検挙総件数(告知・送致) 分子
No. of persons killed or injured by traffic accidents No. of persons killed by traffic accidents Arrests for traffic violations (Total) 指標計算式
交通事故発生件数 交通事故発生件数 総人口 分母
No. of traffic accidents No. of traffic accidents Total population (Both sexes)
出典
都道府県コー
ド
180

都道府県 交通事故死傷者数(人口10万人当たり) 交通事故死者数(人口10万人当たり) 交通事故負傷者数(人口10万人当たり) 交通事故死傷者数(交通事故100件当たり)
Prefecture Persons killed or injured by traffic accidents(per 100,000 persons)
Persons killed by traffic accidents(per 100,000 persons)
Persons injured by traffic accidents(per 100,000 persons)
Persons killed or injured(per 100 traffic accidents)
(人:person (人:person (人:person
全国 All Japan
北海道 Hokkaido青森県 Aomori-ken岩手県 Iwate-ken宮城県 Miyagi-ken秋田県 Akita-ken
山形県 Yamagata-ken福島県 Fukushima-ken茨城県 Ibaraki-ken栃木県 Tochigi-ken群馬県 Gumma-ken
埼玉県 Saitama-ken千葉県 Chiba-ken東京都 Tokyo-to神奈川県 Kanagawa-ken新潟県 Niigata-ken
富山県 Toyama-ken石川県 Ishikawa-ken福井県 Fukui-ken山梨県 Yamanashi-ken長野県 Nagano-ken
岐阜県 Gifu-ken静岡県 Shizuoka-ken愛知県 Aichi-ken三重県 Mie-ken滋賀県 Shiga-ken
京都府 Kyoto-fu大阪府 Osaka-fu兵庫県 Hyogo-ken奈良県 Nara-ken和歌山県 Wakayama-ken
鳥取県 Tottori-ken島根県 Shimane-ken岡山県 Okayama-ken広島県 Hiroshima-ken山口県 Yamaguchi-ken
徳島県 Tokushima-ken香川県 Kagawa-ken愛媛県 Ehime-ken高知県 Kochi-ken福岡県 Fukuoka-ken
佐賀県 Saga-ken長崎県 Nagasaki-ken熊本県 Kumamoto-ken大分県 Oita-ken宮崎県 Miyazaki-ken
鹿児島県 Kagoshima-ken沖縄県 Okinawa-ken
平均値 Mean標準偏差 Standard deviation
分子 交通事故死傷者数 交通事故死者数 交通事故負傷者数 交通事故死傷者数
指標計算式 Numerators No. of persons killed or injured bytraffic accidents No. of persons killed by traffic accidents No. of persons injured by traffic accidents No. of persons killed or injured by traffic accidents
Formulae ofindicators 分母 総人口 総人口 総人口 交通事故発生件数
Denominators Total population (Both sexes) Total population (Both sexes) Total population (Both sexes) No. of traffic accidents
出典 Reference
交通事故死傷者数(交通事故100件当たり) 交通事故死者数(交通事故100件当たり) 道路交通法違反検挙件数(人口千人当たり)
Persons killed or injured(per 100 traffic accidents)
Persons killed (per 100 traffic accidents) Arrests for traffic violations (per 1,000 persons)
(人:person (人:person (件:number of casesPref.Code
MeanS.D.
交通事故死傷者数 交通事故死者数 道路交通法違反検挙総件数(告知・送致) 分子
No. of persons killed or injured by traffic accidents No. of persons killed by traffic accidents Arrests for traffic violations (Total) 指標計算式
交通事故発生件数 交通事故発生件数 総人口 分母
No. of traffic accidents No. of traffic accidents Total population (Both sexes)
出典
都道府県コー
ド
181

6)防犯 Crime prevention 7)犯罪 Crimes
都道府県 警察官数(人口千人当たり) 刑法犯認知件数(人口千人当たり) 窃盗犯認知件数(人口千人当たり) 刑法犯検挙率
Prefecture Police men (per 1,000 persons) Recognitions of criminal offenses(per 1,000 persons)
Recognitions of larceny offenses(per 1,000 persons)
Ratio of arrests to recognitions of criminal offenses
(人:person (件:number of cases (件:number of cases
全国 All Japan
北海道 Hokkaido青森県 Aomori-ken岩手県 Iwate-ken宮城県 Miyagi-ken秋田県 Akita-ken
山形県 Yamagata-ken福島県 Fukushima-ken茨城県 Ibaraki-ken栃木県 Tochigi-ken群馬県 Gumma-ken
埼玉県 Saitama-ken千葉県 Chiba-ken東京都 Tokyo-to神奈川県 Kanagawa-ken新潟県 Niigata-ken
富山県 Toyama-ken石川県 Ishikawa-ken福井県 Fukui-ken山梨県 Yamanashi-ken長野県 Nagano-ken
岐阜県 Gifu-ken静岡県 Shizuoka-ken愛知県 Aichi-ken三重県 Mie-ken滋賀県 Shiga-ken
京都府 Kyoto-fu大阪府 Osaka-fu兵庫県 Hyogo-ken奈良県 Nara-ken和歌山県 Wakayama-ken
鳥取県 Tottori-ken島根県 Shimane-ken岡山県 Okayama-ken広島県 Hiroshima-ken山口県 Yamaguchi-ken
徳島県 Tokushima-ken香川県 Kagawa-ken愛媛県 Ehime-ken高知県 Kochi-ken福岡県 Fukuoka-ken
佐賀県 Saga-ken長崎県 Nagasaki-ken熊本県 Kumamoto-ken大分県 Oita-ken宮崎県 Miyazaki-ken
鹿児島県 Kagoshima-ken沖縄県 Okinawa-ken
平均値 Mean標準偏差 Standard deviation
分子 警察官数 刑法犯認知件数 窃盗犯認知件数 刑法犯検挙件数
指標計算式 Numerators No. of police men Recognitions of criminal offenses Recognitions of larceny offenses Arrests to recognitions of criminal offenses
Formulae ofindicators 分母 総人口 総人口 総人口 刑法犯認知件数
Denominators Total population (Both sexes) Total population (Both sexes) Total population (Both sexes) Recognitions of criminal offenses
出典 Reference
刑法犯検挙率 窃盗犯検挙率 刑法犯認知件数に占める凶悪犯の割合
Ratio of arrests to recognitions of criminal offenses Ratio of arrests to recognitions of larceny offenses Ratio of felonious offenses to recognitions ofcriminal offenses
(%) (%) (%)Pref.Code
MeanS.D.
刑法犯検挙件数 窃盗犯検挙件数 凶悪犯認知件数 分子
Arrests to recognitions of criminal offenses Arrests to recognitions of larceny offenses Recognitions of felonious offences 指標計算式
刑法犯認知件数 窃盗犯認知件数 刑法犯認知件数 分母
Recognitions of criminal offenses Recognitions of larceny offenses Recognitions of criminal offenses
出典
都道府県コー
ド
182

6)防犯 Crime prevention 7)犯罪 Crimes
都道府県 警察官数(人口千人当たり) 刑法犯認知件数(人口千人当たり) 窃盗犯認知件数(人口千人当たり) 刑法犯検挙率
Prefecture Police men (per 1,000 persons) Recognitions of criminal offenses(per 1,000 persons)
Recognitions of larceny offenses(per 1,000 persons)
Ratio of arrests to recognitions of criminal offenses
(人:person (件:number of cases (件:number of cases
全国 All Japan
北海道 Hokkaido青森県 Aomori-ken岩手県 Iwate-ken宮城県 Miyagi-ken秋田県 Akita-ken
山形県 Yamagata-ken福島県 Fukushima-ken茨城県 Ibaraki-ken栃木県 Tochigi-ken群馬県 Gumma-ken
埼玉県 Saitama-ken千葉県 Chiba-ken東京都 Tokyo-to神奈川県 Kanagawa-ken新潟県 Niigata-ken
富山県 Toyama-ken石川県 Ishikawa-ken福井県 Fukui-ken山梨県 Yamanashi-ken長野県 Nagano-ken
岐阜県 Gifu-ken静岡県 Shizuoka-ken愛知県 Aichi-ken三重県 Mie-ken滋賀県 Shiga-ken
京都府 Kyoto-fu大阪府 Osaka-fu兵庫県 Hyogo-ken奈良県 Nara-ken和歌山県 Wakayama-ken
鳥取県 Tottori-ken島根県 Shimane-ken岡山県 Okayama-ken広島県 Hiroshima-ken山口県 Yamaguchi-ken
徳島県 Tokushima-ken香川県 Kagawa-ken愛媛県 Ehime-ken高知県 Kochi-ken福岡県 Fukuoka-ken
佐賀県 Saga-ken長崎県 Nagasaki-ken熊本県 Kumamoto-ken大分県 Oita-ken宮崎県 Miyazaki-ken
鹿児島県 Kagoshima-ken沖縄県 Okinawa-ken
平均値 Mean標準偏差 Standard deviation
分子 警察官数 刑法犯認知件数 窃盗犯認知件数 刑法犯検挙件数
指標計算式 Numerators No. of police men Recognitions of criminal offenses Recognitions of larceny offenses Arrests to recognitions of criminal offenses
Formulae ofindicators 分母 総人口 総人口 総人口 刑法犯認知件数
Denominators Total population (Both sexes) Total population (Both sexes) Total population (Both sexes) Recognitions of criminal offenses
出典 Reference
刑法犯検挙率 窃盗犯検挙率 刑法犯認知件数に占める凶悪犯の割合
Ratio of arrests to recognitions of criminal offenses Ratio of arrests to recognitions of larceny offenses Ratio of felonious offenses to recognitions ofcriminal offenses
(%) (%) (%)Pref.Code
MeanS.D.
刑法犯検挙件数 窃盗犯検挙件数 凶悪犯認知件数 分子
Arrests to recognitions of criminal offenses Arrests to recognitions of larceny offenses Recognitions of felonious offences 指標計算式
刑法犯認知件数 窃盗犯認知件数 刑法犯認知件数 分母
Recognitions of criminal offenses Recognitions of larceny offenses Recognitions of criminal offenses
出典
都道府県コー
ド
183

都道府県 刑法犯認知件数に占める粗暴犯の割合 刑法犯認知件数に占める窃盗犯の割合 刑法犯認知件数に占める風俗犯の割合 少年刑法犯検挙人員(14~19歳人口千人当たり)
Prefecture Ratio of violent offenses to recognitions ofcriminal offenses
Ratio of larceny offenses to recognitions ofcriminal offenses
Ratio of moral offenses to recognitions ofcriminal offenses
(%) (%) (%)
全国 All Japan
北海道 Hokkaido青森県 Aomori-ken岩手県 Iwate-ken宮城県 Miyagi-ken秋田県 Akita-ken
山形県 Yamagata-ken福島県 Fukushima-ken茨城県 Ibaraki-ken栃木県 Tochigi-ken群馬県 Gumma-ken
埼玉県 Saitama-ken千葉県 Chiba-ken東京都 Tokyo-to神奈川県 Kanagawa-ken新潟県 Niigata-ken
富山県 Toyama-ken石川県 Ishikawa-ken福井県 Fukui-ken山梨県 Yamanashi-ken長野県 Nagano-ken
岐阜県 Gifu-ken静岡県 Shizuoka-ken愛知県 Aichi-ken三重県 Mie-ken滋賀県 Shiga-ken
京都府 Kyoto-fu大阪府 Osaka-fu兵庫県 Hyogo-ken奈良県 Nara-ken和歌山県 Wakayama-ken
鳥取県 Tottori-ken島根県 Shimane-ken岡山県 Okayama-ken広島県 Hiroshima-ken山口県 Yamaguchi-ken
徳島県 Tokushima-ken香川県 Kagawa-ken愛媛県 Ehime-ken高知県 Kochi-ken福岡県 Fukuoka-ken
佐賀県 Saga-ken長崎県 Nagasaki-ken熊本県 Kumamoto-ken大分県 Oita-ken宮崎県 Miyazaki-ken
鹿児島県 Kagoshima-ken沖縄県 Okinawa-ken
平均値 Mean標準偏差 Standard deviation
分子 粗暴犯認知件数 窃盗犯認知件数 風俗犯認知件数 少年刑法犯検挙人員
指標計算式 Numerators Recognitions of violent offences Recognitions of larceny offenses Recognitions of moral offences Juvenile delinquent arrested for criminal offenses
Formulae ofindicators 分母 刑法犯認知件数 刑法犯認知件数 刑法犯認知件数 14~19歳人口
Denominators Recognitions of criminal offenses Recognitions of criminal offenses Recognitions of criminal offenses Population (14-19, total)
出典 Reference
少年刑法犯検挙人員(14~19歳人口千人当たり) 少年窃盗犯検挙人員(14~19歳人口千人当たり) 特別法犯検挙件数(人口10万人当たり)
Juvenile delinquent arrested for criminal offenses(per 1,000 persons of 14-19 years old)
Juvenile delinquent arrested for criminal larceny(per 1,000 persons of 14-19 years old)
Cases indicted for special criminal laws(per 100,000 persons)
(人:person (人:person (件:number of casesPref.Code
MeanS.D.
少年刑法犯検挙人員 少年窃盗犯検挙人員 特別法犯検挙件数 分子
Juvenile delinquent arrested for criminal offenses Juvenile delinquent arrested for criminal larceny Cases indicted for special criminal laws 指標計算式
14~19歳人口 14~19歳人口 総人口 分母
Population (14-19, total) Population (14-19, total) Total population (Both sexes)
出典
都道府県コー
ド
184

都道府県 刑法犯認知件数に占める粗暴犯の割合 刑法犯認知件数に占める窃盗犯の割合 刑法犯認知件数に占める風俗犯の割合 少年刑法犯検挙人員(14~19歳人口千人当たり)
Prefecture Ratio of violent offenses to recognitions ofcriminal offenses
Ratio of larceny offenses to recognitions ofcriminal offenses
Ratio of moral offenses to recognitions ofcriminal offenses
(%) (%) (%)
全国 All Japan
北海道 Hokkaido青森県 Aomori-ken岩手県 Iwate-ken宮城県 Miyagi-ken秋田県 Akita-ken
山形県 Yamagata-ken福島県 Fukushima-ken茨城県 Ibaraki-ken栃木県 Tochigi-ken群馬県 Gumma-ken
埼玉県 Saitama-ken千葉県 Chiba-ken東京都 Tokyo-to神奈川県 Kanagawa-ken新潟県 Niigata-ken
富山県 Toyama-ken石川県 Ishikawa-ken福井県 Fukui-ken山梨県 Yamanashi-ken長野県 Nagano-ken
岐阜県 Gifu-ken静岡県 Shizuoka-ken愛知県 Aichi-ken三重県 Mie-ken滋賀県 Shiga-ken
京都府 Kyoto-fu大阪府 Osaka-fu兵庫県 Hyogo-ken奈良県 Nara-ken和歌山県 Wakayama-ken
鳥取県 Tottori-ken島根県 Shimane-ken岡山県 Okayama-ken広島県 Hiroshima-ken山口県 Yamaguchi-ken
徳島県 Tokushima-ken香川県 Kagawa-ken愛媛県 Ehime-ken高知県 Kochi-ken福岡県 Fukuoka-ken
佐賀県 Saga-ken長崎県 Nagasaki-ken熊本県 Kumamoto-ken大分県 Oita-ken宮崎県 Miyazaki-ken
鹿児島県 Kagoshima-ken沖縄県 Okinawa-ken
平均値 Mean標準偏差 Standard deviation
分子 粗暴犯認知件数 窃盗犯認知件数 風俗犯認知件数 少年刑法犯検挙人員
指標計算式 Numerators Recognitions of violent offences Recognitions of larceny offenses Recognitions of moral offences Juvenile delinquent arrested for criminal offenses
Formulae ofindicators 分母 刑法犯認知件数 刑法犯認知件数 刑法犯認知件数 14~19歳人口
Denominators Recognitions of criminal offenses Recognitions of criminal offenses Recognitions of criminal offenses Population (14-19, total)
出典 Reference
少年刑法犯検挙人員(14~19歳人口千人当たり) 少年窃盗犯検挙人員(14~19歳人口千人当たり) 特別法犯検挙件数(人口10万人当たり)
Juvenile delinquent arrested for criminal offenses(per 1,000 persons of 14-19 years old)
Juvenile delinquent arrested for criminal larceny(per 1,000 persons of 14-19 years old)
Cases indicted for special criminal laws(per 100,000 persons)
(人:person (人:person (件:number of casesPref.Code
MeanS.D.
少年刑法犯検挙人員 少年窃盗犯検挙人員 特別法犯検挙件数 分子
Juvenile delinquent arrested for criminal offenses Juvenile delinquent arrested for criminal larceny Cases indicted for special criminal laws 指標計算式
14~19歳人口 14~19歳人口 総人口 分母
Population (14-19, total) Population (14-19, total) Total population (Both sexes)
出典
都道府県コー
ド
185

8)自然災害 Natural disasters 9)不慮の事故 Accidents
都道府県覚せい剤取締検挙件数(人口10万人当たり)
災害被害額(人口1人当たり)不慮の事故による死亡者数
(人口10万人当たり)公害苦情件数(人口10万人当たり)
Prefecture Cases indicted for drug law(per 100,000 persons)
Value of damage by disasters (per capita) Deaths by accidents (per 100,000 persons)
(件:number of cases (円:yen (人:person
全国 All Japan
北海道 Hokkaido青森県 Aomori-ken岩手県 Iwate-ken宮城県 Miyagi-ken秋田県 Akita-ken
山形県 Yamagata-ken福島県 Fukushima-ken茨城県 Ibaraki-ken栃木県 Tochigi-ken群馬県 Gumma-ken
埼玉県 Saitama-ken千葉県 Chiba-ken東京都 Tokyo-to神奈川県 Kanagawa-ken新潟県 Niigata-ken
富山県 Toyama-ken石川県 Ishikawa-ken福井県 Fukui-ken山梨県 Yamanashi-ken長野県 Nagano-ken
岐阜県 Gifu-ken静岡県 Shizuoka-ken愛知県 Aichi-ken三重県 Mie-ken滋賀県 Shiga-ken
京都府 Kyoto-fu大阪府 Osaka-fu兵庫県 Hyogo-ken奈良県 Nara-ken和歌山県 Wakayama-ken
鳥取県 Tottori-ken島根県 Shimane-ken岡山県 Okayama-ken広島県 Hiroshima-ken山口県 Yamaguchi-ken
徳島県 Tokushima-ken香川県 Kagawa-ken愛媛県 Ehime-ken高知県 Kochi-ken福岡県 Fukuoka-ken
佐賀県 Saga-ken長崎県 Nagasaki-ken熊本県 Kumamoto-ken大分県 Oita-ken宮崎県 Miyazaki-ken
鹿児島県 Kagoshima-ken沖縄県 Okinawa-ken
平均値 Mean標準偏差 Standard deviation
分子 覚せい剤取締検挙件数 災害被害額 不慮の事故による死亡者数 公害苦情件数
指標計算式 Numerators Cases indicted for drug laws Value of damage by disasters Freak accident fatalities
Formulae ofindicators 分母 総人口 総人口 総人口 総人口
Denominators Total population (Both sexes) Total population (Both sexes) Total population (Both sexes) Total population (Both sexes)
出典 Reference
10)公害 Pollution 11)保険 Insurance
公害苦情件数(人口10万人当たり) 民間生命保険保有契約件数(人口千人当たり) 民間生命保険保険金額(保有契約1件当たり)
Cases of grievances against pollution(per 100,000 persons)
Private life insurance policies in force(per 1,000 persons)
Amount insured by private life insurance(per policy in force)
(件:number of cases (件:number of contracts (万円:10 thousand yenPref.Code
MeanS.D.
公害苦情件数 民間生命保険保有契約件数 民間生命保険保有契約保険金額 分子
Private life insurance policies in force Insurance paid by private life insurance 指標計算式
総人口 総人口 民間生命保険保有契約件数 分母
Total population (Both sexes) Total population (Both sexes) Private life insurance policies in force
出典
都道府県コー
ド
Cases of grievances against pollution(7 major environmental pollutions)
186

8)自然災害 Natural disasters 9)不慮の事故 Accidents
都道府県覚せい剤取締検挙件数(人口10万人当たり)
災害被害額(人口1人当たり)不慮の事故による死亡者数
(人口10万人当たり)公害苦情件数(人口10万人当たり)
Prefecture Cases indicted for drug law(per 100,000 persons)
Value of damage by disasters (per capita) Deaths by accidents (per 100,000 persons)
(件:number of cases (円:yen (人:person
全国 All Japan
北海道 Hokkaido青森県 Aomori-ken岩手県 Iwate-ken宮城県 Miyagi-ken秋田県 Akita-ken
山形県 Yamagata-ken福島県 Fukushima-ken茨城県 Ibaraki-ken栃木県 Tochigi-ken群馬県 Gumma-ken
埼玉県 Saitama-ken千葉県 Chiba-ken東京都 Tokyo-to神奈川県 Kanagawa-ken新潟県 Niigata-ken
富山県 Toyama-ken石川県 Ishikawa-ken福井県 Fukui-ken山梨県 Yamanashi-ken長野県 Nagano-ken
岐阜県 Gifu-ken静岡県 Shizuoka-ken愛知県 Aichi-ken三重県 Mie-ken滋賀県 Shiga-ken
京都府 Kyoto-fu大阪府 Osaka-fu兵庫県 Hyogo-ken奈良県 Nara-ken和歌山県 Wakayama-ken
鳥取県 Tottori-ken島根県 Shimane-ken岡山県 Okayama-ken広島県 Hiroshima-ken山口県 Yamaguchi-ken
徳島県 Tokushima-ken香川県 Kagawa-ken愛媛県 Ehime-ken高知県 Kochi-ken福岡県 Fukuoka-ken
佐賀県 Saga-ken長崎県 Nagasaki-ken熊本県 Kumamoto-ken大分県 Oita-ken宮崎県 Miyazaki-ken
鹿児島県 Kagoshima-ken沖縄県 Okinawa-ken
平均値 Mean標準偏差 Standard deviation
分子 覚せい剤取締検挙件数 災害被害額 不慮の事故による死亡者数 公害苦情件数
指標計算式 Numerators Cases indicted for drug laws Value of damage by disasters Freak accident fatalities
Formulae ofindicators 分母 総人口 総人口 総人口 総人口
Denominators Total population (Both sexes) Total population (Both sexes) Total population (Both sexes) Total population (Both sexes)
出典 Reference
10)公害 Pollution 11)保険 Insurance
公害苦情件数(人口10万人当たり) 民間生命保険保有契約件数(人口千人当たり) 民間生命保険保険金額(保有契約1件当たり)
Cases of grievances against pollution(per 100,000 persons)
Private life insurance policies in force(per 1,000 persons)
Amount insured by private life insurance(per policy in force)
(件:number of cases (件:number of contracts (万円:10 thousand yenPref.Code
MeanS.D.
公害苦情件数 民間生命保険保有契約件数 民間生命保険保有契約保険金額 分子
Private life insurance policies in force Insurance paid by private life insurance 指標計算式
総人口 総人口 民間生命保険保有契約件数 分母
Total population (Both sexes) Total population (Both sexes) Private life insurance policies in force
出典
都道府県コー
ド
Cases of grievances against pollution(7 major environmental pollutions)
187

都道府県 民間生命保険保険金額(1世帯当たり)火災保険住宅物件・一般物件新契約件数
(一般世帯千世帯当たり)
火災保険住宅物件・一般物件保険金受取件数
(一般世帯千世帯当たり)
Prefecture Amount insured by private life insurance(per household)
New fire insurance policies effected(per 1,000 private households)
Cases of payments of fire insurance(per 1,000 private households)
(万円:10 thousand yen (件:number of contracts (件:number of contracts
全国 All Japan
北海道 Hokkaido青森県 Aomori-ken岩手県 Iwate-ken宮城県 Miyagi-ken秋田県 Akita-ken
山形県 Yamagata-ken福島県 Fukushima-ken茨城県 Ibaraki-ken栃木県 Tochigi-ken群馬県 Gumma-ken
埼玉県 Saitama-ken千葉県 Chiba-ken東京都 Tokyo-to神奈川県 Kanagawa-ken新潟県 Niigata-ken
富山県 Toyama-ken石川県 Ishikawa-ken福井県 Fukui-ken山梨県 Yamanashi-ken長野県 Nagano-ken
岐阜県 Gifu-ken静岡県 Shizuoka-ken愛知県 Aichi-ken三重県 Mie-ken滋賀県 Shiga-ken
京都府 Kyoto-fu大阪府 Osaka-fu兵庫県 Hyogo-ken奈良県 Nara-ken和歌山県 Wakayama-ken
鳥取県 Tottori-ken島根県 Shimane-ken岡山県 Okayama-ken広島県 Hiroshima-ken山口県 Yamaguchi-ken
徳島県 Tokushima-ken香川県 Kagawa-ken愛媛県 Ehime-ken高知県 Kochi-ken福岡県 Fukuoka-ken
佐賀県 Saga-ken長崎県 Nagasaki-ken熊本県 Kumamoto-ken大分県 Oita-ken宮崎県 Miyazaki-ken
鹿児島県 Kagoshima-ken沖縄県 Okinawa-ken
平均値 Mean標準偏差 Standard deviation
分子 民間生命保険保有契約保険金額 火災保険住宅物件・一般物件新契約件数火災保険住宅物件・一般物件保険金
支払件数火災保険住宅物件・一般物件保険金支払金額
指標計算式 Numerators Insurance paid by private life insurance No. of new fire insurance policies effected forresidential properties and general properties
No. of payments from fire insurance forresidential properties and general properties
Formulae ofindicators 分母 総世帯数 一般世帯数 一般世帯数 火災保険住宅物件・一般物件保険金支払件数
Denominators Number of households (Total) Number of private households Number of private households
出典 Reference
火災保険住宅物件・一般物件受取保険金額(保有契約1件当たり)
自動車損害賠償責任保険受取保険金額(支払件数1件当たり)
任意自動車保険普及率(車両)
Amount insured by fire insurance(per policy in force)
Insurance paid by compulsory automobileliability insurance (per recipient)
Popularization of voluntary automobileinsurance on vehicles
(万円:10 thousand yen (万円:10 thousand yen (%)Pref.Code
MeanS.D.
※
火災保険住宅物件・一般物件保険金支払金額 自動車損害賠償責任保険保険金支払金額 分子
Benefits from fire insurance forresidential properties and general properties Amount of payments from automobile insurance 自動車保険普及率(車両) 指標計算式
火災保険住宅物件・一般物件保険金支払件数 自動車損害賠償責任保険保険金支払件数 Popularization of automobile insurance on vehicles 分母
No. of payments from fire insurance forresidential properties and general properties No. of payments from automobile insurance
出典
都道府県コー
ド
188
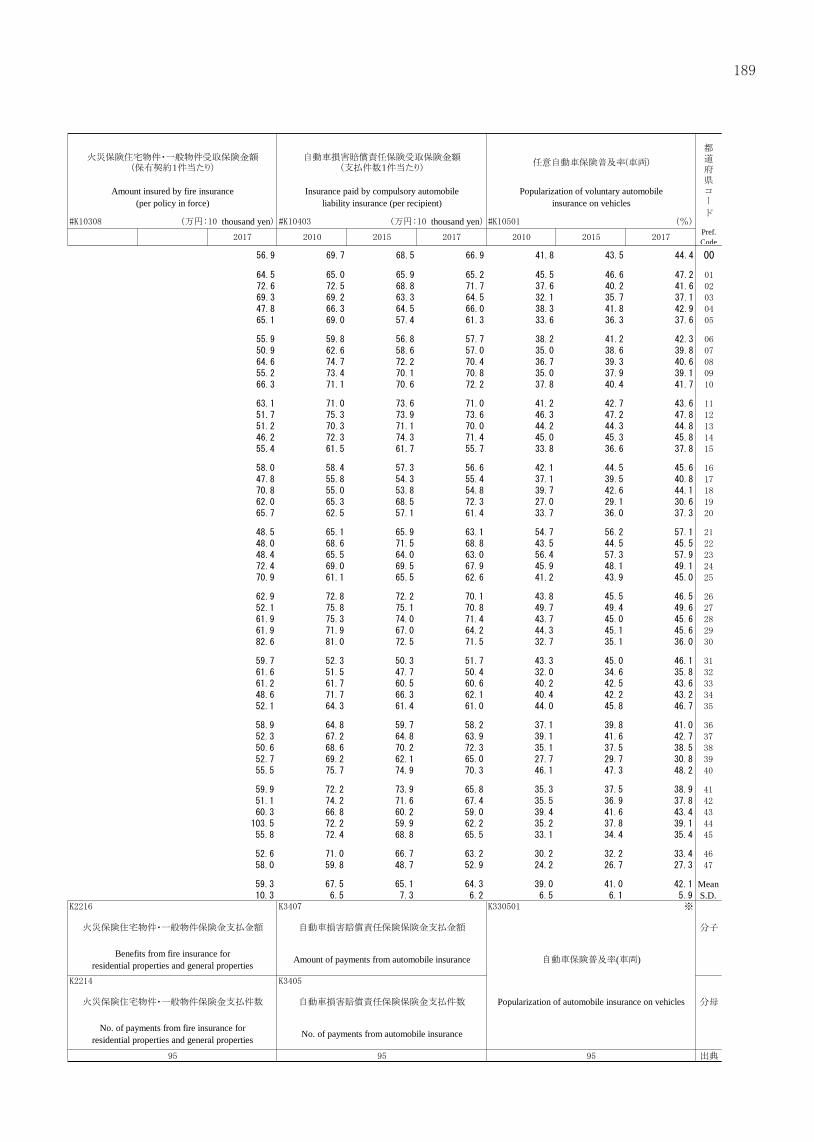
都道府県 民間生命保険保険金額(1世帯当たり)火災保険住宅物件・一般物件新契約件数
(一般世帯千世帯当たり)
火災保険住宅物件・一般物件保険金受取件数
(一般世帯千世帯当たり)
Prefecture Amount insured by private life insurance(per household)
New fire insurance policies effected(per 1,000 private households)
Cases of payments of fire insurance(per 1,000 private households)
(万円:10 thousand yen (件:number of contracts (件:number of contracts
全国 All Japan
北海道 Hokkaido青森県 Aomori-ken岩手県 Iwate-ken宮城県 Miyagi-ken秋田県 Akita-ken
山形県 Yamagata-ken福島県 Fukushima-ken茨城県 Ibaraki-ken栃木県 Tochigi-ken群馬県 Gumma-ken
埼玉県 Saitama-ken千葉県 Chiba-ken東京都 Tokyo-to神奈川県 Kanagawa-ken新潟県 Niigata-ken
富山県 Toyama-ken石川県 Ishikawa-ken福井県 Fukui-ken山梨県 Yamanashi-ken長野県 Nagano-ken
岐阜県 Gifu-ken静岡県 Shizuoka-ken愛知県 Aichi-ken三重県 Mie-ken滋賀県 Shiga-ken
京都府 Kyoto-fu大阪府 Osaka-fu兵庫県 Hyogo-ken奈良県 Nara-ken和歌山県 Wakayama-ken
鳥取県 Tottori-ken島根県 Shimane-ken岡山県 Okayama-ken広島県 Hiroshima-ken山口県 Yamaguchi-ken
徳島県 Tokushima-ken香川県 Kagawa-ken愛媛県 Ehime-ken高知県 Kochi-ken福岡県 Fukuoka-ken
佐賀県 Saga-ken長崎県 Nagasaki-ken熊本県 Kumamoto-ken大分県 Oita-ken宮崎県 Miyazaki-ken
鹿児島県 Kagoshima-ken沖縄県 Okinawa-ken
平均値 Mean標準偏差 Standard deviation
分子 民間生命保険保有契約保険金額 火災保険住宅物件・一般物件新契約件数火災保険住宅物件・一般物件保険金
支払件数火災保険住宅物件・一般物件保険金支払金額
指標計算式 Numerators Insurance paid by private life insurance No. of new fire insurance policies effected forresidential properties and general properties
No. of payments from fire insurance forresidential properties and general properties
Formulae ofindicators 分母 総世帯数 一般世帯数 一般世帯数 火災保険住宅物件・一般物件保険金支払件数
Denominators Number of households (Total) Number of private households Number of private households
出典 Reference
火災保険住宅物件・一般物件受取保険金額(保有契約1件当たり)
自動車損害賠償責任保険受取保険金額(支払件数1件当たり)
任意自動車保険普及率(車両)
Amount insured by fire insurance(per policy in force)
Insurance paid by compulsory automobileliability insurance (per recipient)
Popularization of voluntary automobileinsurance on vehicles
(万円:10 thousand yen (万円:10 thousand yen (%)Pref.Code
MeanS.D.
※
火災保険住宅物件・一般物件保険金支払金額 自動車損害賠償責任保険保険金支払金額 分子
Benefits from fire insurance forresidential properties and general properties Amount of payments from automobile insurance 自動車保険普及率(車両) 指標計算式
火災保険住宅物件・一般物件保険金支払件数 自動車損害賠償責任保険保険金支払件数 Popularization of automobile insurance on vehicles 分母
No. of payments from fire insurance forresidential properties and general properties No. of payments from automobile insurance
出典
都道府県コー
ド
189

都道府県 任意自動車保険普及率(対人) 任意自動車保険普及率(対物)
Prefecture Popularization of voluntary automobileinsurance on persons
Popularization of voluntary automobileinsurance on property
(%) (%)
全国 All Japan
北海道 Hokkaido青森県 Aomori-ken岩手県 Iwate-ken宮城県 Miyagi-ken秋田県 Akita-ken
山形県 Yamagata-ken福島県 Fukushima-ken茨城県 Ibaraki-ken栃木県 Tochigi-ken群馬県 Gumma-ken
埼玉県 Saitama-ken千葉県 Chiba-ken東京都 Tokyo-to神奈川県 Kanagawa-ken新潟県 Niigata-ken
富山県 Toyama-ken石川県 Ishikawa-ken福井県 Fukui-ken山梨県 Yamanashi-ken長野県 Nagano-ken
岐阜県 Gifu-ken静岡県 Shizuoka-ken愛知県 Aichi-ken三重県 Mie-ken滋賀県 Shiga-ken
京都府 Kyoto-fu大阪府 Osaka-fu兵庫県 Hyogo-ken奈良県 Nara-ken和歌山県 Wakayama-ken
鳥取県 Tottori-ken島根県 Shimane-ken岡山県 Okayama-ken広島県 Hiroshima-ken山口県 Yamaguchi-ken
徳島県 Tokushima-ken香川県 Kagawa-ken愛媛県 Ehime-ken高知県 Kochi-ken福岡県 Fukuoka-ken
佐賀県 Saga-ken長崎県 Nagasaki-ken熊本県 Kumamoto-ken大分県 Oita-ken宮崎県 Miyazaki-ken
鹿児島県 Kagoshima-ken沖縄県 Okinawa-ken
平均値 Mean標準偏差 Standard deviation
※ ※
分子
指標計算式 Numerators 自動車保険普及率(対人) 自動車保険普及率(対物)
Formulae ofindicators 分母
Popularization of automobileinsurance on persons
Popularization of automobileinsurance on property
Denominators
出典 Reference
190

都道府県 任意自動車保険普及率(対人) 任意自動車保険普及率(対物)
Prefecture Popularization of voluntary automobileinsurance on persons
Popularization of voluntary automobileinsurance on property
(%) (%)
全国 All Japan
北海道 Hokkaido青森県 Aomori-ken岩手県 Iwate-ken宮城県 Miyagi-ken秋田県 Akita-ken
山形県 Yamagata-ken福島県 Fukushima-ken茨城県 Ibaraki-ken栃木県 Tochigi-ken群馬県 Gumma-ken
埼玉県 Saitama-ken千葉県 Chiba-ken東京都 Tokyo-to神奈川県 Kanagawa-ken新潟県 Niigata-ken
富山県 Toyama-ken石川県 Ishikawa-ken福井県 Fukui-ken山梨県 Yamanashi-ken長野県 Nagano-ken
岐阜県 Gifu-ken静岡県 Shizuoka-ken愛知県 Aichi-ken三重県 Mie-ken滋賀県 Shiga-ken
京都府 Kyoto-fu大阪府 Osaka-fu兵庫県 Hyogo-ken奈良県 Nara-ken和歌山県 Wakayama-ken
鳥取県 Tottori-ken島根県 Shimane-ken岡山県 Okayama-ken広島県 Hiroshima-ken山口県 Yamaguchi-ken
徳島県 Tokushima-ken香川県 Kagawa-ken愛媛県 Ehime-ken高知県 Kochi-ken福岡県 Fukuoka-ken
佐賀県 Saga-ken長崎県 Nagasaki-ken熊本県 Kumamoto-ken大分県 Oita-ken宮崎県 Miyazaki-ken
鹿児島県 Kagoshima-ken沖縄県 Okinawa-ken
平均値 Mean標準偏差 Standard deviation
※ ※
分子
指標計算式 Numerators 自動車保険普及率(対人) 自動車保険普及率(対物)
Formulae ofindicators 分母
Popularization of automobileinsurance on persons
Popularization of automobileinsurance on property
Denominators
出典 Reference
191

L.家計 Family Budget1)二人以上の世帯の収入・支出
Family income and expenditure of two-or-more-person households
都道府県実収入
(二人以上の世帯のうち勤労者世帯)(1世帯当たり1か月間)
世帯主収入(二人以上の世帯のうち勤労者世帯)
(1世帯当たり1か月間)
平均消費性向(二人以上の世帯のうち勤労者世帯)
消費支出(二人以上の世帯)(1世帯当たり1か月間)
PrefectureMonthly income per household
(workers' households of two-or-more-personhouseholds)
Monthly wages and salaries of householdhead per household(workers' households of
two-or-more-person households)
Monthly propensity to consume(workers' households of two-or-more-person
households)(千円:thousand yen (千円:thousand yen (%)
全国 All Japan
北海道 Hokkaido青森県 Aomori-ken岩手県 Iwate-ken宮城県 Miyagi-ken秋田県 Akita-ken
山形県 Yamagata-ken福島県 Fukushima-ken茨城県 Ibaraki-ken栃木県 Tochigi-ken群馬県 Gumma-ken
埼玉県 Saitama-ken千葉県 Chiba-ken東京都 Tokyo-to神奈川県 Kanagawa-ken新潟県 Niigata-ken
富山県 Toyama-ken石川県 Ishikawa-ken福井県 Fukui-ken山梨県 Yamanashi-ken長野県 Nagano-ken
岐阜県 Gifu-ken静岡県 Shizuoka-ken愛知県 Aichi-ken三重県 Mie-ken滋賀県 Shiga-ken
京都府 Kyoto-fu大阪府 Osaka-fu兵庫県 Hyogo-ken奈良県 Nara-ken和歌山県 Wakayama-ken
鳥取県 Tottori-ken島根県 Shimane-ken岡山県 Okayama-ken広島県 Hiroshima-ken山口県 Yamaguchi-ken
徳島県 Tokushima-ken香川県 Kagawa-ken愛媛県 Ehime-ken高知県 Kochi-ken福岡県 Fukuoka-ken
佐賀県 Saga-ken長崎県 Nagasaki-ken熊本県 Kumamoto-ken大分県 Oita-ken宮崎県 Miyazaki-ken
鹿児島県 Kagoshima-ken沖縄県 Okinawa-ken
平均値 Mean標準偏差 Standard deviation
※ ※
分子
指標計算式 Numerators 実収入(二人以上の世帯のうち勤労者世帯)
Formulae ofindicators 分母
Monthly income per household(workers' households of two-or-more-person
households)
Income of household head forworkers' households of two-or-more-person
households
Denominators
出典 Reference(注)項目欄に「*」の付されている項目は,都道府県庁所在市のデータである。
Note:Items with * refer to the cities with prefectural governments.
消費支出(二人以上の世帯のうち勤労者世帯)
世帯主収入(二人以上の世帯のうち勤労者世帯)
Living expenditure (worker's households oftwo-or-more-person households)
可処分所得(二人以上の世帯のうち勤労者世帯)
Disposable income (worker's households oftwo-or-more-person households)
消費支出(二人以上の世帯)(1世帯当たり1か月間)
食料費割合(二人以上の世帯) 住居費割合(二人以上の世帯)
Monthly living expenditure per household(Two-or-more-person households)
Ratio of expenditure for food(Two-or-more-person households)
Ratio of expenditure for housing(Two-or-more-person households)
(千円:thousand yen (%) (%)Pref.Code
MeanS.D.
※
食料費(二人以上の世帯) 住居費(二人以上の世帯) 分子
Food expenditures for two-or-more-person households
Housing expenditures for two-or-more-person households 指標計算式
Consumption expenditures for two-or-more-personhouseholds 消費支出(二人以上の世帯) 消費支出(二人以上の世帯) 分母
Consumption expenditures for two-or-more-personhouseholds
Consumption expenditures for two-or-more-personhouseholds
出典
都道府県コー
ド
消費支出(二人以上の世帯)
192

L.家計 Family Budget1)二人以上の世帯の収入・支出
Family income and expenditure of two-or-more-person households
都道府県実収入
(二人以上の世帯のうち勤労者世帯)(1世帯当たり1か月間)
世帯主収入(二人以上の世帯のうち勤労者世帯)
(1世帯当たり1か月間)
平均消費性向(二人以上の世帯のうち勤労者世帯)
消費支出(二人以上の世帯)(1世帯当たり1か月間)
PrefectureMonthly income per household
(workers' households of two-or-more-personhouseholds)
Monthly wages and salaries of householdhead per household(workers' households of
two-or-more-person households)
Monthly propensity to consume(workers' households of two-or-more-person
households)(千円:thousand yen (千円:thousand yen (%)
全国 All Japan
北海道 Hokkaido青森県 Aomori-ken岩手県 Iwate-ken宮城県 Miyagi-ken秋田県 Akita-ken
山形県 Yamagata-ken福島県 Fukushima-ken茨城県 Ibaraki-ken栃木県 Tochigi-ken群馬県 Gumma-ken
埼玉県 Saitama-ken千葉県 Chiba-ken東京都 Tokyo-to神奈川県 Kanagawa-ken新潟県 Niigata-ken
富山県 Toyama-ken石川県 Ishikawa-ken福井県 Fukui-ken山梨県 Yamanashi-ken長野県 Nagano-ken
岐阜県 Gifu-ken静岡県 Shizuoka-ken愛知県 Aichi-ken三重県 Mie-ken滋賀県 Shiga-ken
京都府 Kyoto-fu大阪府 Osaka-fu兵庫県 Hyogo-ken奈良県 Nara-ken和歌山県 Wakayama-ken
鳥取県 Tottori-ken島根県 Shimane-ken岡山県 Okayama-ken広島県 Hiroshima-ken山口県 Yamaguchi-ken
徳島県 Tokushima-ken香川県 Kagawa-ken愛媛県 Ehime-ken高知県 Kochi-ken福岡県 Fukuoka-ken
佐賀県 Saga-ken長崎県 Nagasaki-ken熊本県 Kumamoto-ken大分県 Oita-ken宮崎県 Miyazaki-ken
鹿児島県 Kagoshima-ken沖縄県 Okinawa-ken
平均値 Mean標準偏差 Standard deviation
※ ※
分子
指標計算式 Numerators 実収入(二人以上の世帯のうち勤労者世帯)
Formulae ofindicators 分母
Monthly income per household(workers' households of two-or-more-person
households)
Income of household head forworkers' households of two-or-more-person
households
Denominators
出典 Reference(注)項目欄に「*」の付されている項目は,都道府県庁所在市のデータである。
Note:Items with * refer to the cities with prefectural governments.
消費支出(二人以上の世帯のうち勤労者世帯)
世帯主収入(二人以上の世帯のうち勤労者世帯)
Living expenditure (worker's households oftwo-or-more-person households)
可処分所得(二人以上の世帯のうち勤労者世帯)
Disposable income (worker's households oftwo-or-more-person households)
消費支出(二人以上の世帯)(1世帯当たり1か月間)
食料費割合(二人以上の世帯) 住居費割合(二人以上の世帯)
Monthly living expenditure per household(Two-or-more-person households)
Ratio of expenditure for food(Two-or-more-person households)
Ratio of expenditure for housing(Two-or-more-person households)
(千円:thousand yen (%) (%)Pref.Code
MeanS.D.
※
食料費(二人以上の世帯) 住居費(二人以上の世帯) 分子
Food expenditures for two-or-more-person households
Housing expenditures for two-or-more-person households 指標計算式
Consumption expenditures for two-or-more-personhouseholds 消費支出(二人以上の世帯) 消費支出(二人以上の世帯) 分母
Consumption expenditures for two-or-more-personhouseholds
Consumption expenditures for two-or-more-personhouseholds
出典
都道府県コー
ド
消費支出(二人以上の世帯)
193
L
家
計
(指標)

都道府県 光熱・水道費割合(二人以上の世帯) 家具・家事用品費割合(二人以上の世帯) 被服及び履物費割合(二人以上の世帯) 保健医療費割合(二人以上の世帯)
Prefecture Ratio of expenditure for fuel, light & water charges(Two-or-more-person households)
Ratio of expenditure for furniture & householdutensils (Two-or-more-person households)
Ratio of expenditure for clothes & footwear(Two-or-more-person households)
(%) (%) (%)
全国 All Japan
北海道 Hokkaido青森県 Aomori-ken岩手県 Iwate-ken宮城県 Miyagi-ken秋田県 Akita-ken
山形県 Yamagata-ken福島県 Fukushima-ken茨城県 Ibaraki-ken栃木県 Tochigi-ken群馬県 Gumma-ken
埼玉県 Saitama-ken千葉県 Chiba-ken東京都 Tokyo-to神奈川県 Kanagawa-ken新潟県 Niigata-ken
富山県 Toyama-ken石川県 Ishikawa-ken福井県 Fukui-ken山梨県 Yamanashi-ken長野県 Nagano-ken
岐阜県 Gifu-ken静岡県 Shizuoka-ken愛知県 Aichi-ken三重県 Mie-ken滋賀県 Shiga-ken
京都府 Kyoto-fu大阪府 Osaka-fu兵庫県 Hyogo-ken奈良県 Nara-ken和歌山県 Wakayama-ken
鳥取県 Tottori-ken島根県 Shimane-ken岡山県 Okayama-ken広島県 Hiroshima-ken山口県 Yamaguchi-ken
徳島県 Tokushima-ken香川県 Kagawa-ken愛媛県 Ehime-ken高知県 Kochi-ken福岡県 Fukuoka-ken
佐賀県 Saga-ken長崎県 Nagasaki-ken熊本県 Kumamoto-ken大分県 Oita-ken宮崎県 Miyazaki-ken
鹿児島県 Kagoshima-ken沖縄県 Okinawa-ken
平均値 Mean標準偏差 Standard deviation
分子 光熱・水道費(二人以上の世帯) 家具・家事用品費(二人以上の世帯) 被服及び履物費(二人以上の世帯) 保健医療費(二人以上の世帯)
指標計算式 Numerators Fuel, light and water charges expenditures fortwo-or-more-person households
Furniture and household utensils expendituresfor two-or-more-person households
Clothes and footwear expenditures fortwo-or-more-person households
Formulae ofindicators 分母 消費支出(二人以上の世帯) 消費支出(二人以上の世帯) 消費支出(二人以上の世帯) 消費支出(二人以上の世帯)
Denominators Consumption expenditures for two-or-more-person households
Consumption expenditures for two-or-more-person households
Consumption expenditures for two-or-more-person households
出典 Reference(注)項目欄に「*」の付されている項目は,都道府県庁所在市のデータである。
Note : Items with * refer to the cities with prefectural governments.
保健医療費割合(二人以上の世帯) 交通・通信費割合(二人以上の世帯) 教育費割合(二人以上の世帯)
Ratio of expenditure for medical care(Two-or-more-person households)
Ratio of expenditure for transportation &communication (Two-or-more-person households)
Ratio of expenditure for education(Two-or-more-person households)
(%) (%) (%)Pref.Code
MeanS.D.
保健医療費(二人以上の世帯) 交通・通信費(二人以上の世帯) 教育費(二人以上の世帯) 分子
Medical care expenditures fortwo-or-more-person households
Transportation and communication expenditures fortwo-or-more-person households
Education expenditures for two-or-more-person households 指標計算式
消費支出(二人以上の世帯) 消費支出(二人以上の世帯) 消費支出(二人以上の世帯) 分母
Consumption expenditures for two-or-more-personhouseholds
Consumption expenditures for two-or-more-personhouseholds
Consumption expenditures for two-or-more-personhouseholds
出典
都道府県コー
ド
194

都道府県 光熱・水道費割合(二人以上の世帯) 家具・家事用品費割合(二人以上の世帯) 被服及び履物費割合(二人以上の世帯) 保健医療費割合(二人以上の世帯)
Prefecture Ratio of expenditure for fuel, light & water charges(Two-or-more-person households)
Ratio of expenditure for furniture & householdutensils (Two-or-more-person households)
Ratio of expenditure for clothes & footwear(Two-or-more-person households)
(%) (%) (%)
全国 All Japan
北海道 Hokkaido青森県 Aomori-ken岩手県 Iwate-ken宮城県 Miyagi-ken秋田県 Akita-ken
山形県 Yamagata-ken福島県 Fukushima-ken茨城県 Ibaraki-ken栃木県 Tochigi-ken群馬県 Gumma-ken
埼玉県 Saitama-ken千葉県 Chiba-ken東京都 Tokyo-to神奈川県 Kanagawa-ken新潟県 Niigata-ken
富山県 Toyama-ken石川県 Ishikawa-ken福井県 Fukui-ken山梨県 Yamanashi-ken長野県 Nagano-ken
岐阜県 Gifu-ken静岡県 Shizuoka-ken愛知県 Aichi-ken三重県 Mie-ken滋賀県 Shiga-ken
京都府 Kyoto-fu大阪府 Osaka-fu兵庫県 Hyogo-ken奈良県 Nara-ken和歌山県 Wakayama-ken
鳥取県 Tottori-ken島根県 Shimane-ken岡山県 Okayama-ken広島県 Hiroshima-ken山口県 Yamaguchi-ken
徳島県 Tokushima-ken香川県 Kagawa-ken愛媛県 Ehime-ken高知県 Kochi-ken福岡県 Fukuoka-ken
佐賀県 Saga-ken長崎県 Nagasaki-ken熊本県 Kumamoto-ken大分県 Oita-ken宮崎県 Miyazaki-ken
鹿児島県 Kagoshima-ken沖縄県 Okinawa-ken
平均値 Mean標準偏差 Standard deviation
分子 光熱・水道費(二人以上の世帯) 家具・家事用品費(二人以上の世帯) 被服及び履物費(二人以上の世帯) 保健医療費(二人以上の世帯)
指標計算式 Numerators Fuel, light and water charges expenditures fortwo-or-more-person households
Furniture and household utensils expendituresfor two-or-more-person households
Clothes and footwear expenditures fortwo-or-more-person households
Formulae ofindicators 分母 消費支出(二人以上の世帯) 消費支出(二人以上の世帯) 消費支出(二人以上の世帯) 消費支出(二人以上の世帯)
Denominators Consumption expenditures for two-or-more-person households
Consumption expenditures for two-or-more-person households
Consumption expenditures for two-or-more-person households
出典 Reference(注)項目欄に「*」の付されている項目は,都道府県庁所在市のデータである。
Note : Items with * refer to the cities with prefectural governments.
保健医療費割合(二人以上の世帯) 交通・通信費割合(二人以上の世帯) 教育費割合(二人以上の世帯)
Ratio of expenditure for medical care(Two-or-more-person households)
Ratio of expenditure for transportation &communication (Two-or-more-person households)
Ratio of expenditure for education(Two-or-more-person households)
(%) (%) (%)Pref.Code
MeanS.D.
保健医療費(二人以上の世帯) 交通・通信費(二人以上の世帯) 教育費(二人以上の世帯) 分子
Medical care expenditures fortwo-or-more-person households
Transportation and communication expenditures fortwo-or-more-person households
Education expenditures for two-or-more-person households 指標計算式
消費支出(二人以上の世帯) 消費支出(二人以上の世帯) 消費支出(二人以上の世帯) 分母
Consumption expenditures for two-or-more-personhouseholds
Consumption expenditures for two-or-more-personhouseholds
Consumption expenditures for two-or-more-personhouseholds
出典
都道府県コー
ド
195

都道府県 教養娯楽費割合(二人以上の世帯)その他の消費支出費割合
(二人以上の世帯)平均貯蓄率(二人以上の世帯のうち勤労者
世帯)預貯金純増率(二人以上の世帯のうち勤労者世帯)
Prefecture Ratio of expenditure for reading & recreation(Two-or-more-person households)
Ratio of expenditure for other living(Two-or-more-person households)
Ratio of net savings & insurance to disposableincome(workers' households of two-or-more-
person households)(%) (%) (%)
全国 All Japan
北海道 Hokkaido青森県 Aomori-ken岩手県 Iwate-ken宮城県 Miyagi-ken秋田県 Akita-ken
山形県 Yamagata-ken福島県 Fukushima-ken茨城県 Ibaraki-ken栃木県 Tochigi-ken群馬県 Gumma-ken
埼玉県 Saitama-ken千葉県 Chiba-ken東京都 Tokyo-to神奈川県 Kanagawa-ken新潟県 Niigata-ken
富山県 Toyama-ken石川県 Ishikawa-ken福井県 Fukui-ken山梨県 Yamanashi-ken長野県 Nagano-ken
岐阜県 Gifu-ken静岡県 Shizuoka-ken愛知県 Aichi-ken三重県 Mie-ken滋賀県 Shiga-ken
京都府 Kyoto-fu大阪府 Osaka-fu兵庫県 Hyogo-ken奈良県 Nara-ken和歌山県 Wakayama-ken
鳥取県 Tottori-ken島根県 Shimane-ken岡山県 Okayama-ken広島県 Hiroshima-ken山口県 Yamaguchi-ken
徳島県 Tokushima-ken香川県 Kagawa-ken愛媛県 Ehime-ken高知県 Kochi-ken福岡県 Fukuoka-ken
佐賀県 Saga-ken長崎県 Nagasaki-ken熊本県 Kumamoto-ken大分県 Oita-ken宮崎県 Miyazaki-ken
鹿児島県 Kagoshima-ken沖縄県 Okinawa-ken
平均値 Mean標準偏差 Standard deviation
分子 教養娯楽費(二人以上の世帯) その他の消費支出(二人以上の世帯)
指標計算式 Numerators Reading and recreation expenditures fortwo-or-more-person households
Other living expenditure fortwo-or-more-person households
Formulae ofindicators 分母 消費支出(二人以上の世帯) 消費支出(二人以上の世帯)
Denominators Consumption expenditures for two-or-more-person households
Consumption expenditures for two-or-more-person households
出典 Reference(注)項目欄に「*」の付されている項目は,都道府県庁所在市のデータである。
Note : Items with * refer to the cities with prefectural governments.a) (Savings - Withdraw of deposits) + (Insurance premium payments -Insurance proceeds)(workers' households of two-or-more-person households)
預貯金純増+保険純増(二人以上の世帯のうち勤労者世帯)
a)
可処分所得(二人以上の世帯のうち勤労者世帯)
Disposable income (worker's households oftwo-or-more-person households)
2)世帯の資産 Household assets
預貯金純増率(二人以上の世帯のうち勤労者世帯)土地家屋借金純減率(二人以上の世帯のうち勤労者
世帯)貯蓄現在高(二人以上の世帯)(1世帯当たり)
Ratio of net savings to disposable income(workers' households of two-or-more-person
households)
Ratio of net decrease in debts for houses & land todisposable income(workers' households of two-or-
more-person households)
Amount of savings per household(Two-or-more-person households)
(%) (%) (千円:thousand yenPref.Code
MeanS.D.
※
預貯金純増(二人以上の世帯のうち勤労者世帯)土地家屋借金純減(二人以上の世帯のうち勤労者世
帯)分子
Savings - Withdraw of deposits (workers' households oftwo-or-more-person households)
Payments of debts for houses and land - Debts for houses andland (workers' households of two-or-more-person households) 貯蓄現在高(二人以上の世帯) 指標計算式
可処分所得(二人以上の世帯のうち勤労者世帯) 可処分所得(二人以上の世帯のうち勤労者世帯) Savings (Two-or-more-person households) 分母
出典
都道府県コー
ド
Disposable income (worker's households of two-or-more-person households)
Disposable income (worker's households of two-or-more-person households)
196

都道府県 教養娯楽費割合(二人以上の世帯)その他の消費支出費割合
(二人以上の世帯)平均貯蓄率(二人以上の世帯のうち勤労者
世帯)預貯金純増率(二人以上の世帯のうち勤労者世帯)
Prefecture Ratio of expenditure for reading & recreation(Two-or-more-person households)
Ratio of expenditure for other living(Two-or-more-person households)
Ratio of net savings & insurance to disposableincome(workers' households of two-or-more-
person households)(%) (%) (%)
全国 All Japan
北海道 Hokkaido青森県 Aomori-ken岩手県 Iwate-ken宮城県 Miyagi-ken秋田県 Akita-ken
山形県 Yamagata-ken福島県 Fukushima-ken茨城県 Ibaraki-ken栃木県 Tochigi-ken群馬県 Gumma-ken
埼玉県 Saitama-ken千葉県 Chiba-ken東京都 Tokyo-to神奈川県 Kanagawa-ken新潟県 Niigata-ken
富山県 Toyama-ken石川県 Ishikawa-ken福井県 Fukui-ken山梨県 Yamanashi-ken長野県 Nagano-ken
岐阜県 Gifu-ken静岡県 Shizuoka-ken愛知県 Aichi-ken三重県 Mie-ken滋賀県 Shiga-ken
京都府 Kyoto-fu大阪府 Osaka-fu兵庫県 Hyogo-ken奈良県 Nara-ken和歌山県 Wakayama-ken
鳥取県 Tottori-ken島根県 Shimane-ken岡山県 Okayama-ken広島県 Hiroshima-ken山口県 Yamaguchi-ken
徳島県 Tokushima-ken香川県 Kagawa-ken愛媛県 Ehime-ken高知県 Kochi-ken福岡県 Fukuoka-ken
佐賀県 Saga-ken長崎県 Nagasaki-ken熊本県 Kumamoto-ken大分県 Oita-ken宮崎県 Miyazaki-ken
鹿児島県 Kagoshima-ken沖縄県 Okinawa-ken
平均値 Mean標準偏差 Standard deviation
分子 教養娯楽費(二人以上の世帯) その他の消費支出(二人以上の世帯)
指標計算式 Numerators Reading and recreation expenditures fortwo-or-more-person households
Other living expenditure fortwo-or-more-person households
Formulae ofindicators 分母 消費支出(二人以上の世帯) 消費支出(二人以上の世帯)
Denominators Consumption expenditures for two-or-more-person households
Consumption expenditures for two-or-more-person households
出典 Reference(注)項目欄に「*」の付されている項目は,都道府県庁所在市のデータである。
Note : Items with * refer to the cities with prefectural governments.a) (Savings - Withdraw of deposits) + (Insurance premium payments -Insurance proceeds)(workers' households of two-or-more-person households)
預貯金純増+保険純増(二人以上の世帯のうち勤労者世帯)
a)
可処分所得(二人以上の世帯のうち勤労者世帯)
Disposable income (worker's households oftwo-or-more-person households)
2)世帯の資産 Household assets
預貯金純増率(二人以上の世帯のうち勤労者世帯)土地家屋借金純減率(二人以上の世帯のうち勤労者
世帯)貯蓄現在高(二人以上の世帯)(1世帯当たり)
Ratio of net savings to disposable income(workers' households of two-or-more-person
households)
Ratio of net decrease in debts for houses & land todisposable income(workers' households of two-or-
more-person households)
Amount of savings per household(Two-or-more-person households)
(%) (%) (千円:thousand yenPref.Code
MeanS.D.
※
預貯金純増(二人以上の世帯のうち勤労者世帯)土地家屋借金純減(二人以上の世帯のうち勤労者世
帯)分子
Savings - Withdraw of deposits (workers' households oftwo-or-more-person households)
Payments of debts for houses and land - Debts for houses andland (workers' households of two-or-more-person households) 貯蓄現在高(二人以上の世帯) 指標計算式
可処分所得(二人以上の世帯のうち勤労者世帯) 可処分所得(二人以上の世帯のうち勤労者世帯) Savings (Two-or-more-person households) 分母
出典
都道府県コー
ド
Disposable income (worker's households of two-or-more-person households)
Disposable income (worker's households of two-or-more-person households)
197

都道府県 預貯金現在高割合(二人以上の世帯) 生命保険現在高割合(二人以上の世帯) 有価証券現在高割合(二人以上の世帯) 負債現在高(二人以上の世帯)(1世帯当たり)
Prefecture Ratio of deposits(Two-or-more-person households)
Ratio of life insurance savings(Two-or-more-person households)
Ratio of securities savings(Two-or-more-person households)
(%) (%) (%)
全国 All Japan
北海道 Hokkaido青森県 Aomori-ken岩手県 Iwate-ken宮城県 Miyagi-ken秋田県 Akita-ken
山形県 Yamagata-ken福島県 Fukushima-ken茨城県 Ibaraki-ken栃木県 Tochigi-ken群馬県 Gumma-ken
埼玉県 Saitama-ken千葉県 Chiba-ken東京都 Tokyo-to神奈川県 Kanagawa-ken新潟県 Niigata-ken
富山県 Toyama-ken石川県 Ishikawa-ken福井県 Fukui-ken山梨県 Yamanashi-ken長野県 Nagano-ken
岐阜県 Gifu-ken静岡県 Shizuoka-ken愛知県 Aichi-ken三重県 Mie-ken滋賀県 Shiga-ken
京都府 Kyoto-fu大阪府 Osaka-fu兵庫県 Hyogo-ken奈良県 Nara-ken和歌山県 Wakayama-ken
鳥取県 Tottori-ken島根県 Shimane-ken岡山県 Okayama-ken広島県 Hiroshima-ken山口県 Yamaguchi-ken
徳島県 Tokushima-ken香川県 Kagawa-ken愛媛県 Ehime-ken高知県 Kochi-ken福岡県 Fukuoka-ken
佐賀県 Saga-ken長崎県 Nagasaki-ken熊本県 Kumamoto-ken大分県 Oita-ken宮崎県 Miyazaki-ken
鹿児島県 Kagoshima-ken沖縄県 Okinawa-ken
平均値 Mean標準偏差 Standard deviation
分子 預貯金現在高(二人以上の世帯) 生命保険現在高(二人以上の世帯) 有価証券現在高(二人以上の世帯)
指標計算式 Numerators Demand deposits and time deposits (Two-or-more-person households)
Life insurance, etc. (Two-or-more-personhouseholds) Securities (Two-or-more-person households)
Formulae ofindicators 分母 貯蓄現在高(二人以上の世帯) 貯蓄現在高(二人以上の世帯) 貯蓄現在高(二人以上の世帯) Liabilities (Two-or-more-person households)
Denominators Savings (Two-or-more-person households) Savings (Two-or-more-person households) Savings (Two-or-more-person households)
出典 Reference
負債現在高(二人以上の世帯)(1世帯当たり) 住宅・土地のための負債割合(二人以上の世帯)電子レンジ(電子オーブンレンジを含む)所有数量
(二人以上の世帯)(千世帯当たり)
Liabilities per household(Two-or-more-person households)
Ratio of liabilities for houses and land(Two-or-more-person households)
Number of microwave ovens per 1,000 households(Two-or-more-person households)
(千円:thousand yen (%) (台:quantitiesPref.Code
MeanS.D.
※ ※
住宅・土地のための負債(二人以上の世帯) 分子
Liabilities for purchase of houses and/or land (Two-or-more-person households)
電子レンジ(電子オーブンレンジを含む)所有数量(二人以上の世帯)
指標計算式
Liabilities (Two-or-more-person households) 負債現在高(二人以上の世帯)Quantities of durable goods possessed (Two-or-more-person
households, microwave ovens incl. electronic ovens) 分母
Liabilities (Two-or-more-person households)
出典
都道府県コー
ド
負債現在高(二人以上の世帯)
198

都道府県 預貯金現在高割合(二人以上の世帯) 生命保険現在高割合(二人以上の世帯) 有価証券現在高割合(二人以上の世帯) 負債現在高(二人以上の世帯)(1世帯当たり)
Prefecture Ratio of deposits(Two-or-more-person households)
Ratio of life insurance savings(Two-or-more-person households)
Ratio of securities savings(Two-or-more-person households)
(%) (%) (%)
全国 All Japan
北海道 Hokkaido青森県 Aomori-ken岩手県 Iwate-ken宮城県 Miyagi-ken秋田県 Akita-ken
山形県 Yamagata-ken福島県 Fukushima-ken茨城県 Ibaraki-ken栃木県 Tochigi-ken群馬県 Gumma-ken
埼玉県 Saitama-ken千葉県 Chiba-ken東京都 Tokyo-to神奈川県 Kanagawa-ken新潟県 Niigata-ken
富山県 Toyama-ken石川県 Ishikawa-ken福井県 Fukui-ken山梨県 Yamanashi-ken長野県 Nagano-ken
岐阜県 Gifu-ken静岡県 Shizuoka-ken愛知県 Aichi-ken三重県 Mie-ken滋賀県 Shiga-ken
京都府 Kyoto-fu大阪府 Osaka-fu兵庫県 Hyogo-ken奈良県 Nara-ken和歌山県 Wakayama-ken
鳥取県 Tottori-ken島根県 Shimane-ken岡山県 Okayama-ken広島県 Hiroshima-ken山口県 Yamaguchi-ken
徳島県 Tokushima-ken香川県 Kagawa-ken愛媛県 Ehime-ken高知県 Kochi-ken福岡県 Fukuoka-ken
佐賀県 Saga-ken長崎県 Nagasaki-ken熊本県 Kumamoto-ken大分県 Oita-ken宮崎県 Miyazaki-ken
鹿児島県 Kagoshima-ken沖縄県 Okinawa-ken
平均値 Mean標準偏差 Standard deviation
分子 預貯金現在高(二人以上の世帯) 生命保険現在高(二人以上の世帯) 有価証券現在高(二人以上の世帯)
指標計算式 Numerators Demand deposits and time deposits (Two-or-more-person households)
Life insurance, etc. (Two-or-more-personhouseholds) Securities (Two-or-more-person households)
Formulae ofindicators 分母 貯蓄現在高(二人以上の世帯) 貯蓄現在高(二人以上の世帯) 貯蓄現在高(二人以上の世帯) Liabilities (Two-or-more-person households)
Denominators Savings (Two-or-more-person households) Savings (Two-or-more-person households) Savings (Two-or-more-person households)
出典 Reference
負債現在高(二人以上の世帯)(1世帯当たり) 住宅・土地のための負債割合(二人以上の世帯)電子レンジ(電子オーブンレンジを含む)所有数量
(二人以上の世帯)(千世帯当たり)
Liabilities per household(Two-or-more-person households)
Ratio of liabilities for houses and land(Two-or-more-person households)
Number of microwave ovens per 1,000 households(Two-or-more-person households)
(千円:thousand yen (%) (台:quantitiesPref.Code
MeanS.D.
※ ※
住宅・土地のための負債(二人以上の世帯) 分子
Liabilities for purchase of houses and/or land (Two-or-more-person households)
電子レンジ(電子オーブンレンジを含む)所有数量(二人以上の世帯)
指標計算式
Liabilities (Two-or-more-person households) 負債現在高(二人以上の世帯)Quantities of durable goods possessed (Two-or-more-person
households, microwave ovens incl. electronic ovens) 分母
Liabilities (Two-or-more-person households)
出典
都道府県コー
ド
負債現在高(二人以上の世帯)
199

都道府県ルームエアコン所有数量
(二人以上の世帯)(千世帯当たり)タブレット端末所有数量
(二人以上の世帯)(千世帯当たり)ピアノ・電子ピアノ所有数量
(二人以上の世帯)(千世帯当たり) 1)自動車所有数量
(二人以上の世帯)(千世帯当たり)
Prefecture Number of room air-conditioners per 1,000households (Two-or-more-person households)
Number of personal computers (tablet) per 1,000households (Two-or-more-person households)
Number of pianos and electronic pianos per 1,000households (Two-or-more-person households) 1)
(台:quantities (台:quantities (台:quantities
全国 All Japan
北海道 Hokkaido青森県 Aomori-ken岩手県 Iwate-ken宮城県 Miyagi-ken秋田県 Akita-ken
山形県 Yamagata-ken福島県 Fukushima-ken茨城県 Ibaraki-ken栃木県 Tochigi-ken群馬県 Gumma-ken
埼玉県 Saitama-ken千葉県 Chiba-ken東京都 Tokyo-to神奈川県 Kanagawa-ken新潟県 Niigata-ken
富山県 Toyama-ken石川県 Ishikawa-ken福井県 Fukui-ken山梨県 Yamanashi-ken長野県 Nagano-ken
岐阜県 Gifu-ken静岡県 Shizuoka-ken愛知県 Aichi-ken三重県 Mie-ken滋賀県 Shiga-ken
京都府 Kyoto-fu大阪府 Osaka-fu兵庫県 Hyogo-ken奈良県 Nara-ken和歌山県 Wakayama-ken
鳥取県 Tottori-ken島根県 Shimane-ken岡山県 Okayama-ken広島県 Hiroshima-ken山口県 Yamaguchi-ken
徳島県 Tokushima-ken香川県 Kagawa-ken愛媛県 Ehime-ken高知県 Kochi-ken福岡県 Fukuoka-ken
佐賀県 Saga-ken長崎県 Nagasaki-ken熊本県 Kumamoto-ken大分県 Oita-ken宮崎県 Miyazaki-ken
鹿児島県 Kagoshima-ken沖縄県 Okinawa-ken
平均値 Mean標準偏差 Standard deviation
※ ※ ※
分子
指標計算式 Numerators ルームエアコン所有数量(二人以上の世帯)
タブレット端末所有数量(二人以上の世帯)
ピアノ・電子ピアノ所有数量(二人以上の世帯)
自動車所有数量(二人以上の世帯)
Formulae ofindicators 分母
Quantities of durable goods possessed (Two-or-more-person households, room air conditioners) a) b)
Denominators
出典 Reference1) 2004年,2009年は電子ピアノを除く。1) For 2004 and 2009, “electronic pianos” are excluded.a) Quantities of durable goods possessed (Two-or-more-person households, personal computers (Tablet))b) Quantities of durable goods possessed (Two-or-more-person households, pianos, electronic pianos)
自動車所有数量(二人以上の世帯)(千世帯当たり)
スマートフォン所有数量(二人以上の世帯)(千世帯当たり)
パソコン所有数量(二人以上の世帯)(千世帯当たり)
Number of cars per 1,000 households(Two-or-more-person households)
Number of smart phones per 1,000 households(Two-or-more-person households)
Number of personal computers per 1,000 households(Two-or-more-person households)
(台:quantities (台:quantities (台:quantitiesPref.Code
MeanS.D.
※ ※ ※
分子
自動車所有数量(二人以上の世帯) スマートフォン所有数量(二人以上の世帯) パソコン所有数量(二人以上の世帯)
Quantities of automobiles per 1000 households(Two-or-more-person households)
Quantities of smart phones per 1000 households(Two-or-more-person households)
Quantities of durable goods possessed(Personal Computers) (Two-or-more-person
households)分母
出典
都道府県コー
ド
200

都道府県ルームエアコン所有数量
(二人以上の世帯)(千世帯当たり)タブレット端末所有数量
(二人以上の世帯)(千世帯当たり)ピアノ・電子ピアノ所有数量
(二人以上の世帯)(千世帯当たり) 1)自動車所有数量
(二人以上の世帯)(千世帯当たり)
Prefecture Number of room air-conditioners per 1,000households (Two-or-more-person households)
Number of personal computers (tablet) per 1,000households (Two-or-more-person households)
Number of pianos and electronic pianos per 1,000households (Two-or-more-person households) 1)
(台:quantities (台:quantities (台:quantities
全国 All Japan
北海道 Hokkaido青森県 Aomori-ken岩手県 Iwate-ken宮城県 Miyagi-ken秋田県 Akita-ken
山形県 Yamagata-ken福島県 Fukushima-ken茨城県 Ibaraki-ken栃木県 Tochigi-ken群馬県 Gumma-ken
埼玉県 Saitama-ken千葉県 Chiba-ken東京都 Tokyo-to神奈川県 Kanagawa-ken新潟県 Niigata-ken
富山県 Toyama-ken石川県 Ishikawa-ken福井県 Fukui-ken山梨県 Yamanashi-ken長野県 Nagano-ken
岐阜県 Gifu-ken静岡県 Shizuoka-ken愛知県 Aichi-ken三重県 Mie-ken滋賀県 Shiga-ken
京都府 Kyoto-fu大阪府 Osaka-fu兵庫県 Hyogo-ken奈良県 Nara-ken和歌山県 Wakayama-ken
鳥取県 Tottori-ken島根県 Shimane-ken岡山県 Okayama-ken広島県 Hiroshima-ken山口県 Yamaguchi-ken
徳島県 Tokushima-ken香川県 Kagawa-ken愛媛県 Ehime-ken高知県 Kochi-ken福岡県 Fukuoka-ken
佐賀県 Saga-ken長崎県 Nagasaki-ken熊本県 Kumamoto-ken大分県 Oita-ken宮崎県 Miyazaki-ken
鹿児島県 Kagoshima-ken沖縄県 Okinawa-ken
平均値 Mean標準偏差 Standard deviation
※ ※ ※
分子
指標計算式 Numerators ルームエアコン所有数量(二人以上の世帯)
タブレット端末所有数量(二人以上の世帯)
ピアノ・電子ピアノ所有数量(二人以上の世帯)
自動車所有数量(二人以上の世帯)
Formulae ofindicators 分母
Quantities of durable goods possessed (Two-or-more-person households, room air conditioners) a) b)
Denominators
出典 Reference1) 2004年,2009年は電子ピアノを除く。1) For 2004 and 2009, “electronic pianos” are excluded.a) Quantities of durable goods possessed (Two-or-more-person households, personal computers (Tablet))b) Quantities of durable goods possessed (Two-or-more-person households, pianos, electronic pianos)
自動車所有数量(二人以上の世帯)(千世帯当たり)
スマートフォン所有数量(二人以上の世帯)(千世帯当たり)
パソコン所有数量(二人以上の世帯)(千世帯当たり)
Number of cars per 1,000 households(Two-or-more-person households)
Number of smart phones per 1,000 households(Two-or-more-person households)
Number of personal computers per 1,000 households(Two-or-more-person households)
(台:quantities (台:quantities (台:quantitiesPref.Code
MeanS.D.
※ ※ ※
分子
自動車所有数量(二人以上の世帯) スマートフォン所有数量(二人以上の世帯) パソコン所有数量(二人以上の世帯)
Quantities of automobiles per 1000 households(Two-or-more-person households)
Quantities of smart phones per 1000 households(Two-or-more-person households)
Quantities of durable goods possessed(Personal Computers) (Two-or-more-person
households)分母
出典
都道府県コー
ド
201

M.生活時間 Daily Time1)行動別平均時間(週全体平均時間) Time spent on daily activities (weekly average)
都道府県 1次活動の平均時間(男) 1次活動の平均時間(女) 2次活動の平均時間(有業者・男) 2次活動の平均時間(有業者・女)
Prefecture Primary activities (male) Primary activities (female) Secondary activities (male with a job) Secondary activities (female with a job)
(分:minutes (分:minutes (分:minutes
全国 All Japan
北海道 Hokkaido青森県 Aomori-ken岩手県 Iwate-ken宮城県 Miyagi-ken秋田県 Akita-ken
山形県 Yamagata-ken福島県 Fukushima-ken茨城県 Ibaraki-ken栃木県 Tochigi-ken群馬県 Gumma-ken
埼玉県 Saitama-ken千葉県 Chiba-ken東京都 Tokyo-to神奈川県 Kanagawa-ken新潟県 Niigata-ken
富山県 Toyama-ken石川県 Ishikawa-ken福井県 Fukui-ken山梨県 Yamanashi-ken長野県 Nagano-ken
岐阜県 Gifu-ken静岡県 Shizuoka-ken愛知県 Aichi-ken三重県 Mie-ken滋賀県 Shiga-ken
京都府 Kyoto-fu大阪府 Osaka-fu兵庫県 Hyogo-ken奈良県 Nara-ken和歌山県 Wakayama-ken
鳥取県 Tottori-ken島根県 Shimane-ken岡山県 Okayama-ken広島県 Hiroshima-ken山口県 Yamaguchi-ken
徳島県 Tokushima-ken香川県 Kagawa-ken愛媛県 Ehime-ken高知県 Kochi-ken福岡県 Fukuoka-ken
佐賀県 Saga-ken長崎県 Nagasaki-ken熊本県 Kumamoto-ken大分県 Oita-ken宮崎県 Miyazaki-ken
鹿児島県 Kagoshima-ken沖縄県 Okinawa-ken
平均値 Mean標準偏差 Standard deviation
※ ※ ※
分子
指標計算式 Numerators 1次活動の平均時間 (男) 1次活動の平均時間 (女) 2次活動の平均時間 (有業者・男) 2次活動の平均時間 (有業者・女)
Formulae ofindicators 分母
Average time of primary activities(Age 15 and over, male)
Average time of primary activities(Age 15 and over, female)
Average time of secondary activities(Male with a job)
Denominators
出典 Reference
2次活動の平均時間(有業者・女) 2次活動の平均時間(無業者・男) 2次活動の平均時間(無業者・女)
Secondary activities (female with a job) Secondary activities (male without a job) Secondary activities (female without a job)
(分:minutes (分:minutes (分:minutesPref.Code
MeanS.D.
※ ※ ※
分子
2次活動の平均時間 (有業者・女) 2次活動の平均時間(無業者・男) 2次活動の平均時間 (無業者・女) 指標計算式
Average time of secondary activities(Female with a job)
Average time of secondary activities(Male without a job)
Average time of secondary activities(Female without a job) 分母
出典
都道府県コー
ド
202

M.生活時間 Daily Time1)行動別平均時間(週全体平均時間) Time spent on daily activities (weekly average)
都道府県 1次活動の平均時間(男) 1次活動の平均時間(女) 2次活動の平均時間(有業者・男) 2次活動の平均時間(有業者・女)
Prefecture Primary activities (male) Primary activities (female) Secondary activities (male with a job) Secondary activities (female with a job)
(分:minutes (分:minutes (分:minutes
全国 All Japan
北海道 Hokkaido青森県 Aomori-ken岩手県 Iwate-ken宮城県 Miyagi-ken秋田県 Akita-ken
山形県 Yamagata-ken福島県 Fukushima-ken茨城県 Ibaraki-ken栃木県 Tochigi-ken群馬県 Gumma-ken
埼玉県 Saitama-ken千葉県 Chiba-ken東京都 Tokyo-to神奈川県 Kanagawa-ken新潟県 Niigata-ken
富山県 Toyama-ken石川県 Ishikawa-ken福井県 Fukui-ken山梨県 Yamanashi-ken長野県 Nagano-ken
岐阜県 Gifu-ken静岡県 Shizuoka-ken愛知県 Aichi-ken三重県 Mie-ken滋賀県 Shiga-ken
京都府 Kyoto-fu大阪府 Osaka-fu兵庫県 Hyogo-ken奈良県 Nara-ken和歌山県 Wakayama-ken
鳥取県 Tottori-ken島根県 Shimane-ken岡山県 Okayama-ken広島県 Hiroshima-ken山口県 Yamaguchi-ken
徳島県 Tokushima-ken香川県 Kagawa-ken愛媛県 Ehime-ken高知県 Kochi-ken福岡県 Fukuoka-ken
佐賀県 Saga-ken長崎県 Nagasaki-ken熊本県 Kumamoto-ken大分県 Oita-ken宮崎県 Miyazaki-ken
鹿児島県 Kagoshima-ken沖縄県 Okinawa-ken
平均値 Mean標準偏差 Standard deviation
※ ※ ※
分子
指標計算式 Numerators 1次活動の平均時間 (男) 1次活動の平均時間 (女) 2次活動の平均時間 (有業者・男) 2次活動の平均時間 (有業者・女)
Formulae ofindicators 分母
Average time of primary activities(Age 15 and over, male)
Average time of primary activities(Age 15 and over, female)
Average time of secondary activities(Male with a job)
Denominators
出典 Reference
2次活動の平均時間(有業者・女) 2次活動の平均時間(無業者・男) 2次活動の平均時間(無業者・女)
Secondary activities (female with a job) Secondary activities (male without a job) Secondary activities (female without a job)
(分:minutes (分:minutes (分:minutesPref.Code
MeanS.D.
※ ※ ※
分子
2次活動の平均時間 (有業者・女) 2次活動の平均時間(無業者・男) 2次活動の平均時間 (無業者・女) 指標計算式
Average time of secondary activities(Female with a job)
Average time of secondary activities(Male without a job)
Average time of secondary activities(Female without a job) 分母
出典
都道府県コー
ド
203
M
生活時間
(指標)

都道府県 3次活動の平均時間(有業者・男) 3次活動の平均時間(有業者・女) 3次活動の平均時間(無業者・男) 3次活動の平均時間(無業者・女)
Prefecture Tertiary activities (male with a job) Tertiary activities (female with a job) Tertiary activities (male without a job) Tertiary activities (female without a job)
(分:minutes (分:minutes (分:minutes
全国 All Japan
北海道 Hokkaido青森県 Aomori-ken岩手県 Iwate-ken宮城県 Miyagi-ken秋田県 Akita-ken
山形県 Yamagata-ken福島県 Fukushima-ken茨城県 Ibaraki-ken栃木県 Tochigi-ken群馬県 Gumma-ken
埼玉県 Saitama-ken千葉県 Chiba-ken東京都 Tokyo-to神奈川県 Kanagawa-ken新潟県 Niigata-ken
富山県 Toyama-ken石川県 Ishikawa-ken福井県 Fukui-ken山梨県 Yamanashi-ken長野県 Nagano-ken
岐阜県 Gifu-ken静岡県 Shizuoka-ken愛知県 Aichi-ken三重県 Mie-ken滋賀県 Shiga-ken
京都府 Kyoto-fu大阪府 Osaka-fu兵庫県 Hyogo-ken奈良県 Nara-ken和歌山県 Wakayama-ken
鳥取県 Tottori-ken島根県 Shimane-ken岡山県 Okayama-ken広島県 Hiroshima-ken山口県 Yamaguchi-ken
徳島県 Tokushima-ken香川県 Kagawa-ken愛媛県 Ehime-ken高知県 Kochi-ken福岡県 Fukuoka-ken
佐賀県 Saga-ken長崎県 Nagasaki-ken熊本県 Kumamoto-ken大分県 Oita-ken宮崎県 Miyazaki-ken
鹿児島県 Kagoshima-ken沖縄県 Okinawa-ken
平均値 Mean標準偏差 Standard deviation
※ ※ ※
分子
指標計算式 Numerators 3次活動の平均時間 (有業者・男) 3次活動の平均時間 (有業者・女) 3次活動の平均時間 (無業者・男) 3次活動の平均時間 (無業者・女)
Formulae ofindicators 分母
Average time of tertiary activities(Male with a job)
Average time of tertiary activities(Female with a job)
Average time of tertiary activities(Male without a job)
Denominators
出典 Reference
2)2次活動の種類別平均時間 Time spent per day in secondary activities
3次活動の平均時間(無業者・女) 仕事の平均時間(有業者・男) 仕事の平均時間(有業者・女)
Tertiary activities (female without a job) Work (male with a job) Work (female with a job)
(分:minutes (分:minutes (分:minutesPref.Code
MeanS.D.
※ ※ ※
分子
3次活動の平均時間 (無業者・女) 仕事の平均時間 (有業者・男) 仕事の平均時間 (有業者・女) 指標計算式
Average time of tertiary activities(Female without a job) Average time of work (Male with a job) Average time of work (Female with a job) 分母
出典
都道府県コー
ド
204

都道府県 3次活動の平均時間(有業者・男) 3次活動の平均時間(有業者・女) 3次活動の平均時間(無業者・男) 3次活動の平均時間(無業者・女)
Prefecture Tertiary activities (male with a job) Tertiary activities (female with a job) Tertiary activities (male without a job) Tertiary activities (female without a job)
(分:minutes (分:minutes (分:minutes
全国 All Japan
北海道 Hokkaido青森県 Aomori-ken岩手県 Iwate-ken宮城県 Miyagi-ken秋田県 Akita-ken
山形県 Yamagata-ken福島県 Fukushima-ken茨城県 Ibaraki-ken栃木県 Tochigi-ken群馬県 Gumma-ken
埼玉県 Saitama-ken千葉県 Chiba-ken東京都 Tokyo-to神奈川県 Kanagawa-ken新潟県 Niigata-ken
富山県 Toyama-ken石川県 Ishikawa-ken福井県 Fukui-ken山梨県 Yamanashi-ken長野県 Nagano-ken
岐阜県 Gifu-ken静岡県 Shizuoka-ken愛知県 Aichi-ken三重県 Mie-ken滋賀県 Shiga-ken
京都府 Kyoto-fu大阪府 Osaka-fu兵庫県 Hyogo-ken奈良県 Nara-ken和歌山県 Wakayama-ken
鳥取県 Tottori-ken島根県 Shimane-ken岡山県 Okayama-ken広島県 Hiroshima-ken山口県 Yamaguchi-ken
徳島県 Tokushima-ken香川県 Kagawa-ken愛媛県 Ehime-ken高知県 Kochi-ken福岡県 Fukuoka-ken
佐賀県 Saga-ken長崎県 Nagasaki-ken熊本県 Kumamoto-ken大分県 Oita-ken宮崎県 Miyazaki-ken
鹿児島県 Kagoshima-ken沖縄県 Okinawa-ken
平均値 Mean標準偏差 Standard deviation
※ ※ ※
分子
指標計算式 Numerators 3次活動の平均時間 (有業者・男) 3次活動の平均時間 (有業者・女) 3次活動の平均時間 (無業者・男) 3次活動の平均時間 (無業者・女)
Formulae ofindicators 分母
Average time of tertiary activities(Male with a job)
Average time of tertiary activities(Female with a job)
Average time of tertiary activities(Male without a job)
Denominators
出典 Reference
2)2次活動の種類別平均時間 Time spent per day in secondary activities
3次活動の平均時間(無業者・女) 仕事の平均時間(有業者・男) 仕事の平均時間(有業者・女)
Tertiary activities (female without a job) Work (male with a job) Work (female with a job)
(分:minutes (分:minutes (分:minutesPref.Code
MeanS.D.
※ ※ ※
分子
3次活動の平均時間 (無業者・女) 仕事の平均時間 (有業者・男) 仕事の平均時間 (有業者・女) 指標計算式
Average time of tertiary activities(Female without a job) Average time of work (Male with a job) Average time of work (Female with a job) 分母
出典
都道府県コー
ド
205
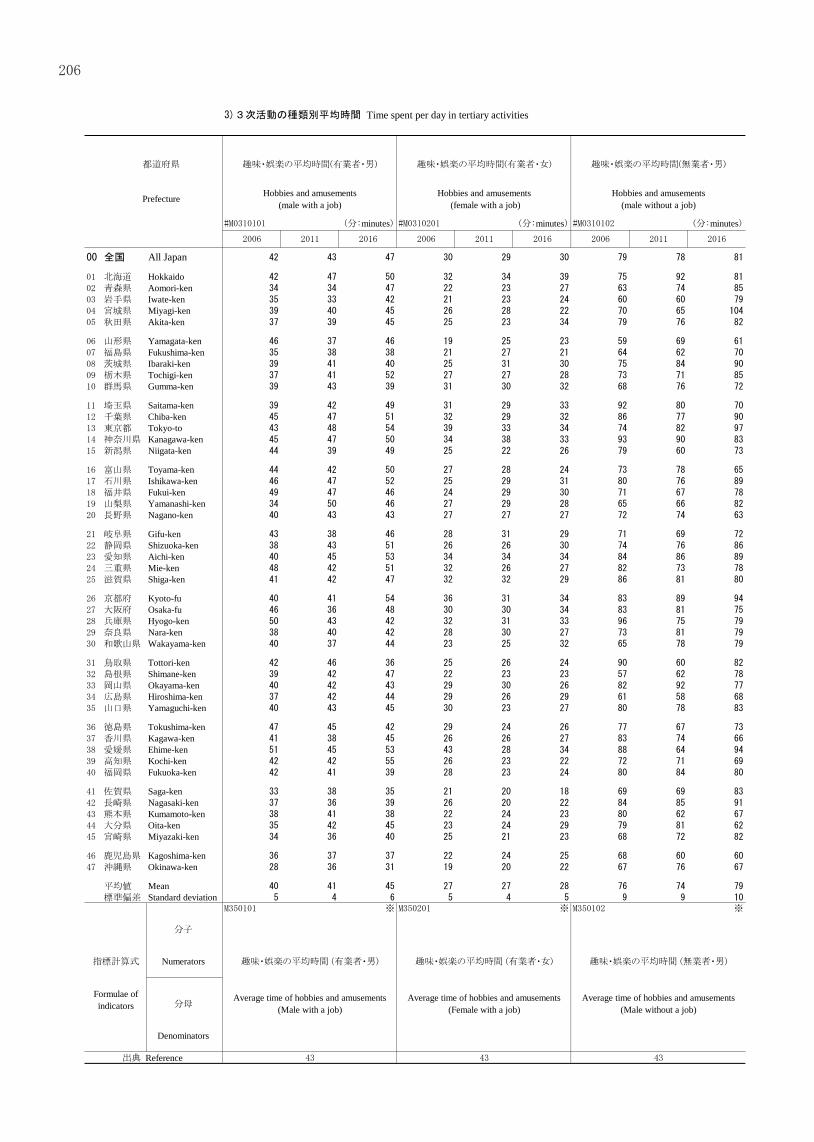
3)3次活動の種類別平均時間 Time spent per day in tertiary activities
都道府県 趣味・娯楽の平均時間(有業者・男) 趣味・娯楽の平均時間(有業者・女) 趣味・娯楽の平均時間(無業者・男) 趣味・娯楽の平均時間(無業者・女)
Prefecture Hobbies and amusements(male with a job)
Hobbies and amusements (female with a job)
Hobbies and amusements(male without a job)
Hobbies and amusements (female without a job)
(分:minutes (分:minutes (分:minutes
全国 All Japan
北海道 Hokkaido青森県 Aomori-ken岩手県 Iwate-ken宮城県 Miyagi-ken秋田県 Akita-ken
山形県 Yamagata-ken福島県 Fukushima-ken茨城県 Ibaraki-ken栃木県 Tochigi-ken群馬県 Gumma-ken
埼玉県 Saitama-ken千葉県 Chiba-ken東京都 Tokyo-to神奈川県 Kanagawa-ken新潟県 Niigata-ken
富山県 Toyama-ken石川県 Ishikawa-ken福井県 Fukui-ken山梨県 Yamanashi-ken長野県 Nagano-ken
岐阜県 Gifu-ken静岡県 Shizuoka-ken愛知県 Aichi-ken三重県 Mie-ken滋賀県 Shiga-ken
京都府 Kyoto-fu大阪府 Osaka-fu兵庫県 Hyogo-ken奈良県 Nara-ken和歌山県 Wakayama-ken
鳥取県 Tottori-ken島根県 Shimane-ken岡山県 Okayama-ken広島県 Hiroshima-ken山口県 Yamaguchi-ken
徳島県 Tokushima-ken香川県 Kagawa-ken愛媛県 Ehime-ken高知県 Kochi-ken福岡県 Fukuoka-ken
佐賀県 Saga-ken長崎県 Nagasaki-ken熊本県 Kumamoto-ken大分県 Oita-ken宮崎県 Miyazaki-ken
鹿児島県 Kagoshima-ken沖縄県 Okinawa-ken
平均値 Mean標準偏差 Standard deviation
※ ※ ※
分子
指標計算式 Numerators 趣味・娯楽の平均時間 (有業者・男) 趣味・娯楽の平均時間 (有業者・女) 趣味・娯楽の平均時間 (無業者・男) 趣味・娯楽の平均時間 (無業者・女)
Formulae ofindicators 分母
Average time of hobbies and amusements(Male with a job)
Average time of hobbies and amusements(Female with a job)
Average time of hobbies and amusements(Male without a job)
Denominators
出典 Reference
趣味・娯楽の平均時間(無業者・女) テレビ・ラジオ・新聞・雑誌の平均時間(有業者・男) テレビ・ラジオ・新聞・雑誌の平均時間(有業者・女)
Hobbies and amusements (female without a job) T.V. , radio, newspapers and magazines(male with a job)
T.V. , radio, newspapers and magazines(female with a job)
(分:minutes (分:minutes (分:minutesPref.Code
MeanS.D.
※ ※ ※
分子
趣味・娯楽の平均時間 (無業者・女)テレビ・ラジオ・新聞・雑誌の平均時間
(有業者・男)テレビ・ラジオ・新聞・雑誌の平均時間
(有業者・女)指標計算式
Average time of hobbies and amusements(Female without a job)
Average time of watching TV, listening to the radio,reading newspapers or magazines (Male with a job) a) 分母
出典a) Average time of watching TV, listening to the radio, reading newspapers or magazines (Female with a job)
都道府県コー
ド
206

3)3次活動の種類別平均時間 Time spent per day in tertiary activities
都道府県 趣味・娯楽の平均時間(有業者・男) 趣味・娯楽の平均時間(有業者・女) 趣味・娯楽の平均時間(無業者・男) 趣味・娯楽の平均時間(無業者・女)
Prefecture Hobbies and amusements(male with a job)
Hobbies and amusements (female with a job)
Hobbies and amusements(male without a job)
Hobbies and amusements (female without a job)
(分:minutes (分:minutes (分:minutes
全国 All Japan
北海道 Hokkaido青森県 Aomori-ken岩手県 Iwate-ken宮城県 Miyagi-ken秋田県 Akita-ken
山形県 Yamagata-ken福島県 Fukushima-ken茨城県 Ibaraki-ken栃木県 Tochigi-ken群馬県 Gumma-ken
埼玉県 Saitama-ken千葉県 Chiba-ken東京都 Tokyo-to神奈川県 Kanagawa-ken新潟県 Niigata-ken
富山県 Toyama-ken石川県 Ishikawa-ken福井県 Fukui-ken山梨県 Yamanashi-ken長野県 Nagano-ken
岐阜県 Gifu-ken静岡県 Shizuoka-ken愛知県 Aichi-ken三重県 Mie-ken滋賀県 Shiga-ken
京都府 Kyoto-fu大阪府 Osaka-fu兵庫県 Hyogo-ken奈良県 Nara-ken和歌山県 Wakayama-ken
鳥取県 Tottori-ken島根県 Shimane-ken岡山県 Okayama-ken広島県 Hiroshima-ken山口県 Yamaguchi-ken
徳島県 Tokushima-ken香川県 Kagawa-ken愛媛県 Ehime-ken高知県 Kochi-ken福岡県 Fukuoka-ken
佐賀県 Saga-ken長崎県 Nagasaki-ken熊本県 Kumamoto-ken大分県 Oita-ken宮崎県 Miyazaki-ken
鹿児島県 Kagoshima-ken沖縄県 Okinawa-ken
平均値 Mean標準偏差 Standard deviation
※ ※ ※
分子
指標計算式 Numerators 趣味・娯楽の平均時間 (有業者・男) 趣味・娯楽の平均時間 (有業者・女) 趣味・娯楽の平均時間 (無業者・男) 趣味・娯楽の平均時間 (無業者・女)
Formulae ofindicators 分母
Average time of hobbies and amusements(Male with a job)
Average time of hobbies and amusements(Female with a job)
Average time of hobbies and amusements(Male without a job)
Denominators
出典 Reference
趣味・娯楽の平均時間(無業者・女) テレビ・ラジオ・新聞・雑誌の平均時間(有業者・男) テレビ・ラジオ・新聞・雑誌の平均時間(有業者・女)
Hobbies and amusements (female without a job) T.V. , radio, newspapers and magazines(male with a job)
T.V. , radio, newspapers and magazines(female with a job)
(分:minutes (分:minutes (分:minutesPref.Code
MeanS.D.
※ ※ ※
分子
趣味・娯楽の平均時間 (無業者・女)テレビ・ラジオ・新聞・雑誌の平均時間
(有業者・男)テレビ・ラジオ・新聞・雑誌の平均時間
(有業者・女)指標計算式
Average time of hobbies and amusements(Female without a job)
Average time of watching TV, listening to the radio,reading newspapers or magazines (Male with a job) a) 分母
出典a) Average time of watching TV, listening to the radio, reading newspapers or magazines (Female with a job)
都道府県コー
ド
207
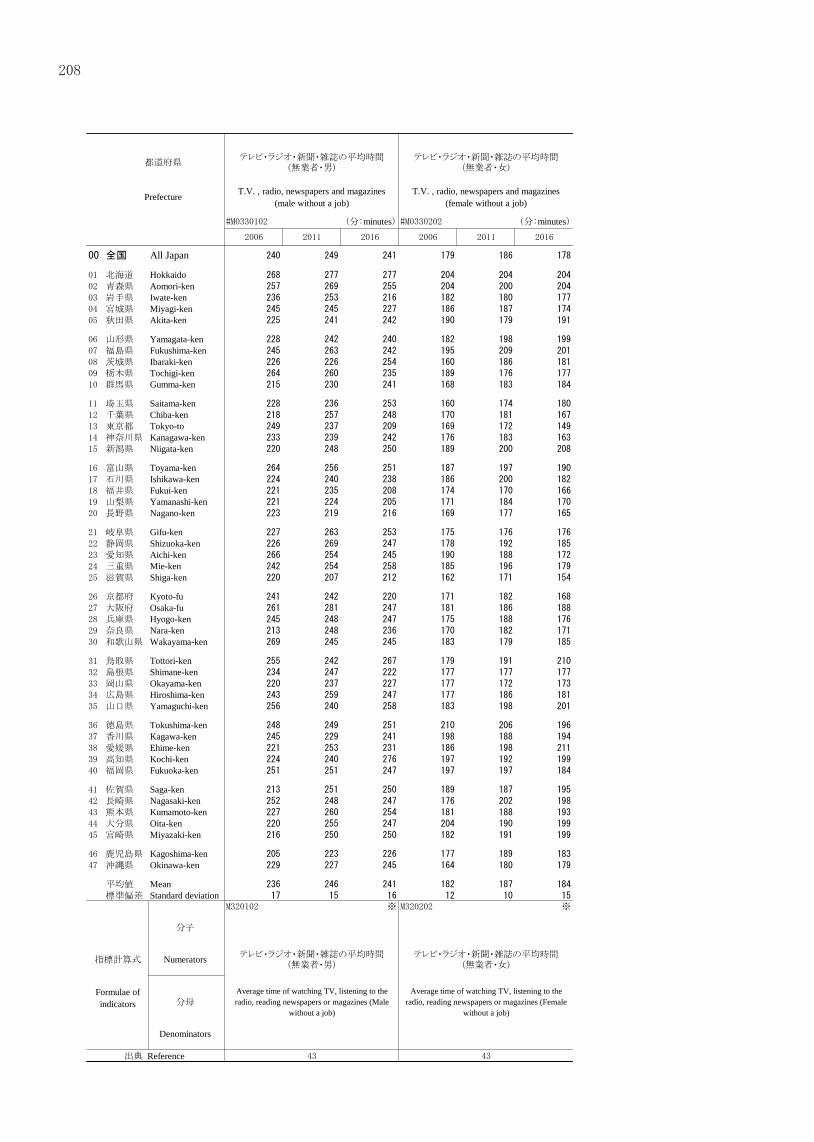
都道府県テレビ・ラジオ・新聞・雑誌の平均時間
(無業者・男)テレビ・ラジオ・新聞・雑誌の平均時間
(無業者・女)
Prefecture T.V. , radio, newspapers and magazines(male without a job)
T.V. , radio, newspapers and magazines(female without a job)
(分:minutes (分:minutes
全国 All Japan
北海道 Hokkaido青森県 Aomori-ken岩手県 Iwate-ken宮城県 Miyagi-ken秋田県 Akita-ken
山形県 Yamagata-ken福島県 Fukushima-ken茨城県 Ibaraki-ken栃木県 Tochigi-ken群馬県 Gumma-ken
埼玉県 Saitama-ken千葉県 Chiba-ken東京都 Tokyo-to神奈川県 Kanagawa-ken新潟県 Niigata-ken
富山県 Toyama-ken石川県 Ishikawa-ken福井県 Fukui-ken山梨県 Yamanashi-ken長野県 Nagano-ken
岐阜県 Gifu-ken静岡県 Shizuoka-ken愛知県 Aichi-ken三重県 Mie-ken滋賀県 Shiga-ken
京都府 Kyoto-fu大阪府 Osaka-fu兵庫県 Hyogo-ken奈良県 Nara-ken和歌山県 Wakayama-ken
鳥取県 Tottori-ken島根県 Shimane-ken岡山県 Okayama-ken広島県 Hiroshima-ken山口県 Yamaguchi-ken
徳島県 Tokushima-ken香川県 Kagawa-ken愛媛県 Ehime-ken高知県 Kochi-ken福岡県 Fukuoka-ken
佐賀県 Saga-ken長崎県 Nagasaki-ken熊本県 Kumamoto-ken大分県 Oita-ken宮崎県 Miyazaki-ken
鹿児島県 Kagoshima-ken沖縄県 Okinawa-ken
平均値 Mean標準偏差 Standard deviation
※ ※
分子
指標計算式 Numerators テレビ・ラジオ・新聞・雑誌の平均時間(無業者・男)
テレビ・ラジオ・新聞・雑誌の平均時間(無業者・女)
Formulae ofindicators 分母
Average time of watching TV, listening to theradio, reading newspapers or magazines (Male
without a job)
Average time of watching TV, listening to theradio, reading newspapers or magazines (Female
without a job)
Denominators
出典 Reference
Ⅱ 基礎データ
Basic Data
208


![ൡnazawa, Kanagawa Prefecture]](https://img.pdfslide.tips/doc/110x75/61a4f85fffe91b25910d8514/nazawa-kanagawa-prefecture.jpg)