Embed Size (px)
Citation preview

Master thesis
Spot Weldability of TRIP Steel with
High Carbon, High Aluminium Content
Jung, Geunsu (鄭根洙)
Computational Metallurgy
Graduate Institute of Ferrous Technology
Pohang University of Science and Technology
2011

고 탄소, 알루미늄 합금 TRIP강의
점용접성 평가
Spot Weldability of TRIP Steel with
High Carbon, High Aluminium Content

Spot Weldability of TRIP Steel with
High Carbon, High Aluminium Content
By
Jung, Geunsu
Computational Metallurgy
Graduate Institute of Ferrous Technology
Pohang University of Science and Technology
A thesis submitted to the faculty of Pohang University of
Science and Technology in partial fulfillments of the
requirements for the degree of Master of Science in the Graduate
Institute of Ferrous Technology (Computational Metallurgy)
Pohang, Korea
December 19th
, 2011
Approved by
Prof. Suh, Dong-Woo Prof. Bhadeshia, H.K.D.H.
________________ _____________________
Major Advisor Co-Advisor
Spot Weldability of TRIP Steel with
High Carbon, High Aluminium Content
Jung, Geunsu
This dissertation is submitted for the degree of Master of Science
at the Graduate Institute of Ferrous Technology of Pohang
University of Science and Technology. The research reported
herein was approved by the committee of Thesis Appraisal.
December 19th
, 2011
Thesis Review Committee
Chairman: Prof. Suh, Dong-Woo
(Signature)_________________
Member: Prof. Lee, Jong-bong
(Signature)_________________
Member: Prof. B. C. De Cooman
(Signature)_________________

i
MFT Jung geunsu
20100940 Spot weldability of TRIP steel with high carbon, high
aluminium content
Computational Metallurgy 2011
Advisor: Prof. Suh, Dong-Woo
Text in English
Abstract
Recent trends towards the integration of strong steels into the automotive
industry have accentuated demands on their resistance spot weldability, a
technique most widely used for bonding during automotive assembly. However,
strong steels are inherently rich in alloying elements. TRIP steels are not
exceptions because they require certain level of carbon content and cementite
inhibitors such as silicon to maintain austenite stability. The resulting high
hardenability makes it difficult to avoid the formation of brittle martensite in the
heat affected zone of resistance spot welds.
Recent research on TRIP-assisted steel alloy with relatively high carbon and
aluminium concentration showed a possible way forward. In this so called δ-
TRIP steel, δ-ferrite is stabilized by aluminium and persists in the microstructure
at all temperatures after solidification. Soft δ-ferrite can be retained in the
martensite that forms. Since it is assumed that avoiding fully martensitic weld
nugget may be helpful for better weldability and weld toughness, this idea is
promising. Previous research done by Yi et al. reports that δ-ferrite retained after
welding process is indeed good for better spot weldabilty, but it is not clear
whether the properties achieved are adequate.

ii
Expanding on this notion, the effectiveness of δ-ferrite in terms of spot
weldability has been qualitatively investigated in this work with alloys newly
designed for the purpose. The thesis can be divided into two parts, pre-weld
studies and an understanding of the weld. The initial part deals with the
optimization of heat treatment conditions itself to acquire the best possible
mechanical properties for the alloys. Specimens were tensile tested and analyzed
using optical and electron microscopes. The weld study covers microstructure,
joint property evaluations and fracture surface analysis. Relations between weld
microstructure and fracture mechanisms have been obtained. To further enhance
spot weldability, additional heating processes after spot welding with different
conditions were applied to assess whether the tempering of martensite in the weld
nuggets is advantageous. The procedure was expected to soften the weld nugget
and result in better weld integrity.
iii
Nomenclature
AHSS Advanced high strength steel
HSS High strength steel
TRIP Transformation induced plasticity
IF steel Interstitial free steel
Ac1 Temperature of austenite formation on heating
Ac3 Temperature at which transformation of ferrite into
austenite is completed on heating
RSW Resistance spot welding
TS Tensile strength
UTS Ultimate tensile strength
YS Yield strength
MPa Mega pascal, the unit for tensile strength
TSS Tensile shear strength
CTS Cross tensile sterngth
kVA Kilo volt-ampere
WSmin Minimum weld nugget size
AC Alternating current
DC Direct current

iv
Table of contents
Abstract ...................................................................................... i
Nomenclature ........................................................................... iii
Table of contents ...................................................................... iv
List of figures .......................................................................... vii
List of tables .............................................................................. x
1 Introduction ........................................................................... 1
1.1 TRIP steels and δ-TRIP steel ....................................................... 1
1.2 Resistance spot welding ................................................................ 2
1.3 Objectives ...................................................................................... 3
2 Literature review ................................................................... 5
2.1 TRIP steel ...................................................................................... 5
2.2 δ-TRIP steel ................................................................................... 9
2.3 Resistance spot welding .............................................................. 14
2.3.1 Introduction of resistance spot welding .............................. 14
2.3.2 Weld parameters................................................................... 16
2.3.3 Weld defects .......................................................................... 23
2.4 Spot weldability of high strength steel ...................................... 25

v
2.4.1 Suitable weld condition ........................................................ 25
2.4.2 Carbon equivalent ................................................................ 27
2.4.3 Weld strength test ................................................................. 28
3 Experiments ......................................................................... 33
3.1 Material specification ................................................................. 33
3.2 Pre-welding test ........................................................................... 37
3.2.1 Heat treatment cycle ............................................................ 37
3.2.2 Metallography....................................................................... 38
3.2.3 Mechanical test ..................................................................... 38
3.3 Spot welding test ......................................................................... 39
3.3.1 Welding condition ................................................................. 39
3.3.2 Weld microstructure ............................................................ 40
3.3.3 Weld property test ................................................................ 41
4 Pre-welding tests .................................................................. 42
4.1 Microstructure ............................................................................ 42
4.2 Mechanical property test ........................................................... 51
4.2.1 Property dependence on annealing temperatures ............. 51
4.2.2 Property dependence on austempering times .................... 55
5 Evaluation of spot weldability ............................................ 60
5.1 Weld nugget growth .................................................................... 60
5.2 Weld microstructure ................................................................... 67

vi
5.3 Weld hardness ............................................................................. 70
5.4 Weld strength .............................................................................. 72
5.5 Weld fracture surface study ....................................................... 77
5.6 Post weld heat treatment ............................................................ 81
5.7 Weld strength summary ............................................................. 84
6 Conclusion ............................................................................ 85
References ............................................................................... 87
Acknowledgement .................................................................. 94
Curriculum Vitae .................................................................... 95

vii
List of Figures
Fig. 1.1 schematic of spot welding process ................................................. 3
Fig. 2.1 mechanical properties of automotive steel [16] ............................. 5
Fig. 2.2 an illustration of TRIP phenomena [18]......................................... 6
Fig. 2.3 example of the microstructure of TRIP-ssisted steel [20] ............. 7
Fig. 2.4 typical heat treatment cycle for modern TRIP steel ....................... 8
Fig. 2.5 trends of the effect of alloying elements on the amount of
retained austenite % [6] ............................................................................. 11
Fig. 2.6 predicted quantites of each phase as a function of temperature
for the optimized alloy [6] ......................................................................... 12
Fig. 2.7 δ-ferrite dendrite in microstructure of δ-TRIP steel [6] ............... 12
Fig. 2.8 a stress-strain curve of new δ-TRIP steel and the comparison of
properties against other TRIP steels from literature [6] ............................ 13
Fig. 2.9 a schematic of RSW process ........................................................ 15
Fig. 2.10 comparison of different welding current wave forms ................ 17
Fig. 2.11 resistance in general spot welding process [44] ......................... 18
Fig. 2.12 change in bulk resistivity with temperature [44] ....................... 18
Fig. 2.13 dynamic resistance curves for 10-cycle AC and DC welds on
0.037-in. uncoated steel [41] ..................................................................... 19
Fig. 2.14 contact resistance comparison of AC and DC welding [42] ...... 20
Fig. 2.15 an example of the weld lobe diagram ........................................ 22
Fig. 2.16 several examples of external discontinuities in RSW [44] ........ 24
Fig. 2.17 a large void in mild steel weld [44]............................................ 24
Fig. 2.18 weld cracks in AA6111 and AA5754 [44] ................................. 25
Fig. 2.19 weld lobe curves for mild steel and IF steel [48] ....................... 26
Fig. 2.20 effect of weld current on nugget diameter [13].......................... 27

viii
Fig. 2.21 specimen dimensions for shear tensile and cross tensile tests
[53, 54] ...................................................................................................... 29
Fig. 2.22 different weld fracture mode [53, 54] ........................................ 31
Fig. 2.23 effect of nugget diameter and base metal strength on TSS and
CTS of joints [13] ...................................................................................... 32
Fig. 3.1 equilibrium phase diagrams for alloys ......................................... 35
Fig. 3.2 microstructures of hot-rolled alloys ............................................. 36
Fig. 3.3 heat treatment cycles for new alloys ............................................ 38
Fig. 3.4 rectangular tension test specimen [56] ......................................... 39
Fig. 3.5 definition of nugget size [53, 54] ................................................. 41
Fig. 4.1 microstructures of quenched specimens after annealing ............. 42
Fig. 4.2 SEM image of quenched 4HA ..................................................... 43
Fig. 4.3 microstructures after annealing with temperature variation ........ 46
Fig. 4.4. EBSD images of alloys after annealing and austempering ......... 48
Fig. 4.5 microstructure changes in the alloys with austempering time
variations ................................................................................................... 49
Fig. 4.6 EBSD images of alloy 3HA with different austempering time .... 50
Fig. 4.7 retained austenite volume fraction change with different
austempering times .................................................................................... 51
Fig. 4.8 mechanical properties with different annealing times ................. 53
Fig. 4.9 mechanical properties with different austempering times of
3HA ........................................................................................................... 56
Fig. 4.10 tensile properties for every alloy with different heating
conditions .................................................................................................. 58
Fig. 5.1 weld nugget growth change of each alloy with different weld
currents ...................................................................................................... 64
Fig. 5.2 weld lobe diagrams for alloys and the weld currents ................... 66

ix
Fig. 5.3 weld microstructure (AC welded) ................................................ 68
Fig. 5.4 weld microstructure (DC welded) ................................................ 69
Fig. 5.5 hardness measured across weld nugget ........................................ 71
Fig. 5.6 hardness profiles for AC weld ...................................................... 71
Fig. 5.7 hardness profiles for DC weld ..................................................... 72
Fig. 5.8 weld strength results for AC spot welded alloys .......................... 74
Fig. 5.9 weld strength results for DC spot welded alloys ......................... 75
Fig. 5.10 relations between electrode force and weld strength ................. 77
Fig. 5.11 weld surface fracture images of 4HA......................................... 80
Fig. 5.12 weld strength change after PWHT ............................................. 82
Fig. 5.13 weld hardness profiles of 3LA and 4LA after PWHT ................ 83

x
List of Tables
Table 3.1 composition of investigated alloys ............................................ 33
Table 3.2 spot welding conditions ............................................................. 40
Table 4.1 mechanical property changes with different annealing ............. 54
Table 4.2 mechanical property of 3HA with different austempering ........ 56
Table 5.1 δ-ferrite volume fraction comparison in weld nuggets .............. 70
Table 5.2 post weld heat treatment conditions .......................................... 81
Table 5.3 comparison of weld strength and ductility ratio with
commercial steels ...................................................................................... 84

1
1 Introduction
1.1 TRIP steels and δ-TRIP steel
Competition between materials and environmental legislation are driving the
big trend for lighter automobile. The exploitation of stronger steel is therefore a
common practice in industry. Among many kinds of high-strength steels, TRIP
steel stands out because of its excellent formability and strength-ductility ratio
[1].
In TRIP steel, some austenite, usually stable only at high temperatures, is
retained to the ambient temperature but transforms into hard martensite during
straining, which delays the onset of necking, resulting in greater uniform
elongation [2]. Therefore, retained austenite is important in determining the
mechanical properties of TRIP steel.
Conventional low-alloyed TRIP assisted steels has 0.15 C, 1.2-1.5 Mn and 1.0-
1.5 Si wt% in composition [3]. The addition of at least 0.3-0.8 wt%Si addition is
common as a cementite inhibitor [2, 3]. However, silicon has been reported to
reduce surface quality by forming Si oxide phases [4].
In order to retain enough austenite for good mechanical properties and at the
same time improve surface quality, many alloy designs have been made where
silicon were replaced by aluminium with the function of inhibiting cementite
formation [3]. Recently, a new type of TRIP steel with significant aluminium
2
content has been suggested and developed whose mechanical properties were
outstanding with ultimate tensile strength of more than 1 GPa and uniform
elongation in excess of 23% [5, 6]. This so called δ-TRIP steel characterizes itself
by having δ-ferrite which is stable at all temperatures in the solid state. This kind
of TRIP steel has been investigated by authors [5-10] and is described in detail in
the next chapter.
1.2 Resistnace spot welding
This is a simple and quick metal-bonding method in use by industry [11]. In
automotive assembly, more than 3,000 spots are typically made for the structure
of a single vehicle [9, 12]. The conventional process starts with clamping the
metal sheets in between electrodes as in Fig. 1.1. When the electrical current
coming from one electrode travels through the sheets, heat is created at the
interface between electrodes and sheets where the electrical resistance is large.
With this localized heat due to contact, metal starts to melt, and the weld nugget
is created under high pressures pushing two sheets together. After certain holding
time, metal sheets are released bound and the whole process ends. Usually the
entire sequence takes less than 1 s, so spot welding is a rapid and productive
welding method. Depending on the thickness and type of the metal, welding
conditions such as weld current, weld time, electrode type and electrode force
should be adjusted.

3
Fig. 1.1 schematic of spot welding process
1.3 Objectives
Since steel sheets that are made for the use in the automotive industry are
eventually spot-welded in the production process, weldability of the steel must be
assessed before application. In most cases, higher strength in strong steels comes
from enhanced alloying element concentrations. This may bring about a
reduction in weldability because of an increased carbon equivalent [13]. It
becomes clear that when conducting an alloy design, not only mechanical
properties of the steel but also its spot weldability should be taken into account
[13, 14]. Although δ-TRIP has a high carbon equivalent, retained δ-ferrite in the
weld zone and heat affected zone due to its high aluminium concentration helps

4
improve weld toughness.
Alloys that are investigated in this work had been modelled based on this idea
of utilizing δ-ferrite for better weld performance of the steel. Thus, the objectives
of this thesis can be stated as below.
1) Optimization of heat treatment parameters for the alloys for the best
mechanical properties before actual welding
2) Investigation on the influence of δ-ferrite on spot weldabiilty in the newly
proposed TRIP-assisted steels
3) Analysis of weld microstructures and qualitative study of δ-ferrite formation in
the fusion zone
4) Study of weld fracture surfaces and fracture mechanisms
5
2 Literature review
2.1 TRIP steel
The need for strong steels for the automotive industry has exerted for many
decades [3, 15], in order to achieve weight reduction, to enhance safety and to
avoid any threat from alternative materials such as aluminium.
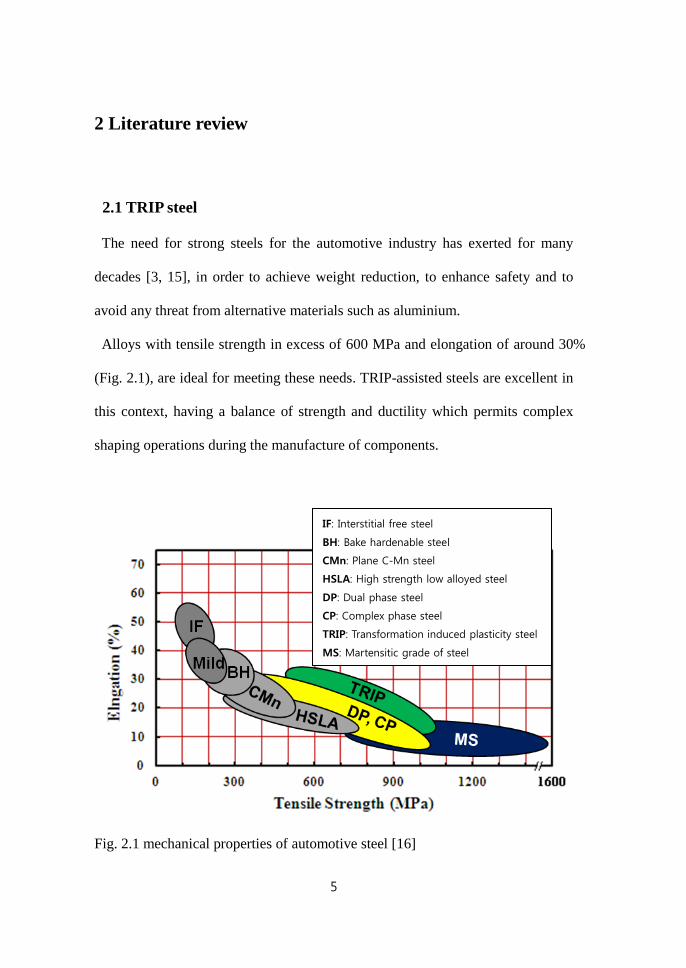
Alloys with tensile strength in excess of 600 MPa and elongation of around 30%
(Fig. 2.1), are ideal for meeting these needs. TRIP-assisted steels are excellent in
this context, having a balance of strength and ductility which permits complex
shaping operations during the manufacture of components.
Fig. 2.1 mechanical properties of automotive steel [16]
IF: Interstitial free steel
BH: Bake hardenable steel
CMn: Plane C-Mn steel
HSLA: High strength low alloyed steel
DP: Dual phase steel
CP: Complex phase steel
TRIP: Transformation induced plasticity steel
MS: Martensitic grade of steel

6
Fig. 2.2 illustrates the TRIP phenomenon wherein retained austenite
transforms into martensite under loading, thus suppressing plastic instability and
extending the range of uniform elongation [17, 18]. Fully austenitic TRIP steels
do exist but require large quantities of austenite stabilizing solutes and hence are
not affordable. However, as can be seen in Fig. 2.3, conventional low-alloy
TRIP-assisted steel has austenite only as a minor phase dispersed in a rather soft
ferrite matrix [19].
Fig. 2.2 an illustration of TRIP phenomena [18]
Loading direction

7
Fig. 2.3 an example of the multiple phase microstructure of conventional TRIP-
assisted steel with a composition of 0.11 C, 0.15 Mn, 0.15 Si, 0.04 Al wt% (F:
ferrite A: austenite B: bainite) [20]
As shown in Fig. 2.4, a heating process for TRIP steels generally consists of 3
stages; intercritical annealing, isothermal transformation and the final cooling.
The intercritical annealing is usually done in between the Ac1 and Ac3
temperatures where two phases, ferrite and austenite, are thermodynamically
stable. After, the steel is rapidly cooled to the temperature range where bainitic
transformation proceeds and as a result carbon partitions into the residual
austenite [20]. The carbon-enrichment of the austenite is preserved by adding
cementite retarders such as silicon, which deter the precipitation of cementite
from austenite [21]. Consequently, the enriched austenite becomes stable and can

8
survive martensite transformation to room temperature [3, 22].
Fig. 2.4 typical heat treatment cycle for modern TRIP steel and schematics of
expected microstructure at each stage (α: ferrite γ: austenite αB: bainite)
Although the addition of silicon is necessary to saturate austenite with carbon
by preventing carbide nucleation in conventional TRIP steels, the oxide of silicon,
SiO2, on steel surface can cause some problems. For the prevention of corrosion,
Zn coating is usually applied to automotive steel sheets, but silicon selectively
oxidizes and forms SiO2 on steel surfaces, deteriorating molten zinc wettability
9
[4, 23, 24]. Moreover, the silicon oxide is known to anchor iron oxide which in
turn forms red-scale on steel surface, making it difficult to remove oxide layers
by acid pickling after hot-rolling process [25, 26].
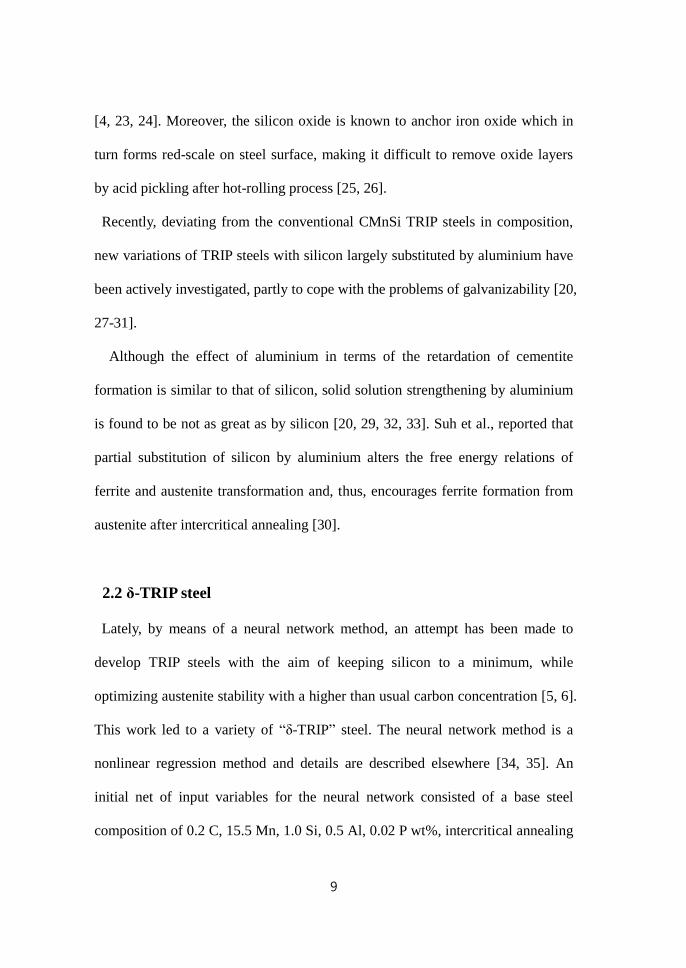
Recently, deviating from the conventional CMnSi TRIP steels in composition,
new variations of TRIP steels with silicon largely substituted by aluminium have
been actively investigated, partly to cope with the problems of galvanizability [20,
27-31].
Although the effect of aluminium in terms of the retardation of cementite
formation is similar to that of silicon, solid solution strengthening by aluminium
is found to be not as great as by silicon [20, 29, 32, 33]. Suh et al., reported that
partial substitution of silicon by aluminium alters the free energy relations of
ferrite and austenite transformation and, thus, encourages ferrite formation from
austenite after intercritical annealing [30].
2.2 δ-TRIP steel
Lately, by means of a neural network method, an attempt has been made to
develop TRIP steels with the aim of keeping silicon to a minimum, while
optimizing austenite stability with a higher than usual carbon concentration [5, 6].
This work led to a variety of “δ-TRIP” steel. The neural network method is a
nonlinear regression method and details are described elsewhere [34, 35]. An
initial net of input variables for the neural network consisted of a base steel
composition of 0.2 C, 15.5 Mn, 1.0 Si, 0.5 Al, 0.02 P wt%, intercritical annealing

10
parameters of 780°C for 300 s and isothermal holding parameters of 400°C for
500 s [6]. Fig. 2.5 illustrates several examples of the trends predicted by
calculation. It was predicted that carbon and manganese help retain more
austenite. Silicon and aluminium also increase the fraction of residual austenite
because they suppress cementite formation during isothermal holding process [2,
3, 21]. Based on such predictions, an ideal TRIP steel in which enough residual
austenite is obtained and the amount of solute silicon is kept minimum was
estimated with the neural network method along with a commercially available
genetic algorithm [36]. The composition of which is 0.4 C, 2.0 Mn, 0.5 Si, 2.0 Al,
0.5 Cu, 0.02 P wt%. The steel is expected to have 41±20 vol% of retained
austenite fraction after the intercritical annealing at 840°C for 60 s followed by
isothermal holding at 300°C for 900 s [6].
As it can be expected from the steel‟s calculated phase diagram, δ-ferrite does
not completely disappear on solidification, persisting to a minimum 20 vol% at
ambient temperature. Fig 2.7 shows the dendritic δ-ferrite in the microstructure
of δ-TRIP steel, and this is a unique feature of the steel.
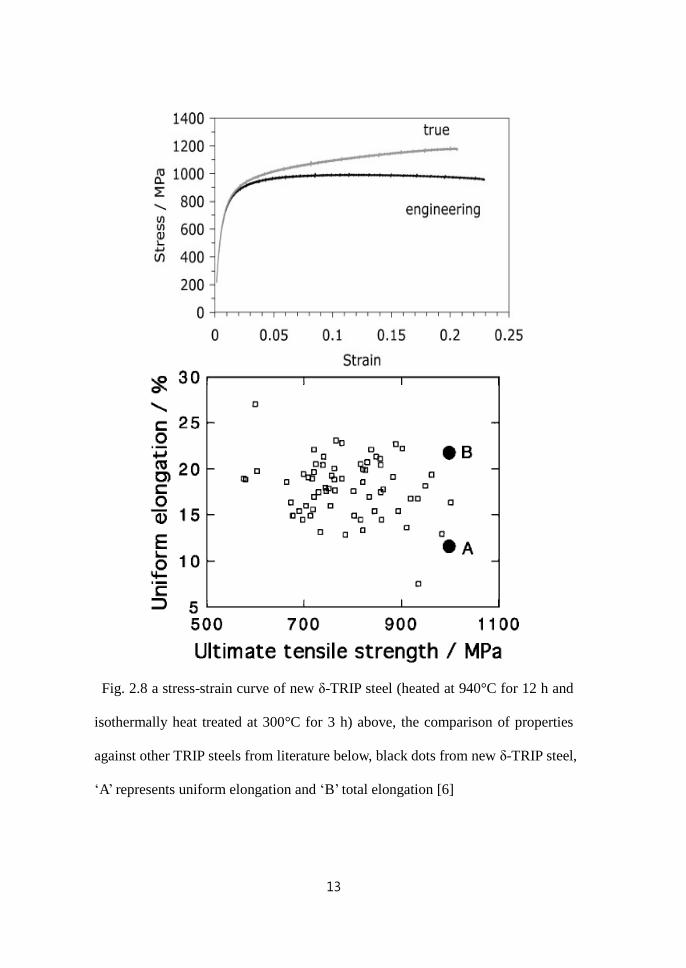
This new δ-TRIP steel has been reported to have an ultimate tensile strength of
1 GPa and total elongation of more than 20% if properly heat treated [6], and
from Fig 2.8, it is clear that its mechanical properties are comparable with
conventional TRIP steels.

11
Fig. 2.5 trends of the effect of alloying elements on the amount of retained
austenite % [6]

12
Fig. 2.6 predicted quantities of each phase as a function of temperature for the
optimized alloy [6]
Fig. 2.7 δ-ferrite dendrite in microstructure of δ-TRIP steel [6]
13
Fig. 2.8 a stress-strain curve of new δ-TRIP steel (heated at 940°C for 12 h and
isothermally heat treated at 300°C for 3 h) above, the comparison of properties
against other TRIP steels from literature below, black dots from new δ-TRIP steel,
„A‟ represents uniform elongation and „B‟ total elongation [6]

14
By means of neural network modeling process with genetic algorithm, δ-TRIP
steel had been developed, and further work has been reported with respect to its
retention [7-10]. A distinguishing aspect of this novel steel is the retention of δ-
ferrite following solidification process, which may possibly improve weldability
of the steel by preventing fully martensitic weld zones. The directly welded part
of the steel melts and solidifies again, which in most cases for AHSS, ends of a
highly brittle martensitic weld nugget. However, if the δ-ferrite survives in the
nugget zone, then it well reduces the weld hardness and hence embrittlement.
This has partly been investigated by Yi et al. [9], although detailed relationships
between δ-ferrite, weld fracture mechanism and weldabilty remains unclear.
2.3 Resistance Spot Welding
2.3.1 Introduction of resistance spot weld
Resistance spot welding, RSW in short, is simple, easy to automate and fit for
mass production, and for these reasons it is one of most widely used joining
methods in the automotive industry. RSW is an autogenous welding process,
meaning that unlike other methods, it does not require filler metals. RSW
harnesses the metal‟s natural electrical resistance to generate heating. The
procedure begins with electrodes which clamp two metal sheets (Fig. 2.9). The
current flows through the sheets from one electrode to the other, and resistance to
this flowing current generates heat. A temperature is reached where the metal
sheets fuse at the faying surfaces and a molten region is generated in between

15
two sheets. As the current shuts off, the melt rapidly solidifies due to cooling
water, forming a solid nugget. Ever since the original invention by Professor
Elihu Thomson in 1877, the process has been applied actively for the assembly of
metal sheets in the automobile and aircraft industries [37].
Fig 2.9 a schematic of RSW process
The heat generated by resistance is expressed as below [13].
Here R1 is the contact resistance of two metal sheets, R2 the metal‟s electrical
resistance, I the weld current, s the weld time and r the contact diameter of two
sheets. R1 and R2 are approximately constant, so the current, weld time and
contact diameter determined by the electrical force are known to be important in
determining the welding condition [13]. Thus, manipulation of such welding
Copper electrode
Weld nugget
Water cooling

16
parameters for each material is the key for controlling weld quality.
2.3.2 Weld parameters
During welding, molten zone at the faying sheet surface becomes the weld
nugget, so if more heat can be generated, a larger volume of metal can be melted,
resulting in a bigger nugget. Larger weld nuggets are generally good for weld
performance [38-40]. The weld nugget size should be large enough for better
impact property as well as preferable weld failure mode [38, 40].
Current
In RSW, the generated heat is proportional directly to the weld current. Two
types of current wave forms are available for conventional RSW processes; they
are AC (alternating current) and DC (direct current) wave forms. In the
automotive industry, the spot welding process with single-phase AC has been
predominant [41]. DC systems can be used by rectification of single-phase or
multi-phase AC into DC. Inverter equipped spot welders can provide very high
frequency (2000 Hz) DC, which is effective in terms of energy use [41]. Also,
DC system-based spot welding usually requires more equipment, thus bringing
reliability problems, and is more costly [42], but it minimizes the heat loss and
provides uniform heat flow. Fig. 2.10 compares each current wave form, and in a
single-phase AC there is an inevitable energy loss because of a series of current
zero points, while DC systems provide reliable uniform heat flow. Many

17
investigations on the differences that may come from different power systems,
AC or DC, have been conducted by many authors [41, 43].
Fig. 2.10 comparison of different welding current wave forms
Resistance
Although practically uncontrollable, it is important to understand the effect of
resistance on weldability in RSW. Fig. 2.11 illustrates regions where electrical
resistivity exists in RSW, and it can be observed that there are two major types,
bulk and contact resistance. The total is then the sum of all the resistance values
which are in series. Bulk resistance largely is the characteristic of the sheet
material that is spot welded. For most metals, it increases with temperature, and a

18
stiff peak is observed for aluminium at 925 K, the melting point of the metal (Fig.
2.12).
Fig. 2.11 resistance in general spot welding process [44]
Fig. 2.12 change in resistivity with temperature for different metals [44]

19
Contact resistance is significantly affected by pressure and surface condition.
Brown measured resistance change during spot welding (Fig. 2.13). In the case of
AC welding, resistance drops rapidly at the initial stage because of the decreased
contact resistance from the high current peak that is absent in DC. Highly
concentrated current generates great heat and brakes down the contact surface,
destroying possible oxide phases on surface that can act as insulators [41]. As a
result, heating efficiency in spot weld process can be compromised for AC
welding. Later, because of the fact that bulk resistance increase in proportion to
temperature, the overall resistance of AC eventually approaches to that of DC.
Fig. 2.14 is the comparison of contact resistance profiles of AC and DC welding
suggested by Li et al., and it shows a rapid drop of contact resistance in the case
of AC welding [42].
Fig. 2. 13 dynamic resistance curves for 10-cycle AC and DC welds on 0.037-in.
uncoated steel [41]
Weld current = 7.4 kA

20
Fig. 2.14 contact resistance comparison of AC and DC welding [42]
Weld time
Spot welding process generally consists of 4 steps, which are squeezing,
welding, holding and final releasing [11]. In AC systems, the weld time is
expressed in cycles (one cycle is 1/60 of a second in a 60 Hz power system),
while millisecond is used for DC systems. During squeeze time, metal sheets are
placed in position and clamped by electrodes. When the electrode force has
reached the desired level, welding proceeds by the application of current. During
this time, melting and joining occurs. Weld time should be determined according
to material type, weld quality as well as productivity. The current is shut off
during the hold time, so the nugget is allowed to cool. Finally the metal is
released, and the next welding sequence begins. The time for each step should be
21
set according to the material, thickness and the coating conditions [45].
Electrode force
Electrode force is applied on electrodes to press and secure metal sheets in
position. Electrode force P is expressed as below, where t is the metal thickness
in mm, TS tensile strength of the steel sheets in MPa [13].
According to the above equation, stronger steels will require greater electrode
force. If the force is insufficient to push the two metal sheets tight, a small
contact diameter results, which alters the amount of heat that is generated,
according to equation 2.3.1.
Weld lobe curve
Fig. 2.15 demonstrates the general type of weld-lobe curve diagram. This
diagram simply shows the window of operation within which weld quality can be
guaranteed. Although many variations of the lobe diagram can exist, the
electrode force is customarily set constant, and the diagram is drawn on the basis
of current versus time.
The lower boundary in the graph is determined at the condition in which the
weld current is not high enough, so weld nugget size would not grow as big as
minimum weld nugget size, which is 4t0.5
(t=metal sheet thickness). Criteria for

22
the minimum nugget size may vary depending on the standards and applications
for example 5t0.5
for more severe condition. Sun explained that the
conventionally suggested minimum weld nugget size 4t0.5
is insufficient to
guarantee spot weldability for 800 grade high steels [38]. Marya came up with a
new and stricter criterion for determining minimum weld size, and it is expressed
as [40],
where φ is a weld nugget diameter, and d is the sheet thickness.
The upper boundary is drawn from the points over which expulsion occurs.
Expulsion is one kind of a weld defect and leads to the loss of metal, so it is
detrimental to weld quality [44]. Different materials have different weld
conditions, so different lobe curves. For weld quality, welding should be done
within the range of two boundaries.
Fig. 2.15 an example of the weld lobe diagram

23
2.3.3 Weld defects
Spot welds are not free from defects, which can be largely categorized into two
groups; external and internal discontinuities [44].
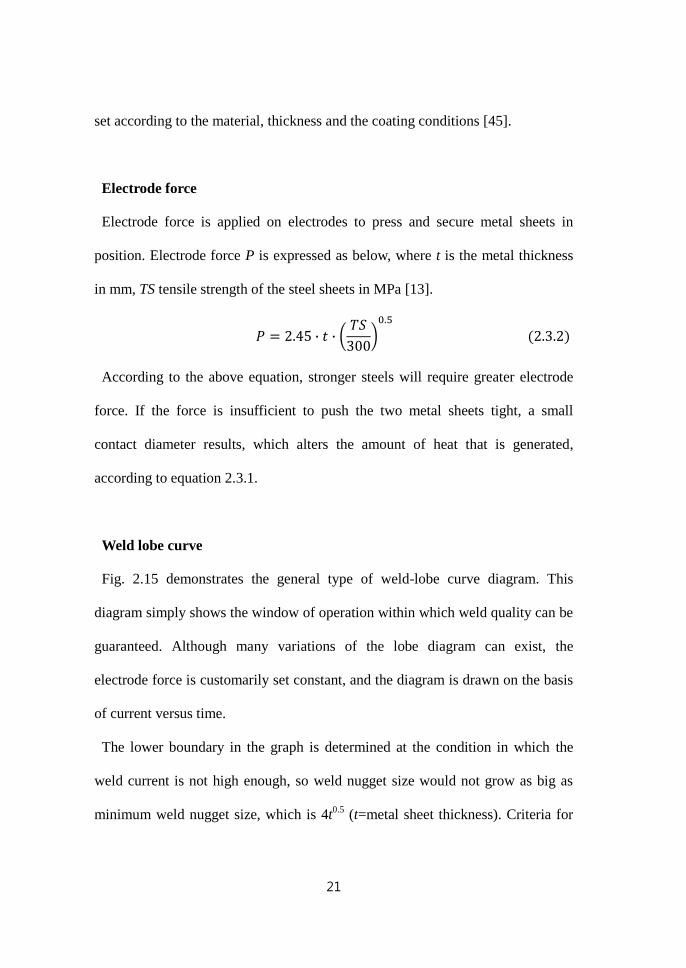
External discontinuities
Defects that appear on the weld surface fall into this category. They usually can
be observed by bare eyes or with the aid of low magnifying microscope. The
prevention of external defects in most cases comes from the adjustment of
welding parameters [44].
24
Fig 2.16 several examples of external discontinuities in RSW [44]
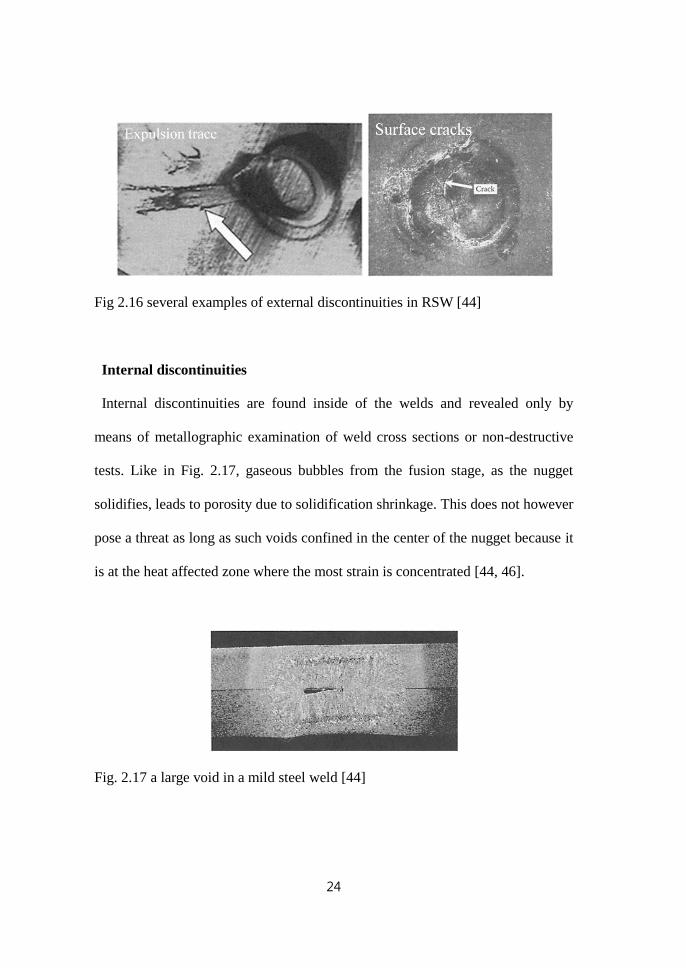
Internal discontinuities
Internal discontinuities are found inside of the welds and revealed only by
means of metallographic examination of weld cross sections or non-destructive
tests. Like in Fig. 2.17, gaseous bubbles from the fusion stage, as the nugget
solidifies, leads to porosity due to solidification shrinkage. This does not however
pose a threat as long as such voids confined in the center of the nugget because it
is at the heat affected zone where the most strain is concentrated [44, 46].
Fig. 2.17 a large void in a mild steel weld [44]
25
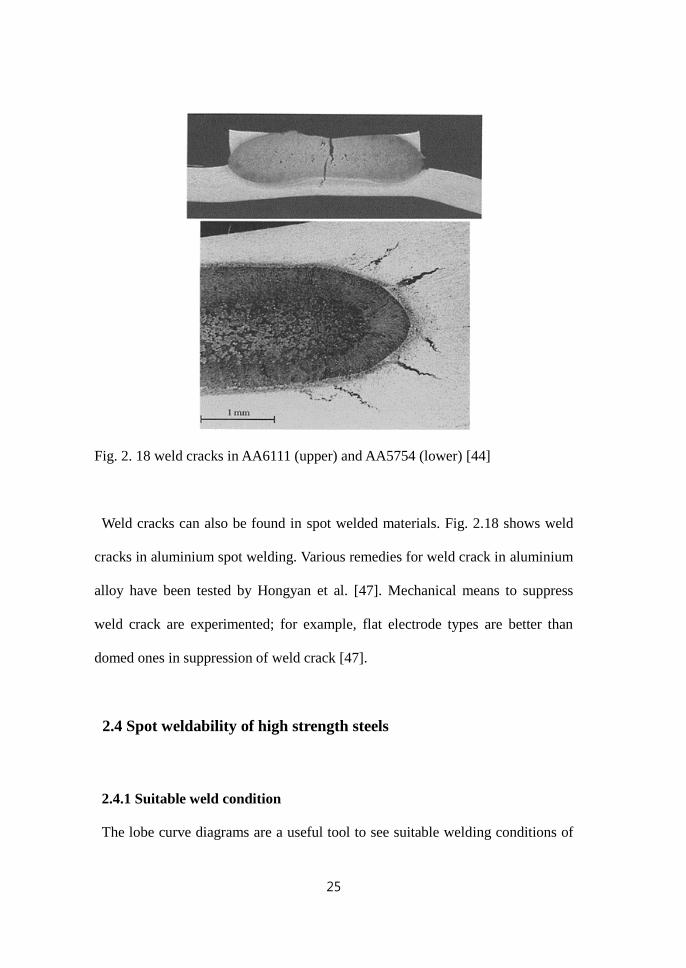
Fig. 2. 18 weld cracks in AA6111 (upper) and AA5754 (lower) [44]
Weld cracks can also be found in spot welded materials. Fig. 2.18 shows weld
cracks in aluminium spot welding. Various remedies for weld crack in aluminium
alloy have been tested by Hongyan et al. [47]. Mechanical means to suppress
weld crack are experimented; for example, flat electrode types are better than
domed ones in suppression of weld crack [47].
2.4 Spot weldability of high strength steels
2.4.1 Suitable weld condition
The lobe curve diagrams are a useful tool to see suitable welding conditions of

26
certain materials. Since a larger process window allows flexibility during the
production process, a broad range between the minimum and maximum weld
current is appreciated in industry. It is known that highly alloyed steel needs less
current to than low-alloy steel [48]. A comparison of weld lobe curves of mild
steel and IF (interstitial free) steel is illustrated in Fig. 2.19; the latter is hardly
alloyed and hence requires more current value. The addition of alloying elements
in steel increases its bulk resistance, so that heat generated from welding process
increases [11]. Therefore, for an IF steel to acquire the same nugget size as mild
steel, it requires the current to be maintained for a longer period. Fig. 2.20 is the
weld nugget growth graph for three different steel alloys. The more alloyed steel,
590TRIP steel, has the suitable weld current range that is overall lower than other
alloys by the same principle.
Fig. 2.19 weld lobe curves for mild steel and IF steel [48]

27
Fig. 2.20 effect of weld current on nugget diameter [13]
2.4.2 Carbon equivalent
In typical resistance spot weld process, cooling rate is very rapid ranging from
1,000-10,000 K s-1
because of the quenching effect from the copper electrodes
[49, 50]. As a result, martensite forms at the fusion zone, increasing hardness
around weld compared with the base metal. When considering weldability, the
carbon equivalent is important because it is closely related to hardenability
around the weld zone. Typically, highly alloyed steels have the high value of
carbon equivalent. Many different empirical equations have been published for
determining carbon equivalent [13, 51, 52], of which are listed below.

28
2.4.3 Weld strength test
Weld strength from spot welded part needs to be evaluated to ascertain the
appropriate integration of steels into automobile production. According to
Japanese standards [53, 54], two types of tensile testing methods are employed to
assess weld strength, and they are shown schematically in Fig. 2.21. For shear
tensile stress test, TSS in short, machined materials are spot welded at one end
and horizontally dragged until failure. Samples spot welded into a cross-shaped
piece and then pulled apart normal to the plate plane involve a cross tensile
strength test, CTS in short. In both cases, the fracture tensile strength is measured
[53, 54].

29
W=30, L=30, A=100, B=70 (mm)
Fig. 2.21 specimen dimensions and shapes for shear tensile and cross tensile
tests [53, 54]
Shear tensile
strength test
Shear tensile
strength test
Cross tensile
strength test

30
The shape of the weld fracture surface determines the fracture mode of weld
failure (Fig. 2.22). Plug fracture usually means the part was welded well and
strong enough to withstand the load because it fails around the nugget. If fracture
occurs in a partial plug fracture mode, it is not as good as the plug fractured case,
but is tolerable. Lastly, interfacial fracture is the case where weld nugget is not
strong at all. It happens with insufficient nugget size. Interfacial fracture mode
should be avoided, and plug fracture mode is ideal [9].
The weld nugget size is a critical factor for weld strength [13]. In the upper
graph in Fig. 2.23, shear strength increases in accordance with nugget size. The
lower graph in Fig. 2.23 shows the relations between base metal strength and
TSS, CTS. While TSS increases with base metal strength, CTS decreases after
peaking at the point where the base metal strength is 590MPa. This is explained
by the fact carbon equivalent of high strength steel usually is higher [14].

31
Fig. 2.22 different weld fracture mode; plug fracture, partial plug fracture and
interfacial fracture mode [53, 54]
Plug fracture
mode
Partial plug
fracture mode
Interfacial
fracture mode Sheared fracture nugget
Corona

32
Fig. 2.23 effect of nugget diameter(upper) and base metal strength(lower) on TSS
and CTS of joints [13]
Another important factor when assessing spot weldability is ductilitiy ratio,
which is expressed as CTS/TSS value. While the origin of it remains unclear, it is
known that a weld with a ductility ratio more than 0.5 shows better toughness
[55]. Thus, it is imperative to acquire a reasonable ductility ratio to avoid weld
embrittlement problem for automotive steels.
Tensile strength (MPa)

33
3 Experiments
3.1 Material specification
Table 3.1 specifies the compositions of 4 similar alloy systems that were
investigated for this work. Alloy designs were conducted based on the former δ-
TRIP steel compositions [6-8, 10]. Carbon and aluminium contents were
purposely varied in order to see their effect on δ-ferrite stability.
Table 3.1 composition of investigated alloys
Alloy C
(wt%)
Mn
(wt%)
Si
(wt%)
Al
(wt%)
3LA 0.30 0.52 0.20 3.50
3HA 0.30 0.51 0.21 5.60
4LA 0.40 0.51 0.19 3.50
4HA 0.40 0.50 0.18 5.60
Fig. 3.1 shows the calculated equilibrium phase diagrams for each alloy using
commercial thermodynamic simulation software, ThermoCalc with the TCFE6
database. Predictions can be made from the equilibrium phase diagrams that the
δ-ferrite that forms in the early stages of solidification would not completely
disappear except in the case of 4LA. Considering remaining fraction of δ-ferrite
at room temperature, the stability of δ-ferrite in 3HA is the highest, and then
decreases in the order 3LA, 4HA and 4LA.

34

35
Fig. 3.1 equilibrium phase diagrams for 3LA, 3HA, 4LA and 4HA alloys

36
Specimens were produced as vacuum-melted ingots of 25 kg and austenitized at
1200°C for 1 h followed by hot-rolling to 4.5 mm in thickness, with the finishing
rolling temperature at above 950°C. After the hot rolling process, the sheets were
cold-rolled to a final thickness of 1.2 mm. Images of the microstructure of the
hot-rolled specimens are provided in Fig. 3.2.
Fig. 3. 2 microstructures of hot-rolled alloys
As expected from the equilibrium phase diagrams, coarse δ-ferrite bands are
observed in 3LA, 3HA and 4HA. Ferrite bands are absent in 4LA because of the

37
low stability of δ-ferrite. It is suggested that δ-ferrite transformed entirely into
austenite at the high hot-deformation temperatures, and the formation of
polygonal ferrite occurred instead on cooling following solidification.
3.2 Pre-welding test
3.2.1 Heat treatment cycle
Since the alloys will not be used as-cold-rolled condition, proper heat treatment
needs be planned to optimize mechanical properties before moving on to
weldabilty tests. On designing the heat treatment cycle, two variations,
intercritical annealing temperature and isothermal transformation (austempering,
hereafter) time were set. For intercritical annealing, the temperatures were
changed from 780°C to 840°C with an increment of 20°C. The austemepring
temperature was set to be 400°C, though durations for it varied from 30 s, 60 s,
120 s, 300 s to 600 s. Such variations were made based on previous research on
δ-TRIP steels [5-10]. A brief illustration of heat treatment design is presented in
Fig. 3.3.

38
Fig. 3.3 heat treatment cycles for new alloys
3.2.2 Metallography
Heat treated samples were prepared with conventional method for
metallographical study. Mechanically polished surfaces were etched with 2%
nital etchant, and the microstructures were revealed using optical microscopy
(Eclipse MA200, Nikon) and scanning electron microscopy (FE-SEM, Carl Zeiss
Ultra 55).
3.2.3 Mechanical tests
The mechanical properties of heat treated samples were assessed using a tensile
testing machine (Zwick/Roell Z100). Heat treated samples were machined to the
dimensions for tensile tests according to standard practice [56]. Fig. 3.4 shows
the shape and the dimensions of the tensile test sample used.

39
G=25, W=6.25, T=thickness of material, L=100, A=32, B=32, c=10, R=6(mm)
Fig. 3.4 rectangular tension test specimen [56]
The fraction of retained austenite is affected by heat treatment conditions since
its stability is achieved by carbon enrichment during the bainitic transforming
period. The fraction of retained austenite was measured using X-ray diffraction
(Bruker D8 Advance), and by using scanning electron microscopy with electron
back scattered diffraction.
3.3 Spot welding tests
3.3.1 Welding conditions
For the evaluation of weldability, spot welding of fully heat treated samples was
conducted according to the conventional standard [57, 58]. First, samples were
spot welded with single phase AC spot welder (75 kVA) with maximum electrode
force of 7 kN (pneumatic). Direct current spot welding was also conducted using
inverter DC spot welder (200 kVA) with maximum electrode force of 20 kN
(servo-motor powered). The welding conditions for each process are shown in
Table 3.2. Weld conditions were in fact identical; weld times are differently

40
written because of the difference in units.
Table 3.2 spot welding conditions (upper: single phase AC spot weld, lower:
inverter DC spot weld)
3.3.2 Weld microstructure
Spot welded specimens were sectioned in half and weld microstructures were
revealed using the same method as described earlier in 3.2.2. The formation of δ-
ferrite in the weld zone was studied. The size of each weld nugget was
determined by measuring the nugget diameter (Fig. 3.5). Based on measurements
of nugget size, lobe diagrams for each alloy were acquired.
Force Welding time / cycle, 60 Hz Electrode
4.0 kN
Squeeze Weld Hold Metal Type Tip dia. Coolant
40 17 17 Cu-Cr DR 6.0 mm 41 /min
Force Welding time / ms Electrode
4.0 kN
Squeeze Weld Hold Metal Type Tip dia. Coolant
646 272 272 Cu-Cr DR 6.0 mm 41 /min

41
Fig. 3.5 definition of nugget size [53, 54]
3.3.3 Weld property tests
Weld strength was evaluated by shear tensile strength test, TSS test, and cross
tensile strength test, CTS test. Specimens were heat treated and machined
according to a Japanese industrial standard [53, 54]. The ductility ratio was
determined as CTS/TSS. The hardness distribution around weld nugget was
measured using Vickers hardness tester, Mitutoyo HR-522.

42
4 Pre-welding tests
4.1 Microstructure
Microstructures obtained from annealing and quenching processes are
illustrated in Fig. 4.1. Specimens were intercritically annealed at 840°C for 3 min
before being water quenched to ambient temperature.
Fig. 4.1 microstructures of quenched specimens after 840°C annealing for 3 min
Similar microstructures for hot-rolled conditions in Fig. 3.2 can be observed.
However, the substitution of pearlite due to rapid cooling by martensite is worth
3LA 3HA
4LA 4HA

43
noticing, as shown in Fig. 4.2. Microstructure of Alloy 4LA can be characterized
as rather homogenous, while the other alloys clearly show coarse δ-ferrite bands.
Fig. 4.2 SEM image of quenched 4HA revealing martensite in the matrix
(M : martensite)
To see the effect of annealing temperature, alloys were annealed at different
temperatures, 780°C, 800°C, 820°C and 840°C. Their respective microstructures
are seen in Fig. 4.3. Each specimen was annealed for 3 min with different
M
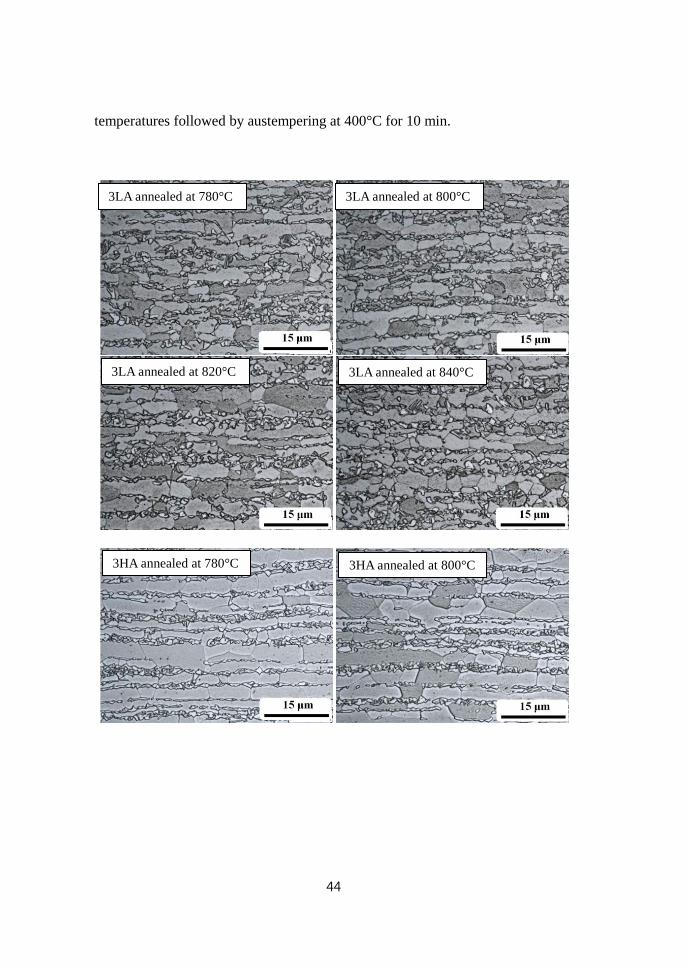
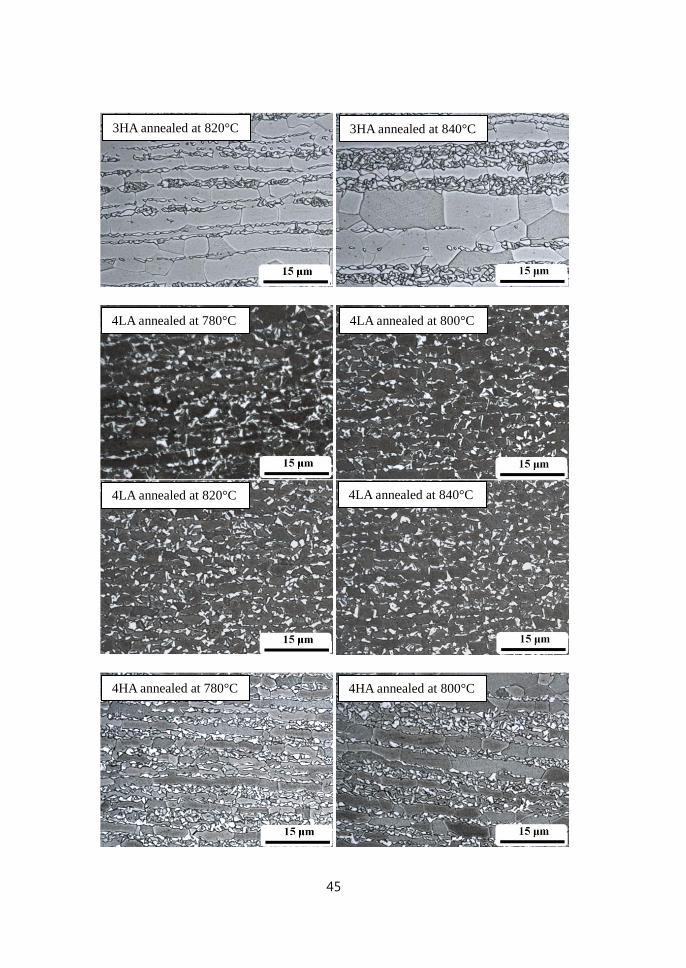
44
temperatures followed by austempering at 400°C for 10 min.
3LA annealed at 780°C 3LA annealed at 800°C
3LA annealed at 820°C 3LA annealed at 840°C
3HA annealed at 780°C 3HA annealed at 800°C
45
3HA annealed at 820°C 3HA annealed at 840°C
4LA annealed at 780°C 4LA annealed at 800°C
4LA annealed at 820°C 4LA annealed at 840°C
4HA annealed at 780°C 4HA annealed at 800°C

46
Fig. 4.3 microstructures after annealing with temperature variation
The annealing temperature, over the range studied, does not seem to have a
significant effect on microstructure. As expected from the equilibrium phase
diagrams, except for 4LA, δ-ferrite bands are retained in the microstructures. In
between the δ-ferrite are fine mixtures of retained austenite and bainite that
formed during austempering.
The formation of austenite was studied using EBSD analysis as shown in Fig.
4.4. Specimens were annealed at 840°C for 3 min and austempered at 400°C for
10 min. In between δ-ferrite bands, some austenite stabilized due to carbon
enrichment has survived after the whole heat treatment. Such retained austenite
contributes to good mechanical properties by transforming into martensite on
loading.
4HA annealed at 820°C 4HA annealed at 840°C

47
3LA
3HA
4LA

48
Fig. 4.4 EBSD images of alloys after annealing and austempering
( white : ferrite, green : austenite )
Heat treatment trials with different isothermal holding times were conducted to
see the effect of austempering duration on microstructural changes. Alloy 3HA
was picked and processed with different annealing and austempering times.
Coarse δ-ferrite bands are observed along with mixtures of retained austenite and
bainite, Fig. 4.5. The grain sizes of retained austenite are roughly 3-4 μm, Fig.
4.6. However, significant changes were not noticed in the microstructures as a
function of austempering time.
4HA

49
Fig. 4.5 microstructure change in the alloys with austempering time variations
(annealed at 840°C for 3 min, austempered at 400°C for different holding times)
Austempering for 30 s Austempering for 60 s
Austempering for 120 s Austempering for 300 s
30 s 60 s

50
Fig. 4.6 EBSD images of alloy 3HA with different austempering time
( white : ferrite, green : austenite )
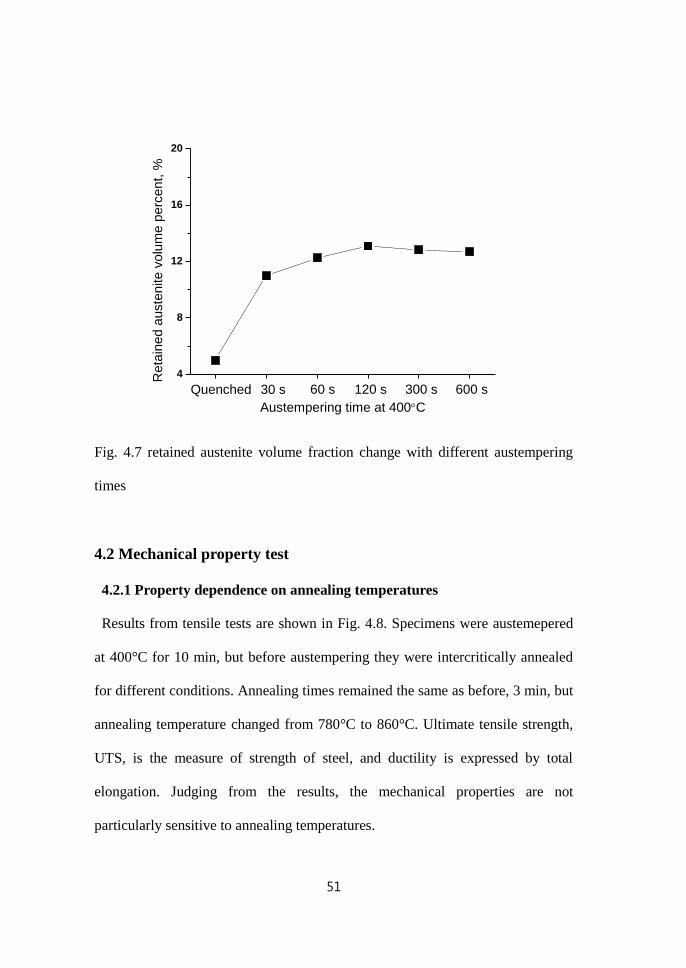
EBSD analysis for each case was done and the results are shown in Fig. 4.6.
The fraction of retained austenite is similar in each case according to the X-ray
diffraction analysis in Fig. 4.7. Around 12% of austenite was retained in the
matrix after any heat treatments except for the quenched ones. Longer holding
does not seem to have an effect once bainitic transformation was allowed for 30 s.
Therefore it can be concluded that most austenite is already stabilized during
bainitic transformation at short time.
120 s 300 s
51
4
8
12
16
20
Quenched 600 s300 s120 s60 s30 s
Re
tain
ed
au
ste
nite
vo
lum
e p
erc
en
t, %
Austempering time at 400C
Fig. 4.7 retained austenite volume fraction change with different austempering
times
4.2 Mechanical property test
4.2.1 Property dependence on annealing temperatures
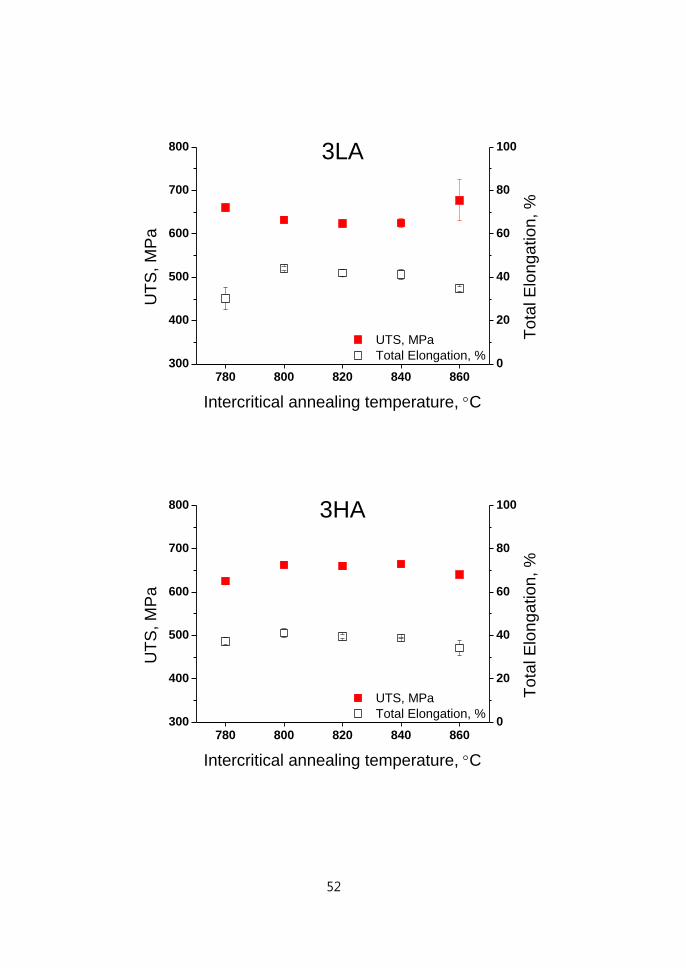
Results from tensile tests are shown in Fig. 4.8. Specimens were austemepered
at 400°C for 10 min, but before austempering they were intercritically annealed
for different conditions. Annealing times remained the same as before, 3 min, but
annealing temperature changed from 780°C to 860°C. Ultimate tensile strength,
UTS, is the measure of strength of steel, and ductility is expressed by total
elongation. Judging from the results, the mechanical properties are not
particularly sensitive to annealing temperatures.
52
780 800 820 840 860300
400
500
600
700
800
Intercritical annealing temperature, C
UT
S, M
Pa
0
20
40
60
80
100
UTS, MPa
Total Elongation, %
To
tal E
lon
ga
tio
n, %
3LA
780 800 820 840 860300
400
500
600
700
800
Intercritical annealing temperature, C
UT
S, M
Pa
0
20
40
60
80
100
UTS, MPa
Total Elongation, %
To
tal E
lon
ga
tio
n, %
3HA

53
780 800 820 840 860300
400
500
600
700
800
Intercritical annealing temperature, C
UT
S, M
Pa
0
20
40
60
80
100
UTS, MPa
Total Elongation, %
To
tal E
lon
ga
tio
n, %
4LA
780 800 820 840 860300
400
500
600
700
800
Intercritical annealing temperature, C
UTS, MPa
Total Elongation, %
UT
S, M
Pa
4HA
0
20
40
60
80
100T
ota
l E
lon
ga
tio
n, %
Fig. 4.8 mechanical properties with different annealing times

54
Table 4.1 mechanical property changes with different annealing times
3LA
Annealing
temperature,
˚C
Yield
strength,
MPa
UTS, MPa
Uniform
elongation,
%
Total
elongation,
%
780 454 660 26 30
800 471 632 33 44
820 472 624 32 42
840 470 625 31 41
860 503 677 26 35
3HA
Annealing
temperature,
˚C
Yield
strength,
MPa
UTS, MPa
Uniform
elongation,
%
Total
elongation,
%
780 451 625 28 37
800 481 663 31 41
820 483 660 30 40
840 486 665 30 39
860 470 640 24 34
4LA
Annealing
temperature,
˚C
Yield
strength,
MPa
UTS, MPa
Uniform
elongation,
%
Total
elongation,
%
780 524 671 34 44
800 525 675 36 49
820 518 668 35 46
840 526 670 34 44
860 515 668 30 43
4HA
Annealing
temperature,
˚C
Yield
strength,
MPa
UTS, MPa
Uniform
elongation,
%
Total
elongation,
%
780 463 624 32 40
800 507 716 34 42
820 512 725 33 39
840 515 728 33 40
860 514 715 22 29

55
4.2.2 Property dependence on austempering times
Unlike annealing temperatures, austempering time has great influence on alloys‟
mechanical properties. Property changes of alloy 3HA with different
austempering times are presented in Fig. 4.9. For the quenched case without any
bainitic transformation period, due to major martensite formation, the steel
exhibited very high strength reaching almost 1 GPa though it was brittle. As
retained austenite fraction increases, meaning longer austempering, ductility went
up at the expense of strength.

56
Fig. 4.9 mechanical properties with different austempering times of 3HA
Table 4. 2 mechanical properties of 3HA with different austempering times
Ultimate tensile strength, MPa
Annealing
temperature,
˚C
Austempering time, s
0 30 60 120 300 600
780 902 740 720 700 690 625
800 949 757 733 712 696 662
820 942 768 752 718 688 660
840 960 782 746 728 689 665
Total Elongation, %
Annealing
temperature,
˚C
Austempering time, s
0 30 60 120 300 600
780 15 30 31 34 35 37
800 12 29 31 34 39 41
820 8 27 31 36 36 40
840 9 25 30 35 36 39

57
Since attention was placed on the fact that rather short austempering time was
already enough to stabilize the austenite, for the sake of high strength, the other
alloys, 3LA, 4LA and 4HA, were all tensile tested again after short austempering,
30 s, and results are compared in Fig. 4.10. As predicted, shorter austempering
gave better strength with a loss of ductility.
400
450
500
550
600
600 s60 s30 sQuenched
Yie
ld S
tre
ng
th,
MP
a
Austempering duration at 400C
3LA
3HA
4LA
4HA
0
10
20
30
40
50
Austempering duration at 400C
Un
ifo
rm E
lon
ga
tio
n,
%
3LA
3HA
4LA
4HA
Quenched 30 s 60 s 600 s

58
500
600
700
800
900
1000
1100
1200
1300
Austempering duration at 400C
UT
S,
MP
a
3LA
3HA
4LA
4HA
Quenched 30 s 60 s 600 s
0
10
20
30
40
50
Austempering duration at 400C
To
tal E
lon
ga
tio
n, %
3LA
3HA
4LA
4HA
Quenched 30 s 60 s 600 s
Fig. 4.10 tensile properties for every alloy annealed at 840°C for 3 min with
different austempering conditions
Especially for 4LA and 4HA, tensile strength of more than 800 MPa could be
achieved with total elongation of 25% for 30 s of austempering. Tensile strength
59
of 300 MPa was reduced after austempering for 30 s compared with the
quenched specimen. However, the rate of strength reduction was not high after 30
s of austempering, and it is because at first 30 s bainitic transformation occurred
rapidly, and after the initial stage transformation rate decreased.
The effect of aluminium on ductility was recognized because 3LA and 4LA
showed superior ductility than 3HA and 4HA. It implies that the aluminium that
is contained in ferrite matrix may have brought about a deterioration of ductility.
60
5 Evaluation of spot weldability
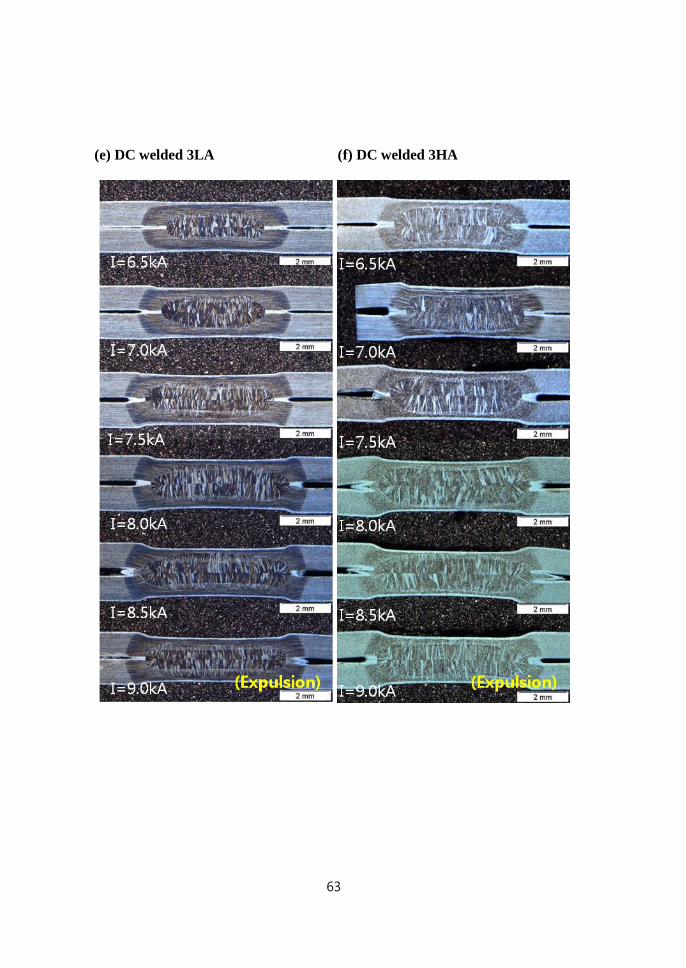
5.1 Weld nugget growth
The weld nugget grows in proportional with welding current in both AC and DC
spot weld, Fig. 5.1. Sample 3LA, having the least alloying element concentration,
showed the widest tolerance for weld condition, without any expulsion observed
during AC spot welding. As the solute concentration increases, the suitable weld
range seems to narrow down because of the early emergence of expulsion. As
discussed earlier, expulsion is a weld defect to be avoided.
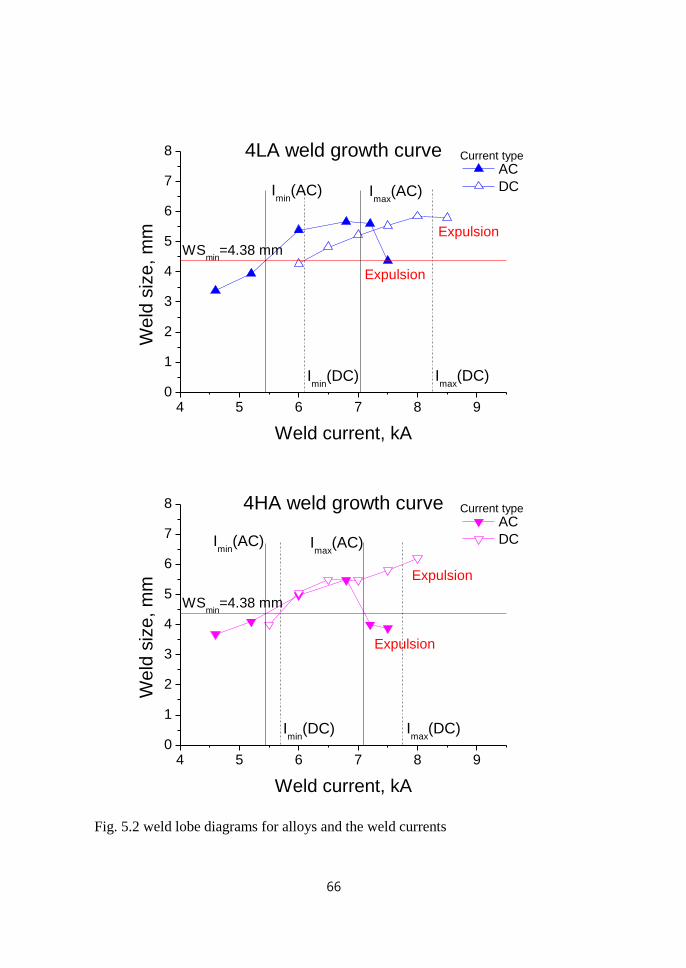
WSmin is the abbreviation for minimum weld nugget size, and in this work a
conventionally recommended criterion for automotive steels [59], 4t0.5
, is used
where t is the metal sheet thickness in mm. Weld nugget should exceed WSmin in
diameter because a small nugget would not be strong enough and is likely to fail
in the interfacial fracture mode [59, 60]
Based on acquired weld nugget images, nugget sizes were measured, and the
weld currents for expulsion identified. With these, weld lobe curve diagrams for
each specimen were drawn as shown in Fig. 5.2, and the effect of two types of
weld current compared.

61
(a) AC welded 3LA (b) AC welded 3HA

62
(c) AC welded 4LA (d) AC welded 4HA
63
(e) DC welded 3LA (f) DC welded 3HA

64
(g) DC welded 4LA (h) DC welded 4HA
Fig. 5.1 weld nugget growth change of each alloy with different weld currents

65
4 5 6 7 8 90
1
2
3
4
5
6
7
8
AC
DC
Expulsion
We
ld s
ize
, m
m
Weld current, kA
WSmin
=4.38 mm
Imin
(AC)
Imax
(DC)
3LA weld growth curve
Imin
(DC)
Current type
4 5 6 7 8 90
1
2
3
4
5
6
7
8 Current type
AC
DC
Expulsion
Expulsion
3HA weld growth curve
We
ld s
ize
, m
m
Weld current, kA
Imin
(AC)
Imax
(DC)
WSmin
=4.38 mm
Imax
(AC)
66
4 5 6 7 8 90
1
2
3
4
5
6
7
8 Current type
AC
DC
Expulsion
Expulsion
We
ld s
ize
, m
m
Weld current, kA
4LA weld growth curve
Imin
(AC) Imax
(AC)
WSmin
=4.38 mm
Imax
(DC)Imin
(DC)
4 5 6 7 8 90
1
2
3
4
5
6
7
8 Current type
AC
DC
Expulsion
Expulsion
4HA weld growth curve
We
ld s
ize
, m
m
Weld current, kA
WSmin
=4.38 mm
Imin
(AC)
Imin
(DC) Imax
(DC)
Imax
(AC)
Fig. 5.2 weld lobe diagrams for alloys and the weld currents
67
In Fig. 5.2, both minimum weld current values Imin(AC) and Imin(DC) were
determined from the value where minimum nugget size is produced, and the
current value of expulsion was used as an indicator for maximum weld current
values, Imax(AC) and Imax(DC). Generally, Imax of steels in this work does not
exceed 9 kA, which is disadvantageous for dissimilar welding because mild
steels, dual phase steels or interstitial free steels that are used in the automotive
industries usually require higher welding currents due to low solute
concentrations. It appears that AC welded samples have narrower weld current
ranges than those using direct current. And, higher currents are generally required
for the DC welding case.
5.2 Weld microstructure
More magnified weld images are provided in Fig. 5.3 and 5.4 for better
observation of general weld microstructure and δ-ferrite formation on the
solidification in welds. Regardless of weld current types and alloys, δ-ferrite
dendrites can be observed in every nugget zone. Even for the case of 4LA,
because of very rapid cooling from spot welding process, clear evidence of
dendritic δ-ferrite formation was preserved in the microstructure even though the
fraction of δ-ferrite was smallest. A point counting method was employed to
estimate the δ-ferrite fraction in weld nuggets (Table 5.1). Since δ-ferrite can be
retained for every case, fully martensitic nuggets were avoided and thus an
improvement of spot weldability is expected.

68
Fig. 5.3 weld microstructure (AC welded)
3LA
3HA
4LA
4HA

69
Fig. 5.4 weld microstructure (DC welded)
3LA
3HA
4LA
4HA
70
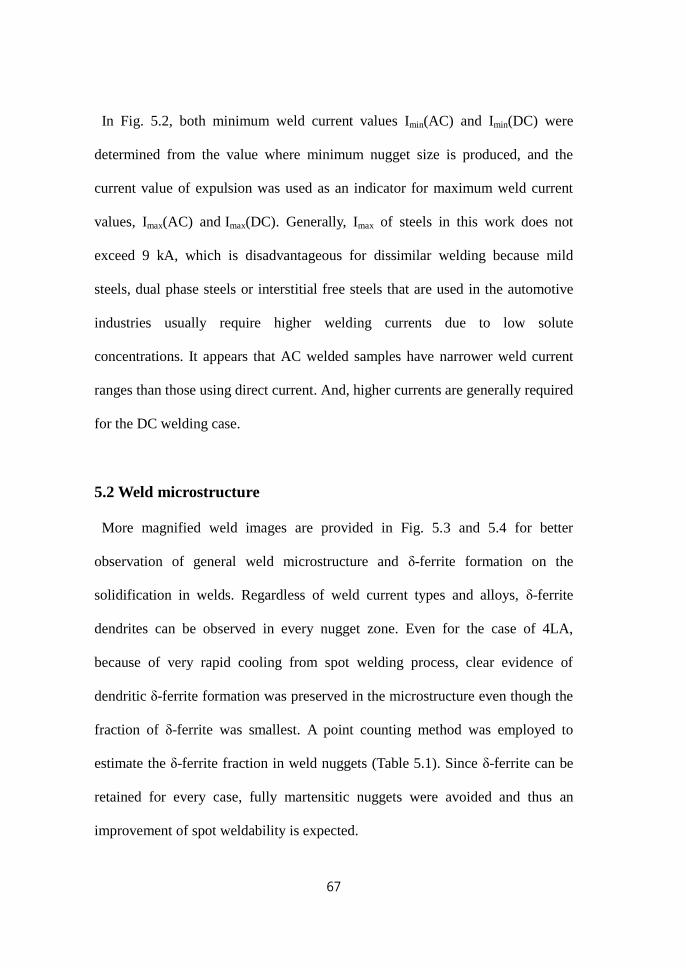
Table 5.1 δ-ferrite volume fraction comparison in weld nuggets
3LA 3HA 4LA 4HA
AC 0.27±0.04 0.46±0.05 0.12±0.11 0.37±0.03
DC 0.28±0.03 0.48±0.08 0.19±0.10 0.26±0.07
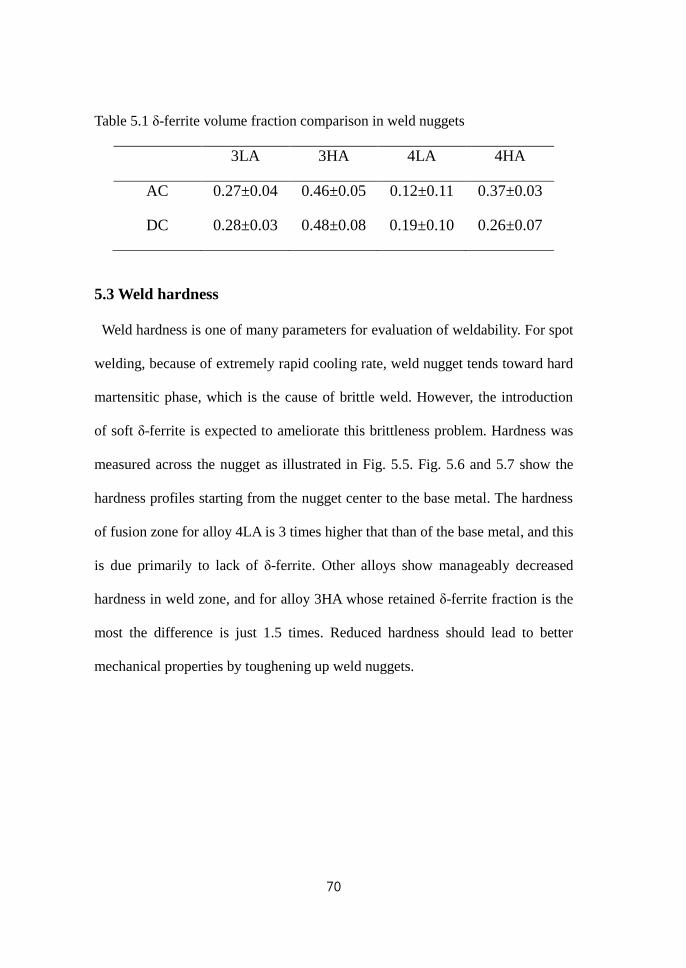
5.3 Weld hardness
Weld hardness is one of many parameters for evaluation of weldability. For spot
welding, because of extremely rapid cooling rate, weld nugget tends toward hard
martensitic phase, which is the cause of brittle weld. However, the introduction
of soft δ-ferrite is expected to ameliorate this brittleness problem. Hardness was
measured across the nugget as illustrated in Fig. 5.5. Fig. 5.6 and 5.7 show the
hardness profiles starting from the nugget center to the base metal. The hardness
of fusion zone for alloy 4LA is 3 times higher that than of the base metal, and this
is due primarily to lack of δ-ferrite. Other alloys show manageably decreased
hardness in weld zone, and for alloy 3HA whose retained δ-ferrite fraction is the
most the difference is just 1.5 times. Reduced hardness should lead to better
mechanical properties by toughening up weld nuggets.
71
Fig. 5.5 hardness measured across weld nugget
Fig. 5.6 hardness profiles for AC weld (dwell time, 10 s)

72
Fig. 5.7 hardness profiles for DC weld (dwell time, 10 s)
5.4 Weld strength
Weld strength was tested by two means according to Japanese standard [53, 54].
Fig 5.10 compares weld strength from AC spot welded specimens, and Fig 5.11
that of DC welded 3LA and 4LA. Overall, the shear strength increases with the
nugget size, although cross tensile strength does not seem to respond to the
nugget size factor. As a result, the ductility ratio (CTS/TSS) suffers for AC
welded specimens. DC welded 3LA and 4LA, nevertheless, shows better ductility
ratio due to increased cross tensile strength.

73

74
Fig. 5.8 weld strength results for AC spot welded alloys
(■: interfacial fracture mode ★: partial plug fracture mode ●: plug fracture
mode)

75
Fig. 5.9 weld strength results for DC spot welded alloys
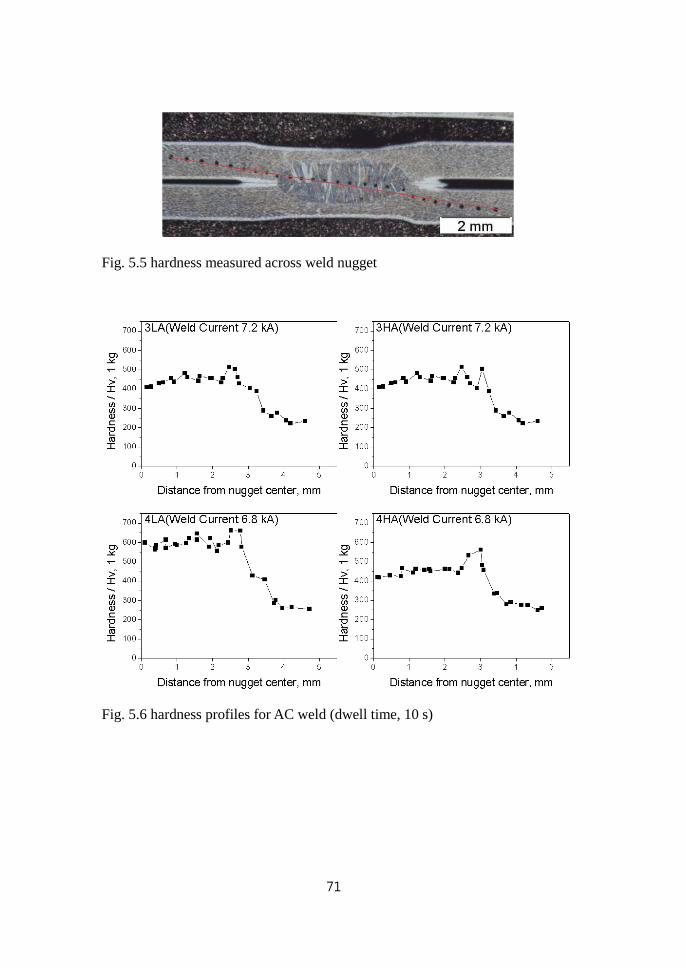
The effect of electrode force on weld strength was tested and the results are
shown in Fig. 5.11. Alloy 3LA was selected and spot welded with DC power
76
system with one variation, electrode force, changing by 0.5 kN. However, there
seemed no remarkable relation between electrode force and weld strength.
77
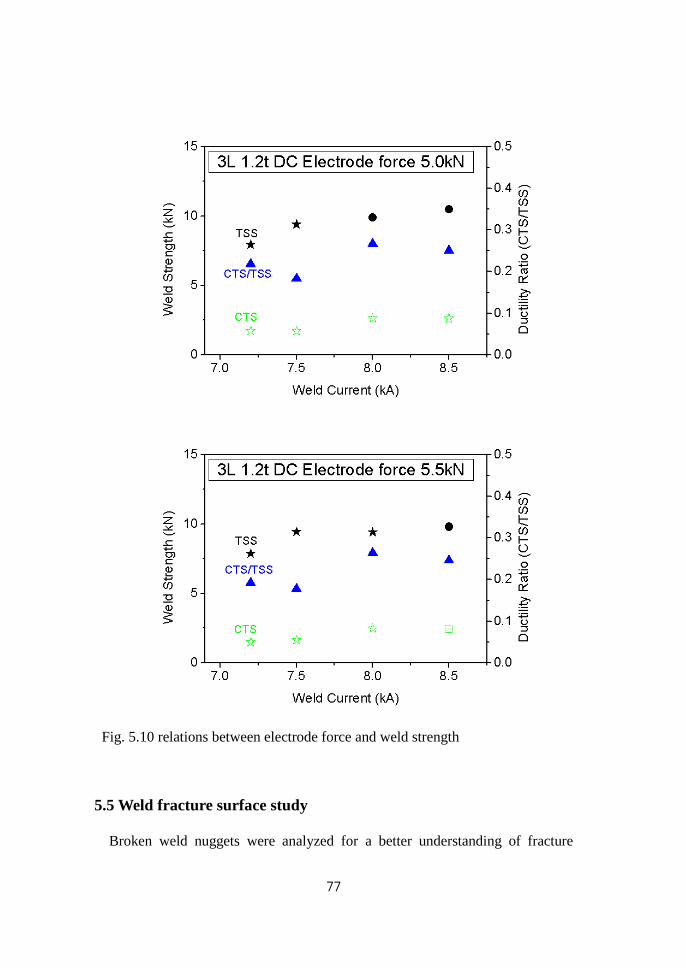
Fig. 5.10 relations between electrode force and weld strength
5.5 Weld fracture surface study
Broken weld nuggets were analyzed for a better understanding of fracture

78
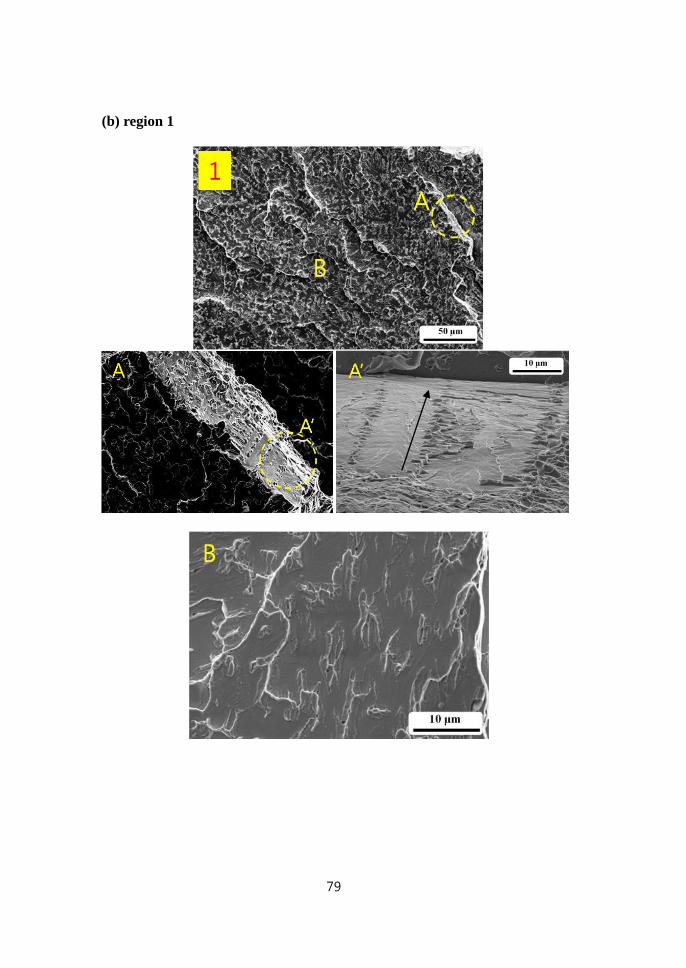
mechanism. Representative weld fracture images of AC spot welded alloy 4HA
are shown in Fig. 5.10. At the center of the weld nugget, A ́in Fig. 5.10 shows
evidence of ductile and cleavage fracture at the same time. Along the arrow,
dimples, which are indicators of ductile fracture, are found, and it seems δ-ferrite
had formed there. In between such dendrites, there is cleavage clearly observed.
Thus, two different fracture modes were simultaneously activated during the
fracture, which means soft δ-ferrite failed in a ductile fracture mode, while
martensite fractured in a brittle manner. Furthermore, around the outermost
region of weld nugget, 2 (Fig. 5.10), there can be observed dendrite-shape
morphology spreading outward. At heat affected zone, a clear image of massive
cleavage region was acquired as shown in „3‟ in Fig. 5.10. Surface fracture
images suggest that hard martensite still causes the problem by breaking in a
brittle fashion.
(a) weld fracture surface image of 4HA
79
(b) region 1

80
(c) region 2 and 3
Fig. 5.11 weld surface fracture images of 4HA

81
5.6 Post weld heat treatment
To deal with the problem of brittleness in the heat affected zone, post weld heat
treatment was introduced after welding. Post welding heat treatment is one of
popular welding techniques and has been used to remove residual strain or
hydrogen trapped in nugget [61]. However, it was not until recently post weld
heat treatment technique was tried for resistance spot welding. DC welded 3LA
and 4LA samples were selected for post weld heat treatment. Conditions for such
heat treatments are shown in Table 5.2. Especially, the second condition was a
simulation of the bake hardening process, which is used in automotive production
during painting. Remarkable effects were observed especially for 4LA showing
ductility ratio reaching 0.4 after post weld heat treatment, which is significant
considering alloy composition of 4LA. Low temperature and short duration of
heat treatment was rather less effective, but it can be confirmed that the
tempering of martensite around weld nugget surely improves weld toughness.
Table 5.2 post weld heat treatment conditions
Current for 3LA Current for 4LA Temperature time
1 8.5 kA 8.0 kA - -
2 8.5 kA 8.0 kA 200°C 30 min
3 8.5 kA 8.0 kA 300°C 1 h
4 8.5 kA 8.0 kA 400°C 1 h

82
Fig. 5.12 weld strength change after post weld heat treatment
83
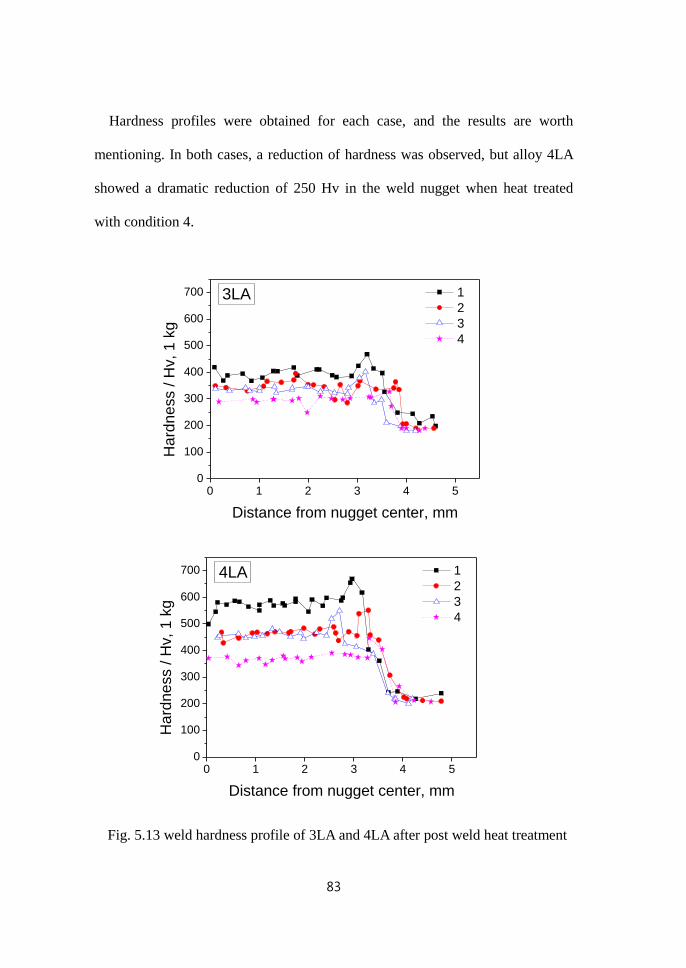
Hardness profiles were obtained for each case, and the results are worth
mentioning. In both cases, a reduction of hardness was observed, but alloy 4LA
showed a dramatic reduction of 250 Hv in the weld nugget when heat treated
with condition 4.
0 1 2 3 4 50
100
200
300
400
500
600
700 3LA
Ha
rdn
ess /
Hv,
1 k
g
Distance from nugget center, mm
1
2
3
4
0 1 2 3 4 50
100
200
300
400
500
600
700 4LA
Ha
rdn
ess /
Hv,
1 k
g
Distance from nugget center, mm
1
2
3
4
Fig. 5.13 weld hardness profile of 3LA and 4LA after post weld heat treatment

84
5.7 Weld strength summary
Comparisons for weld strength and ductility ratio are made against commercial
steels and previously characterised δ-TRIP steels, Table 5.3. Steels used in this
work exceed former δ-TRIP steels in CTS value and ductility ratio even though
TSS value seems to be inferior. Compared with current commercial TRIP steels,
the performance of steels used for this work is impressive considering the higher
carbon concentrations.
Table 5.3 comparison of weld strength and ductility ratio with commercial steels
[9, 62]
Carbon
wt%
Minimum
weld
current, kA
Maximum
weld
current, kA
Current
range,
kA
TSS,
kN
CTS,
kN
Ductility
ratio
590DP 0.095 5.0 7.0 2.0 12.2 6.9 0.57
780DP 0.070 4.8 7.6 2.8 15.9 9.4 0.59
780TR 0.155 4.6 7.0 2.4 15.7 5.3 0.34
Alloy8 0.43 - - - 16.5 2.0 0.12
Alloy9 0.39 - - - 12.5 2.7 0.22
3LAC 0.3 6.2 7.5 1.3 10.9 3.6 0.33
3LDC 0.3 7.0 8.5 1.5 10.1 4.0 0.39
4LAC 0.4 5.5 7.1 1.6 11.6 2.3 0.21
4LDC 0.4 6.2 8.0 1.8 10.3 2.6 0.25

85
6 Conclusions
The aim of the work was to study the weldability of high strength TRIP steel
which, because of the high aluminium concentration, contains δ-ferrite at all
temperatures. The possibility for better weldability came originally from this very
idea of retaining δ-ferrite in weld nugget which prevents the formation of a fully
martensitic weld nugget, thus making the weld nugget better resistant to cold
cracking problems.
Prior to the work on welding, the newly designed alloys showed acceptable
mechanical properties exhibiting tensile strength of 800 MPa with total
elongation of 25%, and further ductility could be acquired at the expense of
strength.
For evaluation of spot weldability, two types of resistance spot welding using
AC or DC were conducted on alloy samples. In every case, retention of δ-ferrite
was possible in the weld nugget, even for alloy 4LA in which δ-ferrite was
predicted to completely decompose according to the equilibrium phase diagrams.
Based on weld microstructure, suitable welding current ranges were determined
for each specimen. Due to the rather high alloy concentration, current levels that
are required for welding were in between 5 and 7 kA, which were low and might
present difficulties when welded to dissimilar low alloyed steels.
Weld hardness in weld nugget area was effectively reduced to as low as 1.5
times that of the base metal, which accounts for the presence of soft δ-ferrite.
Weld strength and toughness expressed by the ductility ratio were also measured.

86
Tensile shear strength increased with weld nugget size, while cross tensile
strength stayed almost the same regardless of weld nugget size changes.
Generally, for DC spot welds, the ductility ratio was higher, thanks to better cross
tensile strength, although shear tensile strength was not very much different.
From the fracture surface study of broken weld samples, it was determined that
martensite, even in the presence of soft δ-ferrite, still showed brittle behavior. As
a cure for the matter, post-weld heat treatment on resistance spot welding was
suggested, and the ductility ratio as high as 0.45 was achieved through
appropriate heat treatment. Although a satisfying level of ductility ratio was
achieved, heat treatment, practically tempering, by furnace is deemed counter-
productive because of the need for another process after welding. Nonetheless,
the significance of welding with heat treatment lies with the conclusion that hard
phase martensite was in principle the reason for low cross tensile strength values.
Overall, it is concluded spot weldabilty of TRIP steels can be improved by
retaining δ-ferrite in the nugget area because it gives better ductility to the weld.
Better weld quality can clearly be achieved with help of heat treatment after
welding process even though productivity may be compromised.

87
References
1. C. Y. Kang, H. J. Kim, C. G. Kim, B. W. Lee, M. Y. Lee, G. H. Lee and T.
L. Kim: „Tensile properties and spot weldability of trip high strength
steel sheet‟, Journal of Korean Society for Heat Treatment, 1998, 11,
295-304.
2. H. K. D. H. Bhadeshia, R. W. K. Honeycombe: „Steels: microstructure
and properties‟, 209-233, 2006, Oxford, UK, Elsevier Ltd.
3. B. C. de Cooman, J. G. Speer, I. Y. Pyshmintsev and N. Yoshinaga:
„Materials design - the key to modern steel products‟, 396-404, 2007,
GRIPS media.
4. S. Yoshitsugu, Y. Takako, S. Yoshiharu, F. Sakae and Y. Shu:
„Thermodynamic analysis of selective oxidation behavior of Si and Mn-
added steel during recrystallization annealing‟, ISIJ International, 2009,
49, 564-573.
5. S. Chatterjee: „Transformation in TRIP-assisted steels: microstructure
and properties‟, 95-121, Ph.D. Thesis, 2006, University of Cambridge.
6. S. Chatterjee, M. Murugananth and H. K. D. H. Bhadeshia: „δ TRIP
steel‟, Materials Science and Technology, 2007, 23, 819-827.
7. H. L. Yi, K. Y. Lee and H. K. D. H. Bhadeshia: „Stabilisation of ferrite in
hot-rolled δ-TRIP Steel‟, Materials Sciences and Technology, 2011, 27,
525-529.
8. H. L. Yi, K. Y. Lee and H. K. D. H. Bhadeshia: „Extraordinary ductility
in Al bearing δ-TRIP Steel‟, Proceedings of the Royal Society A, 2010,
467A, 234-243.
9. H. L. Yi, K. Y. Lee, J. H. Lim and H. K. D. H. Bhadeshia: „Spot
weldability of δ-TRIP Steel containing 0.4 wt-%C‟, Science and
Techonology of Welding & Joining, 2010, 15, 619-624.
88
10. H. L. Yi, S. K. Ghosh, W. J. Liu, K. Y. Lee and H. K. D. H. Bhadeshia:
„Nonequilibrium soldification and ferrite in δ-TRIP Steel‟, Materials
Science and Technology, 2010, 26, 817-823..
11. „Handbook for resistance spot welding‟, 2005, Miller Electric
Manufacturing Co., Appleton, WI.
12. D.J. Radakovic and M. Tumuluru: „Predicting resistance spot weld
failure modes in shear tension tests of advanced high-strength
automotive steels‟, Welding Journal, 2008, 87, 96-s-105-s.
13. H. Oikawa, G. Murayama, T. Sakiyama, Y. Takahashi and T. Ishikawa:
„Resistance spot weldability of high strength steel (HSS) sheets for
automobiles‟, Nippon Steel Technical Report, 2007, 95, 39-45.
14. T. Saito: „Resistance Spot welding of high strength Steel‟, Welding
Technology, 1982. 3(34).
15. S. Brauser, L. A. Pepke, G. Weber and M. Rethmeier: „Deformation
behaviour of spot-welded high strength steels for automotive
applications‟, Materials Science and Engineering, 2010, 527, 7099-7108.
16. „Advanced high-strength steel applications guidelines‟, Auto/Steel
Partnership, Southfield, MI, 2008,.
17. S. Thibaud, N. Boudeau and J.C. Gelin: „TRIP steel: Plastic behaviour
modelling and influence on functional behaviour‟, Journal of Materials
Processing Technology, 2006, 177, 433-438.
18. B. C. de Cooman: „Structure-Properties Relationship in TRIP Steels
Containing Carbide-free Bainite‟, Current Opinion in Solid State and
Materials Science, 2004, 8, 285-303.
19. O. Matsumura, Y. Sakuma and H. Takechi: „Enhancement of Elongation
by Retained Austenite in Intercritical Annealed 0.4C-1.5Si-0.8Mn Steel‟,
Transactions of the Iron and Steel Institute of Japan, 1987, 27, 570-579.
20. P. J. Jacques, E. Girault, A. Mertens, B. Verlinde, J. V. Humbeeck and F.
Delannay: „The Developments of Cold-rolled TRIP-assisted Multiphase
89
Steels. Al-alloyed TRIP-assisted Multiphase Steels‟, ISIJ International,
2001, 41, 1068-1074.
21. H. K. D. H. Bhadeshia: „Bainite in Steels‟, 129-161, 2001, Cambridge,
UK, The University Press.
22. P. J. Jacques: „Transformation-induced plasticity for high strength
formable steels‟, Current Opinion in Solid State and Materials Science,
2004, 8, 259-265.
23. J. Mahieu, B. C. de Cooman and S. Claessens: „Galvanizability of high-
strength steels for automotive applications‟, Metallurgical and Materials
Transactions A, 2001, 32, 2905-2908.
24. P. Drillet, Z. Zermout, D. Bouleau, J. Mataigne and S. Claessens:
„Selective Oxidation of high Si, Mn and Al steel grade during
Recrystallization Annealing, and steel/Zn reactivity‟, Galvatech ´04: 6th
International Conference on Zinc and Zinc Alloy Coated Steel Sheet-
Conference Proceedings, 2004, 1123-1134.
25. B. Mintz: „Hot dip galvanising of transformation induced plasticity and
other intercritically annealed steels‟, International Materials Reviews,
2001, 46, 169-197.
26. T. Maki and T. Furuhara: „Microstructure and mechanical property of
ultra-fine (ferrite+cementite) duplex structure in high carbon steel‟,
Materials Science Forum, 2003, 426-432, 19-26.
27. M. F. Gallagher, J. G. Speer and D. K. Matlock: „Effect of annealing
temperature on austenite decomposition in a Si-alloyed trip steel‟,
Materials Science and Technology 2003 Meeting, 2003, 563-576.
28. M. de Meyer, D. Vanderschueren and B.C. de Coomaim: „The influence
of the substitution of Si by AI on the properties of cold rolled C-Mn-Si
TRIP steels‟, ISIJ International, 1999, 39, 813-822.
29. E. Girault, A. Mertens, P. J. Jacques, Y. Houbaert, B. Verlinde and J. V.
Humbeeck: „Comparison of the effects of silicon and aluminium on the

90
tensile behaviour of multiphase TRIP-assisted steels‟, Scripta Materialia,
2001, 44, 885-892.
30. D. W. Suh, S. J. Park, C. S. Oh and S. J. Kim: „Influence of partial
replacement of Si by Al on the change of phase fraction during heat
treatment of TRIP steels‟, Scripta Materialia, 2007, 57, 1097-1100.
31. H. H. Do, K. M. Cho, C. S. Oh, D. W. Suh and S. J. Kim: „Effects of C
Contents on the Microstructures and Mechanical Properties of
CMnSiAlCu TRIP-Aided Cold-Rolled Steel Sheets‟, Journal of the
Korean Institute of Metals and Materials, 2006, 44, 99-107.
32. M. Zhang, L. Li, R. Y. Fu, D. Krizan and B. C. de Cooman: „Continuous
cooling transformation diagrams and properties of micro-alloyed TRIP
steels‟, Materials Science and Engineering: A, 2006, 438-440, 296-299.
33. R. Kuziak, R. Kawalla and S. Waengler: „Advanced high strength steels
for automotive industry: A review‟, Archives of Civil and Mechanical
Engineering, 2008, 8, 103-117.
34. D. J. C. MacKay: „Bayesian Interpolation‟, Neural Computation, 1992, 4,
415-447.
35. H. K. D. H. Bhadeshia: „Neural networks in materials science‟, ISIJ
International, 1999, 39, 966-979.
36. „Epogy 2003‟, software, 2003, Synaps Incorporation, Atlanta, GA.
37. M. Hamedi and H. Pashazadeh: „Numerical Study of Nugget Formation
in Resistance Spot Welding‟, International Journal of Mechanics, 2008, 2,
11-15.
38. X. Sun, E.V. Stephens and M. A. Khaleel: „Effects of fusion zone size
and failure mode on peak load and energy absorption of advanced high
strength steel spot welds under lap shear loading conditions‟,
Engineering Failure Analysis, 2008. 15, 356-367.
39. M. Marya, and X. Q. Gayden: „Development of requirements for
resistance spot welding Dual-Phase (DP600) steels part 1 - The causes of
91
interfacial fracture‟, Welding Journal, 2005. 84, 172-s-182-s.
40. M. Marya and X. Q. Gayden: „Development of requirements for
resistance spot welding dual-phase (DP600) steels part 2: Statistical
analyses and process maps‟, Welding Journal, 2005, 84, 197-s-204-s.
41. B. M. Brown: „Comparison of AC and DC rsesistance welding of
automotive steels‟, Welding Journal, 1987, 66, 18-23.
42. W. Li, D. Cerjanec and G.A. Grzadzinski: „A comparative study of
single-phase AC and multiphase DC resistance spot welding. Journal of
Manufacturing Science and Engineering‟, Transactions of the ASME,
2005, 127, 583-589.
43. K. Hofman, M. Soter, C. orsette, S. Villai and M. Prokator: „AC or DC
for resistance welding dual-phase 600?‟, Welding Journal, 2005, 84, 46-
48.
44. H. Zhang and J. Senkara: „Resistance welding : fundementals and
applications‟, 229-337, 2006, Boca Raton, FL, CRC Press.
45. M. I. Khan, M. L. Kuntz, E. Biro and Y. Zhou: „Microstructure and
mechanical properties of resistance spot welded advanced high strength
steels‟, Materials Transactions, 2008, 49, 1629-1637.
46. J. Zhang and P. Dong: „A hybrid polygonal element method for fracture
mechanics analysis of resistance spot welds containing porosity‟,
Engineering Fracture Mechanics, 1998, 59, 815-825.
47. H. Zhang, J. Senkara and X. Wu: „Suppressing cracking in resistance
welding AA5754 by mechanical means. Journal of Manufacturing
Science and Engineering‟, Transactions of the ASME, 2002, 124, 79-85.
48. J. E. Gould and M. Kimchi: „Challenges in Welding New Sheet Steel
Products‟, 33rd Mechanical Working and Steel Process Conference
Proceedings, 1991. XXIX.
49. J. E. Gould, S. P. Khurana and T. Li: „Predictions of microstructures
when welding automotive advanced high-strength steels‟, Welding
92
Journal, 2006, 85, 111-s-116-s.
50. M. Pouranvari: „Effect of Welding parameters on the peak load and
lnergy absorption of low-carbon steel resistance spot welds‟, ISRN
Mechanical Engineering, 2011, 1-7.
51. „Specification for metal-arc welding of carbon and carbon manganese
steels, BS5135, British Standard Institue, 1974.
52. Y. Ito and K. Bessyo: „Cracking parameter of high strength steels related
to heat-affected zone cracking‟, Journal of Japan Welding Society, 1968,
37, 683-991.
53. „Specimens dimensions and procedure for shear testing resistance spot
and embossed projection welded joint‟, JIS Z 3136, Japaneses Standards
Association, Tokyo, Japan, 1999.
54. „Specimens dimensions and procedure for cross testing resistance spot
and embossed projection welded joints‟, JIS Z 3137, Japaneses Standards
Association, Tokyo, Japan, 1999.
55. T. Sekita, S. Kaneto, S. Hasuno, A. Sato, T. Ogawa and K. Ogura:
„Materials and technologies for automotive use‟, JFE Technical Report,
2004, 1-18.
56. International, A., ASTM A370-03a, in Standard test methods and
definitions for mechanical testing of steel products.
57. „Resistance welding – weldability. Part 1: assessment of weldability for
resistance spot, seam and projection welding of metallic materials‟, ISO
18278-1:2004, ISO, Geneva, Switzerland, 2004.
58. „Resistance welding – weldability. Part 2: alternative procedure for the
assessment of sheet steels for spot welding‟, ISO 18278-2:2004E, ISO,
Geneva, Switzerland, 2004.
59. Y. J. Chao: „Failure mode of spot welds: Interfacial versus pullout‟,
Science and Technology of Welding and Joining, 2003, 8, 133-137.
60. Y. J. Chao: „Ultimate strength and failure mechanism of resistance spot

93
weld subjected to tensile, shear, or combined tensile/shear loads‟, Journal
of Engineering Materials and Technology, Transactions of the ASME,
2003, 125, 125-132.
61. S. Kou: „Welding metallurgy‟, 75-82, 2002, Hoboken, NJ, John Wiley &
Sons Inc..
62. „Automotive steel data book‟, POSCO Automobile Steel Application
Center, POSCO, Pohang, Korea, 2009.

94
Acknowledgement
I wish to sincerely thank my academic supervisors, Professor Harry Bhadeshia
and Professor Dong Woo Suh for their time, guidance and support in the
completion of this work. Had it not been for their greatness in the field of
material science, I would have not finished this thesis. I am also very much
grateful to Professor Jong Bong Lee for his deep knowledge in welding which
helped me venture through my research journey. Some of people from POSCO
must be recognized as contributors to my thesis. I, especially, would like to thank
Principal researcher Kyoo-young Lee and Jr. researcher Sang-Man Yun from
Technical Research Labs, POSCO for their support and commitment.
Much appreciation goes to all the members of my group, computational
metallurgy group in GIFT, POSTECH, for their help and friendships. Also, I
would like to acknowledge some of people from other groups in GIFT who
became my best friends and gave me constant mental support. And, all the
members from PT group in Cambridge University shall be remembered for their
hospitality during my stay in the Great Britain.
Finally, I want to thank my family and friends for always standing by me and
believing in me.

95
Curriculum Vitae
Name: Jung, geunsu
E-mail: [email protected]
Date of birth: 13th July, 1984
Place of birth: Ulsan, South Korea
Education
M. S. 2012, POSTECH (Pohang, Korea), Graduate Institute of Ferrous
Technology, Computational Metallurgy Group
B. S. 2010, Changwon National University (Changwon, Korea), Department of
Metallurgy and Materials Science Engineering