Embed Size (px)
DESCRIPTION
Innocenti Report Card 13, Spravodlivosť pre deti: Správa o nerovnosti detí v bohatých krajinách, zoraďuje 41 štátov EÚ a OECD podľa toho, ako veľmi zaostávajú deti na konci distribúcie príjmov za ich rovesníkmi nachádzajúcimi sa v strede. Správa sa zameriava na najspodnejšiu hranicu nerovnosti v príjmoch, úspechoch vo vzdelávaní, subjektívnom pociťovaní zdravia a životnej spokojnosti. Slovensko sa umiestnilo v spodnej časti rebríčka nerovnosti v štyroch oblastiach.
Citation preview
UNICEF Innocenti Report Card 13Children in the Developed World
Fairness for Children A league table of inequality in child well-being in rich countries
Innocenti Report Card 13 was written by John Hudson and Stefan Kühner.
The UNICEF Office of Research – Innocenti would like to acknowledge the generous support for Innocenti Report Card 13 provided by the Government of Italy.
Any part of this Innocenti Report Card may be freely reproduced using the following reference:
UNICEF Office of Research (2016). ‘Fairness for Children: A league table of inequality in child well-being in rich countries’, Innocenti Report Card 13, UNICEF Office of Research – Innocenti, Florence.
The Innocenti Report Card series is designed to monitor and compare the performance of economically advanced countries in securing the rights of their children.
In 1988 the United Nations Children’s Fund (UNICEF) established a research centre to support its advocacy for children worldwide and to identify and research current and future areas of UNICEF’s work. The prime objectives of the Office of Research – Innocenti are to improve international understanding of issues relating to children’s rights, to help facilitate full implementation of the Convention on the Rights of the Child, supporting advocacy worldwide. The Office aims to set out a comprehensive framework for research and knowledge within the organization, in support of its global programmes and policies. Through strengthening research partnerships with leading academic institutions and development networks in both the North and the South, the Office seeks to leverage additional resources and influence in support of efforts towards policy reform in favour of children.
Publications produced by the Office are contributions to a global debate on children and child rights issues and include a wide range of opinions. For that reason, some publications may not necessarily reflect UNICEF policies or approaches on some topics. The views expressed are those of the authors and/or editors and are published in order to stimulate further dialogue on issues affecting children.
Cover photo © Blend Images / Alamy Stock Photo
©United Nations Children’s Fund (UNICEF), April 2016
ISBN: 978 88 6522 045 0
eISBN: 978-92-1-057893-6
UNICEF Office of Research – Innocenti Piazza SS. Annunziata, 12 50122 Florence, Italy
Tel: +39 055 2033 0 Fax: +39 055 2033 220
www.unicef-irc.org
Fairness for Children A league table of inequality in child well-being in rich countries
Innocenti Report Card 13Children in the Developed World

INTRODUCTIONSECTION 1
This Report Card presents an overview of inequalities in child well-being in 41 countries of the European Union (EU) and the Organisation for Economic Co-operation and Development (OECD). It focuses on ‘bottom-end inequality’ – the gap between children at the bottom and those in the middle – and addresses the question ‘how far behind are children being allowed to fall?’ in income, education, health and life satisfaction.
Why inequality?
With the gap between rich and poor at its highest level for some three decades in most OECD countries, there is now a renewed focus on questions surrounding inequality.
While much political debate has centred on the growing income of the top 1 per cent, in many rich countries incomes below the median have grown less quickly than have those above the median.1
Across the OECD, the risks of poverty have been shifting from the elderly towards youth since the 1980s. These developments accentuate the need to monitor the well-being of the most disadvantaged children, but income inequality also has far-reaching consequences for society, harming educational attainment, key health outcomes and even economic growth.2
A concern with fairness and social justice requires us to consider whether some members of society are being left so far behind that it unfairly affects their lives both now and in the future.This Report Card asks the same underlying question as Report Card 9,3 which focused on inequality in child well-being, but uses the most recent data available and includes more countries.
Inequality, fairness and children
Questions of fairness and social justice have a special resonance when inequalities among children,
rather than adults, are the focus of attention.
Social inequalities among adults may be justifiable if they have arisen through fair competition and under conditions of equality of opportunity. But when it comes to children, the social and economic circumstances they face are beyond their control, and so differences in merit cannot reasonably be advanced as justification for inequalities among them.
In addition, few dispute that childhood experiences have a profound effect not only on children’s current lives, but also on their future opportunities and prospects. Likewise, social and economic disadvantages in early life increase the risk of having lower earnings, lower standards of health and lower skills in adulthood. This in turn can perpetuate disadvantage across generations.4 None of this is the fault of the child.
“In all actions concerning children, whether undertaken by public or private social welfare institutions, courts of law, administrative authorities or legislative bodies, the best interests of the child shall be a primary consideration.”
– United Nations Convention on the Rights of the Child, 1989 (article 3)
S E C T I O N 1 I N T R O D U C T I O N
2 I N N O C E N T I R E P O R T C A R D 1 3
Box 1 Social justice and fairness
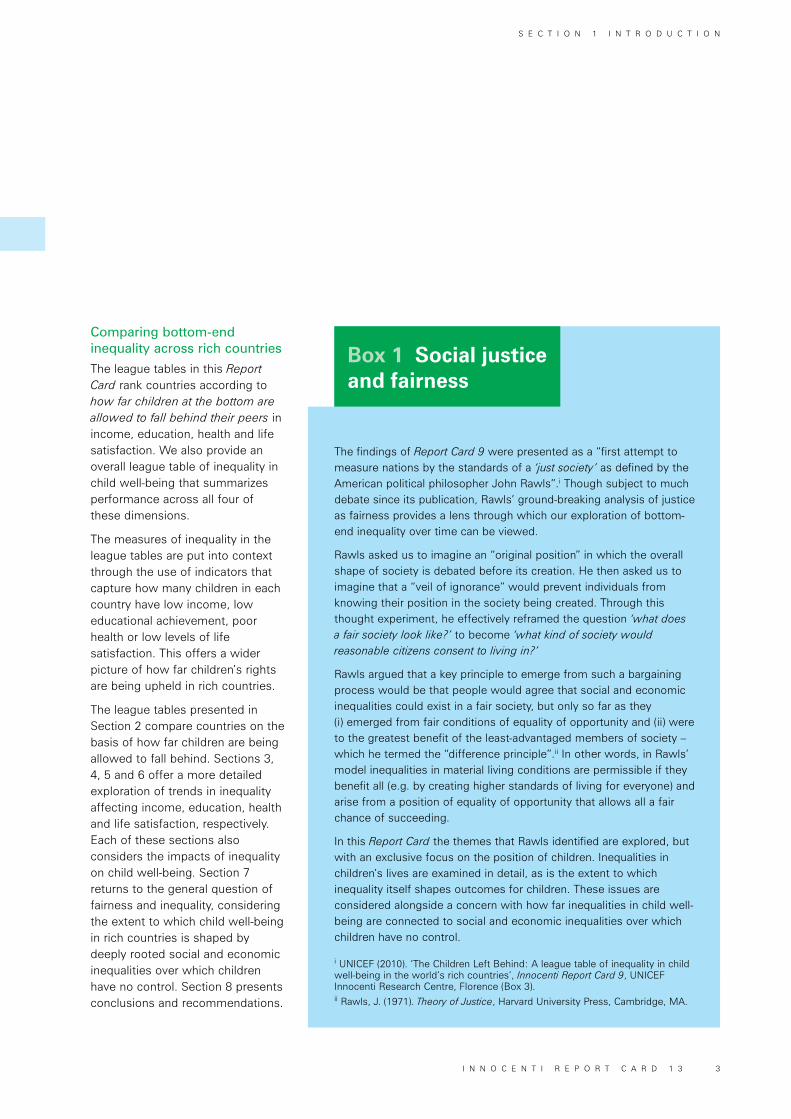
Comparing bottom-end inequality across rich countries
The league tables in this Report Card rank countries according to how far children at the bottom are allowed to fall behind their peers in income, education, health and life satisfaction. We also provide an overall league table of inequality in child well-being that summarizes performance across all four of these dimensions.
The measures of inequality in the league tables are put into context through the use of indicators that capture how many children in each country have low income, low educational achievement, poor health or low levels of life satisfaction. This offers a wider picture of how far children’s rights are being upheld in rich countries.
The league tables presented in Section 2 compare countries on the basis of how far children are being allowed to fall behind. Sections 3, 4, 5 and 6 offer a more detailed exploration of trends in inequality affecting income, education, health and life satisfaction, respectively. Each of these sections also considers the impacts of inequality on child well-being. Section 7 returns to the general question of fairness and inequality, considering the extent to which child well-being in rich countries is shaped by deeply rooted social and economic inequalities over which children have no control. Section 8 presents conclusions and recommendations.
INTRODUCTION
The findings of Report Card 9 were presented as a “first attempt to measure nations by the standards of a ‘just society’ as defined by the American political philosopher John Rawls”.i Though subject to much debate since its publication, Rawls’ ground-breaking analysis of justice as fairness provides a lens through which our exploration of bottom-end inequality over time can be viewed.
Rawls asked us to imagine an “original position” in which the overall shape of society is debated before its creation. He then asked us to imagine that a “veil of ignorance” would prevent individuals from knowing their position in the society being created. Through this thought experiment, he effectively reframed the question ‘what does a fair society look like?’ to become ‘what kind of society would reasonable citizens consent to living in?’
Rawls argued that a key principle to emerge from such a bargaining process would be that people would agree that social and economic inequalities could exist in a fair society, but only so far as they (i) emerged from fair conditions of equality of opportunity and (ii) were to the greatest benefit of the least-advantaged members of society – which he termed the “difference principle”.ii In other words, in Rawls’ model inequalities in material living conditions are permissible if they benefit all (e.g. by creating higher standards of living for everyone) and arise from a position of equality of opportunity that allows all a fair chance of succeeding.
In this Report Card the themes that Rawls identified are explored, but with an exclusive focus on the position of children. Inequalities in children’s lives are examined in detail, as is the extent to which inequality itself shapes outcomes for children. These issues are considered alongside a concern with how far inequalities in child well-being are connected to social and economic inequalities over which children have no control.
i UNICEF (2010). ‘The Children Left Behind: A league table of inequality in child well-being in the world’s rich countries’, Innocenti Report Card 9, UNICEF Innocenti Research Centre, Florence (Box 3).ii Rawls, J. (1971). Theory of Justice, Harvard University Press, Cambridge, MA.
S E C T I O N 1 I N T R O D U C T I O N
I N N O C E N T I R E P O R T C A R D 1 3 3
Rank Country Relative income gap Child poverty rate (50% of the median)
1 Norway 37.00 4.5
2 Iceland 37.76 6.4
3 Finland 38.34 3.7
4 Denmark 39.54 4.8
5 Czech Republic 39.62 6.3
6 Switzerland 39.64 7
7 United Kingdom 39.94 9.3
8 Netherlands 40.64 5.7
9 Luxembourg 41.21 13
10 Ireland 41.49 6.9
11 Austria 41.87 9.6
12 Germany 43.11 7.2
13 France 43.95 9
14 Australia 44.75 9.3
15 Republic of Korea 45.74 8
16 Sweden 46.23 9.1
17 New Zealand 46.52 11
18 Cyprus 47.19 9.1
19 Slovenia 47.29 8.3
20 Malta 48.21 14.5
21 Hungary 48.34 15
22 Belgium 48.41 10.1
23 Poland 51.76 14.5
24 Canada 53.19 16.9
25 Slovakia 54.21 13.7
26 Croatia 54.59 14.8
27 Lithuania 54.81 17.8
28 Estonia 55.55 12.4
29 Turkey 57.07 22.8
30 United States 58.85 20
31 Chile 59.03 26.3
32 Latvia 59.66 16.3
33 Portugal 60.17 17.4
34 Japan 60.21 15.8
35 Italy 60.64 17.7
36 Spain 62.62 20.2
37 Israel 64.58 27.5
38 Greece 64.69 22.3
39 Mexico 65.00 24.6
40 Bulgaria 67.01 23.1
41 Romania 67.08 24.3
LEAGUE TABLESSECTION 2
See data sources and notes on page 44.
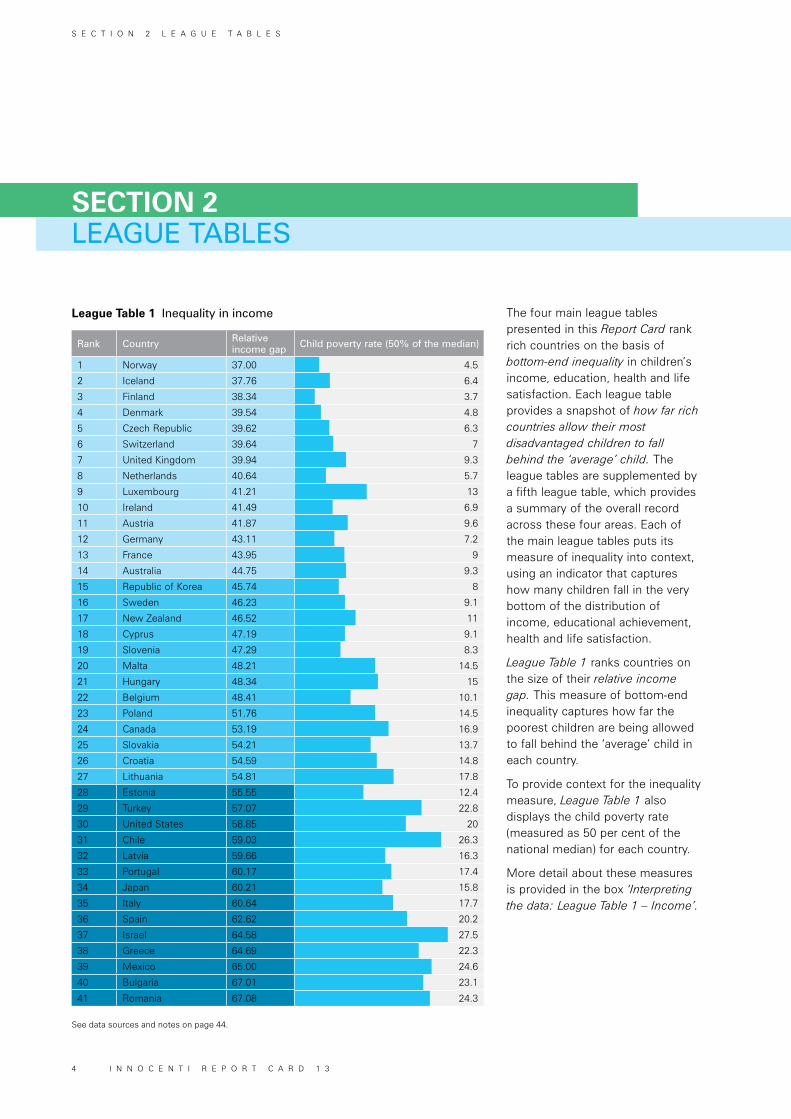
League Table 1 Inequality in income The four main league tables presented in this Report Card rank rich countries on the basis of bottom-end inequality in children’s income, education, health and life satisfaction. Each league table provides a snapshot of how far rich countries allow their most disadvantaged children to fall behind the ‘average’ child. The league tables are supplemented by a fifth league table, which provides a summary of the overall record across these four areas. Each of the main league tables puts its measure of inequality into context, using an indicator that captures how many children fall in the very bottom of the distribution of income, educational achievement, health and life satisfaction.
League Table 1 ranks countries on the size of their relative income gap. This measure of bottom-end inequality captures how far the poorest children are being allowed to fall behind the ‘average’ child in each country.
To provide context for the inequality measure, League Table 1 also displays the child poverty rate (measured as 50 per cent of the national median) for each country.
More detail about these measures is provided in the box ‘Interpreting the data: League Table 1 – Income’.
S E C T I O N 2 L E A G U E T A B L E S
4 I N N O C E N T I R E P O R T C A R D 1 3
Interpreting the data: League Table 1 – Income
Higher income gap Lower income gap
Low
er p
over
tyH
ighe
r po
vert
y
Chi
ld p
over
ty r
ate
Relative income gap
FINODK
ISNL CZ
CH
UK
IEDE
AT
LU
FRAU
KRSI
SECY
BENZ
MTHU
PL
EESK
HR
CALT
LVJP
PTTT
US
TR
ES
GR
CLIL
MXBG
RO
LEAGUE TABLES Key findings:
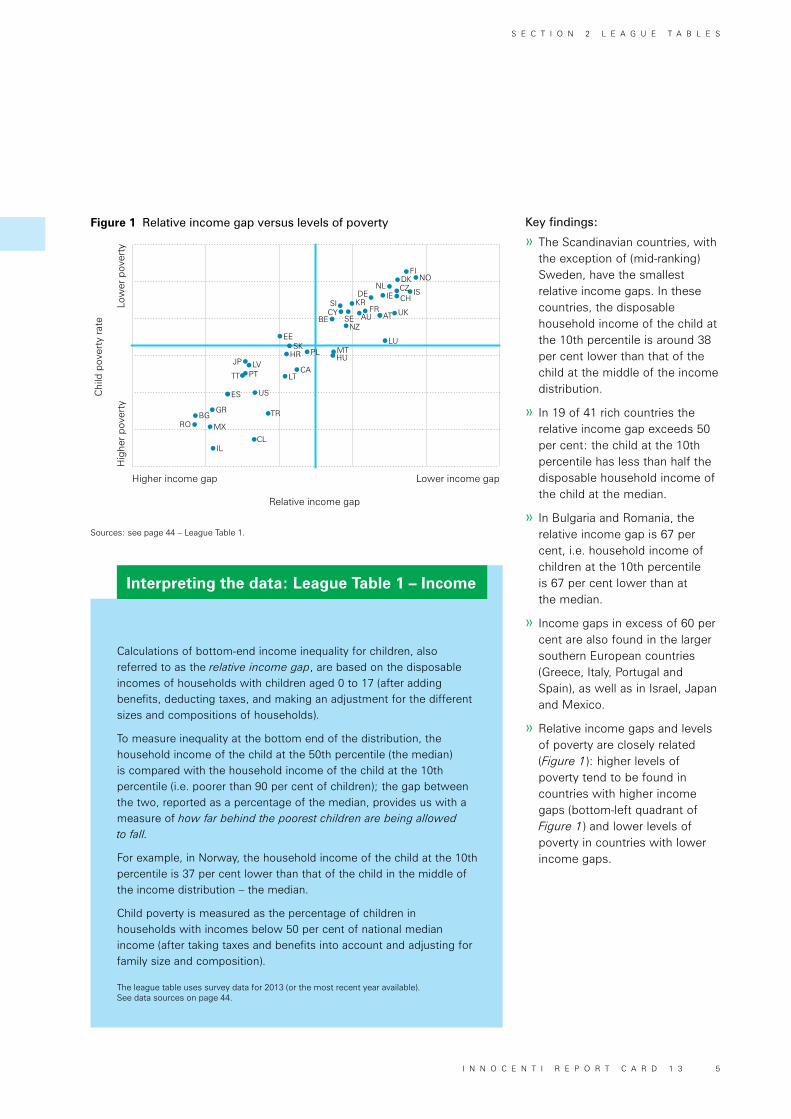
» The Scandinavian countries, with the exception of (mid-ranking)Sweden, have the smallest relative income gaps. In these countries, the disposable household income of the child at the 10th percentile is around 38 per cent lower than that of the child at the middle of the income distribution.
» In 19 of 41 rich countries the relative income gap exceeds 50 per cent: the child at the 10th percentile has less than half the disposable household income of the child at the median.
» In Bulgaria and Romania, the relative income gap is 67 per cent, i.e. household income of children at the 10th percentile is 67 per cent lower than at the median.
» Income gaps in excess of 60 per cent are also found in the larger southern European countries (Greece, Italy, Portugal and Spain), as well as in Israel, Japan and Mexico.
» Relative income gaps and levels of poverty are closely related (Figure 1): higher levels of poverty tend to be found in countries with higher income gaps (bottom-left quadrant of Figure 1) and lower levels of poverty in countries with lower income gaps.
Calculations of bottom-end income inequality for children, also referred to as the relative income gap, are based on the disposable incomes of households with children aged 0 to 17 (after adding benefits, deducting taxes, and making an adjustment for the different sizes and compositions of households).
To measure inequality at the bottom end of the distribution, the household income of the child at the 50th percentile (the median) is compared with the household income of the child at the 10th percentile (i.e. poorer than 90 per cent of children); the gap between the two, reported as a percentage of the median, provides us with a measure of how far behind the poorest children are being allowed to fall.
For example, in Norway, the household income of the child at the 10th percentile is 37 per cent lower than that of the child in the middle of the income distribution – the median.
Child poverty is measured as the percentage of children in households with incomes below 50 per cent of national median income (after taking taxes and benefits into account and adjusting for family size and composition).
The league table uses survey data for 2013 (or the most recent year available). See data sources on page 44.
Figure 1 Relative income gap versus levels of poverty
Sources: see page 44 – League Table 1.
S E C T I O N 2 L E A G U E T A B L E S
I N N O C E N T I R E P O R T C A R D 1 3 5
Rank Country Achievement gap
Share of children below proficiency level 2 in all three subjects
1 Chile 1.92 24.6
2 Romania 1.77 24.0
3 Estonia 1.59 3.2
4 Latvia 1.19 8.3
5 Croatia 0.88 11.7
6 Poland 0.79 5.7
7 Lithuania 0.67 12.1
8 Denmark 0.66 9.3
9 Ireland 0.62 6.8
10 United States 0.54 12.2
11 Slovenia 0.46 9.9
12 Spain 0.36 10.4
13 Czech Republic 0.30 8.9
14 Canada 0.28 6.2
15 Republic of Korea 0.22 4.4
16 Finland 0.18 5.3
17 Hungary 0.15 13.1
18 Greece 0.08 15.7
19 Portugal -0.10 12.6
20 Switzerland -0.12 7.5
21 Austria -0.17 10.7
22 Italy -0.26 11.9
23 Norway -0.28 11.0
24 Australia -0.29 9.1
25 United Kingdom -0.40 11.2
26 Iceland -0.46 13.6
27 Japan -0.48 5.5
28 Germany -0.56 8.8
29 Sweden -0.61 15.0
30 Netherlands -0.70 8.6
31 New Zealand -0.94 11.1
32 Bulgaria -0.97 28.6
33 Luxembourg -0.98 14.4
34 Slovakia -1.03 18.8
35 France -1.36 12.7
36 Belgium -1.39 11.5
37 Israel -1.96 18.5
Mexico 2.19 31.0
Turkey 1.76 15.6
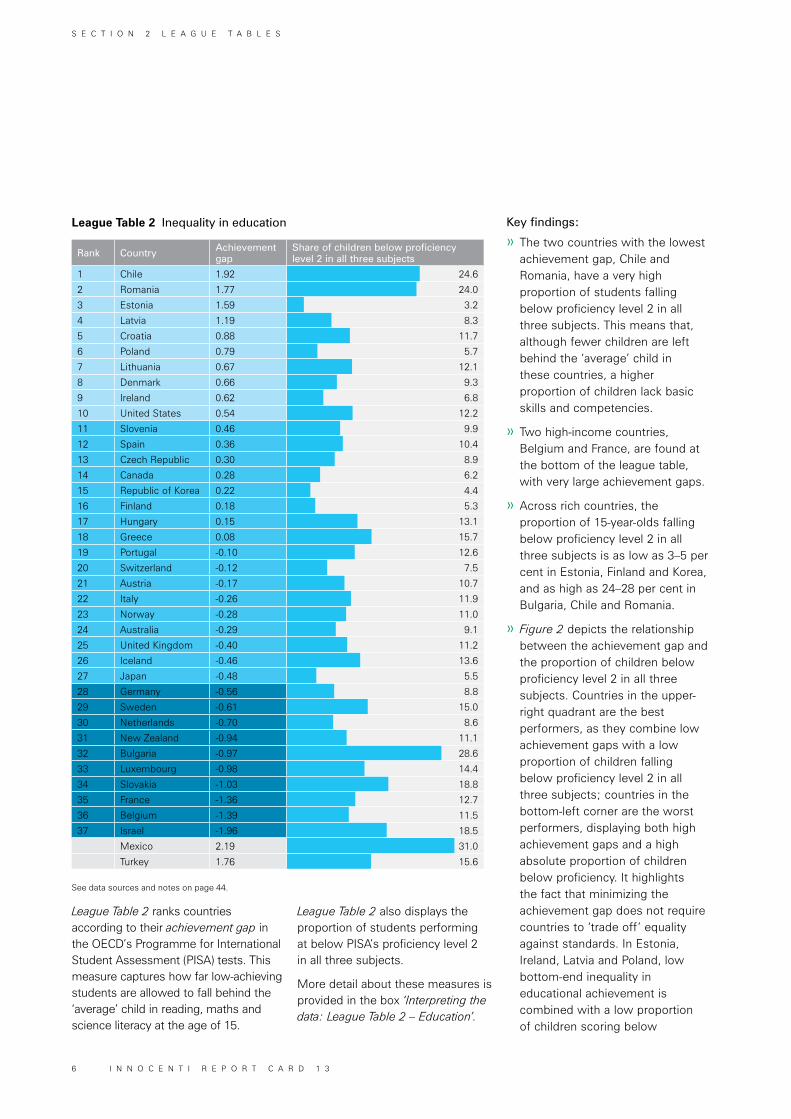
League Table 2 ranks countries according to their achievement gap in the OECD’s Programme for International Student Assessment (PISA) tests. This measure captures how far low-achieving students are allowed to fall behind the ‘average’ child in reading, maths and science literacy at the age of 15.
See data sources and notes on page 44.
League Table 2 Inequality in education
League Table 2 also displays the proportion of students performing at below PISA’s proficiency level 2 in all three subjects.
More detail about these measures is provided in the box ‘Interpreting the data: League Table 2 – Education’.
Key findings:
» The two countries with the lowest achievement gap, Chile and Romania, have a very high proportion of students falling below proficiency level 2 in all three subjects. This means that, although fewer children are left behind the ‘average’ child in these countries, a higher proportion of children lack basic skills and competencies.
» Two high-income countries, Belgium and France, are found at the bottom of the league table, with very large achievement gaps.
» Across rich countries, the proportion of 15-year-olds falling below proficiency level 2 in all three subjects is as low as 3–5 per cent in Estonia, Finland and Korea, and as high as 24–28 per cent in Bulgaria, Chile and Romania.
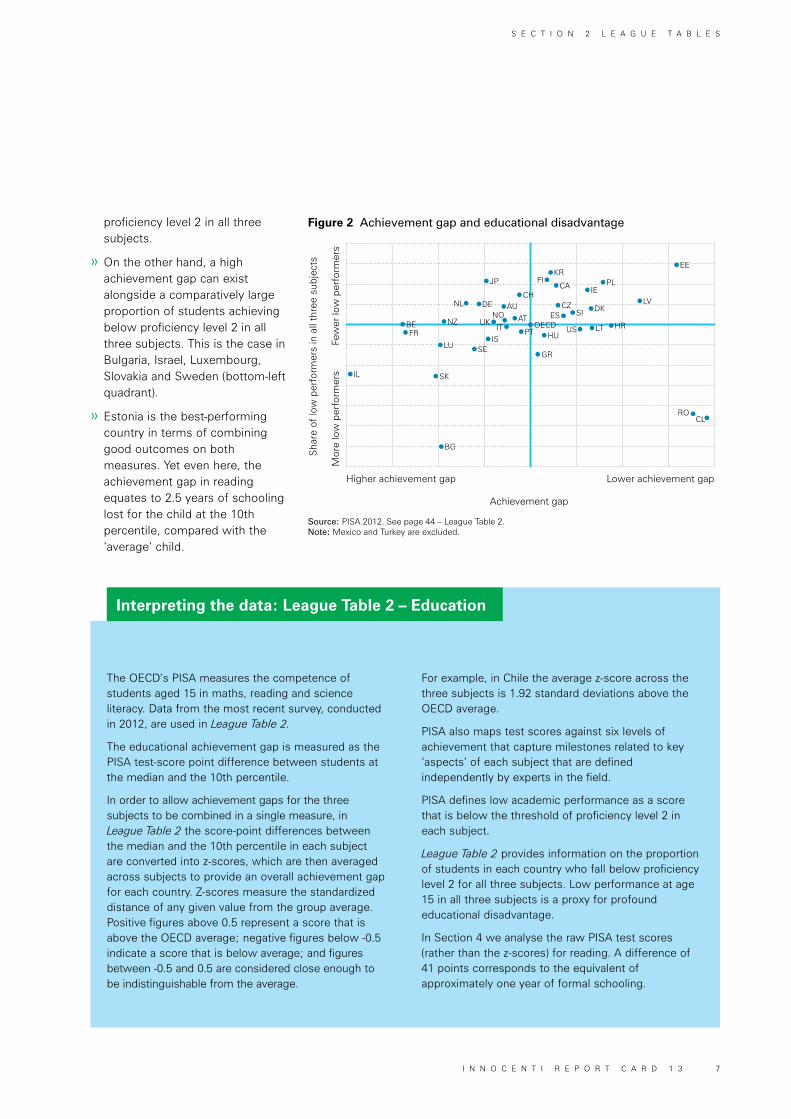
» Figure 2 depicts the relationship between the achievement gap and the proportion of children below proficiency level 2 in all three subjects. Countries in the upper-right quadrant are the best performers, as they combine low achievement gaps with a low proportion of children falling below proficiency level 2 in all three subjects; countries in the bottom-left corner are the worst performers, displaying both high achievement gaps and a high absolute proportion of children below proficiency. It highlights the fact that minimizing the achievement gap does not require countries to ‘trade off’ equality against standards. In Estonia, Ireland, Latvia and Poland, low bottom-end inequality in educational achievement is combined with a low proportion of children scoring below
S E C T I O N 2 L E A G U E T A B L E S
6 I N N O C E N T I R E P O R T C A R D 1 3
Interpreting the data: League Table 2 – Education
Higher achievement gap Lower achievement gap
Few
er lo
w p
erfo
rmer
s M
ore
low
per
form
ers
Sha
re o
f lo
w p
erfo
rmer
s in
all
thre
e su
bjec
ts
Achievement gap
BG
IL SK
FRBE
LU
NZ
SEIS
NL DE
UKIT
AT
AU
JP
PT
GR
HUOECD
CH
US
SIESCZ
CAFI
KR
LT
DK
IE
HR
PL
RO
LV
EE
CL
NO
The OECD’s PISA measures the competence of students aged 15 in maths, reading and science literacy. Data from the most recent survey, conducted in 2012, are used in League Table 2.
The educational achievement gap is measured as the PISA test-score point difference between students at the median and the 10th percentile.
In order to allow achievement gaps for the three subjects to be combined in a single measure, in League Table 2 the score-point differences between the median and the 10th percentile in each subject are converted into z-scores, which are then averaged across subjects to provide an overall achievement gap for each country. Z-scores measure the standardized distance of any given value from the group average. Positive figures above 0.5 represent a score that is above the OECD average; negative figures below -0.5 indicate a score that is below average; and figures between -0.5 and 0.5 are considered close enough to be indistinguishable from the average.
Figure 2 Achievement gap and educational disadvantage
Source: PISA 2012. See page 44 – League Table 2.Note: Mexico and Turkey are excluded.
proficiency level 2 in all three subjects.
» On the other hand, a high achievement gap can exist alongside a comparatively large proportion of students achieving below proficiency level 2 in all three subjects. This is the case in Bulgaria, Israel, Luxembourg, Slovakia and Sweden (bottom-left quadrant).
» Estonia is the best-performing country in terms of combining good outcomes on both measures. Yet even here, the achievement gap in reading equates to 2.5 years of schooling lost for the child at the 10th percentile, compared with the ‘average’ child.
For example, in Chile the average z-score across the three subjects is 1.92 standard deviations above the OECD average.
PISA also maps test scores against six levels of achievement that capture milestones related to key ‘aspects’ of each subject that are defined independently by experts in the field.
PISA defines low academic performance as a score that is below the threshold of proficiency level 2 in each subject.
League Table 2 provides information on the proportion of students in each country who fall below proficiency level 2 for all three subjects. Low performance at age 15 in all three subjects is a proxy for profound educational disadvantage.
In Section 4 we analyse the raw PISA test scores (rather than the z-scores) for reading. A difference of 41 points corresponds to the equivalent of approximately one year of formal schooling.
S E C T I O N 2 L E A G U E T A B L E S
I N N O C E N T I R E P O R T C A R D 1 3 7
Rank Country Relative health gap
One or more health complaints every day
1 Austria 23.64 17.7
2 Germany 24.76 19.6
3 Switzerland 24.95 16.3
4 Norway 25.15 14.9
5 Denmark 25.50 17.6
6 Finland 25.89 15.0
7 Portugal 26.39 17.7
8 Netherlands 26.74 19.9
9 Czech Republic 26.84 25.3
10 Spain 27.31 23.9
11 Greece 27.37 27.9
12 Croatia 27.59 25.7
13 Estonia 27.65 23.8
14 United States 27.98 28.2
15 Belgium 28.14 23.8
16 Slovenia 28.29 18.7
17 Latvia 28.61 23.3
18 Hungary 28.79 22.2
19 United Kingdom 28.87 21.4
20 Ireland 28.90 21.0
21 Slovakia 28.96 23.8
22 Sweden 29.08 19.1
23 France 29.18 30.7
24 Canada 29.27 22.6
25 Lithuania 29.31 23.0
26 Bulgaria 29.39 30.6
27 Australia 29.86 21.8
28 Italy 30.11 30.5
29 Luxembourg 30.27 24.1
30 Malta 30.56 30.7
31 Iceland 31.08 22.6
32 Romania 33.95 31.2
33 Poland 34.05 27.4
34 Turkey 34.54 53.3
35 Israel 38.88 29.7
See data sources and notes on page 44.
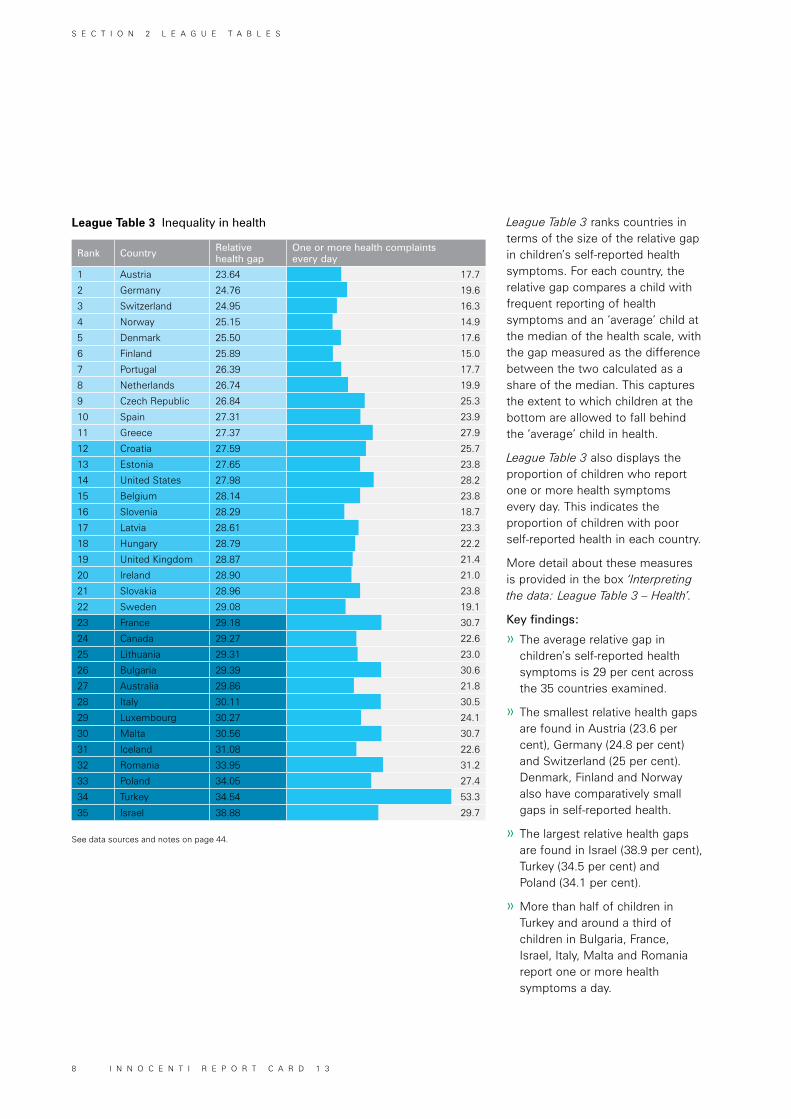
League Table 3 Inequality in health League Table 3 ranks countries in terms of the size of the relative gap in children’s self-reported health symptoms. For each country, the relative gap compares a child with frequent reporting of health symptoms and an ‘average’ child at the median of the health scale, with the gap measured as the difference between the two calculated as a share of the median. This captures the extent to which children at the bottom are allowed to fall behind the ‘average’ child in health.
League Table 3 also displays the proportion of children who report one or more health symptoms every day. This indicates the proportion of children with poor self-reported health in each country.
More detail about these measures is provided in the box ‘Interpreting the data: League Table 3 – Health’.
Key findings:
» The average relative gap in children’s self-reported health symptoms is 29 per cent across the 35 countries examined.
» The smallest relative health gaps are found in Austria (23.6 per cent), Germany (24.8 per cent) and Switzerland (25 per cent). Denmark, Finland and Norway also have comparatively small gaps in self-reported health.
» The largest relative health gaps are found in Israel (38.9 per cent), Turkey (34.5 per cent) and Poland (34.1 per cent).
» More than half of children in Turkey and around a third of children in Bulgaria, France, Israel, Italy, Malta and Romania report one or more health symptoms a day.
S E C T I O N 2 L E A G U E T A B L E S
8 I N N O C E N T I R E P O R T C A R D 1 3
Interpreting the data: League Table 3 – Health
Higher health gap Lower health gap
Few
er c
ompl
aint
sM
ore
com
plai
nts
One
or
mor
e he
alth
com
plai
nts
ever
y da
y
Relative health gap
TR
ILRO
PLMT
IT
BGFR
ISLU
AU
LT
CA
SKLVHU
UKIESE SI
USHR
BEEE
GR
ESCZ
NLPT DK
FI NOCH
DEAT
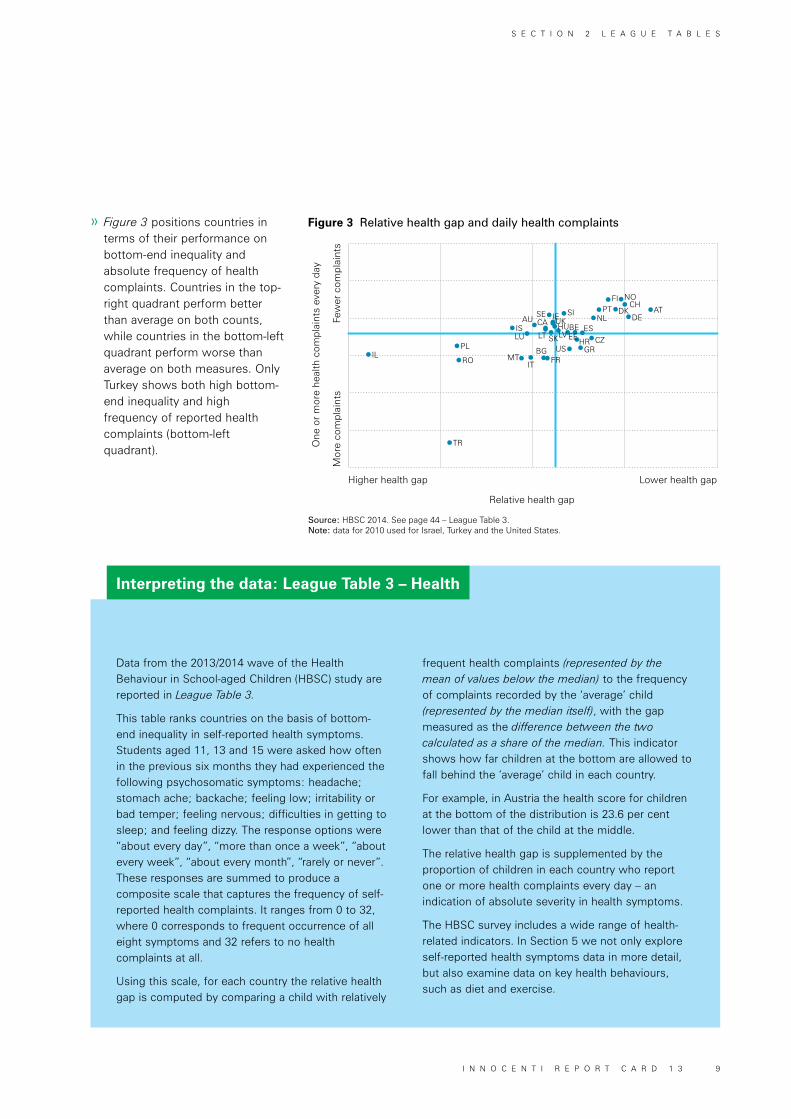
» Figure 3 positions countries in terms of their performance on bottom-end inequality and absolute frequency of health complaints. Countries in the top-right quadrant perform better than average on both counts, while countries in the bottom-left quadrant perform worse than average on both measures. Only Turkey shows both high bottom-end inequality and high frequency of reported health complaints (bottom-left quadrant).
Figure 3 Relative health gap and daily health complaints
Source: HBSC 2014. See page 44 – League Table 3. Note: data for 2010 used for Israel, Turkey and the United States.
Data from the 2013/2014 wave of the Health Behaviour in School-aged Children (HBSC) study are reported in League Table 3.
This table ranks countries on the basis of bottom-end inequality in self-reported health symptoms. Students aged 11, 13 and 15 were asked how often in the previous six months they had experienced the following psychosomatic symptoms: headache; stomach ache; backache; feeling low; irritability or bad temper; feeling nervous; difficulties in getting to sleep; and feeling dizzy. The response options were “about every day”, “more than once a week”, “about every week”, “about every month”, “rarely or never”. These responses are summed to produce a composite scale that captures the frequency of self-reported health complaints. It ranges from 0 to 32, where 0 corresponds to frequent occurrence of all eight symptoms and 32 refers to no health complaints at all.
Using this scale, for each country the relative health gap is computed by comparing a child with relatively
frequent health complaints (represented by the mean of values below the median) to the frequency of complaints recorded by the ‘average’ child (represented by the median itself), with the gap measured as the difference between the two calculated as a share of the median. This indicator shows how far children at the bottom are allowed to fall behind the ‘average’ child in each country.
For example, in Austria the health score for children at the bottom of the distribution is 23.6 per cent lower than that of the child at the middle.
The relative health gap is supplemented by the proportion of children in each country who report one or more health complaints every day – an indication of absolute severity in health symptoms.
The HBSC survey includes a wide range of health-related indicators. In Section 5 we not only explore self-reported health symptoms data in more detail, but also examine data on key health behaviours, such as diet and exercise.
S E C T I O N 2 L E A G U E T A B L E S
I N N O C E N T I R E P O R T C A R D 1 3 9
Rank Country Relative life satisfaction gap Life satisfaction at 4 or lower out of 10
1 Netherlands 24.03 4.4
2 Australia 24.34 4.5
3 Denmark 25.12 5.7
4 Greece 25.72 4.5
5 Romania 26.06 4.8
6 Latvia 26.09 6.4
7 Switzerland 26.32 5.4
8 Norway 26.35 4.5
9 Austria 26.90 5.2
10 Estonia 26.95 5.3
11 Finland 27.01 5.7
12 Slovenia 27.21 5.6
13 Ireland 27.38 6.9
14 Malta 27.61 5.7
15 Hungary 27.86 6.3
16 Bulgaria 27.90 5.0
17 Sweden 27.98 8.2
18 Portugal 28.03 6.0
19 Iceland 28.38 6.7
20 United Kingdom 28.42 7.4
21 United States 28.67 7.3
22 Italy 28.80 8.0
23 Croatia 29.13 5.0
24 Spain 29.23 5.6
25 Canada 29.37 8.6
26 Slovakia 29.41 7.0
27 Lithuania 29.44 5.4
28 France 29.56 8.5
29 Germany 29.58 8.4
30 Belgium 29.96 9.6
31 Israel 30.01 7.7
32 Luxembourg 30.04 8.2
33 Poland 31.11 10.0
34 Czech Republic 31.50 8.6
35 Turkey 35.95 15.3
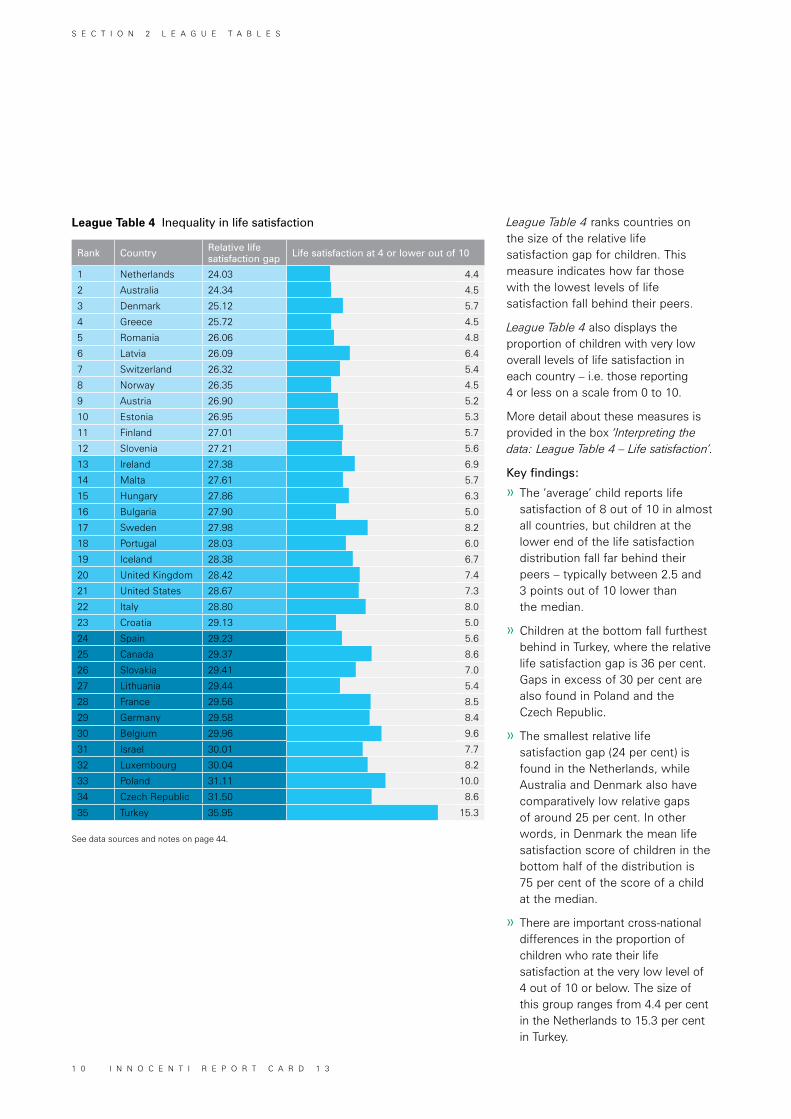
League Table 4 ranks countries on the size of the relative life satisfaction gap for children. This measure indicates how far those with the lowest levels of life satisfaction fall behind their peers.
League Table 4 also displays the proportion of children with very low overall levels of life satisfaction in each country – i.e. those reporting 4 or less on a scale from 0 to 10.
More detail about these measures is provided in the box ‘Interpreting the data: League Table 4 – Life satisfaction’.
Key findings:
» The ‘average’ child reports life satisfaction of 8 out of 10 in almost all countries, but children at the lower end of the life satisfaction distribution fall far behind their peers – typically between 2.5 and 3 points out of 10 lower than the median.
» Children at the bottom fall furthest behind in Turkey, where the relative life satisfaction gap is 36 per cent. Gaps in excess of 30 per cent are also found in Poland and the Czech Republic.
» The smallest relative life satisfaction gap (24 per cent) is found in the Netherlands, while Australia and Denmark also have comparatively low relative gaps of around 25 per cent. In other words, in Denmark the mean life satisfaction score of children in the bottom half of the distribution is 75 per cent of the score of a child at the median.
» There are important cross-national differences in the proportion of children who rate their life satisfaction at the very low level of 4 out of 10 or below. The size of this group ranges from 4.4 per cent in the Netherlands to 15.3 per cent in Turkey.
See data sources and notes on page 44.
League Table 4 Inequality in life satisfaction
S E C T I O N 2 L E A G U E T A B L E S
1 0 I N N O C E N T I R E P O R T C A R D 1 3
Interpreting the data: League Table 4 – Life satisfaction
Life
sat
isfa
ctio
n at
4 o
r le
ss o
ut o
f 10
Relative life satisfaction gap
Higher life satisfaction gap Lower life satisfaction gap
Hig
her
life
satis
fact
ion
Low
er li
fe s
atis
fact
ion
TR
PL
CZ
BE
LUIL
FRDE
CA
IT
SKIS
SEUKUS
ESLTHR
HUPT
MTBG
SIFI
IE
EEAT
LV
CH
NORO
DK
GRAU
NL
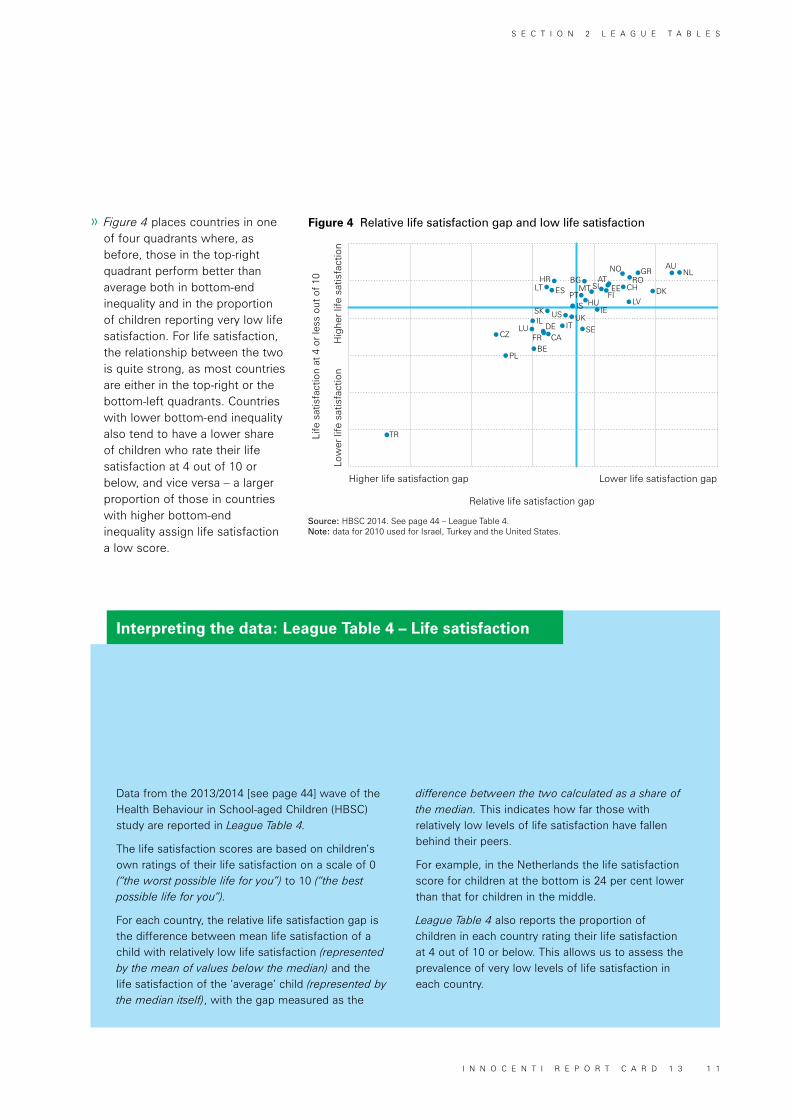
» Figure 4 places countries in one of four quadrants where, as before, those in the top-right quadrant perform better than average both in bottom-end inequality and in the proportion of children reporting very low life satisfaction. For life satisfaction, the relationship between the two is quite strong, as most countries are either in the top-right or the bottom-left quadrants. Countries with lower bottom-end inequality also tend to have a lower share of children who rate their life satisfaction at 4 out of 10 or below, and vice versa – a larger proportion of those in countries with higher bottom-end inequality assign life satisfaction a low score.
Data from the 2013/2014 [see page 44] wave of the Health Behaviour in School-aged Children (HBSC) study are reported in League Table 4.
The life satisfaction scores are based on children’s own ratings of their life satisfaction on a scale of 0 (“the worst possible life for you”) to 10 (“the best possible life for you”).
For each country, the relative life satisfaction gap is the difference between mean life satisfaction of a child with relatively low life satisfaction (represented by the mean of values below the median) and the life satisfaction of the ‘average’ child (represented by the median itself), with the gap measured as the
Figure 4 Relative life satisfaction gap and low life satisfaction
Source: HBSC 2014. See page 44 – League Table 4.Note: data for 2010 used for Israel, Turkey and the United States.
difference between the two calculated as a share of the median. This indicates how far those with relatively low levels of life satisfaction have fallen behind their peers.
For example, in the Netherlands the life satisfaction score for children at the bottom is 24 per cent lower than that for children in the middle.
League Table 4 also reports the proportion of children in each country rating their life satisfaction at 4 out of 10 or below. This allows us to assess the prevalence of very low levels of life satisfaction in each country.
S E C T I O N 2 L E A G U E T A B L E S
I N N O C E N T I R E P O R T C A R D 1 3 1 1
Rank Country Income Education Health Life satisfaction Missing indicators
1 Denmark 4 8 5 3 0
2= Finland 3 16 6 11 0
2= Norway 1 23 4 8 0
2= Switzerland 6 20 3 7 0
5 Austria 11 21 1 9 0
6 Netherlands 8 30 8 1 0
7 Ireland 10 9 20 13 0
8 Estonia 28 3 13 10 0
9 Slovenia 19 11 16 12 0
10 Latvia 32 4 17 6 0
11 Czech Republic 5 13 9 34 0
12 Croatia 26 5 12 23 0
13 Australia 14 24 27 2 0
14= Germany 12 28 2 29 0
14= Greece 38 18 11 4 0
14= Hungary 21 17 18 15 0
14= United Kingdom 7 25 19 20 0
18 United States 30 10 14 21 0
19 Portugal 33 19 7 18 0
20 Iceland 2 26 31 19 0
21 Romania 41 2 32 5 0
22 Spain 36 12 10 24 0
23 Sweden 16 29 22 17 0
24 Malta 20 30 14 1
25 Lithuania 27 7 25 27 0
26 Canada 24 14 24 25 0
27 Poland 23 6 33 33 0
28 France 13 35 23 28 0
29= Belgium 22 36 15 30 0
29= Luxembourg 9 33 29 32 0
31 Slovakia 25 34 21 26 0
32 Italy 35 22 28 22 0
33 Bulgaria 40 32 26 16 0
34 Turkey 29 34 35 1
35 Israel 37 37 35 31 0
- Republic of Korea 15 15 2
- Chile 31 1 2
- New Zealand 17 31 2
- Japan 34 27 2
- Cyprus 18 3
- Mexico 39 3
n.a top third middle third bottom third two or more indicators missing
See data sources and notes on page 44.
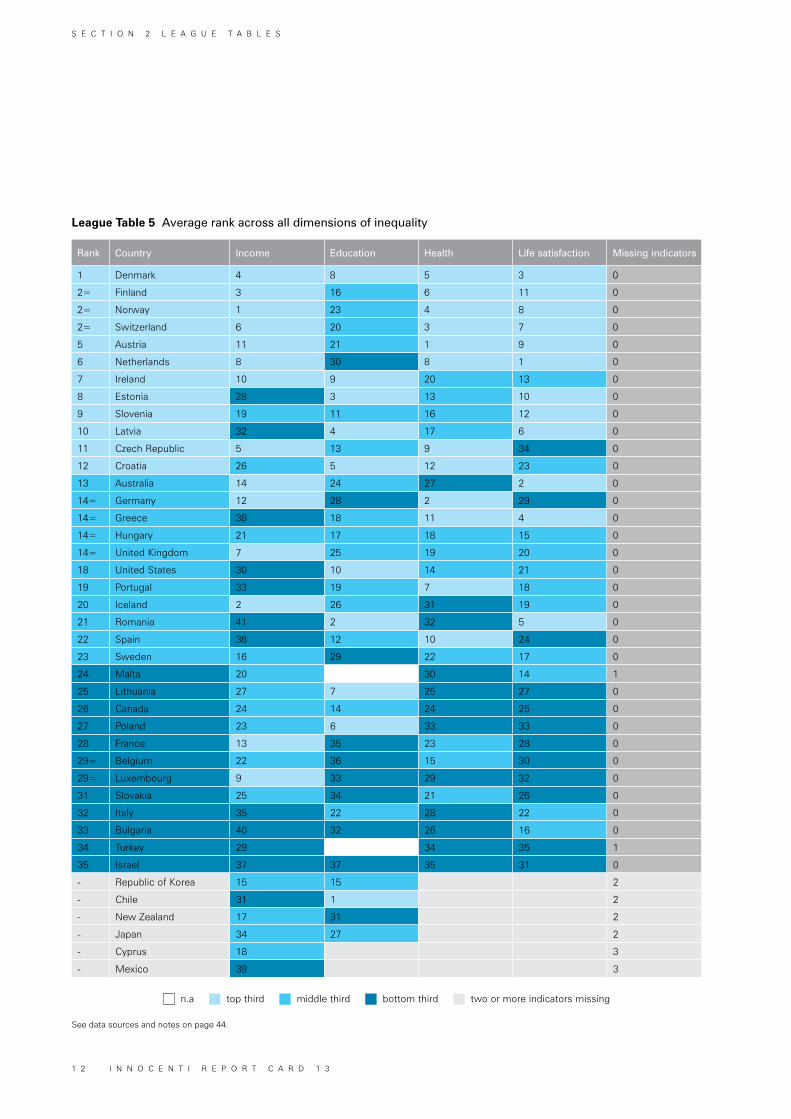
League Table 5 Average rank across all dimensions of inequality
S E C T I O N 2 L E A G U E T A B L E S
1 2 I N N O C E N T I R E P O R T C A R D 1 3
League Table 5 summarizes each country’s overall record for bottom-end inequality in child well-being. It displays each country’s rank in the income, education, health and life satisfaction league tables, and provides an overall rank based on that country’s average position across each of the four previous league tables.
Countries lacking indicators for two or more domains of child well-being are excluded from the overall ranking, but are displayed at the end of the league table for reference.
Key findings:
» Denmark is at the top of the overall league table. It has comparatively low bottom-end inequality in each of the four domains of child well-being. Indeed it is the only country to rank in the top third in all four league tables. Denmark’s lowest ranking is eighth in education.
» Finland, Norway and Switzerland share second place in the overall league table. They rank in the top third in each domain, except education.
» Israel and Turkey rank lowest in the overall league table. They
have comparatively high bottom-end inequality in each of the four domains of child well-being for which they have valid data.
» Some of the richest countries in the world are placed in the bottom third of the overall league table, including three of the Group of Seven countries: Canada (26th), France (28th) and Italy (32nd). The country in the European Union with the highest income per person, Luxembourg, ranks 29th.
» Report Card 9 examined bottom-end inequality before the economic crisis. A comparison of the overall league tables in the two Report Cards suggests that France, Iceland and Sweden have seen their comparative positions decline in recent years: France, previously towards the middle of the overall table, now ranks in the bottom third; while Iceland and Sweden, previously towards the top of the overall league table, now sit marginally above the bottom third. However, a direct comparison between the two Report Cards cannot be made as somewhat different measures are used.
S E C T I O N 2 L E A G U E T A B L E S
I N N O C E N T I R E P O R T C A R D 1 3 1 3
INCOMESECTION 3
Income gaps have widened in the majority of rich countries
How has income inequality evolved over the past few years? Different pathways can explain changes in the relative income gap over time. For example, if incomes at the bottom of the distribution grow faster than in the middle, the result is a doubly positive scenario of overall improvements coupled with declines in bottom-end inequality. Conversely, if the 10th percentile decreases faster than the median, inequality widens and the poorest children are left even further behind.
Countries are placed into five groups in Figure 5 to clarify the reasons for changes in inequality between 2008 and 2013. These pathways are based on ‘real’ changes in incomes over time, i.e. adjusting for inflation, although this does not affect the relative gap itself.
Bottom-end income inequality has increased in over half of the rich countries analysed: 19 of 37 saw an increase in the relative child income gap of at least 1 percentage point between 2008 and 2013. Two-thirds of these countries saw a substantial increase in inequality, exceeding 2 percentage points.
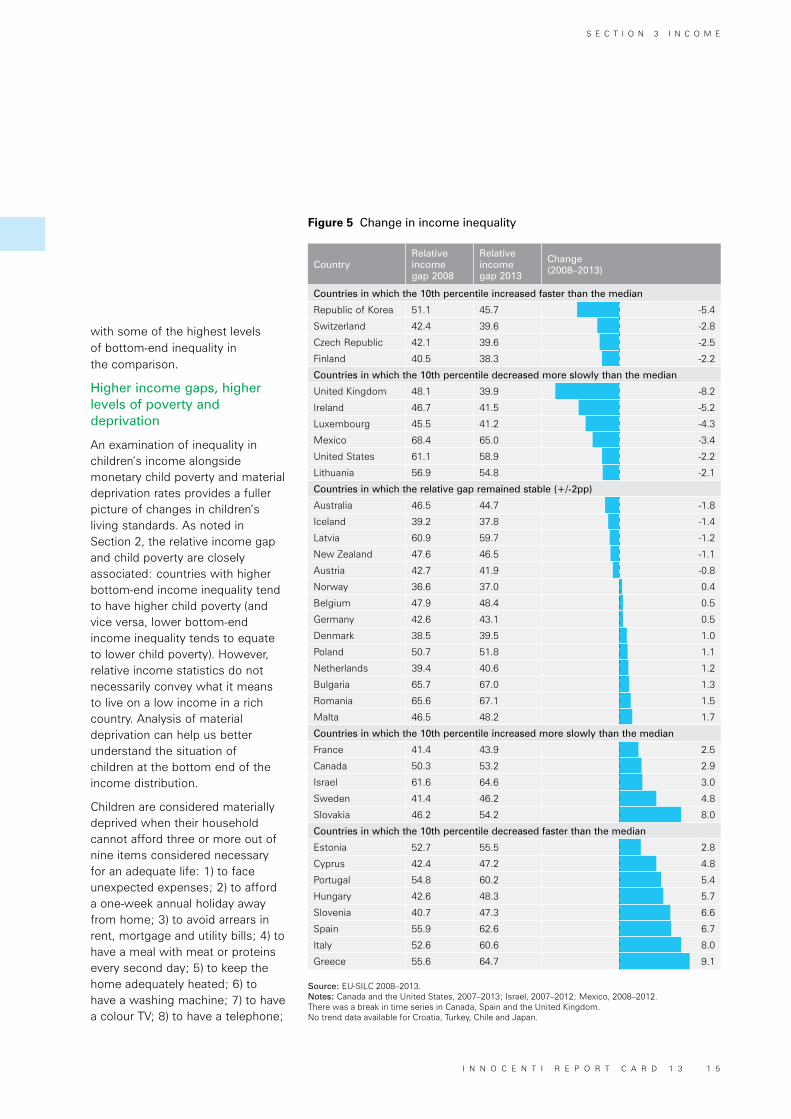
Figure 5 shows that:
» Of the 10 countries where the relative income gap narrowed by at least 2 percentage points between 2008 and 2013, in only
four – the Czech Republic, Finland, Korea and Switzerland – was that because of a ‘positive’ closing of the gap: the incomes of both the 10th percentile and the median grew, but those of the 10th percentile increased faster.
» In the second group of countries, the relative gap shrank because the median income declined, while the 10th percentile either decreased more slowly (Ireland, Lithuania and Luxembourg), remained unchanged (the United Kingdom and the United States) or even increased (Mexico).
» In Canada, France, Israel, Slovakia and Sweden, the relative income gap increased, as the median income grew or at least remained unchanged, while the 10th percentile income improved more slowly or even decreased, thus widening the gap between the bottom and the middle.
» The largest increases in inequality – of at least 5 percentage points – occurred in four southern European countries (Greece, Italy, Portugal and Spain) and three eastern European countries (Hungary, Slovakia and Slovenia). In all these countries, except Slovakia, children’s median household incomes fell, but the 10th percentile income decreased even faster, leaving the poorest children increasingly lagging behind.
Social transfers matter
Labour markets play a significant role in shaping the income of households with children – particularly following an economic crisis, when rates of unemployment and underemployment rise. Children living in jobless households are overrepresented in the bottom income decile in all European countries. In Bulgaria, over 75 per cent of children in the poorest decile live in a jobless household, while that is the case for over 60 per cent in Belgium, Greece, Hungary, Ireland and Slovakia.
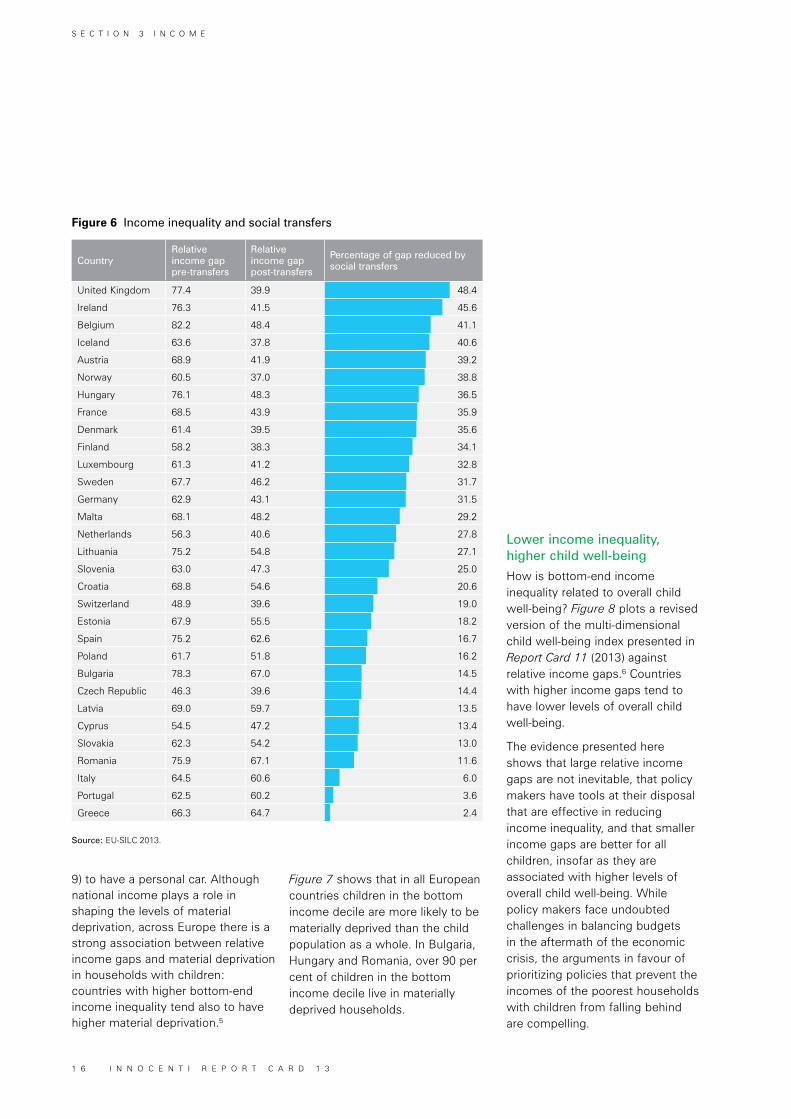
The comparison of pre- and post-transfer incomes for European countries shown in Figure 6 underlines the fact that social transfers also play a role in reducing relative income gaps among children in rich countries. Indeed, in all these countries income inequality is higher before social transfers than after, but the degree to which social transfers reduce the relative income gap varies considerably across Europe.
In Ireland and the United Kingdom, social transfers nearly halve the relative income gap. Indeed, without significant social transfers, the income gaps in these two countries would be among the highest in Europe. In other countries, particularly Bulgaria, Greece, Italy and Portugal, the pre- and post-transfer income gaps are very similar. These are countries
S E C T I O N 3 I N C O M E
1 4 I N N O C E N T I R E P O R T C A R D 1 3
CountryRelative income gap 2008
Relative income gap 2013
Change (2008–2013)
Countries in which the 10th percentile increased faster than the median
Republic of Korea 51.1 45.7 -5.4
Switzerland 42.4 39.6 -2.8
Czech Republic 42.1 39.6 -2.5
Finland 40.5 38.3 -2.2
Countries in which the 10th percentile decreased more slowly than the median
United Kingdom 48.1 39.9 -8.2
Ireland 46.7 41.5 -5.2
Luxembourg 45.5 41.2 -4.3
Mexico 68.4 65.0 -3.4
United States 61.1 58.9 -2.2
Lithuania 56.9 54.8 -2.1
Countries in which the relative gap remained stable (+/-2pp)
Australia 46.5 44.7 -1.8
Iceland 39.2 37.8 -1.4
Latvia 60.9 59.7 -1.2
New Zealand 47.6 46.5 -1.1
Austria 42.7 41.9 -0.8
Norway 36.6 37.0 0.4
Belgium 47.9 48.4 0.5
Germany 42.6 43.1 0.5
Denmark 38.5 39.5 1.0
Poland 50.7 51.8 1.1
Netherlands 39.4 40.6 1.2
Bulgaria 65.7 67.0 1.3
Romania 65.6 67.1 1.5
Malta 46.5 48.2 1.7
Countries in which the 10th percentile increased more slowly than the median
France 41.4 43.9 2.5
Canada 50.3 53.2 2.9
Israel 61.6 64.6 3.0
Sweden 41.4 46.2 4.8
Slovakia 46.2 54.2 8.0
Countries in which the 10th percentile decreased faster than the median
Estonia 52.7 55.5 2.8
Cyprus 42.4 47.2 4.8
Portugal 54.8 60.2 5.4
Hungary 42.6 48.3 5.7
Slovenia 40.7 47.3 6.6
Spain 55.9 62.6 6.7
Italy 52.6 60.6 8.0
Greece 55.6 64.7 9.1
INCOME Figure 5 Change in income inequality
Source: EU-SILC 2008–2013.Notes: Canada and the United States, 2007–2013; Israel, 2007–2012; Mexico, 2008–2012. There was a break in time series in Canada, Spain and the United Kingdom.No trend data available for Croatia, Turkey, Chile and Japan.
with some of the highest levels of bottom-end inequality in the comparison.
Higher income gaps, higher levels of poverty and deprivation
An examination of inequality in children’s income alongside monetary child poverty and material deprivation rates provides a fuller picture of changes in children’s living standards. As noted in Section 2, the relative income gap and child poverty are closely associated: countries with higher bottom-end income inequality tend to have higher child poverty (and vice versa, lower bottom-end income inequality tends to equate to lower child poverty). However, relative income statistics do not necessarily convey what it means to live on a low income in a rich country. Analysis of material deprivation can help us better understand the situation of children at the bottom end of the income distribution.
Children are considered materially deprived when their household cannot afford three or more out of nine items considered necessary for an adequate life: 1) to face unexpected expenses; 2) to afford a one-week annual holiday away from home; 3) to avoid arrears in rent, mortgage and utility bills; 4) to have a meal with meat or proteins every second day; 5) to keep the home adequately heated; 6) to have a washing machine; 7) to have a colour TV; 8) to have a telephone;
S E C T I O N 3 I N C O M E
I N N O C E N T I R E P O R T C A R D 1 3 1 5
CountryRelative income gap pre-transfers
Relative income gap post-transfers
Percentage of gap reduced by social transfers
United Kingdom 77.4 39.9 48.4
Ireland 76.3 41.5 45.6
Belgium 82.2 48.4 41.1
Iceland 63.6 37.8 40.6
Austria 68.9 41.9 39.2
Norway 60.5 37.0 38.8
Hungary 76.1 48.3 36.5
France 68.5 43.9 35.9
Denmark 61.4 39.5 35.6
Finland 58.2 38.3 34.1
Luxembourg 61.3 41.2 32.8
Sweden 67.7 46.2 31.7
Germany 62.9 43.1 31.5
Malta 68.1 48.2 29.2
Netherlands 56.3 40.6 27.8
Lithuania 75.2 54.8 27.1
Slovenia 63.0 47.3 25.0
Croatia 68.8 54.6 20.6
Switzerland 48.9 39.6 19.0
Estonia 67.9 55.5 18.2
Spain 75.2 62.6 16.7
Poland 61.7 51.8 16.2
Bulgaria 78.3 67.0 14.5
Czech Republic 46.3 39.6 14.4
Latvia 69.0 59.7 13.5
Cyprus 54.5 47.2 13.4
Slovakia 62.3 54.2 13.0
Romania 75.9 67.1 11.6
Italy 64.5 60.6 6.0
Portugal 62.5 60.2 3.6
Greece 66.3 64.7 2.4
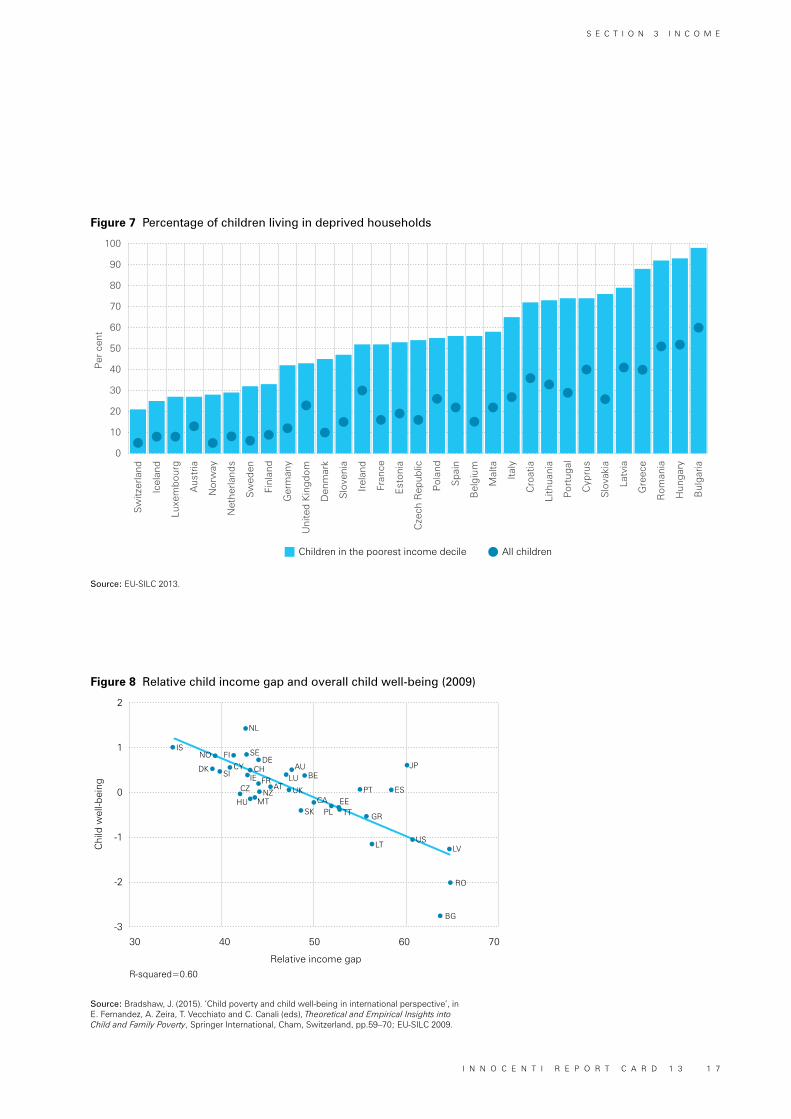
9) to have a personal car. Although national income plays a role in shaping the levels of material deprivation, across Europe there is a strong association between relative income gaps and material deprivation in households with children: countries with higher bottom-end income inequality tend also to have higher material deprivation.5
Figure 7 shows that in all European countries children in the bottom income decile are more likely to be materially deprived than the child population as a whole. In Bulgaria, Hungary and Romania, over 90 per cent of children in the bottom income decile live in materially deprived households.
Lower income inequality, higher child well-being
How is bottom-end income inequality related to overall child well-being? Figure 8 plots a revised version of the multi-dimensional child well-being index presented in Report Card 11 (2013) against relative income gaps.6 Countries with higher income gaps tend to have lower levels of overall child well-being.
The evidence presented here shows that large relative income gaps are not inevitable, that policy makers have tools at their disposal that are effective in reducing income inequality, and that smaller income gaps are better for all children, insofar as they are associated with higher levels of overall child well-being. While policy makers face undoubted challenges in balancing budgets in the aftermath of the economic crisis, the arguments in favour of prioritizing policies that prevent the incomes of the poorest households with children from falling behind are compelling.
Figure 6 Income inequality and social transfers
Source: EU-SILC 2013.
S E C T I O N 3 I N C O M E
1 6 I N N O C E N T I R E P O R T C A R D 1 3
All childrenChildren in the poorest income decile
Hun
gary
Bul
garia
Rom
ania
Gre
ece
Latv
ia
Slo
vaki
a
Cyp
rus
Por
tuga
l
Lith
uani
a
Cro
atia
Italy
Mal
ta
Bel
gium
Spa
in
Pol
and
Cze
ch R
epub
lic
Est
onia
Fran
ce
Irela
nd
Slo
veni
a
Den
mar
k
Uni
ted
Kin
gdom
Ger
man
y
Finl
and
Sw
eden
Net
herla
nds
Nor
way
Aus
tria
Luxe
mbo
urg
Icel
and
Sw
itzer
land
Per
cen
t
0
10
20
30
40
50
60
70
80
90
100
Chi
ld w
ell-b
eing
Relative income gapR-squared=0.60
30 40 50 60 70
-3
-2
-1
0
1
2
GR
PT
LT
ES
BG
RO
LV
JP
CZ
HU MTNZ
FRIECHCY
SIDK
NO FI SEDE
IS
NL
AT UK
SK
LUAU
BE
CA EEPL TT
US
Figure 8 Relative child income gap and overall child well-being (2009)
Figure 7 Percentage of children living in deprived households
Source: Bradshaw, J. (2015). ‘Child poverty and child well-being in international perspective’, in E. Fernandez, A. Zeira, T. Vecchiato and C. Canali (eds), Theoretical and Empirical Insights into Child and Family Poverty, Springer International, Cham, Switzerland, pp.59–70; EU-SILC 2009.
Source: EU-SILC 2013.
S E C T I O N 3 I N C O M E
I N N O C E N T I R E P O R T C A R D 1 3 1 7
Inequality in educational achievement narrowed in the majority of the countries
Whether or not inequality has declined in recent years is an important question. But understanding how the achievement gaps have altered indicates how far educational disadvantage and low achievement have been addressed. For example, a closing of the achievement gap can result from children at the lower end being ‘lifted up’, so that their achievement level is closer to the average standard. However, it may also be the result of falling average achievement, alongside constant (or even declining) achievement among the children at the bottom end of the distribution.
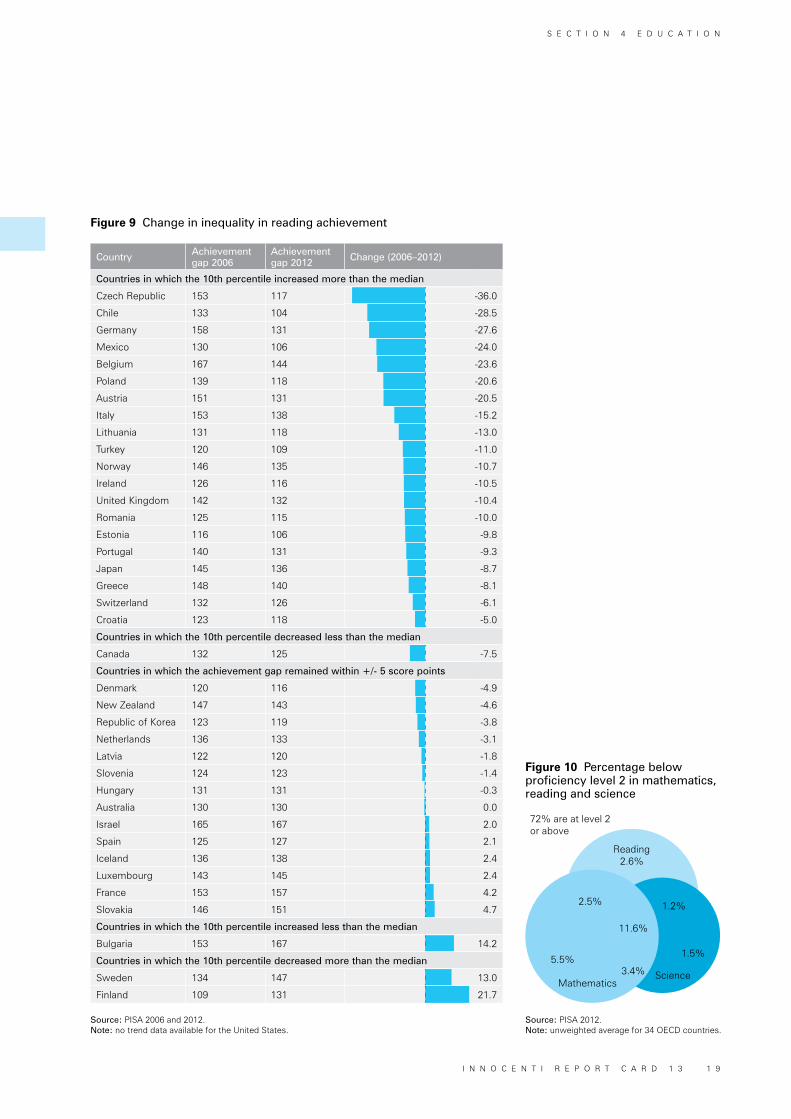
Figure 9 details changes in inequality in PISA test scores for reading between 2006 and 2012.7 It shows that the majority of countries display a positive trend in terms of reducing the achievement gap in reading. Countries are placed into five groups, depending on how their inequality has changed. We are particularly interested in cases where both the median improved and the achievement gap narrowed, as this is a ‘win-win’ scenario of overall improvement coupled with a decline in inequality at the lower end.
The main pathways distinguished in Figure 9 are:
» Countries that narrowed inequality while improving median test scores. The positive news is that 20 out of the 38 countries fell into this category, with the largest improvements in Chile, the Czech Republic, Germany and Mexico, although the median test scores in the Czech Republic and Mexico remain low compared with other countries. Belgium and Germany show large improvements, but with higher median test scores.
» Countries that saw a decrease in inequality but with a fall in median test scores. This type of trajectory is only seen in Canada, where a notable decline in lower-end inequality occurs in part because of a decline in overall achievement.
» Countries that saw an increase in inequality alongside increased median test scores. Only Bulgaria displays this trend; low achievers have been allowed to fall even further behind.
» Countries where bottom-end inequality increased alongside a fall in median test scores. This type of downward trajectory is the most worrying – and not very common in reading. Two high-income countries fall into this group: Finland and Sweden.
Many countries reduced absolute educational disadvantage
In League Table 2, measures of the relative achievement gap were supplemented by an indicator of absolute educational disadvantage, measured as all children who fall under the PISA threshold of proficiency level 2 in all three subjects. Across the OECD countries in 2012, 28 per cent of 15-year-olds fell below proficiency level 2 in at least one of the three subjects, and 11.6 per cent scored below level 2 in all three subjects (Figure 10). Children who underachieve in all three subjects are likely to have been in the lowest-achieving group for some time.
EDUCATIONSECTION 4
S E C T I O N 4 E D U C A T I O N
1 8 I N N O C E N T I R E P O R T C A R D 1 3
Reading2.6%
72% are at level 2 or above
Mathematics
5.5%
2.5%
11.6%
1.2%
3.4%
1.5%
Science
Country Achievement gap 2006
Achievement gap 2012 Change (2006–2012)
Countries in which the 10th percentile increased more than the median
Czech Republic 153 117 -36.0
Chile 133 104 -28.5
Germany 158 131 -27.6
Mexico 130 106 -24.0
Belgium 167 144 -23.6
Poland 139 118 -20.6
Austria 151 131 -20.5
Italy 153 138 -15.2
Lithuania 131 118 -13.0
Turkey 120 109 -11.0
Norway 146 135 -10.7
Ireland 126 116 -10.5
United Kingdom 142 132 -10.4
Romania 125 115 -10.0
Estonia 116 106 -9.8
Portugal 140 131 -9.3
Japan 145 136 -8.7
Greece 148 140 -8.1
Switzerland 132 126 -6.1
Croatia 123 118 -5.0
Countries in which the 10th percentile decreased less than the median
Canada 132 125 -7.5
Countries in which the achievement gap remained within +/- 5 score points
Denmark 120 116 -4.9
New Zealand 147 143 -4.6
Republic of Korea 123 119 -3.8
Netherlands 136 133 -3.1
Latvia 122 120 -1.8
Slovenia 124 123 -1.4
Hungary 131 131 -0.3
Australia 130 130 0.0
Israel 165 167 2.0
Spain 125 127 2.1
Iceland 136 138 2.4
Luxembourg 143 145 2.4
France 153 157 4.2
Slovakia 146 151 4.7
Countries in which the 10th percentile increased less than the median
Bulgaria 153 167 14.2
Countries in which the 10th percentile decreased more than the median
Sweden 134 147 13.0
Finland 109 131 21.7
EDUCATION Figure 9 Change in inequality in reading achievement
Figure 10 Percentage below proficiency level 2 in mathematics, reading and science
Source: PISA 2006 and 2012.Note: no trend data available for the United States.
Source: PISA 2012.Note: unweighted average for 34 OECD countries.
S E C T I O N 4 E D U C A T I O N
I N N O C E N T I R E P O R T C A R D 1 3 1 9
Box 2 A ‘sticky floor’ in poor children’s cognitive development: evidence from the UK’s Millennium Cohort Study
Per
cent
Poor Non-poor
0Bottom decile
2 3 4 5 6 7 8 9 Topdecile
10
20
30
40
50
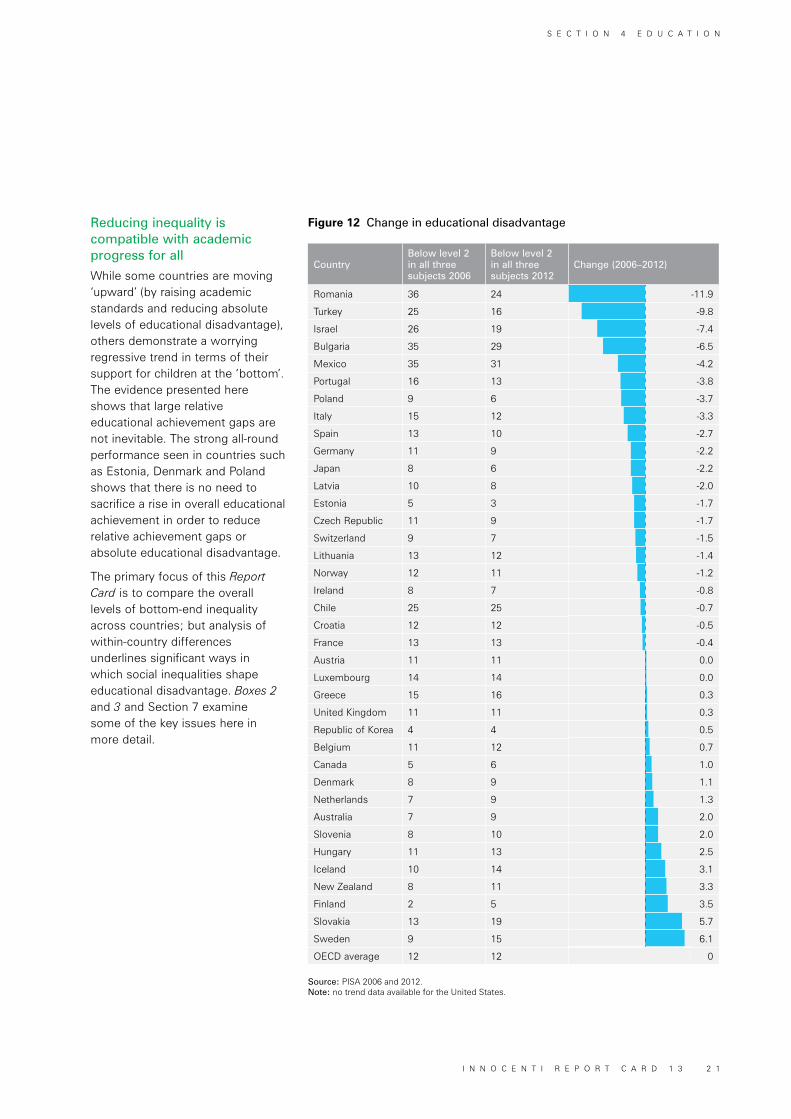
Figure 12 displays trends in absolute educational disadvantage between 2006 and 2012 for the 38 countries included in the PISA study. It shows:
» The largest reductions in cross-subject low performance were found in Bulgaria, Israel, Romania and Turkey. However, despite positive developments, these four countries remained among those with the highest overall levels of absolute educational disadvantage in 2012.
» Reductions in the share of children performing at below proficiency level 2 in all three subjects occurred in the Czech Republic, Germany, Latvia and Poland; this improvement resulted in them joining the top third of countries (those that performed best) in terms of absolute educational disadvantage in 2012.
» Absolute educational disadvantage remained broadly static between 2006 and 2012 in a number of other countries. Some countries with the highest proportions of children falling below proficiency level 2 in all three subjects, such as Chile, Greece and Luxembourg, struggled to reduce the proportion of low performers.
» Finland and Sweden saw a notable increase in the proportion of 15-year-olds who failed to achieve proficiency level 2 in all three subjects between 2006 and 2012, suggesting that there is a growing group of very disadvantaged children in these two countries.
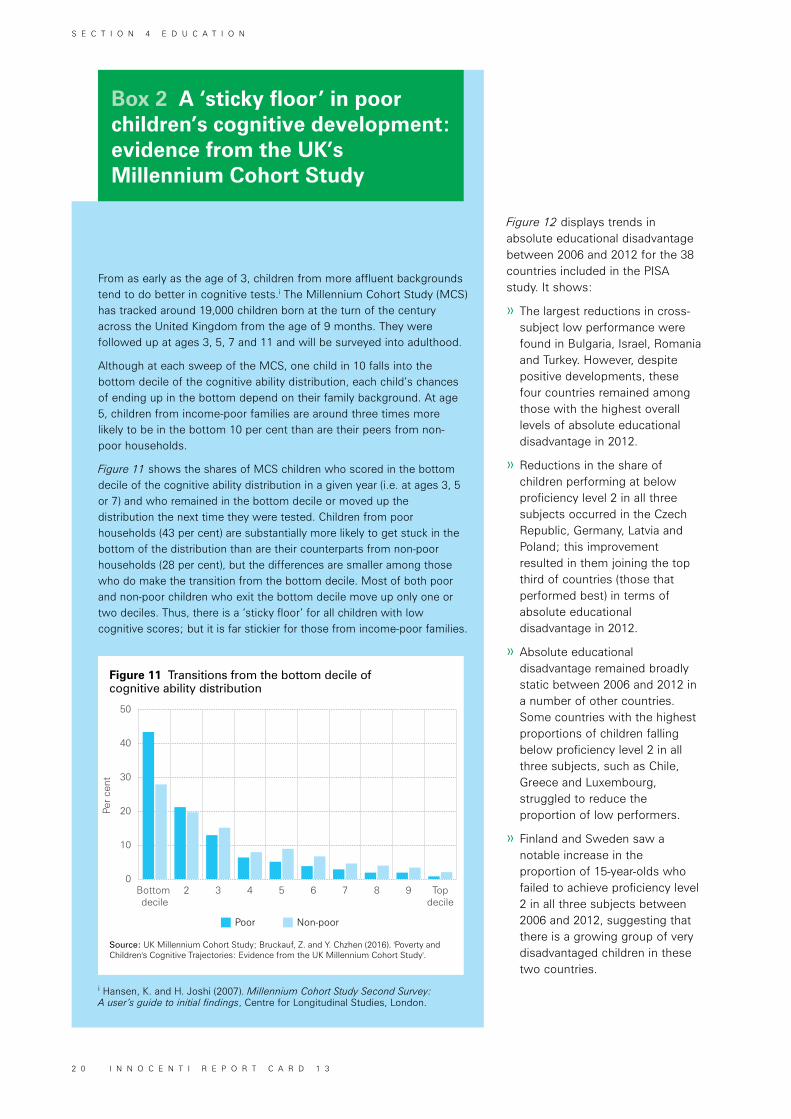
From as early as the age of 3, children from more affluent backgrounds tend to do better in cognitive tests.i The Millennium Cohort Study (MCS) has tracked around 19,000 children born at the turn of the century across the United Kingdom from the age of 9 months. They were followed up at ages 3, 5, 7 and 11 and will be surveyed into adulthood.
Although at each sweep of the MCS, one child in 10 falls into the bottom decile of the cognitive ability distribution, each child’s chances of ending up in the bottom depend on their family background. At age 5, children from income-poor families are around three times more likely to be in the bottom 10 per cent than are their peers from non-poor households.
Figure 11 shows the shares of MCS children who scored in the bottom decile of the cognitive ability distribution in a given year (i.e. at ages 3, 5 or 7) and who remained in the bottom decile or moved up the distribution the next time they were tested. Children from poor households (43 per cent) are substantially more likely to get stuck in the bottom of the distribution than are their counterparts from non-poor households (28 per cent), but the differences are smaller among those who do make the transition from the bottom decile. Most of both poor and non-poor children who exit the bottom decile move up only one or two deciles. Thus, there is a ‘sticky floor’ for all children with low cognitive scores; but it is far stickier for those from income-poor families.
i Hansen, K. and H. Joshi (2007). Millennium Cohort Study Second Survey: A user’s guide to initial findings, Centre for Longitudinal Studies, London.
Figure 11 Transitions from the bottom decile of cognitive ability distribution
Source: UK Millennium Cohort Study; Bruckauf, Z. and Y. Chzhen (2016). 'Poverty and Children's Cognitive Trajectories: Evidence from the UK Millennium Cohort Study'.
S E C T I O N 4 E D U C A T I O N
2 0 I N N O C E N T I R E P O R T C A R D 1 3
CountryBelow level 2 in all three subjects 2006
Below level 2 in all three subjects 2012
Change (2006–2012)
Romania 36 24 -11.9
Turkey 25 16 -9.8
Israel 26 19 -7.4
Bulgaria 35 29 -6.5
Mexico 35 31 -4.2
Portugal 16 13 -3.8
Poland 9 6 -3.7
Italy 15 12 -3.3
Spain 13 10 -2.7
Germany 11 9 -2.2
Japan 8 6 -2.2
Latvia 10 8 -2.0
Estonia 5 3 -1.7
Czech Republic 11 9 -1.7
Switzerland 9 7 -1.5
Lithuania 13 12 -1.4
Norway 12 11 -1.2
Ireland 8 7 -0.8
Chile 25 25 -0.7
Croatia 12 12 -0.5
France 13 13 -0.4
Austria 11 11 0.0
Luxembourg 14 14 0.0
Greece 15 16 0.3
United Kingdom 11 11 0.3
Republic of Korea 4 4 0.5
Belgium 11 12 0.7
Canada 5 6 1.0
Denmark 8 9 1.1
Netherlands 7 9 1.3
Australia 7 9 2.0
Slovenia 8 10 2.0
Hungary 11 13 2.5
Iceland 10 14 3.1
New Zealand 8 11 3.3
Finland 2 5 3.5
Slovakia 13 19 5.7
Sweden 9 15 6.1
OECD average 12 12 0
Figure 12 Change in educational disadvantage
Source: PISA 2006 and 2012. Note: no trend data available for the United States.
Reducing inequality is compatible with academic progress for all
While some countries are moving ‘upward’ (by raising academic standards and reducing absolute levels of educational disadvantage), others demonstrate a worrying regressive trend in terms of their support for children at the ‘bottom’. The evidence presented here shows that large relative educational achievement gaps are not inevitable. The strong all-round performance seen in countries such as Estonia, Denmark and Poland shows that there is no need to sacrifice a rise in overall educational achievement in order to reduce relative achievement gaps or absolute educational disadvantage.
The primary focus of this Report Card is to compare the overall levels of bottom-end inequality across countries; but analysis of within-country differences underlines significant ways in which social inequalities shape educational disadvantage. Boxes 2 and 3 and Section 7 examine some of the key issues here in more detail.
S E C T I O N 4 E D U C A T I O N
I N N O C E N T I R E P O R T C A R D 1 3 2 1
Box 3 Educational disadvantage through a gendered lens
Gender Gap Gender Gap – significant differencesBoys Girls
Latv
iaR
oman
iaIc
elan
dS
wed
enLi
thua
nia
Cro
atia
Gre
ece
Turk
eyIs
rael
Bul
garia
OE
CD
ave
rage
Uni
ted
Sta
tes
Nor
way
Por
tuga
lFr
ance
Slo
veni
aH
unga
ryIta
lyN
ew Z
eala
ndM
exic
oS
lova
kia
Chi
leFi
nlan
dP
olan
dC
zech
Rep
ublic
Bel
gium
Aus
tral
iaG
erm
any
Spa
inIre
land
Den
mar
kC
anad
aK
orea
Japa
nE
ston
iaS
witz
erla
ndA
ustr
iaN
ethe
rland
sU
nite
d K
ingd
omLu
xem
bour
g
Per
cent
age
poin
ts
10
15
20
25
30
35
40
0
5
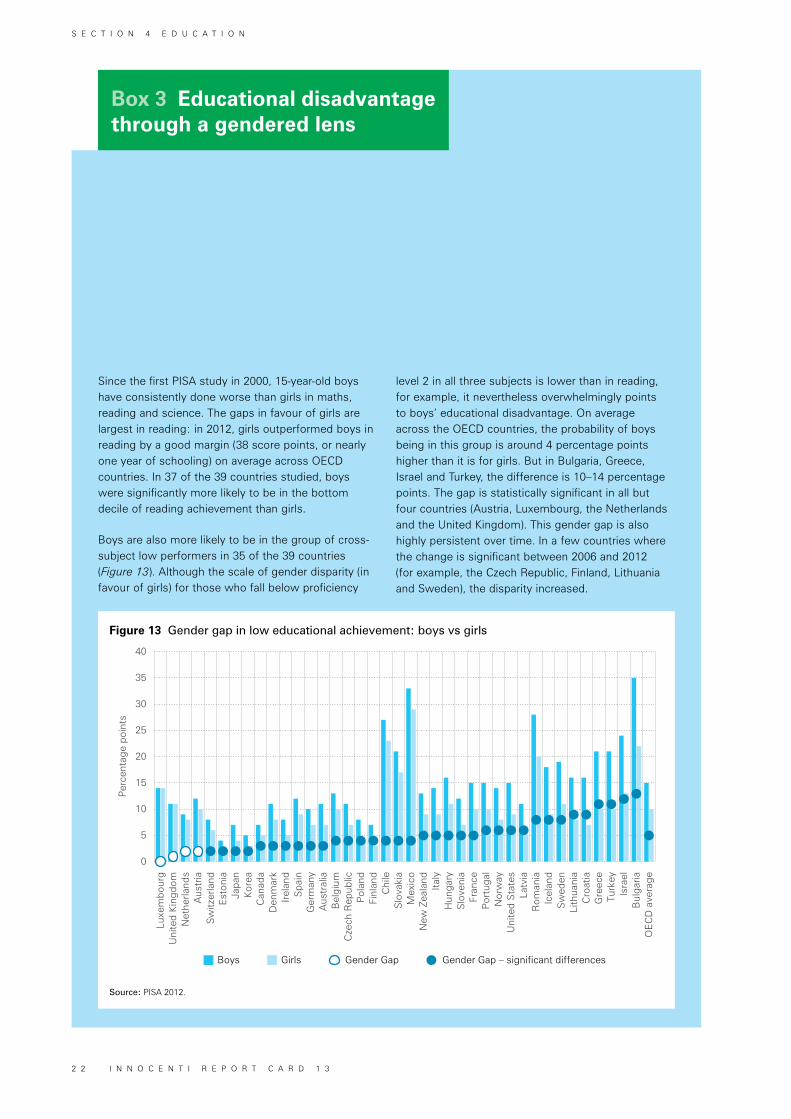
Since the first PISA study in 2000, 15-year-old boys have consistently done worse than girls in maths, reading and science. The gaps in favour of girls are largest in reading: in 2012, girls outperformed boys in reading by a good margin (38 score points, or nearly one year of schooling) on average across OECD countries. In 37 of the 39 countries studied, boys were significantly more likely to be in the bottom decile of reading achievement than girls.
Boys are also more likely to be in the group of cross-subject low performers in 35 of the 39 countries (Figure 13). Although the scale of gender disparity (in favour of girls) for those who fall below proficiency
Figure 13 Gender gap in low educational achievement: boys vs girls
Source: PISA 2012.
level 2 in all three subjects is lower than in reading, for example, it nevertheless overwhelmingly points to boys’ educational disadvantage. On average across the OECD countries, the probability of boys being in this group is around 4 percentage points higher than it is for girls. But in Bulgaria, Greece, Israel and Turkey, the difference is 10–14 percentage points. The gap is statistically significant in all but four countries (Austria, Luxembourg, the Netherlands and the United Kingdom). This gender gap is also highly persistent over time. In a few countries where the change is significant between 2006 and 2012 (for example, the Czech Republic, Finland, Lithuania and Sweden), the disparity increased.
S E C T I O N 4 E D U C A T I O N
2 2 I N N O C E N T I R E P O R T C A R D 1 3
Country Relative gap 2002
Relative gap 2014 Change (2002–2014)
Countries in which the relative gap remained stable (-/+ 2 ppt)
United States 29.2 28.0 -1.2
Estonia 28.8 27.7 -1.1
Spain 27.8 27.3 -0.5
Lithuania 29.2 29.3 0.1
Austria 23.2 23.6 0.4
Greece 26.2 27.4 1.2
Hungary 27.3 28.8 1.5
United Kingdom 27.3 28.9 1.6
Finland 24.0 25.9 1.9
Countries in which the middle improved more than the bottom
Romania 31.6 34.0 2.3
Sweden 26.2 29.1 2.8
Slovakia 25.5 29.0 3.5
Portugal 22.5 26.4 3.9
Israel 31.2 38.9 7.7
Countries in which the bottom declined more than the middle
Norway 23.1 25.2 2.0
Luxembourg 28.2 30.3 2.1
Bulgaria 27.2 29.4 2.2
Croatia 25.3 27.6 2.3
Belgium 25.7 28.1 2.5
Switzerland 22.4 25.0 2.5
Canada 26.6 29.3 2.7
Latvia 25.4 28.6 3.3
Iceland 27.7 31.1 3.4
Italy 26.4 30.1 3.7
Denmark 21.8 25.5 3.8
Czech Republic 22.8 26.8 4.0
Germany 20.5 24.8 4.3
Netherlands 22.2 26.7 4.6
France 24.4 29.2 4.8
Turkey 29.7 34.5 4.9
Slovenia 22.2 28.3 6.1
Ireland 22.5 28.9 6.4
Malta 24.0 30.6 6.6
Poland 26.3 34.1 7.8
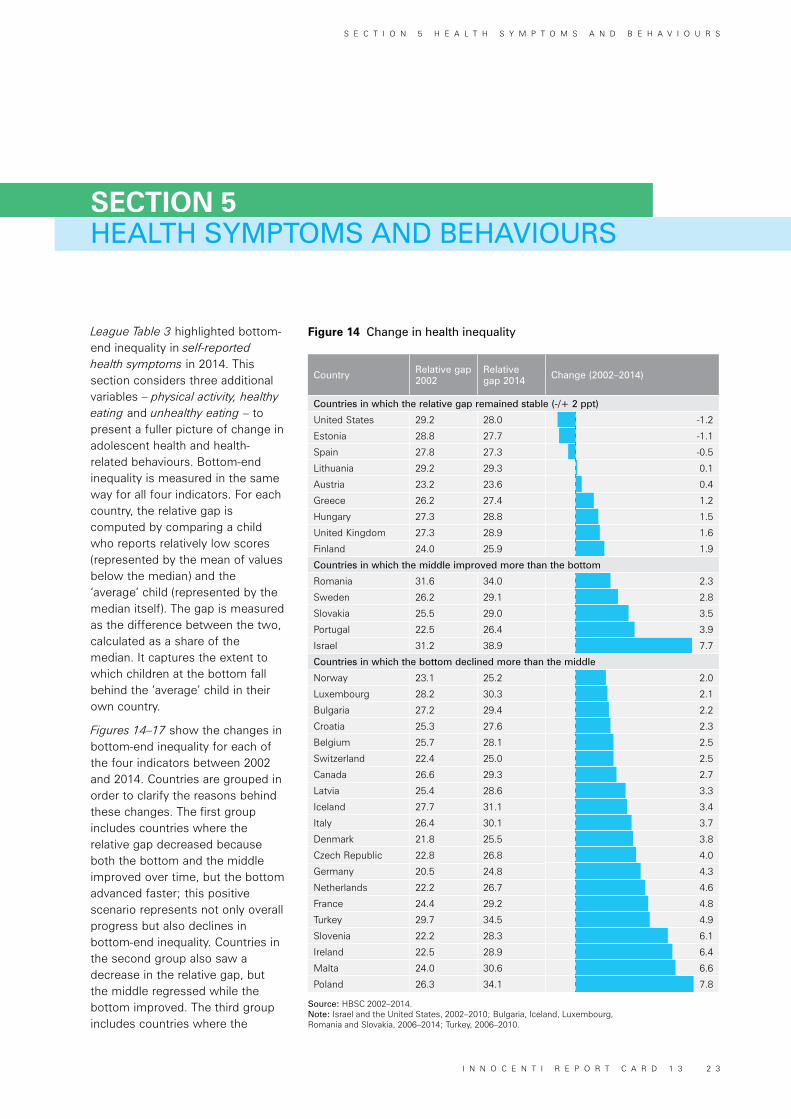
League Table 3 highlighted bottom-end inequality in self-reported health symptoms in 2014. This section considers three additional variables – physical activity, healthy eating and unhealthy eating – to present a fuller picture of change in adolescent health and health-related behaviours. Bottom-end inequality is measured in the same way for all four indicators. For each country, the relative gap is computed by comparing a child who reports relatively low scores (represented by the mean of values below the median) and the ‘average’ child (represented by the median itself). The gap is measured as the difference between the two, calculated as a share of the median. It captures the extent to which children at the bottom fall behind the ‘average’ child in their own country.
Figures 14–17 show the changes in bottom-end inequality for each of the four indicators between 2002 and 2014. Countries are grouped in order to clarify the reasons behind these changes. The first group includes countries where the relative gap decreased because both the bottom and the middle improved over time, but the bottom advanced faster; this positive scenario represents not only overall progress but also declines in bottom-end inequality. Countries in the second group also saw a decrease in the relative gap, but the middle regressed while the bottom improved. The third group includes countries where the
HEALTH SYMPTOMS AND BEHAVIOURSSECTION 5
Figure 14 Change in health inequality
Source: HBSC 2002–2014. Note: Israel and the United States, 2002–2010; Bulgaria, Iceland, Luxembourg, Romania and Slovakia, 2006–2014; Turkey, 2006–2010.
S E C T I O N 5 H E A L T H S Y M P T O M S A N D B E H A V I O U R S
I N N O C E N T I R E P O R T C A R D 1 3 2 3
Country Relative gap 2002
Relative gap 2014 Change (2002–2014)
Countries in which the bottom improved more than the middle
Malta 64.6 55.6 -9.0
Finland 51.0 42.5 -8.5
Norway 55.7 47.6 -8.1
France 58.3 50.3 -8.0
Spain 51.4 45.1 -6.3
Bulgaria 56.9 51.1 -5.8
Estonia 52.8 47.8 -5.0
Portugal 51.0 46.9 -4.1
Ireland 49.8 46.1 -3.7
Switzerland 48.7 45.3 -3.4
Croatia 50.1 46.8 -3.3
Czech Republic 49.3 46.2 -3.1
Latvia 49.6 46.5 -3.1
Iceland 50.3 47.7 -2.6
Belgium 51.5 49.2 -2.3
United States 54.3 52.1 -2.2
Hungary 54.4 52.3 -2.1
Netherlands 49.4 47.5 -2.0
Countries in which the relative gap remained stable (-/+ 2 ppt)
Slovakia 49.6 47.7 -1.9
Denmark 51.8 50.3 -1.5
Luxembourg 49.4 48.2 -1.2
Canada 47.9 46.9 -1.0
United Kingdom 47.7 47.3 -0.4
Austria 47.3 47.0 -0.4
Lithuania 48.1 47.9 -0.2
Slovenia 47.7 48.2 0.5
Sweden 47.9 48.6 0.7
Greece 50.3 51.2 0.9
Germany 46.8 47.7 0.9
Israel 61.8 62.9 1.1
Countries in which the middle improved more than the bottom
Poland 45.6 48.5 2.9
Romania 55.9 58.8 2.9
Countries in which the bottom declined more than the middle
Italy 54.2 56.8 2.6
Turkey 55.5 60.9 5.3
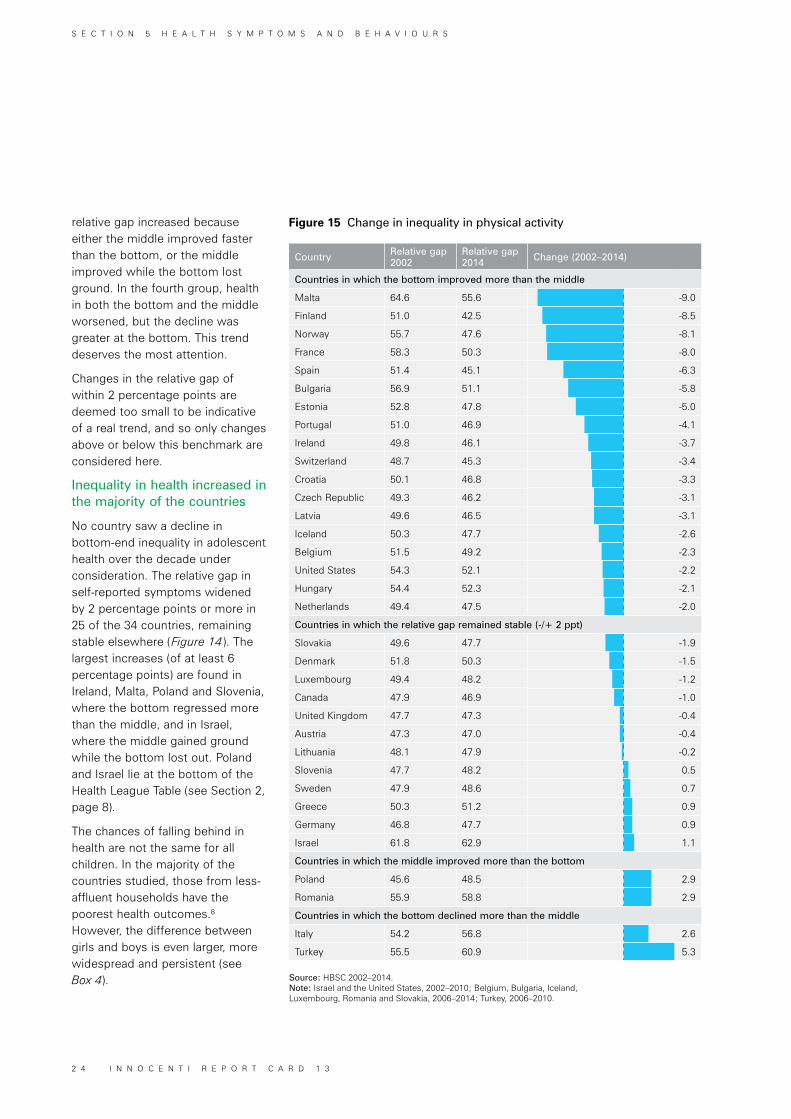
relative gap increased because either the middle improved faster than the bottom, or the middle improved while the bottom lost ground. In the fourth group, health in both the bottom and the middle worsened, but the decline was greater at the bottom. This trend deserves the most attention.
Changes in the relative gap of within 2 percentage points are deemed too small to be indicative of a real trend, and so only changes above or below this benchmark are considered here.
Inequality in health increased in the majority of the countries
No country saw a decline in bottom-end inequality in adolescent health over the decade under consideration. The relative gap in self-reported symptoms widened by 2 percentage points or more in 25 of the 34 countries, remaining stable elsewhere (Figure 14). The largest increases (of at least 6 percentage points) are found in Ireland, Malta, Poland and Slovenia, where the bottom regressed more than the middle, and in Israel, where the middle gained ground while the bottom lost out. Poland and Israel lie at the bottom of the Health League Table (see Section 2, page 8).
The chances of falling behind in health are not the same for all children. In the majority of the countries studied, those from less-affluent households have the poorest health outcomes.8 However, the difference between girls and boys is even larger, more widespread and persistent (see Box 4).
Figure 15 Change in inequality in physical activity
Source: HBSC 2002–2014.Note: Israel and the United States, 2002–2010; Belgium, Bulgaria, Iceland, Luxembourg, Romania and Slovakia, 2006–2014; Turkey, 2006–2010.
S E C T I O N 5 H E A L T H S Y M P T O M S A N D B E H A V I O U R S
2 4 I N N O C E N T I R E P O R T C A R D 1 3
Country Relative gap 2002
Relative gap 2014 Change (2002–2014)
Countries in which the bottom improved more than the middle
Malta 52.9 40.3 -12.6
Hungary 58.8 50.5 -8.3
Denmark 49.8 42.2 -7.6
Norway 51.2 44.0 -7.2
Spain 53.8 47.4 -6.3
Sweden 51.2 45.5 -5.7
Greece 49.8 45.0 -4.8
Italy 51.8 48.0 -3.8
Estonia 49.9 46.4 -3.5
Bulgaria 47.6 44.6 -3.0
United States 52.1 49.6 -2.5
Lithuania 47.4 45.4 -2.1
Countries in which the relative gap remained stable (-/+ 2 ppt)
Iceland 49.6 47.9 -1.8
Germany 50.3 48.6 -1.7
Latvia 47.6 46.0 -1.6
Ireland 48.2 46.7 -1.5
Switzerland 45.7 44.6 -1.0
Slovenia 45.4 44.4 -1.0
United Kingdom 50.1 49.6 -0.5
Turkey 43.9 43.4 -0.5
Austria 47.4 47.2 -0.2
Canada 42.8 43.0 0.2
Romania 45.2 45.5 0.3
Netherlands 35.0 35.4 0.3
Slovakia 45.6 46.3 0.7
Israel 49.2 50.3 1.1
Belgium 40.7 41.9 1.2
Luxembourg 47.1 48.7 1.5
Countries in which the middle improved more than the bottom
Finland 42.7 48.6 6.0
Countries in which the bottom declined more than the middle
Czech Republic 43.8 45.9 2.1
France 44.4 47.2 2.8
Poland 43.2 46.4 3.2
Croatia 43.9 48.4 4.4
Portugal 41.6 48.2 6.6
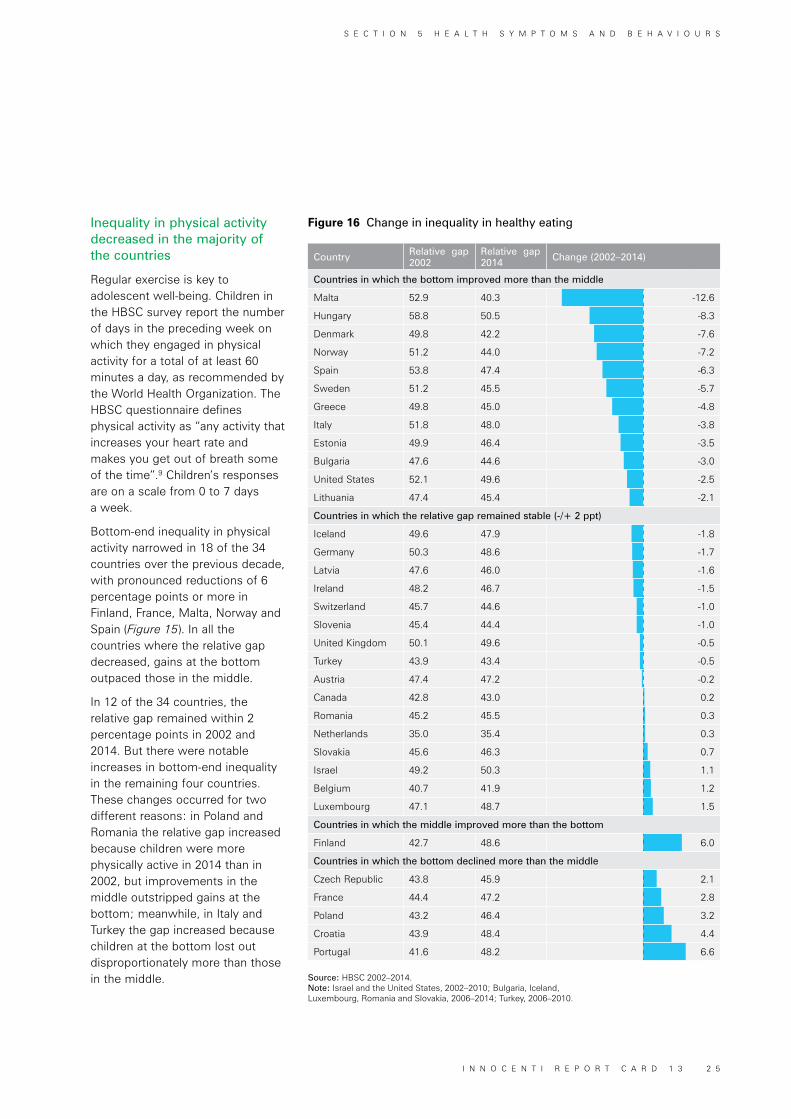
Inequality in physical activity decreased in the majority of the countries
Regular exercise is key to adolescent well-being. Children in the HBSC survey report the number of days in the preceding week on which they engaged in physical activity for a total of at least 60 minutes a day, as recommended by the World Health Organization. The HBSC questionnaire defines physical activity as “any activity that increases your heart rate and makes you get out of breath some of the time”.9 Children’s responses are on a scale from 0 to 7 days a week.
Bottom-end inequality in physical activity narrowed in 18 of the 34 countries over the previous decade, with pronounced reductions of 6 percentage points or more in Finland, France, Malta, Norway and Spain (Figure 15). In all the countries where the relative gap decreased, gains at the bottom outpaced those in the middle.
In 12 of the 34 countries, the relative gap remained within 2 percentage points in 2002 and 2014. But there were notable increases in bottom-end inequality in the remaining four countries. These changes occurred for two different reasons: in Poland and Romania the relative gap increased because children were more physically active in 2014 than in 2002, but improvements in the middle outstripped gains at the bottom; meanwhile, in Italy and Turkey the gap increased because children at the bottom lost out disproportionately more than those in the middle.
Figure 16 Change in inequality in healthy eating
Source: HBSC 2002–2014. Note: Israel and the United States, 2002–2010; Bulgaria, Iceland, Luxembourg, Romania and Slovakia, 2006–2014; Turkey, 2006–2010.
S E C T I O N 5 H E A L T H S Y M P T O M S A N D B E H A V I O U R S
I N N O C E N T I R E P O R T C A R D 1 3 2 5
Country Relative gap 2002
Relative gap 2014 Change (2002–2014)
Countries in which the bottom improved more than the middle
Netherlands 89.1 69.4 -19.7
Slovenia 73.2 53.8 -19.4
Iceland 61.9 44.5 -17.4
Norway 71.1 57.8 -13.3
Greece 66.0 52.7 -13.3
Bulgaria 89.5 77.8 -11.7
Israel 90.3 79.8 -10.4
Spain 75.0 64.6 -10.4
Italy 77.1 66.7 -10.4
Canada 68.1 57.8 -10.4
Ireland 76.0 66.5 -9.5
Germany 77.0 67.8 -9.2
Luxembourg 74.7 66.4 -8.3
Malta 77.7 69.7 -8.0
Portugal 73.5 66.1 -7.4
Finland 61.8 55.9 -5.9
Czech Republic 70.6 66.2 -4.4
Denmark 64.3 60.0 -4.3
United States 76.9 72.6 -4.3
United Kingdom 72.5 68.2 -4.3
Latvia 67.7 63.7 -4.1
Croatia 74.2 70.5 -3.6
Austria 69.2 65.7 -3.5
Sweden 60.9 58.5 -2.5
France 74.9 72.5 -2.3
Countries in which the relative gap remained stable (-/+ 2 ppt)
Hungary 80.8 79.1 -1.7
Switzerland 75.0 73.6 -1.4
Poland 74.0 73.0 -1.0
Estonia 63.9 63.3 -0.6
Lithuania 63.5 65.4 1.9
Countries in which the middle improved more than the bottom
Romania 75.2 78.4 3.2
Slovakia 70.9 75.2 4.3
Belgium 71.2 76.3 5.1
Countries in which the bottom declined more than the middle
Turkey 68.7 76.9 8.2
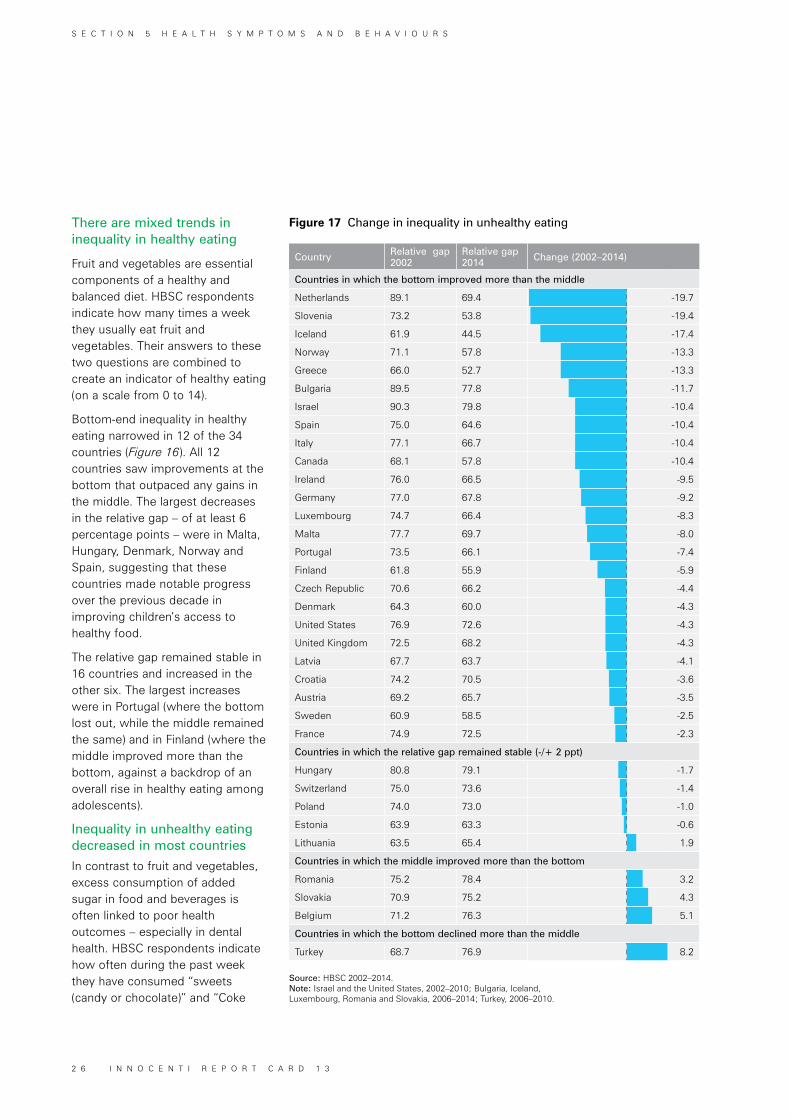
There are mixed trends in inequality in healthy eating
Fruit and vegetables are essential components of a healthy and balanced diet. HBSC respondents indicate how many times a week they usually eat fruit and vegetables. Their answers to these two questions are combined to create an indicator of healthy eating (on a scale from 0 to 14).
Bottom-end inequality in healthy eating narrowed in 12 of the 34 countries (Figure 16). All 12 countries saw improvements at the bottom that outpaced any gains in the middle. The largest decreases in the relative gap – of at least 6 percentage points – were in Malta, Hungary, Denmark, Norway and Spain, suggesting that these countries made notable progress over the previous decade in improving children’s access to healthy food.
The relative gap remained stable in 16 countries and increased in the other six. The largest increases were in Portugal (where the bottom lost out, while the middle remained the same) and in Finland (where the middle improved more than the bottom, against a backdrop of an overall rise in healthy eating among adolescents).
Inequality in unhealthy eating decreased in most countries
In contrast to fruit and vegetables, excess consumption of added sugar in food and beverages is often linked to poor health outcomes – especially in dental health. HBSC respondents indicate how often during the past week they have consumed “sweets (candy or chocolate)” and “Coke
Figure 17 Change in inequality in unhealthy eating
Source: HBSC 2002–2014. Note: Israel and the United States, 2002–2010; Bulgaria, Iceland, Luxembourg, Romania and Slovakia, 2006–2014; Turkey, 2006–2010.
S E C T I O N 5 H E A L T H S Y M P T O M S A N D B E H A V I O U R S
2 6 I N N O C E N T I R E P O R T C A R D 1 3
Box 4 Adolescent girls persistently more likely to fall behind in health
0
2
4
6
8
10
12
14
16
18
20
Luxe
mbo
urg
Gre
ece
Den
mar
kS
wed
enIta
ly
Slo
veni
aC
anad
aN
ethe
rland
sIre
land
Uni
ted
Kin
gdom
Sw
itzer
land
Cze
ch R
epub
licC
roat
iaE
ston
iaR
oman
iaLa
tvia
Ger
man
yN
orw
ayFr
ance
Lith
uani
aPo
rtug
alS
pain
Bul
garia
Hun
gary
Uni
ted
Sta
tes
Finl
and
Pola
ndIc
elan
dA
ustr
iaM
alta
Bel
gium
Slo
vaki
aTu
rkey
Isra
el
Perc
enta
ge p
oint
s
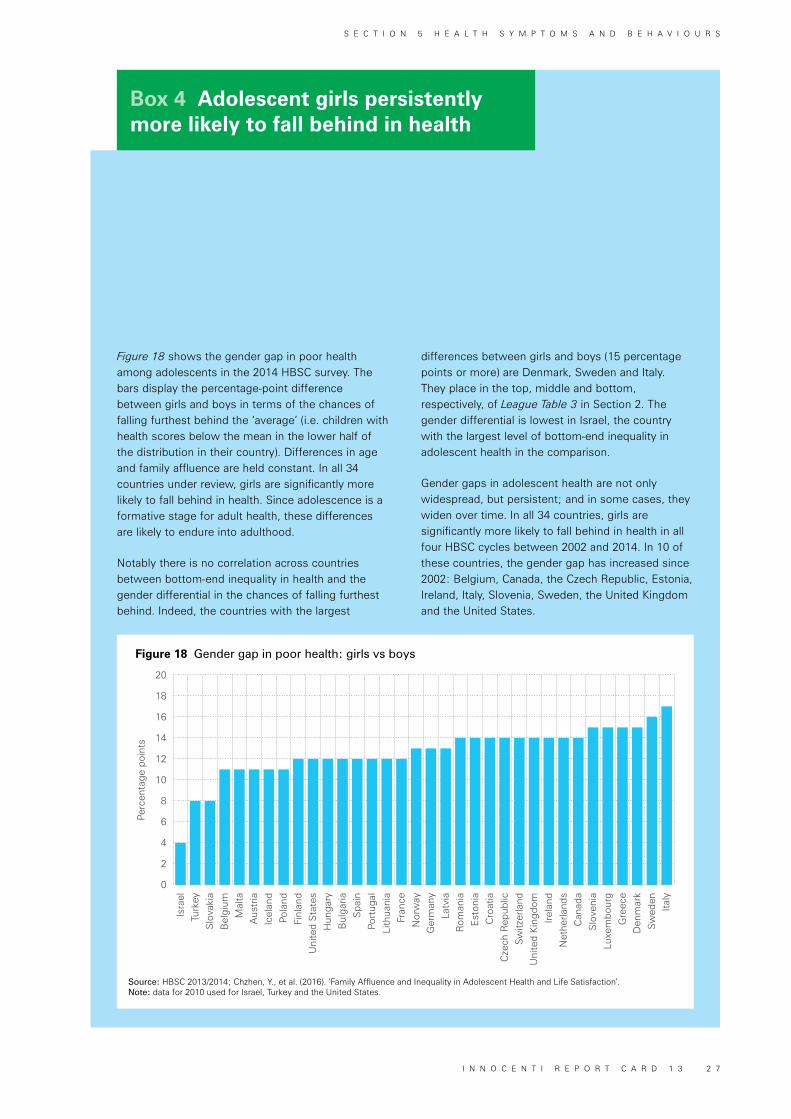
Figure 18 shows the gender gap in poor health among adolescents in the 2014 HBSC survey. The bars display the percentage-point difference between girls and boys in terms of the chances of falling furthest behind the ‘average’ (i.e. children with health scores below the mean in the lower half of the distribution in their country). Differences in age and family affluence are held constant. In all 34 countries under review, girls are significantly more likely to fall behind in health. Since adolescence is a formative stage for adult health, these differences are likely to endure into adulthood.
Notably there is no correlation across countries between bottom-end inequality in health and the gender differential in the chances of falling furthest behind. Indeed, the countries with the largest
Figure 18 Gender gap in poor health: girls vs boys
Source: HBSC 2013/2014; Chzhen, Y., et al. (2016). ‘Family Affluence and Inequality in Adolescent Health and Life Satisfaction’.Note: data for 2010 used for Israel, Turkey and the United States.
differences between girls and boys (15 percentage points or more) are Denmark, Sweden and Italy. They place in the top, middle and bottom, respectively, of League Table 3 in Section 2. The gender differential is lowest in Israel, the country with the largest level of bottom-end inequality in adolescent health in the comparison.
Gender gaps in adolescent health are not only widespread, but persistent; and in some cases, they widen over time. In all 34 countries, girls are significantly more likely to fall behind in health in all four HBSC cycles between 2002 and 2014. In 10 of these countries, the gender gap has increased since 2002: Belgium, Canada, the Czech Republic, Estonia, Ireland, Italy, Slovenia, Sweden, the United Kingdom and the United States.
S E C T I O N 5 H E A L T H S Y M P T O M S A N D B E H A V I O U R S
I N N O C E N T I R E P O R T C A R D 1 3 2 7
or other soft drinks that contain sugar”. Their responses are converted into an indicator of unhealthy eating (on a scale from 0 to 14), with higher values corresponding to less-frequent consumption of added sugar.
The vast majority of countries, 25 out of 34, had reduced bottom-end inequality in unhealthy eating by at least 2 percentage points over the previous decade (Figure 17). In all cases, this came about because the bottom improved faster than the middle – a veritable ‘win-win’ scenario. The Netherlands, Slovenia and Iceland saw considerable reductions in the relative gap of over 17 percentage points. A sizeable improvement of 19 percentage points places Slovenia alongside Greece and Iceland as one of the best-performing countries in bottom-end inequality in terms of (abstinence from) unhealthy eating.
The relative gap in unhealthy eating decreased in more countries – and by a greater margin – than in any other health-related indicator in this section, albeit from a higher base. This indicates that today’s adolescents consume less sugar than their counterparts did at the turn of the century, while even those who eat less healthily than their peers no longer fall so far behind.
Nevertheless, bottom-end inequality in unhealthy eating tended to exceed that in the other three indicators in 2014, and there were four countries – Belgium, Romania, Slovakia and Turkey – where the
the influence of such factors is quite difficult to detect in cross-national analyses.
The complexity of the processes driving bottom-end inequality in health is underlined by the fact that the vast majority of countries examined here have seen inequality in health-related outcomes widen in some of the four areas considered here, yet narrow in others. Indeed, Spain and the United States are the only countries that have reduced inequality among adolescents across all four measures. A similar picture exists in terms of country rankings in 2014, with most countries placing in the top half for some measures and in the bottom half for others. This is true even for some of the best overall performers: the Netherlands shows relatively large bottom-end inequality in unhealthy eating, Finland in healthy eating, and Denmark in physical activity.12
What we do know is that, based on data from the HBSC survey for 2013/2014, average levels of self-reported health, physical activity, healthy and unhealthy eating vary with the relative health inequality gaps for each of these outcomes. The country-level averages for all these measures are highly correlated with the respective relative gaps in health-related outcomes studied here.13
More precisely: children are more likely to report more frequent health symptoms and to have lower average physical activity, lower
relative gap in unhealthy eating had increased by 2 percentage points or more since 2002. The sizeable increase of 8 percentage points in the relative gap in Turkey is due to worsening outcomes overall, and especially at the bottom. By contrast, inequality widened in the other three countries because, in spite of an overall reduction in the prevalence of unhealthy diets, outcomes at the bottom improved more slowly than in the middle.
Reductions in inequality in healthy and unhealthy eating can go hand in hand. Ten out of the 12 countries that showed progress in reducing bottom-end inequality in the consumption of fruit and vegetables also reduced bottom-end inequality in the consumption of added sugars. The relative gap in unhealthy eating remained stable in the other two countries, Hungary and Lithuania. Norway and Spain stand out in particular, achieving large reductions in bottom-end inequality of 6 percentage points or more in both diet-related indicators.
Explaining trends in bottom-end inequality
Growing up in unequal, harsh social environments may pose a barrier for children to a healthy, happy and productive life.10 Although there are no clear relationships between income inequality and the health-related indicators in this section, income inequality can have a lagged effect on health and well-being in adolescence.11 Cultural factors may also be important, but
S E C T I O N 5 H E A L T H S Y M P T O M S A N D B E H A V I O U R S
2 8 I N N O C E N T I R E P O R T C A R D 1 3
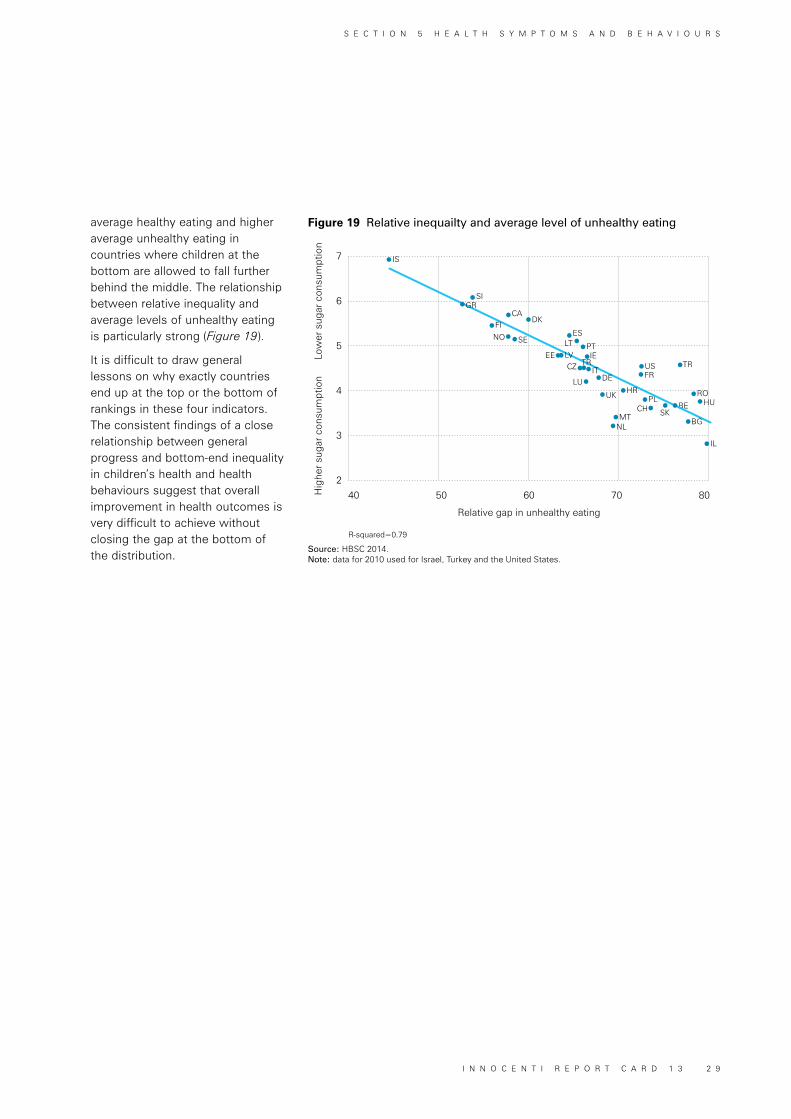
Hig
her
suga
r co
nsum
ptio
nLo
wer
sug
ar c
onsu
mpt
ion
Relative gap in unhealthy eating
R-squared=0.79
40 50 60 70 80
2
3
4
5
6
7
NLMT
PLCH SK
BE
IL
HURO
TRFRUS
UK
LU
CZIEEE
PTLTES
DK
SENO
CA
SI
IS
DEIT
LV
FI
GR
HR
BG
TR
Figure 19 Relative inequailty and average level of unhealthy eating
Source: HBSC 2014.Note: data for 2010 used for Israel, Turkey and the United States.
average healthy eating and higher average unhealthy eating in countries where children at the bottom are allowed to fall further behind the middle. The relationship between relative inequality and average levels of unhealthy eating is particularly strong (Figure 19).
It is difficult to draw general lessons on why exactly countries end up at the top or the bottom of rankings in these four indicators. The consistent findings of a close relationship between general progress and bottom-end inequality in children’s health and health behaviours suggest that overall improvement in health outcomes is very difficult to achieve without closing the gap at the bottom of the distribution.
S E C T I O N 5 H E A L T H S Y M P T O M S A N D B E H A V I O U R S
I N N O C E N T I R E P O R T C A R D 1 3 2 9
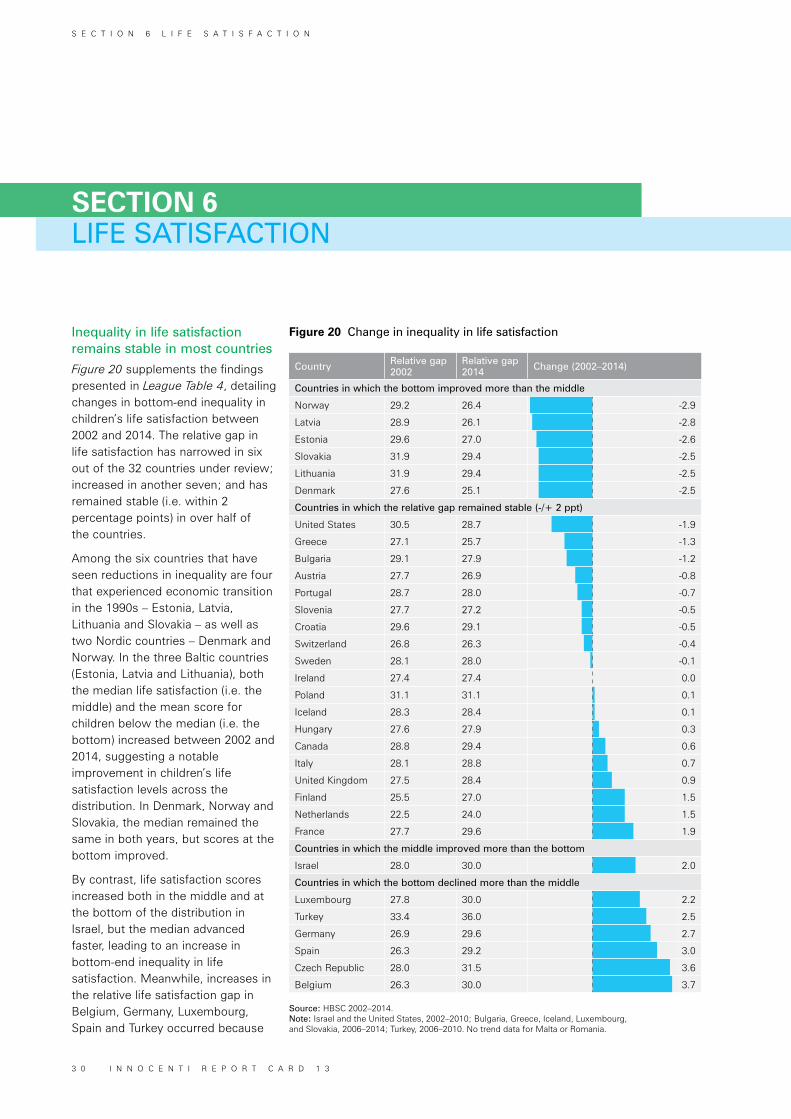
Inequality in life satisfaction remains stable in most countries
Figure 20 supplements the findings presented in League Table 4, detailing changes in bottom-end inequality in children’s life satisfaction between 2002 and 2014. The relative gap in life satisfaction has narrowed in six out of the 32 countries under review; increased in another seven; and has remained stable (i.e. within 2 percentage points) in over half of the countries.
Among the six countries that have seen reductions in inequality are four that experienced economic transition in the 1990s – Estonia, Latvia, Lithuania and Slovakia – as well as two Nordic countries – Denmark and Norway. In the three Baltic countries (Estonia, Latvia and Lithuania), both the median life satisfaction (i.e. the middle) and the mean score for children below the median (i.e. the bottom) increased between 2002 and 2014, suggesting a notable improvement in children’s life satisfaction levels across the distribution. In Denmark, Norway and Slovakia, the median remained the same in both years, but scores at the bottom improved.
By contrast, life satisfaction scores increased both in the middle and at the bottom of the distribution in Israel, but the median advanced faster, leading to an increase in bottom-end inequality in life satisfaction. Meanwhile, increases in the relative life satisfaction gap in Belgium, Germany, Luxembourg, Spain and Turkey occurred because
LIFE SATISFACTION SECTION 6
Source: HBSC 2002–2014.Note: Israel and the United States, 2002–2010; Bulgaria, Greece, Iceland, Luxembourg, and Slovakia, 2006–2014; Turkey, 2006–2010. No trend data for Malta or Romania.
Figure 20 Change in inequality in life satisfaction
Country Relative gap 2002
Relative gap 2014 Change (2002–2014)
Countries in which the bottom improved more than the middle
Norway 29.2 26.4 -2.9
Latvia 28.9 26.1 -2.8
Estonia 29.6 27.0 -2.6
Slovakia 31.9 29.4 -2.5
Lithuania 31.9 29.4 -2.5
Denmark 27.6 25.1 -2.5
Countries in which the relative gap remained stable (-/+ 2 ppt)
United States 30.5 28.7 -1.9
Greece 27.1 25.7 -1.3
Bulgaria 29.1 27.9 -1.2
Austria 27.7 26.9 -0.8
Portugal 28.7 28.0 -0.7
Slovenia 27.7 27.2 -0.5
Croatia 29.6 29.1 -0.5
Switzerland 26.8 26.3 -0.4
Sweden 28.1 28.0 -0.1
Ireland 27.4 27.4 0.0
Poland 31.1 31.1 0.1
Iceland 28.3 28.4 0.1
Hungary 27.6 27.9 0.3
Canada 28.8 29.4 0.6
Italy 28.1 28.8 0.7
United Kingdom 27.5 28.4 0.9
Finland 25.5 27.0 1.5
Netherlands 22.5 24.0 1.5
France 27.7 29.6 1.9
Countries in which the middle improved more than the bottom
Israel 28.0 30.0 2.0
Countries in which the bottom declined more than the middle
Luxembourg 27.8 30.0 2.2
Turkey 33.4 36.0 2.5
Germany 26.9 29.6 2.7
Spain 26.3 29.2 3.0
Czech Republic 28.0 31.5 3.6
Belgium 26.3 30.0 3.7
S E C T I O N 6 L I F E S A T I S F A C T I O N
3 0 I N N O C E N T I R E P O R T C A R D 1 3
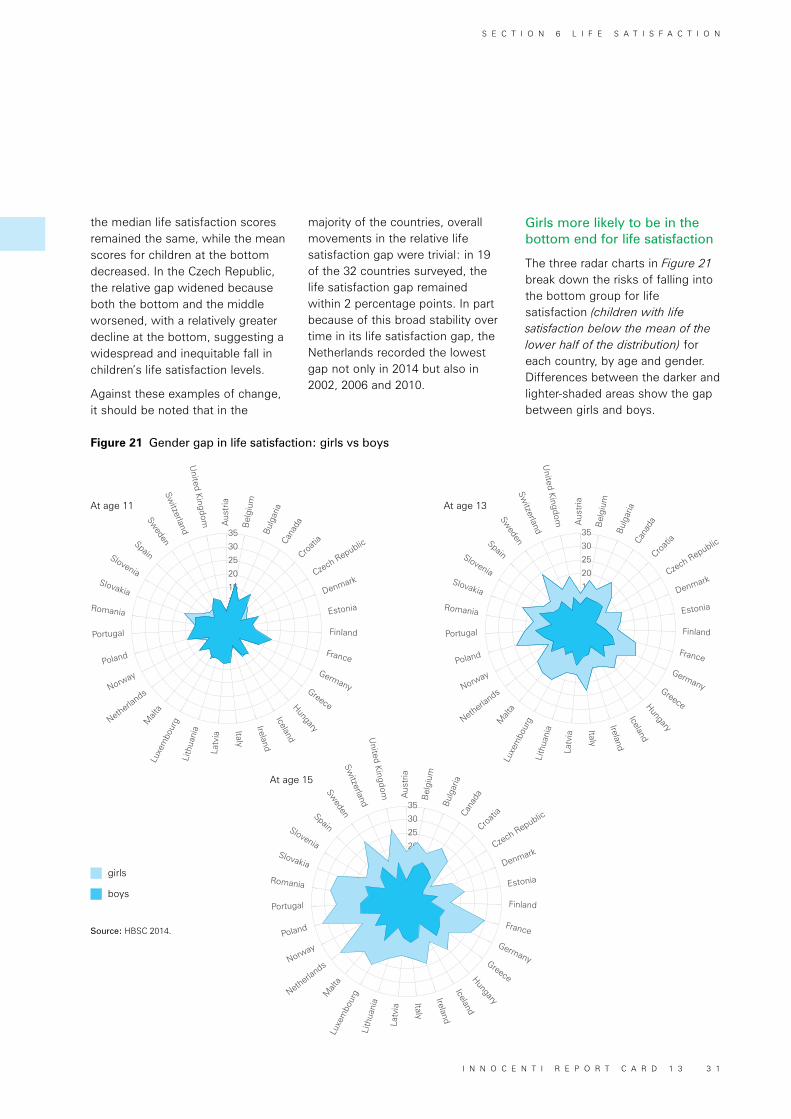
5
10
15
20
25
30
35
5
10
15
20
25
30
35
Finland
Aus
tria
Latv
ia
Romania Estonia
Italy
Portugal
Denmark
United Kingdom
Ireland
Poland
Czech Republic
Switzerland
Iceland
Norway
Croati
a
Sweden
Hungary
Netherlands
Cana
da
Spain
Greece
Malt
a
Bul
garia
Slovenia
Germany
Luxe
mbo
urg
Bel
gium
Slovakia
France
Lith
uani
a
Finland
Aus
tria
Latv
ia
Romania Estonia
Italy
Portugal
Denmark
United Kingdom
Ireland
Poland
Czech Republic
Switzerland
Iceland
Norway
Croati
a
Sweden
Hungary
Netherlands
Cana
da
Spain
Greece
Malt
a
Bul
garia
Slovenia
Germany
Luxe
mbo
urg
Bel
gium
Slovakia
France
Lith
uani
a
Finland
Aus
tria
Latv
ia
Romania Estonia
Italy
Portugal
Denmark
United Kingdom
Ireland
Poland
Czech Republic
Switzerland
Iceland
Norway
Croati
a
Sweden
Hungary
Netherlands
Cana
da
Spain
Greece
Malt
a
Bul
garia
Slovenia
Germany
Luxe
mbo
urg
Bel
gium
Slovakia
France
Lith
uani
a
5
10
15
20
25
30
355
10
15
20
25
30
35
5
10
15
20
25
30
35
Finland
Aus
tria
Latv
ia
Romania Estonia
Italy
Portugal
Denmark
United Kingdom
Ireland
Poland
Czech RepublicSw
itzerland
Iceland
Norway
Croati
a
Sweden
Hungary
Netherlands
Cana
da
Spain
Greece
Malt
a
Bul
garia
Slovenia
Germany
Luxe
mbo
urg
Bel
gium
Slovakia
France
Lith
uani
a
Finland
Aus
tria
Latv
ia
Romania Estonia
Italy
Portugal
Denmark
United Kingdom
Ireland
Poland
Czech Republic
Switzerland
Iceland
Norway
Croati
a
Sweden
Hungary
Netherlands
Cana
da
Spain
Greece
Malt
a
Bul
garia
Slovenia
Germany
Luxe
mbo
urg
Bel
gium
Slovakia
France
Lith
uani
a
Finland
Aus
tria
Latv
ia
Romania Estonia
Italy
Portugal
Denmark
United Kingdom
Ireland
Poland
Czech Republic
Switzerland
Iceland
Norway
Croati
a
Sweden
Hungary
Netherlands
Cana
da
Spain
Greece
Malt
a
Bul
garia
Slovenia
Germany
Luxe
mbo
urg
Bel
gium
Slovakia
France
Lith
uani
a
5
10
15
20
25
30
35
5
10
15
20
25
30
35
5
10
15
20
25
30
35
Finland
Aus
tria
Latv
ia
Romania Estonia
Italy
Portugal
Denmark
United Kingdom
Ireland
Poland
Czech Republic
Switzerland
Iceland
Norway
Croati
a
Sweden
Hungary
Netherlands
Cana
da
Spain
Greece
Malt
a
Bul
garia
Slovenia
Germany
Luxe
mbo
urg
Bel
gium
Slovakia
France
Lith
uani
a
Finland
Aus
tria
Latv
ia
Romania Estonia
Italy
Portugal
Denmark
United Kingdom
Ireland
Poland
Czech Republic
Switzerland
Iceland
Norway
Croati
a
Sweden
Hungary
Netherlands
Cana
da
Spain
Greece
Malt
a
Bul
garia
Slovenia
Germany
Luxe
mbo
urg
Bel
gium
Slovakia
France
Lith
uani
a
Finland
Aus
tria
Latv
ia
Romania Estonia
Italy
Portugal
Denmark
United Kingdom
Ireland
Poland
Czech Republic
Switzerland
Iceland
Norway
Croati
a
Sweden
Hungary
Netherlands
Cana
da
Spain
Greece
Malt
a
Bul
garia
Slovenia
Germany
Luxe
mbo
urg
Bel
gium
Slovakia
France
Lith
uani
a
5
10
15
20
25
30
35
girls
boys
LIFE SATISFACTION
Figure 21 Gender gap in life satisfaction: girls vs boys
Source: HBSC 2014.
the median life satisfaction scores remained the same, while the mean scores for children at the bottom decreased. In the Czech Republic, the relative gap widened because both the bottom and the middle worsened, with a relatively greater decline at the bottom, suggesting a widespread and inequitable fall in children’s life satisfaction levels.
Against these examples of change, it should be noted that in the
majority of the countries, overall movements in the relative life satisfaction gap were trivial: in 19 of the 32 countries surveyed, the life satisfaction gap remained within 2 percentage points. In part because of this broad stability over time in its life satisfaction gap, the Netherlands recorded the lowest gap not only in 2014 but also in 2002, 2006 and 2010.
Girls more likely to be in the bottom end for life satisfaction
The three radar charts in Figure 21 break down the risks of falling into the bottom group for life satisfaction (children with life satisfaction below the mean of the lower half of the distribution) for each country, by age and gender. Differences between the darker and lighter-shaded areas show the gap between girls and boys.
At age 13
At age 15
At age 11
S E C T I O N 6 L I F E S A T I S F A C T I O N
I N N O C E N T I R E P O R T C A R D 1 3 3 1
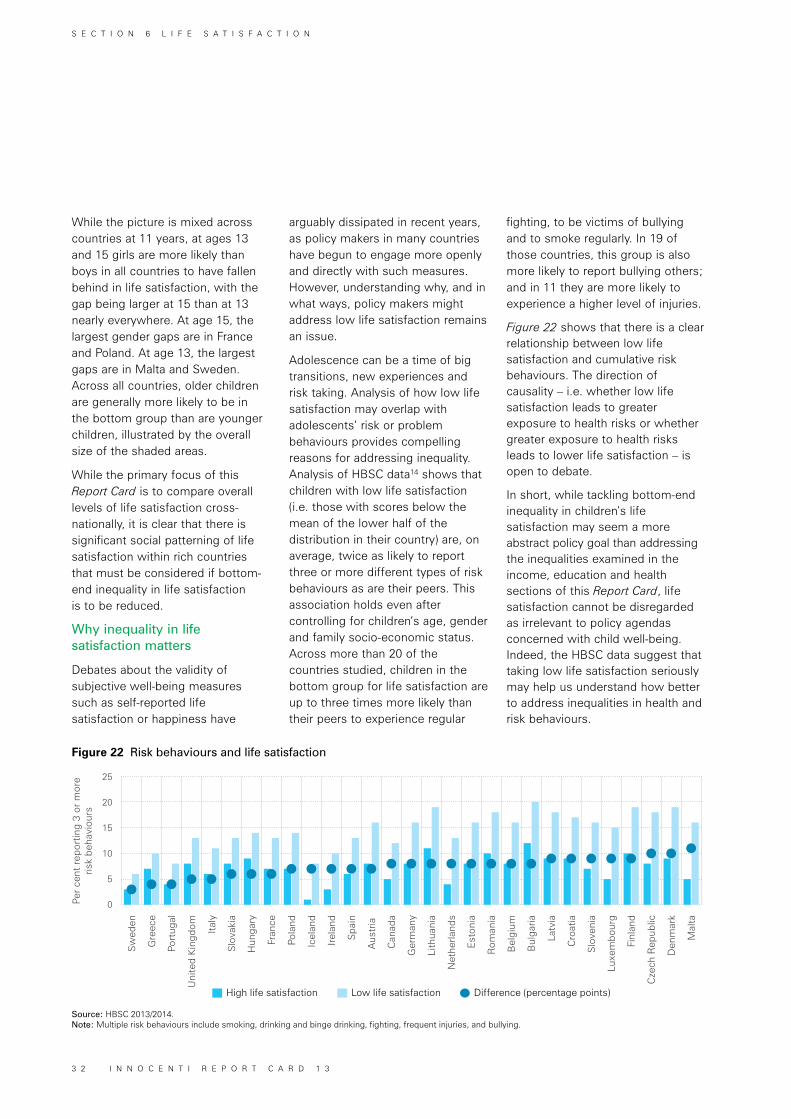
Difference (percentage points)High life satisfaction Low life satisfaction
Mal
ta
Cze
ch R
epub
lic
Den
mar
k
Finl
and
Luxe
mbo
urg
Slo
veni
a
Cro
atia
Latv
ia
Bul
garia
Bel
gium
Rom
ania
Est
onia
Net
herla
nds
Lith
uani
a
Ger
man
y
Can
ada
Aus
tria
Spa
in
Irela
nd
Icel
and
Pola
nd
Fran
ce
Hun
gary
Slo
vaki
a
Italy
Uni
ted
Kin
gdom
Port
ugal
Gre
ece
Sw
eden
Per
cent
rep
ortin
g 3
or m
ore
risk
beha
viou
rs
5
10
15
20
25
0
arguably dissipated in recent years, as policy makers in many countries have begun to engage more openly and directly with such measures. However, understanding why, and in what ways, policy makers might address low life satisfaction remains an issue.
Adolescence can be a time of big transitions, new experiences and risk taking. Analysis of how low life satisfaction may overlap with adolescents’ risk or problem behaviours provides compelling reasons for addressing inequality. Analysis of HBSC data14 shows that children with low life satisfaction (i.e. those with scores below the mean of the lower half of the distribution in their country) are, on average, twice as likely to report three or more different types of risk behaviours as are their peers. This association holds even after controlling for children’s age, gender and family socio-economic status. Across more than 20 of the countries studied, children in the bottom group for life satisfaction are up to three times more likely than their peers to experience regular
fighting, to be victims of bullying and to smoke regularly. In 19 of those countries, this group is also more likely to report bullying others; and in 11 they are more likely to experience a higher level of injuries.
Figure 22 shows that there is a clear relationship between low life satisfaction and cumulative risk behaviours. The direction of causality – i.e. whether low life satisfaction leads to greater exposure to health risks or whether greater exposure to health risks leads to lower life satisfaction – is open to debate.
In short, while tackling bottom-end inequality in children’s life satisfaction may seem a more abstract policy goal than addressing the inequalities examined in the income, education and health sections of this Report Card, life satisfaction cannot be disregarded as irrelevant to policy agendas concerned with child well-being. Indeed, the HBSC data suggest that taking low life satisfaction seriously may help us understand how better to address inequalities in health and risk behaviours.
Figure 22 Risk behaviours and life satisfaction
Source: HBSC 2013/2014.Note: Multiple risk behaviours include smoking, drinking and binge drinking, fighting, frequent injuries, and bullying.
While the picture is mixed across countries at 11 years, at ages 13 and 15 girls are more likely than boys in all countries to have fallen behind in life satisfaction, with the gap being larger at 15 than at 13 nearly everywhere. At age 15, the largest gender gaps are in France and Poland. At age 13, the largest gaps are in Malta and Sweden. Across all countries, older children are generally more likely to be in the bottom group than are younger children, illustrated by the overall size of the shaded areas.
While the primary focus of this Report Card is to compare overall levels of life satisfaction cross-nationally, it is clear that there is significant social patterning of life satisfaction within rich countries that must be considered if bottom-end inequality in life satisfaction is to be reduced.
Why inequality in life satisfaction matters
Debates about the validity of subjective well-being measures such as self-reported life satisfaction or happiness have
S E C T I O N 6 L I F E S A T I S F A C T I O N
3 2 I N N O C E N T I R E P O R T C A R D 1 3
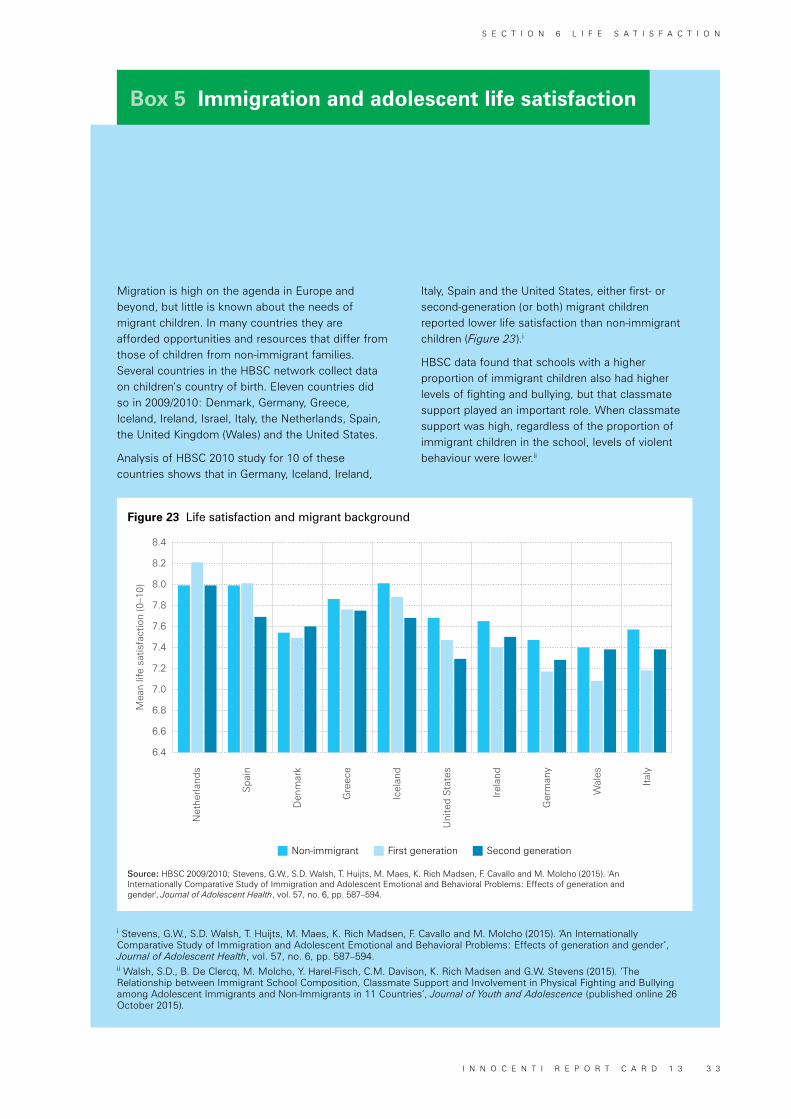
Box 5 Immigration and adolescent life satisfaction
Non-immigrant First generation Second generation
Italy
Wal
es
Ger
man
y
Irela
nd
Uni
ted
Sta
tes
Icel
and
Gre
ece
Den
mar
k
Spa
in
Net
herla
nds
6.8
6.6
7.2
7.0
7.6
7.4
8.0
7.8
8.4
8.2
6.4
Mea
n lif
e sa
tisfa
ctio
n (0
–10)
Migration is high on the agenda in Europe and beyond, but little is known about the needs of migrant children. In many countries they are afforded opportunities and resources that differ from those of children from non-immigrant families. Several countries in the HBSC network collect data on children’s country of birth. Eleven countries did so in 2009/2010: Denmark, Germany, Greece, Iceland, Ireland, Israel, Italy, the Netherlands, Spain, the United Kingdom (Wales) and the United States.
Analysis of HBSC 2010 study for 10 of these countries shows that in Germany, Iceland, Ireland,
i Stevens, G.W., S.D. Walsh, T. Huijts, M. Maes, K. Rich Madsen, F. Cavallo and M. Molcho (2015). ‘An Internationally Comparative Study of Immigration and Adolescent Emotional and Behavioral Problems: Effects of generation and gender’, Journal of Adolescent Health, vol. 57, no. 6, pp. 587–594.ii Walsh, S.D., B. De Clercq, M. Molcho, Y. Harel-Fisch, C.M. Davison, K. Rich Madsen and G.W. Stevens (2015). ‘The Relationship between Immigrant School Composition, Classmate Support and Involvement in Physical Fighting and Bullying among Adolescent Immigrants and Non-Immigrants in 11 Countries’, Journal of Youth and Adolescence (published online 26 October 2015).
Figure 23 Life satisfaction and migrant background
Source: HBSC 2009/2010; Stevens, G.W., S.D. Walsh, T. Huijts, M. Maes, K. Rich Madsen, F. Cavallo and M. Molcho (2015). 'An Internationally Comparative Study of Immigration and Adolescent Emotional and Behavioral Problems: Effects of generation and gender', Journal of Adolescent Health, vol. 57, no. 6, pp. 587–594.
Italy, Spain and the United States, either first- or second-generation (or both) migrant children reported lower life satisfaction than non-immigrant children (Figure 23).i
HBSC data found that schools with a higher proportion of immigrant children also had higher levels of fighting and bullying, but that classmate support played an important role. When classmate support was high, regardless of the proportion of immigrant children in the school, levels of violent behaviour were lower.ii
S E C T I O N 6 L I F E S A T I S F A C T I O N
I N N O C E N T I R E P O R T C A R D 1 3 3 3
In this section, we investigate the extent to which the socio-economic status (SES) of a child’s family predicts his or her outcomes in education, health and life satisfaction – what social scientists refer to as the ‘social gradient’. With income inequality rising in most rich countries,15 analysts have asked whether this will affect equality of opportunity in the future.16 Indeed, the OECD recently warned that rising income inequality can “stifle upward social mobility”.17
An examination of how strongly factors such as family background shape inequalities in health, education and life satisfaction can help us to understand some of the ways in which economic inequality affects children’s lives now and in the future – particularly the lives of the most disadvantaged children. If income or family background strongly predict children’s life chances, and if income inequality is widening in most rich countries, that will exacerbate inequality in children’s outcomes, raising important questions about fairness for children.
Life satisfaction
The HBSC study includes an indicator of family SES – the family affluence scale – allowing examination of the degree to which the SES of the household in which a child grows up predicts their life satisfaction and health outcomes. For each of the outcomes, we show the likelihood that a child from the lowest SES category is at the very
bottom of the distribution of life satisfaction and health, compared with a child from the highest SES category.18
Figure 24 shows the influence of SES on children’s lowest reported life satisfaction in 2014. In all 34 countries the bars are above 0, indicating that children with the lowest SES are more likely to be at the bottom of the life satisfaction scale, though there is a considerable range across the countries. The largest effects of SES are found in Hungary, Israel, Luxembourg, Poland and Portugal, where children in the lowest SES group are between 18 and 27 percentage points more likely to report extremely low life satisfaction.
Crucially, this effect can be seen just as clearly in 2002, 2006 and 2010 as in 2014.19 These four cycles of the HBSC survey capture the voices of some 700,000 children in countries of the EU and OECD. In short, there is clear evidence that over the course of the twenty-first century, children from the lowest SES households are consistently more likely to fall behind their peers in terms of life satisfaction.
Health
The relationship between SES and poor health is most pronounced for physical activity and healthy eating. The interpretation of these figures is the same as before – the likelihood that a child from the
FAIRNESS FOR CHILDREN SECTION 7
lowest SES category will be at the very bottom of the scale for the outcome being measured, compared with a child in the top SES category. The figures show that, for 2014:
» SES influences inequalities in physical activity across rich countries (Figure 25). In all 34 countries in the analysis, children from the lowest SES group are significantly more likely to fall behind in physical activity. The largest social gradients are in Belgium, Latvia and Luxembourg, where children in the lowest SES group are over 20 percentage points more likely to be at the bottom than are children from the highest SES group. The social gradient in physical activity has widened over time in six countries: Belgium, Italy, Latvia, the Netherlands, Sweden and the United Kingdom.
» SES influences inequalities in healthy eating across rich countries (Figure 26), with children from the lowest SES households significantly more likely to fall behind in consumption of fruit and vegetables. Only in three countries, Israel, Malta and Romania, is there no significant correlation between SES and falling behind in healthy eating. The largest social gradients (of 20 percentage points or more) can be seen in Canada and the United Kingdom, where they have widened over the past
S E C T I O N 7 F A I R N E S S F O R C H I L D R E N
3 4 I N N O C E N T I R E P O R T C A R D 1 3
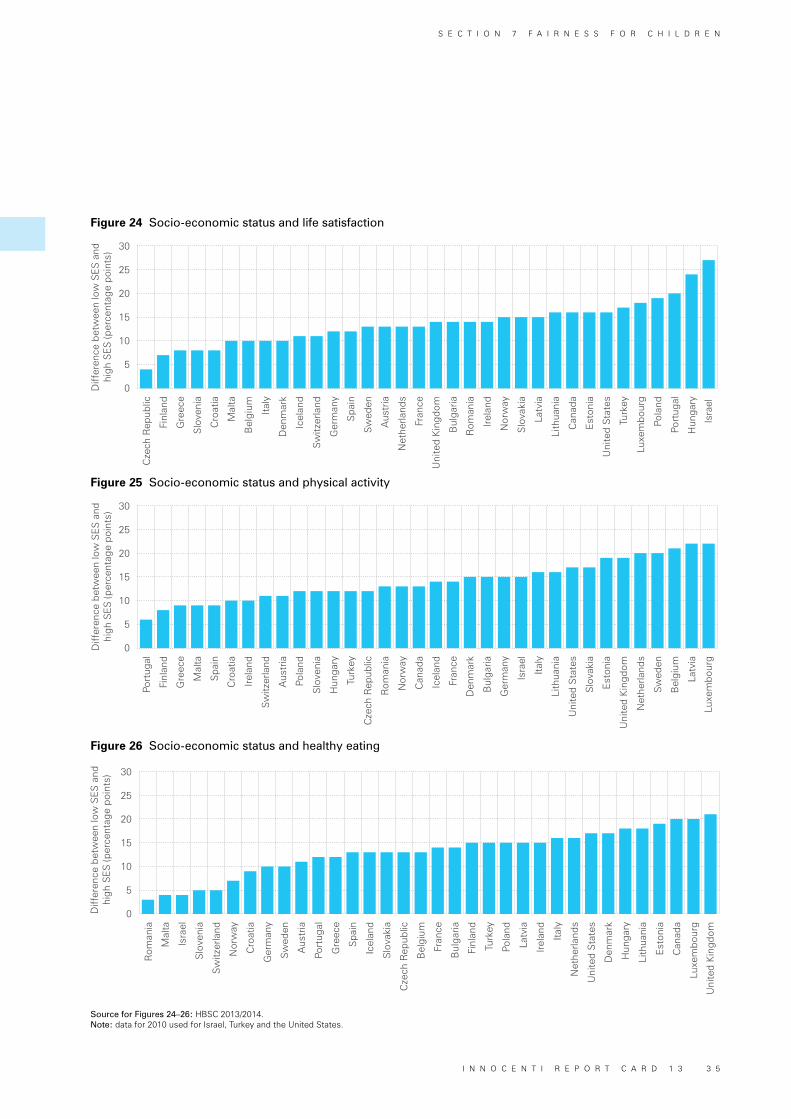
Diff
eren
ce b
etw
een
low
SE
S a
ndhi
gh S
ES
(per
cent
age
poin
ts)
0
5
10
15
20
25
30
Luxe
mbo
urg
Pola
nd
Port
ugal
Hun
gary
Isra
el
Turk
ey
Uni
ted
Sta
tes
Est
onia
Can
ada
Lith
uani
a
Latv
ia
Slo
vaki
a
Nor
way
Irela
nd
Rom
ania
Bul
garia
Uni
ted
Kin
gdom
Fran
ce
Net
herla
nds
Aus
tria
Sw
eden
Spa
in
Ger
man
y
Sw
itzer
land
Icel
and
Den
mar
k
Italy
Bel
gium
Mal
ta
Cro
atia
Slo
veni
a
Gre
ece
Finl
and
Cze
ch R
epub
lic
0
5
10
15
20
25
30
Net
herla
nds
Sw
eden
Bel
gium
Latv
ia
Luxe
mbo
urg
Uni
ted
Kin
gdom
Est
onia
Slo
vaki
a
Uni
ted
Sta
tes
Lith
uani
a
Italy
Isra
el
Ger
man
y
Bul
garia
Den
mar
k
Fran
ce
Icel
and
Can
ada
Nor
way
Rom
ania
Cze
ch R
epub
lic
Turk
ey
Hun
gary
Slo
veni
a
Pola
nd
Aus
tria
Sw
itzer
land
Irela
nd
Cro
atia
Spa
in
Mal
ta
Gre
ece
Finl
and
Port
ugal
Diff
eren
ce b
etw
een
low
SE
S a
ndhi
gh S
ES
(per
cent
age
poin
ts)
0
5
10
15
20
25
30
Lith
uani
a
Est
onia
Can
ada
Luxe
mbo
urg
Uni
ted
Kin
gdom
Hun
gary
Den
mar
k
Uni
ted
Sta
tes
Net
herla
nds
Italy
Irela
nd
Latv
ia
Pola
nd
Turk
ey
Finl
and
Bul
garia
Fran
ce
Bel
gium
Cze
ch R
epub
lic
Slo
vaki
a
Icel
and
Spa
in
Gre
ece
Port
ugal
Aus
tria
Sw
eden
Ger
man
y
Cro
atia
Nor
way
Sw
itzer
land
Slo
veni
a
Isra
el
Mal
ta
Rom
ania
Diff
eren
ce b
etw
een
low
SE
S a
ndhi
gh S
ES
(per
cent
age
poin
ts)
FAIRNESS FOR CHILDREN
Figure 25 Socio-economic status and physical activity
Source for Figures 24–26: HBSC 2013/2014.Note: data for 2010 used for Israel, Turkey and the United States.
Figure 24 Socio-economic status and life satisfaction
Figure 26 Socio-economic status and healthy eating
S E C T I O N 7 F A I R N E S S F O R C H I L D R E N
I N N O C E N T I R E P O R T C A R D 1 3 3 5
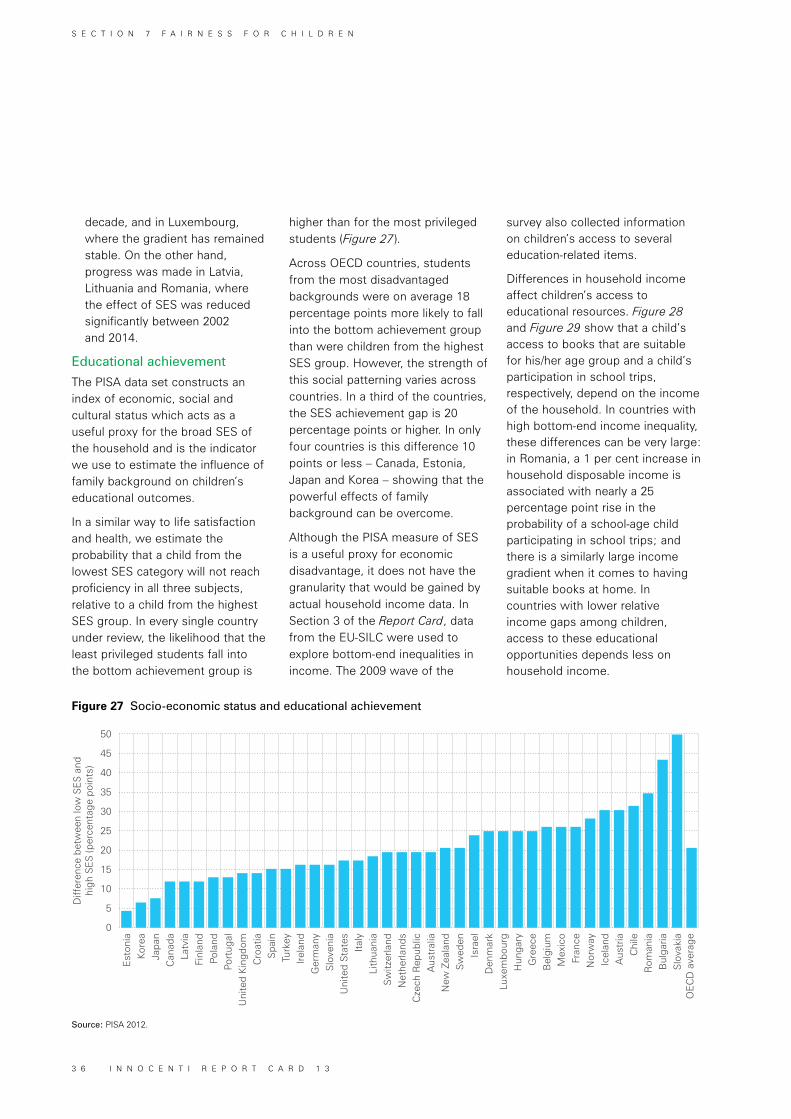
0
5
10
15
20
25
30
35
40
45
50
Chi
leR
oman
iaB
ulga
riaS
lova
kia
OE
CD
ave
rage
Aus
tria
Icel
and
Nor
way
Fran
ceM
exic
oB
elgi
umG
reec
eH
unga
ryLu
xem
bour
gD
enm
ark
Isra
elS
wed
enN
ew Z
eala
ndA
ustr
alia
Cze
ch R
epub
licN
ethe
rland
sS
witz
erla
nd
Italy
Lith
uani
a
Uni
ted
Sta
tes
Slo
veni
aG
erm
any
Irela
ndTu
rkey
Cro
atia
Spa
in
Port
ugal
Uni
ted
Kin
gdom
Finl
and
Pola
nd
Can
ada
Latv
ia
Kore
aJa
pan
Est
onia
Diff
eren
ce b
etw
een
low
SE
S a
ndhi
gh S
ES
(per
cent
age
poin
ts)
decade, and in Luxembourg, where the gradient has remained stable. On the other hand, progress was made in Latvia, Lithuania and Romania, where the effect of SES was reduced significantly between 2002 and 2014.
Educational achievement
The PISA data set constructs an index of economic, social and cultural status which acts as a useful proxy for the broad SES of the household and is the indicator we use to estimate the influence of family background on children’s educational outcomes.
In a similar way to life satisfaction and health, we estimate the probability that a child from the lowest SES category will not reach proficiency in all three subjects, relative to a child from the highest SES group. In every single country under review, the likelihood that the least privileged students fall into the bottom achievement group is
higher than for the most privileged students (Figure 27).
Across OECD countries, students from the most disadvantaged backgrounds were on average 18 percentage points more likely to fall into the bottom achievement group than were children from the highest SES group. However, the strength of this social patterning varies across countries. In a third of the countries, the SES achievement gap is 20 percentage points or higher. In only four countries is this difference 10 points or less – Canada, Estonia, Japan and Korea – showing that the powerful effects of family background can be overcome.
Although the PISA measure of SES is a useful proxy for economic disadvantage, it does not have the granularity that would be gained by actual household income data. In Section 3 of the Report Card, data from the EU-SILC were used to explore bottom-end inequalities in income. The 2009 wave of the
survey also collected information on children’s access to several education-related items.
Differences in household income affect children’s access to educational resources. Figure 28 and Figure 29 show that a child’s access to books that are suitable for his/her age group and a child’s participation in school trips, respectively, depend on the income of the household. In countries with high bottom-end income inequality, these differences can be very large: in Romania, a 1 per cent increase in household disposable income is associated with nearly a 25 percentage point rise in the probability of a school-age child participating in school trips; and there is a similarly large income gradient when it comes to having suitable books at home. In countries with lower relative income gaps among children, access to these educational opportunities depends less on household income.
Figure 27 Socio-economic status and educational achievement
Source: PISA 2012.
S E C T I O N 7 F A I R N E S S F O R C H I L D R E N
3 6 I N N O C E N T I R E P O R T C A R D 1 3
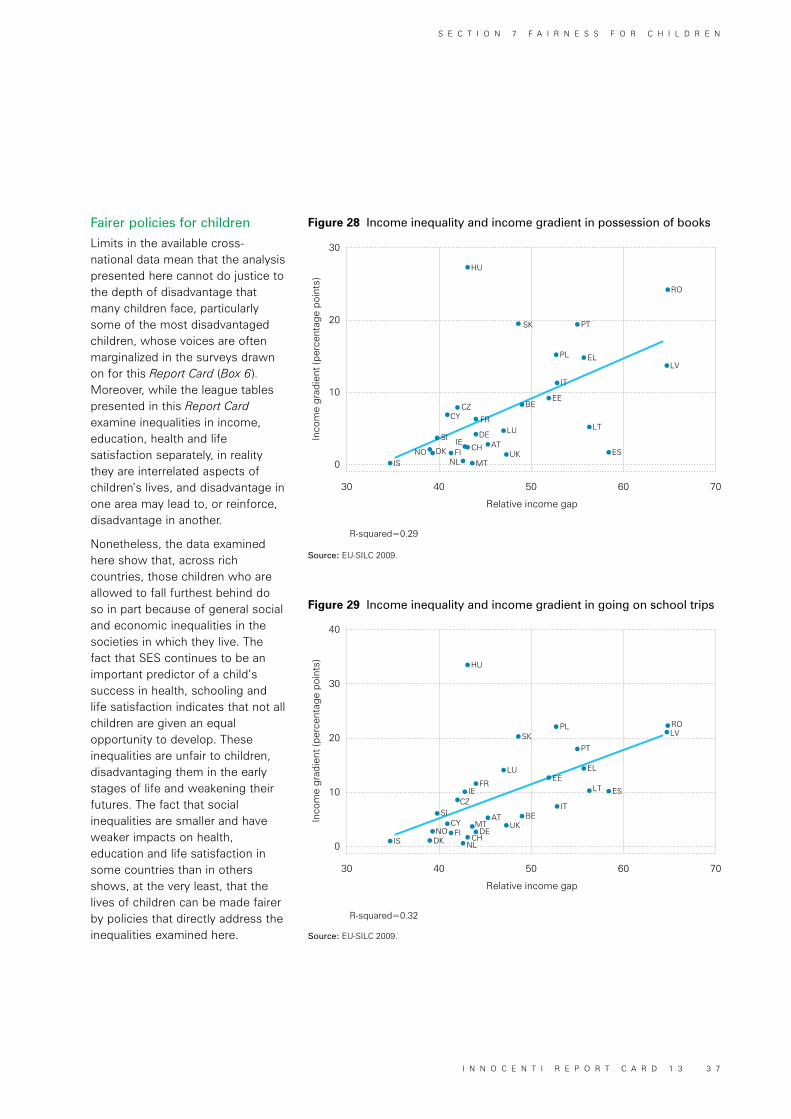
Inco
me
grad
ient
(per
cent
age
poin
ts)
Relative income gap
R-squared=0.32
30 40 50 60 70
0
10
20
30
40
ROLV
ESLT
EL
IT
PT
PLSK
EE
BEUK
AT
LU
FRIE
CZ
MTDE
CHNL
FICY
SI
NODKIS
HU
Inco
me
grad
ient
(per
cent
age
poin
ts)
Relative income gap
R-squared=0.29
30 40 50 60 70
0
10
20
30
RO
LV
ES
LT
PT
ELPL
IT
EE
SK
BE
UK
LU
ATCHIE
DE
FR
CZ
MTNLFI
CY
SI
NO DK
IS
HU
Fairer policies for children
Limits in the available cross-national data mean that the analysis presented here cannot do justice to the depth of disadvantage that many children face, particularly some of the most disadvantaged children, whose voices are often marginalized in the surveys drawn on for this Report Card (Box 6). Moreover, while the league tables presented in this Report Card examine inequalities in income, education, health and life satisfaction separately, in reality they are interrelated aspects of children’s lives, and disadvantage in one area may lead to, or reinforce, disadvantage in another.
Nonetheless, the data examined here show that, across rich countries, those children who are allowed to fall furthest behind do so in part because of general social and economic inequalities in the societies in which they live. The fact that SES continues to be an important predictor of a child’s success in health, schooling and life satisfaction indicates that not all children are given an equal opportunity to develop. These inequalities are unfair to children, disadvantaging them in the early stages of life and weakening their futures. The fact that social inequalities are smaller and have weaker impacts on health, education and life satisfaction in some countries than in others shows, at the very least, that the lives of children can be made fairer by policies that directly address the inequalities examined here.
Figure 28 Income inequality and income gradient in possession of books
Figure 29 Income inequality and income gradient in going on school trips
Source: EU-SILC 2009.
Source: EU-SILC 2009.
S E C T I O N 7 F A I R N E S S F O R C H I L D R E N
I N N O C E N T I R E P O R T C A R D 1 3 3 7
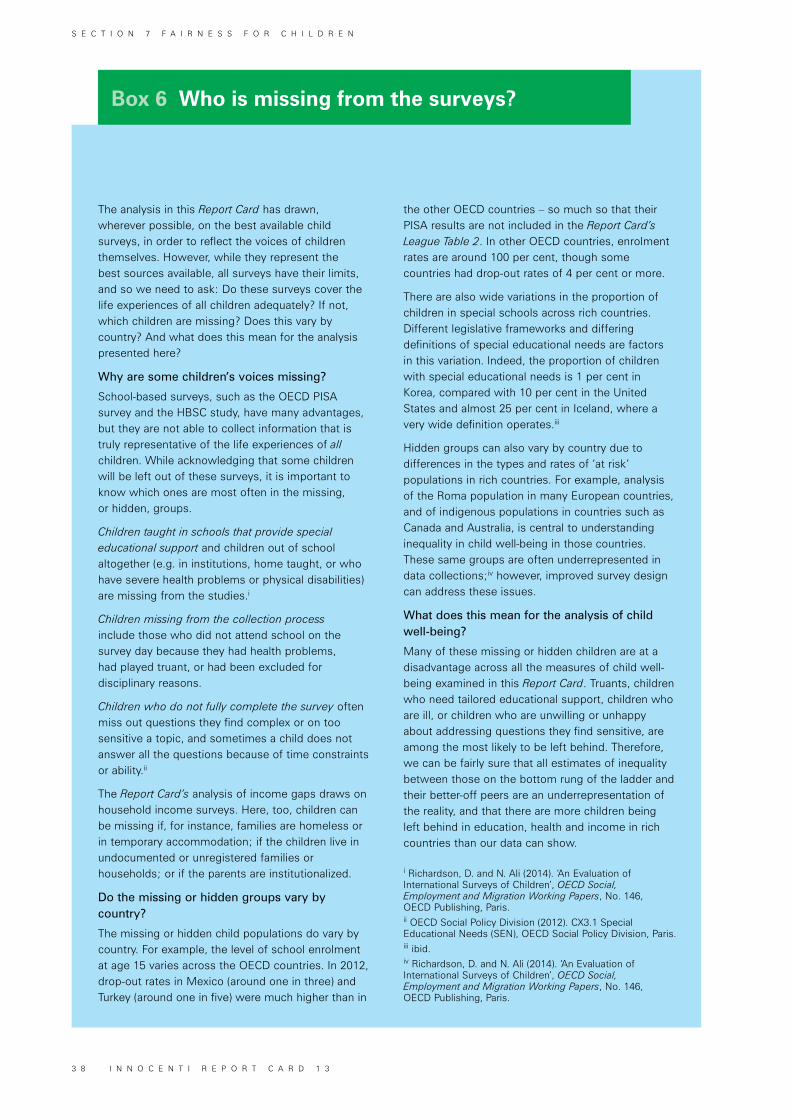
Box 6 Who is missing from the surveys?
The analysis in this Report Card has drawn, wherever possible, on the best available child surveys, in order to reflect the voices of children themselves. However, while they represent the best sources available, all surveys have their limits, and so we need to ask: Do these surveys cover the life experiences of all children adequately? If not, which children are missing? Does this vary by country? And what does this mean for the analysis presented here?
Why are some children’s voices missing?
School-based surveys, such as the OECD PISA survey and the HBSC study, have many advantages, but they are not able to collect information that is truly representative of the life experiences of all children. While acknowledging that some children will be left out of these surveys, it is important to know which ones are most often in the missing, or hidden, groups.
Children taught in schools that provide special educational support and children out of school altogether (e.g. in institutions, home taught, or who have severe health problems or physical disabilities) are missing from the studies.i
Children missing from the collection process include those who did not attend school on the survey day because they had health problems, had played truant, or had been excluded for disciplinary reasons.
Children who do not fully complete the survey often miss out questions they find complex or on too sensitive a topic, and sometimes a child does not answer all the questions because of time constraints or ability.ii
The Report Card’s analysis of income gaps draws on household income surveys. Here, too, children can be missing if, for instance, families are homeless or in temporary accommodation; if the children live in undocumented or unregistered families or households; or if the parents are institutionalized.
Do the missing or hidden groups vary by country?
The missing or hidden child populations do vary by country. For example, the level of school enrolment at age 15 varies across the OECD countries. In 2012, drop-out rates in Mexico (around one in three) and Turkey (around one in five) were much higher than in
the other OECD countries – so much so that their PISA results are not included in the Report Card’s League Table 2. In other OECD countries, enrolment rates are around 100 per cent, though some countries had drop-out rates of 4 per cent or more.
There are also wide variations in the proportion of children in special schools across rich countries. Different legislative frameworks and differing definitions of special educational needs are factors in this variation. Indeed, the proportion of children with special educational needs is 1 per cent in Korea, compared with 10 per cent in the United States and almost 25 per cent in Iceland, where a very wide definition operates.iii
Hidden groups can also vary by country due to differences in the types and rates of ‘at risk’ populations in rich countries. For example, analysis of the Roma population in many European countries, and of indigenous populations in countries such as Canada and Australia, is central to understanding inequality in child well-being in those countries. These same groups are often underrepresented in data collections;iv however, improved survey design can address these issues.
What does this mean for the analysis of child well-being?
Many of these missing or hidden children are at a disadvantage across all the measures of child well-being examined in this Report Card. Truants, children who need tailored educational support, children who are ill, or children who are unwilling or unhappy about addressing questions they find sensitive, are among the most likely to be left behind. Therefore, we can be fairly sure that all estimates of inequality between those on the bottom rung of the ladder and their better-off peers are an underrepresentation of the reality, and that there are more children being left behind in education, health and income in rich countries than our data can show.
i Richardson, D. and N. Ali (2014). ‘An Evaluation of International Surveys of Children’, OECD Social, Employment and Migration Working Papers, No. 146, OECD Publishing, Paris.ii OECD Social Policy Division (2012). CX3.1 Special Educational Needs (SEN), OECD Social Policy Division, Paris. iii ibid.iv Richardson, D. and N. Ali (2014). ‘An Evaluation of International Surveys of Children’, OECD Social, Employment and Migration Working Papers, No. 146, OECD Publishing, Paris.
S E C T I O N 7 F A I R N E S S F O R C H I L D R E N
3 8 I N N O C E N T I R E P O R T C A R D 1 3
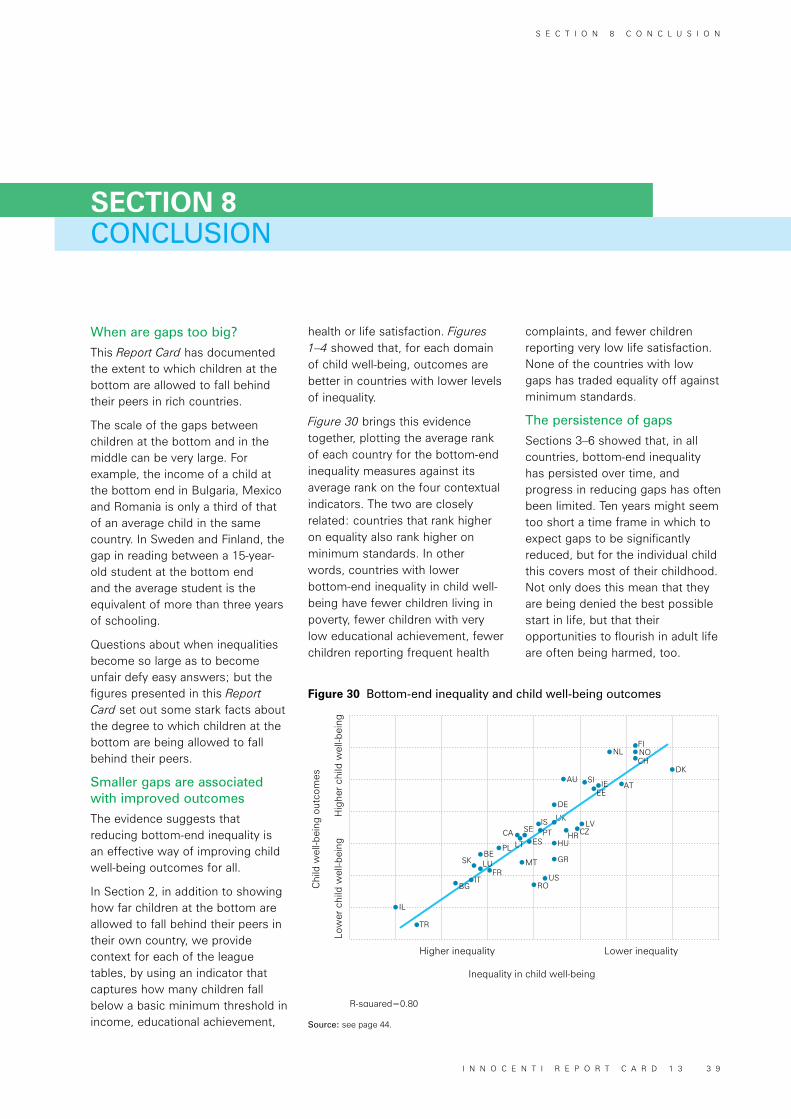
Higher inequality Lower inequality
R-squared=0.80
Hig
her
child
wel
l-bei
ngLo
wer
chi
ld w
ell-b
eing
Chi
ld w
ell-b
eing
out
com
es
Inequality in child well-being
DK
NOFI
NL
UK
HRCZLV
DE
AU SIAT
BEMT
ROUS
GR
ES
SECAHU
TR
IL
CH
IEEE
BGIT
FRLUSK
PL LT
ISPT
CONCLUSION SECTION 8
Figure 30 Bottom-end inequality and child well-being outcomes
Source: see page 44.
When are gaps too big?
This Report Card has documented the extent to which children at the bottom are allowed to fall behind their peers in rich countries.
The scale of the gaps between children at the bottom and in the middle can be very large. For example, the income of a child at the bottom end in Bulgaria, Mexico and Romania is only a third of that of an average child in the same country. In Sweden and Finland, the gap in reading between a 15-year-old student at the bottom end and the average student is the equivalent of more than three years of schooling.
Questions about when inequalities become so large as to become unfair defy easy answers; but the figures presented in this Report Card set out some stark facts about the degree to which children at the bottom are being allowed to fall behind their peers.
Smaller gaps are associated with improved outcomes
The evidence suggests that reducing bottom-end inequality is an effective way of improving child well-being outcomes for all.
In Section 2, in addition to showing how far children at the bottom are allowed to fall behind their peers in their own country, we provide context for each of the league tables, by using an indicator that captures how many children fall below a basic minimum threshold in income, educational achievement,
health or life satisfaction. Figures 1–4 showed that, for each domain of child well-being, outcomes are better in countries with lower levels of inequality.
Figure 30 brings this evidence together, plotting the average rank of each country for the bottom-end inequality measures against its average rank on the four contextual indicators. The two are closely related: countries that rank higher on equality also rank higher on minimum standards. In other words, countries with lower bottom-end inequality in child well-being have fewer children living in poverty, fewer children with very low educational achievement, fewer children reporting frequent health
complaints, and fewer children reporting very low life satisfaction. None of the countries with low gaps has traded equality off against minimum standards.
The persistence of gaps
Sections 3–6 showed that, in all countries, bottom-end inequality has persisted over time, and progress in reducing gaps has often been limited. Ten years might seem too short a time frame in which to expect gaps to be significantly reduced, but for the individual child this covers most of their childhood. Not only does this mean that they are being denied the best possible start in life, but that their opportunities to flourish in adult life are often being harmed, too.
S E C T I O N 8 C O N C L U S I O N
I N N O C E N T I R E P O R T C A R D 1 3 3 9
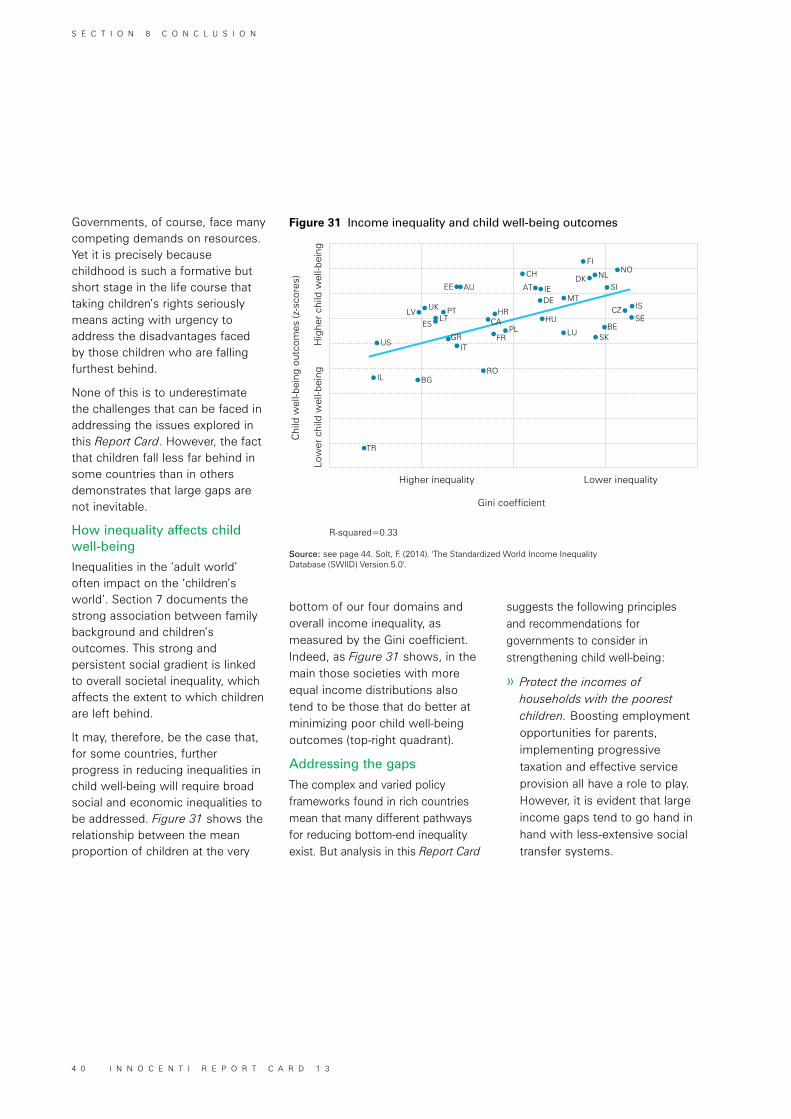
Higher inequality Lower inequality
R-squared=0.33
Hig
her
child
wel
l-bei
ngLo
wer
chi
ld w
ell-b
eing
Chi
ld w
ell-b
eing
out
com
es (z
-sco
res)
Gini coefficient
MTIEAT
CH
FI
NLDKNO
DE
SI
CZ IS
SEBE
SKLU
HUHR
CAPL
FR
AU
PTLT
UKLV
ES
GRIT
RO
US
BG
TR
IL
EE
Figure 31 Income inequality and child well-being outcomes
Source: see page 44. Solt, F. (2014). 'The Standardized World Income Inequality Database (SWIID) Version 5.0'.
Governments, of course, face many competing demands on resources. Yet it is precisely because childhood is such a formative but short stage in the life course that taking children’s rights seriously means acting with urgency to address the disadvantages faced by those children who are falling furthest behind.
None of this is to underestimate the challenges that can be faced in addressing the issues explored in this Report Card. However, the fact that children fall less far behind in some countries than in others demonstrates that large gaps are not inevitable.
How inequality affects child well-being
Inequalities in the ‘adult world’ often impact on the ‘children’s world’. Section 7 documents the strong association between family background and children’s outcomes. This strong and persistent social gradient is linked to overall societal inequality, which affects the extent to which children are left behind.
It may, therefore, be the case that, for some countries, further progress in reducing inequalities in child well-being will require broad social and economic inequalities to be addressed. Figure 31 shows the relationship between the mean proportion of children at the very
bottom of our four domains and overall income inequality, as measured by the Gini coefficient. Indeed, as Figure 31 shows, in the main those societies with more equal income distributions also tend to be those that do better at minimizing poor child well-being outcomes (top-right quadrant).
Addressing the gaps
The complex and varied policy frameworks found in rich countries mean that many different pathways for reducing bottom-end inequality exist. But analysis in this Report Card
suggests the following principles and recommendations for governments to consider in strengthening child well-being:
» Protect the incomes of households with the poorest children. Boosting employment opportunities for parents, implementing progressive taxation and effective service provision all have a role to play. However, it is evident that large income gaps tend to go hand in hand with less-extensive social transfer systems.
S E C T I O N 8 C O N C L U S I O N
4 0 I N N O C E N T I R E P O R T C A R D 1 3
» Focus on improving the educational achievements of disadvantaged learners. The Convention on the Rights of the Child requires recognition not just of the right to education, but also “achieving this right progressively and on the basis of equal opportunity”. This means preventing children from falling far behind in their educational achievement. Evidence from the PISA surveys shows that there is no inevitable trade-off between reducing achievement gaps and overall outcomes, and so this agenda can be both fair and effective.
» Promote and support healthy lifestyles for all children. Promoting healthy lifestyles at an early age is likely to pay short- and long-term dividends, but the fact that such large relative child health gaps exist in many countries is a cause for concern. This is particularly so for inequalities in physical activity, given that these seem more tightly bound to inequalities in income. This would suggest that there is particular scope for governments to do more to open up opportunities for less-affluent children to participate in physical activity in and out of school. Evidence from the EU-SILC shows that low income is a barrier to participation in extra-curricular activities in European schools.
» Take subjective well-being seriously. Data gathered over a period of more than 10 years for the HBSC survey show stable patterns of inequality in children’s life satisfaction. While this stability confirms that subjective well-being data reveal meaningful information about children’s lives in rich countries, the fact that some countries have had persistently large gaps is a cause for concern. Moreover, the findings that children with low life satisfaction are more likely to be exposed to risky health behaviours and outcomes underlines the fact that subjective well-being also matters for health and education.
» Place equity at the heart of child well-being agendas. The leave-no-one-behind principle should form the foundation of future social strategies. The evidence presented in this Report Card suggests that to improve overall child well-being the most disadvantaged must not be ignored.
Better monitoring and measurement of child well-being
Producing better data for informed public debate and a more comprehensive picture of child well-being is essential. To this end we recommend:
» The availability, timeliness and usefulness of information about the well-being of children in rich countries should be improved. As part of this process, governments and national statistical agencies should continue to work together more closely to harmonize surveys, wherever possible, in order to allow for fruitful cross-national comparison of child well-being outcomes and to foster cross-national policy learning.
» Data sets should track children through different stages of their life. Such analysis is particularly powerful for an exploration of the temporality of child well-being and the factors that shape child well-being. Governments should increase their support for these longitudinal data sources.
» Children’s voices should be built into data-collection processes. While children’s voices are heard more clearly than ever before in the key data sets used in this Report Card, further efforts can still be made to capture child-derived measures of well-being more systematically and to understand better the particular contexts in which child well-being improves and worsens. Children need to be able to shape the questions asked in surveys of their own lives and well-being.
S E C T I O N 8 C O N C L U S I O N
I N N O C E N T I R E P O R T C A R D 1 3 4 1

4 2 I N N O C E N T I R E P O R T C A R D 1 3
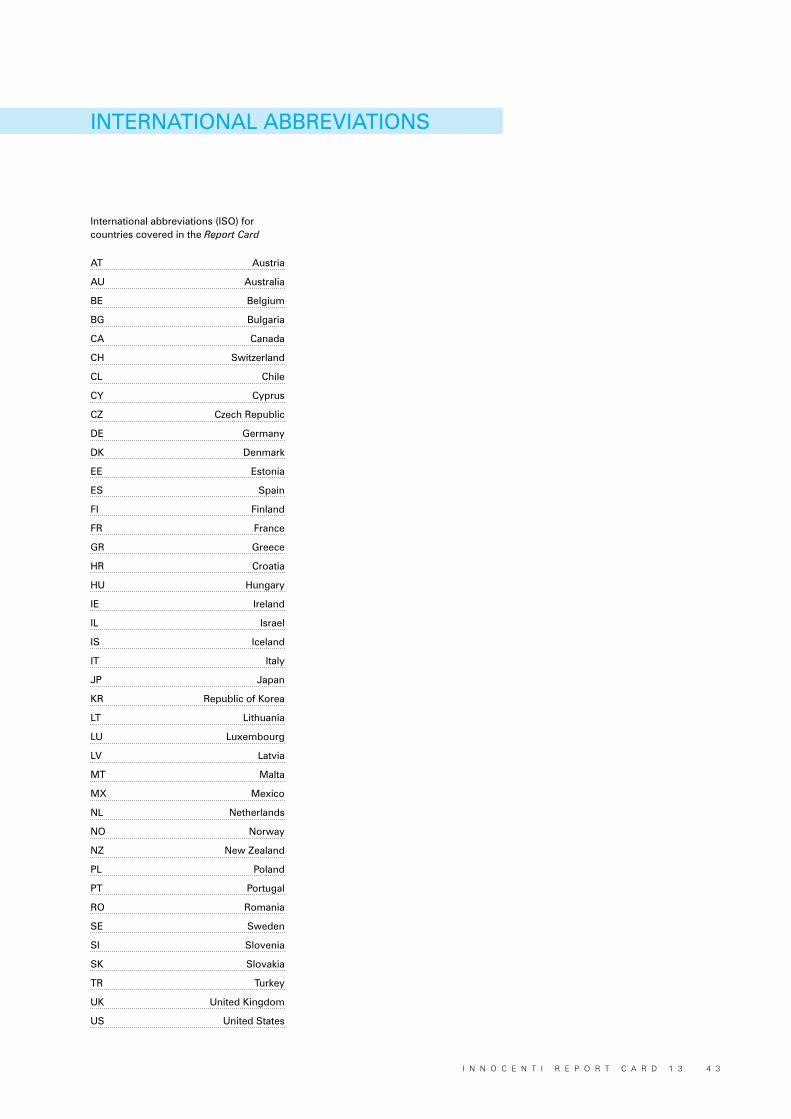
International abbreviations (ISO) for countries covered in the Report Card
AT Austria
AU Australia
BE Belgium
BG Bulgaria
CA Canada
CH Switzerland
CL Chile
CY Cyprus
CZ Czech Republic
DE Germany
DK Denmark
EE Estonia
ES Spain
FI Finland
FR France
GR Greece
HR Croatia
HU Hungary
IE Ireland
IL Israel
IS Iceland
IT Italy
JP Japan
KR Republic of Korea
LT Lithuania
LU Luxembourg
LV Latvia
MT Malta
MX Mexico
NL Netherlands
NO Norway
NZ New Zealand
PL Poland
PT Portugal
RO Romania
SE Sweden
SI Slovenia
SK Slovakia
TR Turkey
UK United Kingdom
US United States
INTERNATIONAL ABBREVIATIONS
I N N O C E N T I R E P O R T C A R D 1 3 4 3
League Table 1 – Income
Data refer to children aged 0 to 17.
Sources: The calculations for League Table 1 are based on micro-data from the European Union Statistics on Income and Living Conditions (EU-SILC) 2013 for European Union countries and Iceland, Norway and Switzerland.
For the remaining countries:
» Australia: Household, Income and Labour Dynamics in Australia 2013;
» Canada: Canadian Income Survey (CIS) 2013. The 2007 estimates (Figure 5) are based on the Survey of Income and Labour Dynamics (SLID) 2007 (from Luxembourg Income Study). The CIS and the SLID use different methodologies, and so the results are not directly comparable;
» Chile: La Encuesta de Caracterización Socioeconómica Nacional (CASEN) 2011;
» Israel: Household Expenditure Survey 2012 (from Luxembourg Income Study);
» Japan: Ministry of Health, Labour and Welfare’s Comprehensive Survey of Living Conditions 2013;
» Mexico: Household Income and Expenditure Survey 2012 (from Luxembourg Income Study);
» New Zealand: Household Economic Survey 2013/2014 (estimates taken from B. Perry, Household Incomes in New Zealand: Trends in indicators of inequality and hardship, 1982 to 2014, New Zealand Ministry of Social Development, Auckland, 2015);
» Republic of Korea: Household and Income Expenditure Survey and Farm Household Economy Survey 2013;
» Turkey: Income and Living Conditions Survey 2013;
» United States: Current Population Survey 2013, Annual Social and Economic Supplement (from Luxembourg Income Study).
League Table 2 – Education
Data refer to children aged 15 (between 15 years 3 months and 16 years 2 months).
Source: The calculations for League Table 2 are based on micro-data from the OECD Programme for International Student Assessment (PISA) 2012.
Mexico and Turkey are excluded from the main ranking because of low school enrolment rates of 15–19-year-olds in 2011 (56 per cent in Mexico and 64 per cent in Turkey).*
More detailed information on the OECD PISA survey can be found at: www.oecd.org/pisa and in OECD (2014). PISA 2012 Technical Report, OECD Publishing, Paris.
League Table 3 – Health and League Table 4 – Life satisfaction
Data refer to children aged 11, 13 and 15, except in Australia (age 13–14).
Source: The calculations for League Table 3 and for League Table 4 are based on micro-data from the Health Behaviour in School-aged Children (HBSC) 2013/2014.
Data from the 2009/2010 cycle of the HBSC are used for Israel, Turkey and the United States.
Detailed information on HBSC can be found at: www.hbsc.org
Identical survey questions from the 2014 Australian Child Wellbeing Project (ACWP) are used for Australia.
For more information about ACWP see: www.australianchildwellbeing.com.au
League Table 5
League Table 5 summarizes League Tables 1–4 and thus uses all the above sources.
DATA SOURCES – THE LEAGUE TABLES
* http://www.oecd.org/edu/educationataglance2013-countrynotesandkeyfacttables.htm
4 4 I N N O C E N T I R E P O R T C A R D 1 3
The original research for this report, including further methodological explanations, can be found in the Innocenti Working Papers detailed below and available at www.unicef-irc.org
Aleman-Diaz, A., E. Toczydlowska, J. Mazur, D. Frasquilho, M. Melkumova and G. Holmqvist (2016). ‘Why Do Inequalities Matter? A look at the evidence’, Innocenti Working Paper 2016-06, UNICEF Office of Research – Innocenti, Florence.
Bruckauf, Z. (2016). ‘Falling Behind: Socio-demographic profiles of educationally disadvantaged youth. Evidence from PISA 2006–2012’, Innocenti Working Paper 2016-11, UNICEF Office of Research – Innocenti, Florence.
Bruckauf, Z. and Y. Chzhen (2016). ‘Education for All? Measuring inequality of educational outcomes among 15-year-olds across 39 industrialized nations’, Innocenti Working Paper 2016-08, UNICEF Office of Research – Innocenti, Florence.
Bruckauf, Z. and Y. Chzhen (2016). ‘Poverty and Children’s Cognitive Trajectories: Evidence from the UK Millennium Cohort Study’, Innocenti Working Paper 2016-14, UNICEF Office of Research – Innocenti, Florence.
Chzhen, Y., E. Toczydlowska and S. Handa (2016). ‘Child Poverty Dynamics and Income Mobility in Europe, 2010–2013’, Innocenti Working Paper 2016-16, UNICEF Office of Research – Innocenti, Florence.
Chzhen, Y., I. Moor, W. Pickett, G. Stevens and E. Toczydlowska (2016). ‘Family Affluence and Inequality in Adolescent Health and Life Satisfaction: Evidence from the HBSC study 2002–2014’, Innocenti Working Paper 2016-10, UNICEF Office of Research – Innocenti, Florence.
Chzhen, Y., Z. Bruckauf, K. Ng, D. Pavlova, T. Torsheim and M. Gaspar de Matos (2016). ‘Inequalities in Adolescent Health and Life Satisfaction: Evidence from the Health Behaviour in School-aged Children study’, Innocenti Working Paper 2016-09, UNICEF Office of Research – Innocenti, Florence.
Elgar, F.J. and C. Currie (2016). ‘Early-life Exposure to Income Inequality and Adolescent Health’, Innocenti Working Paper 2016-07, UNICEF Office of Research – Innocenti, Florence.
Toczydlowska, E. (2016). ’Children in the Bottom of Income Distribution in Europe: Risks and composition’, Innocenti Working Paper 2016-12, UNICEF Office of Research – Innocenti, Florence.
Toczydlowska, E., Y. Chzhen, Z. Bruckauf and S. Handa (2016). ‘Income Inequality among Children in Europe 2008–2013’, Innocenti Working Paper 2016-15, UNICEF Office of Research – Innocenti, Florence.
Walsh, S.D., Z. Bruckauf and T. Gaspar (2016). ‘Adolescents at Risk: Psychosomatic health complaints, low life satisfaction, excessive sugar consumption and their relationship with cumulative risk behaviours’, Innocenti Working Paper 2016-13, UNICEF Office of Research – Innocenti, Florence.
DATA SOURCES – THE BACKGROUND PAPERS
I N N O C E N T I R E P O R T C A R D 1 3 4 5
1. OECD (2015). In it Together: Why less inequality benefits all, OECD Publishing, Paris.
2. Cingano, F. (2014). ‘Trends in Income Inequality and its Impact on Economic Growth’, OECD Social, Employment and Migration Working Papers, No. 163, OECD Publishing, Paris; OECD (2014). ‘Does Income Inequality Hurt Economic Growth?’, OECD Focus on Inequality and Growth, December 2014; Wilkinson, R. and K. Pickett (2009). The Spirit Level, Penguin Books, London.
3. UNICEF (2010). ‘The Children Left Behind: A league table of inequality in child well-being in the world’s rich countries’, Innocenti Report Card 9, UNICEF Office of Research, Florence; Stewart, F. (2013). ‘Approaches towards Inequality and Inequity: Concepts, measures and policies’, UNICEF Office of Research Discussion Paper 2013-01, UNICEF Office of Research, Florence.
4. UNICEF (2010). ‘The Children Left Behind: A league table of inequality in child well-being in the world’s rich countries’, Innocenti Report Card 9, UNICEF Office of Research, Florence, p. 3.
5. Toczydlowska, E., Y. Chzhen, Z. Bruckauf and S. Handa (2016). ‘Income Inequality among Children in Europe 2008–2013’, Innocenti Working Paper 2016-15, UNICEF Office of Research – Innocenti, Florence.
6. UNICEF (2013). ‘Child Well-being in Rich Countries: A comparative overview’, Innocenti Report Card 11, UNICEF Office of Research, Florence; see also Table 4.1 in Bradshaw, J. (2015). ‘Child Poverty and Child Well-being in International Perspective’, in E. Fernandez, A. Zeira, T. Vecchiato and C. Canali (eds), Theoretical and Empirical Insights into Child and Family Poverty, Springer International Publishing, Cham, Switzerland, pp. 59–70.
7. Bruckauf, Z. and Y. Chzhen (2016). ‘Education for All? Measuring inequality of educational outcomes among 15-year-olds across 39 industrialized nations’, Innocenti Working Paper 2016-08, UNICEF Office of Research – Innocenti, Florence.
8. Chzhen, Y., I. Moor, W. Pickett, G. Stevens and E. Toczydlowska (2016). ‘Family Affluence and Inequality in Adolescent Health and Life Satisfaction: Evidence from the HBSC study 2002–2014’, Innocenti Working Paper 2016-10, UNICEF Office of Research – Innocenti, Florence.
9. Currie, C., J. Inchley, M. Molcho, M. Lenzi, Z. Veselska and F. Wild (eds) (2014). Health Behaviour in School-aged Children (HBSC) Study Protocol: Background, methodology and mandatory items for the 2013/14 survey, Child and Adolescent Health Research Unit, University of St Andrews.
10. Aleman-Diaz, A., E. Toczydlowska, J. Mazur, D. Frasquilho, M. Melkumova and G. Holmqvist (2016). ‘Why Do Inequalities Matter? A look at the evidence’, Innocenti Working Paper 2016-06, UNICEF Office of Research – Innocenti, Florence.
11. Elgar, F.J. and C. Currie (2016). ‘Early-life Exposure to Income Inequality and Adolescent Health’, Innocenti Working Paper 2016-11, UNICEF Office of Research – Innocenti, Florence.
12. Chzhen, Y., Z. Bruckauf, K. Ng, D. Pavlova, T. Torsheim and M. Gaspar de Matos (2016). ‘Inequalities in Adolescent Health and Life Satisfaction: Evidence from the Health Behaviour in School-aged Children study’, Innocenti Working Paper 2016-09, UNICEF Office of Research – Innocenti, Florence.
13. ibid.
14. Walsh, S.D., Z. Bruckauf, Y. Chzhen and T. Gaspar (2016). ‘Adolescents at Risk: Psychosomatic health complaints, low life satisfaction, excessive sugar consumption and their relationship with cumulative risk behaviours’, Innocenti Working Paper 2016-13, UNICEF Office of Research – Innocenti, Florence.
15. OECD (2015). In it Together: Why less inequality benefits all, OECD Publishing, Paris.
16. OECD (2011). Divided We Stand: Why inequality keeps rising, OECD Publishing, Paris; Corak, M. (2013). ‘Income Inequality, Equality of Opportunity, and Intergenerational Mobility’, Journal of Economic Perspectives, vol. 27, no. 3, pp. 79–102.
17. ibid., p. 40.
18. The very bottom of the distribution is defined as having a score that is below the mean of the bottom half of the distribution.
19. Chzhen, Y., I. Moor, W. Pickett, G. Stevens and E. Toczydlowska (2016). ‘Family Affluence and Inequality in Adolescent Health and Life Satisfaction: Evidence from the HBSC study 2002–2014’, Innocenti Working Paper 2016-10, UNICEF Office of Research – Innocenti, Florence.
REFERENCES
4 6 I N N O C E N T I R E P O R T C A R D 1 3
The Innocenti Report Card 13 project was coordinated by the UNICEF Office of Research – Innocenti and assisted by a panel of advisors and reviewers. Research was completed at the end of November 2015.
The full text and the background papers to this report can be downloaded from the UNICEF Office of Research website: www.unicef-irc.org
Research and data analysis
Zlata Bruckauf (Consultant, UNICEF Office of Research)
Yekaterina Chzhen (Social and Economic Policy Specialist, UNICEF Office of Research)
Sudhanshu Handa (Chief, Social and Economic Policy Unit, UNICEF Office of Research)
John Hudson (Independent Consultant, University of York)
Stefan Kühner (Independent Consultant, University of York)
Emilia Toczydlowska (Consultant, UNICEF Office of Research)
Advisory board
Mario Biggeri (University of Florence)
Francesca Borgonovi (Organisation for Economic Co-operation and Development)
Jonathan Bradshaw (University of York)
Candace Currie (University of St Andrews)
Frank Elgar (McGill University)
David Gordon (University of Bristol)
Anne-Catherine Guio (Luxembourg Institute of Socio-Economic Research (LISER))
Heather Joshi (Institute of Education, University College London)
Eric Marlier (Luxembourg Institute of Socio-Economic Research (LISER))
Kate Pickett (University of York)
Denisa Sologon (Luxembourg Institute of Socio-Economic Research (LISER))
Russell Viner (University College London)
Health Behaviour in School-aged Children (HBSC) Technical Committee
Aixa Aleman-Diaz (University of St Andrews)
Michal Molcho (National University of Ireland, Galway)
Torbjorn Torsheim (University of Bergen)
UNICEF advisors
Marta Arias Robles (Specialist, Advocacy and Child Rights Education, UNICEF Private Fundraising and Partnerships)
Prerna Banati (Chief, Programme and Planning, UNICEF Office of Research)
Sarah Cook (Director, UNICEF Office of Research)
Goran Holmqvist (Associate Director, UNICEF Office of Research)
Dominic Richardson (Senior Education Specialist, UNICEF Office of Research)
Dale Rutstein (Chief, Communication Unit, UNICEF Office of Research)
Administrative support at the UNICEF Office of Research was provided by Cinzia Iusco Bruschi and Laura Meucci. Production was overseen by Eve Leckey.
ACKNOWLEDGEMENTS
I N N O C E N T I R E P O R T C A R D 1 3 4 7

4 8 I N N O C E N T I R E P O R T C A R D 1 3
Previous issues in this series:
Innocenti Report Card 1
A league table of child poverty in rich nations
Innocenti Report Card 2
A league table of child deaths by injury in rich nations
Innocenti Report Card 3
A league table of teenage births in rich nations
Innocenti Report Card 4
A league table of educational disadvantage in rich nations
Innocenti Report Card 5
A league table of child maltreatment deaths in rich nations
Innocenti Report Card 6
Child poverty in rich countries 2005
Innocenti Report Card 7
Child poverty in perspective: An overview of child
well-being in rich countries
Innocenti Report Card 8
The child care transition: A league table of early childhood
education and care in economically advanced countries
Innocenti Report Card 9
The children left behind: A league table of inequality in
child well-being in the world’s rich countries
Innocenti Report Card 10
Measuring child poverty: New league tables of child
poverty in the world’s rich countries
Innocenti Report Card 11
Child well-being in rich countries: A comparative overview
Innocenti Report Card 12
Children of the recession: The impact of the economic
crisis on child well-being in rich countries
Graphics: MCC Design, UK (mccdesign.com)
Printed by:
Innocenti Report Card 13, 2016
Fairness for Children: A league table of inequality in child well-being in rich countries
UNICEF Office of Research – Innocenti Piazza SS. Annunziata, 12 50122 Florence, Italy Tel: +39 055 20 330 Fax: +39 055 2033 220 [email protected] www.unicef-irc.org
ISBN: 978 88 6522 045 0
© The United Nations Children’s Fund (UNICEF) April 2016
Sales no.: E.16.XX.1
ISBN: 978-88-6522-045-0
eISBN: 978-92-1-057893-6