Embed Size (px)
Citation preview

February 7, 2018Governor Rick Snyder
Lt. Governor Brian CalleyState Budget Director John J. Walsh

2
Michigan’s Momentum
• Added over 540,000 private-sector jobs• Ranked #1 in the Great Lakes Region• Ranked #6 nationally
• Unemployment has fallen by 10% since 2009• Lowest unemployment rate in 17 years
• Per capita income growth from 2010 through Sept. 2017 grew 28%
• #1 in the Great Lakes Region• #6 in nation

3
Michigan’s Momentum
• In 2017, more people moved into Michigan than moved out• #1 in the Great Lakes Region for inbound migration of people with a
bachelor’s degree
• #1 in the creation of manufacturing jobs in the country • 76% of U.S. R&D in the auto industry is done in Michigan• World’s leader in Mobility – Planet M Initiative
• The second most diverse agriculture industry in the nation• Grown to over a $100 billion dollar industry• Value added processors expanding and coming to Michigan

4
FY19 Budget Plan:
Almost three quarters of the total spending is dedicated to education and health and human services.
Health andHuman Services
45%
Jobs11%Education
29%
Government Services
7%
Environment2%
Public Safety6%
Total FY 2019 Gross Spending is $56.8B, up only 0.6%
5
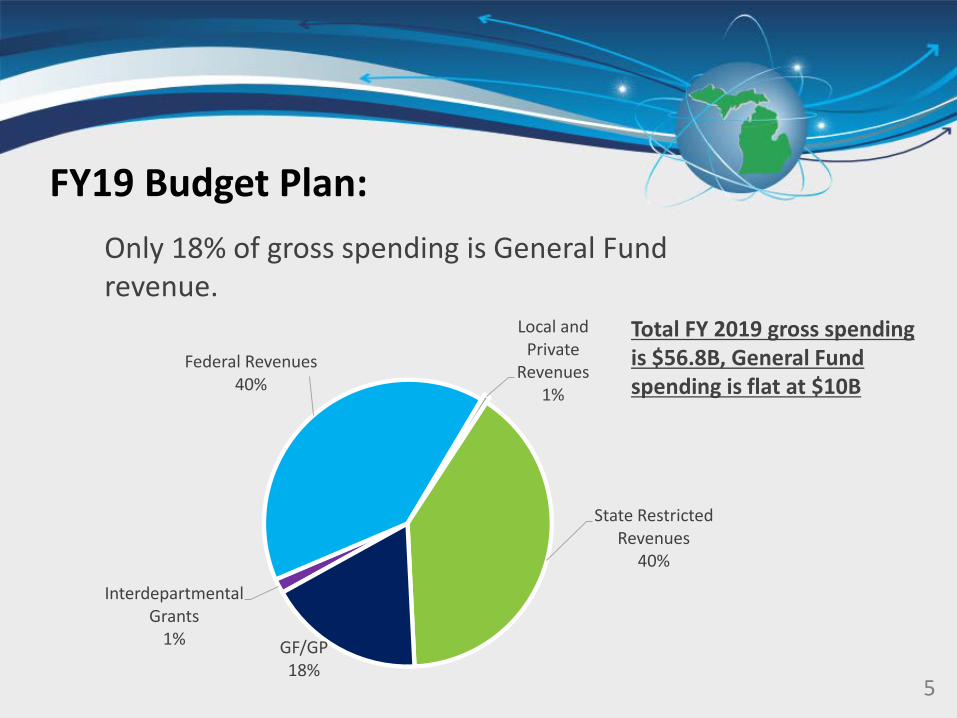
FY19 Budget Plan:
Interdepartmental Grants
1%
Federal Revenues40%
Local and Private
Revenues1%
State Restricted Revenues
40%
GF/GP18%
Only 18% of gross spending is General Fund revenue.
Total FY 2019 gross spending is $56.8B, General Fund spending is flat at $10B

Maximizing Our Momentum
6
• Providing for a wide scope of tax relief • Increasing K-12 and higher education funding• Accelerating support for roads and transportation• Prioritizing safety for Michiganders• Making strategic one-time investments
2019 Budget • Total budget $56.8B, up 0.6 percent • General Fund $10B, no change from 2018• Projected inflation rate for 2019 is 1.9 percent

Tax Relief for Michiganders
7
• Increased Homestead Property Tax Credit
• Increased maximum credit by $300
• Increasing income cap by $10,000
• Total for FY2019 is $205.6M
• Phase out of Sales Tax on the Difference for trade in vehicles, total
benefit for FY2019 is $42M
• Personal Property Tax reform, total for FY2019 is $438M
• Total Tax Relief for FY2019 is $685.6M

8
2019 Ongoing General Fund Reductions $5 Million & Above New Investments $5 Million & Above
IT Investment Fund, $25M Indigent Defense Commission, $46M
Corrections facility closure, $18.8M Prisoner Food Service, $13.7DHHS Managed Care Rule savings, $21.2M
Rural Hospital payments, $7M
Restoring cost share for foster care, $8M PFAS contaminant response, $8MBusiness Attraction/Community Revitalization, $5.1M
Reduce various Corrections items, $6M
Medicaid pharmaceutical savings, $5MAll others totaling $40.3M All others totaling $36MTotal GF Reductions, $129.4M Total GF Investments, $110.7M 8

9
2019 Ongoing School Aid Fund Reductions $5 Million & Above New Investments $5 Million & Above
Shared Time reforms, $67.9M Foundation allowance increase, $312M
Cyber School reduction, $25M CTE per-pupil payment, $5M
University operations, $28.6M
Early On funding, $5M
All others totaling $0.3M All others totaling $0.5MTotal SAF Reductions, $93.2M Total SAF Investments, $351.1M

10
2019 One-time investmentsOne-time Investments $5 Million and Above (Combined GF & SAF; FY18 + FY19)
Accelerated roads investment, $175M
Pre-pay capital outlay projects, $112.1M
Flint investments, $25.9M
Statewide Broadband $20M total ($13.6M GF and $6.4M Restricted)
Going Pro funding, $10M
Corrections custody staff training, $9.3M
State Police trooper schools $6.1M (plus $3.8M ongoing)
All Other, $30.7M
Total One-time Investments, $382.7M 10

Educating Michigan’s Tomorrow Today
11*FY 18 includes an additional $200 million for one-time MPSERS liability paydown**Does not include federal funding, adult education funding, or preschool funding
$12.6 Billion*
$6.5 billion
$7.5 billion
$8.5 billion
$9.5 billion
$10.5 billion
$11.5 billion
$12.5 billion
FY 2011 FY 2012 FY 2013 FY 2014 FY 2015 FY 2016 FY 2017 FY 2018 FY 2019
$10.7 billion
$11.7 billion
$11.0 billion$10.8 billion
$12.0 billion
$11.6 billion$11.3 billion
$12.4 billion $12.6 billion

Educating Michigan’s Tomorrow Today• Foundation allowance, $312M ($120-$240/per-pupil increase)
• Largest increase in minimum foundation allowance in 15 years• Equity gap closed by 54% since 2011-2012
• Career and technical training (CTE), up to an additional $50 per enrolled high school student, $5M
• New Early on Funding, $5M
• This funding from SAF growth and Shared Time and Cyber-Schools, $92.9M
12

Education Foundation Allowance
13
5,000
5,500
6,000
6,500
7,000
7,500
8,000
8,500
2012 2013 2014 2015 2016 2017 2018 2019
Minimum State Foundation Allowance Maximum State Foundation Allowance
$6,8
46
$8,0
19
$6,9
66
$8,0
19
$7,0
76
$8,0
49
$7,2
51
$8,0
99
$7,3
91
$8,1
69
$7,5
11
$8,2
29
$7,6
31
$8,2
89
$7,8
31
$8,3
89
$1,1
73 G
ap
$1,0
53 G
ap
$973
Gap
$848
Gap
$778
Gap
$718
Gap
$658
Gap
$558
Gap

Total Pre-K to 12 Funding Per Student
14
$7,067 $7,285 $7,560 $7,874 $8,006 $8,266 $8,661 $8,734
$2,190 $2,173 $2,144 $2,252 $2,340 $2,341 $2,409 $2,488 $1,070 $1,109 $1,193
$1,200 $1,189 $1,161 $1,164 $1,167
0
2,000
4,000
6,000
8,000
10,000
12,000
FY12 FY13 FY14 FY15 FY16 FY17 FY18 FY19 Exec Rec
Stat
e Do
llars
Per
Pup
il
Fiscal Year
State Funds Local Funds Federal Funds
$10,567 $10,897$11,326 $11,535 $11,768 $12,234 $12,389
$10,327

On Track to Pay Liabilities off by 2038
15
$(10)
$-
$10
$20
$30
$40
$50
2006
2007
2008
2009
2010
2011
2012
2013
2014
2015
2016
2017
2018
2019
2020
2021
2022
2023
2024
2025
2026
2027
2028
2029
2030
2031
2032
2033
2034
2035
2036
2037
2038
Billi
ons
MPSERS Unfunded Liabilities 2006-2038
*Uptick in 2016 is the result of lowering assumed rate of return to 7.5%, thereby lowering long-term risk.
Pre-reform
Post-reformProjected

Higher Education Funding
16
• University operations increase of $28.6M ongoing• Total funding to $1.5B• 2 percent increase
• Tuition Restraint • 3.8 percent (2x inflation)
• MSU AgBioResearch, increase of $679K
• MSU Extension operations, increase of $585K

Transportation Funding
17
Accelerating to nearly $1 billion in new transportation revenues 2017 - 2019.
$483$627 $632 $637 $641
$150$325
$600$175
$0
$200
$400
$600
$800
$1,000
$1,200
$1,400
FY 2017 FY 2018 FY 2019 FY 2020 FY 2021 Fuel & Registration Income Tax General Fund Acceleration
$0.5B
$0.6B
$1.0B
$1.2B
(in
mill
ions
)
$1.0B

Transportation Funding
18
Over 60 percent of state road and bridge funding supports local roads.
Cities & Villages22%
County Road Commissions
40%
State Roads38%
TOTAL: $2.7 billion

Prioritizing Michigan’s Safety
19
• Funding 50 additional troopers; $3.8M ongoing, $3.1M one-time
• Funding 80 troopers for the state’s attrition school, $3M one-time
• Replacement of outdated technology (car cameras), $1.25M ongoing
• State Police recruitment and outreach, $1M (FY18 supplemental)
• Train over 350 new corrections officers to fill department vacancies, $9.2M one-time
• Funding 10 Conservation Officers, $1.5M ongoing
• Campus Sexual Assault Prevention & Education Initiative, $600K one-time; additional requests in process

Responsible Use of Lapsed Funds
20
• Nearly $300M in FY17 lapsed funding needs to go to one-time uses.
• $175M for Roads and Infrastructure
• $112M to pre-pay already approved Capital Outlay projects: Capitol Building and new veterans homes
• Avoids $48M in long-term interest costs

Strategic One-Time Investments
21
• Statewide Broadband, $20M
• Next Generation Technologies/Mobility Pilot, $20M (included in state share of $175M road acceleration)
• Michigan Israel Business Accelerator, $2.5M total for 5 years
• Project Rising Tide, $2M
• Employment First Program, $500K

Additional Budget Related Items
22
• One time funding of upcoming Marshall Plan for Talent –rollout later this month
• Two environmental infrastructure programs• Renew Michigan Initiative
• Water Infrastructure Investment
• Equitable sharing of excess PPT distributions
• Indigent defense statutory reforms
• Revise tax refund allocation between GF and SAF

Two Environmental Infrastructure Initiatives
23
• Renew Michigan investment of $79M to replace bond funds that have been depleted, to clean up contaminated sites, improve solid waste management and recycling, provide water quality monitoring and improve state park infrastructure. Average cost of $4.75 yr per family
• Water Infrastructure Investment of $110M to fund integrated asset management, grant and loan funds for water and sewer infrastructure in communities, and have a fund for water and sewer emergencies. Phased in maximum cost of $5 per person for water systems of 1,000 users or more.
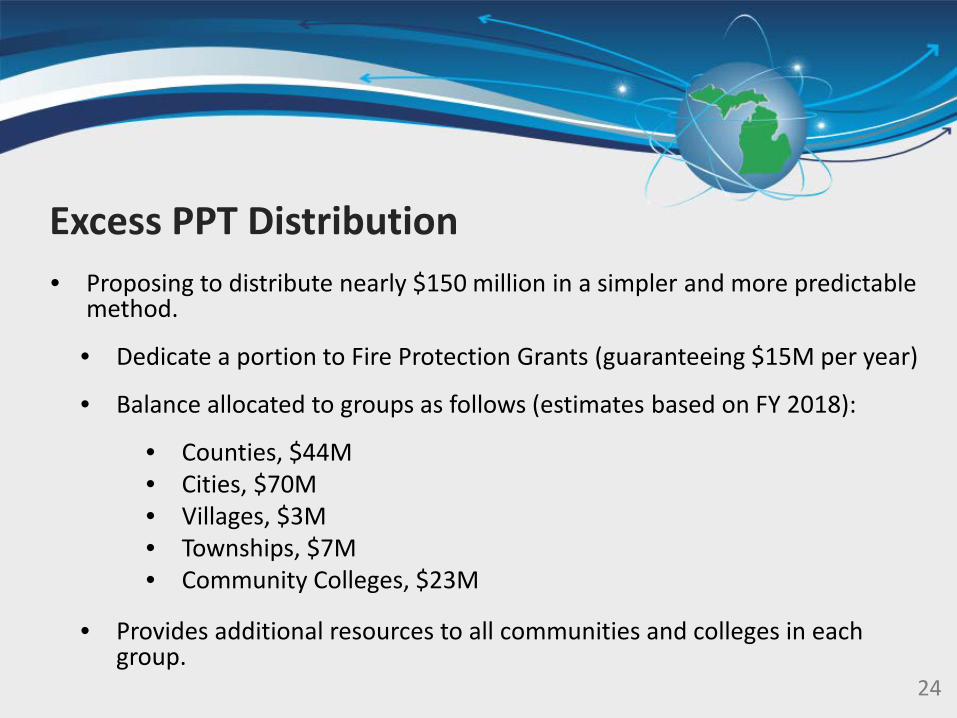
Excess PPT Distribution
24
• Proposing to distribute nearly $150 million in a simpler and more predictable method.
• Dedicate a portion to Fire Protection Grants (guaranteeing $15M per year)
• Balance allocated to groups as follows (estimates based on FY 2018):
• Counties, $44M• Cities, $70M• Villages, $3M• Townships, $7M• Community Colleges, $23M
• Provides additional resources to all communities and colleges in each group.

Rainy Day Fund Approaching $1 Billion
25Fiscal Year
Mill
ions
*2019 Projected. Plus 25% of FY2018 lapsed funds.
$1,254
$994
$145
$0 $81
$2 $2 $2 $2 $2 $2 $2
$365
$506
$386
$498
$612$710
$889 $922
$0
$200
$400
$600
$800
$1,000
$1,200
$1,400
2000 2001 2002 2003 2004 2005 2006 2007 2008 2009 2010 2011 2012 2013 2014 2015 2016 2017 2018 2019
Budget Stabilization Fund
Questions?
Thank you.
26