Embed Size (px)
Citation preview

Sede Amministrativa: Università degli Studi di Padova
Dipartimento di Geoscienze
SCUOLA DI DOTTORATO DI RICERCA IN : Scienze della Terra
CICLO XXIII
STRATIGRAPHIC ANALYSIS ON MONTE AGNELLO AND LATEMAR PLATFORMS
(Southern Alps, Dolomites, Italy)
Direttore della Scuola: Ch.mo Prof. Gilberto Artioli
Supervisore: Ch.mo Prof. Paolo Mietto
Co-supervisore: Dr. Nereo Preto
Dottorando : Alessandro Marangon


Muere lentamente quien se transforma en esclavo del hábito,
repitiendo todos los días los mismos trayectos,quien no cambia de marca,
no arriesga vestir un color nuevoy no le habla a quien no conoce [...]
Pablo Neruda


To my parents, my brother and Lisa,
needles on the compass of my life


Contents
I
1. Introduction 1
1.2 The Latemar Paradox
1.3 The Latemar cycle
2. Cyclostratigraphy 11
2.1 Orbital parameters
2.1.1 Eccentricity
2.1.2 Obliquity
2.1.3 Precession
3. Environmental Magnetism 17
3.1 Magnetic Susceptibility
3.2 Anhysteretic remanent magnetization
3.3 Saturation isothermal remanent magnetization
3.4 S-Ratio
4. The Latemar paradox: a possible solution? 23
5. The growth history of the Agnello platform 27
5.1 Introduction
5.2 Geological Setting
5.3 Stratigraphic analysis
5.3.1 Stratigraphic sections
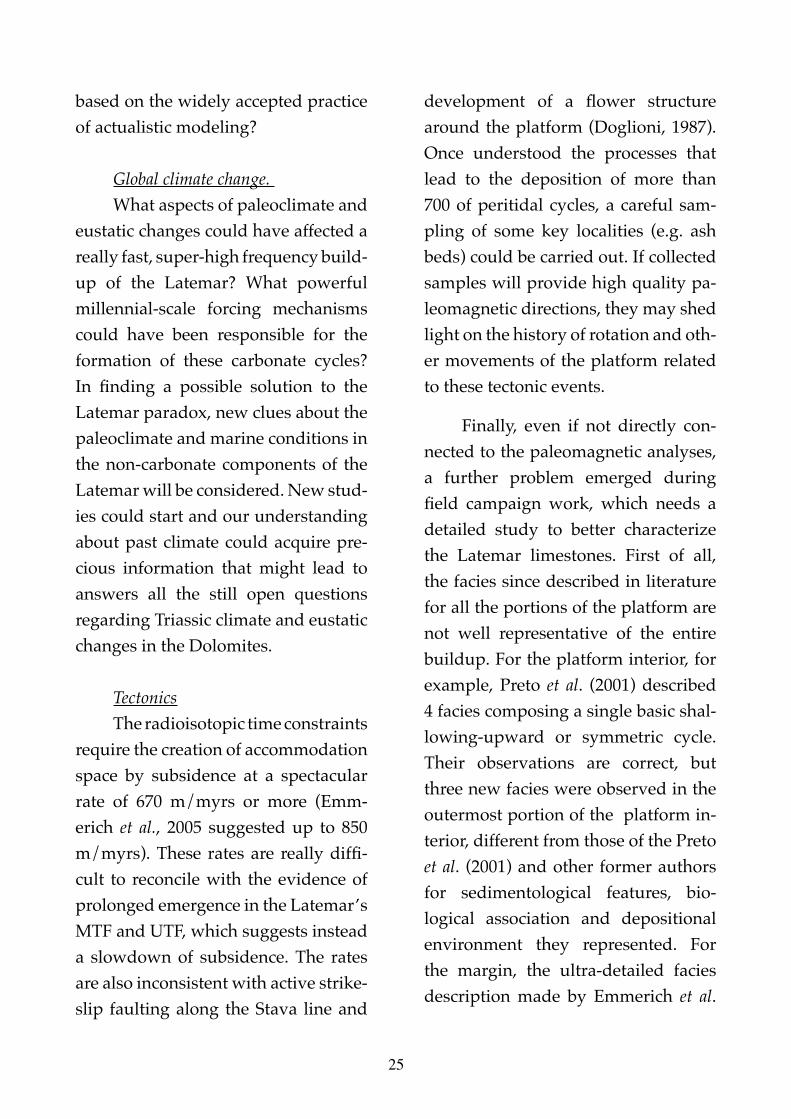
5.3.2 Baito La Bassa Section
II
5.3.3 Baito Valbona Section
5.3.4 Microfacies Analysis
4.4 Ammonoid Biostratigraphy
4.5 2.5D Model
4.6 Discussions
5.6.1 Biostratigraphy
5.6.2 Growth History
5.6.3 The Stava Line
7.7 Conclusions
6. The Latemar: a mud mound platform dominated by microbialites 47
6.1 Introduction
6.1.1 The Latemar
6.1.2MicrobialCarbonates:definitions
6.1.3 Controls on carbonate platforms growth
6.2 Geological Setting
6.2.1 Carbonate production organisms after the P/T mass extinction
6.3 Materials and Methods
6.4 Facies belt of the Latemar platform
6.5 Discussions
6.5.1 A strong imprint of early diagenesis
6.5.2 Is the M-Factory responsible for carbonate production?
6.5.3 Latemar: a “mud mound” platform
6.5.4 A comparison with other platforms worldwide
6.6 Conclusions
7. Environmental magnetism of the Ttriassic Latemar platform 67
7.1 Introduction
7.1.1 The Latemar controversy: collapse of an age-old paradigm?
7.1.2 Emerging rock magnetic-based proxies for carbonate platforms
7.2 Geological Setting
7.3 Materials and Methods
7.3.1 Samples
7.3.2 Magnetic Measurements
7.3.3 Statistical Time Series Analysis
7.4 Results
7.4.1 Cima Forcellone
7.4.2 CDL Series
7.5 Discussions
7.5.1Originofthemagneticsignalanditspaleoenvironmentalsignificance
7.5.2 Spectral characteristics and comparison with lithological series
7.5.3 The Latemar cyle: evidence for a Milankovitch or a sub-Milankovitch timing?
7.6 Conclusions
8. Conclusions 91
References 95
III


Introduction
Cyclostratigraphy is emerging as a central focus in stratigraphy,
with its impressive record of global climate changes forced by Earth’s astronomical parameters, and with its capacity to provide high- reso-lution information about geologic time. Shallow-marine cyclostrati-graphy, principally from carbonate-rich peritidal facies, represents the main source of information about astronomical forcing and global cli-mate change prior to the Jurassic. Mineral magnetic parameters (MS, ARM, SIRM, S-ratio, ARM/MS and ARM/SIRM ratio) provide new information about shallow-mari-ne cyclostratigraphy. They reveal a coherent signal indicating magne-tic concentration variations in tune with a depth index derived from fa-cies cyclicity (Mayer & Appel, 1999). The Dolomites area of the Southern Alps (Italy) was characterized, at the end of the Anisian (Middle Triassic), by an episode of exceptionally high
subsidence, that caused dramatic aggradation of isolated carbonate platforms. Some carbonate buil-dups grew up to 700 m (e.g., Brack et al., 2007) until subsidence rates dropped and a progradational pha-se began (Bosellini, 1984). Thanks to the exceptional preservation and exposure, the sedimentary cyclicity of the Latemar and Monte Agnello platform interiors, represented by high order peritidal cycles, is evi-dent.
The combined study of fa-cies and magnetic parameters is a powerful tool in investigating cycli-cities and opens new issues about its origin.
Growth history of the AgnelloPlatform
Strong dolomitization characte-rizes the whole platform, making thus impossible every kind of stu-dy regarding magnetic parameters. Nonetheless collected field data allowed to reconstruct the growth
Extended abstract (english)

history of the buildup, a carbonate platform never studied by anyone.
A detailed geological mapping of Monte Agnello platform was un-dertaken and geological data were draped on a high resolution Digital Terrain Model in order to evaluate the geometrical parameters of the platform. Stratigraphic sections were logged within the upper slope-mar-gin-lagoon progradational system, and the microfacies of the platform interior were compared with those of the nearby aggradational Latemar platform. A biostratigraphic study of dasycladacean algae and scatte-red ammonoids findings was also carried out, but yielded few results. However, ammonoids of the avi-sianum and crassus subzones were recovered in the lower-middle part of the aggradational platform inte-rior. It was possible to reconstruct the growth history of this platform. The Agnello massif preserves a por-tion of a carbonate platform that was prograding towards North, al-though it is impossible to determine whether the platform was isolated or attached to a putative southern structural high. It grew nearly 600 m until subsidence rates suddenly dropped, and then prograded at least 3.5 km; the buildup reached a total thickness of about 700 m. Cli-noforms are steep, 30° on average. The platform sediments are sealed by a subaerial pyroclastic succes-sion that lies on a slightly karstified surface. Extended microbial crusts (including common Tubiphytes),
and corals characterized margin and upper slope during the pro-gradational phase. The inner pla-tform is constituted by submetric peritidal sedimentary cycles with prevailing subtidal facies. Microfa-cies are more micritic, and grains more deeply micritized than those of the aggrading Latemar platform, reflecting longer residence time of lagoonal sediments before burial. Well developed tepee belts as those of the Latemar platform are absent. Thin sections analysis reveals that sedimentary environments chan-ged significantly in the lagoon at the switch from aggradation to pro-gradation. The thickness of the pla-tform is comparable or higher than that of other coeval platforms in the Southern Alps, including those that underwent drowning in the Late Anisian. This suggests that strong subsidence was not the primary cause of drowning, although it may have enhanced the effects of paleo-ceanographic or climatic factors as suggested by Preto et al. (2005) and Brack et al., (2007).
The petrological and magneticmineral composition of the Latemarcycles
The Latemar massif appears to be more suitable than Monte Agnel-lo for magnetic analysis because se-veral portions of the platform are not affected by dolomitization. 102 m of inner platform series were sampled at Cimon del Latemar in order to in-

vestigate MS, ARM, SIRM, S-ratio, ARM/MS and ARM/SIRM ratio. SEM observation and Lowrie Test were carried out on a subset of sam-ples to determine the mineralogy of the magnetic grains. All the measu-rements were made in collaboration with prof. Ken Kodama (Lehigh University, Bethlehem, USA) while the spectral analysis was performed with the collaboration of prof. Linda Hinnov (Johns Hopkins University, Baltimore, USA).
The results obtained are here summarized:
Facies measurements exhibit a cyclic pattern. The spectra obtai-ned from the facies rank are anyway quite noisy: that happens because facies ranking is obtained from the basis of interpretation. Problems are still present in the definition of a sedimentary cycle and in its reco-gnition on the field.
A clear cyclic signal emerges from the spectra related to the ma-gnetic parameters. Some of the pa-rameters chosen are more suitable than other for a cyclostratigraphic purpose because it depends on what each parameter is measuring. For example, MS, measuring all the magnetic components of the rock (diamagnetic, paramagnetic and ferromagnetic), is not a good tool in the case of carbonate rocks. The carbonate component is prevai-ling on the ferromagnetic minerals, masking in this way their contribu-tion. ARM and SIRM are the best parameters because they measure
only the ferromagnetic component (all the minerals in the matter of SIRM, low coercivity components in the matter of ARM).
A comparison between the spectra from rank series and ma-gnetic parameters reveals a correla-tion among them. Two meaningful peaks describing a 5:1 ratio emer-ge in both cases and they are in the same frequency range
Box-plot and covariance tests were applied but facies ranking and magnetic parameters appear inde-pendent. The correlation between the two is close to zero. This means that they are related to different causes, even if they reveal cyclities beating at the same time. Facies ranking is thus easily linked to sea level changes (exhibiting an alter-nation of subtidal and supratidal facies), while magnetic parameters reveal values falling in the range of aeolian dust (Oldfield et al. 1985, Hounslow and Maher, 1999).
We can observe in the field two kinds of cycles: a first on one the order of 1 m and a second one one the order of 5 m. They are phy-sical expression of the 5:1 ratio clear-ly visible also in the spectra. They are traditionally related to the Mi-lankovian parameters of eccentrici-ty and precession occurring every 100 and 22 Kyrs. This implies a 10 Myrs time span for the whole Late-mar platform. Radiometric ages in-stead give instead less than 1 Myr time span for the buildup. In this case, the 5:1 bundling should refer
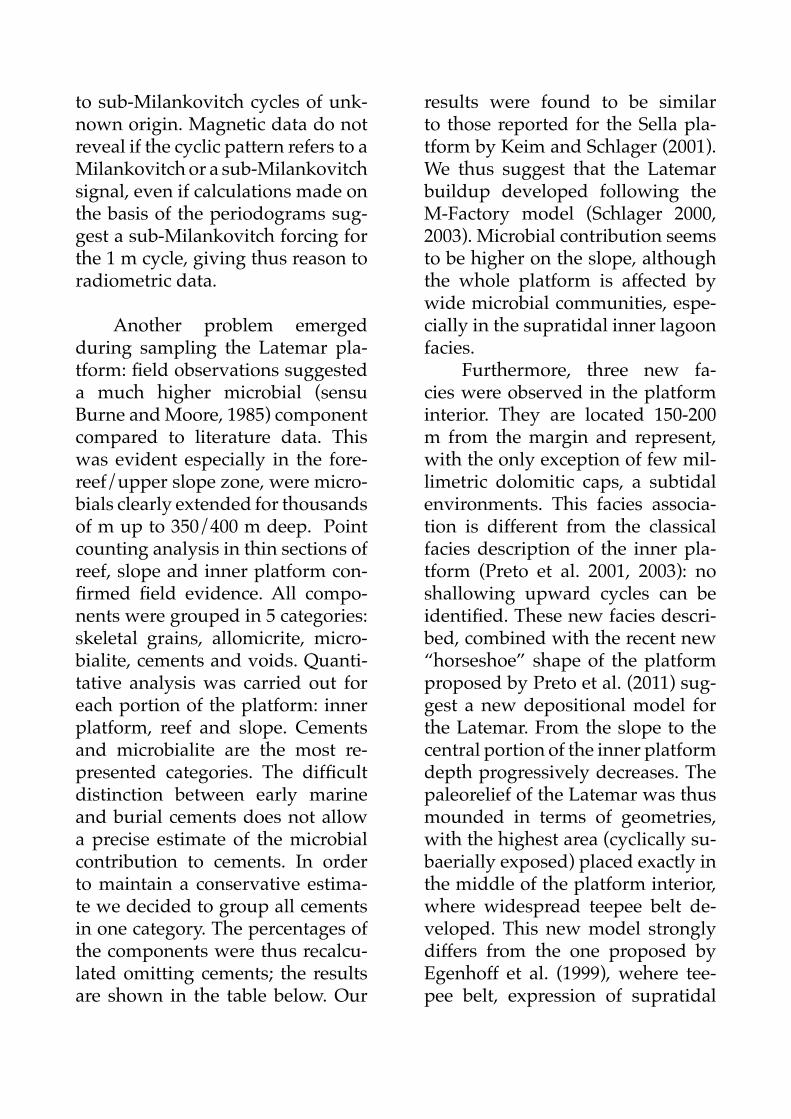
to sub-Milankovitch cycles of unk-nown origin. Magnetic data do not reveal if the cyclic pattern refers to a Milankovitch or a sub-Milankovitch signal, even if calculations made on the basis of the periodograms sug-gest a sub-Milankovitch forcing for the 1 m cycle, giving thus reason to radiometric data.
Another problem emerged during sampling the Latemar pla-tform: field observations suggested a much higher microbial (sensu Burne and Moore, 1985) component compared to literature data. This was evident especially in the fore-reef/upper slope zone, were micro-bials clearly extended for thousands of m up to 350/400 m deep. Point counting analysis in thin sections of reef, slope and inner platform con-firmed field evidence. All compo-nents were grouped in 5 categories: skeletal grains, allomicrite, micro-bialite, cements and voids. Quanti-tative analysis was carried out for each portion of the platform: inner platform, reef and slope. Cements and microbialite are the most re-presented categories. The difficult distinction between early marine and burial cements does not allow a precise estimate of the microbial contribution to cements. In order to maintain a conservative estima-te we decided to group all cements in one category. The percentages of the components were thus recalcu-lated omitting cements; the results are shown in the table below. Our
results were found to be similar to those reported for the Sella pla-tform by Keim and Schlager (2001). We thus suggest that the Latemar buildup developed following the M-Factory model (Schlager 2000, 2003). Microbial contribution seems to be higher on the slope, although the whole platform is affected by wide microbial communities, espe-cially in the supratidal inner lagoon facies.
Furthermore, three new fa-cies were observed in the platform interior. They are located 150-200 m from the margin and represent, with the only exception of few mil-limetric dolomitic caps, a subtidal environments. This facies associa-tion is different from the classical facies description of the inner pla-tform (Preto et al. 2001, 2003): no shallowing upward cycles can be identified. These new facies descri-bed, combined with the recent new “horseshoe” shape of the platform proposed by Preto et al. (2011) sug-gest a new depositional model for the Latemar. From the slope to the central portion of the inner platform depth progressively decreases. The paleorelief of the Latemar was thus mounded in terms of geometries, with the highest area (cyclically su-baerially exposed) placed exactly in the middle of the platform interior, where widespread teepee belt de-veloped. This new model strongly differs from the one proposed by Egenhoff et al. (1999), wehere tee-pee belt, expression of supratidal

environments are considered a belt isolating a submerged inner lagoon from a margin, submerged too.

Introduzione
Lo studio della Ciclostra-tigrafia, grazie all’incre-dibile numero di infor-
mazioni e all’alta risoluzione dei dati che fornisce riguardo ai cam-biamenti climatici legati a parame-tri astronomici, rappresenta ormai un punto cardine della stratigrafia. In particolare, studi ciclostratigrafi-ci su sedimenti di acque basse, spe-cialmente carbonati ricchi in facies intertidali, rappresenta una delle principali fonti di informazione ri-guardo alle variazioni climatiche e al forcing astronomico da tempi re-centi sino al Giurassico. Nuove in-formazioni sulla ciclostratigrafia di ambienti marini di acque basse può essere fornita dallo studio di alcuni parametri (MS, ARM, SIRM, S-ra-tio, ARM/MS e ARM/SIR) ricava-bili da minerali magnetici di origine detritica. L’analisi delle curve legate alle variazioni di concentrazione di questi minerali rivela marcate simi-litudini con le variazioni di profon-dità ricavabili dall’analisi di facies
(Mayer & Appel, 1999).L’area delle Dolomiti, nelle Alpi
Meridionali (Italia) è stata interes-sata da un episodio di forte subsi-denza durante l’Anisico sommitale (Triassico Medio) che ha portato ad una forte aggradazione di piattafor-me carbonatiche isolate. Alcune di esse hanno raggiunto spessori pari a 700 m (es., Brack et al., 2007) pri-ma che la subsidenza cessasse im-provvisamente per lasciare spazio ad una fase progradante (Bosellini, 1984). Le piattaforme carbonatiche del Monte Agnello e del Latemar, grazie alla loro ottima preservazio-ne ed esposizione degli affioramen-ti, mostrano molto bene la ciclicità della piattaforma interna, rappre-sentata da cicli peritidali di sesto ordine.
Lo studio combinato di facies e parametri magnetici rappresenta dunque un potente mezzo per stu-diare la ciclicità ed apre nuovi oriz-zonti circa le sue origini.
Extended abstract (italiano)
LapiattaformadelMonteAgnel-lo
Nessuno studio circa le pro-prietà magnetiche è stato possibile per quanto riguarda la piattaforma del Monte Agnello a causa della forte dolomitizzazione che con-traddistingue l’intero edificio. Cio-nonostante, durante il rilevamento dell’area sono stati raccolti numero-si dati che hanno permesso di rico-struire la storia della piattaforma, di cui non sono presenti dati in biblio-grafia.
Un rilevamento geologico det-tagliato della piattaforma ha prodot-to una carta successivamente unita ad un Modello Digitale del Terre-no (DTM): in questo modo è stato possibile visualizzare le geometrie della piattaforma. Due sezioni stra-tigrafiche sono state misurate nella porzione progradante della piatta-forma comprendenti il passaggio scarpata-margine-laguna interna. Le microfacies della piattaforma interna sono state confrontate con quelle provenienti dalla porzione aggradante della coeva piattafor-ma del Latemar. Lo studio biostra-tigrafico su alghe dasycaldacee e ammonoidi non ha permesso pre-cise datazioni, soprattutto a causa dell’assenza di campioni di ammo-noidi ritrovati in situ. I campioni di ammonoidi ritrovati appartengono alle subzone ad avisianum e cras-sus. Il massiccio del Monte Agnel-lo preserva una porzione della fase
progradante, con clinoformi rivolte a nord, sebbene sia impossibile de-terminare se la piattaforma fosse o meno attaccata a qualche alto strut-turale presente nell’area. La fase aggradante ha portato alla depo-sizione di circa 600 m di piattafor-ma, prima dell’improvvisa diminu-zione del tasso di subsidenza. Una progradazione di almeno 3.5 Km è seguita, portando ad uno spesso-re totale della piattaforma di 700 m. Le clinoformi sono ripide,30° in media. I sedimenti di piattaforma sono coperti da flussi piroclastici subaerei che si sono deposti su una superficie debolmente carsificata. Estese croste microbialitiche e co-ralli caratterizzano il margine e la porzione sommitale della scarpata surante la fase progradante. La piat-taforma interna è costituita da da cicli peritidali submetrici con una prevalenza di facies subtidali. Le microfacies sono più micritiche ed i grani molto più micritizzati rispetto a quelli presenti nella porzione ag-gradante della piattaforma interna del Latemar. Ciò è espressione di un maggior tempo di residenza dei sedimenti prima del seppellimento. Sono assenti le ben sviluppate fasce a teepee che invece si ritrovano nel Latemar. L’analisi in sezione sottile delle rocce di piattaforma mostra un significativo cambiamento nell’am-biente di sedimentazione al passag-gio tra aggradazione e progradazio-ne. Lo spessore della piattaforma è comparabile o addirittura maggiore rispetto alle altre piattaforme coeve

delle Alpi Meridionali, comprese quelle annegate durante l’Anisico sommitale. Sulla base di queste os-servazioni, la subsidenza potrebbe non essere la causa primaria del-l’annegamento delle piattaforme: potrebbe bensì aver enfatizzato gli effetti legati a fattori paleoceano-grafici o paleclimatici come sugge-rito da Preto et al. (2005) e Brack et al. (2007)
La composizione petrografica e magneticadeiciclidelLatemar.
Il massiccio del Latemar è più adatto per analisi di tipo magnetico rispetto alla piattaforma del Monte Agnello in quanto diverse sue por-zioni non risultano affette da dolo-mitizzazione. 102 m di piattaforma interna sono stati campionati sul Cimon del Latemar per studiare l’andamento di MS, ARM, SIRM, S-ratio, ARM/MS e ARM/SIRM. Per determinare la mineralogia dei granuli magnetici una serie di cam-pioni è stata sottoposta ad indagini attraverso microscopio elettronico a scansione (SEM) e il Test di Lowrie. Le prove di laboratorio sono state condotte in collaborazione con il prof. Ken Kodama (Università di Lehigh, Bethlehem, USA), mentre l’analisi spettrale è stata condotta in collaborazione con la prof. Linda Hinnov (Università Johns Hopkins, Baltimora, USA). I risultati ottenuti sono i seguenti:
L’analisi spettarele delle facies mostra un pattern ciclico. Gli spettri
ottenuti sono comunque piuttosto rumorosi, un problema imputabile al fatto che la determinazione delle facies è basata sull’interpretazione del dato di terreno. Inoltre, ancora vi sono incertezze circa la definizio-ne e l’identificazione di un ciclo se-dimentario.
Un chiaro segnale ciclico emerge dall’analisi spettrale dei pa-rametri magnetici. Alcuni dei pa-rametri scelti appaiono migliori di altri. Per esempio la suscettibilità magnetica (MS), misurando tutte le componenti magnetiche di una roc-cia (dia, para e ferromagnetica), non risulta essere un buon parametro nei carbonati. La componente car-bonatica infatti prevale nettamente sui minerali ferromagnetici masche-randone il contributo. ARM e SIRM sono i parametri migliori in quanto misurano solo la componente fer-romagnetica (rispettivamente delle fasi a bassa coercitività nel caso di ARM, di tutte le fasi mineralogiche nel caso di SIRM).
Il confronto tra gli spettri delle facies e quelli dei parametri magne-tici mostra importanti similitudini. Due picchi significativi sono pre-senti in entrambi i casi nello stesso range di frequenza, e mostrano un rapporto tra essi di 5:1
Test statistici (box-plot e anali-si di covarianza) sono stati applicati per testare la dipendenza tra facies e parametri magnetici. La correl-zione tra loro è tuttavia vicina allo zero, quindi essi sembrano indipen-denti. La ciclcità che entrambi mo-
strano presenta tuttavia nella stessa frequenza: ciò significa che facies e parametri magnetici variano per cause differenti. Le variazioni nelle facies sono facilmente interpretabili come risposta a variazioni eustati-che (alternanza tra facies subtidali e supratidali), mentre i valori legati ai parametri magnetici suggerisco-no un legame con l’apporto di eo-lico di polveri (Oldfield et al., 1985; Hounslow e Maher, 1999).
Sul terreno si possono ricono-scere due tipo di cicli: uno dell’ordi-ne di un metro,, il secondo dell’or-dine di 5 m. Essi sono espressione fisica del rapporto 5:1 visibile dagli spettri. Tradizionalmente essi ven-gono messi in relazione con i para-metri Milankoviani di eccentricità e precessione, che si ripetono rispet-tivamente ogni 100.000 e 22.000 anni. Ciò implicherebbe una dura-ta di sviluppo della piattaforma di 10 milioni d’anni. Dati radiometrici indicano invece che il Latemar si è sviluppato in meno di un milione d’anni: il rapporto di 5:1 eviden-ziato da facies e parametri magne-tici dovrebbe dunque riferirsi a ci-clicità submilankoviane di origine al momento sconosciuta. L’analisi dei dati magnetici non permette di capire se il segnale registrato dalle rocce abbia carattere Milankoviano o sub-Milankoviano, sebbene l’ana-lis dei periodogrammi suggerisca una relazione tra il ciclo metrico e un forcing sub-Milankoviano, asse-condando i dati radiometrici.
Un nuovo ed interessante pro-blema è poi emerso durante il cam-pionamento della piattaforma del Latemar: sul terreno la componente di origine microbiale (sensu Bur-ne and Moore, 1985) sembra essere molto maggiore rispetto a quanto sinora presente in letteratura. Que-sto dato è particalrmente evidente nella regione compresa tra il margi-ne esterno e la porzione superiore della scarpata, sulla quale bound-stone microbiali si estendono sino a 350-400 m di profondità. Questa evidenza è stata confermata dai conteggi svolte sulle sezioni sotti-li di campioni di margine, scarpa-ta e piattaforma interna. Le varie componenti sono state suddivise in 5 categorie: granuli scheletrici, allomicrite, microbialite, cementi e vuoti. Un’analisi quantitative delle componenti è stata svolta su tutte le porzioni di piattaforma. Cementi e microbialite sono le categorie mag-giormente rappresentate. La diffi-cile distinzione tra cementi marini precoci e cementi legati a seppelli-mento non ha permesso una precisa stima del contributo organico sulla precipitazione del cemento, quindi per ottenre una stima maggiormen-te conservativa si è scelto di rag-gruppare tutti i cementi in un’unica categoria. I risultati ottenuti sono simili ai dati di Keim e Schlager (2001) per la piattaforma del Sel-la. Un dato che suggerisce come la piattaforma del Latemar possa es-sersi sviluppata seguendo il model-lo della M-factory (Schlager, 2000,

2003). Il contenuto di microbialite sembra essere maggiore nella scar-pata, sebbene l’intera piattaforma sia caratterizzata dalla presenza di microbiliti, specialmente nelle fa-cies supratidali della piattaforma interna.
Tre nuove facies infine sono state descritte nella piattaforma in-terna. Esse si rinvengono a circa 150-200 metri dal margine e rappresen-tano ambienti subtidali, eccezzion fatta per pochi millimetrici livelli dolomitizzati. Questa associazione di facies è diversa da quella classica descritta per la piattaforma inter-na (Preto et al. 2001, 2003): non vi sono evidenze di cicli sedimentari. La descrizione di queste nuove fa-cies, unita alla recente forma a ferro di cavallo proposta da Preto et al. (2011) per la piattaforma, permette di ipotizzare un nuovo modello de-posizionale per il Latemar. Partendo dallo slope e muovendosi verso la porzione centrale della piattaforma interna si evidenzia una progres-siva diminuzione della paleopro-fondità. Il paleorilievo del Latemar risulterebbe dunqe arrotondato, presentando la parte più rilevata (e ciclicamente esposta ad emersione) esattamente al centro della piatta-forma, proprio dove si vedono oggi le fasce a teepee. Questo nuovo mo-dello differisce di molto rispetto a quello proposto da Egenhoff et al. (1999), dove le fasce a teepee, rap-presentanti ambienti supratidali, vengono identificate come la por-zione esterna della piattaforma ca-
pace di isolare una laguna interna sommersa.

Among the Middle Triassic carbonate platforms of the
Dolomites, the Latemar buildup is the most studied. Several authors investigated the platform thanks to its exceptional exposure and preservation of depositional geometries. It was described for the first time by Rossi (1957). He focused his attention especially on the paleontological features of the buildup, giving an interesting overview of the biological association that characterizes the platform. During the ‘60s and the ‘70s, all the studies focused on its sedimentology, stratigraphy and on the paleogeography of the surrounding area (Leonardi, 1968; Cros and Lagny, 1969; Bosellini and Rossi, 1974; Cros, 1974; Biddle et al., 1978). The recognizable atoll-like shape and the neat subdivision in two different portions (a first one composed by well stratified limestones in a metric scale and a
second one clearly clinostratified) testified with no doubts the nature of the buildup as an isolated platform. In 1981, Gaetani et al. described the complex relationship between facies distribution and platform geometries.
A conspicuous number of data were collected, for different purpos-es: biostratigraphy (Brack and Rieber, 1993; De Zanche et al., 1995; Manfrin et al., 2005; Preto and Piros, 2008), sedi-mentology and stratigraphy (Gaetani et al., 1981; Harris, 1993, 1994; Blend-inger, 1996; Egenhoff et al., 1999; Em-merich et al., 2005; Peterhänsel and Egenhoff, 2008), sequence stratigra-phy and cyclostratigraphy (Gold-hammer et al., 1987, 1990; Hinnov and Goldhammer, 1991; Zühlke et al., 2003; Zühlke, 2004), geochronology (Mundil et al., 1996, 2003), magneto-stratigraphy (Kent et al., 2004). Such a number of data, from very different study approaches, were not able to solve all the problems involved with
1. Introduction
the growth history of the platform: one in particular is related to the sed-imentation rate of the buildup. How fast did the entire platform grow up? Cyclostratigraphy on one hand, bio and chronostratigraphy on the other tell us two very different stories.
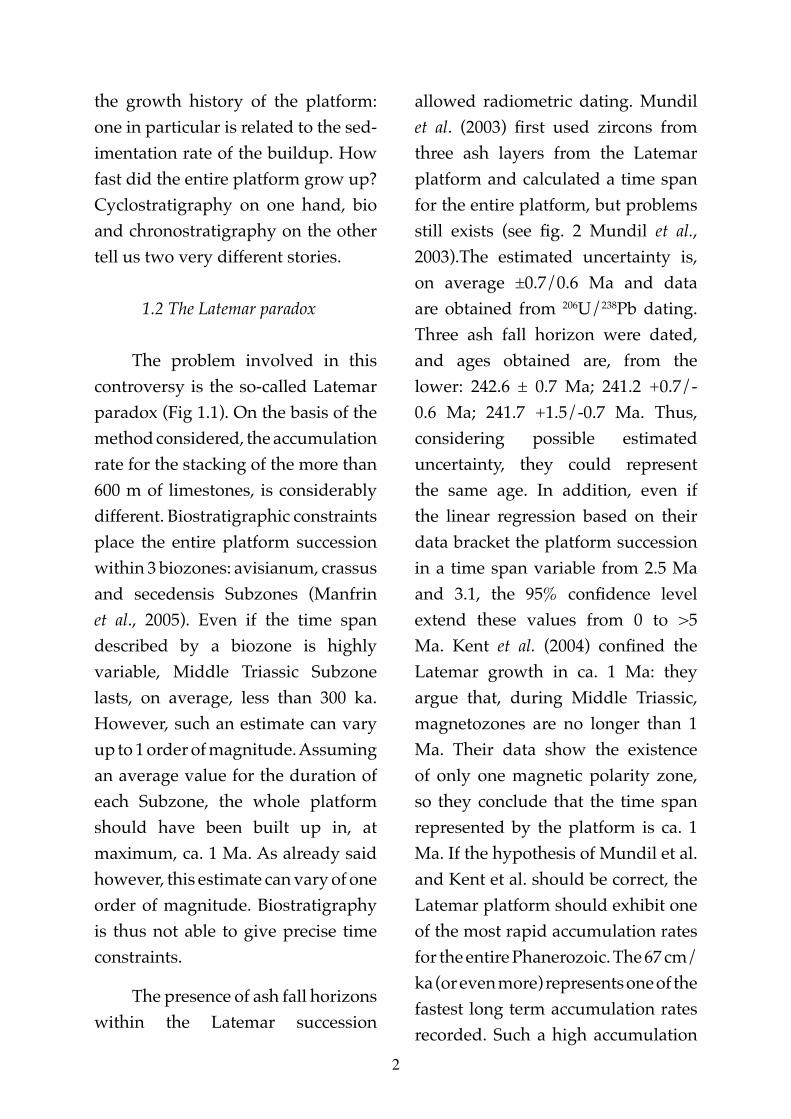
1.2 The Latemar paradox
The problem involved in this controversy is the so-called Latemar paradox (Fig 1.1). On the basis of the method considered, the accumulation rate for the stacking of the more than 600 m of limestones, is considerably different. Biostratigraphic constraints place the entire platform succession within 3 biozones: avisianum, crassus and secedensis Subzones (Manfrin et al., 2005). Even if the time span described by a biozone is highly variable, Middle Triassic Subzone lasts, on average, less than 300 ka. However, such an estimate can vary up to 1 order of magnitude. Assuming an average value for the duration of each Subzone, the whole platform should have been built up in, at maximum, ca. 1 Ma. As already said however, this estimate can vary of one order of magnitude. Biostratigraphy is thus not able to give precise time constraints.
The presence of ash fall horizons within the Latemar succession
allowed radiometric dating. Mundil et al. (2003) first used zircons from three ash layers from the Latemar platform and calculated a time span for the entire platform, but problems still exists (see fig. 2 Mundil et al., 2003).The estimated uncertainty is, on average ±0.7/0.6 Ma and data are obtained from 206U/238Pb dating. Three ash fall horizon were dated, and ages obtained are, from the lower: 242.6 ± 0.7 Ma; 241.2 +0.7/-0.6 Ma; 241.7 +1.5/-0.7 Ma. Thus, considering possible estimated uncertainty, they could represent the same age. In addition, even if the linear regression based on their data bracket the platform succession in a time span variable from 2.5 Ma and 3.1, the 95% confidence level extend these values from 0 to >5 Ma. Kent et al. (2004) confined the Latemar growth in ca. 1 Ma: they argue that, during Middle Triassic, magnetozones are no longer than 1 Ma. Their data show the existence of only one magnetic polarity zone, so they conclude that the time span represented by the platform is ca. 1 Ma. If the hypothesis of Mundil et al. and Kent et al. should be correct, the Latemar platform should exhibit one of the most rapid accumulation rates for the entire Phanerozoic. The 67 cm/ka (or even more) represents one of the fastest long term accumulation rates recorded. Such a high accumulation
2

rate is usually associated with platforms that undergo drowning. Carbonate production, in those cases, has to keep pace with the extremely
rapid subsidence and/or eustatic rise (Schlager, 1981). This would imply that, mostly, the Latemar platform should have developed in subtidal
3
250
245
240
235
230
225
220
215
210
205
200
Mill
ions
of y
ears
b.p
TRIA
SSIC
PAN
THA
LASS
A(C
hina
)
PAN
GE
A(N
.Am
eric
a)
GE
RM
AN
BA
SIN
TETH
YS(E
urop
e)
Latemar
Dürrenstein
Dachstein
Geoch
rono
logy
Lith
ozon
esAm
mon
ites Z
ones
Amm
onite
s Sub
zone
s
Late
mar
Sece
daFr
ütsc
hbac
h
Dol
omia
Pri
ncip
ale
Pass
aic
Lock
aton
gSt
ockt
on
Mus
chen
kalk
Bun
tsan
ds-
tein
Ear
lyM
iddl
eLa
te Nor
ian
Rh.
Car
nian
Ladi
nian
Ani
sian
Ole
n
Ind Gui
zhou
100
200
300
400
LCF
MTF
SC1r
SC2r
.1r
F1r.
1r
F1n.1r
RE
ITZI
Z.
SEC
ED
EN
SIS
Z.
Serp
ian.
Sz.
Cra
ssus
. Sz.
Avi
sian
um. S
z.
UC
FU
TF ?
MAGNETIC POLARITYZONES IN THE DOLOMITES
?
CimaForcellone
Cimon delLatemar
Hinnov &Kodama
Gold-hammer
Zühlke
Preto
Met
res
LAT-
3124
2.6
Ma
LAT-
3024
1.2
Ma
LAT-
3224
1.7
Ma
GTS2004 TRIASSIC CYCLOSTRATIGRAPHY LATEMAR CHRONOSTRATIGRAPHY
Fig. 1.1: Controversial Middle Triassic cyclostratigraphy. From left: GTS2004 is from Gradstein et al. (2004). Most of the stage boundaries remain disputed, especially the Anisian/Ladinian boundary, the interval spanned by the Latemar cyclic succession. In the middle, global occurrences of Triassic cyclo-stratigraphy. They include the Guizhou platform (Yang & Lehrmann, 2003), the Newark series of Pan-gea (Olsen et al., 1996), the Bundsandstein and Muschelkalk (Menning et al., 2005) of the German Basin; the Durrenstein, Dolomia Principale and Dachstein formations of the Thetys have all been shown to contain astronomical-like depositional signals (see text). This is true also of the Latemar Limestone, but geochronology indicates that Latemar cycles are sub-Milankovitch scale. Latemar chronostratigraphy is from Hinnov (2006) and expresses incompatible magnetostratigraphic relations among three biostrati-graphically calibrated uppermost Anisian/lowermost Ladinian sections in the western Dolomites. The section chosed are the, Latemar, Seceda and Frotschbach. Latemar geochronology from single zircon U/Pb dating of Mundil et al. (2003); lithozones from Egenhoff et al. (1999): LCF=Lower Cyclic Facies, MTF=Middle Tepee Facies, UCF=Upper Cyclic Facies, UTF=Upper Tepee facies; ammonite zones are from De Zanche et al. (1995) while subzones derive from Mietto et al. (1995). The Secedensis Zone is projected graphically into the platform according to its position relative to the Crassus Subzone defined at Seceda (De Zanche et al. 1995). Shaded boundary intervals denote uncertainties in the Latemar subzo-nes. No ammonoids findings which define the Reitzi/Secedensis boundary have not been identified in the platform interior. Latemar Magnetostratigraphy from Kent et al. (2004). Magnetostratigraphies from the Buchenstein beds of Seceda and Frotschbach are from Brack et al. (2000) and Muttoni et al. (2004). Se-ceda magnetostratigraphy is projected into the Latemar chronostratigraphy according to the ammonite zones and subzones (De Zanche et al. 1995). Grey rectangles with vertical arrows indicate uncertainties in the positions of the chron boundaries imposed by the Crassus Subzone boundary uncertainties in the Latemar. Projection of Frotschbach magnetostratigraphy into the Latemar according to its correlation to Seceda are based on Muttoni et al. (2004). Ammonite subzones are not defined at Frotschbach. Chron boundary uncertainties are not shown, but probably reflect those in the projected Seceda chrons.. At far right: coverage of detailed cycle measurements discussed in text. Modified from Hinnov and Kodama (2008).

environment. Several studies demostrate instead that the buildup spent most of its life subaerially exposed (Goldhammer et al., 1987; Hinnov and Goldammer, 1991; Egenhoff et al., 1999; Preto et al., 2001) and it never drowned (Goldhammer and Harris, 1989; Zühlke et al., 2003; Emmerich et al., 2005). Only Blendinger (2004) proposed that all Latemar facies could be explained with deep subtidal sediments, suggesting the absence of subaerial exposure substituted by hydrothermal alteration, but other studies challenge this hypothesis (Peterhänsel and Egenhoff, 2005; Preto et al., 2005). The presence of centimetric dolomite-caliche vadose caps at top of each basic cycle and the well developed centimetric to metric teepees (Dunn, 1991) clearly suggest cyclic subaerial exposure. Radiocarbon dating studies from deposits of the Holocene reveal a very slow development rate for these exposure facies, ranging from 1 to 10 m/Ma (Demicco and Hardie, 1994) related to evaporative pumping of seawater throughout the top of the exposed platform. Before high precision geochronology was available, basing on comparative sedimentology and actualistic models, Goldhammer et al. (1987) suggested a 12 million year long record of precession forced sea-level oscillations and several authors
in the next years agreed with them (Hinnov and Goldhammer, 1991; Preto et al., 2001, 2004). In terms of sedimentation rates, this means a 5 cm/Ka accumulation rate to obtain the more than 600 meter-scale cycles. Goldhammer et al. (1987) observed a sub-metric scale basic cycle (with an average thickness of 65 cm) “each composed of subtidal grainstones overlain by a cm-vadose diagentic cap”. They pointed out the evidences for sea level oscillations as cause of this basic Latemar cycle. As they observed, several features that can be found in the Latemar limestones are, according to literature, suggesting a Milankovitch glacio-eustatic control on the origin of the cyclicity. The 104 to 105 years average duration, the disconformable boundaries of the carbonate sequences and their lateral stratigraphic extent (Goodwin and Anderson, 1985), particularly evident in the Latemar, are otherwise ambiguous. They confirm the presence of a cyclic signal, but they do not tell us what type of cyclicity it represents, whether it follows an autocyclic or an allocyclic model.
The sedimentology of Latemar cycles, however, excludes at least that the Ginsburg autocyclic model was at play. What characterizes Ginsburg’s autocyclic model (Ginsburg, 1971) is the idea that carbonate production,
4

mostly due to calcareous algae, is restricted to an interval between 2 and 10 m depth. This implies that, with a constant subsidence, carbonate production is active only in shallow water environments. Waves, storms and tidal currents are able to drive sediments to the tidal flat, making it prograde and the sea retire. Thus, at a certain point, carbonate production stops because the whole area emerges and the entire system undergoes drowning. This produces asymmetrical sequences: subtidal-intertidal-supratidal facies, always stacked in this order. A discordant surface marks the boundary between supratidal and the following subtidal facies. Many of the Latemar basic cycles show instead subtidal bioclastic grainstones with a dolomitic or caliche cap, clear evidence of subaerial exposure. The abscence of peritidal subfacies and shoreline progradation rules out the hypothesis of an autocyclic model as a mechanism for producing the cycles. Again, Goldhammer et al., (1987) noticed that the basic cycles are usually grouped in numbers of 5 (rarely 4 or 6). They related the 5:1 bundling expressed by cycles and megacycles to the orbital forcing of eccentricity:precession. If the ca. 600 sedimentary cycles of the Latemar are interpreted to represent precession, this gives a duration for the platform growth of ca. 12 Ma.
1.3 The Latemar cycle
The Latemar cyclicity was firstly well defined by Goldhammer et al., (1987). From this study and with all the subsequent works, field observations, facies interpretations and thin section analysis were extensively carried out. They are all in broad agreement with the fact that the basic Latemar cycle expresses a shallowing-upward sequence of subfacies repeating from cycle to cycle. At the end of the ‘80s, when the cyclostratigraphic approach was at the beginning, the problem was how to match these stratigraphic informations about cycling facies into time series analysis to test the presence of an astronomical forcing. So far the solution was to base the analysis of facies upon the interpretations of field data. However, this type of approach may be not accurate enough and lacks of objectivity, being facies necessarily an interpretation that could often be different from scholar to scholar and not a mathematically measurable parameter.
The basic Latemar cycle’s description is a perfect example that confirms the subjectivity of the facies interpretations. Three different research groups described it giving three different points of view (fig. 1.2A). Goldhammer et al. (1987) described decimetric (0.65 cm average) subtidal units indicating a
5
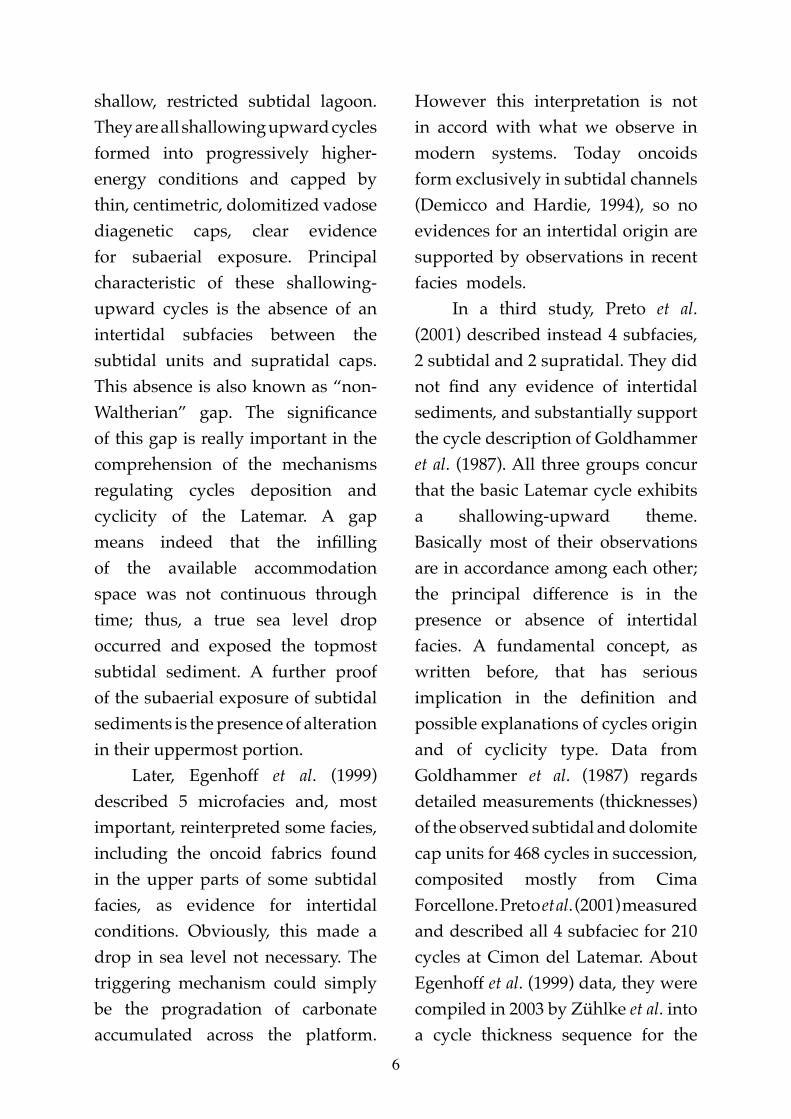
shallow, restricted subtidal lagoon. They are all shallowing upward cycles formed into progressively higher-energy conditions and capped by thin, centimetric, dolomitized vadose diagenetic caps, clear evidence for subaerial exposure. Principal characteristic of these shallowing-upward cycles is the absence of an intertidal subfacies between the subtidal units and supratidal caps. This absence is also known as “non-Waltherian” gap. The significance of this gap is really important in the comprehension of the mechanisms regulating cycles deposition and cyclicity of the Latemar. A gap means indeed that the infilling of the available accommodation space was not continuous through time; thus, a true sea level drop occurred and exposed the topmost subtidal sediment. A further proof of the subaerial exposure of subtidal sediments is the presence of alteration in their uppermost portion.
Later, Egenhoff et al. (1999) described 5 microfacies and, most important, reinterpreted some facies, including the oncoid fabrics found in the upper parts of some subtidal facies, as evidence for intertidal conditions. Obviously, this made a drop in sea level not necessary. The triggering mechanism could simply be the progradation of carbonate accumulated across the platform.
However this interpretation is not in accord with what we observe in modern systems. Today oncoids form exclusively in subtidal channels (Demicco and Hardie, 1994), so no evidences for an intertidal origin are supported by observations in recent facies models.
In a third study, Preto et al. (2001) described instead 4 subfacies, 2 subtidal and 2 supratidal. They did not find any evidence of intertidal sediments, and substantially support the cycle description of Goldhammer et al. (1987). All three groups concur that the basic Latemar cycle exhibits a shallowing-upward theme. Basically most of their observations are in accordance among each other; the principal difference is in the presence or absence of intertidal facies. A fundamental concept, as written before, that has serious implication in the definition and possible explanations of cycles origin and of cyclicity type. Data from Goldhammer et al. (1987) regards detailed measurements (thicknesses) of the observed subtidal and dolomite cap units for 468 cycles in succession, composited mostly from Cima Forcellone. Preto et al. (2001) measured and described all 4 subfaciec for 210 cycles at Cimon del Latemar. About Egenhoff et al. (1999) data, they were compiled in 2003 by Zühlke et al. into a cycle thickness sequence for the
6

Cimon del Latemar section, although the data are not publicly available. Are all these datasets really expression of the depositional signals? Are they objective or not?
To search “bundling” patterns consistent with patterns derived from astronomical parameters (precession, obliquity, eccentricity, i.e. Milankovitch parameters), an analysis of cycle thickness sequences was performed (Hinnov, 2000). Precession and obliquity index exhibit indeed unique long-term amplitude and frequency modulations, which are expressed in forced stratigraphic cycle thicknesses. Thus, cycle thickness variations should largely reflect astronomical frequency modulations. In fact, frequency modulations are not the unique involved in cycle thickness variations: amplitude modulations are important too, so it is more reasonable that cycle thickness reflect a complex combination of both amplitude and frequency modulations. It is impossible to separate these combined effects from measures which only regard cycle thicknesses. Moreover, this uneven sampling rate is inadequate to recover the precession index, but only the eccentricity. This happens because the precession index, which is the simplest case of forcing, requires a sample spacing of ≤ 10 ka. Such a value is derived from the Nyquist-Shannon
sampling theorem. It demonstrates that a band-limited analog signal needs a minimum sampling frequency to be correctly reproduced, which is half with respect to the maximum frequency of the signal. In practice, to find a precession index, which has a cycle every 20 ka, a sample spacing of ≤ 10 ka is required. In practice, if the basic Latemar cycle is forced by precession, it has to be sampled with a sample rate of, at least, 2 samples per cycle. Eccentricity instead represents a long-term modulation, with its 100 ka, so it’s easier to find using a not uniform sample spacing. The Latemar cycle thickness spectra reveal strong affinities to precession index modulation (fig. 1.2B) but this result goes against geochronological and paleomagnetic evidences being they, as already said, in contrast with a precessional scaling of the Latemar cycle.
One particular aspect was really interesting in the study of Preto et al. (2001): they collected data regarding the internal variability of the Latemar cycle. In this way it was possible to overcome the limitation existing with cycle thickness approach. Four subfacies were thus described as components of the cycles: open biota deep subtidal, restricted biota shallow subtidal, supratidal flat and caliche soils, index of severe exposure. They then “ranked” the platform facies
7
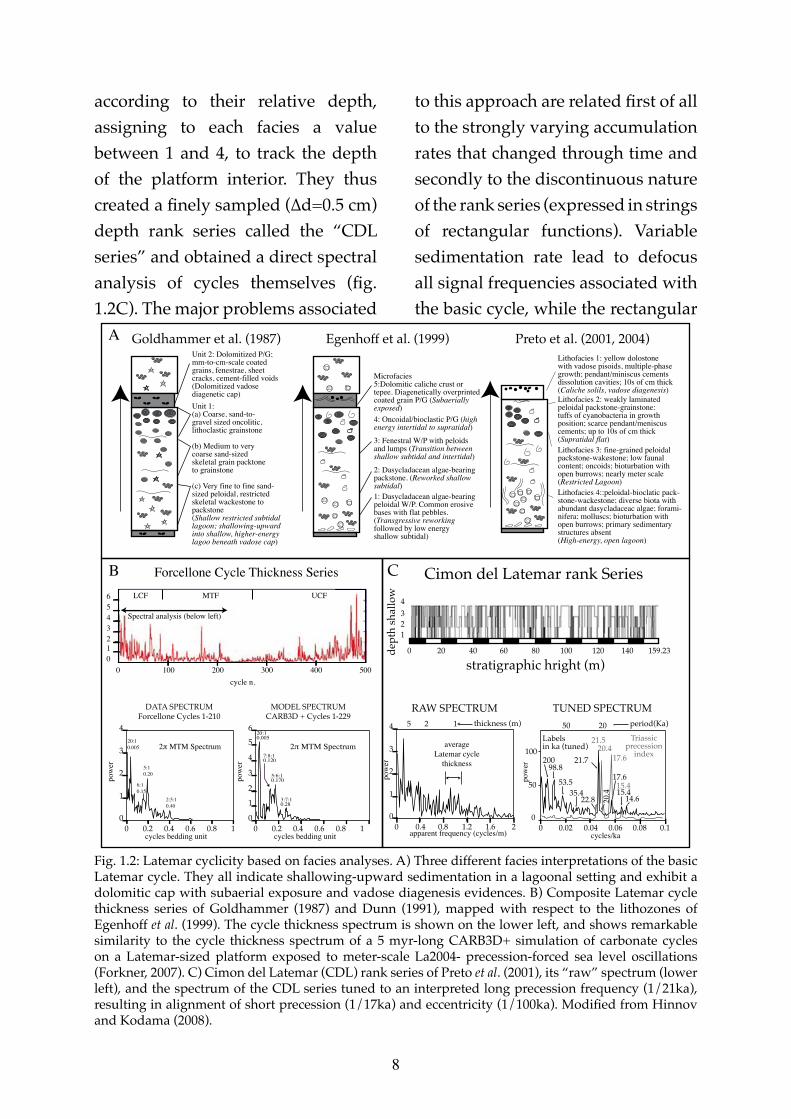
according to their relative depth, assigning to each facies a value between 1 and 4, to track the depth of the platform interior. They thus created a finely sampled (∆d=0.5 cm) depth rank series called the “CDL series” and obtained a direct spectral analysis of cycles themselves (fig. 1.2C). The major problems associated
to this approach are related first of all to the strongly varying accumulation rates that changed through time and secondly to the discontinuous nature of the rank series (expressed in strings of rectangular functions). Variable sedimentation rate lead to defocus all signal frequencies associated with the basic cycle, while the rectangular
8
Goldhammer et al. (1987) Egenhoff et al. (1999) Preto et al. (2001, 2004)Unit 2: Dolomitized P/G;mm-to-cm-scale coatedgrains, fenestrae, sheet cracks, cement-filled voids(Dolomitized vadose diagenetic cap) Unit 1:(a) Coarse, sand-to-gravel sized oncolitic,lithoclastic grainstone
(b) Medium to verycoarse sand-sizedskeletal grain packtoneto grainstone
(c) Very fine to fine sand-sized peloidal, restrictedskeletal wackestone to packstone(Shallow restricted subtidallagoon; shallowing-upwardinto shallow, higher-energylagoo beneath vadose cap)
Microfacies5:Dolomitic caliche crust ortepee. Diagenetically overprintedcoated grain P/G (Subaeriallyexposed)4: Oncoidal/bioclastic P/G (highenergy intertidal to supratidal)
3: Fenestral W/P with peloidsand lumps (Transition between shallow subtidal and intertidal)
2: Dasycladacean algae-bearingpackstone. (Reworked shallowsubtidal)1: Dasycladacean algae-bearingpeloidal W/P. Common erosivebases with flat pebbles.(Transgressive reworkingfollowed by low energyshallow subtidal)
Lithofacies 1: yellow dolostonewith vadose pisoids, multiple-phasegrowth; pendant/miniscus cementsdissolution cavities; 10s of cm thick(Caliche solils, vadose diagenesis)Lithofacies 2: weakly laminatedpeloidal packstone-grainstone:tuffs of cyanobacteria in growthposition; scarce pendant/meniscuscements; up to 10s of cm thick(Supratidal flat)Lithofacies 3: fine-grained peloidalpackstone-wakestone; low faunalcontent; oncoids; bioturbation withopen burrows; nearly meter scale(Restricted Lagoon)Lithofacies 4::peloidal-bioclatic pack-stone-wackestone; diverse biota withabundant dasycladaceac algae; forami-nifera; molluscs; bioturbation withopen burrows; primary sedimentarystructures absent (High-energy, open lagoon)
A
B
Spectral analysis (below left)
LCF MTF UCF
1000 200 300 400 500cycle n.
0123456
Forcellone Cycle Thickness Series
20:10.005
6:10.15
5:10.20
2:5:10.40
cycles bedding unit
pow
er
2π MTM Spectrum
DATA SPECTRUMForcellone Cycles 1-210
00
1
2
3
4
0.2 0.4 0.6 0.8 1
20:10.005
7:8:10.120
5:6:10.170
3:7:10.28
cycles bedding unit
pow
er
2π MTM Spectrum
MODEL SPECTRUMCARB3D + Cycles 1-229
00
1
2
3
4
5
6
0.2 0.4 0.6 0.8 1
0
1234
20 40 60 80 100 120 140 159.23
stratigraphic hright (m)
dept
h sh
allo
w
C Cimon del Latemar rank Series
apparent frequency (cycles/m)
pow
er
averageLatemar cycle
thickness
RAW SPECTRUM TUNED SPECTRUM
00
1
2
3
4
0.4 0.8 1.2 1.6 2cycles/ka
0 0.02 0.04 0.06 0.08 0.1
thickness (m)15 2
pow
er
0
50
100200
98.8
53.535.4
22.8
21.7
20.4
17.6
15.414.6
Labelsin ka (tuned)
Triassicprecession
index
15.4
17.620.4
21.5
50 20 period(Ka)
Fig. 1.2: Latemar cyclicity based on facies analyses. A) Three different facies interpretations of the basic Latemar cycle. They all indicate shallowing-upward sedimentation in a lagoonal setting and exhibit a dolomitic cap with subaerial exposure and vadose diagenesis evidences. B) Composite Latemar cycle thickness series of Goldhammer (1987) and Dunn (1991), mapped with respect to the lithozones of Egenhoff et al. (1999). The cycle thickness spectrum is shown on the lower left, and shows remarkable similarity to the cycle thickness spectrum of a 5 myr-long CARB3D+ simulation of carbonate cycles on a Latemar-sized platform exposed to meter-scale La2004- precession-forced sea level oscillations (Forkner, 2007). C) Cimon del Latemar (CDL) rank series of Preto et al. (2001), its “raw” spectrum (lower left), and the spectrum of the CDL series tuned to an interpreted long precession frequency (1/21ka), resulting in alignment of short precession (1/17ka) and eccentricity (1/100ka). Modified from Hinnov and Kodama (2008).

functions caused confusing artifacts in the spectral analysis. It is thus necessary to find a new way to evaluate and study cyclic successions with a proxy continuous in nature, able to be sampled at regular intervals and that measures physical parameters, free from subjective interpretations.
9

10
Cyclostratigraphy is a branch of the tra-ditional stratigraphy
that focuses its attention on astro-nomically forced climate cycles within sedimentary successions.
First observations that can be brou-ght back to a cyclostratigraphic approach are referable to Gilbert (1895). He studied the rhythmic stratifications in some Cretaceous successions of the Colorado (USA)
2. Cyclostratigraphy
11
00.010.020.030.040.050.06
Eccentricity
2222.5
2323.5
2424.5 Obliquity
-0.06-0.04-0.02
0.020
0.040.06 PrecessionPo
wer
420440460480500520540560580 Mean Solar insolation
Time from the present (in Ka)
0 200 400 600 800 1000
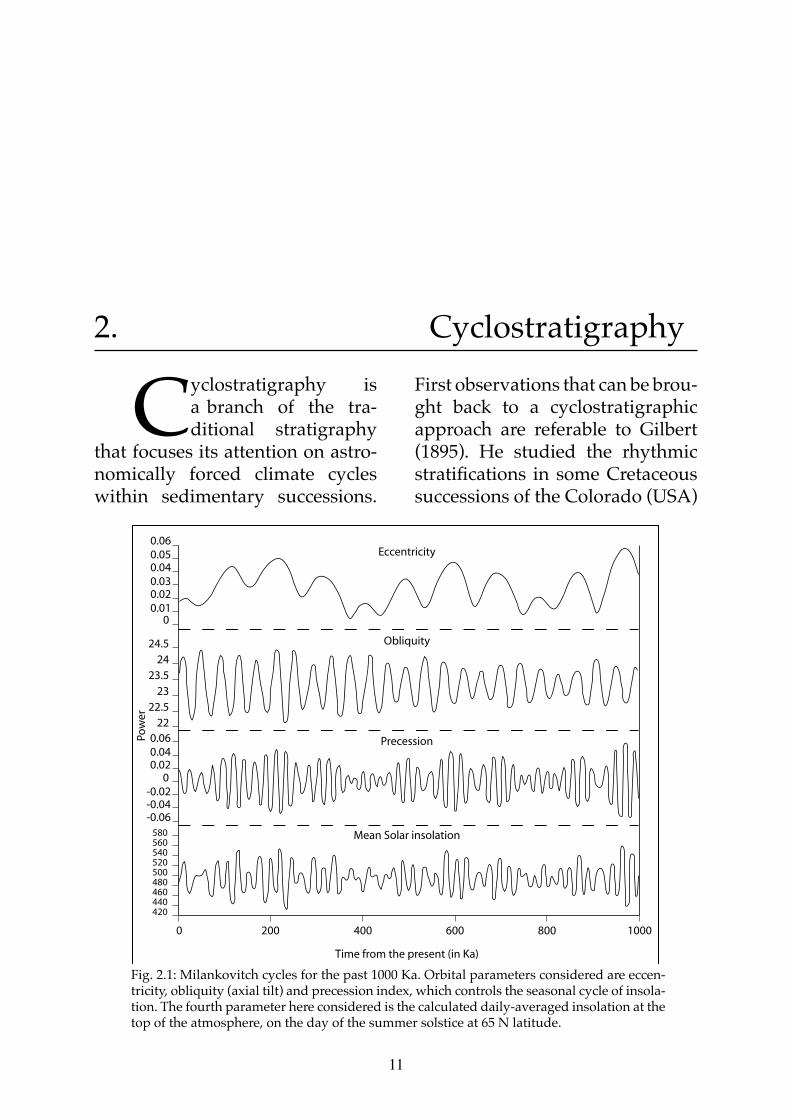
Fig. 2.1: Milankovitch cycles for the past 1000 Ka. Orbital parameters considered are eccen-tricity, obliquity (axial tilt) and precession index, which controls the seasonal cycle of insola-tion. The fourth parameter here considered is the calculated daily-averaged insolation at the top of the atmosphere, on the day of the summer solstice at 65 N latitude.

and hypothesized the existence of a strong cause and effect relation-ship between the cyclicity recor-ded in the rocks and the variations of orbital parameters. He tried to apply these observations to calcu-late the duration of the Upper Cre-taceous, and the results obtained are not so different from the actual geochronological scale. However, our knowledge about orbital para-meters greatly improved with the studies of the Serbian mathemati-cian and civil engineer Milutin Mi-lankovic. Published in 1941, after more than 20 years of researches, his theory describes the combined effects of changes in Earth’s mo-vements upon its climate. More precisely, he found that variations in eccentricity, axial obliquity and precession of terrestrial orbit de-termine climatic patterns on Earth (Fig. 2.1).
2.1 Orbital parameters
Earth’s movements, rotation around its axis and revolution around the Sun, generate a complex system of quasi-periodic variations. Milankovitch focused his attention on three dominant parameters, eccentricity, obliquity and precession, which change cyclically through time. Such variations cause changes in the amount of solar radiation (solar forcing) that reaches Earth’s surface, which translates in global climate changes reflected in sedimentary cycles.
2.1.1 Eccentricity
Earth’s orbit is an ellipse and the measure of how the ellipse deviates from a circular orbit is called eccentricity (Fig. 2.2). The shape of Earth’s orbit is not constant trough time, but varies from nearly circular, expressed by a value of eccentricity of 0.005 (low eccentricity) to a quite accentuated ellipse with an eccentricity value ten times greater (0.058, high eccentricity). The average eccentricity value is 0.028, while nowadays is 0.017. Several components of these variations occur with different periods. The most important are: long eccentricity, with a period of 413 ka and a variation in eccentricity of ± 0.012; short eccentricity, with a period of 100 ka and a variation from -0.03 to +0.02. Actually, short eccentricity consists of four cycles of nearly equal strength with periods ranging from 95 kyr to 131 kyr. The reason for these variations is that earth is not the only planet orbiting the Sun. Especially the gravitational fields of Jupiter and Saturn strongly affect Earth’s orbit, even if the semi-major axis remains unchanged. Since, according to Kepler’s third law, the semi-major axis determines the orbit’s period, the sidereal year does not change too. On the contrary, the semi-minor axis has to decrease if the eccentricity increases and, obviously, solar radiation and the length of the seasons will change.
12

2.1.2 Obliquity
Earth’s axis is not perpendicular to the plane of Earth’s orbit (ecliptic). Axial tilt is the astronomical term that refers to the tilt angle of the rotation axis with respect to the perpendicular to its orbital plane (Fig. 2.3). If the rotation axis would be exactly perpendicular to the orbital plane, axial tilt would be 0°. With regards to the Earth, axial tilt, known also as obliquity, is not stable through time, but has periodical variations.
They take approximately 41 ka for a 2.4° variation that shifts the tilt between 22.1° and 24.5° and back. Again, gravitational fields of the biggest planets of our Solar System are responsible of these variations. Like eccentricity, the obliquity cycle triggers climatic changes on Earth. An increase in obliquity creates an increase in insolation seasonal cycles amplitude. Thus both Earth’s hemispheres receive more radiative flux from the Sun during summers, while less radiative flux reaches Earth’s surface during winters. Moreover, mean insolation increases in high latitudes whit increasing obliquity increasing, while the amount of insolation is reduced at lower latitudes. During cooler summers there is a reduction in melting of the previous winter’s ice and snow: such a situation clearly favors the start of an ice age. Thus, in theory, obliquity can trigger important variations in Earth’s climate
13
SUN
EARTH
a
b
Earth
22.1°
24.5°
Fig. 2.2: Variation in orbital eccentricity: ellipse a represents a high eccentricity value, ellipse b represents a low eccentricity value.
Fig 2.3: Axial tilting. Earth’s axis inclination vary from a minum value of 22.1° to a maximum of 24.5°
favoring, alternatively, start and end of ice ages. In practice, several factors are involved into climate variations, and obliquity appears to be one of the weakest in triggering effective changes.
2.1.3 Precession
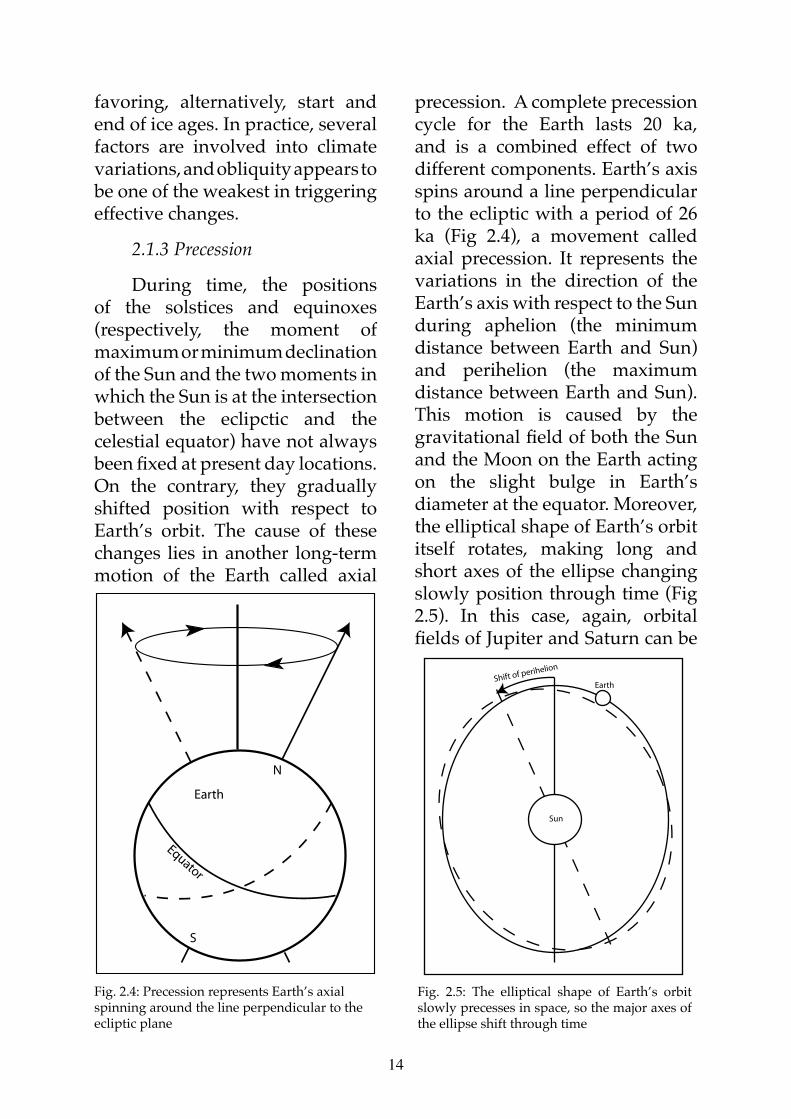
During time, the positions of the solstices and equinoxes (respectively, the moment of maximum or minimum declination of the Sun and the two moments in which the Sun is at the intersection between the eclipctic and the celestial equator) have not always been fixed at present day locations. On the contrary, they gradually shifted position with respect to Earth’s orbit. The cause of these changes lies in another long-term motion of the Earth called axial
precession. A complete precession cycle for the Earth lasts 20 ka, and is a combined effect of two different components. Earth’s axis spins around a line perpendicular to the ecliptic with a period of 26 ka (Fig 2.4), a movement called axial precession. It represents the variations in the direction of the Earth’s axis with respect to the Sun during aphelion (the minimum distance between Earth and Sun) and perihelion (the maximum distance between Earth and Sun). This motion is caused by the gravitational field of both the Sun and the Moon on the Earth acting on the slight bulge in Earth’s diameter at the equator. Moreover, the elliptical shape of Earth’s orbit itself rotates, making long and short axes of the ellipse changing slowly position through time (Fig 2.5). In this case, again, orbital fields of Jupiter and Saturn can be
14
Earth
N
S
Equator
Sun
Shift of perihelion
Earth
Fig. 2.4: Precession represents Earth’s axial spinning around the line perpendicular to the ecliptic plane
Fig. 2.5: The elliptical shape of Earth’s orbit slowly precesses in space, so the major axes of the ellipse shift through time
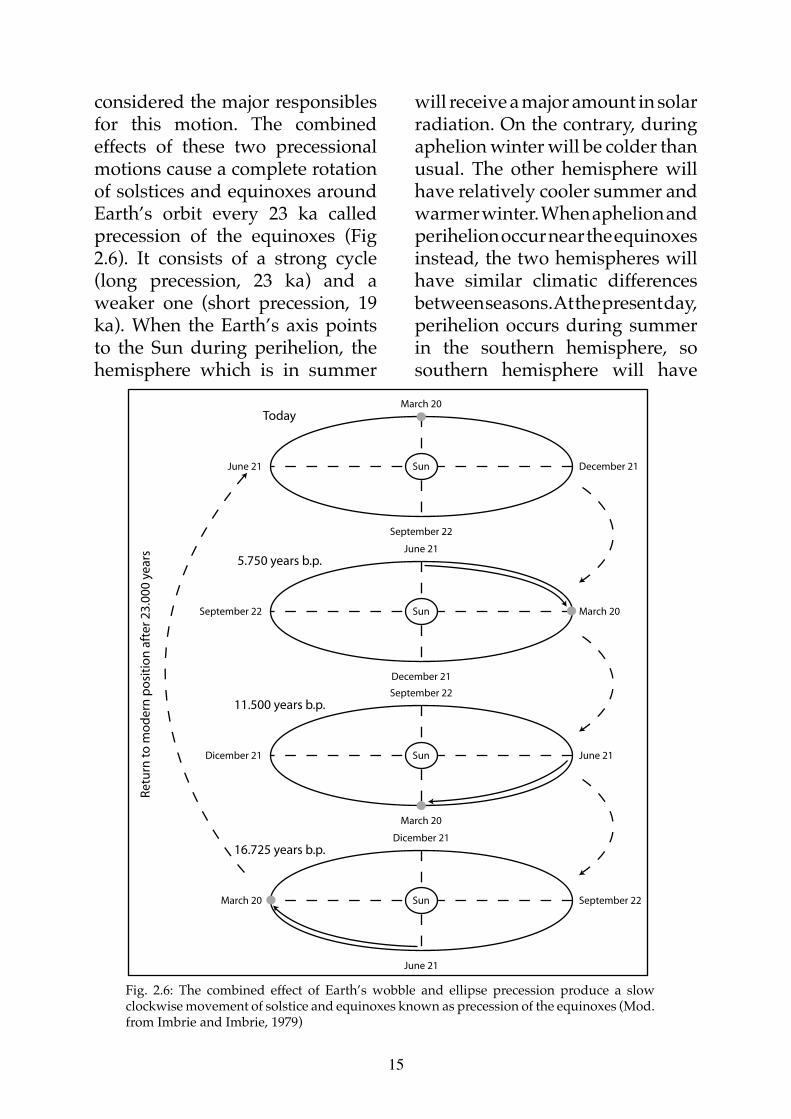
will receive a major amount in solar radiation. On the contrary, during aphelion winter will be colder than usual. The other hemisphere will have relatively cooler summer and warmer winter. When aphelion and perihelion occur near the equinoxes instead, the two hemispheres will have similar climatic differences between seasons. At the present day, perihelion occurs during summer in the southern hemisphere, so southern hemisphere will have
considered the major responsibles for this motion. The combined effects of these two precessional motions cause a complete rotation of solstices and equinoxes around Earth’s orbit every 23 ka called precession of the equinoxes (Fig 2.6). It consists of a strong cycle (long precession, 23 ka) and a weaker one (short precession, 19 ka). When the Earth’s axis points to the Sun during perihelion, the hemisphere which is in summer
15
Sun
March 20
September 22
June 21 December 21
Today
Sun
June 21
December 21
September 22 March 20
5.750 years b.p.
Sun
September 22
March 20
Dicember 21 June 21
11.500 years b.p.
Sun
Dicember 21
June 21
March 20 September 22
16.725 years b.p.
Ret
urn
to m
od
ern
po
siti
on
aft
er 2
3.00
0 ye
ars
Fig. 2.6: The combined effect of Earth’s wobble and ellipse precession produce a slow clockwise movement of solstice and equinoxes known as precession of the equinoxes (Mod. from Imbrie and Imbrie, 1979)

more extreme seasons than the northern one.
16
En v i r o n m e n t a l magnetism is a branch of paleomagnetism.
The study of Earth’s magnetic field and its variations through time improved the knowledge about stratigraphy adding important informations to those already known from the geological record. The first who came to the conclusion that Earth’s behavior is just like that one of a giant magnet was William Gilbert. He published in 1600 “De Magnete, Magneticisque Corporibus, et de Magno Magnete Tellure Physiologia Nova”, explaining why a needle on a compass indicates the North and dividing, for the first time, electrical from magnetic phenomena. Isaac Newton then, in 1687 discovered the presence of the Earth’s magnetic field, as he wrote in his “Philosopiae Naturais Principia Mathematica”. Now
our knowledge about terrestrial magnetism is improved, several theories were proposed about the origin of the magnetic field, and important discoveries were made about its behavior. One of the most important for a stratigraphic purpose regards its variations in intensity and direction through space and time. The study of rocks from the geological record worldwide showed that the magnetic field was subjected to several inversions of the magnetic polarity. These events are synchronous and global, even if their occurrence in time seems accidental. Nonetheless, from the 1960’s, most of the stratigraphic successions were investigated also with the intent of collecting paleomagnetic data. This brought to the construction of a Geomagnetic Polarity Time Scale (GPTS) which, integrated with
3. Environmental magnetism
17

biostratigraphy, chemostratigraphy, cyclostratigraphy geochronology, allows a better definition of the time span represented by a stratigraphic section. However, not all paleomagnetic data involved field inversions. In the last twenty years a new branch in paleomagnetic studies developed: the environmental magnetism. Basically, it is based on measurements of concentration, magnetic grain size and magnetic mineralogy of the fine grained (micron to submicron scale), usually ferromagnetic mineral grains present in a rock. These grains can derive from erosion and re-deposition or may be formed authigenically in situ (Thompson and Oldfield, 1986; Reynolds and King, 1995; Verosub and Roberts, 1995; Maher and Thompson, 1999). Differently from the paramagnetic and diamagnetic fraction, related to neoformation of minerals during diagenesis, several works already demonstrated that ferromagnetic minerals concentration can be a sensitive measure of astronomically-driven climate cycles (Mayer and Appel, 1999; Elwood et al., 2000; Latta et al., 2006; Kodama et al., 2010; Hinnov and Kodama, pers. comm.),
as these minerals are associated to the terrigenous fraction. The parameters that can be used for environmental magnetism studies are here described.
3.1 Magnetic susceptibility
Magnetic susceptibility (MS) can be defined as the ratio of the induced magnetization to an inducing magnetic field. Every mineral phase in a rock contributes to the magnetic susceptibility, so MS is a precious source of information on the composition of a sample. It records the concentration of all the magnetic minerals, ferromagnetic, paramagnetic, and diamagnetic, in a sedimentary rock, thus it can also be difficult to interpret on its own. If the MS is dominated by the ferromagnetic fraction, MS can be a good proxy for climate-driven fluctuations of magnetic-rich sediment in marine and lake deposits. Orbital cycles were recorded by MS variations in Quaternary marine sediments of the equatorial Atlantic; the concentration of magnetic minerals was controlled by aeolian dust originating from Africa (Bloemendal et al. 1988). Tertiary sediments on the Ceara
18

Rise extend the orbital record of MS variations well into the Oligocene (Shackleton et al., 1999). MS in marine deposits varies inversely with carbonate content, and is very sensitive to changes in carbonate production and/or carbonate dissolution (e.g. Halfman et al. 1994; Barthès et al. 1999; Hoogakker et al. 2004; Mader et al. 2004). Mayer & Appel (1999) found that MS varied inversely to carbonate content and that both recorded Milankovitch periodicities in the Early Cretaceous pelagic limestones of the Biancone Formation of the Southern Alps. On the contrary, if the paramagnetic fraction dominates, MS cannot be considered a good proxy because the ferromagnetic fraction results obliterated and the obtained signal thus will not correctly reflect the Milankovitch periodicities.
3.2 Anhysteretic remanent magnetization
Anhysteretic remanent magnetization (ARM) measures the concentration of low coercivity ferromagnetic minerals in a rock, typically magnetite, which is usually a detrital magnetic mineral in marine sediments. Coercivity
can be expressed as a measure of the strength of the magnetization. It thus represents the value of reverse field required to remove the magnetization. It is very important for paleomagnetic studies because it also measures the stability of the magnetization. Furthermore, coercivity can be used to determine the magnetic mineralogy and, for a given magnetic mineral, the magnetic particle grain size. Thus unlike MS, which measures a combined and complex magnetic response of diamagnetic minerals (carbonate, quartz, organics), paramagnetic minerals (clays, ferromagnesian silicates), and ferromagnetic minerals (magnetite, hematite, Fe sulfides, like greigite or pyrrhotite), ARM is a measure of the concentration of only a portion of minerals present in a rock, the most important for environmental magnetic studies. It is measured by applying by alternating field demagnetization of a sample in the presence of a small DC magnetic field. It is also possible to apply partial ARMs (ARMs with different strength alternating magnetic fields) to measure the ARM of sub-populations of ferromagnetic grains
19
and detect the contribution of each ferromagnetic mineral phase. The response of ferromagnetic minerals in a rock to the application of an ARM is similar to that of a thermal remanent magnetization (TRM) (Banerjee and Mellema, 1974; Stephenson and Collinson, 1974; Levi and Merrill, 1976). Consequently, ARMs are often considered as one of the best model of natural magnetization processes. With particular regard to magnetite, the strength of ARM is highly dependent on grain size, the finest magnetite particles having the strongest ARMs (Dunlop and Argyle, 1997). ARM is, among all the different parameters that can be considered in environmental magnetism, one of the most powerful tools for detecting cyclicity within carbonates and on marine marls (Kodama et al., 2010) on a variety of timescales, including orbitally-forced cycles (e.g., Latta et al., 2006).
3.3 Saturation isothermal remanent magnetization
Isothermal remanent magnetizations (IRMs) measure the concentration of all ferromagnetic minerals in a rock sample, using
a different magnetization method than ARM. The rock sample is simply exposed to a DC magnetic field in order to impose an IRM. Usually, the same operation is repeated several times, so the sample is exposed to increasingly greater DC magnetic fields until saturation is reached (SIRM). When saturation is reached, obviously the IRMs do not increase even though the DC fields being applied increases. This type of analysis is called IRM acquisition. Data obtained can be modeled (Kruiver et al., 2001) to determine how many ferromagnetic components are present in a sample and their relative coercivity values. The saturation IRM (SIRM) measures the concentration of all, high and low coercivity, magnetic minerals in a rock. Most laboratories can apply DC magnetic fields as high as 1.3-5 T, while ARMs can only be applied in alternating fields as high as 0.1 T. That’s why, typically, SIRMs can detect very high coercivity minerals (hematite, goethite) while ARMs can measure concentrations of only low coercivity minerals (magnetite, greigite).
20

3.4 S-ratio
IRM data can be used not only to detect the mineral composition of a sample and all coercivity values for each ferromagnetic mineral. Different IRMs can be chosen to detect variations in the relative amounts of different coercivity ferromagnetic minerals. S-ratio thus represents the ratio of an IRM applied in a field opposite to the field used to apply an SIRM. Typically a back field of 0.3 T is chosen since it is the theoretical maximum coercivity of magnetite. In this it is possible to detect variations in the relative amounts of low and high coercivity minerals. Thus, the S-ratio can help to detect stratigraphic variations in the relative proportion of magnetite to hematite in a rock.
In addiction to S-ratio, other different ratios can be chosen to detect variations in grain size of the minerals present. For example, if S-ratio demonstrates that the ferromagnetic fraction is dominated by one mineral phase, ARM/SIRM ratio reflects grain size variations of the dominant magnetic mineral in the sample. With particular regard to magnetite instead, if it dominates,
magnetic susceptibility ARM/MS ratio can detect variations in the grain size of magnetite.
21

22
The study of the strati-graphic variations of the magnetic properties
is thus emerging as a promising ap-proach in detecting cyclicities within carbonates. This approach, especially the use of magnetic susceptibility, was extensively used for recent successions (Mead et al., 1986; Barthes et al., 1999; Schmidt et al., 1999; Kodama et al., 2010). Szurlies et al. (2003) used IRM acquisition and thermal demagnetiza-tion to characterize the ferromagnetic minerals in the Lower Buntsandstein cycles of Central Germany (Permina-Triassic boundary).
The Latemar paradox represents one of the most known cases where the application of shallow-marine cyclostratigraphy for astronomical calibration of geologic time appears problematic. While its succession of carbonate platform cycles has a stack-ing pattern strongly suggestive of up
to 10 Ma of precession-forced oscil-lations, its chronology has been con-strained by U-Pb-dated zircons to only 2 Ma, or even less. The resolution of the controversy is thus important for understanding the climatic, eustatic and tectonic processes that led to the dominant depositional cyclicity of the platform. However, this is not only a problem associated to this isolated, small platform: one of the major gaps in coverage about climatic, eustatic and tectonic processes that led to the depo-sitional ciclycity for the Triassic period includes just the stratigraphic interval occupied by the Latemar platform. The solution of the Latemar paradox is thus not only of local importance, but can be extremely important on a wider, global point of view. The sig-nificance of the research also extends beyond this issue, and includes:
4. The Latemar paradox: a possible solution?
23

Environmental magnetism of shal-low-marine carbonate.
The application of rock magnet-ic methods introduces a completely new dimension in the research of the Latemar platform and of carbonate platforms in general. So far, most of the works focused their attention on car-bonate facies analysis. Rock magnetic properties will supply new objective information about local, regional and global fluxes of non-carbonate mate-rial into the platform carbonate, and determine the relationships of these fluxes with respect to the now firmly established facies. In a pilot study car-ried out by Linda Hinnov (Johns Hop-kins University) and Ken Kodama (Lehigh University) on a stratigraphic section of Cima Forcellone (Latemar platform), ARM data evidence a signif-icantly varying sub-micron magnetite influx that could be related to aeolian processes. Rock magnetic variations within cycles will yield a perspective on the full spectral range of paleoenvi-ronmental changes affecting the plat-form. Finally, the lessons learned from studying the Latemar can be applied to other shallow-marine platforms, for which rock magnetics is an emerging field. For this reason the initial idea was to test the same methodology (en-vironmental magnetism) on another carbonate platform, Monte Agnello. This latter buildup, sited immediately
southward from the coeval Latemar platform, was never studied by any-one, so no data are available from lit-erature. A detailed field survey, facies analysis and biostratigraphic study was thus carried out on the Agnello platform, to reconstruct the growth history of the platform. Unfortunate-ly, this platform is characterized by strong dolomitization, which affects most of the accessible localities, so no magnetic data could be collected and analyzed.
Comparative sedimentologyIf radiometric data are correct,
the fast growth of the platform (less than 2 Mas for stacking 700 m of lime-stones) implies accumulation rates of subaerial caliche and massive tepee-zone cementation that are orders of magnitude higher than those known from Late Quaternary analogs. This observation immediately raises a meaningful question: can we still be-lieve to the comparative sedimentol-ogy paradigm that was the foundation of more than last half of century of re-searches? When the Latemar grew up, no evidences of ice caps are recorded, so Middle Triassic was supposed to be in “green-house” geologic period that likely experienced environmental con-ditions unknown for the Quaternary. Thus, at least in this case may it be in-appropriate to infer ancient processes
24
based on the widely accepted practice of actualistic modeling?
Global climate change. What aspects of paleoclimate and
eustatic changes could have affected a really fast, super-high frequency build-up of the Latemar? What powerful millennial-scale forcing mechanisms could have been responsible for the formation of these carbonate cycles? In finding a possible solution to the Latemar paradox, new clues about the paleoclimate and marine conditions in the non-carbonate components of the Latemar will be considered. New stud-ies could start and our understanding about past climate could acquire pre-cious information that might lead to answers all the still open questions regarding Triassic climate and eustatic changes in the Dolomites.
TectonicsThe radioisotopic time constraints
require the creation of accommodation space by subsidence at a spectacular rate of 670 m/myrs or more (Emm-erich et al., 2005 suggested up to 850 m/myrs). These rates are really diffi-cult to reconcile with the evidence of prolonged emergence in the Latemar’s MTF and UTF, which suggests instead a slowdown of subsidence. The rates are also inconsistent with active strike-slip faulting along the Stava line and
development of a flower structure around the platform (Doglioni, 1987). Once understood the processes that lead to the deposition of more than 700 of peritidal cycles, a careful sam-pling of some key localities (e.g. ash beds) could be carried out. If collected samples will provide high quality pa-leomagnetic directions, they may shed light on the history of rotation and oth-er movements of the platform related to these tectonic events.
Finally, even if not directly con-nected to the paleomagnetic analyses, a further problem emerged during field campaign work, which needs a detailed study to better characterize the Latemar limestones. First of all, the facies since described in literature for all the portions of the platform are not well representative of the entire buildup. For the platform interior, for example, Preto et al. (2001) described 4 facies composing a single basic shal-lowing-upward or symmetric cycle. Their observations are correct, but three new facies were observed in the outermost portion of the platform in-terior, different from those of the Preto et al. (2001) and other former authors for sedimentological features, bio-logical association and depositional environment they represented. For the margin, the ultra-detailed facies description made by Emmerich et al.
25
(2005) was restricted to five facies es-sentially describing all the different boundstone types that can be found on the margin belt. On the slopes, a con-sistent amount of microbialites was found down to 250 meters depth and new facies were thus described on the upper slope. A detailed point counting of samples coming from all the differ-ent portions of the platform was car-ried out and the contribution of micro-bials for the platform was quantified. These data confirm a general idea con-cerning the factory responsible for the carbonate production of Middle Tri-assic dolomitic platforms and, based also on the new interpretation of the Latemar shape given by Preto et al. (2011), allow to propose a new model for the platform different than the one proposed by Egenhoff et al. (1999).
In the next chapters thus there will be discussed:
The growth history of the Agnel-lo platform
The microbial contribution to the Latemar platform
The results of the environmen-tal magnetism as a possible solution to the Latemar controversy
26

5.1 Introduction
Several carbonate platforms grew up during the Anisian in the western Dolomites
(Southern Alps). Most of them are really small isolated buildups: platform interior facies are extended no more than few km2, margins are narrow (30 m wide on average) and slopes are steep (30° on average; Blendinger, 1986; Harris, 1993, 1994; Blendinger, 2001 among the others). They all nucleated on tectonically raised blocks of a previous Anisian carbonate bank, the Contrin Formation and were surrounded by starved intraplatform basins represented by the Livinallongo Formation.
A huge volcanic event with eruption centres in the Predazzo area (Vardabasso 1930, Vardabasso 1945, Bosellini 1968, Rossi et al., 1977) is recorded after this generation of platforms. Was it the cause of the
demise of all the buildups? It does not seem so, at least for some of them: some drowned, as the Cernera platform (Blendinger 1983). Why? Strong subsidence has been suggested as the main cause of drowning by Brack et al. (2007). Preto et al. (2005) proposes instead that the triggering mechanism could have been the onset of an upwelling circulation in this part of the western Tethys. Again, does the demise of the platforms caome before or after the volcanism? A detailed field survey and stratigraphic study of Monte Agnello could help to answer these questions.
Monte Agnello is a carbonate platform sited in the western Dolomites, immediately southward of the Latemar massif (Fig. 5.1). New ammonoid findings date this buildup to the upper Anisian, according to Brack et al. 2005. This age is equivalent to that of the Latemar platform (Manfrin et al. 2005).
5. The growth history of the Agnello platform
27

Unlike the Latemar, however, the Agnello platform is still substantially unexplored. Data from literature regard only the volcanic cap covering the carbonate sediments (Calanchi et al. 1977; Calanchi et al. 1978). Recently, Nemeth and Budai (2009) described the Dos Capello/Doss Capel (northern portion of Monte Agnello) as volcanic flank facies of a phreatomagmatic volcano deposited on north-dipping slopes of a platform showing a strong aggradation until the subsidence rate suddenly drops. This is recorded by a prograding phase which in the
case of the nearby Latemar platform is not preserved (e.g., discussion in Emmerich et al., 2005), but only testified by subsided blocks within the Predazzo caldera (Preto et al., 2011). In the Dolomites, progradation distances were quite different from platform to platform, ranging from the 1-2 km of the Pale di San Lucano) to the 9-10 km of the Catinaccio/Rosengarten (Bosellini, 1984; Maurer, 2000). Monte Agnello represents one case in which the prograding phase is well preserved and the correlative platform interior facies are easily
28
Isar
co
Rienza
Adig
e
Avis
io
Piav
e
AnsieiBolzano
Brunico
Dobbiacco
10 Km
Cortinad’Ampezzo
PredazzoCislon
Agnello
Latemar
Rosengarten Marmolada
Civetta
Cernera
SellaSassolungo
Sassongher
Tre Cime
Cadini
Bressanone
Fig. 5.1: Localization of the Agnello platform (in grey) with respetc to the other Triassic Dolomitic platfor-ms. (Western Dolomites, Nortnern Italy)

accessed. Field survey was carried out to produce a detailed geological map, that clearly highlights the geometry of the platform and its stratigraphic relationships with adjacent formations. Excavation campaigns carried out by the Predazzo Civic Museum revealed the presence of abundant well preserved fossil plants, associated to paleosols, immediately above the carbonate platform top. Above this level, a volcanic succession starts. These two features (i.e. the preserved prograding top of the platform and the presence of the fossil plants associated to paleosols) offer new information about the sedimentary environments at the moment of the demise of the platform. Besides, they can contribute to better understand the response of the Monte Agnello platform to late Anisian subsidence and clarify why some of these buildups underwent drowning. Two stratigraphic sections representing the platform top were measured and sampled to describe the sedimentary environment. All samples were studied in thin section and five different microfacies types were recognized. Ammonoid findings were used to date the platform. Finally, the mineralogy and geochemistry of clay have been analyzed to understand the sedimentary environment before the volcanic sealing.
5.2 Geological Setting
The study focuses on a Middle Triassic isolated carbonate buildup sited in the western Dolomites, Monte Agnello. It belongs to a group of carbonate platforms that grew up in the Dolomitic area, characterized by strong aggradation in response to a prolonged sea-level rise (De Zanche et al., 1995). During Anisian time an extensive, shallow water carbonate platform, now represented by the Contrin Formation, deposited in the western Dolomites, whereas in the eastern Dolomites a basinal succession (lower Ambata Formation) developed (Gaetani et al., 1981, De Zanche et al., 1993). Syndepositional extensional tectonics affected the Contrin Formation in the western Dolomites, opening intra-platform basins (Moena Formation) infilled with black laminated limestone and carbonate breccias (Masetti and Neri, 1980). Later, differential subsidence of Contrin platform blocks generated structural highs in which new, strongly aggrading platforms (e.g. Latemar, Marmolada, Agnello, Pale di San Martino) could achieve thicknesses of up to 700 m (Gaetani et al., 1981; Blendinger, 1986; Brack et al., 2007). When subsidence dropped, a progradational phase began. Following the recent established GSSP
29

boundary of the Ladinian (Brack et al., 2005), these buildups, traditionally considered for the most part Ladinian, are now within the late Anisian. The contact between the Contrin Formation and the overlying Sciliar Formation is not simple to recognize: the calcareous facies of both formations are similar. Moreover, only few outcrops show this contact. The Contrin Formation is here represented by withish-grey limestones, mostly dolomitized. Most common facies are peloidal packstones and bioclastic grainstones, often binded by encrusting microbialites. Locally, dasycladacean rudstone-floatstones are present (Gaetani et al. 1981). The term Sciliar Formation identifies all those carbonatic bodies interfingering the basinal formations of Livinallongo and Acquatona, deposited immediatly before (or partially coeval) to the volcanic pulse that took place in the Dolomites in the late Ladinian and brought to the emplacement of the Predazzo and Monzoni complexes. The Sciliar Formation is composed by granular white or light gray dolomites, heavily recristallized. Subordinate are withish-grey limestones (more or less dolomitized), typically microbial boundstone associated to bioclastic calcarenites. Extremely abundant are radiaxial fibrous cements, subordinate cyanobacteria, dasycaldacean algae, microproblematica (e.g., Tubiphytes
sp.); rare are skeletal metazoans. The boundary between Contrin and Sciliar formations is easily positioned only where the Plattenkalke member of the Livinallongo Formation is traceable into the platform. The whole succession is well exposed on the western flank of Monte Agnello, despite some vegetation cover. The best outcrop conditions for the lower portion of the platform are in the southern part, in front of the villages of Ziano di Fiemme and Panchià. Here the succession starts with the Lower Triassic Werfen Formation, a mixed carbonatic and silicilastic formation representing an overall transgressive phase (Assereto et al., 1973). Upon it lie the Contrin and Sciliar Formations (Fig. 5.2). During late Ladinian, a complex volcanic activity took place in the Dolomites
30
Werfen FmLower Serla DolomiteFm
Contrin Formation
Aggrading portion ofSciliar Dolomite
Agnelloplatform
Prograding portion ofSciliar Dolomite
Volcanic Units50 m
Fig. 5.2: Simplified stratigrapfhy of the Monte Agnello area. The Agnello platform is repre-sented by the Sciliar Dolomite, both in its ag-grading and prograding phase

(Pisa et al., 1980a; Bosellini et al., 1982a). The western Dolomites in particular were affected by a crustal intrusion (Predazzo-Monzoni) associated to a volcanic sequence characterized by volcanic breccias, lava breccia, lava flows and tuffaceous layers (Calanchi et al., 1978).
These volcanics lie on the platform limestones, sealing the carbonatic succession.
5.3 Stratigraphical analysis
Typical Ladinian platforms geometries and growth modes are particularly evident in the Agnello buildup. The Sciliar Formation encompasses the whole platform, both in its aggrading and prograding phase (Fig. 5.3). No sections could be logged, measured neither sampled because of the mount flanks steepness. The central
31
A
B
SlopeInner platformContrin platform
Fig. 5.3: Western flanks of Monte Agnello. a) Picture of Monte Agnello, clinoforms are clearly visible in the cen-tral portion of the image. b) Line drowing of the picture. In dark grey are enhanced clinoforms of the Agnello platform. They are steep primary clinoforms, 30° on average. Inner platform facies in white. In this portion of the platform only the aggrading phase is shown. The platform developed on the Contrin Formation (light grey), a normally faulted carbonatic bank.

and northern portions of the platform are composed for the most part of slope facies. Two stratigraphic sections representing the platform interior in its prograding portion were measured and sampled, and their microfacies have been studied in thin section.
5.3.1 Stratigraphic sections
The whole southern side of Monte Agnello is very steep and wooded. Outcrops occur only on vertical walls. Valleys deeply cut into the buildup from East to West highlight the separation between the platform interior and the slope (Fig. 5.4). The prograding portion of the platform crops out north of this lineage, which represents the shelf break of the aggrading platform exposed by erosion. Two composite sections (Baito La Bassa and Baito Valbona sections) were logged on the
northern portion of the buildup. They encompass the platform interior of the prograding phase (Fig. 5.5) and clearly reveal the progradation of the platform. This is particulary clear for Baito La Bassa section, where the inner platform facies lie upon a coral boundstone of the platform margin. Further below, massive grainstone are expression of an upper slope environment. Baito Valbona section represents instead the youngest portion of the platform, with the platform interior facies sealed by volcanic units.
5.3.2 Baito La Bassa Section
This 34.29 m long section (Fig. 5.6a) is located in the northernmost portion of Monte Agnello, and represents the platform interior nearly at the end of the prograding phase. Mainly composed
32
Volcanic cap
Inner platform (aggrading portion)
Platform slope
Baito La Bassasection
Baito Valbonasection
Fig. 5.4: Monte Agnello view from Google Earth. Deep incise valleys higlight the contact (white dashed line) between the aggrading portion of the inner platform and the northern dipping clinofor-ms of the slope. The volcanic units capping the platform are here well enhanced by the absence of vegetation cover.
Fig. 5.5: Localization of the two measured and sampled sections. They both encompass the pro-grading portion of the platform. Baito Valbona section records the contact between carbonatic and volcanic units. Thus, it documents the whole platform history (unlike Latemar platform, where the prograding phase is missing)
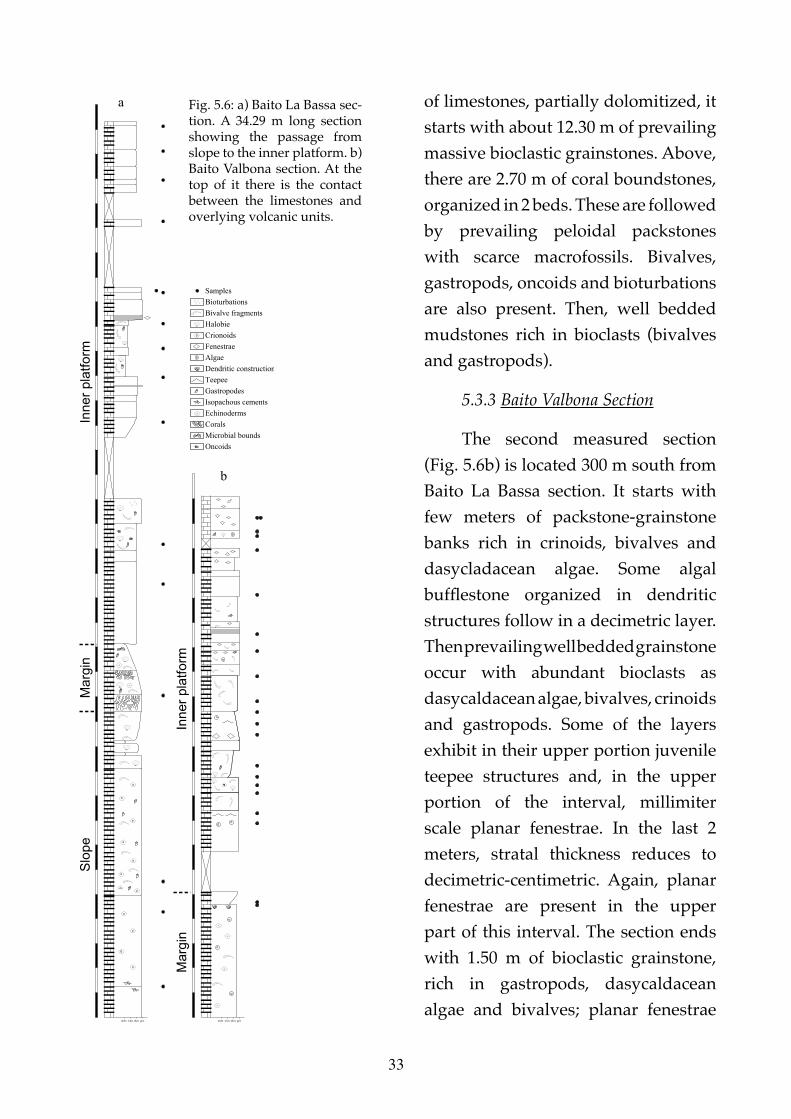
of limestones, partially dolomitized, it starts with about 12.30 m of prevailing massive bioclastic grainstones. Above, there are 2.70 m of coral boundstones, organized in 2 beds. These are followed by prevailing peloidal packstones with scarce macrofossils. Bivalves, gastropods, oncoids and bioturbations are also present. Then, well bedded mudstones rich in bioclasts (bivalves and gastropods).
5.3.3 Baito Valbona Section
The second measured section (Fig. 5.6b) is located 300 m south from Baito La Bassa section. It starts with few meters of packstone-grainstone banks rich in crinoids, bivalves and dasycladacean algae. Some algal bufflestone organized in dendritic structures follow in a decimetric layer. Then prevailing well bedded grainstone occur with abundant bioclasts as dasycaldacean algae, bivalves, crinoids and gastropods. Some of the layers exhibit in their upper portion juvenile teepee structures and, in the upper portion of the interval, millimiter scale planar fenestrae. In the last 2 meters, stratal thickness reduces to decimetric-centimetric. Again, planar fenestrae are present in the upper part of this interval. The section ends with 1.50 m of bioclastic grainstone, rich in gastropods, dasycaldacean algae and bivalves; planar fenestrae
33
mdst wkst pkst grst mdst wkst pkst grst
SamplesBioturbationsBivalve fragmentsHalobieCrionoidsFenestraeAlgaeDendritic constructionTeepeeGastropodesIsopachous cementsEchinodermsCoralsMicrobial boundsOncoids
a
b
Slo
pe
Mar
gin
Inne
r pla
tform
Mar
gin
Inne
r pla
tform
Fig. 5.6: a) Baito La Bassa sec-tion. A 34.29 m long section showing the passage from slope to the inner platform. b) Baito Valbona section. At the top of it there is the contact between the limestones and overlying volcanic units.

occur too, even if in the last 30 cm they appear to be randomly disposed. A thick volcanic unit follows a slightly karstified surface.
5.3.4 Microfacies analyses:
About 50 samples were studied on thin section and 5 microfacies (Tav 1) were identified. Sometimes grains were micritized to the point that it is impossible to determine their origin: they appear mostly as microsparitic grains with subrounded shapes, and a micritc rim enveloping them. These grains were classified as undetermined grains. Completely micritic angular to subrounded grains were found too.
Microfacies Type 1:
Peloidal packstone-grainstone. Principal components are peloids with well defined and sharp boundaries, fragments of Tubiphytes, and a micritic pseudomatrix composed mostly by peloids strongly compenetrating each others. These peloids were not completely lithified at deposition time and in extreme cases indistinguishable from a fine carbonatic matrix. Rare foraminifera, daycladacean algae and agglutinate tubes (rounded voids or tubolar cavities agglutinating fine micrite), probably related to cyanobacteria, are also present. Most of the intergranular sediment is composed by microspar. Two types of
cements infill the cavities. Cavities are usually rimmed by a marine phreatic radiaxial fibrous cement, in rare cases replaced by a dog tooth cement. In larger cavities the central portion is occupied by a burial blocky cement (Fig. 5.7 a,b).
Microfacies Type 2:
Coral boundstone. Scleractinian corals dominate the microfacies (Fig. 5.7c), agglutinate tubes and foraminifera are subordinate; a micritic rim usually envelops corals. Intergranular micrite exhibits a thrombolitic structure. Sparse 1-2 cm large cavities are present too.
Microfacies Type 3:
Fenestral packstone-grainstone with fenestrae disposed according to a LF-B1 fabric (Flugel, 2004). Two subfacies can be recognized: 3a and 3b. Subfacies 3a represents thrombolitic packstone with plagues of grainstone composed by fecal pellets, foraminifera, encrusting tubes and subordinate bivalves and brachiopods. Fenestrae are widespread. Type 3b represents a packstone-grainstone composed by agglutinate tubes, undetermined micritized grains, Tubiphytes, peloids with indistinct edges (Fig. 5.7d) strongly compenetrating each others to form a “pseudomatrix”. Characteristic features of these
34

peloids, such as the absence of a sharp margin, the deep compenetration due to early compactation suggest in situ deposition and suggest to interpret them as automicrite. Corals, microbial crusts and foraminifera are subordinate. Voids are heterogeneous in shape (from thin and elongated to subcircolar) and dimensions (from 2 or 3 mm to 7-8 mm). As usual, two generations of cements are present: a radiaxial fibrous cement rims the cavities, blocky clear cement occurs in larger cavities to fill the remaining voids.
Microfacies Type 4:
Laminated packstone-grainstone. The only difference with type 3 is in the presence of lamination. Lamination is due to the alternation of different grainstone levels composed where grains have different dimensions and are binded by microbialites. Very small planar fenestrae, 1 or 2 mm long, are the most common type of cavities. Other voids are represented by larger cavities, sub-ovoidal in section, with a major axis of 7-8 mm and a minor one of 3-5 mm.
Microfacies Type 5:
Peloidal bioclastic grainstone. Most of the grains are peloids with sharp boundaries, and lumps, but numerous are also undetermined,
deeply micritized grains. Foraminifera, bivalves and gastropodes are subordinate. Microbial crusts can be present, creating thin levels in between the grainstone fabric. Small Fenestrae, randomly disposed, are a distinctive feature of these microfacies. Interstitial microsparite fills the voids between grains, while bigger cavities are infilled with radiaxial fibrous cements. In larger voids, a blocky clear cement is also present Three subfacies can be distinguished: 5a, 5b and 5c. The first two are composed by very small grains, mostly <1 mm and anyway never >2 mm. Type 5a can be distinguished from type 5b by the dimension of planar fenestrae, 2-4 mm in 5a and up to 1.5-2 cm in 5b. Some of the thin sections reveal the presence of oncoids, larger than other grains. They appear to nucleate on small aggregate grains. In type 5c grains are heterogenous in dimensions. They are represented by peloids with sharp boundaries, angular peloids, dasycaldacean algae, calcimicrobes and encrusting tubes. Some of the studied samples are dominated by dasycladacean algae (Fig. 5.7e). . Type 5c differs from Type 1 (peloidal packstone-grainstone) because of the presence of dasycaldacean algae and the different range of dimensions, few mm in Type 5c, up to 1.5 cm in Type2.
35

5.4 Ammonoid biostratigraphy
Despite extensive researches, no
ammonoids were found in situ on the platform. Isolated specimens were
36
Bk
Dt
Bl
0.4 mm a2.5 mm b
2.5 mm c1.5 mm d
2 mm e
Fig. 5.7: a) Cements type infilling a large cavity. A first generation of cement is the cloudy bladed (Bl). It creates a thin rim (0.1 to 0.3 on average) mm bording the ed-ges of the cavity. Sometimes it is followed by a doog tooth (Dt) cement. Followinf Flugel (1994), we interpret these as early marine cement. If the dimension of the ca-vities is > 0.5 mm in diameter (on avera-ge), a blocky cemet (Bk) occur filling voids during burial; b) Radiaxial fibrous cement. These type of cement, with an ondulate extinction, typically exhibits two ore more growth zonations; c) Grains exhibiting a thrombolitic structure, evidence of a mi-crobial control on carbonatic sedimenta-
tion; d) Scleractinian corals building the reef facies of the platform; e) Transversal and longitudinal section of Diplopora anulata (Schafhäutl, 1853)

found in some areas located along the
southern flank of the massif (Fig. 5.8).
Valle Averta
Monte Agnello massif is deeply incised by the Averta Valley which joins Fiemme Valley at the village of Ziano di Fiemme. In the platform limestones cropping out at Forzella/Forcella (2181 m), east of Averta Valley, both Philipp (1904) and Leonardi (1937) found thin-shelled bivalves (Daonella) and ammonoids, unfortunately not age diagnostic. In a steep, narrow tributary valley of the Averta Valley, cut into the Forzella, dark calcareous blocks bearing ammonoids were found, similar to a block from the old collections in the Geological Museum of Padova University. The fauna here collected is
represented by Parakellnerites sp., P. cf. boeckhi (Roth), Stoppaniceras aff. artinii (Airaghi), cf. Sturia sp.
Ziano di Fiemme
The Pizzancae (2162 m), an elongated knoll in the southern portion of Monte Agnello, sits between the villages of Ziano and Panchià. It is limited eastward by the Averta Valley (see above) and westward by the Rio Bianco (see below). An ammonoid specimen, now stored in the Predazzo museum, was found in one of the detrital cones at the base of Pizzancae. It is an external mould from a white microcristalline dolomite. The specimen is a Parakellnerites cf. boeckhi (Roth).
Rio Bianco
Two deep valleys cut the southern portion of Monte Agnello, towards the Fiemme Valley. Eastward is the Averta Valley, between the peak of la Forzella/Forcella (2181 m) and the Pizzancae knoll (2162 m). Westward is the Rio Bianco valley, between the knolls of Pizzancae and Cornacci (2189 m). The specimens collected came from some blocks of white dolomite analogous to that coming from Ziano (see above). They were in the river bed of Rio Bianco, at 2050 m a.s.l. The material is stored in the Predazzo museum. It comprises Hungarites zalaensis (Mojsisovics)
37
a
b
c
d
Fig. 5.8: Localization of the collected ammonoid samples. a) Fossi Palanca; b) Rio Bianco; c) Averta Valley; d) Ziano di Fiemme. Despite no specimens were found in situ, they offer precious informa-tions about platform ages.
and Parakellnerites boeckhi (Roth).
Fossi Palanca
An arenaceous brownish limestone of the Plattenkalke Member (Livinallongo-Buchenstein Formation) outcrop on the foot of the Cornacci knoll, western flank of Monte Agnello, north of Stava village. The studied specimens come from some debris in the valley below the outcrops, in Fossi Palanca locality. The fauna is constituted by Aplococeras avisianum (Mojsisovics), Latemarites sp., L. cf. bavaricus (Reis), Hungarites sp. (cf. Manfrin et al., 2005). All the specimens are stored in the Predazzo Museum.
5.5 2.5D Model
A detailed survey was carried out on Monte Agnello, and the resulting geological map was draped on a DEM abtained from the Topographic Maps of the Trento Province, with a grid resolution of 10 m. This 2.5D representation allowed a quantitative evaluation of the platform geometry. It clearly shows a strong aggrading phase followed by a northward progradation of at least 3.5 km (Fig. 5.9a and b). The aggrading phase of the platform clearly outcrops in the southern portion of the massif. It is represented by well bedded limestones, mostly peloidal packstone/grainstone. Bioclasts are represented by dasycaldacean algae,
bivalves and gastropods. Limestones appear strongly dolomitized. The real dimension of the platform is impossible to determine. Marginal facies are not entirely visible: they disappear southward, were only the aggrading inner platform is visible. Thus, it is impossible to determine not only the shape of the platform (and, consequently, the real dimensions), but also whether Monte Agnello was isolated or attached to the south to some putative structural highs. An accurate calculation of the platform thickness is possible: the aggrading phase accounts for a thickness of 650 m, while the prograding phase is associated to a further aggradation of 50 m. Thus, the platform achieved a total thickness of 700 m in its complete life cycle.
5.6 Discussions
Among late Anisian/early Ladinian platforms, the Agnello buildup is one of the few cases where both the aggrading and the prograding phase are exposed and accessible. Besides, is one of the few cases in which the platform top is preserved and the contact with the overlain formation is well exposed. Ammonoid biostratigraphy, althoug no ammonoids were found in situ, constraints the first phase of growth of Monte Agnello to the Late Anisian.
38

5.6.1 Biostratigraphy
Although ammonoids came only from debris, their provenance is known to a sufficient precision to discuss these data and draw useful conclusions. The base of slope association from Fossi Palanca (see Fig. 8), including Latemarites cf. bavaricus and Aplococeras avisianum, is characteristic of the avisianum Subzone (sensu Mietto & Manfrin 1995, Mietto et al., 2003). Among the specimens coming from the platform, significant are Stoppaniceras aff. artinii and Parakellnerites boeckhi. These two species were more often found in associations belonging to the crassus Subzone. Hungarites zalaensis instead has a wide distribution, encompassing both the avisinum (sensu Mietto & Manfrin 1995) and crassus subzones and extending above in the secedensis
Subzone. All these three Illirian (upper Anisian) subzones are well documented in the nearby Latemar platform (Manfrin et al., 2005). Thus, the ammonoid associations from Monte Agnello confirm the correlation with the aggrading phaseof the Latemar, and place the entire aggrading phase of the M. Agnello buildup in the uppermost Anisian.
5.6.2 Growth history
The carbonate platform of Monte Agnello nucleated on a structural high derived from a horst and graben structure developed on the Contrin Formation (Fig. 3). The Anisian buildup of Monte Agnello exhibits the classical evolution pattern of the pre volcanic platforms of the Dolomites. Aggradation here is represented by 650 m of limestones, mostly dolomitized; the subsequent prograding phase
Fig. 5.9: The top of the Agnello platform consists of ~ 35 m of prograding unit. As the 2.5D model clearly shows (a), the geometry of the platform suddenly change at about 650 m from its base. The progradation is well documented at Baito La Bassa section, where well bedded limestone lies upon more massive layers. Thus, inner platform facies directly overlay reef and slope facies (see fig. 6). b) Schematic reconstruction of Monte Agnello at the end of Anisian.
39
aggrading phase
prograding phase a bs.l
Inner ptf
Reef
650 m
35 m
Slope

further thickened the platform, for a total thickness of 700 m of calcareous sediments. These 2 phases together gave a thickness comparable or, in some cases, higher that those of the coeval platforms. Unlike the Latemar buildup, in Monte Agnello the prograding phase is well preserved and shows a strong progradation northward. Clinoforms steepness varies within 25° - 45°, being 30° on average. This value is similar to that found for the other western dolomitic isolated platforms. The platform prograded for at least 3.5 km. Facies from the prograding phase of the platform interior were compared with samples from the aggrading portion of the Latemar massif. A comparison with samples from the aggrading portion of Monte Agnello was impossible for two reasons: first of all because of rough field conditions, and second because dolomitization strongly affected large portions of Monte Agnello. Monte Agnello microfacies appear more micritic with respect to the Latemar. Grains are more deeply micritized in Monte Agnello, always exhibit a micritic rim and are very often reduced to undetermined peloids. This suggests a longer residence time of sediments on the platform interior of Monte Agnello, as easily happens today in lagoonal environments (Flügel, 2004). During aggradation instead, residence time of sediments is lower, so micritization
has less time to take place. Limestones appear thus less micritic and grains less micritized. At Baito Valbona, volcanics lie upon a slightly karstified surface (Fig. 5.10). This surface testifies the emersion of the platform before subaerial volcanic activity started (fig. 5.11). Volcanic doming appears as one of the most probable explanations for this early emersion (Doglioni, 1983). Monte Agnello did not drown like other Anisian platforms. The uplift and the following covering by volcanics stopped the carbonate production in the platform interior. Brack et al. (2007) suggest that subsidence should be the primary cause of drowning, at least for Cernera and Bivera platforms. Monte Agnello attained a thickness comparable to the other coeval platforms in the Southern Alps, including Cernera and Bivera, and was thus subjected to similar average subsidence rates. Thus for
40
Fig. 5.10 Volcanics infilling karstic patches

late Anisian platforms, subsidence could not be the primary or sole cause of drowning, otherwise all platforms, including M. Agnello and the Latemar, would have been drowned. However, strong subsidence may have enhanced the effects of paleoceanographic or climatic factors as suggested by Preto et al. (2005).
Nowadays, Monte Agnello is truncated southward by the deep incision of Fassa Valley, which cuts a portion of unknown extension of the platform interior and, consequently, all the southern margin and slope. Only Permian volcanics occur on the southern side of Fassa Valley,
constituting the Lagorai chain. It is thus impossible to determine whether Monte Agnello was an isolated buildup or if it was attached to a putative structural high located to the South (Fig. 5.1).
5.6.3 The Stava Line
Some observations can be done also on the Stava Line, a tectonic line bordering westward the Agnello platform. Stava Line was interpreted as Triassic because the Predazzo magmatic complex is supposed to cut it (Doglioni, 1983). In the same paper, it was interpreted as a transcurrent line transpressive sinistral fault in Middle Triassic time. Later, a sinistral
41
Fig. 5.11: Volcanics (in orange) cover the Agnello platform. Faults (in red) uplifted the northern portion of the buildup. Picture taken from Rif. Torre di Pisa, Latear massif
transpression was introduced to explain some flower and en-èchelon structures of the Triassic thrusts of Marmolada and Costabella (Doglioni, 1984a,b). Field evidence suggests that the transpressive movement should not be possible, at least in the Anisian time. The Stava Line lies between Monte Agnello and the Latemar massif: it thus separates two platforms of the same age. During Anisian time, they were both productive platforms, which tops were close to sea level. Nowadays, there is a ca. 600 m difference in elevation (and maybe more, since at Latemar the last platform top of the aggrading phase has been eroded) between the two platform tops, the Latemar being uplifted. This uplift was attributed to the transpressive movement of the Stava Line, which must thus occur after the demise of the platforms. However, it has been shown that the Agnello platform was covered by volcanics, associated to the emplacement of the Predazzo magmatic complex, immediately after its demise. The same volcanics then should seal the Stava Line. Hence, there is no time to create such a displacement (more than 600 m)after the demise of the Agnello platform but before the emplacement of the Predazzo volcanics, as the two events substantially coincide in time. A transpressive movement in Triassic time could be possible, but it
could not produce the whole vertical displacement visible today. The Stava Line thus must have been reactivated as a mostly inverse fault (or sinistral transpressive) during Alpine tectonics, as suggested by Selli (1998). If this was the case, it cannot be truncated by the Predazzo volcanic complex, but no field evidence can be found nowadays because of the wooden western flanks of the Fassa Valley.
5.7 Conclusions
Summarizing, the Agnello buildup, an Anisian carbonate platform in the western Dolomites, was studied and a detailed field survey carried out.
1. A geological map and a 2.5D model were produced representing the whole platform and all the formations present in the area: these were used to describe the growth pattern of Monte Agnello, which is similar to all coeval Dolomitic platforms. It is characterized by a first, strongly aggradational phase, when the platform grew up nearly 650 m. Then subsidence suddenly dropped and a progradation of at least 3.5 km occurred, for a final platform thickness of 700 m.
2. The platform attained a thickness comparable to that of other coeval platforms, including those that drowned during Late Anisian.
42

Subsidence thus cannot be the primary cause of drowning of Middle Triassic platforms of the Dolomites. The contact between the calcareous sediments and the overlying volcanic units is represented by a slightly karstified surface, implying a short episode of uplift preceding volcanism.
3. The comparison between the platform top of monte Agnello and the coeval Latemar platform reveals how the Stava Line could not act as a transpressive fault during Triassic times or, at least, it must have been further reactivated to produce the >600 m. vertical displacement visible today between the two platforms.
43

4b
3b
ET
ET
T
1
C
2
T
RFC
3a
4
44
Tav 1. Characteristic microfacies of the prograding phase of the Agnello platform. Bar = 5 mm. 1) Pe-loidal packstone-grainstone: principal componen-ts are Tubiphytes (T) and peloids with a sharp margin. Radiaxial fibrous cements (RFC) rim the cavities; 2) Coral (C) boundstones; 3a) Packstone/Grainstone with a distinctive widespread LF-B1 fabric; 3b) Packstone/Grainstone with encrusting tubes (ET), Tubyphites (T), microbial peloids; 4) Bindstone with stromatolic laminae

45
5a 5b 5c
Tav. 1 Characteristic microfacies of the pgrograding portion of the Agnello platform. 5a) Peloidal grainstone with little and randomly disposed fenestrae; 5b) Peloidal grainstone with centimetric fenestrae; 5c) Grainstone with heterogenous grains, mainly fecal pellets, undeterminad grains, calcimicrobes and Dasycladacean algae. All the pictures are at the thin section scale (2x3 cm).

46

6. TheLatemar:amudmound platformdominatedbymicrobialite
47
6.1. Introduction
6.1.1 The Latemar
TheLatemarplatformisoneofthe most studied carbonate build-upsintheDolomites(Alps,North-ernItaly).Itsexceptionalexposure,outcrop accessibility and goodpreservation from dolomitizationallowed a conspicuous number ofstudiesaboutmanydifferentaspectsof stratigraphyandsedimentology(AsseretoandKendall,1977;Gaeta-ni et al., 1981; Goldhammer et al.,1987,1990;Wilsonet al.,1990;Hin-novandGoldhammer,1991;BrackandRieber,1993;Harris,1993,1994;De Zanche et al., 1995; Blendinger,1996;Mundill et al.,1996;Egenhoffet al.,1999;Pretoet al.,2001;Zühlkeet al.2003;Kentet al.,2004;Zühlke2004;Emmerichet al.,2005;Manfrinet al.,2005;Meyers,2008;Peterhän-selandEgenhoff,2008;Pretoet al.,2011). The Dolomites represent acasestudyofparticularinterestforcarbonateplatformstudies,becausegeometries and platform-basin re-lationshipsareextraordinarilywell
exposed (e.g., Moijsisovics, 1879;Bosellini,1984;GianollaP.andPan-izza M., 2009 Schlager and Keim,2009). Such exceptional preserva-tion was possible because the Do-lomites constitute a pop-up struc-ture that escaped intense Alpinetectonicdeformation(Castellarinet al.,1982).
Carbonate platforms of theDolomites were considered clas-sical tropical platforms, both withregard to their geometry and bio-logical composition of reef buildercommunities since von Richtofen(1860) even if extended coralalgalreef builder associations are notrecognizable. Improvement in theknowledge carbonate preipitationmechanisms led Blendinger (1994)to affirm that half of the slope de-positsprecipitatedinsituasmicriteor marine cement (at least for theMarmolada platform). Russo et al.(1997) interpretedtheSassoLungomassif as a microbial mud moundfromfromtheanalysisofthecom-positionoftheCipitboulders(olis-

48
tholites at the toe of slope). KeimandSchlager(1999,2001)observedinsituevidencesofmicritedeposi-tionintheSellaplatform,conclud-ing that “ ...The production modeofthelateLadinianpartoftheSel-la is comparable to that of a mudmound...”.Finally,Blendingeret al.(2004) confirm the same features in the Cernera platform. These stud-ies lead to a new interpretation ofthese carbonate platforms, whicharenowregardedas“mud-moundplatforms” dominated by the M-factory (Schlager,2000,2003). TheLatemar,perhapsthemost famousandstudiedof theTriassiccarbon-ate platforms, has been so far pic-turedasarimmedplatformformedwith a significant contribution from reef-building skeletal metazoans(e.g.,Harris1993,1994;Egenhoffet al.,1999;Emmerichet al.,2005).Thisstudyprovidesnewdataaboutcar-bonate production in the Latemarplatform and extends our knowl-edgeaboutthebiologicallyinducedandcontrolledcarbonateprecipita-tionofMiddleTriassicplatforms.
6.1.2 Microbial carbonates: defini-tions
Theoriginofcarbonateinma-rine environments can be relatedto a complex interaction betweendifferent mineralization process-es: abiotic, biologically controlledandbiologicallyinduced(Schlager,2000; 2003). In Recent carbonaterealms, biologically induced pre-cipitation of micrite can be relat-
ed both to living microorganisms(biomineralization)andtothepres-enceofnon-livingreactiveorganicmatter(organomineralization).Thesameprocessesshouldbeactiveinthe whole geological record (Dè-farge et al., 1996; Riding, 2000). Inabsenceofabiochemicalsignature,distinguish theoriginof carbonatecan be tricky. A lot of terms wereintroduced to define such depos-its, but due to the wide spectrumof processes involved, there is notyet a commonly accepted defini-tion. Burne and Moore (1987) pro-posed the term microbial carbon-ates(andmicrobialites)todescribeorganosedimentary deposits accu-mulatingasaresultofbenthicmi-crobial communities trapping andbindingsedimentsand/orformingthe locus of mineral precipitation.Bourque(1997)proposedtorestrictthetermmicrobialite toonlythosefabrics demonstrably produced byabenthicmicrobialcommunity.Forthis reason some suthors (Flügel,1982; Neuweiler and Reitner, 1993Bosence and Bridges, 1995; Mon-ty, 1995; Reitner and Neuweiler,1995; Reitner et al., 1995; Russo et al., 1997; Keim and Schlager, 1999,2001; Riding, 2002; Schlager, 2003;Guido et al., 2010) introduced thetermautomicrite(sensuWolf,1965)todescribeinsituprecipitatedcar-bonatemicriteandmicrosparwithstructurelesstoclottedtolaminatedfabrics. Such a definition does not highlight any kind of relationshipbetweenthemechanismofprecipi-
49
tationandthemicriteitself.Finally,Duprazet al. (2009) define microbial mats as “organosedimentary bio-films that exhibit tightly-coupled element cycles” and focused theirattention on organomineralizationprocessesthroughwhichmicrobial-itesform.
In this paper, the term micro-bialites is used sensu Burne andMoore (1987) because of the prob-lematic distinction of the origin ofthe micrite produced on the plat-form.
6.1.3 Controls on carbonate pla-tforms growth
Several factors interplay inmodeling geometry and facies ar-chitecture of a carbonate platform:theyareprimarlydependentonthecarbonate factory (andthuson thebiology and ecology of carbonateproducers and on carbonate accu-mulation),asevidencedbySchlager,2000; Pomar 2001; Schlager, 2003;Williamset al.,2011).Grainssizeofthecarbonategrainsproduced,nu-trientavailability, temperatureandgeochemistry of sea-water need tobe considered too (Carannante et al., 1988; Kenter, 1990; Mutti andHallock, 2003; Pomar et al., 2004;Schlager, 2005). Sea level changesandtectonisarefundamenatlexter-nal controls because they regulatethe accumulation space availablefortheplatformgrowing(Goldham-mer and Harris, 1989; Read, 1985;Bosence,2005;Pretoet al.,2011).
Modes of carbonate produc-tion vary through space and time,even if some trends are recogniz-able. Schlager (2000, 2003) identi-fied three types of carbonate factory: 1)T-Factory.TheTropicalfactoryisdominatedbyacoralgalassociation(mostlycorals,greenalgae,foramin-ifers and molluscs), and in Recentoceansisrestrictedtolowlatitudes(30°N to 30°S) and shallow water,highinoxygenandlowinnutrients.AtypicalcarbonateplatformofthistypeistheRecenttropicalsystemoftheGreatBahamaBank.Carbonateprecipitation is essentially biologi-cally controlled by autotrophic or-ganisms, heterotrophs with photo-syntheticsymbiontsandassociatedabiotic precipitation. 2) C-Factory.TheCool-waterfactoryusuallyex-tendsfromthelimitsofthetropicalplatforms to higher latitudes. Wa-tersarecoolerand/orricherinnu-trients.Forthisreason,platformsofthistypecandevelopalsoattropi-callatitudesbutindeeperareasoreutrophic,upwellingsystems.Pre-cipitation is biologically controlledbyheterotrophicorganismsasmol-luscs and echinoderms associatedwithredalgaeandforaminifers.3)M-Factory.Mudmoundsandplat-forms dominated by automicriteandbiologicallyinducedcarbonateprecipitationareknownonly fromthe fossil record and appear to bewidespread especially during latePaleozoic and Mesozoic. Both abi-otic and biologically induced pre-cipitations are responsible for car-

50
bonate production, while a rigidskeletal supported framework isabsent.
Starting from the Precambri-an,carbonateproductionwascon-trolled by, alternatively, skeletalrigid frameworks and widespreadmicrobial communities (Kiesslinget al., 2003 and references therein).Schlager (2003) highlighted thatoncarbonateramps,mudmoundsdeveloped,usuallydisposedintheouterpartbelowwavebase.High-relief carbonate platforms withsteep slopes dominated by micro-bial boundstone precipitation arecharacterized by a submerged mi-crobial reef at margin and upperslope and a flat-topped platform in-terior(e.g.PennsylvanianplatformsinAsturias,DellaPortaetal.2003,2004; Permian Capitan Reef, Car-boniferousTengizKenteret al.2005;the Carnian Sella platform, KeimandSchlager,1999).Alight-depen-dent skeletal framework, instead,producesa raised rimand isolatesan inner lagoon with a margin al-mostatsealevel.DuringPaleozoicand the first half of the Mesozoic, microbial carbonates were com-mon.AftertheJurassic,theyunder-wentheavydecayinfavorofskel-etal metazoans platforms (Mette1983;Meyer1989;Aurellet al.1995;Webb, 1996; Gonzalez & Wetzel1996; Neumeier 1998; Scheibner &Reijmer1999;Kiesslinget al.,2001;).Thereisaprovedlinkbetweenthediffusion of the M-factory and themass extinctions that character-
izedthegeologicalrecord.AsWebb(1996)highlighted,theseextinctionsbroughttolongperiodsofcrisisofseveral skeletal metazoans, whichwere replaced by microbial com-munities. Many Triassic platformsoftheDolomitesaredominatedbymicrobialprecipitation(Blendinger,1994,2004;Russoet al.,1997;KeimandSchlager,2001).
Inthisstudythemicrobialcon-tribution for the Latemar platformwas investigated, as well as faciesdistribution within the buildup.ObservationsreportedinthispaperrevealthattheLatemarplatformisdominatedbymicrobialites,whichimlynewinterpretationsaboutge-ometriesandprocessesfosedimentdepositionandtransportalongtheslopes
6.2 Geological Setting
The Middle Triassic carbon-ate platform of the Latemar is lo-catedinthewesternportionoftheDolomites, northern Italy (Fig. 1).The area recorded two tectonicsphases, with a volcanic episode inbetween when the upper Ladin-ian volcanic Predazzo complexwas emplaced (Doglioni, 1987).Pre volcanic carbonate platformswere characterized by strong sub-sidence that translated in fast ag-gradation. Those platforms werenotable tokeeppacewithsubsid-ence started to retrograde and un-derwentdrowning,likeinthecaseof the Cernera platform (Bosellini,1984;DeZancheet al.,1995;Blend-
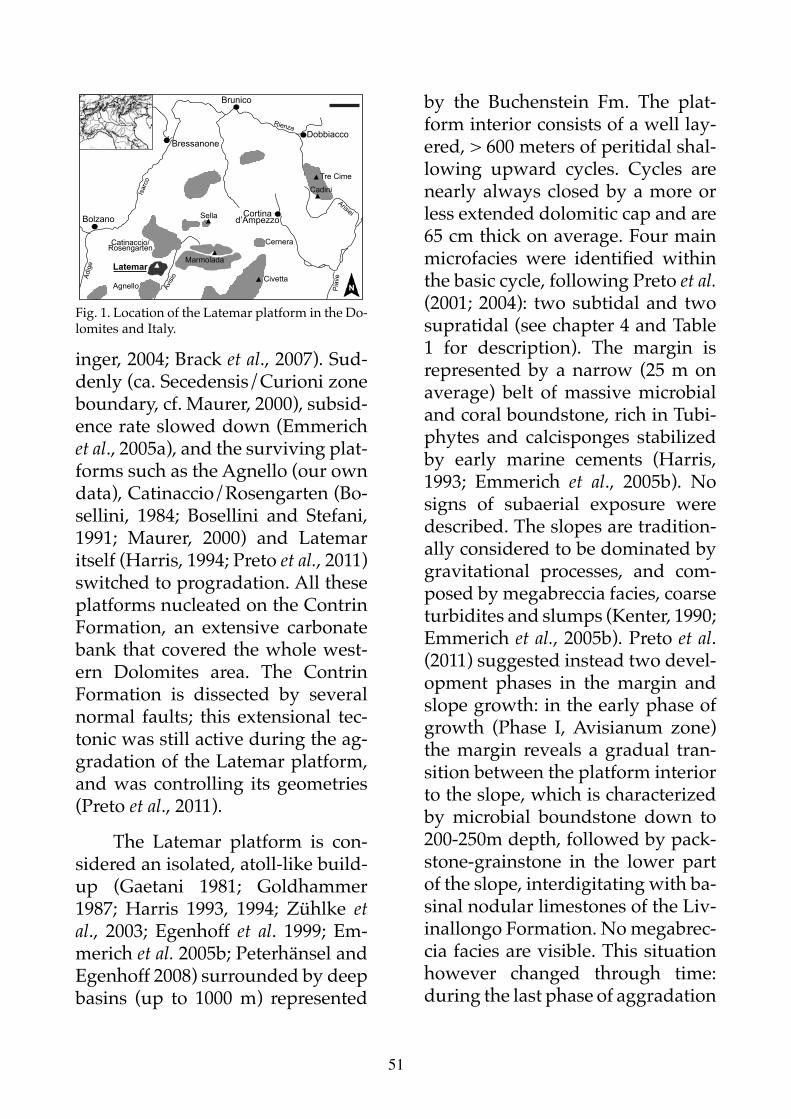
51
inger,2004;Bracket al.,2007).Sud-denly(ca.Secedensis/Curionizoneboundary,cf.Maurer,2000),subsid-enceratesloweddown(Emmerichet al.,2005a),andthesurvivingplat-formssuchastheAgnello(ourowndata),Catinaccio/Rosengarten(Bo-sellini, 1984; Bosellini and Stefani,1991; Maurer, 2000) and Latemaritself(Harris,1994;Pretoet al.,2011)switchedtoprogradation.AlltheseplatformsnucleatedontheContrinFormation, an extensive carbonatebankthatcoveredthewholewest-ern Dolomites area. The ContrinFormation is dissected by severalnormal faults; this extensional tec-tonicwasstillactiveduringtheag-gradationoftheLatemarplatform,and was controlling its geometries(Pretoet al.,2011).
The Latemar platform is con-sideredanisolated,atoll-likebuild-up (Gaetani 1981; Goldhammer1987; Harris 1993, 1994; Zühlke et al., 2003; Egenhoff et al. 1999; Em-merichet al.2005b;PeterhänselandEgenhoff2008)surroundedbydeepbasins (up to 1000 m) represented
by the Buchenstein Fm. The plat-forminteriorconsistsofawelllay-ered,>600metersofperitidalshal-lowing upward cycles. Cycles arenearlyalwaysclosedbyamoreorlessextendeddolomiticcapandare65cmthickonaverage.Fourmainmicrofacies were identified within thebasiccycle,followingPretoet al.(2001;2004): twosubtidaland twosupratidal(seechapter4andTable1 for description). The margin isrepresented by a narrow (25 m onaverage) belt of massive microbialandcoralboundstone,richinTubi-phytes and calcisponges stabilizedby early marine cements (Harris,1993; Emmerich et al., 2005b). Nosigns of subaerial exposure weredescribed.Theslopesaretradition-allyconsideredtobedominatedbygravitational processes, and com-posedbymegabrecciafacies,coarseturbiditesandslumps(Kenter,1990;Emmerichet al.,2005b).Pretoet al.(2011)suggestedinsteadtwodevel-opment phases in the margin andslopegrowth:intheearlyphaseofgrowth (Phase I, Avisianum zone)the margin reveals a gradual tran-sitionbetweentheplatforminteriortotheslope,whichischaracterizedby microbial boundstone down to200-250mdepth,followedbypack-stone-grainstone in the lower partoftheslope,interdigitatingwithba-sinalnodularlimestonesoftheLiv-inallongoFormation.Nomegabrec-ciafaciesarevisible.Thissituationhowever changed through time:duringthelastphaseofaggradation
Agnello
Latemar
Catinaccio/Rosengarten
Marmolada
Sella
Cernera
Cadini
Tre Cime
CivettaAdig
e
Isar
co
Rienza
Ansiei
Piav
e
Avisi
o
Bolzano
Bressanone
Brunico
Dobbiacco
Cortinad’Ampezzo
Fig.1.LocationoftheLatemarplatformintheDo-lomitesandItaly.

52
(PhaseII,Crassus,Secedensiszone)the margin were sistematicallysubjectedtocollapseandtheslopewas characterized by depositionof megabreccias interbedded withmicrobialboundstoneintheupperslope.PhaseIItoe-of-slopedepositsexhibit the same packstone-grain-stonefaciesoftheaggradingphaseI,thoughinterbeddedwithbrecciasandmegabreccias.
6.2.1 Carbonate production or-ganisms after the P/T mass extinction
AtthePermian-Triassicbound-ary a significant extinction oc-curred,whichcausedtheextinctionof 62% of the marine invertebratefamilies (McKinney, 1985) and upto96%ofspecies(Raup,1979).TheAnisiantimeintheDolomitesrep-resents the first real recovery of car-bonate producing biota since theend-Permian crisis (Gaetani et al.,1981;Senowbari-Daryanet al.,1991;Flügel and Kiessling, 2002). Cal-cisponges, calcareous algae, Tubi-phytesandfewscleractinians(mostofthereefalcommunity)wereiden-tified in carbonate platform margins of the Dolomites and specifically on theLatemarplatform(Gaetaniet al.,1981;Harris1993;Emmerich et al.,2005b).
With regards to the carbonatesystems, after the Permian-Triassicmass extinction two main evolu-tionary trends follow(Stefaniet al,2010).Fromregionalshelvesabun-dantinloosemicriticandbiocalca-
reniticsedimentsdevelopedduringEarly Triassic, the overall settingevolvedtosynsedimentarycement-ed,microbiallydominatedAnisian-Ladinian-LowerCarnianplatformscharachterized by high relief andsteepslopes(35-40°).FromMiddleCarnian low angle biomicritic car-bonate ramps record an importantmoistephase (Gianolla et al., 1998;Roghi et al., 2006;Rigo et al., 2007;Breda et al., 2009). Moist periodsappear to be associated to a morewidespreadpresenceofcolonialor-ganisms (Stefani et al., 2010), evenif a complete recovery of coralgalcommunitiesisnotrecordedforthewholeTriassicintheDolomites.
6.3 Materials and methods
Nine stratigraphic sectionswere logged in selected localitiesthroughout the Latemar platform,representativeofitsdepositionalfa-cies,geometriesandgrowthhistory(Fig. 2a,b). Thin sections collectedintheinnerplatformbyPretoet al.(2001, 2004) were critically restud-iedandcomparedwithsamplesoftheplatforminteriortakenfromtheCavignon. Samples were collectedfromthestratigraphicsectionsandfrom other key localities aroundthe platform, and positioned withahighprecision(uncertainity±0,60m) handheld GPS (Bluetooth RSXGeneqSXBlueII)coupledwithanHPiPAQpalmcomputer.
Approximately 100 sampleswere prepared as thin sections for

53
petrographic analysis, in additiontoca.200thatwereavailable frompreviousstudies (Pretoet al.,2001;2004).Asubsetof30samplesfromeachdepositional faciesbeltof thecarbonateplatform(innerplatform,
reef and slopes) were selected forpoint counting.FollowingVanderPlasandTobi (1965), >300pointswerecountedinordertocontainer-rorsto<4%.Componentsweredi-videdinto5classes:skeletalgrains
1 Km
700000696000
5140
000
5136
000
N
Inner PlatformSlopeMargin
PeaksLocalities
Sections and transects
Cimon
Cima Feudo
Forcella ToacForcellone
Forcella dei Camosci
Cresta de Do Peniola
Malga la Mens
M.te Cavignon
Fig. 4b
Fig. 3d and 4a
Fig. 5
Fig. 6
Fig. 3aFig. 3b
Fig. 3c
CDL (Preto et al.2001)
200 m
pre-Contrin formations
BWNW ESE
LPF
LTFLCF
MTF
UCF
UTF
5
6
7
5
6
7
Grainstone and rudstone (slopes)
Grainstone and rudstone with megabreccia (slopes)
Nodular wackestone
Faults
packstone (basin)
Fault-scarp breccia4
4
1
2
Contrin Formation (basement)
Platform interior
3
1
2
3
Microbial boundstones (upper slopes and platform interior)
A
A
CDL Series (Preto et al. 2010)Toac margin transect (Preto et al., 2009, abstract); fig. 4Feudo margin transect (Gattolin et al.,2009); fig. 4Feudo, toe of slope section (Gattolin et al.,2009); fig. 5Cresta de Do Peniola Section; fig. 6
B
C
C
D
D
E
E
B
BB
F
F
Rifugio Torre di Pisa Section; fig. 3Riflettore Section; fig. 3Feudo Section; fig. 3MTF Section; fig. 3
B
H
H
I
I
G
BG
Fig. 6.2a Simplified geological map of the Latemar massif with loca-lities cited in the text (mod. fromPreto et al. 2010). Stars indicatepositionsofstratigraphicssectionsand transects illustrated in fol-lowing figures.
Fig 6.2b: Conceptual model of the Latemar platform, modiefied from Preto et al., 2010. White bars repre-sentthestratigraphicsectionsusedforthisstudy.Theyarenotinscale.

54
(bivalves, gastropods, crinoids,foraminifera, algae), microbialites(clottedpeloidalmicrite,Baccanella,undetermined micritic tubes andclots with inferred calcimicrobialaffinity, peloids with an indistinct margin and Tubiphytes), cements(bladed,blocky,microspar,radiaxialfibrous), allomicrite (peloids with a sharpmargin,micriticgrains,indis-tinctmicrite(informofgrainsandstructurelessmatrix)andvoids.
Some precisions need to bedoneaboutthecomponents:inthemicrobialites class,Tubiphytes wasincludedamongcalcimicrobes.Ac-cordingtoSewnobariDaryan(2008),theJurassicspeciesTubiphytes mor-ronensis represents a consortiumbetweena centraluniserial, agglu-tinatedforaminiferandamicrobialcoating.WecouldnotdemonstratethatthelumenofthemiddleTrias-sicTubiphytesatLatemarrepresentsthechamberofaforaminifer,buttheexternal coating is finely and irreg-ularlylaminated,representingthussubstantiallyasmall-scalestromat-olitic microbialites. The microbialcoatingaccountsforthemajorpartof thevolumeofTubiphytes,whichwasthusincludedinthemicrobialcathegory.
Thinsections,especiallyoflow-er and toe-of-slope slope samples,contain several intraclasts with aclottedpeloidalmicritefabric,frag-mentsofTubyphitesorundeterminedmicritc tubesandclots.Theywereconsideredpartofthemicrobialitesclassbecausethisstudyaimstode-
terminetheamountofmicrobialiteoftheentireplatform.Aclastmadeof microbialite, although resedi-mented,represetspartofthemicro-bialproductionoftheplatoform.
Microspariteorigincanbepri-mary(productofphysicochemical,microbial and biochemical pro-cesses) or secondary (alteration ofmicrite during diagenesis). Thismeansthat,dependingonitsorigin,itcouldbeconsideredasaproductof microbial activity or a cement.The determination of microspariteorigin isoften tricky: in this studymicrospariteisconsideredacementin order to avoid ovestimation oftheamountofmicrobialite.
6.4 Facies belts of the Latemar platform
Eight stratigraphic sectionswere measured in all the portionof theplatform,observationswerecomparedwithdatafromliteratureand a new facies belt is here pre-sented(Table1).Fourlogsarelocat-edintheinnerplatform,whichwasdividedintosevenfacies(fourfromPretoet al.2001,3fromthisstudy);twotransectsweremeasuredinthemargin and five facies were dis-tinguished to describe the type ofboundstonepresent(onthebasisofobservationsfromHarris,1993;Em-merichet al.,2005b).Threenewsec-tionswereloggedintheslopeandfourfaciesdescribed.
Inner platform
TheCDLsectionofPretoet al.

55
(2001;2004)hasbeenrestudied.Re-cently,Pretoet al. (2011)illustratedthe complex “horseshoe” shape ofthe Latemar platform.As a conse-quence,theCDLseriesissitedclos-ertothemargin(500mnorthward,250msouthward) thanpreviouslythought.
Following Preto et al. (2001),theplatforminteriorcanbesubdi-vided into four facies, interpretedtohavebeendepositedatdifferentwaterdepths.Thissubdivisionwasconfirmed by petrographic analy-sis. Two supratidal and two sub-tidalunitsweredescribed:P1)cali-chesoils:yellowishdolostonewithabundant vadose pisoids, pendantandmeniscuscements; P2)supra-tidal flat: weakly laminated lime-stonecharacterizedbythepresenceofwidespreadstromatolitelaminae,subordinatependantandmeniscuscements; P3) restricted subtidal: fine grainedwackestonewithscarceororganisms (rare foraminifera andbioclasts).P4)opensubtidal:pack-stone-grainstone with abundantandvariousbioclasts, inparticulardasycladaceanalgae,bivalves,gas-tropodsandforaminifera.
Moving from the inner plat-formtothemarginadisappearanceof the dolomitic caps at the top ofeachcycleisobservable.Bedthick-nessofeachlayerisvariable,fromfewcentimeters to tensofdecime-ters. Each layer appears massive,devoidofmacrofossilsasmolluscsand dasycladacean algae, only insome cases peloidal packstone-
grainstone can be identified. The presence of cavities, mostly filled by cement and supported by clot-tedpeloidalmicriteandmicrospar,is quite common throughout thewhole sections. They are usuallyelongated parallel to stratification and their dimensions are on aver-age1cminlength,3-4mminheight;insomecasesthesevoidsareupto10cmlongand2mmhighandaresodiffusetosimulatealamination.In some other layers voids are in-stead not so common, isotropic oronly weakly elongated. Oncoidalpackstone to rudstone layers, usu-allyfewcentimetersthick,upto40cminsomecases,areconcentratedmostly at the top of each section.Oncoidsarequiteheterogeneousindimensions, from few millimetersupto1cm.
Four stratigraphic logs weremeasured at different distancesfrom the margin on the southernflank of the Latemar Platform, at Monte Cavignon (Fig. 6.3). Theyarelocated~150to200mfarfromthemargin.Threeofthosesectionswere measured in the Lower Cy-clicFaciesandhavebeencorrelatedthroughamarkerbedwithoncoids.ThefourthlogwasmeasuredatthebaseoftheMiddleTepeeFaciesandisplacedextremelyclose(~20m)tothemarginofCimaFeudo.
Observations carried on thestratigraphic sections of MonteCavignon reveal three new facies,all subtidal. P5) Clotted peloidal
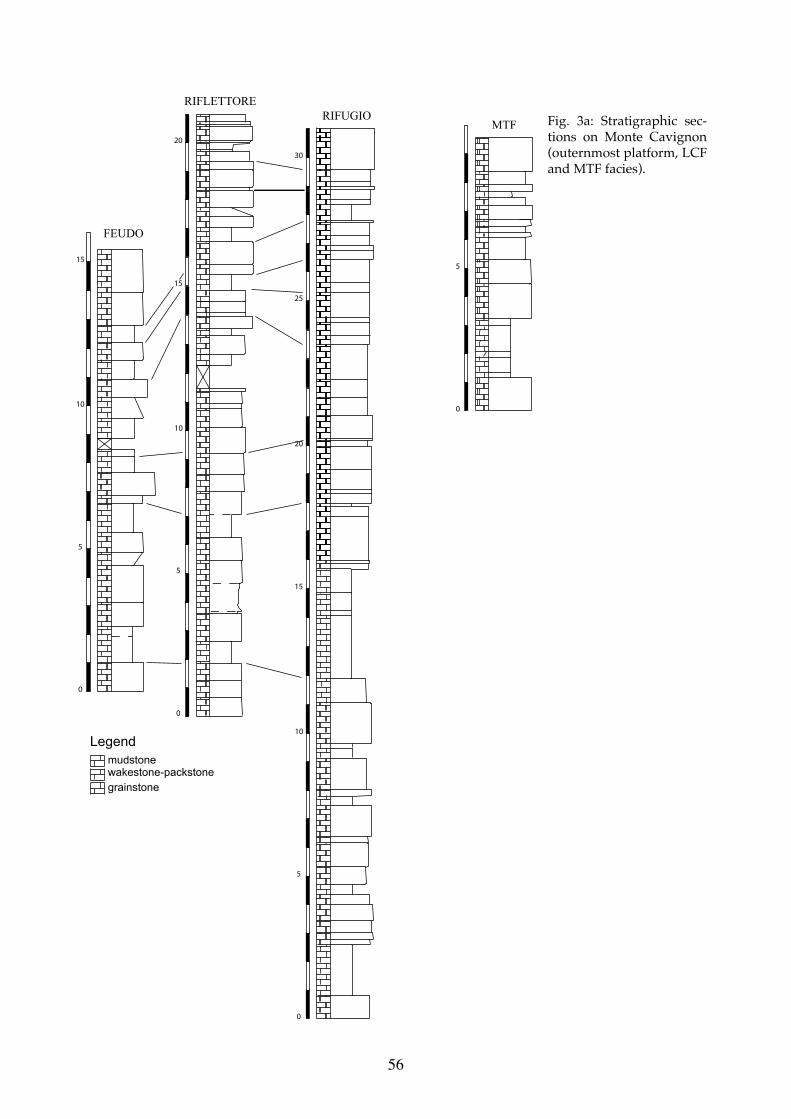
56
FEUDO
RIFLETTORERIFUGIO
5
10
15
10
0
5
20
15
0
10
5
15
20
25
30
0
Legendmudstonewakestone-packstonegrainstone
MTF
5
0
Fig. 3a: Stratigraphic sec-tions on Monte Cavignon(outernmostplatform,LCFandMTFfacies).

57
microbialite boundstone: peloidswithanindistinctmarginorganizedinaclottedfabric.Widespreadmi-crosparite is well evident in be-tween peloids even if it is difficult to identify its origin, whether it isbiologicallyinducedoritrepresentsadiageneticproduct.Micritecrusts(fine micrite binding and coating skeletalgrainsandclasts,interpret-edasmicrobialinoriginfollowingKennardandJames,1986)arepres-ent,foraminifera,bivalvesandgas-tropods are subordinate and rare.Rradiaxial fibrous calcite rim the cavitiessupportedbyclottedpeloi-dal micrite, often two generationsof these type of cement are pres-ent; blocky sparite cement fills the remaining voids during. Dolomitecrystals are present too and ap-pear topartiallyreplacemicritizedgrains. P6) Peloidal grainstone/packstone: peloids with a distinctmarginandmicritizedgrainsofun-knownorigin.Bioclastsrepresentedby foraminifera, rare bivalves, ga-stropods,irregularmicriteclotsandtubespossibly interpretedascalci-microbes, microproblematica suchas Macrotubus and Dasycladaceanalgae(Zornia obscura, Diplopora an-nulata, Diplopora annulatissima).Ce-ments as in Facies 5, microspar isnot so common. P5 and P6 can beconsideredasendmembersofase-ries with gradual transition fromonetotheother,soitiscommontofind samples belonging to the facies P5richinpeloidsor,onthecontrary,faciesP6withportionswithclotted
peloidal micrite and cavities. P7)Oncoidalpackstone/rudstone:clot-tedpeloidalintraclastsforaminiferaand dasycladacean algae are thenucleioftheoncoidalcoating.Notcoated bioclasts such as foramin-iferaandbivalvesaresubordinate.Not coated clotted peloidal intra-clastsarepresenttoo.Cementsgen-erally lack the early marine phaseandarepreferentiallyblockyspariteofburialorigin;saddledolomitein-fills the voids.
Pointcountinganalysisfortheplatform interior reveals that ce-ments are the major component,withapercentageof39.6%;micro-bialite follows,with30.7%;allomi-crite represents the 20%, skeletalgrainsthe7.3%andvoidsareonlythe0.2%.
Margin
Two new transects across twodifferent portions of the platformwere measured, Cima Feudo andForcella Toac (Figs. 2 a,b; 4 a,b).They are both representative ofgrowthPhaseIoftheplatform,andhave been measured in order totesthypothesesaboutthewind-in-duced asymmetry of the platform(Egenhoffet al.,1999).Thebackreefshows a progressive decrease instratification moving from the plat-formtowardsthemargin,whereasthe amount of boundstone faciesprogressively increases. The mar-ginconstitutesabeltofabout25mwide.The platform-break depositsare boundstone interfingered with

58
thin centimetric grainstone layers,evenifthemicrobialportiondomi-nates downslope to 200 m depth.As already pointed out by Har-ris(1993),noevidenceofsubaerialexposureispresentonthemargin.A simplified subdivision into five different margin facies similar tothat one made by Harris (1993) isproposed. M1) Calcisponges-richboundstone: calcisponges, essen-tially sphinctozoan and inozoansponges,createarigidframework.Spongesareoftenpoorlypreserved,soadeterminationofthespeciesisnot possible. Widespread micriticcrusts as stromatolites or undiffer-entiatedmicrobials(sensuKennardandJames,1986)bindthemtogeth-erandconstitutetheotherprincipal
componentof thismicrofacies.Tu-biphytescanoccurtoo.Thismicro-facies is nearly equivalent to whatHarris (1993) distinguished as Tu-biphytes-calcisponge boundstone.M2) Microbial boundstone (Undif-ferentiated microbial-stromatoliteboundstonebyHarris,1993).Smallcolumnar, finger-like growth fab-rics of microbials characterize thismicrofacies, creating rigid grav-ity-defying structures able to trapand bind sediment composed es-sentially by peloidal grainstone.Micrite often exhibits a clottedfabric inwhichpatchesofpeloidalgrainstone occur. M3) Tubiphytes boundstone. Sparse dark micriticTubiphytescreatearigidframeworkin which clotted peloidal micrite,
(m) 0 5 10 15 20 25 30 35 40 45 50 55 60
Inner lagoon Backreef Margin Forereef - slope65
(m) 0 5 10 15 20 25 30 35 40 45 50 55 60
Inner lagoon Backreef Margin Forereef - slope
LegendCrustosepatch reef
Tubiphytespatch reef
Gastropods
Dasycladacean algae not in life position
Bivalves
AmmonoidsCrinoids
Tubiphytes
Peloids
Sedimentary dyke
A
B
Dasycladacean algae in life ppositionCalcisponges in life positionCalcisponges not in life position
Fig.6.4.CimaFeudo(A)andForcellaToac(B)reeftransects.SeeFigs.6.2aand6.2bfortransectslocations.

59
other tubolar microproblematicasuch as Macrotubus, fine grained micritic crusts exhibiting grav-ity defying structures, microsparandradiaxial fibrous cements, oc-cur. This facies correspond to theTubiphytes boundstone of Harris(1993). M4) Microspar and cementdominated boundstone. Microspa-rite crusts creates globular undu-late structures showing differentgrowthphases.Theysurroundirre-gular cavities infilled by bothroydal aragonite. Radiaxial fibrous cemen-tsisthedominatingformofcemen-ts. On hand sample cement crustsare5-6cmthickandisolatecavitiesof considerable dimensions (tensofcm3) usually partially filled with yellowish dolosiltite; single crystaldimensionisupto3mm.Botryoi-dalcalcitesparcementpossiblyre-placing aragonite crystal fans andhemispheroids. Clotted peloidalmicrite is subordinate; calcispon-gesorTubiphytescanoccurtoo.M5)Bioclastic grainstone. Tubiphytes,calcimicrobes, calcisponges, micro-problematica such as Macrotubusandpeloidsarethecomponentsofthegrainstonethatoccurinpatcheswithinboundstones.
Cement are the major com-ponent (49.6%), than microbilites(33.4%), skeletal grains (8.4), allo-micrite(6.4%)andvoids(2%).
Slope
In the southern portion, un-derCimaFeudo,theaggradationalPhase I of the platform is visible,
and the characteristics of its slopecanbestudied.A35mtoe-of-slopesectionwasmeasured(Fig.6.2a,b;Fig.6.5),inwhichaverageclinoforminclinationsvaryfrom20°atthetopto5°atthebaseofsection.Astrati-graphic section of the toe of slopeof theLatemarwasalsomeasuredand described by Harris (1994) inthe south-western portion of theplatformnearMalgalaMens.Toe-of-slopefaciesarecharacterizedbywell layered graded centimetric tometric grainstone-packstone beds.Wackestone beds are rare. Theyinterfinger with pink-red nodular wackestonesreferredtobasinalde-posits (Livinallongo Fm.). Slumpstructures anderosive contactsareoccasionallyobserved.
A33mlongsectioninthenor-th-easternportionoftheLatemar,infrontofCrestadeDoPeniola (Fig.6.2a,b;Fig.6.6)wasalsomeasured.ItrepresentsaPhaseIIslope(Pretoet al.,2011).Megabrecciasandbio-clasticgrainstonesarecommonfa-cies, Tubiphytes boundstones arealso present. Thus, in the growthPhase II, the Latemar evidenceddifferent facieswithregards to theupperslope.Toeofslopeexhibitedinsteadthesamefaciesbothforthefirst and second aggrading phase.
Four facies were observed S1)Cement boundstone: recrystallizedcm-scalecementovergrownbyiso-pachous radiaxial fibrous cement up to 1 cm thick. These cements fill primarycavities irregular inshapeprobablyrelatedtothepresenceof

60
(m) 0
5
10
15
20
?
?
C
25
30
35
?
WK
PK
GR
fining upward beds or bed packagessymmetrical beds or bed packages (mainly coarsening-up first and fining-up later)
(see legend of Fig.6 for other simbology)Legend
Fig.6.5CimaFeudotoeofslopestratigraphicsection.SeelegendofFig.6forothersimbology

61
some living organisms (sponges?).Tubiphytes are subordinate. S2) Tu-biphytes boundstone with radiaxialfibrous cement. Cement is, as in S1, themostabundantcomponent,Tu-biphytesaremoreabundantthaninS1.Finemicritecrustsandpatchesofclottedpeloidalmicritearesub-ordinate but well visible. S3) Skel-etal packstone/grainstone rich inechinoderms,bivalves,gastropods,lumps and lithoclasts of marginlithofacies.S4)Skeletalwackestonerichinthin-shelledbivalvesandra-diolarians,expressionofthebasinaltongues interfingering toe of slope deposits.
Olistolithsofthebrecciafaciesare composed by rudstone (withboundstone fragments derivingfrom the margin), peloidal grain-stone/packstone(FaciesS1,S2,S3).
In the slope microbialite be-cometheprincipalcomponentwithapercentageof41.6%.Cementsfol-low(33.1),thanallomicrite(16.7%),skeletal grains (7.9%, mostly fromtoe-ofslopesections).Voidsareal-most insignificant, representing onlythe0.1%ofthecomponents.
6.5 Discussions
6.5.1 A strong imprint of early diagenesis
Allthesamplesanalyzedclear-ly show a strong syndepositionallithification of the sediment. The evidencesthatsupportthisobserva-tion present similarities with whatobserved by Keim and Schlager
(m) 0
1
2
3
4
5
7
9
10
11
12
13
14
15
16
17
18
21
19
24
23
25
26
27
28
29
30
31
32
33
Legend
GastropodsMegabreccia(Ø >1 m)Breccia (Ø >10 cm)Rudstone - breccia(Ø >1 cm)
Pack-grainstoneMud-wackestoneDolostone
CoquinaCement rims
DasycladaceansBivalvesAmmonoidsThin-shelled biv.CrinoidsReef buildersCoralsTubiphytesPeloid
Fig.6.6:CrestadeDopeniolastratigraphicsec-tions.(youngerupperslope)

62
(2001)fortheSellaplatform:
1)Thepresenceofgravityde-fyingstructurescomposedbyclot-tedpeloidalmicrite.
2)Thepresenceofcavitieswithextremelyirregularshapes,consid-erably bigger than the average di-mensions of peloids, stabilized bymicrobialite(Fig.6.7).
3) Almost all the cavities arelined by a rim of radiaxial fibrous cements,whichcanoccurinoneortwogenerations.Theseareherein-terpreted as early cements formedin the marine phreatic diageneticenvironment. Only bigger cavitiesare filled by blocky sparite inter-pretedasburialcementoccupyingthecentreofthecavity.
4)Severalfracturescuttheclot-ted peloidal micrite and are filled withsedimentmainlycomposedbydetritalmicriteandundetermined,deeplymicritizedgrains.
5) Numerous microbialiteclasts can be found, reworked, inthe lower and toe of slope facies.Thus,theymusthavebeenalreadylithified when they fell down from theplatforminterior,marginorup-per slope. Most of the diageneticfeaturesappear toberelated toanearly lithification of the platform. Late diagenesis was discussed indetail in the past (Wilson et al.,1990; Charmicael and Ferry, 2008andreferencestherein).Suchanev-idence of early diagenesis supporttheobservationson theamountofcements, which are not a second-arycomponentoftheplatformbut,togheter with microbialite, are themajor responsible for the buildingupoftheplatform.
6.5.2 Is the M-Factory responsible for carbonate production?
Quantitativedata (Fig.6.8)onthecompositionoftheLatemarplat-formwerecollectedtoestimatetherealamountofmicrobialcarbonatewith respect to the other compo-nents. Data obtained confirm the presence of widespread microbialsinmarginfaciesassociations,asex-pectedbythedescriptionsmadebyHarris (1993) and Emmerich et al.,(2005b).Thepercentageof33.4%ofmicrobialite is perfectly in agree-ment with field observations, being mostof theboundstonecomposedbymicriticthrombolitesorstromat-olites,orTubiphytes.Nonetheless,cementsarestill themajorcompo-
Cavity border
BI
BIA
A
Fig 6.7: Cavities with irregular shapes filled by basinal sediments (BI), considerably bigger thantheaveragedimensionsofpeloids, stabilizedbyautomicrite(A).

63
nent,representingthe49.6%ofthecomponents.Thisisduetothefactthatmicrospariteishereconsideredpart of the cements, as previouslyexplained (see chapter 3). Consid-ering only the cements, it is wellevident thegreater contributionofthe radiaxial fibrous early marine cementswithrespecttolaterburialcementsphases.Thelowamountofskeletalgrains,similartowhatwasfoundbyKeimandSchlager(2001),indicate that carbonate productionin the Anisian-Ladinian platformsof the Dolomites is dominated byprocesses similar to those demon-strated already for Carnian plat-forms(Russo et al.,1997;KeimandSchlager,2001).Aconsistentamountofmicrobialiteintheinnerplatformispresentaswell,being it thema-jorcomponenttogetherwiththece-ments.Anincreaseintheamountofallomicritewithrespecttothemar-gin facies isobserved.The consid-erablyhighamountofmicrobialitein the slope justifies the presence of microbialite down to 250 m depthofthepaleo-watercolumn.Itmustberemindedthatsuchavaluerep-resentthewholeslope,PhaseIandPhaseII,upperandlower,evenifthetoeofslopesamplesconsideredforthepointcountingareonly5.Thus,the resultsarequite representativeof the upper portion of the slope.Results obtained are really similarin percentages to data showed inKeim and Schlager (2001) for theSellaplatform.Theextensivepres-enceofbothmicrobialiteandearly
marinecements in theupperpor-tionoftheslopeexplainsthesteep-nessofclinoforms,stabilizingthem.Moreover,itexplainsthebadlyde-veloped stratification of the upper slope. It is bioconstructed and notdominated by gravitative proces-ses.This feature differs from whatcanbeobservednowdaysoncoral-galtropicalplatforms,wherecarbo-nate production is confined to the photiczone. In the lowerslope in-stead,werethedetritalcomponentand gravitative processes controlthe sedimentation, layers are wellclinostratified.
Such an amount of microbial-ite is a further confirmation that the Tropical factory could not beresponsible for carbonate produc-tion for the Middle-Upper Triassicplatforms in the Dolomites, as al-readyevidencedforotherbuildups(Blendinger,1994;Russoet al.,1997;Rejimer, 1998; Keim and Schlager,2001; Blendinger et al., 2004). Norigid skeletal frameworks can beidentified as the main margin build-ers;onthecontrary, theM-Factory(Schlager, 2000, 2003) appears tobetterdescribetheoriginofthecar-bonateforplatformsofthatage.
6.5.3 Latemar: a “mud mound” platform
Aspreviouslysaid,theLatemaris considered a classical tropicalplatform.Egenhoffet al.(1999,Fig.16) proposed a paleorelief modelbasedonfaciesdistributioncharac-terizedbysubmergedplatform in-

64
teriorsurroundedbyasubaerialte-pee belt. Proceding towards slope,a submerged margin belt follows;slope is considered dominated bydetriticprocesses.
Pretoet al.(2011)suggestacom-plex“horseshoe”shapefortheplat-form.ThisimpliesthattheCDLSe-ries(Pretoet al.2001,2004)andtheteepeebeltwouldbeconsideredex-actlyinthemiddleoftheplatform.Thefoursectionsmeasuredandde-scribedonMonteCavignondonotexhibit supratidal facies, with theonly exception of a few mm-thickdolomitized caps. Thus, no cycleslike thosewellevident in theCDLSeriesneitherthefourdescibedfa-ciesP1toP4canberecognized.Forthisreasonanewfaciesbeltishereproposed,named“Outermostplat-form”, which comprises facies P5,P6 and P7. It is different from the
platforminteriorintermsofdepo-sitionalenvironments,beingalmostalways submerged. It has to be ahighenergyenvironmenttoo,asthepresenceofoncoidssuggests.
Considering a hypotheticaltransect from the slope to the cen-tre of the platform interior, a pro-gressive shallowing bathymetry isvisible. Thus, a new depositionalmodel that could account for thisgeometryshouldbedeveloped.TheLatemar can be considered a plat-formwithclassicalisolatedtropicalplatformgeometries(amoreorlessflattened top represented by the platforminterior,evenif itdeepenprogressivelytowardthemargin,anarrowmarginandsteepslope)butcarbonateisproducedonthebasisof an M-factory. Consequently, weproposethetermmudmoundplat-form to descibe the Latemar plat-form.
6.5.4 A comparison with other carbonate platforms worldwide
The Latemar platform repre-sentsoneoftheseveralcasesworld-wideofcarbonateplatformsdomi-natedbymicrobialite.Inthisstudy,the Latemar is compared to twoanoalogue carbonate systems: onecoeval, theGreatbankofGuizhou(Nanpanjiang Basin, South China)andonetheronetheSierradelCu-erra(Asturias,Spain).
The Great bank of Guizhou(GBG)isaverywellpreservediso-lated Triassic platform (Lehrmann
CementsAutomicriteAllomicriteSkeletal GrainsVoids
A
40.1%
20.5%
0.4%7.3% 31.7%
49.6%
6.6%2% 8.4% 33.4%
B
33.2%
16.9%0.2% 8% 41.7%
C
Fig.8:Quantitativeanalysisviapointcountingofthe Latemar platform. 300 points were countedforeachsection,andabout30sectionanalyzedforeachportionoftheplatformA)PlatformInteriorB)MarginC)Slope.AutomicriteandCementsarethemajorcomponents,automicriteisabundantintheslope,especiallyinitsupperportion(downto200-250 m depth). Allomicrite is usually resedi-mentedautomicrite.
65
et al.,1998).Itconsistsin3differentphases of growth and is partiallycoeval to the Latemar platform. Itformed in the latest Permian anddrownedduringCarnian.Itwasal-readycomparedtotheplatformsoftheDolomitesandtheLatemar,evenif the new observations presentedinthispaperrequireareview.Theplatforms differv for their dimen-sions (GBGcoversanareaover50times larger that theLatemar)andfortheirarchitecture(progressivelysteepening, slope<10%of thevol-ume of the entire platform for theGBG; pinnacle geometry, slope>50% in volume for the Latemar).GBGhasa1.5kmwideTubiphytesmargin. Lehrman et al., 1998 hy-pothesized an equal productivityforbothGBGandLatemarmargin,andexplainedfortheGBGsuchanextensionwithaninsituaccumula-tionabsentintheLatemarplatform,where, according to Harris (1994)most of the material was shed tothe steep slope. High angle clino-forms were supposed to expressthe angle-of repose determined bymegabrecciaandgrainstone facies.However,wedemonstratewiththisstudythattheplatformisnotdomi-natedbygravityprocessesandmi-crobialiteproductionextendsdownto250montheslope.Thedifferentscaleoftheplatformsrules,accord-ingtoLehrman(1998), thecontentof mud: larger platform has great-er area for mud production in theplatforminteriorandagreaterpro-tection from winnowing, resulting
in a mud rich system with gentleslope in the first phases of growth. Smallerplatformhaslessercarbon-ate production and less protectionfrom winnowing. The system willbemud-poorandgravityprocessesfavoured, generating high-angleclinoforms.Theextensivepresenceofmicrobialitestabilizingtheslope,trapping and binding sediments,rulesoutthisconclusion,atleastforsmall platforms like the Latemar,where the M-Factory controls car-bonateproduction.
TheSierradelCueraplatforminAsturias(Bahamondeet al.,1997;DellaPortaet al.,2003,2004;Kenteret al.,2005;)isaCarboniferoushighreliefcarbonateplatformwithsteepslope,whichrepresentsananalogueoftheLatemarplatform.Theouter-most platform is characterized bythe presence of packstone-wacke-stone and fibrous cement bound-stone associated to crinoid pack-stone-grainstone.Microbialbound-stone associated with abundantmarinecementdominatetheupperslope and extend down to 300-350m below the platform break. Thelowerslopeisdominatedbydetri-tal sediments with clasts derivedfromupperslopeboundstone.TheLatemar platform exhibits moreor less thesamecharacteristics.AsfortheLatemar,theAsturiaslowerslopesaredominatedbyreworkedbrecciawithclastsfromthemarginboundstone.Kenteret al.(2005)sug-gested that microbial boundstonearenotdirectlyrelatedtosea-level
66
fallsandnotsensitivetopaleowinddirections, but their distributionmay be controlled by the upwell-ing of colder nutrient rich waters.Kenteret al.(2005)proposedaslopesheddingmodelwhichexplainsallthese features. Such a model per-fectly explains the presence of mi-crobialiteboundstonedownto250masintheLatemarmassif,aswellas high-productivity steep upperslopesandthepresenceofmargineboundstonefragmentsinthelowerslope.
6.6 Conclusions
A detailed facies analysis ofthe Latemar platform was carriedout, integrating data from Harris(1993,1994),Pretoet al. (2001)andEmmerich et al. (2005b) with newobservations.All data collected al-lowed to point out the followingkey-points:
1)Theplatformisdividedin4units: platform interior, composedby4facies(2subtidaland2supra-tidal) and representing the mostelevated portion of the buildup;otermost platform, with 3 subtidalfacies;amicrobialandcementdom-inatedmargincomposedof5facies;slope composed by 4 facies. Theyallrevealaconsicousamountofmi-crobialite. Widespread microbialitecan be identified in the platform in-terior and in the slope, in contrastwithdatafromliterature.
2) Microbialite and early ma-rine radiaxial fibrous cements are
themajorcomponent.
3) Slope are productive downto250mandwidespreadmicrobial-iteextendsintheplatforminteriortoo.Quantitativeanalysis suggestsM-Factory as the responsible forcarbonateproduction
4)TheLatemarplatformcanbeconsideredamodmoundplatform:the term mud muond reflects the factory responsible for carbonateproduction,whileplatformindicatethepnnaclegeometryofthebuild-up, with its steep slopes and a flat platforminterior.
5) A comparison with the co-evalGreatbankofGuizhou(South-ern China) suggests that platformsize in itself cannot control mudproduction and geometries of theplatform.Platformgeometries,bas-ingonacomparisonwiththeCar-boniferousplatformoftheAsturias(northern Spain) can be explainedwithaslopesheddingmodel.

7. Environmentalmagnetism oftheTriassicLatemarplatform
7.1 Introduction
Cyclostratigraphyofdeep-wa-tersedimentaryrockshasbeenvitalinsupplyingpristinerecordsofas-tronomicalforcingofclimateasfarbackas the lateMesozoic.Forear-liertimes,however,pelagicmarineorganisms had not yet evolved insufficient “rock-forming” numbers. Accordingly,fortheearlyMesozoicandearlier,researchersmustrelyonshallow marine, hemipelagic, andcontinental rocks for retrieval ofastronomically forcedpaleoclimatedata. Shallow-marine cyclostratig-raphy, principally from carbon-ate-richperitidalfacies,isthemainsourceofastronomical forcingandglobalclimatechangedatapriortothe Jurassic period (>200 millionyears ago). This places the imme-diatelyprecedingTriassicperiodatthevanguardforunderstandingthemyriad problems associated withshallow-marinecyclostratigraphy.
Triassic marine geology is re-plete with spectacular formationscomprisedofthickstacksofmeter-
scale shallowing upward carbon-atecycles.Theoriginofthesehigh-frequency (‘5th order’) cycles hasbeendebatedformuchof thepastcentury,withanearlyfocusonthenow famous Rhaetian DachsteinLimestone and Norian DolomiaPrincipale (‘Hauptdolomit’) of theNorthernandSouthernCalcareousAlps in Europe (e.g., Sander 1936;Schwarzacher 1947; Fischer 1964;Bosellini 1967). These formationsrangeuptoseveralkilometersthick,andarecharacterizedbyrepeatingsedimentarybedsthatcyclethroughsubtidal,intertidaltosupratidalfa-cies at a meter scale. This repeat-ing shallowing-upward theme isthoughttohavebeencausedeitherby‘allocyclic’sealeveloscillations,orby‘autocyclic’carbonateproduc-tionandaccumulation in the shal-lowmarineenvironment,oracom-binationofthetwo(Schlager2005).
Recently,measurementsoftheDachsteincycles inbothprovinceshaveuncoveredorbital-likesignals:cyclicities exhibit the expected 5:1Milankovitch ratio, supporting an
67

astronomically forced sea level os-cillation origin (Cozzi et al., 2005;Schwarzacher,2005).MorethantwokilometersofverticalsectionoftheDolomiaPrincipalehavenowbeenstudiedindetailandshowntohavestacking patterns consistent withprecession-forced meter-scale sealevel oscillations (Forkner, 2007).The underlying Carnian Dürren-steinFormation,whilemuchshorterinduration,alsocontainsshallow-marine sedimentary cycles withfrequencies suggestive of preces-sion(Preto&Hinnov,2003).Theas-tronomicaltimingofallthreecyclicformations,whichcovermorethan30 million years of geological his-tory, falls within the constraints ofLateTriassicgeochronology(Grad-steinet al.,2004).ThesimultaneousastronomicalforcingofcontinentallakedepositsinPangeathroughoutthe interval (Olsen et al., 1996; Ol-sen & Kent, 1996, 1999) lends fur-thersupport to thepresenceofas-tronomicallyforcedglobalchangestakingplaceduringtheentireLateTriassic.
However,onlyonestagelowerintheMiddleTriassic,spanningtheuppermost Anisian to lowermostLadinian, the Latemar Limestone(Dolomites,Italy),withits540-me-ter succession of shallowing-up-ward meter-scale carbonate plat-form cycles, has a high-precisiongeochronology that nullifies the original hypothesis by Goldham-meret al.(1987,1990)ofastronomi-calforcingasthecauseofthecycles
(Mundil et al., 2003). This result iscorroboratedbydatingthatwasun-dertakenearlierintheadjacentBu-chenstein basin (Brack et al., 1996;Mundil et al., 1996). Likewise, in acyclostratigraphic analysis of thecoevalbasinalMuschelkalkfortheGermanTimeScale2005,Menninget al.(2005)concurthattheLatemarLimestonecannotbemorethan2to4millionyears long; therefore, thestackofsome600Latemarplatformcycles must be sub-Milankovitch(millennial) scale. This, togetherwithotherevidenceforandagainstthisveryshorttimescale,hasledtoa scientific impasse known as the “Latemar controversy”.
7.1.1 The Latemar controversy: collapse of an age-old paradigm?
Themorethan600meter-scalecycles of the isolated Latemar car-bonate platform (Dolomites, Italy)have a non-random stacking pat-tern that is suggestive of a ~12millionyear-longrecordofpreces-sion-forced sea-level oscillationsata~50m/myraccumulationrate(Goldhammer et al., 1987; Hinnov& Goldhammer, 1991; Preto et al.,2001, 2004). This interpretation re-lies heavily on comparative sedi-mentology and actualistic models,esp.theGoldhammerstudies,whichwere conducted before high-preci-sion geochronology was available.However,todaytheLatemarbuild-up’stimescalehasbeenconstrainedbyU-Pb-datedzircons fromvolca-
68

niclasticsbracketingthesuccessionto2to4millionyears(Mundilet al.,2003),possiblyevenless,~800kyrs,withthecyclicsuccessionspanningonly one magnetic polarity zone(Kent et al., 2004), or ~900 kyrs,fromnewU-Pb-dating(S.Bowring,personal communication). Thus,theLatemarapparentlyhadoneofthe most rapid accumulation ratesknownforaPhanerozoicplatform,670m/myr,anddevelopedmillen-nial-scale cycles with frequenciesthatserendipitouslymimicthoseofthe standard Milankovitch param-eters.
Suchahighaccumulationrateisnormallyassociatedwithdrown-ingplatforms,whichtakeonarap-id, ‘catch-up’ mode of carbonateproduction in response to condi-tions of rapidly increasing subsid-enceand/oreustaticrise(Schlager,1981).ButtheLatemarspentasub-stantialpart—ifnotmost—ofitslifesubaerially exposed (Goldhammeret al., 1987; Hinnov & Goldham-mer,1991;Egenhoffet al.,1999),andit never drowned (Goldhammer&Harris,1989;Zühlke et al., 2003;Emmerich et al., 2005). This highrate is difficult to reconcile with the manyhundredsofcm-dmthickdo-lomite-crust-calichevadosecapsofthecyclebeds,andthedozensofte-pee zones, one of which reaches aremarkable 13 meters in thickness(Dunn, 1991; Seeling et al., 2005).These exposure facies are knownfrom Holocene radiocarbon dat-ing studies to develop extremely
slowly, 1 to 10 m/myrs (Demicco&Hardie,1994),andarethoughttobetheresultofevaporativepump-ingofseawater throughthe topofthe exposed platform. By contrast,Blendinger (2004) proposed thatall Latemar facies were consistentinsteadwithdeep-subtidaldeposi-tion,nosubaerialexposure,andal-teration from hydrothermal seeps;however, this idea was stronglycountered by Peterhänsel & Egen-hoff(2005)andPretoet al.(2005).
IftheU-Pbdatedzirconscom-priseanaccurateandprecisetime-calibration for the Latemar, thenour understanding of carbonateproduction,accumulationandearlydiageneticprocessesoftheLatemarbuildup—aswellasthetectonicen-vironment in which it formed—isdeeply flawed.
Satisfactory resolution of theLatemar controversy will benefit all whodependonthegeologictimes-caleandshouldraisenewquestionsabouteithercomparativesedimen-tology, assuming geochronologyas correct, or geochronology if thecomparative sedimentology is thecorrectmodel.
7.1.2 Emerging rock magnetic-based proxies for carbonate platforms
Rockormineralmagnetismcanprovideanalternativetechniquetofacies interpretation and measure-mentfordetectingcyclostratigraphyintheLatemarcarbonatesequence.The basic tools of rock magnetism
69

aremeasurementsoftheconcentra-tion,magneticgrainsize,andmag-netic mineralogy of the fine-grained (micronandsubmicronscale),usu-ally ferromagnetic mineral grains,in a rock that have been derivedfrom erosion and deposition orhave formed authigenically in situ(Maher & Thompson, 1999; Reyn-olds & King, 1995; Thompson &Oldfield, 1986; Verosub & Roberts, 1995). Previous work has shownthat magnetic mineral concentra-tioncanbesensitivemeasureofas-tronomically-driven climate cycles(Mayer &Appel, 1999; Latta et al.,2006;Kodamaet al., 2010). A first pi-lotstudywascarriedona40mlongtransectatCimaForcellone,thena101mlongportionof theCDLse-rieswassampledforthesametypeofstudy.
7.2 Geological Setting
The Latemar buildup devel-oped during the late Anisian andbelongs to a generation of plat-forms characterized by a very fastaccumulationrateinresponsetoanextremely high rate of subsidence.These isolated buildups nucleatedontheContrinFormation,anexten-sivecarbonatebankdissectedbyasystem of extensional faults. Thiscaused the formation of anoxic in-tra-platform basins represented bytheMoenaFormation(MasettiandNeri,1980)andacomplexhorstandgraben morphology. These plat-forms exhibit peculiar geometries,characterized by an early, strongly
aggradationalphase,anexpressionoftheveryfastsubsidence.Someoftheplatformswereunable tokeeppacewithsubsidenceanddrowned(Bosellini, 1984; De Zanche et al.,1995;Bracket al.,2007).Otherplat-formswereabletokeeppacewiththe strong subsidence until, at theendof theAnisian, thesubsidencerate suddenly dropped and plat-forms started to prograde. Thisphase is evident, for example, inthe Catinaccio/Rosengarten (Bo-sellini, 1984; Bosellini and Stefani,1991;Maurer,2000),intheAgnelloand Sciliar platforms and for theLatemar(Pretoet al.,2011).
TheLatemarbuildupisrepre-sented by a well-stratified platform interior succession associated withsteep clinoforms. The exceptionalexposure and the accessibility ofthe outcrops made the buildup anobjectofnumerousstudies(Gaetaniet al.,1981;Goldhammeret al.,1987;Egenhoff et al., 1999; Preto et al.,2001;Zühlkeet al.,2003;Emmerichet al.,2005,amongtheothers).Themorethan600mof limestonesarecomposedofrepeatedsedimentaryshallowing upward cycles mostlycapped by subaerial dolomitic ex-posuresurfaces(Goldhammeret al.,1987;Egenhoffet al.,1999;Pretoet al.,2001).Traditionally,theentireplat-forminteriorsuccessionisdividedinto6 lithofacies,distinguishedonthebasisoftherelativeabundanceof tepee structures. From the bot-tom to the top of the buildup, thefacies are: Lower Platform Facies
70

(LPF), Lower Tepee Facies (LTF),LowerCyclicFacies(LCF),MiddleTepee Facies (MTF), Upper CyclicFacies (UCF)andUpperTepeeFa-cies (UTF). Gaetani et al., (1981)called “Lower Edifice” what is now considered the LPF. De Zanche et al., (1995) emended the term “Low-er Edifice” to indicate the whole ag-gradingplatform.
The atoll-like shape, consid-ered in the literature the best de-scriptionoftheLatemar’sstructure,mustnowberejectedonthebasisofthedataofPretoet al. (2011).Theyfound that synsedimentary tecton-icsstronglyaffectedboththeshapeandfaciesarrangementoftheplat-form. The fault system created acomplexgeometryinplanviewandmadethetransitionbetweenthein-terior platform to the boundstonereef facies abrupt. On the otherhand, the detailed field mapping of Pretoet al. (2011) definitively dem-onstratestheisolatednatureoftheLatemarbuildup.
7.3 Materials and Methods
7.3.1 Samples
Samples were collected fromtheCDLsection(Pretoet al.,2001).Thisstudycovers117cyclesand4samples per cycle were collectedonaverage,foratotalof486speci-mensina102mlongseries.Forthethinnestcycles(10to15cmofthick-ness)itwaspossibletocollectonly2or3samples/cycle.Thesamplesdidnotneedtobeorientedbecause
therockmagneticcyclostratigraphythat was developed does not relyon paleomagnetic directions, onlymagnetization intensities. Particu-larcarewastakentosampleawayfrommagmaticdikesandtoavoidportionsof thesectionstronglyaf-fectedbydolomitization.Eachsam-ple was described on the basis ofthesub-environmentitrepresented.Tworankserieswerethuscreated:the first one divides all the samples in twocategories,subtidalandsu-pratidal.Thesecond,basedon thesubdivision of Preto et al. (2001),creates4categoriesrankedinorderofincreasingdepth.
7.3.2 Magnetic Measurements
The following parameterswere measured for all samples, inthis order: Natural Remnant Mag-netism (NRM), Magnetic Suscepti-bility(MS),AnhystereticRemanentMagnetization (ARM) in a 97 mTDC field and a 100–0 mT alternating field, Isothermal Remanent Magne-tization (IRM) in a 1 T field which IRM acquisition experiments indi-cateisatornearlyatsaturation.Forasubsetof14samples,IRMacquisi-tionexperimentswereconductedin21stepsfrom16mTupto1T.IRMacquisition results were modeledusing an Excel program availablefrom the Utrecht paleomagnetismlaboratory website (Kruiver et al.,2001).Tohelpidentifythemagneticmineralogyofthesamples,thermaldemagnetization of three orthogo-nal IRMswasconducted (Lowrie,
71

1990). The three orthogonal IRMswere acquired in fields of 1 T, 0.6 T and0.1T.Thermaldemagnetizationwas conducted in 50˚C steps from 100˚C to 650˚C. Scanning electron microscope (SEM) observationswerealsocarriedoutfor11samplescollectedfromlithologiesrepresen-tativeofallfoursub-environments.
All remanence was measuredona2GEnterprises Inc.supercon-ducting magnetometer at LehighUniversityinBethlehem(PA,UnitedStates).Themagnetometerislocat-edinamagnetically-shieldedroomwith a background field of 1600 mT and a background noise level of 1x 10-11 Am2. All the samples werecrushed,usingaplasticcoatedham-mer.Ifasteelhammerwasusedforparticularlyhardsamplestheywerefirst wrapped in paper to ensure no iron fragments contaminated thesamples. The rock pieces for eachsamplewerepackedinsmall8cm3plasticboxes(2cmx2cmx2cm).Theboxes were packed tightly enoughto ensure that all rockpieceswereimmobilized during measurement.Magnetic susceptibility was mea-suredusinganAgicoKLY-3sKap-pabridge.ARMswereimpartedus-ingaSchonstedtGSD-5alternatingfield demagnetizer modified to ap-ply partial ARMs. IRMs and IRMacquisition experiments were car-riedoutwithanASCImpulsemag-netizer. Thermal demagnetizationwas conducted in an ASC TD-48thermalspecimendemagnetizer.
To observe minerals with
the scanning electron microscope(SEM), samples were first of all pul-verized: samples were broken insmallpieces(0.3cm3maximum)us-ingaplastichammer,thenputinaaluminumoxide(Al2O3)mortarandfinally in a Spex ball mill. A mag-neticseparationwasconductedbycirculatingaslurrymade fromthepulverizedrockanddistilledwaterpast a needle magnetized by rareEarthmagnets(HounslowandMa-her,1999).
7.3.3 Statistical time series analy-sis
All the data collected wereanalyzed with AnalySeries andSpectra SSA-MTM Toolkit, Version 4.4. Standard non-parametric tech-niques were performed: spectrumestimation and coherency analysis(Thomson, 1982, 1990) and timefrequency landscaping (runningperiodograms). Spectra were ob-tainedusing theMultiTaperMeth-od(MTM)andalldataweretreatedusinga2ptapertoobtainthepowerspectra.UsingthesoftwareSpectraSSA-MTM Toolkit, Version 4.4, a rednoisemodelwasappliedtoallthespectrainordertoobtain3con-fidence limits (90%, 95% and 99%). Sedimentation rates were calculat-ed with the average spectral misfit method(ASM)developedbyMeyerandSageman(2007).Becausemostofthedata’svarianceoccursatfre-quencies between 0 and 2 cycles/m, only the significant components (>90% probability) identified by
72

the MTM harmonic test in the 0-2cycles/mbandwereconsidered.Afirst calculation was made for sedi-mentationratesthatvariedfrom1.0cm/kyto100cm/kywitha0.5cm/kyincrement.Sinceaminimumap-pears at 1.5 cm/ky, ASM was ap-plied again in two restricted fields, from 1.0 cm/ky to 20 cm/ky witha 0.1 cm/ky increment and from1.0cm/kyto7.0cm/Kywitha0.02cm/kyincrement.
7.4 Results
7.4.1 Cima Forcellone
For the pilot study carried onat Cima Forcellone, about 200 un-evenly spaced samples were col-lectedover40mofseries.Foreachsample,NRM,MS,ARMandSIRMwere measured and S-ratio andARM/SIRMcalculated.Theyrevealacoherentsignalindicatingmagnet-icmineralconcentrationvariationsintunewithadepthindexderivedfrom facies cyclicity (fig. 7.1, appen-dix1).Thedepthindexisbasedonassigning 0 for subaerial exposurefaciesand1forsubtidalfacies.
ARM,ameasureoftheconcen-tration of fine-grained magnetite, shows spectral peaks with wave-lengths of 500 cm (0.2 cycles/m)and110cm(~1cycle/m),whilethefacies depth index shows period-icitieswithwavelengthsof500cmand118cm.PrincipalwavelengthsintheMS(800cm,i.e0.12cycles/m;120 cm, 0.85 cycles/m) and SIRM(400cm,0.25cycles/m;110cm)arein reasonable agreement with the
ARMdata.MSandSIRMalsomea-sure magnetic mineral concentra-tion,butaredifferentmeasuresthanARM(seeabove).Thefaciesdepthindexdoesnothaveasmuchlowfre-quencypowerastheARMbecauseofitsconcentrationofpowerinthecyclewavelengthsthemselves.Thisisthecombinedresultofthebinaryvalues (0,1) and the fine-scale sam-pling, i.e., every cycle is defined and “sampled” at a very high resolution. Thus,thatrankseriesspectrumalsohaspeaksatwavelengthsinthe40-60 cm range (around 2 cycles/m),capturing the thinner cycles in thesequence.TheARMandMSseries,however,don’tperfectlysampletheLatemarcyclesduetotheirregularand widely spaced sampling, andsotheytakeonmorelowfrequencypower, which happens to be con-centrated at a 5:1 “bundling” of the cycles,i.e.,500cm:100cm=5:1.TheMS spectrum has low frequencyat1/800cm,butthiscouldbedueto the preprocessing, i.e., only themeanwasremoved;otherirregularlowfrequenciescouldbepresentinthe MS series that are influencing the lowest frequency registeringthe highest power. The spectra fortheSandARM/SIRMratiosdonotgivethesameresultsastheconcen-tration parameters. The magneticparameter ratios show only weakspectral peaks at 110 cm. Most ofthepowerisatperiodicitiesclosetothelengthofthe40msection.Thiswould suggest that only magneticmineral concentrations, and not
73

Fig.7.1:Rockmagnetic-basedmeasurementsofLatemarcyclicityfroma40mtransectintheForcellonesec-tion,comparedwiththefaciesrankseries(0=exposure,1=subtidal,Goldhammeret al. (1987) classification. LayersMthroughPrefertomarkerbedsofEgenhoffet al.(1999).Numbersinthe4pMTMspectra(calculatedwithAnalyseriesfreewareofPaillardet al.,1996)ontherightidentifythewavelengthsofspectralpeaksincentimeters.Seetextforfurtherdetails.
magneticgrainsizevariations,varyat thedominant frequenciesof theLatemarcarbonatefaciescyclicity.
7.4.1 CDL Series
The analyses of CDL seriescomprises NRM, MS, ARM, IRM,S-ratio,ARM/SIRMandARM/MS
74
measurements (Fig. 7.2, Appendix2). Three depth rank series werecreated(seeaboveinthetextforex-planation) and compared with themagneticparameters.IRMacquisi-tion,LowrietestandSEMobserva-tionswerecarriedoutonasubsetofselectedsamples.
IRM acquisition
IRM acquisition was conduct-edonasubsetofsamples.TheIRMacquisitiondatacanbemodeledtodetermine the different magneticcoercivitycomponentsoftherocks(Kruiveret al.2001).Coercivitycanbe used to constrain the magneticminerals present in the rocks. Ex-periments carried out show a pre-dominance (78 % on average) of a low coercivity phase with a meancoercivityof27mT(median28mT;min.value14mT;maxvalue38mT;st.dev.7.3).Thisvaluesuggeststhatmagnetiteisthedominantmagnet-icmineralintherocks(DunlopandOzdemir,1997).Asmallamount(20% on average) of a high coercivity mineral (mean253mT;min.value100mT;maxvalue708mT, st.dev.154.7), probably hematite, is alsopresent.
Lowrie Test
A subset of 15 samples waschosenforcoercivity-thermalanal-ysis to help identify the magneticmineralogy(Lowrie,1990).Sampleswerechosentoencompassboththecomplete stratigraphic series andall four microfacies considered.
The curves obtained confirm the presence of a major low coerciv-ityIRM(0.1T)componentwithanunblocking temperature around550°C. This unblocking tempera-ture is characteristic of magnetite.Other unblocking temperaturesthat emerge are around 650°C,675°CforthehighcoercivityIRM(1T) component, typical of hematite,and between 200°C and 300°C forboth low and medium coercivityIRM(0.1, 0.6T), typicalofgreigiteorpyrrhotite.Thus,theLowrietestconfirms the presence of magnetite asamajorcomponentof themag-neticmineralgrains,withhematiteasanimportantsecondarycompo-nent. However, the ARM resultswillnotbeaffectedbythepresenceof hematite since the low fields used toapplytheARMswillnotactivateanyhighcoercivityhematitegrainsin the samples. In addition, theLowrie test indicates the presenceofalowcoercivityphasewithlowunblocking temperature (between200°Cand300°C).Thismeansthata small amount of sulfides are pres-ent:evidenceforgreigiteisprimar-ily the low coercivity IRM (0.1 T)demagnetization curves that ex-hibit an unblocking temperaturebetween 200°C and 300°C. Somesamplesshowthesameunblockingtemperature but for medium coer-civityIRM0.6T:thesevaluescouldindicatethepresenceofpyrrhotite.
SEM images
Some SEM observations were
75

Lb5
?
La23
?
La46
Lb6
Base CDL
Tepee zone
Ammonoidhorizon
Tepee
Tuff horizons
Boundary ofsed. cycle
Subtidalfacies (white)
Metricscale
Supratidalto soil facies(gray)
0 NRM 5 0 MS -1e-7 e-4 0 ARM 3 e-6 0 SIRM 5 0 S-Ratio 1e-5 2 Rank Series 4 -1 -3 Log(ARM/MS) -1.5 0 ARM/SIRM 0.2
76
Fig.7.2(previouspage):Magneticparametersdi-stributionalongthe102metresoftheCDLseriescomparedwiththelithologicalobservationofthefacies(basedonPretoet al.2005).
carried out on a subset of 11 sam-plesrepresentingallthe4subfaciesusedfortheRankSeries.Submicronsize magnetite and hematite wereobserved, even if the percentageof hematite versus magnetite doesnotcorrespond towhat theS-ratiovaluessuggest.Thishappensprob-ablybecausemagnetitehasamuchsmaller grain size than hematite.Duringthecrushingprocessisthuseasier to liberate more hematitejustbecauseofitsbiggergrainsize.Somegreigiteandpyrrhotite seemtobepresenttoo,basedonthemor-phology of the grains, even if sul-fide content is much smaller com-paredtothattheoxides(Appendix2). All magnetic minerals exhibitwellroundededgesandsometimestheoriginalhabitofthegrainsisnoteasilyrecognizable.
Natural Remanent Magnetization (NRM)
NRM is the remanent magne-tization present in the rock beforelaboratorytreatment.Itistypicallycomposedofmorethanonecompo-nent:aprimarymagnetization,ac-quiredduringrock formation,andsecondary magnetizations, formedsubsequently to rock formation.Thelattercanresultfromchemicalchanges in the ferromagnetic min-erals, exposure to lightning strikesor a viscous magnetization ac-quired during long term exposure
topost-rockformationgeomagnet-ic fields. NRMs are, therefore, not usefulfortimeseriesanalysissincethey will vary with the amount ofsecondary magnetizations. How-ever,atLatemarhighNRMvalueshave been used to indicate recentlightning strikes (Kent et al. 2004),so samples exhibiting high NRMswereavoidedfortimeseriesanaly-sis. Thus, a first threshold at 1.5x10-
6 Am2/kg, a second threshold at1x10-6 Am2/kg and a third thresh-old at 5x10⁻⁷Am2/kg were appliedfor the time series analysis. Timeseriesanalysiswererunondatabe-lowthese thresholdsremovingthehighestvalues.Thespectra for theraw data and its running periodo-gramareverynoisy,nopeaksclear-lyemerged.Theperiodogramsareeasiertointerpretwhenthehighestvalues are removed (first threshold). The power spectra for the first and thesecondthresholdrevealastrongpeak at 0.015 cycles/m (fig 7.3). In fact, this is just an artifact reflecting thehighNRMvaluesataround80minthesection.
Magnetic Susceptibility (MS)
MS measures the concentra-tion of all the magnetic mineralsin a sample, including the ferro-magnetic, paramagnetic and dia-magneticminerals.MostoftheMSvaluesarenegativeforourresults,which means that the diamagneticfraction from carbonate dominatesthe MS. Thus, MS does not give agood measure of detrital magnetic
77

Fig. 7.3: NRM 4π MTM spectra (calculated with Analyseries freeware of Paillard et al., 1996) and red noise model.Thegraycolumnindicatesahugepeakat0.015cycles/minthe1stand2ndthreshold.Thisisanartifact:ataround80moftheseriesarepresentthehighestvaluesofNRMmeasuredforthethresholdconsi-dered.Suchvaluesaffectthecalculationofthespectra.Thesamepeakisnotpresentlookingattherawdataand at the 3rd threshold: the raw data exhibit NRM values the highest values in the first meters of the series, contrastingthusthevaluesat80m.Inthe3rdthresholdinsteadallthehighestvalueswerenotconsidered.
NRM
mineral concentration variationsfortheLatemarrocks.Therawdataspectrum for MS is rather noisy: aspectralpeakat0.7cycle/mreachesthe 99% confidence limits of the red noise model and exceeds it if thehighest NRM values are removed(first threshold). In this case (first threshold), another spectral peakis observed at 1.25 cycles/m (Fig.7.4).
Anhysteretic remanent magneti-zation (ARM)
ARMmeasures theconcentra-tion of low coercivity (< 100 mT)ferromagneticminerals.Acommonmagneticmineralwiththischarac-
teristic is ferrimagnetic magnetite.ARMis stronglygrainsizedepen-dent for magnetite: the finest mag-netite particles have the strongestARMs (Dunlop andArgyle, 1997).BecauseARMdoesn’tmeasurepara-magneticanddiamagneticminerals,itisapowerfultoolfordetectingthecyclicity of detrital magnetite con-centration variations in carbonatesequences(Lattaet al.,2006).MTMspectraandrunningperiodogramsoftheARMdataseriesexhibitasig-nalthatisclearerthanthespectraoftheNRMandMSdataseries.Rawdata show a well-defined peak at 1 cycle/mandabroaderpeakat0.2cycles/m.Thelatteroneexceedthe
78
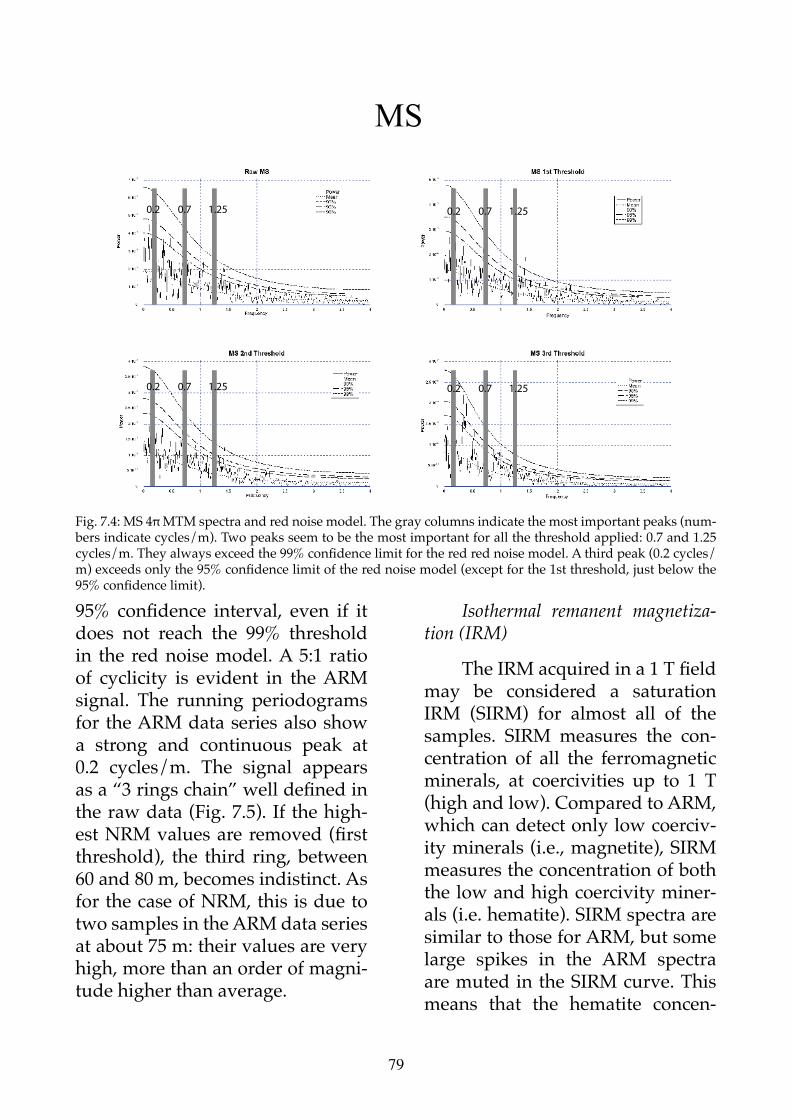
Fig. 7.4: MS 4π MTM spectra and red noise model. The gray columns indicate the most important peaks (num-bersindicatecycles/m).Twopeaksseemtobethemostimportantforallthethresholdapplied:0.7and1.25cycles/m. They always exceed the 99% confidence limit for the red red noise model. A third peak (0.2 cycles/m) exceeds only the 95% confidence limit of the red noise model (except for the 1st threshold, just below the 95% confidence limit).
MS
0.2 0.7 1.25 0.2 0.7 1.25
0.2 0.7 1.25 0.2 0.7 1.25
95% confidence interval, even if it does not reach the 99% threshold in the rednoisemodel.A5:1 ratioof cyclicity is evident in the ARMsignal. The running periodogramsfor theARMdataseriesalsoshowa strong and continuous peak at0.2 cycles/m. The signal appearsas a “3 rings chain” well defined in therawdata(Fig.7.5). If thehigh-est NRM values are removed (first threshold), the third ring, between60and80m,becomesindistinct.AsforthecaseofNRM,thisisduetotwosamplesintheARMdataseriesatabout75m:theirvaluesareveryhigh,morethananorderofmagni-tudehigherthanaverage.
Isothermal remanent magnetiza-tion (IRM)
The IRM acquired in a 1 T field may be considered a saturationIRM (SIRM) for almost all of thesamples. SIRM measures the con-centration of all the ferromagneticminerals, at coercivities up to 1 T(highandlow).ComparedtoARM,whichcandetectonlylowcoerciv-ityminerals(i.e.,magnetite),SIRMmeasurestheconcentrationofboththelowandhighcoercivityminer-als(i.e.hematite).SIRMspectraaresimilartothoseforARM,butsomelarge spikes in the ARM spectraaremutedintheSIRMcurve.Thismeans that the hematite concen-
79

Fig. 7: ARM periodogram stratigraphic height vs. frequency. Well evident the “ring structure” in corrispon-denceofafrequencyof0.2cycles/m.The5:1bundlingisherenotsoevidentlikeitisinthe4pMTMspectra,evenalessintensesignalincorrispondenceofthefrequencyof1cycle/misstillquiteclear.Closetothesamefrequency,atastratigraphicheightbetween55and75mastrongsignalcamesoutforthe1st,2ndand3rdthre-sholdapplied.ThishappensbecauseofthepresenceofthehighestARMvaluesinthatparticolarstratigraphicposition that emphasize the signal in the periodogram. The “chain structure”, if we assume that the 0.2 cycles/mfrequencyisrelatedtoprecession,couldbewellexplainedastheexpressionofshortandlongprecession.
0
10
20
30
40
50
60
70
80
0 0.5 1 1.5 2 2.5
Raw 1st
2nd 3rd
Stra
tig
rap
hic
Hei
gh
t (m
)
Frequency (cycles/m)
0
10
20
30
40
50
60
70
80
0 0.5 1 1.5 2 2.5
Stra
tig
rap
hic
Hei
gh
t (m
)
Frequency (cycles/m)
0
10
20
30
40
50
60
70
80
0 0.5 1 1.5 2 2.5
Stra
tig
rap
hic
Hei
gh
t (m
)
Frequency (cycles/m)
0
10
20
30
40
50
60
70
80
0 0.5 1 1.5 2 2.5
Stra
tig
rap
hic
Hei
gh
t (m
)
Frequency (cycles/m)
tration doesnot always follow themagnetiteconcentrationvariations,suggestingdifferentsourcesorgen-esis for the two oxides. Runningperiodograms for the SIRM seriesare difficult to interpret, with many peaks at frequencies between 0 to1.5 cycles/m. SIRM spectra reveal3mainpeaks, at 0.4, 0.75and1.25cycles/year. The first one is masked byahugeverylowfrequencypeakdue to some high SIRM values intheupperportionofthesection.
Depth Rank Series 2
Depth Rank Series 2 is the first of the two rank series analyzed. Itdivides the samples into two cate-gories,basedon theirdepositionalenvironment: subtidal and supra-tidal.Avalueof0wasassignedtosubtidalsamples,avalueof1tothesupratidal. Power spectra revealthat the most powerful peak is ata frequency of 0.07 cycles/m, cor-responding to a wavelength of 14m.Thissignalisalsoevidentintherunning periodograms, either forthe raw data or data filtered using alltheNRMthresholds.Threeother
80
peaksalwaysexceedthe thresholdof 99% confidence in the red noise model.Theyareat0.6,1and1.4cy-cles/m.
Depth Rank Series 4
DepthRankSeries4,asprevi-ously mentioned, is based on thedepositional environment classifica-tionpresentedinPretoet al.(2001).From -1 to 2, samples are classified based on their deposition in pro-gressively shallower water withsubaerialexposureatrank2.Powerspectrarevealtwolargepeaksat0.5andcloseto1.0cycles/m.Theycanbe related to the 0.6 e 1 cycles/mpresentintheDepthRankSeries2spectra, indicating wavelengths of0.75 m and 1 m. The signal at 0.5cycles/m is also clearly present intherunningperiodograms,aswellasthepeakat1cycle/m.Twooth-er smallpeaks revealingcyclicitieswithwavelengthsof30and40cmarealsopresent,buttheydisappearif some of the samples of dubiousfacies interpretation are assignedto another class (Depth Rank Se-ries4b).TheDepthRankSeries4bis based on the same depositionalenvironment classification used for the Rank 4, but assigned differentvaluestothosesamplesofambigu-ousinterpretation:if,forexample,asamplecouldnoteasilydescribedasaopensubtidalfaciesbutpresentedfeatures halfway between an openanda resctrited subtidal, inDepthRankSeries4itwasinterpretedasopen subtidal (and thus, assigned
avalueof-1),inDepthRankSeries4b it was considered a restrictedsubtidal (and a value of 0 was as-signed).Thisshowshowsubjectivefield interpretation of the subfacies can significantly affect the spectral results.
S-Ratio
TheS-Ratiomeasurestheratiooflowcoercivitytohighcoercivitymagneticminerals.Inpractice,ital-lows the detection of variations intheratioofmagnetite/hematite.Inthis study, the S-ratio formula byThompson and Oldfield (1986) is used:
S=-(IRM0.3T/SIRM1T)
Most of the values for theLatemar are close to one whichmeans that magnetite is the majorcomponentof themagneticminer-als throughout the whole section.Power spectra are influenced by a seriesoflowS-ratiovaluesat66minthesection,whichcausesalargespectralpeakwithverylowfrequen-cy.Apeakat0.2cycles/memergesover the 90% confidence level of the rednoisemodel.Thesignalisalsostrongintherunningperiodograms,where the most powerful valuesdraw a nearly straight line (Fig.7.6).At0.6cycles/maspectralpeakrises above the 95% confidence lev-el,shownalsointheperiodograms,whiletwopeaksbetween1.2to1.4cycles/m are the only peaks thatemerge over the 99% confidence level.Thissignal isevidentalso in
81

S-R
atio
5:1
bu
nd
ling
5:1
bu
nd
ling
80 70 60 50 40 30 20 10 00
0.5
11.
52.
52
Freq
uen
cy (c
ycle
/m)
Stratigraphic Height (m)
80 70 60 50 40 30 20 10 00
0.5
11.
52.
52
Freq
uen
cy (c
ycle
/m)
Stratigraphic Height (m)
82
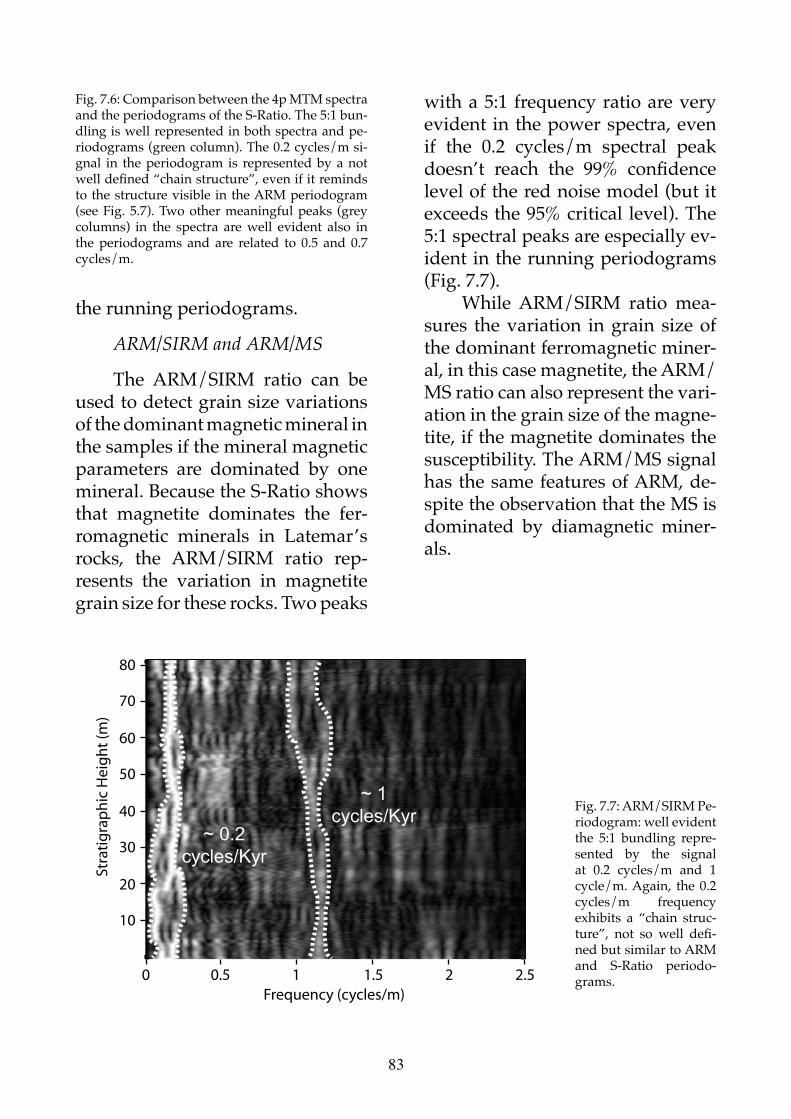
Fig.7.6:Comparisonbetweenthe4pMTMspectraandtheperiodogramsoftheS-Ratio.The5:1bun-dlingiswellrepresentedinbothspectraandpe-riodograms(greencolumn).The0.2cycles/msi-gnal in theperiodogram is representedbyanotwell defined “chain structure”, even if it reminds tothestructurevisible intheARMperiodogram(seeFig.5.7).Twoothermeaningfulpeaks (greycolumns) in the spectra are well evident also inthe periodograms and are related to 0.5 and 0.7cycles/m.
Fig.7.7:ARM/SIRMPe-riodogram:wellevidentthe 5:1 bundling repre-sented by the signalat 0.2 cycles/m and 1cycle/m.Again, the0.2cycles/m frequencyexhibits a “chain struc-ture”, not so well defi-nedbutsimilartoARMand S-Ratio periodo-grams.
~ 0.2 cycles/Kyr
~ 1cycles/Kyr
10
0 0.5 1 1.5 2 2.5
20
30
40
50
60
70
80
Frequency (cycles/m)
Stra
tig
rap
hic
Hei
gh
t (m
)
therunningperiodograms.
ARM/SIRM and ARM/MS
The ARM/SIRM ratio can beusedtodetectgrainsizevariationsofthedominantmagneticmineralinthesamplesifthemineralmagneticparameters are dominated by onemineral.BecausetheS-Ratioshowsthat magnetite dominates the fer-romagnetic minerals in Latemar’srocks, the ARM/SIRM ratio rep-resents the variation in magnetitegrainsizefortheserocks.Twopeaks
witha5:1frequencyratioareveryevidentinthepowerspectra,evenif the 0.2 cycles/m spectral peakdoesn’t reach the 99% confidence leveloftherednoisemodel(butitexceeds the 95% critical level). The 5:1spectralpeaksareespeciallyev-identintherunningperiodograms(Fig.7.7).
While ARM/SIRM ratio mea-sures thevariation ingrain sizeofthedominantferromagneticminer-al,inthiscasemagnetite,theARM/MSratiocanalsorepresentthevari-ationinthegrainsizeofthemagne-tite,ifthemagnetitedominatesthesusceptibility.TheARM/MSsignalhasthesamefeaturesofARM,de-spitetheobservationthattheMSisdominated by diamagnetic miner-als.
83

Fig.10:IRMacquisitiondataforthesampleHKA46c.Twodifferentmagneticcomponentarepresentinthesample, The first component (92%) is represented by a low coercivity mineral (33.9 mT), the second component byahighcoercivityone(190.5mT).Thisvaluessuggestmagnetite(lowcoercivity)andhematite(highcoerci-vity)asdescribedbyDunlopandOzdemir(1997).
10 Log Applied field
0.0E+00
5.0E-07
1.0E-06
1.5E-06
2.0E-06
2.5E-06
3.0E-06
3.5E-06
0 0.5 1 1.5 2 2.5 3 3.5
Raw data
Component 1
Component 2 Sum of components
Syn
thet
ic IR
M
Linear Acquisition Plot - LAP
7.5 Discussion
Therockmagneticcyclostratig-raphyoftheserocksshowsthepres-ence of a well-defined cyclicity. Ba-sically,thecyclicityobservedisthesameforall thedifferentmagneticparametersstudiedbutdifferencesare evident between the magneticdataandthedepthrankseries.Theresults obtained from all the mea-surementsarestillambiguouswithregard to the solution of the Mila-nkovitch versus sub-Milankovitchtiming controversy. The relation-ships between the most powerfulpeaksfromthespectraobtainedbythemagneticparametersseemtoin-dicate a 5:1 “bundling”, suggestive ofeccentricityandprecessionforc-ing,thatclearlyidentifyaMilanko-vitchoriginfortheLatemarcycles.On the contrary, depth rank seriesexpress a different bundling. Eachparameter is coherent with itselffromboththestudysites,CimaFor-celloneandCimondelLatemar.In
fact,the5:1bundlinginitselfisnotevidenceforaMilankovitchsignal.Itcouldbeindeedinterpretedastheresult of a combined Milankovitchand sub Milankovitch parameters,aswewillexplainbelow.
7.5.1 Origin of the magnetic sig-nal and its paleoenvironmental signifi-cance
InthecaseofCimaForcellone,modeling of IRM acquisition data(Fig. 7.8) and an average S ratioof 0.92 indicate that magnetite isthe dominant magnetic mineral inthese rocks, with minor amountsof a high coercivity mineral, prob-ablyhematite,assuggestedby thecoercivityvalues.Hematitemaybeprimaryor secondary,butbecauseofitshighcoercivityitdoesnotcon-tributetotheARM.Sincemagnetiteistypicallyaprimary,detritalmag-neticmineralinmarinesedimenta-ryrocks,ARMisprobablythebestparametertomeasurevariationsin
84
paleoenvironmentalprocesses.TheARMsusceptibility(ratioofARM/DC field used for ARM applica-tions)of0.941kA/mindicatesthatthe magnetite is submicron in size(Dunlop&Argyle,1997)andcouldmeanthatitisderivedfromairbornedust. A similar interpretation wasmadeforthemagnetitecarryingtheARMoftheCretaceousCupidoFor-mationandSanAngelLimestoneinMexico(Lattaet al.,2006)basedonmagneticgrainsizeanddirectSEMobservations of magnetic particlesextracted from the rock. Oldfield et al.(1985)usedtheARMsusceptibil-ity/SIRM ratios for the magnetitetodetecttheoriginofthemagneticgrains collected shipboard in thenorthernAtlanticOceanandontheBarbados islands. They found thatarangeofvaluesbetween0.25and1.25x10-3m/Aidentifyeoliandust.Comparable values were obtainedalsobyHunslowandMaher(1999).Kumar et al. (2005) conducted arockmagneticstudyofArabianSeasediments. Samples came from offthe northwestern and southwest-ern coasts of India. Northwesternrocks,interpretedtohaveamixtureof fluvial and eolian sources, have aARMsusceptibility/SIRMratioof0.5to1.3x10-3m/A.Southwesternsitesinsteadareconsideredtohavefluvial sources and exhibit values rangingfrom1to2x10-3m/.DatafromCimaForcellonerevealameanvalueof0.62x10-3m/A(s=0.23x10-
3m/A),whichisthusmuchconsis-tent with an eolian rather a fluvial
source.The same results are obtained
for the Cimon del Latemar series.Becauseofthemostsuitablesampleratechosen,theanalysescarriedontheCDLseries,withrespect totheCimaForcellonetransect,shouldbeconsideredmoreaccurate. IRMac-quisitionexperimentsandanaver-agevalueofS-Ratioof0.78indicateagain that magnetite is the domi-nantmineral;asmallamountofhe-matite ispresent too,asevidencedby the high coercivity values, aswell as some magnetic sulfides. The presence of the sulfides is support-edalsobytheLowrietest(Fig.7.9).
Again,asforCimaForcellone,an average value of S-Ratio ratioof 0.78 confirms the dominance of sub micron size magnetite. SincemagnetitedominatesboththeARMand SIRM of these rocks, the ratiobetween them is a good indicatoraboutthemagneticgrainsize.Thisassumption is reinforced by theIRMacquisitionexperiments,whichconfirm magnetite as the dominant ferromagnetic mineral in the sam-ples.As already said, a submicronsizeofthegrainscouldreasonablysuggest an eolian dust origin forthe magnetite. SEM observationsreveal very rounded grains, rarelyangular or subangular in shape,whichmeansthattheyweretrans-ported for a relatively long periodof time. The ARM susceptibility/SIRM ratio range from 3.283 x 10-
5 m/A to 9.036 x 10⁻³ m/A, with ameanvaleof0.997x10-3m/Aand
85

Fig.7.9:ResultsofLowrieTestonfoursamples.XaxisrepresentshighcoercivityIRM(1T)component,Yaxismedium coercivity IRM (0.6T) and Z axis low coercivity IRM (0.1T). The unblocking temperature around650°Cforhighcoercivitycomponent,typicalofhematite,iswellvisibleforallthesamples.Sample6dand90devidencethepresenceofmagnetite(lowcoercivityandunblockingtemperatureatabout550°C),whiletheother samples suggest the presence of silfide like greigite or pyrrothite (low and medium coercivity minerals withanunblockingtemperatureinbetween200°Cand300°C.
asof0.584x10-3m/A.Thesevaluesare a little bit higher with respecttothosefromCimaForcellone,butthosesampleswhichhavethehigh-estvaluesofNRM.Thecorrespon-dencebetweenvariationsinsealev-el for the Forcellone section of theLatemarcarbonates,asindicatedbythefaciesdepthindex,andaeolian
input, as indicated by submicronmagnetite, suggests that two inde-pendentglobalproxiesarebeatingatthesamefrequencies,andimpli-catingclimatevariationsaspartofthecauseoftheLatemarcarbonatecyclicity.Suchaninterpretationim-pliesaconstantsedimentationratefortheAeoliandust.Onthecontrary,
86

assumingavariablesedimentationrateforthedetritalcomponent,theexplanation is slightly different. Ifdepth rank series reflect sea level fluctuations, subtidal facies would bedepositedmorequicklythansu-pratidalfacies.Thus,magneticdustwouldbedilutedwhiledepositingin subtidal environments, and thesectionwouldbecondensedduringsupratidal phases. The sedimen-tological approach to the Latemarcontroversy was thus correct butnotprecise:while faciesranking isbased on field observation and in-terpretation is necessary, the mea-surementofmagneticpropertiesisrelatively objective. Thus environ-mental magnetism avoids the biasinherent in facies interpretation.Otherpossiblesourcesforthemag-neticgrainsshouldbeconsidered:iftheyarenotrelatedtoaneoliandustinput,theycouldrepresentaterrig-enous signal from a nearby fluvial systemor,alternatively,theycouldbederivedfromamagmaticsource,i.e. airborne volcanic ash. The first hypothesis is not supported by asearchoftheliterature:theLatemarplatformhasalwaysbeentradition-ally considered an isolated atoll(Gaetani et al., 1981; Goldhammeret al.,1987;Harris,1993;Egenhoffet al.,1999)andrecentstudiesreinforcethisinterpretation(Pretoet al.,2011).Asmentionedinthegeologicalset-ting, it is impossible to determinewhere the closest emerged landsweresituated.OnepossibilityisthePermianignimbriticchainofLago-
rai, located a few km. southward,but there isnoproof that thiswasemergent land during the Triassic.Theisolatednatureoftheplatformdoes not support the fluvial origin forthedust.Also,nootherdetritalsedimentsother thanthemagneticgrains have been described in theliteraturenorfoundintheLatemarrocks.Sinceash layersarepunctu-ated in their occurrence while therecordofvariationinthemagneticminerals’ concentration is continu-ousforthewholesection,wethinkthemagmaticsourceshouldbere-jected.
7.5.2 Spectral characteristics and comparison with lithological series
LookingattheMSsignalintheCDLseries,itappearsrathernoisy:the 5:1 “bundle” clearly present in thedata from theCimaForcellonetransectisnotclearintheCDLse-ries. However, two major spectralpeaks are observed at ca. 0.75 cy-cles/m (1.3 m) and 0.16 cycles/m(6.25 m), thus the 5:1 bundling isstill present, but other weaker butsignificant peaks are also visible. Thisisduetothedominanceofcar-bonatewithrespecttothemagneticfraction.MSisindeedtheresponseofall themineralcomponentsofarock, paramagnetic, diamagneticandferromagnetic.Ifthevaluesarenegative,asithappensforthema-jorportionofourdata,itmeansthatthe diamagnetic component (fromthe carbonate fraction) dominatesthe assemblage. Only few samples
87

revealapositive,even ifvery low,value of MS. They correspond tothehighestNRMvalues.Infact,MScould be a good proxy for climatedriven fluctuation when it is domi-natedbytheferromagneticfraction,whichisnotthecaseofthisstudy.Thisexplainsthenoisysignalofthespectrum.Thus,wethinkthatMSisnotthebestparameterfortheinter-pretationofthesedimentarycyclic-ityoftheLatemar.
The 5:1 “bundling” is instead quiteevidentinARM,S-Ratio,andinARM/SIRMandARM/MSratiosofCimondelLatemar.Allthesepa-rametersareferromagneticparame-tersdominatedbymagnetitebasedon the S ratio and IRM acquistionresults.
Anotherimportantresultfromthis study is related to the differ-encesbetweenthemagneticparam-eterswithrespecttothedepthrankseries.As highlighted in the Intro-duction, several problems havebeenraisedinthefaciesdescriptionof the Latemar since Goldhammeret al. (1987): thereisageneralmis-understanding of the definition of aLatemarcycle,which isdifferentfrom author to author (see Gold-hammeret al.,1987;Egenhoffet al.,1999;Pretoet al.,2001;Zuhlkeet al.,2003). Lateral facies variability as-sociatedwiththesubjectivityofthesedimentological observation aretheprincipalcauseofthedifferencein the cycle definition. The spec-tral analyses of the depth rank se-riescreatedillustratesthisproblem.
The wavelengths associated withthe depth rank series 2 and 4 arenotinagreementwiththemagneticpropertiesspectra,withtheonlyex-ceptionofthe1mwavelength,welldefined for all the parameters. The other peaks are not consistent: the5:1 “bundling” is not represented so theresultsappearinconsistentwiththespectralanalysesfromthemag-neticparameters.Apossibleexpla-nationfor this is inthedatathem-selves. The magnetic parametersare measurements, an expressionof physical, objective properties.The depth rank series instead, arestrongly related to the subjectivepointofviewofthegeologist,andcan be affected by interpretationproblems,asshownbefore.
Thus,forageneralcyclostrati-graphicpurpose,wethinkthattheanalysesofthemagneticpropertiesoftherocks,especiallyARM,SIRM,ARM/MS,S-ratioandARM/SIRM,combined with some IRM acquisi-tionandLowrieteststodeterminethemagneticmineralogyofthesam-ple, are more useful and accuratethan the simple depth rank seriesanalyses.Thepowerof this tool isfirst of all in its independence from field observation, then in the ease of collecting samples (no need fororientation,asmallamountofrockisrequired)andinthequicknessofthe analyses (every sample takesabout1minutetobemeasured).
7.5.3 The Latemar cycle: Evidence for a Milankovitch or a sub-Milankov-
88
itch Timing?Spectra obtained from the
magnetic properties reveal a clear5:1 “bundling” consistent with the eccentricity:precession bundling.With this orbitally driven forcing,thesedimentationrateexpectedforthe whole platform should be ofabout4.5 cm/kyr (Goldhammer et al., 1987; Hinnov & Goldhammer,1991;Pretoet al.,2001,2004).Thisisincontrastwithalltheradiometricdatasofarpublished:Mundil et al.(2003)bracketthesuccessionto2to4MabasingonU-Pbdatedzircons,Kent et al. (2004) to about 800 kyr,Bowring (pers. comm.) to 900 kyr.Suchashortspanoftimeequalstoaveryfastsedimentationrate,closeto 50 cm/Kyr, as confirmed by Mey-er(2008).Thesekindsofvaluescanbeobtainedifweconsiderthatthe1 m wavelength is linked to somesub-Milankovitch periodicities. Ifthe5:1bundlingseenintheLatemarisrelatedtotiming(50cm/kyr),the5 m wavelength would be relatedto the precession index, and the 1m to a sub-Milankovitch periodic-ity (4.000 years). The astronomicalcauses for this kind of periodicityare unknown. However, periodo-gramsrevealastrongsignalincor-rispondence to 0.2 cycles/m. It’sprincipalcharacteristicistoexhibita “chain” structure with 3 rings. This is well evident especially forthe ARM, SIRM and ARM/SIRMalong the whole 102 m transect,whilefortheS-Ratiothisfeatureisclear only in the first 40 m of sec-
tion.Inthemediumandupperpor-tionof the series this structurebe-comes hardly recognizable (cf. fig. 7&8).Thisstructurecouldbewellexplainedasthecomplexresponseofshort(19Kyrs)andlongpreces-sion(23Kyrs):every6 longpreces-sions,7shortprecessionsoccursandthis characteristic creates the “ring” featureintheperiodograms.Everyring should thus represent moreorless135Kyrs:theperiodogramsshow3rings,soapparentlythe102mtransect is theexpressionof405Kyrs.Thisimpliesforthewhole700mofthebuildup,atimespanof2.8Myrs,whichismoreinaccordwiththeradiometricdata.
7.6 Conclusions
With this study we tested thereliability of magnetic properties(MS, ARM, SIRM, S-ratio) and ra-tios between them (ARM/MS,ARM/SIRM)forcyclostratigraphicstudies, in comparison with sedi-mentological analysis. As a testcase we considered the platforminteriorsuccessionofaMiddleTri-assic isolated carbonate platform,theLatemarintheDolomites,Italy.WhileMSisnotagoodtoolwhendiamagneticfractiondominatesthemineral assemblage, other proper-ties,asARM,SIRM,ARM/MS,S-ra-tioandARM/SIRM,combinedwithsome IRM acquisition and LowrieTests to determine the mineralogyofthesample,aremoreusefulandaccuratethanthesimplerankseriesanalysis.
89

Spectralanalysesarestillquiteambiguous and did not definitively solvetheproblemoftheMilankov-ianvssub-Milankovianforcing.TheThe 5:1 bundling revealed by themagnetic signal canbe interpretedas evidence of a Milankovian sig-nal,consistentwiththeeccentricity:precession signal. This interpreta-tionwouldbeinagreementwiththe“classical” 4.5 cm/kyr sedimenta-tionratefortheplatform.Consider-ingthesubmilankovianhypothesis,the5mwavelengthshouldberelat-edtotheprecessionindex,aresultthat justifies radiometric data. How-ever, if the1mwavelengthwouldberelatedtoasub-milankoviansig-nal (of unknown origin), the spec-tralanalysesarenotinstrongcon-trastwiththeradiometricages.Thewholebuildupshoulddevolpedin2.8Myrs,a result thatbetteragreewith a faster sedimentation rate.A sub-milankovitan forcing couldthus reasonably expected for theLatemarplatform.
Finally,wetestedthepowerofmagneticanalyses: it liesaboveallin its independence from field ob-servation, in the ease of collectingsamples (no need of orientation, asmall amount of rock is required)and quickness of the analyses (ev-ery measure takes about 1 minuteforeachsample).
90
8. ConclusionsTwo coeval carbonate
platformsofMiddleTriassic,MonteAgnello and Latemar (SouthernAlps, Dolomites, Italy), wereextensivelystudiedtotesttheuseofpalemagneticpropertiesindetectingcyclostratigraphy. The platforminterior succession of the LatemarwaschosenwiththeattempttosolvethesocalledLatemarparadox.TheplatforminteriorofMonteAgnellowasinvestigatedinsteadtotesttherepoducibilityofthedata.
Strong dolomitization cha-racterizes Monte Agnello, makingthus impossible every kind of stu-dyregardingmagneticparameters.Nonetheless collected field data allowed to reconstruct the growthhistoryofthebuildup,acarbonateplatformneverstudiedbyanyone.
MonteAgnelloplatformFirstofall,MonteAgnellopla-
tform was detailed mapped andgeologicaldataobtainedweredra-ped on a high resolution DigitalTerrainModeltoevaluatethegeo-metricalparametersoftheplatform.Two stratigraphic sections wereloggedwithintheupperslope-mar-gin-lagoon progradational system;platform interior microfacies werecomparedwiththoseofthenearbyLatemar platform. Dasycladaceanalgae and scattered ammonoids fin-dingswasstudiedwithabiostrati-graphic purpose, but yielded fewresults. Ammonoids of the avisia-numandcrassussubzoneswerere-coveredinthelower-middlepartoftheaggradationalplatforminterior,bracketing the satratigraphic suc-cessionwithin thesebiozones.Thegrowthhistoryoftheplatformwasreconstructed. The Agnello massifpreserves a portion of a carbona-
91

te platform that was progradingtowards North, although it is im-possible to determine whether theplatformwasisolatedorattachedtoaputativesouthernstructuralhigh.It grew nearly 600 m until subsi-denceratessuddenlydropped,andthenprogradedatleast3.5km;thebuildupreachedatotalthicknessofabout700m.Clinoformsaresteep,30°onaverage.
Theplatformtopisrepresentedby a slightly karstified surface, sea-led by a subaerial pyroclastic suc-cession. Extended microbial crusts(including common Tubiphytes),and few coral communities cha-racterized themarginandtheup-perslopeduringtheprogradationalphase.Submetricperitidalsedimen-tarycycleswithprevailingsubtidalfacies characterize inner platformfacies. With respect to the aggra-dingLatemarplatform,microfaciesofMonteAgnelloaremoremicritic,andgrainsmoredeeplymicritized,reflecting longer residence time of lagoonal sediments before burial.WelldevelopedtepeebeltsasthoseoftheLatemarplatformareabsent.
Platformthicknessiscompara-bleorhigherthanthatofothercoe-valplatformsintheSouthernAlps,
including those that underwentdrowningintheLateAnisian.Thissuggeststhatstrongsubsidencewasnottheprimarycauseofdrowning,althoughitmayhaveenhancedtheeffectsofpaleoceanographicorcli-maticfactorsassuggestedbyPretoetal.(2005)andBracketal.,(2007).
The Latemar “mud mound”platform
A detailed facies analysis andfaciesbeltmappingoftheLatemarplatform was carried out. Newdata obtained were integrate withobservationsmadebyHarris(1993,1994), Preto (2001) and Emmerich(2005b)withnewobservations.
Four units characterize thewhole platform. Moving from itscoreandprocedingbasinwardtheyare:platforminterior,composedby4facies(2subtidaland2supratidal)andrepresentingthemostelevatedportion of the buildup; otermostplatform,characterizedby3subtidalfacies;themargin,with5boundstonefacieswheremicrobialandcementdominate; slope, composed by 4facies.Theyallrevealaconspicousamountofmicrobialite.
Quantitative analysis revealthat microbialite and early marine
92
radiaxial fibrous cements are the major component in platformbuilding.Slopesarenotdominatedby gravitative processes, they areinsteadproductivedownto250m;widespread microbialite extendsin the platform interior too. Thesedata suggest that the carbonatefactory responsible for carbonateproduction in the Latemar shouldbe an M-factory (Schlager 2000,2003).TheLatemarplatformcanbeconsideredamodmoundplatform:the term mud muond reflects the factory responsible for carbonateproduction,whilethetermplatformindicates thepinnaclegeometryofthe buildup, with its steep slopesand a flat platform interior.
Acomparisonwith the coevalGreat bank of Guizhou (SouthernChina) suggests that platformsize in itself cannot control mudproduction and geometries of theplatform. In addiction, platformgeometries,basingonacomparisonwiththeCarboniferousplatformofthe Asturias (northern Spain) canbeexplainedwithaslopesheddingmodelwhich,incontrasttoanhighstandsheddingmodel.Mechanismsof platform progradation andaggradationwillbe thusregulated
bythismodel.
EnvironmentalmagnetismThe reliability of magnetic
properties(MS,ARM,SIRM,S-ratio)and ratios between them (ARM/MS, ARM/SIRM) were tested fora cyclostratigraphic purpose, incomparison with sedimentologicalanalysis.Asatestcasetheplatforminterior succession of a MiddleTriassicisolatedcarbonateplatform,theLatemarintheDolomites,Italy,waschosen.WhileMSisnotagoodtool when diamagnetic fractiondominatesthemineralassemblage,other properties, as ARM, SIRM,ARM/MS,S-ratioandARM/SIRM,combinedwithsomeIRMacquisitionand Lowrie Tests to determine themineralogyofthesample,aremoreusefulandaccuratethanthesimplerankseriesanalysis.
Spectral analyses are stillquite ambiguous and did notdefinitively solve the problem of the Milankovian vs sub-Milankovianforcing. The The 5:1 bundlingrevealed by the magnetic signalcan be interpreted as evidence ofa Milankovian signal, consistentwith the eccentricity:precessionsignal. This interpretation would
93

beinagreementwiththe“classical”4.5 cm/kyr sedimentation ratefor the platform. Considering thesubmilankovian hypothesis, the 5mwavelengthshouldberelatedtothe precession index, a result thatjustifies radiometric data. However, if the 1 m wavelength would berelatedtoasub-milankoviansignal(of unknown origin), the spectralanalyses are not in strong contrastwith the radiometric ages. Thewholebuildupshoulddevolpedin2.8Myrs,a result thatbetteragreewith a faster sedimentation rate.A sub-milankovitan forcing couldthus reasonably expected for theLatemarplatform.
Finally,thepowerofmagneticanalyses was tested: it lies aboveall in its independence from field observation,intheeaseofcollectingsamples (no need of orientation, asmall amount of rock is required)andquicknessoftheanalyses(everymeasure takes about 1 minute foreachsample).
94
References Assereto r., Bosellini A., FAntini sestini n. And sweet w.C. (1973) The permian-triassic boundary in the southern Alps (Italy). In Permian and Triassic System and Their Mutual Boundary, Logan A. and Hills L.V. (Ed), Can. Soc. Petr. Geol., pp. 176–199, Calgary.
Assereto r. l. A. M. And KendAll, C. (1977) nature, origin and classification of peritidal tepee structures and related breccias. Sedimentology 24, pp. 153–210.
Aurell M., BosenCe d. And wAlthAM d. (1995) Carbonate ramp depositional systems from a late Jurassic epeiric platform (Iberian Basin, Spain): a combined computer modelling and outcrops analysis. Sedimentology 42, pp. 75-94.
BAnerjee s.K. And j.P. MAlleMA j.P. (1977) A new method for the determination of paleointensity from the ARM properties of rocks. Earth and Planetary Science Letters 13, pp. 360-362.
BArthès V., Pozzi j.P., ViBert-ChArBonnel P., thiBAl j. And Mélières M.A. (1999) High- resolution chronostratigraphy from downhole susceptibility logging tuned by paleoclimatic orbital frequencies. Earth and Planetary Science Letters 165, pp. 97-116.
Biddle K.t., wilson j.l. And wArMe j.e., (1978) Submarine cementation in basinal exotic boulders, and the nature of Triassic platform margins, Dolomite Alps, Italy. Proc. 10th Int. Congr. Sedimentol., pp. 1-70.
Blendinger w. (1983) Anisian Sedimentation and Tectonics of the M. Pore – M. Cernera area (Dolomites). Riv. It. Paleont. Strat. 89 (2), pp. 175-208.
Blendinger w. (1986) Isolated stationary carbonate platforms: the Middle Triassic (Ladinian) of the Marmolada area, Dolomites, Italy. Sedimentology 33, pp. 159-183.
95

Blendinger w. (1994) The carbonate factory of Middle Triassic buildups in the Dolomites, Italy: a quantitative analysis. Sedimentology 41, pp. 1147-1159, Oxford
Blendinger w. (1996) The carbonate factory of Middle Triassic buildups in the Dolomites, Italy: a quantitative analysis [Reply]. Sedimentology 43, pp. 402-404.
Blendinger w. (2001) Triassic carbonate buildup flanks in the Dolomites, northern Italy: breccias, boulder fabric and the importance of early diagenesis. Sedimentology, 48 (5), pp. 919-933.
Blendinger w. (2004) Sea level versus hydrothermal diagenesis: origin of Triassic carbonate platform cycles in the Dolomites, Italy. Sedimentary Geology 169, pp. 21-28.
Blendinger w. BrACK P., norBorg A. K. And wulFF-Pedersen e. (2004) Three-dimensional modelling of an isolated carbonate buildup (Triassic, Dolomites, Italy). Sedimentology, 51, pp. 297-314.
BloeMendAl j., lAMB B. And King j. (1998) Paleoenvironmental implications of rock- magnetic properties of late Quaternary sediment cores from the eastern Equatorial Atlantic. Paleoceanography 3, pp. 61-87.
Bosellini A. (1968). Paleogeologia preanisica delle Dolomiti centro-settentrionali. Acc. Naz. Lincei, Mem. Cl. Sc. Fis. Mat. Nat., Ser 8 (9) I, pp. 1-33.
Bosellini, A. (1984) Progradational geometries of carbonate platforms: examples from the Triassic of the Dolomites, northern Italy. Sedimentology, 31, pp. 1–24.
Bosellini A. And steFAni M. (1991) The Rosengarten: a platform-to-basin carbonate section (Middle Triassic, Dolomites, Italy). Dolomieu Conference on Carbonate Platforms and Dolomitization. Guidebook Excursion C, pp. 1–24.
Bosellini A. And rossi d., (1974) Triassic carbonate buildups of the Dolomites, northern Italy. In: L.F. Laporte (Editor), Reefs in Time and Space. SEPM Spec. Publ. 18, pp. 209-233.
Bosellini A., CAstellArin A., doglioni C., guy, F., luCChini F., Perri, M.C., rossi P.l., siMBoli g., & soMMAVillA e. (1982) Magmatismo e tettonica nel Trias delle Dolomiti. In Castellarin, A. and Vai, G. B., eds., Guida alla geologia del Sudalpino centro-orientale: Bologna, Guide Geologiche Regionali, Società Geologica Italiana, pp. 189- 210.
BosenCe d.w.j. And Bridges P.h. (1995). A review of the origin and evolution of carbonate mud-mounds. In: Monty, C.L.V., Bosence, D.W.J., Bridges, P.H.,
96

Pratt, B.R. (Eds.), Carbonate Mud Mounds. Their Origin and Evolution. Spec. Publ. Int. As. soc. Sedimentol., vol. 23, pp. 3–9.
BosenCe D. (2005). A genetic classification of carbonate platforms based on their basinal and tectonic settings in the Cenozoic. Sedimentary Geology 175, pp. 49–72.
Bourque, P.A. (1997). Paleozoic finely crystalline carbonate mounds: cryptic communities, petrogenesis and ecological zonation. Facies 36, pp. 250–253.
BrACK P., And rieBer h. (1993) Towards a better definition of the Anisian/Ladinian boundary: new biostratigraphic data and correlations of boundary sections from Southern Alps. Eclogae Geologicae Helvetiae 86, pp. 415–527.
BrACK, P., Mundil, r., oBerli, F., Meier, M., And rieBer, h. (1996) Biostratigraphic and radiometric age data question the Milankovitch characteristics of the Latemar cycles (Southern Alps, Italy). Geology, 24, 4, pp. 371-375.
BrACK, P., rieBer, h., niCorA A., Mundil r. (2005). The Global boundary Stratotype Section and Point (GSSP) of the Ladinian Stage (Middle Triassic) at Bagolino (Southern Alps, Northern Italy) and its implications for the Triassic time scale. Episodes 28 (4), pp. 233–244.
BrACK, P., rieBer, h., Mundil, r., Blendinger, w., MAurer, F. (2007). Geometry and 785 chronology of growth and drowning of Middle triassic carbonate platforms 786 (Cernera and Bivera/Clapsavon) in the southern Alps (northern Italy). Swiss Journal of Geosciences 100, pp. 327–347.
Burne r. V., Moore l. s. (1987). Microbialites: organosedimentary deposits of benthic microbial communities. Palaios 2, pp. 241–254.
CAlAnChi n., luCChini F., rossi P.l. (1978) The volcanic Rocks from the Mount Agnello area (Fiemme Valley, Italy): a contribution to the knowledge of the Mid-Triassic magmatism of the Southern Alps. Tschermaks Min. Petr. Mitt. 25, pp. 131-143
CArAnnAnte g., esteBAn M., MilliMAn j.d., siMone l., (1988). Carbonate lithofacies as paleolatitude indicators: problems and limitations. Sedimentary Geology 60, pp. 333–346.
Cros P. (1974) Evolution sedimentologique et paleostructurale de quelques plate-formes carbonatees biogenes (Trias des Dolomites italiennes). Sci. Terre 19, pp. 299-379
Cros P. And lAgny P. (1969) Paleokarsts dans le Trias moyen et superieur des Dolomite set des Alpes Carniques occidentales. Importance stratigraphique et paleogeographique. Sci. Terre 14, pp. 139-195
97

de zAnChe V., giAnollA P., MAnFrin s., Mietto P., roghi g. (1995) A Middle Triassic backstepping carbonate platform in the Dolomites (Italy): sequence stratigraphy and biochronostratigraphy. Memorie di Scienze Geologiche 47, pp. 135–155.
de zAnChe V., giAnollA P., MAnFrin s., Mietto P., roghi g. (1995) A Middle Triassic backstepping carbonate platform in the Dolomites (Italy): sequence stratigraphy and biochronostratigraphy. Memorie di Scienze Geologiche 47, pp. 135–155.
dèFArge C.,triChet j., jAunet A.M., roBert M., triBBle j. And sAnsone j. (1996) Texture of microbial sediments revealed by cryo-scanning electron microscopy. Journal of Sedimentary Research, 66 (5), pp. 935-947.
DellA PortA g., Kenter j.A.M., BAhAMonde j., iMMenhAuser A. And VillA E. (2003) Microbial boundstone dominated carbonate slope (Upper Carbonif- erous, N Spain): Microfacies, lithofacies distribution and stratal geometry Facies, 49, pp. 175–208.
DellA PortA g., Kenter j.A.M. And BAhAMonde j. (2004) Depositional facies and stratal geometry of an Upper Carboniferous prograding and aggrading high-relief carbonate platform (Cantabrian Mountains, N Spain) Sedimentology, 51, pp. 267–295.
doglioni, C. (1983) Duomo medio-Triassico nelle Dolomiti, Rend. Soc. Geol. It., 6, pp. 13-16.
doglioni, C. (1984a) Triassic diapiric structures in the Central Dolomites (northern Italy). Eclogae geol. Helv., 77 (2), pp. 261-285.
doglioni, C. (1984b) I sovrascorrimenti delle Dolomiti: sistemi di ramp-flat.Tecnoprint, pp. 1-22
doglioni, C. (1987) Tectonics of the Dolomites (Southern Alps, northern Italy), Journal of Structural Geology, 9, pp. 181-193.
dunn P.A. (1991) Cyclic stratigraphy and early diagenesis: an example from the Triassic Latemar platform, northern Italy: unpublished Ph.D. dissertation, Johns Hopkins University, Baltimore, Maryland, pp. 836
dunloP d.j. And Argyle K.s. (1997) Thermoremanence, anhysteretic remanence, and susceptibility of submicron magnetites: Nonlinear field dependence and variation with grain size. Journal of Geophysical Research, 102, pp. 20199-20210.
duPrAz C., reid P., BrAissAnt o., deCho A.w., norMAn r.s. And VissCher, P.t.
98

(2009) Processes of carbonate precipitation in modern microbial mats. Earth Science Reviews, CHECK
egenhoFF s., Peterhänsel A., BeChstädt t., zühlKe r., And grötsCh j. (1999) Facies architecture of an isolated carbonate platform: tracing the cycles of the Latemar (Middle Triassic, northern Italy). Sedimentology 46, pp. 893-912.
elwood B.B., CriCK r.e., el hAssAni A., Benoist s.l. And young r.h. (2000) Magnetosuceptibility event and cyclostratigraphy method apllied to martine rocks: Detrital input versus carbonate productivity. Geology 28 (12), pp. 1135-1138.
eMMeriCh A., glAsMACher A. u., BAuer F., BeChstädt t., zühlKe r. (2005b) Meso-/Cenozoic basin and carbonate platform development in the SW-Dolomites unraveled by basin modelling and apatite FT analysis: Rosengarten and Latemar (Northern Italy). Sedimentary Geology 175, pp. 415-438.
Flügel E., (1982) Microfacies analysis of limestones. Berlin, New York: Springer-Verlag, pp. 633.
Flügel E And Kiessling w., (2002) Patterns of Phanerozoic Reef crises. SEPM Special Publication 72, pp. 691-733
Flügel E., (2004) Microfacies of Carbonate Rocks. Analysis, Interpretation and Application. Berlin, Heidelberg, New York: Springer-Verlag, pp. 976.
gAetAni, M., Fois, e., jAdoul, F. And niCorA, A. (1981) Nature and evolution of Middle Triassic carbonate buildups in the Dolomites (Italy). Marine Geology 44, pp. 25-27.
giAnollA P. And PAnizzA M. (2009). Le Dolomiti dichiarate dall’UNESCO patrimonio mondiale dell’Umanità. Geoitalia 28, pp. 56-58.
ginsBurg, r.n. (1971). Landward movement of carbonate mud: new model for regressive cycles in carbonates (abstract). AAPG Annual Meeting, Program Abstracts 55, pp. 340.
goldhAMMer, r.K., dunn, P.A., And hArdie, l.A. (1987) High-frequency glacio-eustatic oscillations with Milankovitch characteristics recorded in northern Italy. American Journal of Science 287, pp. 853-892.
goldhAMMer r.K. And hArris M.t. (1989) Eustatic controls on the stratigraphy and geometry of the Latemar buildup (Middle Triassic), the Dolomites of northern Italy. In: Controls on carbonate platform and basin development (Ed. by P.D. Crevello, J.J. Wilson, J.F. Sarg and J.F. Read), Spec. Pub. Soc. Econ. Paleont. Miner. 44, pp.323-338.
99

goldhAMMer, r.K., dunn, P.A., And hArdie, l.A. (1990) Depositional cycles, composite sea level changes, cycle stacking patterns and the hierarchy of stratigraphic forcing: examples from platform carbonates of the Alpine Triassic. Geological Society of America Bulletin 102, pp. 535-562.
gonzAlez r. And wetzel A. (1996) Stratigraphy and paleogeography of the Hauptrogenstein and Klingnau Formations (Middle Bajocian to Late Bathonian), northern Switzerland. Ecolgae Geologicae Helvetiae 89, pp. 695-720.
goodwin P.w. And Anderson e.j. (1985) Punctuated aggradational cycles: a general hypothesis of episodic stratigraphic accumulation. Journal of Geology 93, pp. 515–533.
guido A., PAPAzzoni C.A., MAstAndreA A., Morsilli M., lA russA M.F., tosti F., And russo F (2010) Automicrite in a “nummulite bank” from the Monte Saraceno (Southern Italy): evidence for synsedimentary cementation. Sedimentology, doi: 10.1111/j.1365-3091.2010.01187.x
hAlFMAn j.d., johnson t.C.., And Finney B.P., (1994) New AMS dates, stratigraphic correlations and decadal climatic cycles for the past 4 ka at Lake Turkana, Kenya. Palaeogeography, Palaeoclimatology, Palaeoecology 111(1-2), pp. 83-98.
hArris M.t. (1993) Reef fabrics, biotic crusts and syndepositional cements of the Latemar reef margin (Middle Triassic), Northern Italy. Sedimentology 40, pp. 383–401.
hArris M.t. (1994) The foreslope and toe-of-slope facies of the Middle Triassic Latemar buildup (Dolomites, Northern Italy). Journal of Sedimentological Research B 64, pp. 132–45.
hinnoV, l.A. (2000), New perspectives on orbitally forced stratigraphy. Annual Review of Earth and Planetary Sciences, 28,pp. 419-475.
hinnoV, l.A., And goldhAMMer, r.K. (1991) Spectral analysis of the Middle Triassic Latemar Limestone. Journal of Sedimentary Petrology 61, pp. 1173-1193.
hoogAKKer B.A.A., rothwell r.g., rohling e.j., PAterne M., stow d.A.V., herrle j.o., And ClAyton t. (2004) Variations in terrigenous dilution in western Mediterranean Sea pelagic sediments in response to climate change during the last glacial cycle. Marine Geology 211(1-2), pp. 21-43.
KeiM l. And sChlAger w. (1999) Automicrite facies on steep slopes (Triassic, Dolomites, Italy). Facies, 41, pp. 15– 26.
KeiM l. And sChlAger W. (2001) Quantitative compositional analyses of a Triassic carbonate platform (Southern Alps, Italy). Sed. Geol., 139, pp. 261–283.
100

Kent V., Muttoni g. And BrACK P. (2004) Magnetostratigraphic confirmation of a much faster tempo for sea-level change for the Middle Triassic Latemar platform carbonates. Earth and Planetary Science Letters 228, pp. 369–377.
Kenter J.A.M. (1990). Carbonate platform flanks: slope angle and sediment fabric. Sedimentology 37, pp. 777–794.
Kenter J.A.M., hArris P.M. And dellA PortA g. (2005). Steep microbial boundstone-dominated platform margins – examples an implications. Sedimentary Geology 178, pp. 5–30.
Kiessling w. (2001) Phanerozoic reef trends based on the PaleoReefs database. In: Stanley, G.D. (Ed.), The History and Sedimentology of Ancient Reef Systems. Plenum Press, New York, pp. 41–88.
Kiessling w., Flügel e. And golonKA, j. (2003) Patterns of Phanerozoic carbonate platform sedimentation. Lethaia, 36, pp. 195-226.
KodAMA K.P., AnAstAsio d.j., newton M.l., PAres j.M. And hinnoV l.A. (2010) High-resolution rock magnetic cyclostratigraphy in an Eocene flysh, Spanish Pyrenees. Geochemistry, Geophysics, Geosystems 11, q0AA07, doi: 10.1029/2010gC003069
KruiVer, P.P., deKKers, M.j., And hesloP, d. (2001), Quantification of magnetic coercivity components by the analysis of acquisition curves of isothermal remanent magnetization. Earth and Planetary Science Letters, 189, pp. 269-276.
lAttA d.K., AnAstAsio d.j., hinnoV l.A., elriCK. And KodAMA K.P. (2006) Magnetic record of Milankovitch rhythms in lithologically noncyclic marine carbonates. Geology 34 (1), pp. 29–32.
leonArdi P. (1968) Le Dolomiti, Geologia dei Monti tra Isarco e Piave. Manfrini, Rovereto, pp. 1019
leVi, s. And Merrill, r. t. (1976), A comparison of ARM and TRM in magnetite. Earth and Planetary Science Letters, 32, pp. 171-184.
MAder d., CleAVelAnd l., BiCe d.M., MontAnAri A. And KoeBerl C. (2004) High-resolution cyclostratigraphic analysis of multiple climate proxies from a short Langhian pelagic succession in the Conero Riviera, Ancona (Italy). Palaeogeography, Palaeoclimatology, Palaeoecology 211(3-4), pp. 325-344.
MAher B.A. And thoMPson r. (1999), Quaternary Climates, Environments and Magnetism. Cambridge University Press, Cambridge, pp. 390.
101
MAyer h. And APPel e. (1999) Milankovitch cyclicity and rock-magnetic signatures of palaeoclimatic change in the Early Cretaceous Biacone Formation of the Southern Alps, Italy. Cretaceous Research 20, pp. 189-214.
MAnFrin s., Mietto P., Preto n. (2005). Ammonoid biostratigraphy of the Middle Triassic Latemar Platform (Dolomites, Italy) and its correlation with Nevada and Canada. Geobios 38, pp. 477–504.
MAurer F. (2000) Growth mode of Middle Triassic carbonate platforms in the Western Dolomites (Southern Alps, Italy). Sedimentary Geology, 134, pp. 275-286.
MeAd g.A., tAuxe l. And lABreCque j.l. (1986) Oligocene paleoceanography of the south atlantic: paleoclimatic implications of sediment accumulation rates and magneticsusceptibility measurements. Paleoceanography 1, 3, pp. 273-284.
Meyer F.o. (1989) Siliciclastic in fuence on Mesozoic platformdevelopment: Baltimore Canyon Trough, western Atlantic. In Crevello, P.D., Wilson, J.L., Sarg, F. & Read, J.F. (eds): Controls on Carbonate Platform and Basin Development. SEPM (Society for Sedimentary Geology) Special Publication 44, pp. 213-232.
Meyers s.r. (2008) Resolving Milankovitchian controversies: The Triassic Latemar Limestone and the Eocene Green River Formation. Geology 36, pp. 319-322.
Mette w. (1983): Stratigraphie und Fazies des Jura von Nordsomalia. Berliner Geowissenschaftliche Abhandlungen A149, pp. 1-125.
Mietto P., MAnFrin s. (1995) A high resolution Middle Triassic ammonoid standard scale in the Tethys Realm. A preliminary report. Bulletin de la Société Géologique de France 166, pp. 539–563.
Mietto P., MAnFrin s., Preto n., giAnollA P., Krystyn l., roghi g. (2003) Proposal of the Global Stratigraphic Section and Point (GSSP) at the base of the Avisianum Subzone (FAD of Aplococeras avisianum) in the Bagolino section (Southern Alps, Italy). Albertiana. 28, pp. 26-34
MojsisoViCs e. (1879) Die Dolomit-Riffe von Südtirol und Venetien. Beiträge zur Bildungsgeschichten der Alpen, 552 pp., Hölder, Wien
Monty C.l.V. (1995) The rise and nature of carbonate mud- mounds: an introductory actualistic approach. In: Monty, C.L.V., Bosence, D.W.J., Bridges, P.H., Pratt, B.R. (Eds.), Carbonate Mud-Mounds. Their Origin and Evolution. Spec. Publ. Int. Assoc. Sedimentol., vol. 23, pp. 11–48.
102

Mundil, r., BrACK, P., Meier, M., rieBer, h., And oBerli, F. (1996) High resolution U-Pb dating of middle Triassic volcaniclastics: time-scale calibration and verification of tuning parameters for carbonate sedimentation. Earth and Planetary Science Letters, v. 141, pp. 137-151.
Mundil, r., zühlKe, r., BeChstAdt, t., BrACK, P., egenhoFF, s., Meier, M., oBerli, F., Peterhänsel, A., And rieBer, h. (2003) Cyclicities in Triassic Platform Carbonates: synchronizing radio-isotopic and orbital clock. Terra Nova, v. 15/2, pp. 81-87.
Mutti M., hAlloCK P. (2003). Carbonate systems along nutrient and temperature gradients: a review of sedimentological and geochemical constraints. International Journal of Earth Sciences 92, pp. 465–475.
neuweiler F., reitner j., (1993) Initially indurated structures of fine- grained calcium carbonate formed in place (automicrite). 7th Int. Symp. Biomineral., Monaco, Abstract with Program, 104.
neuMeier U. (1998) Tidal dunes and sand waves in deep outer-shelf environments, Bajocian, southeast Jura, France. Journal of Sedimentary Research 68, pp. 507-514.
Peterhänsel A., egenhoFF s.o. (2005) Sea level versus hydrothermal diagenesis: origin of Triassic carbonate platform cycles in the Dolomites, Italy: Discussion. Sedimentary Geology 178, pp. 145-149.
Peterhänsel A., egenhoFF s.o. (2008) Lateral variability of cycle stacking patterns in the Latemar, Triassic, Italian Dolomites. In: Lukasik, J., Simo, J.A. (Eds.), Controls on carbonate platform and reef development: SEPM Special Publication, vol. 89, pp. 217–229.
PisA g., CAstellArin A., luCChini F., rossi P.l., siMBoli g., Bosellini A. And soMMAVillA e. (1980) Middle Triassic magmatism in Southern Alps I: a review og general data in the Dolomites. Riv. Ital. Paleont. 85 (3-4), pp. 1093-1110.
PoMAr l. (2001) Types of carbonate platform: a genetic approach. Basin Research 13, pp. 313–334.
PoMAr l., BrAndAno M., westPhAl h. (2004). Environmental factors influencing skeletal-grain sediment associations: a critical review of Miocene examples from the Western Mediterranean. Sedimentology 51, pp. 627–651.
Preto n., hinnoV l.A., hArdie l., de zAnChe V. (2001) Middle Triassic orbital signature recorded in the shallow-marine Latemar carbonate buildup (Dolomites, Italy). Geology 29 (12), pp. 1123-1126.
Preto, n., l.A. hinnoV, V. de zAnChe, P. Mietto And l.A. hArdie (2004) The
103

Milankovitch interpretation of the Latemar platform cycles (Dolomites, Italy): implications for geochronology, biostratigraphy, and Middle Triassic carbonate accumulation. in D’Argenio,B., Fischer, A.G., Premoli Silva, I., Weissert, H. and Ferreri, V., eds., Cyclostratigraphy: Approaches and Case Histories, SEPM Special Publication No. 81, 167-182.
Preto n., sPotl C., Mietto P., giAnollA P., riVA A., MAnFrin s. (2005) Aragonite dissolution, sedimentation rates and carbon isotopes in deep-water hemipelagites (Livinallongo Formation, Middle Triassic, northern Italy). Sedimentary Geology 234 1-4, pp. 1–18.
Preto n. And Piros o. (2008) Dasycladalean algae distribution in ammonoid-bearing Middle Triassic platforms (Dolomites, Italy). Facies 54, pp. 581-595.
Preto n., FrAnCesChi M., gAttolin g., MAssironi M., riVA A., grAMignA P., Bertoldi l. And nArdon s. (2011) the Latemar: a middle Triassic polygonal fault-block platform controlled by synsedimentary tectonics. Sedimentary Geology 54, pp. 581-595.
ReAd J.F. (1985). Carbonate platform facies models. AAPG Bulletin 69, pp. 1–21
reitner j. neuweiler F. (1995). Mud mounds: a polygenetic spec- trum of fine-grained carbonate buildups. Facies 32, pp. 1–70.
reitner j., gAutret P., MArin F. And neuweiler F. (1995) Automicrites in a modern marine microbialite. Formation model via organic matrices (Lizard Island, Great Barrier Reef, Australia). Bull. Inst. Océanogr. Monaco, Special Number 14, pp. 237– 263.
reynolds r.l. And King j.w. (1995) Magnetic records of climate change. Rev of Geophys, Suppl., U.S. National Report to the IUGG, pp. 101-110.
RiChthoFen Von F. (1860), Geognostische Beschreibung der Umgebung von Predazzo, Sanct Cassian und der Seisseralpen in Südtirol. Perthes Ed., 327 pp., Gotha.
Riding r. (2000) Microbial carbonates: the geological record of calcified bacterial–algal mats and biofilms. Sedimentology, 47 (Suppl. 1), pp. 179–214.
Riding r. (2002) Structure and composition of organic reefs and carbonate mud mounds: concepts and categories. Earth-Science Reviews, 58, pp. 163–231.
rossi d. (1957) La scogliera del Latemar (note preliminari). Ann. Univ. Ferrara, Sez. 9, 2, pp. 213-241.
104

rossi P.l., Viel g., siMBoli g. (1977) Significato paleogeografico e magmatico tettonico della serie vulcanoclastica ladinica superiore nell’area del Monte Civetta. Boll. Soc. Geol. It., 95, pp. 433-458.
russo F., neri C., MAstAndreA A., And BArACCA A. (1997) The Mud Mound nature of the Cassian Platform margins of the Dolomites. A case history: the Cipit boulders from Punta Grohmann (Sasso Piatto Massif, Northern Italy). Facies 36, pp. 25-36, Erlangen
sCheiBner C. & reijMer j.j.g. (1999) Facies patterns within a Lower Jurassic upper slope to inner platform transect (Jbel Bou Dahar, Morocco). Facies 41, pp.55-80.
sChlAger w. (1981) The paradox of drowned reefs and carbonate platforms. Bull. geol. Soc. Am. 92, pp. 197-211
sChlAger w. (2000) sedimentation rates and growth potential of tropical, cool-water and mud-mound carbonate factories. In: Carbonate platform systems: components and interactions (Eds E. Insalaco, P.W. Skelton and T.J. Palmer), Geol. Soc. London Spec. Publ., 178, pp. 217–227.
SChlAger W. (2003) Benthic carbonate factories of the Phanerozoic. Int. J. Earth Sci., 92, pp. 445–464.
sChlAger W. (2005) Carbonate sedimentology and sequence stratigraphy. SEPM Concepts Sedimentol. Paleontol., 8, 208.
sChlAger w. And KeiM l. (2009) Carbonate platforms in the dolomites area of the southern Alps – historic perspectives on progress in sedimentology. Sedimentology 56, pp. 191-204
sCMidt, A.M, Von doBeneCK t And Bleil u. (1999) Magnetic characterization of Holocene sedimentation in the South Atlantic. Paleoceanography 14, 4, pp. 465-481
selli l. (1998) - Il Lineamento della Valsugana fra Trento e Cima d’Asta: cinematica neogenica ed eredità strutturali permo-mesozoiche nel quadro evolutivo del Sudalpino orientale (NE-Italia). Mem. Soc. Geol. It. 53, pp. 503-541.
shACKleton n. j., Crowhurst s.j., weedon g.P. And lAsKAr j. (1999), Astronomical calibration of OligoceneMiocene time, Philos. Trans. R. Soc. London, Ser. B 357, pp. 1907–1929.
steFAni M., Furin s. And giAnollA P. (2010) The changin climate frameworks and depositional dynamics of Triassic carbonate platforms from the Dolomites.
105

Earth and Palaeogeogaphy, Palaeoclimatology, Palaeoecology 290, 43-57.
stePhenson And Collinson d.w. (1974) Lunar magnetic field paleointensities determined by anhysteretic remanent magnetization method. Earth and Planetary Science Letters 23, 220-228.
szurlies, M., BAChMAnn, g.h., Menning, M., nowACzyK, n.r., And KAding, K.C. (2003) Magnetostratigraphy and high-resolution lithostratigraphy of the Permian-Triassic boundary interval in central Germany. Earth and Planetary Science Letters, 212, 263-278.
thoMPson r. And oldField F. (1986) Environmental Magnetism, Allen & Unwin, London, 227 p.
VerosuB K.l. And roBerts A.P. (1995) Environmental magnetism: Past, present, and future. Journal of Geophysical Research 100, pp. 2175-2192.
VArdABAsso s. (1930) Carta geologica del territorio eruttivo di Predazzo e Monzoni nelle Dolomiti di Fiemme e Fassa. Padova
weBB g.e. (1996) Was Phanerozoic reef history controlled by the distribution of non-enzymatically secreted reff carbonates (microbial carbonate and biologically induced cement)? Sedimentology, 43, pp. 947-971.
wolF K.h. (1965) Gradational sedimentary products of calcareous algae. Sedimentology, 5, 1–37.
zühlKe r., BeChstädt t. And Mundil r. (2003) Sub-Milankovitch and Milankovitch forcing on a model Mesozoic carbonate platform – the Latemar (Middle Triassic, Italy). Terra Nova 15, pp. 69-80.
zühlKe r. (2004) Integrated cyclostratigraphy of a model Mesozoic carbonate platform — the Latemar (Middle Triassic, Italy). In: D’Argenio, B., Fischer, A., Premoli Silva, I., Weissert, H., Ferreri, V. (Eds.), Cyclostraigraphy: Approaches and Case Histories: SEPM Special Publication 81, pp. 183–211.
106