Embed Size (px)
Citation preview
國 立 交 通 大 學
機 械 工 程 學 系
博 士 論 文
高液壓成型機台之研發與其在燃料電池上之應用
Studies on a novel high-pressure hydroforming apparatus and its
application in fuel cells
研 究 生:林志嘉
指導教授:洪景華 教授
中 華 民 國 一 零 二 年 七 月
高液壓成型機台之研發與其在燃料電池上之應用
Studies on a novel high-pressure hydroforming apparatus and its
application in fuel cells
研 究 生:林志嘉 Student:Chih-Chia Lin 指導教授:洪景華 Advisor:Chinghua Hung
國 立 交 通 大 學
機 械 工 程 學 系
博 士 論 文
A Dissertation Submitted to Department of Mechanical Engineering
College of Engineering National Chiao Tung University
in partial Fulfillment of the Requirements for the Degree of
Doctor of Philosophy in
Mechanical Engineering
July 2013
Hsinchu, Taiwan
中華民國一零二年七月
I
高液壓成型機台之研發與其在燃料電池上之應用
研究生:林志嘉 指導教授:洪景華 教授
國立交通大學機械工程學系
摘要
近年來隨著綠能科技崛起以及攜帶型 3C 產品需求增加,可攜式質子交換膜
燃料電池逐漸受到矚目。而金屬材質的雙極板由於其具有低成本、優異的熱、電
與機械性質以及能夠有較薄之厚度(0.1-0.5 mm),因而成為了可攜式燃料電池中
的主要零件。然而,以現有之成形技術仍無法在金屬薄板上有效成形出符合實際
燃料電池所需具有高深寬比的流道結構。
本研究利用自行研發之高液壓成形機台,藉由提升成形製程中之成形壓力來
達到提升微流道深寬比之目的。此設計包含了三個部分:一個能夠產生二段增壓
的機械結構、一個能夠乘載高液壓的高壓承載筒,以及能夠將液壓密封的高壓密
封元件。透過此研究,建立了一套完整的高液壓成形技術,並在現階段應用於可
攜式燃料電池之金屬雙極板的製作上。
由實際實驗可知,此研發之高液壓成形機台不論在製程控制或是成形試片的
重現性上均是合理且可接受的。在施加高達 250 MPa 之成形壓力下,其微流道
之深寬比能夠達到 0.392,比傳統液壓成形所能得到之深寬比(0.31)提升了 26.5%。
後續,再經過有限元素以及最佳化分析後,將可更有效率的利用此高液壓成形技
術以獲得此成形機台的最佳成形能力,使成形試片上的微流道深寬比再提升
4.8%。
關鍵詞: 燃料電池、高液壓成形機台、金屬雙極板、微流道、有限元素分析、最
佳化分析
II
Studies on a novel high-pressure hydroforming apparatus
and its application in fuel cells
Student: Chih-Chia Lin Advisors: Dr. ChingHua Hung
Department of Mechanical Engineering
National Chiao Tung University
ABSTRACT
Portable proton exchange membrane fuel cells (PEMFCs) have received
considerable attention recently because of the suitable material of the development of
3C production processes and green energy techniques. For the key component of
portable PEMFCs, bipolar plates, metals such as stainless steel are becoming popular
because of their excellent mechanical, electrical, and thermal properties, as well as a
low degree of thickness (0.1–0.5 mm). However, current forming techniques cannot
efficiently fabricate micro-flow-channels with a high aspect ratio on thin metallic
blanks to satisfy the practical demands on portable fuel cells.
This study presents the development of a high-pressure hydroforming technique
and explains the design and construction of an experimental high-pressure
hydroforming apparatus. The apparatus is composed of a two-stage pressure-increase
structure to provide high fluid pressure, a high-pressure container and high-pressure
seals to maintain and seal the high fluid pressure. Conclusively, this research develops
a complete high-pressure hydroforming technique and be applied in forming metallic
bipolar plates for portable PEMFCs.
The results of our investigation indicate that the process control for the
developed apparatus and the repeatability for hydroformed specimens are reasonably

III
acceptable. The aspect ratio of micro-flow channels formed using this apparatus can
achieve 0.392 when a working pressure of 250 MPa is applied. Compared with the
maximum channel aspect ratio of 0.31 formed using the traditional hydroforming
process, the channel aspect ratio formed using the new technique and device is 26.5%
higher. Furthermore, finite element and optimization analyses can be performed to
boost the forming capability of the developed technique. Consequently, the aspect
ratio of formed micro-flow channels can be further increased by 4.8%.
Keywords: Fuel cell; high-pressure hydroforming apparatus; metallic bipolar plate;
micro-flow channels; finite element analysis; optimization analysis
IV
誌謝
在這五年的博士生涯裡,首先,我要感謝的人是我的指導教授洪景華老師,
在學業、研究方面的教導為學生指引了正確的方向,對於學生將來的生活很有幫
助,謝謝老師不辭辛勞的指導。同時也感謝口試委員宋震國教授、黃佑民教授、
徐瑞坤教授、陳申岳博士以及洪榮崇教授對於論文所提出的指正與建議。
感謝洪榮崇學長,在學長的指導以及帶領下才能夠讓我的博士論文得以順利
完成;感謝宇中學長,實驗室在學長長期的帶領下備感溫馨;感謝麒禎學長,博學
的知識,每每都能夠耐心解答我的疑惑;感謝彥彬學長,幽默風趣的言談讓實驗
室時常充滿歡樂。還有感謝其他已畢業的博班學長,政成、正展、煌棊、岳儒、
陽光、冠宇等等,在我求學階段對我的照顧。
感謝其他實驗室的夥伴們:安靜的銘傑學長、搞笑的志傑、幽默的明輝學長、
激動的璟璿、害羞的蘭芳、憨厚的俊元、rock 的毅恆、古錐的文玉、很有女人緣
的榆文、只吃巧克力的正斌、裝酷的祺津、強壯的東佑、可愛的宛伶、十字胸毛
的逸翔,回到大陸的阿岳,剛進實驗室的佑傑、瑋倫、名惠以及八寶粥,還有理
強、宗駿、黃詠、世璿、運賢、俊羿、聖平、時恆、建榮、麒翔、忠諭、宗錞、
筱偉、立釗、正一、振傑、雅喬、中南、書麟、馨勻、宜均、呂翔、致豪、品帆、
彥佑,在我的求學階段由於你們各位的出現,讓研究不再枯燥,讓求學階段充滿
了美好的回憶。
此外,我要特別感謝我的爸爸、媽媽、弟弟以及我的女友未來的老婆千儀,
在我學習的過程中在背後默默的支持鼓勵我,讓我無後顧之憂的打拼學業。
在實驗室待久了,經歷過了無數次的分離。天下無不散的筵席,這次輪到我
離開了,離開待了 11 年的地方,珍重!
林志嘉 謹誌
i
TABLE OF CONTENTS
摘要…………………………………………………………………………………….I
ABSTRACT …………………………………………………………………………..II
誌謝…………………………………………………………………………………..IV
TABLE OF CONTENTS ................................................................................................ i
LIST OF TABLE.......................................................................................................... iii
LIST OF FIGURE ......................................................................................................... iv
CHAPTER 1 INTRODUCTION ................................................................................... 1
1.1 Research background ............................................................................................ 1
1.2 Literature review ................................................................................................... 4
1.2.1 Effect of bipolar plate micro channels on cell performance ......................... 4
1.2.2 Forming techniques of micro channels on metallic bipolar plates ............... 5
1.3 Motivation and objective ...................................................................................... 8
1.4 Research method ................................................................................................... 9
1.5 Scope of dissertation ........................................................................................... 10
CHAPTER 2 THE DESIGN AND CONSTRUCTION ON A HIGH-PRESSURE
HYDROFORMING APPARATUS ........................................................ 11
2.1 High-pressure source .......................................................................................... 11
2.2 High-pressure container ...................................................................................... 12
2.3 High-pressure seal component ............................................................................ 15
2.4 High-pressure plunger (secondary plunger) ....................................................... 17
2.5 High-pressure fluid ............................................................................................. 19
CHAPTER 3 EXPERIMENTAL INVESTIGATIONS OF THE HIGH-PRESSURE
HYDROFORMING TECHNIQUE ........................................................ 20
3.1 Material test ........................................................................................................ 20

ii
3.1.1 Solution heat treatment ............................................................................... 20
3.1.2 Uniaxial tensile test ..................................................................................... 22
3.2 High-pressure hydroforming experiment ........................................................... 25
3.2.1 Formability experiment ............................................................................... 26
3.2.2 Forming uniformity experiment .................................................................. 32
3.2.3 Forming parameters experiment ................................................................. 35
3.3 Preliminary fuel cell performance test ................................................................ 37
CHAPTER 4 NUMERICAL INVESTIGATIONS OF THE HIGH-PRESSURE
HYDROFORMING TECHNIQUE ........................................................ 42
4.1 Finite element analysis ....................................................................................... 42
4.2 Optimization analysis ......................................................................................... 46
4.2.1 The verification experiment of the optimization analysis ........................... 49
4.2.2 3D finite element analysis ........................................................................... 50
4.2.3 3D optimization analysis............................................................................. 52
4.2.4 A flow field design on the metallic bipolar plate ........................................ 54
CHAPTER 5 CONCLUSIONS AND FUTURE WORKS .......................................... 58
5.1 Conclusions ........................................................................................................ 58
5.2 Future works ....................................................................................................... 59
REFERENCES ............................................................................................................ 61
Appendix A: The designs of hydroforming apparatus ................................................. 65
A.1 A servo hydrostatic pressing machine ................................................................ 65
A.2 Pressure measurement ....................................................................................... 66
Appendix B: Metallographic test ................................................................................. 68
Appendix C: Forming limit test ................................................................................... 70
C.1 The principle of forming limit diagram (FLD) .................................................. 70
C.2 Forming limit experiments ................................................................................. 73
iii
LIST OF TABLE
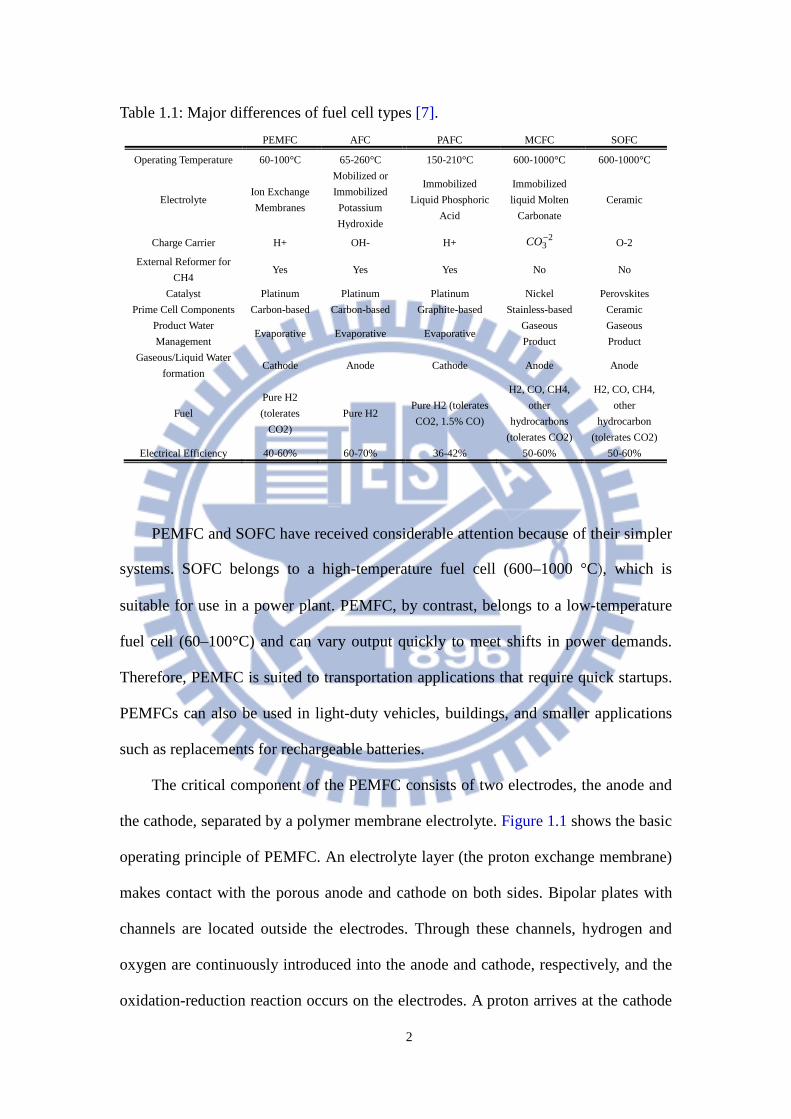
Table 1.1: Major differences of fuel cell types [7]. ................................................................ 2
Table 3.1: The material properties of heat treated SUS304 sheets. ..................................... 25
Table 3.2: The specification of the high-pressure hydroforming apparatus. ....................... 29
Table 3.3: A comparison of experiment results in our research and the related literature.
...................................................................................................................................... 31
Table 3.4: The reduction ratio of each specimen thickness. ................................................ 34
Table 3.5: Detail geometry of micro-channels for the forming parameters experiments. ... 35
Table 3.6: A comparison of experiment results at 150 and 250 MPa................................... 36
Table 3.7: The dimension of the flow field. ......................................................................... 38
Table 3.8: Cell specifications. .............................................................................................. 38
Table 4.1: The selections and the ranges of design variables. ............................................. 48
Table 4.2: A comparison of hydroforming tests, optimization analysis, and literature. ...... 49
Table 4.3: A comparison of verification experiments and optimization predictions. .......... 53
Table 4.4: A comparison of 2D and 3D simplified finite element model ............................ 54
Table 4.5: Settings for the new optimization analysis. ........................................................ 56
Table 4.6: A comparison of 3D optimization prediction and new optimization prediction.
...................................................................................................................................... 56
iv
LIST OF FIGURE
Figure 1.1: Schematic representation of a PEMFC operation principle [8]. ......................... 3
Figure 1.2: (a) Graphite and (b) metallic bipolar plates [1]. .................................................. 4
Figure 1.3: Schematic representation of a PEMFC structure [12]. ........................................ 5
Figure 1.4: Schematic of Olsson’s stamping apparatus design [20]. ..................................... 6
Figure 1.5: Schematic of Lee’s stamping apparatus design [21]. (a) Before and (b) during
the process. ......................................................................................................... 6
Figure 1.6: Schematic of Ando’s hydroforming apparatus design [22]. ................................ 7
Figure 2.1: Schematic representation of traditional hydroforming process [1, 17-18]. ....... 11
Figure 2.2: Schematic representation of a high-pressure source. ........................................ 12
Figure 2.3: The final von Mises stress contour in the finite-element simulation of the
high-pressure container. (Unit: MPa) ............................................................... 15
Figure 2.4: Three-layer tapered cylinder (a) before and (b) after fitting and surface
polishing. .......................................................................................................... 15
Figure 2.5: (a) The metal backup-ring and (b) schematic representation for the assembly of
the high-pressure seal and the high-pressure container. ................................... 16
Figure 2.6: Schematic of the position of each high-pressure seal component in the
apparatus. ......................................................................................................... 17
Figure 2.7: Design formula figure for a steel-structure pillar. (Received from J. M. Gere &
Timoshenko. 1990) .......................................................................................... 18
Figure 2.8: (a) The secondary plunger. (b) The secondary plunger in the pressure container.
...................................................................................................................................... 19
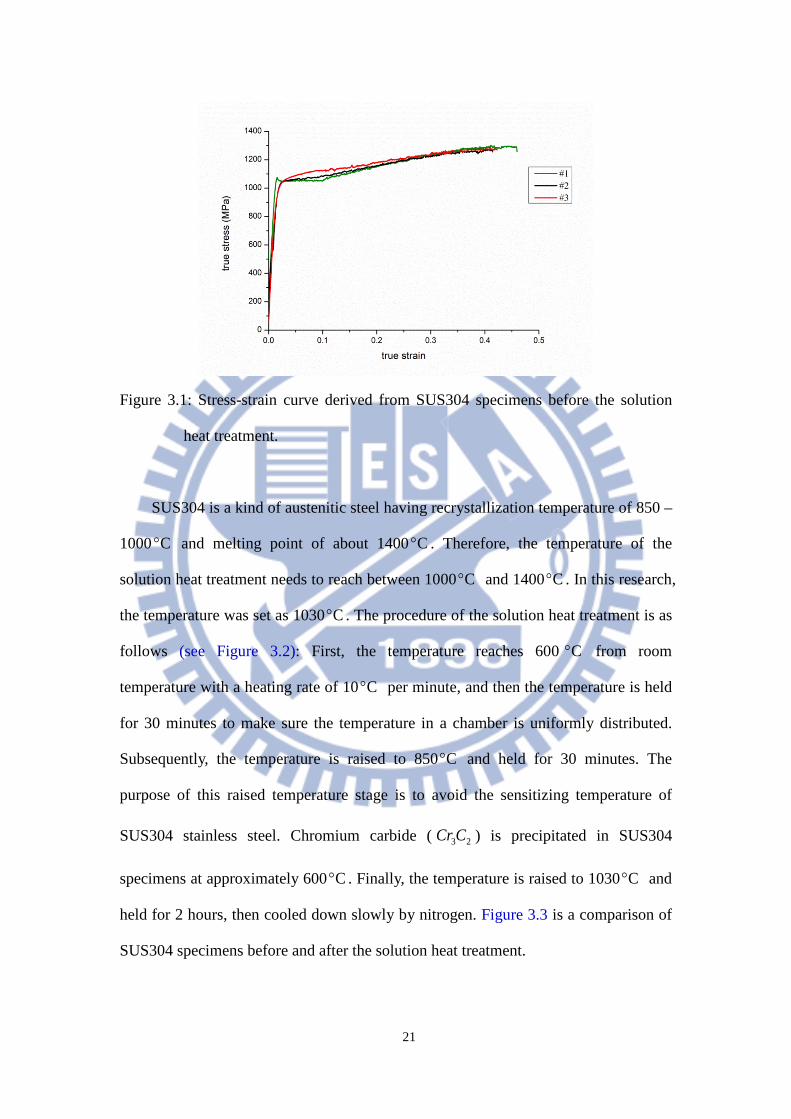
Figure 3.1: Stress-strain curve derived from SUS304 specimens before the solution heat
treatment. ......................................................................................................... 21
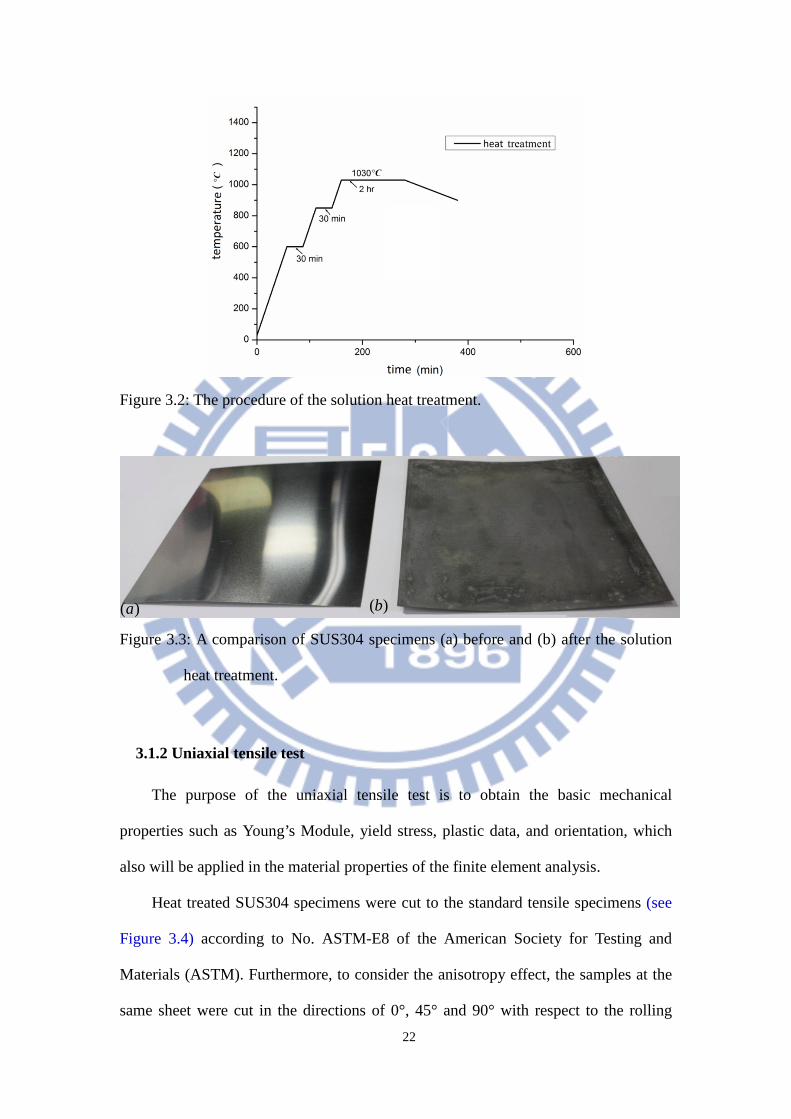
Figure 3.2: The procedure of the solution heat treatment. ................................................... 22

v
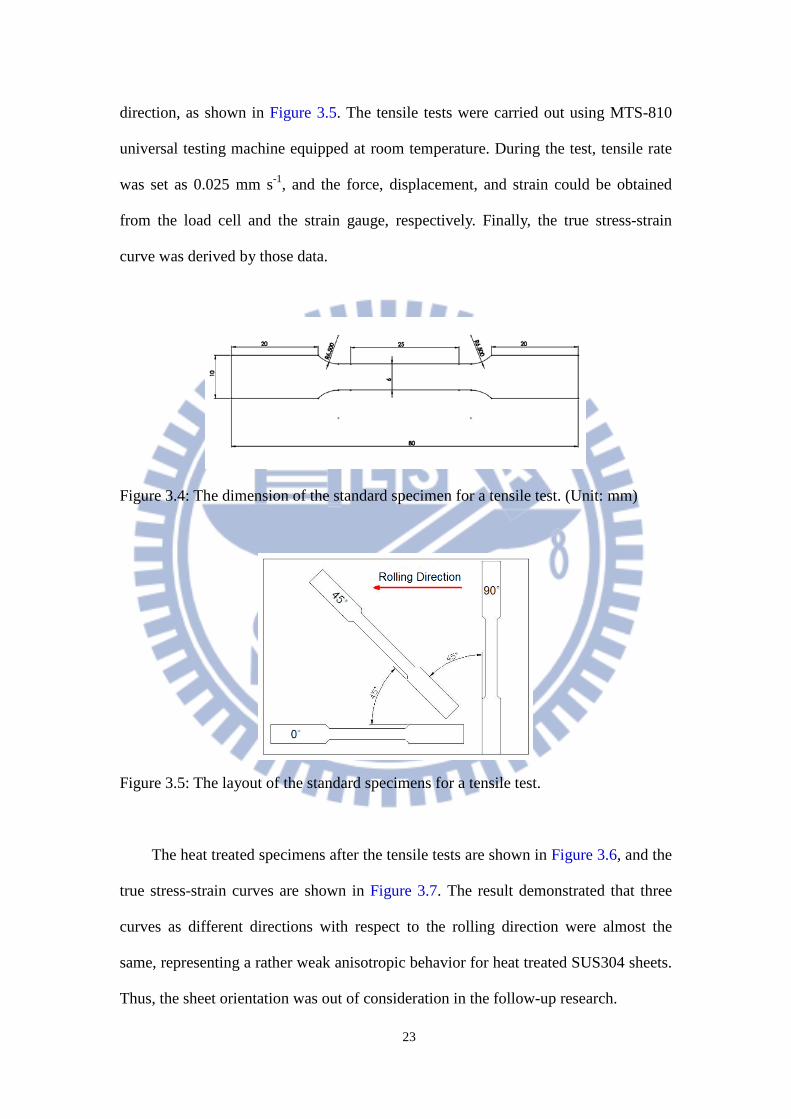
Figure 3.3: A comparison of SUS304 specimens (a) before and (b) after the solution heat
treatment. ......................................................................................................... 22
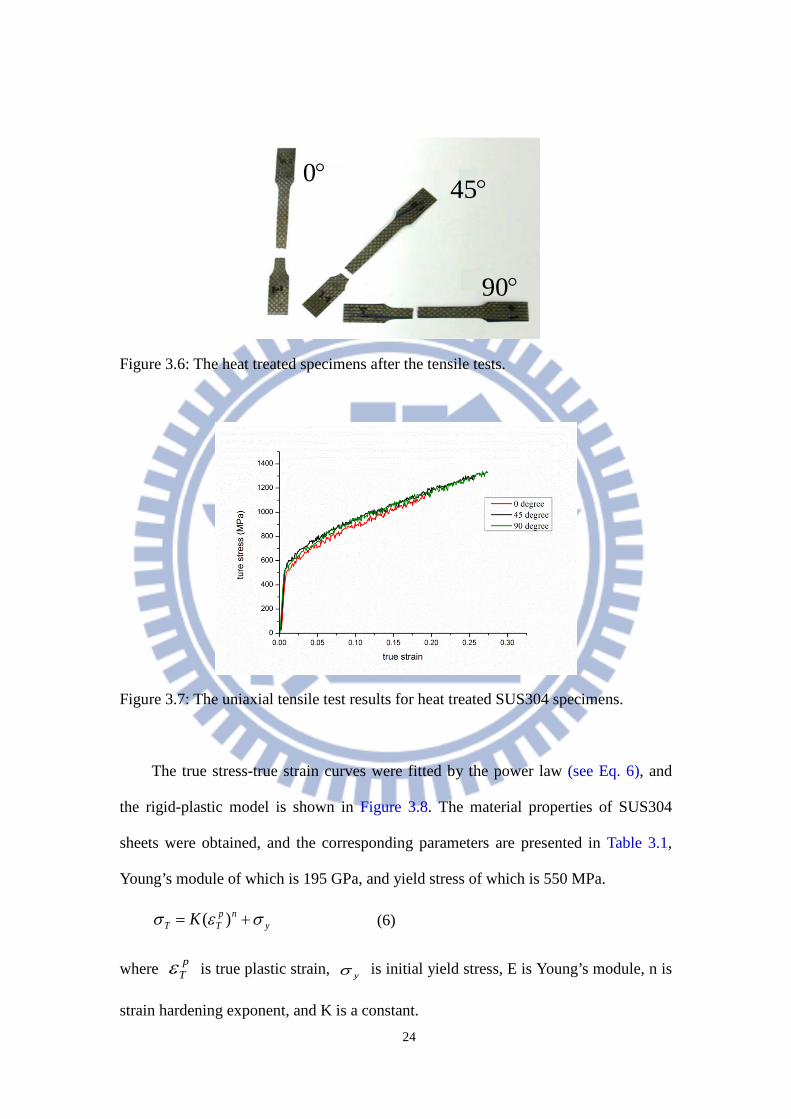
Figure 3.4: The dimension of the standard specimen for a tensile test. (Unit: mm) ............ 23
Figure 3.5: The layout of the standard specimens for a tensile test. .................................... 23
Figure 3.6: The heat treated specimens after the tensile tests. ............................................. 24
Figure 3.7: The uniaxial tensile test results for heat treated SUS304 specimens. ............... 24
Figure 3.8: The fitting curve for heat treated SUS304 tensile test. ...................................... 25
Figure 3.9: The hydroforming apparatus. ............................................................................ 26
Figure 3.10: (a) A mold for hydroforming, and (b) geometries of micro-flow channels on
the mold. .......................................................................................................... 26
Figure 3.11: Laser measurement system (Keyence LK-H020 laser sensor). ....................... 27
Figure 3.12: Pressure versus time for a series of hydroforming tests. ................................. 28
Figure 3.13: The dimensional variation between specimens in each test. ........................... 28
Figure 3.14: Samples of hydroformed specimens................................................................ 29
Figure 3.15: Laser measurement profiles for the mold. ....................................................... 30
Figure 3.16: Laser measurement profiles for hydroformed specimens. .............................. 30
Figure 3.17: Height variations in three different locations of micro channels. ................... 32
Figure 3.18: Side views of (a) the specimen and (b) the working area. .............................. 33
Figure 3.19: Thickness variation of specimens at (a) 60 MPa,(b) 80 MPa,(c) 100 MPa,(d)
150 MPa,(e) 200 MPa, and (f) 250 MPa. ......................................................... 34
Figure 3.20: A mold of the forming parameters experiment. ............................................... 35
Figure 3.21: A comparison of experiment results at 150 and 250 MPa. .............................. 37
Figure 3.22: A mold for the flow field. ................................................................................ 38
Figure 3.23: Schematic representation of metallic bipolar plate fuel cell assembling. ....... 38
Figure 3.24: A single fuel cell assembly. ............................................................................. 39
Figure 3.25: A hydroformed metallic bipolar plate. ............................................................. 39
vi
Figure 3.26: The electrodes and proton exchange membrane. ............................................ 40
Figure 3.27: A comparison of fuel cell performances. ......................................................... 41
Figure 4.1: Schematic of the position of molds and specimen. ........................................... 43
Figure 4.2: The 2-D high-pressure hydroforming simulation model. .................................. 43
Figure 4.3: The relationship of mesh sizes and formed channel height. .............................. 44
Figure 4.4: A comparison of the simplified model, the complete model, and hydroforming
tests. ................................................................................................................. 45
Figure 4.5: The equivalent strain contour on the specimen at 250 MPa. ............................. 46
Figure 4.6: The displacement of the specimen. (Unit: mm) ................................................ 46
Figure 4.7: The distribution of von Mises stress on the specimen. (Unit: MPa) ................. 46
Figure 4.8: Convergence curve for the optimization analysis. ............................................ 48
Figure 4.9: The equivalent strain of the formed specimen and the profile of the mold. ...... 49
Figure 4.10: A mold of the verification experiment. ............................................................ 49
Figure 4.11: A sample after the verification experiment. ..................................................... 50
Figure 4.12: The channel height for a quarter symmetry model. (Unit: mm) ..................... 51
Figure 4.13: The channel height for a 3D simplified model. (Unit: mm) ............................ 52
Figure 4.14: A comparison of 3D simplified model simulations and formability
experiments. ..................................................................................................... 52
Figure 4.15: The channel height for 3D optimization model. (Unit: mm) .......................... 54
Figure 4.16: The distribution of equivalent strain for 3D optimization model. ................... 54
Figure 4.17: Schematic representation of the opening ratio on bipolar plates..................... 55
Figure 4.18: The channel height for the new optimization model. (Unit: mm) ................... 56
Figure 4.19: Schematic representation of a multi-cells fuel cell stack [42]. ........................ 57
Figure 4.20: The new optimization model with flat bottom channels. (Unit: mm) ............. 57
Figure 5.1: Wick structures for a flat heat pipe. ................................................................... 60
Figure 5.2: Schematic of a flat heat pipe. ............................................................................ 60
1
1. CHAPTER 1 INTRODUCTION
1.1 Research background
The current high price of oil is largely due to increases in the price of crude oil
and the growing economies of Asian nations. Because of these high prices, as well as
variations in the global climate, finding high-efficiency replacement energy sources is
one of the most critical issues affecting the world today.
Fuel cells are devices that can generate energy without burning fuel and have
high efficiency, quiet operation, and near-zero pollution [1-6]. The following five
main categories of fuel cells are listed in the order of their operating temperature:
1) Proton exchange membrane or polymer electrolyte fuel cell (PEMFC, PEFC),
2) Alkaline fuel cell (AFC);
3) Phosphoric acid fuel cell (PAFC);
4) Molten carbonate fuel cell (MCFC);
5) Solid oxide fuel cell (SOFC).
PEMFC and SOFC use a solid phase membrane as the cell separator and
electrolyte. The other three use liquid electrolytes. Regarding sealing, assembly, and
handling, using solid membranes is less complex than using other types of fuel cell
systems. Table 1.1 [7] provides a summary of the major differences of fuel cell types.
2
Table 1.1: Major differences of fuel cell types [7]. PEMFC AFC PAFC MCFC SOFC
Operating Temperature 60-100°C 65-260°C 150-210°C 600-1000°C 600-1000°C
Electrolyte Ion Exchange Membranes
Mobilized or Immobilized Potassium Hydroxide
Immobilized Liquid Phosphoric
Acid
Immobilized liquid Molten
Carbonate Ceramic
Charge Carrier H+ OH- H+ 23−CO O-2
External Reformer for CH4
Yes Yes Yes No No
Catalyst Platinum Platinum Platinum Nickel Perovskites Prime Cell Components Carbon-based Carbon-based Graphite-based Stainless-based Ceramic
Product Water Management
Evaporative Evaporative Evaporative Gaseous Product
Gaseous Product
Gaseous/Liquid Water formation
Cathode Anode Cathode Anode Anode
Fuel Pure H2 (tolerates
CO2) Pure H2
Pure H2 (tolerates CO2, 1.5% CO)
H2, CO, CH4, other
hydrocarbons (tolerates CO2)
H2, CO, CH4, other
hydrocarbon (tolerates CO2)
Electrical Efficiency 40-60% 60-70% 36-42% 50-60% 50-60%
PEMFC and SOFC have received considerable attention because of their simpler
systems. SOFC belongs to a high-temperature fuel cell (600–1000 °C), which is
suitable for use in a power plant. PEMFC, by contrast, belongs to a low-temperature
fuel cell (60–100°C) and can vary output quickly to meet shifts in power demands.
Therefore, PEMFC is suited to transportation applications that require quick startups.
PEMFCs can also be used in light-duty vehicles, buildings, and smaller applications
such as replacements for rechargeable batteries.
The critical component of the PEMFC consists of two electrodes, the anode and
the cathode, separated by a polymer membrane electrolyte. Figure 1.1 shows the basic
operating principle of PEMFC. An electrolyte layer (the proton exchange membrane)
makes contact with the porous anode and cathode on both sides. Bipolar plates with
channels are located outside the electrodes. Through these channels, hydrogen and
oxygen are continuously introduced into the anode and cathode, respectively, and the
oxidation-reduction reaction occurs on the electrodes. A proton arrives at the cathode

3
through the electrolyte layer, and an electron from the anode reaches the cathode
along an outer circuit. Finally, energy is generated with some water and heat.
Furthermore, the heat-recycle design can be used to promote the ratio of energy
utilization up to 70%, which is greater than that of oil at 30–40%.
Anode reaction: −+ +→ eHH 222
Cathode reaction: OHeHO 2221 22 →++ −+
Combined reaction: OHOH 2221
2 →+
Figure 1.1: Schematic representation of a PEMFC operation principle [8].
Despite the proven advantages of fuel cells, they are not yet cost-competitive
when compared to existing power generation technologies. This is especially true in
transportation applications. For conventional PEMFCs, bipolar plates compose nearly
60–80% of the stack weight, 50% of the stack volume, and 35–45% of the stack cost
[1, 9-10]. Bipolar plates are usually made of graphite (see Figure 1.2a), a material that
is difficult to handle due to its low mechanical strength and brittleness, causing the
formation of flow channels in graphite to be a challenging, and expensive process,
especially for portable PEMFCs.
4
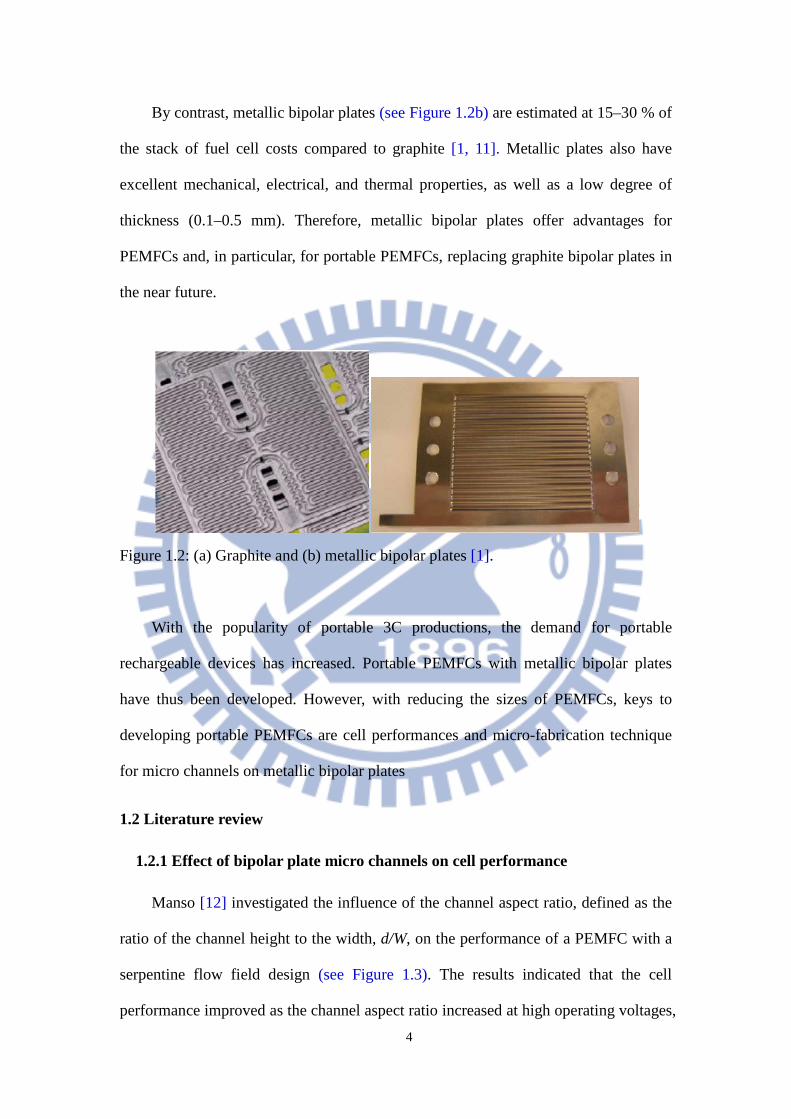
By contrast, metallic bipolar plates (see Figure 1.2b) are estimated at 15–30 % of
the stack of fuel cell costs compared to graphite [1, 11]. Metallic plates also have
excellent mechanical, electrical, and thermal properties, as well as a low degree of
thickness (0.1–0.5 mm). Therefore, metallic bipolar plates offer advantages for
PEMFCs and, in particular, for portable PEMFCs, replacing graphite bipolar plates in
the near future.
Figure 1.2: (a) Graphite and (b) metallic bipolar plates [1].
With the popularity of portable 3C productions, the demand for portable
rechargeable devices has increased. Portable PEMFCs with metallic bipolar plates
have thus been developed. However, with reducing the sizes of PEMFCs, keys to
developing portable PEMFCs are cell performances and micro-fabrication technique
for micro channels on metallic bipolar plates
1.2 Literature review
1.2.1 Effect of bipolar plate micro channels on cell performance
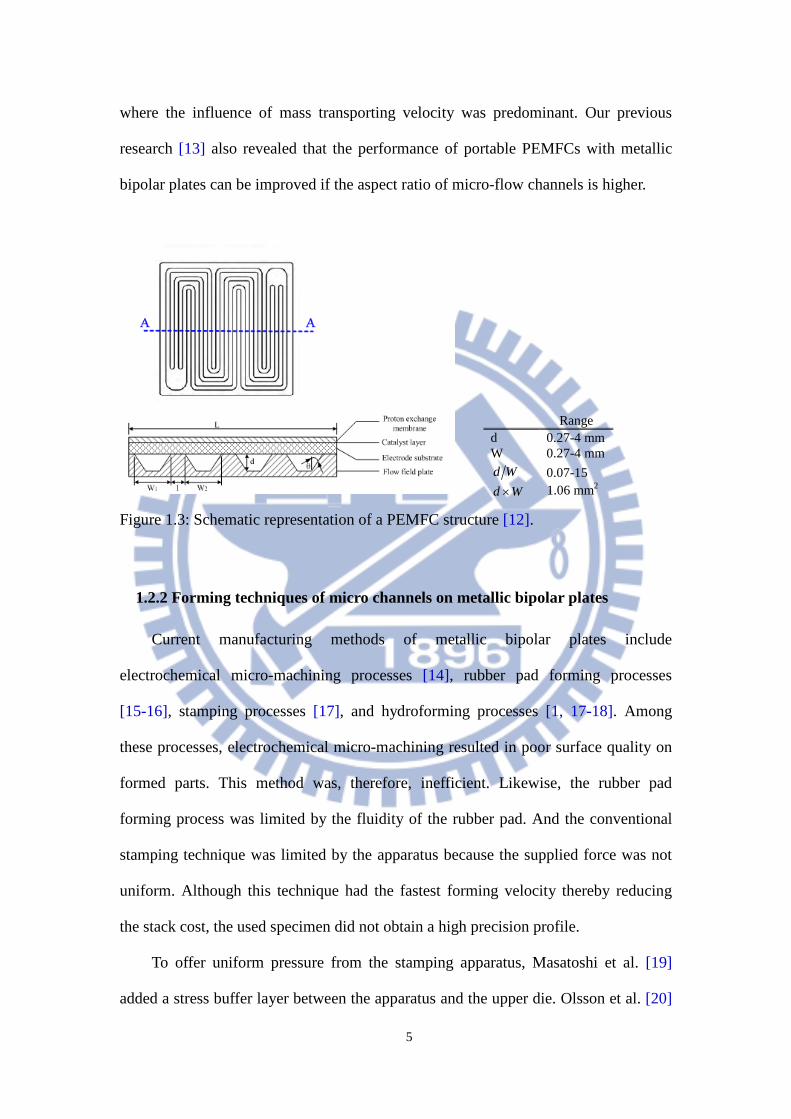
Manso [12] investigated the influence of the channel aspect ratio, defined as the
ratio of the channel height to the width, d/W, on the performance of a PEMFC with a
serpentine flow field design (see Figure 1.3). The results indicated that the cell
performance improved as the channel aspect ratio increased at high operating voltages,
5
where the influence of mass transporting velocity was predominant. Our previous
research [13] also revealed that the performance of portable PEMFCs with metallic
bipolar plates can be improved if the aspect ratio of micro-flow channels is higher.
Figure 1.3: Schematic representation of a PEMFC structure [12].
1.2.2 Forming techniques of micro channels on metallic bipolar plates
Current manufacturing methods of metallic bipolar plates include
electrochemical micro-machining processes [14], rubber pad forming processes
[15-16], stamping processes [17], and hydroforming processes [1, 17-18]. Among
these processes, electrochemical micro-machining resulted in poor surface quality on
formed parts. This method was, therefore, inefficient. Likewise, the rubber pad
forming process was limited by the fluidity of the rubber pad. And the conventional
stamping technique was limited by the apparatus because the supplied force was not
uniform. Although this technique had the fastest forming velocity thereby reducing
the stack cost, the used specimen did not obtain a high precision profile.
To offer uniform pressure from the stamping apparatus, Masatoshi et al. [19]
added a stress buffer layer between the apparatus and the upper die. Olsson et al. [20]
Range
d 0.27-4 mm W 0.27-4 mm
Wd 0.07-15 Wd × 1.06 mm2

6
added a chamber that injected the fluid inside and between the apparatus and the
upper die (see Figure 1.4).
Figure 1.4: Schematic of Olsson’s stamping apparatus design [20].
During the stamping process, it is difficult for the specimens and dies to make
perfect contact because of their surface roughness. This also affects the material
fluidity inside the apparatus. Lee et al. [21] changed the lower die into an inflatable
pipe to ensure more effective contact between the specimens and dies, which also
improved the uniformity of contact pressure (see Figure 1.5).
(a) (b)
Figure 1.5: Schematic of Lee’s stamping apparatus design [21]. (a) Before and (b)
during the process.
7
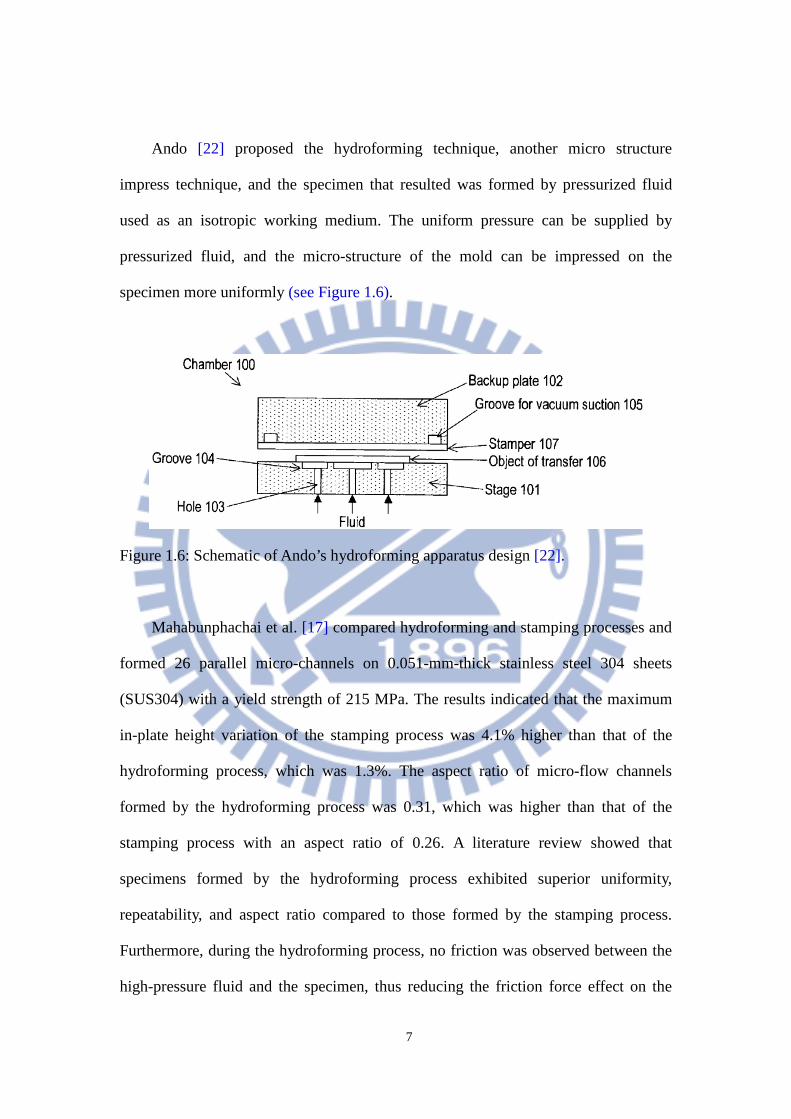
Ando [22] proposed the hydroforming technique, another micro structure
impress technique, and the specimen that resulted was formed by pressurized fluid
used as an isotropic working medium. The uniform pressure can be supplied by
pressurized fluid, and the micro-structure of the mold can be impressed on the
specimen more uniformly (see Figure 1.6).
Figure 1.6: Schematic of Ando’s hydroforming apparatus design [22].
Mahabunphachai et al. [17] compared hydroforming and stamping processes and
formed 26 parallel micro-channels on 0.051-mm-thick stainless steel 304 sheets
(SUS304) with a yield strength of 215 MPa. The results indicated that the maximum
in-plate height variation of the stamping process was 4.1% higher than that of the
hydroforming process, which was 1.3%. The aspect ratio of micro-flow channels
formed by the hydroforming process was 0.31, which was higher than that of the
stamping process with an aspect ratio of 0.26. A literature review showed that
specimens formed by the hydroforming process exhibited superior uniformity,
repeatability, and aspect ratio compared to those formed by the stamping process.
Furthermore, during the hydroforming process, no friction was observed between the
high-pressure fluid and the specimen, thus reducing the friction force effect on the

8
process and resulting in an optimal surface roughness for the specimens after the
hydroforming process.
Koc and Mahabunphachai [1, 18] have used the hydroforming process to
produce micro-flow channels of various dimensions on 0.051-mm-thick SUS304
plates using pressures of 55.2 MPa and 82.7 MPa. The results indicated that the aspect
ratios of micro-flow channels formed at 55.2 and 82.7 MPa may reach approximately
0.26 and 0.29, respectively. The research also demonstrated that it was necessary to
choose a larger rib and channel width, fewer flow channels, and higher fluid pressure
to obtain a high aspect ratio and excellent formability. Furthermore, Mahabunphachai
[18] also used finite element software to simulate the hydroforming process. The
results revealed that it was necessary for the hydrostatic pressure to reach 843 MPa to
form micro-flow channels with a high aspect ratio of 0.72.
1.3 Motivation and objective
Based on the reviewed literature, fuel cell performance can be improved by
increasing the aspect ratio of micro-flow channels. However, previous research on the
hydroforming process applied in forming metallic bipolar plates was limited to a
hydrostatic pressure of 82.7 MPa on 0.051-mm-thick metallic plates with a maximum
aspect ratio of 0.31, which cannot satisfy practical demands for cell performance or
reveal the forming capability of the hydroforming process. Nevertheless, problems
remain with respect to building high-pressure hydroforming devices, and only a few
studies on high-pressure hydroforming techniques have been published.
To improve formability and produce micro-flow channels with a high aspect
ratio, this study increased the forming pressure during the hydroforming process. For
this purpose, a novel high-pressure hydroforming testing apparatus was developed. In
addition, finite element and optimization analyses were performed to further reveal
9
the forming capability of the developed technique.
Conclusively, this research developed a complete high-pressure hydroforming
technique, applied in forming metallic bipolar plates for portable PEMFCs.
1.4 Research method
A novel patented apparatus [23] was first designed and constructed to enable a
two-stage pressure boost in the hydroforming process. It was designed to have a
working pressure that reaches 1000 MPa. A high-pressure container was designed
with three-layered tapered cylinders to sustain maximum working pressures over 1000
MPa. In addition, a special seal component was designed to seal the high-pressure
fluid and, thus, maintain pressure. A series of preliminary tests were subsequently
conducted to verify the feasibility of this high-pressure hydroforming technique and
to ensure that all of the components in the hydroforming apparatus worked smoothly.
Finally, the hydroforming experiments were conducted using various hydrostatic
pressures to form high aspect ratio micro-flow channels on stainless steel sheets. A
fuel cell performance test was also performed to check the performance of
hydroformed metallic bipolar plates.
Concurrently, finite element analysis software was used to analyze the
hydroforming process. First, the precision of the finite element model was verified by
comparing the results between simulations and experiments. Subsequently, the
optimization software was implemented into the finite element software to determine
the optimal aspect ratio of micro-flow channels by changing the dimension of
micro-flow channels on the mold.
This study used SUS304 as the material for metallic bipolar plates to overcome
the corrosion problem in working environments [1, 24-28]. Although different types
of stainless steel (e.g., SUS304, SUS316, SUS316L, SUS317L, SUS904L, and

10
SUS349) could be used as a base material for bipolar plates, SUS304 was selected in
this research for its low material cost, acceptable corrosion resistance, and availability
[29]. Moreover, 0.051-mm-thick SUS304 plates used in previous studies [1, 17-18]
were not sufficiently thick to meet practical demands on rigidity; therefore,
0.1-mm-thick SUS304 plates were used as the specimens in this research.
1.5 Scope of dissertation
This chapter introduces the background of bipolar plates in fuel cells and the
high-pressure hydroforming process, thus revealing the motivation and objectives of
this research. Chapter 2 describes the detailed designs and structure of the newly
developed high-pressure hydroforming apparatus. In Chapter 3, a series of
preliminary experiments using the constructed hydroforming apparatus are conducted
to verify the feasibility of the proposed high-pressure hydroforming technique. In
Chapter 4, the precise finite element and optimization analyses are conducted to
efficiently reveal the full capability of this developed apparatus. Chapter 5
summarizes the study and draws conclusions.
11
CHAPTER 2 THE DESIGN AND CONSTRUCTION ON A
HIGH-PRESSURE HYDROFORMING APPARATUS
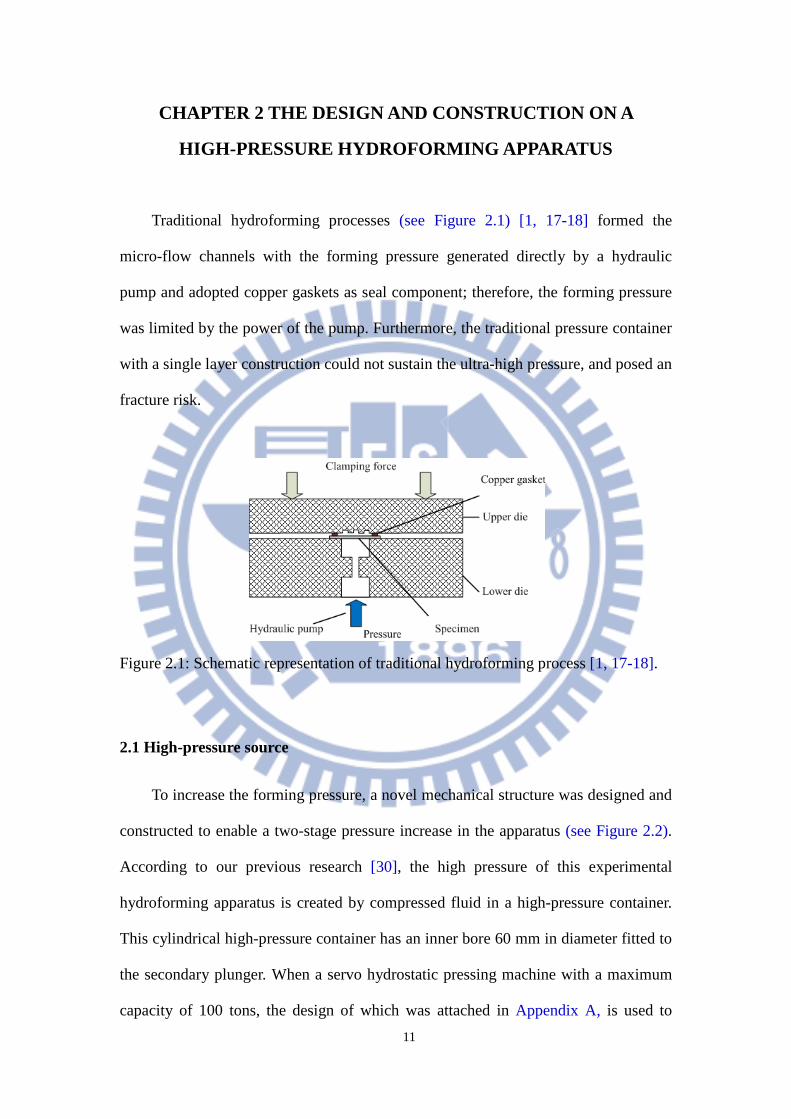
Traditional hydroforming processes (see Figure 2.1) [1, 17-18] formed the
micro-flow channels with the forming pressure generated directly by a hydraulic
pump and adopted copper gaskets as seal component; therefore, the forming pressure
was limited by the power of the pump. Furthermore, the traditional pressure container
with a single layer construction could not sustain the ultra-high pressure, and posed an
fracture risk.
Figure 2.1: Schematic representation of traditional hydroforming process [1, 17-18].
2.1 High-pressure source
To increase the forming pressure, a novel mechanical structure was designed and
constructed to enable a two-stage pressure increase in the apparatus (see Figure 2.2).
According to our previous research [30], the high pressure of this experimental
hydroforming apparatus is created by compressed fluid in a high-pressure container.
This cylindrical high-pressure container has an inner bore 60 mm in diameter fitted to
the secondary plunger. When a servo hydrostatic pressing machine with a maximum
capacity of 100 tons, the design of which was attached in Appendix A, is used to
12
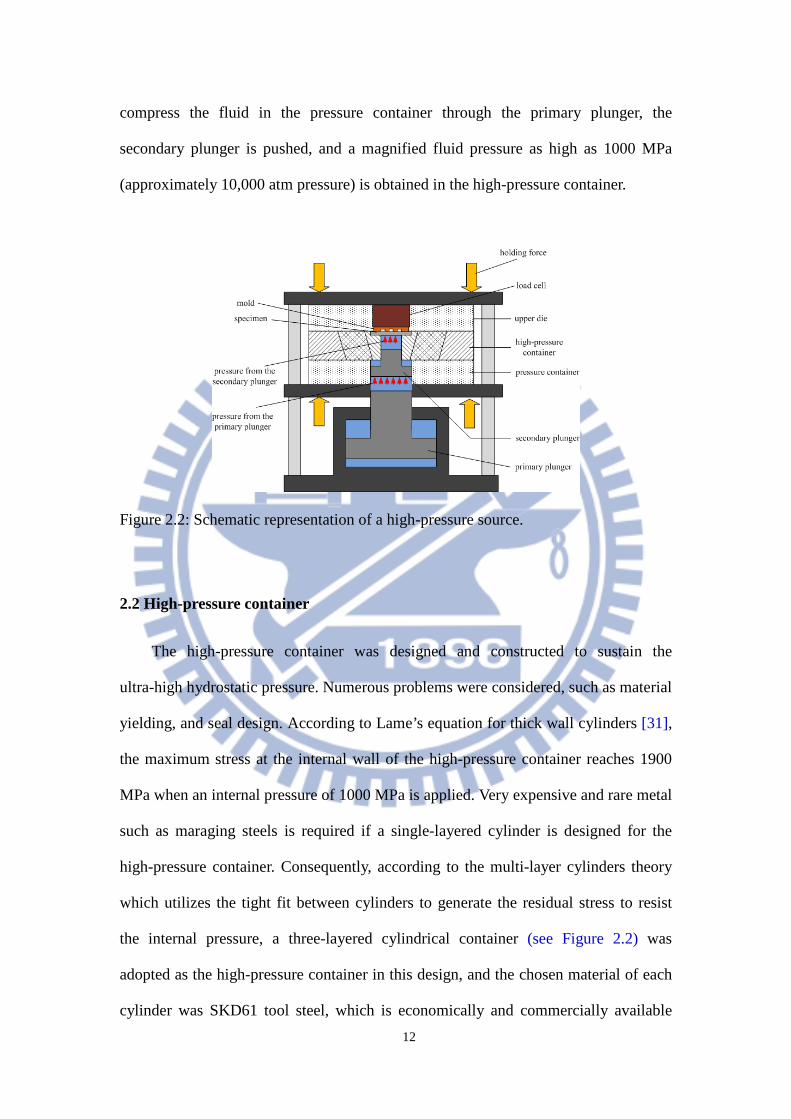
compress the fluid in the pressure container through the primary plunger, the
secondary plunger is pushed, and a magnified fluid pressure as high as 1000 MPa
(approximately 10,000 atm pressure) is obtained in the high-pressure container.
Figure 2.2: Schematic representation of a high-pressure source.
2.2 High-pressure container
The high-pressure container was designed and constructed to sustain the
ultra-high hydrostatic pressure. Numerous problems were considered, such as material
yielding, and seal design. According to Lame’s equation for thick wall cylinders [31],
the maximum stress at the internal wall of the high-pressure container reaches 1900
MPa when an internal pressure of 1000 MPa is applied. Very expensive and rare metal
such as maraging steels is required if a single-layered cylinder is designed for the
high-pressure container. Consequently, according to the multi-layer cylinders theory
which utilizes the tight fit between cylinders to generate the residual stress to resist
the internal pressure, a three-layered cylindrical container (see Figure 2.2) was
adopted as the high-pressure container in this design, and the chosen material of each
cylinder was SKD61 tool steel, which is economically and commercially available
13
[30].
The yield stress for SKD61 was approximately 1600 MPa. With a safety factor of
1.5, as indicated in the literature [30], 1060 MPa was specified as the design working
stress ( yσ ) during the design phase.
The Tresca yield criterion was often used to analyze a compound cylinder in
multi-layer cylinders theory [32-36]. Based on the Tresca yield criterion, the pressure
difference across an nth element at yield at the bore of the element is calculated as
follows:
)11(2 21
n
ynnn K
PP −=− +
σ (1)
where ynσ is the specified working stress of the material for each element, and nK
is the diameter ratio of each cylinder. If m elements and no external pressure on the
outer element occur, that is, 01 =+mP , the internal pressure to produce simultaneous
yielding in all cylinders is calculated as follows:
∑=
−=m
n n
yny K
P1
2 )11(2σ
(2)
The maximum value of yP is determined by differentiating (2) regarding nK
and equating to 0. Three elements were used in this study, and the material of each
cylinder was the same. Equation (2) becomes
)11(23
3/2max
ty
y
KP
−=σ
(3)
where yσ is 1060 MPa, tK is 321 KKK ×× , 1K , 2K , and 3K are the diameter
ratios of the inner cylinder, the middle cylinder, and the outer cylinder respectively.
Because of limitations on the dimension of the apparatus and requirements for
14
fuel cells, the designed diameters for the bore of the internal cylinder and the outer
diameter of the outer cylinder were 60 mm and 500 mm, respectively, for this
experimental hydroforming apparatus, and subsequently, 027.2321 === KKK . The
upper limit to this analysis occurs when the compressive residual stress at the bore of
the inner cylinder, which is caused by the shrinkage stress produced by adding an
outer element, exceeds the yield strength of the material. Furthermore, in this design,
maxyP was up to 1203.17 MPa, which should be able to sustain a high-pressure fluid
higher than 1000 MPa.
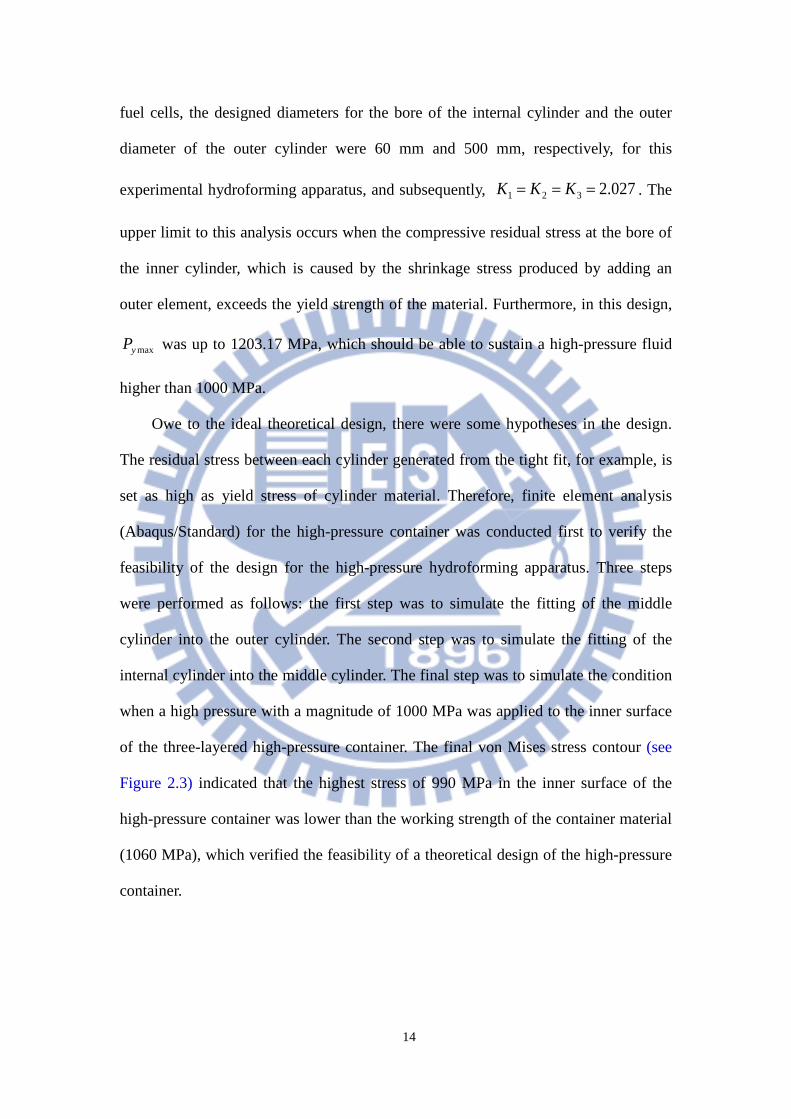
Owe to the ideal theoretical design, there were some hypotheses in the design.
The residual stress between each cylinder generated from the tight fit, for example, is
set as high as yield stress of cylinder material. Therefore, finite element analysis
(Abaqus/Standard) for the high-pressure container was conducted first to verify the
feasibility of the design for the high-pressure hydroforming apparatus. Three steps
were performed as follows: the first step was to simulate the fitting of the middle
cylinder into the outer cylinder. The second step was to simulate the fitting of the
internal cylinder into the middle cylinder. The final step was to simulate the condition
when a high pressure with a magnitude of 1000 MPa was applied to the inner surface
of the three-layered high-pressure container. The final von Mises stress contour (see
Figure 2.3) indicated that the highest stress of 990 MPa in the inner surface of the
high-pressure container was lower than the working strength of the container material
(1060 MPa), which verified the feasibility of a theoretical design of the high-pressure
container.
15
Figure 2.3: The final von Mises stress contour in the finite-element simulation of the
high-pressure container. (Unit: MPa)
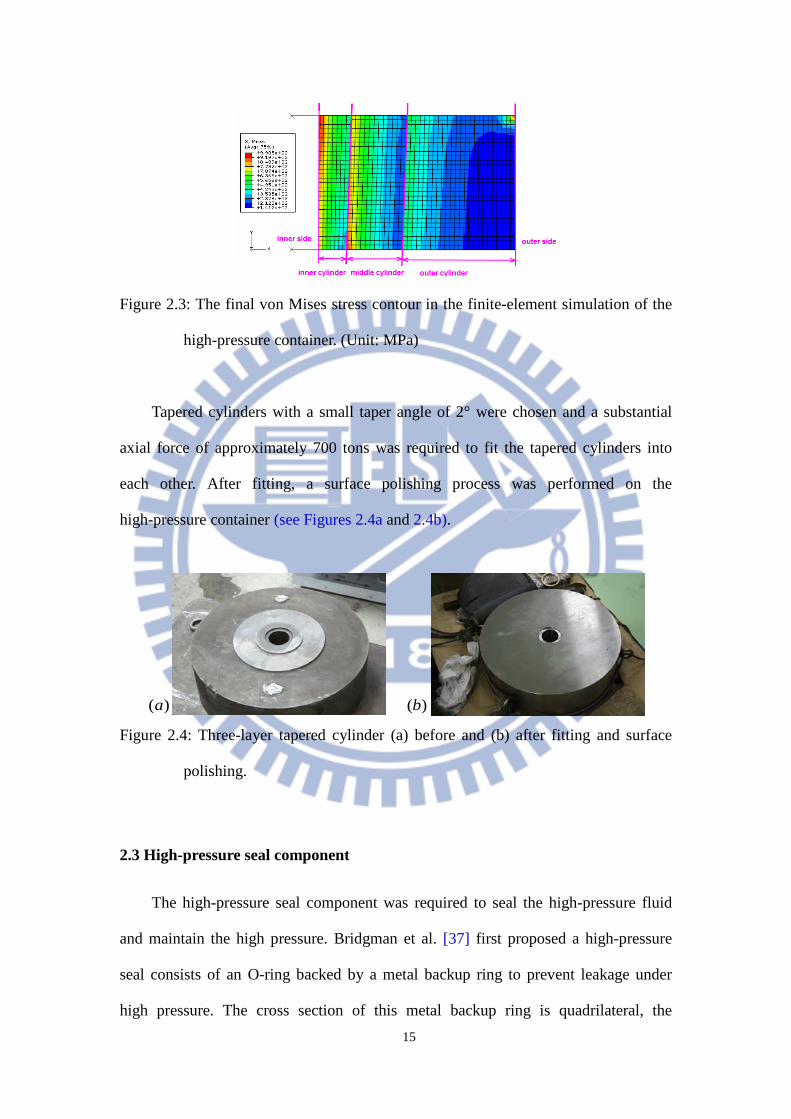
Tapered cylinders with a small taper angle of 2° were chosen and a substantial
axial force of approximately 700 tons was required to fit the tapered cylinders into
each other. After fitting, a surface polishing process was performed on the
high-pressure container (see Figures 2.4a and 2.4b).
)(a )(b Figure 2.4: Three-layer tapered cylinder (a) before and (b) after fitting and surface
polishing.
2.3 High-pressure seal component
The high-pressure seal component was required to seal the high-pressure fluid
and maintain the high pressure. Bridgman et al. [37] first proposed a high-pressure
seal consists of an O-ring backed by a metal backup ring to prevent leakage under
high pressure. The cross section of this metal backup ring is quadrilateral, the
16
so-called unsupported-area-ring or Mitre ring; however, the friction between the
O-ring and the metal backup ring increases in conjunction with the pressure, resulting
in an additional torsion moment [30]. To overcome this problem, Whalley [38] and
our previous research [23, 30] developed a ladder-shaped and a V-shaped
cross-section ring, respectively.
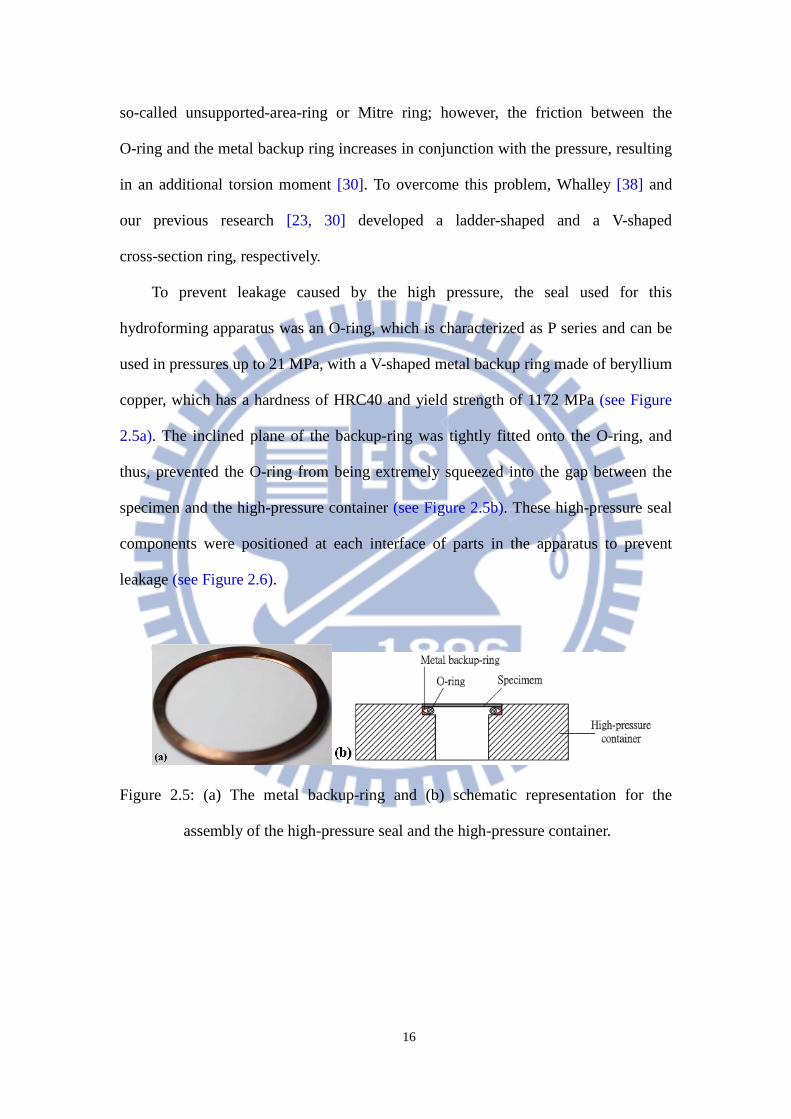
To prevent leakage caused by the high pressure, the seal used for this
hydroforming apparatus was an O-ring, which is characterized as P series and can be
used in pressures up to 21 MPa, with a V-shaped metal backup ring made of beryllium
copper, which has a hardness of HRC40 and yield strength of 1172 MPa (see Figure
2.5a). The inclined plane of the backup-ring was tightly fitted onto the O-ring, and
thus, prevented the O-ring from being extremely squeezed into the gap between the
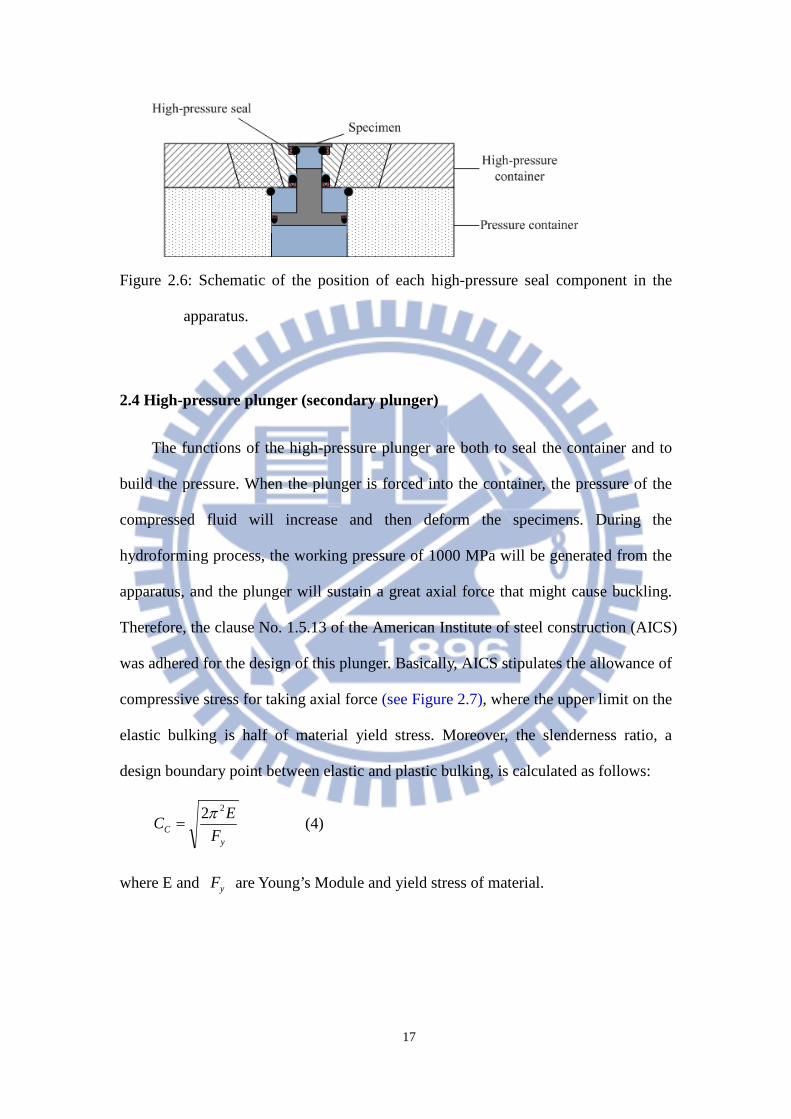
specimen and the high-pressure container (see Figure 2.5b). These high-pressure seal
components were positioned at each interface of parts in the apparatus to prevent
leakage (see Figure 2.6).
Figure 2.5: (a) The metal backup-ring and (b) schematic representation for the
assembly of the high-pressure seal and the high-pressure container.
17
Figure 2.6: Schematic of the position of each high-pressure seal component in the
apparatus.
2.4 High-pressure plunger (secondary plunger)
The functions of the high-pressure plunger are both to seal the container and to
build the pressure. When the plunger is forced into the container, the pressure of the
compressed fluid will increase and then deform the specimens. During the
hydroforming process, the working pressure of 1000 MPa will be generated from the
apparatus, and the plunger will sustain a great axial force that might cause buckling.
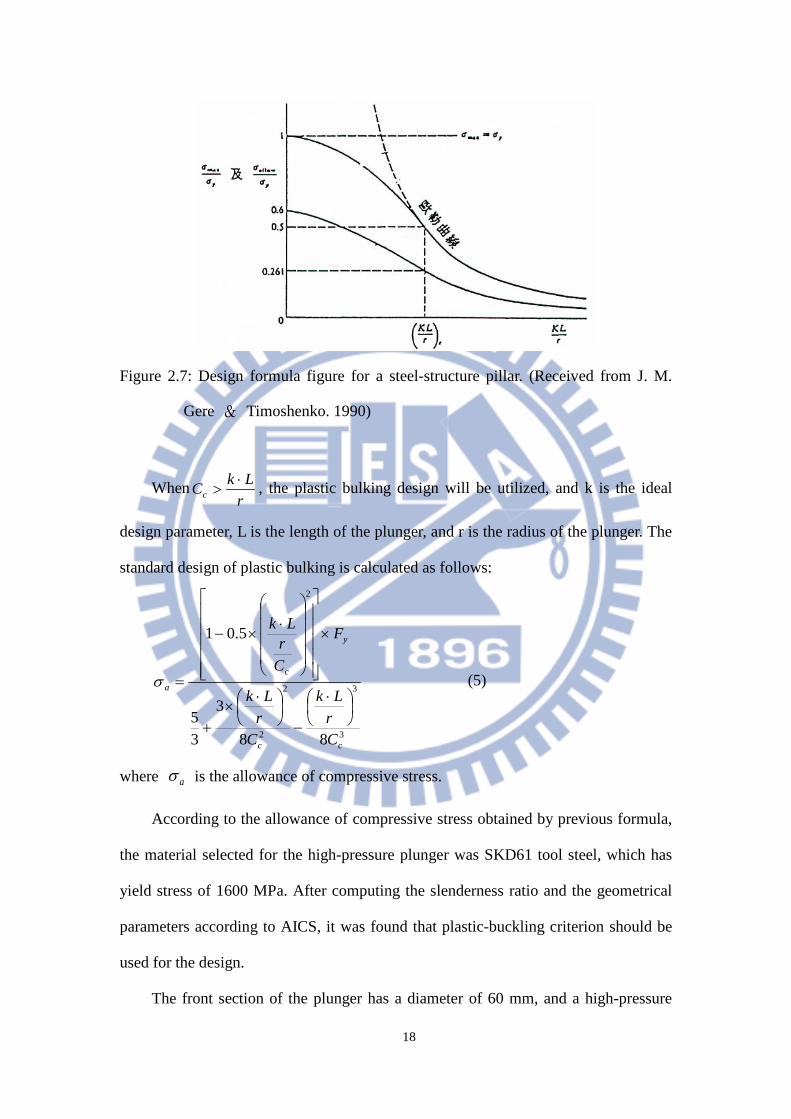
Therefore, the clause No. 1.5.13 of the American Institute of steel construction (AICS)
was adhered for the design of this plunger. Basically, AICS stipulates the allowance of
compressive stress for taking axial force (see Figure 2.7), where the upper limit on the
elastic bulking is half of material yield stress. Moreover, the slenderness ratio, a
design boundary point between elastic and plastic bulking, is calculated as follows:
yC F
EC22π
= (4)
where E and yF are Young’s Module and yield stress of material.
18
Figure 2.7: Design formula figure for a steel-structure pillar. (Received from J. M.
Gere & Timoshenko. 1990)
Whenr
LkCc⋅
> , the plastic bulking design will be utilized, and k is the ideal
design parameter, L is the length of the plunger, and r is the radius of the plunger. The
standard design of plastic bulking is calculated as follows:
3
3
2
2
2
88
3
35
5.01
cc
y
c
a
Cr
Lk
Cr
Lk
F
Cr
Lk
⋅
−
⋅
×+
×
⋅
×−
=σ (5)
where aσ is the allowance of compressive stress.
According to the allowance of compressive stress obtained by previous formula,
the material selected for the high-pressure plunger was SKD61 tool steel, which has
yield stress of 1600 MPa. After computing the slenderness ratio and the geometrical
parameters according to AICS, it was found that plastic-buckling criterion should be
used for the design.
The front section of the plunger has a diameter of 60 mm, and a high-pressure

19
seal with an O-ring and a beryllium copper backup is fitted on the plunger (see
Figures. 2.8a and 2.8b).
)(a )(b Figure 2.8: (a) The secondary plunger. (b) The secondary plunger in the pressure
container.
2.5 High-pressure fluid
The fluid in the pressure containers has two functions, that is, to transmit
pressure and to lubricate the interface between the plunger and the container. The
fluid must be incompressible and safe under high pressure, and have excellent
lubrication and stability.
Circulation oil R68, SAE30 oil, mineral oil, castor oil, and glycerine are
commonly utilized. SAE30 oil can sustain pressure of 1000 MPa, R68 and castor oil
can sustain 1500 MPa working pressures, and glycerine can sustain up to 3000 MPa
working pressures; however, R68 is relatively cheap and commercially available.
Hence, this study chose circulation R68 oil from Chinese Petroleum Corp. as the
pressure fluid.
20
CHAPTER 3 EXPERIMENTAL INVESTIGATIONS OF THE
HIGH-PRESSURE HYDROFORMING TECHNIQUE
This research did a series of preliminary experiments using the constructed
hydroforming apparatus to verify the feasibility of the proposed high-pressure
hydroforming technique. Moreover, a fuel cell with a pair of hydroformed bipolar
plates was assembled to test its performance and to confirm the feasibility of
hydroformed bipolar plates.
3.1 Material test
Before the high-pressure hydroforming experiments, the material properties of
the specimen (SUS304) should be overall understood. Thus, the uniaxial tensile tests
for specimens were conducted. In addition, metallographic test and forming limit test
were also conducted in this research to comprehensively obtain the material properties
of SUS304, the experiment results of which were attached in Appendix B and C.
3.1.1 Solution heat treatment
Thin SS304 blanks with dimensions of 100 mm × 100 mm × 0.1 mm were used
as specimens for the hydroforming experiments. The uniaxial tensile test was
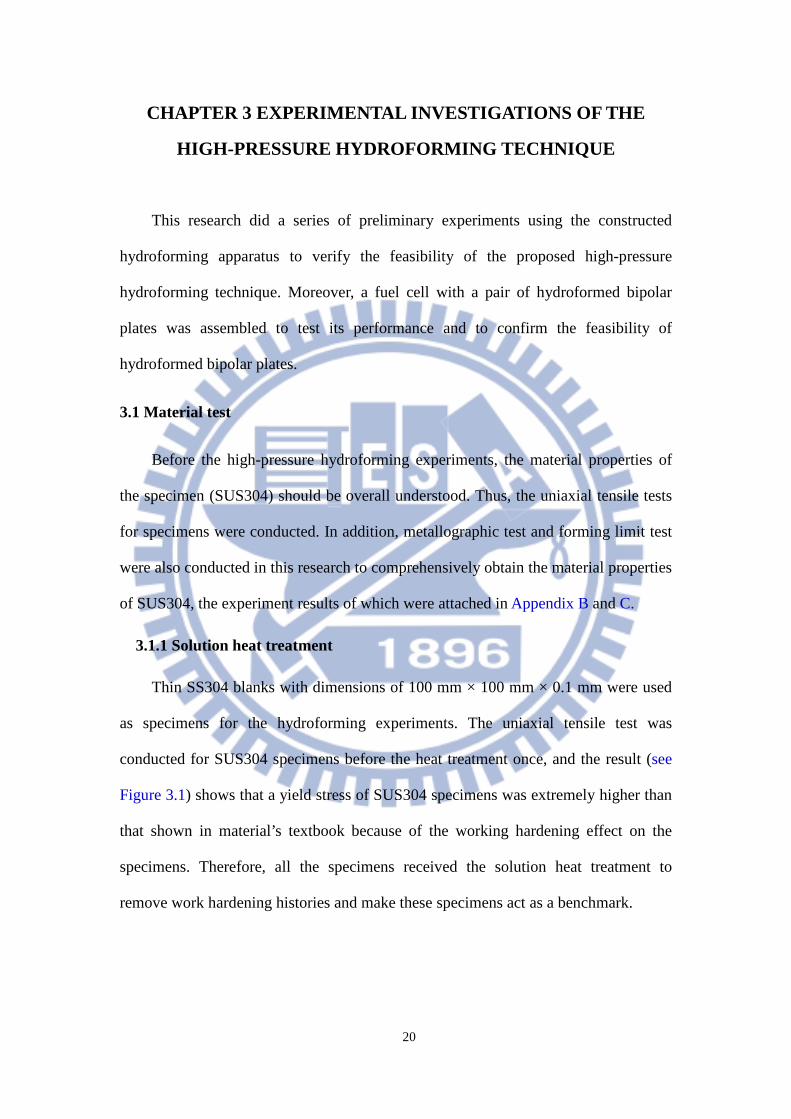
conducted for SUS304 specimens before the heat treatment once, and the result (see
Figure 3.1) shows that a yield stress of SUS304 specimens was extremely higher than
that shown in material’s textbook because of the working hardening effect on the
specimens. Therefore, all the specimens received the solution heat treatment to
remove work hardening histories and make these specimens act as a benchmark.
21
Figure 3.1: Stress-strain curve derived from SUS304 specimens before the solution
heat treatment.
SUS304 is a kind of austenitic steel having recrystallization temperature of 850 –
1000 C° and melting point of about 1400 C° . Therefore, the temperature of the
solution heat treatment needs to reach between 1000 C° and 1400 C° . In this research,
the temperature was set as 1030 C° . The procedure of the solution heat treatment is as
follows (see Figure 3.2): First, the temperature reaches 600 C° from room
temperature with a heating rate of 10 C° per minute, and then the temperature is held
for 30 minutes to make sure the temperature in a chamber is uniformly distributed.
Subsequently, the temperature is raised to 850 C° and held for 30 minutes. The
purpose of this raised temperature stage is to avoid the sensitizing temperature of
SUS304 stainless steel. Chromium carbide ( 23CCr ) is precipitated in SUS304
specimens at approximately 600 C° . Finally, the temperature is raised to 1030 C° and
held for 2 hours, then cooled down slowly by nitrogen. Figure 3.3 is a comparison of
SUS304 specimens before and after the solution heat treatment.
22
Figure 3.2: The procedure of the solution heat treatment.
Figure 3.3: A comparison of SUS304 specimens (a) before and (b) after the solution
heat treatment.
3.1.2 Uniaxial tensile test
The purpose of the uniaxial tensile test is to obtain the basic mechanical
properties such as Young’s Module, yield stress, plastic data, and orientation, which
also will be applied in the material properties of the finite element analysis.
Heat treated SUS304 specimens were cut to the standard tensile specimens (see
Figure 3.4) according to No. ASTM-E8 of the American Society for Testing and
Materials (ASTM). Furthermore, to consider the anisotropy effect, the samples at the
same sheet were cut in the directions of 0°, 45° and 90° with respect to the rolling
)(a )(b
23
direction, as shown in Figure 3.5. The tensile tests were carried out using MTS-810
universal testing machine equipped at room temperature. During the test, tensile rate
was set as 0.025 mm s-1, and the force, displacement, and strain could be obtained
from the load cell and the strain gauge, respectively. Finally, the true stress-strain
curve was derived by those data.
Figure 3.4: The dimension of the standard specimen for a tensile test. (Unit: mm)
Figure 3.5: The layout of the standard specimens for a tensile test.
The heat treated specimens after the tensile tests are shown in Figure 3.6, and the
true stress-strain curves are shown in Figure 3.7. The result demonstrated that three
curves as different directions with respect to the rolling direction were almost the
same, representing a rather weak anisotropic behavior for heat treated SUS304 sheets.
Thus, the sheet orientation was out of consideration in the follow-up research.
24
Figure 3.6: The heat treated specimens after the tensile tests.
Figure 3.7: The uniaxial tensile test results for heat treated SUS304 specimens.
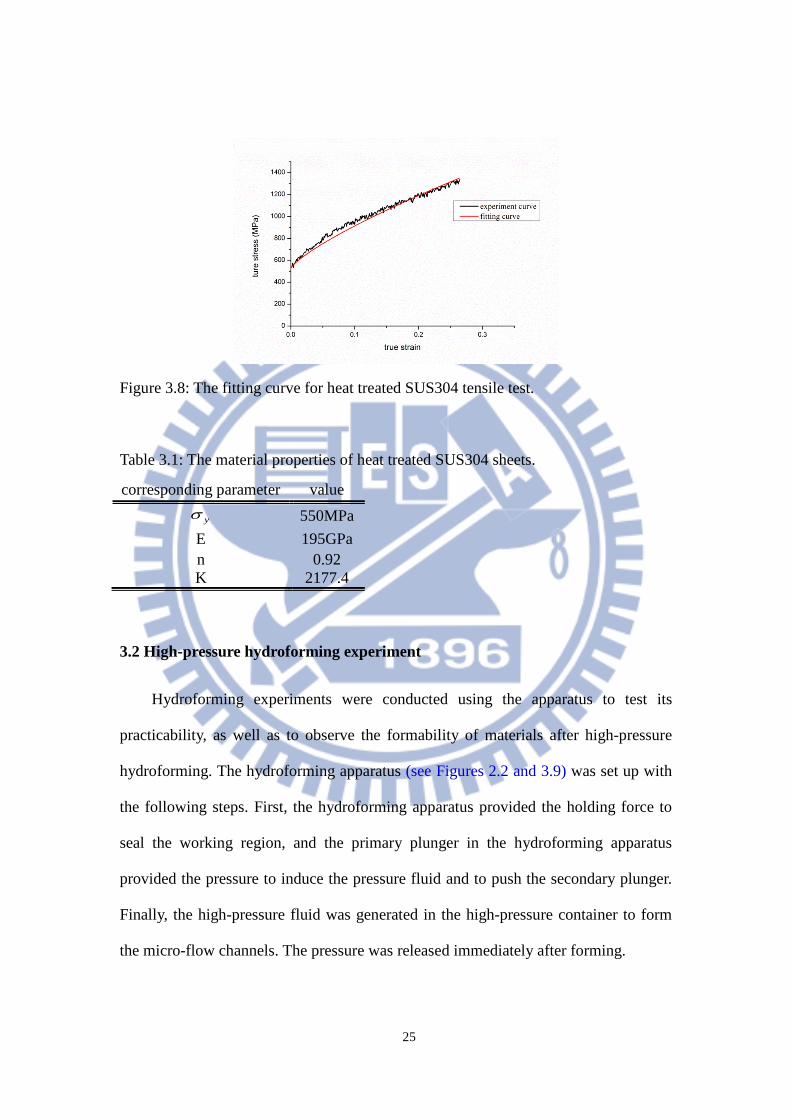
The true stress-true strain curves were fitted by the power law (see Eq. 6), and
the rigid-plastic model is shown in Figure 3.8. The material properties of SUS304
sheets were obtained, and the corresponding parameters are presented in Table 3.1,
Young’s module of which is 195 GPa, and yield stress of which is 550 MPa.
ynp
TT K σεσ += )( (6)
where pTε is true plastic strain, yσ is initial yield stress, E is Young’s module, n is
strain hardening exponent, and K is a constant.
°0°45
°90
25
Figure 3.8: The fitting curve for heat treated SUS304 tensile test.
Table 3.1: The material properties of heat treated SUS304 sheets.
3.2 High-pressure hydroforming experiment
Hydroforming experiments were conducted using the apparatus to test its
practicability, as well as to observe the formability of materials after high-pressure
hydroforming. The hydroforming apparatus (see Figures 2.2 and 3.9) was set up with
the following steps. First, the hydroforming apparatus provided the holding force to
seal the working region, and the primary plunger in the hydroforming apparatus
provided the pressure to induce the pressure fluid and to push the secondary plunger.
Finally, the high-pressure fluid was generated in the high-pressure container to form
the micro-flow channels. The pressure was released immediately after forming.
corresponding parameter value
yσ
550MPa E 195GPa n 0.92 K 2177.4
26
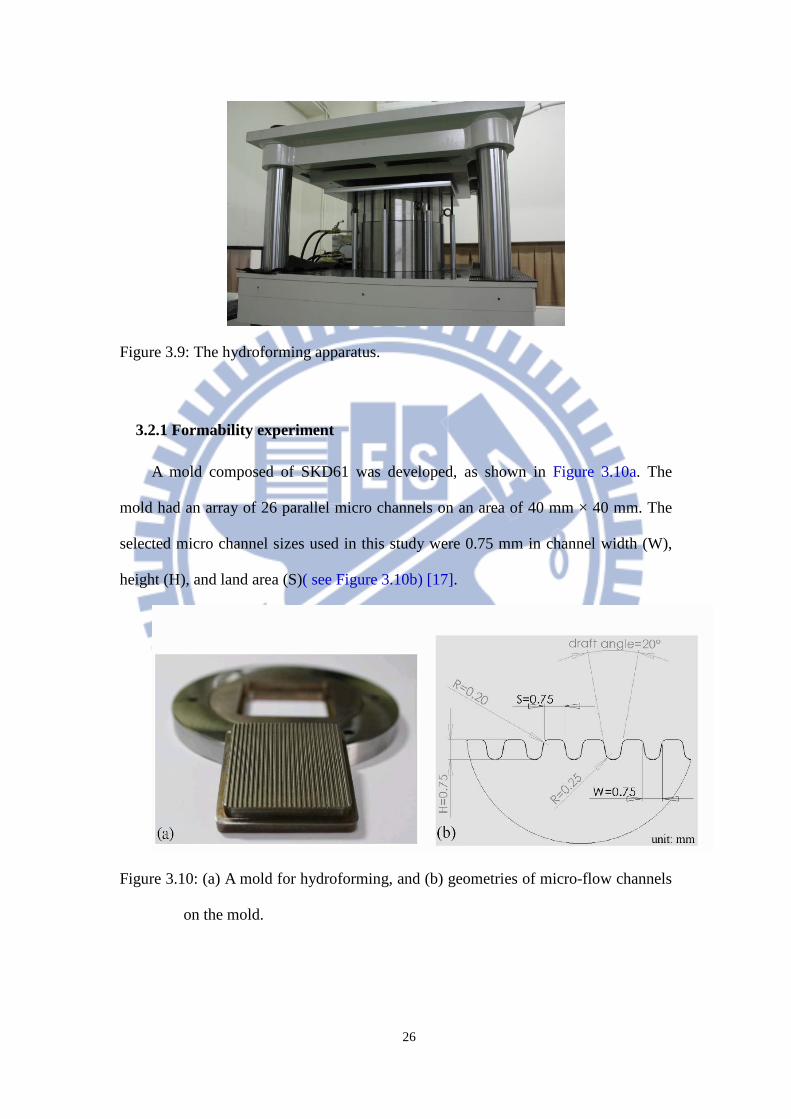
Figure 3.9: The hydroforming apparatus.
3.2.1 Formability experiment
A mold composed of SKD61 was developed, as shown in Figure 3.10a. The
mold had an array of 26 parallel micro channels on an area of 40 mm × 40 mm. The
selected micro channel sizes used in this study were 0.75 mm in channel width (W),
height (H), and land area (S)( see Figure 3.10b) [17].
Figure 3.10: (a) A mold for hydroforming, and (b) geometries of micro-flow channels
on the mold.
27
A series of experiments was conducted to assess the capability and repeatability
of the hydroforming process for fabrication of metallic bipolar plates, with various
hydrostatic pressures from 60 to 250 MPa applied to the specimens, and with a speed
rate of 13 MPa min-1. For each case, three replications were conducted to examine the
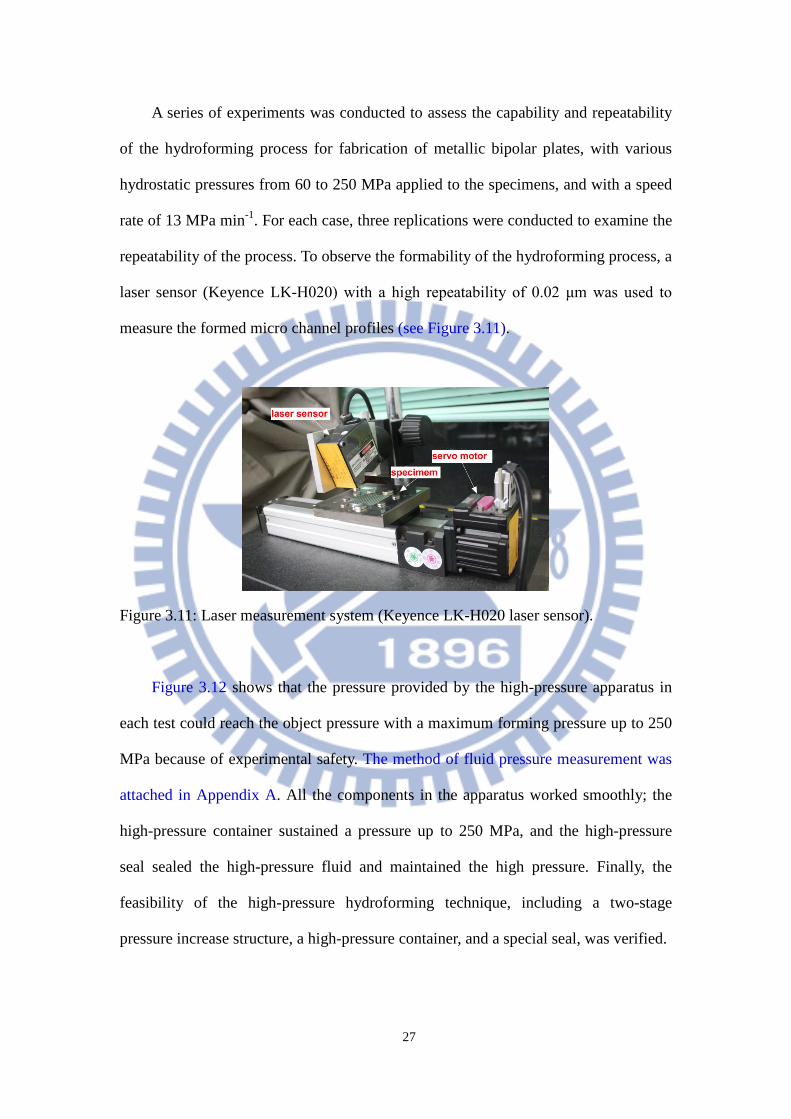
repeatability of the process. To observe the formability of the hydroforming process, a
laser sensor (Keyence LK-H020) with a high repeatability of 0.02 μm was used to
measure the formed micro channel profiles (see Figure 3.11).
Figure 3.11: Laser measurement system (Keyence LK-H020 laser sensor).
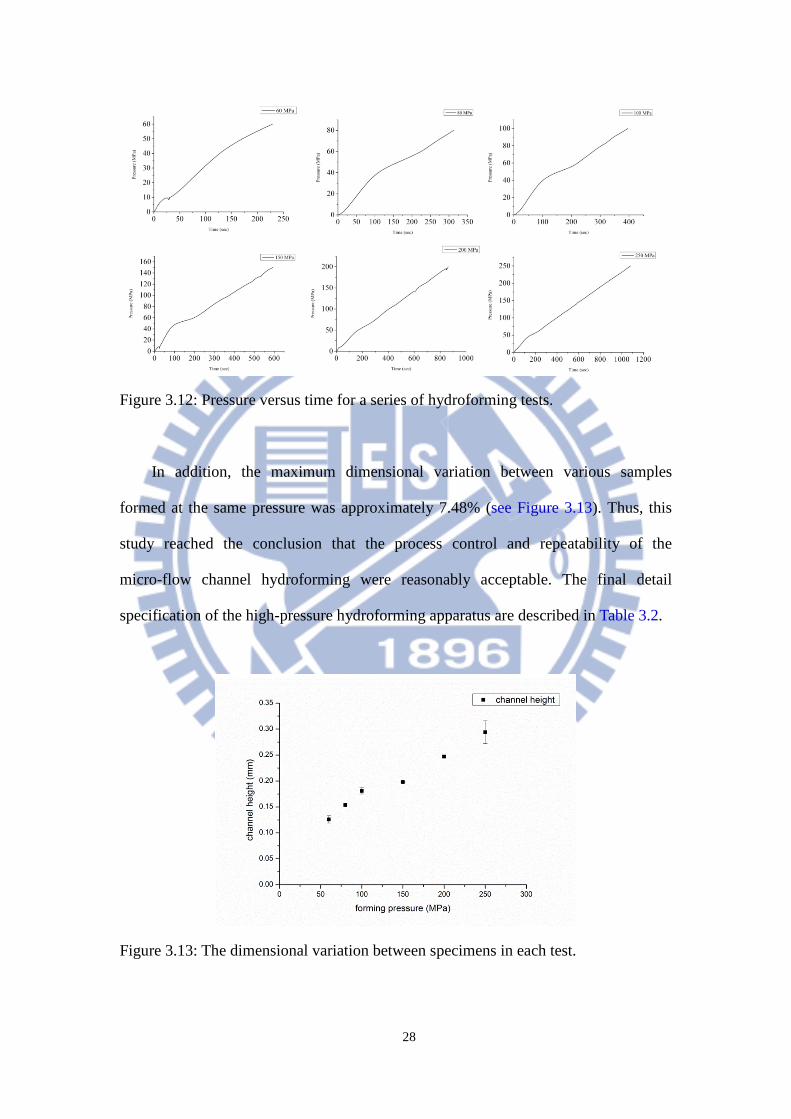
Figure 3.12 shows that the pressure provided by the high-pressure apparatus in
each test could reach the object pressure with a maximum forming pressure up to 250
MPa because of experimental safety. The method of fluid pressure measurement was
attached in Appendix A. All the components in the apparatus worked smoothly; the
high-pressure container sustained a pressure up to 250 MPa, and the high-pressure
seal sealed the high-pressure fluid and maintained the high pressure. Finally, the
feasibility of the high-pressure hydroforming technique, including a two-stage
pressure increase structure, a high-pressure container, and a special seal, was verified.
28
Figure 3.12: Pressure versus time for a series of hydroforming tests.
In addition, the maximum dimensional variation between various samples
formed at the same pressure was approximately 7.48% (see Figure 3.13). Thus, this
study reached the conclusion that the process control and repeatability of the
micro-flow channel hydroforming were reasonably acceptable. The final detail
specification of the high-pressure hydroforming apparatus are described in Table 3.2.
Figure 3.13: The dimensional variation between specimens in each test.
29
Table 3.2: The specification of the high-pressure hydroforming apparatus.
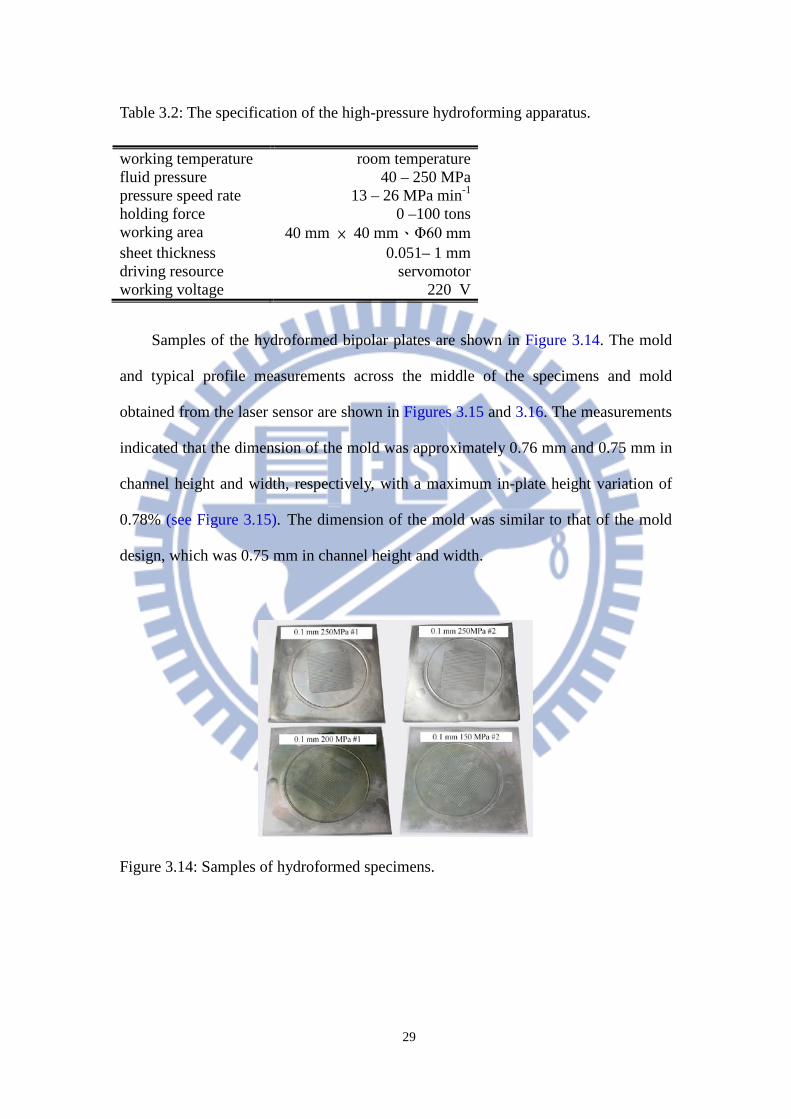
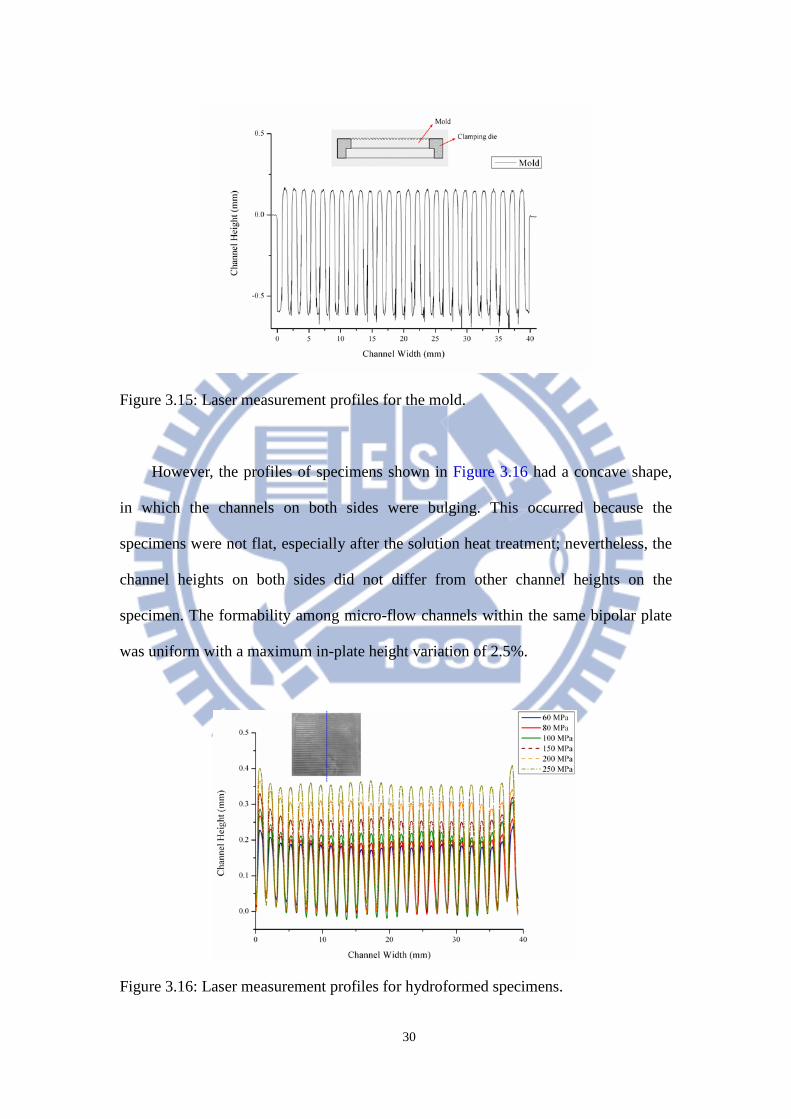
Samples of the hydroformed bipolar plates are shown in Figure 3.14. The mold
and typical profile measurements across the middle of the specimens and mold
obtained from the laser sensor are shown in Figures 3.15 and 3.16. The measurements
indicated that the dimension of the mold was approximately 0.76 mm and 0.75 mm in
channel height and width, respectively, with a maximum in-plate height variation of
0.78% (see Figure 3.15). The dimension of the mold was similar to that of the mold
design, which was 0.75 mm in channel height and width.
Figure 3.14: Samples of hydroformed specimens.
working temperature room temperature fluid pressure 40 – 250 MPa pressure speed rate 13 – 26 MPa min-1 holding force 0 –100 tons working area 40 mm × 40 mm、Φ60 mm sheet thickness 0.051– 1 mm driving resource servomotor working voltage 220 V
30
Figure 3.15: Laser measurement profiles for the mold.
However, the profiles of specimens shown in Figure 3.16 had a concave shape,
in which the channels on both sides were bulging. This occurred because the
specimens were not flat, especially after the solution heat treatment; nevertheless, the
channel heights on both sides did not differ from other channel heights on the
specimen. The formability among micro-flow channels within the same bipolar plate
was uniform with a maximum in-plate height variation of 2.5%.
Figure 3.16: Laser measurement profiles for hydroformed specimens.
31
In previous studies [1, 17-18], traditional hydroforming process had been limited
by the forming pressure, and formed micro-flow channels on 0.051-mm-thick
SUS304 plates with a maximum aspect ratio of 0.31, which prevented the cell
performance from being revealed effectively. In our preliminary tests, heat treated
SUS304 specimens with 0.051 mm thickness was tested by the developed apparatus,
and the result (see Table 3.3) confirmed that formed channel aspect ratio on heat
treated SUS304 blanks reached 0.39 with increasing working pressure up to 150 MPa,
which could verify that high-pressure hydroforming technique is indeed helpful for
promoting the formability of specimens. However, to meet the requirement on the
strength of practical bipolar plates, heat treated SUS304 specimens with 0.1 mm
thickness were selected in the follow-up research.
Table 3.3: A comparison of experiment results in our research and the related
literature.
From the experiment results (see Table 3.3), the aspect ratio of the micro-flow
channels formed on the 0.1-mm-thick SUS304 plates reached 0.392 at 250 MPa
working pressures by using the proposed high-pressure hydroforming technique, the
result of which revealed that, compared with the channel aspect ratio of 0.31 formed
sheet thickness pressure aspect ratio Mahabunphachai,[17] 0.051 mm 60 MPa 0.310
this research
0.051 mm 150 MPa 0.390
0.1 mm
60 MPa 0.168 80 MPa 0.205 100 MPa 0.241 150 MPa 0.264 200 MPa 0.329 250 MPa 0.392
32
by tradition hydroforming technique, an aspect ratio of formed micro channels could
be promoted up to 26.5%. Hence, the high aspect ratio micro-flow channel on a
reinforced metallic plate may be obtained using this high-pressure hydroforming
apparatus to meet both cell performance and manufacturing requirements.
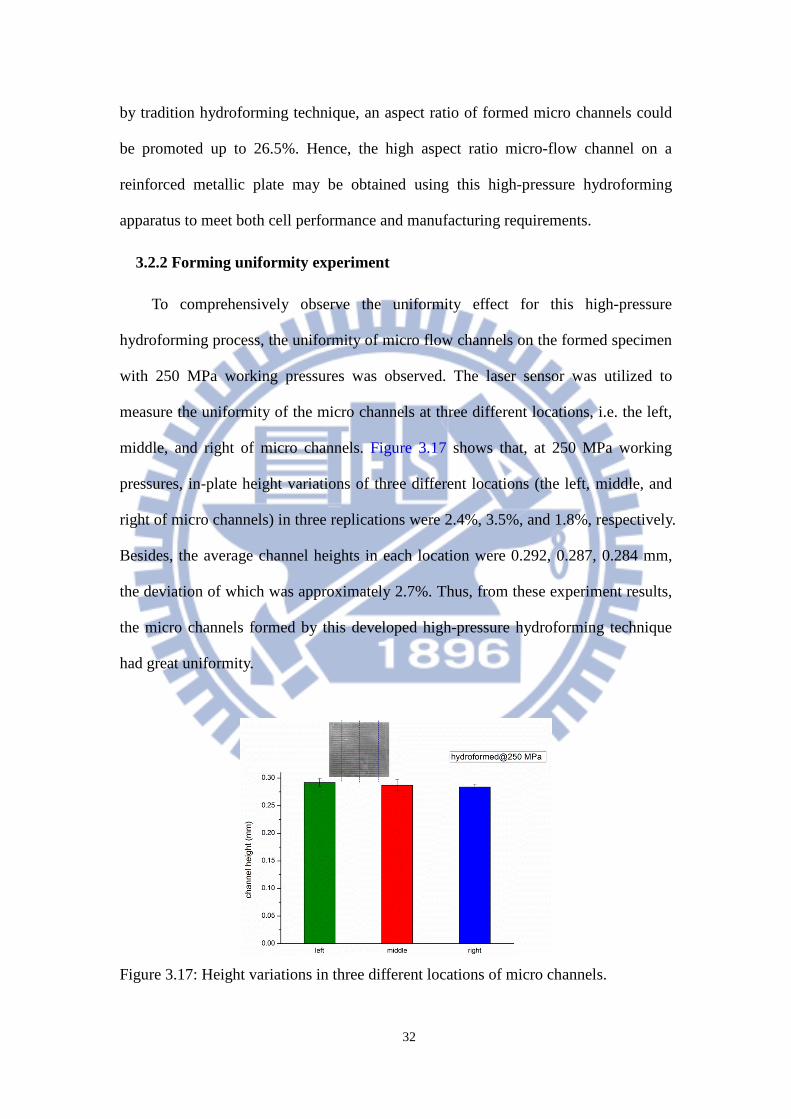
3.2.2 Forming uniformity experiment
To comprehensively observe the uniformity effect for this high-pressure
hydroforming process, the uniformity of micro flow channels on the formed specimen
with 250 MPa working pressures was observed. The laser sensor was utilized to
measure the uniformity of the micro channels at three different locations, i.e. the left,
middle, and right of micro channels. Figure 3.17 shows that, at 250 MPa working
pressures, in-plate height variations of three different locations (the left, middle, and
right of micro channels) in three replications were 2.4%, 3.5%, and 1.8%, respectively.
Besides, the average channel heights in each location were 0.292, 0.287, 0.284 mm,
the deviation of which was approximately 2.7%. Thus, from these experiment results,
the micro channels formed by this developed high-pressure hydroforming technique
had great uniformity.
Figure 3.17: Height variations in three different locations of micro channels.
33
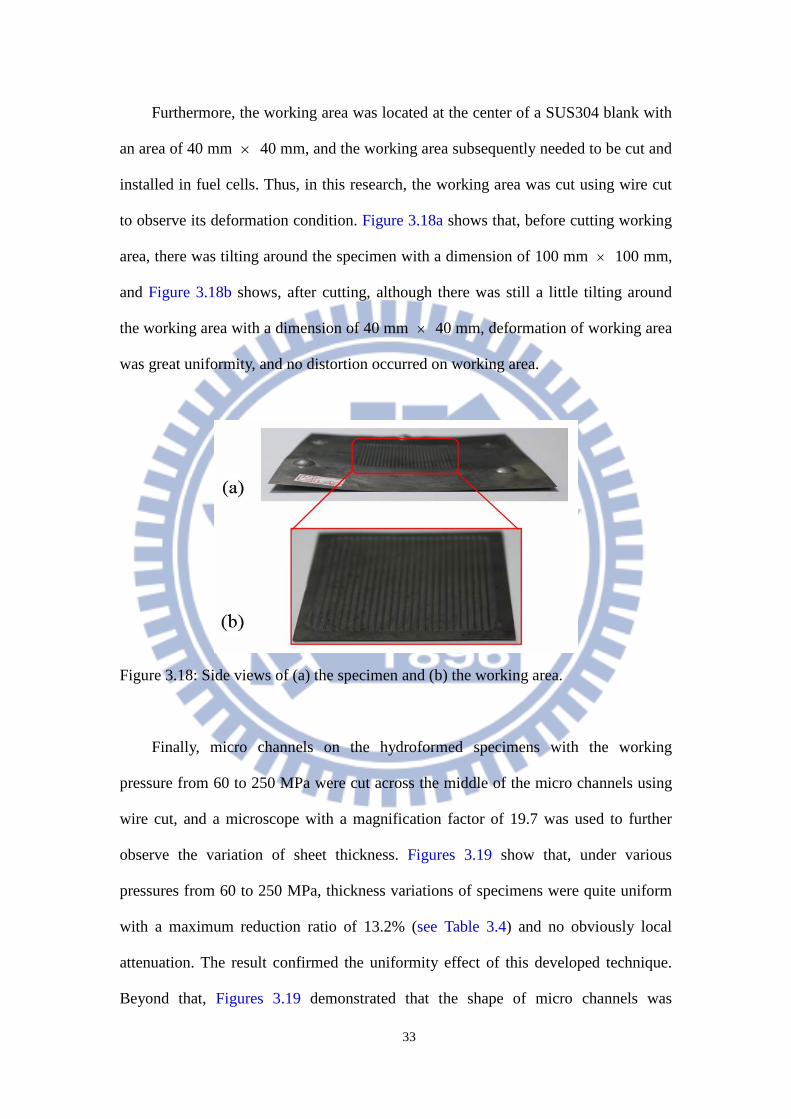
Furthermore, the working area was located at the center of a SUS304 blank with
an area of 40 mm × 40 mm, and the working area subsequently needed to be cut and
installed in fuel cells. Thus, in this research, the working area was cut using wire cut
to observe its deformation condition. Figure 3.18a shows that, before cutting working
area, there was tilting around the specimen with a dimension of 100 mm × 100 mm,
and Figure 3.18b shows, after cutting, although there was still a little tilting around
the working area with a dimension of 40 mm × 40 mm, deformation of working area
was great uniformity, and no distortion occurred on working area.
Figure 3.18: Side views of (a) the specimen and (b) the working area.
Finally, micro channels on the hydroformed specimens with the working
pressure from 60 to 250 MPa were cut across the middle of the micro channels using
wire cut, and a microscope with a magnification factor of 19.7 was used to further
observe the variation of sheet thickness. Figures 3.19 show that, under various
pressures from 60 to 250 MPa, thickness variations of specimens were quite uniform
with a maximum reduction ratio of 13.2% (see Table 3.4) and no obviously local
attenuation. The result confirmed the uniformity effect of this developed technique.
Beyond that, Figures 3.19 demonstrated that the shape of micro channels was
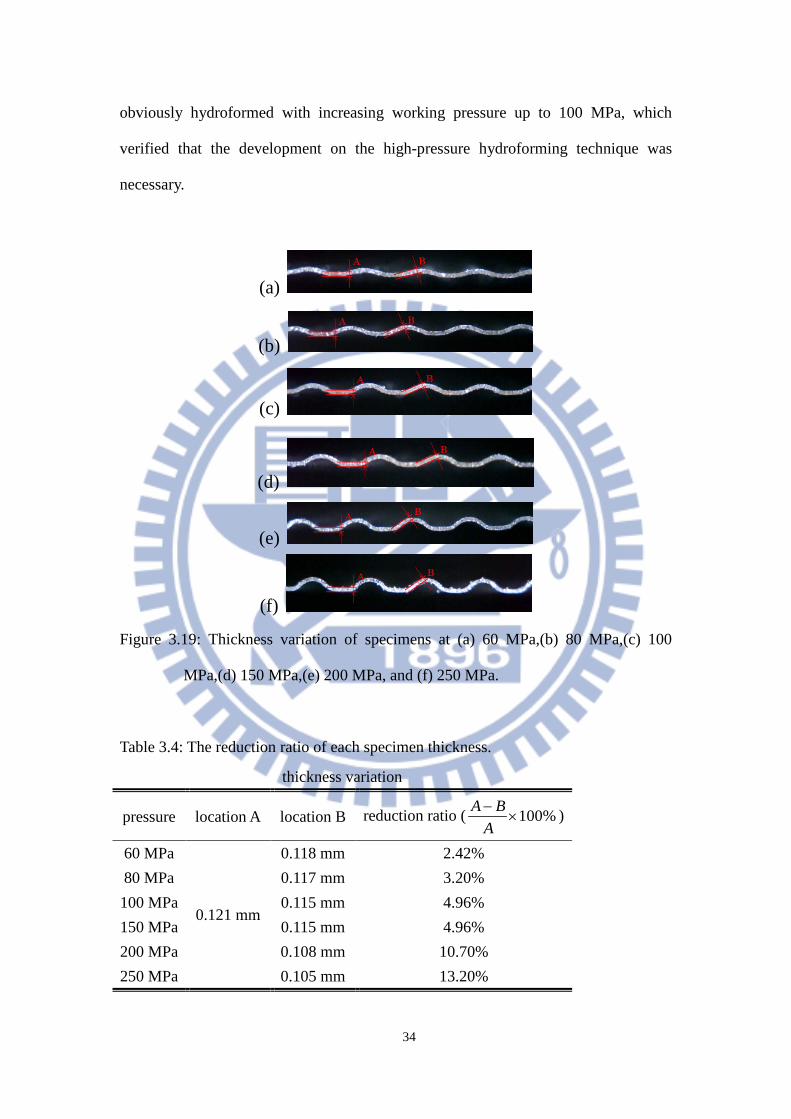
34
obviously hydroformed with increasing working pressure up to 100 MPa, which
verified that the development on the high-pressure hydroforming technique was
necessary.
(a)
(b)
(c)
(d)
(e)
(f)
Figure 3.19: Thickness variation of specimens at (a) 60 MPa,(b) 80 MPa,(c) 100
MPa,(d) 150 MPa,(e) 200 MPa, and (f) 250 MPa.
Table 3.4: The reduction ratio of each specimen thickness.
thickness variation
pressure location A location B reduction ratio ( %100×−A
BA )
60 MPa
0.121 mm
0.118 mm 2.42% 80 MPa 0.117 mm 3.20%
100 MPa 0.115 mm 4.96% 150 MPa 0.115 mm 4.96% 200 MPa 0.108 mm 10.70% 250 MPa 0.105 mm 13.20%
35
*Land area means the distance between channels
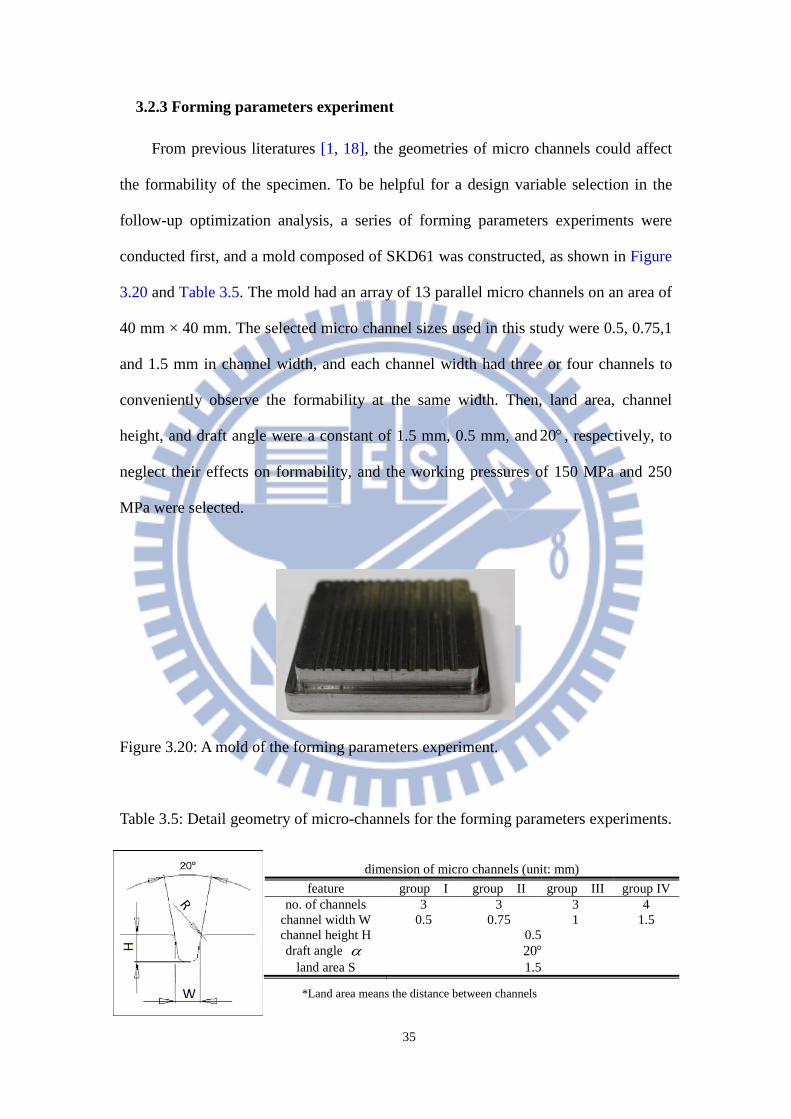
3.2.3 Forming parameters experiment
From previous literatures [1, 18], the geometries of micro channels could affect
the formability of the specimen. To be helpful for a design variable selection in the
follow-up optimization analysis, a series of forming parameters experiments were
conducted first, and a mold composed of SKD61 was constructed, as shown in Figure
3.20 and Table 3.5. The mold had an array of 13 parallel micro channels on an area of
40 mm × 40 mm. The selected micro channel sizes used in this study were 0.5, 0.75,1
and 1.5 mm in channel width, and each channel width had three or four channels to
conveniently observe the formability at the same width. Then, land area, channel
height, and draft angle were a constant of 1.5 mm, 0.5 mm, and °20 , respectively, to
neglect their effects on formability, and the working pressures of 150 MPa and 250
MPa were selected.
Figure 3.20: A mold of the forming parameters experiment.
Table 3.5: Detail geometry of micro-channels for the forming parameters experiments.
dimension of micro channels (unit: mm) feature group I group II group III group IV
no. of channels 3 3 3 4 channel width W 0.5 0.75 1 1.5 channel height H 0.5 draft angle α °20
land area S 1.5
36
The experiment result (see Table 3.6 and Figure 3.21) demonstrated that, on the
effect of channel widths on the mold, when channel widths increased 3 times, from
0.5 mm to 1.5 mm, the formed channel aspect ratio between group I and group IV was
promoted by 26.70% at 150 MPa, and the formed channel aspect ratio was improved
by 27.81% at 250 MPa. On the other hand, on the effect of forming pressure, when
forming pressure increased 1.67 times, from 150 to 250 MPa, the formed aspect ratio
was promoted by 15.60%, 5.51%, 5.14%, and 16.89% at group I, II, III, IV
respectively. The great improvement of formed channel aspect ratio occurred at group
I and group IV because those channels were located on the edges of the mold and
were less limit on material flow at higher fluid pressure.
To further observe the effects between the channel width on the mold and
forming pressure, the results of group II and group III were observed, the channel
width on the mold of which increased 1.33 times. The formed channel aspect ratio
was promoted by 7.08% at 150 MPa, and the formed channel aspect ratio was
improved by 6.72% at 250 MPa. From these results, channel width on a mold and
forming pressure could obviously affect the formed channel aspect ratio on specimens,
and the effect of channel widths on the mold with the improvement of formed channel
aspect of 6.72% and 7.08% was greater than that in forming pressure with the
improvement of 5.14% and 5.51%.
Table 3.6: A comparison of experiment results at 150 and 250 MPa.
hydroformed channel aspect ratio group I group II group III group IV
channel width on a mold 0.5 mm 0.75 mm 1 mm 1.5 mm 150 MPa 0.184 0.223 0.240 0.251 250 MPa 0.218 0.236 0.253 0.302

37
Figure 3.21: A comparison of experiment results at 150 and 250 MPa.
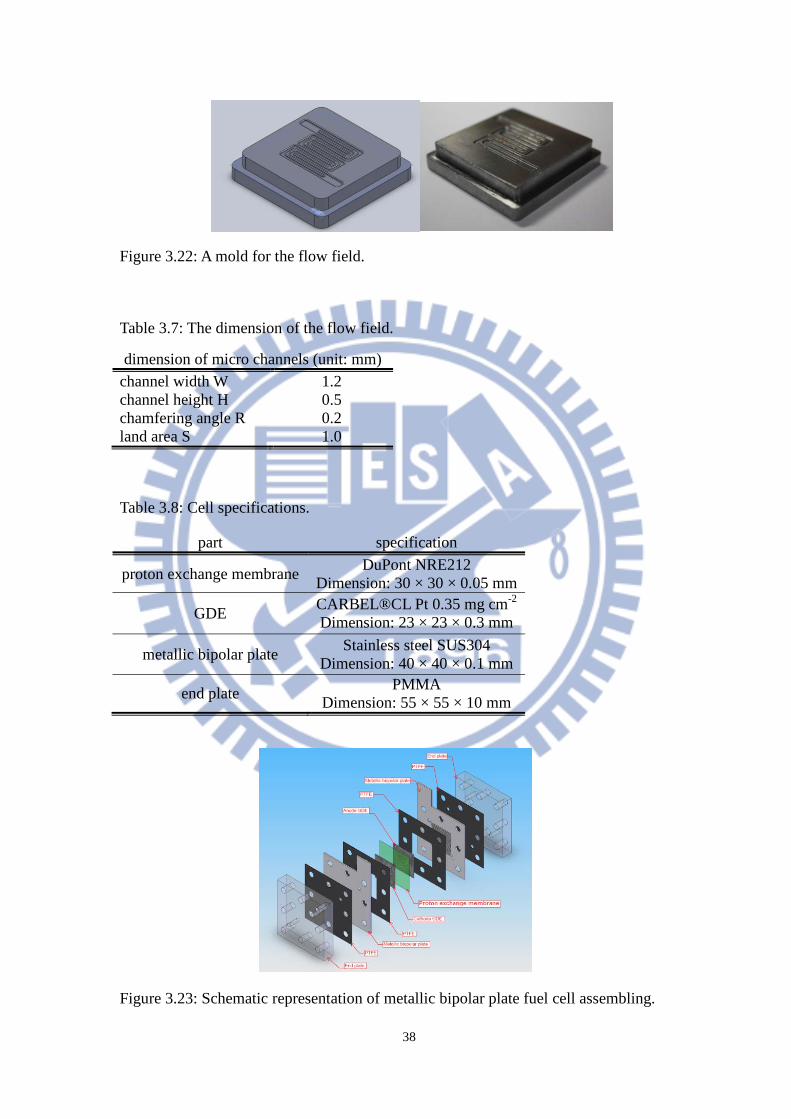
3.3 Preliminary fuel cell performance test
To further make sure the feasibility of hydroformed specimens applied in fuel
cells, two pairs of metallic bipolar plates were performed using working pressure of
150 MPa and 250 MPa respectively, and then a fuel cell with a pair of metallic bipolar
plate was assembled to test its preliminary cell performance. The flow field design
referred to that in Liu’s research [15-16], and the selected micro channel sizes were
1.2, 0.5, and 1.0 mm in channel width, channel height, and land area, respectively, as
shown in Figure 3.22 and Table 3.7. Measuring equipment, TEI-P300-1AB2CS, was
utilized, and the cell specifications are shown in Table 3.8. The cell was fabricated
with an end plate, gasket, bipolar plate, gasket, electrode, and proton exchange
membrane in turn, as shown in Figure 3.23.
0
0.05
0.1
0.15
0.2
0.25
0.3
0.35
groupⅠ group Ⅱ group Ⅲ group Ⅳ
aspe
ct r
atio
150 MPa
250 MPa
38
Figure 3.22: A mold for the flow field.
Table 3.7: The dimension of the flow field.
Table 3.8: Cell specifications.
Figure 3.23: Schematic representation of metallic bipolar plate fuel cell assembling.
dimension of micro channels (unit: mm) channel width W 1.2 channel height H 0.5 chamfering angle R 0.2 land area S 1.0
part specification
proton exchange membrane DuPont NRE212 Dimension: 30 × 30 × 0.05 mm
GDE CARBEL®CL Pt 0.35 mg cm-2 Dimension: 23 × 23 × 0.3 mm
metallic bipolar plate Stainless steel SUS304 Dimension: 40 × 40 × 0.1 mm
end plate PMMA Dimension: 55 × 55 × 10 mm
39
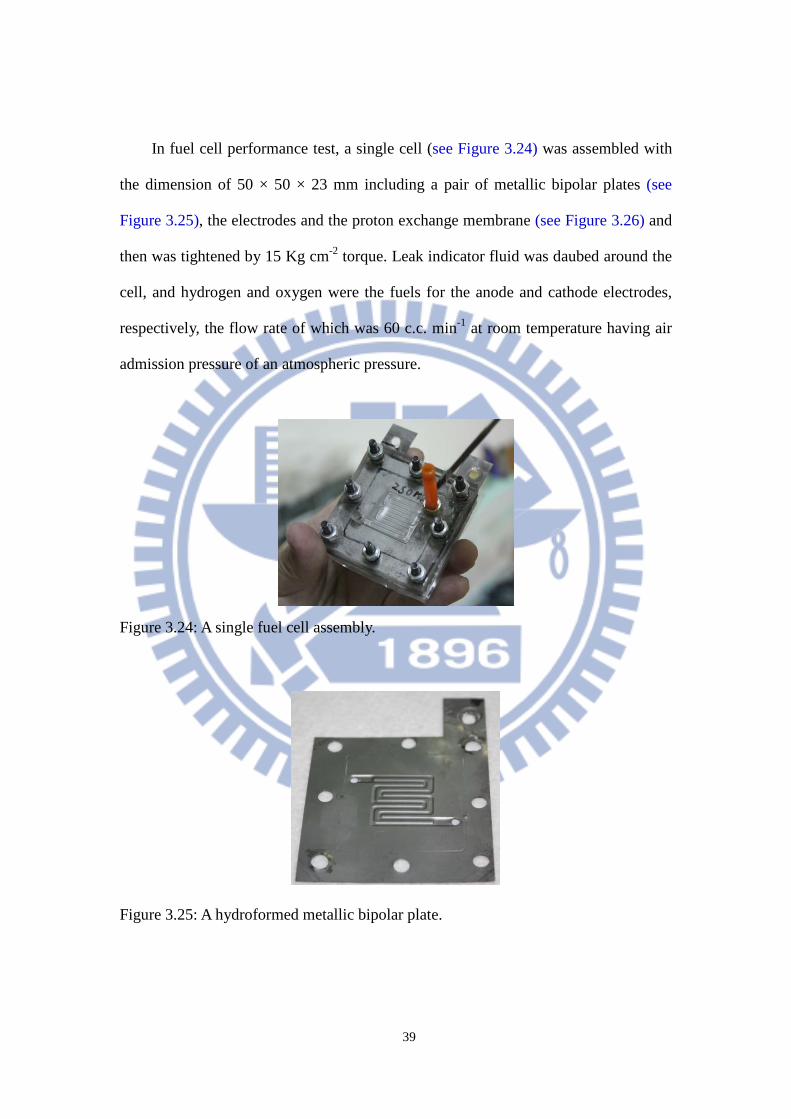
In fuel cell performance test, a single cell (see Figure 3.24) was assembled with
the dimension of 50 × 50 × 23 mm including a pair of metallic bipolar plates (see
Figure 3.25), the electrodes and the proton exchange membrane (see Figure 3.26) and
then was tightened by 15 Kg cm-2 torque. Leak indicator fluid was daubed around the
cell, and hydrogen and oxygen were the fuels for the anode and cathode electrodes,
respectively, the flow rate of which was 60 c.c. min-1 at room temperature having air
admission pressure of an atmospheric pressure.
Figure 3.24: A single fuel cell assembly.
Figure 3.25: A hydroformed metallic bipolar plate.
40
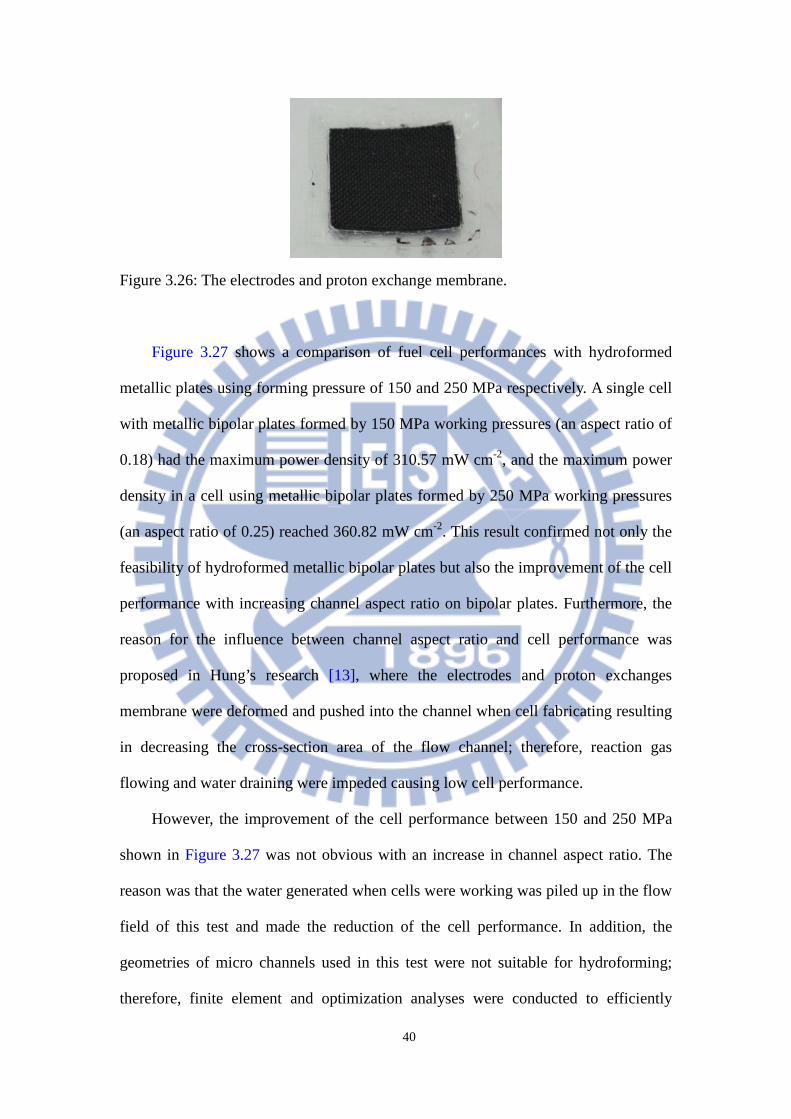
Figure 3.26: The electrodes and proton exchange membrane.
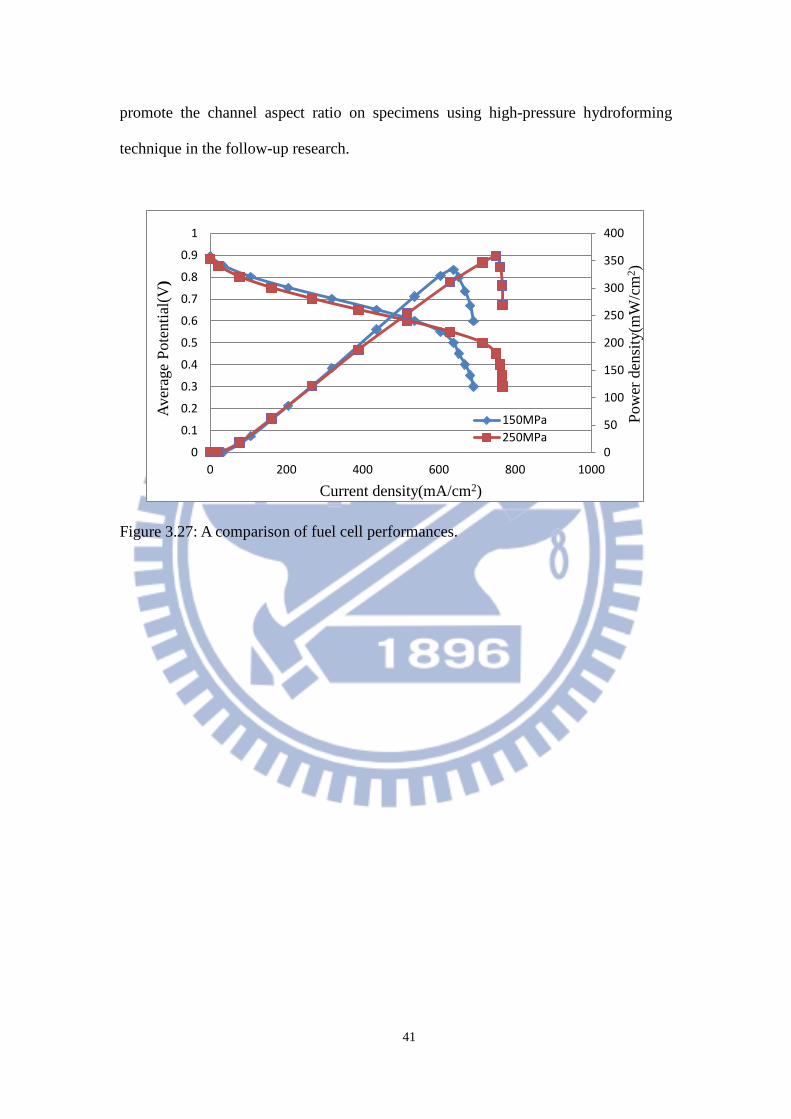
Figure 3.27 shows a comparison of fuel cell performances with hydroformed
metallic plates using forming pressure of 150 and 250 MPa respectively. A single cell
with metallic bipolar plates formed by 150 MPa working pressures (an aspect ratio of
0.18) had the maximum power density of 310.57 mW cm-2, and the maximum power
density in a cell using metallic bipolar plates formed by 250 MPa working pressures
(an aspect ratio of 0.25) reached 360.82 mW cm-2. This result confirmed not only the
feasibility of hydroformed metallic bipolar plates but also the improvement of the cell
performance with increasing channel aspect ratio on bipolar plates. Furthermore, the
reason for the influence between channel aspect ratio and cell performance was
proposed in Hung’s research [13], where the electrodes and proton exchanges
membrane were deformed and pushed into the channel when cell fabricating resulting
in decreasing the cross-section area of the flow channel; therefore, reaction gas
flowing and water draining were impeded causing low cell performance.
However, the improvement of the cell performance between 150 and 250 MPa
shown in Figure 3.27 was not obvious with an increase in channel aspect ratio. The
reason was that the water generated when cells were working was piled up in the flow
field of this test and made the reduction of the cell performance. In addition, the
geometries of micro channels used in this test were not suitable for hydroforming;
therefore, finite element and optimization analyses were conducted to efficiently
41
promote the channel aspect ratio on specimens using high-pressure hydroforming
technique in the follow-up research.
Figure 3.27: A comparison of fuel cell performances.
0
50
100
150
200
250
300
350
400
0
0.1
0.2
0.3
0.4
0.5
0.6
0.7
0.8
0.9
1
0 200 400 600 800 1000
Aver
age
Pote
ntia
l(V)
Current density(mA/cm2)
150MPa250MPa
Pow
er d
ensi
ty(m
W/c
m2 )
42
4. CHAPTER 4 NUMERICAL INVESTIGATIONS OF THE
HIGH-PRESSURE HYDROFORMING TECHNIQUE
To reveal the full capability of this developed apparatus, finite element analysis
software was used to analyze the hydroforming process, and the optimization software
subsequently predicted the possibly optimal aspect ratio of micro-flow channels using
the verified finite element model. In the end, the verification experiment of the
optimization analysis was conducted to confirm the precision of the optimization
analysis. Thus, a complete high-pressure hydroforming technique was developed.
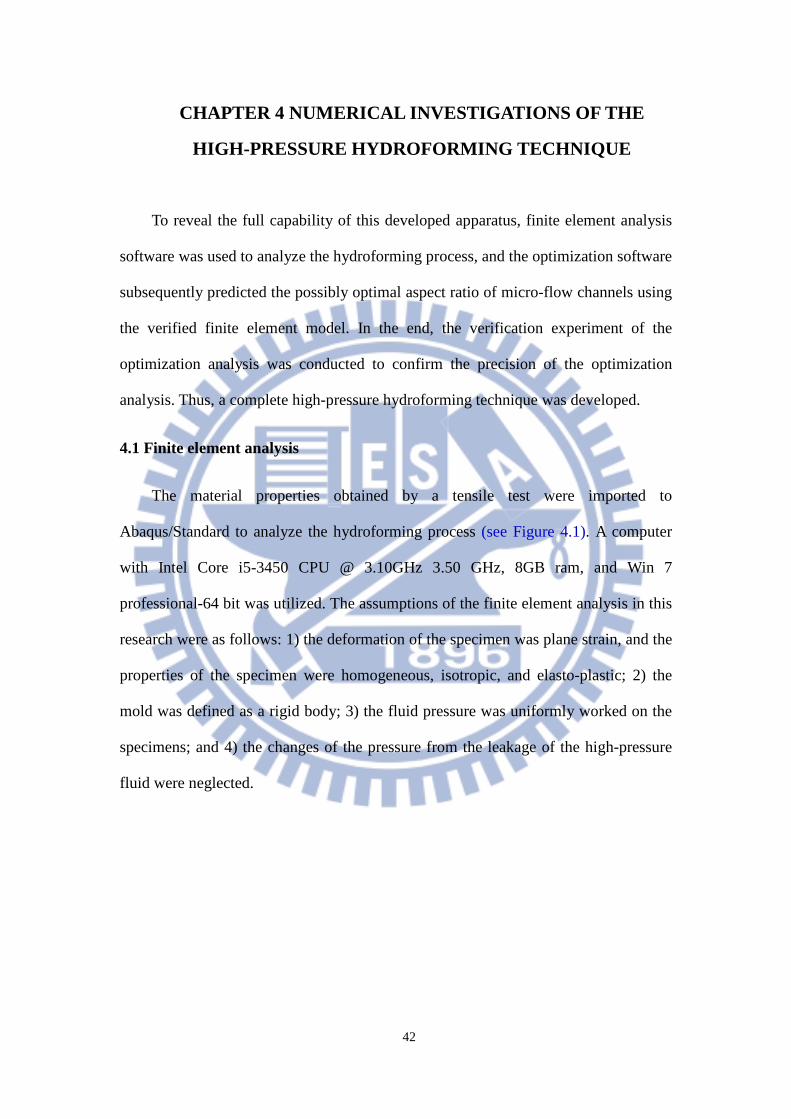
4.1 Finite element analysis
The material properties obtained by a tensile test were imported to
Abaqus/Standard to analyze the hydroforming process (see Figure 4.1). A computer
with Intel Core i5-3450 CPU @ 3.10GHz 3.50 GHz, 8GB ram, and Win 7
professional-64 bit was utilized. The assumptions of the finite element analysis in this
research were as follows: 1) the deformation of the specimen was plane strain, and the
properties of the specimen were homogeneous, isotropic, and elasto-plastic; 2) the
mold was defined as a rigid body; 3) the fluid pressure was uniformly worked on the
specimens; and 4) the changes of the pressure from the leakage of the high-pressure
fluid were neglected.
43
Figure 4.1: Schematic of the position of molds and specimen.
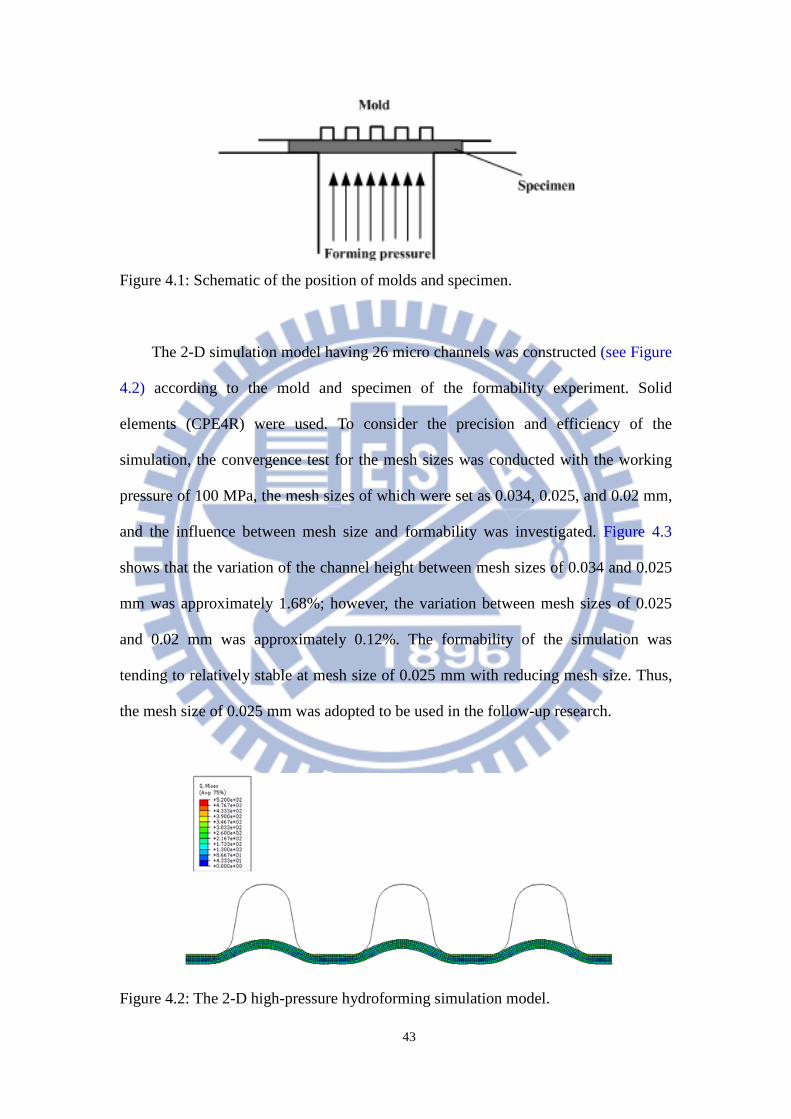
The 2-D simulation model having 26 micro channels was constructed (see Figure
4.2) according to the mold and specimen of the formability experiment. Solid
elements (CPE4R) were used. To consider the precision and efficiency of the
simulation, the convergence test for the mesh sizes was conducted with the working
pressure of 100 MPa, the mesh sizes of which were set as 0.034, 0.025, and 0.02 mm,
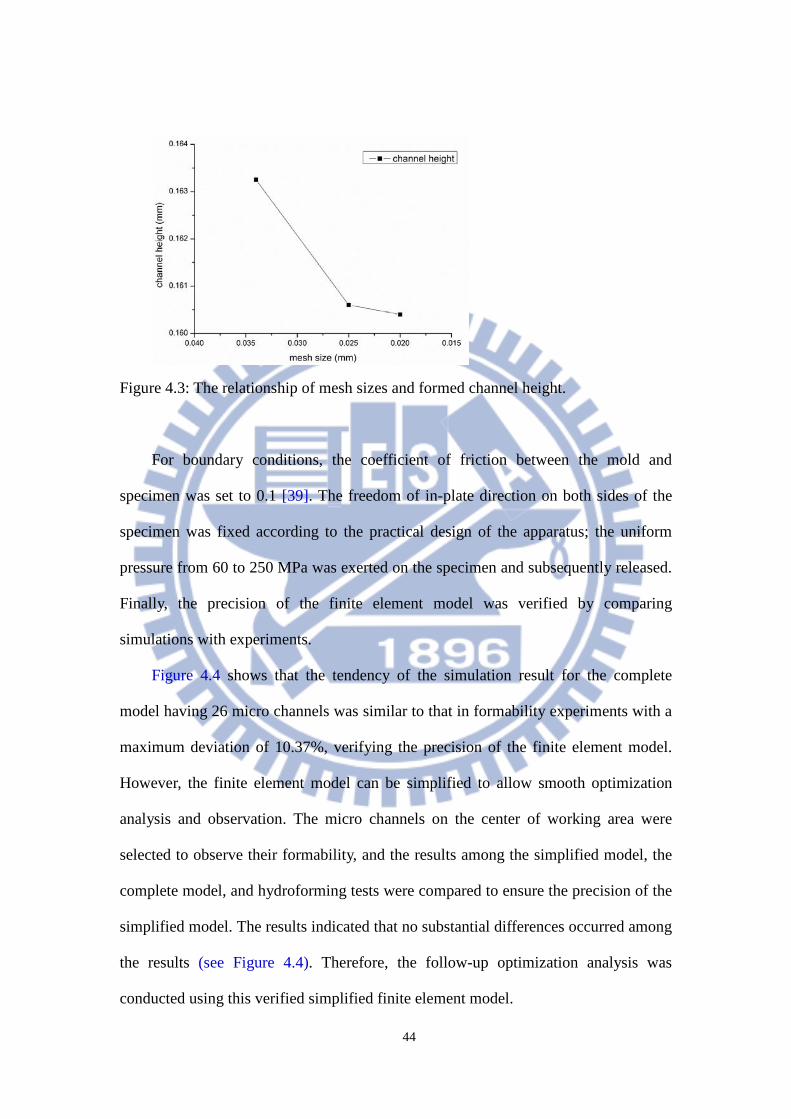
and the influence between mesh size and formability was investigated. Figure 4.3
shows that the variation of the channel height between mesh sizes of 0.034 and 0.025
mm was approximately 1.68%; however, the variation between mesh sizes of 0.025
and 0.02 mm was approximately 0.12%. The formability of the simulation was
tending to relatively stable at mesh size of 0.025 mm with reducing mesh size. Thus,
the mesh size of 0.025 mm was adopted to be used in the follow-up research.
Figure 4.2: The 2-D high-pressure hydroforming simulation model.
44
Figure 4.3: The relationship of mesh sizes and formed channel height.
For boundary conditions, the coefficient of friction between the mold and
specimen was set to 0.1 [39]. The freedom of in-plate direction on both sides of the
specimen was fixed according to the practical design of the apparatus; the uniform
pressure from 60 to 250 MPa was exerted on the specimen and subsequently released.
Finally, the precision of the finite element model was verified by comparing
simulations with experiments.
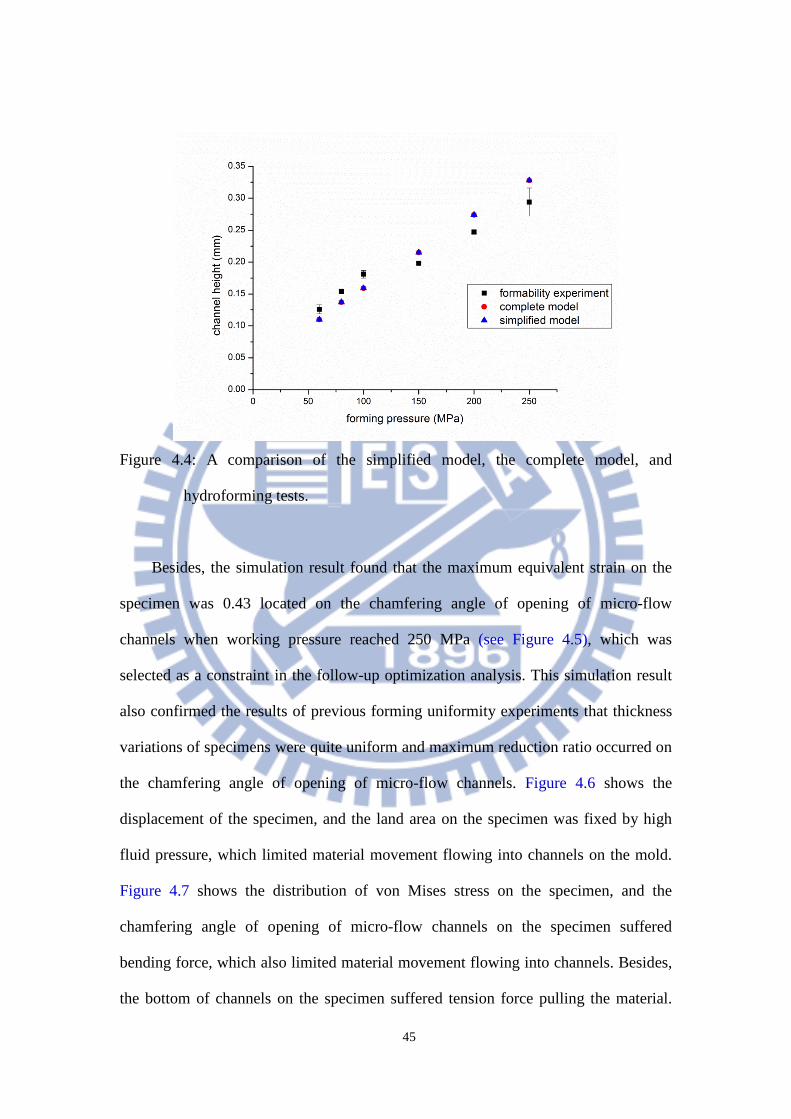
Figure 4.4 shows that the tendency of the simulation result for the complete
model having 26 micro channels was similar to that in formability experiments with a
maximum deviation of 10.37%, verifying the precision of the finite element model.
However, the finite element model can be simplified to allow smooth optimization
analysis and observation. The micro channels on the center of working area were
selected to observe their formability, and the results among the simplified model, the
complete model, and hydroforming tests were compared to ensure the precision of the
simplified model. The results indicated that no substantial differences occurred among
the results (see Figure 4.4). Therefore, the follow-up optimization analysis was
conducted using this verified simplified finite element model.
45
Figure 4.4: A comparison of the simplified model, the complete model, and
hydroforming tests.
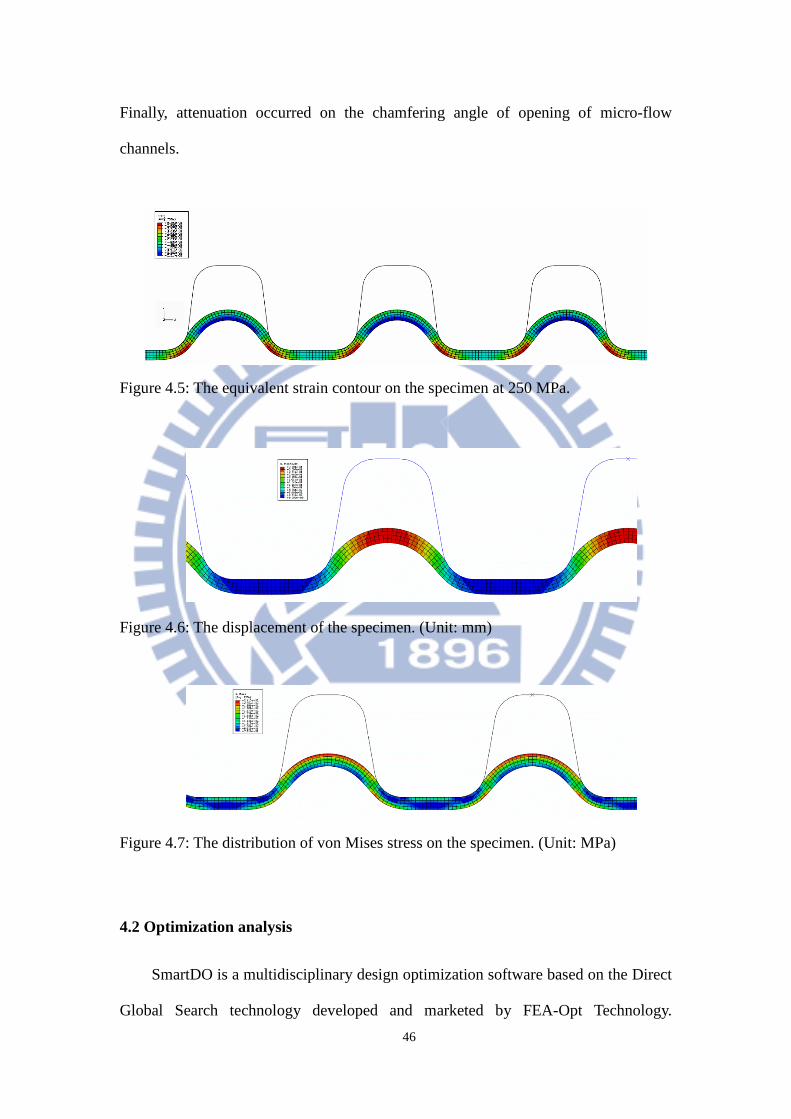
Besides, the simulation result found that the maximum equivalent strain on the
specimen was 0.43 located on the chamfering angle of opening of micro-flow
channels when working pressure reached 250 MPa (see Figure 4.5), which was
selected as a constraint in the follow-up optimization analysis. This simulation result
also confirmed the results of previous forming uniformity experiments that thickness
variations of specimens were quite uniform and maximum reduction ratio occurred on
the chamfering angle of opening of micro-flow channels. Figure 4.6 shows the
displacement of the specimen, and the land area on the specimen was fixed by high
fluid pressure, which limited material movement flowing into channels on the mold.
Figure 4.7 shows the distribution of von Mises stress on the specimen, and the
chamfering angle of opening of micro-flow channels on the specimen suffered
bending force, which also limited material movement flowing into channels. Besides,
the bottom of channels on the specimen suffered tension force pulling the material.
46
Finally, attenuation occurred on the chamfering angle of opening of micro-flow
channels.
Figure 4.5: The equivalent strain contour on the specimen at 250 MPa.
Figure 4.6: The displacement of the specimen. (Unit: mm)
Figure 4.7: The distribution of von Mises stress on the specimen. (Unit: MPa)
4.2 Optimization analysis
SmartDO is a multidisciplinary design optimization software based on the Direct
Global Search technology developed and marketed by FEA-Opt Technology.

47
SmartDO specialized in the CAE-Based optimization, such as CAE (computer-aided
engineering), FEA (finite element analysis), CAD (computer-aided design), CFD
(Computational fluid dynamics) andautomatic control, with application on various
physics phenomena. It is both GUI and scripting driven, allowed to be integrated with
almost any kind of CAD/CAE and in-house codes. SmartDO focuses on the direct
global optimization solver, which does not need much parametric study and tweaking
on the solver parameter. Because of this, SmartDO has been frequently customized as
the push-button expert system [40].
To fully reveal the capability of the experimental apparatus, the optimization
analysis was conducted in this research by modifying the dimension of micro-flow
channels on the mold to form the extreme high-aspect-ratio micro-flow channels.
SmartDO was connected to the finite element software, and the aspect ratio of
the micro-flow channels on formed specimens was chosen as the object function. In
preliminary formability tests, the working pressure of 250 MPa was successfully
exerted on the specimens. Simultaneously, the finite element analysis for 250 MPa
working pressures exerted on the specimens was conducted, and the result indicated
that the maximum equivalent strain on the specimen was 0.43 located on the
chamfering angle of the opening of micro channels. To avoid the rupture of the
specimen, the equivalent strain of the specimen was set to equal or below 0.43 as the
constraint. According to the related literature [39] and our practical experience, the
selection and the ranges of design variables were a channel width of 0.5–1.5 mm, a
land area of 0.5–1.5 mm, and a draft angle of °− 2014 , as shown in Table 4.1.

48
Table 4.1: The selections and the ranges of design variables.
Figure 4.8 shows the convergence curve for the optimization analysis, and Table
4.2 shows a comparison among the results of the formability experiments, the
optimization analysis, and Mahabunphachai’s research [17]. A group of possibly
optimal forming parameters obtained by the optimization analysis was 0.803 mm, 1.5
mm, and 14˚ in channel width, land area, and draft angle respectively, and 250 MPa
working pressures was offered. The predicted channel height might reach 0.415 mm
with an aspect ratio of 0.517, which was greater than the aspect ratio of 0.31 formed
by Mahabunphachai’s research [17] and the aspect ratio of 0.392 obtained by the
formability experiments of this research. Besides, the equivalent strain of the formed
specimen and the profile of the mold obtained by the optimization analysis are shown
in Figure 4.9. The maximum equivalent stain was 0.43, which was within the
constraint (the equivalent stain 0.43≤ ).
Figure 4.8: Convergence curve for the optimization analysis.
design variables range channel width W 0.5 –1.5 mm land area S 0.5 –1.5 mm draft angle α °− 2014
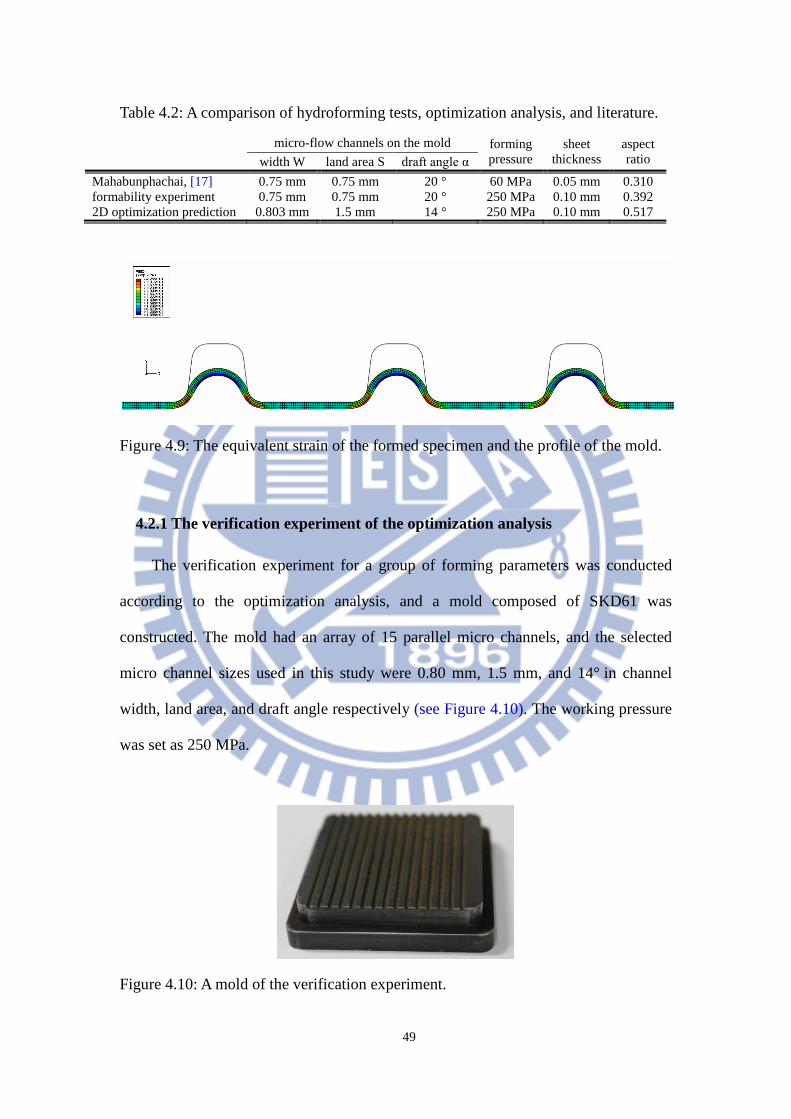
49
Table 4.2: A comparison of hydroforming tests, optimization analysis, and literature.
Figure 4.9: The equivalent strain of the formed specimen and the profile of the mold.
4.2.1 The verification experiment of the optimization analysis
The verification experiment for a group of forming parameters was conducted
according to the optimization analysis, and a mold composed of SKD61 was
constructed. The mold had an array of 15 parallel micro channels, and the selected
micro channel sizes used in this study were 0.80 mm, 1.5 mm, and 14° in channel
width, land area, and draft angle respectively (see Figure 4.10). The working pressure
was set as 250 MPa.
Figure 4.10: A mold of the verification experiment.
micro-flow channels on the mold forming pressure
sheet thickness
aspect ratio width W land area S draft angle α
Mahabunphachai, [17] 0.75 mm 0.75 mm 20 ° 60 MPa 0.05 mm 0.310 formability experiment 0.75 mm 0.75 mm 20 ° 250 MPa 0.10 mm 0.392 2D optimization prediction 0.803 mm 1.5 mm 14 ° 250 MPa 0.10 mm 0.517
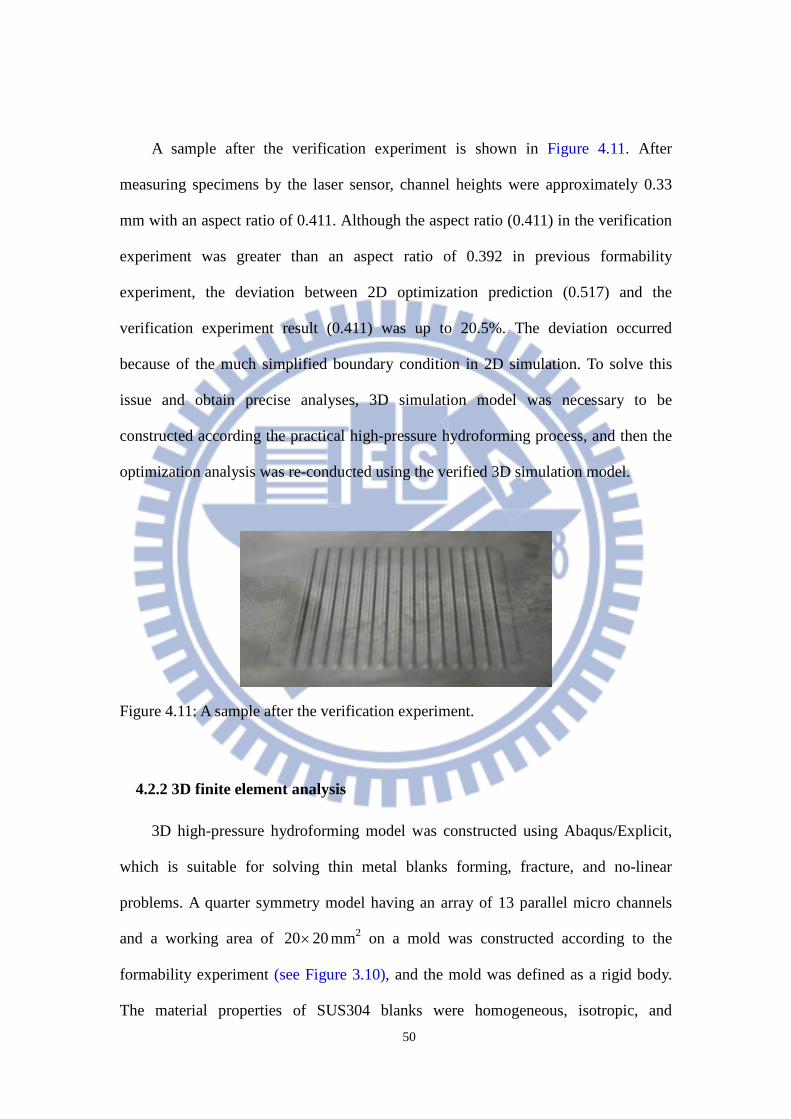
50
A sample after the verification experiment is shown in Figure 4.11. After
measuring specimens by the laser sensor, channel heights were approximately 0.33
mm with an aspect ratio of 0.411. Although the aspect ratio (0.411) in the verification
experiment was greater than an aspect ratio of 0.392 in previous formability
experiment, the deviation between 2D optimization prediction (0.517) and the
verification experiment result (0.411) was up to 20.5%. The deviation occurred
because of the much simplified boundary condition in 2D simulation. To solve this
issue and obtain precise analyses, 3D simulation model was necessary to be
constructed according the practical high-pressure hydroforming process, and then the
optimization analysis was re-conducted using the verified 3D simulation model.
Figure 4.11: A sample after the verification experiment.
4.2.2 3D finite element analysis
3D high-pressure hydroforming model was constructed using Abaqus/Explicit,
which is suitable for solving thin metal blanks forming, fracture, and no-linear
problems. A quarter symmetry model having an array of 13 parallel micro channels
and a working area of 2020× mm2 on a mold was constructed according to the
formability experiment (see Figure 3.10), and the mold was defined as a rigid body.
The material properties of SUS304 blanks were homogeneous, isotropic, and

51
elasto-plastic, and shell elements (S4R) were used. After the convergence test, the
mesh size of 0.1 mm was selected.
For boundary conditions, the coefficient of friction between the mold and
specimen was set to 0.1 [39]. The edges of the specimen were fixed according to the
practical design of the apparatus; various pressures from 60 to 250 MPa was exerted
on the specimen and subsequently released.
The simulation result (see Figure 4.12) shows that, at 250 MPa working pressure,
the channel height could reach 0.309 mm with an aspect ratio of 0.412. Compared
with the formability experiment result (an aspect ratio of 0.392), the deviation was
approximately 4.85%, verifying the precision of the simulation model. However, a
computational task of a quarter symmetry model was extremely heavy, spending more
than 9 hours. Thus, 3D simplified model having three channels with a length of 10
mm was constructed. The result (see Figure 4.13) found that the channel height
reached 0.307 mm with an aspect ratio of 0.408, which was similar to the result of a
quarter symmetry model with the deviation of 0.97%, and the computational time was
only one hour. Moreover, Figure 4.14 shows a comparison of pervious formability
experiment results and 3D simplified simulation results and confirms the precision of
3D simplified model.
Figure 4.12: The channel height for a quarter symmetry model. (Unit: mm)
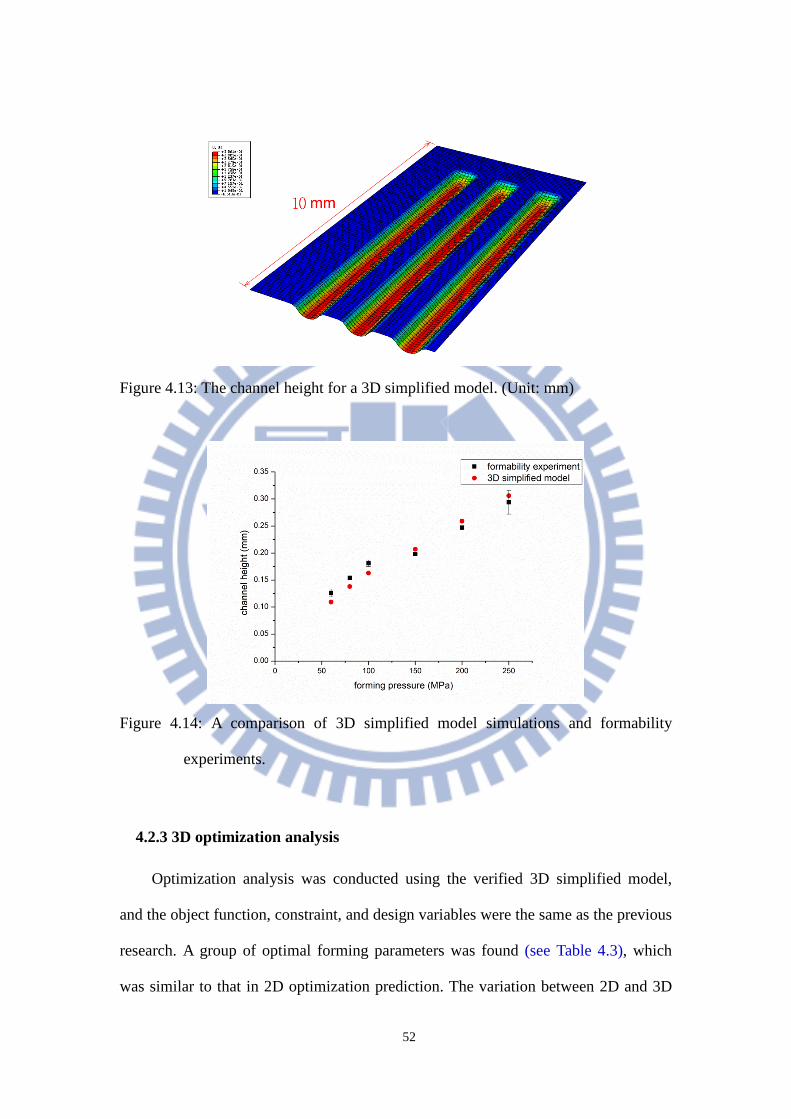
52
Figure 4.13: The channel height for a 3D simplified model. (Unit: mm)
Figure 4.14: A comparison of 3D simplified model simulations and formability
experiments.
4.2.3 3D optimization analysis
Optimization analysis was conducted using the verified 3D simplified model,
and the object function, constraint, and design variables were the same as the previous
research. A group of optimal forming parameters was found (see Table 4.3), which
was similar to that in 2D optimization prediction. The variation between 2D and 3D
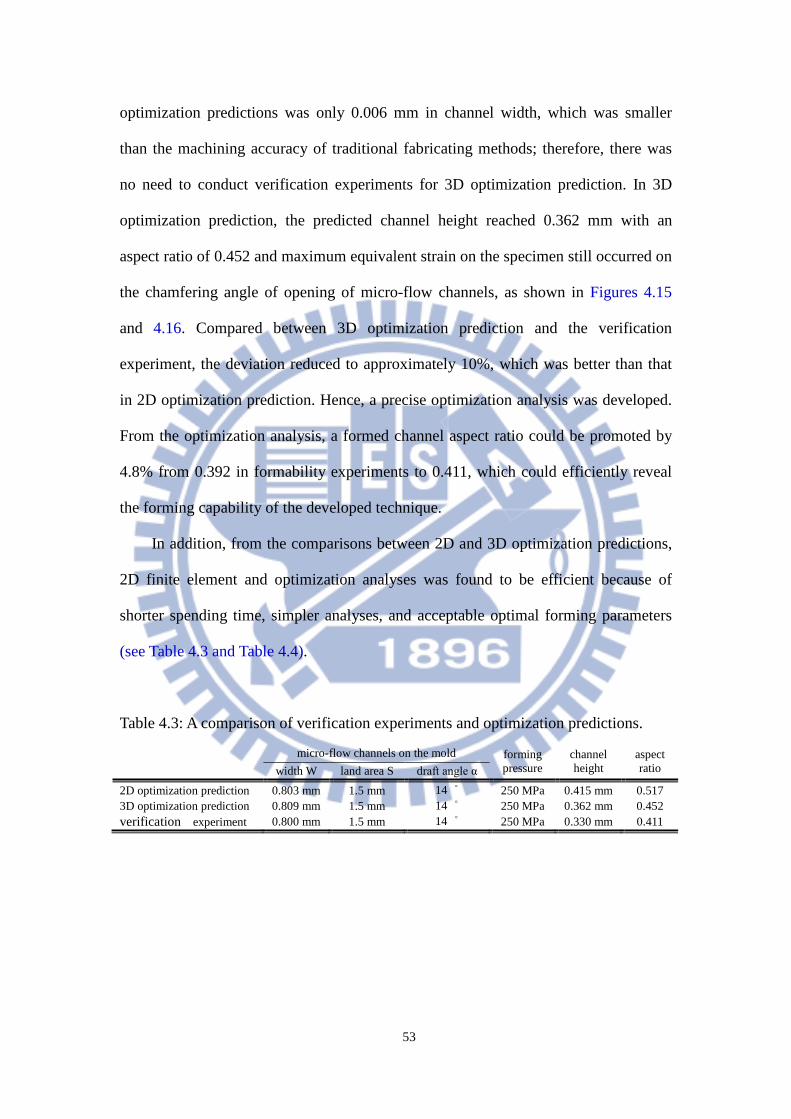
53
optimization predictions was only 0.006 mm in channel width, which was smaller
than the machining accuracy of traditional fabricating methods; therefore, there was
no need to conduct verification experiments for 3D optimization prediction. In 3D
optimization prediction, the predicted channel height reached 0.362 mm with an
aspect ratio of 0.452 and maximum equivalent strain on the specimen still occurred on
the chamfering angle of opening of micro-flow channels, as shown in Figures 4.15
and 4.16. Compared between 3D optimization prediction and the verification
experiment, the deviation reduced to approximately 10%, which was better than that
in 2D optimization prediction. Hence, a precise optimization analysis was developed.
From the optimization analysis, a formed channel aspect ratio could be promoted by
4.8% from 0.392 in formability experiments to 0.411, which could efficiently reveal
the forming capability of the developed technique.
In addition, from the comparisons between 2D and 3D optimization predictions,
2D finite element and optimization analyses was found to be efficient because of
shorter spending time, simpler analyses, and acceptable optimal forming parameters
(see Table 4.3 and Table 4.4).
Table 4.3: A comparison of verification experiments and optimization predictions.
micro-flow channels on the mold forming
pressure channel height
aspect ratio width W land area S draft angle α
2D optimization prediction 0.803 mm 1.5 mm 14 ° 250 MPa 0.415 mm 0.517 3D optimization prediction 0.809 mm 1.5 mm 14 ° 250 MPa 0.362 mm 0.452 verification experiment 0.800 mm 1.5 mm 14 ° 250 MPa 0.330 mm 0.411
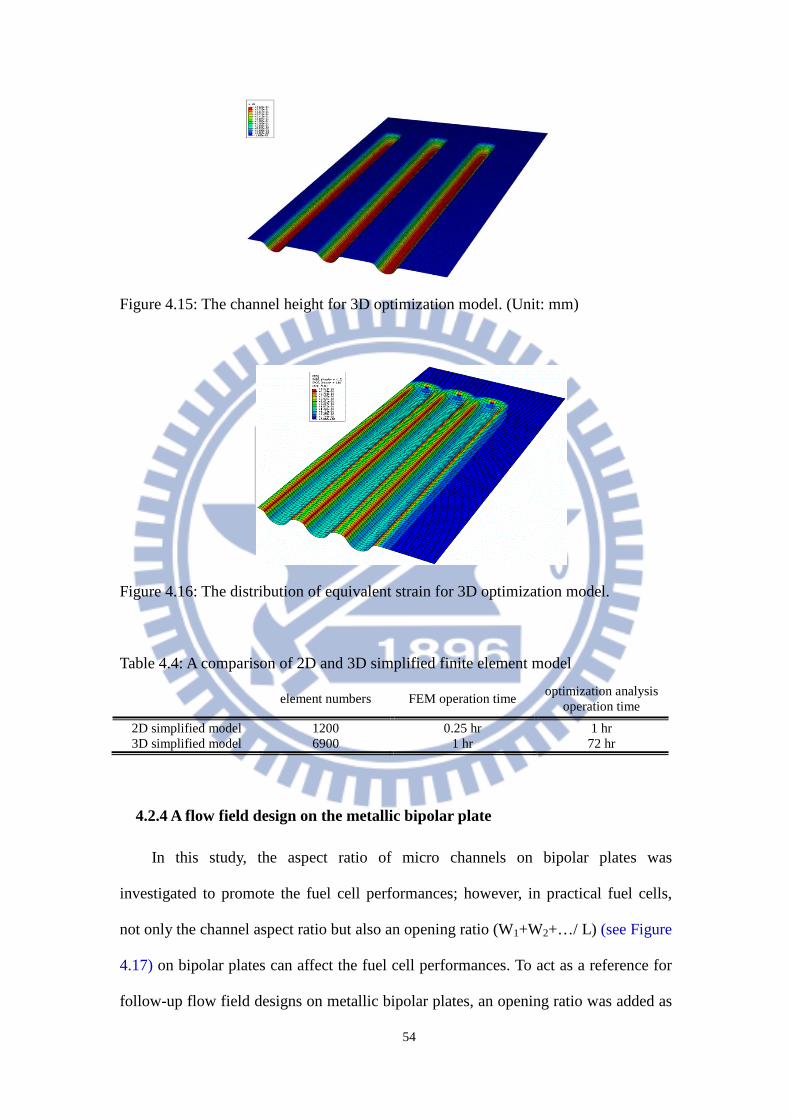
54
Figure 4.15: The channel height for 3D optimization model. (Unit: mm)
Figure 4.16: The distribution of equivalent strain for 3D optimization model.
Table 4.4: A comparison of 2D and 3D simplified finite element model
element numbers FEM operation time optimization analysis operation time
2D simplified model 1200 0.25 hr 1 hr 3D simplified model 6900 1 hr 72 hr
4.2.4 A flow field design on the metallic bipolar plate
In this study, the aspect ratio of micro channels on bipolar plates was
investigated to promote the fuel cell performances; however, in practical fuel cells,
not only the channel aspect ratio but also an opening ratio (W1+W2+…/ L) (see Figure
4.17) on bipolar plates can affect the fuel cell performances. To act as a reference for
follow-up flow field designs on metallic bipolar plates, an opening ratio was added as
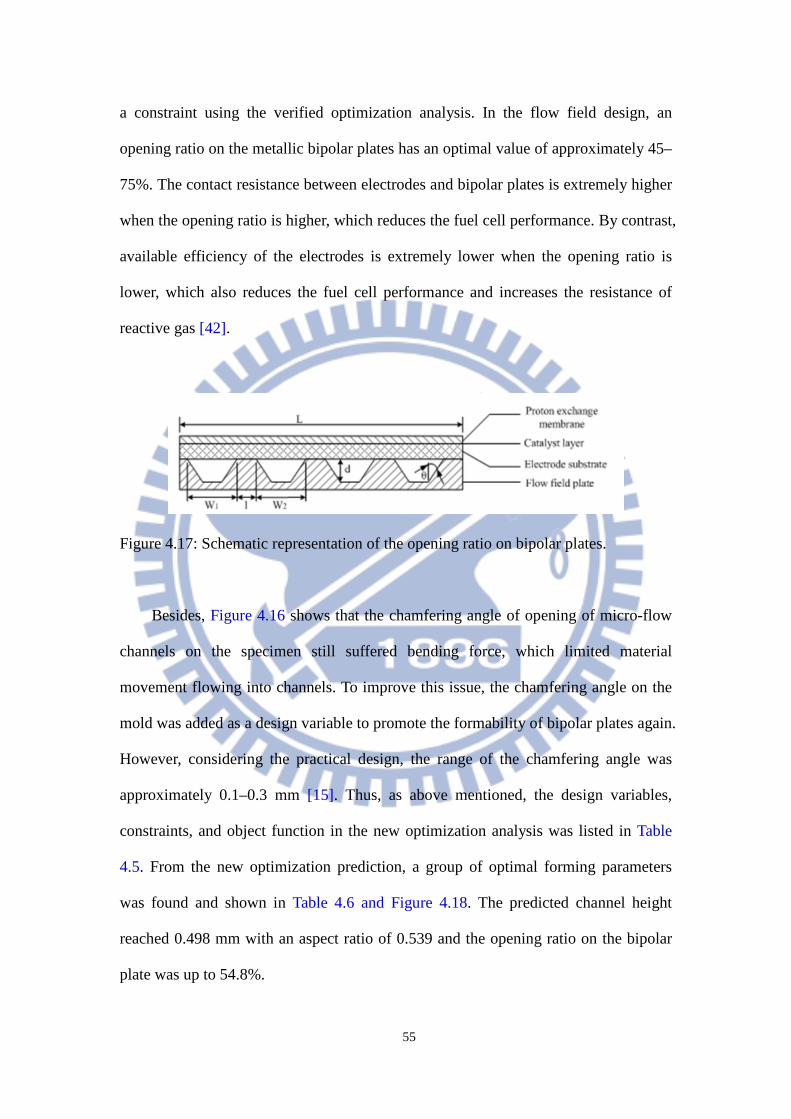
55
a constraint using the verified optimization analysis. In the flow field design, an
opening ratio on the metallic bipolar plates has an optimal value of approximately 45–
75%. The contact resistance between electrodes and bipolar plates is extremely higher
when the opening ratio is higher, which reduces the fuel cell performance. By contrast,
available efficiency of the electrodes is extremely lower when the opening ratio is
lower, which also reduces the fuel cell performance and increases the resistance of
reactive gas [42].
Figure 4.17: Schematic representation of the opening ratio on bipolar plates.
Besides, Figure 4.16 shows that the chamfering angle of opening of micro-flow
channels on the specimen still suffered bending force, which limited material
movement flowing into channels. To improve this issue, the chamfering angle on the
mold was added as a design variable to promote the formability of bipolar plates again.
However, considering the practical design, the range of the chamfering angle was
approximately 0.1–0.3 mm [15]. Thus, as above mentioned, the design variables,
constraints, and object function in the new optimization analysis was listed in Table
4.5. From the new optimization prediction, a group of optimal forming parameters
was found and shown in Table 4.6 and Figure 4.18. The predicted channel height
reached 0.498 mm with an aspect ratio of 0.539 and the opening ratio on the bipolar
plate was up to 54.8%.
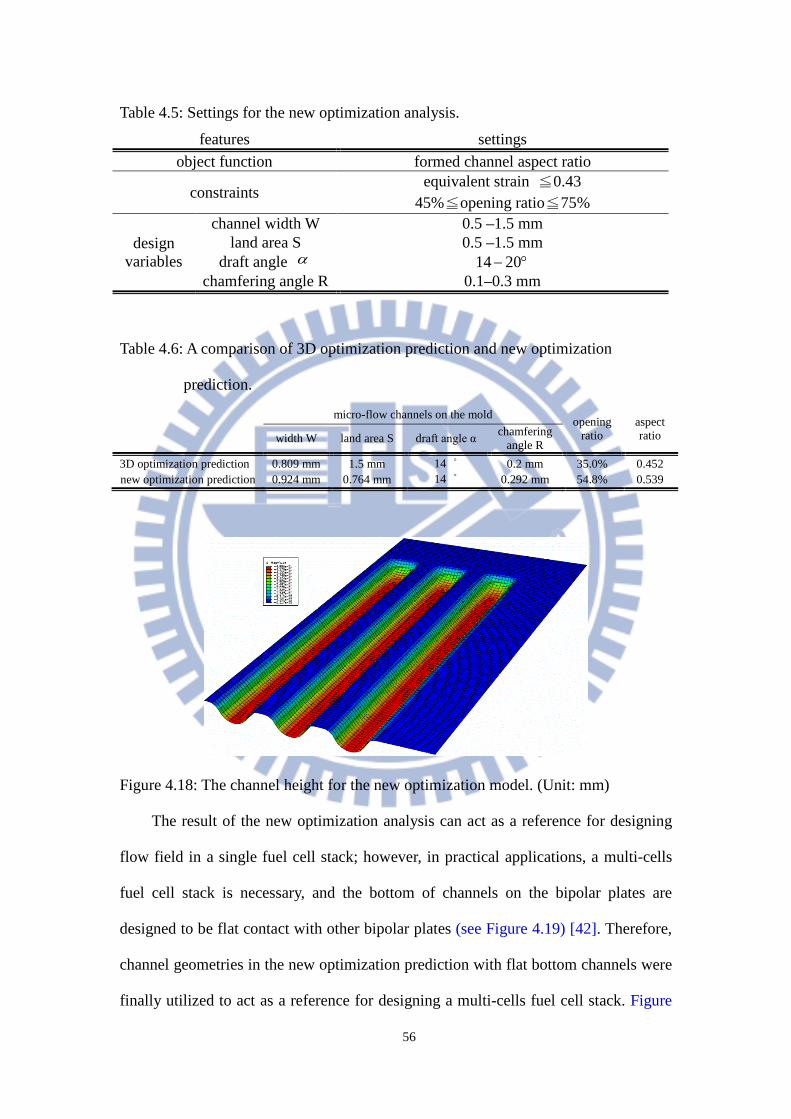
56
Table 4.5: Settings for the new optimization analysis.
features settings object function formed channel aspect ratio
constraints equivalent strain ≦0.43
45%≦opening ratio≦75%
design variables
channel width W 0.5 –1.5 mm land area S 0.5 –1.5 mm
draft angle α °− 2014 chamfering angle R 0.1–0.3 mm
Table 4.6: A comparison of 3D optimization prediction and new optimization
prediction.
Figure 4.18: The channel height for the new optimization model. (Unit: mm)
The result of the new optimization analysis can act as a reference for designing
flow field in a single fuel cell stack; however, in practical applications, a multi-cells
fuel cell stack is necessary, and the bottom of channels on the bipolar plates are
designed to be flat contact with other bipolar plates (see Figure 4.19) [42]. Therefore,
channel geometries in the new optimization prediction with flat bottom channels were
finally utilized to act as a reference for designing a multi-cells fuel cell stack. Figure
micro-flow channels on the mold opening
ratio aspect ratio width W land area S draft angle α chamfering
angle R 3D optimization prediction 0.809 mm 1.5 mm 14 ° 0.2 mm 35.0% 0.452 new optimization prediction 0.924 mm 0.764 mm 14 ° 0.292 mm 54.8% 0.539
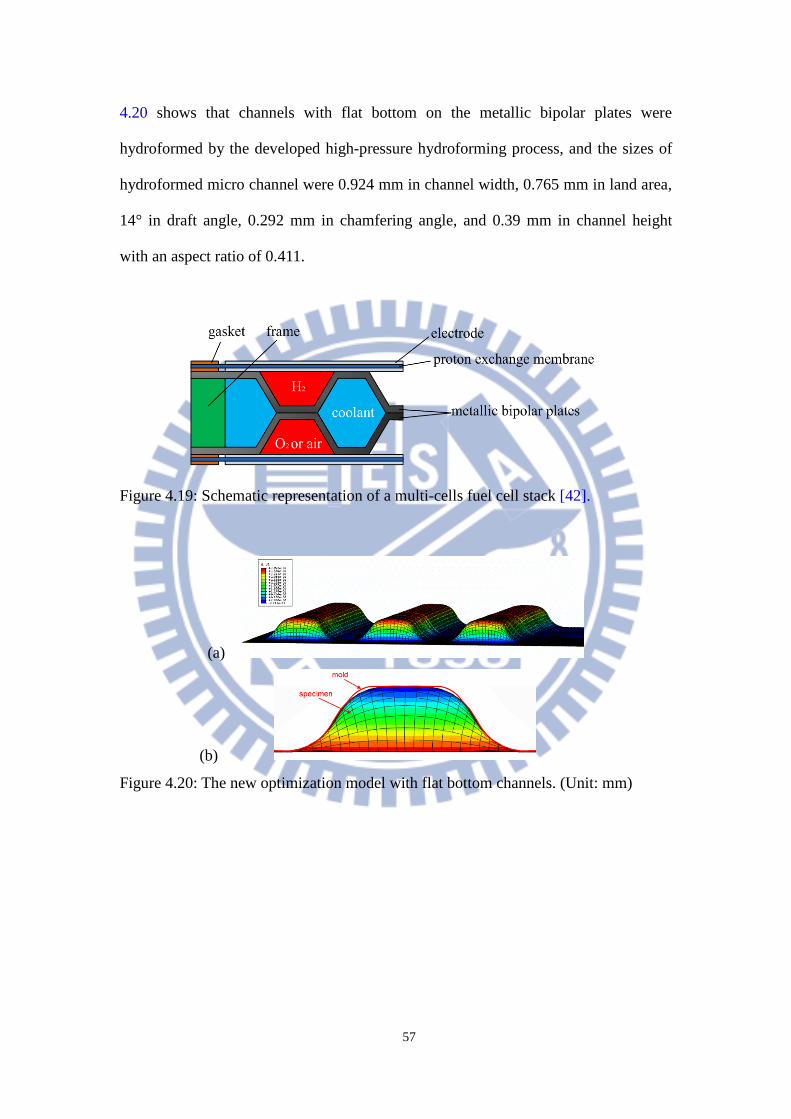
57
4.20 shows that channels with flat bottom on the metallic bipolar plates were
hydroformed by the developed high-pressure hydroforming process, and the sizes of
hydroformed micro channel were 0.924 mm in channel width, 0.765 mm in land area,
14° in draft angle, 0.292 mm in chamfering angle, and 0.39 mm in channel height
with an aspect ratio of 0.411.
Figure 4.19: Schematic representation of a multi-cells fuel cell stack [42].
(a)
(b)
Figure 4.20: The new optimization model with flat bottom channels. (Unit: mm)

58
5. CHAPTER 5 CONCLUSIONS AND FUTURE WORKS
5.1 Conclusions
In this study, an experimental hydroforming apparatus was designed, built, and
modified, with an emphasis on structural simplicity using commercially available
materials. A series of experiments was performed to verify the practicability of the
apparatus, and satisfactory testing results were obtained with information on the
material behavior under various hydrostatic pressures. Several conclusions in this
research are offered as follows:
1. The feasibility of this high-pressure hydroforming technique was verified; a
two-stage pressure increase structure, a high-pressure container with three tapered
layers, and special high-pressure seals were successfully designed and
preliminarily proven to safely provide a working pressure of 250 MPa. During the
process, the maximum dimensional variation of hydroformed channel heights was
approximately 7.48%; therefore, the process control and repeatability of the
micro-flow channel hydroforming were reasonably acceptable.
2. Fabrication of the 0.1-mm-thick metallic bipolar plates (SUS304) with the
hydroforming apparatus is feasible, and we successfully formed micro-flow
channels with an aspect ratio of 0.392. Compared with the maximum aspect ratio
of 0.31 formed by the traditional hydroforming process with 0.051 mm thickness
SUS304 blanks, the aspect ratio of micro-flow channels in this study was
improved by 26.5%, which enabled the fuel cells with metallic bipolar plates to
meet both performance and manufacturing requirements. Furthermore, this result
also proved that micro-flow channels with a high aspect ratio can be obtained by
increasing the forming pressure.

59
3. The uniformity experiments indicated that the hydroformed micro channels
structures were uniform, and no obviously local attenuation condition and no
distortion occurred on working area.
4. In the fuel cell performance test, this research confirmed not only the feasibility of
hydroformed metallic bipolar plates but also the improvement of the cell
performance with increasing channel aspect ratio on bipolar plates.
Simultaneously, to reveal the forming capability of the developed high-pressure
hydroforming apparatus, this research constructed the precise 2D and 3D finite
element and optimization analyses for this developed high-pressure hydroforming
process to attempt to obtain a group of optimal forming parameters and to form an
optimal aspect ratio of micro-flow channels on heat treated SUS304 specimens.
The feasibility of the optimization analysis was verified by the follow-up
verification experiment, which achieved the channel aspect ratio of 0.411. Compared
with the aspect ratio of 0.392 in previous formability experiments, the channel aspect
ratio was further increased by 4.8%.
In this research, the forming capability of the developed high-pressure
hydroforming technique was revealed through hydroforming experiment, finite
element and optimization analyses. Overall, this research developed a complete
high-pressure hydroforming technique, which can be applied in forming metallic
bipolar plates for portable PEMFCs.
5.2 Future works
1. In this research, the high-pressure hydroforming apparatus with a working area of
40 mm × 40 mm was successfully developed; however, to widely utilize this
high-pressure hydroforming technique, a testing apparatus with a large working
area should be further developed.
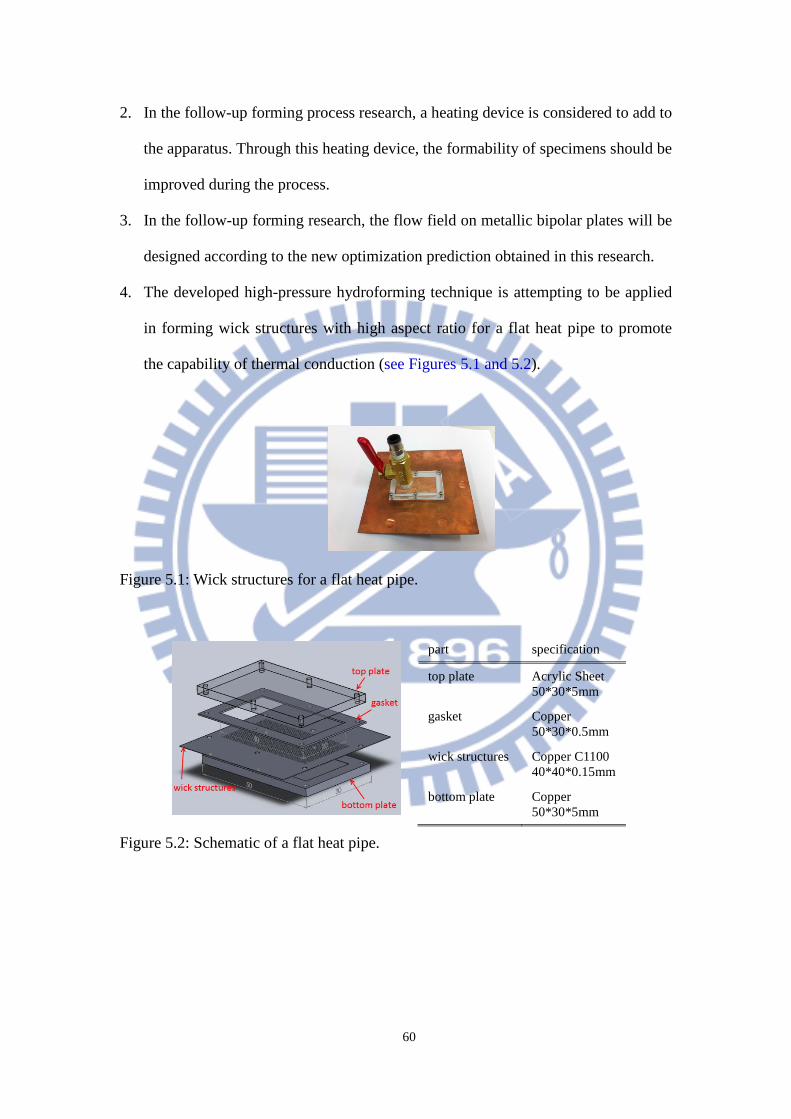
60
2. In the follow-up forming process research, a heating device is considered to add to
the apparatus. Through this heating device, the formability of specimens should be
improved during the process.
3. In the follow-up forming research, the flow field on metallic bipolar plates will be
designed according to the new optimization prediction obtained in this research.
4. The developed high-pressure hydroforming technique is attempting to be applied
in forming wick structures with high aspect ratio for a flat heat pipe to promote
the capability of thermal conduction (see Figures 5.1 and 5.2).
Figure 5.1: Wick structures for a flat heat pipe.
Figure 5.2: Schematic of a flat heat pipe.
part specification
top plate Acrylic Sheet 50*30*5mm
gasket Copper 50*30*0.5mm
wick structures Copper C1100 40*40*0.15mm
bottom plate Copper 50*30*5mm

61
REFERENCES
[1] M. Koc, S. Mahabunphachai," Feasibility investigations on a novel
micro-manufacturing process for fabrication of fuel cell bipolar plates: Internal
pressure-assisted embossing of micro-channels with in-die mechanical bonding,"
Journal of Power Sources 178(2007) 725-733.
[2] X. Li, I. Sabir," Review of bipolar plates in PEM fuel cells: Flow-field designs,"
Journal of Hydrogen Energy 30(2005) 359-371.
[3] E. Middelman, W. Kout, B. Vogelaar, J. Lenssen, E. D. Waal," Bipolar plates for
PEM fuel cells: A review," Journal of Power Sources 118(2003) 44–46.
[4] I. Bar-On, R. Kirchain, R. Roth," Technical cost analysis for PEM fuel cells,"
Journal of Power Sources 109(2002) 71-75.
[5] P. Costamagna, S. Srinivasan," Quantum jumps in the PEMFC science and
technology from the 1960s to the year 2000 Part I. Fundamental scientific
aspects," Journal of Power Sources 102(2001) 235-269.
[6] H. Tawfik, Y. Hung, D. Mahajan," Metal bipolar plates for PEM fuel cell-A
review," Journal of Power Sources 163(2007) 755-767.
[7] S. Mahabunphachai," A hybrid hydroforming and mechanical bonding process
for fuel cell bipolar plates," A dissertation of Doctor of Philosophy (Mechanical
Engineering), The University of Michigan, 2008.
[8] Taiwan Fuel Cell information website. http://www.tfci.org.tw.
[9] X. Li, I. Sabir," Review of bipolar plates in PEM fuel cells: Flow-field designs,"
Journal of Hydrogen Energy 30(2005) 359-371.
[10] E. Middelman, W. Kout, B. Vogelaar, J. Lenssen, E. D. Waal," Bipolar plates for
PEM fuel cells: A review," Journal of Power Sources 118(2003) 44–46.
[11] E. A. Cho, U. S. Jeon, H. Y. Ha, S. A. Hong, I. H. Oh," Characteristics of

62
composite bipolar plates for polymer. Electrolyte membrane fuel cells," Journal
of Power Sources 125(2004) 178–182.
[12] A. P. Manso, F. F. Marzo, M. G. Mujika, J. Barranco, A. Lorenzo," Numerical
analysis of the influence of the channel cross-section aspect ratio on the
performance of a PEM fuel cell with serpentine flow field design," Journal of
Hydrogen Energy 36(2011) 6795-6808.
[13] J. C. Hung, T. C. Yang, K. C. Li," Studies on the fabrication of metallic bipolar
plates—Using micro electrical discharge machining milling," Journal of Power
Sources 196(2011) 2070-2074.
[14] S. J. Lee, C. Y. Lee," Simulation and fabrication of micro-scaled flow channels
for metallic bipolar plates by the electrochemical micro-machining process,"
Journal of Power Sources 185(2008) 1115–1121.
[15] Y. Liu, L. Hu," Fabrication of metallic bipolar plate for proton exchange
membrane fuel cells by rubber pad forming," Journal of Power Sources
195(2010) 3529–3535.
[16] Y. Liu, L. Hua, J. Lan, X. Wei," Studies of the deformation styles of the
rubber-pad forming process used for manufacturing metallic bipolar plates,"
Journal of Power Sources 195(2010) 8177–8184.
[17] S. Mahabunphachai, O. N. Cora, M. Koc," Effect of manufacturing processes on
formability and surface topography of proton exchange membrane fuel cell
metallic bipolar plates," Journal of Power Sources 195(2010) 5269–5277.
[18] S. Mahabunphachai, M. Koc," Fabrication of micro-channel arrays on thin
metallic sheet using internal fluid pressure: Investigations on size effects and
development of design guidelines," Journal of Power Sources 175(2008) 363–
371.
[19] S. Masatoshi, N. Katsuyuki," Processing method, magnetic transfer method and

63
recording medium," Japan Patent, JP2003-157520 (2003).
[20] L. Olsson," Imprint method and device," United States Patent, US20030189273
(2003).
[21] J. J. Lee," Imprinting apparatus for forming pattern at uniform contact by
additional constant," World Intellectual Property Organization Patent,
WO2006135170 (2006).
[22] T. Ando, S. Komoriya, M. Ogino, C. Haginoya, A. Mitauchi," Imprinting device
and microstructure transfer method," United States Patent, US20060286193
(2006).
[23] J. C. Hung, C. H. Hung," uniform pressing apparatus for use in a micro-nano
imprint process," United States Patent, US7462029 (2008).
[24] A. Hermann, T. Chaudhuri, P. Spagnol," Bipolar plates for PEM fuel cells:A
review," Journal of Hydrogen Energy 30(2005) 1297-1302.
[25] B. Cunningham, D. G. Baird," The Development of Economical Bipolar Plates
for Fuel Cells," Journal of Material Chemistry 16(2006) 4385–4388.
[26] J. Wind, R. Spah, W. Kaiser, G. Boehm," Metallic bipolar plates for PEM. fuel
cells," Journal of Power Sources 105(2002) 256–260.
[27] J. P. Allen," Bipolar Separator and Current Collector Design and. Manufacture,"
2000 Fuel Cell Seminar Abstracts (2000) 55–58.
[28] M. C. Li, C. L. Zeng, S. Z. Luo, J. N. Shen, H. C. Lin, C. N. Cao,"
Electrochemical corrosion characteristics of type 316 stainless steel in simulated
anode environment for PEMFC," Electrochimica Acta 48(2003) 1735–1741.
[29] F. Dundar, E. Dur, S. Mahabunphachai, M. Koc," Corrosion resistance
characteristics of stamped and hydroformed proton exchange membrane fuel cell
metallic bipolar plates," Journal of Power Sources 195(2010) 3546–3552.
[30] J. C. Hung, C. Hung," The design and development of a hydrostatic extrusion

64
apparatus," Journal of Materials Processing Technology 104(2000) 226-235.
[31] S. Timoshenko," Strength of Materials, Part II," D. Van Nostrand Co., Princeton,
N. J., 1930.
[32] H. L. D. Pugh," Recent Developments in Cold Forming," Bullied Memorial
Lectures, Vol. III, University of Nottingham, 1965.
[33] S. J. Becker, L. Mollick," Theory of Ideal Design of a Compound Vessel," ASME.
Journal of Engineering for Industry, 1960.
[34] S. J. Becker," Analysis of a Yielded Compound Cylinder," ASME. Journal of
Engineering for Industry, 83(1961) 43.
[35] S. J. Becker," Yielded Compound Cylinder in Generalised Plane Strain," ASME.
Journal of Engineering for Industry, 83(1961) 441.
[36] T. E. Davidon, D. P. Kendall," The design of high pressure containers and
associated equipment," in: H. L. D. Pugh (Eds.), Mechanical behavior of
materials under pressure, Elsevier publishing Co., New York, 1970.
[37] P. W. Bridgman," The Physics of High Pressure," Bell, London, 1931.
[38] E. Whalley, A. Lavergne," Modified unsupported-area hydraulic seal for pressure
of 50 kilobar," Review of Scientific Instruments 47 (1976) 136-137.
[39] L. Peng, X. Lai, D. Liu, P. Hua, J. Ni," Flow channel shape optimum design for
hydroformed metal bipolar plate in PEM fuel cell," Journal of Power Sources
178(2008) 223-230.
[40] SmartDO. http://www.smartdo.co/index_e.htm.
[41] Z. Marciniak, J. L. Duncan, S. J. Hu," Mechanics of Sheet Metal Forming,"
Second edition, Butterworth-Heinemann, 2002.
[42] C. C. Huang, " fuel cells," Tsang hai book publishing Co., Taichung, third
version, 2008 (traditional Chinese).
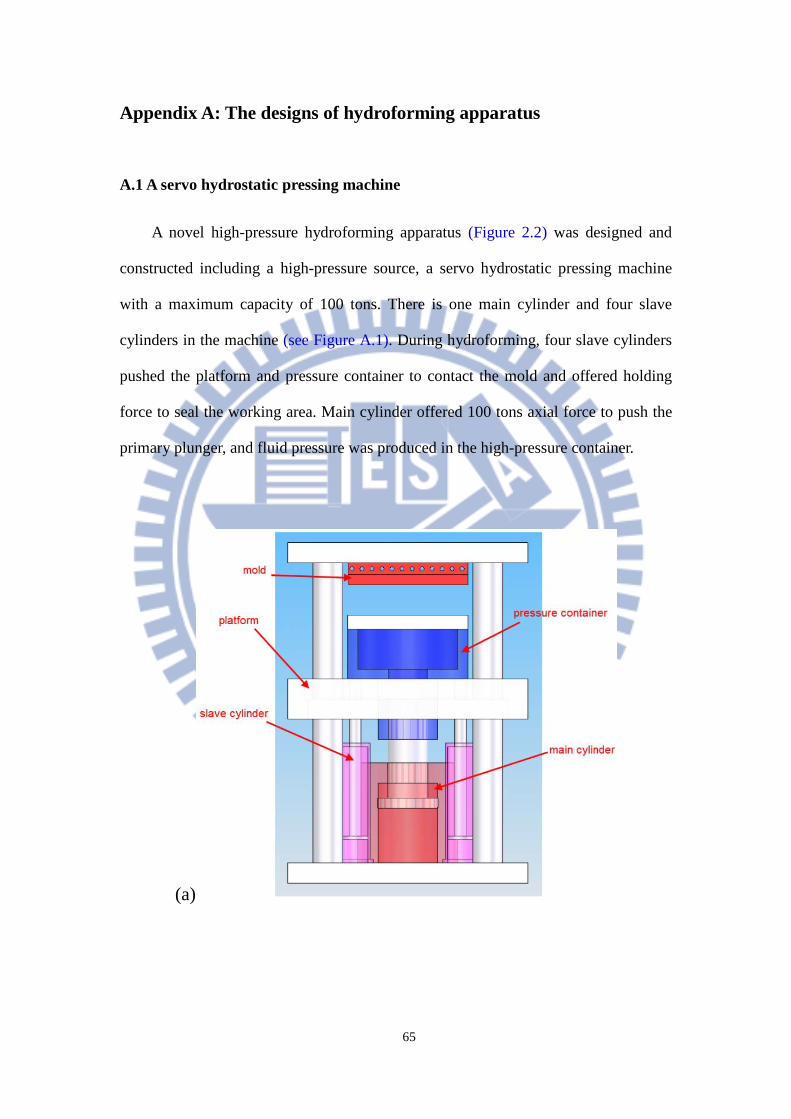
65
Appendix A: The designs of hydroforming apparatus
A.1 A servo hydrostatic pressing machine
A novel high-pressure hydroforming apparatus (Figure 2.2) was designed and
constructed including a high-pressure source, a servo hydrostatic pressing machine
with a maximum capacity of 100 tons. There is one main cylinder and four slave
cylinders in the machine (see Figure A.1). During hydroforming, four slave cylinders
pushed the platform and pressure container to contact the mold and offered holding
force to seal the working area. Main cylinder offered 100 tons axial force to push the
primary plunger, and fluid pressure was produced in the high-pressure container.
(a)
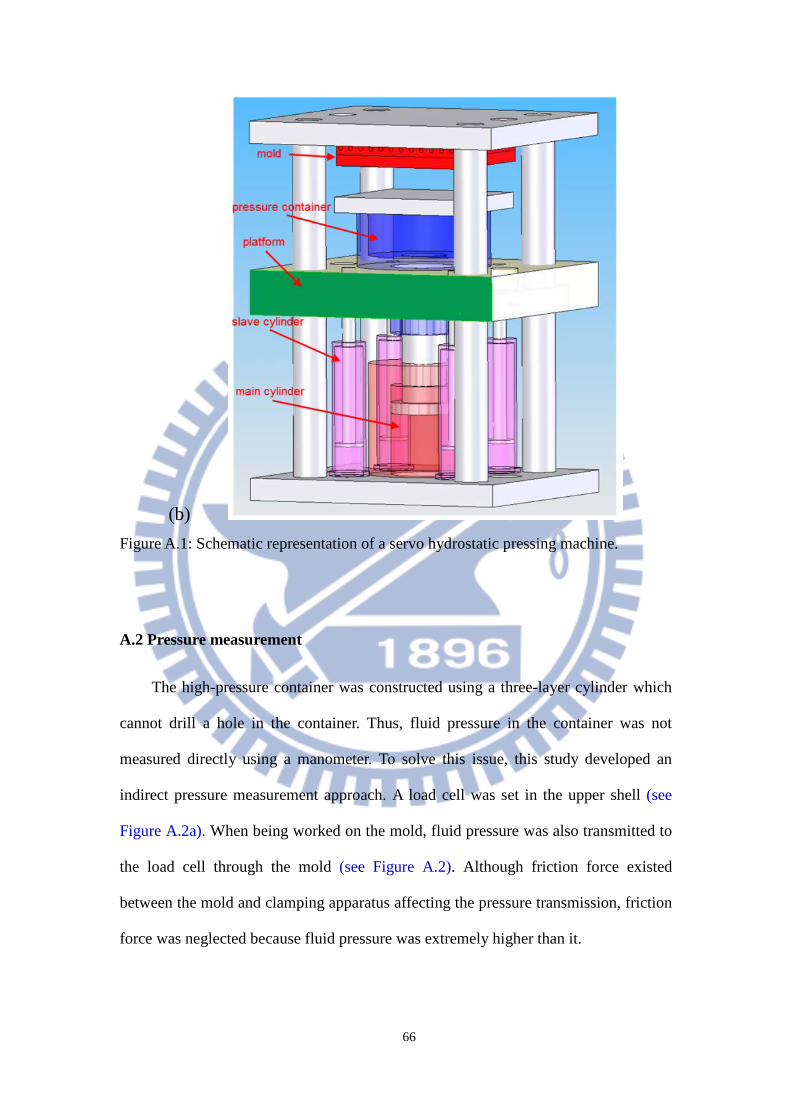
66
(b) Figure A.1: Schematic representation of a servo hydrostatic pressing machine.
A.2 Pressure measurement
The high-pressure container was constructed using a three-layer cylinder which
cannot drill a hole in the container. Thus, fluid pressure in the container was not
measured directly using a manometer. To solve this issue, this study developed an
indirect pressure measurement approach. A load cell was set in the upper shell (see
Figure A.2a). When being worked on the mold, fluid pressure was also transmitted to
the load cell through the mold (see Figure A.2). Although friction force existed
between the mold and clamping apparatus affecting the pressure transmission, friction
force was neglected because fluid pressure was extremely higher than it.
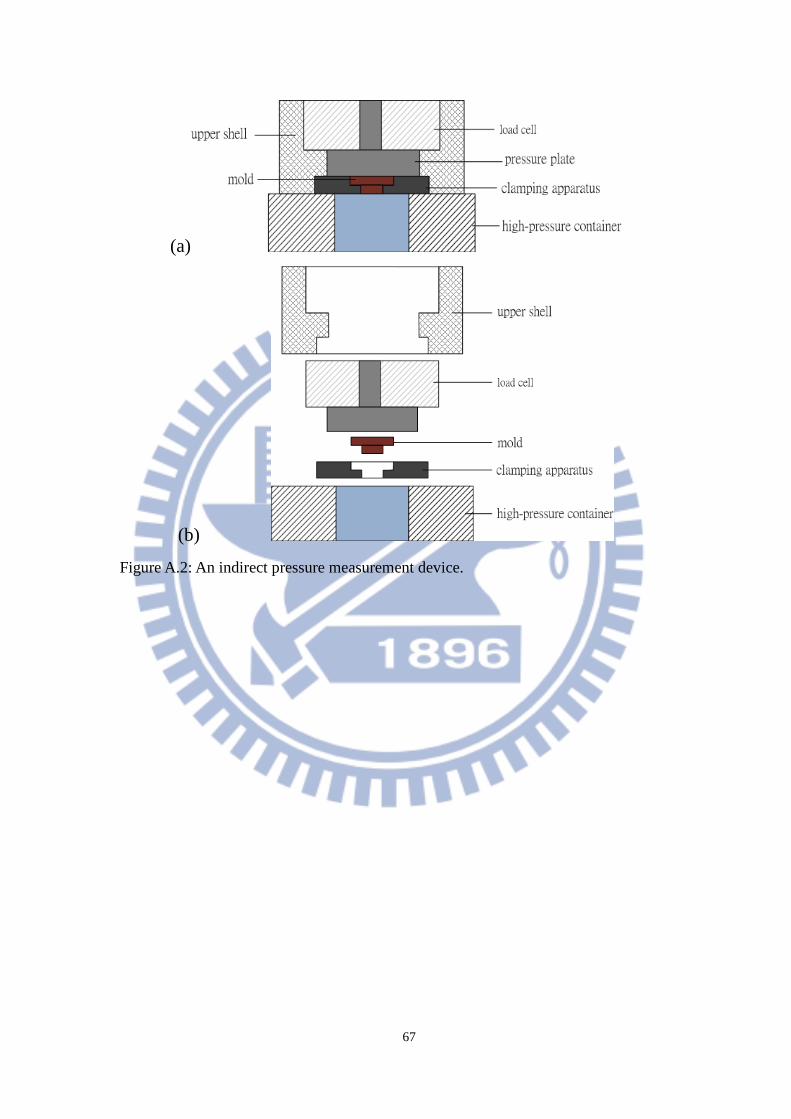
67
(a)
(b)
Figure A.2: An indirect pressure measurement device.

68
Appendix B: Metallographic test
The specimens receiving the solution heat treatment were observed
metallographic ally, and the procedure of the test is as follow:
1. The specimen is embedded with PhenoCure○R .
2. The surface of the specimen is grinded by sand paper using different particle sizes
of 240, 400, 600, 800, 1000, 1200, 1500 in turn. The direction of the next particle
size grinding needs to rotate 90 degree of the direction of the last particle size
grinding, and the grinding crack of the last particle size grinding need to be
removed.
3. The grinded specimen is polished by a polishing machine using mm1 particle
size alumina solution.
4. After polishing, the specimen is cleaned by water and then dried. Subsequently,
the specimen is corroded using an etchant according to ASTM E407–70 (Table
B.1). Samples are etched for approximately 15–20 seconds to expose the grain
boundary on the surface of samples. After etching, samples can be observed and
captured the image by an optical microscope.
Table B.1: The composition of an etchant.
Average grain sizes of heat treatment blanks were measured according to the
ASTM Standard E112-88 (mean lineal intercept or Heyn’s method). Several lines
including 45 degree oblique, horizontal, and vertical lines were drawn on the images
composition percentage (%)
3HNO 50 HCl 25
OH 2 25
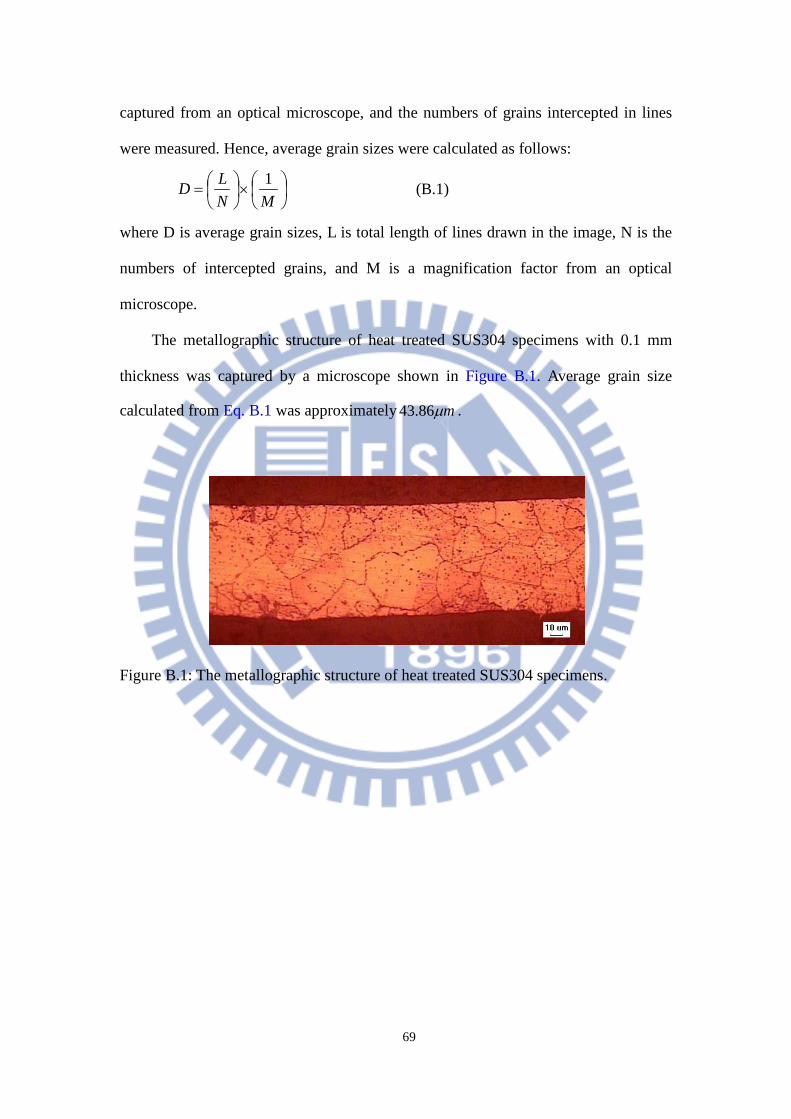
69
captured from an optical microscope, and the numbers of grains intercepted in lines
were measured. Hence, average grain sizes were calculated as follows:
×
=
MNLD 1 (B.1)
where D is average grain sizes, L is total length of lines drawn in the image, N is the
numbers of intercepted grains, and M is a magnification factor from an optical
microscope.
The metallographic structure of heat treated SUS304 specimens with 0.1 mm
thickness was captured by a microscope shown in Figure B.1. Average grain size
calculated from Eq. B.1 was approximately mm86.43 .
Figure B.1: The metallographic structure of heat treated SUS304 specimens.
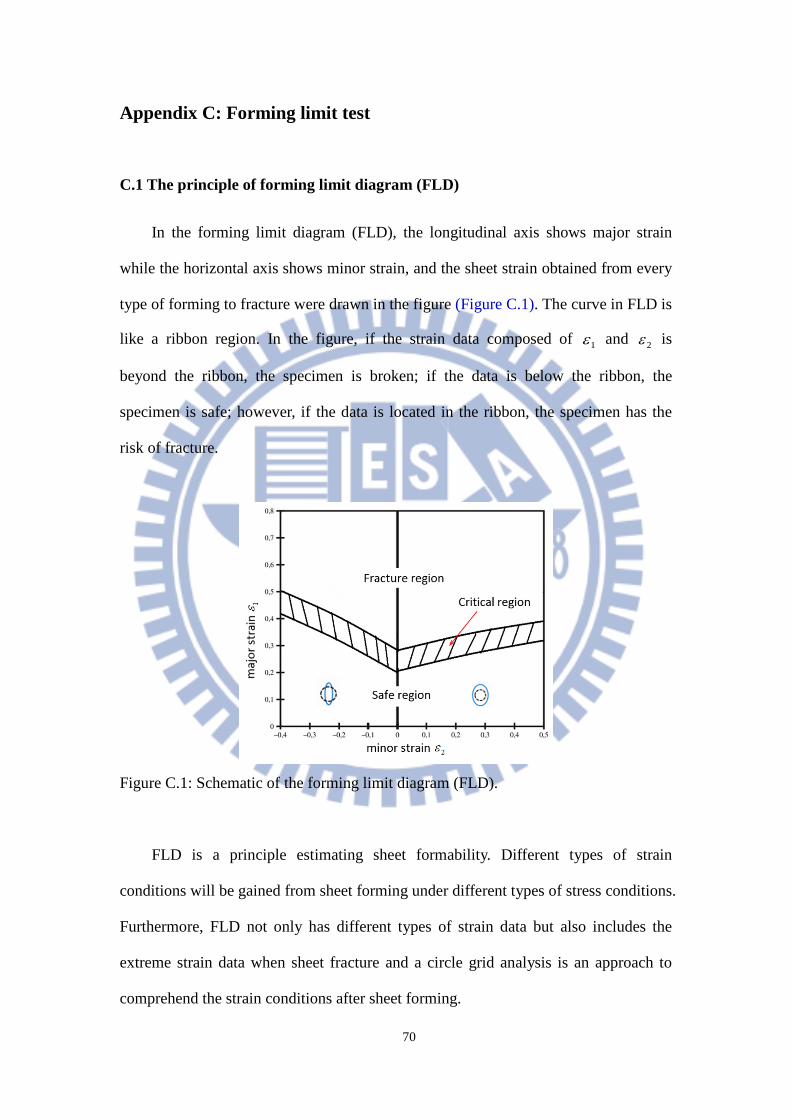
70
Appendix C: Forming limit test
C.1 The principle of forming limit diagram (FLD)
In the forming limit diagram (FLD), the longitudinal axis shows major strain
while the horizontal axis shows minor strain, and the sheet strain obtained from every
type of forming to fracture were drawn in the figure (Figure C.1). The curve in FLD is
like a ribbon region. In the figure, if the strain data composed of 1ε and 2ε is
beyond the ribbon, the specimen is broken; if the data is below the ribbon, the
specimen is safe; however, if the data is located in the ribbon, the specimen has the
risk of fracture.
Figure C.1: Schematic of the forming limit diagram (FLD).
FLD is a principle estimating sheet formability. Different types of strain
conditions will be gained from sheet forming under different types of stress conditions.
Furthermore, FLD not only has different types of strain data but also includes the
extreme strain data when sheet fracture and a circle grid analysis is an approach to
comprehend the strain conditions after sheet forming.
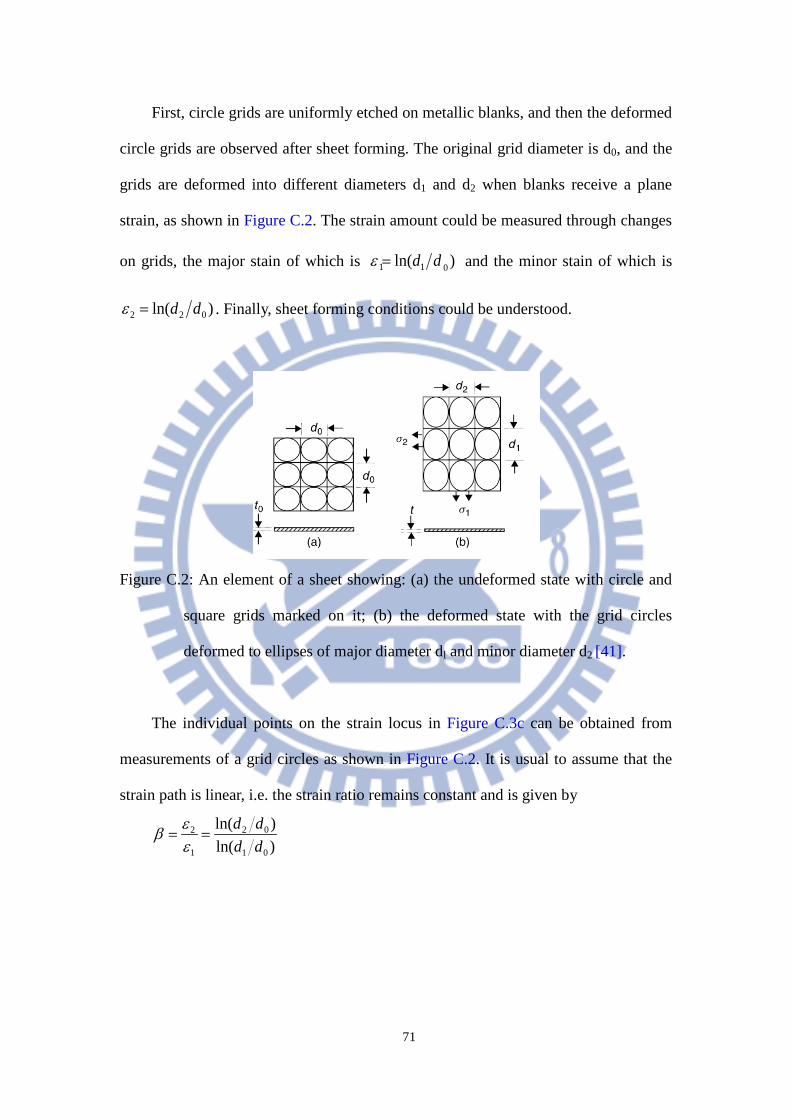
71
First, circle grids are uniformly etched on metallic blanks, and then the deformed
circle grids are observed after sheet forming. The original grid diameter is d0, and the
grids are deformed into different diameters d1 and d2 when blanks receive a plane
strain, as shown in Figure C.2. The strain amount could be measured through changes
on grids, the major stain of which is )ln( 011 dd=ε and the minor stain of which is
)ln( 022 dd=ε . Finally, sheet forming conditions could be understood.
Figure C.2: An element of a sheet showing: (a) the undeformed state with circle and
square grids marked on it; (b) the deformed state with the grid circles
deformed to ellipses of major diameter dl and minor diameter d2 [41].
The individual points on the strain locus in Figure C.3c can be obtained from
measurements of a grid circles as shown in Figure C.2. It is usual to assume that the
strain path is linear, i.e. the strain ratio remains constant and is given by
)ln()ln(
01
02
1
2
dddd
==εεβ
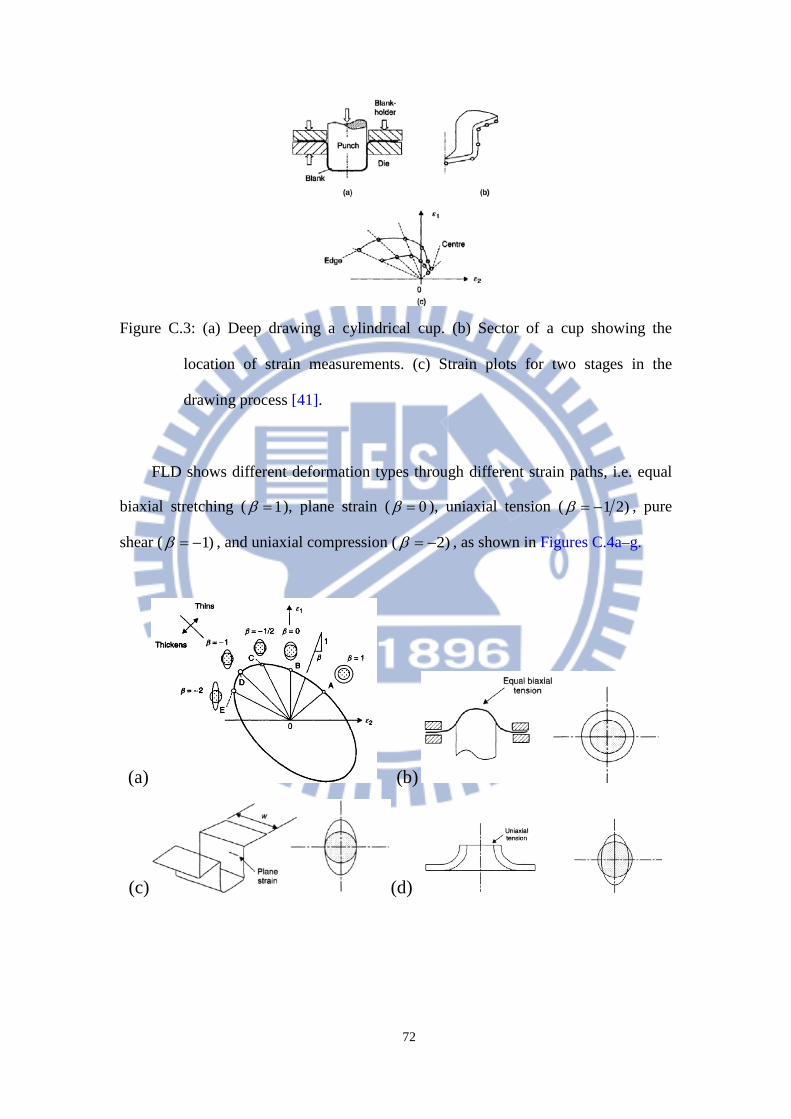
72
Figure C.3: (a) Deep drawing a cylindrical cup. (b) Sector of a cup showing the
location of strain measurements. (c) Strain plots for two stages in the
drawing process [41].
FLD shows different deformation types through different strain paths, i.e. equal
biaxial stretching ( 1=β ), plane strain ( 0=β ), uniaxial tension ( )21−=β , pure
shear ( )1−=β , and uniaxial compression ( )2−=β , as shown in Figures C.4a–g.
(a) (b)
(c) (d)
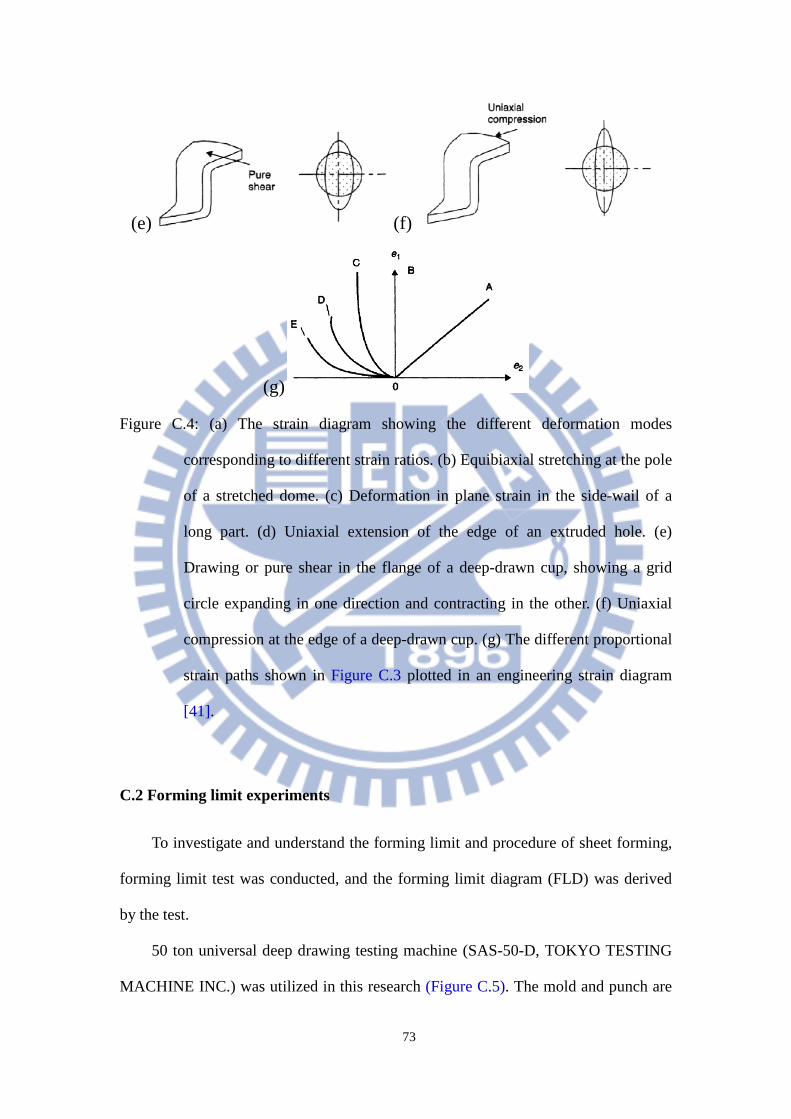
73
(e) (f)
(g)
Figure C.4: (a) The strain diagram showing the different deformation modes
corresponding to different strain ratios. (b) Equibiaxial stretching at the pole
of a stretched dome. (c) Deformation in plane strain in the side-wail of a
long part. (d) Uniaxial extension of the edge of an extruded hole. (e)
Drawing or pure shear in the flange of a deep-drawn cup, showing a grid
circle expanding in one direction and contracting in the other. (f) Uniaxial
compression at the edge of a deep-drawn cup. (g) The different proportional
strain paths shown in Figure C.3 plotted in an engineering strain diagram
[41].
C.2 Forming limit experiments
To investigate and understand the forming limit and procedure of sheet forming,
forming limit test was conducted, and the forming limit diagram (FLD) was derived
by the test.
50 ton universal deep drawing testing machine (SAS-50-D, TOKYO TESTING
MACHINE INC.) was utilized in this research (Figure C.5). The mold and punch are
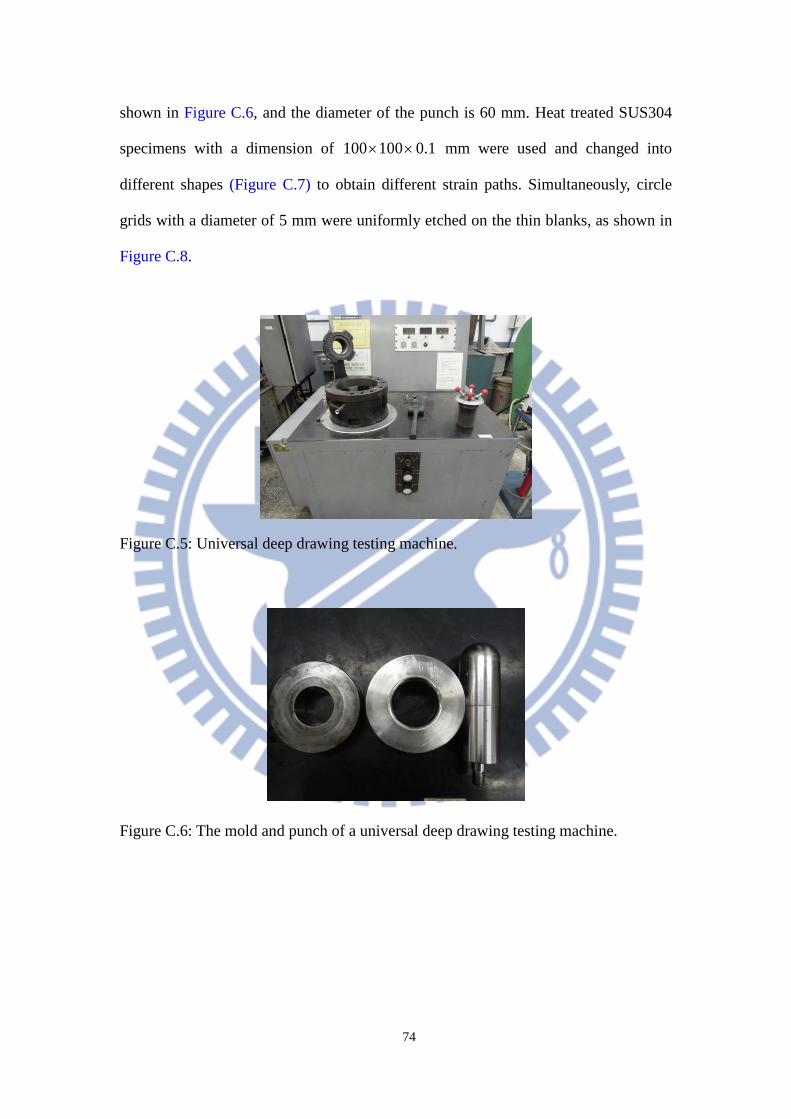
74
shown in Figure C.6, and the diameter of the punch is 60 mm. Heat treated SUS304
specimens with a dimension of 1.0100100 ×× mm were used and changed into
different shapes (Figure C.7) to obtain different strain paths. Simultaneously, circle
grids with a diameter of 5 mm were uniformly etched on the thin blanks, as shown in
Figure C.8.
Figure C.5: Universal deep drawing testing machine.
Figure C.6: The mold and punch of a universal deep drawing testing machine.
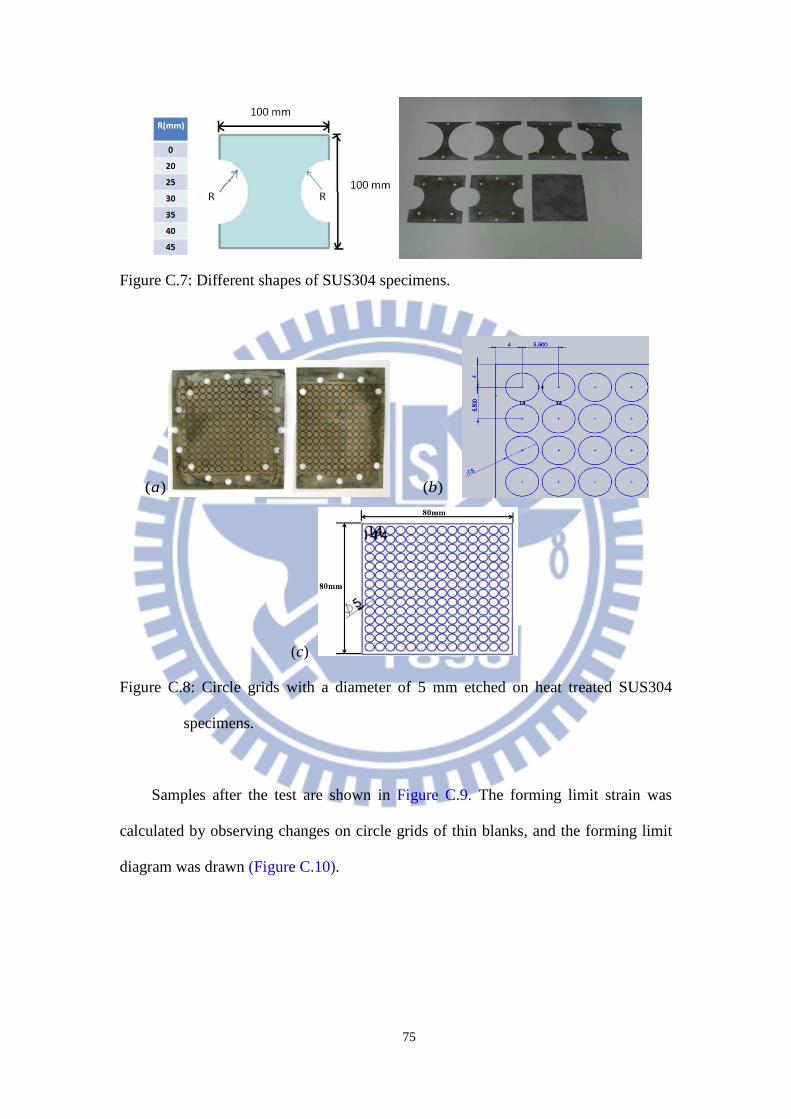
75
Figure C.7: Different shapes of SUS304 specimens.
)(a )(b
)(c
Figure C.8: Circle grids with a diameter of 5 mm etched on heat treated SUS304
specimens.
Samples after the test are shown in Figure C.9. The forming limit strain was
calculated by observing changes on circle grids of thin blanks, and the forming limit
diagram was drawn (Figure C.10).

76
Figure C.9: Samples after a forming limit test.
In Figure C.9, specimen No. 7 was designed to simulate strain path of equal
biaxial tension condition (Figure C.4b), the data of which were located on the right
side of FLD theoretically. However, specimen No.7 could not be clamped firm
because of extremely thin thickness of 0.1 mm, and the contact pressure between
specimen No. 7 and the punch was greater than the holding force which the testing
machine could offer. Therefore, after the test, specimen No. 7 shown in Figure C.9
had the indentation condition on the edges of the specimen, which was different from
the ideal deformation type. Finally, the data derived from specimen No. 7 was located
on the vertical axial representing plane strain condition (Figure C.10), and FLD
derived from the forming limit test lacked the data on the right side.
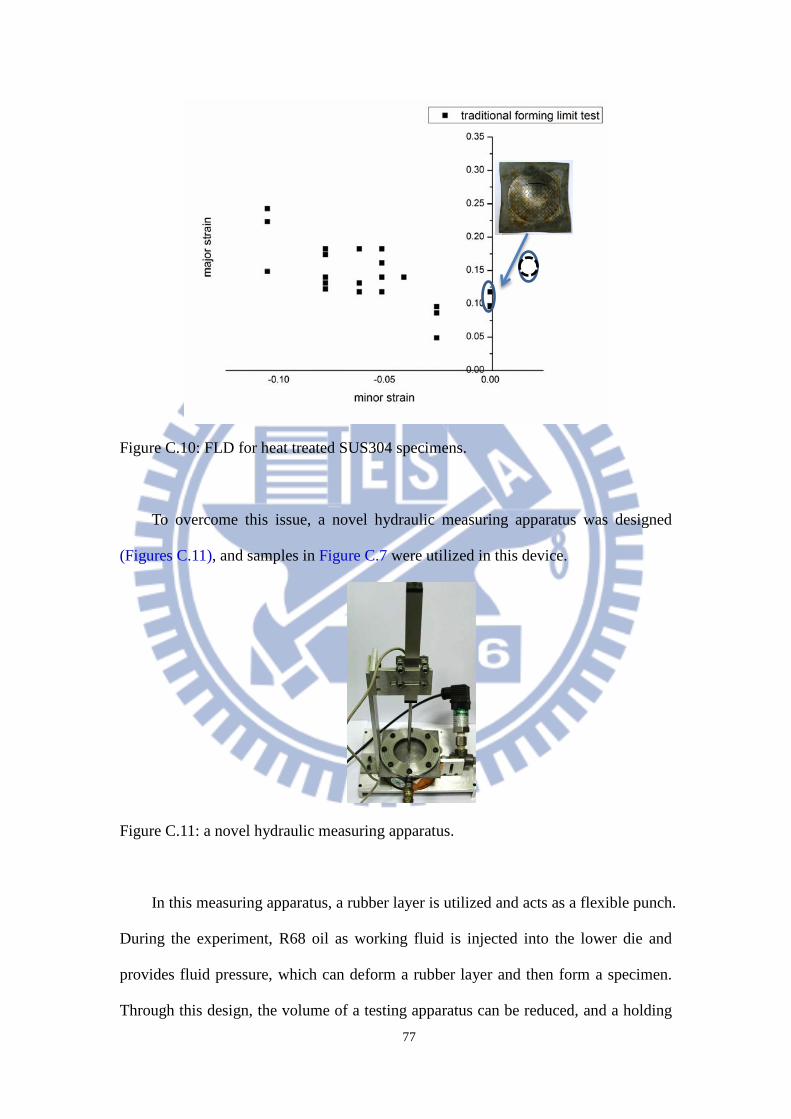
77
Figure C.10: FLD for heat treated SUS304 specimens.
To overcome this issue, a novel hydraulic measuring apparatus was designed
(Figures C.11), and samples in Figure C.7 were utilized in this device.
Figure C.11: a novel hydraulic measuring apparatus.
In this measuring apparatus, a rubber layer is utilized and acts as a flexible punch.
During the experiment, R68 oil as working fluid is injected into the lower die and
provides fluid pressure, which can deform a rubber layer and then form a specimen.
Through this design, the volume of a testing apparatus can be reduced, and a holding
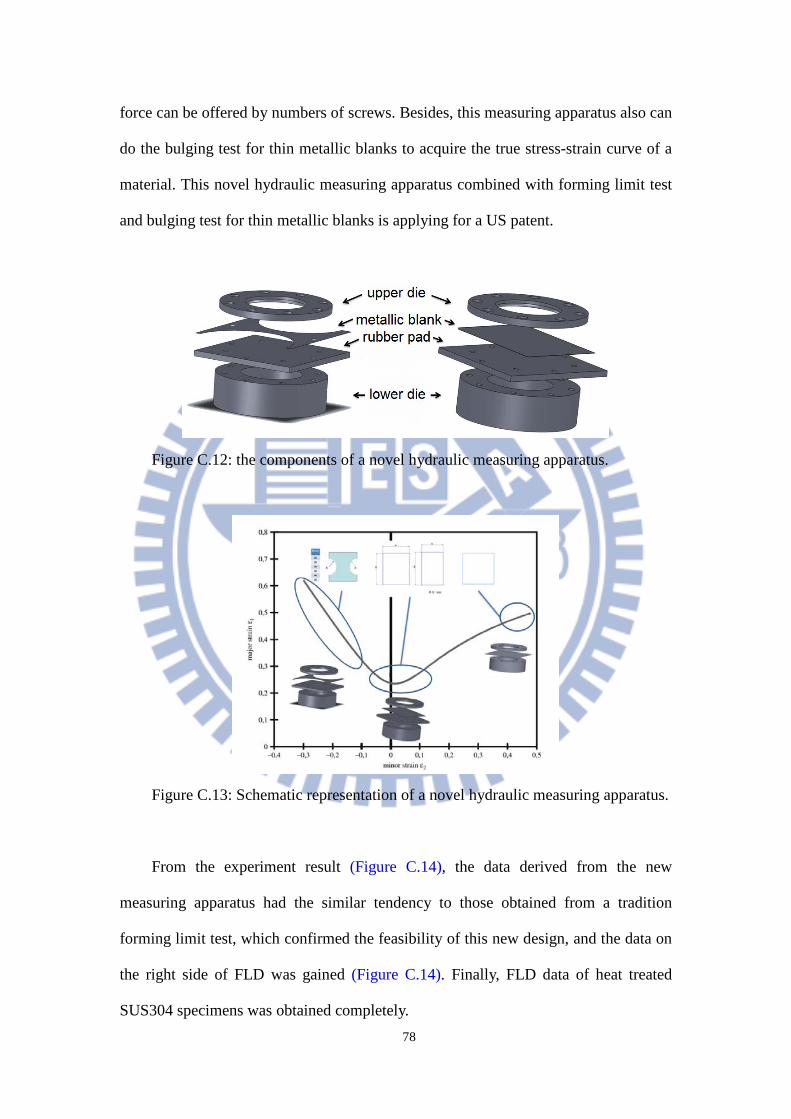
78
force can be offered by numbers of screws. Besides, this measuring apparatus also can
do the bulging test for thin metallic blanks to acquire the true stress-strain curve of a
material. This novel hydraulic measuring apparatus combined with forming limit test
and bulging test for thin metallic blanks is applying for a US patent.
Figure C.12: the components of a novel hydraulic measuring apparatus.
Figure C.13: Schematic representation of a novel hydraulic measuring apparatus.
From the experiment result (Figure C.14), the data derived from the new
measuring apparatus had the similar tendency to those obtained from a tradition
forming limit test, which confirmed the feasibility of this new design, and the data on
the right side of FLD was gained (Figure C.14). Finally, FLD data of heat treated
SUS304 specimens was obtained completely.
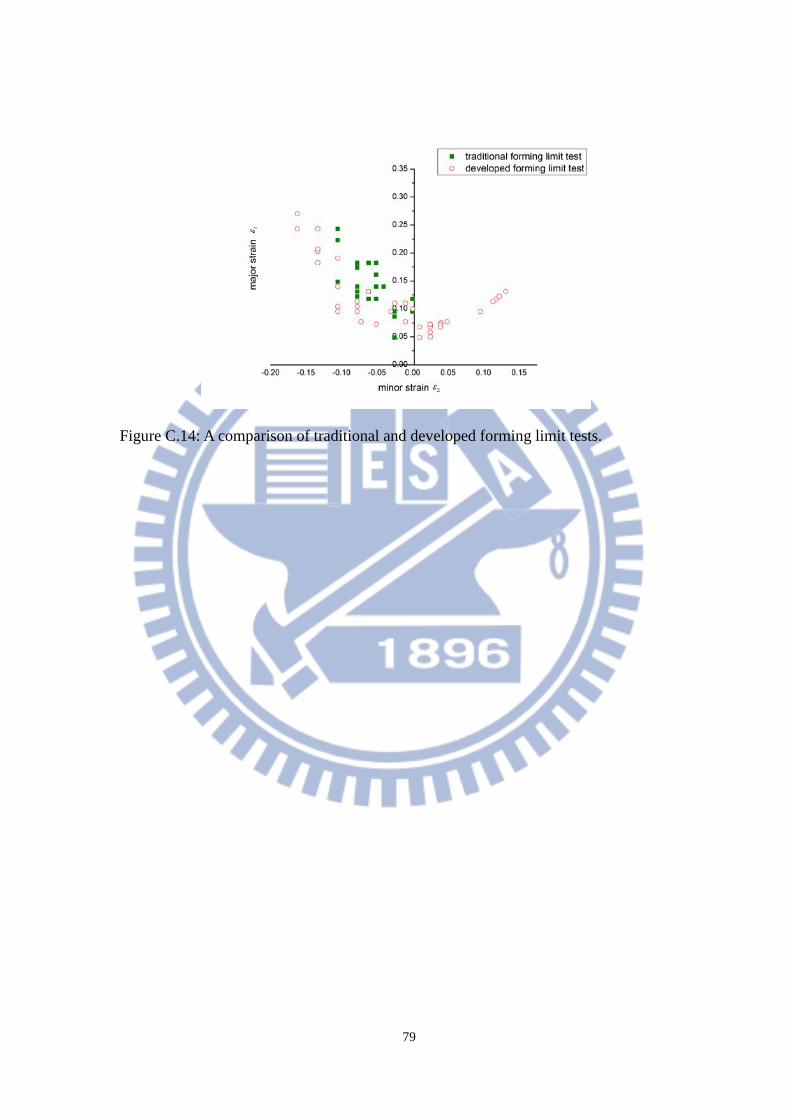
79
Figure C.14: A comparison of traditional and developed forming limit tests.