Embed Size (px)
Citation preview
IT 11 026
Examensarbete 30 hpMaj 2011
Study and Implementation of Statistical Information System for EHR System
Xuejun Xu
Institutionen för informationsteknologiDepartment of Information Technology

Teknisk- naturvetenskaplig fakultet UTH-enheten Besöksadress: Ångströmlaboratoriet Lägerhyddsvägen 1 Hus 4, Plan 0 Postadress: Box 536 751 21 Uppsala Telefon: 018 – 471 30 03 Telefax: 018 – 471 30 00 Hemsida: http://www.teknat.uu.se/student
Abstract
Study and Implementation of Statistical InformationSystem for EHR System
Xuejun Xu
Uganda is accentuating a lot of efforts to strengthen its healthcare services andprovide National Electronic Health Record System. One of the core components ofElectronic Health Record System is Statistical Information System. The StatisticalInformation System locates in the application logic in the technical architecture of thewhole project. Exsiting tool, DHIS 2 is evaluated and found not proper to be used asthe project's Statistical Information System. Based on the discussions above, thesystem is divided into 3 parts: Static Statistics, Dynamic Statistics and HMIS Reports.The static part provides powerful search for statistics. The dynamic part utilizes aflash chart, where users can see the move of statistics like watching a movie. TheHMIS part is the place where the traditioncal HMIS reports can be generated.
Tryckt av: Reprocentralen ITCIT 11 026Examinator: Anders JanssonÄmnesgranskare: Mats DanielsHandledare: Rustam Nabiev

1
1. INTRODUCTION .................................................................................................................... 3
1.1 INTRODUCTION ....................................................................................................................... 3
1.2 BACKGROUND ......................................................................................................................... 3
1.3 MOTIVATION............................................................................................................................ 4
1.4 THESIS STRUCTURE ................................................................................................................ 5
2. ICT4MPOWER TECHNICAL ARCHITECTURE ................................................................. 6
2.1 CONTEXT OF UGANDA............................................................................................................. 6
2.2 TECHNICAL ARCHITECTURE .................................................................................................. 6
2.2.1 Network Topology ............................................................................................................... 6
2.2.2 Analysis and Performance.................................................................................................. 8
2.3 WHERE IS STATISTICAL INFORMATION SYSTEM? .................................................................. 8
3. EVALUATION OF DHIS 2 .................................................................................................... 10
3.1 WHAT’S DHIS 2? .................................................................................................................. 10
3.2 USE OF DHIS 2 IN HMIS ...................................................................................................... 10
3.3 DATA MODEL IN DHIS 2 ....................................................................................................... 11
3.3.1 Data Elements ................................................................................................................... 11
3.3.2 Indicators .......................................................................................................................... 12
3.3.3 Organisation Units............................................................................................................ 12
3.3.4 Dataset ............................................................................................................................... 12
3.3.5 User Information .............................................................................................................. 12
3.3.6 Conclusion ........................................................................................................................ 13
3.4 IMPORT AND EXPORT DATA IN DHIS 2 ................................................................................. 13
3.5 IS DHIS2 GOOD TO BE USED AS OUR STATISTICAL INFORMATION SYSTEM? ...................... 13
4. DESIGN OF THE STATISTICAL INFORMATION SYSTEM ............................................ 15
4.1 SUMMARY .............................................................................................................................. 15
4.2 STATIC STATISTICS ................................................................................................................ 15
4.2.1 Why Static? ....................................................................................................................... 15
4.2.2 Basic Search ..................................................................................................................... 15
4.2.3 Advanced Search .............................................................................................................. 16
4.2.4 Result Table and Charts.................................................................................................... 17
4.3 DYNAMIC STATISTICS ........................................................................................................... 17
4.3.1 Why Dynamic? .................................................................................................................. 17
4.3.2 Dynamic Statistics ............................................................................................................. 18
4.4 HMIS REPORTS .................................................................................................................... 19
4.4.1 Motivation ......................................................................................................................... 19
4.4.2 Generate HMIS Reports ................................................................................................... 19
5. IMPLEMENTATION, TESTING AND EVALUATION ....................................................... 20
5.1 TECHNICAL STRUCTURE ....................................................................................................... 20
5.1.1 Catalyst .............................................................................................................................. 20
2
5.1.2 MVC of Statistical Information System ........................................................................... 20
5.1.3 System Overview ............................................................................................................... 21
5.2 STATIC STATISTICS ................................................................................................................ 24
5.2.1 Basic Search ..................................................................................................................... 24
5.2.2 Advanced Search .............................................................................................................. 28
5.3 DYNAMIC STATISTICS ........................................................................................................... 31
5.4 GENERATE HMIS REPORTS ................................................................................................. 40
6. CONCLUSION AND OUTLOOK ......................................................................................... 42
ACKNOWLEDGEMENT .............................................................................................................. 43
BIBIOGRAPHY ............................................................................................................................. 44
3
1. Introduction
1.1 Introduction
Karolinska University Hospital, Karolinska Institutet, Royal Institute of Technology
and Ericsson Sweden AB are involved in the international project ”ICT4MPOWER”
(Information and Communication ) to develop National Electronic Health Record
(EHR) System in Uganda. ICT4MPOWER System resulting from the project will
provide a roadmap for implementation and maintenance of low cost EHR System in
developing countries.
One of the core components of Electronic Health Record System is Statistical
Information System. The issue of statistical information is very crucial to monitor
various aspect of the project to make important evidence based decisions at various
levels in the health sector. Statistical Information System should offer a range of
methods for the collection, presentation and analysis of data from different
components of the EHR system.
The project “ICT4MPOWER” should end on December 2011, the writer works at
Karolinska Hospital to develop the statistical information system for the EHR System.
1.2 Background
Uganda has remained consistent in its pursuit of poverty eradication as the overriding
priority for national socioeconomic development. Uganda has registered significant
progress in reorganizing and stabilizing its economy, improving economic growth and
reducing poverty. The population of Uganda is estimated at 30 million persons with
an average population growth rate of 3.4% between the 1991 and 2002 censuses. This
growth rate is one of the highest in the world. Health outcomes for Uganda are poor.
The Uganda Demographic and Health Survey (UDHS) 2006 recorded the Infant
Mortality Rate at 75 deaths per 1,000 live births, Under-five mortality rate at 137
deaths per 1,000 live births, and the Maternal Mortality Ratio at 435 deaths per
100,000 live births[1]
. To raise the country averages for the health outcomes there is
need to specifically target the poor and to improve the situation for many of the
disadvantaged groups in the population since the better off have higher capacity to
benefit from social services and thus higher rate of improvement in health outcomes
without impacting on the health of the poor[2]
. The stagnation of health outcomes in
the 1990s was a manifestation of underlying poverty with deprivation not only in
nutrition, housing, water/sanitation and education, but also the high burden of
communicable and non-communication diseases. The HIV/AIDS pandemic that
peaked in the early 1990s, has led to far reaching social and economic consequences
including a decline in life expectancy. Communicable diseases continue to be the
4
leading cause of morbidity and mortality in Uganda. Non-communicable diseases
including hypertension, diabetes and cancer, mental illness, chronic and degenerative
disorders and cardiovascular diseases are on the rise. This raises the importance of
having accurate information on time to facilitate rapid response and accurate
interventions.
Uganda is accentuating a lot of efforts to strengthen its healthcare services and
provide National Integrated Health Management Information System. In order to
succeed in these efforts, all national health units, starting from Village Health Team,
and up to Mulago National Hospital must be part of this activity[3]
. The Ministry of
Health Uganda has done tremendous steps in coming closer to this vision. HMIS
Manual has been developed, which accentuates on such issues as strengthening
delivery of unified health services, models for management and constant
improvements of health services, quality assurance, documentation and reporting[4]
. In
order to start implementation of the concepts developed in HMIS Manual, the
Ministry of Health Uganda has embraced on the national project “ICT4MPOWER”,
where the focus is on development and implementation of National EHR System,
which would store life-long records of clients.
1.3 Motivation
The health care problems may be looked at with respect to the following thematic
areas: a) The lack of patient unique id makes it difficult to facilitate data transmission
or client records for second opinion before or after referral. Even when patient referral
does occur it is impossible to do effective follow up or patient tracing. Accompanied
with this is the inability to have an effective archival system making the whole
referral process impossible to run with the increasing population. b) Management of
patient records like the patient referral is a teasing problem in view to the lack of the
unique patient identifier and paper based nature of the current medical records. This is
further complicated by the multiple records generated on each patient for each visit to
the health facility and to each department in the facility. c) Disease surveillance, poor
record keeping leads to problems with the disease surveillance. In the most recent
annual report it was observed that 56% of the health units submitted their reports on
time due to absence of feed back or radio call network breakdown. d) Local human
capacity development at all levels of healthcare chain, current staffing levels is low
especially in hard to reach areas of the country though there is need for accurate data
to get a national picture. e) Local decision making and responsibilities of health staff
in rural communities is very low due to non functioning health facility management
committees, inadequate appreciation and support for the community health workers
and the poor information utilization culture at all levels.
Through ICT4MPOWER project, the project partners hope to: a) Empower the
community health worker with m-learning materials. b) Facilitate communication
5
between the facility and the community health worker. c) Harmonize patient referrals
procedure and feedback. d) Operationalise the concept of primary health care at
community level. e) Facilitate mobility of the community health worker. f) Ensure the
continuity of care throughout the health care system with Electronic Health Record
(EHR) and Unique Patient ID. g) Provide for secondary opinions through
telemedicine and Improve health care seeking behavior of households.
The statistical information system plays a vital role in tracking and monitoring health
status of the population and of important subgroups, monitoring trends in health status
and health care delivery, compiling statistical information to guide actions and
policies to improve the healthcare system.
Currently in Uganda, all health workers follow the HMIS manual, recording all the
statistical data manually in paper forms. If the ministry of health wants to view
statistical information of patients, they will have to read through a lot of paper forms,
which is quite inefficient and hard to get clear statistical information.
By developing this Statistical Information System: a) All statistical information is
based on the patients’ data in the database, which is easier to maintain. b) The
Ministry of Health will be able to search statistical information in whatever the way
they want, for example, by location, age, indicators and so on. c) The movement and
trend of statistical information will be shown in a dynamic chart. d) The traditional
HMIS reports can be generated from the statistical information system as excel files.
1.4 Thesis Structure
The objective of this thesis project is to research and develop a statistical information
system of EHR system of “ICT4MPOWER” project for Uganda.
Chapter 2 describes the technical architecture of the ICT4MPOWER project and in
which part of the architecture will the statistical information system lies. Chapter 3
evaluates the DHIS system to see whether it’s proper for our system. Chapter 4
analyzes the data models of the system and how to get statistical information from
these data models. Chapter 5 describes the design of the statistical information system,
including the structures and ideas. Chapter 6 gives the implementation details and the
development environment of the statistical information system. Chapter 7 tests and
evaluates the developed statistical information system, the screen shots of the system
will also be here. Chapter 8 gives the conclusion and outlook of the statistical
information system.

6
2. ICT4MPOWER Technical Architecture
2.1 Context of Uganda
EHR Systems are in use in many countries, including Uganda. However, these
systems are limited to 1 health unit, or small geographical region, which consists of
4-5 health units. In order to achieve the vision of Integrated Health Management
Information System, all health units must be connected to EHR System. This problem
cannot be solved by replicating current EHR solutions, which is too expensive and
difficult to maintain. Therefore, new technical architecture must be developed, which
will consider the issues of low-cost implementation and affordable maintenance.
Uganda has around 30 million people, of which 80% live in rural areas. There are
around 30000 health professionals working in Uganda.
In urban areas, such as Kampala and Mbarara, hospitals have access to broadband
network. In rural areas, health units don’t have access to broadband network.
However, mobile operators are rolling out mobile networks in rural areas, and more
than 80% of rural areas are covered by mobile networks, which provide GSM and
GPRS connections[5]
.
Additionally, another challenge which is crucial for National EHR System rollout is
lack of resources to maintain and provide local technical support to rural health units.
Number of people living in Uganda, and number of health professionals will guide us
on scalability aspects of EHR system. Mobile networks will guide us on performance
and availability aspects of EHR system. Lack of local technical resources will guide
us on security, reliability, and the balance of centralization and decentralization of
EHR technical infrastructure and human resources to support and maintain the
system.
2.2 Technical Architecture
2.2.1 Network Topology
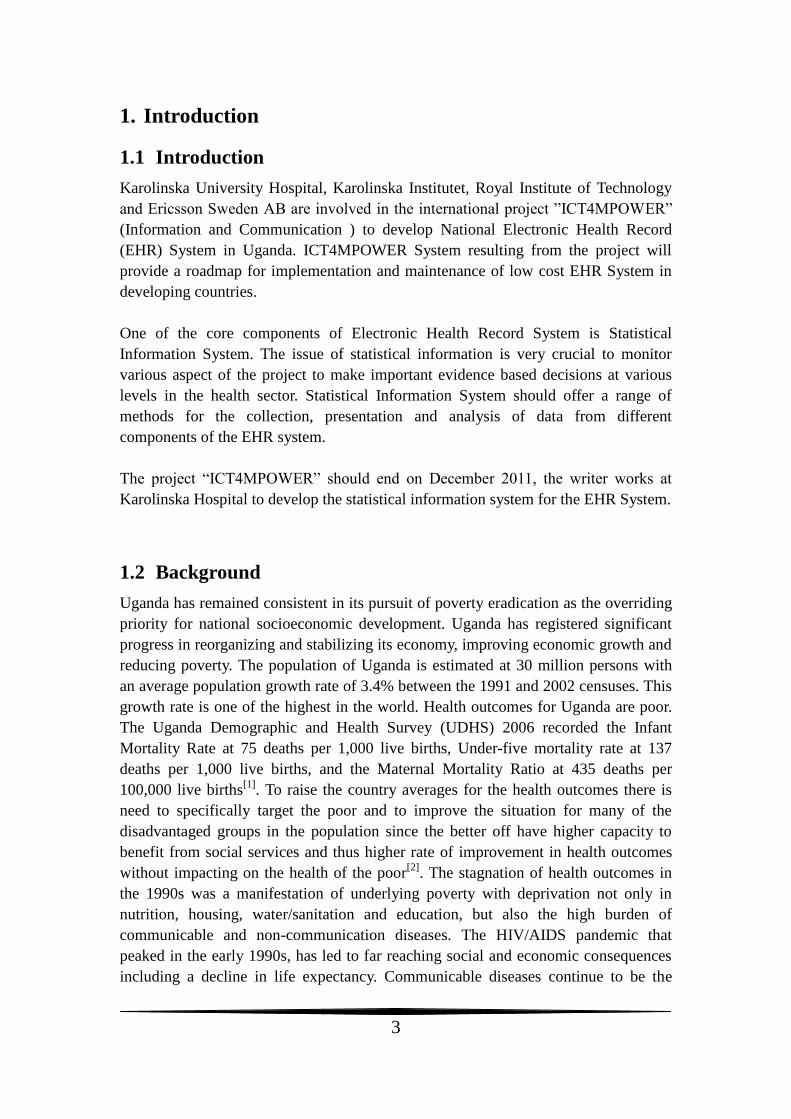
According to the context of Uganda, we designed the technical architecture, shown in
figure 2.1.
7
Figure 2.1 Network Topology of ICT4MPOWER
To provide high availability and cost-effective maintenance of National EHR System,
it must be placed centrally. Central location can be provided at the Ministry of Health
Uganda, or outsourced to an organization for maintaining EHR System.
As shown in Figure 2.1, health units within the country get access to the EHR System
by using mobile infrastructure (GPRS) or by broadband internet connection.
Local EHR applications are installed in end-user devices, End-users will be able to
use local EHR Applications without necessity of having connectivity directly to
central EHR System. Any updates that end-users make (such as adding a record to the
patient or registering a new patient), will be packaged and sent to the Gateway.
Gateway will receive the package and identify the destination, which in this case is
Central EHR System. EHR System can then download the package from the Gateway.
Gateway System is divided into 2 core components: Primary Gateway (PGW) and
8
Secondary Gateway (SGW). PGW is responsible for receiving requests from
end-users and from Central EHR System, and based on the nature of request, route it
to SGW or process the request by itself. One can avoid having SGWs if requests are
coming from small amount of end-users, therefore, architecture of PGW will allow for
processing all requests by itself. However, for load balancing, SGW and indeed
several SGWs are necessary to support PGW[5]
.
2.2.2 Analysis and Performance
By placing EHR System and other necessary components centrally, we eliminate the
need for costly investments in each health facilities to have their own local systems
implemented and maintained. Another advantage is that centralized EHR System can
be available nationally once it is operational.
In most cases, maintenance is a big challenge in rural areas, where there is a lack of
trained technical support team. High availability can be achieved by coordinating
human resources (centralized technical support team) at one central location and by
providing redundancy in terms of backup and restore facilities (clustering might not
be necessary in the beginning, but something to investigate later). Centralized
technical support team can provide 24 hours maintenance and support of EHR System,
and restore from failovers in case it happens.
By providing the Gateway between end-users and Central EHR System, we managed
to decentralize end-users work, and dependency on available communication links
and bandwidth, which further improves availability of entire solution. Additionally we
reduce the costs of GPRS connection by limiting the usage of communication links
only to synchronize the data between end-users and Central EHR System.
2.3 Where is Statistical Information System?
The client EHR system is divided into 4 tiers: GUI, Controller, Application Logic
(different catalyst applications and services) and Data Access Service.
The end-user is using GUI (Mozilla browser) to view relevant information. GUI is an
entry point to the system.
The Controller (Apache Web Server) links GUI to Application Logic. The function of
the controller is to keep track of different links and update those links accordingly.
Application Logic consists of services that are visible to an end-user and those
services that run in the background. Those services that are connected to the
Controller are visible to the end-user, and Statistical Information System is one of
them.

9
All services will be developed in Perl Language using Catalyst as web application
development and implementation framework. These applications can be considered as
business logic of the Client System.
10
3. Evaluation of DHIS 2
3.1 What’s DHIS 2?
The District Health Information Software – Version 2 (DHIS 2) is Free and Open
Source Software (FOSS) HMIS designed and developed under a global research and
development initiative (called Health Information Systems Project – HISP)
originating from the Department of Informatics, University of Oslo, Norway[6]
.
It is a tool for collection, validation, analysis, and presentation of aggregate statistical
data, tailored (but not limited) to integrated health information management activities.
It is a generic tool rather than a pre-configured database application, with an open
meta-data model and a flexible user interface that allows the user to design the
contents of a specific information system without the need for programming. DHIS 2
and upwards is a modular web-based software package built with free and open
source Java frameworks.
DHIS 2 provides a comprehensive HMIS solution for the reporting and analysis needs
of health facilities at any level. It is a tried and tested application in various countries,
and also now being adopted by WHO for their HMN implementation.
3.2 Use of DHIS 2 in HMIS
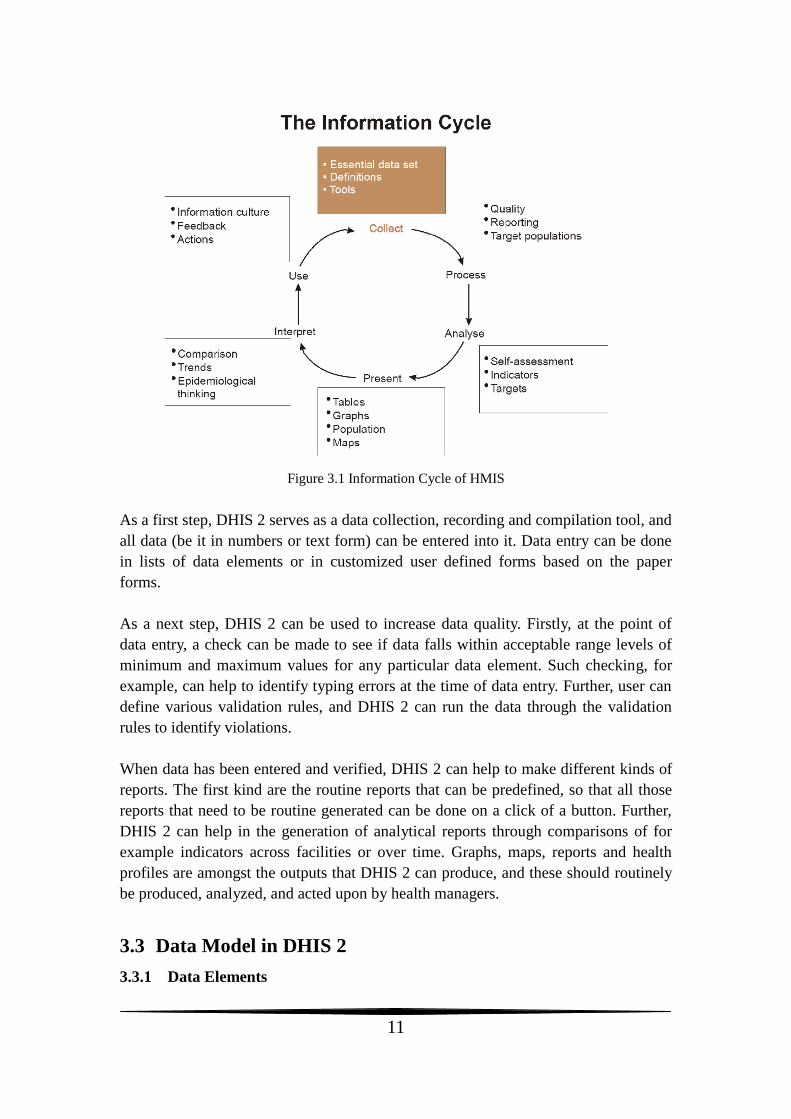
The wider context of HMIS can be comprehensively described through the
information cycle presented in Figure 3.1 below. The information cycle pictorially
depicts the different components, stages and processes through which the data is
collected, checked for quality, processed, analyzed and used.
11
Figure 3.1 Information Cycle of HMIS
As a first step, DHIS 2 serves as a data collection, recording and compilation tool, and
all data (be it in numbers or text form) can be entered into it. Data entry can be done
in lists of data elements or in customized user defined forms based on the paper
forms.
As a next step, DHIS 2 can be used to increase data quality. Firstly, at the point of
data entry, a check can be made to see if data falls within acceptable range levels of
minimum and maximum values for any particular data element. Such checking, for
example, can help to identify typing errors at the time of data entry. Further, user can
define various validation rules, and DHIS 2 can run the data through the validation
rules to identify violations.
When data has been entered and verified, DHIS 2 can help to make different kinds of
reports. The first kind are the routine reports that can be predefined, so that all those
reports that need to be routine generated can be done on a click of a button. Further,
DHIS 2 can help in the generation of analytical reports through comparisons of for
example indicators across facilities or over time. Graphs, maps, reports and health
profiles are amongst the outputs that DHIS 2 can produce, and these should routinely
be produced, analyzed, and acted upon by health managers.
3.3 Data Model in DHIS 2
3.3.1 Data Elements
12
Data elements form the basis of DHIS 2. Data elements define what is actually
recorded in system, for example, number of immunizations or number of cases of
malaria. (An administrator will be provided with a list of standardized data elements
for inclusion into the DHIS 2 system) Data elements are stored in table DataElement
in DHIS 2. Each data element is some aggregated result and belongs to one or several
data element groups. Data element group is some way to organize data elements. They
are stored in table DataElementGroup in DHIS 2. Each group may include one or
many data elements. And data element groups are organized into sets, which are
stored in table DataElementGroupSet.
Each data element also has some category combination related to it. Category combos
are stored in table CategoryCombo.
3.3.2 Indicators
Indicators are provided by DHIS 2. They are stored in table Indicator. And Indicator
has some type (Number, Percent, etc.), which is stored in table IndicatorType. Each
indicator belongs to one or several indicator groups. Indicator groups are stored in
table IndicatorGroup. Each group may have one or many indicators. Indicator groups
are organized into sets, which are stored in table IndicatorGroupSet.
3.3.3 Organisation Units
Organisation units are also stored in DHIS 2. They are stored in table
OrganisationUnit. The units are organized hierarchically (like a tree). Each unit
belongs to one or several unit groups. The groups are stored in table OrgUnitGroup.
And like data elements and indicators, these groups are organized into sets, which are
stored in table OrgUnitGroupSet. But each group can belong to one or several sets.
When a group set is defined as “compulsory”, it means that an organisation unit must
be allocated to at least one organisation unit group within that group set. When a
group set is defined as exclusive, it means that an organisation unit can only be
allocated to one organisation unit group within that Group Set. Different units may
have different levels, and these unit levels are stored in table OrgUnitLevel.
3.3.4 Dataset
A dataset is a collection of data elements for which data is entered (register in HMIS).
Values for data elements will not be able to be entered into the system if a data
element is not assigned to a data set. Datasets are stored in table DataSet. Each dataset
has a related period, periods have different types, 1 year, 6 months for example, they
are stored in table Period and PeriodType.
Sections can be inserted into data sets to make them more comprehensible. Each data
set can have one or several sections inserted. Sections are stored in table Section.
Each section is related to a set of data elements.
3.3.5 User Information
Users’ information is stored in the DHIS 2 database. Username and password are
13
stored in table Users. Users’ information is stored in table UserInfo. UserInfo and
Users have the same primary key. Each user has a role, which indicates the authority
of the user. Users’ authorities are stored in table UserRoleAuthorities. And each user
has a number of datasets related, which are stored in table UserRoleDataSet. User
may belong to some organization unit, which is stored in table UserMembership.
Data model about patient data is also included in DHIS 2 database. But patient data is
not visualized in DHIS 2.
Other tables in DHIS 2 database are about Dash board, Excel report, Data mart, Data
entry and so on, which are using data stored in the tables analyzed above.
3.3.6 Conclusion
According to the data model of DHIS 2, there is no record to show who entered the
data. It is impossible to find the user when someone entered rubbish data into the
system. Also many tables seem to be redundant if we use DHIS 2 as our statistical
information system. But the structure of the some tables can be used in our system.
3.4 Import and Export Data in DHIS 2
The import option allows different instance of DHIS 2 to receive standardized set of
data in the absence of a networked system. DHIS 2 is capable of importing data from
other systems that either support the DXF or IXF formats.
In an offline deployment, after the data entry is finished, it will need to be manually
sent to the next level of where the application is running. The exported data values are
stored in an “xml file”.
The import and export function gives the probability to use DHIS 2 together with our
system. The scenario may look like this: xml file about our system, organization units,
data elements, data sets and so on, is generated by our system. Then we import this
xml file into DHIS 2. Data values are input into DHIS 2, this can be done either
manually or automatically (requires modification of source code). After getting the
data value, DHIS 2 exports xml file to give statistical reports back to our system.
From this point of view, we are using just a small part of DHIS2’s functionalities to
meet our requirements. Using DHIS2 means much more work than not using it.
3.5 Is DHIS2 good to be used as our Statistical Information
System?
First of all, we need to input data into DHIS2. As mentioned in “Data Model” section,
DHIS 2 only takes aggregated data. We may need an adaptor which does the
14
aggregation for patients’ data that has been stored in our EHR system.
Data elements, indicators and data sets should be generated first according to HMIS
manual of Uganda. Data can then be input into DHIS 2 by data entry forms. We also
need to add the organization units and hierarchical structure of these units.
Standard database needs to be configured on local machine. Since we use MySQL for
our EHR System, we may also use MySQL for DHIS 2. But configuration needs to be
made for DHIS 2. Besides JVM needs to be installed on local machine.
The integration is the biggest problem since our EHR System and DHIS 2 are two
separated systems. If we use DHIS 2 as our Statistical Information System, users
should be trained to know how to generate statistical reports from DHIS 2.
It is possible to develop an adaptor that we can use to transfer statistical reports from
DHIS 2 to our EHR System. However, DHIS2 should also be run at the same time
with our EHR system. This may increases the system’s load.
Generally speaking, using DHIS2 means more work and more system load. It is better
to develop our own statistical information system.
If we don’t use DHIS2 as our Statistical Information System, indicators need to be
defined according to HMIS manual of Uganda. Then statistical reports can be
generated from the database of our System. And the statistical part can be developed
as a part of our system. It will be much better from the integration and configuration
point of view. But efficient design of data model needs to be performed.
15
4. Design of the Statistical Information System
4.1 Summary
Based on the discussions and conclusions of previous chapters, the statistical
information system will be one of the services that are visible to end-users. It will be a
separate application in the welcome screen, when users enter the statistical
information system, a list of all the available applications in the system will be shown,
which means users are able to get the statistical information about different parts of
the system. In this report, the outpatient part of the EHR system will be taken as a
design example for statistics, the others parts are more or less the same.
Generally, the statistical information system is divided into 3 function parts. a) Static
Statistics, where the users will be able do the basic and advanced search of statistics,
search results will be shown in a table, pie chart and line chart are also provided to
view the statistics. b) Dynamic Statistics. In this part, statistics are shown in a motion
chart based on locations and time period. Users will be able to see the moving trends
of different statistics and compare them in a multiple dimensional way. c) HMIS
reports. The traditional HMIS reports can be generated from the statistical system.
Instead of filling thousands of units manually, the statistical information system gets
data from database and generates exactly the same reports as defined in HMIS manual
in .xls format.
These three function parts will be discussed in detail in the coming sub-chapters.
4.2 Static Statistics
4.2.1 Why Static?
The ”Static” here means the way users view the statistical information will be static.
The search results will be listed in a table, users may choose pie chart or line chart to
view the search results together with the table.
Since everything is stored in the database, the statistical information system allows
users to do search in a very flexible way. Different search criteria is provided, users
are able to get whatever statistical information they are interested.
Compare with the traditional statistical paper reports, the advantages are obvious.
Users are not confusing by huge amount of data in the paper anymore. They don’t
need the calculator do the weekly, monthly or annual statistical calculations. Besides,
they can focus on what they are interested in, and view these statistics in a nice chart.
4.2.2 Basic Search
Basic search functions are provided here for the users. If users don’t have specific
16
requirements on statistics, this part is enough for them to view statistics of different
locations.
Before going into more detail about the basic search, the structure of the locations in
Uganda need to discussed first. Uganda is divided into many districts, each district
has one or more counties, each county has one or more sub-counties, each sub-county
then has one or more parishes, and each parish has one or more villages.
Choosing a location here means users choose some location in any level, then the
statistics of all the next level sub-locations will shown in the search result. For
example, if users choose a district, all the counties of this district will be shown in the
search results. The idea behind this is that users are able to view the statistical
information of some location by comparing between all its sub-locations.
In outpatient part of HMIS manual [7]
, patients are divided into 2 groups according to
the age: 0-4, 5 and above. Following this rule, users have three options about age here:
0-4, 5 and above and all, which means all the patients.
It is also necessary for the users to choose time period. In the basic search part, there
will be two calendars for the users to specify start date and end date separately. The
search result will then be the statistical information between these two dates.
As we discussed with doctors, gender is also interesting for users. Three options about
gender are provides here: Male, Female and Any, which means both male and female
patients.
The last search criterion here is indicators. Unlike indicators in DHIS 2, the indicators
here mean diseases, “Yellow Fever” for example. All the indicators that are listed in
outpatient part of HMIS manual are listed here for users to choose. In the search
results, users can see how many occurrences of the specified indictor are.
Basic search is enough for general purpose. However, there are some limitations, for
example, users can only view statistical information of sub-locations of some location,
what if users want to compare statistical information between 2 districts? What if new
indicators of diseases of babies that are less than 1 year old are added to the HMIS
Manual, how could users choose age bellow 1 year old? Base on these considerations
and investigations, advanced search come up.
4.2.3 Advanced Search
To get over the limitations of basic search and give more flexibility to users, advanced
search is designed. Compare with basic search, advanced search is different at two
aspects: location and age.
17
As designed in basic search, users can only choose one location to view all
sub-locations of this location. More choices are given in advanced search, users are
able to choose any location at any level, the number of locations users can choose are
not limited either. For example, users choose a district, a county, another district and
compare between them.
As for the age part, in advanced search, users can specify an age of years, months and
days. For example, if user input “1y3m28d” in the age input area, it means to search
patients that are 1 year, 3 months and 28 days old. Moreover, users can specify an age
scope, which means to search a group of patients in a specific age scope. For example,
“0d-28d” means users want to get statistical information about patients from 0 to 28
days old.
With advanced search, users are able to search almost whatever statistics they want.
The idea is to use the data in the database as much as possible, the more the data is
used, the more flexibility the users can get.
4.2.4 Result Table and Charts
The result table is a table to show the search results. All options specified in basic or
advanced search will be shown in this table. The value of the indicators will also be
shown.
Two types of chart are provided for users at Static Statistics: Pie chart and Line chart.
In pie chart, the number and percentage of each location will be calculated and shown,
while in line chart, users can compare the moving trends of different locations in a
time period.
4.3 Dynamic Statistics
4.3.1 Why Dynamic?
The idea of dynamic statistics actually came from Gapminder, which is a non-profit
venture – a modern “museum” on the Internet – providing flexible and understandable
statistical information of different areas. The flash elements are integrated into
Gapminder so that users will see the move of statistical information like watching a
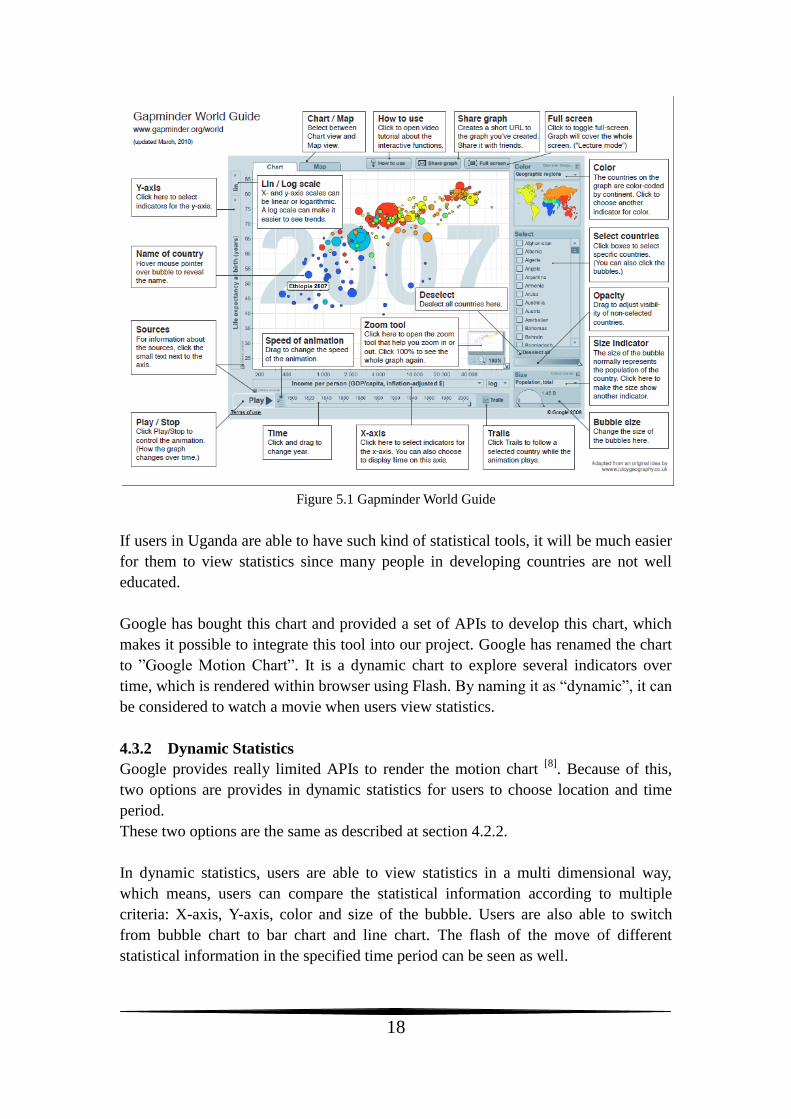
movie. An example of Gapminder is shown in Figure 4.1.
18
Figure 5.1 Gapminder World Guide
If users in Uganda are able to have such kind of statistical tools, it will be much easier
for them to view statistics since many people in developing countries are not well
educated.
Google has bought this chart and provided a set of APIs to develop this chart, which
makes it possible to integrate this tool into our project. Google has renamed the chart
to ”Google Motion Chart”. It is a dynamic chart to explore several indicators over
time, which is rendered within browser using Flash. By naming it as “dynamic”, it can
be considered to watch a movie when users view statistics.
4.3.2 Dynamic Statistics
Google provides really limited APIs to render the motion chart [8]
. Because of this,
two options are provides in dynamic statistics for users to choose location and time
period.
These two options are the same as described at section 4.2.2.
In dynamic statistics, users are able to view statistics in a multi dimensional way,
which means, users can compare the statistical information according to multiple
criteria: X-axis, Y-axis, color and size of the bubble. Users are also able to switch
from bubble chart to bar chart and line chart. The flash of the move of different
statistical information in the specified time period can be seen as well.
19
Dynamic statistics provides a graphical, simple but powerful way to view statistics.
4.4 HMIS Reports
4.4.1 Motivation
In Uganda, many people don’t know how to use computer, some old doctors, they will
prefer the traditional HMIS reports. It is also good to have something printed out as
back up. Besides, it takes a while for users to get used to the statistical information
system, by providing the function to generate traditional HMIS Reports, users can still
follow the original way to do statistics while learning how to use the new statistical
information system.
4.4.2 Generate HMIS Reports
In this part, a select menu of all the available HMIS reports will be shown for the
users. In outpatient part, there are four kinds of HMIS reports, all of them will be
listed in the page, users choose any one of them, a save dialog will pop up to ask users
where they want to save the generated reports. The reports will be generated as .xsl
file, and they will be named as “report name-date”.
20
5. Implementation, Testing and Evaluation
5.1 Technical Structure
5.1.1 Catalyst
As mentioned in Chapter 2, the statistical system is built with Catalyst and Perl.
Catalyst is a web application framework[9]
, which is designed to make it easy to
manage the various tasks you need to do to run an application on the web, either by
doing them itself, or by letting you "plug in" existing Perl modules that do what you
need.
Catalyst follows the MVC pattern. MVC, or Model-View-Controller, is a model
currently favored for web applications. This design pattern is originally from the
Smalltalk programming language. The basic idea is that the three main areas of an
application--handling application flow (Controller), processing information (Model),
and outputting the results (View)--are kept separate, so that it is possible to change or
replace any one without affecting the others[10]
.
5.1.2 MVC of Statistical Information System
The purpose of Model is to access and modify data. The Model of statistical
information system is a set of perl modules (.pm file) generated from project’s
relational databases. In catalyst, a perl module corresponds to a table in the database.
As long as these perl modules have been generated, we will be able to perform
different kind of operations to the database through these perl modules.
The purpose of the View is to present data to the user. In this statistical information
system, a templating module “Template Toolkit” is used to generate HTML (.tt file).
In Catalyst, the View is a small module, just gluing some other module into Catalyst;
the display logic is written within the template itself.
The controller is Catalyst itself. When a request is made to Catalyst, it will be
received by one of your Controller modules; this module will figure out what the user
is trying to do, gather necessary data from a Model, and send it to a View for display.
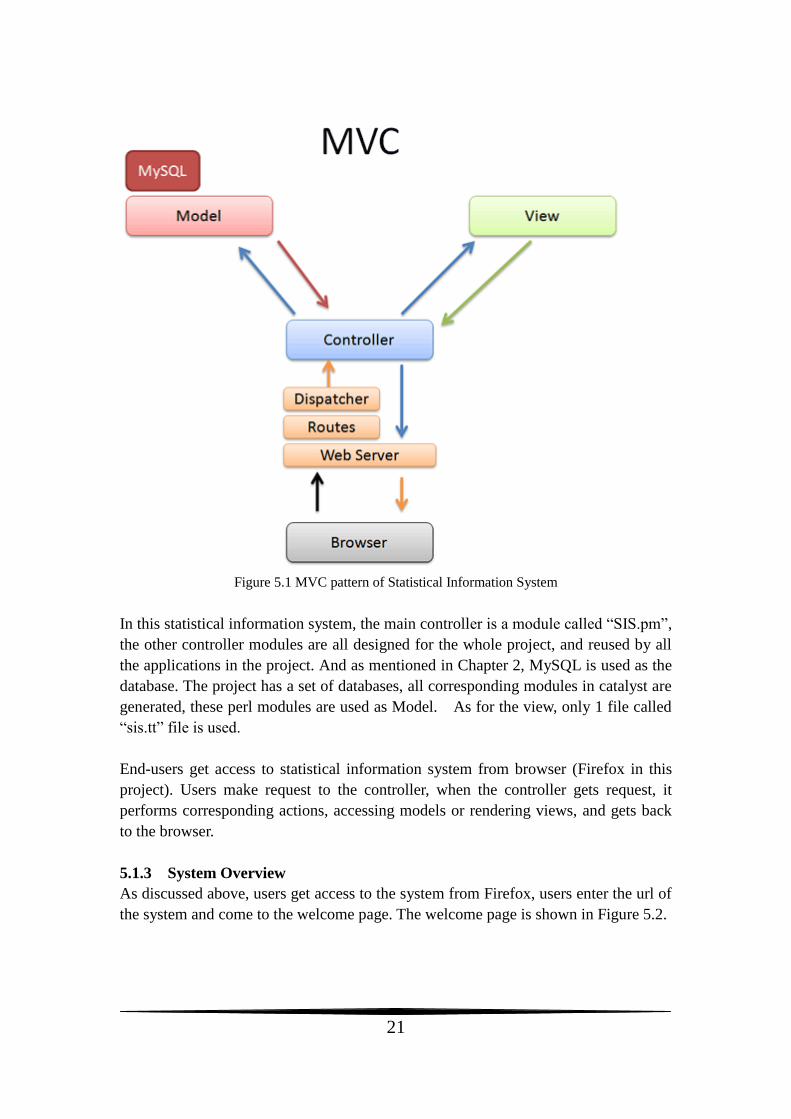
The MVC pattern of statistical information system is shown in Figure 5.1.
21
Figure 5.1 MVC pattern of Statistical Information System
In this statistical information system, the main controller is a module called “SIS.pm”,
the other controller modules are all designed for the whole project, and reused by all
the applications in the project. And as mentioned in Chapter 2, MySQL is used as the
database. The project has a set of databases, all corresponding modules in catalyst are
generated, these perl modules are used as Model. As for the view, only 1 file called
“sis.tt” file is used.
End-users get access to statistical information system from browser (Firefox in this
project). Users make request to the controller, when the controller gets request, it
performs corresponding actions, accessing models or rendering views, and gets back
to the browser.
5.1.3 System Overview
As discussed above, users get access to the system from Firefox, users enter the url of
the system and come to the welcome page. The welcome page is shown in Figure 5.2.
22
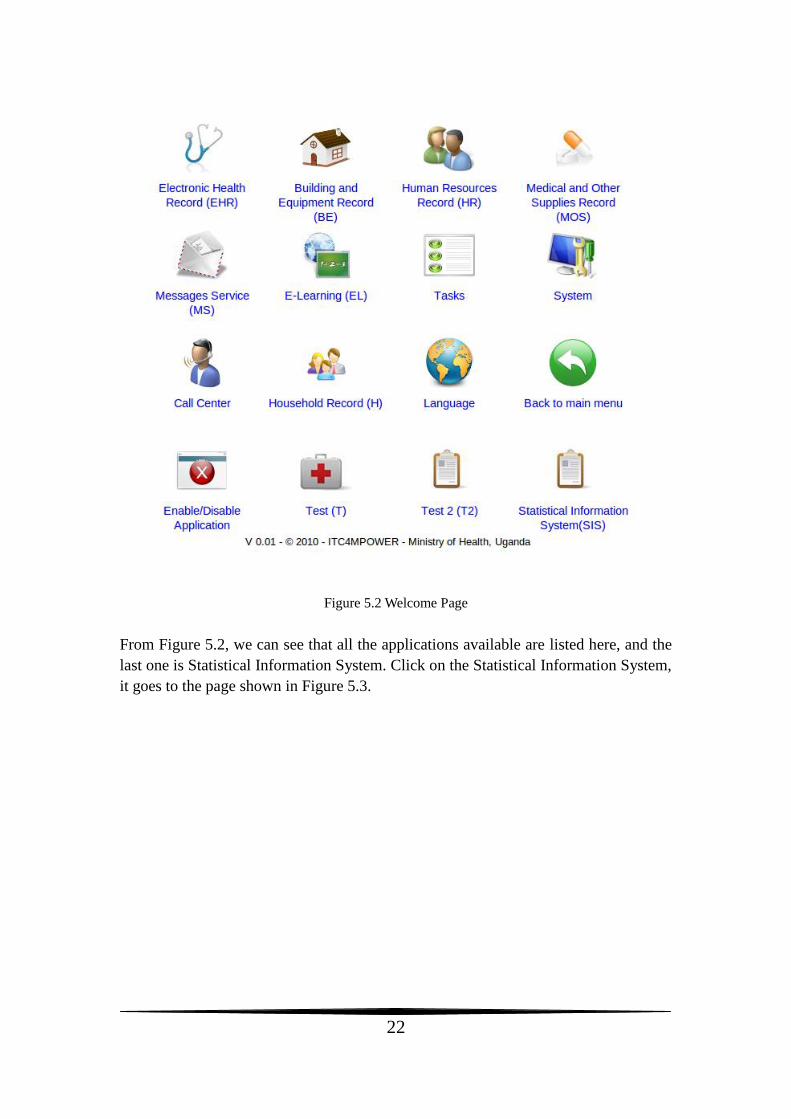
Figure 5.2 Welcome Page
From Figure 5.2, we can see that all the applications available are listed here, and the
last one is Statistical Information System. Click on the Statistical Information System,
it goes to the page shown in Figure 5.3.
23
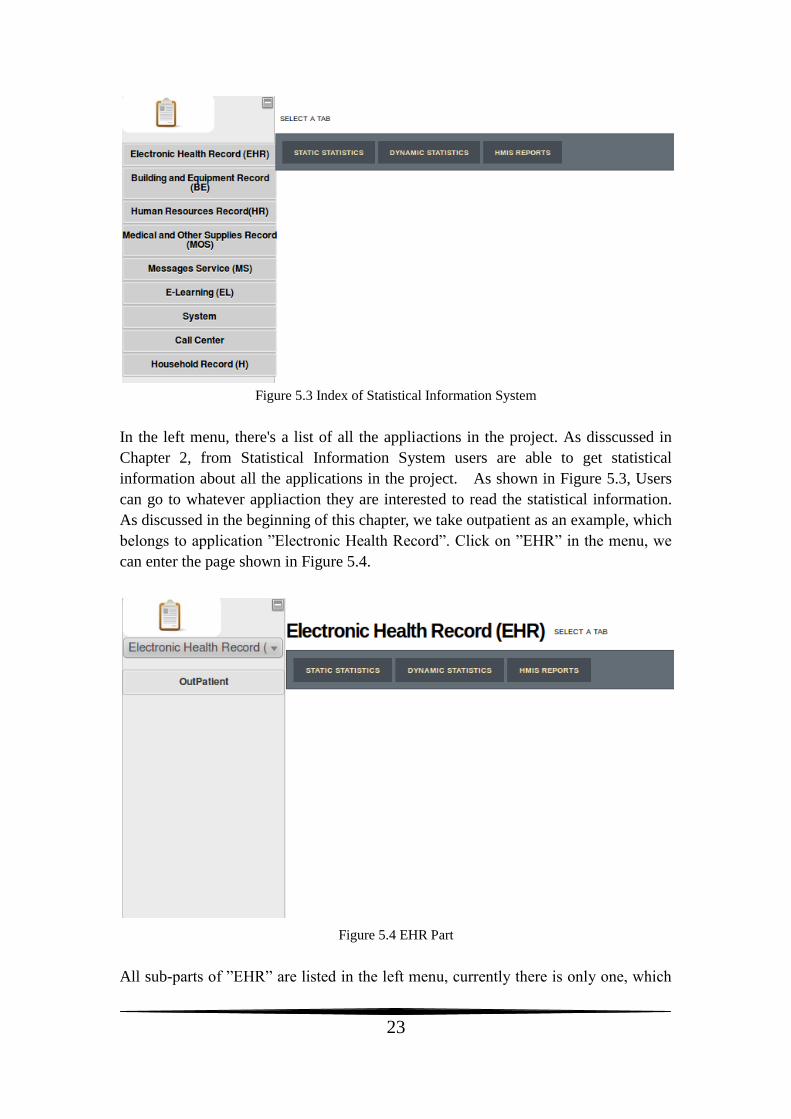
Figure 5.3 Index of Statistical Information System
In the left menu, there's a list of all the appliactions in the project. As disscussed in
Chapter 2, from Statistical Information System users are able to get statistical
information about all the applications in the project. As shown in Figure 5.3, Users
can go to whatever appliaction they are interested to read the statistical information.
As discussed in the beginning of this chapter, we take outpatient as an example, which
belongs to application ”Electronic Health Record”. Click on ”EHR” in the menu, we
can enter the page shown in Figure 5.4.
Figure 5.4 EHR Part
All sub-parts of ”EHR” are listed in the left menu, currently there is only one, which
24
is ”OutPatient”. Click on ”OutPatient”, we come to the page shown in Figure 5.5.
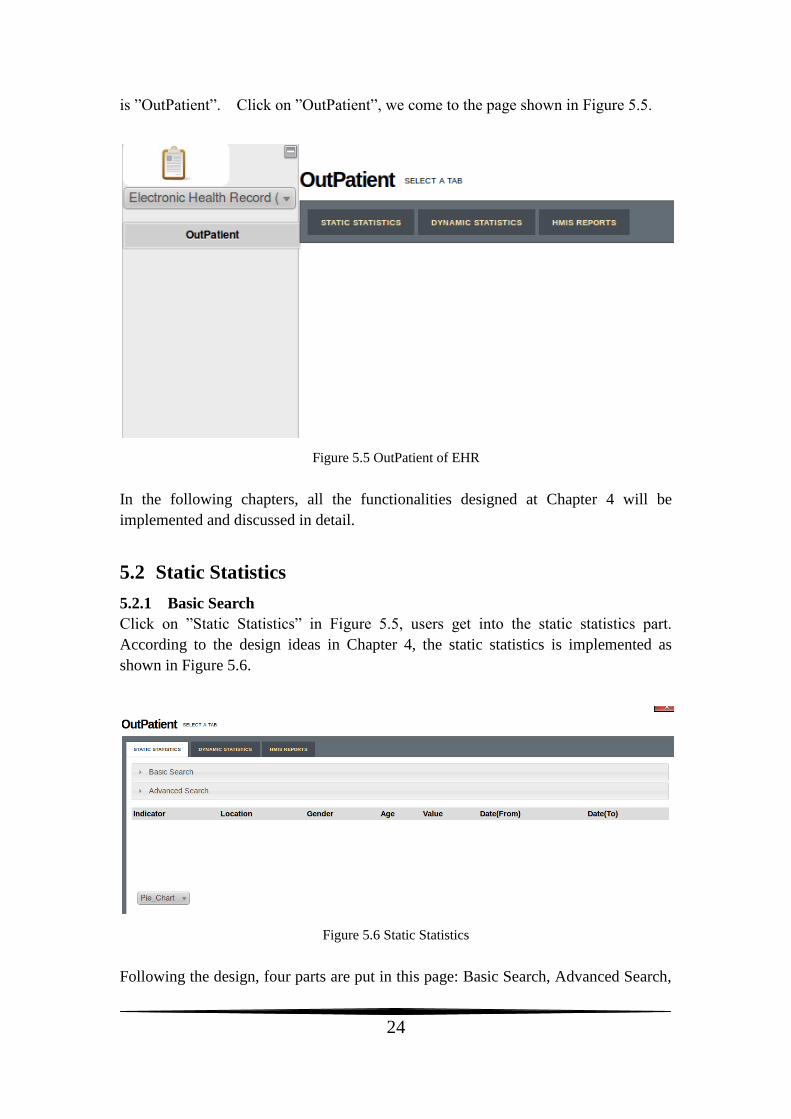
Figure 5.5 OutPatient of EHR
In the following chapters, all the functionalities designed at Chapter 4 will be
implemented and discussed in detail.
5.2 Static Statistics
5.2.1 Basic Search
Click on ”Static Statistics” in Figure 5.5, users get into the static statistics part.
According to the design ideas in Chapter 4, the static statistics is implemented as
shown in Figure 5.6.
Figure 5.6 Static Statistics
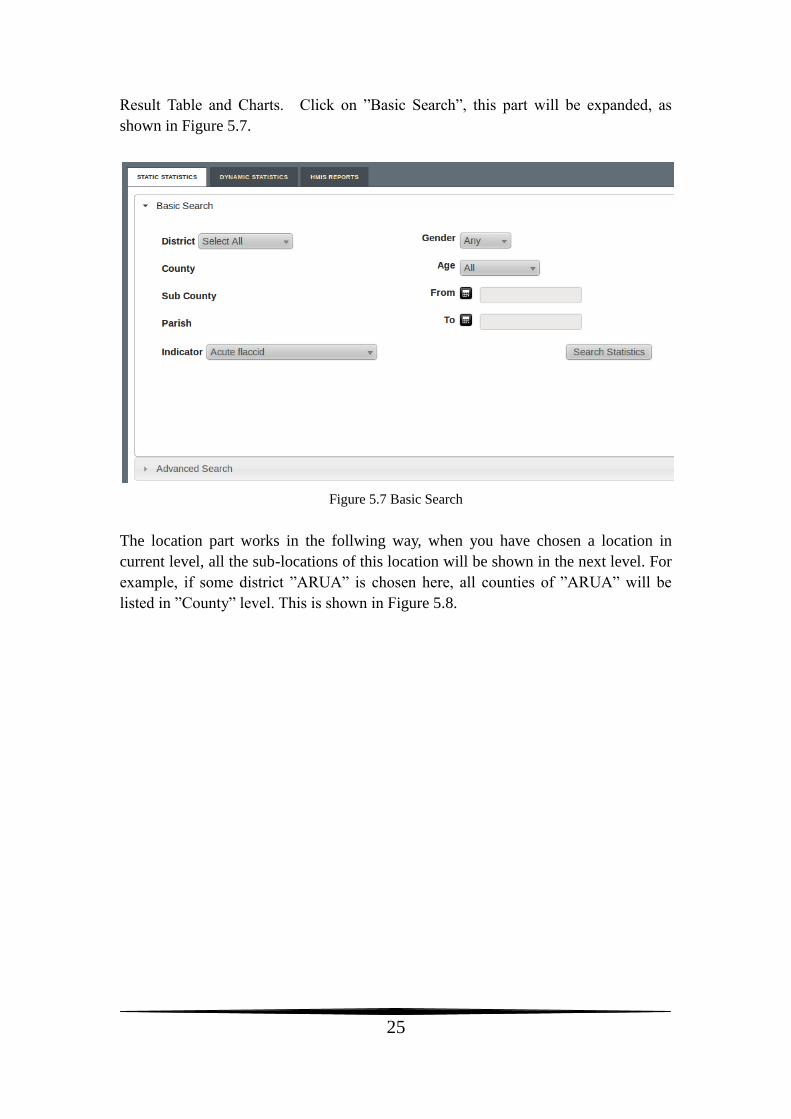
Following the design, four parts are put in this page: Basic Search, Advanced Search,
25
Result Table and Charts. Click on ”Basic Search”, this part will be expanded, as
shown in Figure 5.7.
Figure 5.7 Basic Search
The location part works in the follwing way, when you have chosen a location in
current level, all the sub-locations of this location will be shown in the next level. For
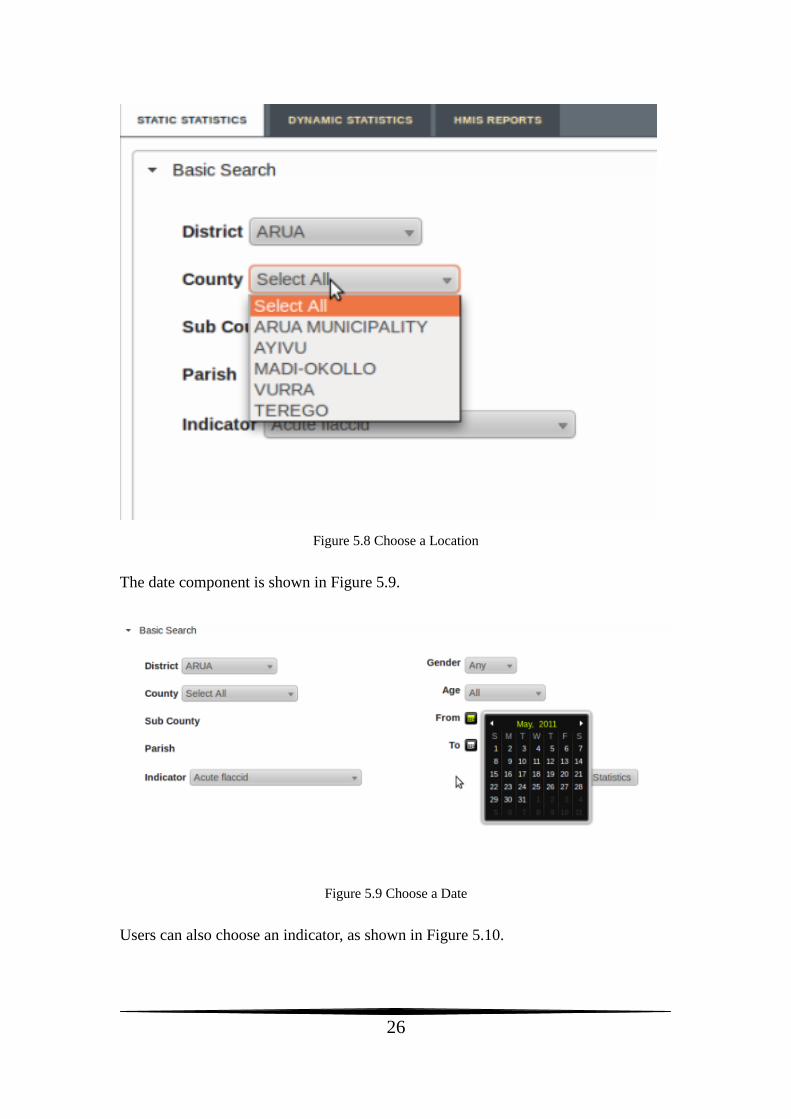
example, if some district ”ARUA” is chosen here, all counties of ”ARUA” will be
listed in ”County” level. This is shown in Figure 5.8.
26
Figure 5.8 Choose a Location
The date component is shown in Figure 5.9.
Figure 5.9 Choose a Date
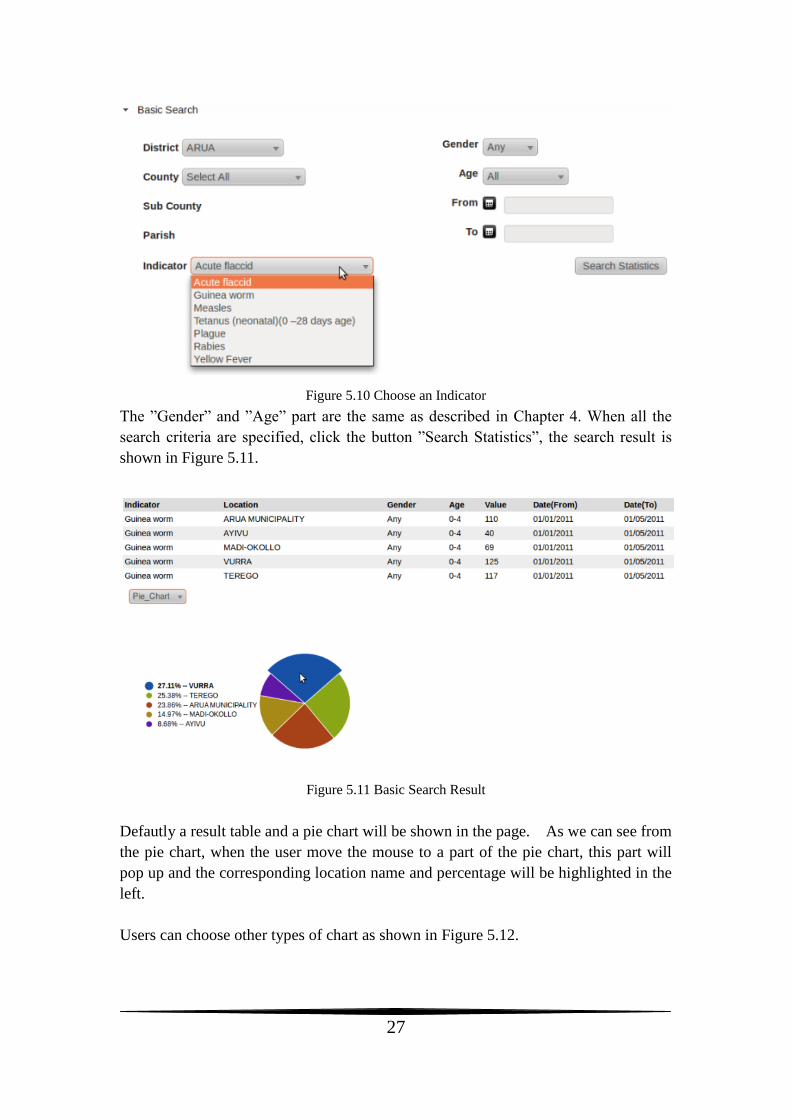
Users can also choose an indicator, as shown in Figure 5.10.
27
Figure 5.10 Choose an Indicator
The ”Gender” and ”Age” part are the same as described in Chapter 4. When all the
search criteria are specified, click the button ”Search Statistics”, the search result is
shown in Figure 5.11.
Figure 5.11 Basic Search Result
Defautly a result table and a pie chart will be shown in the page. As we can see from
the pie chart, when the user move the mouse to a part of the pie chart, this part will
pop up and the corresponding location name and percentage will be highlighted in the
left.
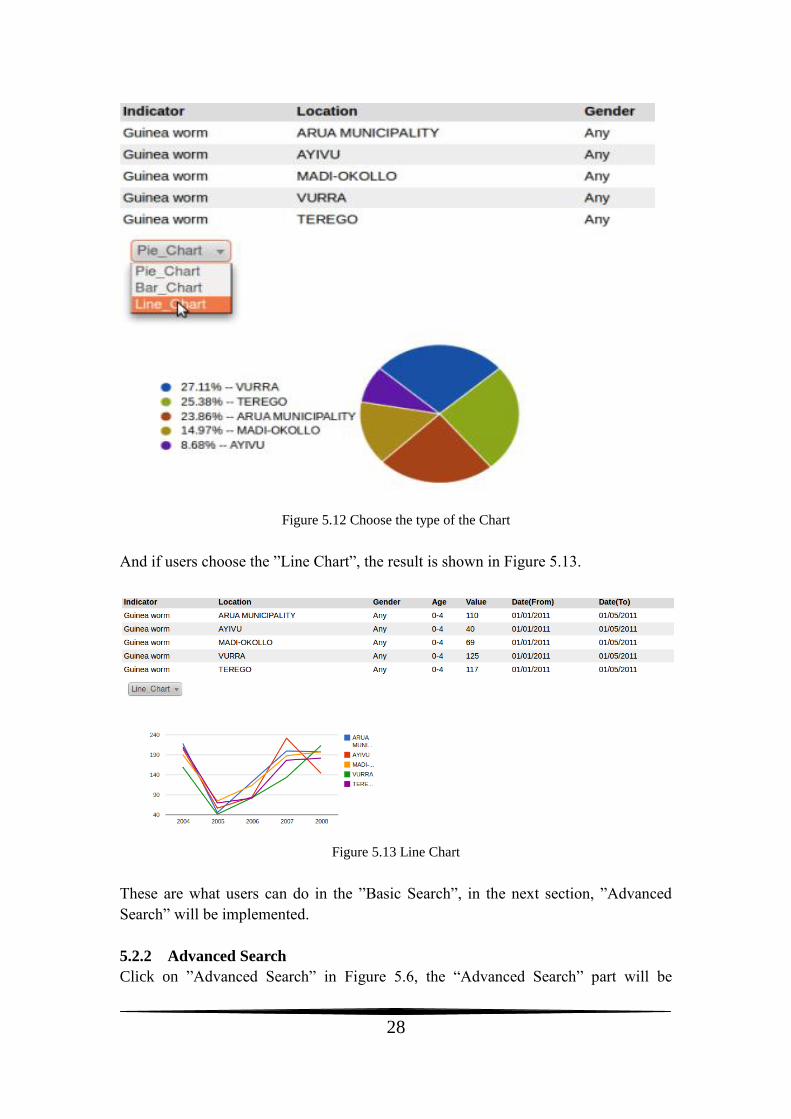
Users can choose other types of chart as shown in Figure 5.12.
28
Figure 5.12 Choose the type of the Chart
And if users choose the ”Line Chart”, the result is shown in Figure 5.13.
Figure 5.13 Line Chart
These are what users can do in the ”Basic Search”, in the next section, ”Advanced
Search” will be implemented.
5.2.2 Advanced Search
Click on ”Advanced Search” in Figure 5.6, the “Advanced Search” part will be
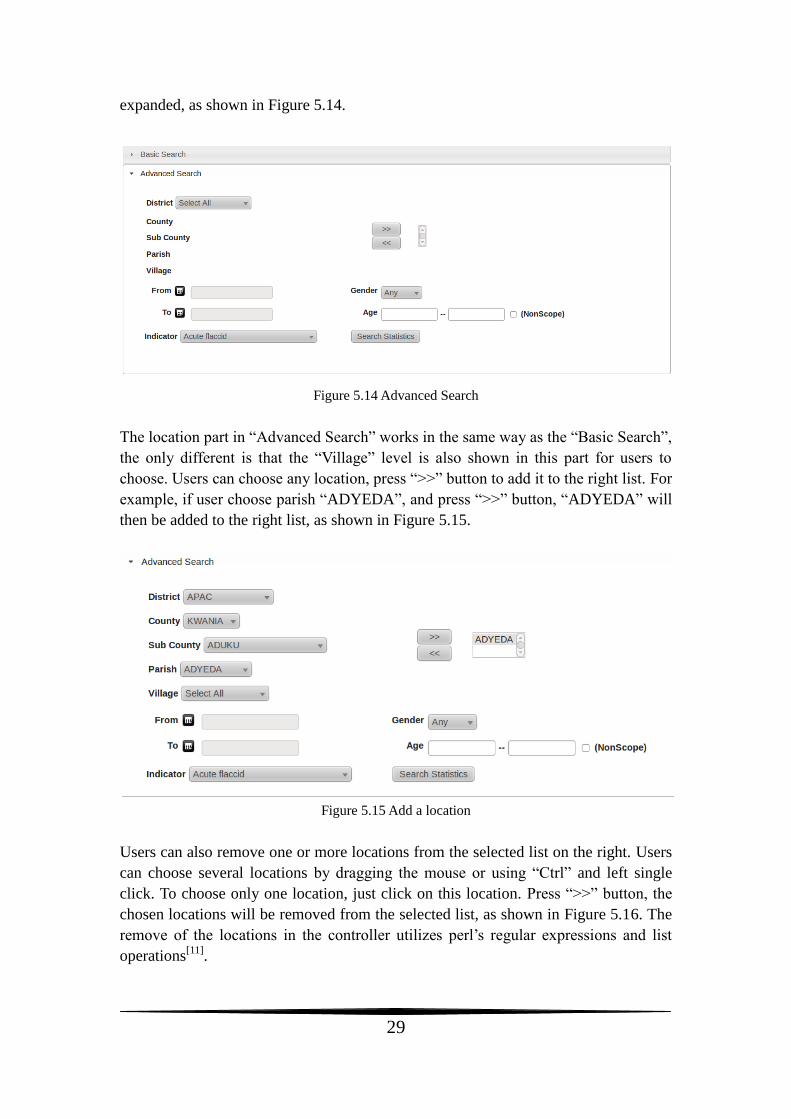
29
expanded, as shown in Figure 5.14.
Figure 5.14 Advanced Search
The location part in “Advanced Search” works in the same way as the “Basic Search”,
the only different is that the “Village” level is also shown in this part for users to
choose. Users can choose any location, press “>>” button to add it to the right list. For
example, if user choose parish “ADYEDA”, and press “>>” button, “ADYEDA” will
then be added to the right list, as shown in Figure 5.15.
Figure 5.15 Add a location
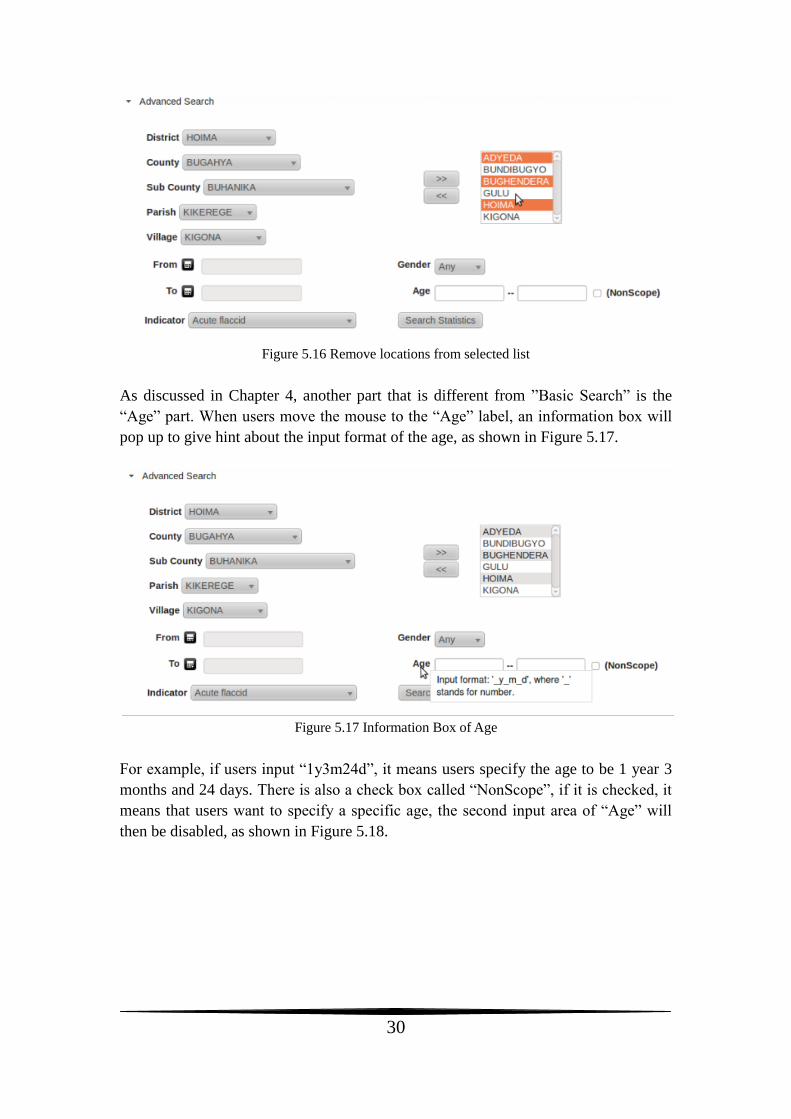
Users can also remove one or more locations from the selected list on the right. Users
can choose several locations by dragging the mouse or using “Ctrl” and left single
click. To choose only one location, just click on this location. Press “>>” button, the
chosen locations will be removed from the selected list, as shown in Figure 5.16. The
remove of the locations in the controller utilizes perl’s regular expressions and list
operations[11]
.
30
Figure 5.16 Remove locations from selected list
As discussed in Chapter 4, another part that is different from ”Basic Search” is the
“Age” part. When users move the mouse to the “Age” label, an information box will
pop up to give hint about the input format of the age, as shown in Figure 5.17.
Figure 5.17 Information Box of Age
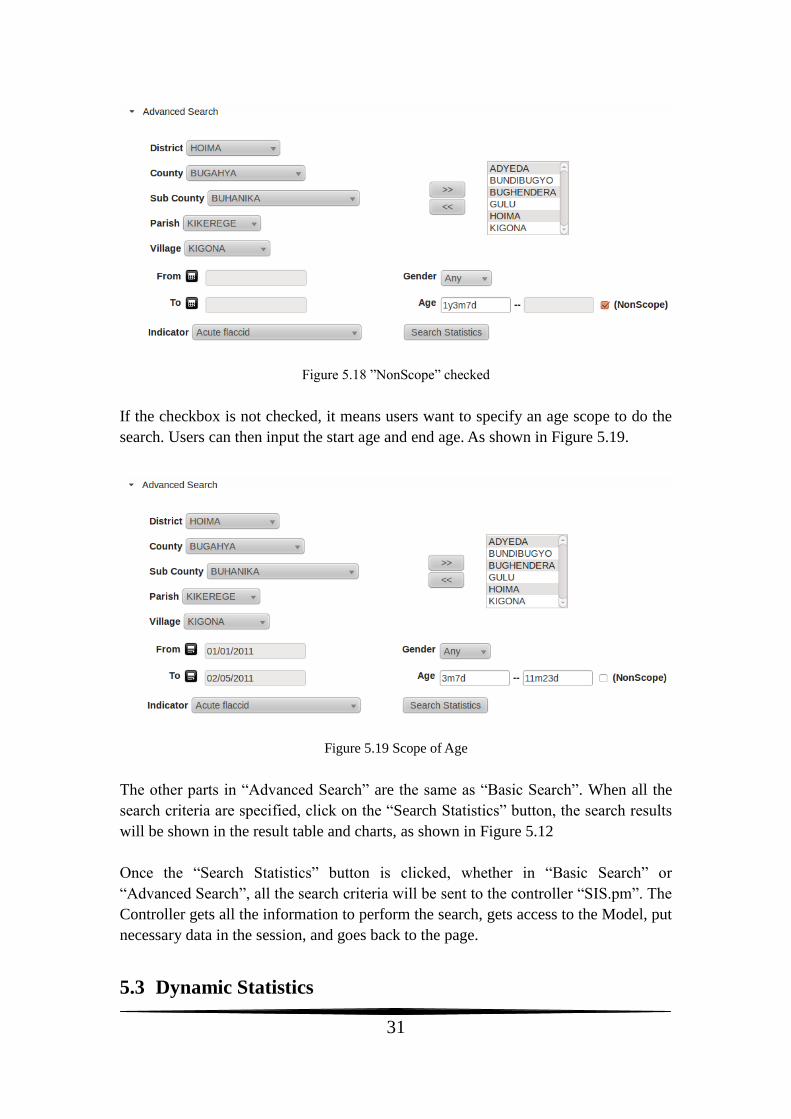
For example, if users input “1y3m24d”, it means users specify the age to be 1 year 3
months and 24 days. There is also a check box called “NonScope”, if it is checked, it
means that users want to specify a specific age, the second input area of “Age” will
then be disabled, as shown in Figure 5.18.
31
Figure 5.18 ”NonScope” checked
If the checkbox is not checked, it means users want to specify an age scope to do the
search. Users can then input the start age and end age. As shown in Figure 5.19.
Figure 5.19 Scope of Age
The other parts in “Advanced Search” are the same as “Basic Search”. When all the
search criteria are specified, click on the “Search Statistics” button, the search results
will be shown in the result table and charts, as shown in Figure 5.12
Once the “Search Statistics” button is clicked, whether in “Basic Search” or
“Advanced Search”, all the search criteria will be sent to the controller “SIS.pm”. The
Controller gets all the information to perform the search, gets access to the Model, put
necessary data in the session, and goes back to the page.
5.3 Dynamic Statistics
32
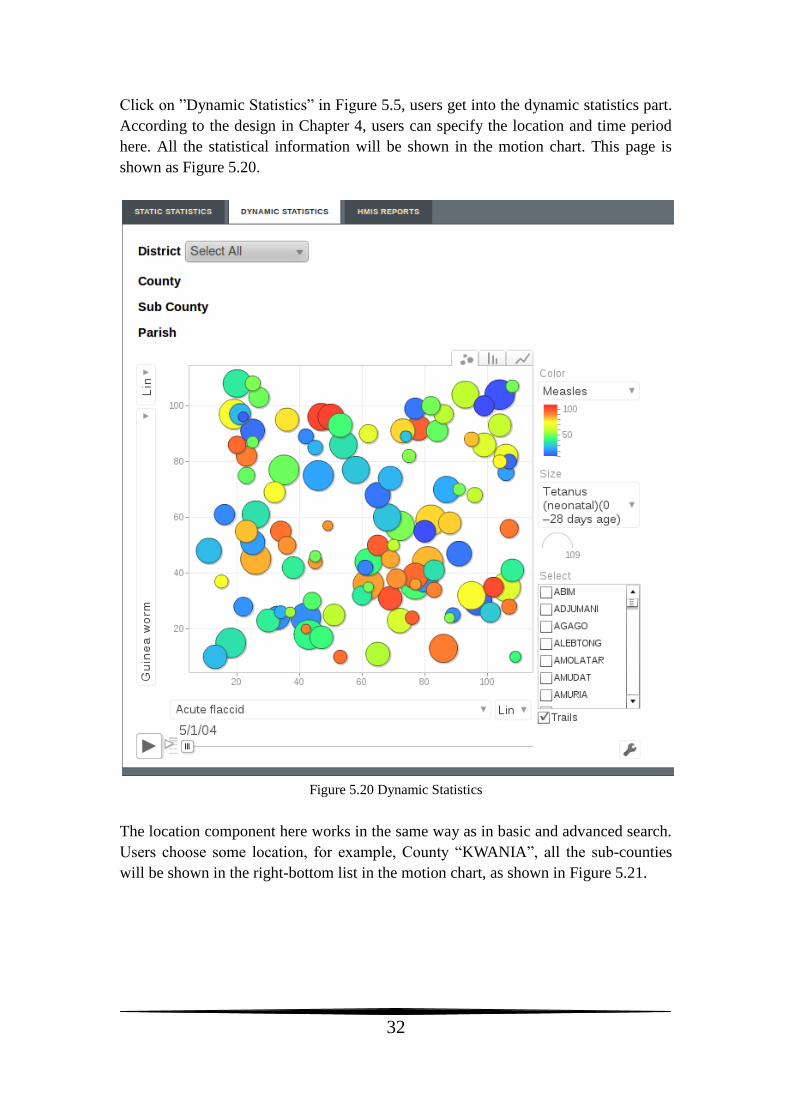
Click on ”Dynamic Statistics” in Figure 5.5, users get into the dynamic statistics part.
According to the design in Chapter 4, users can specify the location and time period
here. All the statistical information will be shown in the motion chart. This page is
shown as Figure 5.20.
Figure 5.20 Dynamic Statistics
The location component here works in the same way as in basic and advanced search.
Users choose some location, for example, County “KWANIA”, all the sub-counties
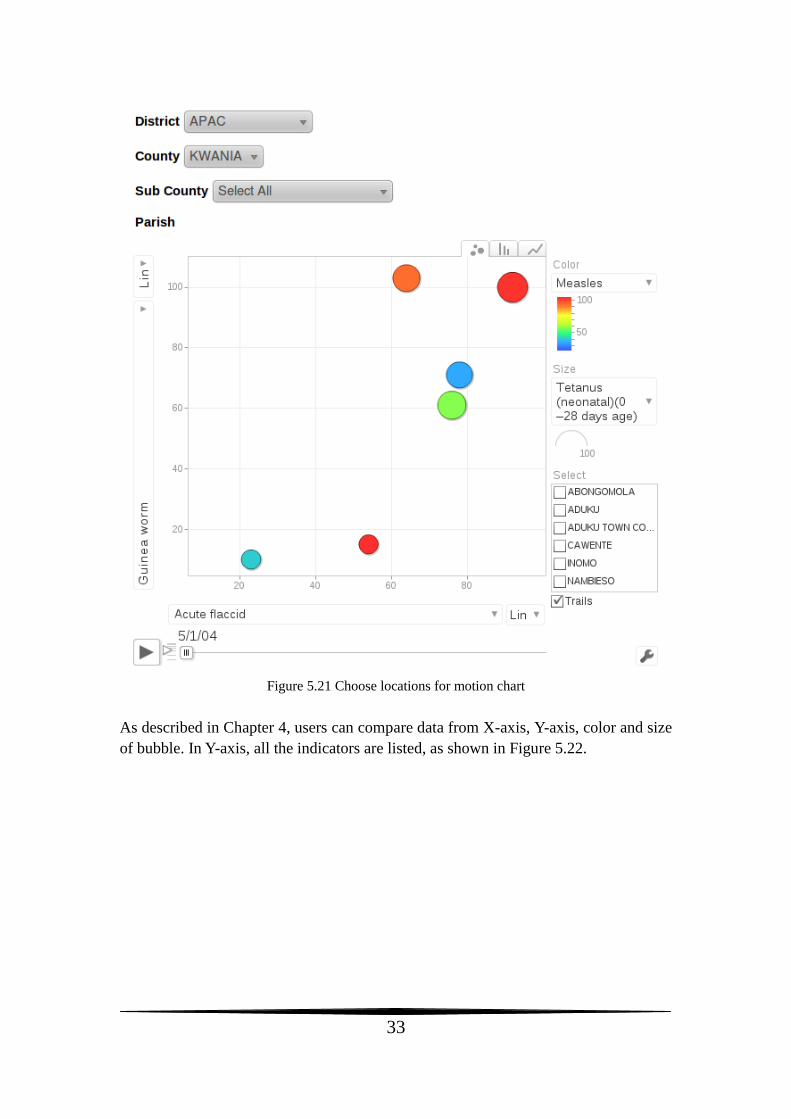
will be shown in the right-bottom list in the motion chart, as shown in Figure 5.21.
33
Figure 5.21 Choose locations for motion chart
As described in Chapter 4, users can compare data from X-axis, Y-axis, color and size
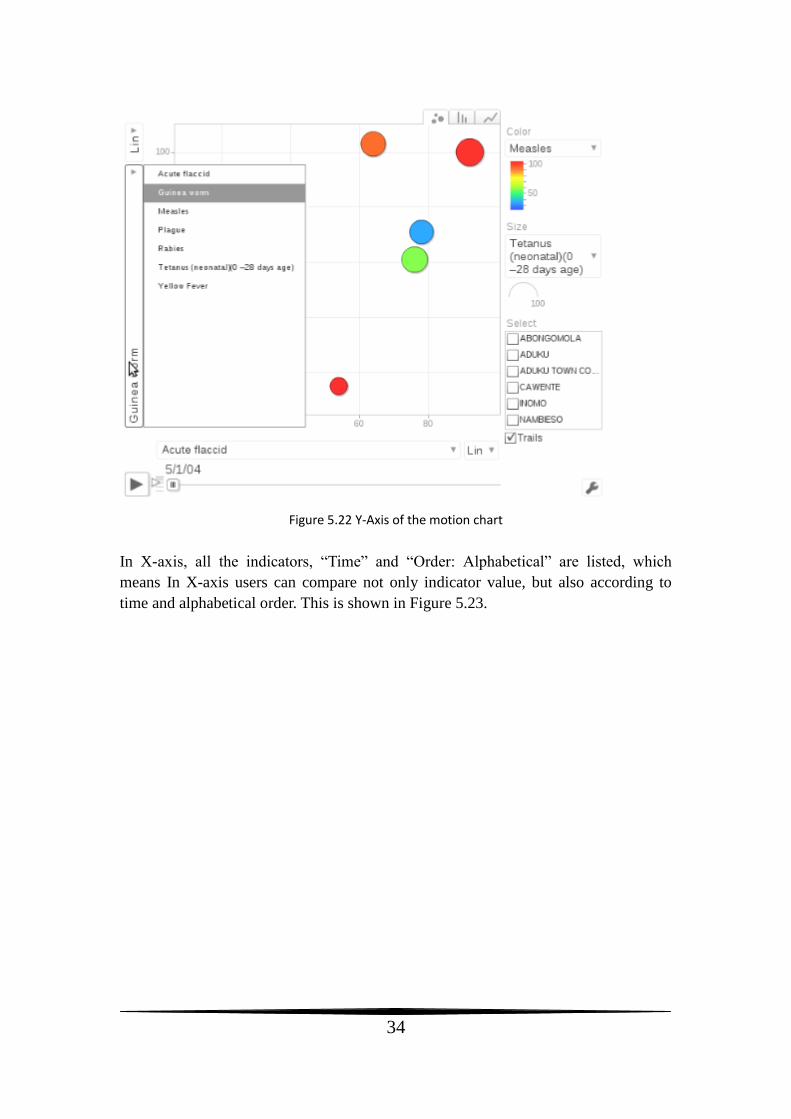
of bubble. In Y-axis, all the indicators are listed, as shown in Figure 5.22.
34
Figure 5.22 Y-Axis of the motion chart
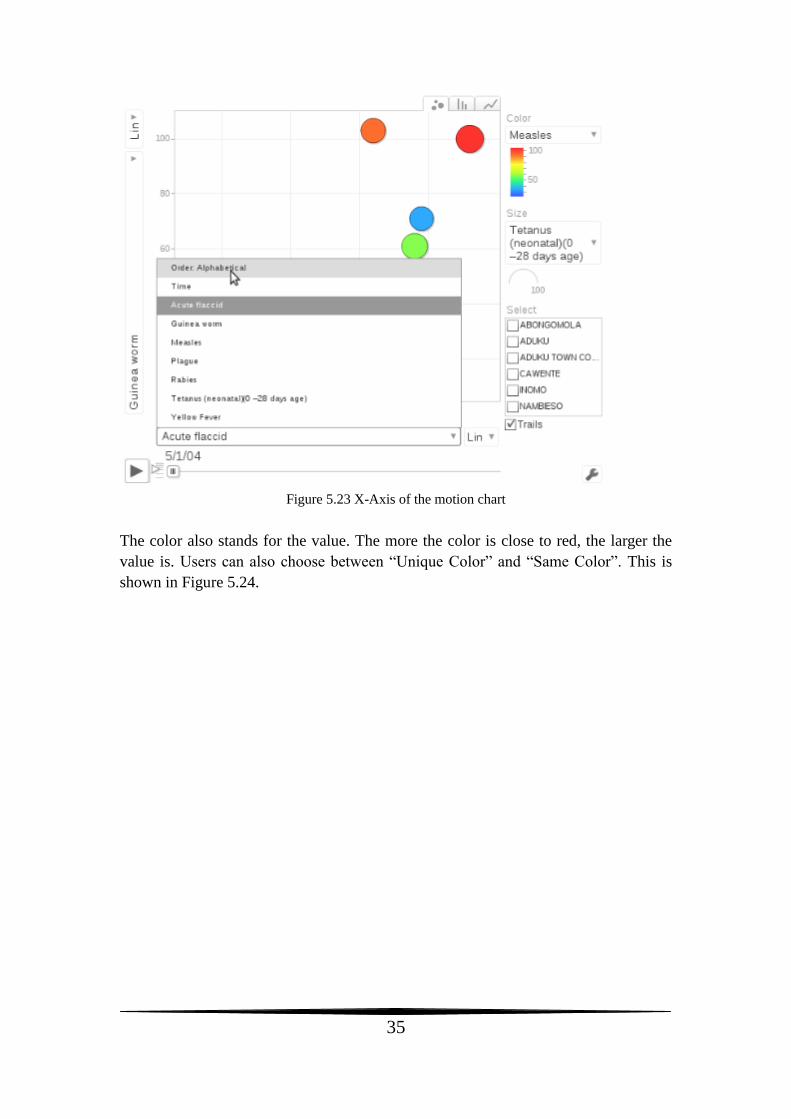
In X-axis, all the indicators, “Time” and “Order: Alphabetical” are listed, which
means In X-axis users can compare not only indicator value, but also according to
time and alphabetical order. This is shown in Figure 5.23.
35
Figure 5.23 X-Axis of the motion chart
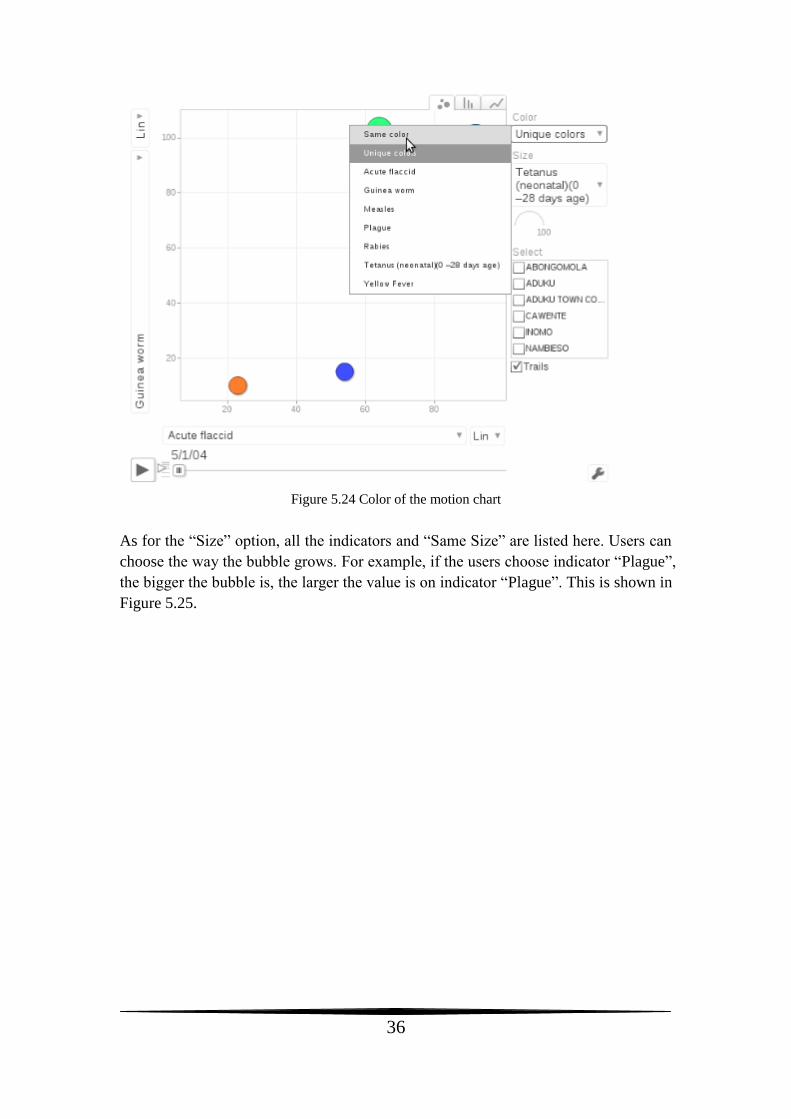
The color also stands for the value. The more the color is close to red, the larger the
value is. Users can also choose between “Unique Color” and “Same Color”. This is
shown in Figure 5.24.
36
Figure 5.24 Color of the motion chart
As for the “Size” option, all the indicators and “Same Size” are listed here. Users can
choose the way the bubble grows. For example, if the users choose indicator “Plague”,
the bigger the bubble is, the larger the value is on indicator “Plague”. This is shown in
Figure 5.25.
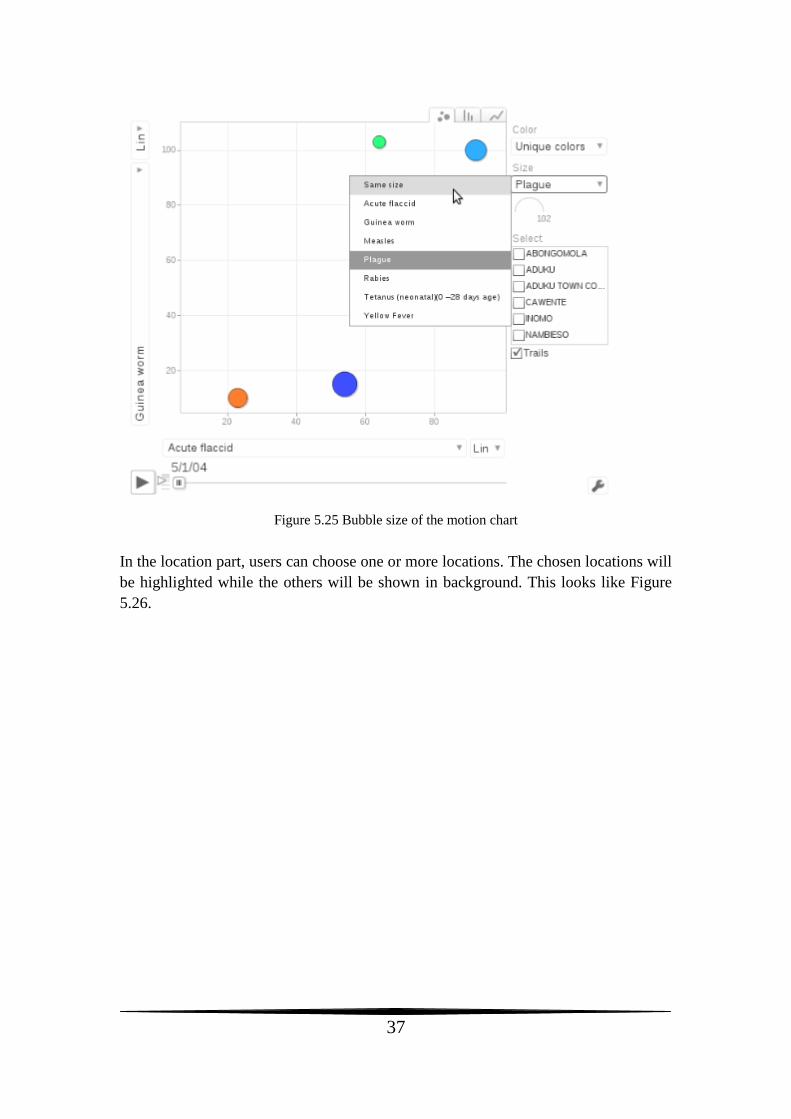
37
Figure 5.25 Bubble size of the motion chart
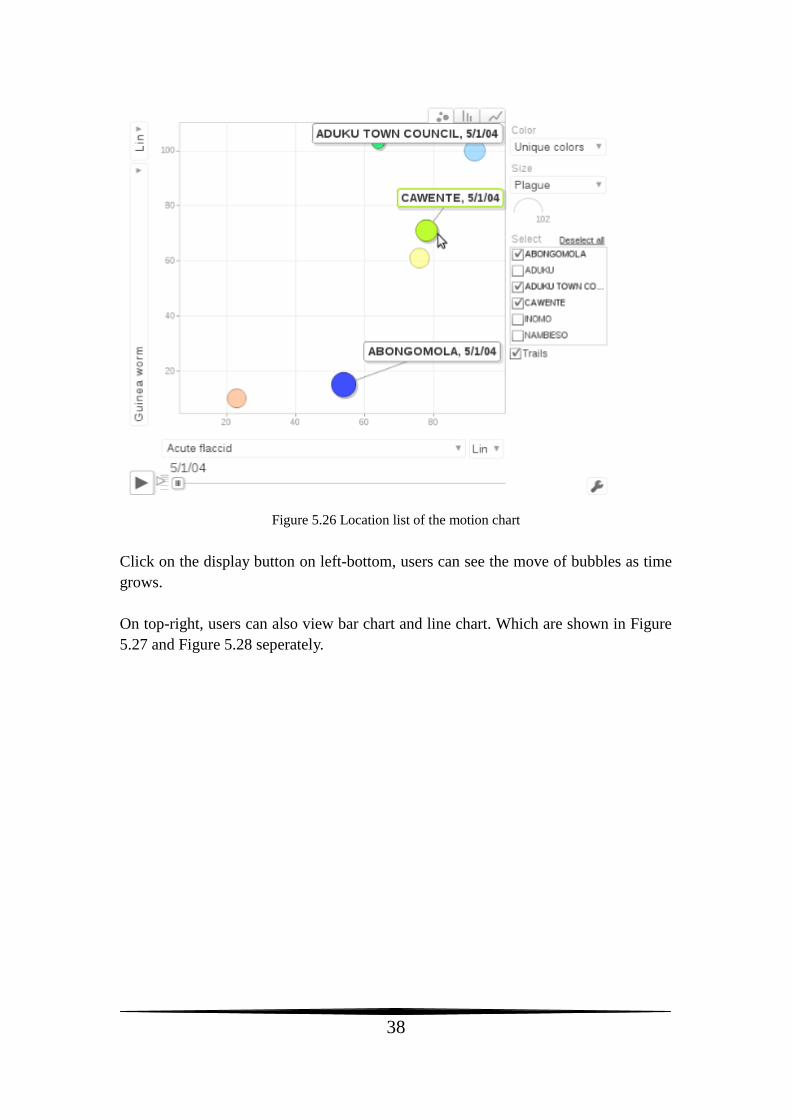
In the location part, users can choose one or more locations. The chosen locations will
be highlighted while the others will be shown in background. This looks like Figure
5.26.
38
Figure 5.26 Location list of the motion chart
Click on the display button on left-bottom, users can see the move of bubbles as time
grows.
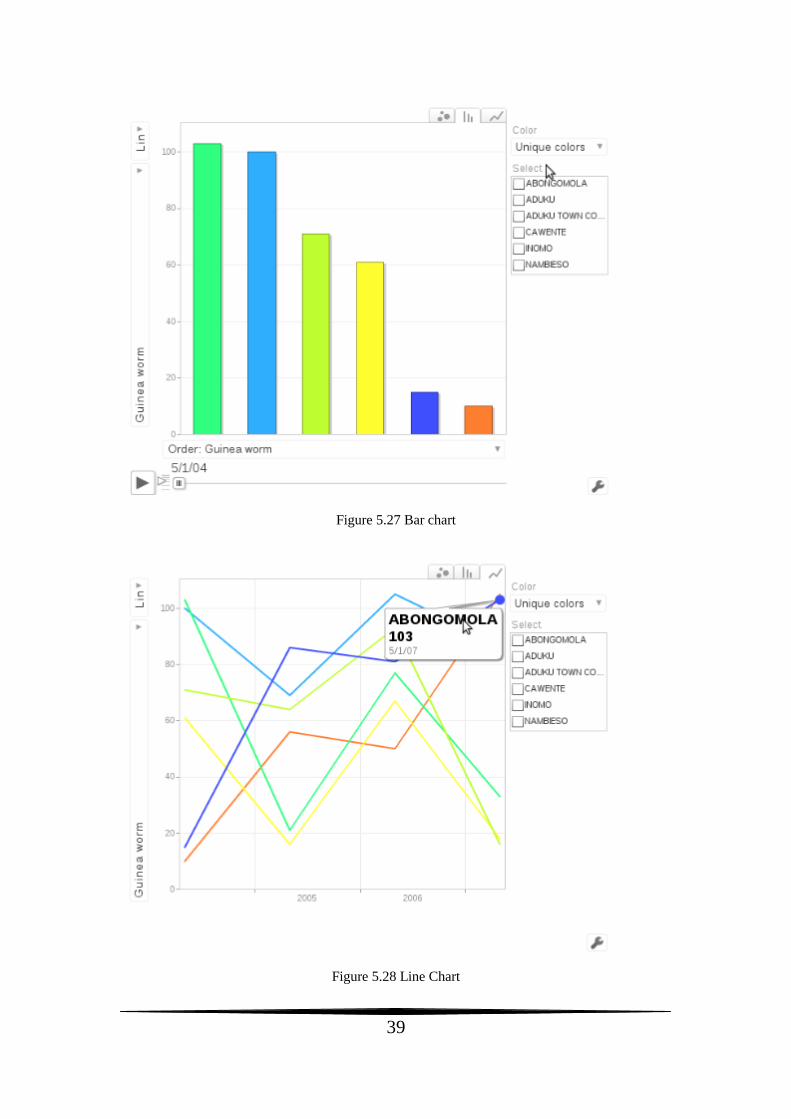
On top-right, users can also view bar chart and line chart. Which are shown in Figure
5.27 and Figure 5.28 seperately.
39
Figure 5.27 Bar chart
Figure 5.28 Line Chart
40
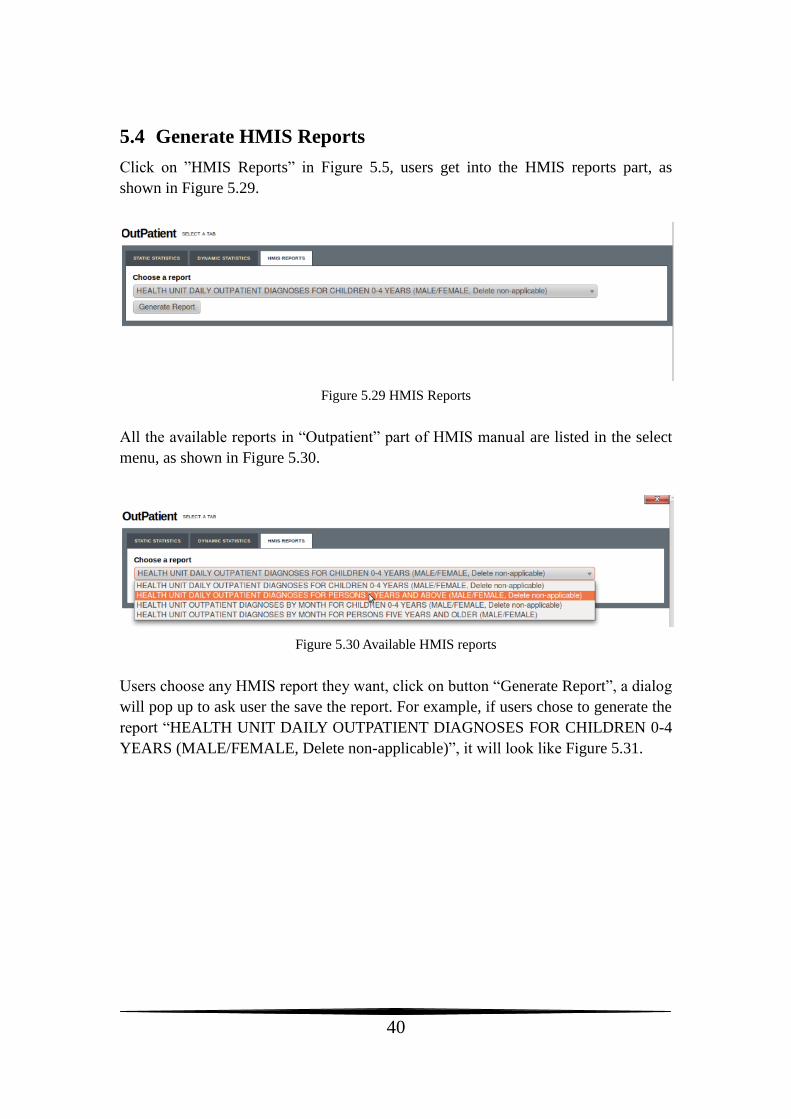
5.4 Generate HMIS Reports
Click on ”HMIS Reports” in Figure 5.5, users get into the HMIS reports part, as
shown in Figure 5.29.
Figure 5.29 HMIS Reports
All the available reports in “Outpatient” part of HMIS manual are listed in the select
menu, as shown in Figure 5.30.
Figure 5.30 Available HMIS reports
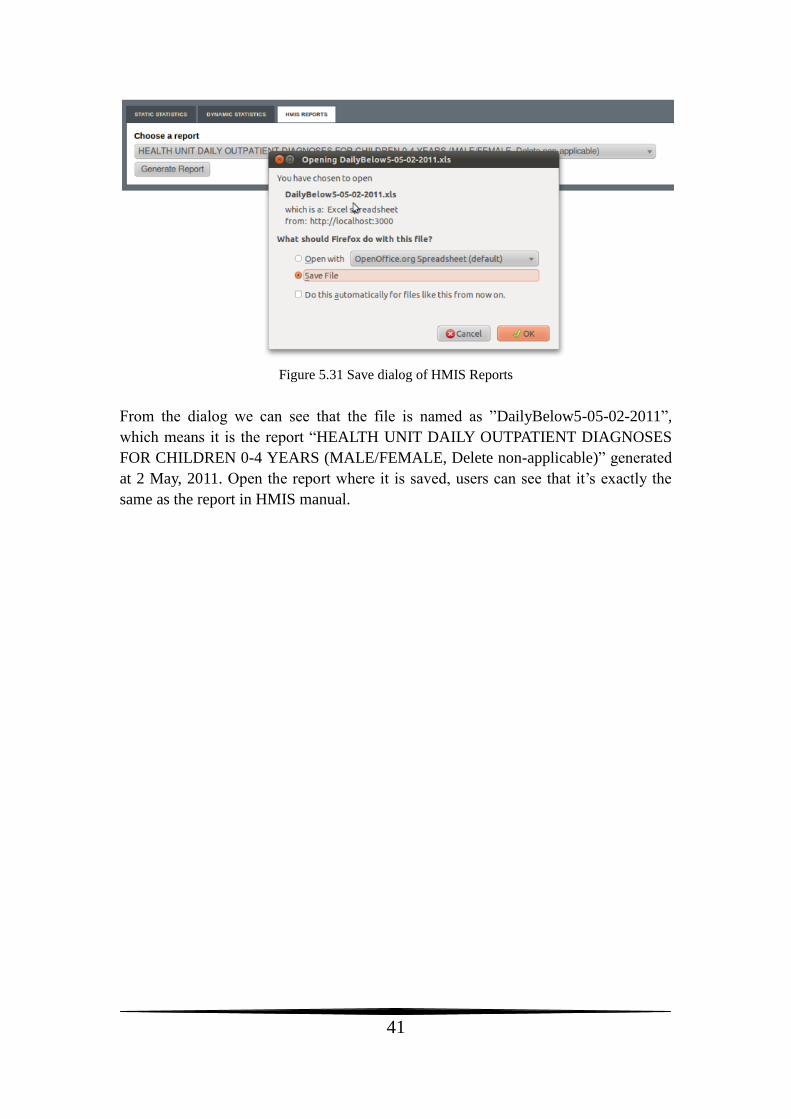
Users choose any HMIS report they want, click on button “Generate Report”, a dialog
will pop up to ask user the save the report. For example, if users chose to generate the
report “HEALTH UNIT DAILY OUTPATIENT DIAGNOSES FOR CHILDREN 0-4
YEARS (MALE/FEMALE, Delete non-applicable)”, it will look like Figure 5.31.
41
Figure 5.31 Save dialog of HMIS Reports
From the dialog we can see that the file is named as ”DailyBelow5-05-02-2011”,
which means it is the report “HEALTH UNIT DAILY OUTPATIENT DIAGNOSES
FOR CHILDREN 0-4 YEARS (MALE/FEMALE, Delete non-applicable)” generated
at 2 May, 2011. Open the report where it is saved, users can see that it’s exactly the
same as the report in HMIS manual.
42
6. Conclusion and Outlook
In this thesis, we did investigations about statistical requirements in Uganda,
Designed the statistical information system based on these requirements and
implemented it.
The thesis report starts by introducing the background of Uganda’s medical
infrastructure and statistical requirements. In Chapter 2, the technical architecture of
the whole project is studied to define the position of the statistical information system
in the whole project. Taking the consideration of an existing statistical tool, which is
DHIS 2, we did the evaluation of this tool to see whether it is good to be used as our
statistical information system, if not, what could we learn from this international tool?
Based on all these discussions, in Chapter 4, we started to design our own statistical
information system. Following these design ideas, the statistical information system is
implemented in detail. The screenshots and evaluation are also given in Chapter 5.
Generally, this system is not strong enough yet to be put into real use in Uganda. But
the writer believes that the design ideas of this statistical information system meet
most of Uganda’s needs. To put it into real use, more refinements, refactoring and
testing need to be done.
Also there are some possible improvements that have not been covered in this thesis
report. The system could provide the functionality to generate not only the standard
HMIS reports, but the report about the search results.
Data mining could also be done in the statistical information system, with huge
amount of data in the database, we could generate rules about this data, for example,
we find the characteristics of the group of patients that get the disease diabetes, for the
new registered patient, from their characteristics, we can then do the prediction about
who has bigger chance to get diabetes, so proper prevention can be made to these
patients.
As for the motion chart, it’s still under development by Google, when there are more
APIs available, the Dynamic Statistics could be made more close to Gapminder.
Since Uganda in one of the typical developing countries, this statistical actually
provides a roadmap for the development of statistical information system for other
developing countries. Once a matura version of this system is developed, it can be
reused by many other developing countries.

43
Acknowledgement
First of all, I am very grateful for my supervisor Rustam Nabiev from Karolinska
Hospital, whose help, supervision and support from the very beginning to the end of
this thesis research encourage me to go through any difficulties that I encountered. I
am grateful to any help from Alvin Mattsson Kjellqvist, my colleague throughout the
whole period, all collaborations and discussions with him worked well to smooth my
work.
It is my great honour to have Mats Daniels from Uppsala University as my reviewer.
Many thanks for his trust and any valuable suggestion on my thesis report.
Besides, I should give my thanks to all colleges working for the “ICT4MPOWER” at
the department of Biomedical Engineering, Karolinska University Hospital, the time
of working and having fun with all of you is indeed a very cherish and happy memory
for me.
Finally, I own my heartily gratitude to my family, and friends both in China and
Sweden. Without all their supports, my study and life would not be going so well.
44
Bibiography
[1] Orc Macro. 2006. “Uganda Demographic and Health Survey 2006”.
[2] Husein K, Adeyi O, Bryant J, Cara NB. 1993. ”Developing a primary health care
management information system that supports the pursuit of equity, effectiveness and
affordability”. Social Science and Medicine 36: 585–96.
[3] Gladwin J, Dixon RA and Wilson TD. 2003. “Implementing a new health
management information system in Uganda”. Oxford University Press 18(2).
[4] Peter Kintu, Miriam Nanyunja, Amos Nzabanita, Ruth Magoola.
2005. ”Development of HMIS in poor countries: Uganda as a case study”. UMU
Press 3(1): 46-53
[5] Rustam Nabiev. 2010. “Technical Architecture for Electronic Health Record
System”.
[6] District Health Information Software 2. Available: http://dhis2.com/.
[7] Uganda, M.o.H. Healthcare Management Information System Manual.
[8] Official Website of Google’s Visualization: Motion Chart. Available:
http://code.google.com/apis/visualization/documentation/gallery/motionchart.html.
[9] Catalyst Web Framework. Available: http://www.catalystframework.org/.
[10] Kieren Diment and Matt S Trout. “The Definitive Guide to Catalyst”. APress,
2009:12.
[11] Randal L., Schwartz, Tom Phoenix and brian d foy. “Learning Perl”. US:
O’REILLY, 2008:28.