Embed Size (px)
DESCRIPTION
Statistik
Citation preview

SULAWESI TENGGARA DALAM ANGKA
SULAWESI TENGGARA IN FIGURES
2013
SULAWESI TENGGARA DALAM ANGKA 2013 SULAWESI TENGGARA IN FIGURES 2013 I S S N : 0215.2304 NomorPublikasi/Publication Number : 74000.1201 Katalog BPS / BPS Catalogue : 1102001.74 UkuranBuku/ Book Size : 21 x 15 cm JumlahHalaman/ Number of Pages : 522 Pages Naskah/ Manuscript : Badan Pusat Statistik Provinsi Sulawesi Tenggara BPS Provincial Office of Sulawesi Tenggara Gambar Kulit/ Cover Design : Bidang Integrasi Pengolahan dan Diseminasi Statistik Divison of Integrated Procesing and Statistical Dissemination Penyunting/ Editor : Bidang Integrasi Pengolahan dan Diseminasi Statistik Divison of Integrated Procesing and Statistical Dissemination Diterbitkan Oleh/Published By : Badan Pusat Statistik Provinsi Sulawesi Tenggara BPS Provincial Office of Sulawesi Tenggara Dicetak Oleh/ Printed By : CV. PRIMATAMA SULTRA
Boleh dikutip dengan menyebutkan sumbernya May be cited with reference to the source
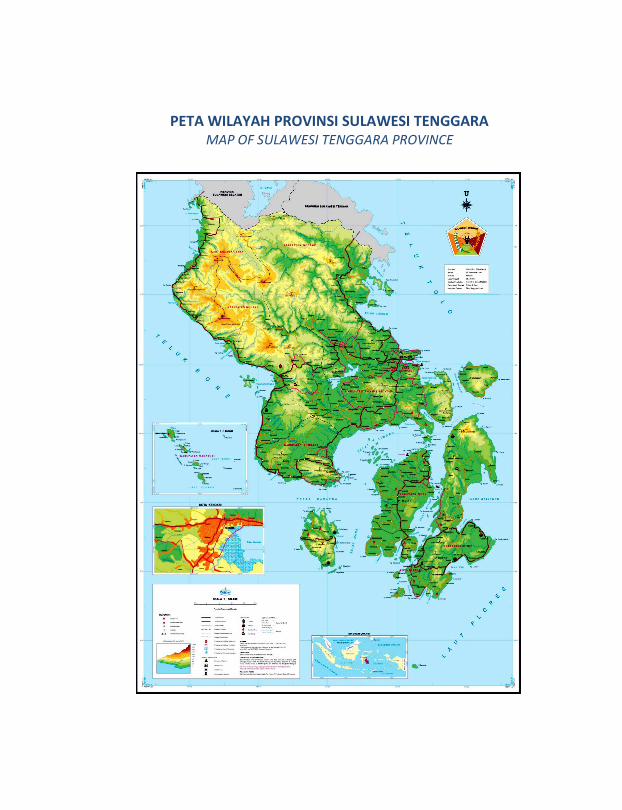
PETA WILAYAH PROVINSI SULAWESI TENGGARA MAP OF SULAWESI TENGGARA PROVINCE


Lambang Provinsi Sulawesi Tenggara
Symbol Of Sulawesi Tenggara Province

vii
MEANING OF SYMBOL
Sulawesi Tenggara in Figures 2013
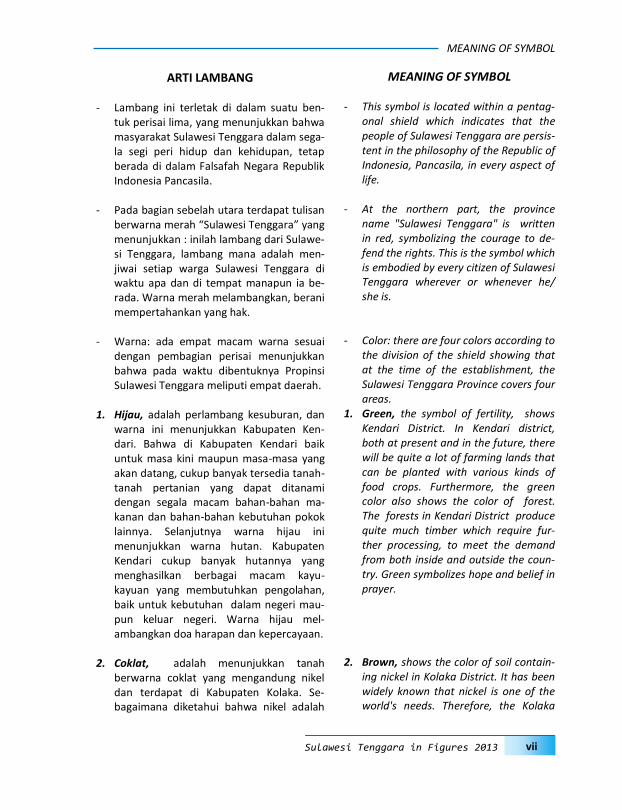
ARTI LAMBANG - Lambang ini terletak di dalam suatu ben-
tuk perisai lima, yang menunjukkan bahwa masyarakat Sulawesi Tenggara dalam sega-la segi peri hidup dan kehidupan, tetap berada di dalam Falsafah Negara Republik Indonesia Pancasila.
- Pada bagian sebelah utara terdapat tulisan
berwarna merah “Sulawesi Tenggara” yang menunjukkan : inilah lambang dari Sulawe-si Tenggara, lambang mana adalah men-jiwai setiap warga Sulawesi Tenggara di waktu apa dan di tempat manapun ia be-rada. Warna merah melambangkan, berani mempertahankan yang hak.
- Warna: ada empat macam warna sesuai
dengan pembagian perisai menunjukkan bahwa pada waktu dibentuknya Propinsi Sulawesi Tenggara meliputi empat daerah.
1. Hijau, adalah perlambang kesuburan, dan
warna ini menunjukkan Kabupaten Ken-dari. Bahwa di Kabupaten Kendari baik untuk masa kini maupun masa-masa yang akan datang, cukup banyak tersedia tanah-tanah pertanian yang dapat ditanami dengan segala macam bahan-bahan ma-kanan dan bahan-bahan kebutuhan pokok lainnya. Selanjutnya warna hijau ini menunjukkan warna hutan. Kabupaten Kendari cukup banyak hutannya yang menghasilkan berbagai macam kayu-kayuan yang membutuhkan pengolahan, baik untuk kebutuhan dalam negeri mau-pun keluar negeri. Warna hijau mel-ambangkan doa harapan dan kepercayaan.
2. Coklat, adalah menunjukkan tanah
berwarna coklat yang mengandung nikel dan terdapat di Kabupaten Kolaka. Se-bagaimana diketahui bahwa nikel adalah
MEANING OF SYMBOL
- This symbol is located within a pentag-onal shield which indicates that the people of Sulawesi Tenggara are persis-tent in the philosophy of the Republic of Indonesia, Pancasila, in every aspect of life.
- At the northern part, the province
name "Sulawesi Tenggara" is written in red, symbolizing the courage to de-fend the rights. This is the symbol which is embodied by every citizen of Sulawesi Tenggara wherever or whenever he/she is.
- Color: there are four colors according to
the division of the shield showing that at the time of the establishment, the Sulawesi Tenggara Province covers four areas.
1. Green, the symbol of fertility, shows Kendari District. In Kendari district, both at present and in the future, there will be quite a lot of farming lands that can be planted with various kinds of food crops. Furthermore, the green color also shows the color of forest. The forests in Kendari District produce quite much timber which require fur-ther processing, to meet the demand from both inside and outside the coun-try. Green symbolizes hope and belief in prayer.
2. Brown, shows the color of soil contain-
ing nickel in Kolaka District. It has been widely known that nickel is one of the world's needs. Therefore, the Kolaka

viii
ARTI LAMBANG
Sulawesi Tenggara Dalam Angka 2013
merupakan kebutuhan dunia., dimana nikel yang terdapat di Kabupaten Kolaka mempunyai daerah yang cukup luas serta kadar yang tinggi. Dengan nikel ini, Sulawe-si Tenggara sudah dikenal dengan dunia luar.
3. Kuning, adalah menunjukkan warna kayu
jati yang terdapat di Kabupaten Muna. Kayu jati termasuk salah satu jenis kayu yang disenangi di dalam dan di luar negeri. Melalui kayu jati dari pulau Muna Sulawesi Tenggara dikenal oleh daerah-daerah lain di Indonesia maupun oleh dunia luar. Warna kuning melambangkan kejayaan masa silam, sekarang dan masa menda-tang, keluhuran yang bijaksana dan cen-dekia.
4. Hitam, adalah menunjukkan warna aspal
yang terdapat cukup banyak di Kabupaten Buton. Aspal Buton ini udah dikenal sejak dahulu dan telah memberikan andilnya pada pembangunan tanah air kita khu-susnya dibidang prasarana jalan. Warna hitam melambangkan kemantapan, keteguhan dan kekekalan.
- Keempat macam warna ini selain mel-
ambangkan jumlah kabupaten yang ada pada saat terbentuknya Provinsi Sulawesi Tenggara, juga sekaligus menunjukkan potensi yang ada di daerah ini cukup ban-yak, yang memberikan jaminan untuk ma-sa depan daerah ini guna tercapainya ke-makmuran dan keadilan yang diidam-idamkan.
- Dan inilah makna dan pengertian yang
dikandung “padi dan kapas” yang secara nasional telah dikenal sebagai lambang untuk kemakmuran dan keadilan. Butir padi yang terdiri dari 17 butir, mel-ambangkan tanggal 17, buah kapas yang
district in Sulawesi Tenggara Province which contains a high level of nickel beneath, is widely known around the world.
3. Yellow, indicates the color of teak
located in Muna District. Teak is one of the most preferable types of wood in-side and outside the country. Through the teak from Muna island, Sulawesi Tenggara is known by other regions, both in Indonesia and other countries. Yellow symbolizes the triumph of the past, present and future, the wise nobil-ity and scholars.
4. Black, shows the color of asphalt which
can be found quite a lot in Buton. Buton asphalt has been known since long ago and has given its contribution for the development in our country, especially in the field of road infrastructure. The black color symbolizes stability, strength and eternity.
- The four colors, in addition to repre-
senting the number of districts in Sula-wesi Tenggara Province when it was established, also shows that in this area, there are a lot of potentials which guarantee the future of this region in order to achieve prosperity and justice coveted.
- Following is the meaning of "paddy and
cotton," which have been widely known as the symbol of prosperity and justice. There are 17 grains of paddy, 8 buds of cotton, with 4 green and 5 white. These figures stand for the date of Indone-

ix
MEANING OF SYMBOL
Sulawesi Tenggara in Figures 2013
terdiri dari 8 buah, melambangkan bulan 8/Agustus, tiap buah kapas dengan ke-lompok hijau 4 dan biji putih 5 mel-ambangkan tahun 45. Hal ini meng-ingatkan Hari Proklamasi Negara RI. 17 Agustus 1945.
- Mata Rantai yang disambung menjadi satu
yang berjumlah 27 mata rantai merupakan perlambang kesatuan dan persatuan dari keempat kabupaten di Sulawesi Tenggara, yang dalam gerak langkah perjuangannya telah mempunyai kesatuan derap dan nada, yakni pembangunan di segala bi-dang; hal ini mengingatkan hari kelahiran Propinsi Sulawesi Tenggara pada tanggal 27 April 1964.
- Kepala Anuang, mempunyai dua macam
pengertian : Bahwa Anuang adalah suatu binatang
yang mempunyai ciri khas yaitu: ulet, gesit dan militan.
Bahwa Anuang itu hanya terdapat di Sulawesi Tenggara pada khususnya dan Sulawesi pada umumnya. Jadi perlam-bang sebagai ciri spesifik untuk Sulawe-si Tenggara.
- Warna Putih, yang menjadi dasar dari
kepala Anuang menunjukkan kesucian dan kebersihan, itikad baik secara tulus ikhlas bagi warga Sulawesi Tenggara dalam melaksanakan pengabdiannya untuk kemajuan daerah dan perkembangan Dae-rah Sulawesi Tenggara pada khususnya dan Negara Republik Indonesia pada umumnya. Warna putih melambangkan kesucian dan bersih tanpa pamrih.
- Warna Biru Laut, mempunyai tiga macam
pengertian : Yang menjadi dasar dari pada Daerah
sian’s Independence Day, 17 August 1945.
- Twenty seven chains connected into
one symbolize the unity of four districts in Sulawesi Tenggara, which focus on the same vision, that is the develop-ment in all segments. The figure “27” reminds the anniversary of Sulawesi Tenggara Province which was on April 27, 1964.
- Head of Anuang, has two meanings :
Anuang is an animal possessing characteristics, including : tough, agile and militan
Anuang can only be found in Sula-wesi, particularly in Sulawesi Tenggara. Thus, it symbolizes the specific characteristics of Sulawesi Tenggara.
- White, used as the background color of
the Anuang’s head, shows purity, clean-liness, and sincere determination of the people of Sulawesi Tenggara in carrying out their dedication for the progress and development of Sulawesi Tenggara in particular and the Republic of Indonesia in general. White symbol-izes purity and clean with no strings attached.
- Sea Blue has three meanings :
It shows that some geographical areas of Sulawesi Tenggara consist of

x
ARTI LAMBANG
Sulawesi Tenggara Dalam Angka 2013
Sulawesi Tenggara ini menunjukkan makna sebagian dari alam geografisnya terdiri dari gugusan pulau yang dipisahkan oleh laut-laut yang penuh dengan kekayaan alam yang terkandung di dalamnya. Bahwa masyarakat Sulawesi Tenggara memiliki jiwa pelaut yang ulung.
Warna biru laut melambangkan sifat kesetiaan, keluhuran dan kejujuran da-lam pengabdiannya.
groups of islands separated by sea full of natural riches therein.
It shows that the people of Sulawesi Tenggara possess the spirit of great sailor. Sea blue symbolizes the nature of loyalty, mobility and honesty in the service.


Sulawesi Tenggara in Figures 2013 xiii
SAMBUTAN GUBERNUR SULAWESI TENGGARA
Assalamu’alaikum Warahmatullahi Wabarakatuh
Seiring dengan perkembangan pembangunan di segala bidang, maka
penyediaan data dan informasi statistik yang akurat menjadi kebutuhan yang
penting sebagai dasar penelitian maupun dasar pengambilan kebijakan.
Data dan informasi statistik yang disajikan dalam buku ini sudah melalui
proses pengumpulan, pengolahan, dan penyajian yang memenuhi standar dan
aturan yang berlaku. Dengan demikian data yang disajikan bersifat akurat, valid,
dan berkesinambungan dalam memberikan gambaran yang nyata terhadap pe-
rubahan yang terjadi pada sektor-sektor pembangunan di Sulawesi Tenggara.
Saya percaya bahwa Buku “Sulawesi Tenggara Dalam Angka Tahun
2013” ini dapat menjadi referensi semua pihak yang membutuhkan data dan
informasi statistik lintas sektor Provinsi Sulawesi Tenggara.
Wassalamu’alaikum Warahmatullahi Wabarakatuh
Kendari, Agustus 2013
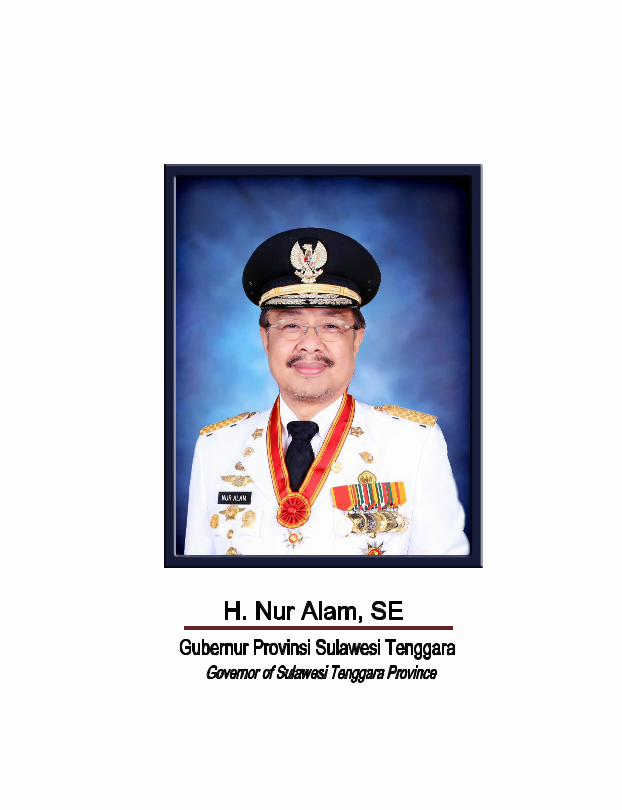
GUBERNUR
SULAWESI TENGGARA
H. NUR ALAM, SE, M.Si
Sulawesi Tenggara Dalam Angka 2013 xiv
FOREWORD BY THE GOVERNOR OF SULAWESI TENGGARA
Assalamu’alaikum Warahmatullahi Wabarakatuh
Along with the Progress of development in all sectors, the availability of accurate statistical data and information becomes an important requirement as the basis of research and decision making.
The statistical data and information presented in this book have been through a series process of collecting, processing, and presenting which meet the prevailing standard and rules. Therefore, the data presented here are accurate, valid and sustainable in providing the real description about the changes occured in every development sector in Sulawesi Tenggara.
I believe that “Sulawesi Tenggara in Figures 2013” will be a useful refer-ence for various parties who need cross-sectoral statistical data and information of Sulawesi Tenggara Province.
Wassalamu’alaikum Warahmatullahi Wabarakatuh
Kendari, August 2013
GOVERNOOR OF
SULAWESI TENGGARA
H. NUR ALAM, SE, M.Si
Sulawesi Tenggara in Figures 2013 xv
KATA PENGANTAR
Buku Sulawesi Tenggara Dalam Angka adalah publikasi tahunan yang diterbitkan oleh Badan Pusat Statistik Provinsi Sulawesi Tenggara.
Publikasi ini memuat himpunan data dari berbagai bidang dan sektor serta gambaran tentang hal-hal yang penting dari bidang-bidang yang bersangkutan. Data yang disajikan ini disusun oleh Badan Pusat Statistik Provinsi Sulawesi Tenggara baik berupa data primer yang dikumpulkan langsung maupun data sekunder yang diperoleh dari instansi pemerintah dan swasta di wilayah Provinsi Sulawesi Tenggara.
Publikasi Sulawesi Tenggara Dalam Angka 2013 dapat terbit berkat kerjasama dan bantuan dari berbagai pihak, baik dari instansi pemerintah maupun swasta. Untuk itu, kepada semua pihak yang telah ikut membantu terwujudnya publikasi ini kami sampaikan penghargaan dan ucapan terima kasih.
Meskipun demikian, kami menyadari masih ada kekurangan dan atau kesalahan yang mungkin terjadi. Untuk perbaikan di masa mendatang, tanggapan dan saran dari pemakai data ini masih diharapkan.
Kendari, Agustus 2013 Badan Pusat Statistik
Provinsi Sulawesi Tenggara Kepala,
Ir. ADI NUGROHO, MM NIP. 196010061983121001
Sulawesi Tenggara Dalam Angka 2013 xvi
PREFACE
“Sulawesi Tenggara in Figures” is an annual publication published by the BPS Provincial Office of Sulawesi Tenggara.
The Publication contains data from various fields and sectors as well as description about important aspects on the related fields. The Data were compiled by BPS Provincial Office of Sulawesi Tenggara either directly from respondents, such as households, private enterprises, or from administrative records from other government institutions and private sectors.
This publication could be released due to the assistance and contribu-tions from various parties, both from government institutions and private organi-zations. Therefore, on this occasion, I would like to express my sincere appreciation and gratitude to all parties who had participated in providing the data or infor-mation required.
This publication has been compiled by giving serious attention as much as possible, nevertheless it is realized that some weakness may occur. Suggestions to improve the content of this publication are cordially welcome.
Kendari, August 2013 BPS Provincial Office of
Sulawesi Tenggara Head,
Ir. ADI NUGROHO, MM NIP. 196010061983121001
LIST OF CONTENT
xvii Sulawesi Tenggara in Figures 2013
Arti Lambang/ Meaning of Symbol vii
Kata Sambutan Gubernur/ Governor Foreword xiii
Kata Pengantar / Preface xv
Daftar Isi/List of Contents xvii
Daftar Gambar/List of Figures xxi
Daftar Tabel /List of Tables xxv
Penjelasan Umum/Explanatory Notes liii
BAB I GEOGRAFI DAN IKLIM/GEOGRAPHY AND CLIMATE 1
1.1 Letak Geografis dan Batas Wilayah/ Geographical Position and Territorial Boundaries
3
1.2 Luas Wilayah/Area 3
1.3 Tanah/Soil 6
1.3.1 Topografi/Topography 6
1.3.2 Geologis/Geology 6
1.4 Perairan (Sungai dan Laut)/Water (Sea & River) 6
1.4.1 Hidrologi/Hidrology 6
1.4.2 Oceanografi/Oceanography 7
1.5 Iklim/Climate 8
1.5.1 Musim/Season 8
1.5.2 Curah Hujan/Rainfall 8
1.5.3 Suhu Udara/Temperature 9
BAB II PEMERINTAHAN/GOVERNMENT 23
2. Pembagian Wilayah Administrasi Pemerintahan/ Division of Local Government
23
2.1 Kabupaten Buton/Buton District 23
2.2 Kabupaten Muna/Muna District 23
2.3 Kabupaten Konawe/Konawe District 24
2.4 Kabupaten Kolaka/ Kolaka District 24
2.5 Kabupaten Konawe Selatan/Konawe Selatan District 24
2.6 Kabupaten Bombana/Bombana District 24
DAFTAR ISI
List of Content Halaman
Page

DAFTAR ISI
xviii Sulawesi Tenggara Dalam Angka 2013
2.7 Kabupaten Wakatobi/Wakatobi District 24
2.8 Kabupaten Kolaka Utara/Kolaka Utara District 24
2.9 Kabupaten Buton Utara/Buton Utara District 25
2.10 Kabupaten Konawe Utara/Konawe Utara District 25
2.11 Kota Kendari / Kendari City 25
2.12 Kota Bau-Bau/Bau-Bau City 25
3. Pembangunan Desa/Rural Development 25
4. Dewan Perwakilan Rakyat Daerah (DPRD)/ Regional Representatives 25
BAB III PENDUDUK DAN TENAGA KERJA/ POPULATION AND EMPLOYMENT 49
BAB IV SOSIAL/SOCIAL 89
4.1 Pendidikan/Education 89
4.2 Kesehatan dan Keluarga Berencana/ Health and Family Planning
91
4.3 Peradilan/Judiciary 94
4.4 Agama/Religion 94
4.5 Sosial lainnya/Other Social Affairs 94
BAB V. PERTANIAN/AGRICULTURE 149
5.1 Penggunaan Tanah/ Land Use 150
5.2 Tanaman Pangan/Food Crops 151
5.3 Tanaman Buah-buahan/Fruits 152
5.4 Tanaman Sayur-sayuran/Vegetables 152
5.5 Tanaman Perkebunan/Plantation Crops 154
5.6 Kehutanan/Forestry 155
5.7 Peternakan/Animal Husbandry 159
5.8 Perikanan/Fishery 159
LIST OF CONTENT
xix Sulawesi Tenggara in Figures 2013
BAB VI INDUSTRI, PERTAMBANGAN, LISTRIK DAN AIR MINUM/ INDUSTRY, MINING, ELECTRICITY AND WATER SUPPLY
241
6.1 Industri/ Industry 241
6.2 Pertambangan/Mining 246
6.3 Listrik/Electricity 246
6.4 Air Minum/Water Supply 246
BAB VII PERDAGANGAN/TRADE 275
BAB VIII ANGKUTAN DAN KOMUNIKASI/ TRANSPORTATION AND COMMUNICATION
297
BAB IX HOTEL DAN PARIWISATA/ 333
HOTEL AND TOURISM
BAB X KEUANGAN DAN HARGA-HARGA/ FINANCE AND PRICES
345
BAB XI PRODUK DOMESTIK REGIONAL BRUTO/ GROSS REGIONAL DOMESTIC PRODUCT
401
BAB XII PERBANDINGAN DENGAN PROVINSI LAIN/ COMPARISON WITH OTHER PROVINCES
439
DAFTAR ISI
xx Sulawesi Tenggara Dalam Angka 2013
Halaman ini sengaja dikosongkan This Page Intentionally Left Blank
LIST OF PICTURE
xxi Sulawesi Tenggara in Figures 2013
1.1 Persentase Luas Wilayah Sulawesi Tenggara menurut Kabupaten/ Kota, 2012 /Percentage of Area in Sulawesi Tenggara by District/City,2012
10
1.2 Persentase Luas Wilayah Sulawesi Tenggara menurut Keadaan Topografi Tanah, 2012/Percentage of Area in Sulawesi Tenggara by Land Topographic Condition, 2012
11
1.3 Jumlah Pulau di Sulawesi Tenggara Menurut Kabupaten/Kota 2012/Number
of Island in Sulawesi Tenggara by District/City, 2012
12
2.1 Banyaknya Desa/Kelurahan menurut Kabupaten dan Kota 2012/Number of Villages/Urban-villages by District and City, 2012
27
2.2 Persentase Jumlah Tenaga Hansip di Sulawesi Tenggara 2012/ Percentage of Civil DefenceForce in Sulawesi Tenggara, 2012
28
2.3 Persentase Jumlah Anggota DPRD Menurut Fraksi, 2012/ Percentage of Re-gional Representatives by Fraction, 2012
29
2.4 Banyaknya Pegawai Negeri Sipil di Lingkungan Pemerintah Daerah Provinsi Sulawesi Tenggara menurut Jenis Kelamin dan Pendidikan 2012/The number of civil servants in Southeast Sulawesi Provincial Government by sex and educa-tion in 2012
30
3.1 Penduduk Sulawesi Tenggara 1971-2012 / Population of Sulawesi Tenggara 1971-2012
55
3.2 Persebaran Penduduk Sulawesi Tenggara 2012/ Population Distribution of Sulawesi Tenggara 2012
56
3.3 Persentase Penduduk Sulawesi Tenggara Berumur 15 Tahun Ke Atas yang Bekerja menurut Lapangan Pekerjaan Utama 2012/ Percentage of Population 15 Years of Age and Over of Sulawesi Tenggara who worked by Main Industry 2012
57
3.4 Persentase Penduduk Sulawesi Tenggara Berumur 15 Tahun Ke Atas yang Bekerja menurut Lapangan Pekerjaan Utama 2009-2012/ Percentage of Popu-lation 15 Years of Age and Over of Sulawesi Tenggara who worked by Main Industry 2009-2012
58
4.1 Jumlah Sekolah Menurut Jenjang Pendidikan Tahun Ajaran 2008/2009 -
2011/2012/Number of School by educational level, Education Year 2008/2009 -
2011/2012
96
Halaman/ Page
DAFTAR GAMBAR LIST OF PICTURES
Gambar/ Picture
DAFTAR GAMBAR
xxii Sulawesi Tenggara Dalam Angka 2013
4.2 Jumlah Tenaga Kesehatan Menurut Profesi Tahun 2012/Number of Health
Power by Profession 2012
97
4.3 Persentase Peserta KB Aktif menurut Jenis Alat KB yang digunakan 2012/
Percentage of actively Family Planning User by Kind of Methode used 2012
98
4.4 Jumlah Kasus Kejahatan Yang dilaporkan dan diselesaikan Tahun 2012/
Number of Reported Crime and Cleared 2012
99
4.5 Peristiwa Bencana Alam yang melanda Provinsi Sulawesi Tenggara, 2008 -
2012/Natural Disaster that hits Sulawesi Tenggara Province, 2008 - 2012
100
5.1 Persentase Luas Penggunaan Tanah di Sulawesi Tenggara 2012/Percentage of Land Use in Sulawesi Tenggara 2012
161
5.2 Luas Panen Tanaman Bahan Makanan di Sulawesi Tenggara 2008-2012/Harvested Area of Food Crops in Sulawesi Tenggara 2008-2012
162
5.3 Produksi Tanaman Bahan Makanan di Sulawesi Tenggara 2008-2012/Production of Food Crops in Sulawesi Tenggara 2008-2012
163
5.4 Produksi Tanaman Perkebunan di Sulawesi Tenggara 2008-2012/Production of Plantation Crops in Sulawesi Tenggara 2008-2012
164
5.5 Populasi Ternak Besar di Sulawesi Tenggara Menurut Jenis Ternak 2008-2012/ Population of Large Livestock in Sulawesi Tenggara by Type of Lifestock 2008-2012
165
5.6 Persentase Luas Kawasan Hutan dan Perairan yang Telah Ditetapkan 2012/
Percentage of Fixed Forest and Water Ecosystem Areas , 2012
166
6.1 Persentase Perusahaan Industri Besar/Sedang menurut Kabupaten/Kota,
2012/Percentage of Large and Medium Manufacturing Industry by District/
City, 2012
248
6.2 Tenaga Listrik Terjual dan Nilai Penjualan Listrik Menurut Kantor Rayon
2012/Sold Electricity and Production Value by Regional Division Office, 2012
249
6.3 Jumlah Pelanggan Air Minum menurut Kategori Pelanggan, 2007-2012/
Number Customers of Water Supply Establishment Type of by Customers,
2007-2012
250
7.1 Nilai Ekspor Beberapa Jenis Komoditas Provinsi Sulawesi Tenggara (000 US
$) , 2011-2012/Export Value of Several Comodities of Sulawesi Tenggara Prov-
ince (000 US $), 2011-2012
279
LIST OF PICTURE
xxiii Sulawesi Tenggara in Figures 2013
7.2 Persentase Nilai Perdagangan Antar Pulau Menurut Jenis Komoditas , 2012/
Percentage of Value of Interisland Trade by Kind of Commodity, 2012
280
8.1 Panjang Jalan yang diaspal menurut Tingkat Kewenangan Pemerintahan
(Km) , 2004 - 2012/Length of asphalted Roads by Level Government Authority
(Km) , 2004 - 2012
302
8.2 Panjang Jalan menurut Kondisi Permukaan Jalan dan Tingkat Kewenangan
Pemerintahan (Km) 2012/Length of Roads by Road Surface Condition and
Level Government Authority(Km) , 2012
303
8.3 Jumlah Kendaraan Bermotor Terdaftar Menurut Jenis Kendaraan, 2009 –
2012/ Number of Registered Motor Vehicles by Kind of Vehicle, 2009 - 2012
304
9.1 Jumlah Hotel/Akomodasi, Kamar dan Tempat Tidur menurut Kabupaten/Kota, 2012/Number of Hotels/Acomodation, Rooms and Beds by District/City, 2012
336
9.2 Jumlah Tamu pada Hotel Bintang dan Non Bintang menurut Kabupaten/Kota, 2012/Number of Guests at Classified and Non Classified Hotel by District/City, 2012
337
9.3 Rata-rata Lamanya Menginap Tamu Dalam Negeri dan Tamu Asing pada
Hotel Bintang dan Non Bintang (Hari), 2012/Average Length of Stay of Do-
mestic and Foreign Guest at Classified Non Classified Hotels (Days), 2012
338
10.1 Realisasi Anggaran Pendapatan dan Belanja Daerah Sulawesi Tenggara,
2003-2011/Actual Regional Budget of Sulawesi Tenggara , 2003-2011
351
10.2 Realisasi Penerimaan dan Pengeluaran Daerah Otonom Kabupaten/Kota,
2011/Actual Revenue and Expenditures of District/City 2011
352
10.3 Perkembangan Giro, Deposito dan Tabungan Keadaan 31 Desember 2003-
2012/Giro, Deposit Bank and Saving Progress at December 31St 2003-2012
353
10.4 Persentase Banyaknya Koperasi menurut Kabupaten/Kota, 2012/
Percentage of Number of cooperatives by District/City, 2012
354
11.1 Produk Domestik Regional Bruto Sulawesi Tenggara menurut Lapangan
Usaha, 2007 - 2011/Gross Domestic Regional Product of Sulawesi Tenggara
by Industrial Origin, 2007 - 2011
410

DAFTAR GAMBAR
xxiv Sulawesi Tenggara Dalam Angka 2013
11.2 Distribusi Persentase PDRB Sulawesi Tenggara menurut Lapangan Usaha
Atas Dasar Harga Berlaku, 2007 - 2011/Percentage Distribution of Sulawesi
Tenggara GRDP at Current market prices by Industrial Origin, 2007 - 2011
411
11.3 Pertumbuhan PDRB Sulawesi Tenggara Atas Dasar Harga Konstan 2000,
2007 - 2011/Growth Rate of Sulawesi Tenggara GRDP at 2000 constant pric-
es, 2007 - 2011
412
11.4 PDRB Sulawesi Tenggara menurut Penggunaan Atas Dasar Harga Berlaku,
2007 - 2011/Sulawesi Tenggara GRDP by Expenditure at Current Market
Prices, 2007 - 2011
413
11.5 PDRB Sulawesi Tenggara menurut Penggunaan Atas Dasar Harga Konstan
2000, 2007 - 2011/ Sulawesi Tenggara GRDP by Expenditure at 2000 Con-
stant Market Prices, 2007 - 2011
414
12.1 Produk Domestik Regional Bruto (PDRB) atas dasar harga berlaku menurut
Provinsi di Sulawesi, 2008 - 2011/Gross Regional Domestic Product (GRDP)
at current market prices by Province in Sulawesi, 2008 - 2011
441
12.2 PDRB Perkapita atas dasar harga berlaku menurut Provinsi di Sulawesi,
2008 - 2011/GRDP per capita at current market prices by Province in Sulawe-
si, 2008 - 2012
442
12.3 Indeks Pembangunan Manusia menurut Provinsi di Sulawesi, 2007 - 2011/
Human Development Index by Province in Sulawesi, 2007 - 2011
443
12.4 Laju Inflasi di Ibu Kota Provinsi menurut Provinsi di Sulawesi, 2010 - 2012/
Inflation Rate at Provincial Capital by Province in Sulawesi, 2010 - 2012
444

xxv
TABLE OF CONTENT
Sulawesi Tenggara in Figures 2013
1. GEOGRAFI DAN IKLIM/GEOGRAPHY AND CLIMATE 13
1.1 Letak Geografis Sulawesi Tenggara Menurut Kabupaten/Kota, 2012/ Geo-graphical Position of Sulawesi Tenggara by District/City,2012
13
1.2 Batas Wilayah Sulawesi Tenggara Menurut Kabupaten/Kota, 2012 / Bounda-ry of Sulawesi Tenggara by District/City, 2012
14
1.3 Luas Wilayah Sulawesi Tenggara Menurut Kabupaten/ Kota, 2012/Total Area of Sulawesi Tenggara by District/City, 2012
15
1.4 Luas Wilayah Sulawesi Tenggara Menurut Kondisi Tanah, 2012/ Total Area of Sulawesi Tenggara by Soil Condition, 2012
16
1.5 Luas Wilayah Sulawesi Tenggara Menurut Jenis Tanah, 2012 / Total Area of Sulawesi Tenggara by Type of Soil, 2012
17
1.6 Nama-nama sungai besar yang melintasi Kabupaten/Kota dan Jumlah Pulau Menurut Kabupaten/Kota di Provinsi Sulawesi Tenggara/Great River and number of Sulawesi Tenggara island by Regency/City
18
1.7 Rata-rata Suhu Udara, Kelembapan, Tekanan Udara, Kecepatan Angin, Curah Hujan, dan Penyinaran Matahari Menurut Stasiun di Provinsi Sulawesi Tenggara, 2012/Average of Temperature, Humidity, Atmospheric Pressure, Velocity of Wind, Rainfall, Rainy days and Sun Shine by Station in Sulawesi Tenggara, 2012
19
2. PEMERINTAHAN/GOVERNMENT
2.1 Pembagian Daerah Administrasi Sulawesi Tenggara 2012/Number of Adminis-trative Area of Sulawesi Tenggara, 2012
31
2.2 Banyaknya Kepala Desa dan Lurah Menurut Kabupaten/Kota dan Jenis Ke-lamin 2012/Number of Village Head and Urban Village-administrators by District/City and Sex, 2012
32
2.3 Jumlah Anggota DPRD Sulawesi Tenggara 2012/ Number of Regional Repre-sentatives Members of Sulawesi Tenggara, 2012
33
DAFTAR TABEL
List of Table
TABEL
Table Halaman
Page
xxvi
DAFTAR TABEL
Sulawesi Tenggara Dalam Angka 2013
2.4 Banyaknya Keputusan DPRD Sulawesi Tenggara 2008-2012/Number of Acts Issued by Regional Representatives of Sulawesi Tenggara, 2008-2012
34
2.5 Kegiatan DPRD Sulawesi Tenggara 2010-2012/ Activities of Regional Repre-sentative of Sulawesi Tenggara, 2010-2012
35
2.6 Hasil Penghitungan Suara untuk Keanggotaan DPRD Kabupaten/Kota Dae-rah Pemilihan Sulawesi Tenggara 2009/Vote Counting Result for District/City Regional Representatives membership of Sulawesi Tenggara Election Area, 2009
36
2.7 Hasil Penghitungan Suara Untuk Keanggotaan DPRD Provinsi Daerah Pemili-han Sulawesi Tenggara 2009/ Vote Counting Result for Province Regional Representatives membership of Sulawesi Tenggara Election Area, 2009
37
2.8 Hasil Penghitungan Suara Untuk Keanggotaan DPR Pusat, Daerah Pemilihan Sulawesi Tenggara 2009/ Vote Counting Result for House of Representatives membership of Sulawesi Tenggara Election Area, 2009
38
2.9 Banyaknya Personel Pertahanan Sipil di Sulawesi Tenggara Menurut Klasifi-kasi 2012/Number of Civil Defence Personnel in Sulawesi Tenggara by Clasifi-cation, 2012
39
2.10 Banyaknya Tambahan Pemilik Surat Keputusan Hak atas Tanah Menurut Kabupaten/Kota 2012/Number of Additional Land Certivicates Owners by District/ City, 2012
40
2.11 Realisasi Sertifikasi Tanah Menurut Kabupaten/Kota 2012/Realization of Land Certification by District/City, 2012
41
3. PENDUDUK DAN TENAGA KERJA/
POPULATION AND EMPLOYMENT
3.1.1 Penduduk Sulawesi Tenggara Menurut Kabupaten/ Kota 1971-2012/Population of Sulawesi Tenggara by District and City 1971-2012
59
3.1.2 Jumlah dan Rata-rata Laju Pertumbuhan Penduduk Sulawesi Tenggara Menurut Kabupaten/Kota 1990, 2000, 2010, 2011, 2012/Number and Aver-age Growth Rate of Population of Sulawesi Tenggara by District/City 1990, 2000, 2010, 2011, 2012
61
3.1.3 Persebaran Penduduk Sulawesi Tenggara Menurut Kabupaten/Kota 2000, 2010, 2012/Population Distribution of Sulawesi Tenggara by District/City 2000, 2010, 2012
62
3.1.4 Kepadatan Penduduk Sulawesi Tenggara Menurut Kabupaten/Kota 1990, 2000, 2012/Population Density of Sulawesi Tenggara by District/City 1990, 2000, 2012
63
3.1.5 Penduduk Sulawesi Tenggara Menurut Kelompok Umur dan Jenis Kelamin 2011 dan 2012/Population of Sulawesi Tenggara by Age Group and Sex 2011 dan 2012
64
xxvii
TABLE OF CONTENT
Sulawesi Tenggara in Figures 2013
3.1.6 Penduduk Sulawesi Tenggara Menurut Kabupaten/ Kota,Jenis Kelamin dan Rasio Jenis Kelamin 2012/Population of Sulawesi Tenggara by District/ City, Sex and Sex Ratio 2012
65
3.1.7 Banyaknya Rumahtangga dan Penduduk Sulawesi Tenggara Menurut Ka-bupaten/Kota 2012/Number of Household and Population of Sulawesi Tenggara by District/ City 2012
66
3.2.1 Penduduk Sulawesi Tenggara Berumur 15 Tahun Ke Atas Menurut Jenis Kegiatan 2010-2012/Population 15 Year of Age and Over of Sulawesi Tenggara by Type of Activity 2010-2012
67
3.2.2 Penduduk Sulawesi Tenggara Berumur 15 Tahun Ke Atas Menurut Jenis Kegiatan dan Jenis Kelamin 2012/ Population 15 Year of Age and Over of Sulawesi Tenggara by Type of Activity and Sex 2012
68
3.2.3 Penduduk Sulawesi Tenggara Berumur 15 Tahun Ke Atas yang Bekerja Menurut Lapangan Pekerjaan Utama 2010 -2012/Number of Population 15 Years of Age and Over of Sulawesi Tenggara Who Worked by Main Industry 2010-2012
69
3.2.4 Persentase Penduduk Sulawesi Tenggara Berumur 15 Tahun Ke Atas yang Bekerja Menurut Lapangan Pekerjaan Utama 2010 -2012/Percentage of Population 15 Years of Age and Over of Sulawesi Tenggara Who Worked by Main Industry 2010-2012
70
3.2.5 Penduduk Sulawesi Tenggara Berumur 15 Tahun Ke Atas yang Bekerja Menurut Lapangan Usaha dan Jenis Kelamin 2012/Number of Population 15 Years of Age and Over of Sulawesi Tenggara Who Worked by Main Industry and Sex, 2012
71
3.2.6 Penduduk Sulawesi Tenggara Berumur 15 Tahun Ke Atas yang Mencari Pekerjaan Menurut Pendidikan Tertinggi yang Ditamatkan dan Jenis Ke-lamin 2012/Population 15 Years of Age and Over of Sulawesi Tenggara Looking For Work by Educational Attaintment and Sex 2012
72
3.2.7 Penduduk Sulawesi Tenggara Berumur 15 Tahun Ke Atas yang Bekerja Menurut Pendidikan Tertinggi yang Ditamatkan dan Jenis Kelamin 2012/Population 15 Years of Age and Over of Sulawesi Tenggara Who Worked by Educational Attaintment and Sex 2012
73
3.2.8 Banyaknya Lowongan Kerja di Sulawesi Tenggara yang Terdaftar, Ter-penuhi dan Belum Terpenuhi Menurut Lapangan Usaha 2012/Number of RegisteredJob Vacancies, Fulfilled and Had Not Been Yet Fulfilled by main Industry in Sulawesi Tenggara 2012
74
3.2.9 Banyaknya Pencari Kerja di Sulawesi Tenggara yang Terdaftar, Ditempat-kan dan Dihapuskan Menurut Tingkat Pendidikan 2012/Number of Regis-tered Job Applicants, Placed and Omitted by Educational Attainment 2012
75

xxviii
DAFTAR TABEL
Sulawesi Tenggara Dalam Angka 2013
3.2.10 Banyaknya Keputusan Pemegang Izin Bekerja bagi Tenaga Asing Pendatang di Sulawesi Tenggara Menurut Jenis Pekerjaan 2012/Number of Decision of Work Licence Holder for Foreign New Comer in Sulawesi Tenggara by Type of Occupation 2012
76
3.2.11 Banyaknya Keputusan Pemegang Izin Bekerja bagi Tenaga Asing Pendatang di Sulawesi Tenggara Menurut Lapangan Usaha 2012/Number of Decision of Work Licence Holder for Foreign New Comer in Sulawesi Tenggara by Main Industry 2012
77
3.2.12 Banyaknya Tenaga Asing Pemegang Visa Bekerja dalam Rangka PMA/PMDN Menurut Kebangsaan, Instansi Pemerintah dan Perusahaan Swasta 2012/Number of Foreign Visa Bearer Working on Foreign/Domestic Invest-ment by Nationality, Government and Private Institution 2012
78
3.3.1 Penerimaan Transmigrasi Umum Menurut Jenis Transmigrasi 1998/1999-2012/General Transmigration Revenues by Type of Transmigration 1998/1999-2012
80
3.3.2 Penerimaan Transmigrasi Umum Menurut Daerah Asal 1999/2000-2012/ General Admission of Transmigration by Region of Origin 1999/2000-2012
81
3.3.3 Penerimaan Transmigrasi Umum Menurut Daerah Penempatan 2000-2012/General Admission of Transmigration by Placement Region 2000-2012
83
3.3.4 Penerimaan Transmigrasi Swakarsa Menurut Daerah Penempatan 2000-2012 / Self-financed Transmigration Admission by Region of Placement 2000-2012
85
3.3.5 Penerimaan Transmigrasi Menurut Jenis Transmigrasi 2000-2012/ Transmi-grant Admission by Type of Transmigration 2000-2012
86
4 SOSIAL/SOCIAL 101
4.1.1 Jumlah Sekolah, Guru dan Murid Menurut Tingkat Pendidikan 2008/2009-2011/2012/Number of Schools, Teachers and Students by Educational Level 2008/2009-2011/2012
101
4.1.2 Jumlah Sekolah, Guru dan Murid Menurut Tingkat Pendidikan Di Bawah Kementrian Pendidikan Nasional 2011/2012/ Number of Schools, Teachers and Students by Educational Level Under The Ministry of National Education 2011/2012
102
4.1.3 Jumlah Sekolah, Guru dan Murid TK di Lingkungan Kementrian Pendidikan Nasional Menurut Kabupaten/Kota 2011/2012/Number of Schools, Teachers and Students in Kindergartens Under The Ministry of National Education by District/City 2011/2012
103

xxix
TABLE OF CONTENT
Sulawesi Tenggara in Figures 2013
4.1.4 Jumlah Sekolah, Guru dan Murid Tingkat SD di Lingkungan Kementrian Pendidikan Nasional Menurut Kabupaten/Kota 2011/2012/ Number of Schools, Teachers and Students in Elementary School Under The Ministry of National Education by District/City 2011/2012
104
4.1.5 Jumlah Sekolah, Guru dan Murid SLTP di Lingkungan Kementrian Pendidi-kan Nasional Menurut Kabupaten/Kota 2011/2012/Number of Schools, Teachers and Students in Yunior High School UnderThe Ministry of National Education by District/City 2011/2012
105
4.1.6 Jumlah Sekolah, Guru dan Murid SMA di Lingkungan Kementrian Pendidi-kan Nasional Menurut Kabupaten dan Kota 2011/2012/Number of Schools, Teachers and Students in Senior High School UnderThe Ministry of National Education by District/City 2011/2012
106
4.1.7 Jumlah Sekolah, Guru dan Murid Sekolah Menengah Kejuruan (SMK) di Lingkungan Kementrian Pendidikan Nasional Menurut Kabupaten dan Kota 2011/2012/Number of Schools, Teachers and Students in Vocational School UnderThe Ministry of National Education by District/City 2011/2012
107
4.1.8 Jumlah Sekolah, Guru dan Murid Raudhatul Athfal (RA)/Bustanul Athfal (BA) di bawah Departemen Agama Menurut Kabupaten/Kota, 2011/2012 Number of Schools, Teachers and Students in Raudhatul Athfal School under Religion Department by District/City, 2011/2012
108
4.1.9 Jumlah Sekolah, Guru dan Murid Sekolah Madrasah Ibtidayah (MI) di bawah Departemen Agama Menurut Kabupaten/Kota, 2011/2012/Number of Schools, Teachers and Students in Madrasah Ibtidayah School under Religion Department by District/City, 2011/2012
109
4.1.10 Jumlah Sekolah, Guru dan Murid Sekolah Madrasah Tsanawiyah (MTs) di bawah Departemen Agama Menurut Kabupaten/Kota, 2011/2012/Number of Schools, Teachers and Students in Madrasah Tsanawiyah School under Religion Department by District/City, 2011/2012
110
4.1.11 Jumlah Sekolah, Guru dan Murid Madrasah Aliyah (MA) di bawah Depar-temen Agama Menurut Kabupaten/Kota, 2011/2012/Number of Schools, Teachers and Students in Madrasah Aliyah School under Religion Depart-ment by District/City, 2011/2012
111
4.1.12 Jumlah Guru Penjaskes Sekolah Negeri Prov. Sulawesi Tenggara Menurut Kabupaten/Kota, 2012/Number of Sport Teacher at Public School in Sula-wesi Tenggara by District/City, 2012
112
4.1.13 Jumlah Pelatih Olahraga yang Bersertifikat dan Tidak di Prov. Sulawesi Tenggara Menurut Kabupaten/Kota, 2012/Number of Certified Sport Coach in Sulawesi Tenggara Province by District/City, 2012
113

xxx
DAFTAR TABEL
Sulawesi Tenggara Dalam Angka 2013
4.2.1 Jumlah Fasilitas Kesehatan di Provinsi Sulawesi Tenggara, 2007 - 2012 Number of Health Facility in Sulawesi Tenggara Province, 2007 - 2012
114
4.2.2 Jumlah Tenaga Kesehatan Menurut Unit Kerja dan Sarana Pelayanan Kesehatan di Provinsi Sulawesi Tenggara, 2012 / Number of Health Personel-by unit Organization and Health Service Station in Sulawesi Tenggara Prov-ince, 2012
115
4.2.3 Jumlah Dokter Spesialis, Dokter Umum, dan Dokter Gigi di Sarana Pela-yanan Kesehatan di Provinsi Sulawesi Tenggara, 2012/ Number of Specialist Doctor, Doctor, and Dentist at Medical Service Station in Sulawesi Tenggara Province, 2012
116
4.2.4 Jumlah Kasus 10 Penyakit Terbanyak di Provinsi Sulawesi Tenggara, 2012 / Top Ten Disease Cases in Sulawesi Tenggara Province, 2012
117
4.2.5 Jumlah Balita Gizi Buruk yang mendapatkan perawatan Menurut Kabupat-en /Kota di Provinsi Sulawesi Tenggara, 2012 / Number of Poor Nutrition Under Five Age in care by District/City in Sulawesi Tenggara Province, 2012
118
4.2.6 Jumlah Kasus HIV/AIDS, Infeksi Menular Seksual (IMS), DBD, Diare, TB, dan Malaria Menurut Kabupaten/Kota di Provinsi Sulawesi Tenggara, 2012 / Number of HIV/AIDS Cases, Sexually Transmitted Disease (STD), Dengue Fe-ver, Tubercolosis, and Malaria by District/City in Sulawesi Tenggara Province, 2012
119
4.2.7 Jumlah Kematian Bayi Menurut Kabupaten/Kota di Provinsi Sulawesi Tenggara Tahun 2011-2012 / Number of Infant Mortality by District/City of Sulawesi Tenggara Province, 2011 –2012
120
4.2.8 Cakupan Imunisasi Menurut Kabupaten/Kota di Provinsi Sulawesi Tengga-ra, 2012 / Immunization Coverage by District/City in Sulawesi Tenggara Prov-ince 2012
121
4.2.9 Jumlah Klinik Keluarga Berencana (KKB) dan Pos Pelayanan Keluarga Ber-encana Desa (PPKBD) Menurut Kabupaten/Kota di Provinsi Sulawesi Tenggara, 2012 /Number of Family Planning Clinique (FPC) and Village Family Planning Service Post (VFPSP) by District/City in Sulawesi Tenggara Province 2012
122
4.2.10 Jumlah Peserta KB Aktif dan Baru Menurut Alat Kontrasepsi yang Digunakan, 2012 / Number of Active and Newly Acceptors of Family Planning Programme by Type of Contraception Device Used, 2012
123
4.2.11 Target dan Realisasi Akseptor Baru Menurut Metode Kontrasepsi dan Ka-bupaten/Kota, 2012 / Target and Realization of Newly Acceptors by Contra-ceptive Method and District/City, 2012
124
xxxi
TABLE OF CONTENT
Sulawesi Tenggara in Figures 2013
4.2.12 Jumlah Pasangan Usia Subur dan Peserta KB Aktif Menurut Kabupaten/Kota di Provinsi Sulawesi Tenggara, 2012/ Number of Fertile Age Couple and Actively Family Planning User by District/City in Sulawesi Tenggara Province, 2012
125
4.2.13 Jumlah Tenaga Medis Pengelola Program KB Menurut Kabupaten/Kota 2012/Number of Medical Personnel for Family Planning Program by District/City 2012
126
4.3.1 Jumlah Terdakwa/Tertuduh yang Telah Diajukan Ke Sidang Pengadilan Menurut Golongan Umur dan Jenis Kelamin 2012/Number of Defendants/the Accused Brough in The Court of by Age Group and Sex 2012
127
4.3.2 Jumlah Terdakwa/Tertuduh yang Telah Diajukan Ke Muka Pengadilan Menurut Jenis Pidana/Hukuman dan Jenis Kelamin 2012/Number of De-fendants/ the Accused Brough to Court by Type of Punishment and Sex 2012
128
4.3.3 Jumlah Narapidana Berdasarkan Putusan Pengadilan Negeri Menurut Jenis Kejahatan/ Pelanggaran dan Jenis Kelamin 2012/Number of Convict Based on Conviction of District Court by Type of Crime/Offence and Sex 2012
129
4.3.4 Jumlah Narapidana Berdasarkan Putusan Pengadilan Menurut Kabupaten/Kota dan Jenis Kelamin 2012/Number of Convict Based on Conviction by District/City and Sex 2012
130
4.3.5 Jumlah Kejahatan yang Dilaporkan Kepada Kepolisian Menurut Jenis Keja-hatan dan Kabupaten/Kota 2012/ Number of Crimes Reported to Police by Type of Crime and District/City 2012
131
4.3.6 Jumlah Kejahatan yang Diselesaikan oleh Kepolisian Menurut Jenis Keja-hatan dan Kabupaten/Kota 2012/Number of Crimes Cleared by Police by Type of Crime and District/City 2012
133
4.3.7 Jumlah Kecelakaan Lalulintas Yang Dilaporkan Menurut Kabupaten/Kota 2012/Number of Reported Traffic Accidents by District/ City 2012
135
4.3.8 Jumlah Kecelakaan Lalulintas Yang Diselesaikan dan Estimasi Kerugian Ma-teriil Menurut Kabupaten/Kota 2012/Number of Traffic Accidents Case Clared and Total Lost Estimation by District/ City 2012
136
4.3.9 Jumlah Pidana Penjara, Pidana Kurungan dan Pidana Denda yang Diajukan Menurut Kabupaten/Kota 2012/ Number of Imprisonment, Custody and Fine Sentence Proposed by District/City 2012
137
4.3.10 Jumlah Kasus Tahanan yang Diselesaikan Menurut Jenis Penyelesaian dan Tindak Pidana 2012/Number of Prisoners Cases Solved by Type of Solving and Criminal Act 2012
138
xxxii
DAFTAR TABEL
Sulawesi Tenggara Dalam Angka 2013
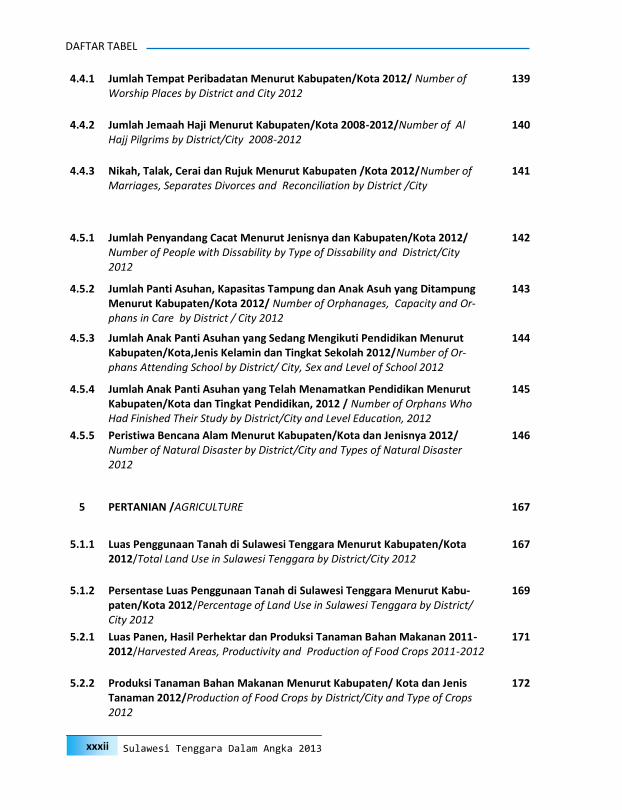
4.4.1 Jumlah Tempat Peribadatan Menurut Kabupaten/Kota 2012/ Number of Worship Places by District and City 2012
139
4.4.2 Jumlah Jemaah Haji Menurut Kabupaten/Kota 2008-2012/Number of Al Hajj Pilgrims by District/City 2008-2012
140
4.4.3 Nikah, Talak, Cerai dan Rujuk Menurut Kabupaten /Kota 2012/Number of Marriages, Separates Divorces and Reconciliation by District /City
141
4.5.1 Jumlah Penyandang Cacat Menurut Jenisnya dan Kabupaten/Kota 2012/Number of People with Dissability by Type of Dissability and District/City 2012
142
4.5.2 Jumlah Panti Asuhan, Kapasitas Tampung dan Anak Asuh yang Ditampung Menurut Kabupaten/Kota 2012/ Number of Orphanages, Capacity and Or-phans in Care by District / City 2012
143
4.5.3 Jumlah Anak Panti Asuhan yang Sedang Mengikuti Pendidikan Menurut Kabupaten/Kota,Jenis Kelamin dan Tingkat Sekolah 2012/Number of Or-phans Attending School by District/ City, Sex and Level of School 2012
144
4.5.4 Jumlah Anak Panti Asuhan yang Telah Menamatkan Pendidikan Menurut Kabupaten/Kota dan Tingkat Pendidikan, 2012 / Number of Orphans Who Had Finished Their Study by District/City and Level Education, 2012
145
4.5.5 Peristiwa Bencana Alam Menurut Kabupaten/Kota dan Jenisnya 2012/ Number of Natural Disaster by District/City and Types of Natural Disaster 2012
146
5 PERTANIAN /AGRICULTURE 167
5.1.1 Luas Penggunaan Tanah di Sulawesi Tenggara Menurut Kabupaten/Kota 2012/Total Land Use in Sulawesi Tenggara by District/City 2012
167
5.1.2 Persentase Luas Penggunaan Tanah di Sulawesi Tenggara Menurut Kabu-paten/Kota 2012/Percentage of Land Use in Sulawesi Tenggara by District/City 2012
169
5.2.1 Luas Panen, Hasil Perhektar dan Produksi Tanaman Bahan Makanan 2011-2012/Harvested Areas, Productivity and Production of Food Crops 2011-2012
171
5.2.2 Produksi Tanaman Bahan Makanan Menurut Kabupaten/ Kota dan Jenis Tanaman 2012/Production of Food Crops by District/City and Type of Crops 2012
172

xxxiii
TABLE OF CONTENT
Sulawesi Tenggara in Figures 2013
5.2.3 Luas Panen Tanaman Bahan Makanan Menurut Kabupaten/Kota dan Jenis Tanaman 2012/Harvested Area of Food Crops by District/ City and Type of Crops 2012
174
5.2.4 Hasil Perhektar Tanaman Bahan Makanan Menurut Kabupaten/Kota dan Jenis Tanaman 2012/ Productivity of Food Crops by District/City and Type of Crops 2012
176
5.2.5 Beras Yang Masuk Per Bulan Melalui Perum Bulog 2012/ Rice Supplied by Bulog per Month 2012
178
5.2.6 Pengadaan Beras Lokal oleh Perum Bulog Menurut Kabupaten/ Kota 2012/Local Rice Supplied by Logistic Agency by District/City 2012
179
5.2.7 Pengadaan Beras Lokal oleh Perum Bulog Perbulan Menurut KUD dan non KUD 2012/Local Rice Supplied by Logistic Agency by Months, by Village Coop-erative Unit, and non Village Cooperative Unit 2012
181
5.2.8 Volume Gula Pasir, Tepung Terigu dan Jagung yang Disalurkan oleh Perum Bulog 2006-2012/Volume of Sugar, Wheat-flower and Maize Distributed by Logistic Agency 2006-2012
182
5.3.1 Produksi Buah-buahan Menurut Kabupaten/Kota dan Jenis Buah di Provinsi Sulawesi Tenggara (Kuintal), 2012/Production of Fruit by Type of Plant and District/City (Quintal), 2012
183
5.4.1 Produksi Sayur-sayuran yang dipanen berkali-kali Menurut Jenis Sayuran dan Kabupaten/Kota (Kuintal) 2012/ Production of Repeatedly Harvested Vegetables by Type of Plant and District/City (Quintal) 2012
185
5.4.2 Produksi Sayur-sayuran yang dipanen Sekaligus Menurut Jenis Sayuran dan Kabupaten/Kota (Kuintal) 2012 / Production of All at Once Harvested Vege-tables by Type of Plant and District/ City 2012
187
5.4.3 Produksi Tanaman Biofarmaka Menurut Jenis dan Kabupaten/Kota (Kuintal) 2012/ Production of Biofarmaka by Type of Plant and District/City (Quintal) 2012
189
5.5.1 Produksi Tanaman Perkebunan Menurut Jenis Tanaman 2008-2012/ Pro-duction of Estate by Type of Crops 2008-2012
191
5.5.2 Produksi Tanaman Perkebunan Menurut Jenis Tanaman dan Kabupaten/Kota 2012/ Production of Estate Crops by Type of Crops and District/City
192
5.5.3 Produksi Tanaman Perkebunan Menurut Jenis Tanaman di Kabupaten Buton 2008-2012/ Production of Estate Crops by Type of Crops in Buton Dis-trict 2012
194
xxxiv
DAFTAR TABEL
Sulawesi Tenggara Dalam Angka 2013
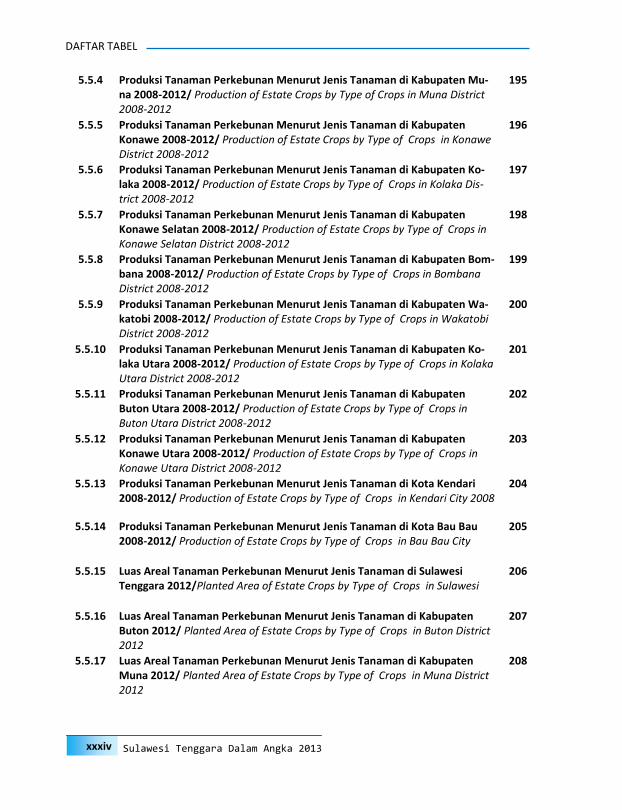
5.5.4 Produksi Tanaman Perkebunan Menurut Jenis Tanaman di Kabupaten Mu-na 2008-2012/ Production of Estate Crops by Type of Crops in Muna District 2008-2012
195
5.5.5 Produksi Tanaman Perkebunan Menurut Jenis Tanaman di Kabupaten Konawe 2008-2012/ Production of Estate Crops by Type of Crops in Konawe District 2008-2012
196
5.5.6 Produksi Tanaman Perkebunan Menurut Jenis Tanaman di Kabupaten Ko-laka 2008-2012/ Production of Estate Crops by Type of Crops in Kolaka Dis-trict 2008-2012
197
5.5.7 Produksi Tanaman Perkebunan Menurut Jenis Tanaman di Kabupaten Konawe Selatan 2008-2012/ Production of Estate Crops by Type of Crops in Konawe Selatan District 2008-2012
198
5.5.8 Produksi Tanaman Perkebunan Menurut Jenis Tanaman di Kabupaten Bom-bana 2008-2012/ Production of Estate Crops by Type of Crops in Bombana District 2008-2012
199
5.5.9 Produksi Tanaman Perkebunan Menurut Jenis Tanaman di Kabupaten Wa-katobi 2008-2012/ Production of Estate Crops by Type of Crops in Wakatobi District 2008-2012
200
5.5.10 Produksi Tanaman Perkebunan Menurut Jenis Tanaman di Kabupaten Ko-laka Utara 2008-2012/ Production of Estate Crops by Type of Crops in Kolaka Utara District 2008-2012
201
5.5.11 Produksi Tanaman Perkebunan Menurut Jenis Tanaman di Kabupaten Buton Utara 2008-2012/ Production of Estate Crops by Type of Crops in Buton Utara District 2008-2012
202
5.5.12 Produksi Tanaman Perkebunan Menurut Jenis Tanaman di Kabupaten Konawe Utara 2008-2012/ Production of Estate Crops by Type of Crops in Konawe Utara District 2008-2012
203
5.5.13 Produksi Tanaman Perkebunan Menurut Jenis Tanaman di Kota Kendari 2008-2012/ Production of Estate Crops by Type of Crops in Kendari City 2008
204
5.5.14 Produksi Tanaman Perkebunan Menurut Jenis Tanaman di Kota Bau Bau 2008-2012/ Production of Estate Crops by Type of Crops in Bau Bau City
205
5.5.15 Luas Areal Tanaman Perkebunan Menurut Jenis Tanaman di Sulawesi Tenggara 2012/Planted Area of Estate Crops by Type of Crops in Sulawesi
206
5.5.16 Luas Areal Tanaman Perkebunan Menurut Jenis Tanaman di Kabupaten Buton 2012/ Planted Area of Estate Crops by Type of Crops in Buton District 2012
207
5.5.17 Luas Areal Tanaman Perkebunan Menurut Jenis Tanaman di Kabupaten Muna 2012/ Planted Area of Estate Crops by Type of Crops in Muna District 2012
208
xxxv
TABLE OF CONTENT
Sulawesi Tenggara in Figures 2013
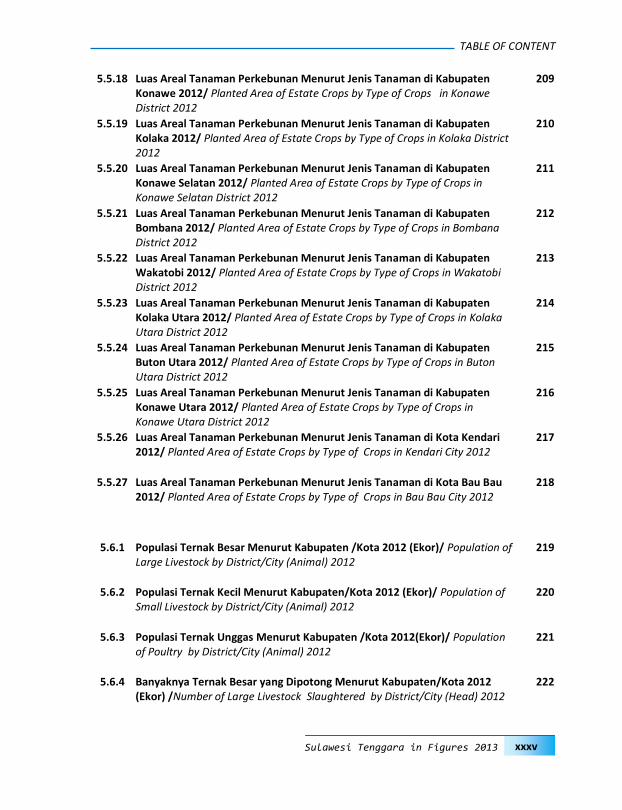
5.5.18 Luas Areal Tanaman Perkebunan Menurut Jenis Tanaman di Kabupaten Konawe 2012/ Planted Area of Estate Crops by Type of Crops in Konawe District 2012
209
5.5.19 Luas Areal Tanaman Perkebunan Menurut Jenis Tanaman di Kabupaten Kolaka 2012/ Planted Area of Estate Crops by Type of Crops in Kolaka District 2012
210
5.5.20 Luas Areal Tanaman Perkebunan Menurut Jenis Tanaman di Kabupaten Konawe Selatan 2012/ Planted Area of Estate Crops by Type of Crops in Konawe Selatan District 2012
211
5.5.21 Luas Areal Tanaman Perkebunan Menurut Jenis Tanaman di Kabupaten Bombana 2012/ Planted Area of Estate Crops by Type of Crops in Bombana District 2012
212
5.5.22 Luas Areal Tanaman Perkebunan Menurut Jenis Tanaman di Kabupaten Wakatobi 2012/ Planted Area of Estate Crops by Type of Crops in Wakatobi District 2012
213
5.5.23 Luas Areal Tanaman Perkebunan Menurut Jenis Tanaman di Kabupaten Kolaka Utara 2012/ Planted Area of Estate Crops by Type of Crops in Kolaka Utara District 2012
214
5.5.24 Luas Areal Tanaman Perkebunan Menurut Jenis Tanaman di Kabupaten Buton Utara 2012/ Planted Area of Estate Crops by Type of Crops in Buton Utara District 2012
215
5.5.25 Luas Areal Tanaman Perkebunan Menurut Jenis Tanaman di Kabupaten Konawe Utara 2012/ Planted Area of Estate Crops by Type of Crops in Konawe Utara District 2012
216
5.5.26 Luas Areal Tanaman Perkebunan Menurut Jenis Tanaman di Kota Kendari 2012/ Planted Area of Estate Crops by Type of Crops in Kendari City 2012
217
5.5.27 Luas Areal Tanaman Perkebunan Menurut Jenis Tanaman di Kota Bau Bau 2012/ Planted Area of Estate Crops by Type of Crops in Bau Bau City 2012
218
5.6.1 Populasi Ternak Besar Menurut Kabupaten /Kota 2012 (Ekor)/ Population of Large Livestock by District/City (Animal) 2012
219
5.6.2 Populasi Ternak Kecil Menurut Kabupaten/Kota 2012 (Ekor)/ Population of Small Livestock by District/City (Animal) 2012
220
5.6.3 Populasi Ternak Unggas Menurut Kabupaten /Kota 2012(Ekor)/ Population of Poultry by District/City (Animal) 2012
221
5.6.4 Banyaknya Ternak Besar yang Dipotong Menurut Kabupaten/Kota 2012 (Ekor) /Number of Large Livestock Slaughtered by District/City (Head) 2012
222

xxxvi
DAFTAR TABEL
Sulawesi Tenggara Dalam Angka 2013
5.6.5 Banyaknya Ternak Kecil yang Dipotong Menurut Kabupaten/Kota 2012/Number of Small Livestock Slaughtered by District/City 2012
223
5.6.6 Banyaknya Ternak Unggas yang Dipotong Menurut Kabupaten/Kota 2012/Number of Poultry Slaughtered by District/City 2012
224
5.6.7 Produksi Daging Ternak Besar Menurut Kabupaten/Kota 2012/Meat Pro-duction of Large Livestock by District/City 2012
225
5.6.8 Produksi Daging Ternak Kecil Menurut Kabupaten/ Kota 2012/Meat Produc-tion of Small Livestock by District/ City 2012
226
5.6.9 Produksi Daging Unggas Menurut Kabupaten/Kota 2012/ Meat Production of Poultry by District/City 2012
227
5.6.10 Produksi Telur Unggas Menurut Kabupaten/Kota (kg), 2012/ Production of Poultry Eggs by District/City 2012 (kg)
228
5.6.11 Jumlah Ternak Masuk Menurut Jenisnya dan Kabupaten/Kota (Ekor), 2012/Number of Incoming Livestock by Kind and District/City (Heads) 2012
229
5.6.12 Jumlah Ternak Keluar Menurut Jenisnya dan Kabupaten/Kota 2012/Number of Outgoing Livestock by Kind and District/City (Heads) 2012
230
5.6.13 Realisasi Vaksinasi Ternak Menurut Kabupaten / Kota dan Jenis Vaksin 2012/Realization of Livestock Vaccination by District/City and Kind of Vac-cines (Dosage) 2012
231
5.7.1 Produksi dan Nilai Perikanan Laut dan Darat Menurut Kabupaten/Kota 2012/Production and Value of Marine and Inland Fisheries Products by Dis-trict/City 2012
232
5.7.2 Produksi dan Nilai Hasil Perikanan Darat Menurut Kabupaten/Kota 2012/Production and Value of Inland Fisheries Product by District/City 2012
233
5.8.1 Luas Kawasan Hutan dan Perairan yang Telah Ditetapkan Menurut Kabu-paten/Kota 2012/ Fixed Forests and Water Ecosystem Areas by District/City 2012
235
6 INDUSTRI, PERTAMBANGAN, LISTRIK DAN AIR MINUM/ INDUSTRY, MINING, ELECTRICITY AND WATER SUPPLY
251
6.1.1 Jumlah Perusahaan Industri Besar/Sedang, Tenaga Kerja dan Pengeluaran
untuk Tenaga Kerja Menurut Kabupaten/Kota, 2012/Number of Large and
Medium Manufacturing Industry, Employees and Labor Costs by District/City,
2012
251
xxxvii
TABLE OF CONTENT
Sulawesi Tenggara in Figures 2013
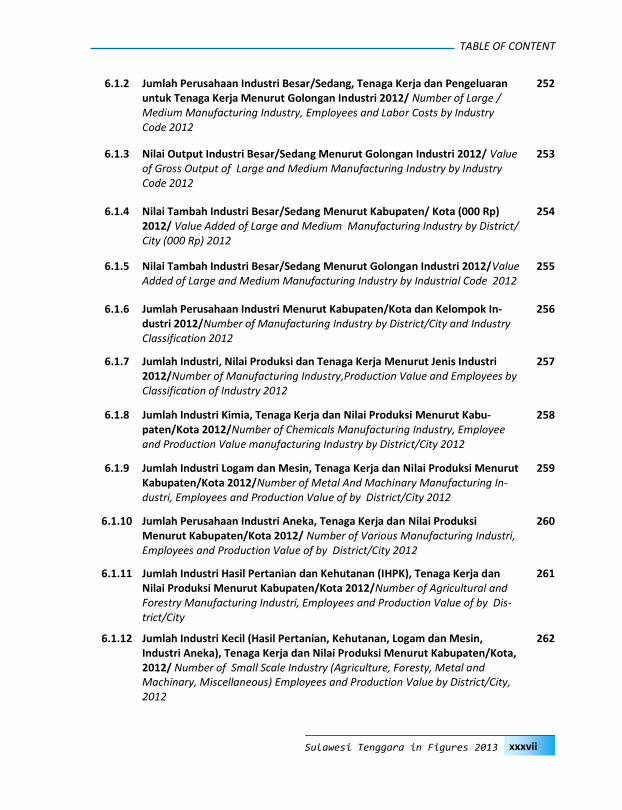
6.1.2 Jumlah Perusahaan Industri Besar/Sedang, Tenaga Kerja dan Pengeluaran untuk Tenaga Kerja Menurut Golongan Industri 2012/ Number of Large / Medium Manufacturing Industry, Employees and Labor Costs by Industry Code 2012
252
6.1.3 Nilai Output Industri Besar/Sedang Menurut Golongan Industri 2012/ Value of Gross Output of Large and Medium Manufacturing Industry by Industry Code 2012
253
6.1.4 Nilai Tambah Industri Besar/Sedang Menurut Kabupaten/ Kota (000 Rp) 2012/ Value Added of Large and Medium Manufacturing Industry by District/City (000 Rp) 2012
254
6.1.5 Nilai Tambah Industri Besar/Sedang Menurut Golongan Industri 2012/Value Added of Large and Medium Manufacturing Industry by Industrial Code 2012
255
6.1.6 Jumlah Perusahaan Industri Menurut Kabupaten/Kota dan Kelompok In-dustri 2012/Number of Manufacturing Industry by District/City and Industry Classification 2012
256
6.1.7 Jumlah Industri, Nilai Produksi dan Tenaga Kerja Menurut Jenis Industri 2012/Number of Manufacturing Industry,Production Value and Employees by Classification of Industry 2012
257
6.1.8 Jumlah Industri Kimia, Tenaga Kerja dan Nilai Produksi Menurut Kabu-paten/Kota 2012/Number of Chemicals Manufacturing Industry, Employee and Production Value manufacturing Industry by District/City 2012
258
6.1.9 Jumlah Industri Logam dan Mesin, Tenaga Kerja dan Nilai Produksi Menurut Kabupaten/Kota 2012/Number of Metal And Machinary Manufacturing In-dustri, Employees and Production Value of by District/City 2012
259
6.1.10 Jumlah Perusahaan Industri Aneka, Tenaga Kerja dan Nilai Produksi Menurut Kabupaten/Kota 2012/ Number of Various Manufacturing Industri, Employees and Production Value of by District/City 2012
260
6.1.11 Jumlah Industri Hasil Pertanian dan Kehutanan (IHPK), Tenaga Kerja dan Nilai Produksi Menurut Kabupaten/Kota 2012/Number of Agricultural and Forestry Manufacturing Industri, Employees and Production Value of by Dis-trict/City
261
6.1.12 Jumlah Industri Kecil (Hasil Pertanian, Kehutanan, Logam dan Mesin, Industri Aneka), Tenaga Kerja dan Nilai Produksi Menurut Kabupaten/Kota, 2012/ Number of Small Scale Industry (Agriculture, Foresty, Metal and Machinary, Miscellaneous) Employees and Production Value by District/City, 2012
262
xxxviii
DAFTAR TABEL
Sulawesi Tenggara Dalam Angka 2013
6.2.1 Produksi dan Nilai Produksi Hasil Pertambangan Nikel 2001-2012/ Production and Production Value of Nickel Mining 2001-2012
263
6.2.2 Produksi dan Nilai Produksi Pertambangan Aspal 2002-2012/ Production and Production Value of Asphalt Mining 2002-2012
264
6.3.1 Jumlah Perusahaan, Langganan, Tenaga Listrik yang Terjual dan Nilai Pen Jualan Setiap Unit PLN Menurut Kantor Rayon 2012/ Number of Company, Customers, Electricity Sold and Revenue of Each PLN Unit by Regional Office 2012
265
6.3.2 Daya Terpasang, Produksi Listrik, Tenaga Listrik yang terjual, Sisa Produksi
dan Nilai Penjualan Tenaga Listrik Menurut Kantor Rayon 2012/Installed Ca-
pacity, Produced and Sold Electricity, Remainder of Production and Revenue
by Regional Office, 2012
266
6.3.3 Daya Terpasang, Produksi Listrik, Tenaga Listrik yang Terjual, Sisa Produksi dan Nilai Pen Jualan Tenaga Listrik Menurut Kategori Pelanggan 2012/ In-stalled Capacity, Produced and Sold Electricity, Remainder of Production and Revenue of Sold Electricity by Costumer Category 2012
267
6.4.1 Jumlah Perusahaan Air Minum dan Pekerja Menurut Kabupaten/Kota 2012/Number of Water Supply Company and Employees by District/ City 2012
268
6.4.2 Jumlah Pelanggan Air Minum Menurut Kategori Pelanggan 2009-2012/Number Customers of Water Supply Establishment by Type of Customers 2009-2012
269
6.4.3 Volume Air Minum yang Disalurkan Menurut Kategori Pelanggan (000 M3) 2009-2012/Volume of Water Supply Distributed by Type of Customers 2009-2012
270
6.4.4 Nilai Air Minum yang Disalurkan Menurut Kategori Pelanggan (000 Rp) 2009-2012/Value of Water Supply Distributed by Type of Customers 2009-2012
271
6.4.5 Nilai Input Perusahaan Air Minum Menurut Jenis Pengeluaran 2010-2012/Input Costs of Water SupplyCompany by Type of Costs 2010-2012
272
7 PERDAGANGAN/TRADE 281
7.1.1 Volume dan Nilai Ekspor Menurut Jenis Komoditas, 2011-2012/Volume and
Value of Exports by Kind of Commodity, 2011-2012
281
xxxix
TABLE OF CONTENT
Sulawesi Tenggara in Figures 2013
7.1.2 Volume dan Nilai Ekspor Menurut Pelabuhan Asal, 2011-2012/ Volume and Value of Export by Port of Origin, 2011-2012
282
7.1.3 Volume dan Nilai Ekspor Menurut Negara Tujuan, 2011-2012/ Volume and
Value of Exports by Destination Country, 2011-2012
283
7.2.1 Volume dan Nilai Impor Menurut Jenis Komoditas, 2011-2012/Volume and Value of Import by Kind of Commodity, 2011-2012
284
7.2.2 Volume dan Nilai Impor Menurut Pelabuhan Masuk, 2011-2012/ Volume and Value of Import by Entry Port, 2011-2012
285
7.2.3 Volume dan Nilai Impor Menurut Negara Asal, 2011-2012/ Volume and Value of Import by Origin Country, 2011-2012
286
7.3.1 Volume dan Nilai Perdagangan Antar Pulau Menurut Hasil Bumi dan Laut 2012/Volume and Value of Inter Island Trade by land and Sea Products 2012
287
7.3.2 Volume dan Nilai Perdagangan Antar Pulau Tanaman Pangan Menurut Jenis Barang 2012/Volume and Value of Inter Island Trade of Food Crops by Kind of Commodity 2012
288
7.3.3 Volume dan Nilai Perdagangan Antar Pulau Hasil Perkebunan Menurut Jenis Barang 2012/Volume and Value of Inter Island Trade of Estate Crops Products by Kind of Commodity 2012
289
7.3.4 Volume dan Nilai Perdagangan Antar Pulau Hasil Peternakan Menurut Jenis Barang 2012/Volume and Value of Inter Island Trade of Animal Husbandry Products by Kind of Commodity 2012
290
7.3.5 Volume dan Nilai Perdagangan Antar Pulau Hasil Kehutanan Menurut Jenis Barang 2012/Volume and Value of Inter Island Trade of Forestry Products by Kind of Commodity
291
7.3.6 Volume dan Nilai Perdagangan Antar Pulau Hasil Perikanan Menurut Jenis Barang 2012/Volume and Value of Inter Island Trade of Fishery Products by Kind of Commodity 2012
292
7.3.7 Perdagangan Antar Pulau Hasil Industri Sulawesi Tenggara Menurut Jenis Barang 2012/ Inter Islands Trade Of Sulawesi Tenggara Industrial Volume by Kind of Commodity 2012
294

xl
DAFTAR TABEL
Sulawesi Tenggara Dalam Angka 2013
8 TRANSPORTASI DAN KOMUNIKASI/TRANSPORTATION AND COMMUNICATION
305
8.1.1 Panjang Jalan Negara, Provinsi dan Kabupaten Menurut Jenis Permukaan (Km) 2004-2012/Length of State, Provincial and District Road by Type of Sur-face (Km) 2004-2012
305
8.1.2 Panjang Jalan Menurut Tingkat Kewenangan Pemerintahan, Jenis Per-mukaan, Kondisi dan Kelas Jalan (km) 2012/ Length of Road by Level of Government authority, Type of Surface, Condition and Class of Road (Km) 2012
306
8.1.3 Panjang Jalan Kabupaten Menurut Kabupaten/Kota, Jenis Permukaan, Kon-disi dan Kelas Jalan (Km) 2012/ Length of District Road by District/City, Type of Surface, Condition and Class of Road (Km) 2012
307
8.2.1 Jumlah Kendaraan Bermotor Terdaftar Menurut Jenis Kendaraan 2009-2012/Number of Registered Motorized Vehicles by Kind of Vehicles 2009-2012
309
8.2.2 Jumlah Kendaraan Bermotor Terdaftar Menurut Kabupaten/Kota dan Jenis Kendaraan, 2012/Number of Registered Motor Vehicles by district/city and Kind of Motor Vehicles, 2012
310
8.3.1 Kunjungan Kapal, Arus Barang, Hewan dan Penumpang Menurut Jenis Pe-layaran 2012/Number of Ship Calls, Traffic of Cargo, Animal,Passenger by Type of Voyage
312
8.3.2 Kunjungan Kapal, Arus Barang, Hewan dan Penumpang Menurut kabu-paten/kota 2012/Number of Ship Calls, Traffic of Cargo, Animal,Passenger by District/City
314
8.4.1 Lalu Lintas Pesawat Terbang dan Penumpang melalui Pelabuhan Udara Se-
Sulawesi Tenggara, 2012/Aircraft and Passenger Traffic at Sulawesi Tengga-
ra Province, 2012
316
8.4.2 Lalu Lintas Barang, Bagasi dan Pos Paket Melalui Pelabuhan Udara Se-
Sulawesi Tenggara (Kg) , 2012/Cargo, Baggage and Parcels Traffic at Airport
in Sulawesi Tenggara (Kg) , 2012
317
8.4.3 Lalu Lintas Pesawat Terbang dan Penumpang melalui Pelabuhan Udara Haluoleo Kendari, 2003 - 2012/ Aircraft and Passenger Traffic at Haluoleo Airport Kendari, 2003-2012
318
8.4.4 Lalu Lintas Pesawat Terbang dan Penumpang melalui Pelabuhan Udara Betoambari Bau-Bau, 2012/Aircraft and Aircraft Passenger Traffic at Betoambari Bau-Bau Airport, 2012
319

xli
TABLE OF CONTENT
Sulawesi Tenggara in Figures 2013
8.4.5 Lalu Lintas Pesawat Terbang dan Penumpang melalui Pelabuhan Udara Sangia Ni Bandera, Kolaka 2012/Aircraft and Passenger Traffic at Sangia Ni Bandera Airport, Kolaka 2012
320
8.4.6 Lalu Lintas Pesawat Terbang dan Penumpang melalui Pelabuhan Udara Matahora, Wakatobi 2012/Aircraft and Passenger Traffic at Matahora Air-port, Wakatobi 2012
321
8.4.7 Lalu Lintas Barang, Bagasi dan Pos Paket melalui Pelabuhan Udara Haluoleo Kendari (Kg) 2003-2012/Traffic of Cargo, Baggage and Parcels at Haluleo Airport Kendari (kg) 2003-2012
322
8.4.8 Lalu Lintas Barang, Bagasi dan Pos Paket melalui Pelabuhan Udara Betoambari Bau Bau (Kg) 2012/ Traffic of Cargo, Baggage and Parcels at Betoambari Airport Bau Bau (kg) 2012
323
8.4.9 Lalu Lintas Barang, Bagasi dan Pos Paket melalui Pelabuhan Udara Sangia Ni Bandera, Kolaka (Kg) 2012/ Traffic of Cargo, Baggage and Parcels at San-gia Ni Bandera Airport, Kolaka (kg) 2012
324
8.4.10 Lalu Lintas Barang, Bagasi dan Pos Paket melalui Pelabuhan Udara Ma-tahora, Wakatobi (Kg) 2012/ Traffic of Cargo, Baggage and Parcels at Ma-tahora Airport, Wakatobi (kg) 2012
325
8.5.1 Jumlah Fasilitas Fisik Pelayanan Jasa Pos dan Giro Menurut Kabupaten/Kota 2012/ Number of Physical Facilities of Postal and Demand Deposit Ser-vices by District/City 2012
326
8.5.2 Jumlah Benda-benda Pos yang Dikirim dan Diterima dirinci Menurut kabu-paten/Kota, 2012/Number of Postal Goods Mailed and Received by District/ City 2012
327
8.5.3 Jumlah Benda-benda Pos yang Dikirim dan Diterima dari Dalam dan Luar Negeri Menurut Jenis Pengiriman (Kg) 2012/ Number of Postal Goods Sent and Received from Through Domestic and International Traffic by Kind of Delivery (Kg) 2012
328
8.5.4 Kapasitas Sentral dan Sambungan Telepon Menurut Unit Pengelola Tehnik (UPT), 2012/Central Capacity and Telephone Connection by UPT (Technical Administrator Unit), 2012
329
9 HOTEL DAN PARIWISATA/HOTEL AND TOURISM 338
9,1 Jumlah Hotel/Akomodasi, Kamar dan Tempat Tidur Menurut Kabupaten/Kota 2012/Number of Hotels/ Accomodation, Rooms and Beds by District/City 2012
338
9,1 Jumlah Tamu pada Hotel Bintang dan Non Bintang Menurut Kabupaten/Kota 2012/Number of Guests at Classified and Non Classified Hotel by Dis-trict/City 2012
339

xlii
DAFTAR TABEL
Sulawesi Tenggara Dalam Angka 2013
9.3 Jumlah Kamar dan Tempat Tidur pada Hotel Bintang dan Non Bintang Menurut Kabupaten/Kota 2012/Number of Rooms and Beds at Classified and Non Classified Hotel by District/City 2012
340
9.4 Rata-rata Lamanya Menginap Tamu Dalam Negeri dan Tamu Asing pada Hotel Bintang dan Non Bintang (Hari) 2012/ Average Length of Stay of Do-mestic and Foreign Guest at Classified and Non Classified Hotels (Days) 2012
341
10 KEUANGAN DAN HARGA-HARGA/FINANCE AND PRICES 355
10.1.1 Rencana dan Realisasi Anggaran Pendapatan dan Belanja Daerah Sulawesi Tenggara 2003-2011/ Planning and Realization of Regional Budget of Sula-wesi Tenggara Province 2003-2011
355
10.1.2 Rencana dan Realisasi Pendapatan Daerah Provinsi Sulawesi Tenggara 2010-2011/Planning and Realization of Regional Revenues of Sulawesi Tenggara Province 2010-2011
356
10.1.3 Rencana dan Realisasi Pengeluaran Aparatur Daerah dan Pelayanan Publik Provinsi Sulawesi Tenggra 2010-2011/ Planning and Actual Regional Appa-ratus Expenditures and Public Service of Sulawesi Tenggara Province 2010-2011
357
10.1.4 Rencana dan Realisasi Pembiayaan Pemerintah Daerah Provinsi Sulawesi Tenggara Menurut Jenis Pembiayaan 2010-2011/ Planning and Financing Realization of Sulawesi Tenggara Provincial Goverment by Kind of Financing 2010-2011
358
10.1.5 Realisasi Pendapatan, Belanja dan Pembiayaan Daerah Kabupaten/Kota Menurut Jenis Pendapatan 2011 / Realization of Regional Income, Expendi-tures, and Financing of District/City by Kind of Income 2011
359
10.1.6 Banyaknya Proyek Penanaman Modal Dalam Negeri dan Asing Menurut Jenis Proyek 2012/ Number of Foreign and Domestic Investment Project by Types of Project 2012
360
10.1.7 Pagu, Realisasi dan Sisa DIPA Sektoral Menurut Jenis Proyek 2012/Budget, Realization and Sectoral Budgetting Remainder by Types of Project 2012
361
10.2.1 Realisasi Penerimaan Pajak Daerah Menurut Jenisnya 2001-2012/ Realiza-tion of Regional Tax Revenues by Type of Tax 2001-2012
363
10.2.2 Target dan Realisasi Penerimaan Pajak Pendapatan Daerah 2011-2012/ Target and Realization of Regional Income Tax Revenues 2011-2012
364
10.2.3 Target dan Realisasi Penerimaan Pendapatan Asli Daerah 2011-2012/ Tar-get and Realization of Original Regional Revenues 2011-2012
365

xliii
TABLE OF CONTENT
Sulawesi Tenggara in Figures 2013
10.2.4 Realisasi Penerimaan Pajak Menurut Kabupaten 2008-2012/ Realization of Tax Revenue by District/City 2008-2012
366
10.2.5 Realisasi Penerimaan PBB, IPEDA Menurut Kabupaten/Kota dan Sektor 2012 (Juta Rupiah) / Realization of Revenues of Land and Building Tax, Re-gional Development Contribution by District/City and Sector 2012 (Millions Rupiah)
367
10.3.1 Produksi dan Porto Folio Polis,Jumlah Uang Pertanggungan dan Premi 2001-2012/Production and Portofolio of Policy, Sum Insured and Premium 2011-2012
368
10.3.2 Produksi dan Porto Folio Polis,Jumlah Uang Pertanggungan dan Premi 2001-2012/Production and Portofolio of Policy, Sum Insured and Premium 2001-2012
369
10.3.3 Produksi dan Porto Folio Polis,Jumlah Uang Pertanggungan dan Premi 2001-2012/Production and Portofolio Forto of Policy, Sum Insured and Premium 2001-2012
370
10.3.4 Produksi dan Porto Folio Polis,Jumlah Uang Pertanggungan dan Premi 2005-2012/Production and Portofolio of Policy, Sum Insured and Premium 2005-2012
371
10.3.5 Pembayaran Klaim dan Penerimaan Pinjaman Polis 2001-2012/ Payment of Claims and Policy Loan Revenues 2001-2012
372
10.3.6 Pembayaran Klaim dan Penerimaan Pinjaman Polis 2001-2012/ Payment of Claims and Policy Loan Revenues 2001-2012
373
10.3.7 Pembayaran Klaim dan Penerimaan Pinjaman Polis 2001-2012/ Payment of Claims and Policy Loan Revenues 2001-2012
374
10.3.8 Pembayaran Klaim dan Penerimaan Pinjaman Polis 2000-2006/ Payment of Claims and Policy Loan Revenues 2000-2006
375
10.4.1 Banyaknya Kantor Bank Menurut Kabupaten/Kota 2012/Number of Bank Offices by District/City 2012
376
10.4.2 Banyaknya BRI Unit Desa Menurut Kabupaten/Kota 2012/Number of BRI Village Unit by District/City 2012
378
10.4.3 Perkembangan Giro, Deposito dan Tabungan Keadaan 31 Desember 2002-2012/Progress of Demand Deposits, Time Deposits and Savings at December 31st 2002-2012
379
xliv
DAFTAR TABEL
Sulawesi Tenggara Dalam Angka 2013
10.4.4 Kredit Perbankan Menurut Jenis Kredit di Sulawesi Tenggara 2012/Bank Credit by Types of Credit in Sulawesi Tenggara 2012
380
10.4.5 Jumlah Nasabah dan Nilai Tabungan Menurut Jenis Tabungan di Sulawesi Tenggara 2012/Number of Customer and Savings Value by Types of Savings in Sulawesi Tenggara 2012
381
10.4.6 Perkembangan Tabanas, Taska dan Tabungan Lainnya Keadaan 31 Desem-ber 2002-2012/Progress of National Development Savings, Term Insurance Savings and Other Savings at December 31st 2002-2012
382
10.4.7 Posisi Pinjaman Perbankan Menurut Sektor Ekonomi di Sulawesi Tenggara 2012/ Banking Borrowing Position by Economic Sectors in Sulawesi Tenggara 2012
383
10.5.1 Banyaknya Koperasi Menurut Kabupaten/Kota 2012/ Number of Coopera-tives by District/City 2012
384
10.5.2 Perkembangan Koperasi 2008-2012/Progress of Coorperatives 2008 - 2012 385
10.5.3 Perkembangan Koperasi Non-KUD 2008-2012/ Progress of Non Village Unit Coorperatives 2008-2012
386
10.6.1 Indeks Harga Konsumen Menurut Kelompok di Kendari 2012 /Consumer Prices Indices by Group in Kendari 2012
387
10.6.2 Inflasi Kota Kendari Menurut Kelompok Pengeluaran, 2012/ Inflation Rate of Kendari City by Expenditure Group 2012
389
10.6.3 Harga Eceran BeberapaJenis Barang di Kota Kendari, 2012/ Retail Prices of Essential Commodities in Kendari City 2012
391
10.6.4 Harga Rata-rata Bahan Makanan di Pasar Pedesaan Menurut Jenis Barang , 2009 - 2012/Average Prices of 12 Kinds of Food Stuffs at Rural Mar-ket by Commodity , 2009 - 2012 (Rupiah/Rupiahs)
398
11 PDRB/ GDRP 415
11.1.1 PDRB Sulawesi Tenggara Menurut Lapangan Usaha Atas Dasar Harga Berla-ku 2007-2011/ Sulawesi Tenggara GRDP by Industrial Origin at Current Mar-ket Prices 2007-2011
415
xlv
TABLE OF CONTENT
Sulawesi Tenggara in Figures 2013
11.1.2 PDRB Sulawesi Tenggara Menurut Lapangan Usaha Atas Dasar Harga Kon-stan 2000, 2007-2012/ Sulawesi Tenggara GRDP by Industrial Origin at 2000 Constant Market Prices 2007-2011
416
11.1.3 Distribusi Persentase PDRB Sulawesi Tenggara Menurut Lapangan Usaha Atas Dasar Harga Berlaku 2007-2011/ Percentage Distribution of Sulawesi Tenggara GRDP by Industrial Origin at Current Market Prices 2007-2011
417
11.1.4 Distribusi Persentase PDRB Sulawesi Tenggara Menurut Lapangan Usaha Atas Dasar Harga Konstan 2000, 2007-2011/Percentage Distribution of Sulawesi Tenggara GRDP by Industrial Origin at 2000 Constant Market Pric-es 2007-2011
418
11.1.5 Indeks Perkembangan PDRB Sulawesi Tenggara Menurut Lapangan Usaha Atas Dasar Harga Berlaku 2007-2011/Growth Index of Sulawesi Tenggara GRDP by Industrial Origin at Current Market Prices 2007-2011
419
11.1.6 Indeks Perkembangan PDRB Sulawesi Tenggara Menurut Lapangan Usaha Atas Dasar Harga Konstan 2000, 2007-2011/Growth Index of Sulawesi Tenggara GRDP by Industrial Origin at 2000 Constant Market Prices, 2007-2011
420
11.1.7 PDRB Per Kapita Sulawesi Tenggara 2007-2011/Per Capita GRDP of Sula-wesi Tenggara 2007-2011
421
11.1.8 Indeks Perkembangan PDRB Per Kapita Sulawesi Tenggara 2007-2011/Growth Index of Sulawesi Tenggara Per Capita GRDP 2007-2011
423
11.1.9 Indeks Berantai PDRB Sulawesi Tenggara Menurut Lapangan Usaha Atas Dasar Harga Berlaku 2007-2011/ Link Index of Sulawesi Tenggara GRDP by Industrial Origin at Current Market Prices 2007-2011
425
11.1.10 Indeks Berantai PDRB Sulawesi Tenggara Menurut Lapangan Usaha Atas Dasar Harga Konstan 2000, 2007-2011/Link Index of Sulawesi Tenggara GRDP by Industrial Origin at 2000 Constant Market Prices 2007-2011
426
11.1.11 Indeks Implisit PDRB Sulawesi Tenggara Menurut Lapangan Usaha , 2007-2011/Implicite Index of Sulawesi Tenggara 2007-2011
427
11.2.1 PDRB Sulawesi Tenggara Menurut Penggunaan Atas Dasar Harga Konstan 2000, (Jutaan Rupiah) 2007-2011/ Sulawesi Tenggara GRDP by Expenditure at 2000 Constant Market Prices 2007-2011
428
11.2.2 PDRB Sulawesi Tenggara Menurut Penggunaan Atas Dasar Harga Konstan 2000, (Jutaan Rupiah) 2007-2011/ Sulawesi Tenggara GRDP by Expenditure at 2000 Constant Market Prices 2007-2011
429
11.2.3 Distribusi Persentase PDRB Sulawesi Tenggara Menurut Penggunaan Atas Dasar Harga Berlaku 2007-2011/Percentage Distribution of Sulawesi Tenggara GRDP by Expenditure at Current Market Prices 2007-2011
430

xlvi
DAFTAR TABEL
Sulawesi Tenggara Dalam Angka 2013
11.2.4 Distribusi Persentase PDRB Sulawesi Tenggara Menurut Penggunaan Atas Dasar Harga Konstan 2000, 2007-2011/Percentage Distribution of Sulawesi Tenggara GRDP by Expenditures at 2000 Constant Market Prices 2007-2011
431
11.2.5 Indeks Perkembangan PDRB Sulawesi Tenggara Menurut Penggunaan Atas Dasar Harga Berlaku 2007-2011/Growth Index of Sulawesi Tenggara GRDP by Expenditures at Current Market Prices 2007-2011
432
11.2.6 Indeks Perkembangan PDRB Sulawesi Tenggara Menurut Penggunaan Atas Dasar Harga Konstan 2000, 2007-2011/ Growth Index of Sulawesi Tenggara GRDP by Expenditure Origin at 2000 Constant Market Prices 2007-2011
433
11.2.7 Indeks Berantai PDRB Sulawesi Tenggara Menurut Penggunaan Atas Dasar Harga Berlaku 2007-2011/ Link Index of Sulawesi Tenggara GRDP by Expendi-ture at Current Market Prices 2007-2011
434
11.2.8 Indeks Berantai PDRB Sulawesi Tenggara Menurut Menurut Penggunaan Atas Dasar Harga Konstan 2000, 2007-2011/Link Index of Sulawesi Tenggara GRDP by Expenditure at 2000 Constant Market Prices 2007-2011
435
11.2.9 Indeks Implisit PDRB Sulawesi Tenggara Menurut Penggunaan, 2007-2011/Implicite Index of Sulawesi Tenggara by Expenditure 2007-2011
436
12 PERBANDINGAN DENGAN PROVINSI LAIN/COMPARISON WITH OTHERS PROVINCE
445
12.1.1 Penduduk Pertengahan Tahun Menurut Provinsi, 2009 -2012/Midyear Popu-lation by Province, 2009 - 2012
445
12.2.1 PDRB Atas Dasar Harga Berlaku dirinci Menurut Provinsi (Miliar Rupiah) 2008 -2011/GRDP at Current Market Prices by Province, (Billion Rupiahs) 2008 - 2011
446
12.2.2 PDRB Atas Dasar Harga Konstan 2000 dirinci Menurut Provinsi (Miliar Rupi-ah) 2008 -2011/GRDP at Constant Prices 2000, by Province (Billion Rupiahs), 2008 - 2011
447
12.2.3 PDRB Per Kapita Atas Dasar Harga Berlaku dirinci Menurut Provinsi (Ribu Rupiah) 2008 -2011/Per Capita GRDP at Current Market Prices by Province, (Thousands Rupiahs) 2008 - 2011
448
12.2.4 PDRB Per Kapita Atas Dasar Harga Konstan 2000 dirinci Menurut Provinsi (Ribu Rupiah) 2008 -2011/GRDP Per Capita at Constant Prices 2000, by Prov-ince (Thousand Rupiahs), 2008 - 2011
449
12.2.5 Distribusi Persentase PDRB Atas Dasar Harga Berlaku dirinci Menurut Provinsi (%) 2008 -2011/Percentage Distribution of GRDP at Current Market Prices by Province, (%) 2008 - 2011
450

xlvii
TABLE OF CONTENT
Sulawesi Tenggara in Figures 2013
12.2.6 Laju Pertumbuhan PDRB atas Dasar Harga Konstan 2000 dirinci Menurut Provinsi (%), 2008 -2011 /GDRP Growth Rate at constant prices 2000 by Province (%) 2008 - 2011
451
12.3.1 Jumlah Penduduk Miskin Dirinci Menurut Provinsi, 2008 -2012 (000 Jiwa)/
Number of poor people by Province, 2008 - 2012 (000 people)
452
12.3.2 Persentase Penduduk Miskin Menurut Provinsi, 2008 - 2012/Percentage
of poor people by province, 2008 - 2012
453
12.3.3 Garis Kemiskinan Menurut Provinsi, 2008 - 2012 (Rupiah Per Kapita)/
Poverty Line by province 2008 - 2012 (Rupiah Per Capita)
454
12.4.1 Indeks Pembangunan Manusia (IPM) Menurut provinsi 2007 - 2011/
Human Development Index (HDI) by province 2007 - 2012
455
12.4.2 Laju Inflasi di Ibukota Provinsi Indonesia, 2010 - 2012/Inflation Rate at
Provincial Capital in Indonesia, 2010 - 2012
456
12.4.3 Indeks Kemahalan Konstruksi (IKK) Menurut Provinsi 2010 - 2012/
Construction Cost Index (CCI) by province 2010 - 2012
457

xlviii
DAFTAR TABEL
Sulawesi Tenggara Dalam Angka 2013
Halaman ini sengaja dikosongkan This Page Intentionally Left Blank
EXPLANATORY NOTES
xlix Sulawesi Tenggara in Figures 2013
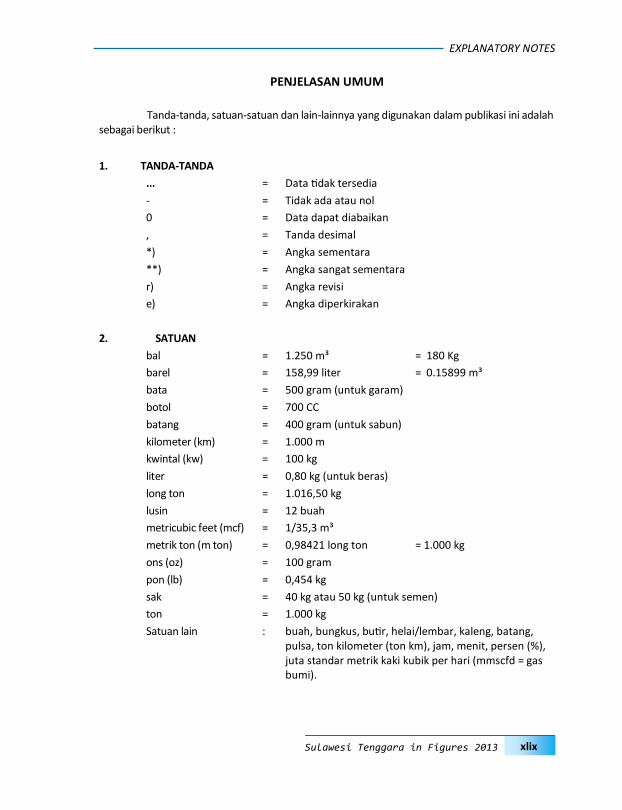
PENJELASAN UMUM
Tanda-tanda, satuan-satuan dan lain-lainnya yang digunakan dalam publikasi ini adalah
sebagai berikut :
1. TANDA-TANDA
... = Data tidak tersedia
- = Tidak ada atau nol
0 = Data dapat diabaikan
, = Tanda desimal
*) = Angka sementara
**) = Angka sangat sementara
r) = Angka revisi
e) = Angka diperkirakan
2. SATUAN
bal = 1.250 m³ = 180 Kg
barel = 158,99 liter = 0.15899 m³
bata = 500 gram (untuk garam)
botol = 700 CC
batang = 400 gram (untuk sabun)
kilometer (km) = 1.000 m
kwintal (kw) = 100 kg
liter = 0,80 kg (untuk beras)
long ton = 1.016,50 kg
lusin = 12 buah
metricubic feet (mcf) = 1/35,3 m³
metrik ton (m ton) = 0,98421 long ton = 1.000 kg
ons (oz) = 100 gram
pon (lb) = 0,454 kg
sak = 40 kg atau 50 kg (untuk semen)
ton = 1.000 kg
Satuan lain : buah, bungkus, butir, helai/lembar, kaleng, batang, pulsa, ton kilometer (ton km), jam, menit, persen (%), juta standar metrik kaki kubik per hari (mmscfd = gas bumi).

PENJELASAN UMUM
l Sulawesi Tenggara Dalam Angka 2013
3. KLASIFIKASI INDUSTRI PENGOLAHAN
31. Industri makanan, minuman dan tembakau
32. Industri tekstil, pakaian jadi dan kulit
33. Industri kayu dan barang-barang dari kayu, termasuk perabot rumahtangga.
34. Industri kertas dan barang-barang dari kertas, percetakan dan penerbitan.
35. Industri kimia dan barang-barang dari kimia, minyak bumi dan batu bara
36. Industri barang bukan logam kecuali minyak bumi dan batu bara
37. Industri logam dasar
38. Industri barang dari logam, mesin dan peralatannya
39. Industri, barang pengolahan lainnya
4. LAIN-LAIN
FOB = Free On Board = Harga ekspor sampai ke pelabuhan muat
CIF = Cost Insurance and Freight = Harga untuk impor sampai ke pelabuhan masuk
CIF=FOB = (Asuransi dan freight)
M.T.O.W = Maximum Tage of Weight = kemampuan berat maksimum suatu pesawat untuk terbang
DWT = Dead weights Ton = bobot mati
B.R.T. = Bruto Registered Ton
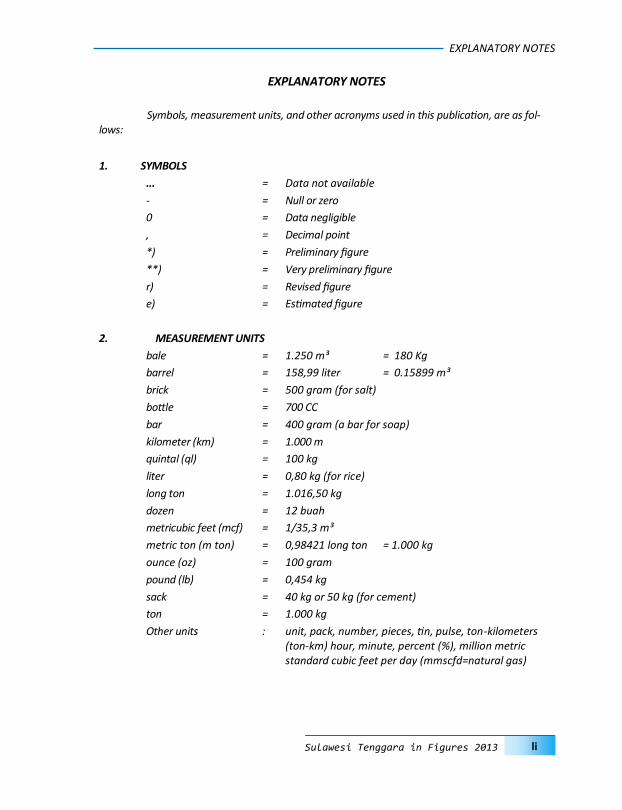
EXPLANATORY NOTES
li Sulawesi Tenggara in Figures 2013
EXPLANATORY NOTES
Symbols, measurement units, and other acronyms used in this publication, are as fol-
lows:
1. SYMBOLS
... = Data not available
- = Null or zero
0 = Data negligible
, = Decimal point
*) = Preliminary figure
**) = Very preliminary figure
r) = Revised figure
e) = Estimated figure
2. MEASUREMENT UNITS
bale = 1.250 m³ = 180 Kg
barrel = 158,99 liter = 0.15899 m³
brick = 500 gram (for salt)
bottle = 700 CC
bar = 400 gram (a bar for soap)
kilometer (km) = 1.000 m
quintal (ql) = 100 kg
liter = 0,80 kg (for rice)
long ton = 1.016,50 kg
dozen = 12 buah
metricubic feet (mcf) = 1/35,3 m³
metric ton (m ton) = 0,98421 long ton = 1.000 kg
ounce (oz) = 100 gram
pound (lb) = 0,454 kg
sack = 40 kg or 50 kg (for cement)
ton = 1.000 kg
Other units : unit, pack, number, pieces, tin, pulse, ton-kilometers (ton-km) hour, minute, percent (%), million metric standard cubic feet per day (mmscfd=natural gas)

PENJELASAN UMUM
lii Sulawesi Tenggara Dalam Angka 2013
3. CLASSIFICATION OF MANUFACTURING INDUSTRY
31. Manufacturing industry of food, beverages and tobacco
32. Manufacturing industry of textile, garments and leathers
33. Manufacturing industry of wood, products of woods, including furniture
34. Manufacturing industry of paper and paper products, printing and publishing
35. Manufacturing industry of chemical and products of chemical, petroleum, and coal.
36. Manufacturing industry of nonmetallic mineral products, except products of pe-troleum and coal.
37. Manufacturing industry of basic metal
38. Manufacturing industry of fabricated metal products, machinery and equipments.
39. Other manufacturing industries
4. OTHERS
FOB = Free On Board
CIF = Cost, Insurance and Freight
CIF=FOB = Insurance and freight
M.T.O.W = Maximum Take-off Weight
DWT = Deadweights Tonnage
B.R.T. = Bruto Registered Tonnage
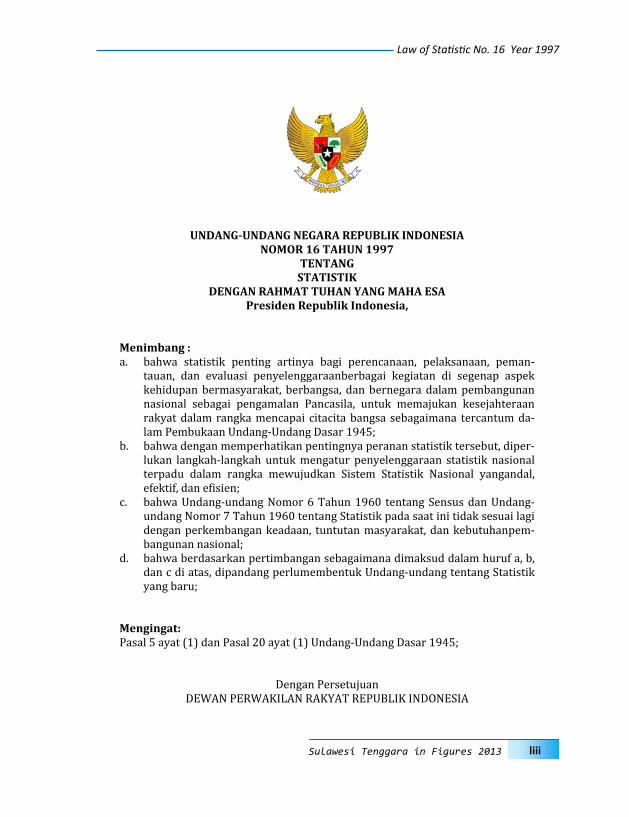
Law of Sta s c No. 16 Year 1997
liii Sulawesi Tenggara in Figures 2013
UNDANG‐UNDANGNEGARAREPUBLIKINDONESIANOMOR16TAHUN1997
TENTANGSTATISTIK
DENGANRAHMATTUHANYANGMAHAESAPresidenRepublikIndonesia,
Menimbang:a. bahwa statistik penting artinya bagi perencanaan, pelaksanaan, peman-
tauan, dan evaluasi penyelenggaraanberbagai kegiatan di segenap aspekkehidupanbermasyarakat, berbangsa, danbernegaradalampembangunannasional sebagai pengamalan Pancasila, untuk memajukan kesejahteraanrakyatdalamrangkamencapai citacitabangsa sebagaimana tercantumda-lamPembukaanUndang-UndangDasar1945;
b. bahwadenganmemperhatikanpentingnyaperananstatistiktersebut,diper-lukan langkah-langkah untukmengatur penyelenggaraan statistik nasionalterpadu dalam rangka mewujudkan Sistem Statistik Nasional yangandal,efektif,dane isien;
c. bahwaUndang-undangNomor6Tahun1960 tentangSensusdanUndang-undangNomor7Tahun1960tentangStatistikpadasaatinitidaksesuailagidenganperkembangankeadaan, tuntutanmasyarakat,dankebutuhanpem-bangunannasional;
d. bahwaberdasarkanpertimbangansebagaimanadimaksuddalamhurufa,b,dancdiatas,dipandangperlumembentukUndang-undangtentangStatistikyangbaru;
Mengingat:Pasal5ayat(1)danPasal20ayat(1)Undang-UndangDasar1945;
DenganPersetujuan
DEWANPERWAKILANRAKYATREPUBLIKINDONESIA
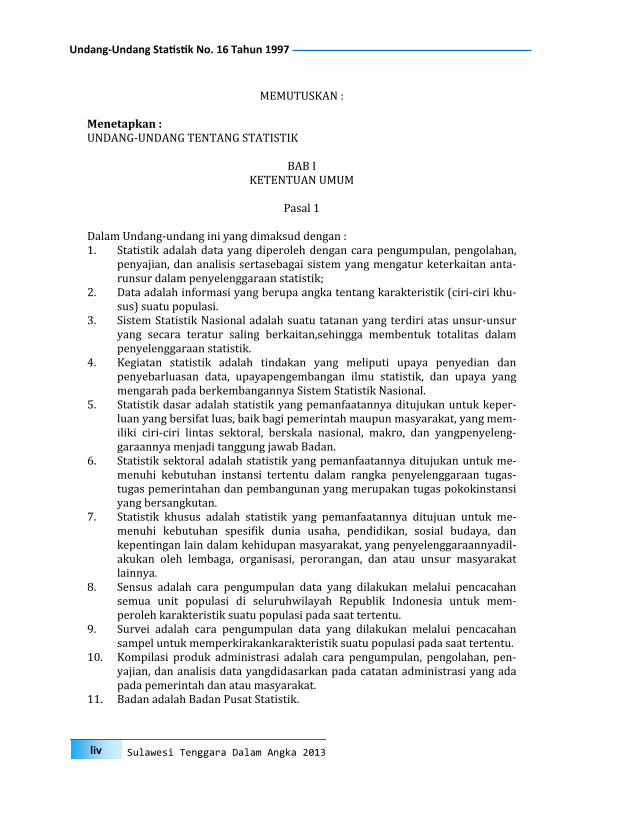
Undang‐Undang Sta s k No. 16 Tahun 1997
liv Sulawesi Tenggara Dalam Angka 2013
MEMUTUSKAN:
Menetapkan:UNDANG-UNDANGTENTANGSTATISTIK
BABIKETENTUANUMUM
Pasal1
DalamUndang-undanginiyangdimaksuddengan:1. Statistikadalahdatayangdiperolehdengancarapengumpulan,pengolahan,
penyajian,dananalisissertasebagaisistemyangmengaturketerkaitananta-runsurdalampenyelenggaraanstatistik;
2. Dataadalahinformasiyangberupaangkatentangkarakteristik(ciri-cirikhu-sus)suatupopulasi.
3. SistemStatistikNasionaladalahsuatutatananyangterdiriatasunsur-unsuryang secara teratur saling berkaitan,sehingga membentuk totalitas dalampenyelenggaraanstatistik.
4. Kegiatan statistik adalah tindakan yang meliputi upaya penyedian danpenyebarluasan data, upayapengembangan ilmu statistik, dan upaya yangmengarahpadaberkembangannyaSistemStatistikNasional.
5. Statistikdasaradalahstatistikyangpemanfaatannyaditujukanuntukkeper-luanyangbersifatluas,baikbagipemerintahmaupunmasyarakat,yangmem-iliki ciri-ciri lintas sektoral, berskala nasional, makro, dan yangpenyeleng-garaannyamenjaditanggungjawabBadan.
6. Statistiksektoraladalahstatistikyangpemanfaatannyaditujukanuntukme-menuhi kebutuhan instansi tertentu dalam rangka penyelenggaraan tugas-tugaspemerintahandanpembangunanyangmerupakantugaspokokinstansiyangbersangkutan.
7. Statistik khusus adalah statistik yang pemanfaatannya ditujuan untuk me-menuhi kebutuhan spesi ik dunia usaha, pendidikan, sosial budaya, dankepentinganlaindalamkehidupanmasyarakat,yangpenyelenggaraannyadil-akukan oleh lembaga, organisasi, perorangan, dan atau unsur masyarakatlainnya.
8. Sensus adalah cara pengumpulan data yang dilakukan melalui pencacahansemua unit populasi di seluruhwilayah Republik Indonesia untuk mem-perolehkarakteristiksuatupopulasipadasaattertentu.
9. Survei adalah cara pengumpulan data yang dilakukan melalui pencacahansampeluntukmemperkirakankarakteristiksuatupopulasipadasaattertentu.
10. Kompilasi produk administrasi adalah cara pengumpulan, pengolahan, pen-yajian,dananalisisdatayangdidasarkanpadacatatanadministrasiyangadapadapemerintahdanataumasyarakat.
11. BadanadalahBadanPusatStatistik.

Law of Sta s c No. 16 Year 1997
lv Sulawesi Tenggara in Figures 2013
12. Populasi adalah keseluruhan unit yangmenjadi objek kegiatan statistik baikyang berupa instansi pemerintah,lembaga, organisasi, orang, benda maupunobjeklainnya.
13. Sampel adalah sebagian unit populasi yang menjadi objek penelitian untukmemperkirakankarakteristiksuatupopulasi.
14. Sinopsisadalahsuatuikhtisarpenyelenggaraanstatistik.15. Penyelenggarakegiatan statistik adalah instansipemerintah, lembaga, organ-
isasi,perorangan,danatauunsurmasyarakatlainnya.16. Petugas statistikadalahorangyangdiberi tugasolehpenyelenggarakegiatan
statistikuntukmelaksanakanpengumpulandata,baikmelaluiwawancara,pen-gukuran,maupuncaralainterhadapobjekkegiatanstatistik.
17. Responden adalah instansi pemerintah, lembaga, organisasi, orang, dan atauunsurmasyarakatlainnyayangditentukansebagaiobjekkegiatanstatistik.
BABII
ASAS,ARAH,DANTUJUAN
Pasal2
Selain berlandaskan asas-asas pembangunan nasional, Undang-undang ini juga be-rasaskan:a. keterpaduan;b. keakuratan;danc. kemutakhiran.
Pasal3
Kegiatanstatistikdiarahkanuntuk:a. mendukungpembangunannasional;b. mengembangkanSistemStatistikNasionalyangandal,efektif,dane isien;c. meningkatkankesadaranmasyarakatakanartidankegunaanstatistik;dand. mendukungpengembanganilmupengetahuandanteknologi.
Pasal4
Kegiatanstatistikbertujuanuntukmenyediakandatastatistikyanglengkap,akurat,danmutakhirdalamrangkamewujudkan Sistem Statistik Nasional yang andal, efektif, dan e isien guna men-dukungpembangunannasional.
BABIIIJENISSTATISTIKDANCARAPENGUMPULANDATA
BagianPertamaJenisStatistik
Pasal5
Berdasarkantujuanpemanfaatannya,jenisstatistikterdiriatas:

Undang‐Undang Sta s k No. 16 Tahun 1997
lvi Sulawesi Tenggara Dalam Angka 2013
a. statistikdasar;b. statistiksektoral;danc. statistikkhusus.
Pasal6
(1) Statistik dasar dan statistik sektoral terbuka pemanfaatannya untuk umum,kecualiditentukanlainolehperaturanperundang-undanganyangberlaku;
(2) Setiap orang memiliki kesempatan yang sama untuk mengetahui dan me-manfaatkanstatistikkhususdengantetapmemperhatikanseseorangataulem-bagayangdilindungiundang-undang.
BagianKeduaCaraPengumpulanData
Pasal7
Statistikdiselenggarakanmelaluipengumpulandatayangdilakukandengancara:a. sensus;b. survei;c. kompilasiprodukadministrasi;dand. caralainsesuaidenganperkembanganilmupengetahuandanteknologi.
Pasal8(1) Sensus sebagaimanadimaksuddalamPasal 7huruf adiselenggarakan seku-
rang-kurangnyasekalidalam10(sepuluh)tahunolehBadan,yangmeliputi:(2) (3) sensuspenduduk;(4) sensuspertanian;dan(5) sensusekonomi.(6) Penetapan tahunpenyelenggaraandanperubahan jenis sensus sebagaimana
dimaksuddalamayat(1),diaturlebihlanjutdenganPeraturanPemerintah.
Pasal9(1) SurveisebagaimanadimaksuddalamPasal7hurufbdiselenggarakansecara
berkaladansewaktu-waktuuntukmemperolehdatayangrinci.(2) Surveiantarsensusdilakukanpadapertengahan2(dua)sensussejenisuntuk
menjembatani2(dua)sensustersebut.
Pasal10(1) KompilasiprodukadministrasisebagaimanadimaksuddalamPasal7hurufc
dilaksanakandenganmemanfaatkanberbagaidokumenprodukadministrasi.(2) Hasilkompilasiprodukadministrasimilik instansipemerintah terbukapem-
anfaatannyauntukumum,kecualiditentukan lainolehperaturanperundang-undanganyangberlaku.
(3) Setiaporangmempunyaikesempatanyangsamauntukmengetahuidanme-

Law of Sta s c No. 16 Year 1997
lvii Sulawesi Tenggara in Figures 2013
manfaatkan hasil kompilasi produk administrasi milik lembaga, organisasi,perorangan,danatauunsurmasyarakatlainnyadengantetapmemperhatikanhakseseorangataulembagayangdilindungiundang-undang.
BABIV
PENYELENGGARAANSTATISTIKBagianPertamaStatistikDasar
Pasal11
(1) StatistikdasardiselenggarakanolehBadan.(2) Dalammenyelenggarakan statistik dasar sebagaimana dimaksuddalam ayat
(1),Badanmemperolehdatadengancara:a. sensus;b. survei;c. kompilasiprodukadministrasi;dand. caralainsesuaidenganperkembanganilmupengetahuandanteknologi.
BagianKedua
StatistikSektoral
Pasal12(1) Statistik sektoral diselenggarakan oleh instansi pemerintah sesuai lingkup
tugasdanfungsinya,secaramandiriataubersamadenganBadan.(2) Dalammenyelenggarakanstatistiksektoral,instansipemerintahmemperoleh
datadengancara:a. survei;b. kompilasiprodukadministrasi;danc. caralainsesuaidenganperkembanganilmupengetahuandanteknologi.
(3) Statistik sektoral harus diselenggarakan bersama dengan Badan apabilastatistik tersebut hanya dapat diperolehdengan cara sensus dan denganjangkauanpopulasiberskalanasional.
(4) HasilstatistiksektoralyangdiselenggarakansendiriolehinstansipemerintahwajibdiserahkankepadaBadan.
BagianKetigaStatistikKhusus
Pasal13
(1) Statistik khusus diselenggarakan olehmasyarakat, baik lembaga, organisasi,peroranganmaupun unsurmasyarakat lainnya secaramandiri atau bersamadenganBadan.
(2) Dalammenyelenggarakanstatistikkhusussebagaimanadimaksuddalamayat(1),masyarakatmemperolehdatadengancara:a. survei;
Undang‐Undang Sta s k No. 16 Tahun 1997
lviii Sulawesi Tenggara Dalam Angka 2013
b. kompilasiprodukadministrasi;danc. caralainsesuaidenganperkembanganilmupengetahuandanteknolo-
gi.
Pasal14(1) Dalam rangka pengembangan Sistem Statistik Nasional, masyarakat se-
bagaimanadimaksuddalamPasal13ayat(1)wajibmemberitahukansinop-siskegiatanstatistikyangtelahselesaidiselenggarakannyakepadaBadan.
(2) Sinopissebagaimanadimaksuddalamayat(1)memuat:judul;a. wilayahkegiatanstatistik;b. objekpopulasi;c. jumlahresponden;d. waktupelaksanaan;e. metodestatistik;f. namadanalamatpenyelenggara;dang. abstrak.
(3) Penyampaianpemberitahuansinopsisdapatdilakukanmelaluipos,jaringankomunikasidataataucarapenyampaianlainnyayangdianggapmudahbagipenyelenggarakegiatanstatistik.
(4) Kewajiban memberitahukan sinopsis sebagaimana dimaksud dalam ayat(1),tidakberlakubagistatistikyangdigunakanuntukmemenuhikebutuhanintern.
BABV
PENGUMUMANDANPENYEBARLUASAN
Pasal15(1) Badanberwenangmengumumkanhasilstatistikyangdiselenggarakannya.(2) PengumumanhasilstatistikdimuatdalamBeritaResmiStatistik.
Pasal16Badanmenyebarluaskanhasilstatistikyangdiselenggarakannya.
BABVIKOORDINASIDANKERJASAMA
Pasal17
(1) KoordinasidankerjasamapenyelenggaraanstatistikdilakukanolehBadandenganinstansipemerintahdanmasyarakat,ditingkatpusatdandaerah.
(2) DalamrangkamewujudkandanmengembangkanSistemStatistikNasional,Badan bekerja sama denganinstansi pemerintah dan masyarakat untukmembangunpembakuankonsep,de inisi,klasi ikasi,danukuran-ukuran.
(3) Koordinasi dan kerja sama sebagaimana dimaksud dalam ayat (1) dil-aksanakanatasdasarkemitraandandengantetapmengantisipasisertamen-

Law of Sta s c No. 16 Year 1997
lix Sulawesi Tenggara in Figures 2013
erapkanperkembanganilmupengetahuandanteknologi.(4) Ketentuanmengenaitatacaradanlingkupkoordinasidankerjasamapenye-
lenggaraanstatistikantaraBadan,instansipemerintah,danmasyarakatdia-turlebihlanjutdenganKeputusanPresiden.
Pasal18(1) Kerja samapenyelenggaraanstatistikdapat jugadilakukanolehBadan, in-
stansi pemerintah, dan ataumasyarakat dengan lembaga internasional,negaraasing,ataulembagaswastaasingsesuaidenganperaturanperundang-undanganyangberlaku.
(2) Kerjasamapenyelenggaraanstatistiksebagaimanadimaksuddalamayat(1)didasarkanpadaprinsipbahwapenyelenggarautamaadalahBadan,instansipemerintah,ataumasyarakatIndonesia.
BABVII
HAKDANKEWAJIBANBagianPertama
PenyelenggaraKegiatanStatistik
Pasal19Penyelenggarakegiatanstatistikberhakmemperolehketerangandarirespondenmengenaikarakteristiksetiapunitpopulasiyangmenjadiobjek.
Pasal20Penyelenggara kegiatan statistik wajib memberikan kesempatan yang samakepadamasyarakatuntukmengetahuidanmemperolehmanfaatdari statistik yang tersedia, sesuaidenganketentuanperaturanperundang-undanganyangberlaku.
Pasal21Penyelenggara kegiatan statistikwajibmenjamin kerahasiaan keterangan yangdiperolehdariresponden.BagianKeduaPetugasStatistik
Pasal22SetiappetugasstatistikBadanberhakmemasukiwilayahkerjayangtelahditen-tukanuntukmemperolehketeranganyangdiperlukan.
Pasal23Setiap petugas statistik wajib menyampaikan hasil pelaksanaan statistik se-bagaimanaadanya.

Undang‐Undang Sta s k No. 16 Tahun 1997
lx Sulawesi Tenggara Dalam Angka 2013
Pasal24
Ketentuan mengenai jaminan kerahasiaan keterangan sebagaimana dimaksudPasal21berlakujugabagipetugasstatistik.
Pasal25Setiap petugas statistik harus memperlihatkan surat tugas dan atau tandapengenal, serta wajib memperhatikan nilai-nilaiagama, adat istiadat setempat,tatakrama,danketertibanumum.
BagianKetigaResponden
Pasal26(1) Setiap orang berhak menolak untuk dijadikan responden, kecuali dalam
penyelenggaraanstatistikdasarolehBadan.(2) Setiap responden berhak menolak petugas statistik yang tidak dapat me-
menuhiketentuansebagaimanadimaksuddalamPasal25.
Pasal27
Setiaprespondenwajibmemberikanketeranganyangdiperlukandalampenye-lenggaraanstatistikdasarolehBadan.
BABVIIIKELEMBAGAAN
Pasal28
(1) PemerintahmembentukBadanyangberadadibawahdanbertanggung ja-wablangsungkepadaPresiden.
(2) BadanmempunyaiperwakilanwilayahdiDaerahyangmerupakaninstansivertikal.
(3) Ketentuanmengenaitugas,fungsi,susunanorganisasi,dantatakerjaBadan,sebagaimanadimaksuddalamayatdanayat (2), diatur lebih lanjutdenganKeputusanPresiden.
Pasal29
(1) Pemerintah membentuk Forum Masyarakat Statistik yang bertugas mem-berikansarandanpertimbangandibidangstatistikkepadaBadan.
(2) Forum sebagaimana dimaksud dalam ayat (1) bersifat nonstruktural danindependen,yanganggotanyaterdiriatasunsurpemerintah,pakar,praktisi,dantokohmasyarakat.
Law of Sta s c No. 16 Year 1997
lxi Sulawesi Tenggara in Figures 2013
Pasal30(1) Instansipemerintahdapatmembentuksatuanorganisasidi lingkungannya
untukmelaksanakanstatistiksektoral.(2) Ketentuanmengenaitugas,fungsi,susunanorganisasi,dantatakerjasatuan
organisasi sebagaimana dimaksuddalam ayat (1) diatur oleh instansi yangbersangkutanberdasarkanperaturanperundang-undanganyangberlaku.
(3) Dalammenyelenggarakanstatistiksektoral,satuanorganisasisebagaimanadimaksuddalamayat(1)harusmengadakankoordinasidenganBadanuntukmenerapkan penggunaan konsep, de inisi, klasi ikasi, dan ukuran-ukuranyang telahdibakukandalamrangkapengembanganSistemStatistikNasional.
BABIX
PEMBINAAN
Pasal31Badan bekerja sama dengan instansi pemerintah dan unsur masyarakatmelakukan pembinaan terhadappenyelenggara kegiatan statistik danmasyara-kat, agar lebih meningkatkan kontribusi dan apresiasi masyarakatterhadapstatistik, mengembangkan Sistem Statistik Nasional, dan mendukung pem-bangunannasional.
Pasal32Dalam rangka pembinaan sebagaimana dimaksud dalam Pasal 31, Badanmelakukanupaya-upayasebagaiberikut:a. meningkatkan kemampuan sumber dayamanusia dalam penyelenggaraan
statistik;b. mengembangkanstatistiksebagaiilmu;c. meningkatkan penguasaan ilmu pengetahuan dan teknologi yang dapat
mendukungpenyelenggaraanstatistik;d. mewujudkan kondisi yang mendukung terbentuknya pembakuan dan
pengembangan konsep, de inisi,klasi ikasi, dan ukuran-ukuran dalamkerangkasemangatkerjasamadenganparapenyelenggarakegiatanstatistiklainnya;
e. mengembangkansisteminformasistatistik;f. meningkatkanpenyebarluasaninformasistatistik;g. meningkatkan kemampuan penggunaan dan pemanfaatan hasil statistik
untukmendukungpembangunannasional;danh. meningkatkankesadaranmasyarakatakanartidankegunaanstatistik.
Pasal33
Pelaksanaan pembinaan sebagaimana dimaksud dalam Pasal 31 diatur lebihlanjutdenganPeraturanPemerintah.
Undang‐Undang Sta s k No. 16 Tahun 1997
lxii Sulawesi Tenggara Dalam Angka 2013
BABXKETENTUANPIDANA
Pasal34
Setiaporangyang tanpahakmenyelenggarakansensus sebagaimanadimaksuddalamPasal11 ayat (2)huruf a,dipidanadenganpidanapenjarapaling lama2(dua)tahundandendapalingbanyakRp.50.000.000,00(limapuluhjutarupiah).
Pasal35
SetiaporangyangdengansengajamelanggarketentuansebagaimanadimaksuddalamPasal14ayat(1),dipidanadenganpidanakurunganpaling lama1(satu)tahunataudendapalingbanyakRp.25.000.000,00(duapuluhlimajutarupiah).
Pasal36
(1) PenyelengarakegiatanstatistikyangdengansengajadantanpaalasanyangsahtidakmemenuhikewajibansebagaimanadimaksuddalamPasal20,dipi-danadenganpidanakurunganpalinglama1(satu)tahunataudendapalingbanyakRp.25.000.000,00(duapuluhlimajutarupiah).
(2) Penyelengara kegiatan statistik yang dengan sengajamelanggar ketentuansebagaimana dimaksud dalam Pasal21, dipidana dengan pidana penjarapaling lama 5 (lima) tahun dan denda paling banyak Rp. 100.000.000,00(seratusjutarupiah).
Pasal37
Petugasstatistikyangdengansengajamelanggarketentuansebagaimanadimak-suddalamPasal24,dipidanadenganpidanapenjarapalinglama1(satu)tahun6(enam)bulandandendapalingbanyakRp.15.000.000,00 (limabelasjuta rupi-ah).
Pasal38Responden yang dengan sengaja melanggar ketentuan sebagaimana dimaksuddalam Pasal 27, dipidana denganpidana penjara paling lama 1 (satu) tahun 6(enam) bulan dan denda paling banyakRp. 25.000.000,00 (dua puluhlima jutarupiah).
Pasal39Setiaporangyangdengansengajadantanpaalasanyangsahmencegah,mengha-lang-halangi, atau menggagalkanjalannya penyelenggaraan statistik yang dil-akukan oleh penyelenggara kegiatan statistik dasar dan atau statistiksektoral,dipidanadenganpidanapenjarapalinglama5(lima)tahundendapalingbanyakRp.100.000.000,00(seratusjutarupiah).
Pasal40

Law of Sta s c No. 16 Year 1997
lxiii Sulawesi Tenggara in Figures 2013
(1) Tindak pidana sebagaimana dimaksud dalam Pasal 34, Pasal 36 ayat (2),Pasal37,Pasal38,danPasal39adalahkejahatan.
(2) TindakpidanasebagaimanadimaksuddalamPasal35danPasal36ayat(1)adalahpelanggaran.
BABXI
KETENTUANPERALIHAN
Pasal41Semua peraturan pelaksanaan Undang-undang Nomor 6 Tahun 1960 tentangSensus dan Undang-undang Nomor 7Tahun 1960 tentang Statistik dinyatakantetap berlaku sepanjang tidak bertentangan atau belum diganti dengan yangbaruberdasarkanUndang-undangini.
BABXII
KETENTUANPENUTUP
Pasal42PadasaatmulaiberlakunyaUndang-undangini,makaUndang-undangNomor6Tahun 1960 tentang Sensus danUndang-undangNomor 7 Tahun 1960 tentangStatistikdinyatakantidakberlaku.
Pasal43Undang-undanginimulaiberlakupadatanggaldiundangkan.
Agarsetiaporangdapatmengetahuinya,memerintahkanpengundanganUndang-undanginidenganpenempatannyadalamLembaranNegaraRepublikIndonesia.
DisahkandiJakartapadatanggal19Mei1997PRESIDENREPUBLIKINDONESIAttdSOEHARTO
DiundangkandiJakartapadatanggal19Mei1997MENTERINEGARASEKRETARISNEGARAREPUBLIKINDONESIA

Undang‐Undang Sta s k No. 16 Tahun 1997
lxiv Sulawesi Tenggara Dalam Angka 2013
Halaman ini sengaja dikosongkan This Page Inten onally Le Blank

geography and climateGEOGRAFI DAN IKLIM1
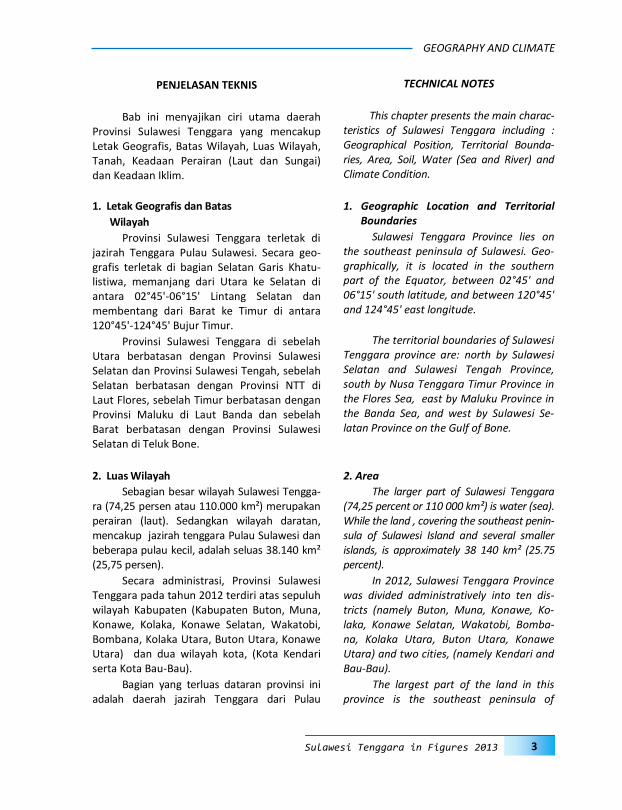
GEOGRAPHY AND CLIMATE
3 Sulawesi Tenggara in Figures 2013
PENJELASAN TEKNIS
Bab ini menyajikan ciri utama daerah Provinsi Sulawesi Tenggara yang mencakup Letak Geografis, Batas Wilayah, Luas Wilayah, Tanah, Keadaan Perairan (Laut dan Sungai) dan Keadaan Iklim.
1. Letak Geografis dan Batas
Wilayah
Provinsi Sulawesi Tenggara terletak di jazirah Tenggara Pulau Sulawesi. Secara geo-grafis terletak di bagian Selatan Garis Khatu-listiwa, memanjang dari Utara ke Selatan di antara 02°45'-06°15' Lintang Selatan dan membentang dari Barat ke Timur di antara 120°45'-124°45' Bujur Timur.
Provinsi Sulawesi Tenggara di sebelah Utara berbatasan dengan Provinsi Sulawesi Selatan dan Provinsi Sulawesi Tengah, sebelah Selatan berbatasan dengan Provinsi NTT di Laut Flores, sebelah Timur berbatasan dengan Provinsi Maluku di Laut Banda dan sebelah Barat berbatasan dengan Provinsi Sulawesi Selatan di Teluk Bone.
2. Luas Wilayah
Sebagian besar wilayah Sulawesi Tengga-ra (74,25 persen atau 110.000 km²) merupakan perairan (laut). Sedangkan wilayah daratan, mencakup jazirah tenggara Pulau Sulawesi dan beberapa pulau kecil, adalah seluas 38.140 km² (25,75 persen).
Secara administrasi, Provinsi Sulawesi Tenggara pada tahun 2012 terdiri atas sepuluh wilayah Kabupaten (Kabupaten Buton, Muna, Konawe, Kolaka, Konawe Selatan, Wakatobi, Bombana, Kolaka Utara, Buton Utara, Konawe Utara) dan dua wilayah kota, (Kota Kendari serta Kota Bau-Bau).
Bagian yang terluas dataran provinsi ini adalah daerah jazirah Tenggara dari Pulau
TECHNICAL NOTES
This chapter presents the main charac-teristics of Sulawesi Tenggara including : Geographical Position, Territorial Bounda-ries, Area, Soil, Water (Sea and River) and Climate Condition.
1. Geographic Location and Territorial Boundaries
Sulawesi Tenggara Province lies on the southeast peninsula of Sulawesi. Geo-graphically, it is located in the southern part of the Equator, between 02°45' and 06°15' south latitude, and between 120°45' and 124°45' east longitude.
The territorial boundaries of Sulawesi Tenggara province are: north by Sulawesi Selatan and Sulawesi Tengah Province, south by Nusa Tenggara Timur Province in the Flores Sea, east by Maluku Province in the Banda Sea, and west by Sulawesi Se-latan Province on the Gulf of Bone.
2. Area
The larger part of Sulawesi Tenggara (74,25 percent or 110 000 km²) is water (sea). While the land , covering the southeast penin-sula of Sulawesi Island and several smaller islands, is approximately 38 140 km² (25.75 percent).
In 2012, Sulawesi Tenggara Province was divided administratively into ten dis-tricts (namely Buton, Muna, Konawe, Ko-laka, Konawe Selatan, Wakatobi, Bomba-na, Kolaka Utara, Buton Utara, Konawe Utara) and two cities, (namely Kendari and Bau-Bau).
The largest part of the land in this province is the southeast peninsula of
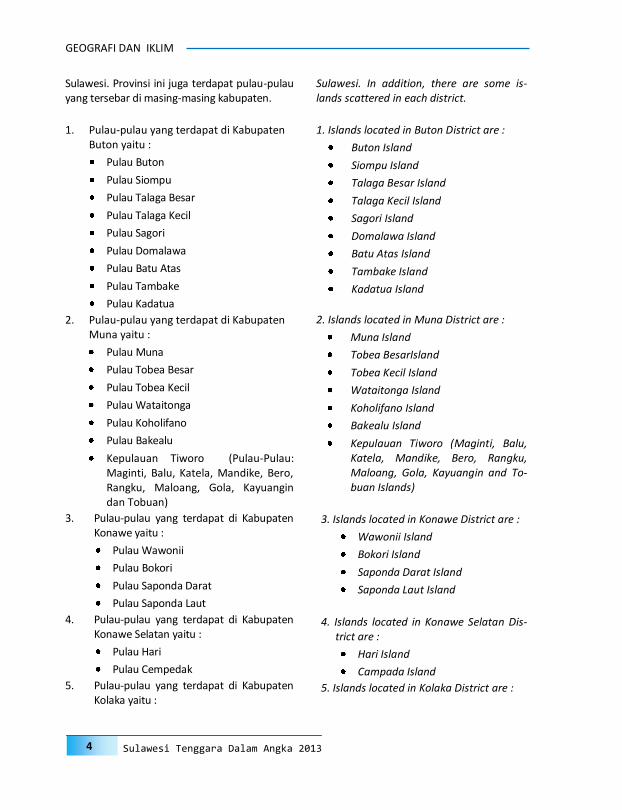
GEOGRAFI DAN IKLIM
4 Sulawesi Tenggara Dalam Angka 2013
Sulawesi. Provinsi ini juga terdapat pulau-pulau yang tersebar di masing-masing kabupaten.
1. Pulau-pulau yang terdapat di Kabupaten Buton yaitu :
Pulau Buton
Pulau Siompu
Pulau Talaga Besar
Pulau Talaga Kecil
Pulau Sagori
Pulau Domalawa
Pulau Batu Atas
Pulau Tambake
Pulau Kadatua
2. Pulau-pulau yang terdapat di Kabupaten Muna yaitu :
Pulau Muna
Pulau Tobea Besar
Pulau Tobea Kecil
Pulau Wataitonga
Pulau Koholifano
Pulau Bakealu
Kepulauan Tiworo (Pulau-Pulau: Maginti, Balu, Katela, Mandike, Bero, Rangku, Maloang, Gola, Kayuangin dan Tobuan)
3. Pulau-pulau yang terdapat di Kabupaten Konawe yaitu :
Pulau Wawonii
Pulau Bokori
Pulau Saponda Darat
Pulau Saponda Laut
4. Pulau-pulau yang terdapat di Kabupaten Konawe Selatan yaitu :
Pulau Hari
Pulau Cempedak
5. Pulau-pulau yang terdapat di Kabupaten Kolaka yaitu :
Sulawesi. In addition, there are some is-lands scattered in each district.
1. Islands located in Buton District are :
Buton Island
Siompu Island
Talaga Besar Island
Talaga Kecil Island
Sagori Island
Domalawa Island
Batu Atas Island
Tambake Island
Kadatua Island
2. Islands located in Muna District are :
Muna Island
Tobea BesarIsland
Tobea Kecil Island
Wataitonga Island
Koholifano Island
Bakealu Island
Kepulauan Tiworo (Maginti, Balu, Katela, Mandike, Bero, Rangku, Maloang, Gola, Kayuangin and To-buan Islands)
3. Islands located in Konawe District are :
Wawonii Island
Bokori Island
Saponda Darat Island
Saponda Laut Island
4. Islands located in Konawe Selatan Dis-trict are :
Hari Island
Campada Island
5. Islands located in Kolaka District are :
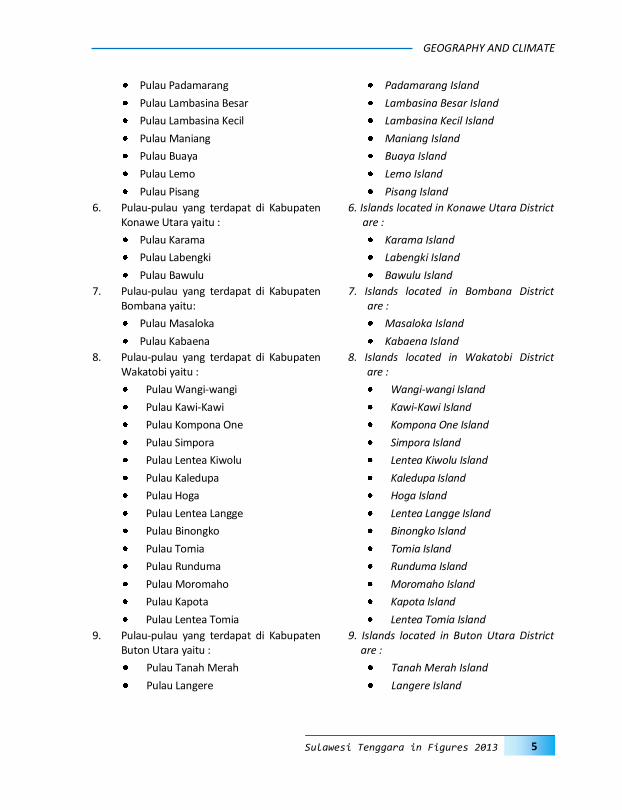
GEOGRAPHY AND CLIMATE
5 Sulawesi Tenggara in Figures 2013
Pulau Padamarang
Pulau Lambasina Besar
Pulau Lambasina Kecil
Pulau Maniang
Pulau Buaya
Pulau Lemo
Pulau Pisang
6. Pulau-pulau yang terdapat di Kabupaten Konawe Utara yaitu :
Pulau Karama
Pulau Labengki
Pulau Bawulu
7. Pulau-pulau yang terdapat di Kabupaten Bombana yaitu:
Pulau Masaloka
Pulau Kabaena
8. Pulau-pulau yang terdapat di Kabupaten Wakatobi yaitu :
Pulau Wangi-wangi
Pulau Kawi-Kawi
Pulau Kompona One
Pulau Simpora
Pulau Lentea Kiwolu
Pulau Kaledupa
Pulau Hoga
Pulau Lentea Langge
Pulau Binongko
Pulau Tomia
Pulau Runduma
Pulau Moromaho
Pulau Kapota
Pulau Lentea Tomia
9. Pulau-pulau yang terdapat di Kabupaten Buton Utara yaitu :
Pulau Tanah Merah
Pulau Langere
Padamarang Island
Lambasina Besar Island
Lambasina Kecil Island
Maniang Island
Buaya Island
Lemo Island
Pisang Island
6. Islands located in Konawe Utara District are :
Karama Island
Labengki Island
Bawulu Island
7. Islands located in Bombana District are :
Masaloka Island
Kabaena Island
8. Islands located in Wakatobi District are :
Wangi-wangi Island
Kawi-Kawi Island
Kompona One Island
Simpora Island
Lentea Kiwolu Island
Kaledupa Island
Hoga Island
Lentea Langge Island
Binongko Island
Tomia Island
Runduma Island
Moromaho Island
Kapota Island
Lentea Tomia Island
9. Islands located in Buton Utara District are :
Tanah Merah Island
Langere Island

GEOGRAFI DAN IKLIM
6 Sulawesi Tenggara Dalam Angka 2013
3. Tanah
3.1 Topografi
Peta topografi menunjukkan bahwa Sulawesi Tenggara umumnya memiliki per-mukaan tanah yang bergunung, bergelombang berbukit-bukit. Diantara gunung dan bukit-bukit, terbentang dataran-dataran yang meru-pakan daerah potensial untuk pengembangan sektor pertanian.
Permukaan tanah pegunungan seluas 1.868.860 ha telah digunakan untuk usaha. Tanah ini sebagian besar berada pada ketinggian 100-500 meter di atas permukaan laut dan pada kemiringan tanah yang mencapai 40 derajat.
3.2 Geologis
Kondisi batuan di wilayah Provinsi Sulawesi Tenggara ditinjau dari sudut geologis, terdiri atas batuan sedimen, batuan metamorfosis, dan batuan beku. Dari ketiga jenis batuan tersebut, yang terluas adalah batuan sedimen seluas 2.579,79 ha (67,64 persen).
Dari jenis tanah, Provinsi Sulawesi Tenggara memiliki sedikitnya enam jenis tanah, yaitu tanah podsolik seluas 2.299.729 ha atau 60,30 persen dari luas tanah Sulawesi Tenggara, tanah mediteran seluas 898.802 ha (23,57 persen), tanah latosol seluas 349.784 ha (9,17 persen), tanah organosol seluas 116.099 ha (3,04 persen), jenis tanah alluvial seluas 129.569 ha (3,40 persen) dan tanah grumosol seluas 20.017 ha (0,52 persen).
4. Perairan (Sungai dan Laut)
4.1 Hidrologi
Provinsi Sulawesi Tenggara memiliki beberapa sungai yang melintasi hampir seluruh kabupaten/kota. Sungai-sungai tersebut pada umumnya potensial untuk dijadikan sebagai
3. Soil
3.1 Topography
Topographicaly, Sulawesi Tenggara has a mountainous and undulated soil surface. Among the mountains and hills, there are stretches of plains potential for the development of agricultural sector.
The up-mountain range, of 1,868,860 ha, has been used for business activities. This land is mostly located at an altitude range from 100 to 500 meters and the slopes of 40 degrees.
3.2 Geology
Geologically, the stone in Sulawesi Tenggara Province, consisted of sedimen-tary, metamorphic and frozen stone. Among the three types of stone, the largest one was the sedimentary stone which was 2,579.79 hectares (67.64 percent).
Based on the soil type, there were at least six types of soil found in the Sulawesi Tenggara Province namely podzolik soil of 2,299,729 ha (60.30 percent), mediterrane-an soil of 898,802 ha (23.57 percent), lato-sol soil of 349,784 ha (9.17 percent), or-ganozol soil of 116,099 ha (3.04 percent), alluvial soil of 129,569 ha (3.40 percent) and grumosol soil of 20,017 ha (0.52 per-cent).
4. Water (River and Sea)
4.1 Hydrology
Sulawesi Tenggara Province has sev-eral rivers flowing across almost every district/city. In general, these rivers are potential to be used as a source to meet
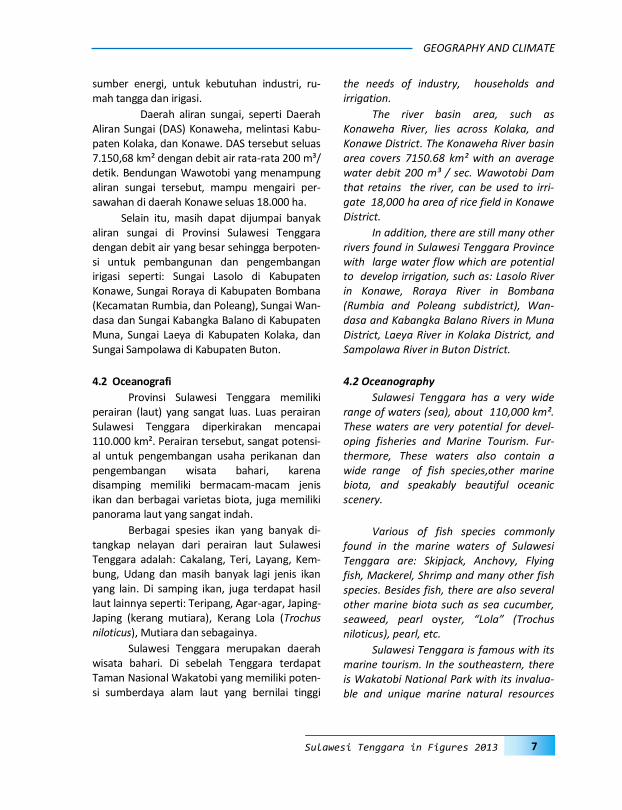
GEOGRAPHY AND CLIMATE
7 Sulawesi Tenggara in Figures 2013
sumber energi, untuk kebutuhan industri, ru-mah tangga dan irigasi.
Daerah aliran sungai, seperti Daerah Aliran Sungai (DAS) Konaweha, melintasi Kabu-paten Kolaka, dan Konawe. DAS tersebut seluas 7.150,68 km² dengan debit air rata-rata 200 m³/detik. Bendungan Wawotobi yang menampung aliran sungai tersebut, mampu mengairi per-sawahan di daerah Konawe seluas 18.000 ha.
Selain itu, masih dapat dijumpai banyak aliran sungai di Provinsi Sulawesi Tenggara dengan debit air yang besar sehingga berpoten-si untuk pembangunan dan pengembangan irigasi seperti: Sungai Lasolo di Kabupaten Konawe, Sungai Roraya di Kabupaten Bombana (Kecamatan Rumbia, dan Poleang), Sungai Wan-dasa dan Sungai Kabangka Balano di Kabupaten Muna, Sungai Laeya di Kabupaten Kolaka, dan Sungai Sampolawa di Kabupaten Buton.
4.2 Oceanografi
Provinsi Sulawesi Tenggara memiliki perairan (laut) yang sangat luas. Luas perairan Sulawesi Tenggara diperkirakan mencapai 110.000 km². Perairan tersebut, sangat potensi-al untuk pengembangan usaha perikanan dan pengembangan wisata bahari, karena disamping memiliki bermacam-macam jenis ikan dan berbagai varietas biota, juga memiliki panorama laut yang sangat indah.
Berbagai spesies ikan yang banyak di-tangkap nelayan dari perairan laut Sulawesi Tenggara adalah: Cakalang, Teri, Layang, Kem-bung, Udang dan masih banyak lagi jenis ikan yang lain. Di samping ikan, juga terdapat hasil laut lainnya seperti: Teripang, Agar-agar, Japing-Japing (kerang mutiara), Kerang Lola (Trochus niloticus), Mutiara dan sebagainya.
Sulawesi Tenggara merupakan daerah wisata bahari. Di sebelah Tenggara terdapat Taman Nasional Wakatobi yang memiliki poten-si sumberdaya alam laut yang bernilai tinggi
the needs of industry, households and irrigation.
The river basin area, such as Konaweha River, lies across Kolaka, and Konawe District. The Konaweha River basin area covers 7150.68 km² with an average water debit 200 m³ / sec. Wawotobi Dam that retains the river, can be used to irri-gate 18,000 ha area of rice field in Konawe District.
In addition, there are still many other rivers found in Sulawesi Tenggara Province with large water flow which are potential to develop irrigation, such as: Lasolo River in Konawe, Roraya River in Bombana (Rumbia and Poleang subdistrict), Wan-dasa and Kabangka Balano Rivers in Muna District, Laeya River in Kolaka District, and Sampolawa River in Buton District.
4.2 Oceanography
Sulawesi Tenggara has a very wide range of waters (sea), about 110,000 km². These waters are very potential for devel-oping fisheries and Marine Tourism. Fur-thermore, These waters also contain a wide range of fish species,other marine biota, and speakably beautiful oceanic scenery.
Various of fish species commonly found in the marine waters of Sulawesi Tenggara are: Skipjack, Anchovy, Flying fish, Mackerel, Shrimp and many other fish species. Besides fish, there are also several other marine biota such as sea cucumber, seaweed, pearl oyster, “Lola” (Trochus niloticus), pearl, etc.
Sulawesi Tenggara is famous with its marine tourism. In the southeastern, there is Wakatobi National Park with its invalua-ble and unique marine natural resources
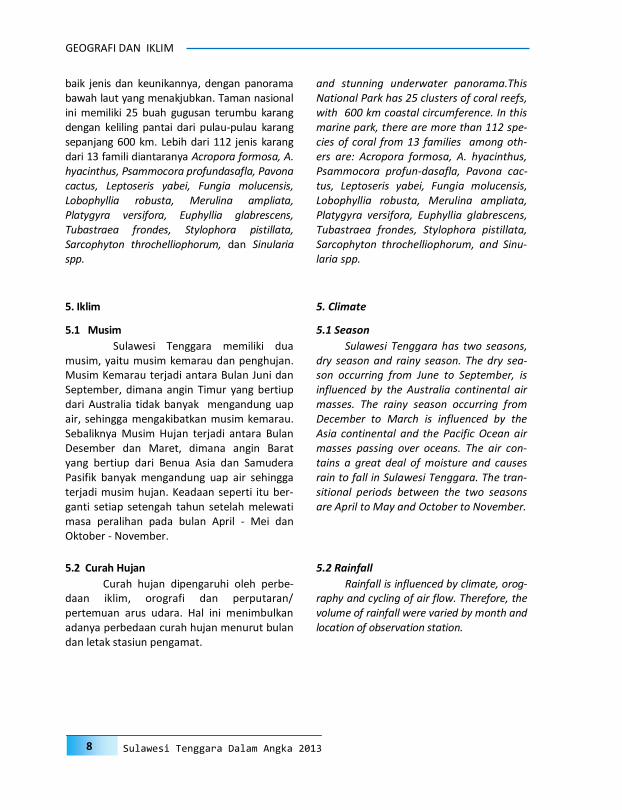
GEOGRAFI DAN IKLIM
8 Sulawesi Tenggara Dalam Angka 2013
baik jenis dan keunikannya, dengan panorama bawah laut yang menakjubkan. Taman nasional ini memiliki 25 buah gugusan terumbu karang dengan keliling pantai dari pulau-pulau karang sepanjang 600 km. Lebih dari 112 jenis karang dari 13 famili diantaranya Acropora formosa, A. hyacinthus, Psammocora profundasafla, Pavona cactus, Leptoseris yabei, Fungia molucensis, Lobophyllia robusta, Merulina ampliata, Platygyra versifora, Euphyllia glabrescens, Tubastraea frondes, Stylophora pistillata, Sarcophyton throchelliophorum, dan Sinularia spp.
5. Iklim
5.1 Musim
Sulawesi Tenggara memiliki dua musim, yaitu musim kemarau dan penghujan. Musim Kemarau terjadi antara Bulan Juni dan September, dimana angin Timur yang bertiup dari Australia tidak banyak mengandung uap air, sehingga mengakibatkan musim kemarau. Sebaliknya Musim Hujan terjadi antara Bulan Desember dan Maret, dimana angin Barat yang bertiup dari Benua Asia dan Samudera Pasifik banyak mengandung uap air sehingga terjadi musim hujan. Keadaan seperti itu ber-ganti setiap setengah tahun setelah melewati masa peralihan pada bulan April - Mei dan Oktober - November.
5.2 Curah Hujan
Curah hujan dipengaruhi oleh perbe-daan iklim, orografi dan perputaran/pertemuan arus udara. Hal ini menimbulkan adanya perbedaan curah hujan menurut bulan dan letak stasiun pengamat.
and stunning underwater panorama.This National Park has 25 clusters of coral reefs, with 600 km coastal circumference. In this marine park, there are more than 112 spe-cies of coral from 13 families among oth-ers are: Acropora formosa, A. hyacinthus, Psammocora profun-dasafla, Pavona cac-tus, Leptoseris yabei, Fungia molucensis, Lobophyllia robusta, Merulina ampliata, Platygyra versifora, Euphyllia glabrescens, Tubastraea frondes, Stylophora pistillata, Sarcophyton throchelliophorum, and Sinu-laria spp.
5. Climate
5.1 Season
Sulawesi Tenggara has two seasons, dry season and rainy season. The dry sea-son occurring from June to September, is influenced by the Australia continental air masses. The rainy season occurring from December to March is influenced by the Asia continental and the Pacific Ocean air masses passing over oceans. The air con-tains a great deal of moisture and causes rain to fall in Sulawesi Tenggara. The tran-sitional periods between the two seasons are April to May and October to November.
5.2 Rainfall
Rainfall is influenced by climate, orog-raphy and cycling of air flow. Therefore, the volume of rainfall were varied by month and location of observation station.
GEOGRAPHY AND CLIMATE
9 Sulawesi Tenggara in Figures 2013
5.3 Suhu Udara
Tinggi rendahnya suhu udara di-pengaruhi oleh letak geografis wilayah dan ketinggian dari permukaan laut. Sulawesi Tenggara yang terletak di daerah khatulistiwa dengan ketinggian pada umumnya di bawah 1.000 meter, sehingga beriklim tropis. Pada tahun 2012, suhu udara maksimum rata-rata berkisar antara 30oC - 36oC, dan suhu minimum rata-rata berkisar antara 20oC - 23oC
5.3 Temperature
The air temperature is influenced by geographical position and the altitude above the sea level. Sulawesi Tenggara which is located on the equator with an altitude below 1000 meters, has a tropical climate. In 2012, the range of average maximum temperature was 30oC - 36oC, and the average minimum temperature was 20oC - 23oC.

GEOGRAFI DAN IKLIM
10 Sulawesi Tenggara Dalam Angka 2013
1.1
Persentase Luas Wilayah Sulawesi Tenggara Menurut Kabupaten/Kota 2012 Gambar
Figure Percentage of Area in Sulawesi Tenggara by District/City, 2012
Sumber/Source : Kanwil BPN Prov. Sultra/ Regional Office of National Land Agency of Sulawesi
Tenggara
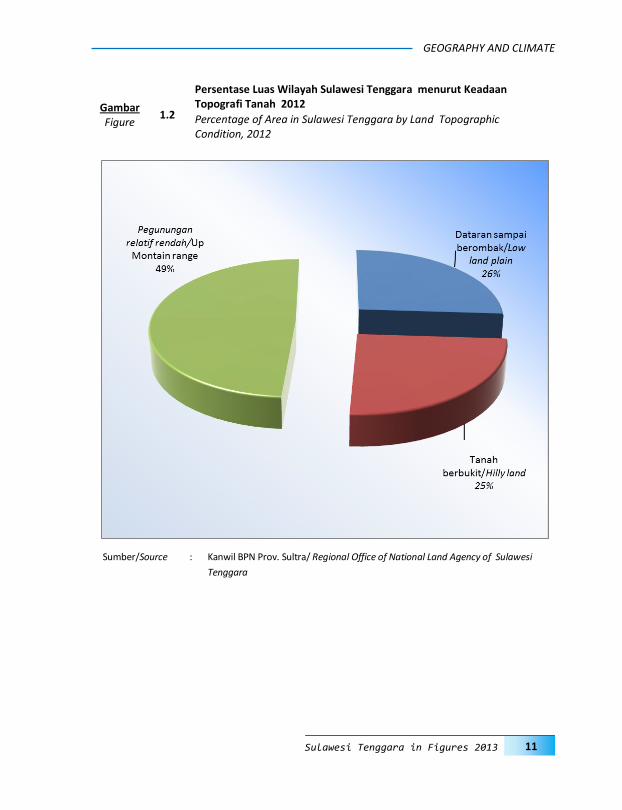
GEOGRAPHY AND CLIMATE
11 Sulawesi Tenggara in Figures 2013
1.2
Persentase Luas Wilayah Sulawesi Tenggara menurut Keadaan Topografi Tanah 2012 Gambar
Figure Percentage of Area in Sulawesi Tenggara by Land Topographic Condition, 2012
Sumber/Source : Kanwil BPN Prov. Sultra/ Regional Office of National Land Agency of Sulawesi
Tenggara
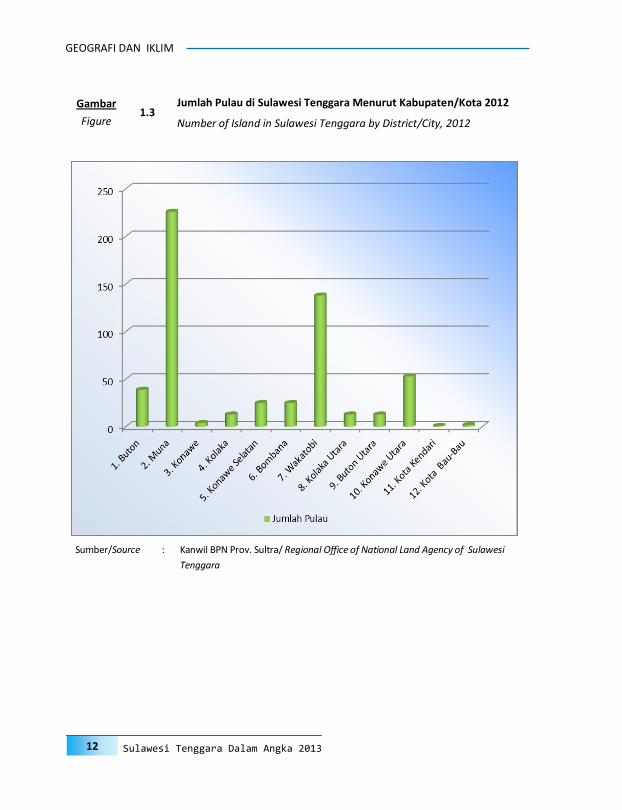
GEOGRAFI DAN IKLIM
12 Sulawesi Tenggara Dalam Angka 2013
1.3 Jumlah Pulau di Sulawesi Tenggara Menurut Kabupaten/Kota 2012 Gambar
Figure Number of Island in Sulawesi Tenggara by District/City, 2012
Sumber/Source : Kanwil BPN Prov. Sultra/ Regional Office of National Land Agency of Sulawesi
Tenggara
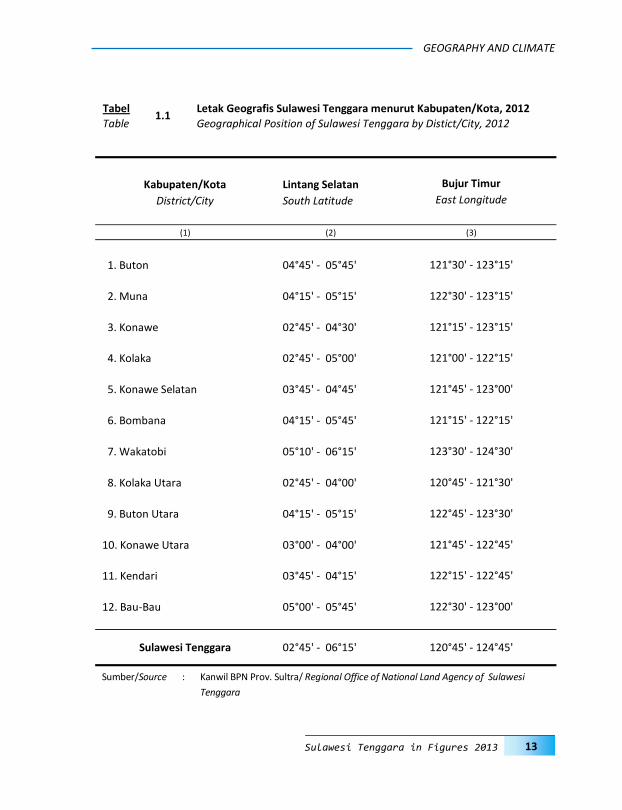
GEOGRAPHY AND CLIMATE
13 Sulawesi Tenggara in Figures 2013
Kabupaten/Kota Lintang Selatan Bujur Timur
District/City South Latitude East Longitude
(1) (2) (3)
1. Buton 04°45' - 05°45' 121°30' - 123°15'
2. Muna 04°15' - 05°15' 122°30' - 123°15'
3. Konawe 02°45' - 04°30' 121°15' - 123°15'
4. Kolaka 02°45' - 05°00' 121°00' - 122°15'
5. Konawe Selatan 03°45' - 04°45' 121°45' - 123°00'
6. Bombana 04°15' - 05°45' 121°15' - 122°15'
7. Wakatobi 05°10' - 06°15' 123°30' - 124°30'
8. Kolaka Utara 02°45' - 04°00' 120°45' - 121°30'
9. Buton Utara 04°15' - 05°15' 122°45' - 123°30'
10. Konawe Utara 03°00' - 04°00' 121°45' - 122°45'
11. Kendari 03°45' - 04°15' 122°15' - 122°45'
12. Bau-Bau 05°00' - 05°45' 122°30' - 123°00'
02°45' - 06°15' 120°45' - 124°45' Sulawesi Tenggara
Tabel 1.1
Letak Geografis Sulawesi Tenggara menurut Kabupaten/Kota, 2012 Table Geographical Position of Sulawesi Tenggara by Distict/City, 2012
Sumber/Source : Kanwil BPN Prov. Sultra/ Regional Office of National Land Agency of Sulawesi
Tenggara

GEOGRAFI DAN IKLIM
14 Sulawesi Tenggara Dalam Angka 2013
Tabel 1.2
Batas Wilayah Sulawesi Tenggara menurut Kabupaten/Kota, 2012
Table Boundary of Sulawesi Tenggara by District/City, 2012
Batas - B o u n d a r y
Kabupaten/Kota Sebelah Sebelah Sebelah Sebelah
District/City Utara Selatan Timur Barat
Northern Southern Eastern Western (1) (2) (3) (4) (5)
1. Buton Kab. Muna Prov. NTT Prov. Maluku Kab. Bombana
(Laut Flores) (Laut Banda) (Selat Muna) 2. Muna Selat Tiworo Kab. Buton Selat Buton Selat Kabaena
Kab. Konawe 3. Konawe Prov. Sulsel & Kab. Kolaka/ Kab.Konut Kab. Kolaka
Prov. Sulteng Kab. Konsel 4. Kolaka Kab. Kolut/ Kab. Bombana Kab. Konawe Prov. Sulsel
Kab. Konawe (Selat Bone) 5. Konawe Selatan Kab. Konawe Selat Tiworo Laut Banda Kab. Kolaka
6. Bombana Kab. Kolaka Selat Kabaena Kab. Konsel Teluk Bone
7. Wakatobi Laut Banda Laut Flores Laut Banda Laut Flores
8. Kolaka Utara Prov. Sulsel Kab. Kolaka Kab. Konawe Teluk Bone
9. Buton Utara Selat Wawonii Kab. Buton Laut Banda Selat Buton
Laut Banda Kab. Muna 10. Konawe Utara Prov. Sulteng Kab. Konawe Laut Banda Kab. Kolut/
Kab. Konawe 11. Kota Kendari Laut Banda Kab. Konsel Laut Banda Kab. Konsel
12. Kota Bau-Bau Selat Buton Kab. Buton Kab. Buton Laut Banda
Prov. Sulsel & Prov. NTT Prov. Maluku Prov. Sulsel Sulawesi Tenggara
Prov. Sulteng (Laut Flores) (Laut Banda) (Teluk Bone)
Sumber/Source : Kanwil BPN Prov. Sultra/ Regional Office of National Land Agency of Sulawesi
Tenggara
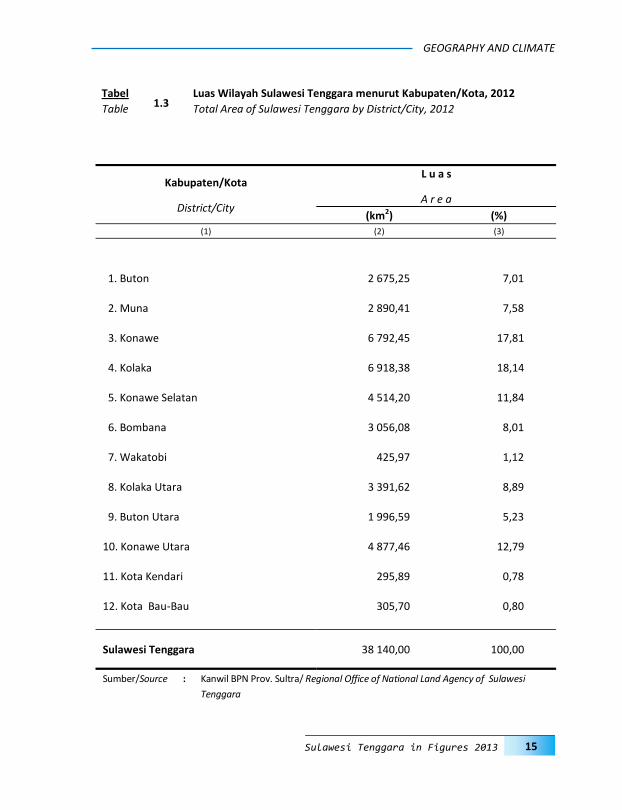
GEOGRAPHY AND CLIMATE
15 Sulawesi Tenggara in Figures 2013
Tabel 1.3
Luas Wilayah Sulawesi Tenggara menurut Kabupaten/Kota, 2012 Table Total Area of Sulawesi Tenggara by District/City, 2012
Kabupaten/Kota
District/City
L u a s
A r e a
(km2) (%) (1) (2) (3)
1. Buton 2 675,25 7,01
2. Muna 2 890,41 7,58
3. Konawe 6 792,45 17,81
4. Kolaka 6 918,38 18,14
5. Konawe Selatan 4 514,20 11,84
6. Bombana 3 056,08 8,01
7. Wakatobi 425,97 1,12
8. Kolaka Utara 3 391,62 8,89
9. Buton Utara 1 996,59 5,23
10. Konawe Utara 4 877,46 12,79
11. Kota Kendari 295,89 0,78
12. Kota Bau-Bau 305,70 0,80
38 140,00 100,00 Sulawesi Tenggara
Sumber/Source : Kanwil BPN Prov. Sultra/ Regional Office of National Land Agency of Sulawesi
Tenggara
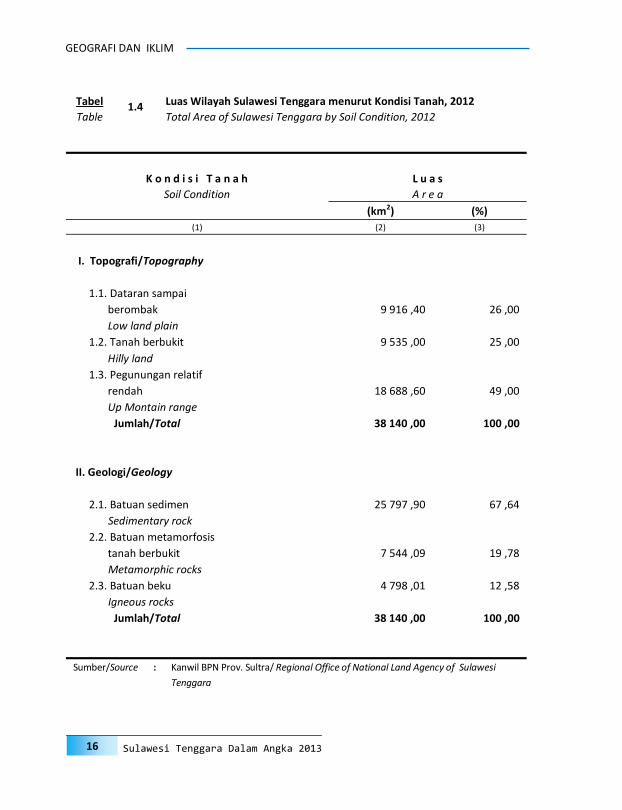
GEOGRAFI DAN IKLIM
16 Sulawesi Tenggara Dalam Angka 2013
K o n d i s i T a n a h L u a s
Soil Condition A r e a
(km2) (%)
(1) (2) (3)
I. Topografi/Topography
1.1. Dataran sampai
berombak 9 916 ,40 26 ,00
Low land plain
1.2. Tanah berbukit 9 535 ,00 25 ,00
Hilly land
1.3. Pegunungan relatif
rendah 18 688 ,60 49 ,00
Up Montain range
Jumlah/Total 38 140 ,00 100 ,00
II. Geologi/Geology
2.1. Batuan sedimen 25 797 ,90 67 ,64
Sedimentary rock
2.2. Batuan metamorfosis
tanah berbukit 7 544 ,09 19 ,78
Metamorphic rocks
2.3. Batuan beku 4 798 ,01 12 ,58
Igneous rocks
Jumlah/Total 38 140 ,00 100 ,00
Tabel 1.4 Luas Wilayah Sulawesi Tenggara menurut Kondisi Tanah, 2012 Table Total Area of Sulawesi Tenggara by Soil Condition, 2012
Sumber/Source : Kanwil BPN Prov. Sultra/ Regional Office of National Land Agency of Sulawesi
Tenggara
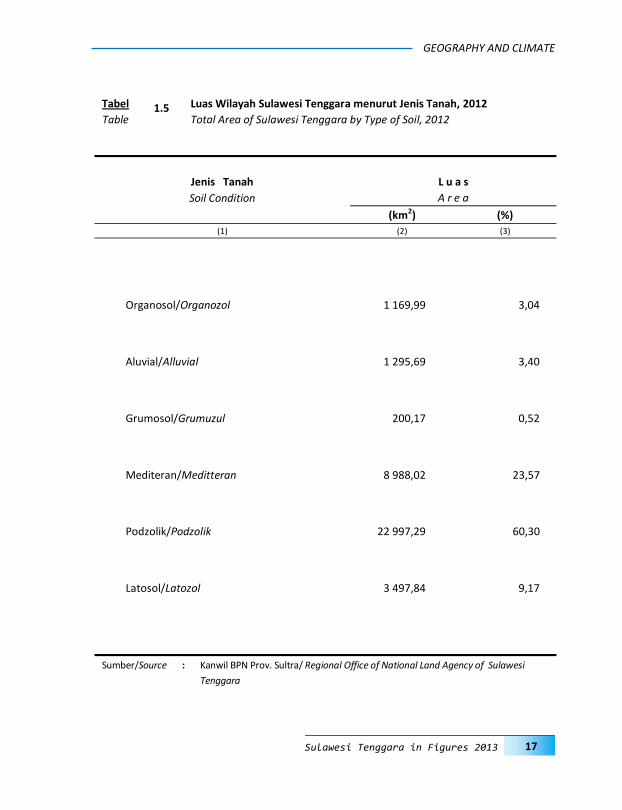
GEOGRAPHY AND CLIMATE
17 Sulawesi Tenggara in Figures 2013
Tabel 1.5 Luas Wilayah Sulawesi Tenggara menurut Jenis Tanah, 2012 Table Total Area of Sulawesi Tenggara by Type of Soil, 2012
Jenis Tanah L u a s
Soil Condition A r e a
(km2) (%)
(1) (2) (3)
Organosol/Organozol 1 169,99 3,04
Aluvial/Alluvial 1 295,69 3,40
Grumosol/Grumuzul 200,17 0,52
Mediteran/Meditteran 8 988,02 23,57
Podzolik/Podzolik 22 997,29 60,30
Latosol/Latozol 3 497,84 9,17
Sumber/Source : Kanwil BPN Prov. Sultra/ Regional Office of National Land Agency of Sulawesi
Tenggara
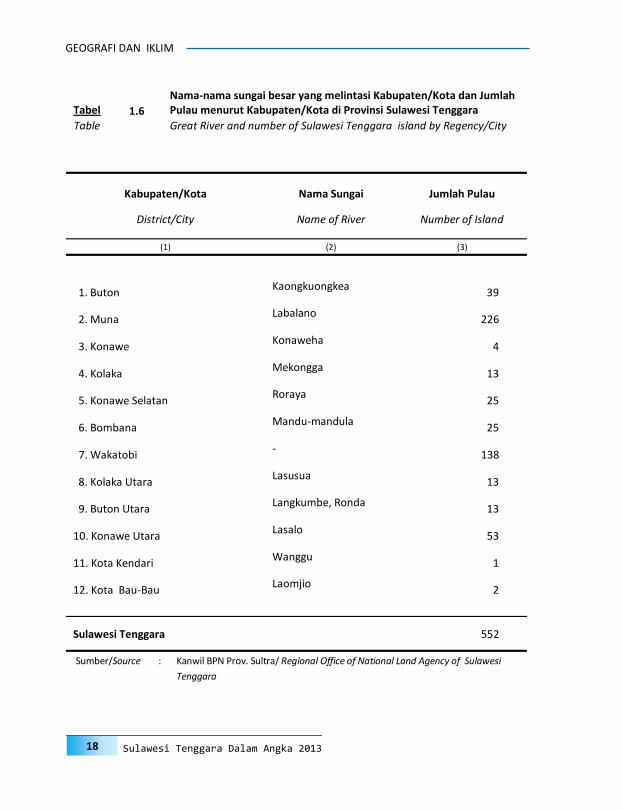
GEOGRAFI DAN IKLIM
18 Sulawesi Tenggara Dalam Angka 2013
Kabupaten/Kota
District/City
Nama Sungai
Name of River
Jumlah Pulau
Number of Island
(1) (2) (3)
1. Buton Kaongkuongkea
39
2. Muna Labalano
226
3. Konawe Konaweha
4
4. Kolaka Mekongga
13
5. Konawe Selatan Roraya
25
6. Bombana Mandu-mandula
25
7. Wakatobi -
138
8. Kolaka Utara Lasusua
13
9. Buton Utara Langkumbe, Ronda
13
10. Konawe Utara Lasalo
53
11. Kota Kendari Wanggu
1
12. Kota Bau-Bau Laomjio
2
552 Sulawesi Tenggara
Tabel 1.6
Nama-nama sungai besar yang melintasi Kabupaten/Kota dan Jumlah Pulau menurut Kabupaten/Kota di Provinsi Sulawesi Tenggara
Table Great River and number of Sulawesi Tenggara island by Regency/City
Sumber/Source : Kanwil BPN Prov. Sultra/ Regional Office of National Land Agency of Sulawesi
Tenggara
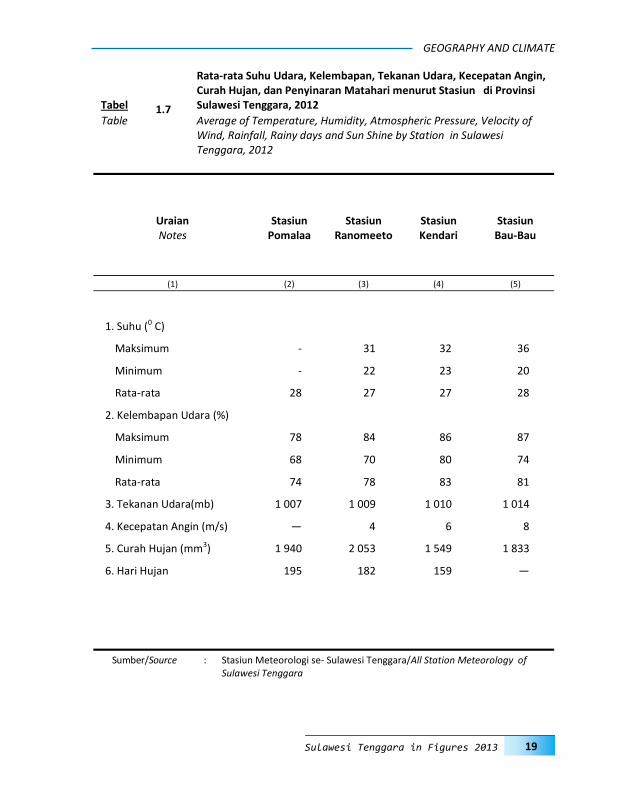
GEOGRAPHY AND CLIMATE
19 Sulawesi Tenggara in Figures 2013
Tabel 1.7
Rata-rata Suhu Udara, Kelembapan, Tekanan Udara, Kecepatan Angin, Curah Hujan, dan Penyinaran Matahari menurut Stasiun di Provinsi Sulawesi Tenggara, 2012
Table Average of Temperature, Humidity, Atmospheric Pressure, Velocity of Wind, Rainfall, Rainy days and Sun Shine by Station in Sulawesi Tenggara, 2012
Sumber/Source : Stasiun Meteorologi se- Sulawesi Tenggara/All Station Meteorology of Sulawesi Tenggara
Uraian Notes
Stasiun Pomalaa
Stasiun Ranomeeto
Stasiun Kendari
Stasiun Bau-Bau
(1) (2) (3) (4) (5)
1. Suhu (0 C)
Maksimum - 31 32 36
Minimum - 22 23 20
Rata-rata 28 27 27 28
2. Kelembapan Udara (%)
Maksimum 78 84 86 87
Minimum 68 70 80 74
Rata-rata 74 78 83 81
3. Tekanan Udara(mb) 1 007 1 009 1 010 1 014
4. Kecepatan Angin (m/s) — 4 6 8
5. Curah Hujan (mm3) 1 940 2 053 1 549 1 833
6. Hari Hujan 195 182 159 —

GEOGRAFI DAN IKLIM
20 Sulawesi Tenggara Dalam Angka 2013
Halaman ini sengaja dikosongkan This page intentionally left blank
G o v e r n m e n tPEMERINTAHAN2
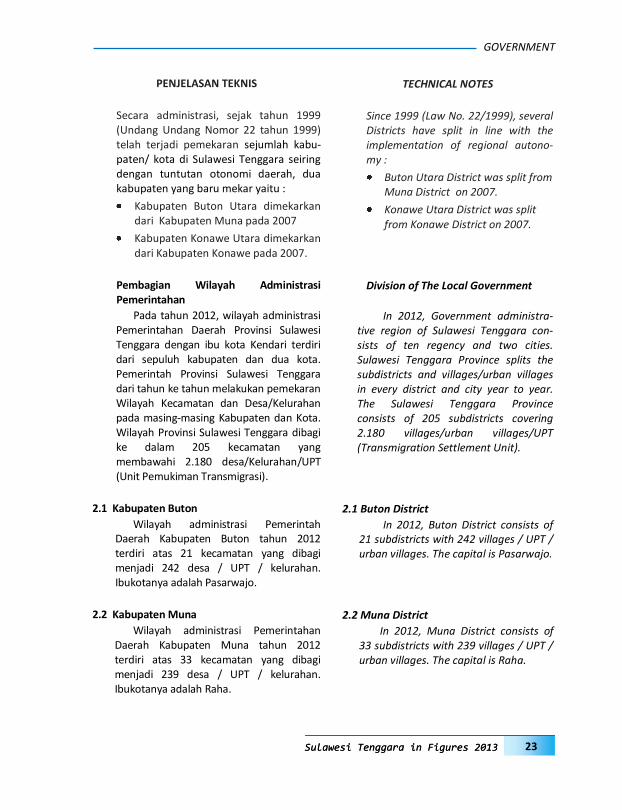
GOVERNMENT
23 Sulawesi Tenggara in Figures 2013 Sulawesi Tenggara in Figures 2013
PENJELASAN TEKNIS
Secara administrasi, sejak tahun 1999 (Undang Undang Nomor 22 tahun 1999) telah terjadi pemekaran sejumlah kabu-paten/ kota di Sulawesi Tenggara seiring dengan tuntutan otonomi daerah, dua kabupaten yang baru mekar yaitu :
Kabupaten Buton Utara dimekarkan dari Kabupaten Muna pada 2007
Kabupaten Konawe Utara dimekarkan dari Kabupaten Konawe pada 2007.
Pembagian Wilayah Administrasi Pemerintahan
Pada tahun 2012, wilayah administrasi Pemerintahan Daerah Provinsi Sulawesi Tenggara dengan ibu kota Kendari terdiri dari sepuluh kabupaten dan dua kota. Pemerintah Provinsi Sulawesi Tenggara dari tahun ke tahun melakukan pemekaran Wilayah Kecamatan dan Desa/Kelurahan pada masing-masing Kabupaten dan Kota. Wilayah Provinsi Sulawesi Tenggara dibagi ke dalam 205 kecamatan yang membawahi 2.180 desa/Kelurahan/UPT (Unit Pemukiman Transmigrasi).
2.1 Kabupaten Buton
Wilayah administrasi Pemerintah Daerah Kabupaten Buton tahun 2012 terdiri atas 21 kecamatan yang dibagi menjadi 242 desa / UPT / kelurahan. Ibukotanya adalah Pasarwajo.
2.2 Kabupaten Muna
Wilayah administrasi Pemerintahan Daerah Kabupaten Muna tahun 2012 terdiri atas 33 kecamatan yang dibagi menjadi 239 desa / UPT / kelurahan. Ibukotanya adalah Raha.
TECHNICAL NOTES
Since 1999 (Law No. 22/1999), several Districts have split in line with the implementation of regional autono-my :
Buton Utara District was split from Muna District on 2007.
Konawe Utara District was split from Konawe District on 2007.
Division of The Local Government
In 2012, Government administra-tive region of Sulawesi Tenggara con-sists of ten regency and two cities. Sulawesi Tenggara Province splits the subdistricts and villages/urban villages in every district and city year to year. The Sulawesi Tenggara Province consists of 205 subdistricts covering 2.180 villages/urban villages/UPT (Transmigration Settlement Unit).
2.1 Buton District
In 2012, Buton District consists of 21 subdistricts with 242 villages / UPT / urban villages. The capital is Pasarwajo.
2.2 Muna District
In 2012, Muna District consists of 33 subdistricts with 239 villages / UPT / urban villages. The capital is Raha.
PEMERINTAHAN
24 Sulawesi Tenggara Dalam Angka 2013 Sulawesi Tenggara Dalam Angka 2013
2.3 Kabupaten Konawe
Wilayah administrasi Pemerintahan Daerah Kabupaten Konawe tahun 2012 terdiri atas 30 kecamatan yang dibagi menjadi 410 desa / UPT / kelurahan. Ibukotanya adalah Unaaha
2.4 Kabupaten Kolaka
Wilayah administrasi Pemerintahan Daerah Kabupaten Kolaka tahun 2012 dengan ibukota Kolaka terdiri atas 20 kecamatan yang dibagi menjadi 213 desa//UPT/kelurahan.
2.5 Kabupaten Konawe Selatan
Wilayah Administrasi Pemerintahan Daerah Kabupaten Konawe Selatan tahun 2010 terdiri dari 22 kecamatan yang dibagi menjadi 355 desa/UPT/kelurahan. Ibukotanya adalah Andoolo.
2.6 Kabupaten Bombana
Wilayah administrasi Pemerintahan Daerah Kabupaten Bombana tahun 2012 terdiri atas 22 kecamatan yang dibagi men-jadi 140 desa / UPT / kelurahan. Ibukotanya adalah Kasipute.
2.7 Kabupaten Wakatobi
Wilayah administrasi Pemerintahan Daerah Kabupaten Wakatobi tahun 2012 terdiri atas 8 kecamatan yang dibagi men-jadi 100 desa / UPT / kelurahan. Ibukotanya adalah Wanci.
2.8 Kabupaten Kolaka Utara
Wilayah administrasi Pemerintahan Daerah Kabupaten Kolaka Utara tahun 2012 terdiri atas 15 kecamatan yang dibagi menjadi 133 desa/UPT/kelurahan. Ibukotanya adalah Lasusua.
2.3 Konawe District
In 2012, Konawe District consists of 30 subdistricts with 410 villages / UPT / urban villages. The capital is Unaaha.
2.4 Kolaka District
Kolaka District in 2012 consists of 20 subdistricts with 213 villages / UPT / urban villages. The capital is Kolaka.
2.5 Konawe Selatan District
Konawe Selatan in 2012 District consists of 22 subdistricts with 355 villages / UPT / urban villages. The capital is Andoolo.
2.6 Bombana District
Bombana District in 2012 consists of 22 subdistricts with 140 villages / UPT / urban villages. The capital is Kasipute.
2.7 Wakatobi District
Wakatobi District in 2012 consists of 8 subdistricts with 100 villages / UPT / urban villages. The capital is Wanci.
2.8 Kolaka Utara District
Kolaka Utara District in 2012 con-sists of 15 subdistricts with 133 villag-es/UPT/urban villages. The capital is Lasusua.
GOVERNMENT
25 Sulawesi Tenggara in Figures 2013 Sulawesi Tenggara in Figures 2013
2.9 Kabupaten Buton Utara
Wilayah administrasi Pemerintahan Daerah Kabupaten Buton Utara tahun 2012 terdiri atas 6 kecamatan yang dibagi menjadi 95 desa/UPT/kelurahan. Ibukotanya adalah Buranga.
2.10 Kabupaten Konawe Utara
Wilayah administrasi Pemerintahan Daerah Kabupaten Konawe Utara tahun 2012 terdiri atas 10 kecamatan yang dibagi menjadi 146 desa/UPT/kelurahan. Ibukotanya adalah Asera.
2.11 Kota Kendari
Wilayah administrasi Pemerintahan Daerah Kota Kendari tahun 2012 terdiri atas 10 kecamatan yang dibagi men-jadi 64 kelurahan. Ibukotanya adalah Kendari.
2.12 Kota Bau-Bau
Wilayah administrasi Pemerintahan Daerah Kota Bau-Bau tahun 2012 terdiri atas 7 kecamatan yang dibagi men-jadi 43 kelurahan. Ibukotanya adalah Baubau.
3. Pembangunan Desa
Usaha Pemerintah Daerah Provinsi Sulawesi Tenggara dalam pembangunan desa bertujuan untuk meletakkan sendi-sendi kehidupan desa, yaitu masyarakat desa yang berkecukupan material dan spiritual serta makin adil dan merata guna terwujudnya Desa Pancasila.
Kriteria dan kategori pembangunan desa dibedakan menjadi desa swadaya, swakarya, dan swa sembada.
2.9 Buton Utara District
In 2012, Buton Utara District con-sists of 6 subdistricts with 95 villages/UPT/urban villages. The capital is Buranga.
2.10 Konawe Utara District
In 2012, Konawe Utara District consists of 10 subdistricts with 146 villages/UPT/urban villages. The capital is Asera.
2.11 Kendari City
Kendari City in 2012 consists of 10 subdistricts with 64 urban villages. The capital is Kendari.
2.12 Bau-Bau City
In 2012, Bau-Bau City consists of 7 subdistricts with 43 urban villages. The capital is Bau-Bau.
3. Rural Development
Rural development by the local government was directed to putting the joints of rural life, that are prosperous society of material and spiritual, in a fair and equitable condition, in order to realize Desa Pancasila.
Criteria and categories of rural development are differentiated as self-effort, self-developing, and self-supporting village.
PEMERINTAHAN
26 Sulawesi Tenggara Dalam Angka 2013 Sulawesi Tenggara Dalam Angka 2013
4. Dewan Perwakilan Rakyat Daerah (DPRD)
Jumlah anggota DPRD Sulawesi Tenggara tahun 2012 adalah sebanyak 45 orang, terdiri dari Fraksi Golkar Nurani Indonesia Raya sebanyak 12 orang, Fraksi Amanat Rakyat 12 orang, Fraksi Partai Keadilan Sejahtera sebanyak 5 orang, Fraksi Demokrat Indonesia 8 orang dan Fraksi Bangun Sultra 8 orang.
4. Regional Representatives
The number of the Regional Representatives in 2012 was 45 members consisting of 12 members of Golkar Nura-ni Indonesia Raya Fraction, 12 members of Amanat Nasional Fraction, 5 members of PKS Party Fraction, 8 members of Dem-okrat Indonesia Fraction, and 8 members of Bangun Sultra Fraction.

GOVERNMENT
27 Sulawesi Tenggara in Figures 2013 Sulawesi Tenggara in Figures 2013
2.1 Banyaknya Desa/Kelurahan menurut Kabupaten/Kota, 2012 Gambar
Figure Number of Villages/Urban-villages by District and City, 2012
Sumber/Source : BPMD Kabupaten/Kota / Village Community Empowerment Board District/City
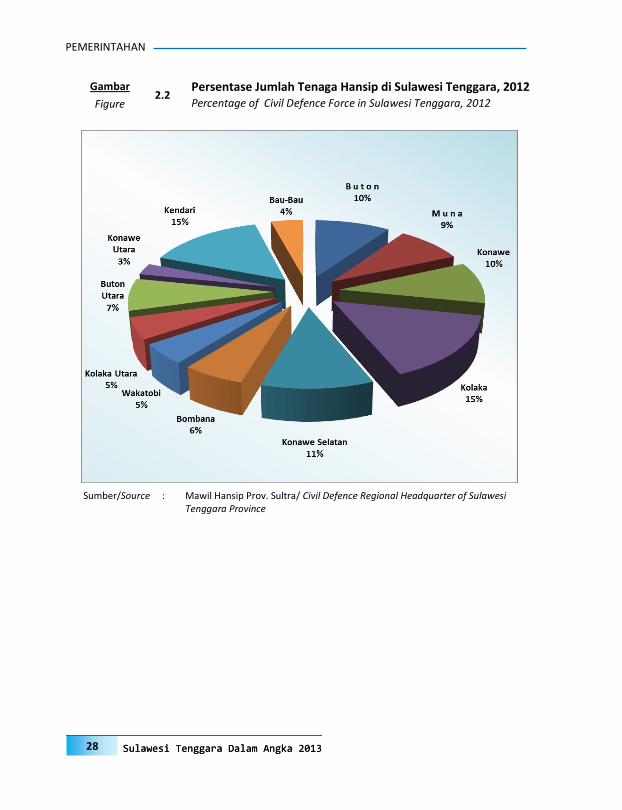
PEMERINTAHAN
28 Sulawesi Tenggara Dalam Angka 2013 Sulawesi Tenggara Dalam Angka 2013
2.2 Persentase Jumlah Tenaga Hansip di Sulawesi Tenggara, 2012 Gambar
Figure Percentage of Civil Defence Force in Sulawesi Tenggara, 2012
Sumber/Source : Mawil Hansip Prov. Sultra/ Civil Defence Regional Headquarter of Sulawesi Tenggara Province

GOVERNMENT
29 Sulawesi Tenggara in Figures 2013 Sulawesi Tenggara in Figures 2013
2.3 Persentase Jumlah Anggota DPRD menurut Fraksi, 2012 Gambar
Figure Percentage of Regional Representatives Members by Fraction, 2012
Sumber/Source : DPRD Tk.I Sultra/ Regional Representatives of Sulawesi Tenggara Province
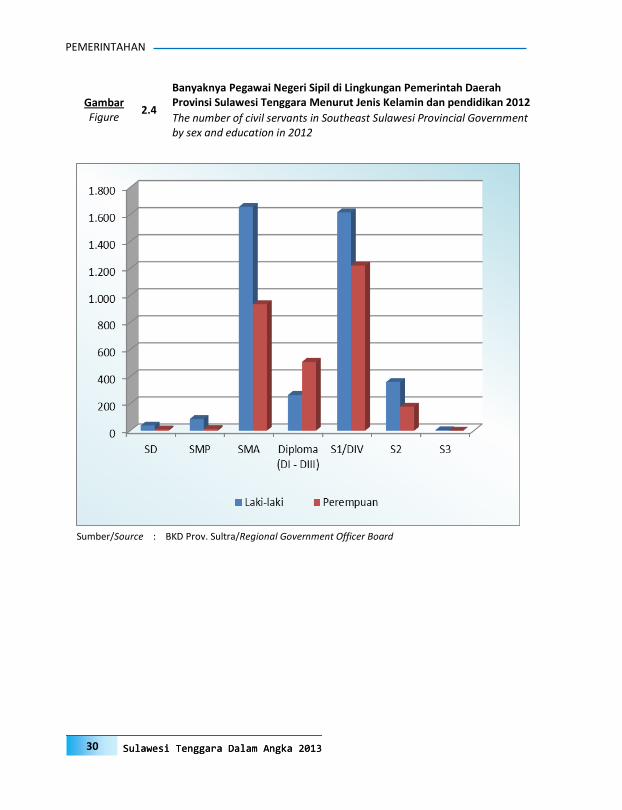
PEMERINTAHAN
30 Sulawesi Tenggara Dalam Angka 2013 Sulawesi Tenggara Dalam Angka 2013
2.4
Banyaknya Pegawai Negeri Sipil di Lingkungan Pemerintah Daerah Provinsi Sulawesi Tenggara Menurut Jenis Kelamin dan pendidikan 2012 Gambar
Figure The number of civil servants in Southeast Sulawesi Provincial Government by sex and education in 2012
Sumber/Source : BKD Prov. Sultra/Regional Government Officer Board

GOVERNMENT
31 Sulawesi Tenggara in Figures 2013 Sulawesi Tenggara in Figures 2013
Tabel 2.1
Pembagian Daerah Administrasi Sulawesi Tenggara, 2012
Table Number of Administrative Area of Sulawesi Tenggara, 2012
Kabupaten/ Ibukota
Jumlah /
Number of
K o d e Kota Capital Kecamatan Kelurahan Desa UPT Desa +
Code District/ Subdistrict Urban Village Village TSU Kelurahan
City
Village + Urban
Village
(1) (2) (3) (4) (5) (6) (7) (8)
7401 B u t o n Pasarwajo 21 31 211 - 242
7402 M u n a R a h a 33 31 205 3 239
7403 Konawe Unaaha 30 64 344 2 410
7404 Kolaka Kolaka 20 45 168 0 213
7405 Konawe Selatan Andoolo 22 15 336 4 355
7406 Bombana Rumbia 22 22 116 2 140
7407 Wakatobi Wangi-Wangi 8 25 75 0 100
7408 Kolaka Utara Lasusua 15 6 127 0 133
7409 Buton Utara Buranga 6 12 82 1 95
7410 Konawe Utara Asera 10 11 133 2 146
7471 Kendari Kendari 10 64 - - 64
7472 Bau-Bau Bau-Bau 8 43 - - 43
7400 Sulawesi Tenggara Kendari 205 369 1,797 14 2,180
Sumber/Source : BPMD Kabupaten/Kota / Village Community Empowerment Board District/City

PEMERINTAHAN
32 Sulawesi Tenggara Dalam Angka 2013 Sulawesi Tenggara Dalam Angka 2013
Tabel
Banyaknya Kepala Desa dan Lurah
2.2 menurut Kabupaten/Kota dan Jenis Kelamin, 2012
Table Number of Village Head and Urban Village-administrators by District/City and Sex, 2012
Kabupaten/ Lurah Kepala Desa
Kota Rural Village Head Urban Village Head
District/ Laki-Laki Perempuan Laki-Laki Perempuan
City Male Female Male Female
(1) (2) (3) (4) (5)
1. B u t o n 24 8 197 13
2. M u n a 30 1 202 3
3. Konawe 62 2 330 4
4. Kolaka 45 0 164 4
5. Konawe Selatan 13 2 316 20
6. Bombana 20 2 115 1
7. Wakatobi 24 1 74 1
8. Kolaka Utara 5 1 121 6
9. Buton Utara 8 4 76 2
10. Konawe Utara 9 2 130 4
11. Kota Kendari 64 0 0 0
12. Kota Bau-Bau 36 7 0 0
Sulawesi Tenggara 2012 340 30 1 725 58
2011 317 26 1 571 44
2010 356 40 1 640 50
2009 318 20 1 549 33
2008 403 24 1 446 22
2007 376 24 1 446 22
Sumber/Source : BPMD Kabupaten/Kota / Village Community Empowerment Board District/City
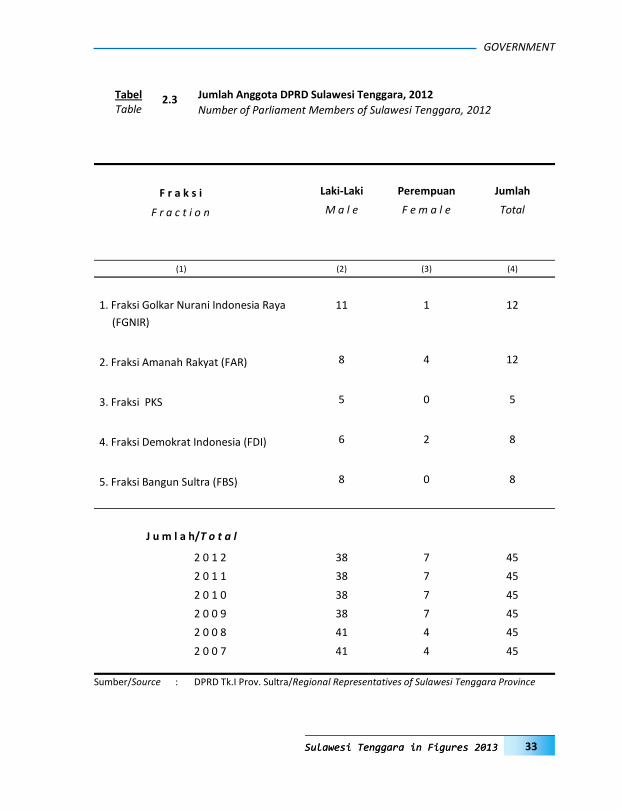
GOVERNMENT
33 Sulawesi Tenggara in Figures 2013 Sulawesi Tenggara in Figures 2013
F r a k s i Laki-Laki Perempuan Jumlah
F r a c t i o n M a l e F e m a l e Total
(1) (2) (3) (4)
1. Fraksi Golkar Nurani Indonesia Raya
(FGNIR)
11 1 12
2. Fraksi Amanah Rakyat (FAR) 8 4 12
3. Fraksi PKS 5 0 5
4. Fraksi Demokrat Indonesia (FDI) 6 2 8
5. Fraksi Bangun Sultra (FBS) 8 0 8
J u m l a h/T o t a l
2 0 1 2 38 7 45
2 0 1 1 38 7 45
2 0 1 0 38 7 45
2 0 0 9 38 7 45
2 0 0 8 41 4 45
2 0 0 7 41 4 45
Sumber/Source : DPRD Tk.I Prov. Sultra/Regional Representatives of Sulawesi Tenggara Province
Tabel Jumlah Anggota DPRD Sulawesi Tenggara, 2012 2.3 Table Number of Parliament Members of Sulawesi Tenggara, 2012
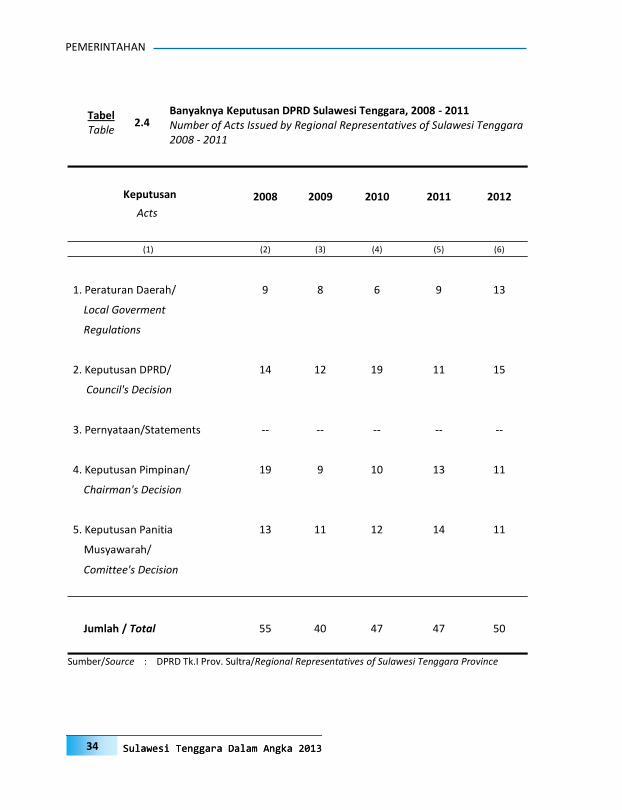
PEMERINTAHAN
34 Sulawesi Tenggara Dalam Angka 2013 Sulawesi Tenggara Dalam Angka 2013
Keputusan 2008 2009 2010 2011 2012
Acts
(1) (2) (3) (4) (5) (6)
1. Peraturan Daerah/ 9 8 6 9 13
Local Goverment
Regulations
2. Keputusan DPRD/ 14 12 19 11 15
Council's Decision
3. Pernyataan/Statements -- -- -- -- --
4. Keputusan Pimpinan/ 19 9 10 13 11
Chairman's Decision
5. Keputusan Panitia 13 11 12 14 11
Musyawarah/
Comittee's Decision
Jumlah / Total 55 40 47 47 50
Sumber/Source : DPRD Tk.I Prov. Sultra/Regional Representatives of Sulawesi Tenggara Province
2.4 Banyaknya Keputusan DPRD Sulawesi Tenggara, 2008 - 2011 Tabel
Table Number of Acts Issued by Regional Representatives of Sulawesi Tenggara 2008 - 2011

GOVERNMENT
35 Sulawesi Tenggara in Figures 2013 Sulawesi Tenggara in Figures 2013
Jenis Kegiatan/Type of Activity 2010 2011 2012
(1) (4) (5) (6)
1. Rapat Paripurna Dewan/Council Plenary Session 51 44 40 2. Rapat Paripurna Istimewa/Special Plenary Session 4 3 3 3. Rapat Paripurna Khusus/Particular Plenary Session -- 21 0 4. Rapat Kerja/Rapat Gabungan Komisi/Working Meeting/ 10 18 20
5. Rapat Fraksi-Fraksi/Fractions Meeting -- -- 0 6. Rapat Pimpinan Dewan/Council Chairman Meeting 5 8 0 7. Rapat Panitia Khusus/Particular Committee Meeting 19 21 15 8. Rapat Panitia Anggaran/Budget Committee Meeting 12 17 20 9. Rapat Panitia Musyawarah/Deliberation Committee Meeting 12 14 11 10. Rapat Panitia Tehnis/Technical Committee Meeting -- -- -- 11. Kunjungan Ke Luar Daerah/Regional Trip -- -- -- 12. Kunjungan Kerja dalam Daerah Prov./Working Trip in Prov-
-- -- -- 13. Kunjungan Kerja Keluar Negeri/Foreign Working Trip -- -- -- 14. Kunjungan Kerja Komisi/Committee Working Trip -- -- -- 15. Kunjungan Kerja Pimpinan Dewan -- -- -- Bersama Dengan Gubernur KDH./Working Trip of Council's
16. R e s e s/Recess of Parliament 3 -- 3 17. Rapat Komisi-Komisi/Committee Meeting
17.1. Komisi A/Commission A 10 9 4 17.2. Komisi B/Commission B - 11 6 17.3. Komisi C/Commission C 13 14 10 17.4. Komisi D/Commission D 21 13 12 17.5. Komisi E/Commission E -- --
18. Rapat Koordinasi Pimpinan Ketua 7 -- 4 Fraksi Dengan Gubernur/Coordination Meeting between
19. Rapat Badan Pertimbangan Daerah/Regional Deliberation -- -- --
20. Hearing (Dengar Pendapat) 12 49 34 Komisi ABCDE/Commission ABCDE 21. Menerima Unjuk Rasa/Accepting Protest 16 149 109
Sumber/Source : DPRD Tk.I Prov. Sultra/Regional Representatives of Sulawesi Tenggara Province
2.5 Kegiatan DPRD Sulawesi Tenggara, 2010 - 2012 Tabel
Table Activities of Regional Representatives of Sulawesi Tenggara, 2010-2012

PEMERINTAHAN
36 Sulawesi Tenggara Dalam Angka 2013 Sulawesi Tenggara Dalam Angka 2013
P a r t a i P a r t y
Kabupaten/Kota - District/City Jumlah
Buton Muna Konawe Kolaka Kota Kota Bomba Wakatobi Konsel Kolut Total
Kendari Bau-Bau na
(1) (2) (3) (4) (5) (6) (7) (8) (9) (10) (11) (12)
1 P. Hati Nurani Rakyat 6 274 -- - - -- 926 1 543 1 666 -- -- 10 409
2 P. Karya Peduli Bangsa - -- - - -- 1 107 411 327 -- -- 1 845
3 P. Pengusaha dan Pekerja Ind. - -- - - -- 1 194 394 183 -- -- 1 771
4 P. Peduli Rakyat Nasional - -- - - -- 1 104 423 696 -- -- 2 223
5 P. Gerakan Indonesia Raya - -- - - -- 1 458 1 173 103 -- -- 2 734
6 P. Barisan Nasional - -- - - -- 394 281 592 -- -- 1 267
7 P. Keadilan dan Persatuan Ind. - -- - 3 371 -- 695 926 678 -- -- 5 670
8 P. Keadilan Sejahtera 4 570 -- 4 701 7 828 -- 2 592 875 1 103 -- -- 21 669
9 P. Amanat Nasional 6 936 -- - 18 843 -- 4 041 2 151 5 973 -- -- 37 944
10 P. Perjuangan Indonesia Baru - -- - - -- 209 139 220 -- -- 568
11 P. Kedaulatan - -- - - -- 990 114 1 257 -- -- 2 361
12 P. Persatuan Daerah - -- - - -- 1 657 235 1 787 -- -- 3 679
13 P. Kebangkitan Bangsa - -- - 3 737 -- 1 091 743 2 360 -- -- 7 931
14 P. Pemuda Indonesia - -- - - -- 563 34 223 -- -- 820
15 P. Nasional Indonesia Marhaenisme - -- - - -- 277 198 615 -- -- 1 090
16 P. Demokrasi Pembaharuan - -- - - -- 1 277 418 810 -- -- 2 505
17 P. Karya Perjuangan - -- - - -- 1 123 16 489 -- -- 1 628
18 P. Matahari Bangsa - -- - - -- 737 236 604 -- -- 1 577
19 P. Penegak Demokrasi Indonesia - -- - - -- 622 45 989 -- -- 1 656
20 P. Demokrasi Kebangsaan - -- - - -- 347 222 552 -- -- 1 121
21 P. Republika Nusantara - -- - - -- 1 200 558 604 -- -- 2 362
22 P. Pelopor - -- - 2 574 -- 1 076 1 035 511 -- -- 5 196
23 P. Golongan Karya 19 957 -- 13 579 8 755 -- 3 997 1 115 1 884 -- -- 49 287
24 P. Persatuan Pembangunan 4 866 -- - 15 235 -- 7 820 266 1 406 -- -- 29 593
25 P. Damai Sejahtera - -- - - -- 52 160 75 -- -- 287
26 P. Nas. Benteng Kerakyatan Ind. - -- - 10 757 -- 1 798 66 4 679 -- -- 17 300
27 P. Bulan Bintang 7 240 -- - 4 083 -- 6 009 1 025 846 -- -- 19 203
28 P. Demokrasi Indonesia Perjuangan - -- 8 395 3 175 -- 2 293 352 7 217 -- -- 21 432
29 P. Bintang Reformasi - -- - 3 289 -- 1 350 - 2 186 -- -- 6 825
30 P. Patriot - -- - - -- 232 - 201 -- -- 433
31 P. Demokrat - -- 11 702 14 788 -- 7 197 - 2 461 -- -- 36 148
32 P. Kasih Demokrasi Indonesia - -- - - -- 345 - - -- -- 345
33 P. Indonesia Sejahtera - -- - - -- 1 241 - - -- -- 1 241
34 P. Kebangkitan Nasional Ulama - -- - - -- 764 - 284 -- -- 1 048
35 P. Merdeka - -- - - -- 44 - 438 -- -- 482
36 P. Persatuan Nahdlatul Ummah - -- - - -- 286 - 963 -- -- 1 249
37 P. Sarikat Indonesia - -- - - -- 1 - 842 -- -- 843
38 P. Buruh - -- - - -- 514 - 879 -- -- 1 393
39 Lainnya/Others 63 779 -- - - -- - - - -- -- 63 779
J u m l a h / T o t a l 113 622 0 38 377 96 435 0 58 623 15 154 46 703 137,282 0 368 914
Tabel
Hasil Penghitungan Suara untuk Keanggotaan DPRD Kabupaten/Kota
Daerah Pemilihan Sulawesi Tenggara, 2009 2.6
Table Vote Counting Results for District/City Regional Representatives
Membership of Sulawesi Tenggara Election Area,2009
Sumber/Source : KPU Provinsi Sulawesi Tenggara/General Election Commission of Sulawesi Tenggara Province

GOVERNMENT
37 Sulawesi Tenggara in Figures 2013 Sulawesi Tenggara in Figures 2013
P a r t a i / P a r t y
Kabupaten/Kota - District/City Jumlah
Buton Muna Konawe Kolaka Kota Kendari
Kota Bau-Bau
Wakato-
bi
Konsel Kolut Total Bombana
(1) (2) (3) (4) (5) (6) (7) (8) (9) (10) (11) (12)
1 P. Hati Nurani Rakyat 6 332 -- -- -- -- 1 142 -- - 3 403 -- 10 877
2 P. Karya Peduli Bangsa - -- -- -- -- 1 024 -- - 1 521 -- 2 545
3 P. Pengusaha dan Pekerja Ind. - -- -- -- -- 418 -- - 436 -- 854
4 P. Peduli Rakyat Nasional - -- -- -- -- 1 277 -- - 1 734 -- 3 011
5 P. Gerakan Indonesia Raya - -- -- -- -- 1 723 -- - 3 709 -- 5 432
6 P. Barisan Nasional - -- -- -- -- 741 -- - 500 -- 1 241
7 P. Keadilan dan Persatuan Ind. - -- -- -- -- 1 276 -- - 448 -- 1 724
8 P. Keadilan Sejahtera 6 910 -- -- -- -- 3 535 -- 2 172 6 306 -- 18 923
9 P. Amanat Nasional 11 744 -- -- -- -- 5 645 -- 7 476 12 209 -- 37 074
10 P. Perjuangan Indonesia Baru - -- -- -- -- 357 -- - 486 -- 843
11 P. Kedaulatan - -- -- -- -- 546 -- - 132 -- 678
12 P. Persatuan Daerah - -- -- -- -- 1 093 -- - 1 121 -- 2 214
13 P. Kebangkitan Bangsa - -- -- -- -- 1 727 -- - 2 770 -- 4 497
14 P. Pemuda Indonesia - -- -- -- -- 365 -- - 1 903 -- 2 268
15 P. Nasional Indonesia Marhaenisme - -- -- -- -- 272 -- - 145 -- 417
16 P. Demokrasi Pembaharuan - -- -- -- -- 931 -- - 2 777 -- 3 708
17 P. Karya Perjuangan - -- -- -- -- 577 -- - 384 -- 961
18 P. Matahari Bangsa - -- -- -- -- 138 -- - 212 -- 350
19 P. Penegak Demokrasi Indonesia - -- -- -- -- 214 -- - 284 -- 498
20 P. Demokrasi Kebangsaan - -- -- -- -- 682 -- - 879 -- 1 561
21 P. Republika Nusantara - -- -- -- -- 935 -- - 1 090 -- 2 025
22 P. Pelopor - -- -- -- -- 346 -- - 1 537 -- 1 883
23 P. Golongan Karya 20 537 -- -- -- -- 6 217 -- 4 140 22 856 -- 53 750
24 P. Persatuan Pembangunan 8 448 -- -- -- -- 5 001 -- - 4 801 -- 18 250
25 P. Damai Sejahtera - -- -- -- -- 217 -- - 223 -- 440
26 P. Nas. Benteng Kerakyatan Ind. - -- -- -- -- 505 -- - 2 868 -- 3 373
27 P. Bulan Bintang 5 829 -- -- -- -- 6 647 -- - 2 085 -- 14 561
28 P. Demokrasi Indonesia Perjuangan - -- -- -- -- 2 118 -- 5 421 6 602 -- 14 141
29 P. Bintang Reformasi - -- -- -- -- 2 273 -- 2 497 1 149 -- 5 919
30 P. Patriot - -- -- -- -- 970 -- - 486 -- 1 456
31 P. Demokrat - -- -- -- -- 5 570 -- 5 741 42 020 -- 53 331
32 P. Kasih Demokrasi Indonesia - -- -- -- -- 89 -- - 235 -- 324
33 P. Indonesia Sejahtera - -- -- -- -- 295 -- - 362 -- 657
34 P. Kebangkitan Nasional Ulama - -- -- -- -- 1 872 -- - 1 112 -- 2 984
35 P. Merdeka - -- -- -- -- 85 -- - 2 246 -- 2 331
36 P. Persatuan Nahdlatul Ummah - -- -- -- -- 142 -- - 176 -- 318
37 P. Sarikat Indonesia - -- -- -- -- 23 -- - 164 -- 187
38 P. Buruh - -- -- -- -- 357 -- - 2 760 -- 3 117
39 Lainnya/Others 51 980 -- -- -- -- - -- 19 098 - -- 71 078
J u m l a h / T o t a l 111 780 0 0 0 0 57 345 0 46 545 134 131 0 349 801
Tabel
Hasil Penghitungan Suara untuk Keanggotaan DPRD Provinsi Daerah
Pemilihan Sulawesi Tenggara, 2009 2.7
Table Vote Counting Results for Province Regional Representatives Membership
Sumber/Source : KPU Provinsi Sulawesi Tenggara/General Election Commission of Sulawesi Tenggara Province
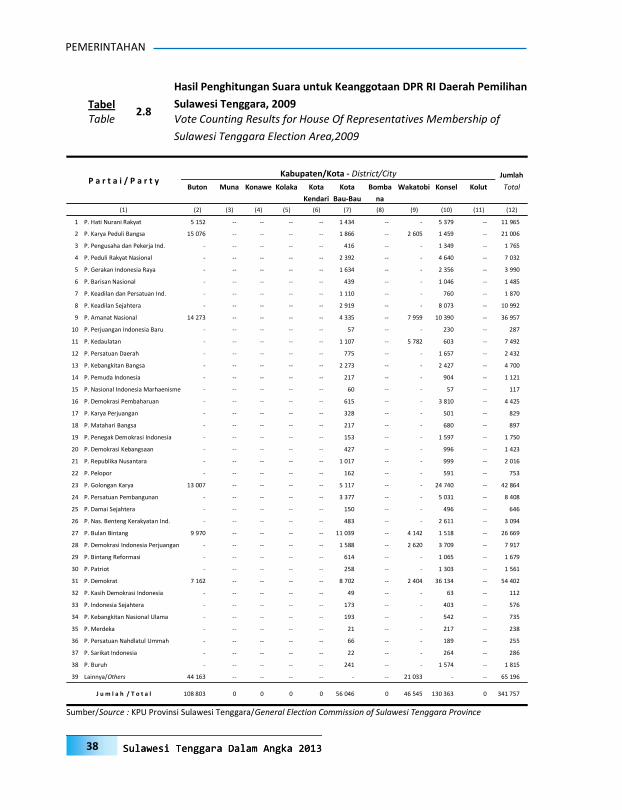
PEMERINTAHAN
38 Sulawesi Tenggara Dalam Angka 2013 Sulawesi Tenggara Dalam Angka 2013
P a r t a i / P a r t y
Kabupaten/Kota - District/City Jumlah
Buton Muna Konawe Kolaka Kota Kota Bomba Wakatobi Konsel Kolut Total
Kendari Bau-Bau na
(1) (2) (3) (4) (5) (6) (7) (8) (9) (10) (11) (12)
1 P. Hati Nurani Rakyat 5 152 -- -- -- -- 1 434 -- - 5 379 -- 11 965
2 P. Karya Peduli Bangsa 15 076 -- -- -- -- 1 866 -- 2 605 1 459 -- 21 006
3 P. Pengusaha dan Pekerja Ind. - -- -- -- -- 416 -- - 1 349 -- 1 765
4 P. Peduli Rakyat Nasional - -- -- -- -- 2 392 -- - 4 640 -- 7 032
5 P. Gerakan Indonesia Raya - -- -- -- -- 1 634 -- - 2 356 -- 3 990
6 P. Barisan Nasional - -- -- -- -- 439 -- - 1 046 -- 1 485
7 P. Keadilan dan Persatuan Ind. - -- -- -- -- 1 110 -- - 760 -- 1 870
8 P. Keadilan Sejahtera - -- -- -- -- 2 919 -- - 8 073 -- 10 992
9 P. Amanat Nasional 14 273 -- -- -- -- 4 335 -- 7 959 10 390 -- 36 957
10 P. Perjuangan Indonesia Baru - -- -- -- -- 57 -- - 230 -- 287
11 P. Kedaulatan - -- -- -- -- 1 107 -- 5 782 603 -- 7 492
12 P. Persatuan Daerah - -- -- -- -- 775 -- - 1 657 -- 2 432
13 P. Kebangkitan Bangsa - -- -- -- -- 2 273 -- - 2 427 -- 4 700
14 P. Pemuda Indonesia - -- -- -- -- 217 -- - 904 -- 1 121
15 P. Nasional Indonesia Marhaenisme - -- -- -- -- 60 -- - 57 -- 117
16 P. Demokrasi Pembaharuan - -- -- -- -- 615 -- - 3 810 -- 4 425
17 P. Karya Perjuangan - -- -- -- -- 328 -- - 501 -- 829
18 P. Matahari Bangsa - -- -- -- -- 217 -- - 680 -- 897
19 P. Penegak Demokrasi Indonesia - -- -- -- -- 153 -- - 1 597 -- 1 750
20 P. Demokrasi Kebangsaan - -- -- -- -- 427 -- - 996 -- 1 423
21 P. Republika Nusantara - -- -- -- -- 1 017 -- - 999 -- 2 016
22 P. Pelopor - -- -- -- -- 162 -- - 591 -- 753
23 P. Golongan Karya 13 007 -- -- -- -- 5 117 -- - 24 740 -- 42 864
24 P. Persatuan Pembangunan - -- -- -- -- 3 377 -- - 5 031 -- 8 408
25 P. Damai Sejahtera - -- -- -- -- 150 -- - 496 -- 646
26 P. Nas. Benteng Kerakyatan Ind. - -- -- -- -- 483 -- - 2 611 -- 3 094
27 P. Bulan Bintang 9 970 -- -- -- -- 11 039 -- 4 142 1 518 -- 26 669
28 P. Demokrasi Indonesia Perjuangan - -- -- -- -- 1 588 -- 2 620 3 709 -- 7 917
29 P. Bintang Reformasi - -- -- -- -- 614 -- - 1 065 -- 1 679
30 P. Patriot - -- -- -- -- 258 -- - 1 303 -- 1 561
31 P. Demokrat 7 162 -- -- -- -- 8 702 -- 2 404 36 134 -- 54 402
32 P. Kasih Demokrasi Indonesia - -- -- -- -- 49 -- - 63 -- 112
33 P. Indonesia Sejahtera - -- -- -- -- 173 -- - 403 -- 576
34 P. Kebangkitan Nasional Ulama - -- -- -- -- 193 -- - 542 -- 735
35 P. Merdeka - -- -- -- -- 21 -- - 217 -- 238
36 P. Persatuan Nahdlatul Ummah - -- -- -- -- 66 -- - 189 -- 255
37 P. Sarikat Indonesia - -- -- -- -- 22 -- - 264 -- 286
38 P. Buruh - -- -- -- -- 241 -- - 1 574 -- 1 815
39 Lainnya/Others 44 163 -- -- -- -- - -- 21 033 - -- 65 196
J u m l a h / T o t a l 108 803 0 0 0 0 56 046 0 46 545 130 363 0 341 757
Sumber/Source : KPU Provinsi Sulawesi Tenggara/General Election Commission of Sulawesi Tenggara Province
Tabel
Hasil Penghitungan Suara untuk Keanggotaan DPR RI Daerah Pemilihan
Sulawesi Tenggara, 2009 2.8
Table Vote Counting Results for House Of Representatives Membership of
Sulawesi Tenggara Election Area,2009

GOVERNMENT
39 Sulawesi Tenggara in Figures 2013 Sulawesi Tenggara in Figures 2013
Kabupaten/Kota Hansip/ Wanra Kamra Menwa Alumni Linmas People People Student Menwa Jumlah
District/City Civil Defence/ Resistance Security Regiment Student Total
Civil Protec- Regiment tion Alumni
(2) (3) (4) (5) (6) (7) (1)
1. B u t o n 980 0 0 0 0 980
2. M u n a 882 0 0 0 0 882
3. K o n a w e 1 000 0 0 0 0 1 000
4. K o l a k a 1 582 0 0 0 0 1 582
5. Konawe Selatan 1 100 0 0 0 0 1 100
6. Bombana 612 0 0 0 0 612
7. Wakatobi 496 0 0 0 0 496
8. Kolaka Utara 516 0 0 0 0 516
9 Buton Utara 770 0 0 0 0 770
10 Konawe Utara 276 0 0 0 0 276
11. Kota Kendari 1 388 0 0 72 58 1 518
12. Kota Bau-Bau 422 0 0 0 0 422
Sulawesi Tenggara
2 0 1 2 10 024 0 0 72 58 10 154
2 0 1 1
10 024r
0
0
72
58
10 154r
Tabel 2.9
Banyaknya Personel Pertahanan Sipil di Sulawesi Tenggara menurut Klasifikasi, 2012
Table Number of Civil Defence Personnel in Sulawesi Tenggara by Classification, 2012
Sumber/Source: Mawil Hansip Provinsi Sulawesi Tenggara/Civil Defence Regional Headquarter
of Sulawesi Tenggara Province
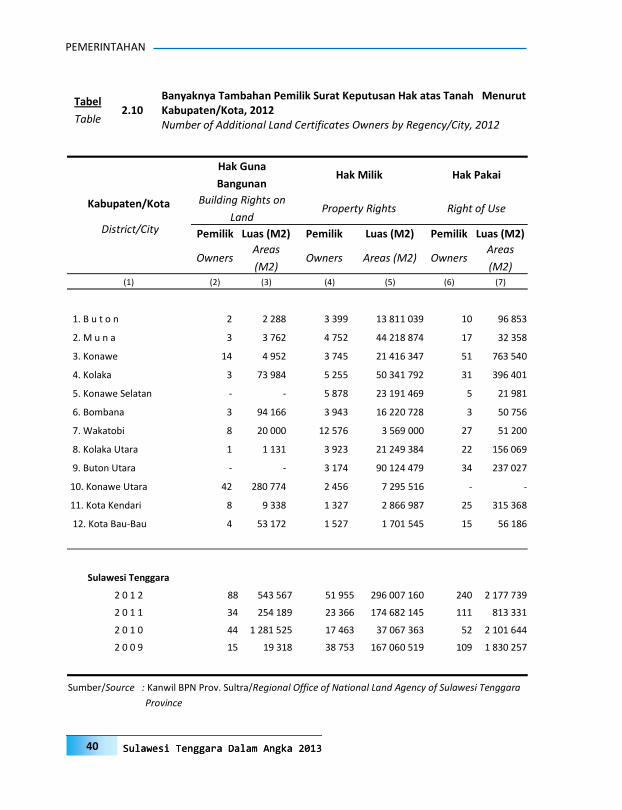
PEMERINTAHAN
40 Sulawesi Tenggara Dalam Angka 2013 Sulawesi Tenggara Dalam Angka 2013
Tabel
Table 2.10
Banyaknya Tambahan Pemilik Surat Keputusan Hak atas Tanah Menurut Kabupaten/Kota, 2012 Number of Additional Land Certificates Owners by Regency/City, 2012
Kabupaten/Kota
District/City
Hak Guna
Bangunan Hak Milik Hak Pakai
Building Rights on
Land Property Rights Right of Use
Pemilik Luas (M2) Pemilik Luas (M2) Pemilik Luas (M2)
Owners Areas
(M2) Owners Areas (M2) Owners
Areas
(M2) (1) (2) (3) (4) (5) (6) (7)
1. B u t o n 2 2 288 3 399 13 811 039 10 96 853
2. M u n a 3 3 762 4 752 44 218 874 17 32 358
3. Konawe 14 4 952 3 745 21 416 347 51 763 540
4. Kolaka 3 73 984 5 255 50 341 792 31 396 401
5. Konawe Selatan - - 5 878 23 191 469 5 21 981
6. Bombana 3 94 166 3 943 16 220 728 3 50 756
7. Wakatobi 8 20 000 12 576 3 569 000 27 51 200
8. Kolaka Utara 1 1 131 3 923 21 249 384 22 156 069
9. Buton Utara - - 3 174 90 124 479 34 237 027
10. Konawe Utara 42 280 774 2 456 7 295 516 - -
11. Kota Kendari 8 9 338 1 327 2 866 987 25 315 368
12. Kota Bau-Bau 4 53 172 1 527 1 701 545 15 56 186
Sulawesi Tenggara
2 0 1 2 88 543 567 51 955 296 007 160 240 2 177 739
2 0 1 1 34 254 189 23 366 174 682 145 111 813 331
2 0 1 0 44 1 281 525 17 463 37 067 363 52 2 101 644
2 0 0 9 15 19 318 38 753 167 060 519 109 1 830 257
Sumber/Source : Kanwil BPN Prov. Sultra/Regional Office of National Land Agency of Sulawesi Tenggara
Province
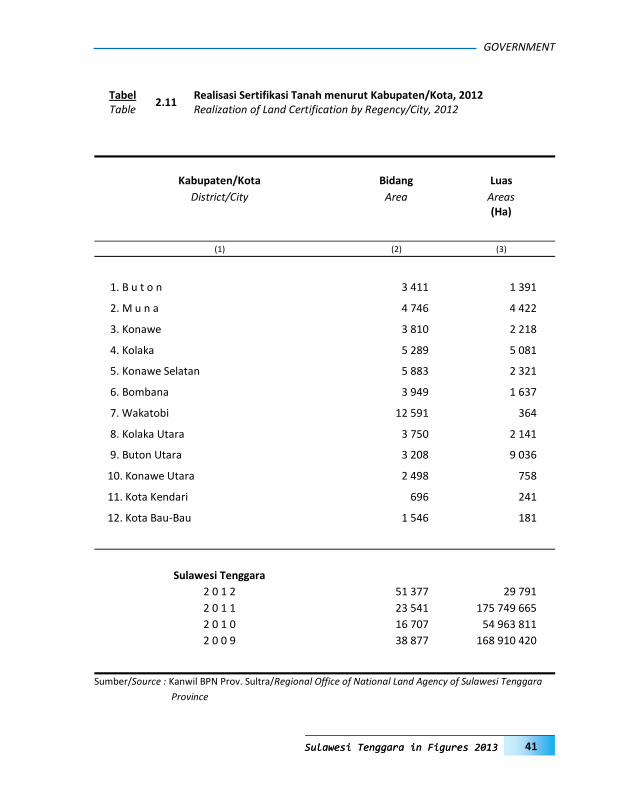
GOVERNMENT
41 Sulawesi Tenggara in Figures 2013 Sulawesi Tenggara in Figures 2013
Kabupaten/Kota Bidang Luas
District/City Area Areas
(Ha)
(1) (2) (3)
1. B u t o n 3 411 1 391
2. M u n a 4 746 4 422
3. Konawe 3 810 2 218
4. Kolaka 5 289 5 081
5. Konawe Selatan 5 883 2 321
6. Bombana 3 949 1 637
7. Wakatobi 12 591 364
8. Kolaka Utara 3 750 2 141
9. Buton Utara 3 208 9 036
10. Konawe Utara 2 498 758
11. Kota Kendari 696 241
12. Kota Bau-Bau 1 546 181
Sulawesi Tenggara
2 0 1 2 51 377 29 791
2 0 1 1 23 541 175 749 665
2 0 1 0 16 707 54 963 811
2 0 0 9 38 877 168 910 420
Sumber/Source : Kanwil BPN Prov. Sultra/Regional Office of National Land Agency of Sulawesi Tenggara
Province
Tabel Realisasi Sertifikasi Tanah menurut Kabupaten/Kota, 2012 2.11
Table Realization of Land Certification by Regency/City, 2012

PEMERINTAHAN
42 Sulawesi Tenggara Dalam Angka 2013 Sulawesi Tenggara Dalam Angka 2013
Unit Organisasi/Nama Laki-laki Perempuan Jumlah
Dinas/Nama badan Male Female Total
Unit Organization
(1) (2) (3) (4)
1 Sekretariat 497 343 840
2 Sekretariat DPRD 96 53 149
3 Sekretariat KPU 21 3 24
4 Dinas Pendidikan 207 126 333
5 Dinas Kesehatan 153 208 361
6 Dinas Perhubungan 128 53 181
7 Dinas PU 478 101 579
8 Dinas Koperasi 51 24 75
9 Dinas Sosial 66 54 120
10 Dinas Tenaga Kerja 113 70 183
11 Dinas Pemuda dan Olahraga 63 26 89
12 Dinas Pertanian 285 157 442
13 Dinas Perkebunan 248 117 365
14 Dinas Kehutanan 123 45 168
15 Dinas Energi danPertambangan 59 32 91
16 Dinas Kelautan 131 77 208
17 Dinas Perindag 74 55 129
18 Dinas Kebudayaan 43 28 71
19 Dinas Pendapatan 155 129 284
20 Inspektorat 52 47 99
21 Bappeda 71 39 110
22 Badan Lingkungan Hidup 20 18 38
23 BPM dan Pemerintah Desa 48 34 82
24 Badan Pemb.Perempuan & KB 24 22 46
Tabel
Table 2.12
Banyaknya Pegawai Negeri Sipil di Lingkungan Pemerintah Daerah Provinsi Sulawesi Tenggara Menurut Unit Organisasi dan jenis Kelamin 2012 Number of Civil Servants within the Sulawesi Tenggara Provincial Government According to the Unit Oragnization and Sex 2012

GOVERNMENT
43 Sulawesi Tenggara in Figures 2013 Sulawesi Tenggara in Figures 2013
Unit Organisasi/Nama Laki-laki Perempuan Jumlah
Dinas/Nama badan Male Female Total
Unit Organization
(1) (2) (3) (4)
25 Badan Kesbang, Politik & Linmas 45 20 65
26 Badan Kepegawaian Daerah 58 45 103
27 Badan Pendidikan dan Pelatihan 73 12 85
28 Badan Penelitiaan & Pengembangan 24 31 55
29 Badan perpustakaan & Arsip daerah 52 44 96
30 Badan Ketahanan pangan 39 25 64
31 BPMD 33 13 46
32 Badan Penanggulangan Bencana 35 13 48
33 Kantor Penghubung pemerintah 29 35 64
34 Rumah Sakit Umum Daerah 195 591 786
35 Rumah sakit Jiwa 90 103 193
36 Bakorlut 55 35 90
37 Badan Narkotika 12 11 23
38 KPID 4 7 11
39 Satuan Pol. PP 59 10 69
40 Sekretariat Dewan Korpri 13 10 23
Jumlah / Total 4 022 2 866 6 888
Lanjutan Tabel / Continued Table 2.12
Sumber/Source : BKD Prov. Sultra/ Regional Government Officer Board

PEMERINTAHAN
44 Sulawesi Tenggara Dalam Angka 2013 Sulawesi Tenggara Dalam Angka 2013
Golongan Kepangkatan
Grade
Laki-laki Male
Perempuan Female
Jumlah Total
(1) (2) (3) (4)
I / a 7 2 9
I / b 11 2 13
I / c 25 2 27
I / d 11 0 11
II / a 410 207 617
II / b 503 217 720
II / c 180 304 484
II / d 130 112 242
III / a 694 682 1 376
III / b 797 640 1 437
III / c 408 282 690
III / d 445 294 739
IV / a 222 73 295
IV / b 121 40 161
IV / c 37 4 41
IV / d 20 5 25
IV / e 1 0 1
Jumlah / Total 4 022 2 866 6 888
Tabel Banyaknya Pegawai Negeri Sipil di Lingkungan Pemerintah Daerah Provinsi Sulawesi Tenggara Menurut Kepangkatan dan jenis Kelamin 2012
2.13 Table Number of Civil Servants within the Sulawesi Tenggara provincial govern-ment According to the Grade and Sex 2012
Sumber/Source : BKD Prov. Sultra/ Regional Government Officer Board
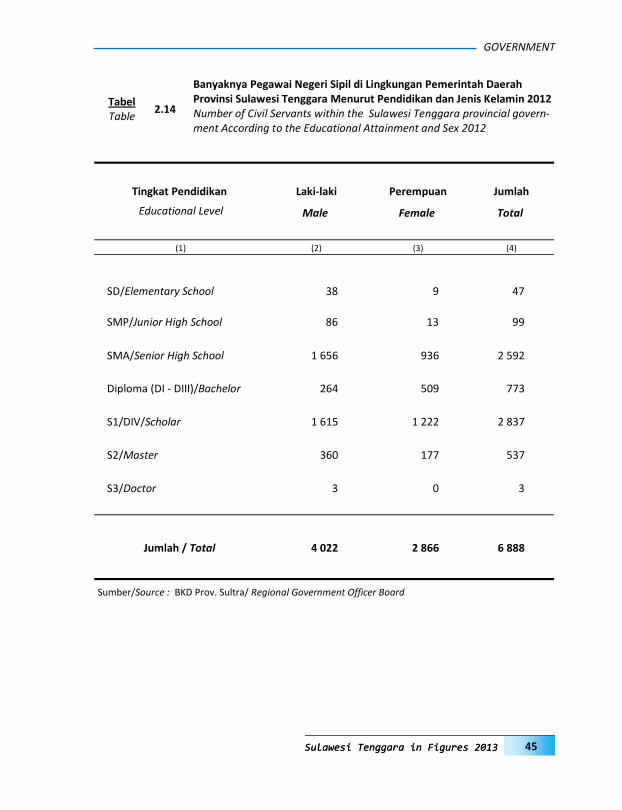
GOVERNMENT
45 Sulawesi Tenggara in Figures 2013 Sulawesi Tenggara in Figures 2013
Tingkat Pendidikan Laki-laki Perempuan Jumlah
Educational Level Male Female Total
(1) (2) (3) (4)
SD/Elementary School 38 9 47
SMP/Junior High School 86 13 99
SMA/Senior High School 1 656 936 2 592
Diploma (DI - DIII)/Bachelor 264 509 773
S1/DIV/Scholar 1 615 1 222 2 837
S2/Master 360 177 537
S3/Doctor 3 0 3
Jumlah / Total 4 022 2 866 6 888
2.14
Banyaknya Pegawai Negeri Sipil di Lingkungan Pemerintah Daerah Provinsi Sulawesi Tenggara Menurut Pendidikan dan Jenis Kelamin 2012 Tabel
Table Number of Civil Servants within the Sulawesi Tenggara provincial govern-ment According to the Educational Attainment and Sex 2012
Sumber/Source : BKD Prov. Sultra/ Regional Government Officer Board
PEMERINTAHAN
46 Sulawesi Tenggara Dalam Angka 2013 Sulawesi Tenggara Dalam Angka 2013
Halaman ini sengaja dikosongkan This page intentionally left blank
P O P U L A T I O N A N D E M P L O Y M E N T3PENDUDUK DAN TENAGA KERJA

POPULATION AND EMPLOYMENT
49 Sulawesi Tenggara in Figures 2013
PENJELASAN TEKNIS
Sumber utama data kependudukan ada-lah Sensus Penduduk yang dilaksanakan setiap sepuluh tahun sekali. Sensus Penduduk telah dilaksanakan sebanyak enam kali sejak Indonesia merdeka yaitu tahun 1961, 1971, 1980, 1990, 2000 dan 2010. Selain Sensus Penduduk, untuk menjembatani ketersediaan data kependudukan di antara dua periode sensus, BPS melakukan Survei Penduduk Antar Sensus (SUPAS). SUPAS telah dil-akukan sebanyak empat kali, tahun 1976, 1985, 1995 dan terakhir 2005. Data kependudukan selain Sensus dan SUPAS adalah proyeksi penduduk.
Di dalam sensus penduduk, pencaca-han dilakukan terhadap seluruh penduduk yang berdomisili di wilayah teritorial Indonesia termasuk warga Nega-ra asing kecuali anggota Korps Diplomatik beserta keluarganya. Berbeda dengan pelaksanaan sensus penduduk sebe-lumnya, Sensus Penduduk 2010 melaksanakan metode pencacahan lengkap termasuk pula anggota rumah tangga Korps Diplomatik RI yang tinggal di luar negeri.
Sensus Penduduk 2010 dilakukan serentak di seluruh tanah air mulai tang-gal 1-31 Mei 2010. Metode pengumpulan data dilakukan dengan wawancara antara petugas sensus dengan responden. Cara pencacahan yang dipakai dalam sensus penduduk adalah kombinasi antara de jure dan de facto. Bagi penduduk yang bertempat tinggal tetap dipakai cara de jure, dicacah di mana mereka biasa tinggal, sedangkan untuk penduduk yang tidak bertempat tinggal tetap dicacah
TECHNICAL NOTES
The main source of demographic data is Population Census, which is con-ducted every ten years. Population Census has been conducted six times since Indonesia’s independence: 1961, 1971, 1980, 1990, 2000 and 2010. In addition to the Population Census, BPS also conducted Intercensal Population Survey, called SUPAS which is de-signed to proceed demographic data between two censuses. SUPAS has been conducted four times: 1976, 1985, 1995 and 2005. Besides Popula-tion Census and SUPAS, the democratic data report also uses population projection.
The population census enumer-ates all residents who domicile in the entire territory of Republic of Indone-sia including foreign citizenship except the diplomatic corps members and their families. Being different from the implementation of the previous censuses, the 2010 Population Census applied the complete enumeration method which also included the household members of the diplomatic corps of Republic of Indonesia living abroad.
The 2010 Population Census was simultaneously conducted in Indonesia territory from 1-31 May 2010. Data were collected by interviewing re-spondents in which the combination of de jure and de facto approaches were applied. De jure was applied to the permanent residents, while de facto was applied to non-permanent residents. The permanent residents were enumerated in place where they normally live, the non permanent
PENDUDUK DAN KETENAGAKERJAAN
50 Sulawesi Tenggara Dalam Angka 2013
dengan cara de facto, yaitu dicacah di tempat di mana mereka ditemukan petugas sensus biasanya pada malam ‘Hari Sensus’. Termasuk penduduk yang tidak bertempat tinggal tetap adalah tuna wisma, awak kapal berbendera Indonesia, penghuni perahu/rumah apung, masyarakat terpencil/terasing dan pengungsi.
Bagi mereka yang mempunyai tempat tinggal tetap, tetapi sedang bertugas ke luar wilayah lebih dari enam bulan, tidak dicacah di tempat tinggalnya. Sebaliknya, seseorang atau keluarga menempati suatu bangunan belum mencapai enam bulan tetapi bermaksud menetap di sana dicacah di tempat tersebut.
Penduduk adalah semua orang yang berdomisili di wilayah teritorial Republik Indonesia selama 6 bulan atau lebih dan atau mereka yang berdomisili kurang dari 6 bulan tetapi bertujuan menetap.
Rata-rata Pertumbuhan Penduduk adalah angka yang menunjukkan tingkat pertambahan penduduk per tahun dalam jangka waktu tertentu.
Kepadatan Penduduk adalah banyaknya penduduk per km persegi.
Rasio Jenis Kelamin adalah perbandingan antara banyaknya penduduk laki-laki dengan banyaknya penduduk perempuan pada suatu daerah dan waktu tertentu. Biasanya dinyatakan dengan banyaknya penduduk laki-laki untuk 100 penduduk perempuan.
residents were enumerated where they were found by the enumerators, usually on the night of ‘Census Day’. The non permanent residents include homeless people, ship crew, boat peo-ple, remote area community and in-ternally displaced persons.
For those who had permanent residence but had been away from their former home for six months or more were not enumerated in their permanent places. In contrast, some-one or a family who moved to another place less than six months but intend-ed to settle there, was enumerated in that place.
Population are all residents of the entire territory of Republic of Indone-sia who have stayed for six months or longer, and or those who domicile less than six months but intending to settle permanently.
Average growth of population is the annual population growth rate over a certain period.
Population density is the number of people per square kilometer.
Sex Ratio is the ratio of the number of males to the number of females in a given area and time, usually expressed as the number of males for every 100 females.
POPULATION AND EMPLOYMENT
51 Sulawesi Tenggara in Figures 2013
Struktur umur penduduk pada suatu daerah sangat ditentukan oleh perkembangan tingkat kelahiran, kematian dan migrasi.
Rumah Tangga adalah seseorang atau sekelompok orang yang mendiami sebagi-an atau seluruh bangunan fisik/sensus, dan biasanya tinggal bersama serta pengelolaan makan dari satu dapur. Yang dimaksud makan dari satu dapur adalah jika pengurusan kebutuhan sehari-hari dikelola bersama-sama menjadi satu.
Anggota Rumah Tangga adalah semua orang yang biasanya bertempat tinggal di suatu rumah tangga, baik yang berada di rumah pada waktu pencacahan maupun yang sementara tidak ada.
Rata-rata Anggota Rumah Tangga adalah angka yang menunjukkan rata-rata jumlah anggota rumah tangga per rumah tangga.
Sumber utama data ketenagakerjaan adalah Survei Angkatan Kerja Nasional (Sakernas). Survei ini khusus dirancang untuk mengumpulkan informasi/data ketenagakerjaan. Pada beberapa survei sebelumnya, pengumpulan data ketenagakerjaan dipadukan dalam kegiatan lainnya, seperti Survei Sosial Ekonomi Nasional (Susenas), Sensus Penduduk (SP), dan Survei Penduduk Antar Sensus (SUPAS). Sakernas pertama kali diselenggarakan pada tahun 1976, kemudian dilanjutkan pada tahun 1977 dan 1978.
Pada tahun 1986-1993, Sakernas diselenggarakan secara triwulanan di seluruh provinsi di Indonesia, baru sejak
The age structure of population is highly determined by the fertility, mortality and migration rate.
Household is a person or a group of person usually living together in a physical/census building unit or part of it and making a common provision for food and other essentials of living. The Common provision for food means one organising daily needs for all of household members.
Household member is a person who usually lives in a household regardless of their location at the time of enu-meration.
Average household size is the average number of household members per household.
The main source of employment data is National Labour Force Survey (Sakernas). This survey is specifically designed to collect information on employment statistics. Previously, the collection of such data was integrated with other surveys, such as National Socio-economic Survey (Susenas), Population Census (SP), and Intercen-sal Population Survey (SUPAS). The first Sakernas was conducted in 1976, then conducted anually during the period 1977-1978.
During 1986-1993, Sakernas was conducted quarterly in all Provinces in Indonesia, only since 1994 until 2001
PENDUDUK DAN KETENAGAKERJAAN
52 Sulawesi Tenggara Dalam Angka 2013
tahun 1994 s/d 2001, Sakernas dil-aksanakan secara tahunan setiap bulan Agustus. Sejak tahun 2002-2004, di samping Sakernas tahunan dilakukan pula Sakernas Triwulanan. Sakernas Triwu-lanan ini dimaksudkan untuk memantau indikator ketenagakerjaan secara dini di Indonesia, yang mengacu pada KILM (the Key Indicators of the Labour Market) yang direkomendasikan oleh ILO (the Interna-tional Labour Organization). Sejak tahun 2005-2010 Sakernas dilaksanakan pengumpulan datanya secara semesteran pada bulan Februari (semester I) dan Agustus (semester II). Mulai tahun 2011, Sakernas dilaksanakan triwulanan (empat kali dalam setahun), yaitu pada Bulan februari, Maret, Agustus, dan November.
Sejak Sakernas 2001, konsep status pekerjaan dan pengangguran mengalami perluasan dan penyempurnaan. Status pekerjaan yang pada Sakernas 2000 han-ya 5 kategori, mulai tahun 2001 dit-ambahkan kategori baru yaitu: pekerja bebas pertanian dan pekerja bebas non pertanian. Selain itu, dalam rangka me-nyesuaikan dengan konsep ILO, konsep pengangguran terbuka diperluas yaitu disamping mencakup penduduk yang aktif mencari pekerjaan, mencakup pula ke-lompok penduduk yang sedang memper-siapkan usaha/pekerjaan baru, kelompok penduduk yang tidak mencari pekerjaan, karena merasa tidak mungkin mendapat pekerjaan serta kelompok penduduk yang tidak aktif mencari pekerjaan dengan alasan sudah mempunyai pekerjaan teta-pi belum mulai bekerja. Inflation factor yang digunakan dalam penghitungan angka hasil sakernas didasarkan pada total penduduk dirinci menurut kelompok umur, provinsi dan daerah perkotaan dan pedesaan hasil proyeksi penduduk.
Sakernas was conducted yearly, every August of the year. During the period 2002-2004, besides a yearly Sakernas, BPS also conducted a quarterly Saker-nas. A Quarterly Sakernas is aimed to monitor the prompt indicators of Indo-nesian labour market which referred to the Key Indicators of the Labour Market (KILM) recommended by ILO (the International Labour Organiza-tion). Since 2005-2010, Sakernas has been conducted in semester period, i.e February (Semester I) and August (Semester II. Since 2011, sakernas has conducted quarterly; i.e. February, May, August and November
Since 2001 Sakernas, the concept of employment status and unemploy-ment was revised. The employment status, previously covered only 5 cate-gories, but since 2001 two new cate-gories of casual employee both in agriculture and non agriculture sec-tors have been added. To adapt the ILO concept, the concept of open un-employment was also extended. Open unemployment now covers population who were looking for work, popula-tion who were establishing a new business/firm/ establishment, discour-aged job seekers, and those who were not actively looking for work with the reason of already having job but not starting to work. The inflation factor used for the calculation of Sakernas result was based on the population total categorised by the age group, province, and urban/rural area as a result of population projection.
POPULATION AND EMPLOYMENT
53 Sulawesi Tenggara in Figures 2013
Tenaga kerja adalah penduduk berumur 15 tahun ke atas yang dapat dibedakan atas dua kelompok yaitu:
Angkatan Kerja adalah penduduk usia 15 tahun ke atas (penduduk usia kerja) dan mempunyai pekerjaan (bekerja) atau sedang mencari pekerjaan (pengangguran terbuka). Penduduk yang bekerja tidak hanya meliputi penduduk yang sedang bekerja, tetapi juga sementara tidak bekerja karena suatu sebab, misalnya pegawai yang sedang cuti, petani yang sedang menunggu panen dan sebagainya. Sedangkan pencari kerja adalah penduduk yang tidak memiliki pekerjaan tetapi sedang mencari pekerjaan. Angkatan kerja seperti diketahui sangat tergantung pada struktur penduduk, sifat demografis serta keadaan sosial ekonomi daerah.
Bukan Angkatan kerja adalah mereka yang berumur 15 tahun ke atas yang kegiatannya hanya bersekolah, mengurus rumahtangga dan lainnya (tidak aktif secara ekonomis).
Penduduk Usia Kerja adalah Penduduk yang berumur 15 tahun ke atas.
Bekerja adalah kegiatan melakukan pekerjaan dengan maksud memperoleh atau membantu memperoleh pendapa-tan atau keuntungan dalam jangka waktu paling sedikit 1 jam secara terus menerus dalam seminggu yang lalu (termasuk pekerja keluarga tanpa upah yang mem-bantu dalam usaha/kegiatan ekonomi).
Jumlah jam kerja seluruhnya adalah jumlah jam kerja yang digunakan untuk bekerja (tidak termasuk jam kerja istira-hat resmi dan jam kerja yang digunakan untuk hal-hal di luar pekerjaan)
Manpower is 15 years of age and over which can be divided into two groups:
Economically Active is people aged 15 years old and over who are working or looking for work (open unemployment). Working population not only covers people who are working but also temporarily absent from work for some reason such as employees on leave, the farmers who were waiting for the harvest, and so on. While unemployment is all people who do not have a job but they are looking for a job. Economically Active highly depends on the population structure, demographic, and local socio-economic.
Not Economically Active is people aged 15 years and over who are not working but not looking for work, such as attending school only, taking care of household only and so on.
Working Age Population is population aged 15 years and over.
The concept of working means activity intended to earn income by doing work or helping to do work at least one hour continuously during the ref-erence week (including unpaid family worker/s for any economic activity .
Total Working Hours is the total hours spent by an employee to perform all jobs (excluding the time used for other activities which are not classified as work).

PENDUDUK DAN KETENAGAKERJAAN
54 Sulawesi Tenggara Dalam Angka 2013
Lapangan Usaha adalah bidang kegiatan dari pekerjaan/tempat bekerja dimana seseorang bekerja. Klasifikasi lapangan usaha mengikuti Klasifikasi Baku Lapan-gan Usaha Indonesia (KBLI) dalam 1 digit.
Status Pekerjaan adalah kedudukan seseorang dalam unit usaha/kegiatan dalam melakukan pekerjaan.
Pekerja Tak Dibayar adalah seseorang yang bekerja membantu usaha untuk memperoleh penghasilan/keuntungan yang dilakukan oleh salah seorang ang-gota rumah tangga atau bukan anggota rumah tangga tanpa mendapat upah/gaji.
Tingkat Partisipasi Angkatan Kerja (TPAK) adalah persentase jumlah angkatan kerja terhadap jumlah penduduk usia kerja
Transmigrasi
Dalam upaya pemerataan penyebaran penduduk antar propinsi-propinsi di Indonesia, dewasa ini pemerintah telah dan terus melaksanakan suatu program perpindahan penduduk yang disebut Program Transmigrasi. Tujuan program ini, disamping untuk pemerataan penyebaran penduduk dan tenaga kerja serta pembukaan dan pengembangan daerah produksi baru, juga diharapkan dapat mendorong peningkatan taraf hidup para transmigran dan masyarakat di sekitarnya.
Industry is field of a person’s activity or establishment. The classification of industries follows the Indonesia Stand-ard Industrial Classification (KBLI) in one digit.
Employment Status is the status of a person at his place of work or estab-lishment where he was employed.
Unpaid Worker is a person who in-tended to work without pay in an establishment run by other members of the family, relative or neighbour.
The Labor Force Participation Rate (LFPRs) is percentages of labour forces by working age population
Transmigration
In order to distribute the population among provinces, the Indonesian Gov-ernment has been implementing a migration program was called Trans-migration Program. This program aims to distribute the population and labor, open and develop new produc-tion areas. In addition, it is expected to improve the standard of living of the migrants and their surrounding communities.
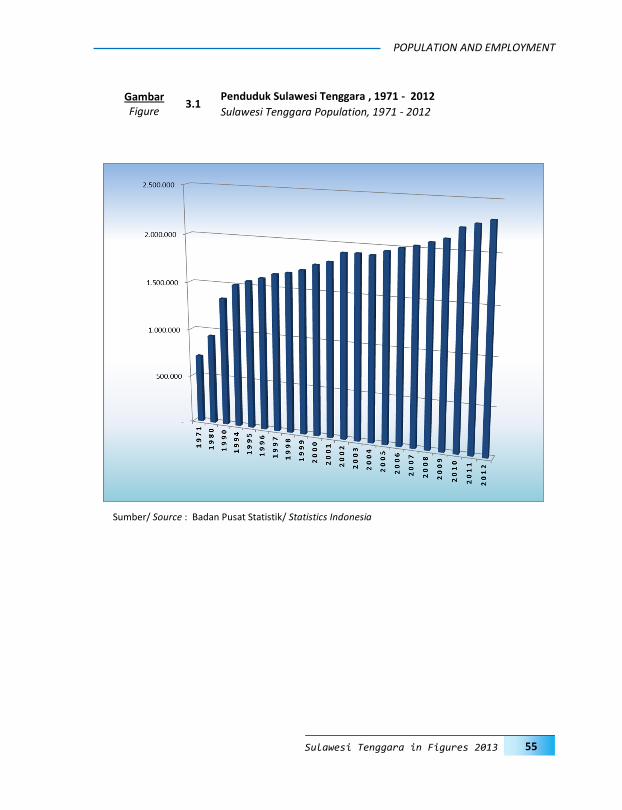
POPULATION AND EMPLOYMENT
55 Sulawesi Tenggara in Figures 2013
Sumber/ Source : Badan Pusat Statistik/ Statistics Indonesia
3.1 Penduduk Sulawesi Tenggara , 1971 - 2012 Gambar
Figure Sulawesi Tenggara Population, 1971 - 2012
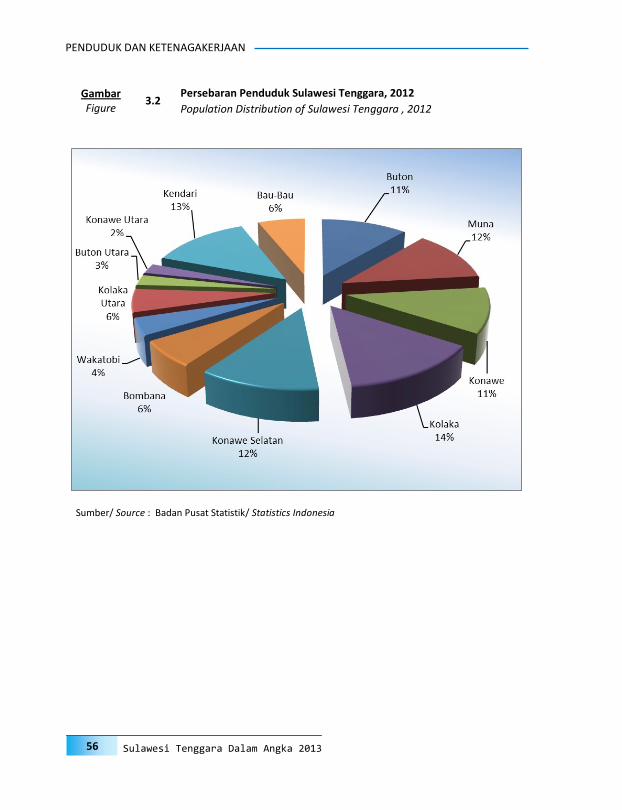
PENDUDUK DAN KETENAGAKERJAAN
56 Sulawesi Tenggara Dalam Angka 2013
3.2 Persebaran Penduduk Sulawesi Tenggara, 2012 Gambar
Figure Population Distribution of Sulawesi Tenggara , 2012
Sumber/ Source : Badan Pusat Statistik/ Statistics Indonesia

POPULATION AND EMPLOYMENT
57 Sulawesi Tenggara in Figures 2013
3.3
Persentase Penduduk Berumur 15 Tahun Ke Atas Yang Bekerja Menurut Lapangan Pekerjaan Utama, 2012 Gambar
Figure Percentage of Sulawesi Tenggara Population 15 Years Old and over who worked by Main Industry, 2012
Sumber/ Source : Badan Pusat Statistik/ Statistics Indonesia

PENDUDUK DAN KETENAGAKERJAAN
58 Sulawesi Tenggara Dalam Angka 2013
3.4
Persentase Penduduk Berumur 15 Tahun Ke Atas Yang Bekerja Menurut Lapangan Pekerjaan Utama, 2009 - 2012 Gambar
Figure Percentage of Sulawesi Tenggara Population 15 Years Old and over who worked by Main Industry, 2009 - 2012
Sumber/ Source : Badan Pusat Statistik/ Statistics Indonesia

POPULATION AND EMPLOYMENT
59 Sulawesi Tenggara in Figures 2013
Buton Muna Konawe Kolaka Konsel Bombana T a h u n Y e a r s
(1) (2) (3) (4) (5) (6) (7)
1 9 7 1 300 343 154 024 189 968 69 694 --- ---
1 9 8 0 317 124 174 057 306 675 144 446 --- ---
1 9 9 0 394 484 226 933 488 471 239 731 --- ---
1 9 9 4 417 612 243 561 563 032 279 799 --- ---
1 9 9 5 424 771 250 162 586 235 293 160 --- ---
1 9 9 6 430 585 254 033 606 775 304 005 --- ---
1 9 9 7 437 620 260 365 478 769 319 768 --- ---
1 9 9 8 446 080 264 142 486 545 321 182 --- ---
1 9 9 9 452 066 268 616 491 177 326 013 --- ---
2 0 0 0 533 417 274 160 444 912 323 329 --- ---
2 0 0 1 548 775 278 820 452 810 331 151 --- ---
2 0 0 2 613 594 283 009 464 623 342 219 --- ---
2 0 0 3 571 272 292 774 477 368 355 653 --- ---
2 0 0 4 456 396 292 332 471 323 352 607 --- ---
2 0 0 5 266 401 287 732 260 830 266 015 228 765 105 847
2 0 0 6 271 657 290 358 265 646 273 168 234 400 107 294
2 0 0 7 275 666 243 397 224 345 278 829 237 918 108 231
2 0 0 8 279 546 246 004 228 706 281 450 240 053 109 883
2 0 0 9 284 627 248 461 233 080 287 246 244 046 111 481
2 0 1 0 255 712 268 277 241 982 315 232 264 587 139 235
2 0 1 1 260 801 273 616 246 798 321 506 269 853 142 006
2 0 1 2 261 119 276 817 250 491 329 343 275 234 146 072
Tabel 3.1.1
Penduduk Sulawesi Tenggara menurut Kabupaten/Kota, 1971 - 2012
Table Population of Sulawesi Tenggara by District/City, 1971 - 2012
3.1 Penduduk
Population
[Diolah dari Hasil Sensus Penduduk, Survei Penduduk Antar Sensus (SUPAS) dan Proyeksi Penduduk, BPS/Based on Population Census, Inter-censal Population Survey and Projection of Population, BPS-Statistics Indonesia]
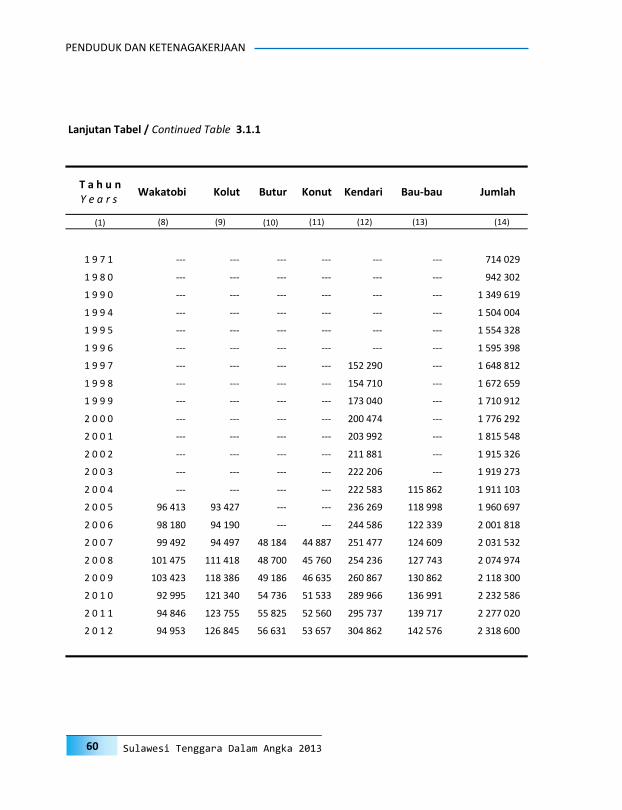
PENDUDUK DAN KETENAGAKERJAAN
60 Sulawesi Tenggara Dalam Angka 2013
Wakatobi Kolut Butur Konut Kendari Bau-bau Jumlah T a h u n Y e a r s
(1) (8) (9) (10) (11) (12) (13) (14)
1 9 7 1 --- --- --- --- --- --- 714 029
1 9 8 0 --- --- --- --- --- --- 942 302
1 9 9 0 --- --- --- --- --- --- 1 349 619
1 9 9 4 --- --- --- --- --- --- 1 504 004
1 9 9 5 --- --- --- --- --- --- 1 554 328
1 9 9 6 --- --- --- --- --- --- 1 595 398
1 9 9 7 --- --- --- --- 152 290 --- 1 648 812
1 9 9 8 --- --- --- --- 154 710 --- 1 672 659
1 9 9 9 --- --- --- --- 173 040 --- 1 710 912
2 0 0 0 --- --- --- --- 200 474 --- 1 776 292
2 0 0 1 --- --- --- --- 203 992 --- 1 815 548
2 0 0 2 --- --- --- --- 211 881 --- 1 915 326
2 0 0 3 --- --- --- --- 222 206 --- 1 919 273
2 0 0 4 --- --- --- --- 222 583 115 862 1 911 103
2 0 0 5 96 413 93 427 --- --- 236 269 118 998 1 960 697
2 0 0 6 98 180 94 190 --- --- 244 586 122 339 2 001 818
2 0 0 7 99 492 94 497 48 184 44 887 251 477 124 609 2 031 532
2 0 0 8 101 475 111 418 48 700 45 760 254 236 127 743 2 074 974
2 0 0 9 103 423 118 386 49 186 46 635 260 867 130 862 2 118 300
2 0 1 0 92 995 121 340 54 736 51 533 289 966 136 991 2 232 586
2 0 1 1 94 846 123 755 55 825 52 560 295 737 139 717 2 277 020
2 0 1 2 94 953 126 845 56 631 53 657 304 862 142 576 2 318 600
Lanjutan Tabel / Continued Table 3.1.1

POPULATION AND EMPLOYMENT
61 Sulawesi Tenggara in Figures 2013
Tabel 3.1.2
Jumlah dan Rata-rata Laju Pertumbuhan Penduduk Sulawesi Tenggara menurut Kabupaten/Kota, 1990, 2000, 2010, 2011, 2012
Table Number and Average Growth Rate of Population of Sulawesi Tenggara by District/City, 1990, 2000, 2011, 2012
Kabupaten/Kota District/City
P e n d u d u k Population
Laju Per-tumbuhan
(%) Growth Rates
1990 1) 2000 1) 2010 1) 20112) 20122) 2011-2012
(1) (2) (3) (4) (5) (5) (6)
1. Buton 394 484 533 417 255 712 260 801 261 119 0,12
2. M u n a 226 933 274 160 268 277 273 616 276 817 1,17
3. Konawe 488 471 444 912 241 982 246 798 250 491 1,50
4. Kolaka 239 731 323 329 315 232 321 506 329 343 2,44
5. Konawe Selatan --- --- 264 587 269 853 275 234 1,99
6. Bombana --- --- 139 235 142 006 146 072 2,86
7. Wakatobi --- --- 92 995 94 846 94 953 0,11
8. Kolaka Utara --- --- 121 340 123 755 126 845 2,50
9. Buton Utara 3) --- --- 54 736 55 825 56 631 1,44
10. Konawe Utara 4) --- --- 51 533 52 560 53 657 2,09
11. Kota Kendari --- 200 474 289 966 295 737 304 862 3,09
12. Kota Bau-Bau --- --- 136 991 139 717 142 576 2,05
Sulawesi Tenggara 1 349 619 1 776 292 2 232 586 2 277 020 2 318 600 1,83
Catatan/Note : 1) Buton Utara pecahan dari Kab.Muna/ Buton Utara, Fraction of Muna District
2) Konawe Utara pecahan dari Kab.Konawe/ Konawe Utara, Fraction of Konawe District
[Diolah dari Hasil Sensus Penduduk (SP) dan Proyeksi Penduduk, BPS/Based on Population Census and Projection of Population, BPS-Statistics Indonesia]
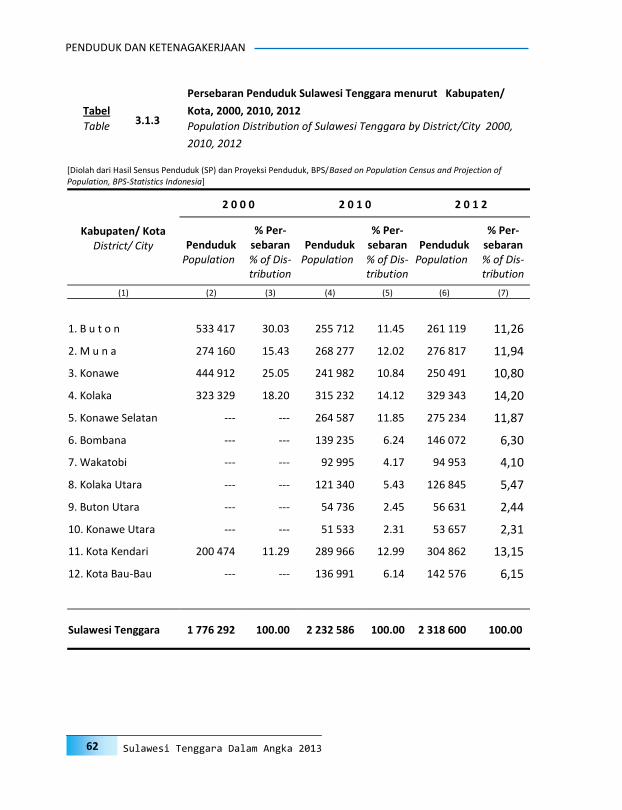
PENDUDUK DAN KETENAGAKERJAAN
62 Sulawesi Tenggara Dalam Angka 2013
Kabupaten/ Kota District/ City
2 0 0 0 2 0 1 0 2 0 1 2
Penduduk Population
% Per-sebaran % of Dis-tribution
Penduduk Population
% Per-sebaran % of Dis-tribution
Penduduk Population
% Per-sebaran % of Dis-tribution
(1) (2) (3) (4) (5) (6) (7)
1. B u t o n 533 417 30.03 255 712 11.45 261 119 11,26
2. M u n a 274 160 15.43 268 277 12.02 276 817 11,94
3. Konawe 444 912 25.05 241 982 10.84 250 491 10,80
4. Kolaka 323 329 18.20 315 232 14.12 329 343 14,20
5. Konawe Selatan --- --- 264 587 11.85 275 234 11,87
6. Bombana --- --- 139 235 6.24 146 072 6,30
7. Wakatobi --- --- 92 995 4.17 94 953 4,10
8. Kolaka Utara --- --- 121 340 5.43 126 845 5,47
9. Buton Utara --- --- 54 736 2.45 56 631 2,44
10. Konawe Utara --- --- 51 533 2.31 53 657 2,31
11. Kota Kendari 200 474 11.29 289 966 12.99 304 862 13,15
12. Kota Bau-Bau --- --- 136 991 6.14 142 576 6,15
1 776 292 100.00 2 232 586 100.00 2 318 600 100.00 Sulawesi Tenggara
Tabel 3.1.3
Persebaran Penduduk Sulawesi Tenggara menurut Kabupaten/
Kota, 2000, 2010, 2012
Table Population Distribution of Sulawesi Tenggara by District/City 2000,
2010, 2012
[Diolah dari Hasil Sensus Penduduk (SP) dan Proyeksi Penduduk, BPS/Based on Population Census and Projection of Population, BPS-Statistics Indonesia]

POPULATION AND EMPLOYMENT
63 Sulawesi Tenggara in Figures 2013
Luas
Area
(Km2)
Penduduk Kepadatan Penduduk
Kabupaten/Kota
District/City
Population Population Density
2000 2010 2012 2000 2010 2012
(1) (2) (3) (4) (5) (6) (7) (8)
1. B u t o n 2 675 533 417 255 712 261 119 199 96 98
2. M u n a 2 890 274 160 268 277 276 817 56 93 96
3. Konawe 6 792 444 912 241 982 250 491 38 38 37
4. Kolaka 6 918 323 329 315 232 329 343 47 46 48
5. Konawe Selatan 4 514 --- 264 587 275 234 --- 59 61
6. Bombana 3 056 --- 139 235 146 072 --- 46 48
7. Wakatobi 426 --- 92 995 94 953 --- 218 223
8. Kolaka Utara 3 392 --- 121 340 126 845 --- 36 37
9. Buton Utara 1 997 --- 54 736 56 631 --- 27 28
10. Konawe Utara 4 877 --- 51 533 53 657 --- 11 11
11. Kota Kendari 296 200 474 289 966 304 862 677 980 1030
12. Kota Bau-Bau 306 --- 136 991 142 576 --- 448 466
Sulawesi Tenggara 38 140 1 776 292 2 232 586 2 318 600 47 59 61
Tabel
Kepadatan Penduduk Sulawesi Tenggara menurut Kabupaten/Kota,
2000, 2010, 2012 3.1.4
Table Population Density of Sulawesi Tenggara by District/City, 2000, 2010,
2012
[Diolah dari Hasil Sensus Penduduk (SP) dan Proyeksi Penduduk, BPS/Based on Population Census and Projection of Population, BPS-Statistics Indonesia]
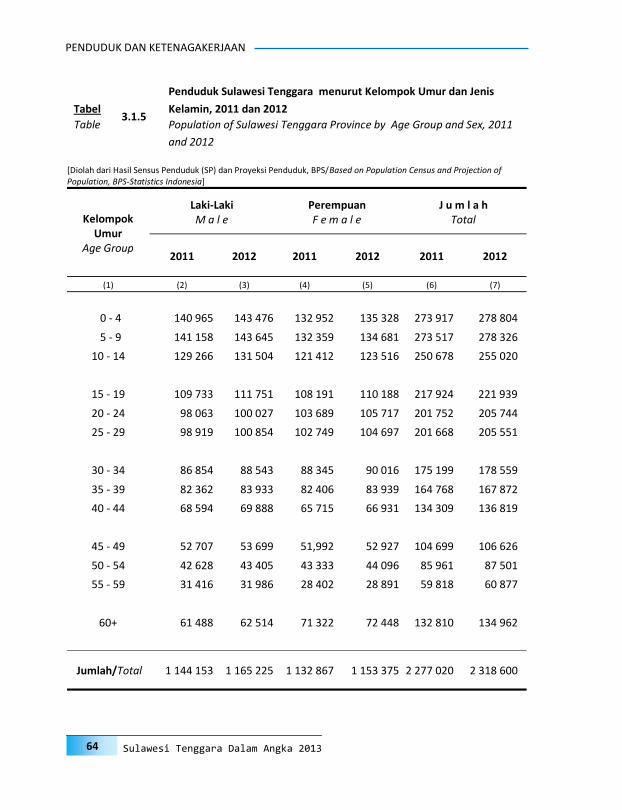
PENDUDUK DAN KETENAGAKERJAAN
64 Sulawesi Tenggara Dalam Angka 2013
Kelompok Umur
Age Group
Laki-Laki M a l e
Perempuan F e m a l e
J u m l a h Total
2011 2012 2011 2012 2011 2012
(1) (2) (3) (4) (5) (6) (7)
0 - 4 140 965 143 476 132 952 135 328 273 917 278 804
5 - 9 141 158 143 645 132 359 134 681 273 517 278 326
10 - 14 129 266 131 504 121 412 123 516 250 678 255 020
15 - 19 109 733 111 751 108 191 110 188 217 924 221 939
20 - 24 98 063 100 027 103 689 105 717 201 752 205 744
25 - 29 98 919 100 854 102 749 104 697 201 668 205 551
30 - 34 86 854 88 543 88 345 90 016 175 199 178 559
35 - 39 82 362 83 933 82 406 83 939 164 768 167 872
40 - 44 68 594 69 888 65 715 66 931 134 309 136 819
45 - 49 52 707 53 699 51,992 52 927 104 699 106 626
50 - 54 42 628 43 405 43 333 44 096 85 961 87 501
55 - 59 31 416 31 986 28 402 28 891 59 818 60 877
60+ 61 488 62 514 71 322 72 448 132 810 134 962
Jumlah/Total 1 144 153 1 165 225 1 132 867 1 153 375 2 277 020 2 318 600
Tabel 3.1.5
Penduduk Sulawesi Tenggara menurut Kelompok Umur dan Jenis
Kelamin, 2011 dan 2012
Table Population of Sulawesi Tenggara Province by Age Group and Sex, 2011
and 2012
[Diolah dari Hasil Sensus Penduduk (SP) dan Proyeksi Penduduk, BPS/Based on Population Census and Projection of Population, BPS-Statistics Indonesia]
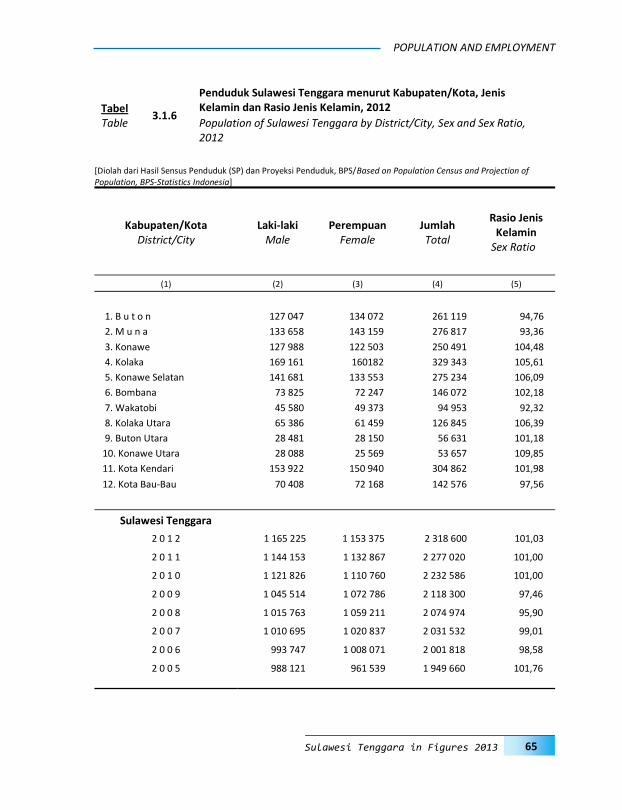
POPULATION AND EMPLOYMENT
65 Sulawesi Tenggara in Figures 2013
Kabupaten/Kota District/City
Laki-laki Male
Perempuan Female
Jumlah Total
Rasio Jenis Kelamin
Sex Ratio
(1) (2) (3) (4) (5)
1. B u t o n 127 047 134 072 261 119 94,76
2. M u n a 133 658 143 159 276 817 93,36
3. Konawe 127 988 122 503 250 491 104,48
4. Kolaka 169 161 160182 329 343 105,61
5. Konawe Selatan 141 681 133 553 275 234 106,09
6. Bombana 73 825 72 247 146 072 102,18
7. Wakatobi 45 580 49 373 94 953 92,32
8. Kolaka Utara 65 386 61 459 126 845 106,39
9. Buton Utara 28 481 28 150 56 631 101,18
10. Konawe Utara 28 088 25 569 53 657 109,85
11. Kota Kendari 153 922 150 940 304 862 101,98
12. Kota Bau-Bau 70 408 72 168 142 576 97,56
Sulawesi Tenggara
2 0 1 2 1 165 225 1 153 375 2 318 600 101,03
2 0 1 1 1 144 153 1 132 867 2 277 020 101,00
2 0 1 0 1 121 826 1 110 760 2 232 586 101,00
2 0 0 9 1 045 514 1 072 786 2 118 300 97,46
2 0 0 8 1 015 763 1 059 211 2 074 974 95,90
2 0 0 7 1 010 695 1 020 837 2 031 532 99,01
2 0 0 6 993 747 1 008 071 2 001 818 98,58
2 0 0 5 988 121 961 539 1 949 660 101,76
3.1.6
Penduduk Sulawesi Tenggara menurut Kabupaten/Kota, Jenis Kelamin dan Rasio Jenis Kelamin, 2012 Tabel
Table Population of Sulawesi Tenggara by District/City, Sex and Sex Ratio, 2012
[Diolah dari Hasil Sensus Penduduk (SP) dan Proyeksi Penduduk, BPS/Based on Population Census and Projection of Population, BPS-Statistics Indonesia]

PENDUDUK DAN KETENAGAKERJAAN
66 Sulawesi Tenggara Dalam Angka 2013
Kabupaten/Kota Penduduk Rumahtangga Penduduk Per
District/City Population Household Rumahtangga
Population Per
Household
(1) (2) (3) (4)
1. B u t o n 261 119 57 179 4,6
2. M u n a 276 817 63 391 4,4
3. K o n a w e 250 491 56 545 4,4
4. Kolaka 329 343 74 636 4,4
5. Konawe Selatan 275 234 67 256 4,1
6.. Bombana 146 072 33 568 4,4
7. Wakatobi 94 953 24 664 3,8
8. Kolaka Utara 126 845 28 145 4,5
9. Buton Utara 56 631 12 643 4,5
10.Konawe Utara 53 657 11 789 4,6
11.Kota Kendari 304 862 67 561 4,5
12.Kota Bau-Bau 142 576 31 900 4,5
Sulawesi Tenggara
2 0 1 2 2 318 600 529 277 4.4
2 0 1 1 2 277 020 512 120 4.4
2 0 1 0 2 232 586 502 066 4.4
2 0 0 9 2 118 300 529 972 4.0
2 0 0 8 2 074 974 503 518 4.1
2 0 0 7 2 031 532 452 528 4.5
2 0 0 6 2 001 818 466 440 4.3
3.1.7
Banyaknya Rumahtangga dan Penduduk Sulawesi Tenggara Menurut
Kabupaten/Kota, 2012 Tabel
Table Number of Households and Population of Sulawesi Tenggara by District/
City, 2012
[Diolah dari Hasil Sensus Penduduk (SP) dan Proyeksi Penduduk, BPS/Based on Population Census and Projection of Population, BPS-Statistics Indonesia]
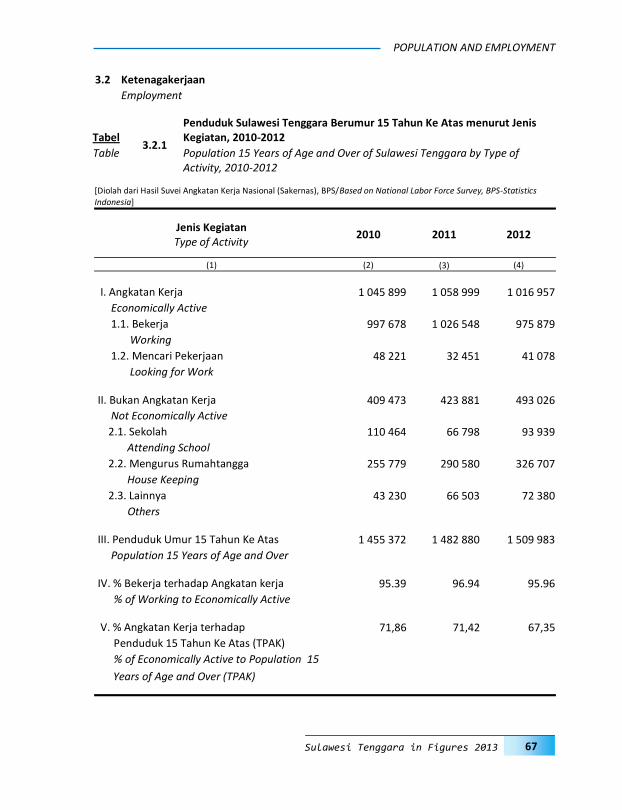
POPULATION AND EMPLOYMENT
67 Sulawesi Tenggara in Figures 2013
Jenis Kegiatan Type of Activity
2010 2011 2012
(1) (2) (3) (4)
I. Angkatan Kerja 1 045 899 1 058 999 1 016 957
Economically Active
1.1. Bekerja 997 678 1 026 548 975 879
Working
1.2. Mencari Pekerjaan 48 221 32 451 41 078
Looking for Work
II. Bukan Angkatan Kerja 409 473 423 881 493 026
Not Economically Active
2.1. Sekolah 110 464 66 798 93 939
Attending School
2.2. Mengurus Rumahtangga 255 779 290 580 326 707
House Keeping
2.3. Lainnya 43 230 66 503 72 380
Others
III. Penduduk Umur 15 Tahun Ke Atas 1 455 372 1 482 880 1 509 983
Population 15 Years of Age and Over
IV. % Bekerja terhadap Angkatan kerja 95.39 96.94 95.96
% of Working to Economically Active
V. % Angkatan Kerja terhadap 71,86 71,42 67,35
Penduduk 15 Tahun Ke Atas (TPAK)
% of Economically Active to Population 15
Years of Age and Over (TPAK)
Tabel 3.2.1
Penduduk Sulawesi Tenggara Berumur 15 Tahun Ke Atas menurut Jenis Kegiatan, 2010-2012
Table Population 15 Years of Age and Over of Sulawesi Tenggara by Type of Activity, 2010-2012
3.2 Ketenagakerjaan
Employment
[Diolah dari Hasil Suvei Angkatan Kerja Nasional (Sakernas), BPS/Based on National Labor Force Survey, BPS-Statistics Indonesia]

PENDUDUK DAN KETENAGAKERJAAN
68 Sulawesi Tenggara Dalam Angka 2013
Tabel 3.2.2
Penduduk Sulawesi Tenggara Berumur 15 Tahun Ke Atas menurut Jenis Kegiatan dan Jenis Kelamin 2012
Table Population 15 Years of Age and Over of Sulawesi Tenggara by Type of Activity and Sex, 2012
Jenis Kegiatan Laki-Laki Perempuan Jumlah
Type of Activity Male Female Total
(1) (2) (3) (4)
I. Angkatan Kerja 623 096 393 861 1 016 957
Economically Active
1.1. Bekerja 605 925 369 954 975 879
Working
1.2. Mencari Pekerjaan 17 171 23 907 41 078
Looking for Work
II. Bukan Angkatan Kerja 125 133 367 893 493 026
Not Economically Active
2.1. Sekolah 44 621 49 318 93 939
Attending School
2.2. Mengurus Rumahtangga 32 752 293 955 326 707
House Keeping
2.3. Lainnya 47 760 24 620 72 380
Others
III. Penduduk Umur 15 Tahun Ke Atas 748 229 761 754 1 509 983
Population 15 Years of Age and Over
IV. % Bekerja terhadap Angkatan kerja 97.24 93.93 95.96
% of Working to Economically Active
V. % Angkatan Kerja terhadap 83.28 51.70 67.35
Penduduk 15 Tahun Ke Atas (TPAK)
% of Economically Active to Population
15 Years of Age and Over (TPAK)
[Diolah dari Hasil Suvei Angkatan Kerja Nasional (Sakernas), BPS/Based on National Labor Force Survey, BPS-Statistics Indonesia]
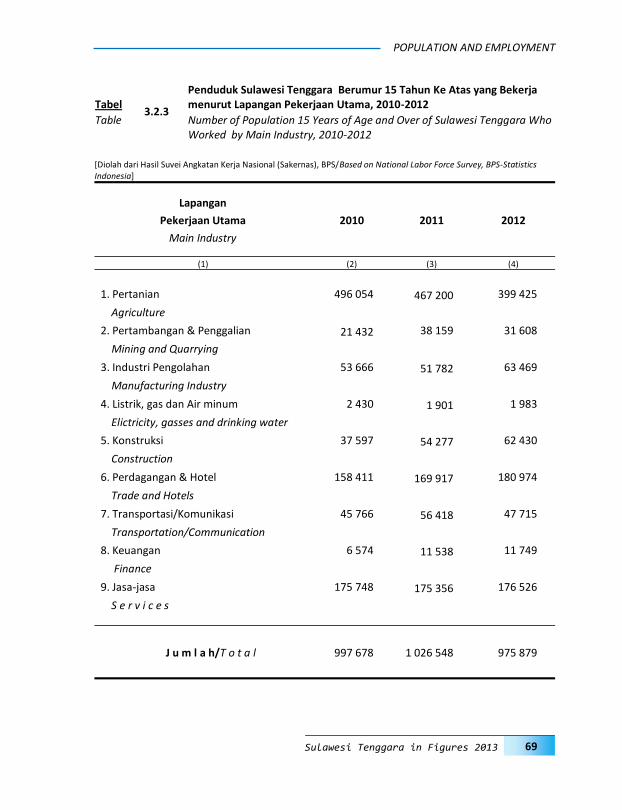
POPULATION AND EMPLOYMENT
69 Sulawesi Tenggara in Figures 2013
Lapangan
Pekerjaan Utama 2010 2011 2012
Main Industry
(1) (2) (3) (4)
1. Pertanian 496 054 467 200 399 425
Agriculture
2. Pertambangan & Penggalian 21 432 38 159 31 608
Mining and Quarrying
3. Industri Pengolahan 53 666 51 782 63 469
Manufacturing Industry
4. Listrik, gas dan Air minum 2 430 1 901 1 983
Elictricity, gasses and drinking water
5. Konstruksi 37 597 54 277 62 430
Construction
6. Perdagangan & Hotel 158 411 169 917 180 974
Trade and Hotels
7. Transportasi/Komunikasi 45 766 56 418 47 715
Transportation/Communication
8. Keuangan 6 574 11 538 11 749
Finance
9. Jasa-jasa 175 748 175 356 176 526
S e r v i c e s
J u m l a h/T o t a l 997 678 1 026 548 975 879
Tabel Penduduk Sulawesi Tenggara Berumur 15 Tahun Ke Atas yang Bekerja menurut Lapangan Pekerjaan Utama, 2010-2012
3.2.3 Table Number of Population 15 Years of Age and Over of Sulawesi Tenggara Who
Worked by Main Industry, 2010-2012
[Diolah dari Hasil Suvei Angkatan Kerja Nasional (Sakernas), BPS/Based on National Labor Force Survey, BPS-Statistics Indonesia]

PENDUDUK DAN KETENAGAKERJAAN
70 Sulawesi Tenggara Dalam Angka 2013
Lapangan
Pekerjaan Utama 2010 2011 2012
Main Industry
(1) (3) (4) (4)
1. Pertanian 49.72 45.51 40.93
Agriculture
2. Pertambangan & Penggalian 2.15 3.72 3.24
Mining and Quarrying
3. Industri Pengolahan 5.38 5.04 6.50
Manufacturing Industry
4. Listrik, gas dan Air minum 0.24 0.19 0.20
Elictricity, gasses and drinking water
5. Konstruksi 3.77 5.29 6.40
Construction
6. Perdagangan & Hotel 15.88 16.55 18.54
Trade and Hotels
7. Transportasi/Komunikasi 4.59 5.50 4.89
Transportation/Communication
8. Keuangan 0.66 1.12 1.20
Finance
9. Jasa-jasa 17.62 17.08 18.09
S e r v i c e s
J u m l a h/T o t a l 100.00 100.00 100.00
Tabel Persentase Penduduk Sulawesi Tenggara Berumur 15 Tahun Ke Atas yang Bekerja menurut Lapangan Pekerjaan Utama, 2010-2012
3.2.4 Table Percentage of Population 15 Years of Age and Over of Sulawesi Tenggara
Who Worked by Main Industry, 2010-2011
[Diolah dari Hasil Suvei Angkatan Kerja Nasional (Sakernas), BPS/Based on National Labor Force Survey, BPS-Statistics Indonesia]

POPULATION AND EMPLOYMENT
71 Sulawesi Tenggara in Figures 2013
Lapangan
Pekerjaan Utama Laki-laki Perempuan Total
Main Industry Male Female Total
(1) (3) (4) (4)
1. Pertanian 252 664 146 761 399 425
Agriculture
2. Pertambangan & Penggalian 27 118 4 490 31 608
Mining and Quarrying
3. Industri Pengolahan 35 466 28 003 63 469
Manufacturing Industry
4. Listrik, gas dan Air minum 1 818 165 1 983
Elictricity, gasses and drinking water
5. Konstruksi 59 773 2 657 62 430
Construction
6. Perdagangan & Hotel 73 435 107 539 180 974
Trade and Hotels
7. Transportasi/Komunikasi 46 917 798 47 715
Transportation/Communication
8. Keuangan 8 369 3 380 11 749
Finance
9. Jasa-jasa 100 365 76 161 176 526
S e r v i c e s
J u m l a h/T o t a l 605 925 369 954 975 879
3.2.5
Penduduk Sulawesi Tenggara Berumur 15 Tahun Ke Atas yang Bekerja menurut Lapangan Usaha dan Jenis Kelamin, 2012 Tabel
Table Number of Population 15 Years of Age and Over of Sulawesi Tenggara Who Worked by Main Industry and Sex, 2012
[Diolah dari Hasil Suvei Angkatan Kerja Nasional (Sakernas), BPS/Based on National Labor Force Survey, BPS-Statistics Indonesia]

PENDUDUK DAN KETENAGAKERJAAN
72 Sulawesi Tenggara Dalam Angka 2013
Pendidikan Tertinggi Yang Ditamatkan Laki-Laki Perempuan Jumlah
Educational Attainment Male Female Total
(1) (2) (3) (4)
1. Tidak/Belum Tamat SD 1 277 1 156 2 433
Did Not Complete/Have Not Yet Completed
Primary School
2. Sekolah Dasar 1 742 1 934 3 676
Primary School
3. SLTP 2 488 2 477 4 965
Junior High School
4. SMTA Umum 6 712 8 728 15 440
Senior High School (General)
5. SMTA Kejuruan 2 149 2 672 4 821
Senior High School (Vocational)
6. Diploma / Universitas 2 803 6 940 9 743
Diploma / University
J u m l a h/T o t a l 17 171 23 907 41 078
3.2.6
Penduduk Sulawesi Tenggara Berumur 15 Tahun Ke Atas yang Mencari Pekerjaan menurut Pendidikan Tertinggi yang Ditamatkan dan Jenis Kelamin Tabel
Table Population 15 Years of Age and Over of Sulawesi Tenggara Looking For Work by Educational Attainment and Sex, 2012
[Diolah dari Hasil Suvei Angkatan Kerja Nasional (Sakernas), BPS/Based on National Labor Force Survey, BPS-Statistics Indonesia]

POPULATION AND EMPLOYMENT
73 Sulawesi Tenggara in Figures 2013
Pendidikan Tertinggi Yang Ditamatkan Laki-Laki Perempuan Jumlah
Educational Attainment Male Female Total
(1) (2) (3) (4)
1. Tidak/Belum Tamat SD 114 204 93 152 207 356
Did Not Complete/Have Not Yet Completed
Primary School
2. Sekolah Dasar 151 333 86 527 237 860
Primary School
3. SLTP 113 268 62 972 176 240
Junior High School
4. SMTA Umum 133 485 56 147 189 632
Senior High School (General)
5. SMTA Kejuruan 32 316 14 213 46 529
Senior High School (Vocational)
6. Diploma / Universitas 61 319 56 943 118 262
Diploma / University
J u m l a h/T o t a l 605 925 369 954 975 879
3.2.7
Penduduk Sulawesi Tenggara Berumur 15 Tahun Ke Atas yang Bekerja menurut Pendidikan Tertinggi yang Ditamatkan dan Jenis Kelamin, 2012 Tabel
Table Population 15 Years of Age and Over of Sulawesi Tenggara Who worked by Educational Attainment and Sex, 2012
[Diolah dari Hasil Suvei Angkatan Kerja Nasional (Sakernas), BPS/Based on National Labor Force Survey, BPS-Statistics Indonesia]
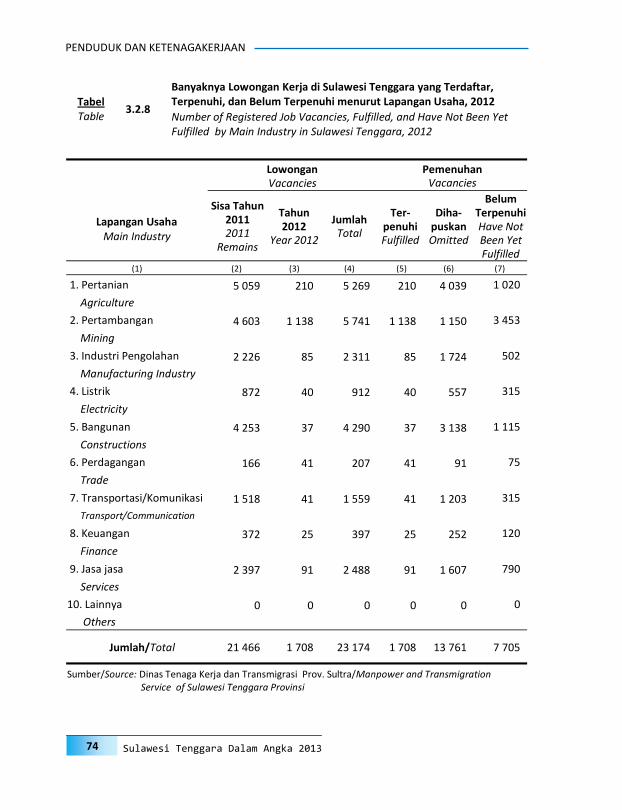
PENDUDUK DAN KETENAGAKERJAAN
74 Sulawesi Tenggara Dalam Angka 2013
Lapangan Usaha
Lowongan Vacancies
Pemenuhan Vacancies
Sisa Tahun 2011 2011
Remains
Tahun 2012
Year 2012
Jumlah Total
Ter-penuhi Fulfilled
Diha-puskan Omitted
Belum Terpenuhi Have Not Been Yet Fulfilled
Main Industry
(1) (2) (3) (4) (5) (6) (7)
1. Pertanian 5 059 210 5 269 210 4 039 1 020
Agriculture
2. Pertambangan 4 603 1 138 5 741 1 138 1 150 3 453
Mining
3. Industri Pengolahan 2 226 85 2 311 85 1 724 502
Manufacturing Industry
4. Listrik 872 40 912 40 557 315
Electricity
5. Bangunan 4 253 37 4 290 37 3 138 1 115
Constructions
6. Perdagangan 166 41 207 41 91 75
Trade
7. Transportasi/Komunikasi 1 518 41 1 559 41 1 203 315
Transport/Communication
8. Keuangan 372 25 397 25 252 120
Finance
9. Jasa jasa 2 397 91 2 488 91 1 607 790
Services
10. Lainnya 0 0 0 0 0 0
Others
Jumlah/Total 21 466 1 708 23 174 1 708 13 761 7 705
Sumber/Source: Dinas Tenaga Kerja dan Transmigrasi Prov. Sultra/Manpower and Transmigration Service of Sulawesi Tenggara Provinsi
3.2.8
Banyaknya Lowongan Kerja di Sulawesi Tenggara yang Terdaftar, Terpenuhi, dan Belum Terpenuhi menurut Lapangan Usaha, 2012 Tabel
Table Number of Registered Job Vacancies, Fulfilled, and Have Not Been Yet Fulfilled by Main Industry in Sulawesi Tenggara, 2012

POPULATION AND EMPLOYMENT
75 Sulawesi Tenggara in Figures 2013
Tingkat Sisa Terdaftar Di- Di- Belum Di-
Pendidikan Tahun Tahun Jumlah tempatkan hapuskan Tempatkan
Educational 2011 2012 Total 2012 2012 2012
Level 2011 Remain
Year
2012 Registered
Year
Placed 2012
Omitted Have Not Yet Been
Placed 2012 (1) (2) (3) (4) (5) (6) (7)
1. Sekolah Dasar 420 52 472 106 63 303
Primary School
2. S L T P 645 108 753 90 96 567
Junior High School
3. S M T A 24 370 3 610 27 980 887 3 853 23 240
Senior High School
4. Sarjana Muda 9 732 1 661 11 393 446 1 078 9 869
Bachelor of Art
5. S a r j a n a 19 274 1 878 21 152 178 1 289 19 685
Bachelor
6. S2 96 20 116 1 1 114
Master Degree
Jumlah/Total 54 537 7 329 61 866 1 708 6 380 53 778
Sumber/Source: Dinas Tenaga Kerja dan Transmigrasi Prov. Sultra/Manpower and Transmigration Service of Sulawesi Tenggara Province
Tabel Banyaknya Pencari Kerja di Sulawesi Tenggara yang Terdaftar, Ditempatkan dan Dihapuskan menurut Tingkat Pendidikan 2012
3.2.9 Table Number of Registered Job Vacancies, Fulfilled, and Have Not Been Yet
Fulfilled by education in Sulawesi Tenggara, 2012,
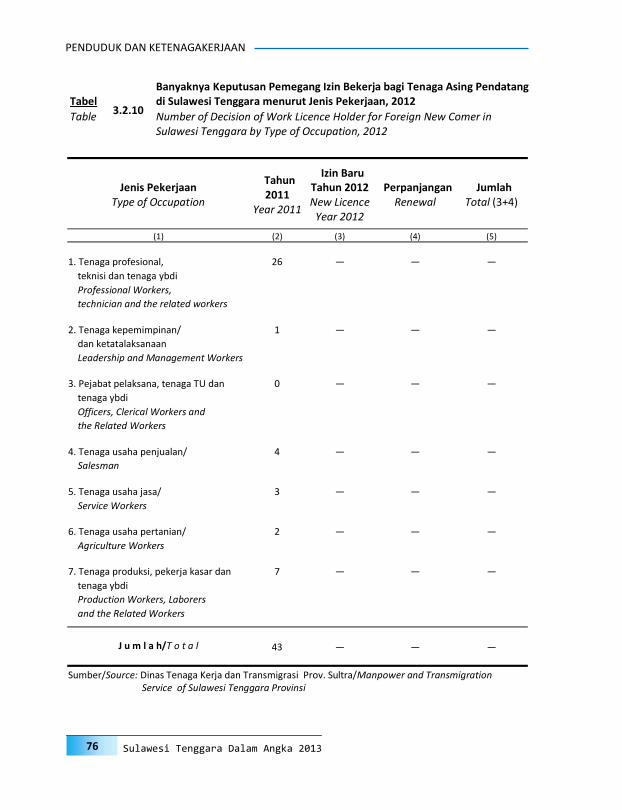
PENDUDUK DAN KETENAGAKERJAAN
76 Sulawesi Tenggara Dalam Angka 2013
Jenis Pekerjaan Type of Occupation
Tahun 2011
Year 2011
Izin Baru Tahun 2012 New Licence
Year 2012
Perpanjangan Renewal
Jumlah Total (3+4)
(1) (2) (3) (4) (5)
1. Tenaga profesional, 26 — — —
teknisi dan tenaga ybdi
Professional Workers,
technician and the related workers
2. Tenaga kepemimpinan/ 1 — — —
dan ketatalaksanaan
Leadership and Management Workers
3. Pejabat pelaksana, tenaga TU dan 0 — — —
tenaga ybdi
Officers, Clerical Workers and
the Related Workers
4. Tenaga usaha penjualan/ 4 — — —
Salesman
5. Tenaga usaha jasa/ 3 — — —
Service Workers
6. Tenaga usaha pertanian/ 2 — — —
Agriculture Workers
7. Tenaga produksi, pekerja kasar dan 7 — — —
tenaga ybdi
Production Workers, Laborers
and the Related Workers
J u m l a h/T o t a l 43 — — —
Sumber/Source: Dinas Tenaga Kerja dan Transmigrasi Prov. Sultra/Manpower and Transmigration Service of Sulawesi Tenggara Provinsi
Tabel Banyaknya Keputusan Pemegang Izin Bekerja bagi Tenaga Asing Pendatang di Sulawesi Tenggara menurut Jenis Pekerjaan, 2012
3.2.10 Table Number of Decision of Work Licence Holder for Foreign New Comer in
Sulawesi Tenggara by Type of Occupation, 2012

POPULATION AND EMPLOYMENT
77 Sulawesi Tenggara in Figures 2013
Lapangan Usaha Main Industry
Tahun 2012 Year
Izin Baru Tahun 2012 New Licence
Year 2012
Perpanjangan Renewal
Jumlah Total (3+4)
(1) (2) (3) (4) (5)
1. Industri Pengolahan 6 0 5 11
Manufacturing Industry
2. Bangunan 0 0 0 0
Construction
3. Perdagangan 3 0 2 5
Trade
4. Transportasi/Komunikasi 0 0 0 0
Transportation/ Communication
5. Keuangan 0 0 0 0
Finance
6. Jasa -jasa 10 0 10 20
Services
7. Pertanian 0 0 0 0
Agriculture
J u m l a h/T o t a l 13 0 12 25
Sumber/Source: Dinas Tenaga Kerja dan Transmigrasi Prov. Sultra/Manpower and Transmigration Service of Sulawesi Tenggara Provinsi
Tabel Banyaknya Keputusan Pemegang Izin Bekerja bagi Tenaga Asing Pendatang di Sulawesi Tenggara menurut Lapangan Usaha, 2012
3.2.11 Table Number of Decision of Work Licence Holder for Foreign New Comer in
Sulawesi Tenggara by Main Industry, 2012

PENDUDUK DAN KETENAGAKERJAAN
78 Sulawesi Tenggara Dalam Angka 2013
Kebangsaan Nationality
Instansi Pemerintah Government Institution
Perusahaan Swasta Private
Company
Jumlah Total
(1) (2) (3) (4)
1. Amerika/Inggris 0 0 0
USA/U.K.
2. J e p a n g 0 3 3
J a p a n
3. M e s i r 0 0 0
E g y p t
4. K a n a d a 0 0 0
C a n a d a
5. Malaysia 0 1 1
Malaysia
6. Selandia Baru 0 0 0
New Zealand
7. T a i w a n 0 0 0
T a i w a n
8. Cina 0 13 13
China
9. Perancis 0 0 0
France
10. Singapura 0 0 0
Singapore
11. Swiss 0 0 0
Swiss
12. Belanda 0 0 0
Netherland
3.2.12
Banyaknya Tenaga Asing Pemegang Visa Bekerja dalam Rangka PMA/PMDN menurut Kebangsaan, Instansi Pemerintah dan Perusahaan Swasta, 2012 Tabel
Table Number of Foreign Visa Bearer Working on Foreign/Domestic Investment by Nationality, Government, and Private Institution, 2012

POPULATION AND EMPLOYMENT
79 Sulawesi Tenggara in Figures 2013
Kebangsaan Nationality
Instansi Pemerintah Government Institution
Perusahaan Swasta Private
Company
Jumlah Total
(1) (2) (3) (4)
13. Belgia 0 0 0
Belgium
14. Finlandia 0 0 0
Finland
15. Australia 0 0 0
Australia
16. Filipina 0 0 0
Philipine
17. India 0 2 2
India
18. Korea Selatan 0 0 0
South Korea
19. Italia 0 0 0
Italy
20. Portugal 0 0 0
Portugal
J u m l a h/T o t a l
2 0 1 2 0 19 19
2 0 1 1 19 43 43
2 0 1 0 109 38 38
2 0 0 9 96 109 109
2 0 0 8 21 96 113
2 0 0 7 30 21 19
Sumber/Source: Dinas Tenaga Kerja dan Transmigrasi Prov. Sultra/Manpower and Transmigration Service of Sulawesi Tenggara Provinsi
Lanjutan Tabel / Continued Table 3.2.12
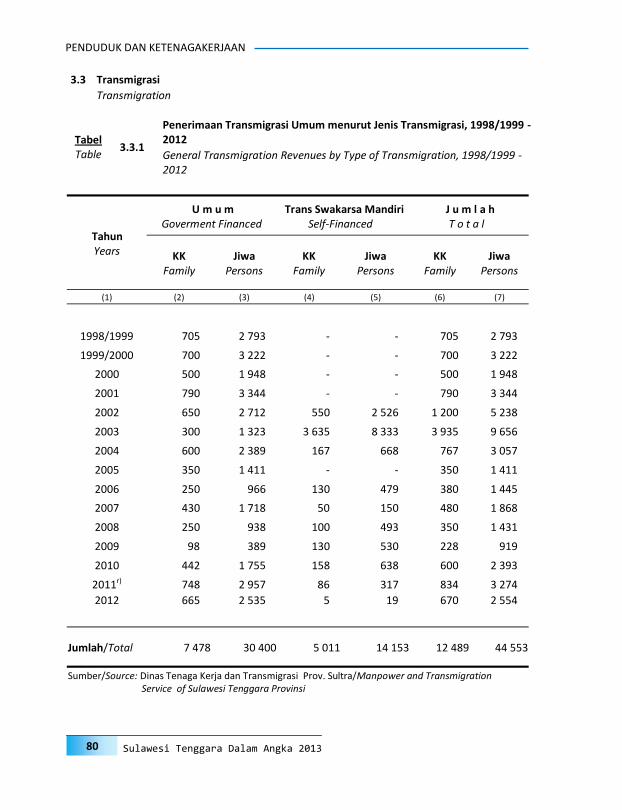
PENDUDUK DAN KETENAGAKERJAAN
80 Sulawesi Tenggara Dalam Angka 2013
Tahun Years
U m u m Goverment Financed
Trans Swakarsa Mandiri Self-Financed
J u m l a h T o t a l
KK Family
Jiwa Persons
KK Family
Jiwa Persons
KK Family
Jiwa Persons
(1) (2) (3) (4) (5) (6) (7)
1998/1999 705 2 793 - - 705 2 793
1999/2000 700 3 222 - - 700 3 222
2000 500 1 948 - - 500 1 948
2001 790 3 344 - - 790 3 344
2002 650 2 712 550 2 526 1 200 5 238
2003 300 1 323 3 635 8 333 3 935 9 656
2004 600 2 389 167 668 767 3 057
2005 350 1 411 - - 350 1 411
2006 250 966 130 479 380 1 445
2007 430 1 718 50 150 480 1 868
2008 250 938 100 493 350 1 431
2009 98 389 130 530 228 919
2010 442 1 755 158 638 600 2 393
2011r) 748 2 957 86 317 834 3 274
2012 665 2 535 5 19 670 2 554
Jumlah/Total 7 478 30 400 5 011 14 153 12 489 44 553
Sumber/Source: Dinas Tenaga Kerja dan Transmigrasi Prov. Sultra/Manpower and Transmigration Service of Sulawesi Tenggara Provinsi
3.3.1
Penerimaan Transmigrasi Umum menurut Jenis Transmigrasi, 1998/1999 - 2012 Tabel
Table General Transmigration Revenues by Type of Transmigration, 1998/1999 - 2012
3.3 Transmigrasi
Transmigration
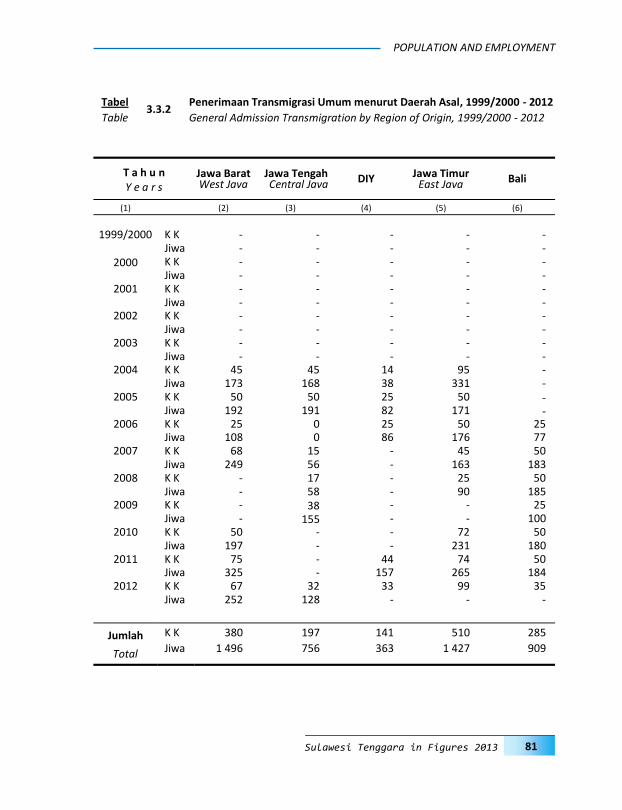
POPULATION AND EMPLOYMENT
81 Sulawesi Tenggara in Figures 2013
Jawa Barat West Java
Jawa Tengah Central Java DIY Jawa Timur
East Java Bali T a h u n Y e a r s
(1) (2) (3) (4) (5) (6)
1999/2000 K K - - - - -
Jiwa - - - - - 2000 K K - - - - -
Jiwa - - - - - 2001 K K - - - - -
Jiwa - - - - - 2002 K K - - - - -
Jiwa - - - - - 2003 K K - - - - -
Jiwa - - - - - 2004 K K 45 45 14 95 -
Jiwa 173 168 38 331 - 2005 K K 50 50 25 50 -
Jiwa 192 191 82 171 - 2006 K K 25 0 25 50 25
Jiwa 108 0 86 176 77 2007 K K 68 15 - 45 50
Jiwa 249 56 - 163 183 2008 K K - 17 - 25 50
Jiwa - 58 - 90 185 2009 K K - 38 - - 25
Jiwa - 155 - - 100 2010 K K 50 - - 72 50
Jiwa 197 - - 231 180 2011 K K 75 - 44 74 50
Jiwa 325 - 157 265 184 2012 K K 67 32 33 99 35
Jiwa 252 128 - - -
Jumlah
Total
K K 380 197 141 510 285
Jiwa 1 496 756 363 1 427 909
Tabel Penerimaan Transmigrasi Umum menurut Daerah Asal, 1999/2000 - 2012 3.3.2
Table General Admission Transmigration by Region of Origin, 1999/2000 - 2012

PENDUDUK DAN KETENAGAKERJAAN
82 Sulawesi Tenggara Dalam Angka 2013
T a h u n Y e a r s
NTB Dili DKI APPDT Jumlah Total
(1) (7) (8) (9) (10) (11)
1999/2000 K K 0 0 0 700 700 Jiwa 0 0 0 3 222 3 222
2000 K K 0 0 0 500 500
Jiwa 0 0 0 2 325 2 325 2001 K K 0 0 0 790 790
Jiwa 0 0 0 3 344 3 344 2002 K K 0 0 0 650 650
Jiwa 0 0 0 2 712 2 712 2003 K K 0 0 0 300 300
Jiwa 0 0 0 1 323 1 323 2004 K K 0 0 0 401 600
Jiwa 0 0 0 1 679 2 389 2005 K K 0 0 0 175 350
Jiwa 0 0 0 775 1 411 2006 K K 0 0 0 125 250
Jiwa 0 0 0 519 966 2007 K K 0 0 0 252 430
Jiwa 0 0 0 1 067 1 718 2008 K K 26 0 0 132 250
Jiwa 93 0 0 512 938 2009 K K 0 0 23 50 136
Jiwa 0 0 105 199 559 2010 K K 25 17 17 311 542
Jiwa 91 60 60 1 414 2 233 2011 K K 50 0 37 448 778
Jiwa 176 0 114 1 913 3 134 2012 K K 0 0 0 0 266
Jiwa 0 0 0 0 380
Jumlah K K 101 17 77 4 834 6 542 Total Jiwa 360 60 279 21 004 26 654
Lanjutan Tabel / Continued Table 3.3.2
Sumber/Source: Dinas Tenaga Kerja dan Transmigrasi Prov. Sultra/Manpower and Transmigration Service of Sulawesi Tenggara Provinsi
Catatan/Note : APPDT = Alokasi Penempatan Pemukiman Daerah Transmigrasi /Allocation of Transmi-gration Region Placement KK = Kepala Keluarga/Family Jiwa = Person

POPULATION AND EMPLOYMENT
83 Sulawesi Tenggara in Figures 2013
T a h u n Y e a r s
KK/Jiwa Head of
Household /Person
Daerah Penempatan District of Placement
Buton M u n a Konawe Kolaka Kota Kendari
(1) (2) (3) (4) (5) (6) (7)
2000 K K 250 100 113 --- ---
Jiwa 1 388 374 415 --- ---
2001 K K 210 100 140 250 ---
Jiwa 1 146 367 558 918 ---
2002 K K 200 150 100 150 50
Jiwa 802 665 418 601 226
2003 K K 0 300 0 -- 0
Jiwa 0 1 323 0 -- 0
2004 K K 100 250 -- -- --
Jiwa 454 970 -- -- --
2005 K K -- 100 -- -- --
Jiwa -- 396 -- -- --
2006 K K -- -- -- -- --
Jiwa -- -- -- --
2007 K K -- 150 150 -- 50
Jiwa -- 659 561 -- 190
2008 K K -- -- 150 -- --
Jiwa -- -- 563 -- --
2009 K K -- -- 48 -- --
Jiwa -- -- 194 -- --
2010 K K -- 300 -- -- --
Jiwa -- 1 222 -- -- --
2011 K K -- 106 100 -- --
Jiwa -- 426 375 -- --
2012 K K -- -- -- -- --
Jiwa -- -- -- -- --
Sumber/Source: Dinas Tenaga Kerja dan Transmigrasi Prov. Sultra/Manpower and Transmigration Service of Sulawesi Tenggara Provinsi
Tabel 3.3.3
Penerimaan Transmigrasi Umum menurut Daerah Penempatan, 2000 - 2012
Table General Admission of Transmigration by Placement Region, 2000 - 2012
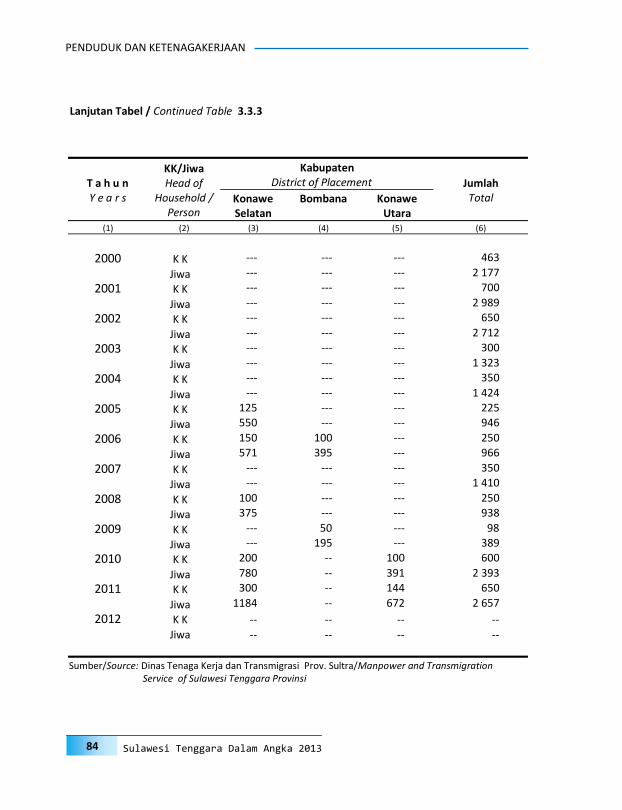
PENDUDUK DAN KETENAGAKERJAAN
84 Sulawesi Tenggara Dalam Angka 2013
T a h u n Y e a r s
KK/Jiwa Head of
Household /Person
Kabupaten District of Placement Jumlah
Total Konawe Selatan
Bombana Konawe Utara
(1) (2) (3) (4) (5) (6)
2000 K K --- --- --- 463
Jiwa --- --- --- 2 177
2001 K K --- --- --- 700
Jiwa --- --- --- 2 989
2002 K K --- --- --- 650
Jiwa --- --- --- 2 712
2003 K K --- --- --- 300
Jiwa --- --- --- 1 323
2004 K K --- --- --- 350
Jiwa --- --- --- 1 424
2005 K K 125 --- --- 225
Jiwa 550 --- --- 946
2006 K K 150 100 --- 250
Jiwa 571 395 --- 966
2007 K K --- --- --- 350
Jiwa --- --- --- 1 410
2008 K K 100 --- --- 250
Jiwa 375 --- --- 938
2009 K K --- 50 --- 98
Jiwa --- 195 --- 389
2010 K K 200 -- 100 600
Jiwa 780 -- 391 2 393
2011 K K 300 -- 144 650
Jiwa 1184 -- 672 2 657
2012 K K -- -- -- --
Jiwa -- -- -- --
Sumber/Source: Dinas Tenaga Kerja dan Transmigrasi Prov. Sultra/Manpower and Transmigration Service of Sulawesi Tenggara Provinsi
Lanjutan Tabel / Continued Table 3.3.3

POPULATION AND EMPLOYMENT
85 Sulawesi Tenggara in Figures 2013
T a h u n Y e a r s
KK/Jiwa Head of
Household/ person
Kabupaten District of Placement
Jumlah Total
Buton Muna Konawe Kolaka Bau-Bau
(1) (2) (3) (4) (5) (6) (7) (8)
2000 K K 0 0 0 0 0 0 Jiwa 0 0 0 0 0 0
2001 K K 0 0 0 0 0 0 Jiwa 0 0 0 0 0 0
2002 K K 300 250 0 0 0 550 Jiwa 1 515 1 011 0 0 0 2 526
2003 K K 450 286 0 0 0 736 Jiwa 1 924 1 178 0 0 0 3 102
2004 K K 0 0 0 0 167 167 Jiwa 0 0 0 0 668 668
2005 K K 0 0 0 0 0 0 Jiwa 0 0 0 0 0 0
2006 K K 0 0 0 0 0 0 Jiwa 0 0 0 0 0 0
2007 K K 0 0 0 0 0 0 Jiwa 0 0 0 0 0 0
2008 K K 0 0 0 100 0 100 Jiwa 0 0 0 493 0 493
2009 K K 0 66 0 64 0 130 Jiwa 0 257 0 237 0 494
2010 K K 0 158 0 0 0 158 Jiwa 0 638 0 0 0 638
2011 K K 0 78 0 0 0 78 Jiwa 0 285 0 0 0 285
2012 K K 0 5 0 0 0 5 Jiwa 0 19 0 0 0 19
Sumber/Source: Dinas Tenaga Kerja dan Transmigrasi Prov. Sultra/Manpower and Transmigration Service of Sulawesi Tenggara Provinsi
Tabel 3.3.4
Penerimaan Transmigrasi Swakarsa menurut Daerah Penempatan, 2000 - 2012
Table General Transmigration Revenues by Placement Region, 2000 - 2012

PENDUDUK DAN KETENAGAKERJAAN
86 Sulawesi Tenggara Dalam Angka 2013
T a h u n Y e a r s
T U N P S T U P S SPONTAN/
Spontaneous Jumlah Total
KK/ Family
Jiwa/Person
KK/ Family
Jiwa/Person
KK/ Family
Jiwa/Person
KK/ Family
Jiwa/Person
(1) (2) (3) (4) (5) (6) (7) (8) (9)
2000 500 2 325 -- -- -- -- 500 2 325
2001 720 2 999 -- -- -- -- 720 2 999
2002 1 200 5 238 -- -- -- -- 1 200 5 238
2003 1 133 4 858 -- -- -- -- 1 133 4 858
2004 767 3 067 -- -- -- -- 767 3 067
2005 350 1 411 -- -- -- -- 350 1 411
2006 380 1 445 -- -- -- -- 380 1 445
2007 430 1 868 -- -- -- -- 430 1 868
2008 350 1 431 -- -- -- -- 350 1 431
2009 230 934 -- -- -- -- 230 934
2010 600 2 393 -- -- -- -- 600 2 393
2011 828 3 315 -- -- -- -- 828 3 315
2012 0 0 -- -- -- -- 0 0
Jumlah / Total
16 663 68 477 -- -- -- -- 16 663 68 477
Sumber/Source: Dinas Tenaga Kerja dan Transmigrasi Prov. Sultra/Manpower and Transmigration Service of Sulawesi Tenggara Provinsi
Tabel 3.3.5 Penerimaan Transmigrasi menurut Jenis Transmigrasi , 2000-2012
Table Transmigration Admission by Type of Transmigration, 2000 - 2012

S O C I A LSOSIAL4
SOCIAL
89 Sulawesi Tenggara in Figures 2013
PENJELASAN TEKNIS
Dalam pelaksanaan pembangunan sosial, pemerintah telah mengupayakan berbagai usaha guna terciptanya kesejahteraan masyarakat di bidang sosial yang lebih baik. Usaha tersebut meliputi kegiatan di bidang pendidikan, agama, kesehatan, keluarga berencana, keamanan, dan ketertiban masyarakat, serta urusan sosial lainnya.
4.1. Pendidikan
Sasaran pembangunan pendidikan dititikberatkan pada peningkatan mutu dan perluasan kesempatan belajar di semua jenjang pendidikan, dimulai dari kegiatan prasekolah (Taman Kanak-Kanak) sampai dengan Perguruan Tinggi. Upaya peningkatan mutu pendidikan yang ingin dicapai tersebut dimaksudkan untuk menghasilkan manusia berkualitas. Sedangkan perluasan kesempatan belajar dimaksud agar penduduk usia sekolah yang setiap tahun mengalami peningkatan sejalan dengan laju pertumbuhan penduduk dapat memperoleh kesempatan belajar yang seluas-luasnya.
Pelaksanaan pembangunan pendidikan di Sulawesi Tenggara mengalami peningkatan dari tahun ke tahun. Indikator yang dapat mengukur tingkat perkembangan pembangunan pendidikan di Sulawesi Tenggara seperti Jumlah sekolah dan guru, perkembangan berbagai rasio dan sebagainya.
1. Tidak/belum pernah sekolah adalah mereka yang tidak pernah atau belum pernah terdaftar dan tidak pernah atau belum pernah aktif mengikuti pendidikan di suatu jenjang pendidikan formal maupun nonformal (paket A/B/C) termasuk juga yang tamat/belum tamat taman kanak-kanak tetapi tidak melanjutkan ke sekolah dasar.
TECHNICAL NOTES
In order to improve the common social welfare, the local government has been supporting social activities that in-clude education, religion, health, family planning, security and public order, and other social affairs.
4.1. Education
Education development targets fo-cused on improving quality and expanding the learning opportunities at all education levels. Improving the quality of education aimed at improving the quality of human resources (from kindergarten to university). While the expansion of learning opportuni-ties, aimed to make every school-age popu-lation had a full opportunity to learn.
From year to year, educational devel-opment in Sulawesi Tenggara has been increasing. An increase in the implementa-tion of education development in Sulawesi Tenggara. The improvement, was meas-ured by several variables such as number of schools, teachers, changes in various spe-cific ratios, etc.
1. Not/never attending school is some-one who has never attended or never been registered in a formal education, such as primary, secondary and ter-tiary education. Those who just com-pleted kindergarten are considered as never attended school.
SOCIAL
90 Sulawesi Tenggara Dalam Angka 2013
2. Masih bersekolah adalah mereka yang terdaftar dan aktif mengikuti pendidikan di suatu jenjang pendidikan formal maupun nonformal (paket A/B/C) yang berada di bawah pengawasan Kemendikbud, Kementrian Agama (Kemenag), Instansi negeri lain maupun instansi swasta, baik pendidikan dasar, menengah maupun pendidikan tinggi. Bagi mahasiswa yang sedang cuti diang-gap masih bersekolah.
3. Tidak bersekolah lagi adalah mereka yang pernah terdaftar dan aktif mengikuti pen-didikan di suatu jenjang pendidikan for-mal maupun nonformal, tetapi pada saat pencacahan tidak lagi terdaftar dan tidak aktif mengikuti pendidikan.
4. Tamat sekolah adalah menyelesaikan pelajaran yang ditandai dengan lulus ujian akhir pada kelas atau tingkat terakhir suatu jenjang pendidikan formal maupun nonformal (paket A/B/C) di sekolah negeri maupun swasta dengan mendapatkan tanda tamat belajar/ijazah. Seseorang yang belum mengikuti pelaja-ran pada kelas tertinggi tetapi telah mengikuti ujian akhir dan lulus dianggap tamat sekolah.
5. Dapat membaca dan menulis artinya dapat membaca dan menulis kata-kata/kalimat sederhana dengan suatu aksara tertentu.
Sekolah adalah lembaga pendidikan for-mal yang dimulai dari pendidikan dasar, menengah, dan tinggi. Pendidikan yang dicatat adalah pendidikan formal ber-dasar kurikulum Kementerian Pendidikan dan Kebudayaan, termasuk pendidikan
2. Attending school is someone who is currently attending primary, second-ary or tertiary education.
3. Not attending school anymore is someone who is not currently attend-ing school (formal and non-formal education).
4. Completed particular level of educa-tion is someone who has completed particular level of education in private or public school by owning certificate.
5. Able to read and write is the ability to read and write at least a simple sentence.
School is an education institution starting from primary, secondary and tertiary education. The education data recorded in the survey covering data on formal education based on the curriculum set up by Ministry of Edu-

SOCIAL
91 Sulawesi Tenggara in Figures 2013
yang diselenggarakan oleh pondok pe-santren dengan memakai kurikulum Ke-menterian Pendidikan dan Kebudayaan, seperti Madrasah Ibtidaiyah (MI), Mad-rasah Tsanawiyah (MTs), dan Madrasah Aliyah (MA). Pondok pesantren/madrasah diniyah adalah sekolah yang tidak me-makai kurikulum dari Kementerian Pen-didikan Nasional.
7. Madrasah Ibtidaiyah adalah lembaga pendidikan berciri khas Islam pada jen-jang Sekolah Dasar. Madrasah Tsanawi-yah adalah lembaga pendidikan berciri khas Islam pada jenjang Sekolah Menen-gah Pertama, Madrasah Aliyah adalah lembaga pendidikan berciri khas Islam pada jenjang Sekolah Menengah Atas (SMA).
4.2 Kesehatan dan Keluarga Berencana
Pembangunan kesehatan di Sulawesi Tenggara dititikberatkan pada peningkatan mutu pelayanan kesehatan masyarakat. Demikian pula pelaksanaan Program Nasional Keluarga Berencana bertujuan menurunkan dan mengendalikan pertumbuhan penduduk dan membudayakan suatu norma yang dikenal dengan Norma Keluarga Kecil Bahagia dan Sejahtera (NKKBS).
Untuk mencapai sasaran pembangunan, baik di bidang kesehatan maupun di bidang program keluarga berencana tersebut, maka sejak tahun 1993 pemerintah daerah telah menggiatkan pelaksanaan pembangunan sarana dan prasarana pelayanan kesehatan dan keluarga berencana sampai ke pelosok pedesaan.
cation and Culture including educa-tion carried out by Muslim Boarding School (Pondok Pesantren) implement-ing the Ministry of National Education curriculum, such as Madrasah Ibtidai-yah (MI), Madrasah Tsanawiyah (MTs), and Madrasah Aliyah (MA). Pondok pesantren/madrasah diniyah (Islamic boarding school/Islamic school) is school which does not imple-ment curriculum from the Ministry of National Education.
7. Madrasah Ibtidaiyah is Islamic school at primary education. Madrasah Tsan-awiyah is Islamic school at lower sec-ondary education and Madrasah Ali-yah is Islamic School at higher second-ary education (SMA).
4.2 Health and Family Planning
Health development in Sulawesi Tenggara was emphasized on improving the quality of public health services. Simi-larly, the implementation of the National Family Planning Program aimed at reduc-ing and controlling population growth, and cultivating a norm which is known as Nor-ma Keluarga Kecil Bahagia dan Sejahtera (the norm of happy and prosperous small family).
Since 1993, to achieve these develop-ment goals, the local government has been intensifying the development of facilities and infrastructure of health services and family planning to remote rural areas.
SOCIAL
92 Sulawesi Tenggara Dalam Angka 2013
Pembangunan keluarga berencana mengutamakan penyediaan prasarana dan sarana pelayanan keluarga berencana, Pengendali Program Lapangan Keluarga Berencana (PPLKB), dan Penyuluh Keluarga Berencana (PKB).
Penyediaan sarana dan prasarana pelayanan keluarga berencana yang tersebar di 12 kabupaten/kota, diharapkan berpengaruh langsung terhadap perkembangan kegiatan KB.
8. Rumah Sakit adalah tempat pemeriksaan dan perawatan kesehatan, biasanya berada di bawah pengawasan dokter/tenaga medis, termasuk rumah sakit khusus seperti rumah sakit perawatan paru paru, dan RS jantung.
9. Rumah Sakit Bersalin/Rumah Bersalin adalah rumah sakit yang dilengkapi dengan fasilitas untuk melahirkan, pemeriksaan kehamilan, pemeriksaan ibu dan anak serta berada di bawah pengawasan dokter atau bidan senior.
10. Poliklinik adalah tempat pemeriksaan kesehatan, biasanya tanpa fasilitas perawatan menginap, berada di bawah pengawasan dokter/tenaga medis, tidak termasuk klinik yang terdapat di puskesmas/rumah sakit. Poliklinik yang karena satu dan lain hal menyediakan tempat perawatan menginap, tetap digolongkan ke dalam poliklinik (bukan rumah sakit).
Puskesmas (Pusat Kesehatan Masyarakat) adalah unit pelayanan kesehatan milik pemerintah yang bertanggung jawab terhadap pelayanan kesehatan masyarakat untuk wilayah
Development priority of family plan-ning is availability of facilities and infrastruc-ture of family planning services, Field Pro-gram Controller of Family Planning, and Family Planning Counselor.
The facilities and infrastructures of family planning services supply, which dis-tributed in 12 districts/ cities, were ex-pected to bring positive impact to the pro-gress of family planning activity.
8. Hospital is a place for health check, usually controlled/supervised by doc-tors/medical personnel. Including in this category are special hospitals such Lung Hospital and Coronary Hospital.
9. Maternal Hospital/Maternal Health Care Centre is a hospital completed with health facilities for birth delivery, pregnancy check and consultation, and post-natal check, under the super-vision of doctor or senior midwives.
10. Polyclinic is a place for health check and consultation usually under the control of doctor/medical personnel without in-patient facilities, excluding clinic located in the public health cen-tre (Puskesmas)/hospital. In the case of polyclinic that provides in-patient facilities due to a special reason, it remains to be classified as a polyclinic (not hospital).
11. Public Health Centre (PHC) is a health centre provided by the government that is responsible for the delivery of health services to the community at the sub-district level, part of

SOCIAL
93 Sulawesi Tenggara in Figures 2013
kecamatan, sebagian kecamatan, atau kelurahan (misal di DKI Jakarta). Tim Puskesmas sesuai jadwal dapat melakukan kegiatan Puskesmas Keliling ke tempat tempat tertentu dalam wilayah kerjanya, untuk mendekatkan pelayanan dengan masyarakat.
Puskesmas Pembantu (Pustu) yaitu unit pelayanan kesehatan masyarakat yang membantu kegiatan Puskesmas di sebagian dari wilayah kerja. Pada beberapa daerah balai pengobatan telah berubah fungsi menjadi Pustu walaupun papan nama masih tertulis balai pengobatan.
13. Apotik adalah tempat penjualan obat yang mempunyai izin operasi dari Departemen Kesehatan, u.p. Ditjen POM, di bawah pengawasan apoteker.
Imunisasi adalah memasukkan kuman atau racun penyakit tertentu yang sudah dilemahkan (vaksin) ke dalam tubuh dengan cara disuntik atau diminum (diteteskan dalam mulut) dengan maksud agar terjadi kekebalan tubuh terhadap penyakit tersebut.
15. Keluhan kesehatan adalah keadaan seseorang yang mengalami gangguan kesehatan atau kejiwaan, baik karena penyakit akut, penyakit kronis, kecelakaan, kriminal atau hal lain.
16. Mengobati sendiri adalah upaya oleh art/keluarga dengan melakukan pengobatan sendiri tanpa datang ke tempat fasilitas
subdistrict or villages (e.g. in DKI Jakarta). Officials in the PHC as scheduled can provide health services in their working areas in the effort of closing their services to the community through Mobile PHC program.
12. Subsidiary Public Health Centre is a health facility that assists the Public Health Centre in its part of working area. In several regions, health check points (Balai Pengobatan) has changes their status into Subsidiary Public health Centre, although their sign written in the board remains un-changed.
Pharmacy is a place of selling medi-cines having permit operation from the Department of Health, through Directorate General for Food and Medicine Supervision, under the con-trol of pharmacist.
14. Immunization is putting enervated microbe of a certain disease into hu-man body by injection or drinking (dropping into mouth) to make the body immune to that disease.
15. Health Complaint is a condition where a person has health or mental prob-lems because of acute illness, chroni-cally illness, accident, crimes, or oth-ers.
16. Self Treatment is an effort of house-hold members/ family to have a health treatment by themselves without visit-
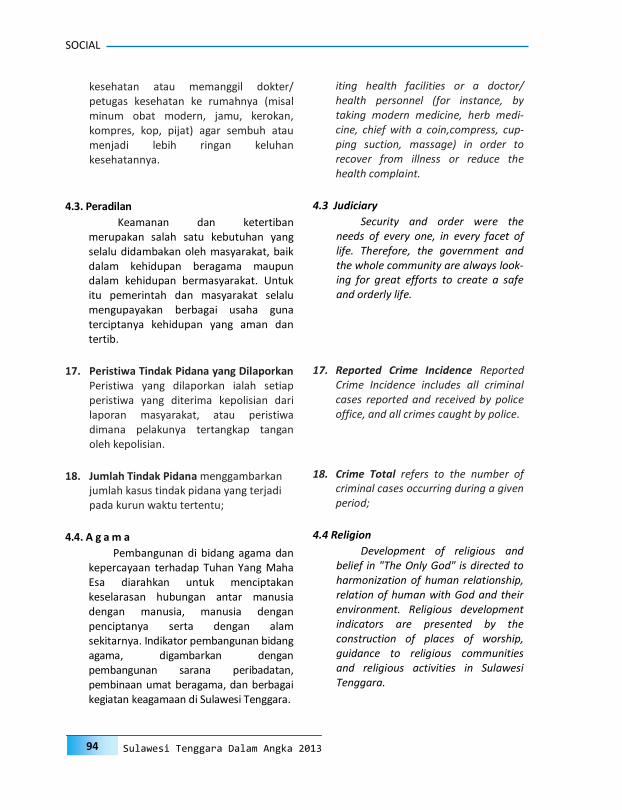
SOCIAL
94 Sulawesi Tenggara Dalam Angka 2013
kesehatan atau memanggil dokter/petugas kesehatan ke rumahnya (misal minum obat modern, jamu, kerokan, kompres, kop, pijat) agar sembuh atau menjadi lebih ringan keluhan kesehatannya.
4.3. Peradilan
Keamanan dan ketertiban merupakan salah satu kebutuhan yang selalu didambakan oleh masyarakat, baik dalam kehidupan beragama maupun dalam kehidupan bermasyarakat. Untuk itu pemerintah dan masyarakat selalu mengupayakan berbagai usaha guna terciptanya kehidupan yang aman dan tertib.
17. Peristiwa Tindak Pidana yang Dilaporkan Peristiwa yang dilaporkan ialah setiap peristiwa yang diterima kepolisian dari laporan masyarakat, atau peristiwa dimana pelakunya tertangkap tangan oleh kepolisian.
18. Jumlah Tindak Pidana menggambarkan jumlah kasus tindak pidana yang terjadi pada kurun waktu tertentu;
4.4. A g a m a
Pembangunan di bidang agama dan kepercayaan terhadap Tuhan Yang Maha Esa diarahkan untuk menciptakan keselarasan hubungan antar manusia dengan manusia, manusia dengan penciptanya serta dengan alam sekitarnya. Indikator pembangunan bidang agama, digambarkan dengan pembangunan sarana peribadatan, pembinaan umat beragama, dan berbagai kegiatan keagamaan di Sulawesi Tenggara.
iting health facilities or a doctor/ health personnel (for instance, by taking modern medicine, herb medi-cine, chief with a coin,compress, cup-ping suction, massage) in order to recover from illness or reduce the health complaint.
4.3 Judiciary
Security and order were the needs of every one, in every facet of life. Therefore, the government and the whole community are always look-ing for great efforts to create a safe and orderly life.
17. Reported Crime Incidence Reported Crime Incidence includes all criminal cases reported and received by police office, and all crimes caught by police.
18. Crime Total refers to the number of criminal cases occurring during a given period;
4.4 Religion
Development of religious and belief in "The Only God" is directed to harmonization of human relationship, relation of human with God and their environment. Religious development indicators are presented by the construction of places of worship, guidance to religious communities and religious activities in Sulawesi Tenggara.

SOCIAL
95 Sulawesi Tenggara in Figures 2013
4.5. Sosial Lainnya
Pada bagian akhir bab ini disajikan beberapa indikator penting pembangunan sosial lainnya di Sulawesi Tenggara seperti urusan keterbelakangan, keterlantaran, dan bencana alam.
19. Bencana Alam: Bencana alam adalah peristiwa alam yang menimbulkan kesengsaraan, kerusakan alam dan ling-kungan, serta mengakibatkan keseng-saraan, kerugian, dan penderitaan pada penduduk. Tidak termasuk bencana yang disebabkan karena hama tanaman atau wabah. Bencana alam yang disajikan an-tara lain: tanah longsor, banjir, dan gem-pa bumi.
4.5 Other Social Affairs
At the end of this chapter, several other important indicators of social devel-opment in Sulawesi Tenggara are present-ed, such as retardation, waif, and natural disasters.
19. Natural Disaster: Natural disaster is a natural phenomenon leading to mis-ery, damages or detriment, and finan-cial loss, as well as the suffering of people. Not including in this category is disaster from plant microbe or out-break. The natural disasters recorded in this category include land slide, flood, and earthquake.

SOCIAL
96 Sulawesi Tenggara Dalam Angka 2013
0
500
1000
1500
2000
2500
TK SD SMTP SMTA
Tahun Ajaran
2008/2009
2009/2010
2010/2011
2011/2012
4.1
Jumlah Sekolah Menurut Jenjang Pendidikan Tahun Ajaran
2008/2009 - 2011/2012 Gambar Figure Number of School by educational level, Education Year
2008/2009 - 2011/2012
Sumber/Source: Dinas Pendidikan dan kebudayaan Kabupaten/Kota/ Education and Culture Service in the District/City Level

SOCIAL
97 Sulawesi Tenggara in Figures 2013
0
500
1000
1500
2000
2500
3000
3500
4000
Dok
ter
Pera
wat
Bida
n
Farm
asi
Ahl
i Giz
i
Tekn
isi M
edis
*)
Sani
tasi
Kes.
Mas
yara
kat
Tenaga Medis Tenaga Non Medis
4.2 Jumlah Tenaga Kesehatan Menurut Profesi Tahun 2012 Gambar
Figure Number of Health Power by Profession 2012
Sumber/Source: Dinas Kesehatan Prov. Sulawesi Tenggara / Health Service of Sulawesi Tenggara Province

SOCIAL
98 Sulawesi Tenggara Dalam Angka 2013
4.3 Persentase Peserta KB Aktif menurut Jenis Alat KB yang digunakan 2012 Gambar
Figure Percentage of actively Family Planning User by Kind of Methode used 2012
Sumber/Source: Kanwil BKKBN Prov. Sultra/National Family Planning Coordinating
Board of Sulawesi Tenggara Province
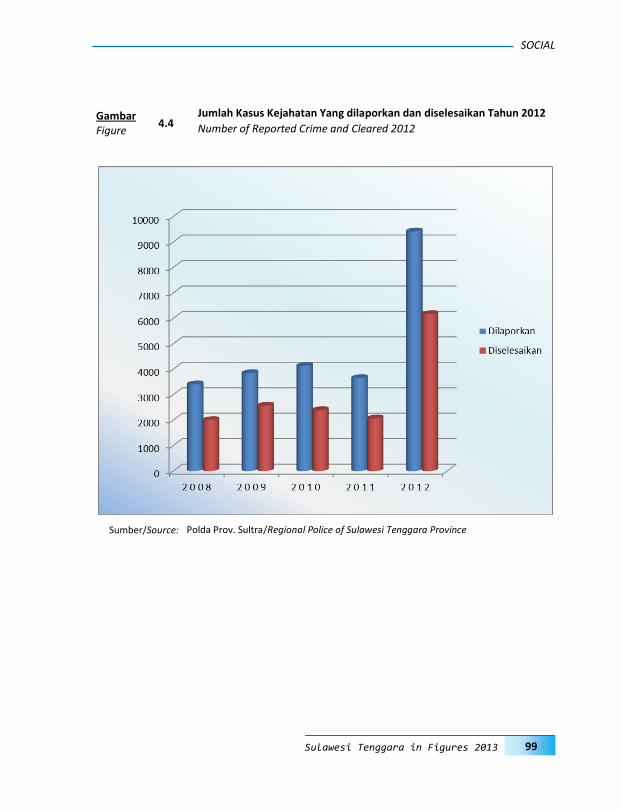
SOCIAL
99 Sulawesi Tenggara in Figures 2013
4.4 Jumlah Kasus Kejahatan Yang dilaporkan dan diselesaikan Tahun 2012 Gambar
Figure Number of Reported Crime and Cleared 2012
Sumber/Source: Polda Prov. Sultra/Regional Police of Sulawesi Tenggara Province

SOCIAL
100 Sulawesi Tenggara Dalam Angka 2013
4.5 Peristiwa Bencana Alam yang melanda Sulawesi Tenggara, 2008 - 2012 Gambar
Figure Natural Disaster that hits Sulawesi Tenggara Province, 2008 - 2012
Sumber/Source: Dinas Sosial Prov. Sultra/ Social Service of Sulawesi Tenggara Province

SOCIAL
101 Sulawesi Tenggara in Figures 2013
Rata-rata Tingkat
Pendidikan Average
Sekolah Guru*) Murid Guru Per Murid Per Murid Per Educational
Level School Teacher Student Sekolah Sekolah Guru
Teacher Per School
Student Per School
Student Per Teacher
(1) (2) (3) (4) (5) (6) (7)
1. T K/Kindergarten
2008/2009 1 083 3 458 42 875 3,19 39,59 12,40 2009/2010 991 3 586 36 063 3,62 36,39 10,06 2010/2011 1 127 4 854 41 857 4,31 37,14 8,62 2011/2012 1 271 5 601 51 522 4,41 40,54 9,20
2. S D/Elementary School
2008/2009 2 173 25 175 336 737 11,59 154,96 13,38 2009/2010 2 197 26 089 345 678 11,87 157,34 13,25 2010/2011 2 239 26 818 348 734 11,98 155,75 13,00 2011/2012 2 268 26 653 350 672 11,75 154,62 13,16
3. S M T P/Junior High School
2008/2009 543 9 904 112 549 18,24 207,27 11,36 2009/2010 614 10 133 114 724 16,50 186,85 11,32 2010/2011 637 11 062 118 408 17,37 185,88 10,70 2011/2012 669 12 025 119 255 17,97 178,26 9,92
5. S M T A/Senior High School **)
2008/2009 294 8 015 83 532 27,26 284,12 10,42 2009/2010 303 8 498 87 045 28,05 287,28 10,24 2010/2011 305 8 467 92 594 27,76 303,59 10,94 2011/2012 348 9 832 98 567 28,25 283,24 10,03
Sumber/Source: Dinas Pendidikan dan kebudayaan Kabupaten/Kota/ Education and Culture Service in the District/City Level
Catatan/Note : *) Termasuk Guru Tidak Tetap/Including Temporary Teachers **) Termasuk SMK/Including Vacational High School
4.1.1
Sekolah, Guru dan Murid Menurut Tingkat Pendidikan Dilingkungan
Kementrian Pendidikan Nasional 2008/2009 - 2011/2012 Tabel Table Number of Schools, Teachers and Students Under The Ministry of Na-
tional Education by Educational Level 2007/2008 - 2011/2012
4.1 Pendidikan
Education
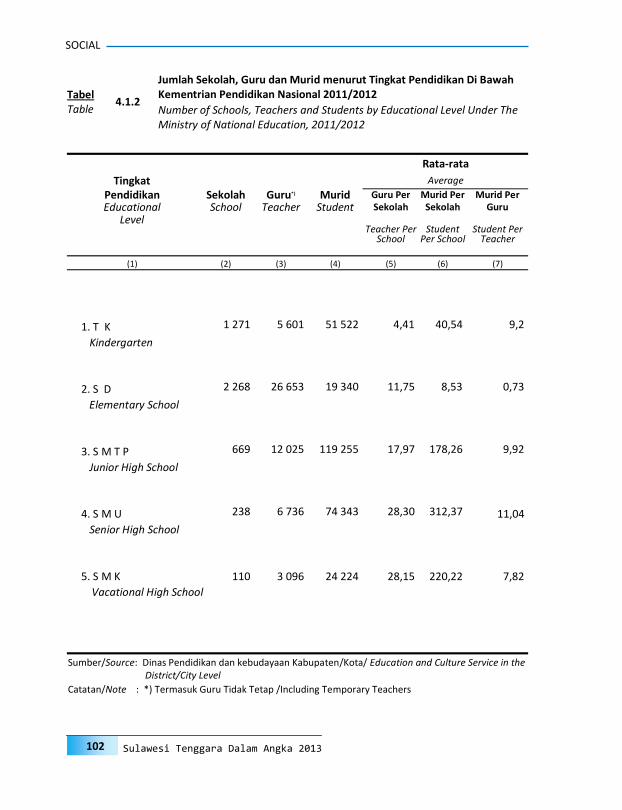
SOCIAL
102 Sulawesi Tenggara Dalam Angka 2013
Rata-rata
Tingkat Average
Pendidikan Sekolah Guru*) Murid Guru Per Murid Per Murid Per Educational School Teacher Student Sekolah Sekolah Guru
Level Teacher Per
School Student
Per School Student Per
Teacher
(1) (2) (3) (4) (5) (6) (7)
1. T K 1 271 5 601 51 522 4,41 40,54 9,2
Kindergarten
2. S D 2 268 26 653 19 340 11,75 8,53 0,73
Elementary School
3. S M T P 669 12 025 119 255 17,97 178,26 9,92
Junior High School
4. S M U 238 6 736 74 343 28,30 312,37 11,04
Senior High School
5. S M K 110 3 096 24 224 28,15 220,22 7,82
Vacational High School
Sumber/Source: Dinas Pendidikan dan kebudayaan Kabupaten/Kota/ Education and Culture Service in the District/City Level
Catatan/Note : *) Termasuk Guru Tidak Tetap /Including Temporary Teachers
4.1.2
Jumlah Sekolah, Guru dan Murid menurut Tingkat Pendidikan Di Bawah Kementrian Pendidikan Nasional 2011/2012 Tabel
Table Number of Schools, Teachers and Students by Educational Level Under The Ministry of National Education, 2011/2012
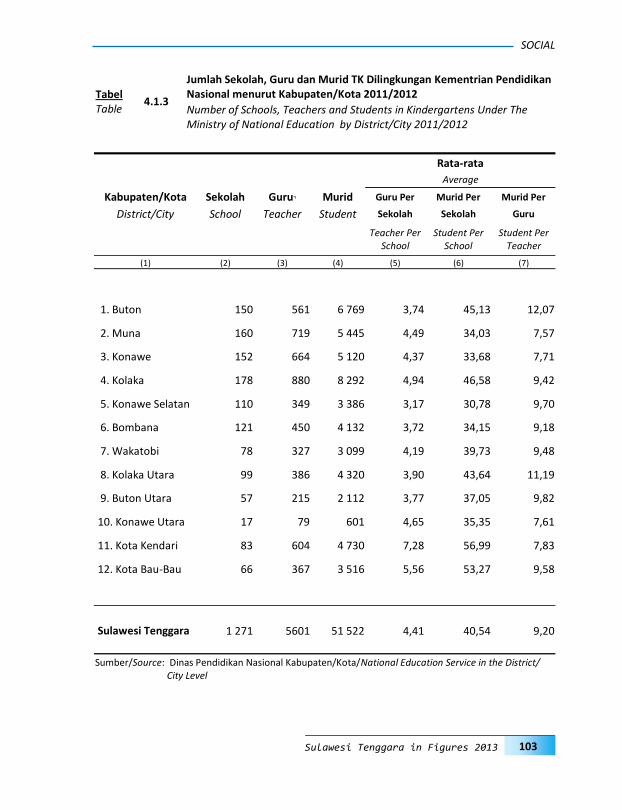
SOCIAL
103 Sulawesi Tenggara in Figures 2013
4.1.3
Jumlah Sekolah, Guru dan Murid TK Dilingkungan Kementrian Pendidikan Nasional menurut Kabupaten/Kota 2011/2012 Tabel
Table Number of Schools, Teachers and Students in Kindergartens Under The Ministry of National Education by District/City 2011/2012
Rata-rata
Average
Kabupaten/Kota Sekolah Guru*) Murid Guru Per Murid Per Murid Per
District/City School Teacher Student Sekolah Sekolah Guru
Teacher Per School
Student Per School
Student Per Teacher
(1) (2) (3) (4) (5) (6) (7)
1. Buton 150 561 6 769 3,74 45,13 12,07
2. Muna 160 719 5 445 4,49 34,03 7,57
3. Konawe 152 664 5 120 4,37 33,68 7,71
4. Kolaka 178 880 8 292 4,94 46,58 9,42
5. Konawe Selatan 110 349 3 386 3,17 30,78 9,70
6. Bombana 121 450 4 132 3,72 34,15 9,18
7. Wakatobi 78 327 3 099 4,19 39,73 9,48
8. Kolaka Utara 99 386 4 320 3,90 43,64 11,19
9. Buton Utara 57 215 2 112 3,77 37,05 9,82
10. Konawe Utara 17 79 601 4,65 35,35 7,61
11. Kota Kendari 83 604 4 730 7,28 56,99 7,83
12. Kota Bau-Bau 66 367 3 516 5,56 53,27 9,58
Sulawesi Tenggara 1 271 5601 51 522 4,41 40,54 9,20
Sumber/Source: Dinas Pendidikan Nasional Kabupaten/Kota/National Education Service in the District/City Level

SOCIAL
104 Sulawesi Tenggara Dalam Angka 2013
4.1.4
Jumlah Sekolah, Guru dan Murid Tingkat SD di Lingkungan Kementrian Pendidikan Nasional menurut Kabupaten/Kota 2011/2012 Tabel
Table Number of Schools, Teachers and Students in Elementary School under the National Education Service by District/City, 2011/2012
Rata-rata
Average
Kabupaten/Kota Sekolah Guru*) Murid Guru Per Murid Per Murid Per
District/City School Teacher Student Sekolah Sekolah Guru
Teacher Per School
Student Per School
Student Per Teacher
(1) (2) (3) (4) (5) (6) (7)
1. Buton 271 3 021 48 819 11,15 180,14 16,16
2. Muna 318 3 532 45 657 11,11 143,58 12,93
3. Konawe 318 3 427 39 344 10,78 123,72 11,48
4. Kolaka 320 4 504 49 338 14,08 154,18 10,95
5. Konawe Selatan 322 3 076 40 111 9,55 124,57 13,04
6. Bombana 146 1 482 20 913 10,15 143,24 14,11
7. Wakatobi 111 1 227 14 404 11,05 129,77 11,74
8. Kolaka Utara 99 1 203 17 206 12,15 173,80 14,30
9. Buton Utara 71 687 9 573 9,68 134,83 13,93
10. Konawe Utara 97 874 9 366 9,01 96,56 10,72
11. Kota Kendari 124 2 261 36 601 18,23 295,17 16,19
12. Kota Bau-Bau 71 1 359 19 340 19,14 272,39 14,23
Sulawesi Tenggara 2 268 26 653 350 672 11,75 154,62 13,16
Sumber/Source: Dinas Pendidikan Nasional Kabupaten/Kota/National Education Service in the District/City Level
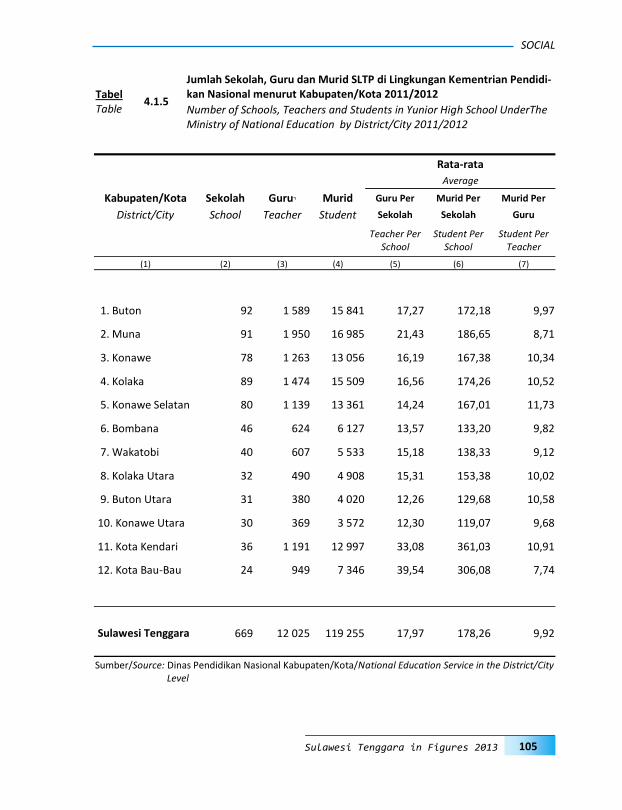
SOCIAL
105 Sulawesi Tenggara in Figures 2013
Rata-rata
Average
Kabupaten/Kota Sekolah Guru*) Murid Guru Per Murid Per Murid Per
District/City School Teacher Student Sekolah Sekolah Guru
Teacher Per School
Student Per School
Student Per Teacher
(1) (2) (3) (4) (5) (6) (7)
1. Buton 92 1 589 15 841 17,27 172,18 9,97
2. Muna 91 1 950 16 985 21,43 186,65 8,71
3. Konawe 78 1 263 13 056 16,19 167,38 10,34
4. Kolaka 89 1 474 15 509 16,56 174,26 10,52
5. Konawe Selatan 80 1 139 13 361 14,24 167,01 11,73
6. Bombana 46 624 6 127 13,57 133,20 9,82
7. Wakatobi 40 607 5 533 15,18 138,33 9,12
8. Kolaka Utara 32 490 4 908 15,31 153,38 10,02
9. Buton Utara 31 380 4 020 12,26 129,68 10,58
10. Konawe Utara 30 369 3 572 12,30 119,07 9,68
11. Kota Kendari 36 1 191 12 997 33,08 361,03 10,91
12. Kota Bau-Bau 24 949 7 346 39,54 306,08 7,74
Sulawesi Tenggara 669 12 025 119 255 17,97 178,26 9,92
Sumber/Source: Dinas Pendidikan Nasional Kabupaten/Kota/National Education Service in the District/City Level
4.1.5
Jumlah Sekolah, Guru dan Murid SLTP di Lingkungan Kementrian Pendidi-kan Nasional menurut Kabupaten/Kota 2011/2012 Tabel
Table Number of Schools, Teachers and Students in Yunior High School UnderThe Ministry of National Education by District/City 2011/2012
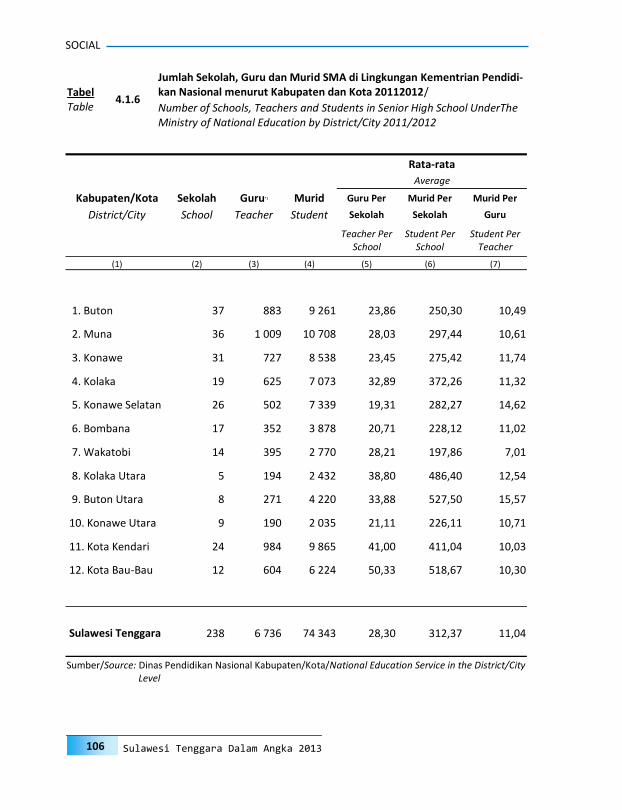
SOCIAL
106 Sulawesi Tenggara Dalam Angka 2013
4.1.6
Jumlah Sekolah, Guru dan Murid SMA di Lingkungan Kementrian Pendidi-kan Nasional menurut Kabupaten dan Kota 20112012/ Tabel
Table Number of Schools, Teachers and Students in Senior High School UnderThe Ministry of National Education by District/City 2011/2012
Rata-rata
Average
Kabupaten/Kota Sekolah Guru*) Murid Guru Per Murid Per Murid Per
District/City School Teacher Student Sekolah Sekolah Guru
Teacher Per School
Student Per School
Student Per Teacher
(1) (2) (3) (4) (5) (6) (7)
1. Buton 37 883 9 261 23,86 250,30 10,49
2. Muna 36 1 009 10 708 28,03 297,44 10,61
3. Konawe 31 727 8 538 23,45 275,42 11,74
4. Kolaka 19 625 7 073 32,89 372,26 11,32
5. Konawe Selatan 26 502 7 339 19,31 282,27 14,62
6. Bombana 17 352 3 878 20,71 228,12 11,02
7. Wakatobi 14 395 2 770 28,21 197,86 7,01
8. Kolaka Utara 5 194 2 432 38,80 486,40 12,54
9. Buton Utara 8 271 4 220 33,88 527,50 15,57
10. Konawe Utara 9 190 2 035 21,11 226,11 10,71
11. Kota Kendari 24 984 9 865 41,00 411,04 10,03
12. Kota Bau-Bau 12 604 6 224 50,33 518,67 10,30
Sulawesi Tenggara 238 6 736 74 343 28,30 312,37 11,04
Sumber/Source: Dinas Pendidikan Nasional Kabupaten/Kota/National Education Service in the District/City Level
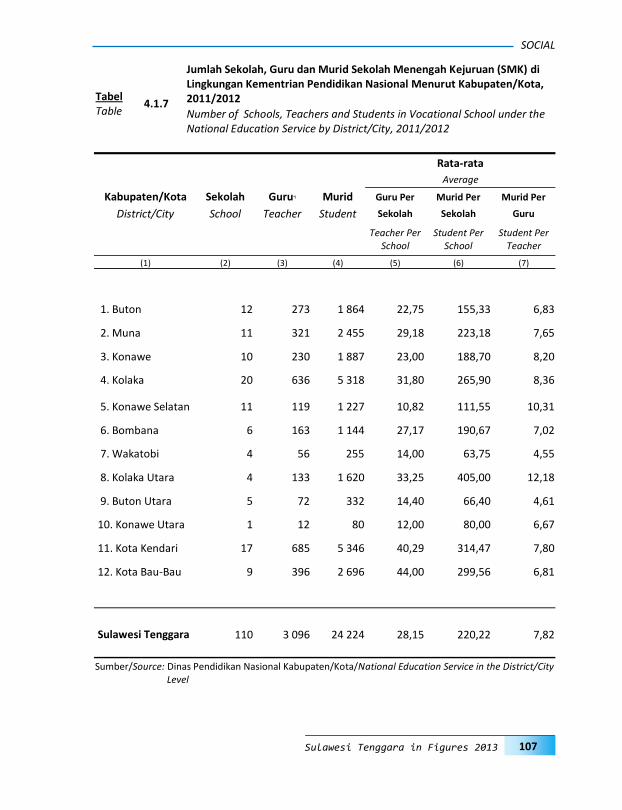
SOCIAL
107 Sulawesi Tenggara in Figures 2013
Rata-rata
Average
Kabupaten/Kota Sekolah Guru*) Murid Guru Per Murid Per Murid Per
District/City School Teacher Student Sekolah Sekolah Guru
Teacher Per School
Student Per School
Student Per Teacher
(1) (2) (3) (4) (5) (6) (7)
1. Buton 12 273 1 864 22,75 155,33 6,83
2. Muna 11 321 2 455 29,18 223,18 7,65
3. Konawe 10 230 1 887 23,00 188,70 8,20
4. Kolaka 20 636 5 318 31,80 265,90 8,36
5. Konawe Selatan 11 119 1 227 10,82 111,55 10,31
6. Bombana 6 163 1 144 27,17 190,67 7,02
7. Wakatobi 4 56 255 14,00 63,75 4,55
8. Kolaka Utara 4 133 1 620 33,25 405,00 12,18
9. Buton Utara 5 72 332 14,40 66,40 4,61
10. Konawe Utara 1 12 80 12,00 80,00 6,67
11. Kota Kendari 17 685 5 346 40,29 314,47 7,80
12. Kota Bau-Bau 9 396 2 696 44,00 299,56 6,81
Sulawesi Tenggara 110 3 096 24 224 28,15 220,22 7,82
Sumber/Source: Dinas Pendidikan Nasional Kabupaten/Kota/National Education Service in the District/City Level
4.1.7
Jumlah Sekolah, Guru dan Murid Sekolah Menengah Kejuruan (SMK) di Lingkungan Kementrian Pendidikan Nasional Menurut Kabupaten/Kota, 2011/2012 Tabel
Table Number of Schools, Teachers and Students in Vocational School under the National Education Service by District/City, 2011/2012
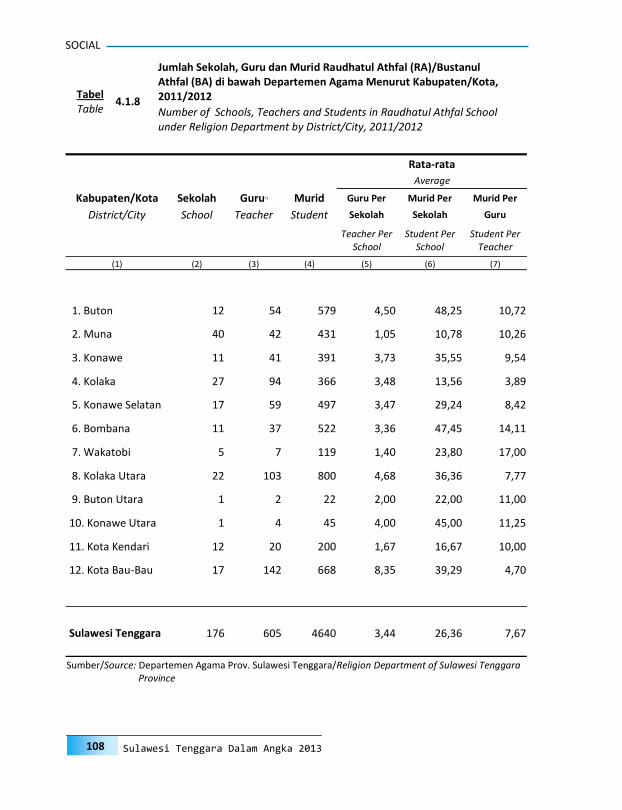
SOCIAL
108 Sulawesi Tenggara Dalam Angka 2013
4.1.8
Jumlah Sekolah, Guru dan Murid Raudhatul Athfal (RA)/Bustanul Athfal (BA) di bawah Departemen Agama Menurut Kabupaten/Kota, 2011/2012 Tabel
Table Number of Schools, Teachers and Students in Raudhatul Athfal School under Religion Department by District/City, 2011/2012
Rata-rata
Average
Kabupaten/Kota Sekolah Guru*) Murid Guru Per Murid Per Murid Per
District/City School Teacher Student Sekolah Sekolah Guru
Teacher Per School
Student Per School
Student Per Teacher
(1) (2) (3) (4) (5) (6) (7)
1. Buton 12 54 579 4,50 48,25 10,72
2. Muna 40 42 431 1,05 10,78 10,26
3. Konawe 11 41 391 3,73 35,55 9,54
4. Kolaka 27 94 366 3,48 13,56 3,89
5. Konawe Selatan 17 59 497 3,47 29,24 8,42
6. Bombana 11 37 522 3,36 47,45 14,11
7. Wakatobi 5 7 119 1,40 23,80 17,00
8. Kolaka Utara 22 103 800 4,68 36,36 7,77
9. Buton Utara 1 2 22 2,00 22,00 11,00
10. Konawe Utara 1 4 45 4,00 45,00 11,25
11. Kota Kendari 12 20 200 1,67 16,67 10,00
12. Kota Bau-Bau 17 142 668 8,35 39,29 4,70
Sulawesi Tenggara 176 605 4640 3,44 26,36 7,67
Sumber/Source: Departemen Agama Prov. Sulawesi Tenggara/Religion Department of Sulawesi Tenggara Province
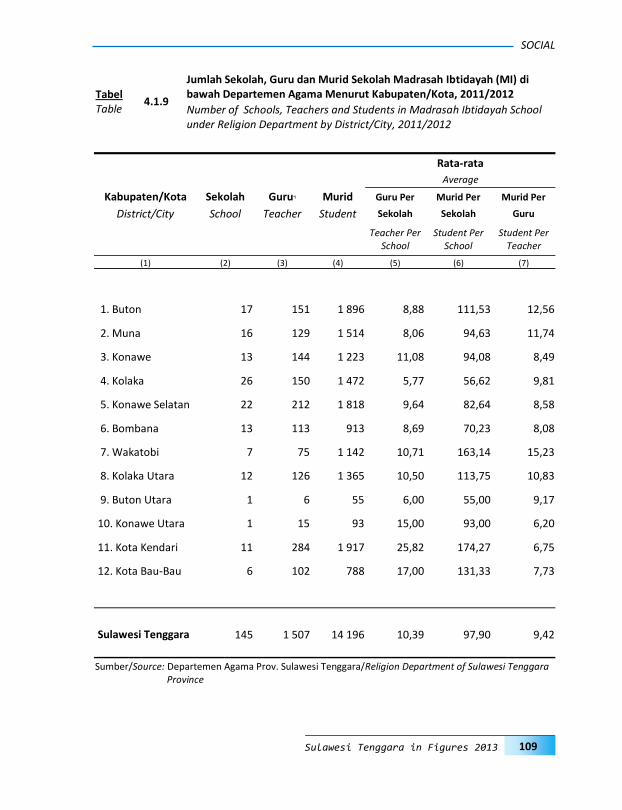
SOCIAL
109 Sulawesi Tenggara in Figures 2013
Rata-rata
Average
Kabupaten/Kota Sekolah Guru*) Murid Guru Per Murid Per Murid Per
District/City School Teacher Student Sekolah Sekolah Guru
Teacher Per School
Student Per School
Student Per Teacher
(1) (2) (3) (4) (5) (6) (7)
1. Buton 17 151 1 896 8,88 111,53 12,56
2. Muna 16 129 1 514 8,06 94,63 11,74
3. Konawe 13 144 1 223 11,08 94,08 8,49
4. Kolaka 26 150 1 472 5,77 56,62 9,81
5. Konawe Selatan 22 212 1 818 9,64 82,64 8,58
6. Bombana 13 113 913 8,69 70,23 8,08
7. Wakatobi 7 75 1 142 10,71 163,14 15,23
8. Kolaka Utara 12 126 1 365 10,50 113,75 10,83
9. Buton Utara 1 6 55 6,00 55,00 9,17
10. Konawe Utara 1 15 93 15,00 93,00 6,20
11. Kota Kendari 11 284 1 917 25,82 174,27 6,75
12. Kota Bau-Bau 6 102 788 17,00 131,33 7,73
Sulawesi Tenggara 145 1 507 14 196 10,39 97,90 9,42
Sumber/Source: Departemen Agama Prov. Sulawesi Tenggara/Religion Department of Sulawesi Tenggara Province
4.1.9
Jumlah Sekolah, Guru dan Murid Sekolah Madrasah Ibtidayah (MI) di bawah Departemen Agama Menurut Kabupaten/Kota, 2011/2012 Tabel
Table Number of Schools, Teachers and Students in Madrasah Ibtidayah School under Religion Department by District/City, 2011/2012

SOCIAL
110 Sulawesi Tenggara Dalam Angka 2013
Rata-rata
Average
Kabupaten/Kota Sekolah Guru*) Murid Guru Per Murid Per Murid Per
District/City School Teacher Student Sekolah Sekolah Guru
Teacher Per School
Student Per School
Student Per Teacher
(1) (2) (3) (4) (5) (6) (7)
1. Buton 25 380 2 950 15,20 118,00 7,76
2. Muna 23 440 1 782 19,13 77,48 4,05
3. Konawe 22 284 2 815 12,91 127,95 9,91
4. Kolaka 39 215 3 281 5,51 84,13 15,26
5. Konawe Selatan 27 258 1 805 9,56 66,85 7,00
6. Bombana 17 185 2 207 10,88 129,82 11,93
7. Wakatobi 9 154 760 17,11 84,44 4,94
8. Kolaka Utara 14 174 1 794 12,43 128,14 10,31
9. Buton Utara 7 48 211 6,86 30,14 4,40
10. Konawe Utara 4 58 194 14,50 48,50 3,34
11. Kota Kendari 15 290 2 428 19,33 161,87 8,37
12. Kota Bau-Bau 9 176 843 19,56 93,67 4,79
Sulawesi Tenggara 211 2 662 21 070 12,62 99,86 7,92
Sumber/Source: Departemen Agama Prov. Sulawesi Tenggara/Religion Department of Sulawesi Tenggara Province
4.1.10
Jumlah Sekolah, Guru dan Murid Sekolah Madrasah Tsanawiyah (MTs) di bawah Departemen Agama Menurut Kabupaten/Kota, 2011/2012 Tabel
Table Number of Schools, Teachers and Students in Madrasah Tsanawiyah School under Religion Department by District/City, 2011/2012
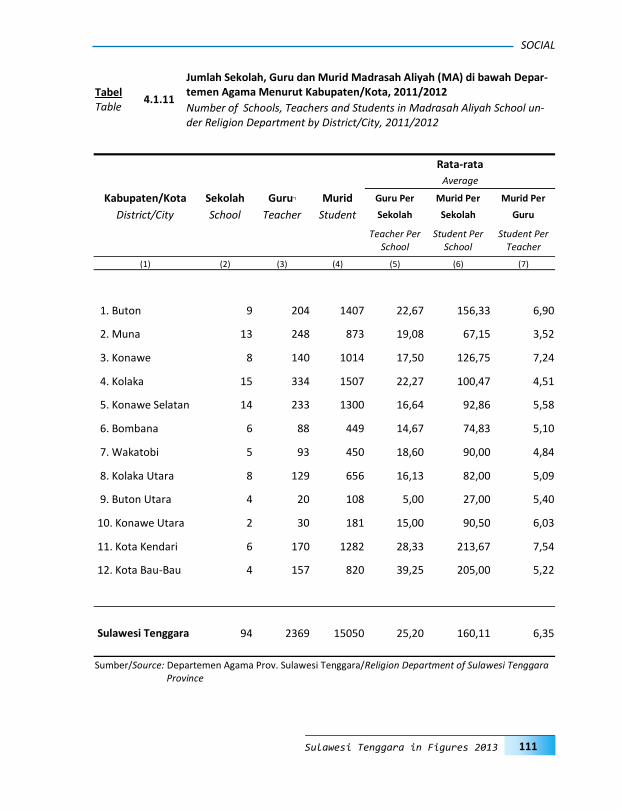
SOCIAL
111 Sulawesi Tenggara in Figures 2013
4.1.11
Jumlah Sekolah, Guru dan Murid Madrasah Aliyah (MA) di bawah Depar-temen Agama Menurut Kabupaten/Kota, 2011/2012 Tabel
Table Number of Schools, Teachers and Students in Madrasah Aliyah School un-der Religion Department by District/City, 2011/2012
Rata-rata
Average
Kabupaten/Kota Sekolah Guru*) Murid Guru Per Murid Per Murid Per
District/City School Teacher Student Sekolah Sekolah Guru
Teacher Per School
Student Per School
Student Per Teacher
(1) (2) (3) (4) (5) (6) (7)
1. Buton 9 204 1407 22,67 156,33 6,90
2. Muna 13 248 873 19,08 67,15 3,52
3. Konawe 8 140 1014 17,50 126,75 7,24
4. Kolaka 15 334 1507 22,27 100,47 4,51
5. Konawe Selatan 14 233 1300 16,64 92,86 5,58
6. Bombana 6 88 449 14,67 74,83 5,10
7. Wakatobi 5 93 450 18,60 90,00 4,84
8. Kolaka Utara 8 129 656 16,13 82,00 5,09
9. Buton Utara 4 20 108 5,00 27,00 5,40
10. Konawe Utara 2 30 181 15,00 90,50 6,03
11. Kota Kendari 6 170 1282 28,33 213,67 7,54
12. Kota Bau-Bau 4 157 820 39,25 205,00 5,22
Sulawesi Tenggara 94 2369 15050 25,20 160,11 6,35
Sumber/Source: Departemen Agama Prov. Sulawesi Tenggara/Religion Department of Sulawesi Tenggara Province
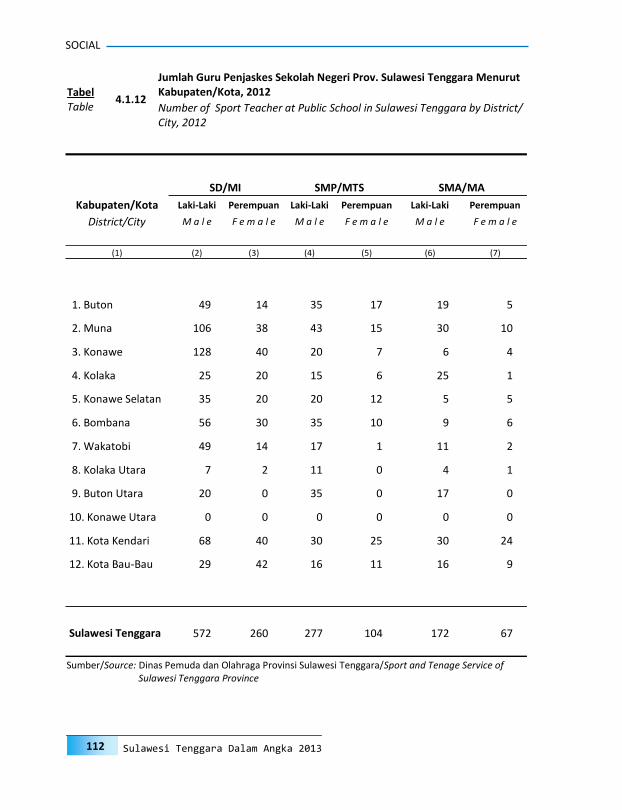
SOCIAL
112 Sulawesi Tenggara Dalam Angka 2013
4.1.12
Jumlah Guru Penjaskes Sekolah Negeri Prov. Sulawesi Tenggara Menurut Kabupaten/Kota, 2012 Tabel
Table Number of Sport Teacher at Public School in Sulawesi Tenggara by District/City, 2012
SD/MI SMP/MTS SMA/MA
Kabupaten/Kota Laki-Laki Perempuan Laki-Laki Perempuan Laki-Laki Perempuan
District/City M a l e F e m a l e M a l e F e m a l e M a l e F e m a l e
(1) (2) (3) (4) (5) (6) (7)
1. Buton 49 14 35 17 19 5
2. Muna 106 38 43 15 30 10
3. Konawe 128 40 20 7 6 4
4. Kolaka 25 20 15 6 25 1
5. Konawe Selatan 35 20 20 12 5 5
6. Bombana 56 30 35 10 9 6
7. Wakatobi 49 14 17 1 11 2
8. Kolaka Utara 7 2 11 0 4 1
9. Buton Utara 20 0 35 0 17 0
10. Konawe Utara 0 0 0 0 0 0
11. Kota Kendari 68 40 30 25 30 24
12. Kota Bau-Bau 29 42 16 11 16 9
Sulawesi Tenggara 572 260 277 104 172 67
Sumber/Source: Dinas Pemuda dan Olahraga Provinsi Sulawesi Tenggara/Sport and Tenage Service of Sulawesi Tenggara Province
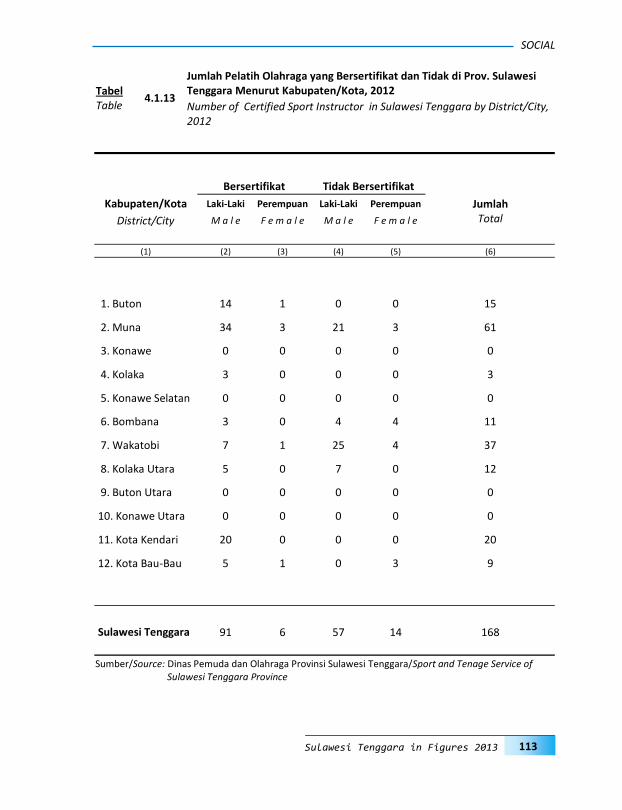
SOCIAL
113 Sulawesi Tenggara in Figures 2013
4.1.13
Jumlah Pelatih Olahraga yang Bersertifikat dan Tidak di Prov. Sulawesi Tenggara Menurut Kabupaten/Kota, 2012 Tabel
Table Number of Certified Sport Instructor in Sulawesi Tenggara by District/City, 2012
Bersertifikat Tidak Bersertifikat
Jumlah Total
Kabupaten/Kota Laki-Laki Perempuan Laki-Laki Perempuan
District/City M a l e F e m a l e M a l e F e m a l e
(1) (2) (3) (4) (5) (6)
1. Buton 14 1 0 0 15
2. Muna 34 3 21 3 61
3. Konawe 0 0 0 0 0
4. Kolaka 3 0 0 0 3
5. Konawe Selatan 0 0 0 0 0
6. Bombana 3 0 4 4 11
7. Wakatobi 7 1 25 4 37
8. Kolaka Utara 5 0 7 0 12
9. Buton Utara 0 0 0 0 0
10. Konawe Utara 0 0 0 0 0
11. Kota Kendari 20 0 0 0 20
12. Kota Bau-Bau 5 1 0 3 9
Sulawesi Tenggara 91 6 57 14 168
Sumber/Source: Dinas Pemuda dan Olahraga Provinsi Sulawesi Tenggara/Sport and Tenage Service of Sulawesi Tenggara Province

SOCIAL
114 Sulawesi Tenggara Dalam Angka 2013
Tahun Year
Rumah Sakit
Hospital
Rumah Bersalin
Maternity Hospital
Puskesmas Public Health
Center
Posyandu Integrated Service Post
Klinik/Balai Kesehatan Clinique/
Health Center
Polindes Village
Maternity Post
(1) (2) (3) (4) (5) (6) (7)
2007 21 — 292 2 479 — 781
2008 22 — 238 2 618 — 897
2009 26 — 179 2 822 — 992
2010 26 — 239 2 876 — 899
2011 26 5 239 2 876 — 899
2012 21 5 252 2 990 4 688
Sumber/Source: Dinas Kesehatan Prov. Sulawesi Tenggara /Health Service of Sulawesi Tenggara Prov-ince
4.2.1 Jumlah Fasilitas Kesehatan di Provinsi Sulawesi Tenggara, 2007 - 2012 Tabel
Table Number of Health Facility in Sulawesi Tenggara Province, 2007 - 2012
4.2. Kesehatan dan Keluarga Berencana
Health and Family Planning

SOCIAL
115 Sulawesi Tenggara in Figures 2013
4.2.2
Jumlah Tenaga Kesehatan Menurut Unit Kerja dan Sarana Pelayanan Kesehatan di Provinsi Sulawesi Tenggara, 2012 Tabel
Table Number of Health Personel by unit Organization and Health Service Station in Sulawesi Tenggara Province, 2012
Unit Kerja Unit
Organization
Tenaga Medis Medical Personel
Tenaga Non Medis
Non-Medical Personel
Dokter Doctor
Perawat Nurse
Bidan Midwife
Farmasi Pharma-
chyist
Ahli Gizi
Nutri-tionist
Teknisi Medis *) Medical Asisstant
Sanitasi Sanitari-
an
Kesehatan Masyarakat
Public Health
(1) (2) (3) (4) (5) (6) (7) (8) (9)
Puskesmas 350 2 199 2.233 257 414 58 359 701
Instalasi Farmasi 0 0 0 25 0 0 0 0
Labkesda 0 2 0 28 4 42 3 28
Dinas Kesehatan 19 73 48 122 72 3 82 524
Rumah Sakit 0 1 382 313 208 116 182 56 260
Jumlah 369 3 656 2 594 640 606 285 500 1 513
Sumber/Source: Dinas Kesehatan Prov. Sulawesi Tenggara/Health Service of Sulawesi Tenggara Prov-ince
Catatan/Notes :*) : termasuk Ahli Radiologi, Fisioterapi, Penata Anastesi /Including Radiologist/Fisiotheraphist/Anasthesy

SOCIAL
116 Sulawesi Tenggara Dalam Angka 2013
Unit Kerja Unit
Organization
Dokter Spesialis Specialist
Doctor
Dokter Umum Doctor
Dokter Gigi
Dentist
(1) (2) (3) (4)
Puskesmas 0 288 62
Rumah Sakit 89 225 34
Institusi Diknakes/Diklat 0 0 0
Sarana Kesehatan lain 0 0 0
Dinkes Kab/Kota 0 17 2
Jumlah 89 530 98
Sumber/Source: Dinas Kesehatan Prov. Sulawesi Tenggara/ Health Service of Sulawesi Tenggara Prov-ince
4.2.3
Jumlah Dokter Spesialis, Dokter Umum, dan Dokter Gigi di Sarana Pela-yanan Kesehatan di Provinsi Sulawesi Tenggara, 2012 Tabel
Table Number of Specialist Doctor, Doctor, and Dentist at Medical Service Station in Sulawesi Tenggara Province, 2012
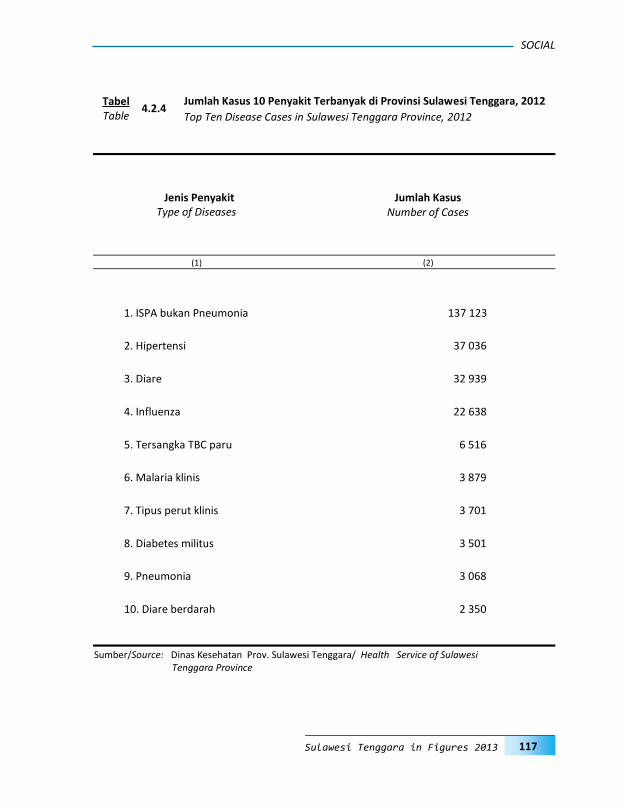
SOCIAL
117 Sulawesi Tenggara in Figures 2013
Jenis Penyakit Type of Diseases
Jumlah Kasus Number of Cases
(1) (2)
1. ISPA bukan Pneumonia 137 123
2. Hipertensi 37 036
3. Diare 32 939
4. Influenza 22 638
5. Tersangka TBC paru 6 516
6. Malaria klinis 3 879
7. Tipus perut klinis 3 701
8. Diabetes militus 3 501
9. Pneumonia 3 068
10. Diare berdarah 2 350
Sumber/Source: Dinas Kesehatan Prov. Sulawesi Tenggara/ Health Service of Sulawesi Tenggara Province
4.2.4 Jumlah Kasus 10 Penyakit Terbanyak di Provinsi Sulawesi Tenggara, 2012 Tabel
Table Top Ten Disease Cases in Sulawesi Tenggara Province, 2012

SOCIAL
118 Sulawesi Tenggara Dalam Angka 2013
Kabupaten/Kota District/City
Balita Gizi Buruk Poor Nutrition Under Five Children
Mendapat Perawatan
In Care Laki-laki
Male Perempuan
Female Jumlah Total
(1) (2) (3) (4) (5)
1. Buton 54 40 94 94
2. Muna 17 14 31 31
3. Konawe 10 8 18 18
4. Kolaka 13 9 22 22
5. Konawe Selatan 14 8 22 22
6. Bombana 13 18 31 31
7. Wakatobi 6 1 7 7
8. Kolaka Utara 6 11 17 17
9. Buton Utara 2 3 5 5
10. Konawe Utara 1 0 1 1
11. Kota Kendari 57 72 129 129
12. Kota Bau-Bau 5 3 8 8
Sulawesi Tenggara 198 187 385 385
Sumber/Source: Profil Kesehatan Provinsi Sulawesi Tenggara 2012 / Health Profile of Sulawesi Tengga-
ra Province 2012
4.2.5
Jumlah Balita Gizi Buruk yang mendapatkan perawatan menurut Kabupaten/Kota di Provinsi Sulawesi Tenggara, 2012 Tabel
Table Number of Poor Nutrition Under Five Children in care by District/City in Sulawesi Tenggara Province, 2012
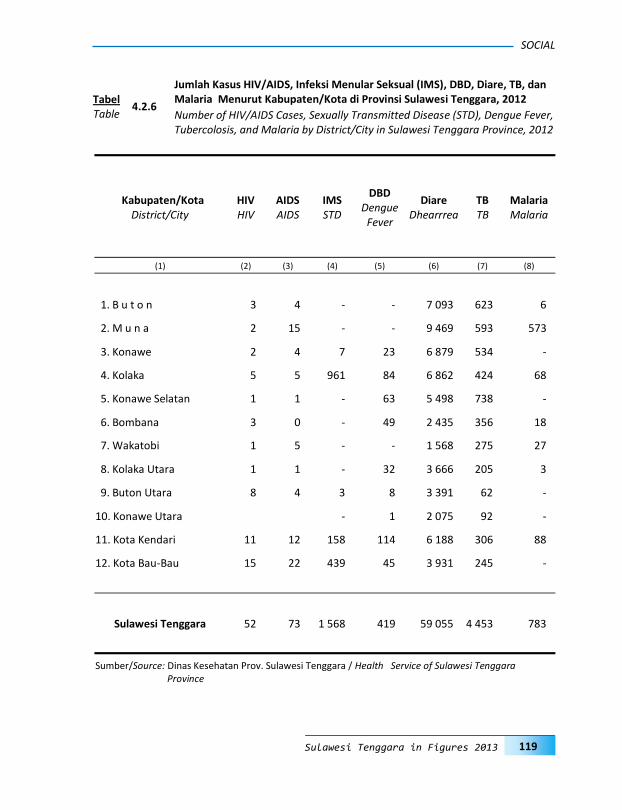
SOCIAL
119 Sulawesi Tenggara in Figures 2013
Kabupaten/Kota District/City
HIV HIV
AIDS AIDS
IMS STD
DBD Dengue
Fever
Diare Dhearrrea
TB TB
Malaria Malaria
(1) (2) (3) (4) (5) (6) (7) (8)
1. B u t o n 3 4 - - 7 093 623 6
2. M u n a 2 15 - - 9 469 593 573
3. Konawe 2 4 7 23 6 879 534 -
4. Kolaka 5 5 961 84 6 862 424 68
5. Konawe Selatan 1 1 - 63 5 498 738 -
6. Bombana 3 0 - 49 2 435 356 18
7. Wakatobi 1 5 - - 1 568 275 27
8. Kolaka Utara 1 1 - 32 3 666 205 3
9. Buton Utara 8 4 3 8 3 391 62 -
10. Konawe Utara - 1 2 075 92 -
11. Kota Kendari 11 12 158 114 6 188 306 88
12. Kota Bau-Bau 15 22 439 45 3 931 245 -
Sulawesi Tenggara 52 73 1 568 419 59 055 4 453 783
Sumber/Source: Dinas Kesehatan Prov. Sulawesi Tenggara / Health Service of Sulawesi Tenggara Province
4.2.6
Jumlah Kasus HIV/AIDS, Infeksi Menular Seksual (IMS), DBD, Diare, TB, dan Malaria Menurut Kabupaten/Kota di Provinsi Sulawesi Tenggara, 2012 Tabel
Table Number of HIV/AIDS Cases, Sexually Transmitted Disease (STD), Dengue Fever, Tubercolosis, and Malaria by District/City in Sulawesi Tenggara Province, 2012
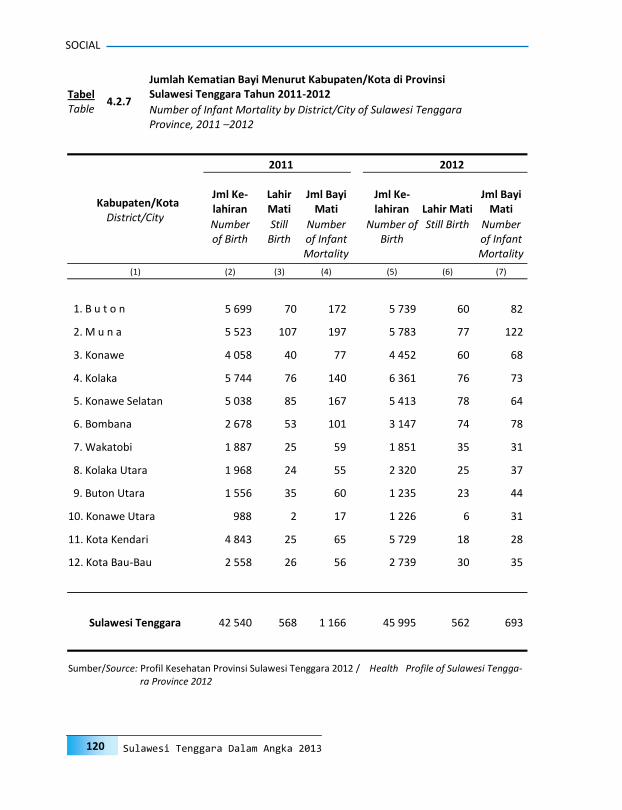
SOCIAL
120 Sulawesi Tenggara Dalam Angka 2013
Kabupaten/Kota District/City
2011 2012
Jml Ke-lahiran
Lahir Mati
Jml Bayi Mati
Jml Ke-lahiran Lahir Mati
Jml Bayi Mati
Number of Birth
Still Birth
Number of Infant Mortality
Number of Birth
Still Birth Number of Infant Mortality
(1) (2) (3) (4) (5) (6) (7)
1. B u t o n 5 699 70 172 5 739 60 82
2. M u n a 5 523 107 197 5 783 77 122
3. Konawe 4 058 40 77 4 452 60 68
4. Kolaka 5 744 76 140 6 361 76 73
5. Konawe Selatan 5 038 85 167 5 413 78 64
6. Bombana 2 678 53 101 3 147 74 78
7. Wakatobi 1 887 25 59 1 851 35 31
8. Kolaka Utara 1 968 24 55 2 320 25 37
9. Buton Utara 1 556 35 60 1 235 23 44
10. Konawe Utara 988 2 17 1 226 6 31
11. Kota Kendari 4 843 25 65 5 729 18 28
12. Kota Bau-Bau 2 558 26 56 2 739 30 35
Sulawesi Tenggara 42 540 568 1 166 45 995 562 693
Sumber/Source: Profil Kesehatan Provinsi Sulawesi Tenggara 2012 / Health Profile of Sulawesi Tengga-ra Province 2012
4.2.7
Jumlah Kematian Bayi Menurut Kabupaten/Kota di Provinsi Sulawesi Tenggara Tahun 2011-2012 Tabel
Table Number of Infant Mortality by District/City of Sulawesi Tenggara Province, 2011 –2012
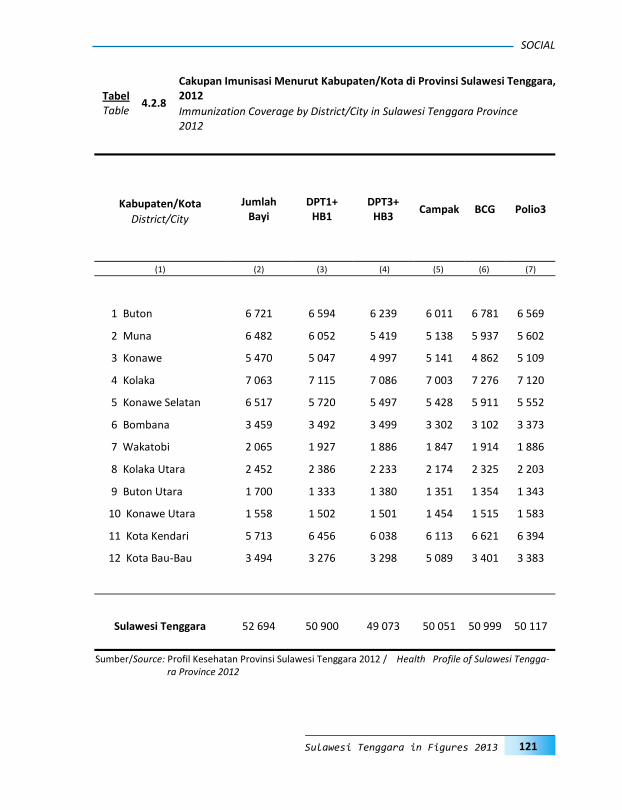
SOCIAL
121 Sulawesi Tenggara in Figures 2013
Jumlah Bayi
DPT1+ HB1
DPT3+ HB3
Campak BCG Polio3 Kabupaten/Kota
District/City
(1) (2) (3) (4) (5) (6) (7)
1 Buton 6 721 6 594 6 239 6 011 6 781 6 569
2 Muna 6 482 6 052 5 419 5 138 5 937 5 602
3 Konawe 5 470 5 047 4 997 5 141 4 862 5 109
4 Kolaka 7 063 7 115 7 086 7 003 7 276 7 120
5 Konawe Selatan 6 517 5 720 5 497 5 428 5 911 5 552
6 Bombana 3 459 3 492 3 499 3 302 3 102 3 373
7 Wakatobi 2 065 1 927 1 886 1 847 1 914 1 886
8 Kolaka Utara 2 452 2 386 2 233 2 174 2 325 2 203
9 Buton Utara 1 700 1 333 1 380 1 351 1 354 1 343
10 Konawe Utara 1 558 1 502 1 501 1 454 1 515 1 583
11 Kota Kendari 5 713 6 456 6 038 6 113 6 621 6 394
12 Kota Bau-Bau 3 494 3 276 3 298 5 089 3 401 3 383
Sulawesi Tenggara 52 694 50 900 49 073 50 051 50 999 50 117
Sumber/Source: Profil Kesehatan Provinsi Sulawesi Tenggara 2012 / Health Profile of Sulawesi Tengga-ra Province 2012
4.2.8
Cakupan Imunisasi Menurut Kabupaten/Kota di Provinsi Sulawesi Tenggara, 2012 Tabel
Table Immunization Coverage by District/City in Sulawesi Tenggara Province 2012

SOCIAL
122 Sulawesi Tenggara Dalam Angka 2013
Kabupaten/Kota KKB PPKBD
District/City
(1) (2) (3)
1. Buton 40 244
2. Muna 76 237
3. Konawe 76 455
4. Kolaka 50 265
5. Konawe Selatan 42 363
6. Bombana 0 22
7. Wakatobi 21 100
8. Kolaka Utara 22 133
9. Buton Utara 11 57
10. Konawe Utara 20 146
11. Kota Kendari 48 64
12. Kota Bau-Bau 21 43
Sulawesi Tenggara 427 2 129
4.2.9
Jumlah Klinik Keluarga Berencana (KKB) dan Pos Pelayanan Keluarga Ber-encana Desa (PPKBD) Menurut Kabupaten/Kota di Provinsi Sulawesi Tenggara, 2012 Tabel
Table Number of Family Planning Clinique (FPC) and Village Family Planning Ser-vice Post (VFPSP) by District/City in Sulawesi Tenggara Province 2012
Sumber/Source: Kanwil BKKBN Prov. Sultra/National Family Planning Coordinating Board of Sulawesi Tenggara Province
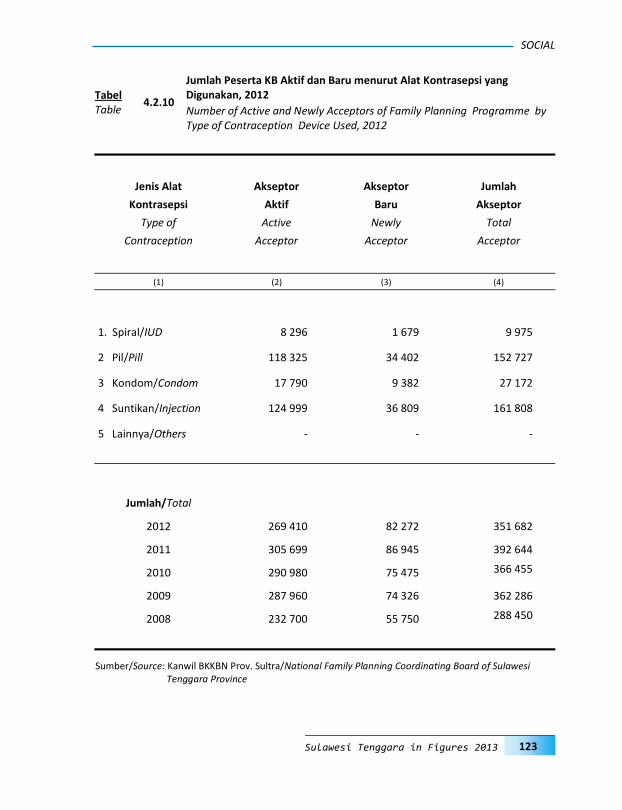
SOCIAL
123 Sulawesi Tenggara in Figures 2013
Jenis Alat Akseptor Akseptor Jumlah
Kontrasepsi Aktif Baru Akseptor
Type of Active Newly Total
Contraception Acceptor Acceptor Acceptor
(1) (2) (3) (4)
1. Spiral/IUD 8 296 1 679 9 975
2 Pil/Pill 118 325 34 402 152 727
3 Kondom/Condom 17 790 9 382 27 172
4 Suntikan/Injection 124 999 36 809 161 808
5 Lainnya/Others - - -
Jumlah/Total
2012 269 410 82 272 351 682
2011 305 699 86 945 392 644
2010 290 980 75 475 366 455
2009 287 960 74 326 362 286
2008 232 700 55 750 288 450
Sumber/Source: Kanwil BKKBN Prov. Sultra/National Family Planning Coordinating Board of Sulawesi Tenggara Province
4.2.10
Jumlah Peserta KB Aktif dan Baru menurut Alat Kontrasepsi yang Digunakan, 2012 Tabel
Table Number of Active and Newly Acceptors of Family Planning Programme by Type of Contraception Device Used, 2012
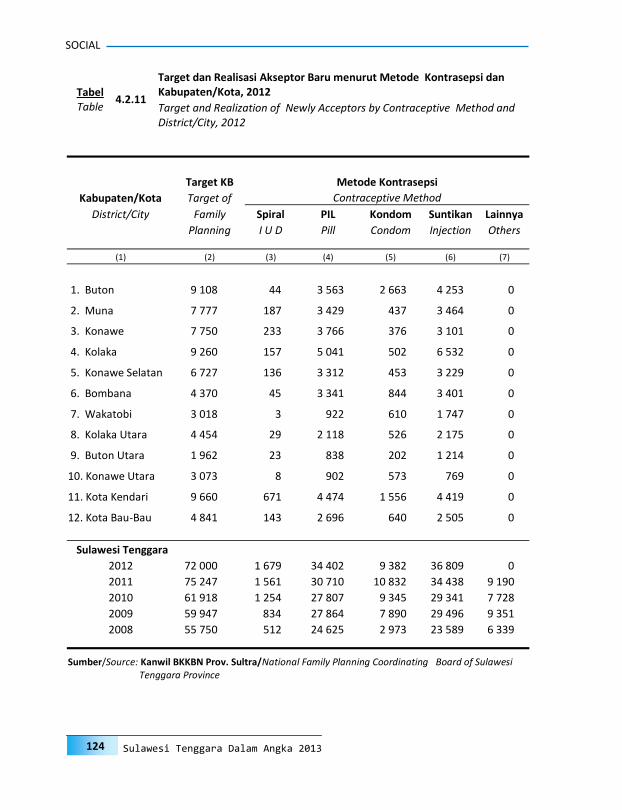
SOCIAL
124 Sulawesi Tenggara Dalam Angka 2013
Target KB Metode Kontrasepsi
Kabupaten/Kota Target of Contraceptive Method
District/City Family Spiral PIL Kondom Suntikan Lainnya
Planning I U D Pill Condom Injection Others
(1) (2) (3) (4) (5) (6) (7)
1. Buton 9 108 44 3 563 2 663 4 253 0
2. Muna 7 777 187 3 429 437 3 464 0
3. Konawe 7 750 233 3 766 376 3 101 0
4. Kolaka 9 260 157 5 041 502 6 532 0
5. Konawe Selatan 6 727 136 3 312 453 3 229 0
6. Bombana 4 370 45 3 341 844 3 401 0
7. Wakatobi 3 018 3 922 610 1 747 0
8. Kolaka Utara 4 454 29 2 118 526 2 175 0
9. Buton Utara 1 962 23 838 202 1 214 0
10. Konawe Utara 3 073 8 902 573 769 0
11. Kota Kendari 9 660 671 4 474 1 556 4 419 0
12. Kota Bau-Bau 4 841 143 2 696 640 2 505 0
Sulawesi Tenggara
2012 72 000 1 679 34 402 9 382 36 809 0
2011 75 247 1 561 30 710 10 832 34 438 9 190
2010 61 918 1 254 27 807 9 345 29 341 7 728
2009 59 947 834 27 864 7 890 29 496 9 351
2008 55 750 512 24 625 2 973 23 589 6 339
Sumber/Source: Kanwil BKKBN Prov. Sultra/National Family Planning Coordinating Board of Sulawesi Tenggara Province
4.2.11
Target dan Realisasi Akseptor Baru menurut Metode Kontrasepsi dan Kabupaten/Kota, 2012 Tabel
Table Target and Realization of Newly Acceptors by Contraceptive Method and District/City, 2012

SOCIAL
125 Sulawesi Tenggara in Figures 2013
Kabupaten/Kota District/City
Jumlah PUS
Number of Fertile Age Cou-
ple
Peserta KB Aktif Actively Family Planning User
IUD IUD
MOW Tubect
omy
MOP Vasec-tomy
Kondom Condom
Implant Implant
Suntikan Injection
Pil Pills
Jumlah Total
(1) (2) (3) (4) (5) (6) (7) (8) (9) (10)
1. B u t o n 49 244 233 277 69 5 116 1 086 16 340 12 466 35 587
2. M u n a 44 679 741 412 705 828 3 169 13 974 19 006 38 835
3. Konawe 49 164 975 1 448 129 568 8 023 11 321 13 440 35 904
4. Kolaka 58 753 1 253 808 65 1 090 5 663 13 987 12 730 35 596
5. Konawe Selatan 54 364 794 850 375 880 8 622 14 891 13 846 40 258
6. Bombana 28 361 92 53 22 973 2 587 9 637 8 787 22 151
7. Wakatobi 20 665 153 22 0 1 640 1 627 9 610 4 095 17 147
8. Kolaka Utara 22 841 109 93 2 1 382 1 736 7 457 7 341 18 120
9. Buton Utara 10 696 58 22 10 537 631 4 517 2 710 8 485
10. Konawe Utara 11 157 139 86 13 1 352 2 158 2 886 2 696 9 330
11. Kota Kendari 49 061 3 025 1 663 86 1 571 4 767 13 874 15 302 40 288
12. Kota Bau-Bau 25 458 724 515 19 1 853 2 442 6 505 5 906 17 964
Sulawesi Tenggara 424 443 14 545 7 744 19 285 60 301 167 510 243 324 437 990 319 665
4.2.12
Jumlah Pasangan Usia Subur dan Peserta KB Aktif Menurut Kabupaten/Kota di Provinsi Sulawesi Tenggara, 2012 Tabel
Table Number of Fertile Age Couple and Actively Family Planning User by District/City in Sulawesi Tenggara Province, 2012
Sumber/Source: Kanwil BKKBN Prov. Sultra/National Family Planning Coordinating Board of Sulawesi Tenggara Province

SOCIAL
126 Sulawesi Tenggara Dalam Angka 2013
Kabupaten/Kota District/City
Tenaga Medis Medical Personel
Dokter Doctor
Bidan Midwife
PPLKB Field FP
Counselor
Penyuluh K B Family
Planning Counselor
Penyuluh Para Medis Paramedic Counselor
(1) (2) (3) (4) (5) (6)
1. Buton 6 15 21 29 1
2. Muna 7 34 33 15 1
3. Konawe 11 33 30 86 0
4. Kolaka 4 20 20 24 1
5. Konawe Selatan 6 31 16 24 0
6. Bombana 0 0 22 44 0
7. Wakatobi 0 0 8 31 0
8. Kolaka Utara 10 17 15 18 0
9. Buton Utara 0 25 6 30 0
10. Konawe Utara 0 0 146 5 2
11. Kota Kendari 9 27 10 44 6
12. Kota Bau-Bau 0 0 7 12 2
Sulawesi Tenggara
2 0 1 2 53 202 334 362 13
2 0 1 1 241 932 198 389 1 106
2 0 1 0 327 1 154 117 75 12
2 0 0 9 327 1 154 117 75 0
2 0 0 8 142 668 98 186 4
Sumber/Source: Kanwil BKKBN Prov. Sultra/National Family Planning Coordinating Board of Sulawesi Tenggara Province
4.2.13
Jumlah Tenaga Medis Pengelola Program KB menurut Kabupaten/Kota, 2012 Tabel
Table Number of Medical Personel of Family Planning Program by District/City, 2012

SOCIAL
127 Sulawesi Tenggara in Figures 2013
Golongan Umur Laki-Laki Perempuan Jumlah
Age Group M a l e Female T o t a l
(1) (2) (3) (4)
1. Sampai dengan 15 Tahun
4
- 4
15 years of Age and under
2. 16 - 20 tahun
17
- 17
16-20 years of Age
3. 21 tahun ke atas
62
25 87
21 years of Age and over
Sulawesi Tenggara
2 0 1 2 83 25 108
2 0 1 1 129 9 138
2 0 1 0 70 2 72
2 0 0 9 122 21 143
2 0 0 8 60 12 72
Sumber/Source: Pengadilan Tinggi Prov. Sultra/ High Court of Sulawesi Tenggara Province
4.3.1
Jumlah Terdakwa/Tertuduh yang Telah Diajukan ke Sidang Pengadilan menurut Golongan Umur dan Jenis Kelamin, 2012 Tabel
Table Number of Defendants Brought in The Court of Law by Age Group and Sex, 2012
4.3. Peradilan
Justices
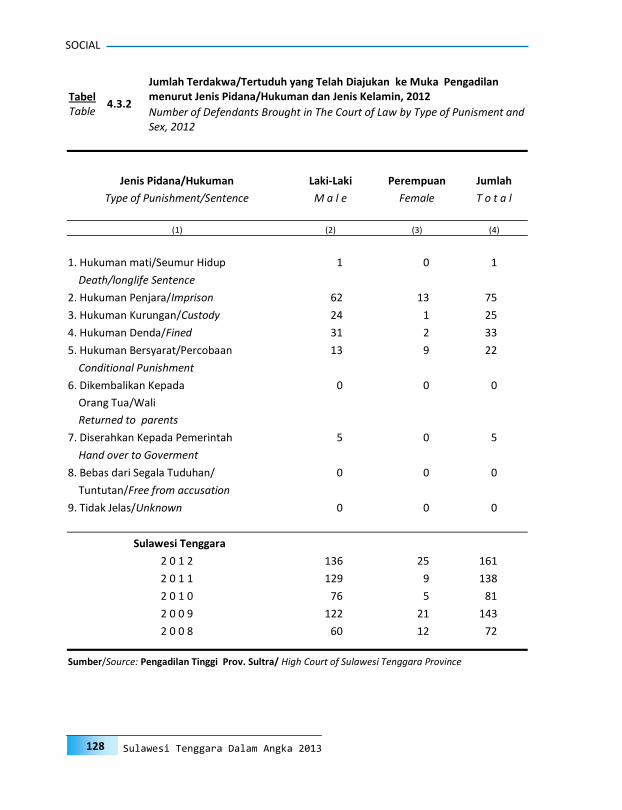
SOCIAL
128 Sulawesi Tenggara Dalam Angka 2013
Jenis Pidana/Hukuman Laki-Laki Perempuan Jumlah
Type of Punishment/Sentence M a l e Female T o t a l
(1) (2) (3) (4)
1. Hukuman mati/Seumur Hidup 1 0 1
Death/longlife Sentence
2. Hukuman Penjara/Imprison 62 13 75
3. Hukuman Kurungan/Custody 24 1 25
4. Hukuman Denda/Fined 31 2 33
5. Hukuman Bersyarat/Percobaan 13 9 22
Conditional Punishment
6. Dikembalikan Kepada 0 0 0
Orang Tua/Wali
Returned to parents
7. Diserahkan Kepada Pemerintah 5 0 5
Hand over to Goverment
8. Bebas dari Segala Tuduhan/ 0 0 0
Tuntutan/Free from accusation
9. Tidak Jelas/Unknown 0 0 0
Sulawesi Tenggara
2 0 1 2 136 25 161
2 0 1 1 129 9 138
2 0 1 0 76 5 81
2 0 0 9 122 21 143
2 0 0 8 60 12 72
Sumber/Source: Pengadilan Tinggi Prov. Sultra/ High Court of Sulawesi Tenggara Province
4.3.2
Jumlah Terdakwa/Tertuduh yang Telah Diajukan ke Muka Pengadilan menurut Jenis Pidana/Hukuman dan Jenis Kelamin, 2012 Tabel
Table Number of Defendants Brought in The Court of Law by Type of Punisment and Sex, 2012
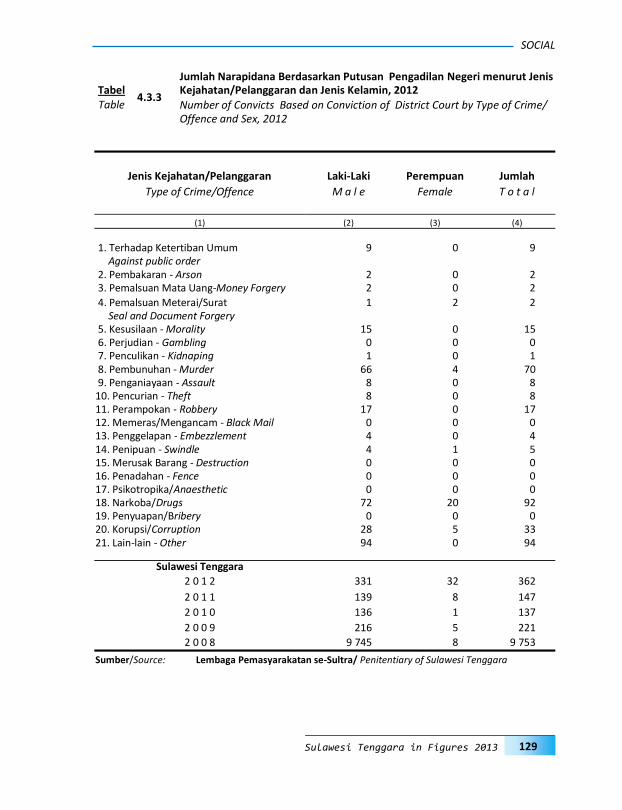
SOCIAL
129 Sulawesi Tenggara in Figures 2013
Jenis Kejahatan/Pelanggaran Laki-Laki Perempuan Jumlah
Type of Crime/Offence M a l e Female T o t a l
(1) (2) (3) (4)
1. Terhadap Ketertiban Umum 9 0 9 Against public order 2. Pembakaran - Arson 2 0 2 3. Pemalsuan Mata Uang-Money Forgery 2 0 2
4. Pemalsuan Meterai/Surat 1 2 2 Seal and Document Forgery 5. Kesusilaan - Morality 15 0 15 6. Perjudian - Gambling 0 0 0 7. Penculikan - Kidnaping 1 0 1 8. Pembunuhan - Murder 66 4 70 9. Penganiayaan - Assault 8 0 8 10. Pencurian - Theft 8 0 8 11. Perampokan - Robbery 17 0 17 12. Memeras/Mengancam - Black Mail 0 0 0 13. Penggelapan - Embezzlement 4 0 4 14. Penipuan - Swindle 4 1 5 15. Merusak Barang - Destruction 0 0 0 16. Penadahan - Fence 0 0 0 17. Psikotropika/Anaesthetic 0 0 0 18. Narkoba/Drugs 72 20 92 19. Penyuapan/Bribery 0 0 0 20. Korupsi/Corruption 28 5 33 21. Lain-lain - Other 94 0 94
Sulawesi Tenggara
2 0 1 2 331 32 362
2 0 1 1 139 8 147
2 0 1 0 136 1 137
2 0 0 9 216 5 221
2 0 0 8 9 745 8 9 753
Sumber/Source: Lembaga Pemasyarakatan se-Sultra/ Penitentiary of Sulawesi Tenggara
4.3.3
Jumlah Narapidana Berdasarkan Putusan Pengadilan Negeri menurut Jenis Kejahatan/Pelanggaran dan Jenis Kelamin, 2012 Tabel
Table Number of Convicts Based on Conviction of District Court by Type of Crime/Offence and Sex, 2012

SOCIAL
130 Sulawesi Tenggara Dalam Angka 2013
Kabupaten Laki-Laki Perempuan Jumlah
District M a l e Female T o t a l
(1) (2) (3) (4)
1. Buton 0 0 0
2. Muna 0 0 0
3. Konawe 0 0 0
4. Kolaka 0 0 0
5. Konawe selatan 0 0 0
6. Bombana 0 0 0
7. Wakatobi 0 0 0
8. Kolaka Utara 0 0 0
9. Buton Utara 0 0 0
10. Konawe Utara 0 0 0
11. Kota Kendari 330 32 362
12. Kota Bau-Bau 0 0 0
Sulawesi Tenggara
2 0 1 2 330 32 362
2 0 1 1 139 8 147
2 0 1 0 64 1 65
2 0 0 9 84 5 89
2 0 0 8 -- -- 9 753
Sumber/Source: Lembaga Pemasyarakatan se-Sultra/ Penitentiary of Sulawesi Tenggara
4.3.4
Jumlah Narapidana Berdasarkan Putusan Pengadilan menurut Kabupaten dan Jenis Kelamin, 2012 Tabel
Table Number of Convicts Based on Conviction by District/City and Sex, 2012

SOCIAL
131 Sulawesi Tenggara in Figures 2013
Kabupaten/Kota District/City Jenis Kejahatan
Type of Crime Polda Buton Muna Konawe Kolaka Konawe Selatan Bombana
(1) (2) (3) (4) (5) (6) (7) (8)
1. Pembunuhan/Murder 1 4 5 6 5 3 3 2. Aniaya Berat/Heavy Assault 0 2 2 1 8 4 10 3. C u r a s/Burglary 0 0 2 2 15 1 2 4. C u r a t/Robbery 1 1 16 11 90 29 10 5. Curanmor/Automobil Theft 0 1 7 18 58 15 13 6. Perkosaan/Rape 0 0 10 6 6 9 5 7. Perjudian/Gambling 4 10 3 19 21 12 10 8. Perzinahan/Adultery 2 1 12 25 5 7 3 9. Pengrusakan/Destruction 14 10 129 32 22 22 9 10. Penipuan/Deception 98 7 63 81 28 32 7 11. Penggelapan/Embezzlement 59 1 24 17 38 18 19 12. Curi Biasa/Theft 6 20 78 66 43 37 31 13. Kej.Kesopanan/Ethical Violance 0 0 0 0 0 1 0 14. Aniaya ringan/Light Assault 0 0 4 18 3 9 0 15. Aniaya biasa/Assault 11 94 476 194 101 96 78 16. Palsu surat/Doc. Forgery 28 1 6 1 2 1 1 17. Serobot tanah/Snatch 7 4 13 5 7 6 8 18. Penghinaan /Humiliation 5 0 21 24 8 10 3 19. Pengeroyokan/Swarming 6 1 119 57 62 38 13 20. Lahgun sajam 1 8 20 4 9 5 26 21. Pengancaman/Threatening 0 2 91 20 23 24 10 22. PRBT tidak senang/ 16 6 49 16 0 0 4 23. Migas /Oil -Natural Gas 18 0 6 8 14 6 7 24. Kawin tidak izin /Illegal Mariage 1 1 1 3 6 6 2 25. Aniaya dlm kel/Family Assault 23 7 94 56 31 34 25 26. Kehutanan /Forestry 4 11 6 18 12 14 3 27. Pembakaran/Arson 0 1 2 2 2 4 0 28. Lain-lain/Others 75 81 329 151 134 340 110
Sulawesi Tenggara 2 0 1 2 380 274 1 588 861 753 783 412 2 0 1 1 165 223 977 752 680 359 190 2 0 1 0 196 351 691 1 002 774 449 243 2 0 0 9 85 218 661 741 817 436 301 2 0 0 8 54 213 790 427 821 210 247
Sumber/Source: Polda Prov. Sultra/Regional Police of Sulawesi Tenggara Province Catatan/Note : Curat = Pencurian Berat/ Thieft Burglary Curas = Pencurian dengan Kekerasan/Thieft Robbery Curanmor = Pencurian Kendaraan Bermotor/Automobile Thieft
4.3.5
Jumlah Kejahatan yang Dilaporkan kepada Kepolisian menurut Jenis Kejahatan dan Kabupaten/Kota, 2012 Tabel
Table Number of Crimes Reported to Police by Type of Crime and District/City, 2012

SOCIAL
132 Sulawesi Tenggara Dalam Angka 2013
Kabupaten/Kota -District/City
Jumlah Jenis Kejahatan Type of Crime Wa-
katobi Kolaka Utara
Buton Utara
Konawe Utara
Resta Kendari
Kota Bau-bau
(1) (2) (3) (4) (5) (6) (7) (8)
1. Pembunuhan/Murder 2 5 -- -- 5 5 44 2. Aniaya Berat/Heavy Assault 0 0 -- -- 1 11 39 3. C u r a s/Burglary 3 1 -- -- 73 11 110 4. C u r a t/Robbery 3 5 -- -- 355 20 541 5. Curanmor/Automobil Theft 0 6 -- -- 201 38 357 6. Perkosaan/Rape 3 2 -- -- 20 5 66 7. Perjudian/Gambling 4 4 -- -- 16 19 122 8. Perzinahan/Adultery 9 0 -- -- 18 0 82 9. Pengrusakan/Destruction 57 5 -- -- 82 38 420 10. Penipuan/Deception 20 8 -- -- 277 21 642 11. Penggelapan/Embezzlement 14 4 -- -- 122 16 332 12. Curi Biasa/Theft 25 16 -- -- 184 121 627 13. Kej.Kesopanan/Ethical Violance 1 0 -- -- 4 0 6 14. Aniaya ringan/Light Assault 0 0 -- -- 27 1 62 15. Aniaya biasa/Assault 159 30 -- -- 434 158 1 831 16. Palsu surat/Doc. Forgery 4 2 -- -- 13 1 60 17. Serobot tanah/Snatch 23 1 -- -- 49 4 127 18. Penghinaan /Humiliation 5 1 -- -- 28 11 116 19. Pengeroyokan/Swarming 8 13 -- -- 218 64 599 20. Lahgun sajam 12 7 -- -- 16 35 143 21. Pengancaman/Threatening 35 6 -- -- 62 15 288 22. PRBT tidak senang 18 0 -- -- 35 13 157 23. Migas /Oil -Natural Gas 2 3 -- -- 9 8 81 24. Kawin tidak izin /Illegal Mariage 1 1 -- -- 9 0 31 25. Aniaya dlm kel/Family Assault 19 1 -- -- 149 54 493 26. Kehutanan /Forestry 0 5 -- -- 3 8 84 27. Pembakaran/Arson 1 0 -- -- 1 0 13 28. Lain-lain/Others 64 49 -- -- 315 293 1 941
Jumlah/Total 2 0 1 2 492 175 -- -- 2 726 970 9 414 2 0 1 1 338 120 -- -- 2 425 770 3 653 2 0 1 0 375 200 -- -- 2 613 942 4 130 2 0 0 9 219 129 -- -- 2 541 959 3 848 2 0 0 8 278 91 -- -- 2 257 781 3 407
Sumber/Source: Polda Prov. Sultra/Regional Police of Sulawesi Tenggara Province
Catatan/Note : Curat = Pencurian Berat/ Thieft Burglary
Curas = Pencurian dengan Kekerasan/Thieft Robbery
Curanmor = Pencurian Kendaraan Bermotor/Automobile Thieft
4.3.5 Lanjutan Tabel
Continued Table
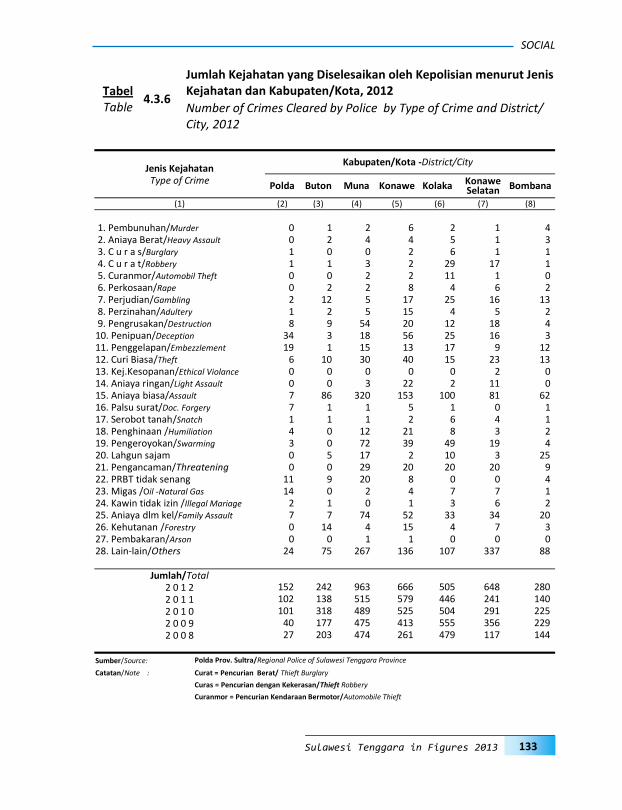
SOCIAL
133 Sulawesi Tenggara in Figures 2013
Kabupaten/Kota -District/City
Jenis Kejahatan Type of Crime Polda Buton Muna Konawe Kolaka Konawe
Selatan Bombana
(1) (2) (3) (4) (5) (6) (7) (8)
1. Pembunuhan/Murder 0 1 2 6 2 1 4 2. Aniaya Berat/Heavy Assault 0 2 4 4 5 1 3 3. C u r a s/Burglary 1 0 0 2 6 1 1 4. C u r a t/Robbery 1 1 3 2 29 17 1 5. Curanmor/Automobil Theft 0 0 2 2 11 1 0 6. Perkosaan/Rape 0 2 2 8 4 6 2 7. Perjudian/Gambling 2 12 5 17 25 16 13 8. Perzinahan/Adultery 1 2 5 15 4 5 2 9. Pengrusakan/Destruction 8 9 54 20 12 18 4 10. Penipuan/Deception 34 3 18 56 25 16 3 11. Penggelapan/Embezzlement 19 1 15 13 17 9 12 12. Curi Biasa/Theft 6 10 30 40 15 23 13 13. Kej.Kesopanan/Ethical Violance 0 0 0 0 0 2 0 14. Aniaya ringan/Light Assault 0 0 3 22 2 11 0 15. Aniaya biasa/Assault 7 86 320 153 100 81 62 16. Palsu surat/Doc. Forgery 7 1 1 5 1 0 1 17. Serobot tanah/Snatch 1 1 1 2 6 4 1 18. Penghinaan /Humiliation 4 0 12 21 8 3 2 19. Pengeroyokan/Swarming 3 0 72 39 49 19 4 20. Lahgun sajam 0 5 17 2 10 3 25 21. Pengancaman/Threatening 0 0 29 20 20 20 9 22. PRBT tidak senang 11 9 20 8 0 0 4 23. Migas /Oil -Natural Gas 14 0 2 4 7 7 1 24. Kawin tidak izin /Illegal Mariage 2 1 0 1 3 6 2 25. Aniaya dlm kel/Family Assault 7 7 74 52 33 34 20 26. Kehutanan /Forestry 0 14 4 15 4 7 3 27. Pembakaran/Arson 0 0 1 1 0 0 0 28. Lain-lain/Others 24 75 267 136 107 337 88
Jumlah/Total 2 0 1 2 152 242 963 666 505 648 280 2 0 1 1 102 138 515 579 446 241 140 2 0 1 0 101 318 489 525 504 291 225 2 0 0 9 40 177 475 413 555 356 229 2 0 0 8 27 203 474 261 479 117 144
Sumber/Source: Polda Prov. Sultra/Regional Police of Sulawesi Tenggara Province
Catatan/Note : Curat = Pencurian Berat/ Thieft Burglary
Curas = Pencurian dengan Kekerasan/Thieft Robbery
Curanmor = Pencurian Kendaraan Bermotor/Automobile Thieft
4.3.6
Jumlah Kejahatan yang Diselesaikan oleh Kepolisian menurut Jenis Kejahatan dan Kabupaten/Kota, 2012 Tabel
Table Number of Crimes Cleared by Police by Type of Crime and District/City, 2012
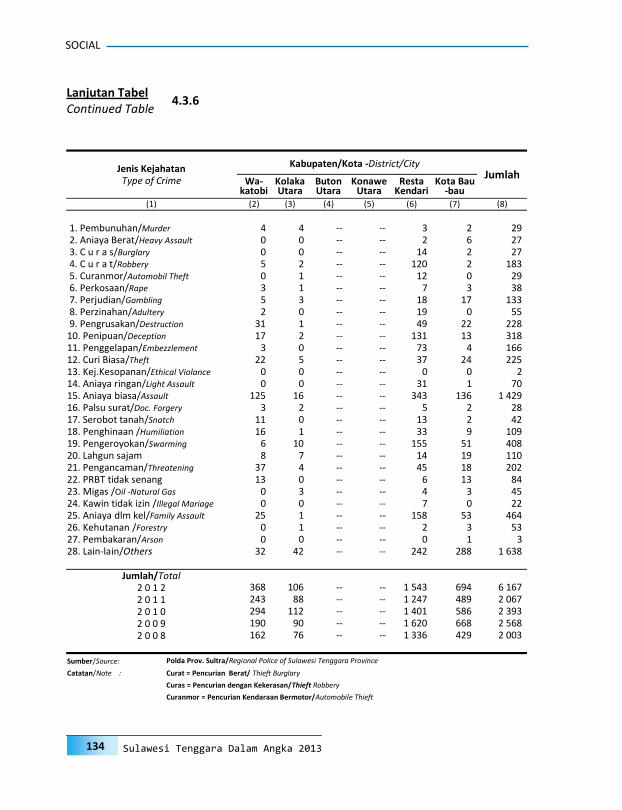
SOCIAL
134 Sulawesi Tenggara Dalam Angka 2013
Kabupaten/Kota -District/City
Jumlah Jenis Kejahatan Type of Crime Wa-
katobi Kolaka Utara
Buton Utara
Konawe Utara
Resta Kendari
Kota Bau-bau
(1) (2) (3) (4) (5) (6) (7) (8)
1. Pembunuhan/Murder 4 4 -- -- 3 2 29 2. Aniaya Berat/Heavy Assault 0 0 -- -- 2 6 27 3. C u r a s/Burglary 0 0 -- -- 14 2 27 4. C u r a t/Robbery 5 2 -- -- 120 2 183 5. Curanmor/Automobil Theft 0 1 -- -- 12 0 29 6. Perkosaan/Rape 3 1 -- -- 7 3 38 7. Perjudian/Gambling 5 3 -- -- 18 17 133 8. Perzinahan/Adultery 2 0 -- -- 19 0 55 9. Pengrusakan/Destruction 31 1 -- -- 49 22 228 10. Penipuan/Deception 17 2 -- -- 131 13 318 11. Penggelapan/Embezzlement 3 0 -- -- 73 4 166 12. Curi Biasa/Theft 22 5 -- -- 37 24 225 13. Kej.Kesopanan/Ethical Violance 0 0 -- -- 0 0 2 14. Aniaya ringan/Light Assault 0 0 -- -- 31 1 70 15. Aniaya biasa/Assault 125 16 -- -- 343 136 1 429 16. Palsu surat/Doc. Forgery 3 2 -- -- 5 2 28 17. Serobot tanah/Snatch 11 0 -- -- 13 2 42 18. Penghinaan /Humiliation 16 1 -- -- 33 9 109 19. Pengeroyokan/Swarming 6 10 -- -- 155 51 408 20. Lahgun sajam 8 7 -- -- 14 19 110 21. Pengancaman/Threatening 37 4 -- -- 45 18 202 22. PRBT tidak senang 13 0 -- -- 6 13 84 23. Migas /Oil -Natural Gas 0 3 -- -- 4 3 45 24. Kawin tidak izin /Illegal Mariage 0 0 -- -- 7 0 22 25. Aniaya dlm kel/Family Assault 25 1 -- -- 158 53 464 26. Kehutanan /Forestry 0 1 -- -- 2 3 53 27. Pembakaran/Arson 0 0 -- -- 0 1 3 28. Lain-lain/Others 32 42 -- -- 242 288 1 638
Jumlah/Total 2 0 1 2 368 106 -- -- 1 543 694 6 167 2 0 1 1 243 88 -- -- 1 247 489 2 067 2 0 1 0 294 112 -- -- 1 401 586 2 393 2 0 0 9 190 90 -- -- 1 620 668 2 568 2 0 0 8 162 76 -- -- 1 336 429 2 003
Sumber/Source: Polda Prov. Sultra/Regional Police of Sulawesi Tenggara Province
Catatan/Note : Curat = Pencurian Berat/ Thieft Burglary
Curas = Pencurian dengan Kekerasan/Thieft Robbery
Curanmor = Pencurian Kendaraan Bermotor/Automobile Thieft
4.3.6 Lanjutan Tabel
Continued Table

SOCIAL
135 Sulawesi Tenggara in Figures 2013
Korban Kecelakaan/Victims
Kabupaten/Kota Kecelakaan Meninggal Luka Luka Jumlah
District/City Accident Dunia Berat Ringan Total
Dead Seriously Slightly
Injured Injured
(1) (2) (3) (4) (5) (6)
1 Buton 71 17 27 58 102
2 Muna 147 25 23 112 160
3 Konawe 251 55 108 294 457
4 Kolaka 223 63 159 209 431
5 Konawe Selatan 152 40 89 169 298
6 Bombana 108 18 33 173 224
7 Wakatobi 33 5 23 32 60
8 Kolaka Utara 62 12 18 103 133
9 Buton Utara -- -- -- -- --
10 Konawe Utara -- -- -- -- --
11 Kota Kendari 550 58 302 423 783
12 Kota Bau-Bau 138 31 90 97 218
Sulawesi Tenggara 1 735 324 872 1 670 2 866
Sumber/Source: Direktorat Lalu Lintas Polda Prov. Sultra/Traffic Department of Sulawesi Tenggara Prov-
ince Police
4.3.7
Jumlah Kecelakaan Lalulintas yang Dilaporkan menurut Kabupaten/Kota, 2012 Tabel
Table Number of Traffic Accidents Reported by District/City, 2012

SOCIAL
136 Sulawesi Tenggara Dalam Angka 2013
Kabupaten/Kota Jumlah Kerugian Penyelesaian
District/City Kecelakaan Materiil Perkara Number of Lost Case Accident Cleared
(1) (2) (3) (4)
1. Buton 71 210 600 000 54
2. Muna 147 399 900 000 117
3. Konawe 251 756 630 000 185
4. Kolaka 223 1 134 650 000 212
5. Konawe Selatan 152 450 565 000 141
6. Bombana 108 362 300 000 90
7. Wakatobi 33 42 900 000 27
8. Kolaka Utara 62 506 750 000 65
9. Buton Utara -- -- --
10. Konawe Utara -- -- --
11. Kota Kendari 550 1 471 900 000 502
12. Kota Bau-Bau 138 123 800 000 128
1 735 5 459 995 000 1 521 Sulawesi Tenggara
Sumber/Source: Direktorat Lalu Lintas Polda Prov. Sultra/Traffic Department of Sulawesi Tenggara Prov-ince Police
4.3.8
Jumlah Kecelakaan Lalulintas yang Diselesaikan dan Taksiran Kerugian Ma-teriil menurut Kabupaten/Kota, 2012 Tabel
Table Number of Traffic Accidents Case Cleared and Total Lost Estimation by Dis-trict/City, 2012

SOCIAL
137 Sulawesi Tenggara in Figures 2013
Pidana Penjara Pidana Kurungan
Imprisonment Custody Pidana
Kabupaten/Kota Kurang 1 - 5 5 Tahun Kurang 1 - 5 5 Tahun Denda
District/City 1 Tahun Tahun Ke atas 1 Tahun Tahun Ke atas Fine
Less than 1 - 5 5 Years Less than 1 - 5 5 Years
1 Year Years & Over 1 Year Years & Over (1) (2) (3) (4) (5) (6) (7) (8)
1. Buton 155 9 0 0 0 0 0
2. M u n a 165 21 10 0 0 0 0
3. Konawe 164 28 18 0 0 0 0
4. K o l a k a 0 0 0 0 0 0
5. Konawe Selatan 115 9 2 0 0 0 0
6. Bombana 0 0 0 0 0 0 0
7. Wakatobi 185 14 3 0 0 0 0
8. Kolaka Utara 94 17 5 0 0 0 0
9. Buton Utara 0 0 0 0 0 0 0
10. Konawe Utara 0 0 0 0 0 0 0
11. Kota Kendari 247 66 18 0 0 0 0
12. Kota Bau-Bau 273 71 27 0 0 0 0
Sulawesi Tenggara
2 0 1 2 1 398 235 83 0 0 0 0 2 0 1 1 1 480 279 83 0 0 0 0 2 0 1 0 0 7 0 0 0 0 0 2 0 0 9 - - - - - - - 2 0 0 8 1 107 227 45 76 -- -- 27 2 0 0 7 869 172 37 36 23 3 0 2 0 0 6 896 242 -- -- -- -- --
Sumber/Source: Kejaksaan Tinggi Prov. Sultra/The High Prosecutor of Sulawesi Tenggara Province Catatan/Note : Bau-Bau wilayah hukum mencakup Bombana/Bau-bau Law Territorial covers Bombana
Raha wilayah hukum mencakup Buton Utara /Raha Law Territorial covers Buton Utara
4.3.9
Jumlah Pidana Penjara, Pidana Kurungan dan Pidana Denda (Pidana
Umum) yang Diajukan menurut Kabupaten, 2012 Tabel Table Number of Imprisonment, Custody and Fine Sentence Proposed by District/
City 2012

SOCIAL
138 Sulawesi Tenggara Dalam Angka 2013
Pidana Penjara Pidana Kurungan
Imprisonment Custody Pidana Kabupaten/Kota Kurang 1 - 5 5 Tahun Kurang 1 - 5 5 Tahun Denda
District/City 1 Tahun Tahun Ke atas 1 Tahun Tahun Ke atas Fine Less than 1 - 5 5 Years Less than 1 - 5 5 Years 1 Year Years & Over 1 Year Years & Over
(1) (2) (3) (4) (5) (6) (7) (8)
1. Buton 155 9 0 0 0 0 0
2. M u n a 165 21 10 0 0 0 0
3. Konawe 164 28 18 0 0 0 0
4. K o l a k a 0 0 0 0 0 0 0
5. Konawe Selatan 115 9 2 0 0 0 0
6. Bombana 0 0 0 0 0 0 0
7. Wakatobi 185 14 3 0 0 0 0
8. Kolaka Utara 94 17 5 0 0 0 0
9. Buton Utara 0 0 0 0 0 0 0
10. Konawe Utara 0 0 0 0 0 0 0
11. Kota Kendari 247 66 18 0 0 0 0
12. Kota Bau-Bau 273 71 27 0 0 0 0
Sulawesi Tenggara
2 0 1 2 1 398 235 83 0 0 0 0
2 0 1 1 1 480 279 83 0 0 0 0
2 0 1 0 0 7 0 0 0 0 0
2 0 0 9 0 0 0 0 0 0 0
2 0 0 8 1 107 227 45 76 -- -- 27
2 0 0 7 869 172 37 36 23 3 0
Sumber/Source: Kejaksaan Tinggi Prov. Sultra/The High Prosecutor of Sulawesi Tenggara Province Catatan/Note : Bau-Bau wilayah hukum mencakup Bombana/Bau-bau Law Territorial covers Bombana
Raha wilayah hukum mencakup Buton Utara /Raha Law Territorial covers Buton Utara
4.3.10
Jumlah Kasus Tahanan yang Diselesaikan menurut Jenis Penyelesaian dan Tindak Pidana 2012 Tabel
Table Number of Prisoners Cases Solved by Type of Solving and Criminal Act 2012

SOCIAL
139 Sulawesi Tenggara in Figures 2013
Kabupaten/Kota District/City
Tempat Peribadatan Places Worship Facilities
Gereja Gereja
Masjid Mushala Katholik Protestan Pura Vihara
Mosque Musholla Catholic protestan Temple Monastery
Church Church
(1) (2) (3) (4) (5) (6) (7)
1. Buton 195 - 4 8 13 1
2. Muna 251 - 12 18 33 2
3. Konawe 381 12 10 48 30 4
4. Kolaka 473 68 9 64 40 1
5. Konawe Selatan 306 7 11 51 69 6
6. Bombana 222 - 2 7 10 -
7. Wakatobi 132 10 - - - -
8. Kolaka Utara 216 63 - 19 - -
9. Buton Utara 58 10 - 5 - -
10. Konawe Utara 147 - 3 7 16 1
11. Kota Kendari 284 47 3 38 1 3
12. Kota Bau-Bau 104 31 2 8 5 1
Sulawesi Tenggara
2 0 1 2 2 769 248 56 273 217 19
2 0 1 1 2 665 248 66 110 217 15
2 0 1 0 2 843 248 78 152 217 17
2 0 0 9 2 686 705 71 111 217 16
2 0 0 8 2 599 528 220 55 178 7
2 0 0 7 2 614 503 60 111 196 15
Sumber/Source: Kanwil Departemen Agama Prov. Sultra/Regional Office of Religious Affairs Ministry of Sulawesi Tenggara Province
4.4.1 Tempat Peribadatan menurut Kabupaten/Kota, 2012 Tabel
Table Number of Worship Place by District/City, 2012
4.4. Agama
Religion

SOCIAL
140 Sulawesi Tenggara Dalam Angka 2013
Kabupaten/Kota 2008 2009 2010 2011 2012
District/City
(1) (3) (4) (5) (6) (7)
1. B u t o n 31 56 62 61 64
2. M u n a 74 57 50 50 80
3. Konawe 118 137 154 158 115
4. K o l a k a 427 385 446 442 457
5. Konawe Selatan 28 44 51 51 29
6. Bombana 148 129 81 81 107
7. Wakatobi 81 69 71 70 72
8. Kolaka Utara 116 173 61 60 107
9. Buton Utara - 0 0 0 1
10. Konawe Utara - 0 4 0 1
11. Kota Kendari 529 565 681 681 455
12. Kota Bau-Bau 142 187 194 194 192
1 694 1 802 1 855 1 848 1 680 Sulawesi Tenggara
Sumber/Source: Kanwil Departemen Agama Prov. Sultra/Regional Office of Religious Affairs Ministry of
Sulawesi Tenggara Province
4.4.2 Jumlah Jemaah Haji menurut Kabupaten/Kota, 2008 - 2012 Tabel
Table Number of Al Hajj Pilgrims by District/City, 2008 - 2012

SOCIAL
141 Sulawesi Tenggara in Figures 2013
Kabupaten/Kota Talak Cerai Nikah/Rujuk
District/City Separate Divorce Marriage/
(1) (2) (3) (4)
1. B u t o n 23 59 --
2. M u n a 61 123 --
3. Konawe 39 140 --
4. K o l a k a 80 200 --
5. Konawe Selatan 10 54 --
6. Bombana 0 0 --
7. Wakatobi 0 0 --
8. Kolaka Utara 0 0 --
9. Buton Utara 0 0 --
10. Konawe Utara 0 0 --
11. Kota Kendari 123 310 105
12. Kota Bau-Bau 79 225 --
Sulawesi Tenggara
2 0 1 2 415 1 111 105
2 0 1 1 349 899 19 549
2 0 1 0 370 872 18 845
2 0 0 9 0 0 17 421
2 0 0 8 150 392 13 892
Sumber/Source: - Kanwil Departemen Agama Prov. Sultra/Regional Office of Religious Affairs Ministry of Sulawesi Tenggara Province
- Pengadilan Tinggi Agama Prov. Sultra/High Court religions of Sulawesi Tenggara Province
4.4.3 Nikah, Talak, Cerai dan Rujuk menurut Kabupaten/Kota, 2012 Tabel
Table Number of Marriages, Divorces, and Reconciliations by District/City, 2012
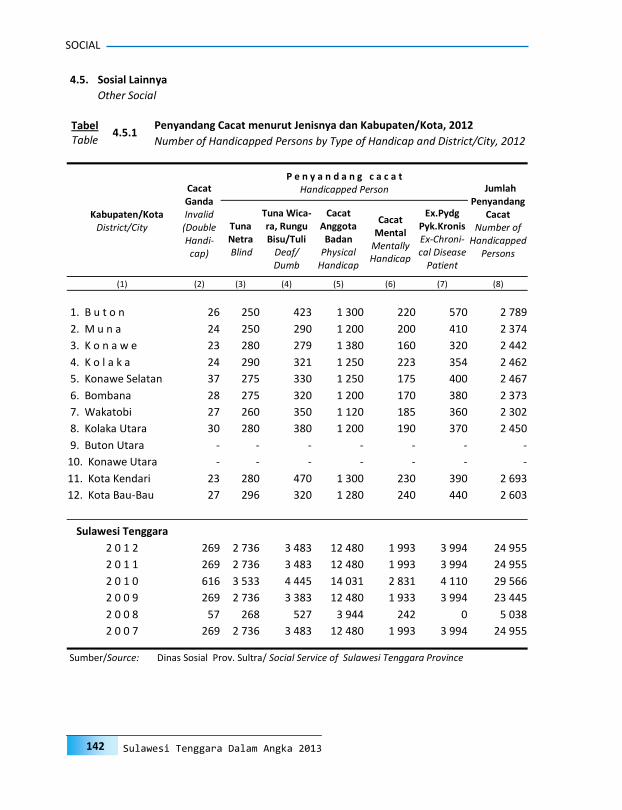
SOCIAL
142 Sulawesi Tenggara Dalam Angka 2013
Kabupaten/Kota District/City
Cacat Ganda Invalid (Double Handi-
cap)
P e n y a n d a n g c a c a t Handicapped Person Jumlah
Penyandang Cacat
Number of Handicapped
Persons
Tuna Netra Blind
Tuna Wica- ra, Rungu Bisu/Tuli
Deaf/Dumb
Cacat Anggota Badan
Physical Handicap
Cacat Mental
Mentally Handicap
Ex.Pydg Pyk.Kronis Ex-Chroni- cal Disease
Patient
(1) (2) (3) (4) (5) (6) (7) (8)
1. B u t o n 26 250 423 1 300 220 570 2 789
2. M u n a 24 250 290 1 200 200 410 2 374
3. K o n a w e 23 280 279 1 380 160 320 2 442
4. K o l a k a 24 290 321 1 250 223 354 2 462
5. Konawe Selatan 37 275 330 1 250 175 400 2 467
6. Bombana 28 275 320 1 200 170 380 2 373
7. Wakatobi 27 260 350 1 120 185 360 2 302
8. Kolaka Utara 30 280 380 1 200 190 370 2 450
9. Buton Utara - - - - - - -
10. Konawe Utara - - - - - - -
11. Kota Kendari 23 280 470 1 300 230 390 2 693
12. Kota Bau-Bau 27 296 320 1 280 240 440 2 603
Sulawesi Tenggara
2 0 1 2 269 2 736 3 483 12 480 1 993 3 994 24 955
2 0 1 1 269 2 736 3 483 12 480 1 993 3 994 24 955
2 0 1 0 616 3 533 4 445 14 031 2 831 4 110 29 566
2 0 0 9 269 2 736 3 383 12 480 1 933 3 994 23 445
2 0 0 8 57 268 527 3 944 242 0 5 038
2 0 0 7 269 2 736 3 483 12 480 1 993 3 994 24 955
4.5.1 Penyandang Cacat menurut Jenisnya dan Kabupaten/Kota, 2012 Tabel
Table Number of Handicapped Persons by Type of Handicap and District/City, 2012
Sumber/Source: Dinas Sosial Prov. Sultra/ Social Service of Sulawesi Tenggara Province
4.5. Sosial Lainnya
Other Social
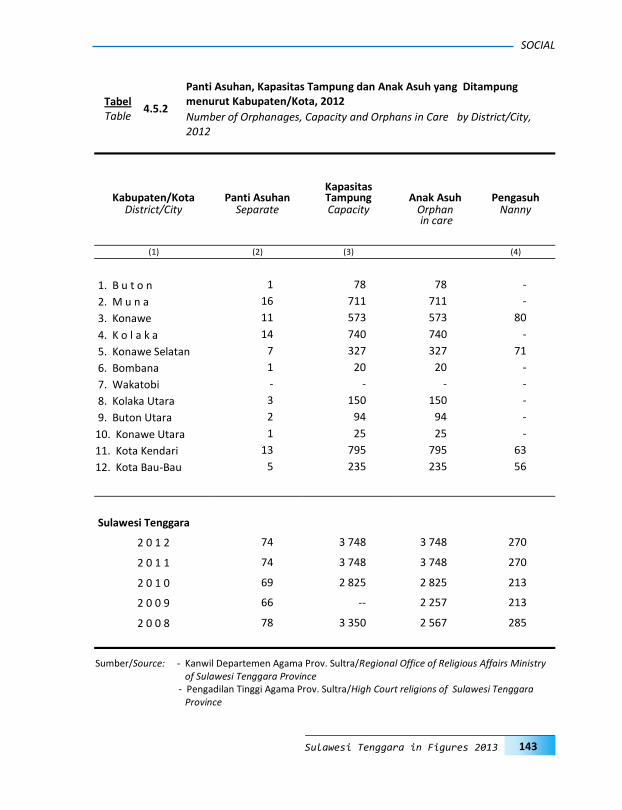
SOCIAL
143 Sulawesi Tenggara in Figures 2013
Kabupaten/Kota Panti Asuhan Kapasitas Tampung Anak Asuh Pengasuh
District/City Separate Capacity Orphan in care
Nanny
(1) (2) (3) (4)
1. B u t o n 1 78 78 -
2. M u n a 16 711 711 -
3. Konawe 11 573 573 80
4. K o l a k a 14 740 740 -
5. Konawe Selatan 7 327 327 71
6. Bombana 1 20 20 -
7. Wakatobi - - - -
8. Kolaka Utara 3 150 150 -
9. Buton Utara 2 94 94 -
10. Konawe Utara 1 25 25 -
11. Kota Kendari 13 795 795 63
12. Kota Bau-Bau 5 235 235 56
Sulawesi Tenggara
2 0 1 2 74 3 748 3 748 270
2 0 1 1 74 3 748 3 748 270
2 0 1 0 69 2 825 2 825 213
2 0 0 9 66 -- 2 257 213
2 0 0 8 78 3 350 2 567 285
Sumber/Source: - Kanwil Departemen Agama Prov. Sultra/Regional Office of Religious Affairs Ministry of Sulawesi Tenggara Province
- Pengadilan Tinggi Agama Prov. Sultra/High Court religions of Sulawesi Tenggara Province
4.5.2
Panti Asuhan, Kapasitas Tampung dan Anak Asuh yang Ditampung menurut Kabupaten/Kota, 2012 Tabel
Table Number of Orphanages, Capacity and Orphans in Care by District/City, 2012

SOCIAL
144 Sulawesi Tenggara Dalam Angka 2013
Kabupaten/Kota District/City
Jenis Kelamin
L/P Sex M/F
Tingkat Sekolah
Jumlah Total
Level of School
S D Elementary
School
SMTP Junior High
School
SMTA Senior High
School
Perguruan Tinggi
College/ University
(1) (2) (3) (4) (5) (6) (7)
1. Buton L/M 21 0 0 0 21 P/F 9 0 0 0 9
2. Muna L/M 76 23 147 0 246 P/F 79 27 114 0 220
3. Konawe L/M 113 15 96 0 224 P/F 87 19 100 0 206
4. Kolaka L/M 172 69 23 0 264 P/F 199 42 35 0 276
5. Konawe Selatan L/M 67 23 57 0 147 P/F 46 26 31 0 103
6. Bombana L/M 20 0 0 0 20 P/F 0 0 0 0 0
7. Wakatobi L/M 0 0 0 0 0 P/F 0 0 0 0 0
8. Kolaka Utara L/M 14 9 17 0 40
P/F 14 8 13 0 35
9. Buton Utara L/M 5 37 7 0 49 P/F 7 33 5 0 45
10.Konawe Utara L/M 0 7 5 0 12 P/F 0 13 0 0 13
11. Kota Kendari L/M 110 79 89 0 278 P/F 161 69 152 0 382
12. Kota Bau-Bau L/M 72 37 14 0 123
P/F 41 20 51 0 112
Sulawesi Tenggara Laki-laki/Male 670 299 455 0 1 424
Perempuan/Female 643 257 501 0 1 401 Jumlah/Total 1 313 556 956 0 2 825
Sumber/Source: Dinas Sosial Prov. Sultra/ Social Service of Sulawesi Tenggara Province
4.5.3
Jumlah Anak Panti Asuhan yang Sedang Mengikuti Pendidikan menurut Kabupaten/Kota, Jenis Kelamin dan Tingkat Sekolah, 2012 Tabel
Table Number of Orphans Attending School by District/City, Sex and Level of School, 2012
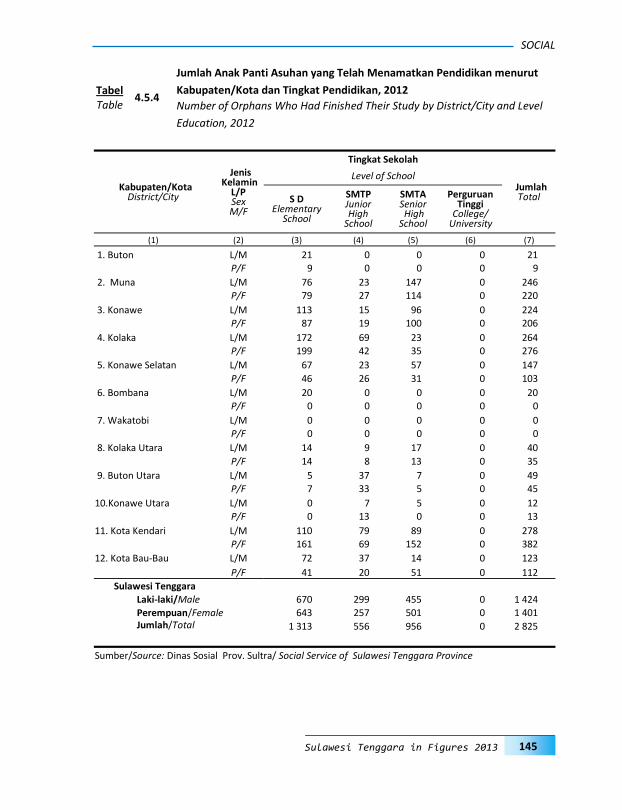
SOCIAL
145 Sulawesi Tenggara in Figures 2013
Kabupaten/Kota District/City
Jenis Kelamin
L/P Sex M/F
Tingkat Sekolah
Jumlah Total
Level of School
S D Elementary
School
SMTP Junior High
School
SMTA Senior High
School
Perguruan Tinggi
College/ University
(1) (2) (3) (4) (5) (6) (7)
1. Buton L/M 21 0 0 0 21 P/F 9 0 0 0 9
2. Muna L/M 76 23 147 0 246 P/F 79 27 114 0 220
3. Konawe L/M 113 15 96 0 224 P/F 87 19 100 0 206
4. Kolaka L/M 172 69 23 0 264 P/F 199 42 35 0 276
5. Konawe Selatan L/M 67 23 57 0 147
P/F 46 26 31 0 103
6. Bombana L/M 20 0 0 0 20 P/F 0 0 0 0 0
7. Wakatobi L/M 0 0 0 0 0 P/F 0 0 0 0 0
8. Kolaka Utara L/M 14 9 17 0 40
P/F 14 8 13 0 35
9. Buton Utara L/M 5 37 7 0 49 P/F 7 33 5 0 45
10.Konawe Utara L/M 0 7 5 0 12 P/F 0 13 0 0 13
11. Kota Kendari L/M 110 79 89 0 278 P/F 161 69 152 0 382
12. Kota Bau-Bau L/M 72 37 14 0 123
P/F 41 20 51 0 112
Sulawesi Tenggara Laki-laki/Male 670 299 455 0 1 424
Perempuan/Female 643 257 501 0 1 401 Jumlah/Total 1 313 556 956 0 2 825
Sumber/Source: Dinas Sosial Prov. Sultra/ Social Service of Sulawesi Tenggara Province
4.5.4
Jumlah Anak Panti Asuhan yang Telah Menamatkan Pendidikan menurut
Kabupaten/Kota dan Tingkat Pendidikan, 2012 Tabel Table Number of Orphans Who Had Finished Their Study by District/City and Level
Education, 2012
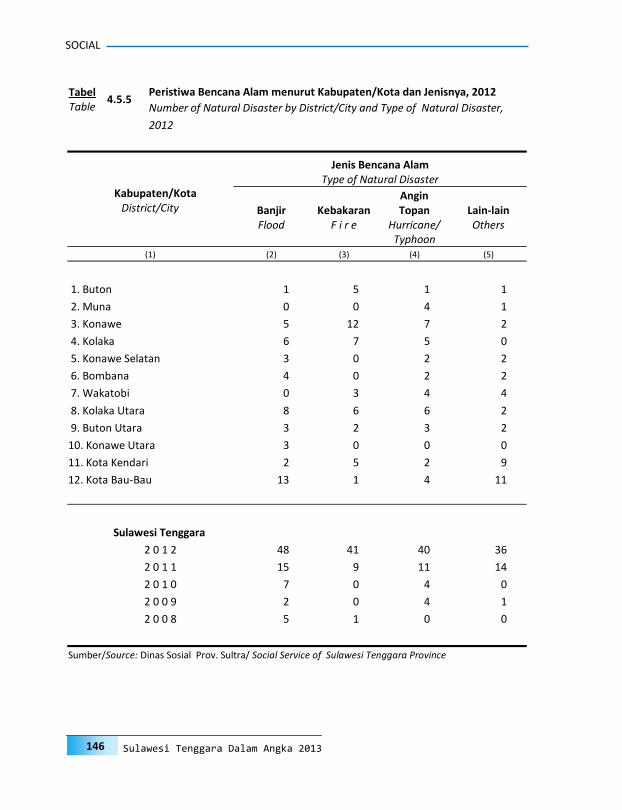
SOCIAL
146 Sulawesi Tenggara Dalam Angka 2013
Kabupaten/Kota District/City
Jenis Bencana Alam Type of Natural Disaster
Banjir Flood
Kebakaran F i r e
Angin Topan
Hurricane/ Typhoon
Lain-lain Others
(1) (2) (3) (4) (5)
1. Buton 1 5 1 1
2. Muna 0 0 4 1
3. Konawe 5 12 7 2
4. Kolaka 6 7 5 0
5. Konawe Selatan 3 0 2 2
6. Bombana 4 0 2 2
7. Wakatobi 0 3 4 4
8. Kolaka Utara 8 6 6 2
9. Buton Utara 3 2 3 2
10. Konawe Utara 3 0 0 0
11. Kota Kendari 2 5 2 9
12. Kota Bau-Bau 13 1 4 11
Sulawesi Tenggara
2 0 1 2 48 41 40 36
2 0 1 1 15 9 11 14
2 0 1 0 7 0 4 0
2 0 0 9 2 0 4 1
2 0 0 8 5 1 0 0
Sumber/Source: Dinas Sosial Prov. Sultra/ Social Service of Sulawesi Tenggara Province
4.5.5 Peristiwa Bencana Alam menurut Kabupaten/Kota dan Jenisnya, 2012 Tabel
Table Number of Natural Disaster by District/City and Type of Natural Disaster,
2012
A G R I C U L T U R EPERTANIAN5
149
AGRICULTURE
Sulawesi Tenggara in Figures 2013
PENJELASAN TEKNIS
1. Pengumpulan data Statistik Pertanian (SP) diselenggarakan oleh Badan Pusat Statistik Provinsi Sulawesi Tenggara bekerja sama dengan Dinas Pertanian.
2. Data pokok tanaman pangan yang dikumpulkan adalah luas panen dan produktivitas (hasil per hektar). Produksi tanaman pangan merupakan hasil perkalian antara luas panen dengan produktivitas. Jenis data tanaman pangan yang dikumpulkan mencakup padi sawah, padi ladang, dan palawija (jagung, kedelai, kacang tanah, kacang hijau, ubi kayu, dan ubi jalar). Pengumpulan data luas panen dilakukan setiap bulan oleh Mantri Pertanian/Kepala Cabang Dinas Kecamatan (KCD) dan dilaporkan dengan formulir Statistik Pertanian (SP). Pengumpulan data dilakukan dengan pendekatan area kecamatan di seluruh wilayah Sulawesi Tenggara. Pengumpulan data luas panen di tingkat kecamatan tersebut didasarkan pada hasil pengumpulan data dari seluruh desa/kelurahan di kecamatan bersangkutan. Pengumpulan data produktivitas tanaman pangan dilakukan melalui Survei Ubinan dengan pendekatan rumah tanggamenggunakan formulir SUB-S. Periode pengumpulan data dilakukan setiap subround (caturwulan/empat bulanan) dengan petugas lapangan adalah Mantri Statistik (Koordinator Statistik Kecamatan)/KSK dan KCD.
Pengumpulan data produktivitas dilakukan melalui pengukuran langsung pada plot ubinan berukuran 2½ m x 2½ m. Pengumpulan data produktivitas dilakukan sesuai dengan waktu panen petani.
TECHNICAL NOTES
1. Agriculture Survey is carried out by the BPS Provincial Office of Sulawesi Tenggara in cooperation with the Agriculture Office.
2. The main food crops data collected consists of area harvested and produc-tivity (yield per hectare).Food crops production is generated by area har-vested multiplied by productivity. Type of foodcrops data covers wetland pad-dy, dryland paddy and secondary food crops (maize, soybeans, peanuts, mung bean, cassava, and sweet pota-toes). The area harvested data is col-lected every month by the Agriculture Extension Workers (called KCD for Kepala Cabang Dinas) and reported in Agriculture Statistics Form(called SP for Statistik Pertanian). Data collection is conducted by using sub district area approach in all over Sulawesi Tengga-ra Province. Area harvested in each sub district is estimated based on the area harvested in each village in the sub district. Food crops productivity (yield per hectare) data are collected through the Crop Cutting Survey using SUB-S form based on household ap-proach. The data collection is conduct-ed every sub round (four monthly) with Sub District Statistics Coordinator (called KSK for Koordinator Statistik Kecamatan) and KCD as the enumera-tor.
The productivity data collection is conducted by a direct measurement in 2½ m x 2½ m crop cutting plot. The productivity measurement is conduct-ed at the time of harvest.
150
PERTANIAN
Sulawesi Tenggara Dalam Angka 2013
3. Penggunaan Tanah
Secara keseluruhan, luas daratan Provinsi Sulawesi Tenggara mencapai 3.814.000 ha, sebagian besar merupakan (digunakan sebagai) hutan negara. Penggunaan lahan diklasifikasikan ke dalam 12 kategori yaitu; sawah, tanah pekarangan/ tanah untuk bangunan dan halaman sekitarnya, tanah tegal/ kebun, tanah ladang/ huma, tanah padang rumput, tanah rawa yang tidak dapat ditanami, tanah tambak/kolam/ tebat dan empang, tanah lahan yang sementara tidak diusahakan, lahan tanaman kayu-kayuan, tanah hutan negara, tanah perkebunan dan tanah lain-lain.
Konversi lahan menunjukkan adanya dinamika pemanfaatan tanah, dimana telah terjadi peningkatan pemanfaatan lahan ladang tambak, kolam, tebat dan empang. Data lahan sawah dikumpulkan setiap akhir tahun,meliputi :
a. Sawah berpengairan teknis
Sawah yang memperoleh pengairan di-mana saluran pemberi terpisah dari salu-ran pembuang agar penyediaan dan pem-bagian irigasi dapat sepenuhnya diatur dan diukur dengan mudah. Jaringan sep-erti ini biasanya terdiri dari saluran induk, sekunder dan tersier. Saluran induk, sekunder serta bangunannya dibangun, dikuasai dan dipelihara oleh pemerintah.
b. Sawah berpengairan setengah teknis
Sawah berpengairan teknis akan tetapi pemerintah hanya menguasai bangunan penyadap untuk dapat mengatur dan mengukur pemasukan air, sedangkan jaringan selanjutnya tidak diukur dan dikuasai pemerintah.
3. Land Use
Overall, the land area of Sulawesi Tenggara covers 3,814,000 ha mostly used as state forest. The land use is-classified into 12 categories, namely: wetland, buildings and surrounding yard, wasteland/ garden, field/ shift-ing cultivation, meadows, unused swamp, dykes and water ponds, tem-porarily fallow, wooded land, forest (state forest), estates and other lands.
Conversion of land has shown dyna-mism of the land use, where there has been an increasing use of land on field, dykes, and water ponds.Wet land data is collected at the end of every year-which consists of:
a. Technical irrigated rice field
Technical irrigated rice field is a rice field whose input drainage is separat-ed from the output drainage so that the irrigation supply and division could be completely controlled and meas-ured easily. Generally this type of irri-gation consists of main, secondary and tertiary drainage. The main and sec-ondarychannel including its building are developed, controlled, and main-tained by the government.
b. Semi technical irrigated rice field
Semi technical irrigated rice field is the same as technical irrigated rice field. However, in this type of rice field, the government only controlswater flow controlling building to control and measure the input drainage, while the remaining irrigation system is not controlled by the government.
151
AGRICULTURE
Sulawesi Tenggara in Figures 2013
c. Sawah berpengairan sederhana
Sawah yang memperoleh pengairan di-mana cara pembagian dan pembuangan airnya belum teratur, walaupun pemerintah sudah ikut membangun seba-gian dari jaringan tersebut (misalnya biaya membuat bendungannya).
d. Sawah tadah hujan
Sawah yang pengairannya tergantung pada air hujan.
e. Sawah pasang surut
Sawah yang pengairannya tergantung pada air sungai yang dipengaruhi oleh pasang surutnya air laut.
f. Sawah lainnya
Rembesan-rembesan rawa yang biasanya ditanami padi.
4. Tanaman Pangan
Setidaknya terdapat delapan jenis tanaman bahan makanan yang diusahakan di Sulawesi Tenggara yaitu: padi sawah, padi ladang, jagung, ubi kayu, ubi jalar, kacang tanah, kacang kedelai dan kacang hijau.
Dalam rangka pemenuhan kebutuhan bahan makanan yang semakin meningkat setiap tahunnya, maka selain memanfaatkan produksi lokal, Depot Logistik (Dolog) Provinsi Sulawesi Tenggara telah memasok beras dari luar wilayah.
5. Produksi padi mencakup padi sawah dan padi ladang. Kualitas produksi padi dan palawija adalah: gabah kering giling (padi), pipilan kering (jagung), biji kering (kedelai dan kacang tanah), dan umbi
c. Non-technical irrigated rice field
Non-technical irrigated rice field is a rice field where the division and out-put drainage are not yet well devel-oped, although the government has already supported to develop a part of the irrigation.
d. Rain-fed rice field
Rain-fed rice field is a rice field which relies only on rainfall.
e. Tidal water rice field
Tidal water rice field is a rice field whose irrigation depends on the level of river affected by tidal water level.
f. Other rice field
Other rice field i.e. swamp for rice cultivation polder, etc.
4. Food Crops
There are at least eight types of food crops cultivated in Sulawesi Tenggara, namely: wetland paddy, dryland pad-dy, maize, cassava, sweet potato, peanut, soybean and mung bean.
In order to meet the needs of staple foods which continue to increase every year, therefore, in addition to utilization of local production, the Logistic Depot of Sulawesi Tenggara Province has been importing rice.
5. The production of paddy covers the production of wet land paddyand dry land paddy. Production of paddy and secondary crops data are presented in the form of: dry unhusked rice (paddy),

152
PERTANIAN
Sulawesi Tenggara Dalam Angka 2013
basah (ubi kayu dan ubi jalar).
6. Tanaman Buah-buahan
Data jenis tanaman buah-buahan yang diusahakan di Sulawesi Tenggara hanya disajikan 21 jenis yaitu: alpokat, mangga, rambutan (nephelium), langsat (lanzon), jeruk, jambu biji, jambu air, durian, pepaya, pisang, nenas, salak, nangka, sawo, sukun, belimbing dan sirsak, manggis, melinjo, jeruk besar dan petai.
7. Tanaman Sayur-sayuran
Data jenis tanaman sayur-sayuran meliputi dua kelompok, yaitu (1) kelompok tanaman sayur-sayuran yang dipanen lebih dari satu kali dan (2) kelompok tanaman sayur-sayuran yang dipanen sekaligus. Kelompok pertama terdiri dari sembilan jenis, yaitu: kacang panjang, cabe, tomat, terung, buncis, ketimun, labu, kangkung dan bayam. Sedangkan kelompok kedua terdiri dari enam jenis, yaitu: bawang merah, bawang putih, bawang daun, kubis, petsai/sawi dan kacang merah.
8. Tanaman sayuran dan buah-buahan semusim
a. Tanaman sayuran semusim adalah tanaman sumber vitamin, garam mineral dan lain-lain yang dikonsumsi dari bagian tanaman yang berupa daun, bunga, buah dan umbinya, yang berumur kurang dari satu tahun.
b. Tanaman buah-buahan semusim adalah tanaman sumber vitamin,
dry loose maize (maize), dry shells crops (soybeans and peanuts) and fresh roots (cassava and sweet pota-toes).
6. Fruit Plants
There are 21 types of fruit plantsthat can be presented, namely: avocado, mango, rambutan (nephelium), lang-sat (Lanzon), orange, guava, rose ap-ple, durian, papaya, banana, pineap-ple, zalacca, jackfruit, sapodilla, breadfruit, starfruit and soursop, man-gosteen, melinjo, grapefruit and petai.
7. Vegetable Plants
Vegetable plants data are differentiat-ed in two groups, i.e.: (1) the repeat-edly harvested vegetables and (2) the all at once harvested vegetables. The first group consists of nine types, namely: long beans, chili, tomatoes, eggplant, beans, cucumbers, squash, kale and spinach. Whereas the second group consists of six types, namely: red onion, garlic, scallion, cabbage, petsai/ mustard greens and red beans.
8. Seasonal vegetables and fruit plants
a. Seasonal vegetable plants are plants which are sources of vita-min, mineral salt, etc., consumed from the part of the plant in the form of leaf, flower, fruit and root with the age of less than one year.
b. Seasonal fruits plants are plants which are the sources of vitamin,
153
AGRICULTURE
Sulawesi Tenggara in Figures 2013
garam mineral dan lain-lain yang dikonsumsi dari bagian tanaman yang berupa buah, berumur kurang dari satu tahun, tidak berbentuk pohon/rumpun tetapi menjalar dan berbatang lunak.
9. Tanaman buah-buahan dan sayuran tahunan
a. Tanaman buah-buahan tahunan adalah tanaman sumber vitamin, garam mineral dan lain-lain yang dikonsumsi dari bagian tanaman yang berupa buah dan merupakan tanaman tahunan.
b. Tanaman sayuran tahunan adalah tanaman sumber vitamin, garam mineral dan lain-lain yang dikonsumsi dari bagian tanaman yang berupa daun dan atau buah yang berumur lebih dari satu tahun.
10. Luas panen adalah luas tanaman sayuran, buah buahan, biofarmaka dan tanaman hias yang diambil hasilnya/dipanen pada perode pelaporan.
11. Luas panen untuk tanaman sayuran: luas tanaman yang dipanen sekaligus/habis/dibongkar dan luas tanaman yang dipanen berkali-kali (lebih dari satu kali)/belum habis.
Tanaman yang dipanen sekaligus/habis/ dibongkar adalah tanaman yang sehabis panen langsung dibongkar/dicabut, terdiri dari bawang merah, bawang putih, bawang daun, kentang, kol/kubis, kembang kol, petsai/sawi, wortel, lobak dan kacang merah.
mineral salt, etc., consumed from the part of the plant in the form of fruits. These plants are creeps with the age of less than one year.
9. Annual fruit and vegetable plants
a. Annual fruits plants are plants which are the sources of vitamin, contained mineral salt, etc., con-sumed from the part of plant in the form of fruits and more than one year of age.
b. Annual vegetable plants are plants which are the sources of vitamin, contained mineral salt, etc., consumed from the part of the plant in the form of vegetable and more than one year of age.
10. Harvested area is an area which vege-table, fruit, medicinal and ornamental plant of crop harvested during the period of report.
11. Harvested area of vegetables: entirely plant harvested/ demolished and plant harvested several times/undemolished.
a. Entirely plants harvested/demolished are plants usually harvested once and demolished to be substituted by other plants, consisting of: shallots, garlic, leeks, potato, cabbage, cauli flower, mustard green, carrots, Chinese radish and red kidney beans.
154
PERTANIAN
Sulawesi Tenggara Dalam Angka 2013
b. Tanaman yang dipanen berkali-kali (lebih dari satu kali)/belum habis adalah tanaman yang pemanenannya lebih dari satu kali dan biasanya dibongkar apabila panenan terakhir sudah tidak memadai lagi, terdiri dari : kacang panjang, cabe besar, cabe rawit, jamur, tomat, terung, buncis, ketimun, labu siam, kangkung, bayam, melon, semangka dan blewah.
12. Produksi adalah hasil menurut bentuk produk dari setiap tanaman sayuran, buah-buahan, biofarmaka dan tanaman hias yang diambil berdasarkan luas yang dipanen pada bulan/triwulan laporan.
13. Tanaman Perkebunan
Sedikitnya terdapat 19 jenis tanaman perkebunan rakyat di Sulawesi Tenggara yaitu: kelapa dalam, kopi, kapuk, lada, pala, cengkeh, jambu mete, kemiri, coklat, enau/aren, vanili, pinang, asam jawa, tembakau, kelapa hybrida, kapas rakyat, tebu, jahe dan sagu.
Bentuk produksi perkebunan adalah; karet kering(karet), daun kering (teh dan tembakau), biji kering(kopi dan coklat), kulit kering (kayu manis dan kina),serat kering (rami), bunga kering (cengkeh), refined sugar (tebu dari perkebunan besar), gula mangkok(tebu dari perkebunan akyat), equivalent kopra(kopra), biji dan bunga (pala) serta minyak daun(sereh).
Persediaan akhir tahun produksi perkebunan besar bukan merupakan cadangan penyangga (bufferstock).
b. Plants harvested several times/undemolished are plants usually harvested more than once and demolished in the case that the last harvest was economically not profitable. They consist of: yard long beans, chili, small chili, mushroom, tomatoes, egg plant, frech beans, cucumber, pumpkin/chajota, swamp cabbage, spin-ach, melon, watermelon and blewah .
12. Production is the standard production quantity form of vegetable, fruit, me-dicinal and ornamental plant based on harvested area reported monthly/quarterly.
13. Plantation Crops
There are at least 19 types of estate crops in Sulawesi Tenggara, namely: coconut, coffee, capok, pepper, nutmeg, clove, cashew nut, candle nut, cocoa, sugar-palm, vanilla, areca nut, tamarind, tobacco, hybrid coconuts, cotton, sugar-cane, ginger and sago.
Production of estate crops are as fol-lows: dry rubber (rubber); dry leaves (tea and tobacco);dry beans (cofee and cocoa); dry bark (cassiavera and cinchona); dry fibre (rosella); dry flow-ers/buds (cloves); refined sugar (sugar cane from estate); cup sugar (sugar cane from smallholders); copra (copra); seeds and buds (nutmeg); and leaf oil (citronella).
The production availability of estates at the end of year is not the buffer stock.

155
AGRICULTURE
Sulawesi Tenggara in Figures 2013
Kehutanan
Hutan adalah sebuah kawasan atau suatu area yang luas yang ditumbuhi dengan lebat oleh pepohonan dan tanaman lainya. Hutan juga dapat dimaknai sebagai suatu kumpulan tetumbuhan, terutama pepohonan/ kayu-kayuan yang menempati suatu kawasan tertentu.
16. Data Statistik Kehutanan sebagian besar merupakan data sekunder yang bersumber dari Dinas Kehutanan.
Kawasan hutan adalah wilayah tertentu yang berupa hutan, yang ditunjuk dan atau ditetapkan oleh pemerintah untuk dipertahankan keberadaannya sebagai hutan tetap. Hal ini untuk menjamin kepastian hukum mengenai status kawasan hutan, letak batas dan luas suatu wilayah tertentu yang sudah ditunjuk menjadi kawasan hutan tetap. Kawasan hutan Indonesia ditetapkan oleh Menteri Kehutanan dalam bentuk Surat Keputusan Menteri Kehutanan tentang Penunjukan Kawasan Hutan dan Perairan Provinsi. Penunjukan Kawasan Hutan ini disusun berdasarkan hasil pemaduserasian antara Rencana Tata Ruang Wilayah Provinsi (RTRWP) dengan Tata Guna Hutan Kesepakatan (TGHK).
Penunjukan kawasan hutan mencakup pula kawasan perairan yang menjadi bagian dari Kawasan Suaka Alam (KSA) dan Kawasan Pelestarian Alam (KPA).
18. Kawasan Suaka Alam (KSA) adalah kawasan dengan ciri khas tertentu, baik di darat maupun di perairan yang
15. Forestry
Forest is an area with a high density of trees and other plants. Forests can also be interpreted as a collection of plants, especially trees / various woods that occupy an area.
16. Most of forestry statistics are second-ary data obtained from the Forestry Office.
17. Forest Area is a specific territory of forest ecosystem determined and or decided by the government as a per-manent forest. Such decisionis im-portant to maintain the size of forest area and to ensure its legitimation and boundary demarcation of permanent forest. Indonesian forest area is deter-mined by the Minister of Forestry in the format of Ministerial Decree on the Designation of Provincial Forest Area and Inland Water, Coastal and Marine Ecosystem. The designation of Forest Area is formulated based on integrated and harmonized of Provin-cial Spatial Planning (RTRWP) and Forest Land Use by Consensus (TGHK).
The designation of forest area in some cases also covers inland water,coastal and marine ecosystem that may be-come part of Sanctuary Reserve Area (KSA) and Nature Conservation Area (KPA).
18. A Sanctuary Reserve Area is a specific terrestrial or aquatic area having spe-cific criteria for preserving biodiversity
156
PERTANIAN
Sulawesi Tenggara Dalam Angka 2013
mempunyai fungsi pokok sebagai kawasan pengawetan keanekaragaman tumbuhan dan satwa serta ekosistemnya, yang juga berfungsi sebagai wilayah sistem penyangga kehidupan.
19. Kawasan Pelestarian Alam (KPA) adalah kawasan dengan ciri khas tertentu, baik di darat maupun di perairan yang mempunyai fungsi pokok perlindungan sistem penyangga kehidupan, pengawetan keanekaragaman jenis tumbuhan dan satwa, serta pemanfaatan secara lestari sumber daya alam hayati dan ekosistemnya.
20. Berdasarkan Undang-Undang No. 41 Tahun 1999 tentang Kehutanan, kawasan hutan dibagi ke dalam kelompok Hutan Konservasi, Hutan Lindung, dan Hutan Produksi dengan pengertian sebagai berikut:
Hutan konservasi adalah kawasan hutan dengan ciri khas tertentu, yang mempunyai fungsi pokok pengawetan keanekaragaman tumbuhan dan satwa serta ekosistemnya.
22. Hutan Lindung adalah kawasan hutan yang mempunyai fungsi pokok sebagai perlindungan sistem penyangga kehidupan untuk mengatur tata air, mencegah banjir, mengendalikan erosi, mencegah intrusi air laut, dan memelihara kesuburan tanah.
23. Hutan Produksi adalah kawasan hutan yang mempunyai fungsi pokok memproduksi hasil hutan. Hutan produksi terdiri dari Hutan Produksi Tetap (HP), Hutan Produksi Terbatas (HPT), dan Hutan Produksi yang dapat dikonversi.
plant and animal as well as ecosystem, which also serve as life support sys-tem.
19. A Nature Conservation area is a spe-cific terrestrial or aquatic area whose main function is to serve life support system and preserve diversity of plant and animal species, as well as to pro-vide a sustainable utilization of living resources and their ecosystems.
20. In accordance to the Act on Forestry No. 41/ 1999, forest area is catego-rized as Conservation Forest, Protec-tion Forest and Production Forest, for which is defined as follows :
Conservation forest is a forest area having specific characteristic estab-lished for the purposes of conserva-tion of animal and plant species and their ecosystem.
22. Protection Forest is a forest area des-ignated to serve life support system, maintain hydrological system, prevent of flood, erosion control, seawater intrusion, and maintain soil fertility.
23. Production forest is a forest area des-ignated mainly to promote sustainable forest production. Production forest is classified as permanent production forest, limited production forest, and convertible production forest.

157
AGRICULTURE
Sulawesi Tenggara in Figures 2013
24. Hutan konservasi terdiri dari :
1. Kawasan suaka alam berupa Cagar Alam (CA) dan Suaka Margasatwa (SM);
2. Kawasan pelestarian alam berupa Taman Nasional (TN), Taman Hutan Raya (THR), dan Taman Wisata Alam (TWA);
3. Taman Buru (TB).
25. Lahan Kritis
Penetapan lahan kritis mengacu pada lahan yang telah sangat rusak karena kehilangan penutupan vegetasinya, se-hingga kehilangan atau berkurang fungsinya sebagai penahan air, pengen-dali erosi, siklus hara, pengatur iklim mikro dan retensi karbon.
Berdasarkan kondisi vegetasinya, kondisi lahan dapat diklasifikasikan sebagai : sangat kritis, kritis, agak kritis, potensial kritis dan kondisi normal.
26. Reboisasi
Reboisasi atau rehabilitasi hutan ber-tujuan untuk menghutankan kembali kawasan hutan yang kritis di wilayah dae-rah aliran sungai (DAS) yang dilaksanakan bersama masyarakat secara partisipatif.
27. Penghijauan
Merupakan upaya merehabilitasi lahan kritis di luar kawasan hutan melalui kegiatan tanam menanam dan bangunan konservasi tanah agar dapat berfungsi sebagai unsur produksi dan sebagai me-dia pengatur tata air yang baik serta upaya mempertahankan dan meningkat-kan daya guna lahan sesuai dengan pe-runtukannya.
24. Conservation forest is divided into :
1. Sanctuary Reserve area consists of Strict Nature Reserve and Wildlife Sanctuary.
2. Nature conservation area consists of National Park (TN), Grand For-est Park (THR) and Nature Recrea-tion Park (TWA);
3. Game Hunting Park (TB)
25. Critical Lands
Critical land refers to a piece of land severely damaged due to loss of its vegetation cover so that its functions as water retention, erosion control, nutrient cycling, micro climate regula-tor and carbon retention are com-pletely depleted. Based upon its vege-tation condition, the land could be classifiedas: very critical, critical, slight critical, potential critical and normal condition.
26. Reforestation
Reforestation or forest rehabilitation is intended to rehabilitate the critical land inside forest area or watershed to improve their ecological and hydrolog-ical functions. The activities were con-ducted with active participation of local communities who live nearby the target area.
27. Regreening
Constitutes an effort to rehabilitate critical lands outside forest area by planting trees and implementing soil conservation practices. It aims to im-prove land productivity and hydrologi-cal function.
158
PERTANIAN
Sulawesi Tenggara Dalam Angka 2013
28. Pemanfaatan Hasil Hutan Kayu pada Hutan Alam
Pemanfaatan hasil hutan kayu adalah segala bentuk usaha yang memanfaatkan dan mengusahakan hasil hutan kayu dengan tidak merusak lingkungan dan tidak mengurangi fungsi pokok hutan. Kegiatan ini hanya dapat dilaksanakan pada areal hutan yang memilki potensi untuk dilakukan kegiatan pemanfaatan hasil hutan kayu dan dapat dilaksanakan setelah diperoleh izin usaha.
29. Izin Usaha Pemanfaatan Hasil Hutan Kayu (IUPHHK) pada hutan alam adalah izin untuk memanfaatkan hutan produksi yang kegiatannya terdiri dari pemanenan atau penebangan, penanaman, pemeliharaan, pengamanan, pengolahan, dan pemasaran hasil hutan kayu. IUPHHK dapat diberikan kepada perorangan, koperasi, badan usaha swasta dan BUMN/BUMD.
30. Kayu Bulat
Produksi hasil hutan utama yang dihasilkan dari hutan adalah kayu bulat. Produksi kayu bulat ini dihasilkan dari hutan alam melalui kegiatan perusahaan Hak Pengusahaan Hutan (HPH/ IUPHHK), kegiatan ijin pemanfaatan kayu (IPK) da-lam rangka pembukaan wilayah hutan, pembangunan Hutan Tanaman Industri (HTI) serta kegiatan hutan rakyat.
31. Kayu Gergajian
Merupakan kayu hasil konversi kayu bulat dengan mengunakan mesin gergaji, mempunyai bentuk yang teratur dengan sisi-sisi sejajar dan sudut sudutnya siku dengan ketebalan tidak lebih dari 6 cm dan kadar air tidak lebih dari 18 %. Kayu Gergajian yang diolah langsung dari kayu
28. Commercial Utilization of Timber in Natural Forest
Commercial utilization of timber as forest product is activities to utilize timber without destructing the envi-ronment and undermining the main functions of the forest area. Those activities could only be executed in forest area with high commercial tim-ber value with license.
29. The license to commercially utilize timber innatural forest is license to utilize production forest for which the activities consist of harvesting or felling, planting, tending, protecting, processing and marketing. The license could be granted to individuals, coop-eratives, private companies, state-owned enterprises/local government-owned enterprises.
30. Log
The main product of commercial forest operation is log. The log is harvested from various sources such as natural forest granted to concessionaires (IUPHHK/HPH), land clearing activities (IPK), industrial forest plantation (HTI) and community forest.
31. Sawn Timber
Constitutes a sawmill product derived from logs as raw material. The product is characterized with regular forms having parallel sides at right angle to each other, thickness not more than 6cm and moisture content not to ex-ceed 18 percent. Sawn timber pro-
159
AGRICULTURE
Sulawesi Tenggara in Figures 2013
bulat, wajib didukung dengan dokumen yang sah.
32. Kayu Lapis
Kayu Lapis adalah panel kayu yang ter-susun dari lapisan veneer dibagian luarnya, sedangkan dibagian intinya (core) bisa berupa veneer atau material lain, diikat dengan lem kemudian dipress (ditekan) sedemikian rupa sehingga men-jadi panel yang kuat. Termasuk dalam artian ini adalah kayu lapis yang dilapisi lagi dengan material lain.
Peternakan
Jenis ternak dikelompokkan menjadi: ternak besar, ternak kecil dan unggas. Di Sulawesi Tenggara, kelompok ternak besar terdiri dari sapi, kerbau dan kuda; Kelompok ternak kecil terdiri dari kamb-ing, domba dan babi; dan kelompok unggas terdiri dari ayam kampung, ayam ras dan itik/itik manila.
34. Data populasi ternak bersumber dari hasil SurveiPeternakan Nasional, sedangkan data jumlah pemotongan ternak merupa-kan hasil Survei Laporan Pemotongan Ternak. Pengumpulan data pemotongan ternak dilakukan secara lengkap di se-luruh Sulawesi Tenggara dari RPH (Rumah Potong Hewan) dan Keurmaster setiap triwulan.
Perikanan
Data statistik perikanan merupakan data sekunder yang bersumber dari Dinas Perikanan Statistik perikanan dibedakan atas data Perikanan Tangkap dan Peri-kanan Budidaya. Perikanan Tangkap diklasifikasikan atas penangkapan ikan di laut dan penangkapan ikan di perairan
duced directly from logs must be certi-fied by a legal document.
32. Plywood
Plywood is wood panel consisting of layers pressed together in between veneers; the core may be veneer or some other material, bound together with glue and pressed tightly together to make a strong panel. Included to this definition is plywood covered with other materials.
Livestock
Livestock types are grouped into: large cattle, small cattle and fowls. In Sula-wesi Tenggara, the large cattle consist of cows, buffaloes and horses;the small cattle consist of goats, sheep and pigs; and a fowl consistsoflocal hens, rustling hens and duck/manila-duck.
34. Data on domestic livestock population are obtained from the Directorate General of Livestock Service, while data on the number of animals slaugh-tered are based on the survey conduct-ed by BPS-quartely. This survey is a complete enumeration on all abbatoirs and keurmasters.
Fishery
Fishery Statistics are secondary data obtained from the Service of Fisheries. Fishery statistics are categorized into two : 1) capture fisheries and 2) aqua-culture. Capture fisheries are further classified into: marine capture fisher-ies and inland open water capture
160
PERTANIAN
Sulawesi Tenggara Dalam Angka 2013
umum. Perikanan Budidaya diklasifikasi-kan atas jenis budidaya yaitu budidaya laut, tambak, kolam, karamba, jaring apung dan sawah.
fisheries. Aquaculture are further clas-sified into several types of culture : marine culture; brackish water pond; fresh water pond; cage; floating net and fish breeding in paddy fields.
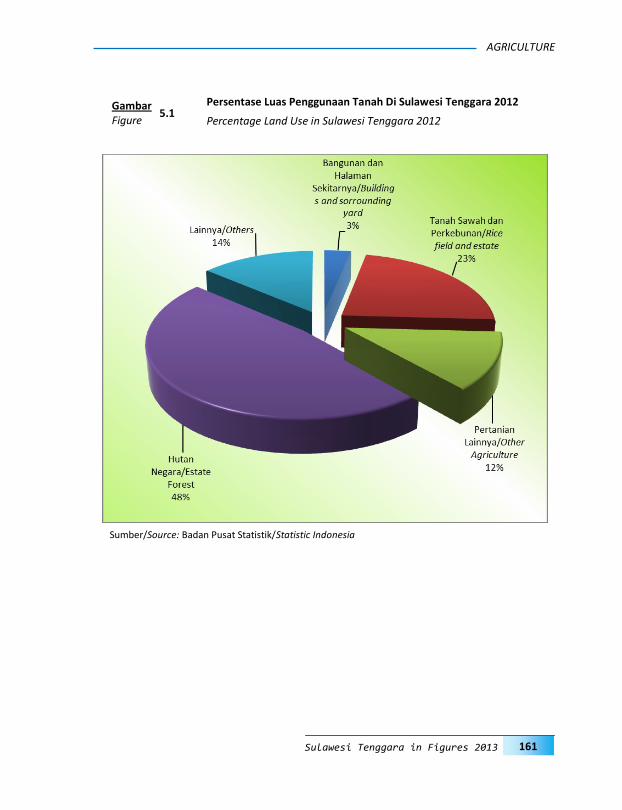
161
AGRICULTURE
Sulawesi Tenggara in Figures 2013
5.1 Persentase Luas Penggunaan Tanah Di Sulawesi Tenggara 2012 Gambar
Figure Percentage Land Use in Sulawesi Tenggara 2012
Sumber/Source: Badan Pusat Statistik/Statistic Indonesia

162
PERTANIAN
Sulawesi Tenggara Dalam Angka 2013
5.2
Luas Panen Tanaman Bahan Makanan Di Sulawesi Tenggara 2008-2012 Gambar
Figure Harvested Area of Food Crops in Sulawesi Tenggara, 2008-2012
Sumber/Source: Badan Pusat Statistik/Statistic Indonesia

163
AGRICULTURE
Sulawesi Tenggara in Figures 2013
5.3 Produksi Tanaman Bahan Makanan Di Sulawesi Tenggara, 2008-2012 Gambar
Figure Production of Food Crops in Sulawesi Tenggara, 2008-2012
Sumber/Source: Badan Pusat Statistik/Statistic Indonesia

164
PERTANIAN
Sulawesi Tenggara Dalam Angka 2013
Sumber/Source: Badan Pusat Statistik/Statistic Indonesia
5.4 Produksi Tanaman Perkebunan di Sulawesi Tenggara, 2008 –2012 Gambar
Figure Production of Plantation Crops in Sulawesi Tenggara, 2008-2012

165
AGRICULTURE
Sulawesi Tenggara in Figures 2013
5.5
Populasi Ternak Besar Menurut Jenis Ternak di Provinsi Sulawesi Tenggara 2008-2012 Gambar
Figure Population of Large Livestock by Kind of Livestock in Sylawesi Tenggara Province, 2008-2012
Sumber/Source: Dinas Pertanian Prov. Sultra/Agriculture Service of Sulawesi Tenggara Province

166
PERTANIAN
Sulawesi Tenggara Dalam Angka 2013
5.6
Persentase Luas Kawasan Hutan dan Perairan yang Telah Ditetapkan 2012 Gambar
Figure Percentage of Fixed Forest and Water Ecosystem Areas , 2012
Sumber/Source: Dinas Kehutanan Prov. Sultra/Forestry Service of Sulawesi Tenggara Province
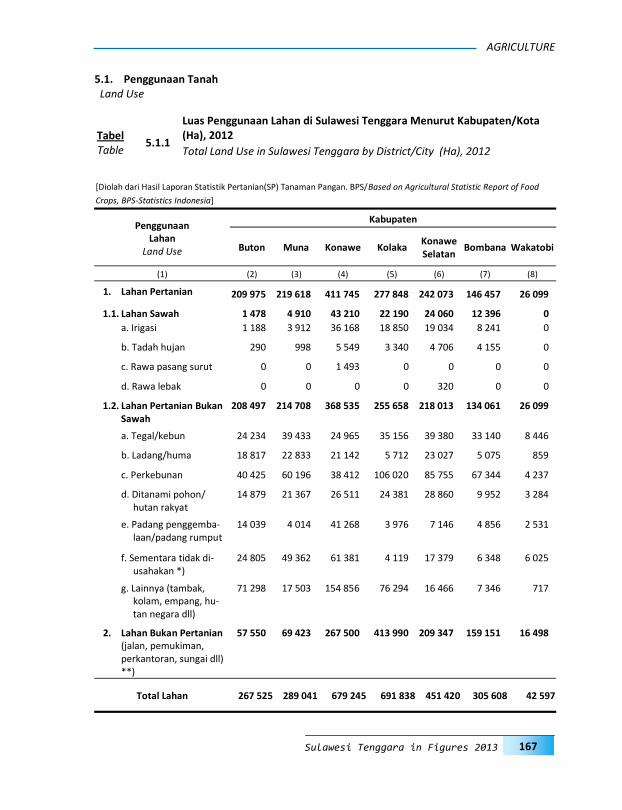
167
AGRICULTURE
Sulawesi Tenggara in Figures 2013
Penggunaan Lahan
Land Use
Kabupaten
Buton Muna Konawe Kolaka Konawe Selatan
Bombana Wakatobi
(2) (3) (4) (5) (6) (7) (8) (1)
1. Lahan Pertanian 209 975 219 618 411 745 277 848 242 073 146 457 26 099
1.1. Lahan Sawah 1 478 4 910 43 210 22 190 24 060 12 396 0
a. Irigasi 1 188 3 912 36 168 18 850 19 034 8 241 0
b. Tadah hujan 290 998 5 549 3 340 4 706 4 155 0
c. Rawa pasang surut 0 0 1 493 0 0 0 0
d. Rawa lebak 0 0 0 0 320 0 0
1.2. Lahan Pertanian Bukan Sawah
208 497 214 708 368 535 255 658 218 013 134 061 26 099
a. Tegal/kebun 24 234 39 433 24 965 35 156 39 380 33 140 8 446
b. Ladang/huma 18 817 22 833 21 142 5 712 23 027 5 075 859
c. Perkebunan 40 425 60 196 38 412 106 020 85 755 67 344 4 237
d. Ditanami pohon/hutan rakyat
14 879 21 367 26 511 24 381 28 860 9 952 3 284
e. Padang penggemba-laan/padang rumput
14 039 4 014 41 268 3 976 7 146 4 856 2 531
f. Sementara tidak di-usahakan *)
24 805 49 362 61 381 4 119 17 379 6 348 6 025
g. Lainnya (tambak, kolam, empang, hu-tan negara dll)
71 298 17 503 154 856 76 294 16 466 7 346 717
2. Lahan Bukan Pertanian (jalan, pemukiman, perkantoran, sungai dll) **)
57 550 69 423 267 500 413 990 209 347 159 151 16 498
Total Lahan 267 525 289 041 679 245 691 838 451 420 305 608 42 597
5.1.1
Luas Penggunaan Lahan di Sulawesi Tenggara Menurut Kabupaten/Kota (Ha), 2012 Tabel
Table Total Land Use in Sulawesi Tenggara by District/City (Ha), 2012
5.1. Penggunaan Tanah Land Use
[Diolah dari Hasil Laporan Statistik Pertanian(SP) Tanaman Pangan. BPS/Based on Agricultural Statistic Report of Food
Crops, BPS-Statistics Indonesia]
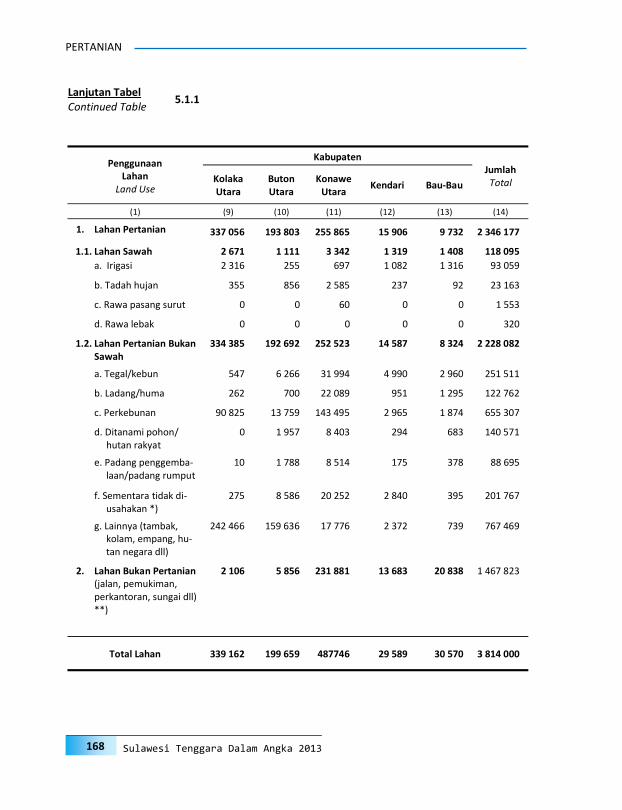
168
PERTANIAN
Sulawesi Tenggara Dalam Angka 2013
Kabupaten Jumlah Total
Penggunaan Lahan
Land Use Kolaka Utara
Buton Utara
Konawe Utara
Kendari Bau-Bau
(1) (9) (10) (11) (12) (13) (14)
1. Lahan Pertanian 337 056 193 803 255 865 15 906 9 732 2 346 177
1.1. Lahan Sawah 2 671 1 111 3 342 1 319 1 408 118 095
a. Irigasi 2 316 255 697 1 082 1 316 93 059
b. Tadah hujan 355 856 2 585 237 92 23 163
c. Rawa pasang surut 0 0 60 0 0 1 553
d. Rawa lebak 0 0 0 0 0 320
1.2. Lahan Pertanian Bukan Sawah
334 385 192 692 252 523 14 587 8 324 2 228 082
a. Tegal/kebun 547 6 266 31 994 4 990 2 960 251 511
b. Ladang/huma 262 700 22 089 951 1 295 122 762
c. Perkebunan 90 825 13 759 143 495 2 965 1 874 655 307
d. Ditanami pohon/hutan rakyat
0 1 957 8 403 294 683 140 571
e. Padang penggemba-laan/padang rumput
10 1 788 8 514 175 378 88 695
f. Sementara tidak di-usahakan *)
275 8 586 20 252 2 840 395 201 767
g. Lainnya (tambak, kolam, empang, hu-tan negara dll)
242 466 159 636 17 776 2 372 739 767 469
2. Lahan Bukan Pertanian (jalan, pemukiman, perkantoran, sungai dll) **)
2 106 5 856 231 881 13 683 20 838 1 467 823
Total Lahan 339 162 199 659 487746 29 589 30 570 3 814 000
Lanjutan Tabel Continued Table
5.1.1

169
AGRICULTURE
Sulawesi Tenggara in Figures 2013
Kabupaten Penggunaan
Lahan Land Use Buton Muna Konawe Kolaka
Konawe Selatan
Bombana Wakatobi
(1) (2) (3) (4) (5) (6) (7) (8)
1. Lahan Pertanian 78,49 75,98 60,62 40,16 53,62 47,92 61,27
1.1. Lahan Sawah 0,55 1,70 6,36 3,21 5,33 4,06 0,00
a. Irigasi 0,44 1,35 5,32 2,72 4,22 2,70 0,00
b. Tadah hujan 0,11 0,35 0,82 0,48 1,04 1,36 0,00
c. Rawa pasang surut 0,00 0,00 0,22 0,00 0,00 0,00 0,00
d. Rawa lebak 0,00 0,00 0,00 0,00 0,07 0,00 0,00
1.2. Lahan Pertanian Bukan Sawah
77,94 74,28 54,26 36,95 48,29 43,87 61,27
a. Tegal/kebun 9,06 13,64 3,68 5,08 8,72 10,84 19,83
b. Ladang/huma 7,03 7,90 3,11 0,83 5,10 1,66 2,02
c. Perkebunan 15,11 20,83 5,66 15,32 19,00 22,04 9,95
d. Ditanami pohon/hutan rakyat
5,56 7,39 3,90 3,52 6,39 3,26 7,71
e. Padang penggemba-laan/padang rumput
5,25 1,39 6,08 0,57 1,58 1,59 5,94
f. Sementara tidak di-usahakan *)
9,27 17,08 9,04 0,60 3,85 2,08 14,14
g. Lainnya (tambak, kolam, empang, hu-tan negara dll)
26,65 6,06 22,80 11,03 3,65 2,40 1,68
2. Lahan Bukan Pertanian (jalan, pemukiman, perkantoran, sungai dll) **)
21,51 24,02 39,38 59,84 46,38 52,08 38,73
Total Lahan 100,00 100,00 100,00 100,00 100,00 100,00 100,00
5.1.2
Persentase Penggunaan Lahan di Sulawesi Tenggara Menurut Kabupaten/Kota (Ha), 2012 Tabel
Table Percentage of Land Use in Sulawesi Tenggara by District/City (Ha), 2012
[Diolah dari Hasil Laporan Statistik Pertanian(SP) Tanaman Pangan. BPS/Based on Agricultural Statistic Report of Food
Crops, BPS-Statistics Indonesia]

170
PERTANIAN
Sulawesi Tenggara Dalam Angka 2013
Penggunaan Lahan
Land Use
Kabupaten Jumlah Total Kolaka
Utara Buton Utara
Konawe Utara
Kendari Bau-Bau
(9) (10) (11) (12) (13) (14) (1)
1. Lahan Pertanian 99,38 97,07 52,46 53,76 31,84 61,51
1.1. Lahan Sawah 0,79 0,56 0,69 4,46 4,61 3,10
a. Irigasi 0,68 0,13 0,14 3,66 4,30 2,44
b. Tadah hujan 0,10 0,43 0,53 0,80 0,30 0,61
c. Rawa pasang surut 0,00 0,00 0,01 0,00 0,00 0,04
d. Rawa lebak 0,00 0,00 0,00 0,00 0,00 0,01
1.2. Lahan Pertanian Bukan Sawah
98,59 96,51 51,77 49,30 27,23 58,42
a. Tegal/kebun 0,16 3,14 6,56 16,86 9,68 6,59
b. Ladang/huma 0,08 0,35 4,53 3,21 4,24 3,22
c. Perkebunan 26,78 6,89 29,42 10,02 6,13 17,18
d. Ditanami pohon/hutan rakyat
0,00 0,98 1,72 0,99 2,23 3,69
e. Padang penggemba-laan/padang rumput
0,00 0,90 1,75 0,59 1,24 2,33
f. Sementara tidak di-usahakan *)
0,08 4,30 4,15 9,60 1,29 5,29
g. Lainnya (tambak, kolam, empang, hu-tan negara dll)
71,49 79,95 3,64 8,02 2,42 20,12
2. Lahan Bukan Pertanian (jalan, pemukiman, perkantoran, sungai dll) **)
0,62 2,93 47,54 46,24 68,16 38,49
Total Lahan 100,00 100,00 100,00 100,00 100,00 100,00
Lanjutan Tabel Continued Table
5.1.2

171
AGRICULTURE
Sulawesi Tenggara in Figures 2013
2011 2012
Jenis Tanaman Type of Crops
Luas Panen
Harvested Area (Ha)
Hasil Per Hektar
Productivity (Ku/Ha)
Produksi Production
(Ton)
Luas Panen
Harvested Area (Ha)
Hasil Per Hektar
Productivity (Ku/Ha)
Produksi Production
(Ton)
(1) (2) (3) (4) (5) (6) (7)
1.1. Padi Sawah/ 110 741 42,13 466 533 114 525 42,57 487 511
Wetland-paddy
1.2. Padi Ladang/ 8 175 30,62 25 034 9 986 28,82 28 780
Dryland-paddy
1.3. J a g u n g/ 28 892 23,53 67 997 30 884 25,40 78 447
Maize
1.4. Ubi Kayu/ 9 130 180,56 164 850 9 093 193,25 175 719
Cassava
1.5. Ubi Jalar/ 3 254 81,36 26 476 3 434 85,65 29 411
Sweet Potatoe
1.6. Kacang Tanah/ 5 887 7,71 4 540 7 496 6,94 5 199
Peanut
1.7. Kacang Kedelai/ 5 814 10,51 6 113 3 870 9,59 3 710
Soybean
1.8. Kacang Hijau/ 1 899 8,04 1 527 1 325 8,12 1 076
Mung bean
5.2.1
Luas Panen, Hasil Perhektar dan Produksi Tanaman Bahan Makanan, 2011 - 2012 Tabel
Table Harvested Areas, Productivity and Production of Food Crops, 2011- 2012
5.2. Tanaman Pangan Food Crops
[Diolah dari Hasil Laporan Statistik Pertanian(SP) Tanaman Pangan dan Survei Ubinan BPS/Based on Agricultural Statistic
Report of Food Crops and Crop Cutting Survey, BPS-Statistics Indonesia]

172
PERTANIAN
Sulawesi Tenggara Dalam Angka 2013
Jenis Tanaman Type of Crops
Kabupaten/Kota - District/City
Buton Muna Konawe Kolaka Konawe Selatan
Bombana Wa-
katobi
(1) (2) (3) (4) (5) (6) (7) (8)
1. Padi/Paddy 14 155 7 817 158 430 121 581 116 543 61 451 3
1.1. Padi Sawah/ 8 115 5 846 157 612 119 474 107 919 58 981 0
Wetland Paddy
1.2. Padi Ladang/ 6 040 1 971 818 2 106 8 623 2 469 3
Dryland Paddy
2. Jagung/ 9 871 39 846 4 210 9 621 6 871 1 853 514
Maize
3. Ubi Kayu/ 63 421 27 460 10 390 11 419 16 229 5 221 9 235
Cassava
4. Ubi Jalar/ 5 239 5 486 2 870 5 670 3 507 571 79
Sweet Potatoe
5. Kacang Tanah/ 123 3 447 164 513 220 126 2
Peanut
6. Kacang Kedelai/ 315 122 713 351 1 742 120 0
Soybean
7. Kacang Hijau/ 71 98 94 261 131 48 0
Mung bean
5.2.2
Produksi Tanaman Bahan Makanan menurut Kabupaten/Kota dan Jenis Tanaman (Ton), 2012 Tabel
Table Production of Food Crops by District/City and Type of Crops (Ton), 2012
[Diolah dari Hasil Laporan Statistik Pertanian(SP) Tanaman Pangan dan Survei Ubinan BPS/Based on Agricultural Statistic
Report of Food Crops and Crop Cutting Survey, BPS-Statistics Indonesia]
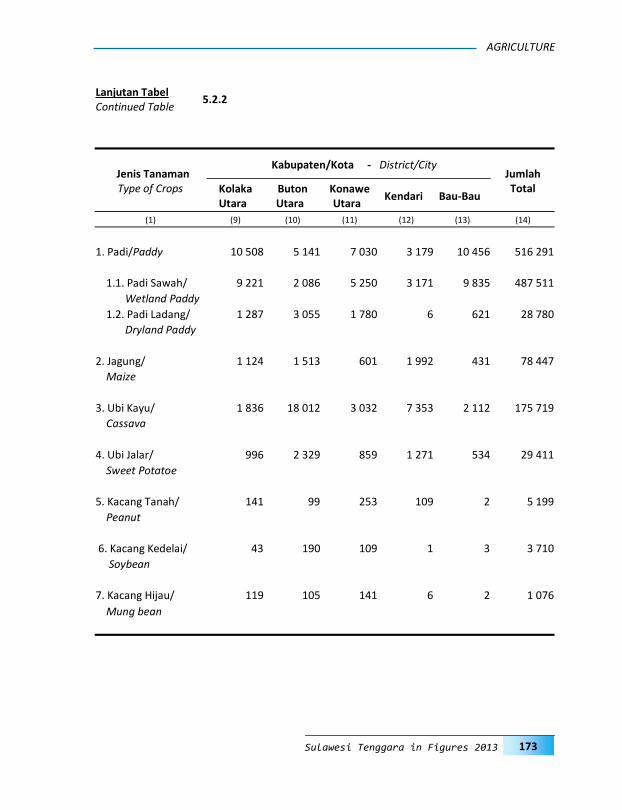
173
AGRICULTURE
Sulawesi Tenggara in Figures 2013
Jenis Tanaman Type of Crops
Kabupaten/Kota - District/City Jumlah Total Kolaka
Utara Buton Utara
Konawe Utara
Kendari Bau-Bau
(1) (9) (10) (11) (12) (13) (14)
1. Padi/Paddy 10 508 5 141 7 030 3 179 10 456 516 291
1.1. Padi Sawah/ 9 221 2 086 5 250 3 171 9 835 487 511
Wetland Paddy
1.2. Padi Ladang/ 1 287 3 055 1 780 6 621 28 780
Dryland Paddy
2. Jagung/ 1 124 1 513 601 1 992 431 78 447
Maize
3. Ubi Kayu/ 1 836 18 012 3 032 7 353 2 112 175 719
Cassava
4. Ubi Jalar/ 996 2 329 859 1 271 534 29 411
Sweet Potatoe
5. Kacang Tanah/ 141 99 253 109 2 5 199
Peanut
6. Kacang Kedelai/ 43 190 109 1 3 3 710
Soybean
7. Kacang Hijau/ 119 105 141 6 2 1 076
Mung bean
Lanjutan Tabel Continued Table
5.2.2

174
PERTANIAN
Sulawesi Tenggara Dalam Angka 2013
Jenis Tanaman Type of Crops
Kabupaten/Kota - District/City
Buton Muna Konawe Kolaka Konawe Selatan
Bombana Wa-
katobi
(1) (2) (3) (4) (5) (6) (7) (8)
1. Padi/Paddy 3 951 2 126 36 924 28 383 28 789 14 473 1
1.1. Padi Sawah/ 1 986 1 480 36 639 27 680 25 636 13 638 0
Wetland Paddy
1.2. Padi Ladang/ 1 965 646 285 703 3 153 835 1
Dryland Paddy
2. Jagung/ 3 781 15 970 1 689 3 718 2 612 733 197
Maize
3. Ubi Kayu/ 3 325 1 422 528 572 824 276 466
Cassava
4. Ubi Jalar/ 597 631 337 670 420 67 10
Sweet Potatoe
5. Kacang Tanah/ 174 5 058 231 708 306 182 3
Peanut
6. Kacang Kedelai/ 326 127 738 371 1 822 124 0
Soybean
7. Kacang Hijau/ 87 121 116 322 161 60 0
Mung bean
5.2.3
Luas Panen Tanaman Bahan Makanan menurut Kabupaten/Kota dan Jenis Tanaman (Ha), 2012 Tabel
Table Harvested Area of Food Crops by District/City and Type of Crops (Ha), 2012
[Diolah dari Hasil Laporan Statistik Pertanian(SP) Tanaman Pangan dan Survei Ubinan BPS/Based on Agricultural Statistic
Report of Food Crops and Crop Cutting Survey, BPS-Statistics Indonesia]

175
AGRICULTURE
Sulawesi Tenggara in Figures 2013
Jenis Tanaman Type of Crops
Kabupaten/Kota - District/City Jumlah Total Kolaka
Utara Buton Utara
Konawe Utara
Kendari Bau-Bau
(1) (9) (10) (11) (12) (13) (14)
1. Padi/Paddy 2 654 1 785 1 981 782 2 662 124 511
1.1. Padi Sawah/ 2 202 675 1 352 780 2 457 114 525
Wetland Paddy
1.2. Padi Ladang/ 452 1 110 629 2 205 9 986
Dryland Paddy
2. Jagung/ 420 596 228 774 166 30 884
Maize
3. Ubi Kayu/ 96 952 153 369 110 9 093
Cassava
4. Ubi Jalar/ 113 273 104 150 62 3 434
Sweet Potatoe
5. Kacang Tanah/ 195 138 345 153 3 7 496
Peanut
6. Kacang Kedelai/ 44 199 115 1 3 3 870
Soybean
7. Kacang Hijau/ 147 129 172 8 2 1 325
Mung bean
Lanjutan Tabel Continued Table
5.2.3
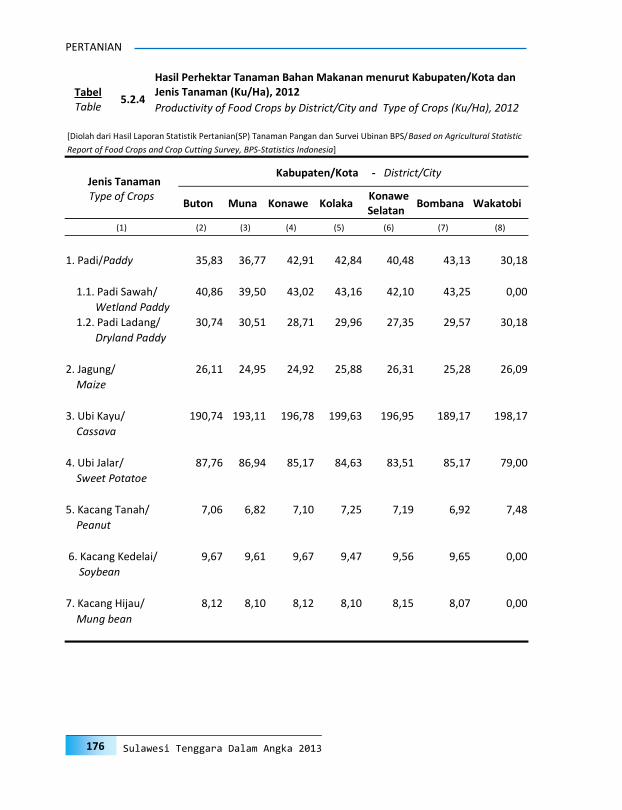
176
PERTANIAN
Sulawesi Tenggara Dalam Angka 2013
Jenis Tanaman Type of Crops
Kabupaten/Kota - District/City
Buton Muna Konawe Kolaka Konawe Selatan
Bombana Wakatobi
(1) (2) (3) (4) (5) (6) (7) (8)
1. Padi/Paddy 35,83 36,77 42,91 42,84 40,48 43,13 30,18
1.1. Padi Sawah/ 40,86 39,50 43,02 43,16 42,10 43,25 0,00
Wetland Paddy
1.2. Padi Ladang/ 30,74 30,51 28,71 29,96 27,35 29,57 30,18
Dryland Paddy
2. Jagung/ 26,11 24,95 24,92 25,88 26,31 25,28 26,09
Maize
3. Ubi Kayu/ 190,74 193,11 196,78 199,63 196,95 189,17 198,17
Cassava
4. Ubi Jalar/ 87,76 86,94 85,17 84,63 83,51 85,17 79,00
Sweet Potatoe
5. Kacang Tanah/ 7,06 6,82 7,10 7,25 7,19 6,92 7,48
Peanut
6. Kacang Kedelai/ 9,67 9,61 9,67 9,47 9,56 9,65 0,00
Soybean
7. Kacang Hijau/ 8,12 8,10 8,12 8,10 8,15 8,07 0,00
Mung bean
5.2.4
Hasil Perhektar Tanaman Bahan Makanan menurut Kabupaten/Kota dan Jenis Tanaman (Ku/Ha), 2012 Tabel
Table Productivity of Food Crops by District/City and Type of Crops (Ku/Ha), 2012
[Diolah dari Hasil Laporan Statistik Pertanian(SP) Tanaman Pangan dan Survei Ubinan BPS/Based on Agricultural Statistic
Report of Food Crops and Crop Cutting Survey, BPS-Statistics Indonesia]

177
AGRICULTURE
Sulawesi Tenggara in Figures 2013
Jenis Tanaman Type of Crops
Kabupaten/Kota - District/City Jumlah Total Kolaka
Utara Buton Utara
Konawe Utara
Kendari Bau-Bau
(1) (9) (10) (11) (12) (13) (14)
1. Padi/Paddy 39,59 28,80 35,49 40,63 39,28 41,47
1.1. Padi Sawah/ 41,88 30,91 38,83 40,66 40,03 42,57
Wetland Paddy
1.2. Padi Ladang/ 28,48 27,52 28,30 30,18 30,29 28,82
Dryland Paddy
2. Jagung/ 26,75 25,39 26,36 25,74 25,94 25,40
Maize
3. Ubi Kayu/ 191,23 189,20 198,18 199,28 191,96 193,25
Cassava
4. Ubi Jalar/ 88,16 85,32 82,62 84,72 86,10 85,65
Sweet Potatoe
5. Kacang Tanah/ 7,21 7,15 7,33 7,16 6,30 6,94
Peanut
6. Kacang Kedelai/ 9,77 9,55 9,48 9,74 9,74 9,59
Soybean
7. Kacang Hijau/ 8,07 8,12 8,19 7,97 8,00 8,12
Mung bean
Lanjutan Tabel Continued Table
5.2.4
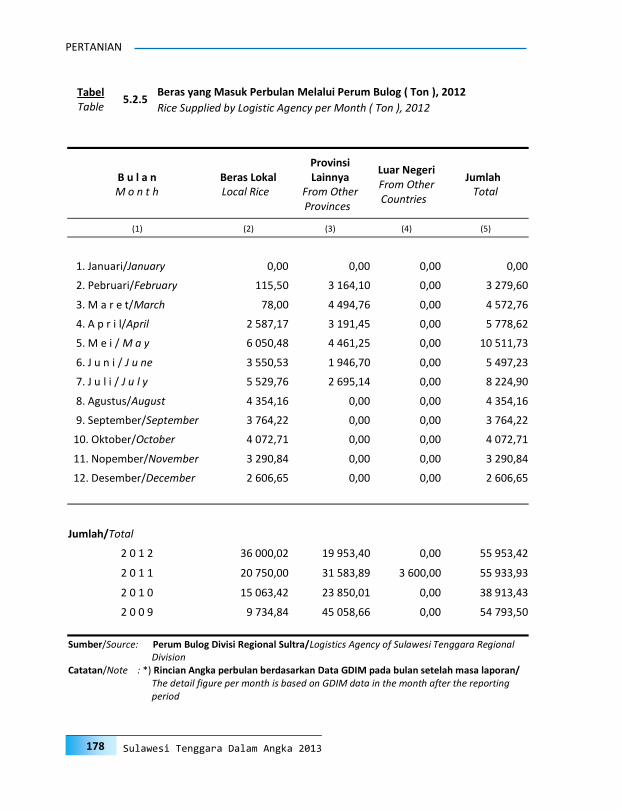
178
PERTANIAN
Sulawesi Tenggara Dalam Angka 2013
B u l a n M o n t h
Beras Lokal Local Rice
Provinsi Lainnya
From Other Provinces
Luar Negeri From Other Countries
Jumlah Total
(1) (2) (3) (4) (5)
1. Januari/January 0,00 0,00 0,00 0,00
2. Pebruari/February 115,50 3 164,10 0,00 3 279,60
3. M a r e t/March 78,00 4 494,76 0,00 4 572,76
4. A p r i l/April 2 587,17 3 191,45 0,00 5 778,62
5. M e i / M a y 6 050,48 4 461,25 0,00 10 511,73
6. J u n i / J u ne 3 550,53 1 946,70 0,00 5 497,23
7. J u l i / J u l y 5 529,76 2 695,14 0,00 8 224,90
8. Agustus/August 4 354,16 0,00 0,00 4 354,16
9. September/September 3 764,22 0,00 0,00 3 764,22
10. Oktober/October 4 072,71 0,00 0,00 4 072,71
11. Nopember/November 3 290,84 0,00 0,00 3 290,84
12. Desember/December 2 606,65 0,00 0,00 2 606,65
Jumlah/Total
2 0 1 2 36 000,02 19 953,40 0,00 55 953,42
2 0 1 1 20 750,00 31 583,89 3 600,00 55 933,93
2 0 1 0 15 063,42 23 850,01 0,00 38 913,43
2 0 0 9 9 734,84 45 058,66 0,00 54 793,50
Sumber/Source: Perum Bulog Divisi Regional Sultra/Logistics Agency of Sulawesi Tenggara Regional Division
Catatan/Note : *) Rincian Angka perbulan berdasarkan Data GDIM pada bulan setelah masa laporan/ The detail figure per month is based on GDIM data in the month after the reporting period
5.2.5 Beras yang Masuk Perbulan Melalui Perum Bulog ( Ton ), 2012 Tabel
Table Rice Supplied by Logistic Agency per Month ( Ton ), 2012

179
AGRICULTURE
Sulawesi Tenggara in Figures 2013
Kabupaten/Kota - District/City B u l a n
Month Buton Muna Konawe Kolaka
Konawe Selatan
Bombana Wakatobi
(1) (2) (3) (4) (5) (6) (7) (8)
1. Januari/January 0,00 0,00 0,00 0,00 0,00 0,00 0,00
2. Pebruari/February 0,00 0,00 45,00 60,00 0,00 10,50 0,00
3. M a r e t/March 0,00 0,00 0,00 60,00 0,00 18,00 0,00
4. A p r i l/April 0,00 440,00 48,87 253,80 0,00 319,50 0,00
5. M e i / M a y 0,00 985,01 669,48 932,57 140,15 721,02 0,00
6. J u n i / J u ne 0,00 0,00 1 071,80 963,26 141,86 390,90 0,00
7. J u l i / J u l y 0,00 0,00 2 813,36 883,02 468,00 333,38 0,00
8. Agustus/August 0,00 297,35 1 470,00 1 015,16 482,40 410,51 0,00
9. September/September 0,00 152,66 1 364,90 902,82 258,60 617,70 0,00
10. Oktober/October 0,00 135,00 1 346,61 862,40 316,50 678,50 0,00
11. Nopember/November 0,00 0,00 740,00 1 255,31 218,40 287,51 0,00
12. Desember/December 0,00 0,00 735,00 1 102,68 111,60 187,50 0,00
Jumlah/Total
2 0 1 2 0,00 2 010,02 10305,02 8 291,02 2 137,51 3 975,02 0,00
2 0 1 1 0,00 1 455,01 7310,50 4 143,02 0,00 2 730,02 0,00
2 0 1 0 0,00 1 320,00 2790,57 1 958,55 0,00 1 755,30 0,00
2 0 0 9 0,00 5 767,10 2970,02 3 350,02 0,00 2 575,92 0,00
Sumber/Source: Perum Bulog Divisi Regional Sultra/Logistics Agency of Sulawesi Tenggara Regional Division
Catatan/Note : *) Rincian Angka perbulan berdasarkan Data GDIM pada bulan setelah masa laporan/ The detail figure per month is based on GDIM data in the month after the reporting period
5.2.6
Pengadaan Beras Lokal oleh Perum Bulog menurut Kabupaten/Kota ( Ton ), 2012 Tabel
Table Local Rice Supplied by Logistic Agency by District/City ( Ton ), 2012

180
PERTANIAN
Sulawesi Tenggara Dalam Angka 2013
B u l a n Month
Kabupaten/Kota - District/City Jumlah Total Kolaka
Utara Buton Utara
Konawe Utara
Kendari Bau-Bau
(1) (2) (3) (4) (5) (6) (7)
1. Januari/January 0,00 0,00 0,00 0,00 0,00 0,00
2. Pebruari/February 0,00 0,00 0,00 0,00 0,00 115,50
3. M a r e t/March 0,00 0,00 0,00 0,00 0,00 78,00
4. A p r i l/April 0,00 0,00 0,00 25,01 1 500,00 2 587,18
5. M e i / M a y 0,00 0,00 0,00 104,10 2 498,16 6 050,49
6. J u n i / J u ne 0,00 0,00 0,00 315,92 666,81 3 550,55
7. J u l i / J u l y 0,00 0,00 0,00 912,82 119,19 5 529,77
8. Agustus/August 0,00 0,00 0,00 678,75 0,00 4 354,17
9. September/September 0,00 0,00 0,00 467,55 0,00 3 764,23
10. Oktober/October 0,00 0,00 0,00 577,50 156,21 4 072,72
11. Nopember/November 0,00 0,00 0,00 765,00 24,63 3 290,85
12. Desember/December 0,00 0,00 0,00 364,87 105,00 2 606,65
Jumlah/Total
2 0 1 2 0,00 0,00 0,00 4 211,52 5070,00 3 6000,11
2 0 1 1 0,00 0,00 0,00 3 252,02 1860,02 2 0750,59
2 0 1 0 0,00 0,00 0,00 2 844,00 4395,00 1 5063,42
2 0 0 9 0,00 0,00 0,00 1 983,68 1 0594,61 2 7241,35
Sumber/Source: Perum Bulog Divisi Regional Sultra/Logistics Agency of Sulawesi Tenggara Regional Division
Catatan/Note : *) Rincian Angka perbulan berdasarkan Data GDIM pada bulan setelah masa laporan/ The detail figure per month is based on GDIM data in the month after the reporting period
Lanjutan Tabel Continued Table
5.2.6
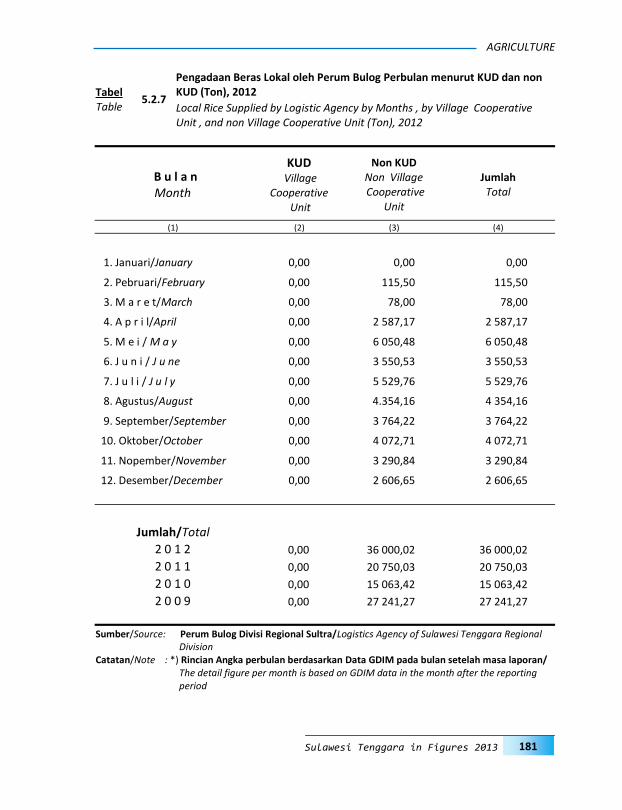
181
AGRICULTURE
Sulawesi Tenggara in Figures 2013
B u l a n Month
KUD Village
Cooperative Unit
Non KUD Non Village Cooperative
Unit
Jumlah Total
(1) (2) (3) (4)
1. Januari/January 0,00 0,00 0,00
2. Pebruari/February 0,00 115,50 115,50
3. M a r e t/March 0,00 78,00 78,00
4. A p r i l/April 0,00 2 587,17 2 587,17
5. M e i / M a y 0,00 6 050,48 6 050,48
6. J u n i / J u ne 0,00 3 550,53 3 550,53
7. J u l i / J u l y 0,00 5 529,76 5 529,76
8. Agustus/August 0,00 4.354,16 4 354,16
9. September/September 0,00 3 764,22 3 764,22
10. Oktober/October 0,00 4 072,71 4 072,71
11. Nopember/November 0,00 3 290,84 3 290,84
12. Desember/December 0,00 2 606,65 2 606,65
Jumlah/Total
2 0 1 2 0,00 36 000,02 36 000,02
2 0 1 1 0,00 20 750,03 20 750,03
2 0 1 0 0,00 15 063,42 15 063,42
2 0 0 9 0,00 27 241,27 27 241,27
Sumber/Source: Perum Bulog Divisi Regional Sultra/Logistics Agency of Sulawesi Tenggara Regional Division
Catatan/Note : *) Rincian Angka perbulan berdasarkan Data GDIM pada bulan setelah masa laporan/ The detail figure per month is based on GDIM data in the month after the reporting period
5.2.7
Pengadaan Beras Lokal oleh Perum Bulog Perbulan menurut KUD dan non KUD (Ton), 2012 Tabel
Table Local Rice Supplied by Logistic Agency by Months , by Village Cooperative Unit , and non Village Cooperative Unit (Ton), 2012

182
PERTANIAN
Sulawesi Tenggara Dalam Angka 2013
T a h u n Gula Pasir Terigu Jagung
Y e a r Sugar Wheat-Flour Maize
(1) (2) (3) (4)
2 0 1 2 0,00 0,00 0,00
2 0 1 1 0,00 0,00 0,00
2 0 1 0 0,00 0,00 0,00
2 0 0 9 600,00 0,00 600,00
2 0 0 8 0,00 0,00 0,00
2 0 0 7 0,00 0,00 0,00
2 0 0 6 10,00 0,00 0,00
Sumber/Source: Perum Bulog Divisi Regional Sultra/Logistics Agency of Sulawesi Tenggara Regional Division
5.2.8
Volume Gula Pasir, Tepung Terigu dan Jagung yang Disalurkan oleh Perum Bulog (Ton), 2006-2012 Tabel
Table Volume of Sugar, Wheat-Flour and Maize Distributed by Logistic agency (Ton), 2006-2012
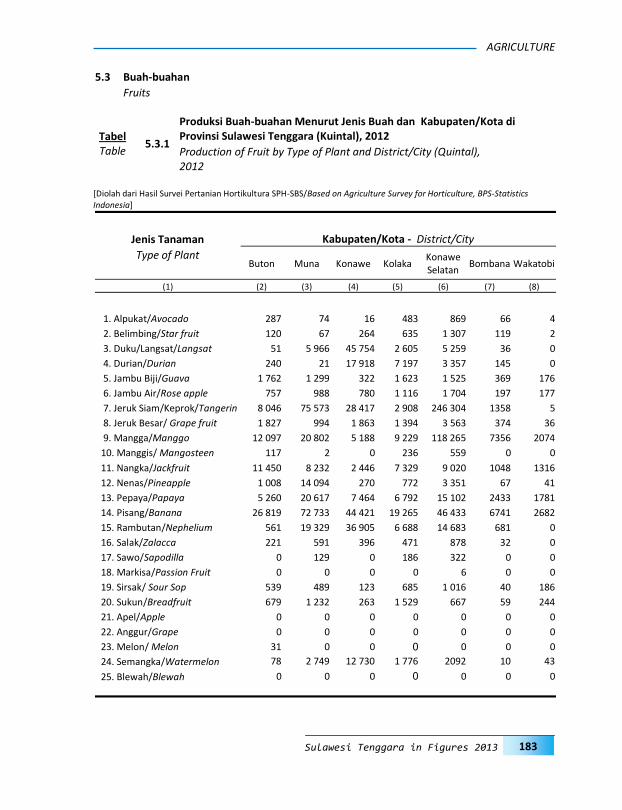
183
AGRICULTURE
Sulawesi Tenggara in Figures 2013
Jenis Tanaman Kabupaten/Kota - District/City
Type of Plant Buton Muna Konawe Kolaka
Konawe Selatan
Bombana Wakatobi
(1) (2) (3) (4) (5) (6) (7) (8)
1. Alpukat/Avocado 287 74 16 483 869 66 4
2. Belimbing/Star fruit 120 67 264 635 1 307 119 2
3. Duku/Langsat/Langsat 51 5 966 45 754 2 605 5 259 36 0
4. Durian/Durian 240 21 17 918 7 197 3 357 145 0
5. Jambu Biji/Guava 1 762 1 299 322 1 623 1 525 369 176
6. Jambu Air/Rose apple 757 988 780 1 116 1 704 197 177
7. Jeruk Siam/Keprok/Tangerin 8 046 75 573 28 417 2 908 246 304 1358 5
8. Jeruk Besar/ Grape fruit 1 827 994 1 863 1 394 3 563 374 36
9. Mangga/Manggo 12 097 20 802 5 188 9 229 118 265 7356 2074
10. Manggis/ Mangosteen 117 2 0 236 559 0 0
11. Nangka/Jackfruit 11 450 8 232 2 446 7 329 9 020 1048 1316
12. Nenas/Pineapple 1 008 14 094 270 772 3 351 67 41
13. Pepaya/Papaya 5 260 20 617 7 464 6 792 15 102 2433 1781
14. Pisang/Banana 26 819 72 733 44 421 19 265 46 433 6741 2682
15. Rambutan/Nephelium 561 19 329 36 905 6 688 14 683 681 0
16. Salak/Zalacca 221 591 396 471 878 32 0
17. Sawo/Sapodilla 0 129 0 186 322 0 0
18. Markisa/Passion Fruit 0 0 0 0 6 0 0
19. Sirsak/ Sour Sop 539 489 123 685 1 016 40 186
20. Sukun/Breadfruit 679 1 232 263 1 529 667 59 244
21. Apel/Apple 0 0 0 0 0 0 0
22. Anggur/Grape 0 0 0 0 0 0 0
23. Melon/ Melon 31 0 0 0 0 0 0
24. Semangka/Watermelon 78 2 749 12 730 1 776 2092 10 43
25. Blewah/Blewah 0 0 0 0 0 0 0
5.3.1
Produksi Buah-buahan Menurut Jenis Buah dan Kabupaten/Kota di Provinsi Sulawesi Tenggara (Kuintal), 2012 Tabel
Table Production of Fruit by Type of Plant and District/City (Quintal), 2012
5.3 Buah-buahan
Fruits
[Diolah dari Hasil Survei Pertanian Hortikultura SPH-SBS/Based on Agriculture Survey for Horticulture, BPS-Statistics Indonesia]

184
PERTANIAN
Sulawesi Tenggara Dalam Angka 2013
Jumlah
Total
Jenis Tanaman Kabupaten/Kota - District/City
Type of Plant Kolaka Utara
Buton Utara
Konawe Utara
Kendari Bau-Bau
(1) (9) (10) (11) (12) (13) (14
1. Alpukat/Avocado 1968 11 128 334 909 5149
2. Belimbing/Star fruit 873 0 90 542 276 4295
3. Duku/Langsat/Langsat 13059 108 3228 693 0 76759
4. Durian/Durian 19194 68 2601 944 20 51705
5. Jambu Biji/Guava 2258 93 39 519 799 10784
6. Jambu Air/Rose apple 620 168 34 475 252 7268
7. Jeruk Siam/Keprok/Tangerin 4261 5838 8138 1211 360 382419
8. Jeruk Besar/ Grape fruit 685 263 786 447 179 12411
9. Mangga/Manggo 11943 2194 2504 1780 4895 198327
10. Manggis/ Mangosteen 16 0 0 9 0 939
11. Nangka/Jackfruit 2894 824 1179 1477 4167 51382
12. Nenas/Pineapple 110 291 285 5765 315 26369
13. Pepaya/Papaya 5279 624 5067 2462 6706 79587
14. Pisang/Banana 57128 5558 11510 6209 7278 306777
15. Rambutan/Nephelium 18288 232 6773 3537 2631 110308
16. Salak/Zalacca 1186 27 72 47 4 3925
17. Sawo/Sapodilla 0 0 0 30 17 684
18. Markisa/Passion Fruit 0 0 0 0 0 6
19. Sirsak/ Sour Sop 243 13 268 321 749 4672
20. Sukun/Breadfruit 983 0 105 1617 798 8176
21. Apel/Apple 0 0 0 0 0 0
22. Anggur/Grape 0 0 0 0 0 0
23. Melon/ Melon 0 3 0 0 0 34
24. Semangka/Watermelon 56 2859 36 5 55 22489
25. Blewah/Blewah 0 0 0 6 0 6
Lanjutan Tabel Continued Table
5.3.1

185
AGRICULTURE
Sulawesi Tenggara in Figures 2013
Jenis Tanaman Kabupaten/Kota - District/City
Type of Plant Buton Muna Konawe Kolaka
Konawe Selatan
Bombana Wakatobi
(1) (2) (3) (4) (5) (6) (7) (8)
1. Kacang panjang 3 152 31 687 23 574 4 301 7 417 1 678 98
Long Bean
2. Cabe besar 16 060 4 208 12 167 1 035 1 727 1 290 72
Chili
3. Cabe rawit 1 244 7 679 11 352 1 973 3 888 1 511 147
Small Chili
4. Tomat 8 180 31 354 21 593 2 065 3 932 5 856 95
Tomatoes
5. Terung 3 455 33 192 25 139 2 963 3 914 5 191 172
Egg plant
6. Buncis 380 353 3 077 407 824 22 0
Snap Bean
7. Ketimun 1 303 7134 12 473 1 625 2 121 315 25
Cucumber
8. Labu siam 248 10 589 3 386 725 1 579 251 0
Squash
9. Kangkung 2 167 20 233 7 565 3 853 6 586 3 456 116
Swamp Cabbage
10. Bayam 928 21 418 4 547 2 424 5 933 1 090 51
Spinach
11. Melinjo 40 161 253 91 251 0 0
Melinjo
12. Petai 54 90 201 1 898 1 739 20 0
Petai
13. Jengkol 11 99 87 87 502 4 0
Jengkol
5.4.1
Produksi Sayur-sayuran yang dipanen berkali-kali Menurut Jenis Sayuran dan Kabupaten/Kota (Kuintal) 2012 Tabel
Table Production of Repeatedly Harvested Vegetables by Type of Plant and District/City (Quintal) 2012
5.4 Sayur-sayuran dan Tanaman Biofarmaka
Vegetables and Biofarmaka Plants
[Diolah dari Hasil Survei Pertanian Hortikultura SPH-SBS/Based on Agriculture Survey for Horticulture, BPS-Statistics Indonesia]
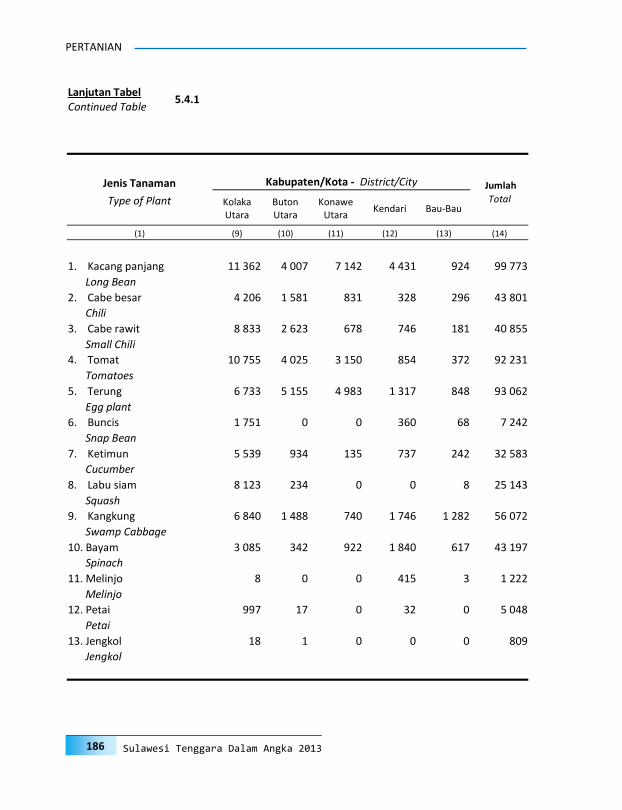
186
PERTANIAN
Sulawesi Tenggara Dalam Angka 2013
Jumlah
Total
Jenis Tanaman Kabupaten/Kota - District/City
Type of Plant Kolaka Utara
Buton Utara
Konawe Utara
Kendari Bau-Bau
(1) (9) (10) (11) (12) (13) (14)
1. Kacang panjang 11 362 4 007 7 142 4 431 924 99 773
Long Bean
2. Cabe besar 4 206 1 581 831 328 296 43 801
Chili
3. Cabe rawit 8 833 2 623 678 746 181 40 855
Small Chili
4. Tomat 10 755 4 025 3 150 854 372 92 231
Tomatoes
5. Terung 6 733 5 155 4 983 1 317 848 93 062
Egg plant
6. Buncis 1 751 0 0 360 68 7 242
Snap Bean
7. Ketimun 5 539 934 135 737 242 32 583
Cucumber
8. Labu siam 8 123 234 0 0 8 25 143
Squash
9. Kangkung 6 840 1 488 740 1 746 1 282 56 072
Swamp Cabbage
10. Bayam 3 085 342 922 1 840 617 43 197
Spinach
11. Melinjo 8 0 0 415 3 1 222
Melinjo
12. Petai 997 17 0 32 0 5 048
Petai
13. Jengkol 18 1 0 0 0 809
Jengkol
Lanjutan Tabel Continued Table
5.4.1
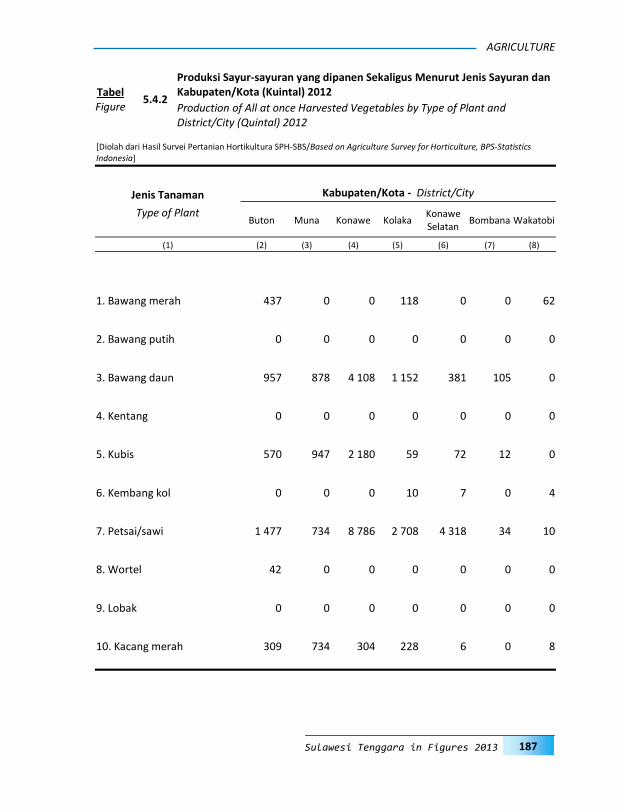
187
AGRICULTURE
Sulawesi Tenggara in Figures 2013
Jenis Tanaman Kabupaten/Kota - District/City
Type of Plant Buton Muna Konawe Kolaka
Konawe Selatan
Bombana Wakatobi
(1) (2) (3) (4) (5) (6) (7) (8)
1. Bawang merah 437 0 0 118 0 0 62
2. Bawang putih 0 0 0 0 0 0 0
3. Bawang daun 957 878 4 108 1 152 381 105 0
4. Kentang 0 0 0 0 0 0 0
5. Kubis 570 947 2 180 59 72 12 0
6. Kembang kol 0 0 0 10 7 0 4
7. Petsai/sawi 1 477 734 8 786 2 708 4 318 34 10
8. Wortel 42 0 0 0 0 0 0
9. Lobak 0 0 0 0 0 0 0
10. Kacang merah 309 734 304 228 6 0 8
5.4.2
Produksi Sayur-sayuran yang dipanen Sekaligus Menurut Jenis Sayuran dan Kabupaten/Kota (Kuintal) 2012 Tabel
Figure Production of All at once Harvested Vegetables by Type of Plant and District/City (Quintal) 2012
[Diolah dari Hasil Survei Pertanian Hortikultura SPH-SBS/Based on Agriculture Survey for Horticulture, BPS-Statistics Indonesia]

188
PERTANIAN
Sulawesi Tenggara Dalam Angka 2013
Jumlah
Total
Kabupaten/Kota - District/City Jenis Tanaman
Type of Plant Kolaka Utara
Buton Utara
Konawe Utara
Kendari Bau-Bau
(1) (9) (10) (11) (12) (13) (14
1. Bawang merah 1 378 0 0 4 0 1 999
2. Bawang putih 0 0 0 0 0 0
3. Bawang daun 1 114 33 0 159 95 8 982
4. Kentang 0 0 0 0 0 0
5. Kubis 1 847 540 378 0 438 7 043
6. Kembang kol 1 239 0 0 23 0 1 283
7. Petsai/sawi 3 971 165 236 3 493 449 26 381
8. Wortel 0 0 0 0 0 42
9. Lobak 0 0 0 0 0 0
10. Kacang merah 10 290 0 0 0 1 889
Lanjutan Tabel Continued Table
5.4.2
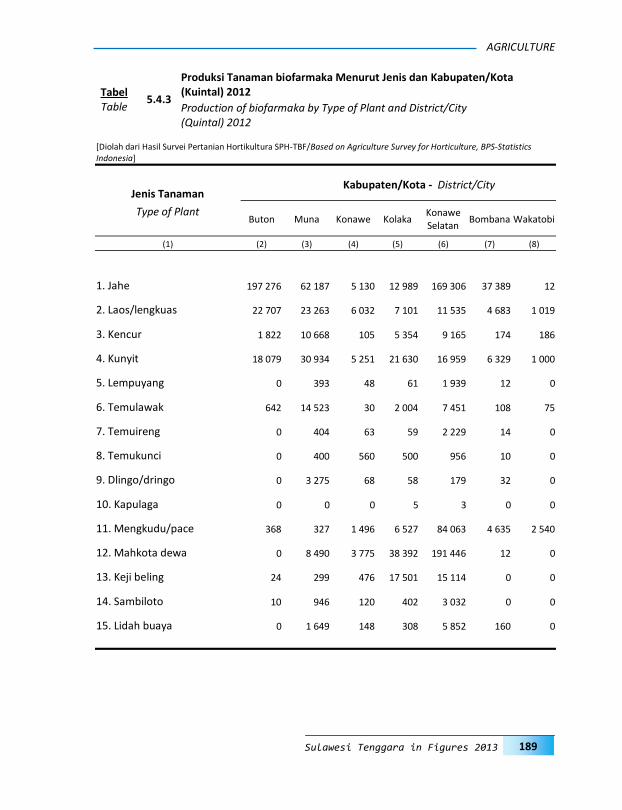
189
AGRICULTURE
Sulawesi Tenggara in Figures 2013
Kabupaten/Kota - District/City
Jenis Tanaman
Type of Plant Buton Muna Konawe Kolaka
Konawe Selatan
Bombana Wakatobi
(1) (2) (3) (4) (5) (6) (7) (8)
1. Jahe 197 276 62 187 5 130 12 989 169 306 37 389 12
2. Laos/lengkuas 22 707 23 263 6 032 7 101 11 535 4 683 1 019
3. Kencur 1 822 10 668 105 5 354 9 165 174 186
4. Kunyit 18 079 30 934 5 251 21 630 16 959 6 329 1 000
5. Lempuyang 0 393 48 61 1 939 12 0
6. Temulawak 642 14 523 30 2 004 7 451 108 75
7. Temuireng 0 404 63 59 2 229 14 0
8. Temukunci 0 400 560 500 956 10 0
9. Dlingo/dringo 0 3 275 68 58 179 32 0
10. Kapulaga 0 0 0 5 3 0 0
11. Mengkudu/pace 368 327 1 496 6 527 84 063 4 635 2 540
12. Mahkota dewa 0 8 490 3 775 38 392 191 446 12 0
13. Keji beling 24 299 476 17 501 15 114 0 0
14. Sambiloto 10 946 120 402 3 032 0 0
15. Lidah buaya 0 1 649 148 308 5 852 160 0
5.4.3
Produksi Tanaman biofarmaka Menurut Jenis dan Kabupaten/Kota (Kuintal) 2012 Tabel
Table Production of biofarmaka by Type of Plant and District/City (Quintal) 2012
[Diolah dari Hasil Survei Pertanian Hortikultura SPH-TBF/Based on Agriculture Survey for Horticulture, BPS-Statistics Indonesia]
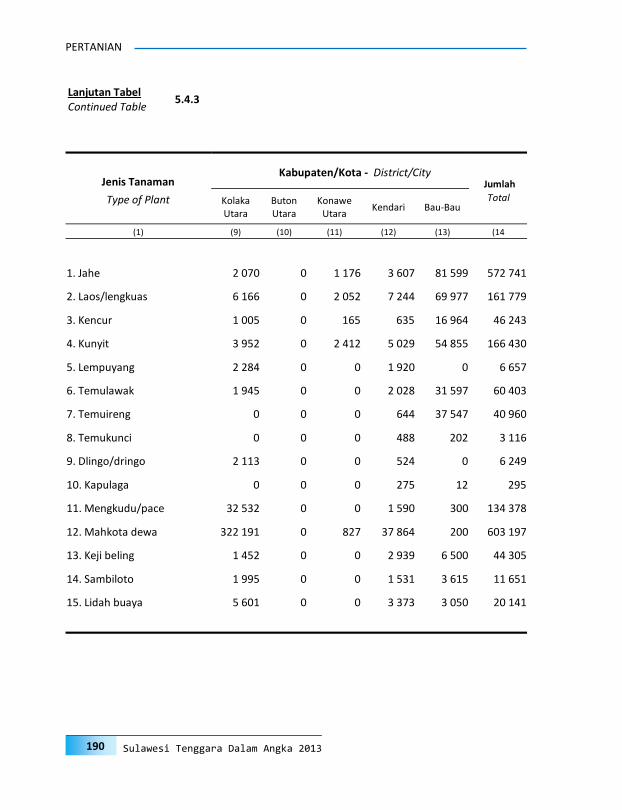
190
PERTANIAN
Sulawesi Tenggara Dalam Angka 2013
Jumlah
Total
Kabupaten/Kota - District/City Jenis Tanaman
Type of Plant Kolaka Utara
Buton Utara
Konawe Utara
Kendari Bau-Bau
(1) (9) (10) (11) (12) (13) (14
1. Jahe 2 070 0 1 176 3 607 81 599 572 741
2. Laos/lengkuas 6 166 0 2 052 7 244 69 977 161 779
3. Kencur 1 005 0 165 635 16 964 46 243
4. Kunyit 3 952 0 2 412 5 029 54 855 166 430
5. Lempuyang 2 284 0 0 1 920 0 6 657
6. Temulawak 1 945 0 0 2 028 31 597 60 403
7. Temuireng 0 0 0 644 37 547 40 960
8. Temukunci 0 0 0 488 202 3 116
9. Dlingo/dringo 2 113 0 0 524 0 6 249
10. Kapulaga 0 0 0 275 12 295
11. Mengkudu/pace 32 532 0 0 1 590 300 134 378
12. Mahkota dewa 322 191 0 827 37 864 200 603 197
13. Keji beling 1 452 0 0 2 939 6 500 44 305
14. Sambiloto 1 995 0 0 1 531 3 615 11 651
15. Lidah buaya 5 601 0 0 3 373 3 050 20 141
Lanjutan Tabel Continued Table
5.4.3

191
AGRICULTURE
Sulawesi Tenggara in Figures 2013
Jenis Tanaman 2 0 0 8 2 0 0 9 2 0 1 0 2 0 1 1 2 0 1 2*)
Type of Crops
(1) (3) (4) (5) (6) (6)
1. Kelapa Dalam/Coconut 37 752 38 284 38 224 37 662 41 420
2. Kopi/Coffee 4 127 3 952 3 940 2 960 3 105
3. Kapuk/Kapok 422 310 230 154 259
4. Lada/Pepper 3 663 5 103 4 991 3 634 4 059
5. Pala/Nutmeg 39 124 219 173 258
6. Cengkeh/Clove 2 174 4 789 6 046 6 838 14 740
7. Jambu Mete/Cashew nut 37 981 30 934 15 952 14 310 22 527
8. Kemiri/Candlenut 1 723 1 353 1 173 1 374 1 136
9. Coklat/Cocoa 115 898 131 830 145 818 161 064 140 645
10. Enau/Aren/Sugar Palm 3 403 3 376 3 332 3 370 319
11. Kapas Rakyat/Cotton plant 0 0 0 0 0
12. Kelapa Hybrida/Hybrid Coco. 3 330 3 285 3 246 3 583 4 049
13. Tembakau/Tobacco 0 0 0 0 0
14. Asam Jawa/Java tamarind 450 481 261 214 84
15. Pinang/Areca-nut 406 209 248 162 313
16. Panili/Vanilla 194 191 57 58 50
17. Sagu/Sago Palm 7 248 4 923 6 165 4 877 4 977
18. Tebu/Sugar-cane 0 0 0 0 0
19. Jahe/Ginger 1 649 1 860 805 227 0
20. Kelapa Sawit 0 0 22 80 144
21. Nilam 0 0 0 0 16 461
Sumber/Source: Dinas Perkebunan dan Hortikultura Prov. Sultra/Estate and Horticulture Service of Sulawesi Tenggara Province
Catatan/Note : *) Angka Sementara/Preliminary Figures
5.5.1 Produksi Tanaman Perkebunan menurut Jenis Tanaman (Ton), 2008-2012 Tabel
Table Production of Estate Crops by Type of Plants (Tons), 2008 -2012
5.5 Perkebunan
Plantation

192
PERTANIAN
Sulawesi Tenggara Dalam Angka 2013
Jenis Tanaman Type of Crops
Kabupaten/Kota - District/City
Buton Muna Konawe Kolaka Konawe Selatan
Bomba-na
Wakato-bi
(1) (2) (3) (4) (5) (6) (7) (8)
1. Kelapa Dalam/Coconut 3 049 6 423 6 130 3 996 3 675 12 700 3 194
2. Kopi/Coffee 659 373 1 096 1 484 1 013 1 200 30
3. Kapuk/Kapok 451 191 142 56 0 4 3
4. Lada/Pepper 42 85 2 458 1 976 2 204 140 0
5. Pala/Nutmeg 9 0 132 5 28 6 4
6. Cengkeh/Clove 37 0 578 2 225 415 130 9
7. Jambu Mete/Cashew nut 16 915 18 025 8 908 2 079 3 675 14 038 545
8. Kemiri/Candlenut 441 138 165 320 444 150 3
9. Coklat/Cocoa 1 603 8 979 13 120 59 483 14 427 7 310 40
10. Enau/Aren/Sugar Palm 41 63 30 214 3 1 980 19
11. Kapas Rakyat/Cotton plant 0 0 0 0 0 0 0
12. Kelapa Hybrida/Hybrid coco. 213 0 210 0 1 971 290 15
13. Tembakau/Tobacco 0 0 0 0 0 0 0
14. Asam Jawa/Java tamarind 65 8 7 1 1 8 23
15. Pinang/Areca-nut 0 5 166 78 81 18 10
16. Panili/Vanilla 1 0 8 94 219 12 0
17. Sagu/Sago Palm 0 0 1 325 663 267 8 0
18. Tebu/Sugar-cane 0 0 0 0 0 0 0
19. Jahe/Ginger 0 0 0 0 0 0 0
20. Kelapa Sawit 0 0 10 479 0 0 0
21. Nilam 0 0 0 0 0 0 0
Sumber/Source: Dinas Perkebunan dan Hortikultura Prov. Sultra/Estate and Horticulture Service of Sula-wesi Tenggara Province
5.5.2
Produksi Tanaman Perkebunan menurut Jenis Tanaman Dan Kabupaten/Kota(Ton), 2008-2012 Tabel
Table Production of Estate Crops by Type of Plants (Tons) and District/City , 2008 -2012
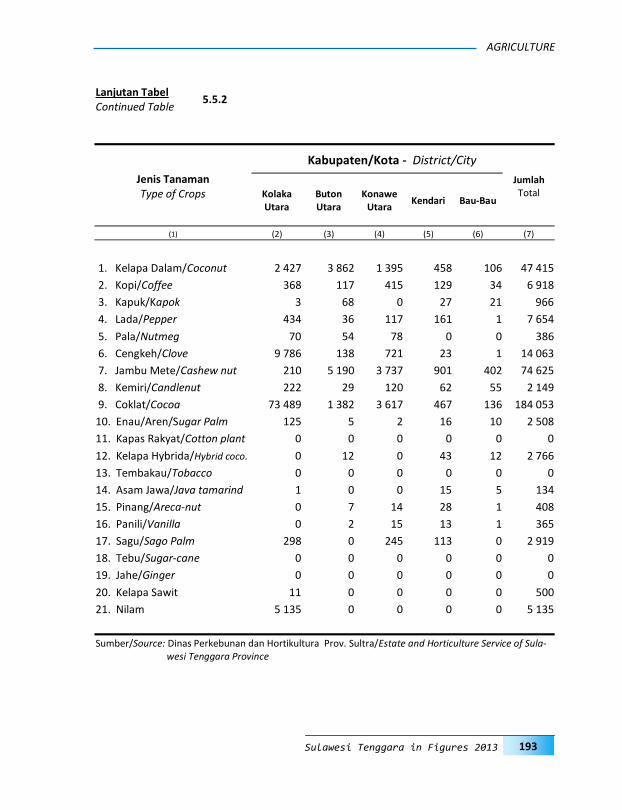
193
AGRICULTURE
Sulawesi Tenggara in Figures 2013
Jenis Tanaman Type of Crops
Kabupaten/Kota - District/City
Jumlah Total Kolaka
Utara Buton Utara
Konawe Utara
Kendari Bau-Bau
(1) (2) (3) (4) (5) (6) (7)
1. Kelapa Dalam/Coconut 2 427 3 862 1 395 458 106 47 415
2. Kopi/Coffee 368 117 415 129 34 6 918
3. Kapuk/Kapok 3 68 0 27 21 966
4. Lada/Pepper 434 36 117 161 1 7 654
5. Pala/Nutmeg 70 54 78 0 0 386
6. Cengkeh/Clove 9 786 138 721 23 1 14 063
7. Jambu Mete/Cashew nut 210 5 190 3 737 901 402 74 625
8. Kemiri/Candlenut 222 29 120 62 55 2 149
9. Coklat/Cocoa 73 489 1 382 3 617 467 136 184 053
10. Enau/Aren/Sugar Palm 125 5 2 16 10 2 508
11. Kapas Rakyat/Cotton plant 0 0 0 0 0 0
12. Kelapa Hybrida/Hybrid coco. 0 12 0 43 12 2 766
13. Tembakau/Tobacco 0 0 0 0 0 0
14. Asam Jawa/Java tamarind 1 0 0 15 5 134
15. Pinang/Areca-nut 0 7 14 28 1 408
16. Panili/Vanilla 0 2 15 13 1 365
17. Sagu/Sago Palm 298 0 245 113 0 2 919
18. Tebu/Sugar-cane 0 0 0 0 0 0
19. Jahe/Ginger 0 0 0 0 0 0
20. Kelapa Sawit 11 0 0 0 0 500
21. Nilam 5 135 0 0 0 0 5 135
Sumber/Source: Dinas Perkebunan dan Hortikultura Prov. Sultra/Estate and Horticulture Service of Sula-
wesi Tenggara Province
Lanjutan Tabel Continued Table
5.5.2
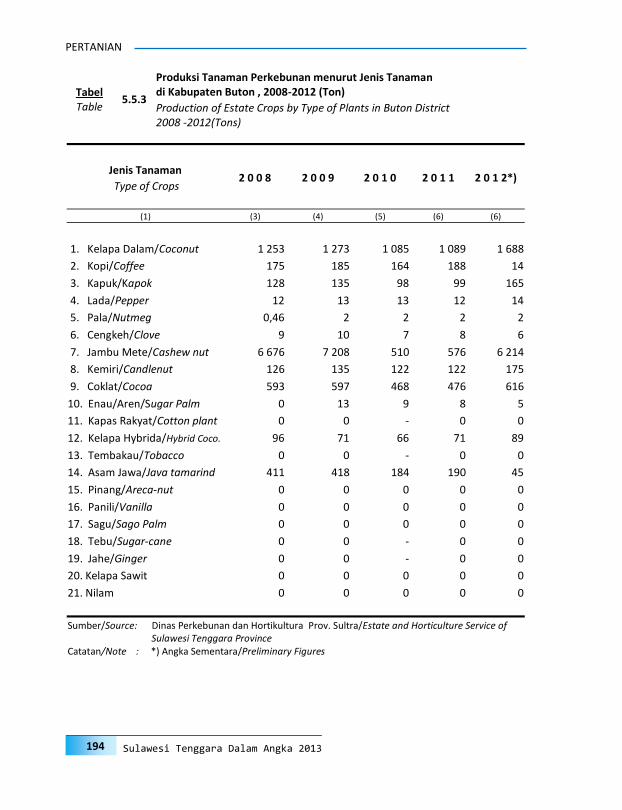
194
PERTANIAN
Sulawesi Tenggara Dalam Angka 2013
Jenis Tanaman 2 0 0 8 2 0 0 9 2 0 1 0 2 0 1 1 2 0 1 2*)
Type of Crops
(1) (3) (4) (5) (6) (6)
1. Kelapa Dalam/Coconut 1 253 1 273 1 085 1 089 1 688
2. Kopi/Coffee 175 185 164 188 14
3. Kapuk/Kapok 128 135 98 99 165
4. Lada/Pepper 12 13 13 12 14
5. Pala/Nutmeg 0,46 2 2 2 2
6. Cengkeh/Clove 9 10 7 8 6
7. Jambu Mete/Cashew nut 6 676 7 208 510 576 6 214
8. Kemiri/Candlenut 126 135 122 122 175
9. Coklat/Cocoa 593 597 468 476 616
10. Enau/Aren/Sugar Palm 0 13 9 8 5
11. Kapas Rakyat/Cotton plant 0 0 - 0 0
12. Kelapa Hybrida/Hybrid Coco. 96 71 66 71 89
13. Tembakau/Tobacco 0 0 - 0 0
14. Asam Jawa/Java tamarind 411 418 184 190 45
15. Pinang/Areca-nut 0 0 0 0 0
16. Panili/Vanilla 0 0 0 0 0
17. Sagu/Sago Palm 0 0 0 0 0
18. Tebu/Sugar-cane 0 0 - 0 0
19. Jahe/Ginger 0 0 - 0 0
20. Kelapa Sawit 0 0 0 0 0
21. Nilam 0 0 0 0 0
Sumber/Source: Dinas Perkebunan dan Hortikultura Prov. Sultra/Estate and Horticulture Service of Sulawesi Tenggara Province
Catatan/Note : *) Angka Sementara/Preliminary Figures
5.5.3
Produksi Tanaman Perkebunan menurut Jenis Tanaman di Kabupaten Buton , 2008-2012 (Ton) Tabel
Table Production of Estate Crops by Type of Plants in Buton District 2008 -2012(Tons)
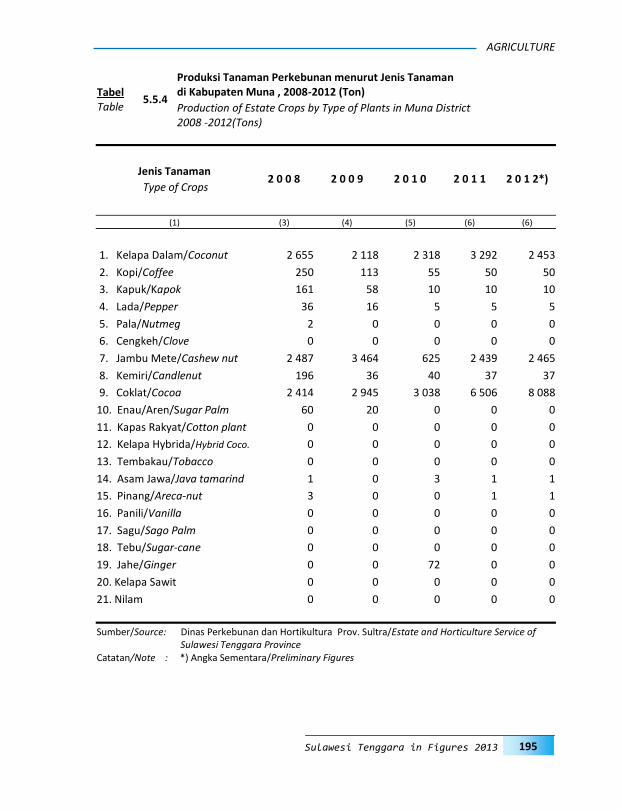
195
AGRICULTURE
Sulawesi Tenggara in Figures 2013
Jenis Tanaman 2 0 0 8 2 0 0 9 2 0 1 0 2 0 1 1 2 0 1 2*)
Type of Crops
(1) (3) (4) (5) (6) (6)
1. Kelapa Dalam/Coconut 2 655 2 118 2 318 3 292 2 453
2. Kopi/Coffee 250 113 55 50 50
3. Kapuk/Kapok 161 58 10 10 10
4. Lada/Pepper 36 16 5 5 5
5. Pala/Nutmeg 2 0 0 0 0
6. Cengkeh/Clove 0 0 0 0 0
7. Jambu Mete/Cashew nut 2 487 3 464 625 2 439 2 465
8. Kemiri/Candlenut 196 36 40 37 37
9. Coklat/Cocoa 2 414 2 945 3 038 6 506 8 088
10. Enau/Aren/Sugar Palm 60 20 0 0 0
11. Kapas Rakyat/Cotton plant 0 0 0 0 0
12. Kelapa Hybrida/Hybrid Coco. 0 0 0 0 0
13. Tembakau/Tobacco 0 0 0 0 0
14. Asam Jawa/Java tamarind 1 0 3 1 1
15. Pinang/Areca-nut 3 0 0 1 1
16. Panili/Vanilla 0 0 0 0 0
17. Sagu/Sago Palm 0 0 0 0 0
18. Tebu/Sugar-cane 0 0 0 0 0
19. Jahe/Ginger 0 0 72 0 0
20. Kelapa Sawit 0 0 0 0 0
21. Nilam 0 0 0 0 0
Sumber/Source: Dinas Perkebunan dan Hortikultura Prov. Sultra/Estate and Horticulture Service of Sulawesi Tenggara Province
Catatan/Note : *) Angka Sementara/Preliminary Figures
5.5.4
Produksi Tanaman Perkebunan menurut Jenis Tanaman di Kabupaten Muna , 2008-2012 (Ton) Tabel
Table Production of Estate Crops by Type of Plants in Muna District 2008 -2012(Tons)
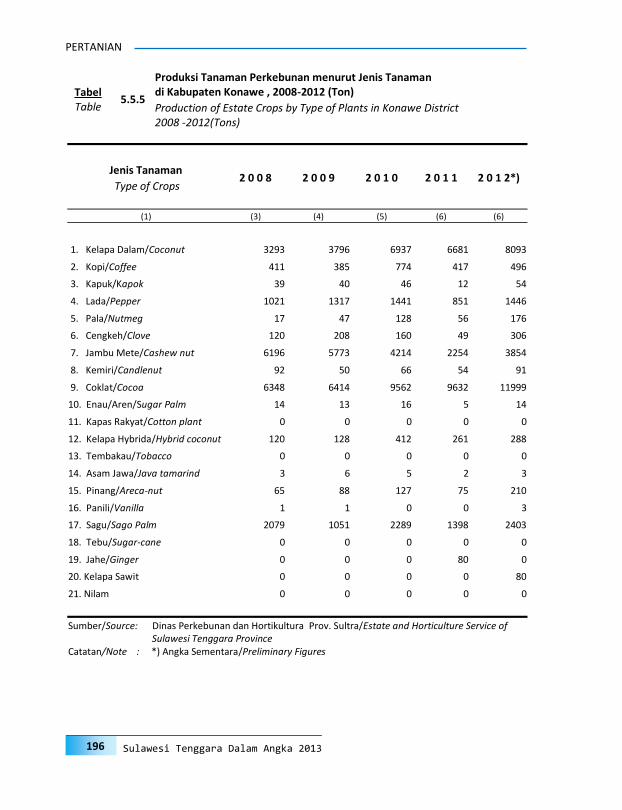
196
PERTANIAN
Sulawesi Tenggara Dalam Angka 2013
Jenis Tanaman 2 0 0 8 2 0 0 9 2 0 1 0 2 0 1 1 2 0 1 2*)
Type of Crops
(1) (3) (4) (5) (6) (6)
1. Kelapa Dalam/Coconut 3293 3796 6937 6681 8093
2. Kopi/Coffee 411 385 774 417 496
3. Kapuk/Kapok 39 40 46 12 54
4. Lada/Pepper 1021 1317 1441 851 1446
5. Pala/Nutmeg 17 47 128 56 176
6. Cengkeh/Clove 120 208 160 49 306
7. Jambu Mete/Cashew nut 6196 5773 4214 2254 3854
8. Kemiri/Candlenut 92 50 66 54 91
9. Coklat/Cocoa 6348 6414 9562 9632 11999
10. Enau/Aren/Sugar Palm 14 13 16 5 14
11. Kapas Rakyat/Cotton plant 0 0 0 0 0
12. Kelapa Hybrida/Hybrid coconut 120 128 412 261 288
13. Tembakau/Tobacco 0 0 0 0 0
14. Asam Jawa/Java tamarind 3 6 5 2 3
15. Pinang/Areca-nut 65 88 127 75 210
16. Panili/Vanilla 1 1 0 0 3
17. Sagu/Sago Palm 2079 1051 2289 1398 2403
18. Tebu/Sugar-cane 0 0 0 0 0
19. Jahe/Ginger 0 0 0 80 0
20. Kelapa Sawit 0 0 0 0 80
21. Nilam 0 0 0 0 0
Sumber/Source: Dinas Perkebunan dan Hortikultura Prov. Sultra/Estate and Horticulture Service of Sulawesi Tenggara Province
Catatan/Note : *) Angka Sementara/Preliminary Figures
5.5.5
Produksi Tanaman Perkebunan menurut Jenis Tanaman di Kabupaten Konawe , 2008-2012 (Ton) Tabel
Table Production of Estate Crops by Type of Plants in Konawe District 2008 -2012(Tons)
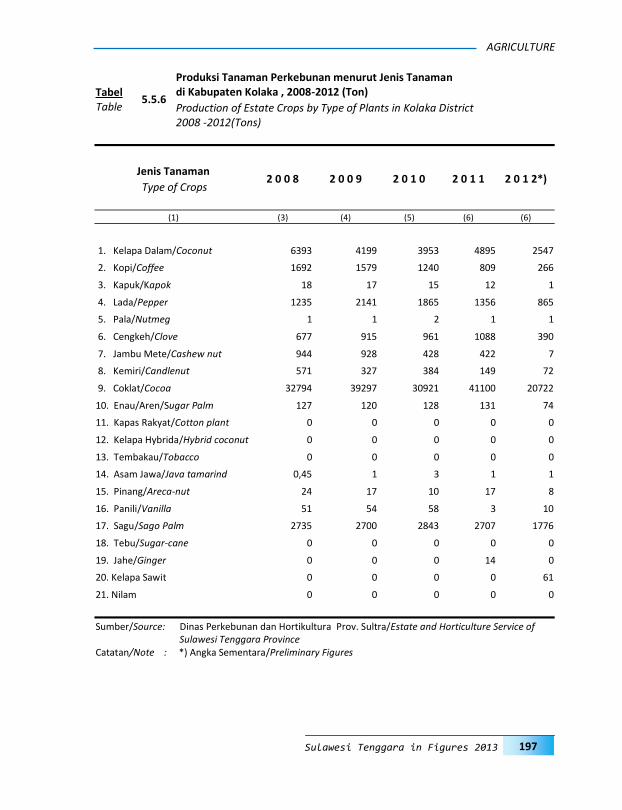
197
AGRICULTURE
Sulawesi Tenggara in Figures 2013
Jenis Tanaman 2 0 0 8 2 0 0 9 2 0 1 0 2 0 1 1 2 0 1 2*)
Type of Crops
(1) (3) (4) (5) (6) (6)
1. Kelapa Dalam/Coconut 6393 4199 3953 4895 2547
2. Kopi/Coffee 1692 1579 1240 809 266
3. Kapuk/Kapok 18 17 15 12 1
4. Lada/Pepper 1235 2141 1865 1356 865
5. Pala/Nutmeg 1 1 2 1 1
6. Cengkeh/Clove 677 915 961 1088 390
7. Jambu Mete/Cashew nut 944 928 428 422 7
8. Kemiri/Candlenut 571 327 384 149 72
9. Coklat/Cocoa 32794 39297 30921 41100 20722
10. Enau/Aren/Sugar Palm 127 120 128 131 74
11. Kapas Rakyat/Cotton plant 0 0 0 0 0
12. Kelapa Hybrida/Hybrid coconut 0 0 0 0 0
13. Tembakau/Tobacco 0 0 0 0 0
14. Asam Jawa/Java tamarind 0,45 1 3 1 1
15. Pinang/Areca-nut 24 17 10 17 8
16. Panili/Vanilla 51 54 58 3 10
17. Sagu/Sago Palm 2735 2700 2843 2707 1776
18. Tebu/Sugar-cane 0 0 0 0 0
19. Jahe/Ginger 0 0 0 14 0
20. Kelapa Sawit 0 0 0 0 61
21. Nilam 0 0 0 0 0
Sumber/Source: Dinas Perkebunan dan Hortikultura Prov. Sultra/Estate and Horticulture Service of Sulawesi Tenggara Province
Catatan/Note : *) Angka Sementara/Preliminary Figures
5.5.6
Produksi Tanaman Perkebunan menurut Jenis Tanaman di Kabupaten Kolaka , 2008-2012 (Ton) Tabel
Table Production of Estate Crops by Type of Plants in Kolaka District 2008 -2012(Tons)

198
PERTANIAN
Sulawesi Tenggara Dalam Angka 2013
Jenis Tanaman 2 0 0 8 2 0 0 9 2 0 1 0 2 0 1 1 2 0 1 2*)
Type of Crops
(1) (3) (4) (5) (6) (6)
1. Kelapa Dalam/Coconut 3634 3634 3634 6341 3656
2. Kopi/Coffee 319 308 308 339 295
3. Kapuk/Kapok 0 0 0 0 0
4. Lada/Pepper 1084 1084 1093 1202 1084
5. Pala/Nutmeg 14 13 13 14 12
6. Cengkeh/Clove 35 32 31 34 27
7. Jambu Mete/Cashew nut 7218 7288 7288 7654 6400
8. Kemiri/Candlenut 376 376 343 377 288
9. Coklat/Cocoa 8339 8268 8409 9022 8956
10. Enau/Aren/Sugar Palm 0,3 0 0 0 0
11. Kapas Rakyat/Cotton plant 0 0 0 0 0
12. Kelapa Hybrida/Hybrid coconut 2910 2910 2910 3201 2911
13. Tembakau/Tobacco 0 0 0 0 0
14. Asam Jawa/Java tamarind 0 0 0 0 0
15. Pinang/Areca-nut 59 57 57 63 47
16. Panili/Vanilla 41 40 40 40 29
17. Sagu/Sago Palm 136 130 138 159 140
18. Tebu/Sugar-cane 0 0 0 0 0
19. Jahe/Ginger 0 29 74 74 0
20. Kelapa Sawit 0 0 0 0 0
21. Nilam 0 0 0 0 0
Sumber/Source: Dinas Perkebunan dan Hortikultura Prov. Sultra/Estate and Horticulture Service of Sulawesi Tenggara Province
Catatan/Note : *) Angka Sementara/Preliminary Figures
5.5.7
Produksi Tanaman Perkebunan menurut Jenis Tanaman di Kabupaten Konawe Selatan , 2008-2012 (Ton) Tabel
Table Production of Estate Crops by Type of Plants in Konawe Selatan District 2008 -2012(Tons)
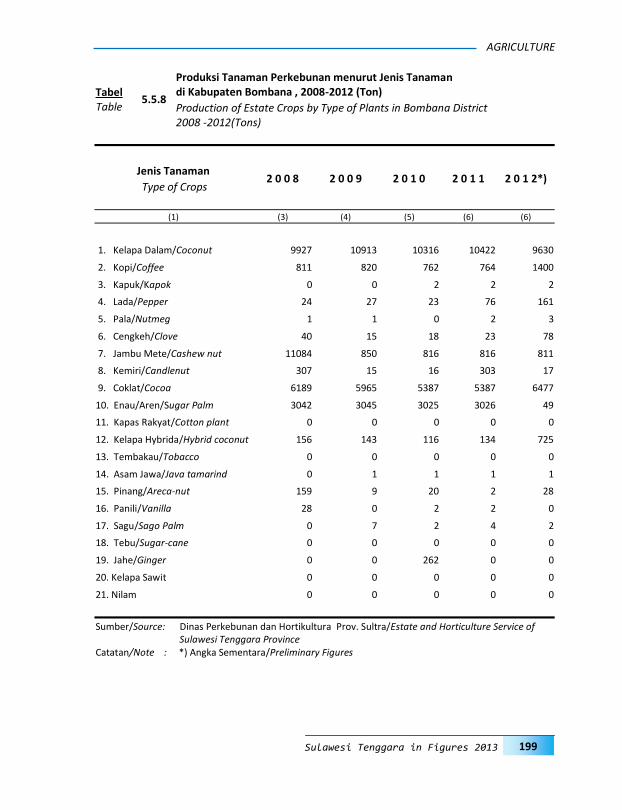
199
AGRICULTURE
Sulawesi Tenggara in Figures 2013
Jenis Tanaman 2 0 0 8 2 0 0 9 2 0 1 0 2 0 1 1 2 0 1 2*)
Type of Crops
(1) (3) (4) (5) (6) (6)
1. Kelapa Dalam/Coconut 9927 10913 10316 10422 9630
2. Kopi/Coffee 811 820 762 764 1400
3. Kapuk/Kapok 0 0 2 2 2
4. Lada/Pepper 24 27 23 76 161
5. Pala/Nutmeg 1 1 0 2 3
6. Cengkeh/Clove 40 15 18 23 78
7. Jambu Mete/Cashew nut 11084 850 816 816 811
8. Kemiri/Candlenut 307 15 16 303 17
9. Coklat/Cocoa 6189 5965 5387 5387 6477
10. Enau/Aren/Sugar Palm 3042 3045 3025 3026 49
11. Kapas Rakyat/Cotton plant 0 0 0 0 0
12. Kelapa Hybrida/Hybrid coconut 156 143 116 134 725
13. Tembakau/Tobacco 0 0 0 0 0
14. Asam Jawa/Java tamarind 0 1 1 1 1
15. Pinang/Areca-nut 159 9 20 2 28
16. Panili/Vanilla 28 0 2 2 0
17. Sagu/Sago Palm 0 7 2 4 2
18. Tebu/Sugar-cane 0 0 0 0 0
19. Jahe/Ginger 0 0 262 0 0
20. Kelapa Sawit 0 0 0 0 0
21. Nilam 0 0 0 0 0
Sumber/Source: Dinas Perkebunan dan Hortikultura Prov. Sultra/Estate and Horticulture Service of Sulawesi Tenggara Province
Catatan/Note : *) Angka Sementara/Preliminary Figures
5.5.8
Produksi Tanaman Perkebunan menurut Jenis Tanaman di Kabupaten Bombana , 2008-2012 (Ton) Tabel
Table Production of Estate Crops by Type of Plants in Bombana District 2008 -2012(Tons)
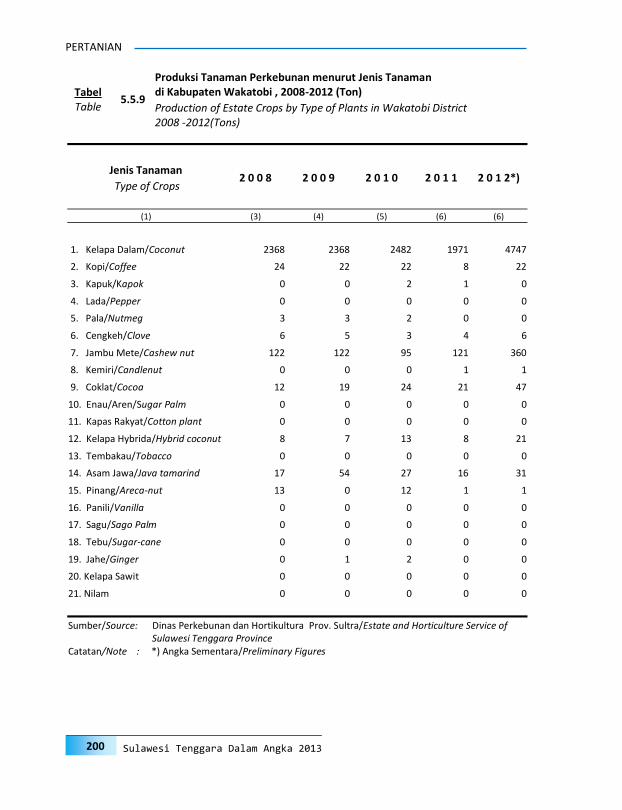
200
PERTANIAN
Sulawesi Tenggara Dalam Angka 2013
Jenis Tanaman 2 0 0 8 2 0 0 9 2 0 1 0 2 0 1 1 2 0 1 2*)
Type of Crops
(1) (3) (4) (5) (6) (6)
1. Kelapa Dalam/Coconut 2368 2368 2482 1971 4747
2. Kopi/Coffee 24 22 22 8 22
3. Kapuk/Kapok 0 0 2 1 0
4. Lada/Pepper 0 0 0 0 0
5. Pala/Nutmeg 3 3 2 0 0
6. Cengkeh/Clove 6 5 3 4 6
7. Jambu Mete/Cashew nut 122 122 95 121 360
8. Kemiri/Candlenut 0 0 0 1 1
9. Coklat/Cocoa 12 19 24 21 47
10. Enau/Aren/Sugar Palm 0 0 0 0 0
11. Kapas Rakyat/Cotton plant 0 0 0 0 0
12. Kelapa Hybrida/Hybrid coconut 8 7 13 8 21
13. Tembakau/Tobacco 0 0 0 0 0
14. Asam Jawa/Java tamarind 17 54 27 16 31
15. Pinang/Areca-nut 13 0 12 1 1
16. Panili/Vanilla 0 0 0 0 0
17. Sagu/Sago Palm 0 0 0 0 0
18. Tebu/Sugar-cane 0 0 0 0 0
19. Jahe/Ginger 0 1 2 0 0
20. Kelapa Sawit 0 0 0 0 0
21. Nilam 0 0 0 0 0
Sumber/Source: Dinas Perkebunan dan Hortikultura Prov. Sultra/Estate and Horticulture Service of Sulawesi Tenggara Province
Catatan/Note : *) Angka Sementara/Preliminary Figures
5.5.9
Produksi Tanaman Perkebunan menurut Jenis Tanaman di Kabupaten Wakatobi , 2008-2012 (Ton) Tabel
Table Production of Estate Crops by Type of Plants in Wakatobi District 2008 -2012(Tons)
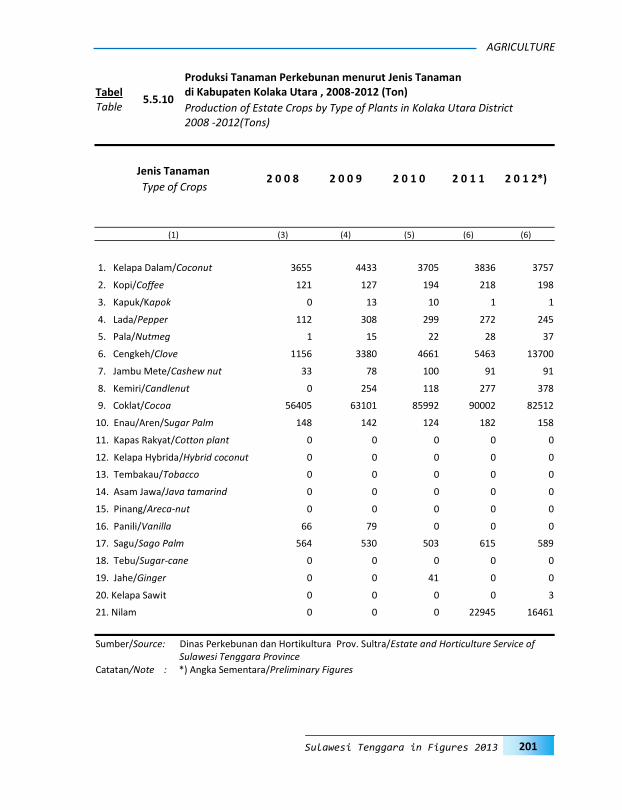
201
AGRICULTURE
Sulawesi Tenggara in Figures 2013
Jenis Tanaman 2 0 0 8 2 0 0 9 2 0 1 0 2 0 1 1 2 0 1 2*)
Type of Crops
(1) (3) (4) (5) (6) (6)
1. Kelapa Dalam/Coconut 3655 4433 3705 3836 3757
2. Kopi/Coffee 121 127 194 218 198
3. Kapuk/Kapok 0 13 10 1 1
4. Lada/Pepper 112 308 299 272 245
5. Pala/Nutmeg 1 15 22 28 37
6. Cengkeh/Clove 1156 3380 4661 5463 13700
7. Jambu Mete/Cashew nut 33 78 100 91 91
8. Kemiri/Candlenut 0 254 118 277 378
9. Coklat/Cocoa 56405 63101 85992 90002 82512
10. Enau/Aren/Sugar Palm 148 142 124 182 158
11. Kapas Rakyat/Cotton plant 0 0 0 0 0
12. Kelapa Hybrida/Hybrid coconut 0 0 0 0 0
13. Tembakau/Tobacco 0 0 0 0 0
14. Asam Jawa/Java tamarind 0 0 0 0 0
15. Pinang/Areca-nut 0 0 0 0 0
16. Panili/Vanilla 66 79 0 0 0
17. Sagu/Sago Palm 564 530 503 615 589
18. Tebu/Sugar-cane 0 0 0 0 0
19. Jahe/Ginger 0 0 41 0 0
20. Kelapa Sawit 0 0 0 0 3
21. Nilam 0 0 0 22945 16461
Sumber/Source: Dinas Perkebunan dan Hortikultura Prov. Sultra/Estate and Horticulture Service of Sulawesi Tenggara Province
Catatan/Note : *) Angka Sementara/Preliminary Figures
5.5.10
Produksi Tanaman Perkebunan menurut Jenis Tanaman di Kabupaten Kolaka Utara , 2008-2012 (Ton) Tabel
Table Production of Estate Crops by Type of Plants in Kolaka Utara District 2008 -2012(Tons)
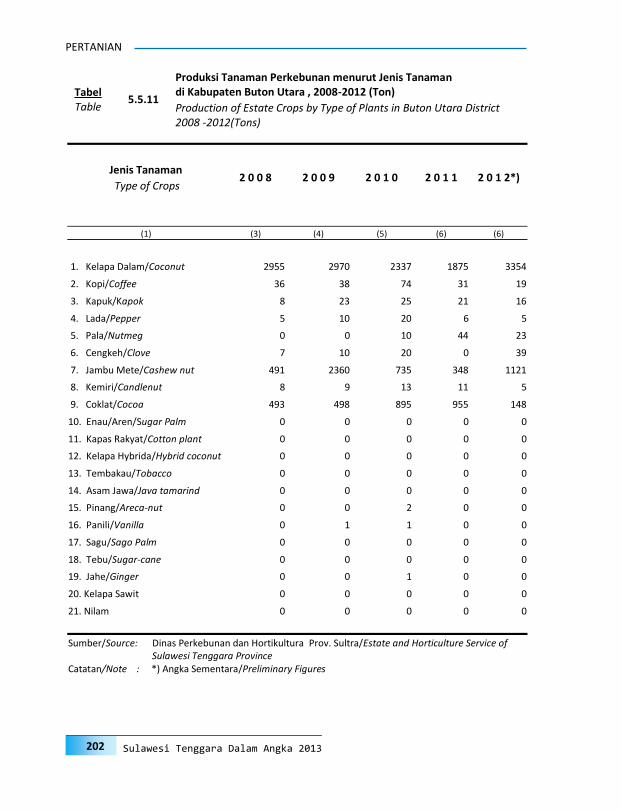
202
PERTANIAN
Sulawesi Tenggara Dalam Angka 2013
Jenis Tanaman 2 0 0 8 2 0 0 9 2 0 1 0 2 0 1 1 2 0 1 2*)
Type of Crops
(1) (3) (4) (5) (6) (6)
1. Kelapa Dalam/Coconut 2955 2970 2337 1875 3354
2. Kopi/Coffee 36 38 74 31 19
3. Kapuk/Kapok 8 23 25 21 16
4. Lada/Pepper 5 10 20 6 5
5. Pala/Nutmeg 0 0 10 44 23
6. Cengkeh/Clove 7 10 20 0 39
7. Jambu Mete/Cashew nut 491 2360 735 348 1121
8. Kemiri/Candlenut 8 9 13 11 5
9. Coklat/Cocoa 493 498 895 955 148
10. Enau/Aren/Sugar Palm 0 0 0 0 0
11. Kapas Rakyat/Cotton plant 0 0 0 0 0
12. Kelapa Hybrida/Hybrid coconut 0 0 0 0 0
13. Tembakau/Tobacco 0 0 0 0 0
14. Asam Jawa/Java tamarind 0 0 0 0 0
15. Pinang/Areca-nut 0 0 2 0 0
16. Panili/Vanilla 0 1 1 0 0
17. Sagu/Sago Palm 0 0 0 0 0
18. Tebu/Sugar-cane 0 0 0 0 0
19. Jahe/Ginger 0 0 1 0 0
20. Kelapa Sawit 0 0 0 0 0
21. Nilam 0 0 0 0 0
Sumber/Source: Dinas Perkebunan dan Hortikultura Prov. Sultra/Estate and Horticulture Service of Sulawesi Tenggara Province
Catatan/Note : *) Angka Sementara/Preliminary Figures
5.5.11
Produksi Tanaman Perkebunan menurut Jenis Tanaman di Kabupaten Buton Utara , 2008-2012 (Ton) Tabel
Table Production of Estate Crops by Type of Plants in Buton Utara District 2008 -2012(Tons)

203
AGRICULTURE
Sulawesi Tenggara in Figures 2013
Jenis Tanaman 2 0 0 8 2 0 0 9 2 0 1 0 2 0 1 1 2 0 1 2*)
Type of Crops
(1) (3) (4) (5) (6) (6)
1. Kelapa Dalam/Coconut 1 118 1 186 1 054 1 054 1 054
2. Kopi/Coffee 206 311 282 282 282
3. Kapuk/Kapok 0 0 0 0 0
4. Lada/Pepper 46 99 144 144 144
5. Pala/Nutmeg 0 39 41 41 4
6. Cengkeh/Clove 122 211 182 182 182
7. Jambu Mete/Cashew nut 2 510 2 257 562 562 562
8. Kemiri/Candlenut 0 90 18 18 18
9. Coklat/Cocoa 1 624 4 237 590 590 590
10. Enau/Aren/Sugar Palm 0 2 2 2 2
11. Kapas Rakyat/Cotton plant 0 0 0 0 0
12. Kelapa Hybrida/Hybrid coconut 0 0 0 0 0
13. Tembakau/Tobacco 0 0 0 0 0
14. Asam Jawa/Java tamarind 0 0 0 0 0
15. Pinang/Areca-nut 0 14 8 8 8
16. Panili/Vanilla 0 8 2 2 2
17. Sagu/Sago Palm 1 603 342 360 360 36
18. Tebu/Sugar-cane 0 0 0 0 0
19. Jahe/Ginger 0 0 0 0 0
20. Kelapa Sawit 0 0 0 0 0
21. Nilam 0 0 0 0 0
Sumber/Source: Dinas Perkebunan dan Hortikultura Prov. Sultra/Estate and Horticulture Service of Sulawesi Tenggara Province
Catatan/Note : *) Angka Sementara/Preliminary Figures
5.5.12
Produksi Tanaman Perkebunan menurut Jenis Tanaman di Kabupaten Konawe Utara , 2008-2012 (Ton) Tabel
Table Production of Estate Crops by Type of Plants in Konawe Utara District 2008 -2012(Tons)

204
PERTANIAN
Sulawesi Tenggara Dalam Angka 2013
Jenis Tanaman 2 0 0 8 2 0 0 9 2 0 1 0 2 0 1 1 2 0 1 2*)
Type of Crops
(1) (3) (4) (5) (6) (6)
1. Kelapa Dalam/Coconut 483 337 337 344 410
2. Kopi/Coffee 80 61 61 62 61
3. Kapuk/Kapok 45 6 6 6 5
4. Lada/Pepper 82 309 89 89 90
5. Pala/Nutmeg 0 0 0 0 0
6. Cengkeh/Clove 1 6 3 6 6
7. Jambu Mete/Cashew nut 138 510 510 548 516
8. Kemiri/Candlenut 43 50 50 45 46
9. Coklat/Cocoa 609 394 394 417 446
10. Enau/Aren/Sugar Palm 13 13 13 13 15
11. Kapas Rakyat/Cotton plant 0 0 0 0 0
12. Kelapa Hybrida/Hybrid coconut 24 13 13 12 12
13. Tembakau/Tobacco 0 0 0 0 0
14. Asam Jawa/Java tamarind 0,4 1 1 1 1
15. Pinang/Areca-nut 74 10 10 12 10
16. Panili/Vanilla 6 8 8 7 6
17. Sagu/Sago Palm 28 30 30 30 31
18. Tebu/Sugar-cane 0 0 0 0 0
19. Jahe/Ginger 0 18 8 8 0
20. Kelapa Sawit 0 0 0 0 0
21. Nilam 0 0 0 0 0
Sumber/Source: Dinas Perkebunan dan Hortikultura Prov. Sultra/Estate and Horticulture Service of Sulawesi Tenggara Province
Catatan/Note : *) Angka Sementara/Preliminary Figures
5.5.13
Produksi Tanaman Perkebunan menurut Jenis Tanaman di Kota Kendari , 2008-2012 (Ton) Tabel
Table Production of Estate Crops by Type of Plants in Kendari City 2008 -2012(Tons)

205
AGRICULTURE
Sulawesi Tenggara in Figures 2013
Jenis Tanaman 2 0 0 8 2 0 0 9 2 0 1 0 2 0 1 1 2 0 1 2*)
Type of Crops
(1) (3) (4) (5) (6) (6)
1. Kelapa Dalam/Coconut 17 58 67 22 31
2. Kopi/Coffee 1 2 4 1 2
3. Kapuk/Kapok 22 17 16 2 5
4. Lada/Pepper 0 0 0 0 0
5. Pala/Nutmeg 0 0 0 0 0
6. Cengkeh/Clove 0 0 0 0 0
7. Jambu Mete/Cashew nut 83 96 68 57 126
8. Kemiri/Candlenut 4 4 3 2 8
9. Coklat/Cocoa 79 96 135 52 44
10. Enau/Aren/Sugar Palm 0 8 15 3 2
11. Kapas Rakyat/Cotton plant 0 0 0 0 0
12. Kelapa Hybrida/Hybrid coconut 15 12 3 2 3
13. Tembakau/Tobacco 0 0 0 0 0
14. Asam Jawa/Java tamarind 17 0 37 1 1
15. Pinang/Areca-nut 10 7 2 1 0
16. Panili/Vanilla 0 0 0 0 0
17. Sagu/Sago Palm 0 0 0 0 0
18. Tebu/Sugar-cane 0 0 0 0 0
19. Jahe/Ginger 0 7 2 2 0
20. Kelapa Sawit 0 0 0 0 0
21. Nilam 0 0 0 0 0
Sumber/Source: Dinas Perkebunan dan Hortikultura Prov. Sultra/Estate and Horticulture Service of Sulawesi Tenggara Province
Catatan/Note : *) Angka Sementara/Preliminary Figures
5.5.14
Produksi Tanaman Perkebunan menurut Jenis Tanaman di Kota Bau-bau , 2008-2012 (Ton) Tabel
Table Production of Estate Crops by Type of Plants in Bau-bau City 2008 -2012(Tons)

206
PERTANIAN
Sulawesi Tenggara Dalam Angka 2013
Jenis Tanaman
Type of Crops
Produktif
Productive Crops
Belum Produktif Not Yet
Prod. Crops
Tidak Produktif
Not Produc-tive
Crops
Jumlah
Total Areas
(1) (2) (3) (4) (5)
1. Kelapa Dalam/Coconut 47 415 10 883 9 782 68 080
2. Kopi/Coffee 6 918 1 372 1 970 10 260
3. Kapuk/Kapok 966 74 129 1 169
4. Lada/Pepper 7 654 2 571 2 997 13 222
5. Pala/Nutmeg 386 519 41 946
6. Cengkeh/Clove 14 063 3 437 539 18 039
7. Jambu Mete/Cashew nut 74 625 10 457 14 585 99 667
8. Kemiri/Candlenut 2 149 794 806 3 749
9. Coklat/Cocoa 184 053 38 597 37 797 260 447
10. Enau/Aren/Sugar Palm 2 508 904 281 3 693
11. Kapas Rakyat/Cotton plant 0 0 0 0
12. Kelapa Hybrida/Hybrid coconut 2 766 195 3 276 6 237
13. Tembakau/Tobacco 0 0 0 0
14. Asam Jawa/Java tamarind 134 84 34 252
15. Pinang/Areca-nut 408 142 100 650
16. Panili/Vanilla 365 362 247 974
17. Sagu/Sago Palm 2 919 1 821 336 5 076
18. Tebu/Sugar-cane 0 0 0 0
19. Jahe/Ginger 0 0 0 0
20. Kelapa Sawit 500 5 019 0 5 519
21. Nilam 5 135 123 929 6 187
Sumber/Source: Dinas Perkebunan dan Hortikultura Prov. Sultra/Estate and Horticulture Service of Sulawesi Tenggara Province
5.5.15
Luas Areal Tanaman Perkebunan Menurut Jenis Tanaman di Sulawesi Tenggara (Ha) , 2012 Tabel
Table Planted Area of Estate Crops by Type of Crops in Sulawesi Tenggara (Ha),2012*)
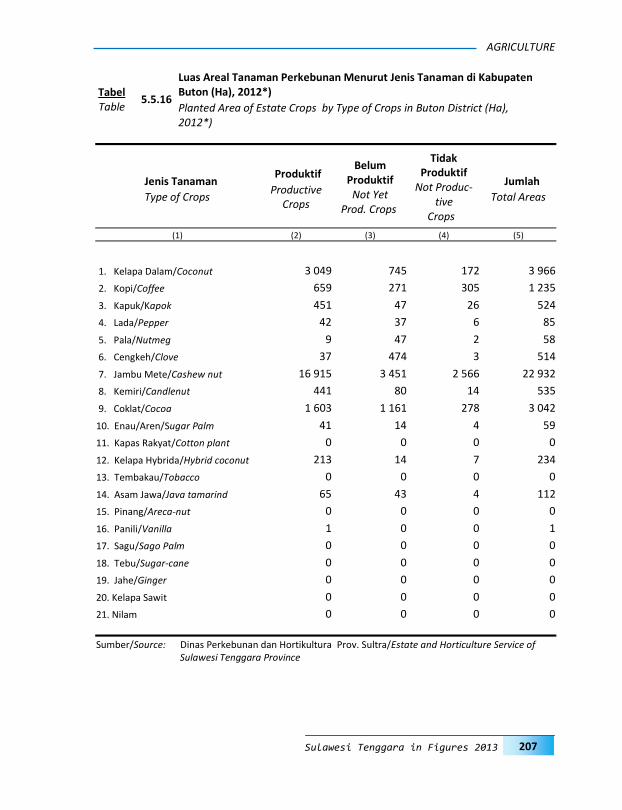
207
AGRICULTURE
Sulawesi Tenggara in Figures 2013
Jenis Tanaman
Type of Crops
Produktif
Productive Crops
Belum Produktif Not Yet
Prod. Crops
Tidak Produktif
Not Produc-tive
Crops
Jumlah
Total Areas
(1) (2) (3) (4) (5)
1. Kelapa Dalam/Coconut 3 049 745 172 3 966
2. Kopi/Coffee 659 271 305 1 235
3. Kapuk/Kapok 451 47 26 524
4. Lada/Pepper 42 37 6 85
5. Pala/Nutmeg 9 47 2 58
6. Cengkeh/Clove 37 474 3 514
7. Jambu Mete/Cashew nut 16 915 3 451 2 566 22 932
8. Kemiri/Candlenut 441 80 14 535
9. Coklat/Cocoa 1 603 1 161 278 3 042
10. Enau/Aren/Sugar Palm 41 14 4 59
11. Kapas Rakyat/Cotton plant 0 0 0 0
12. Kelapa Hybrida/Hybrid coconut 213 14 7 234
13. Tembakau/Tobacco 0 0 0 0
14. Asam Jawa/Java tamarind 65 43 4 112
15. Pinang/Areca-nut 0 0 0 0
16. Panili/Vanilla 1 0 0 1
17. Sagu/Sago Palm 0 0 0 0
18. Tebu/Sugar-cane 0 0 0 0
19. Jahe/Ginger 0 0 0 0
20. Kelapa Sawit 0 0 0 0
21. Nilam 0 0 0 0
Sumber/Source: Dinas Perkebunan dan Hortikultura Prov. Sultra/Estate and Horticulture Service of Sulawesi Tenggara Province
5.5.16
Luas Areal Tanaman Perkebunan Menurut Jenis Tanaman di Kabupaten Buton (Ha), 2012*) Tabel
Table Planted Area of Estate Crops by Type of Crops in Buton District (Ha), 2012*)

208
PERTANIAN
Sulawesi Tenggara Dalam Angka 2013
Jenis Tanaman
Type of Crops
Produktif
Productive Crops
Belum Produktif Not Yet
Prod. Crops
Tidak Produktif
Not Productive
Crops
Jumlah
Total Areas
(1) (2) (3) (4) (5)
1. Kelapa Dalam/Coconut 6 423 452 1 143 8 018
2. Kopi/Coffee 373 5 197 575
3. Kapuk/Kapok 191 1 32 224
4. Lada/Pepper 85 2 36 123
5. Pala/Nutmeg 0 0 0 0
6. Cengkeh/Clove 0 0 0 0
7. Jambu Mete/Cashew nut 18 025 1 274 4 19 303
8. Kemiri/Candlenut 138 2 66 206
9. Coklat/Cocoa 8 979 3 703 1 175 13 857
10. Enau/Aren/Sugar Palm 63 12 29 104
11. Kapas Rakyat/Cotton plant 0 0 0 0
12. Kelapa Hybrida/Hybrid coconut 0 0 0 0
13. Tembakau/Tobacco 0 0 0 0
14. Asam Jawa/Java tamarind 8 0 1 9
15. Pinang/Areca-nut 5 0 12 17
16. Panili/Vanilla 0 0 0 0
17. Sagu/Sago Palm 0 0 0 0
18. Tebu/Sugar-cane 0 0 0 0
19. Jahe/Ginger 0 0 0 0
20. Kelapa Sawit 0 0 0 0
21. Nilam 0 0 0 0
Sumber/Source: Dinas Perkebunan dan Hortikultura Prov. Sultra/Estate and Horticulture Service of Sulawesi Tenggara Province
5.5.17
Luas Areal Tanaman Perkebunan Menurut Jenis Tanaman di Kabupaten Muna (Ha), 2012*) Tabel
Table Planted Area of Estate Crops by Type of Crops in Muna District (Ha), 2012*)

209
AGRICULTURE
Sulawesi Tenggara in Figures 2013
Jenis Tanaman
Type of Crops
Produktif
Productive Crops
Belum Produktif Not Yet
Prod. Crops
Tidak Produktif
Not Productive
Crops
Jumlah
Total Areas
(1) (2) (3) (4) (5)
1. Kelapa Dalam/Coconut 6130 543 451 7124
2. Kopi/Coffee 1096 154 259 1509
3. Kapuk/Kapok 142 4 32 178
4. Lada/Pepper 2458 365 977 3800
5. Pala/Nutmeg 132 87 0 219
6. Cengkeh/Clove 578 205 70 853
7. Jambu Mete/Cashew nut 8908 700 1377 10985
8. Kemiri/Candlenut 165 140 146 451
9. Coklat/Cocoa 13120 4957 1480 19557
10. Enau/Aren/Sugar Palm 30 6 8 44
11. Kapas Rakyat/Cotton plant 0 0 0 0
12. Kelapa Hybrida/Hybrid coconut 210 16 48 274
13. Tembakau/Tobacco 0 0 0 0
14. Asam Jawa/Java tamarind 7 5 0 12
15. Pinang/Areca-nut 166 17 8 191
16. Panili/Vanilla 8 37 14 59
17. Sagu/Sago Palm 1325 600 90 2015
18. Tebu/Sugar-cane 0 0 0 0
19. Jahe/Ginger 0 0 0 0
20. Kelapa Sawit 10 1055 0 1065
21. Nilam 0 0 0 0
Sumber/Source: Dinas Perkebunan dan Hortikultura Prov. Sultra/Estate and Horticulture Service of Sulawesi Tenggara Province
5.5.18
Luas Areal Tanaman Perkebunan Menurut Jenis Tanaman di Kabupaten Konawe (Ha), 2012*) Tabel
Table Planted Area of Estate Crops by Type of Crops in Konawe District (Ha), 2012*)
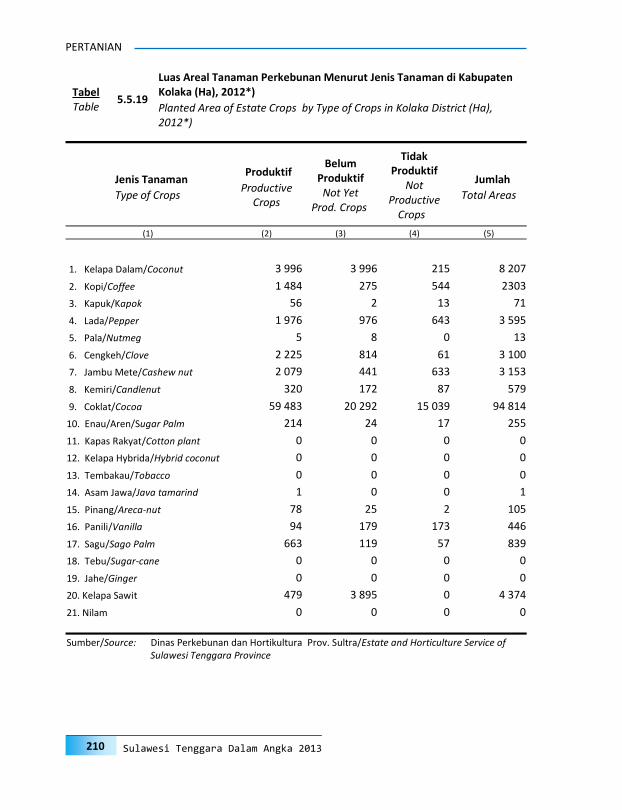
210
PERTANIAN
Sulawesi Tenggara Dalam Angka 2013
Jenis Tanaman
Type of Crops
Produktif
Productive Crops
Belum Produktif Not Yet
Prod. Crops
Tidak Produktif
Not Productive
Crops
Jumlah
Total Areas
(1) (2) (3) (4) (5)
1. Kelapa Dalam/Coconut 3 996 3 996 215 8 207
2. Kopi/Coffee 1 484 275 544 2303
3. Kapuk/Kapok 56 2 13 71
4. Lada/Pepper 1 976 976 643 3 595
5. Pala/Nutmeg 5 8 0 13
6. Cengkeh/Clove 2 225 814 61 3 100
7. Jambu Mete/Cashew nut 2 079 441 633 3 153
8. Kemiri/Candlenut 320 172 87 579
9. Coklat/Cocoa 59 483 20 292 15 039 94 814
10. Enau/Aren/Sugar Palm 214 24 17 255
11. Kapas Rakyat/Cotton plant 0 0 0 0
12. Kelapa Hybrida/Hybrid coconut 0 0 0 0
13. Tembakau/Tobacco 0 0 0 0
14. Asam Jawa/Java tamarind 1 0 0 1
15. Pinang/Areca-nut 78 25 2 105
16. Panili/Vanilla 94 179 173 446
17. Sagu/Sago Palm 663 119 57 839
18. Tebu/Sugar-cane 0 0 0 0
19. Jahe/Ginger 0 0 0 0
20. Kelapa Sawit 479 3 895 0 4 374
21. Nilam 0 0 0 0
Sumber/Source: Dinas Perkebunan dan Hortikultura Prov. Sultra/Estate and Horticulture Service of Sulawesi Tenggara Province
5.5.19
Luas Areal Tanaman Perkebunan Menurut Jenis Tanaman di Kabupaten Kolaka (Ha), 2012*) Tabel
Table Planted Area of Estate Crops by Type of Crops in Kolaka District (Ha), 2012*)
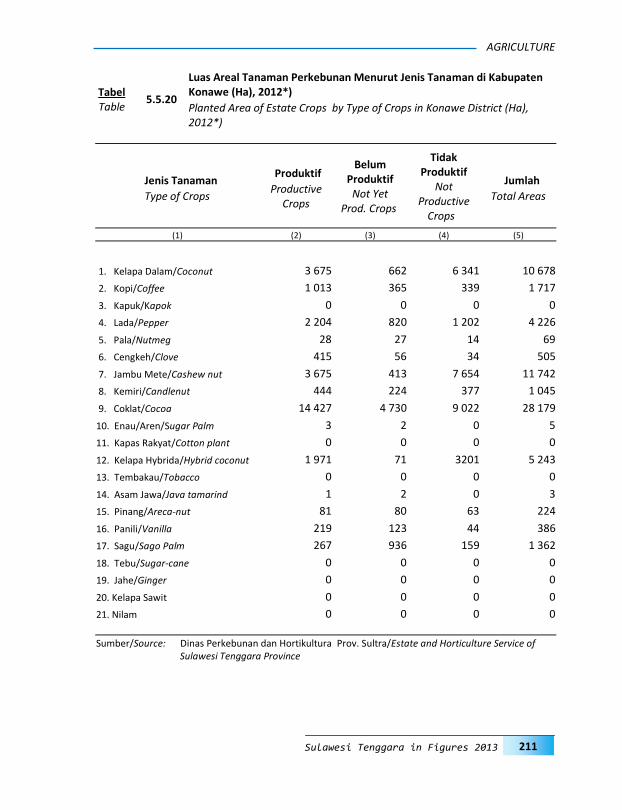
211
AGRICULTURE
Sulawesi Tenggara in Figures 2013
Jenis Tanaman
Type of Crops
Produktif
Productive Crops
Belum Produktif Not Yet
Prod. Crops
Tidak Produktif
Not Productive
Crops
Jumlah
Total Areas
(1) (2) (3) (4) (5)
1. Kelapa Dalam/Coconut 3 675 662 6 341 10 678
2. Kopi/Coffee 1 013 365 339 1 717
3. Kapuk/Kapok 0 0 0 0
4. Lada/Pepper 2 204 820 1 202 4 226
5. Pala/Nutmeg 28 27 14 69
6. Cengkeh/Clove 415 56 34 505
7. Jambu Mete/Cashew nut 3 675 413 7 654 11 742
8. Kemiri/Candlenut 444 224 377 1 045
9. Coklat/Cocoa 14 427 4 730 9 022 28 179
10. Enau/Aren/Sugar Palm 3 2 0 5
11. Kapas Rakyat/Cotton plant 0 0 0 0
12. Kelapa Hybrida/Hybrid coconut 1 971 71 3201 5 243
13. Tembakau/Tobacco 0 0 0 0
14. Asam Jawa/Java tamarind 1 2 0 3
15. Pinang/Areca-nut 81 80 63 224
16. Panili/Vanilla 219 123 44 386
17. Sagu/Sago Palm 267 936 159 1 362
18. Tebu/Sugar-cane 0 0 0 0
19. Jahe/Ginger 0 0 0 0
20. Kelapa Sawit 0 0 0 0
21. Nilam 0 0 0 0
Sumber/Source: Dinas Perkebunan dan Hortikultura Prov. Sultra/Estate and Horticulture Service of Sulawesi Tenggara Province
5.5.20
Luas Areal Tanaman Perkebunan Menurut Jenis Tanaman di Kabupaten Konawe (Ha), 2012*) Tabel
Table Planted Area of Estate Crops by Type of Crops in Konawe District (Ha), 2012*)
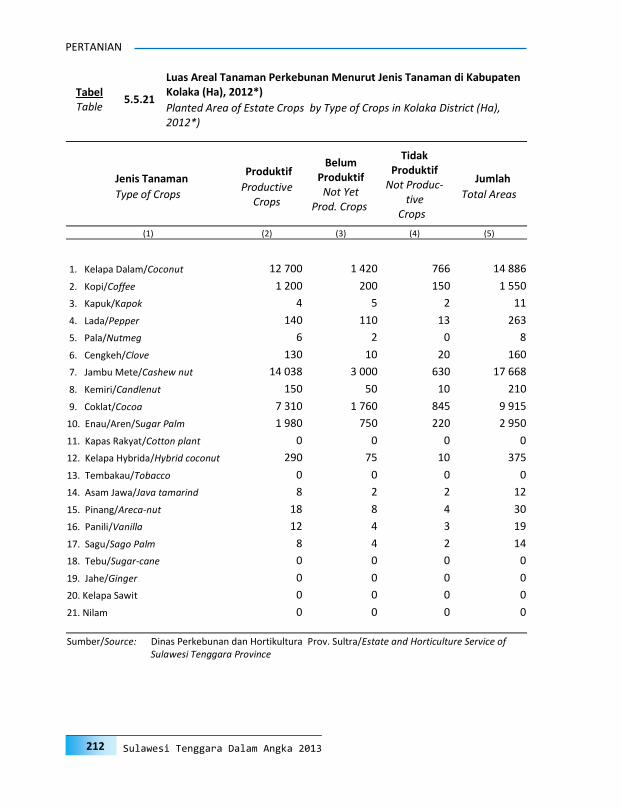
212
PERTANIAN
Sulawesi Tenggara Dalam Angka 2013
Jenis Tanaman
Type of Crops
Produktif
Productive Crops
Belum Produktif Not Yet
Prod. Crops
Tidak Produktif
Not Produc-tive
Crops
Jumlah
Total Areas
(1) (2) (3) (4) (5)
1. Kelapa Dalam/Coconut 12 700 1 420 766 14 886
2. Kopi/Coffee 1 200 200 150 1 550
3. Kapuk/Kapok 4 5 2 11
4. Lada/Pepper 140 110 13 263
5. Pala/Nutmeg 6 2 0 8
6. Cengkeh/Clove 130 10 20 160
7. Jambu Mete/Cashew nut 14 038 3 000 630 17 668
8. Kemiri/Candlenut 150 50 10 210
9. Coklat/Cocoa 7 310 1 760 845 9 915
10. Enau/Aren/Sugar Palm 1 980 750 220 2 950
11. Kapas Rakyat/Cotton plant 0 0 0 0
12. Kelapa Hybrida/Hybrid coconut 290 75 10 375
13. Tembakau/Tobacco 0 0 0 0
14. Asam Jawa/Java tamarind 8 2 2 12
15. Pinang/Areca-nut 18 8 4 30
16. Panili/Vanilla 12 4 3 19
17. Sagu/Sago Palm 8 4 2 14
18. Tebu/Sugar-cane 0 0 0 0
19. Jahe/Ginger 0 0 0 0
20. Kelapa Sawit 0 0 0 0
21. Nilam 0 0 0 0
Sumber/Source: Dinas Perkebunan dan Hortikultura Prov. Sultra/Estate and Horticulture Service of Sulawesi Tenggara Province
5.5.21
Luas Areal Tanaman Perkebunan Menurut Jenis Tanaman di Kabupaten Kolaka (Ha), 2012*) Tabel
Table Planted Area of Estate Crops by Type of Crops in Kolaka District (Ha), 2012*)
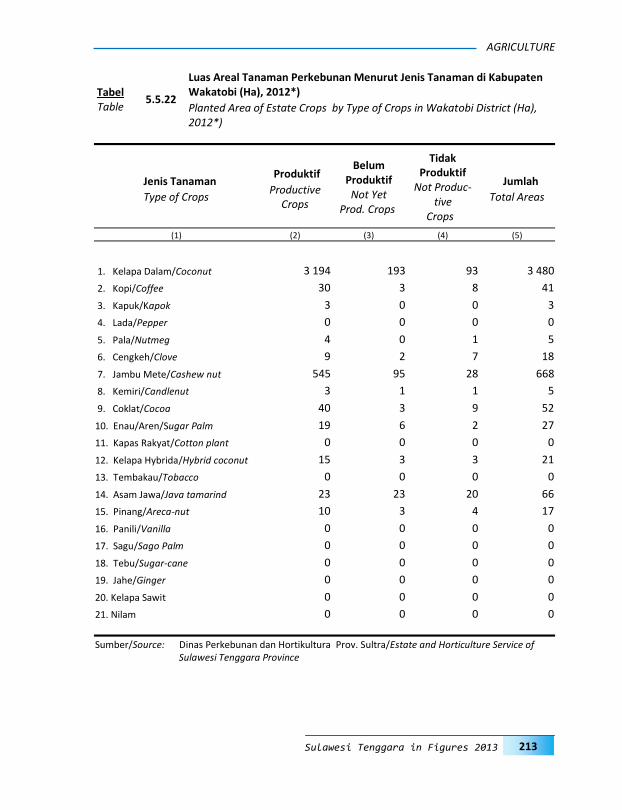
213
AGRICULTURE
Sulawesi Tenggara in Figures 2013
Jenis Tanaman
Type of Crops
Produktif
Productive Crops
Belum Produktif Not Yet
Prod. Crops
Tidak Produktif
Not Produc-tive
Crops
Jumlah
Total Areas
(1) (2) (3) (4) (5)
1. Kelapa Dalam/Coconut 3 194 193 93 3 480
2. Kopi/Coffee 30 3 8 41
3. Kapuk/Kapok 3 0 0 3
4. Lada/Pepper 0 0 0 0
5. Pala/Nutmeg 4 0 1 5
6. Cengkeh/Clove 9 2 7 18
7. Jambu Mete/Cashew nut 545 95 28 668
8. Kemiri/Candlenut 3 1 1 5
9. Coklat/Cocoa 40 3 9 52
10. Enau/Aren/Sugar Palm 19 6 2 27
11. Kapas Rakyat/Cotton plant 0 0 0 0
12. Kelapa Hybrida/Hybrid coconut 15 3 3 21
13. Tembakau/Tobacco 0 0 0 0
14. Asam Jawa/Java tamarind 23 23 20 66
15. Pinang/Areca-nut 10 3 4 17
16. Panili/Vanilla 0 0 0 0
17. Sagu/Sago Palm 0 0 0 0
18. Tebu/Sugar-cane 0 0 0 0
19. Jahe/Ginger 0 0 0 0
20. Kelapa Sawit 0 0 0 0
21. Nilam 0 0 0 0
Sumber/Source: Dinas Perkebunan dan Hortikultura Prov. Sultra/Estate and Horticulture Service of Sulawesi Tenggara Province
5.5.22
Luas Areal Tanaman Perkebunan Menurut Jenis Tanaman di Kabupaten Wakatobi (Ha), 2012*) Tabel
Table Planted Area of Estate Crops by Type of Crops in Wakatobi District (Ha), 2012*)
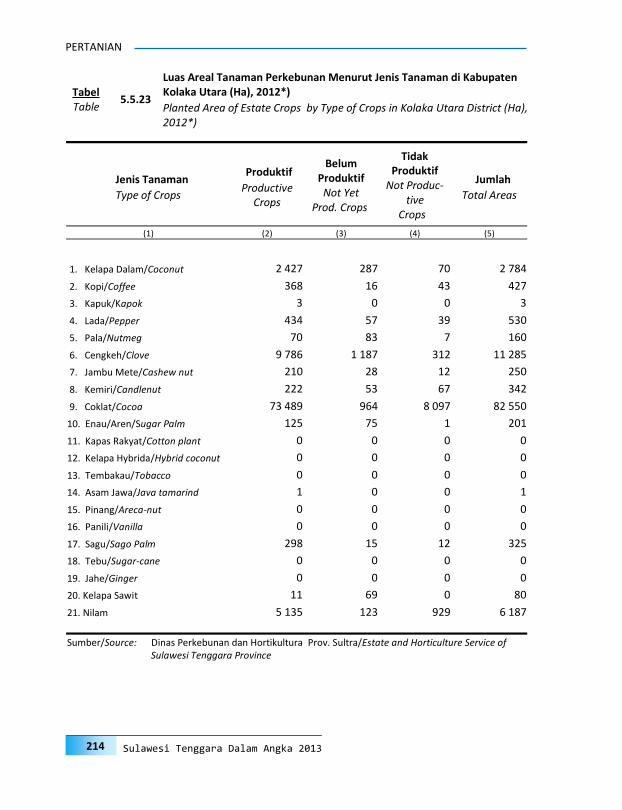
214
PERTANIAN
Sulawesi Tenggara Dalam Angka 2013
Jenis Tanaman
Type of Crops
Produktif
Productive Crops
Belum Produktif Not Yet
Prod. Crops
Tidak Produktif
Not Produc-tive
Crops
Jumlah
Total Areas
(1) (2) (3) (4) (5)
1. Kelapa Dalam/Coconut 2 427 287 70 2 784
2. Kopi/Coffee 368 16 43 427
3. Kapuk/Kapok 3 0 0 3
4. Lada/Pepper 434 57 39 530
5. Pala/Nutmeg 70 83 7 160
6. Cengkeh/Clove 9 786 1 187 312 11 285
7. Jambu Mete/Cashew nut 210 28 12 250
8. Kemiri/Candlenut 222 53 67 342
9. Coklat/Cocoa 73 489 964 8 097 82 550
10. Enau/Aren/Sugar Palm 125 75 1 201
11. Kapas Rakyat/Cotton plant 0 0 0 0
12. Kelapa Hybrida/Hybrid coconut 0 0 0 0
13. Tembakau/Tobacco 0 0 0 0
14. Asam Jawa/Java tamarind 1 0 0 1
15. Pinang/Areca-nut 0 0 0 0
16. Panili/Vanilla 0 0 0 0
17. Sagu/Sago Palm 298 15 12 325
18. Tebu/Sugar-cane 0 0 0 0
19. Jahe/Ginger 0 0 0 0
20. Kelapa Sawit 11 69 0 80
21. Nilam 5 135 123 929 6 187
Sumber/Source: Dinas Perkebunan dan Hortikultura Prov. Sultra/Estate and Horticulture Service of Sulawesi Tenggara Province
5.5.23
Luas Areal Tanaman Perkebunan Menurut Jenis Tanaman di Kabupaten Kolaka Utara (Ha), 2012*) Tabel
Table Planted Area of Estate Crops by Type of Crops in Kolaka Utara District (Ha), 2012*)

215
AGRICULTURE
Sulawesi Tenggara in Figures 2013
Jenis Tanaman
Type of Crops
Produktif
Productive Crops
Belum Produktif Not Yet
Prod. Crops
Tidak Produktif
Not Produc-tive
Crops
Jumlah
Total Areas
(1) (2) (3) (4) (5)
1. Kelapa Dalam/Coconut 3862 957 22 4841
2. Kopi/Coffee 117 29 35 181
3. Kapuk/Kapok 68 5 9 82
4. Lada/Pepper 36 78 36 150
5. Pala/Nutmeg 54 189 2 245
6. Cengkeh/Clove 138 176 2 316
7. Jambu Mete/Cashew nut 5190 441 481 6112
8. Kemiri/Candlenut 29 12 0 41
9. Coklat/Cocoa 1382 280 1453 3115
10. Enau/Aren/Sugar Palm 5 5 0 10
11. Kapas Rakyat/Cotton plant 0 0 0 0
12. Kelapa Hybrida/Hybrid coconut 12 0 0 12
13. Tembakau/Tobacco 0 0 0 0
14. Asam Jawa/Java tamarind 0 0 0 0
15. Pinang/Areca-nut 7 0 0 7
16. Panili/Vanilla 2 1 1 4
17. Sagu/Sago Palm 0 0 0 0
18. Tebu/Sugar-cane 0 0 0 0
19. Jahe/Ginger 0 0 0 0
20. Kelapa Sawit 0 0 0 0
21. Nilam 0 0 0 0
Sumber/Source: Dinas Perkebunan dan Hortikultura Prov. Sultra/Estate and Horticulture Service of Sulawesi Tenggara Province
5.5.24
Luas Areal Tanaman Perkebunan Menurut Jenis Tanaman di Kabupaten Buton Utara (Ha), 2012*) Tabel
Table Planted Area of Estate Crops by Type of Crops in Buton Utara District (Ha), 2012*)

216
PERTANIAN
Sulawesi Tenggara Dalam Angka 2013
Jenis Tanaman
Type of Crops
Produktif
Productive Crops
Belum Produktif Not Yet
Prod. Crops
Tidak Produktif
Not Produc-tive
Crops
Jumlah
Total Areas
(1) (2) (3) (4) (5)
1. Kelapa Dalam/Coconut 1395 1395 445 3235
2. Kopi/Coffee 415 10 42 467
3. Kapuk/Kapok 0 0 0 0
4. Lada/Pepper 117 15 0 132
5. Pala/Nutmeg 78 10 15 103
6. Cengkeh/Clove 721 409 15 1145
7. Jambu Mete/Cashew nut 3737 431 554 4722
8. Kemiri/Candlenut 120 30 10 160
9. Coklat/Cocoa 3617 577 262 4456
10. Enau/Aren/Sugar Palm 2 0 0 2
11. Kapas Rakyat/Cotton plant 0 0 0 0
12. Kelapa Hybrida/Hybrid coconut 0 0 0 0
13. Tembakau/Tobacco 0 0 0 0
14. Asam Jawa/Java tamarind 0 0 0 0
15. Pinang/Areca-nut 14 1 1 16
16. Panili/Vanilla 15 0 0 15
17. Sagu/Sago Palm 245 105 3 353
18. Tebu/Sugar-cane 0 0 0 0
19. Jahe/Ginger 0 0 0 0
20. Kelapa Sawit 0 0 0 0
21. Nilam 0 0 0 0
Sumber/Source: Dinas Perkebunan dan Hortikultura Prov. Sultra/Estate and Horticulture Service of Sulawesi Tenggara Province
5.5.25
Luas Areal Tanaman Perkebunan Menurut Jenis Tanaman di Kabupaten Konawe Utara (Ha), 2012*) Tabel
Table Planted Area of Estate Crops by Type of Crops in Konawe Utara District (Ha), 2012*)

217
AGRICULTURE
Sulawesi Tenggara in Figures 2013
Jenis Tanaman
Type of Crops
Produktif
Productive Crops
Belum Produktif Not Yet
Prod. Crops
Tidak Produktif
Not Produc-tive
Crops
Jumlah
Total Areas
(1) (2) (3) (4) (5)
1. Kelapa Dalam/Coconut 458 210 60 728
2. Kopi/Coffee 129 26 41 196
3. Kapuk/Kapok 27 7 11 45
4. Lada/Pepper 161 110 44 315
5. Pala/Nutmeg 0 66 0 66
6. Cengkeh/Clove 23 104 15 142
7. Jambu Mete/Cashew nut 901 89 306 1296
8. Kemiri/Candlenut 62 17 23 102
9. Coklat/Cocoa 467 149 129 745
10. Enau/Aren/Sugar Palm 16 6 0 22
11. Kapas Rakyat/Cotton plant 0 0 0 0
12. Kelapa Hybrida/Hybrid coconut 43 6 7 56
13. Tembakau/Tobacco 0 0 0 0
14. Asam Jawa/Java tamarind 15 9 2 26
15. Pinang/Areca-nut 28 8 6 42
16. Panili/Vanilla 13 18 12 43
17. Sagu/Sago Palm 113 42 13 168
18. Tebu/Sugar-cane 0 0 0 0
19. Jahe/Ginger 0 0 0 0
20. Kelapa Sawit 0 0 0 0
21. Nilam 0 0 0 0
Sumber/Source: Dinas Perkebunan dan Hortikultura Prov. Sultra/Estate and Horticulture Service of Sulawesi Tenggara Province
5.5.26
Luas Areal Tanaman Perkebunan Menurut Jenis Tanaman di Kota Kendari (Ha) , 2012 Tabel
Table Planted Area of Estate Crops by Type of Crops in Kendari City (Ha) , 2012*)
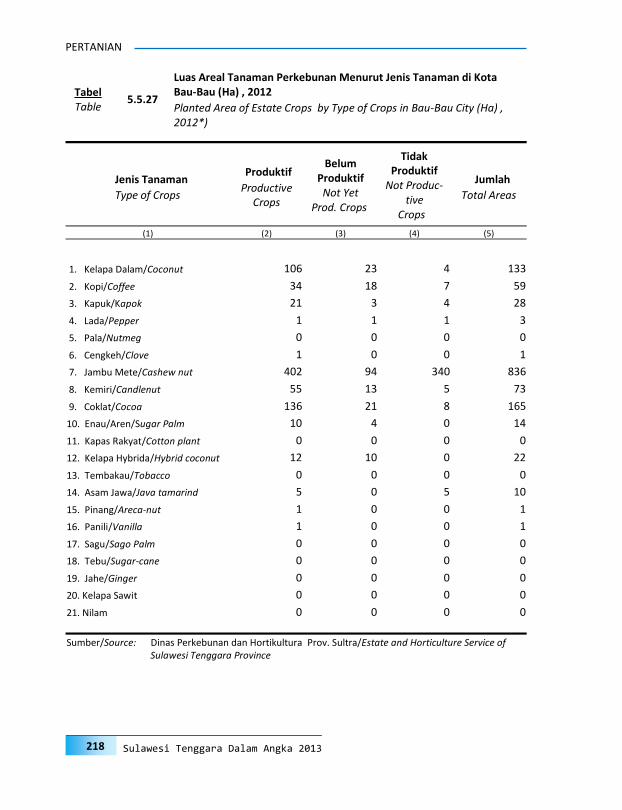
218
PERTANIAN
Sulawesi Tenggara Dalam Angka 2013
Jenis Tanaman
Type of Crops
Produktif
Productive Crops
Belum Produktif Not Yet
Prod. Crops
Tidak Produktif
Not Produc-tive
Crops
Jumlah
Total Areas
(1) (2) (3) (4) (5)
1. Kelapa Dalam/Coconut 106 23 4 133
2. Kopi/Coffee 34 18 7 59
3. Kapuk/Kapok 21 3 4 28
4. Lada/Pepper 1 1 1 3
5. Pala/Nutmeg 0 0 0 0
6. Cengkeh/Clove 1 0 0 1
7. Jambu Mete/Cashew nut 402 94 340 836
8. Kemiri/Candlenut 55 13 5 73
9. Coklat/Cocoa 136 21 8 165
10. Enau/Aren/Sugar Palm 10 4 0 14
11. Kapas Rakyat/Cotton plant 0 0 0 0
12. Kelapa Hybrida/Hybrid coconut 12 10 0 22
13. Tembakau/Tobacco 0 0 0 0
14. Asam Jawa/Java tamarind 5 0 5 10
15. Pinang/Areca-nut 1 0 0 1
16. Panili/Vanilla 1 0 0 1
17. Sagu/Sago Palm 0 0 0 0
18. Tebu/Sugar-cane 0 0 0 0
19. Jahe/Ginger 0 0 0 0
20. Kelapa Sawit 0 0 0 0
21. Nilam 0 0 0 0
Sumber/Source: Dinas Perkebunan dan Hortikultura Prov. Sultra/Estate and Horticulture Service of Sulawesi Tenggara Province
5.5.27
Luas Areal Tanaman Perkebunan Menurut Jenis Tanaman di Kota Bau-Bau (Ha) , 2012 Tabel
Table Planted Area of Estate Crops by Type of Crops in Bau-Bau City (Ha) , 2012*)

219
AGRICULTURE
Sulawesi Tenggara in Figures 2013
Kabupaten/Kota S a p i K e r b a u K u d a J u m l a h
District/City C o w Buffalo H o r s e T o t a l
(1) (2) (3) (4) (5)
1. B u t o n 11 736 0 0 11 736
2. M u n a 53 203 88 137 53 428
3. K o n a w e 33 113 559 2 33 674
4. K o l a k a 23 177 556 454 24 187
5. Konawe Selatan 56 803 266 19 57 088
6. Bombana 44 249 915 483 45 647
7. Wakatobi 930 0 0 930
8. Kolaka Utara 1 570 36 695 2 301
9. Buton Utara 3 282 0 0 3 282
10. Konawe Utara 4 934 231 0 5 165
11. Kota Kendari 1 972 18 0 1 990
12. Kota Bau-Bau 1 542 0 0 1 542
Prov. Sulawesi Tenggara
Sulawesi Tenggara Prov.
2 0 1 2 236 511 2 669 1 790 240 970
2 0 1 1 239 683 2 610 3 570 245 863
2 0 1 0 268 138 5 294 3 465 276 897
2 0 0 9 253 171 7 031 3 695 263 897
2 0 0 8 237 360 7 078 4 038 248 476
2 0 0 7 227 265 6 951 4 118 238 334
2 0 0 6 222 350 7 614 4 670 234 634
Sumber/Source: Dinas Pertanian Prov. Sultra/Agriculture Service of Sulawesi Tenggara Province
5.6.1 Populasi Ternak Besar Menurut Kabupaten/Kota (Ekor) , 2012 Tabel
Table Population of Large Livestock by District/City (Heads), 2012
5.6 Peternakan
Livestock

220
PERTANIAN
Sulawesi Tenggara Dalam Angka 2013
Kabupaten/Kota Kambing Domba B a b i J u m l a h
District/City Goat Sheep P i g T o t a l
(1) (2) (3) (4) (5)
1. B u t o n 20 845 0 508 21 353
2. M u n a 12 876 0 1 277 14 153
3. K o n a w e 20 294 0 15 490 35 784
4. K o l a k a 39 606 0 11 862 51 468
5. Konawe Selatan 7 974 0 7 759 15 733
6. Bombana 15 014 73 1 758 16 845
7. Wakatobi 6 913 0 0 6 913
8. Kolaka Utara 3 220 0 0 3 220
9. Buton Utara 448 0 0 448
10. Konawe Utara 7 320 0 16 7 336
11. Kota Kendari 3 460 0 67 3 527
12. Kota Bau-Bau 2 004 0 2 640 4 644
Prov. Sulawesi Tenggara
Sulawesi Tenggara Prov.
2 0 1 2 139 974 73 41 377 181 424
2 0 1 1 124 460 165 35 871 160 496
2 0 1 0 117 819 161 34 617 152 597
2 0 0 9 114 177 177 32 507 146 861
2 0 0 8 110 629 197 30 022 140 848
2 0 0 7 105 219 353 27 621 133 193
2 0 0 6 99 938 306 29 237 129 481
Sumber/Source: Dinas Pertanian Prov. Sultra/Agriculture Service of Sulawesi Tenggara Province
5.6.2 Populasi Ternak Kecil Menurut Kabupaten/Kota (Ekor) , 2012 Tabel
Table Population of Small Livestock by District/City (Heads) , 2012
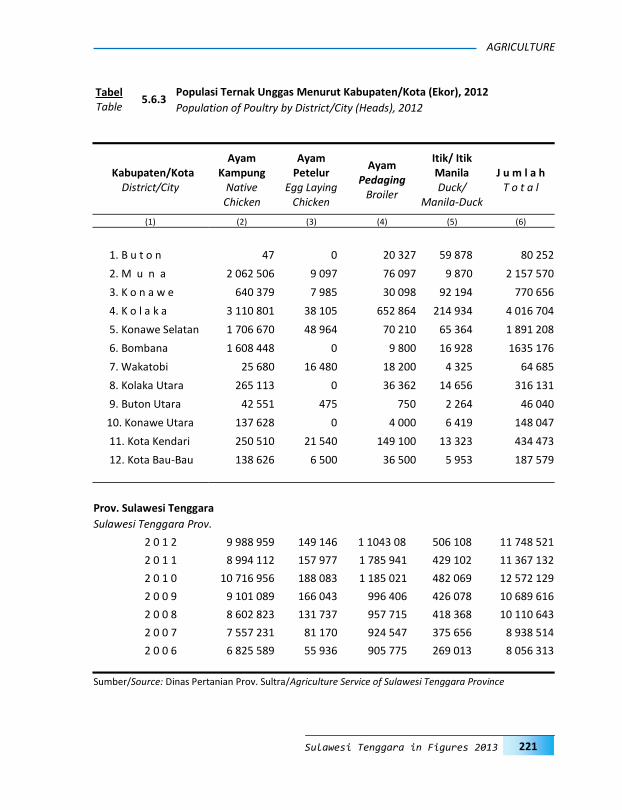
221
AGRICULTURE
Sulawesi Tenggara in Figures 2013
Kabupaten/Kota District/City
Ayam Kampung
Native Chicken
Ayam Petelur
Egg Laying Chicken
Ayam Pedaging
Broiler
Itik/ Itik Manila Duck/
Manila-Duck
J u m l a h T o t a l
(1) (2) (3) (4) (5) (6)
1. B u t o n 47 0 20 327 59 878 80 252
2. M u n a 2 062 506 9 097 76 097 9 870 2 157 570
3. K o n a w e 640 379 7 985 30 098 92 194 770 656
4. K o l a k a 3 110 801 38 105 652 864 214 934 4 016 704
5. Konawe Selatan 1 706 670 48 964 70 210 65 364 1 891 208
6. Bombana 1 608 448 0 9 800 16 928 1635 176
7. Wakatobi 25 680 16 480 18 200 4 325 64 685
8. Kolaka Utara 265 113 0 36 362 14 656 316 131
9. Buton Utara 42 551 475 750 2 264 46 040
10. Konawe Utara 137 628 0 4 000 6 419 148 047
11. Kota Kendari 250 510 21 540 149 100 13 323 434 473
12. Kota Bau-Bau 138 626 6 500 36 500 5 953 187 579
Prov. Sulawesi Tenggara
Sulawesi Tenggara Prov.
2 0 1 2 9 988 959 149 146 1 1043 08 506 108 11 748 521
2 0 1 1 8 994 112 157 977 1 785 941 429 102 11 367 132
2 0 1 0 10 716 956 188 083 1 185 021 482 069 12 572 129
2 0 0 9 9 101 089 166 043 996 406 426 078 10 689 616
2 0 0 8 8 602 823 131 737 957 715 418 368 10 110 643
2 0 0 7 7 557 231 81 170 924 547 375 656 8 938 514
2 0 0 6 6 825 589 55 936 905 775 269 013 8 056 313
Sumber/Source: Dinas Pertanian Prov. Sultra/Agriculture Service of Sulawesi Tenggara Province
5.6.3 Populasi Ternak Unggas Menurut Kabupaten/Kota (Ekor), 2012 Tabel
Table Population of Poultry by District/City (Heads), 2012

222
PERTANIAN
Sulawesi Tenggara Dalam Angka 2013
Kabupaten/Kota S a p i K e r b a u K u d a J u m l a h
District/City C o w Buffalo H o r s e T o t a l
(1) (2) (3) (4) (5)
1. B u t o n 378 0 0 378
2. M u n a 3 137 7 3 3 147
3. K o n a w e 1 772 7 0 1 779
4. K o l a k a 2 869 12 20 2 901
5. Konawe Selatan 3 672 5 0 3 677
6. Bombana 1 088 6 4 1 098
7. Wakatobi 46 0 0 46
8. Kolaka Utara 279 3 17 299
9. Buton Utara 289 0 0 289
10. Konawe Utara 669 3 0 672
11. Kota Kendari 5 703 8 0 5 711
12. Kota Bau-Bau 1 336 0 0 1 336
Sulawesi Tenggara
2 0 1 2 21 238 51 44 21 333
2 0 1 1 16 422 138 84 16 644
2 0 1 0 21 960 359 69 22 388
2 0 0 9 20 760 478 59 21 297
2 0 0 8 19 833 219 55 20 107
2 0 0 7 18 665 225 29 18 556
2 0 0 6 18 349 194 13 18 556
Sumber/Source: Dinas Pertanian Prov. Sultra/Agriculture Service of Sulawesi Tenggara Province
5.6.4
Banyaknya Ternak Besar yang Dipotong Menurut Kabupaten/Kota (Ekor), 2012 Tabel
Table Number of Large Livestock Slaughtered by District/City (Heads), 2012
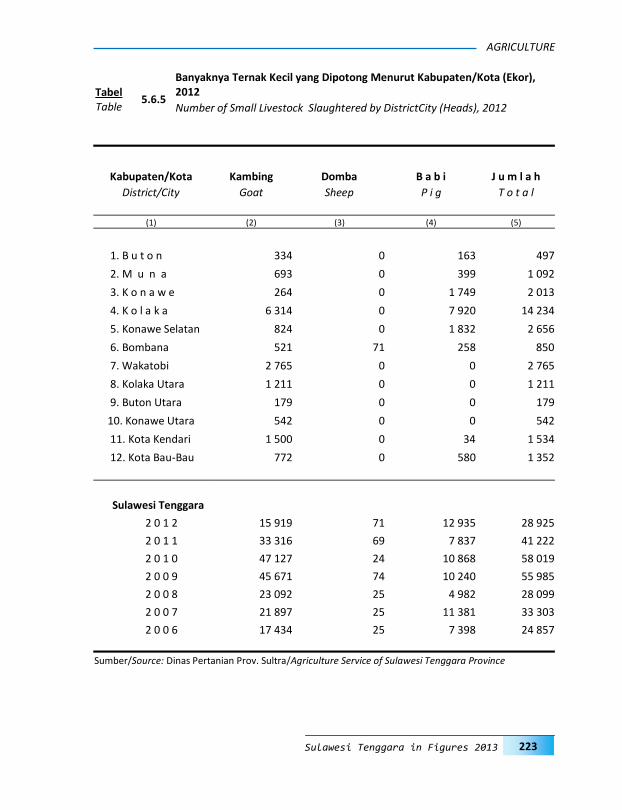
223
AGRICULTURE
Sulawesi Tenggara in Figures 2013
Kabupaten/Kota Kambing Domba B a b i J u m l a h
District/City Goat Sheep P i g T o t a l
(1) (2) (3) (4) (5)
1. B u t o n 334 0 163 497
2. M u n a 693 0 399 1 092
3. K o n a w e 264 0 1 749 2 013
4. K o l a k a 6 314 0 7 920 14 234
5. Konawe Selatan 824 0 1 832 2 656
6. Bombana 521 71 258 850
7. Wakatobi 2 765 0 0 2 765
8. Kolaka Utara 1 211 0 0 1 211
9. Buton Utara 179 0 0 179
10. Konawe Utara 542 0 0 542
11. Kota Kendari 1 500 0 34 1 534
12. Kota Bau-Bau 772 0 580 1 352
Sulawesi Tenggara
2 0 1 2 15 919 71 12 935 28 925
2 0 1 1 33 316 69 7 837 41 222
2 0 1 0 47 127 24 10 868 58 019
2 0 0 9 45 671 74 10 240 55 985
2 0 0 8 23 092 25 4 982 28 099
2 0 0 7 21 897 25 11 381 33 303
2 0 0 6 17 434 25 7 398 24 857
Sumber/Source: Dinas Pertanian Prov. Sultra/Agriculture Service of Sulawesi Tenggara Province
5.6.5
Banyaknya Ternak Kecil yang Dipotong Menurut Kabupaten/Kota (Ekor), 2012 Tabel
Table Number of Small Livestock Slaughtered by DistrictCity (Heads), 2012
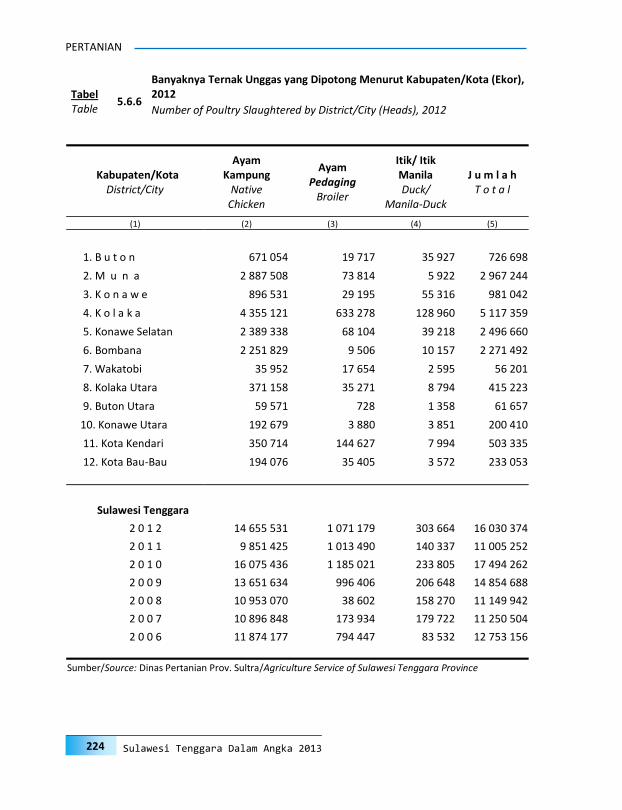
224
PERTANIAN
Sulawesi Tenggara Dalam Angka 2013
Kabupaten/Kota District/City
Ayam Kampung
Native Chicken
Ayam Pedaging
Broiler
Itik/ Itik Manila Duck/
Manila-Duck
J u m l a h T o t a l
(1) (2) (3) (4) (5)
1. B u t o n 671 054 19 717 35 927 726 698
2. M u n a 2 887 508 73 814 5 922 2 967 244
3. K o n a w e 896 531 29 195 55 316 981 042
4. K o l a k a 4 355 121 633 278 128 960 5 117 359
5. Konawe Selatan 2 389 338 68 104 39 218 2 496 660
6. Bombana 2 251 829 9 506 10 157 2 271 492
7. Wakatobi 35 952 17 654 2 595 56 201
8. Kolaka Utara 371 158 35 271 8 794 415 223
9. Buton Utara 59 571 728 1 358 61 657
10. Konawe Utara 192 679 3 880 3 851 200 410
11. Kota Kendari 350 714 144 627 7 994 503 335
12. Kota Bau-Bau 194 076 35 405 3 572 233 053
Sulawesi Tenggara
2 0 1 2 14 655 531 1 071 179 303 664 16 030 374
2 0 1 1 9 851 425 1 013 490 140 337 11 005 252
2 0 1 0 16 075 436 1 185 021 233 805 17 494 262
2 0 0 9 13 651 634 996 406 206 648 14 854 688
2 0 0 8 10 953 070 38 602 158 270 11 149 942
2 0 0 7 10 896 848 173 934 179 722 11 250 504
2 0 0 6 11 874 177 794 447 83 532 12 753 156
Sumber/Source: Dinas Pertanian Prov. Sultra/Agriculture Service of Sulawesi Tenggara Province
5.6.6
Banyaknya Ternak Unggas yang Dipotong Menurut Kabupaten/Kota (Ekor), 2012 Tabel
Table Number of Poultry Slaughtered by District/City (Heads), 2012
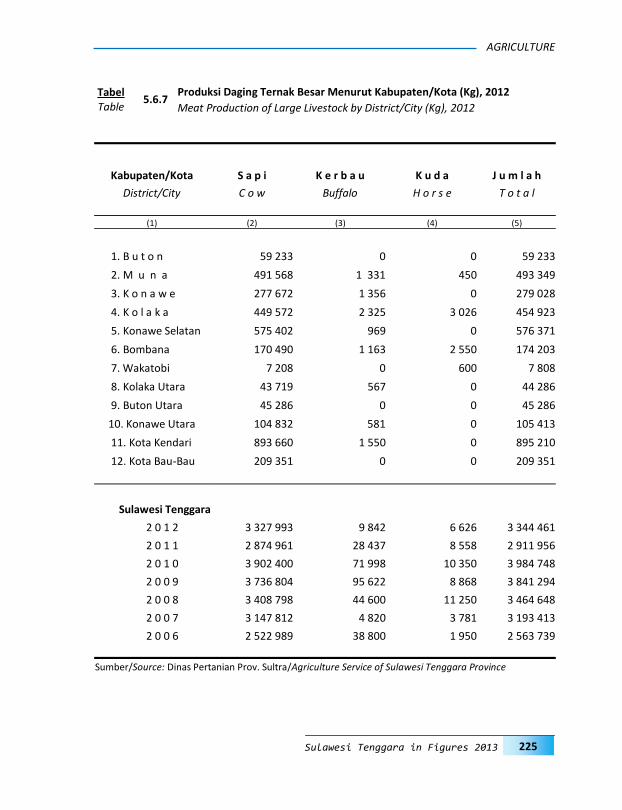
225
AGRICULTURE
Sulawesi Tenggara in Figures 2013
Kabupaten/Kota S a p i K e r b a u K u d a J u m l a h
District/City C o w Buffalo H o r s e T o t a l
(1) (2) (3) (4) (5)
1. B u t o n 59 233 0 0 59 233
2. M u n a 491 568 1 331 450 493 349
3. K o n a w e 277 672 1 356 0 279 028
4. K o l a k a 449 572 2 325 3 026 454 923
5. Konawe Selatan 575 402 969 0 576 371
6. Bombana 170 490 1 163 2 550 174 203
7. Wakatobi 7 208 0 600 7 808
8. Kolaka Utara 43 719 567 0 44 286
9. Buton Utara 45 286 0 0 45 286
10. Konawe Utara 104 832 581 0 105 413
11. Kota Kendari 893 660 1 550 0 895 210
12. Kota Bau-Bau 209 351 0 0 209 351
Sulawesi Tenggara
2 0 1 2 3 327 993 9 842 6 626 3 344 461
2 0 1 1 2 874 961 28 437 8 558 2 911 956
2 0 1 0 3 902 400 71 998 10 350 3 984 748
2 0 0 9 3 736 804 95 622 8 868 3 841 294
2 0 0 8 3 408 798 44 600 11 250 3 464 648
2 0 0 7 3 147 812 4 820 3 781 3 193 413
2 0 0 6 2 522 989 38 800 1 950 2 563 739
Sumber/Source: Dinas Pertanian Prov. Sultra/Agriculture Service of Sulawesi Tenggara Province
5.6.7 Produksi Daging Ternak Besar Menurut Kabupaten/Kota (Kg), 2012 Tabel
Table Meat Production of Large Livestock by District/City (Kg), 2012

226
PERTANIAN
Sulawesi Tenggara Dalam Angka 2013
Kabupaten/Kota Kambing Domba B a b i J u m l a h
District/City Goat Sheep P i g T o t a l
(1) (2) (3) (4) (5)
1. B u t o n 4 225 0 9 338 13 563
2. M u n a 8 766 0 22 912 31 678
3. K o n a w e 3 340 0 100 485 103 825
4. K o l a k a 79 872 0 455 028 534 900
5. Konawe Selatan 10 424 0 105 254 115 678
6. Bombana 6 591 906 14 823 22 320
7. Wakatobi 34 980 0 0 34 980
8. Kolaka Utara 15 319 0 0 15 319
9. Buton Utara 2 262 0 0 2 262
10. Konawe Utara 6 856 0 0 6 856
11. Kota Kendari 18 975 0 1 953 20 928
12. Kota Bau-Bau 9 766 0 33 323 43 089
Sulawesi Tenggara
2 0 1 2 201 376 906 743 116 945 398
2 0 1 1 514 744 832 376 756 892 332
2 0 1 0 565 534 288 543 400 1 109 222
2 0 0 9 548 050 892 511 985 1 060 927
2 0 0 8 295 247 313 543 950 839 510
2 0 0 7 273 559 210 625 268 899 037
2 0 0 6 217 925 313 301 876 520 114
Sumber/Source: Dinas Pertanian Prov. Sultra/Agriculture Service of Sulawesi Tenggara Province
5.6.8 Produksi Daging Ternak Kecil Menurut Kabupaten/Kota (Kg) , 2012 Tabel
Table Meat Production of Small Livestock by District/City (Kg) , 2012
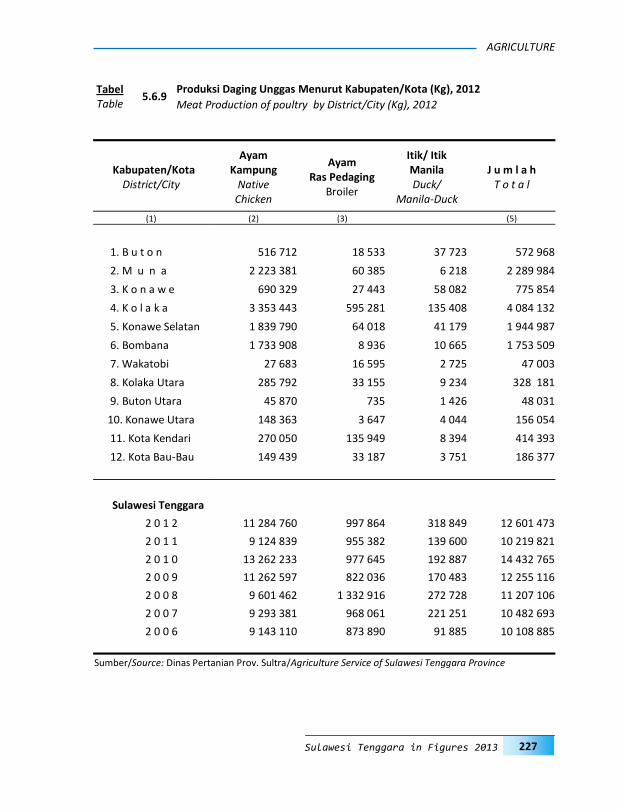
227
AGRICULTURE
Sulawesi Tenggara in Figures 2013
Kabupaten/Kota District/City
Ayam Kampung
Native Chicken
Ayam Ras Pedaging
Broiler
Itik/ Itik Manila Duck/
Manila-Duck
J u m l a h T o t a l
(1) (2) (3) (5)
1. B u t o n 516 712 18 533 37 723 572 968
2. M u n a 2 223 381 60 385 6 218 2 289 984
3. K o n a w e 690 329 27 443 58 082 775 854
4. K o l a k a 3 353 443 595 281 135 408 4 084 132
5. Konawe Selatan 1 839 790 64 018 41 179 1 944 987
6. Bombana 1 733 908 8 936 10 665 1 753 509
7. Wakatobi 27 683 16 595 2 725 47 003
8. Kolaka Utara 285 792 33 155 9 234 328 181
9. Buton Utara 45 870 735 1 426 48 031
10. Konawe Utara 148 363 3 647 4 044 156 054
11. Kota Kendari 270 050 135 949 8 394 414 393
12. Kota Bau-Bau 149 439 33 187 3 751 186 377
Sulawesi Tenggara
2 0 1 2 11 284 760 997 864 318 849 12 601 473
2 0 1 1 9 124 839 955 382 139 600 10 219 821
2 0 1 0 13 262 233 977 645 192 887 14 432 765
2 0 0 9 11 262 597 822 036 170 483 12 255 116
2 0 0 8 9 601 462 1 332 916 272 728 11 207 106
2 0 0 7 9 293 381 968 061 221 251 10 482 693
2 0 0 6 9 143 110 873 890 91 885 10 108 885
Sumber/Source: Dinas Pertanian Prov. Sultra/Agriculture Service of Sulawesi Tenggara Province
5.6.9 Produksi Daging Unggas Menurut Kabupaten/Kota (Kg), 2012 Tabel
Table Meat Production of poultry by District/City (Kg), 2012
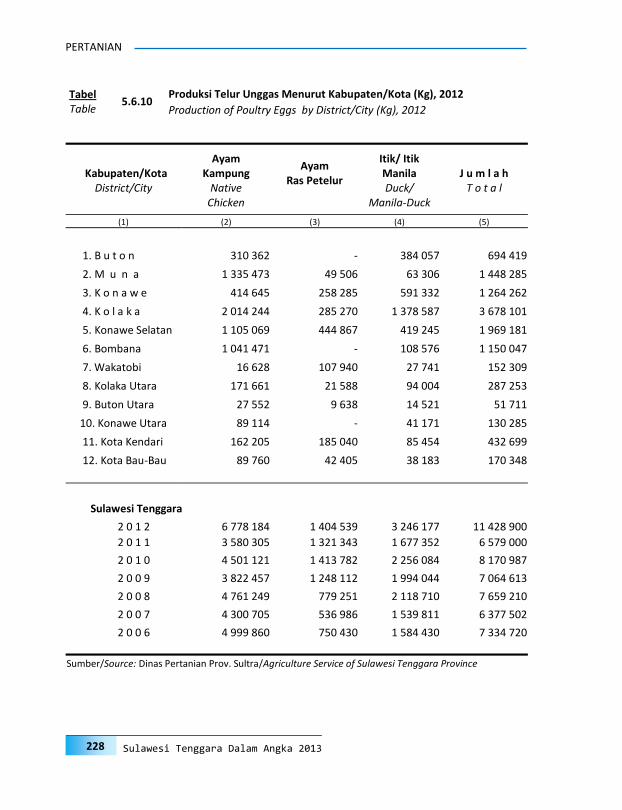
228
PERTANIAN
Sulawesi Tenggara Dalam Angka 2013
Kabupaten/Kota District/City
Ayam Kampung
Native Chicken
Ayam Ras Petelur
Itik/ Itik Manila Duck/
Manila-Duck
J u m l a h T o t a l
(1) (2) (3) (4) (5)
1. B u t o n 310 362 - 384 057 694 419
2. M u n a 1 335 473 49 506 63 306 1 448 285
3. K o n a w e 414 645 258 285 591 332 1 264 262
4. K o l a k a 2 014 244 285 270 1 378 587 3 678 101
5. Konawe Selatan 1 105 069 444 867 419 245 1 969 181
6. Bombana 1 041 471 - 108 576 1 150 047
7. Wakatobi 16 628 107 940 27 741 152 309
8. Kolaka Utara 171 661 21 588 94 004 287 253
9. Buton Utara 27 552 9 638 14 521 51 711
10. Konawe Utara 89 114 - 41 171 130 285
11. Kota Kendari 162 205 185 040 85 454 432 699
12. Kota Bau-Bau 89 760 42 405 38 183 170 348
Sulawesi Tenggara
2 0 1 2 6 778 184 1 404 539 3 246 177 11 428 900
2 0 1 1 3 580 305 1 321 343 1 677 352 6 579 000
2 0 1 0 4 501 121 1 413 782 2 256 084 8 170 987
2 0 0 9 3 822 457 1 248 112 1 994 044 7 064 613
2 0 0 8 4 761 249 779 251 2 118 710 7 659 210
2 0 0 7 4 300 705 536 986 1 539 811 6 377 502
2 0 0 6 4 999 860 750 430 1 584 430 7 334 720
Sumber/Source: Dinas Pertanian Prov. Sultra/Agriculture Service of Sulawesi Tenggara Province
5.6.10 Produksi Telur Unggas Menurut Kabupaten/Kota (Kg), 2012 Tabel
Table Production of Poultry Eggs by District/City (Kg), 2012

229
AGRICULTURE
Sulawesi Tenggara in Figures 2013
Jenis Ternak - Types of Livestock
Kabupaten/Kota Kuda Sapi Kambing Ayam Ras Itik/
District/City Horse Cow Goat Broiler Itik Manila
Duck/ Manila-
Duck
(1) (2) (3) (4) (5) (6)
1. B u t o n 0 15 0 0 0
2. M u n a 0 50 0 0 0
4. K o l a k a 0 40 0 0 0
5. Konawe Selatan 0 40 0 0 0
6. Bombana 0 40 0 0 0
7. Wakatobi 0 0 0 0 0
8. Kolaka Utara 0 15 0 0 0
9. Buton Utara 0 0 0 0 0
10. Konawe Utara 0 30 0 0 0
11. Kota Kendari 0 10 0 156 200 13 100
12. Kota Bau-Bau 0 10 0 0 0
Jumlah/Total
2 0 1 2 0 290 0 156 200 13 100
2 0 1 1 30 1 840 401 63 880 1 661
2 0 1 0 5 4 681 1 894 253 049 4 946
2 0 0 9 67 8 079 3 639 1 646 010 22 291
2 0 0 8 0 0 0 1 089 452 0
2 0 0 7 -- -- -- 947 500 0
2 0 0 6 -- -- -- 947 300 0
Sumber/Source: Dinas Pertanian Prov. Sultra/Agriculture Service of Sulawesi Tenggara Province
5.6.11 Jumlah Ternak Masuk Menurut Jenisnya, dan Kabupaten Kota (Ekor), 2012 Tabel
Table Number of Incoming Livestock by Kind and District/City (Heads), 2012

230
PERTANIAN
Sulawesi Tenggara Dalam Angka 2013
Jenis Ternak - Types of Livestock
Kabupaten/Kota Kuda Sapi Kambing Ayam Ras Itik/
District/City Horse Cow Goat Broiler Itik Manila
Duck/ Manila-
Duck (1) (2) (3) (4) (5) (6)
1. B u t o n - - - - -
2. M u n a - - - - -
4. K o l a k a - - - - -
5. Konawe Selatan - - - - -
6. Bombana 220 5 - - -
7. Wakatobi - 7 - - -
8. Kolaka Utara - - - - -
9. Buton Utara - - - - -
10. Konawe Utara - - - - -
11. Kota Kendari - - - - -
12. Kota Bau-Bau - - - - -
Sulawesi Tenggara
2 0 1 2 220 12 - - -
2 0 1 1 4 255 93 3 066 2 243 374 983
2 0 1 0 6 207 130 4 132 3 051 99 966
2 0 0 9 7 912 75 3 645 2 833 386 907
2 0 0 8 2 425 25 - - -
2 0 0 7 2 860 30 - - -
2 0 0 6 2 782 35 -- -- --
Sumber/Source: Dinas Pertanian Prov. Sultra/Agriculture Service of Sulawesi Tenggara Province
5.6.12 Jumlah Ternak Keluar Menurut Jenisnya dan Kabupaten/Kota (Ekor), 2012 Tabel
Table Number of outgoing Livestock by Kind and District/City (Heads), 2012
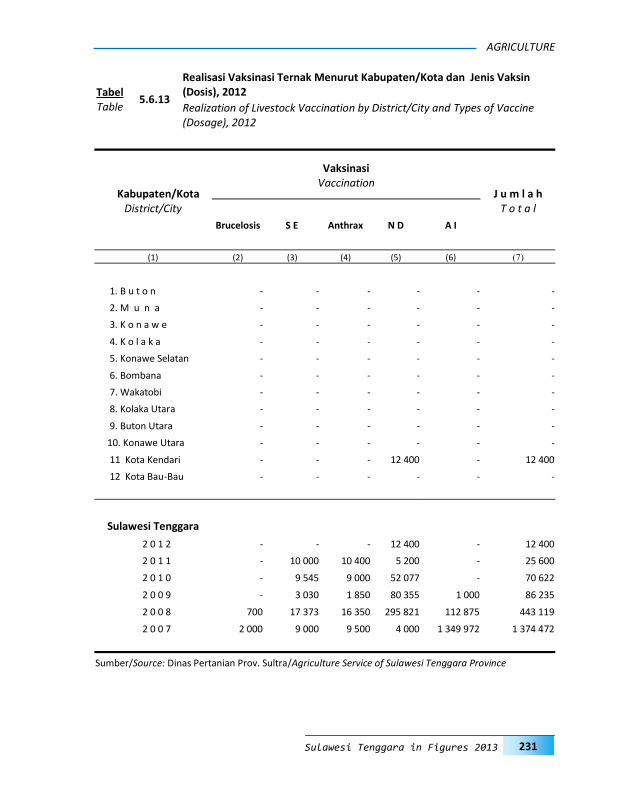
231
AGRICULTURE
Sulawesi Tenggara in Figures 2013
Kabupaten/Kota District/City
Vaksinasi Vaccination
J u m l a h T o t a l
Brucelosis S E Anthrax N D A I
(1) (2) (3) (4) (5) (6) (7)
1. B u t o n - - - - - -
2. M u n a - - - - - -
3. K o n a w e - - - - - -
4. K o l a k a - - - - - -
5. Konawe Selatan - - - - - -
6. Bombana - - - - - -
7. Wakatobi - - - - - -
8. Kolaka Utara - - - - - -
9. Buton Utara - - - - - -
10. Konawe Utara - - - - - -
11 Kota Kendari - - - 12 400 - 12 400
12 Kota Bau-Bau - - - - - -
Sulawesi Tenggara
2 0 1 2 - - - 12 400 - 12 400
2 0 1 1 - 10 000 10 400 5 200 - 25 600
2 0 1 0 - 9 545 9 000 52 077 - 70 622
2 0 0 9 - 3 030 1 850 80 355 1 000 86 235
2 0 0 8 700 17 373 16 350 295 821 112 875 443 119
2 0 0 7 2 000 9 000 9 500 4 000 1 349 972 1 374 472
Sumber/Source: Dinas Pertanian Prov. Sultra/Agriculture Service of Sulawesi Tenggara Province
5.6.13
Realisasi Vaksinasi Ternak Menurut Kabupaten/Kota dan Jenis Vaksin (Dosis), 2012 Tabel
Table Realization of Livestock Vaccination by District/City and Types of Vaccine (Dosage), 2012

232
PERTANIAN
Sulawesi Tenggara Dalam Angka 2013
Kabupaten/Kota District/City
Perikanan Laut Perikanan Darat J u m l a h
Marine fishery Inland fishery T o t a l
Produksi Nilai Produksi Nilai Produksi Nilai
Production Value Production Value Production Value
(Ton) (000 Rp) (Ton) (000 Rp) (Ton) (000 Rp)
(1) (2) (3) (4) (5) (6) (7)
1 B u t o n 34.129,90 2 192 347 557 0 0 34 129,90 2 192 347 557
2 M u n a 30.972,05 164 926 908 2 935,29 42 619 647 33 907,34 207 546 555
3 K o n a w e 11.360,17 49 112 639 1467 31 963 110 12 827,17 81 075 749
4 K o l a k a 168 509,23 364 432 272 29 347,68 562 604 288 197 856,91 927 036 560
5 Konawe Selatan 299 716,40 363 416 420 4 580,78 70 843 594 304 297,18 434 260 014
6 Bombana 48 755,06 152 924 547 12 901,98 101 170 801 61 657,04 254 095 348
7 Wakatobi 6 825,80 36 094 775 0 0 6 825,80 36 094 775
8 Kolaka Utara 32 893,70 456 242 224 12 575,66 109 164 290 45 469,36 565 406 514
9 Buton Utara 14 715,23 85 658 689 0 0 14 715,23 85 658 689
10 Konawe Utara 19 679,00 82 740 181 5 095,42 38 257 650 24 774,42 120 997 831
11 Kota Kendari 36 116,82 132 802 975 16,61 514 800 36 133,43 133 317 775
12 Kota Bau-Bau 118,59 195 143 202 59,39 1 500 180 15 071,68 196 643 382
Sulawesi Tenggara 2 0 1 2 718 685,65 4 275 842 389 68 979,81 958 638 360 787 665,46 5 234 480 749
2 0 1 1 221 471,20 2 237 604 650 24 625,50 445 596 606 246 096,70 2 683 201 256
2 0 1 0 218 338,10 2 228 778 439 56 494,50 922 110 829 270 905,80 862 990 782
2 0 0 9 217 512,90 2 386 423 593 1 000 911,53 190 110 854 1 218 424,43 2 576 534 447
2 0 0 8 7 053,30 78 573 793 26 034,00 127 103 021 33 087,30 205 676 814
2 0 0 7 204 194,80 2 184 405 263 10 407,10 263 017 566 214 601,90 2 447 422 829
Sumber/Source: Dinas Perikanan Prov. Sultra/Fishery Service of Sulawesi Tenggara Province
5.7.1
Produksi dan Nilai Hasil Perikanan Laut dan Darat Menurut Kabupaten/Kota, 2012 Tabel
Table Production and Value of Marine and Inland Fisheries Products by District/City, 2012
5.7 Perikanan
Fishery

233
AGRICULTURE
Sulawesi Tenggara in Figures 2013
Perairan Umum T a m b a k
Kabupaten/Kota Inland Open Water Brackish Water Pond
District/City Produksi Nilai Produksi Nilai
Production Value Production Value
(Ton) (000 Rp) (Ton) (000 Rp)
(1) (2) (3) (4) (5)
1. B u t o n 0,00 0 0,00 0
2. M u n a 0,00 0 2 920,15 42 347 453
3. K o n a w e 44,00 620 390 783,28 18 548 400
4. K o l a k a 57,30 1 453 000 25 791,02 524 503 907
5. Konawe Selatan 0,00 0 3592,30 48 096 374
6. Bombana 0,00 0 12 901,98 101 170 801
7. Wakatobi 0,00 0 0,00 0
8. Kolaka Utara 8 431,20 66 876 400 3 927,70 39 516 069
9. Buton Utara 0,00 0 0,00 0
10. Konawe Utara 4 815,30 27 364 400 252,67 10 528 500
11. Kota Kendari 0,00 0 13,00 464 975
12. Kota Bau-Bau 0,00 0 52,50 1 417 500
Sulawesi Tenggara
2 0 1 2 13 347,80 96 314 190 50 234,60 786 593 979
2 0 1 1 5 837,90 41 736 134 16 992,11 380 167 363
2 0 1 0 5 825,90 41 707 43 545,46 824 304 467
2 0 0 9 5 784,00 40 308 180 16 174,30 256 729 380
2 0 0 8 34,10 417 762 25 196,50 114 050 309
2 0 0 7 4 841,30 30 811 371 9 455,20 248 565 298
Sumber/Source: Dinas Perikanan Prov. Sultra/Fishery Service of Sulawesi Tenggara Province
5.7.2 Produksi dan Nilai Hasil Perikanan Darat Menurut Kabupaten/Kota, 2012 Tabel
Table Production and Value of Inland Fisheries Product Value by District/City, 2012

234
PERTANIAN
Sulawesi Tenggara Dalam Angka 2013
K o l a m J u m l a h
Kabupaten/Kota Freshwater Pond T o t a l
District/City Produksi Nilai Produksi Nilai
Production Values Production Values
(Ton) (000 Rp) (Ton) (000 Rp)
(1) (6) (7) (8) (9)
1. B u t o n 0,00 0 0,00 0
2. M u n a 15,14 272 194 2935,29 42 619 647
3. K o n a w e 639,72 12 794 320 1467,00 31 963 110
4. K o l a k a 3 499,36 36 647 381 29347,68 562 604 288
5. Konawe Selatan 988,48 22 747 220 4580,78 70 843 594
6. Bombana 0,00 0 12901,98 101 170 801
7. Wakatobi 0,00 0 0,00 0
8. Kolaka Utara 216,76 2 771 821 12575,66 109 164 290
9. Buton Utara 0,00 0 0,00 0
10. Konawe Utara 27,45 364 750 5095,42 38 257 650
11. Kota Kendari 3,61 49 825 16,61 514 800
12. Kota Bau-Bau 6,89 82 680 59,39 1 500 180
Sulawesi Tenggara
2 0 1 2 5 397,41 75 730 191 68 979,81 958 638 360
2 0 1 1 1 795,49 23 693 109 1 795,49 23 693 109
2 0 1 0 3 196,34 36 415 830 3 196,34 36 415 830
2 0 0 9 646,39 8 815 160 646,39 8 815 160
2 0 0 8 803,40 12 634 950 26 034,00 127 103 021
2 0 0 7 951,90 14 452 268 15 248,40 293 828 937
Sumber/Source: Dinas Perikanan Prov. Sultra/Fishery Service of Sulawesi Tenggara Province
Lanjutan Tabel Continuation Table
5.7.2
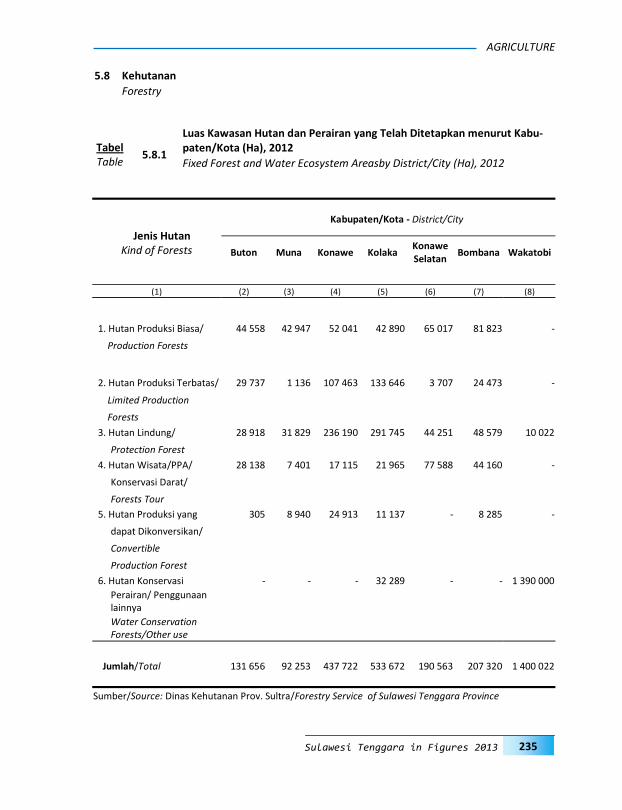
235
AGRICULTURE
Sulawesi Tenggara in Figures 2013
Jenis Hutan Kind of Forests
Kabupaten/Kota - District/City
Buton Muna Konawe Kolaka Konawe Selatan
Bombana Wakatobi
(1) (2) (3) (4) (5) (6) (7) (8)
1. Hutan Produksi Biasa/ 44 558 42 947 52 041 42 890 65 017 81 823 -
Production Forests
2. Hutan Produksi Terbatas/ 29 737 1 136 107 463 133 646 3 707 24 473 -
Limited Production
Forests
3. Hutan Lindung/ 28 918 31 829 236 190 291 745 44 251 48 579 10 022
Protection Forest
4. Hutan Wisata/PPA/ 28 138 7 401 17 115 21 965 77 588 44 160 -
Konservasi Darat/
Forests Tour
5. Hutan Produksi yang 305 8 940 24 913 11 137 - 8 285 -
dapat Dikonversikan/
Convertible
Production Forest
6. Hutan Konservasi - - - 32 289 - - 1 390 000
Perairan/ Penggunaan lainnya Water Conservation Forests/Other use
Jumlah/Total 131 656 92 253 437 722 533 672 190 563 207 320 1 400 022
Sumber/Source: Dinas Kehutanan Prov. Sultra/Forestry Service of Sulawesi Tenggara Province
5.8.1
Luas Kawasan Hutan dan Perairan yang Telah Ditetapkan menurut Kabu-paten/Kota (Ha), 2012 Tabel
Table Fixed Forest and Water Ecosystem Areasby District/City (Ha), 2012
5.8 Kehutanan
Forestry

236
PERTANIAN
Sulawesi Tenggara Dalam Angka 2013
Kabupaten/Kota - District/City
Jenis Hutan Kind of Forests
Jumlah Total
Kolaka Utara
Buton Utara
Konawe Utara
Kendari Bau-Bau
(1) (9) (10) (11) (12) (13) (14)
1. Hutan Produksi Biasa/ 0 6 417 65 999 1 300 1 901 404 893
Production Forests
2. Hutan Produksi Terbatas/ 71 733 9 464 80 490 0 5 005 466 854
Limited Production
Forests
3. Hutan Lindung/ 159 133 15 634 209 661 973 4 554 1 081 489
Protection Forest
4. Hutan Wisata/PPA/ - 83 668 - 2 419 470 282 924
Konservasi Darat/
Forests Tour
5. Hutan Produksi yang - 10 363 33 052 - - 96 995
dapat Dikonversikan/
Convertible
Production Forest
6. Hutan Konservasi - - 74 100 - - 1 496 389
Perairan/ Penggunaan lainnya Water Conservation Forests/Other use
Jumlah/Total 230 866 125 546 463 302 4 692 11 930 3 829 544
Sumber/Source: Dinas Kehutanan Prov. Sultra/Forestry Service of Sulawesi Tenggara Province
Lanjutan Tabel Continuation Table
5.8.1
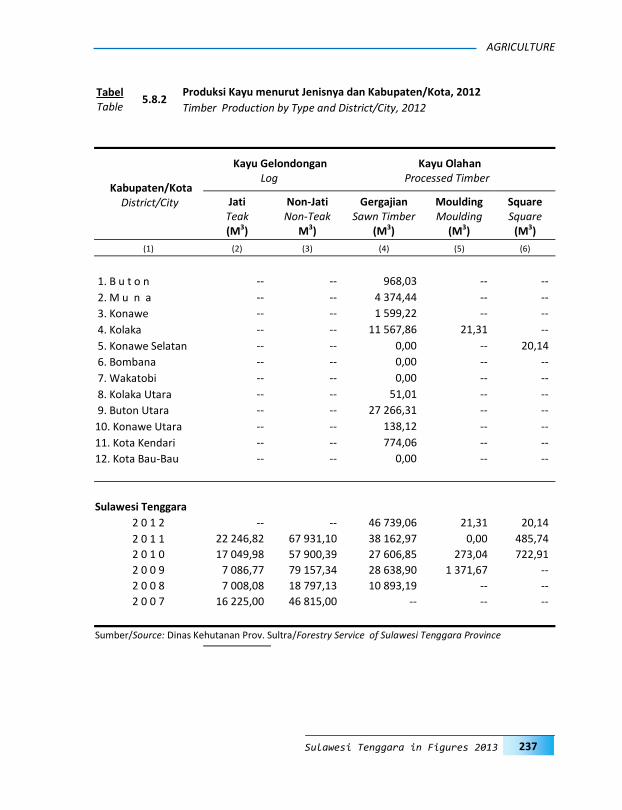
237
AGRICULTURE
Sulawesi Tenggara in Figures 2013
Kabupaten/Kota District/City
Kayu Gelondongan Log
Kayu Olahan Processed Timber
Jati Teak (M3)
Non-Jati Non-Teak
M3)
Gergajian Sawn Timber
(M3)
Moulding Moulding
(M3)
Square Square
(M3)
(1) (2) (3) (4) (5) (6)
1. B u t o n -- -- 968,03 -- --
2. M u n a -- -- 4 374,44 -- --
3. Konawe -- -- 1 599,22 -- --
4. Kolaka -- -- 11 567,86 21,31 --
5. Konawe Selatan -- -- 0,00 -- 20,14
6. Bombana -- -- 0,00 -- --
7. Wakatobi -- -- 0,00 -- --
8. Kolaka Utara -- -- 51,01 -- --
9. Buton Utara -- -- 27 266,31 -- --
10. Konawe Utara -- -- 138,12 -- --
11. Kota Kendari -- -- 774,06 -- --
12. Kota Bau-Bau -- -- 0,00 -- --
Sulawesi Tenggara 2 0 1 2 -- -- 46 739,06 21,31 20,14
2 0 1 1 22 246,82 67 931,10 38 162,97 0,00 485,74
2 0 1 0 17 049,98 57 900,39 27 606,85 273,04 722,91
2 0 0 9 7 086,77 79 157,34 28 638,90 1 371,67 --
2 0 0 8 7 008,08 18 797,13 10 893,19 -- --
2 0 0 7 16 225,00 46 815,00 -- -- --
Sumber/Source: Dinas Kehutanan Prov. Sultra/Forestry Service of Sulawesi Tenggara Province
5.8.2 Produksi Kayu menurut Jenisnya dan Kabupaten/Kota, 2012 Tabel
Table Timber Production by Type and District/City, 2012
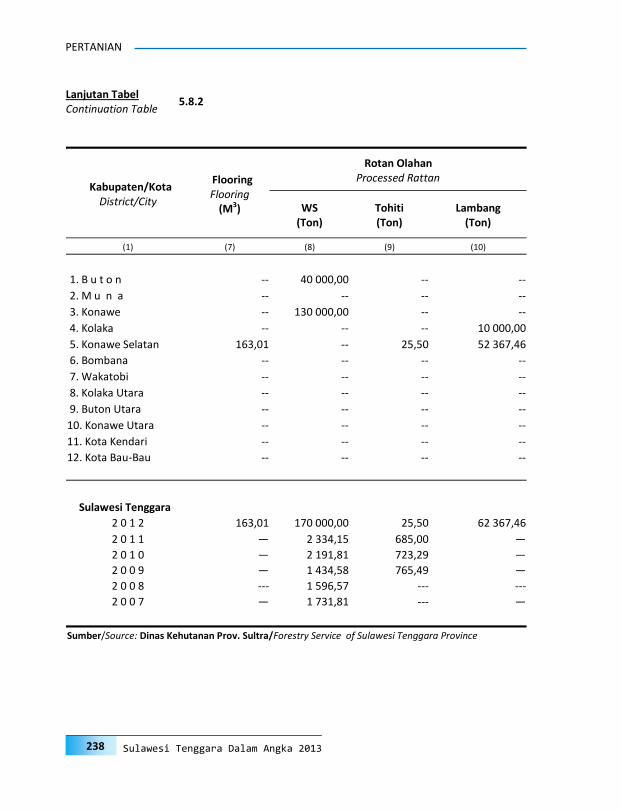
238
PERTANIAN
Sulawesi Tenggara Dalam Angka 2013
Kabupaten/Kota District/City
Flooring Flooring
(M3)
Rotan Olahan Processed Rattan
WS (Ton)
Tohiti (Ton)
Lambang (Ton)
(1) (7) (8) (9) (10)
1. B u t o n -- 40 000,00 -- --
2. M u n a -- -- -- --
3. Konawe -- 130 000,00 -- --
4. Kolaka -- -- -- 10 000,00
5. Konawe Selatan 163,01 -- 25,50 52 367,46
6. Bombana -- -- -- --
7. Wakatobi -- -- -- --
8. Kolaka Utara -- -- -- --
9. Buton Utara -- -- -- --
10. Konawe Utara -- -- -- --
11. Kota Kendari -- -- -- --
12. Kota Bau-Bau -- -- -- --
Sulawesi Tenggara 2 0 1 2 163,01 170 000,00 25,50 62 367,46
2 0 1 1 — 2 334,15 685,00 —
2 0 1 0 — 2 191,81 723,29 —
2 0 0 9 — 1 434,58 765,49 —
2 0 0 8 --- 1 596,57 --- ---
2 0 0 7 — 1 731,81 --- —
Sumber/Source: Dinas Kehutanan Prov. Sultra/Forestry Service of Sulawesi Tenggara Province
Lanjutan Tabel Continuation Table
5.8.2
INDUSTRY, MINING, ELECTRICITY AND WATER SUPPLY
INDUSTRI, PERTAMBANGAN,6 LISTRIK & AIR MINUM
INDUSTRY, MINING, ELECTRICITY AND WATER SUPPLY
241 Sulawesi Tenggara in Figures 2013
PENJELASAN TEKNIS
6.1 Industri Amanat GBHN mengarahkan bahwa,
pembangunan dibidang industri ditujukan untuk memperluas kesempatan kerja, meningkatkan ekspor, menunjang pembangunan daerah, serta memanfaatkan sumber daya alam dan sumber daya manusia. Sejalan dengan itu, maka dewasa ini pemerintah memberikan kesempatan yang seluas-luasnya kepada masyarakat untuk membuka berbagai kegiatan dalam bidang industri.
Penyajian data tentang industri ini
dikelompokkan menurut banyaknya tenaga kerja yang bekerja pada industri tersebut yaitu; industri besar dan sedang, industri kecil dan industri mikro. Industri yang memiliki tenaga kerja 100 orang atau lebih diklasifikasikan sebagai industri besar, 20 sampai dengan 99 orang diklasifikasikan sebagai industri sedang, 5 (lima) sampai dengan 19 orang diklasifikasikan sebagai industri kecil, dan kurang dari lima orang adalah industri mikro.
Data perusahaan industri yang disajikan, diperoleh dari dua sumber, yaitu dari hasil Survei Industri Besar dan Sedang tahun 2011 dan dari Dinas Perindustrian dan Perdagangan Provinsi Sulawesi Tenggara.
1. Pengumpulan data industri besar dan sedang dilakukan melalui Survei Industri Besar dan Sedang dilaksanakan setiap tahun secara lengkap (sensus) sejak tahun 1975. Survey Industri Besar dan Sedang mencakup semua perusahaan industri yang mempunyai tenaga kerja 20 orang atau lebih dengan menggunakan kuesioner II A.
TECHNICAL NOTES
6.1 Industry As mandated by the Broad Outlines
of the Nation's Direction, the development of industry aimed at expanding employ-ment opportunities, increasing exports, supporting regional development, and utilizating natural as well as human re-sources. Accordingly, the government gives wide opportunities to the public to estab-lish various activities in the field of indus-try.
In this publication, the data on indus-
tries are classified according to the number of employees who work in the industry, namely: large and medium manufacturing industries, small industries and micro in-dustries. Manufacturing industries which has 100 employess or more are classified as large scale manufacturing industry, 20 to 99 employees as medium scale manu-facturing industry, 5 to 19 employees as small scale industries, and less than five employees as micro industry.
Data on industry presented in this publication were obtained from two sources, namely the 2011 Large and Medi-um Manufacturing Establishment Survey and from the Industry and Trade Office of Sulawesi Tenggara Province.
1. Data collection of large and medium
scale manufacturing is conducted through The Large and Medium Man-ufacturing Establishment Surveythat has been done annually for all indus-tries (census) since 1975. Large and Medium Manufacturing Establishment Survey covers all manufactures/ indus-tries with 20 workers or more by ques-tionaire II A.

242
INDUSTRI, PERTAMBANGAN, LISTRIK & AIR MINUM
Sulawesi Tenggara Dalam Angka 2013
2. Klasifikasi industri yang digunakan dalam survey ini berdasar kepada Klasifikasi Baku Lapangan Usaha Indonesia (KBLI). KBLI adalah klasifikasi lapangan usaha yang berdasar kepada International Standard Industrial Classification of All Economic Activities (ISIC) revisi 3 yang telah disesuaikan dengan kondisi Indone-sia.
3. Industri Pengolahan adalah suatu
kegiatan ekonomi yang melakukan kegiatan mengubah suatu barang dasar secara mekanis, kimia, atau dengan tan-gan sehingga menjadi barang jadi/ seten-gah jadi, dan atau barang yang kurang nilainya menjadi barang yang lebih tinggi nilainya, dan sifatnya lebih dekat kepada pemakai akhir. Termasuk dalam kegiatan ini adalah jasa industry dan pekerjaan perakitan (assembling).
4. Jasa Industri adalah kegiatan industri
yang melayani keperluan pihak lain. Pada kegiatan ini bahan baku disediakan oleh pihak lain sedangkan pihak pengolah hanya melakukan pengolahannya dengan mendapat imbalan sebagai balas jasa (upah maklon).
5. Perusahaan atau usaha industri adalah
suatu unit (kesatuan) usaha yang melakukan kegiatan ekonomi, bertujuan menghasilkan barang atau jasa, terletak pada suatu bangunan atau lokasi terten-tu, dan mempunyai catatan administrasi tersendiri mengenai produksi dan struktur biaya serta ada seorang atau lebih yang bertanggung jawab atas usaha tersebut.
Industri pengolahan dikelompokkan ke
dalam 4 golongan berdasarkan banyak-nya pekerja, yaitu: Industri Besar (100
2. The industrial clasification adopted in this survey refers to the Klasifikasi Baku Lapangan Usaha Indonesia (KBLI). KBLI is classification of econom-ic activities based on the International Standard Industrial Classification of All Economic Activities (ISIC rev 3) that has been modified according to the local condition in Indonesia.
3. Manufacturing industry is defined as an economic activity processing basic goods mechanically, chemicals or manually into final or intermediate goods. It is also defined as processing of lower value goods into higher value goods as final or intermediate prod-ucts. The activities also include ser-vices for manufacturing and assem-bling.
4. Services for manufacturing is defined
as a manufacturing activity which serving other manufacturing establish-ments. In this case, raw materials are supplied by others while the workers are paid as a compensation for pro-cessing raw materials.
5. A manufacturing establishment is
defined as a production unit engaged in economic activity, producing goods or services, located in a building or in a certain location, keeping a business record concerning the production and cost structure, and having a person or more that are responsible to those activities.
Manufacturing industries are catego-rized into four groups, based on the number of employees : Large scale

INDUSTRY, MINING, ELECTRICITY AND WATER SUPPLY
243 Sulawesi Tenggara in Figures 2013
orang pekerja atau lebih), Industri Se-dang/Menengah ( 20-99 orang peker-ja), Industri Kecil (5-19 orang pekerja), dan Industri Mikro (1-4 orang pekerja).
7. Input atau biaya antara adalah biaya
yang dikeluarkan dalam proses industri yang berupa bahan baku, bahan bakar, barang lainnya diluar bahan baku/bahan penolong, jasa industri, sewa gedung, dan biaya jasa non industri.
8. Output adalah nilai keluaran yang dihasilkan dari proses kegiatan industri yang berupa barang yang dihasilkan, tenaga listrik yang dijual, jasa industri, keuntungan jual beli, pertambahan stok barang setengah jadi dan penerimaan lain.
9. Nilai Tambah adalah besarnya output dikurangi besarnya nilai input (antara).
10. Pengeluaran untuk tenaga kerja adalah merupakan imbalan atas jasa-jasa yang telah dikorbankan oleh pekerja untuk pihak lain yang meliputi upah/gaji, upah lembur, hadiah, bonus dan sejenisnya, iuran dana pensiun, tunjangan sosial, tunjangan kecelakaan, dan lainnya.
11. Modal Tetap adalah modal kerja yang dapat digunakan lebih dari satu tahun.
Pajak tidak langsung adalah pajak yang langsung dibayarkan oleh perusahaan. Termasuk PPn.
13. Bahan baku adalah bahan-bahan yang
digunakan untuk proses produksi dalam membentuk suatu barang produksi.
manufacturing (100 employees or-more), Medium scale manufacturing (20-99 employees), Small scale manu-facturing (5-19 employees), and Mi-cro industry (1-4 employees).
7. Input or intermediate cost is defined
as cost of raw materials and support-ing materials, fuel, other materials, electricity, industrial services, building rent, and nonindustrial services,etc.
8. Output is defined as total value of all processed goods which include pro-duction, electricity sold, industrial services, profits, change in stocks and other incomes.
9. Value added is defined as substraction
from output to input.
Labor Cost is defined as compensation for workers in the form of money and goods. Labor cost covers wage and salary, overtimepay, bonus in cash and goods, pension funds, social allow-ance, accident allowance etc.
11. Fixed Asset is working capital that can be used for more than one year.
Indirect tax is tax paid by establish-
ment including value added taxes (PPn).
13. Raw material is materials used in the
production process of production goods.
14. Outcome product is goods related in
244
INDUSTRI, PERTAMBANGAN, LISTRIK & AIR MINUM
Sulawesi Tenggara Dalam Angka 2013
Barang yang dihasilkan adalah barang yang dihasilkan dalam proses produksi.
15. Mulai tahun 2002, indeks produksi indus-
tri besar dan sedang/menengah menggunakan kerangka sampel tahun 2000. Sesuai dengan kerangka sampel, maka indeks hanya dapat disajikan maksi-mal dalam 2 digit ISIC Revisi 3.
16. Metodologi penarikan sampel
menggunakan "Cut Off Point " dan PPS. 17. Klasifikasi Industri
10. Makanan 11. Minuman 12. Pengolahan Tembakau 13. Tekstil 14. Pakaian Jadi
Kulit, barang kulit dan alas kaki 16. Kayu, barang dari kayu (tidak
termasuk furnitur) dan barang-barang anyaman
17. Kertas dan barang dari kertas 18. Penerbitan, percetakan dan
reproduksi media rekaman 19. Batu bara, pengilangan minyak bumi
dan pengolahan gas bumi, barang-barang dari pengilangan minyak bumi dan bahan nuklir
20. Kimia dan barang-barang dari bahan kimia
21. Farmasi, Produk obat kimia dan obat tradisional
22. Karet, barang dari karet dan plastik 23. Barang galian bukan logam 24. Logam dasar 25. Barang-barang dari logam kecuali
mesin dan peralatannya 26. Komputer barang elektronik dan
optik
the production process. 15. Since 2002, the industrial production
indices of large and medium manufac-turing have been calculated based on the 2000 sampling frame. Using this sampling frame, the indices can be calculated maximally only in 2 digits of ISIC Revision 3.
16. The methodology of the sample selec-
tion was based on "Cut Off Point" and PPS.
17. Classification of Industry
10. Food 11. Beverages 12. Tobacco 13. Textiles 14. Wearing Apparel 15. Tanning and Dressing of Leather 16. Wood and Products of Wood
except Furniture and Plaiting Materials
17. Paper and Paper Products 18. Publishing, Printing and Repro-
duction of Recorded Media 19. Coal, Refined Petroleum Products
and Nuclear Fuel
Chemicals and Chemical Products 21. Pharmaceutical, medicinal prod-
ucts and traditional medicinal chemistry
22. Rubber and Plastics Products 23. Non-metallic Mineral Products 24. Basic Metals 25. Fabricated Metal Products except
Machinery and Equipments Computer electronics and optics
27. Electrical equipment

INDUSTRY, MINING, ELECTRICITY AND WATER SUPPLY
245 Sulawesi Tenggara in Figures 2013
27. Peralatan Listrik 28. Mesin dan perlengkapannya YTDL 29 Kendaraan Bermotor, Trailer dan
Semi Trailer Industri Alat Angkutan Lainnya
31. Industri Furnitur 32. Industri Pengolahan Lainnya 33. Jasa Reparasi Pemasangan Mesin dan
Peralatan
18. Pengumpulan data industri mikro dan kecil (IMK) dilaksanakan pada tahun 1991, 1993, 1994, dan 1995 melalui Survei Industri Kecil dan Kerajinan Rumahtangga (IKKR). Data IMK tahun 1996 dikumpulkan melalui Sensus Ekonomi (SE) 1996 dan sejak tahun 1998 data IMK dikumpulkan melalui Survei Usaha Terintegrasi (SUSI). Sedangkan data IMK Tahun 2006 dikumpulkan melalui Sensus Ekonomi 2006 - Sensus Sampel (SE06-SS). Data tahun 2007 dan 2008 merupakan angka estimasi, karena tidak ada pengumpulan data.
6.2 Pertambangan
1. Pertambangan adalah suatu kegiatan
pengambilan endapan bahan galian ber-harga dan bernilai ekonomis dari dalam kulit bumi, di bawah permukaan bumi dan di bawah permukaan air.
2. Avtur (Aviation Turbin) adalah bahan
bakar khusus untuk turbin/pesawat terbang, jenis khusus minyak tanah dengan proses penyulingan dari 150°C - 250°C.
3. Premium adalah jenis bahan bakar min-yak. Dipergunakan di mesin pembakaran bagian dalam kecuali mesin pesawat
28. Machinery and Equipment 29. Motor Vehicles, Trailers and Sem-
itrailers 30. Other Transport Equipmen Indus-
try 31. Furniture Manufacturing 32. Other Manufacturing 33. Services Repair Installation of Ma-
chinery and Equipment
18. The data collection of micro and small scale industries was conducted through the Small Scale and House-hold/Cottage Industry Survey in 1991, 1993, 1994, and 1995. The 1996 data was collected through the 1996 Eco-nomic Census and since 1998 the data were collected through Integrated Establishment Survey. While the 2006 micro and small scale industries data were collected through the Census Sample of the 2006 Economic Census. The 2007 and 2008 data were estimat-ed figures, since there were no data collection.
6.2 Mining
1. Mining is an activity of taking eco-
nomically valued material from within the earth layer, under earth surface, and under water level.
2. Avtur (Aviation Turbine) fuel is a spe-cial fuel for turbine/jet aircraf, a spe-cial kerosene produced in the distilla-tion process range of 150°C - 250°C.
3. Premium is light hydrocarbon oil used
for internal combustion engine, except ionfor engine, available in the market as Premium, Premix, Super TT, and
246
INDUSTRI, PERTAMBANGAN, LISTRIK & AIR MINUM
Sulawesi Tenggara Dalam Angka 2013
terbang, di pasaran tersedia dalam ben-tuk Premium, Premix, Super TT dan BB2L.
Minyak Bakar adalah bahan bakar min-yak dari jenis residu, lebih kental da-ripada minyak diesel dan mempunyai titik tuang (pour point) yang lebih tinggi da-ripada minyak diesel.
6.3 Listrik
5. Perusahaan Listrik Negara (PLN) adalah Perusahaan Umum Milik Negara yang mempunyai aktivitas kegiatan pembang-kitan, transmisi, dan distribusi tenaga lsitrik.
6.4 Air Minum
6. Perusahaan Air Bersih adalah perusahaan yang mempunyai aktivitas dalam penam-pungan, penjernihan, dan penyaluran air baku atau air bersih dari terminal air me-lalui saluran air, pipa atau mobil tangki (dalam satu pengelolaan administrasi dengan kegiatan ekonomi) kepada rumah tangga, perusahaan industri, atau pengguna komersial lainnya.
7. Jumlah listrik/gas/air bersih yang terjual adalah banyaknya listrik/gas/air bersih yang disalurkan kepada para pelanggan.
8. Biaya input adalah pengeluaran yang digunakan untuk pembelian bahan bakar dan pelumas tenaga listrik yang dibeli, alat-alat tulis, onderdil, ongkos pemeli-haraan dan perbaikan kecil alat produksi, sewa gedung dan mesin serta jasa lainnya.
BB2L.
4. Fuel oil is a fraction obtained from petroleum distillation, either as a dis-tillate or a residue. It is more viscous and has a higher flash point than die-sel fuel.
6.3 Electricity
State Electricity Company (PLN) is a State owned company that has activi-ties for electricity production, trans-mission and electricity distribution.
6.4 Drinking Water 6. The Water Supply Company (PDAM)
is a company with several activities such as the collection and purification of water and the distribution of water to households, industries, and other commercial users.
7. Sold electricity/gas/cleaned water is
total electricity/gas/cleaned water distributed to customers.
8. Input values include expenditures for fuel and lubricant, electricity con-sumed maintenance, stationaries, spareparts, maintenance costs of ma-chineries and vehicles, building and machineries rental costs, and costs of other services.
9. Output cover electricity/gas/cleaned
INDUSTRY, MINING, ELECTRICITY AND WATER SUPPLY
247 Sulawesi Tenggara in Figures 2013
9. Nilai Output adalah nilai tenaga listrik/gas/air bersih yang dijual atau didistri-busikan kepada para pelanggan dan dit-ambah dengan pendapatan atau pen-erimaan dari kegiatan jasa perusahaan.
water sold and distributed to custom-ers added by income from other ser-vices.
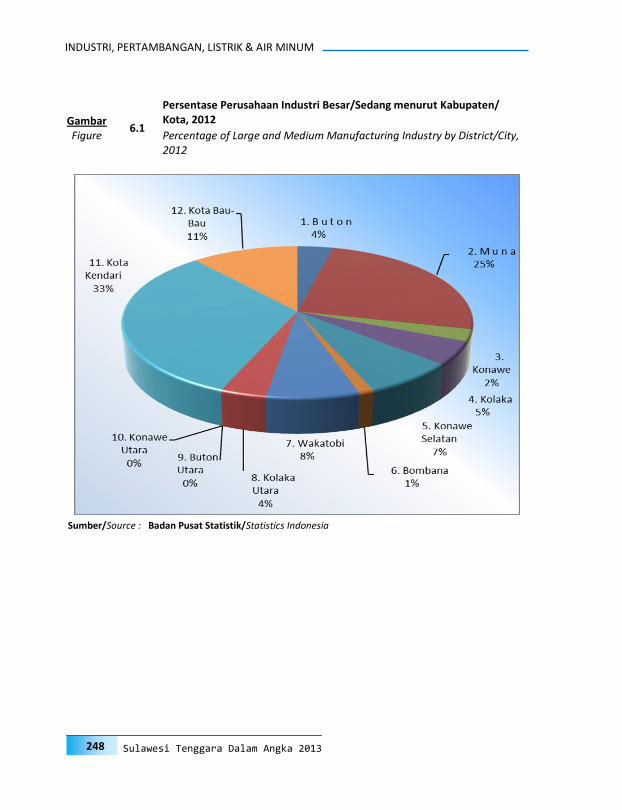
248
INDUSTRI, PERTAMBANGAN, LISTRIK & AIR MINUM
Sulawesi Tenggara Dalam Angka 2013
6.1
Persentase Perusahaan Industri Besar/Sedang menurut Kabupaten/Kota, 2012 Gambar
Figure Percentage of Large and Medium Manufacturing Industry by District/City, 2012
Sumber/Source : Badan Pusat Statistik/Statistics Indonesia
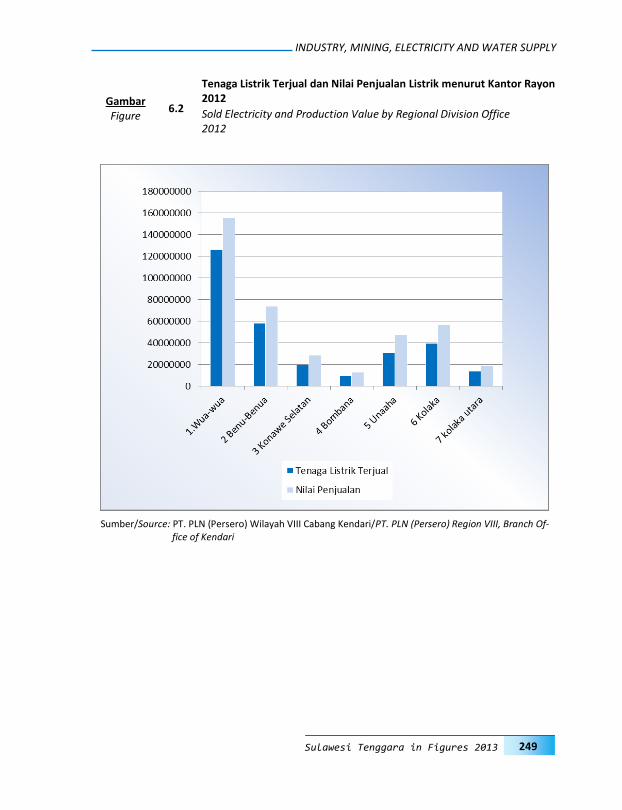
INDUSTRY, MINING, ELECTRICITY AND WATER SUPPLY
249 Sulawesi Tenggara in Figures 2013
6.2
Tenaga Listrik Terjual dan Nilai Penjualan Listrik menurut Kantor Rayon 2012 Gambar
Figure Sold Electricity and Production Value by Regional Division Office 2012
Sumber/Source: PT. PLN (Persero) Wilayah VIII Cabang Kendari/PT. PLN (Persero) Region VIII, Branch Of-fice of Kendari

250
INDUSTRI, PERTAMBANGAN, LISTRIK & AIR MINUM
Sulawesi Tenggara Dalam Angka 2013
6.3 Jumlah Pelanggan Air Minum menurut Kategori Pelanggan, 2008-2012 Gambar
Figure Number Customers of Water Supply Establishment Type of by Customers, 2008-2012
Sumber/Source: Perusahaan Daerah Air Minum Kabupaten Se-Sultra/ Regional Water Supply Com-pany of Sulawesi Tenggara Province
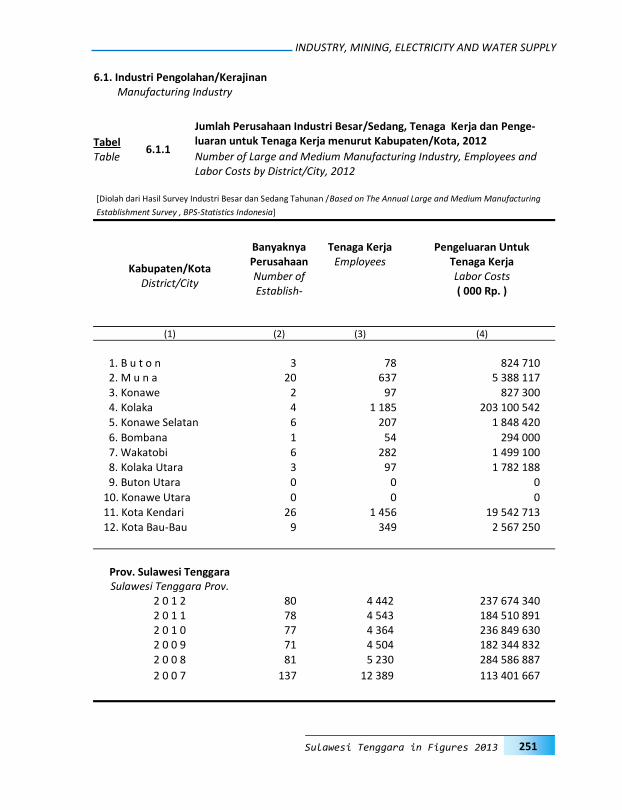
INDUSTRY, MINING, ELECTRICITY AND WATER SUPPLY
251 Sulawesi Tenggara in Figures 2013
Banyaknya Tenaga Kerja Pengeluaran Untuk
Kabupaten/Kota District/City
Perusahaan Employees Tenaga Kerja Number of Labor Costs Establish-
( 000 Rp. )
(1) (2) (3) (4)
1. B u t o n 3 78 824 710 2. M u n a 20 637 5 388 117 3. Konawe 2 97 827 300 4. Kolaka 4 1 185 203 100 542 5. Konawe Selatan 6 207 1 848 420
6. Bombana 1 54 294 000 7. Wakatobi 6 282 1 499 100 8. Kolaka Utara 3 97 1 782 188 9. Buton Utara 0 0 0
10. Konawe Utara 0 0 0 11. Kota Kendari 26 1 456 19 542 713 12. Kota Bau-Bau 9 349 2 567 250
Prov. Sulawesi Tenggara Sulawesi Tenggara Prov.
2 0 1 2 80 4 442 237 674 340 2 0 1 1 78 4 543 184 510 891 2 0 1 0 77 4 364 236 849 630 2 0 0 9 71 4 504 182 344 832 2 0 0 8 81 5 230 284 586 887
2 0 0 7 137 12 389 113 401 667
6.1.1
Jumlah Perusahaan Industri Besar/Sedang, Tenaga Kerja dan Penge-luaran untuk Tenaga Kerja menurut Kabupaten/Kota, 2012 Tabel
Table Number of Large and Medium Manufacturing Industry, Employees and Labor Costs by District/City, 2012
6.1. Industri Pengolahan/Kerajinan Manufacturing Industry
[Diolah dari Hasil Survey Industri Besar dan Sedang Tahunan /Based on The Annual Large and Medium Manufacturing
Establishment Survey , BPS-Statistics Indonesia]
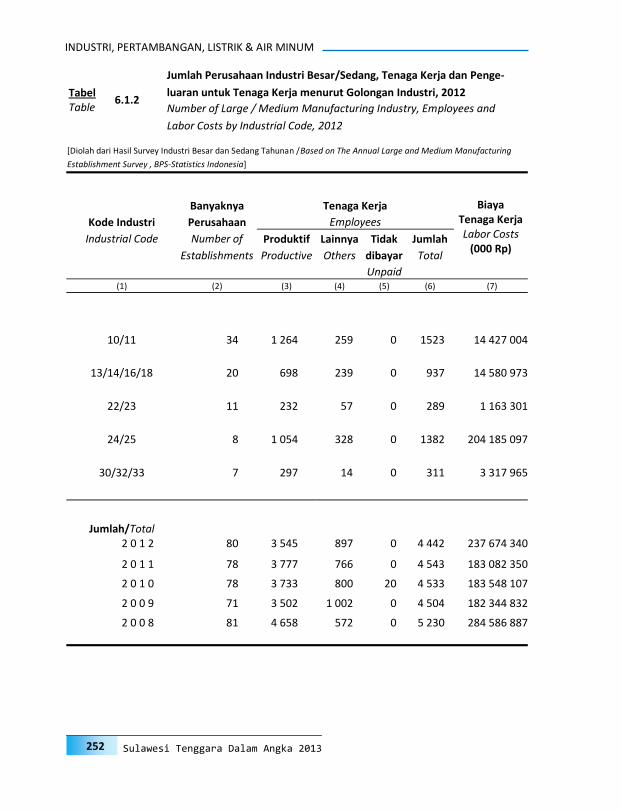
252
INDUSTRI, PERTAMBANGAN, LISTRIK & AIR MINUM
Sulawesi Tenggara Dalam Angka 2013
Biaya Tenaga Kerja Labor Costs
(000 Rp)
Banyaknya Tenaga Kerja
Kode Industri Perusahaan Employees
Industrial Code Number of Produktif Lainnya Tidak Jumlah
Establishments Productive Others dibayar Total
Unpaid (1) (2) (3) (4) (5) (6) (7)
10/11 34 1 264 259 0 1523 14 427 004
13/14/16/18 20 698 239 0 937 14 580 973
22/23 11 232 57 0 289 1 163 301
24/25 8 1 054 328 0 1382 204 185 097
30/32/33 7 297 14 0 311 3 317 965
Jumlah/Total 2 0 1 2 80 3 545 897 0 4 442 237 674 340
2 0 1 1 78 3 777 766 0 4 543 183 082 350
2 0 1 0 78 3 733 800 20 4 533 183 548 107
2 0 0 9 71 3 502 1 002 0 4 504 182 344 832
2 0 0 8 81 4 658 572 0 5 230 284 586 887
6.1.2
Jumlah Perusahaan Industri Besar/Sedang, Tenaga Kerja dan Penge-
luaran untuk Tenaga Kerja menurut Golongan Industri, 2012 Tabel Table Number of Large / Medium Manufacturing Industry, Employees and
Labor Costs by Industrial Code, 2012
[Diolah dari Hasil Survey Industri Besar dan Sedang Tahunan /Based on The Annual Large and Medium Manufacturing
Establishment Survey , BPS-Statistics Indonesia]
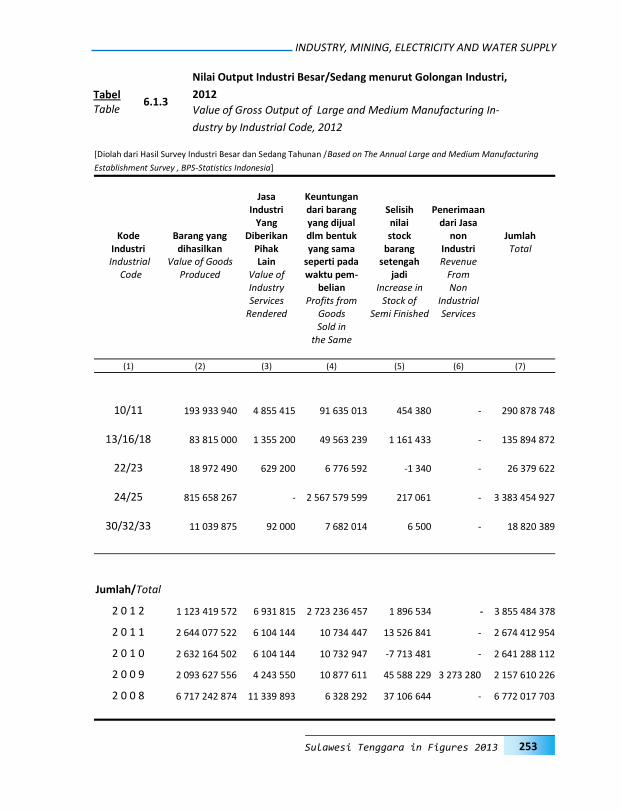
INDUSTRY, MINING, ELECTRICITY AND WATER SUPPLY
253 Sulawesi Tenggara in Figures 2013
Jasa Keuntungan Industri dari barang Selisih Penerimaan Yang yang dijual nilai dari Jasa
Kode Barang yang Diberikan dlm bentuk stock non Jumlah Industri dihasilkan Pihak yang sama barang Industri Total
Industrial Value of Goods Lain seperti pada setengah Revenue Code Produced Value of waktu pem- jadi From
Industry belian Increase in Non Services Profits from Stock of Industrial Rendered Goods Semi Finished Services
Sold in the Same
(1) (2) (3) (4) (5) (6) (7)
10/11 193 933 940 4 855 415 91 635 013 454 380 - 290 878 748
13/16/18 83 815 000 1 355 200 49 563 239 1 161 433 - 135 894 872
22/23 18 972 490 629 200 6 776 592 -1 340 - 26 379 622
24/25 815 658 267 - 2 567 579 599 217 061 - 3 383 454 927
30/32/33 11 039 875 92 000 7 682 014 6 500 - 18 820 389
Jumlah/Total
2 0 1 2 1 123 419 572 6 931 815 2 723 236 457 1 896 534 - 3 855 484 378
2 0 1 1 2 644 077 522 6 104 144 10 734 447 13 526 841 - 2 674 412 954
2 0 1 0 2 632 164 502 6 104 144 10 732 947 -7 713 481 - 2 641 288 112
2 0 0 9 2 093 627 556 4 243 550 10 877 611 45 588 229 3 273 280 2 157 610 226
2 0 0 8 6 717 242 874 11 339 893 6 328 292 37 106 644 - 6 772 017 703
6.1.3
Nilai Output Industri Besar/Sedang menurut Golongan Industri,
2012 Tabel Table Value of Gross Output of Large and Medium Manufacturing In-
dustry by Industrial Code, 2012
[Diolah dari Hasil Survey Industri Besar dan Sedang Tahunan /Based on The Annual Large and Medium Manufacturing
Establishment Survey , BPS-Statistics Indonesia]
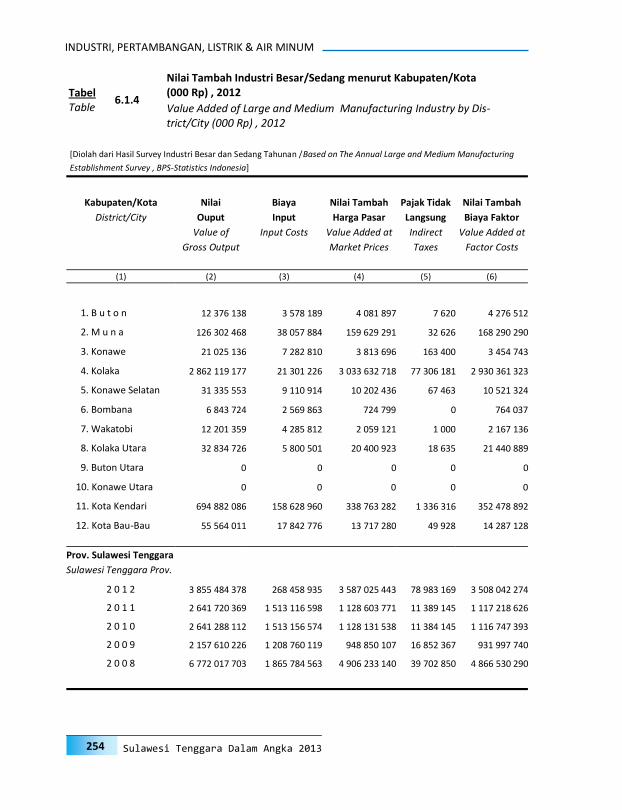
254
INDUSTRI, PERTAMBANGAN, LISTRIK & AIR MINUM
Sulawesi Tenggara Dalam Angka 2013
Kabupaten/Kota Nilai Biaya Nilai Tambah Pajak Tidak Nilai Tambah
District/City Ouput Input Harga Pasar Langsung Biaya Faktor
Value of Input Costs Value Added at Indirect Value Added at
Gross Output Market Prices Taxes Factor Costs
(1) (2) (3) (4) (5) (6)
1. B u t o n 12 376 138 3 578 189 4 081 897 7 620 4 276 512
2. M u n a 126 302 468 38 057 884 159 629 291 32 626 168 290 290
3. Konawe 21 025 136 7 282 810 3 813 696 163 400 3 454 743
4. Kolaka 2 862 119 177 21 301 226 3 033 632 718 77 306 181 2 930 361 323
5. Konawe Selatan 31 335 553 9 110 914 10 202 436 67 463 10 521 324
6. Bombana 6 843 724 2 569 863 724 799 0 764 037
7. Wakatobi 12 201 359 4 285 812 2 059 121 1 000 2 167 136
8. Kolaka Utara 32 834 726 5 800 501 20 400 923 18 635 21 440 889
9. Buton Utara 0 0 0 0 0
10. Konawe Utara 0 0 0 0 0
11. Kota Kendari 694 882 086 158 628 960 338 763 282 1 336 316 352 478 892
12. Kota Bau-Bau 55 564 011 17 842 776 13 717 280 49 928 14 287 128
Prov. Sulawesi Tenggara
Sulawesi Tenggara Prov.
2 0 1 2 3 855 484 378 268 458 935 3 587 025 443 78 983 169 3 508 042 274
2 0 1 1 2 641 720 369 1 513 116 598 1 128 603 771 11 389 145 1 117 218 626
2 0 1 0 2 641 288 112 1 513 156 574 1 128 131 538 11 384 145 1 116 747 393
2 0 0 9 2 157 610 226 1 208 760 119 948 850 107 16 852 367 931 997 740
2 0 0 8 6 772 017 703 1 865 784 563 4 906 233 140 39 702 850 4 866 530 290
6.1.4
Nilai Tambah Industri Besar/Sedang menurut Kabupaten/Kota (000 Rp) , 2012 Tabel
Table Value Added of Large and Medium Manufacturing Industry by Dis-trict/City (000 Rp) , 2012
[Diolah dari Hasil Survey Industri Besar dan Sedang Tahunan /Based on The Annual Large and Medium Manufacturing
Establishment Survey , BPS-Statistics Indonesia]
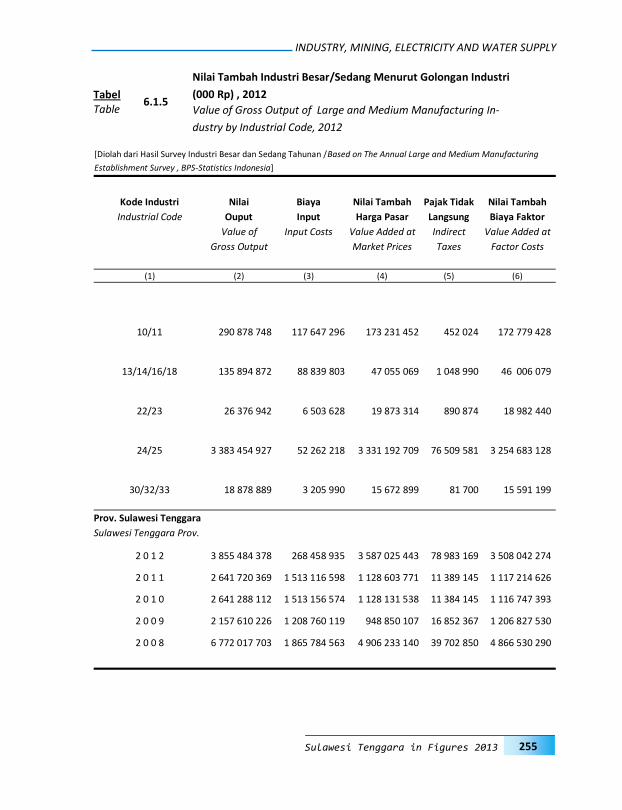
INDUSTRY, MINING, ELECTRICITY AND WATER SUPPLY
255 Sulawesi Tenggara in Figures 2013
Kode Industri Nilai Biaya Nilai Tambah Pajak Tidak Nilai Tambah
Industrial Code Ouput Input Harga Pasar Langsung Biaya Faktor
Value of Input Costs Value Added at Indirect Value Added at
Gross Output Market Prices Taxes Factor Costs
(1) (2) (3) (4) (5) (6)
10/11 290 878 748 117 647 296 173 231 452 452 024 172 779 428
13/14/16/18 135 894 872 88 839 803 47 055 069 1 048 990 46 006 079
22/23 26 376 942 6 503 628 19 873 314 890 874 18 982 440
24/25 3 383 454 927 52 262 218 3 331 192 709 76 509 581 3 254 683 128
30/32/33 18 878 889 3 205 990 15 672 899 81 700 15 591 199
Prov. Sulawesi Tenggara
Sulawesi Tenggara Prov.
2 0 1 2 3 855 484 378 268 458 935 3 587 025 443 78 983 169 3 508 042 274
2 0 1 1 2 641 720 369 1 513 116 598 1 128 603 771 11 389 145 1 117 214 626
2 0 1 0 2 641 288 112 1 513 156 574 1 128 131 538 11 384 145 1 116 747 393
2 0 0 9 2 157 610 226 1 208 760 119 948 850 107 16 852 367 1 206 827 530
2 0 0 8 6 772 017 703 1 865 784 563 4 906 233 140 39 702 850 4 866 530 290
6.1.5
Nilai Tambah Industri Besar/Sedang Menurut Golongan Industri
(000 Rp) , 2012 Tabel Table Value of Gross Output of Large and Medium Manufacturing In-
dustry by Industrial Code, 2012
[Diolah dari Hasil Survey Industri Besar dan Sedang Tahunan /Based on The Annual Large and Medium Manufacturing
Establishment Survey , BPS-Statistics Indonesia]
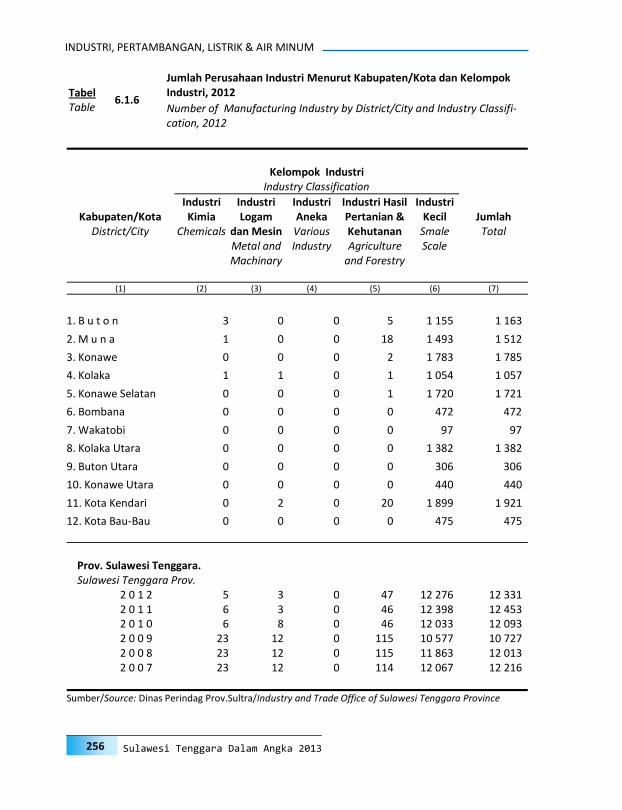
256
INDUSTRI, PERTAMBANGAN, LISTRIK & AIR MINUM
Sulawesi Tenggara Dalam Angka 2013
6.1.6
Jumlah Perusahaan Industri Menurut Kabupaten/Kota dan Kelompok Industri, 2012 Tabel
Table Number of Manufacturing Industry by District/City and Industry Classifi-cation, 2012
Kelompok Industri Industry Classification
Industri Industri Industri Industri Hasil Industri Kabupaten/Kota Kimia Logam Aneka Pertanian & Kecil Jumlah
District/City Chemicals dan Mesin Various Kehutanan Smale Total Metal and Industry Agriculture Scale Machinary and Forestry
(1) (2) (3) (4) (5) (6) (7)
1. B u t o n 3 0 0 5 1 155 1 163
2. M u n a 1 0 0 18 1 493 1 512
3. Konawe 0 0 0 2 1 783 1 785
4. Kolaka 1 1 0 1 1 054 1 057
5. Konawe Selatan 0 0 0 1 1 720 1 721
6. Bombana 0 0 0 0 472 472
7. Wakatobi 0 0 0 0 97 97
8. Kolaka Utara 0 0 0 0 1 382 1 382
9. Buton Utara 0 0 0 0 306 306
10. Konawe Utara 0 0 0 0 440 440
11. Kota Kendari 0 2 0 20 1 899 1 921
12. Kota Bau-Bau 0 0 0 0 475 475
Prov. Sulawesi Tenggara. Sulawesi Tenggara Prov.
2 0 1 2 5 3 0 47 12 276 12 331 2 0 1 1 6 3 0 46 12 398 12 453 2 0 1 0 6 8 0 46 12 033 12 093 2 0 0 9 23 12 0 115 10 577 10 727 2 0 0 8 23 12 0 115 11 863 12 013 2 0 0 7 23 12 0 114 12 067 12 216
Sumber/Source: Dinas Perindag Prov.Sultra/Industry and Trade Office of Sulawesi Tenggara Province

INDUSTRY, MINING, ELECTRICITY AND WATER SUPPLY
257 Sulawesi Tenggara in Figures 2013
Kelompok/
Jenis Industri Classification of
Industry
Jumlah Perusahaan Number of Manufac-
turing Industry
Jumlah Tenaga Kerja
Number of Employees
Investasi Investments
(000 Rp)
Nilai Produksi
Production Value
(000 Rp)
(1) (2) (3) (4) (5)
I. Industri Kimia/ Chemical Industry*
5 294 17 120 603 112 642 661
II. Industri Logam dan Mesin/ Metal and Machinary Industry*
3 690 29 551 883 2 909 430 295
III. Industri Aneka/ Miscell amous Industry*
0 0 0 0
IV. Industri Hasil Pertanian dan Kehutanan/ Agricultural and Forestry Industry*
47 1 506 364 784 577 120 269 175
V. Industri Kecil/ Small Scale Indus-try
0 0 0 0
1. IK. Hasil Pertanian/ Small Scale Industry of Agriculture
7 362 36 006 913 466 189 1 783 663 012
2. IK. Kimia/ Small Scale Industry of Chemical
1 755 9 817 182 236 875 784 819 173
3. IK. Logam dan Mesin/ Small Scale Industry of Metal and Machinary
1 240 8 744 82 326 192 212 858 833
4. IK. Aneka/ Small Scale Industry of Miscella amous things
1 919 14 639 101 745 864 305 906 601
J u m l a h/T o t a l
2 0 1 2 12 331 71 696 1 691 232 183 6 229 589 750
2 0 1 1 12 453 72 453 1 840 702 580 5 955 649 529
2 0 1 0 12 093 70 975 1 723 159 828 5 053 468 287
2 0 0 9 10 727 57 132 1 261 938 165 3 504 140 978
2 0 0 8 12 013 74 465 950 397 007 2 964 047 785 2 0 0 7 36 050 211 965 1 403 272 764 9 199 074 882
Sumber/Source: Dinas Perindag Prov.Sultra/ Industry and Trade Office of Sulawesi Tenggara Province Catatan/Note : *) Industri Besar dan Sedang menurut konsep Dinas Perindag/ Large and Medium Estab-
lishment Industry according to the concept of Industry and Trade Office
6.1.7
Jumlah Industri, Nilai Produksi dan Tenaga Kerja Menurut Jenis
Industri, 2012 Tabel Table Number of Establishments, Labours and Gross Output Values of
Manufacturing Industry, 2012
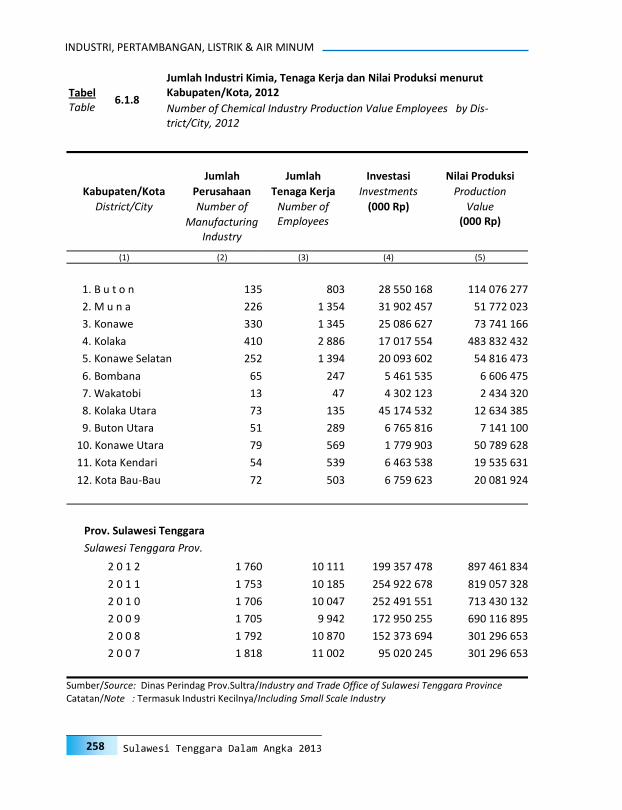
258
INDUSTRI, PERTAMBANGAN, LISTRIK & AIR MINUM
Sulawesi Tenggara Dalam Angka 2013
Jumlah Jumlah Investasi Nilai Produksi
Kabupaten/Kota Perusahaan Tenaga Kerja Investments Production
District/City Number of Number of (000 Rp) Value
Manufacturing Employees (000 Rp)
Industry
(1) (2) (3) (4) (5)
1. B u t o n 135 803 28 550 168 114 076 277
2. M u n a 226 1 354 31 902 457 51 772 023
3. Konawe 330 1 345 25 086 627 73 741 166
4. Kolaka 410 2 886 17 017 554 483 832 432
5. Konawe Selatan 252 1 394 20 093 602 54 816 473
6. Bombana 65 247 5 461 535 6 606 475
7. Wakatobi 13 47 4 302 123 2 434 320
8. Kolaka Utara 73 135 45 174 532 12 634 385
9. Buton Utara 51 289 6 765 816 7 141 100
10. Konawe Utara 79 569 1 779 903 50 789 628
11. Kota Kendari 54 539 6 463 538 19 535 631
12. Kota Bau-Bau 72 503 6 759 623 20 081 924
Prov. Sulawesi Tenggara
Sulawesi Tenggara Prov.
2 0 1 2 1 760 10 111 199 357 478 897 461 834
2 0 1 1 1 753 10 185 254 922 678 819 057 328
2 0 1 0 1 706 10 047 252 491 551 713 430 132
2 0 0 9 1 705 9 942 172 950 255 690 116 895
2 0 0 8 1 792 10 870 152 373 694 301 296 653
2 0 0 7 1 818 11 002 95 020 245 301 296 653
Sumber/Source: Dinas Perindag Prov.Sultra/Industry and Trade Office of Sulawesi Tenggara Province Catatan/Note : Termasuk Industri Kecilnya/Including Small Scale Industry
6.1.8
Jumlah Industri Kimia, Tenaga Kerja dan Nilai Produksi menurut Kabupaten/Kota, 2012 Tabel
Table Number of Chemical Industry Production Value Employees by Dis-trict/City, 2012

INDUSTRY, MINING, ELECTRICITY AND WATER SUPPLY
259 Sulawesi Tenggara in Figures 2013
Jumlah Jumlah Investasi Nilai Produksi Kabupaten/Kota Perusahaan Tenaga Kerja Investments Production
District/City Number of Number of (000 Rp) Value
Manufacturing Employees (000 Rp)
Industry
(1) (2) (3) (4) (5)
1. B u t o n 189 1 010 8 885 816 18 147 382
2. M u n a 190 1 050 23 123 121 38 692 908
3. Konawe 110 1 086 6 442 190 12 293 772
4. Kolaka 139 1 163 28 235 529 2 928 384 076
5. Konawe Selatan 80 438 4 056 716 13 085 011
6. Bombana 90 326 2 266 618 9 448 999
7. Wakatobi 29 72 460 612 3 643 889
8. Kolaka Utara 36 74 19 419 817 4 498 103
9. Buton Utara 14 77 3 554 326 1 893 548
10. Konawe Utara 97 659 5 838 434 8 833 528
11. Kota Kendari 174 2 771 9 139 461 57 900 381
12. Kota Bau-Bau 95 708 456 155 25 467 531
Prov. Sulawesi Tenggara
Sulawesi Tenggara Prov.
2 0 1 2 1 243 9 434 111 878 795 3 122 289 128
2 0 1 1 1 240 9 695 147 102 206 324 671 467
2 0 1 0 1 223 9 504 156 564 334 2 415 726 754
2 0 0 9 1 105 6 784 119 416 805 347 726 503
2 0 0 8 1 255 7 800 113 430 497 1 030 393 650
2 0 0 7 1 269 7 815 73 457 179 946 603 297
Sumber/Source: Dinas Perindag Prov.Sultra/Industry and Trade Office of Sulawesi Tenggara Province Catatan/Note : Termasuk Industri Kecilnya/Including Small Scale Industry
6.1.9
Jumlah Industri Logam dan Mesin Tenaga Kerja dan Nilai
Produksi menurut Kabupaten/Kota, 2012 Tabel Table Number of Metal and Machinary Industry, Employees and Pro-
duction Value by District/City, 2012
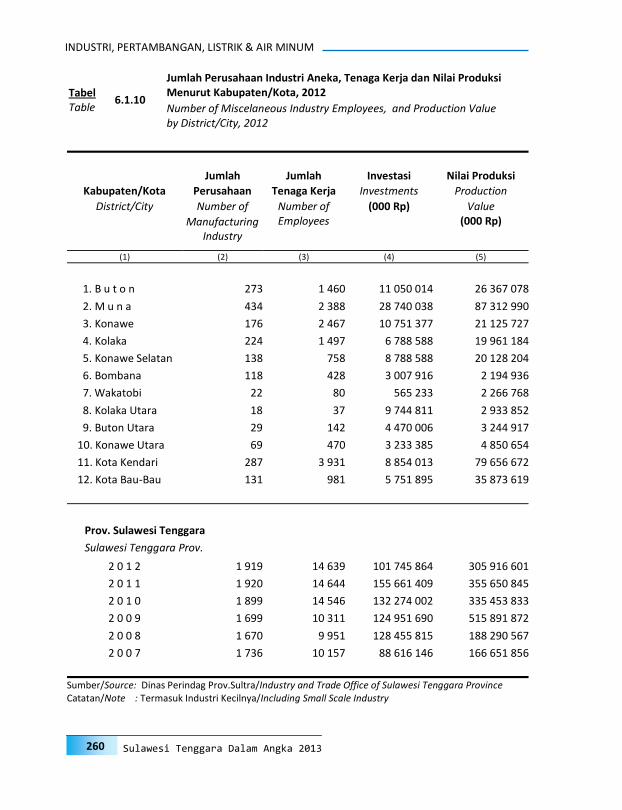
260
INDUSTRI, PERTAMBANGAN, LISTRIK & AIR MINUM
Sulawesi Tenggara Dalam Angka 2013
Jumlah Jumlah Investasi Nilai Produksi
Kabupaten/Kota Perusahaan Tenaga Kerja Investments Production
District/City Number of Number of (000 Rp) Value
Manufacturing Employees (000 Rp)
Industry
(1) (2) (3) (4) (5)
1. B u t o n 273 1 460 11 050 014 26 367 078
2. M u n a 434 2 388 28 740 038 87 312 990
3. Konawe 176 2 467 10 751 377 21 125 727
4. Kolaka 224 1 497 6 788 588 19 961 184
5. Konawe Selatan 138 758 8 788 588 20 128 204
6. Bombana 118 428 3 007 916 2 194 936
7. Wakatobi 22 80 565 233 2 266 768
8. Kolaka Utara 18 37 9 744 811 2 933 852
9. Buton Utara 29 142 4 470 006 3 244 917
10. Konawe Utara 69 470 3 233 385 4 850 654
11. Kota Kendari 287 3 931 8 854 013 79 656 672
12. Kota Bau-Bau 131 981 5 751 895 35 873 619
Prov. Sulawesi Tenggara
Sulawesi Tenggara Prov.
2 0 1 2 1 919 14 639 101 745 864 305 916 601
2 0 1 1 1 920 14 644 155 661 409 355 650 845
2 0 1 0 1 899 14 546 132 274 002 335 453 833
2 0 0 9 1 699 10 311 124 951 690 515 891 872
2 0 0 8 1 670 9 951 128 455 815 188 290 567
2 0 0 7 1 736 10 157 88 616 146 166 651 856
Sumber/Source: Dinas Perindag Prov.Sultra/Industry and Trade Office of Sulawesi Tenggara Province Catatan/Note : Termasuk Industri Kecilnya/Including Small Scale Industry
6.1.10
Jumlah Perusahaan Industri Aneka, Tenaga Kerja dan Nilai Produksi Menurut Kabupaten/Kota, 2012 Tabel
Table Number of Miscelaneous Industry Employees, and Production Value by District/City, 2012
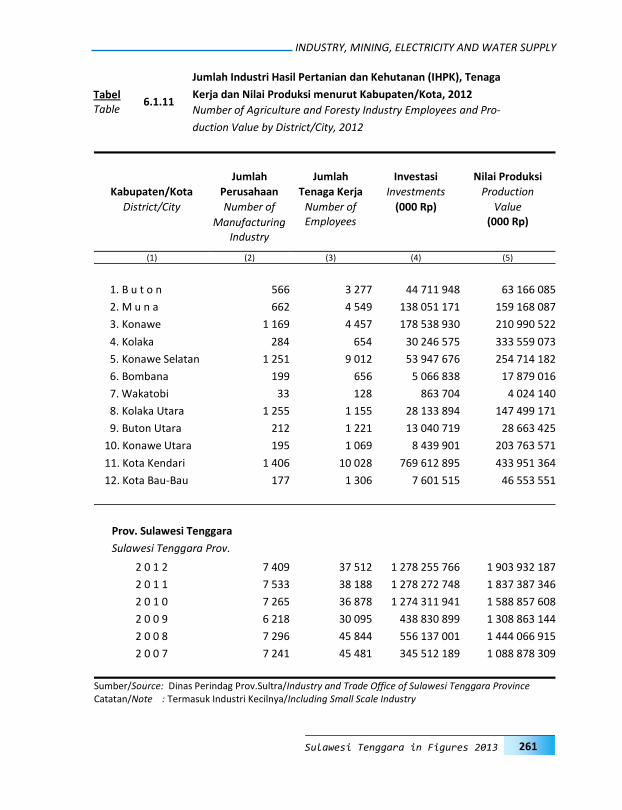
INDUSTRY, MINING, ELECTRICITY AND WATER SUPPLY
261 Sulawesi Tenggara in Figures 2013
Jumlah Jumlah Investasi Nilai Produksi
Kabupaten/Kota Perusahaan Tenaga Kerja Investments Production
District/City Number of Number of (000 Rp) Value
Manufacturing Employees (000 Rp)
Industry
(1) (2) (3) (4) (5)
1. B u t o n 566 3 277 44 711 948 63 166 085
2. M u n a 662 4 549 138 051 171 159 168 087
3. Konawe 1 169 4 457 178 538 930 210 990 522
4. Kolaka 284 654 30 246 575 333 559 073
5. Konawe Selatan 1 251 9 012 53 947 676 254 714 182
6. Bombana 199 656 5 066 838 17 879 016
7. Wakatobi 33 128 863 704 4 024 140
8. Kolaka Utara 1 255 1 155 28 133 894 147 499 171
9. Buton Utara 212 1 221 13 040 719 28 663 425
10. Konawe Utara 195 1 069 8 439 901 203 763 571
11. Kota Kendari 1 406 10 028 769 612 895 433 951 364
12. Kota Bau-Bau 177 1 306 7 601 515 46 553 551
Prov. Sulawesi Tenggara
Sulawesi Tenggara Prov.
2 0 1 2 7 409 37 512 1 278 255 766 1 903 932 187
2 0 1 1 7 533 38 188 1 278 272 748 1 837 387 346
2 0 1 0 7 265 36 878 1 274 311 941 1 588 857 608
2 0 0 9 6 218 30 095 438 830 899 1 308 863 144
2 0 0 8 7 296 45 844 556 137 001 1 444 066 915
2 0 0 7 7 241 45 481 345 512 189 1 088 878 309
Sumber/Source: Dinas Perindag Prov.Sultra/Industry and Trade Office of Sulawesi Tenggara Province Catatan/Note : Termasuk Industri Kecilnya/Including Small Scale Industry
6.1.11
Jumlah Industri Hasil Pertanian dan Kehutanan (IHPK), Tenaga
Kerja dan Nilai Produksi menurut Kabupaten/Kota, 2012 Tabel Table Number of Agriculture and Foresty Industry Employees and Pro-
duction Value by District/City, 2012

262
INDUSTRI, PERTAMBANGAN, LISTRIK & AIR MINUM
Sulawesi Tenggara Dalam Angka 2013
Jumlah Jumlah Investasi Nilai Produksi
Kabupaten/Kota Perusahaan Tenaga Kerja Investments Production
District/City Number of Number of (000 Rp) Value
Manufacturing Employees (000 Rp)
Industry
(1) (2) (3) (4) (5)
1. B u t o n 1 155 6 285 65 662 629 112 376 953
2. M u n a 1 493 8 690 119 367 929 303 061 619
3. Konawe 1 783 9 290 101 217 624 308 562 387
4. Kolaka 1 054 5 840 51 371 505 850 971 221
5. Konawe Selatan 1 720 11 567 80 906 507 339 836 161
6. Bombana 472 1 657 15 802 907 36 129 426
7. Wakatobi 97 327 6 191 672 12 369 117
8. Kolaka Utara 1 382 1 401 102 473 054 167 565 511
9. Buton Utara 306 1 729 27 830 867 40 942 990
10. Konawe Utara 440 2 767 19 286 623 268 237 381
11. Kota Kendari 1 899 16 155 669 095 336 519 218 228
12. Kota Bau-Bau 475 3 498 20 569 188 127 976 625
Prov. Sulawesi Tenggara
Sulawesi Tenggara Prov.
2 0 1 2 12 276 69 206 1 279 775 841 3 087 247 619
2 0 1 1 12 936 69 840 1 413 670 317 3 280 676 196
2 0 1 0 12 083 68 197 1 373 246 496 2 820 034 519
2 0 0 9 10 727 57 132 1 130 102 684 2 862 598 413
2 0 0 8 10 221 63 595 798 023 313 2 662 751 132
2 0 0 7 12 066 74 405 602 575 759 2 459 558 100
Sumber/Source: Dinas Perindag Prov.Sultra/Industry and Trade Office of Sulawesi Tenggara Province Catatan/Note : Termasuk Industri Kecilnya/Including Small Scale Industry
6.1.12
Jumlah Industri Kecil (Hasil Pertanian, Kehutanan, Logam dan Mesin, Industri Aneka), Tenaga Kerja dan Nilai Produksi menurut Kabupaten/Kota, 2012 Tabel
Table Number of Small Scale Industry (Agriculture, Foresty, Metal and Machinary, Miscellaneous) Employees and Production Value by District/City, 2012

INDUSTRY, MINING, ELECTRICITY AND WATER SUPPLY
263 Sulawesi Tenggara in Figures 2013
T a h u n Y e a r
Produksi Nilai Produksi (Juta Rp) Production Production Value
(Million Rupiahs)
Bijih Nikel Ferro Nikel Bijih Nikel*) Ferro Nikel*) Nickel Ore Ferro Nickel Nickel Ore Ferro Nickel
(Ton) (Ton Ni) (1) (2) (3) (4) (5)
2001 700 740 9 302 165 051 604 163
2002 969 689 -- 96 534 --
2003 1 702 267 8 279 135 287 280 628 337
2004 1 426 672 7 441 235 --*) --*)
2005 1 157 657 9 892 440 410 506 925 409
2006 1 486 442 -- 622 492 --
2007 2 499 935 1 712 147 1 204 647 245 511
2008 1 782 356 -- 303 753 --
2009 1 026 975 -- 140 673 --
2010 230 870 3 206 37 241 2 149 516
2011 1 943 383 19 690 213 414 2 571 059
2012 2 908 327 18 372 350 629 2 691 693
Sumber/Source : Dinas Pertambangan dan Energi Prov. Sultra/Mining and Energy Office of Sulawesi
Tenggara Province
6.2.1 Produksi dan Nilai Produksi Hasil Pertambangan Nikel, 2001-2012 Tabel
Table Production and Production Value of Nickel Mining, 2001-2012
6.2. Pertambangan Mining
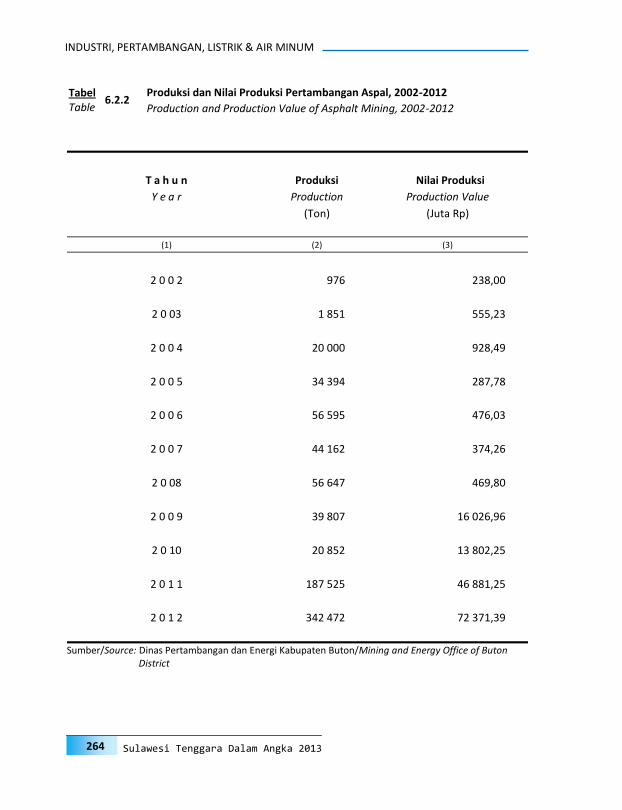
264
INDUSTRI, PERTAMBANGAN, LISTRIK & AIR MINUM
Sulawesi Tenggara Dalam Angka 2013
T a h u n Produksi Nilai Produksi
Y e a r Production Production Value
(Ton) (Juta Rp)
(1) (2) (3)
2 0 0 2 976 238,00
2 0 03 1 851 555,23
2 0 0 4 20 000 928,49
2 0 0 5 34 394 287,78
2 0 0 6 56 595 476,03
2 0 0 7 44 162 374,26
2 0 08 56 647 469,80
2 0 0 9 39 807 16 026,96
2 0 10 20 852 13 802,25
2 0 1 1 187 525 46 881,25
2 0 1 2 342 472 72 371,39
Sumber/Source: Dinas Pertambangan dan Energi Kabupaten Buton/Mining and Energy Office of Buton
District
6.2.2 Produksi dan Nilai Produksi Pertambangan Aspal, 2002-2012 Tabel
Table Production and Production Value of Asphalt Mining, 2002-2012
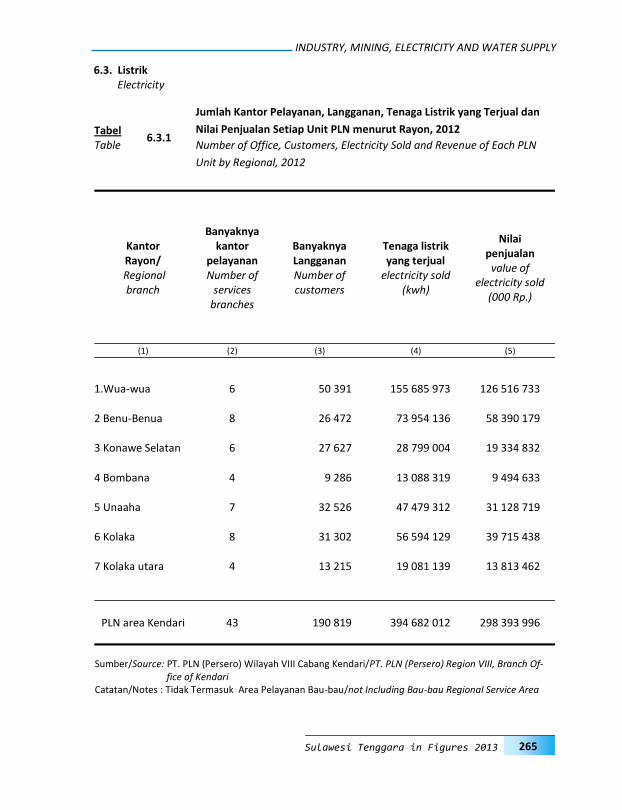
INDUSTRY, MINING, ELECTRICITY AND WATER SUPPLY
265 Sulawesi Tenggara in Figures 2013
6.3. Listrik Electricity
Kantor Rayon/
Regional branch
Banyaknya kantor
pelayanan Number of
services branches
Banyaknya Langganan Number of customers
Tenaga listrik yang terjual
electricity sold (kwh)
Nilai penjualan
value of electricity sold
(000 Rp.)
(1) (2) (3) (4) (5)
1.Wua-wua 6 50 391 155 685 973 126 516 733
2 Benu-Benua 8 26 472 73 954 136 58 390 179
3 Konawe Selatan 6 27 627 28 799 004 19 334 832
4 Bombana 4 9 286 13 088 319 9 494 633
5 Unaaha 7 32 526 47 479 312 31 128 719
6 Kolaka 8 31 302 56 594 129 39 715 438
7 Kolaka utara 4 13 215 19 081 139 13 813 462
PLN area Kendari 43 190 819 394 682 012 298 393 996
6.3.1
Jumlah Kantor Pelayanan, Langganan, Tenaga Listrik yang Terjual dan
Nilai Penjualan Setiap Unit PLN menurut Rayon, 2012 Tabel Table Number of Office, Customers, Electricity Sold and Revenue of Each PLN
Unit by Regional, 2012
Sumber/Source: PT. PLN (Persero) Wilayah VIII Cabang Kendari/PT. PLN (Persero) Region VIII, Branch Of-fice of Kendari
Catatan/Notes : Tidak Termasuk Area Pelayanan Bau-bau/not Including Bau-bau Regional Service Area
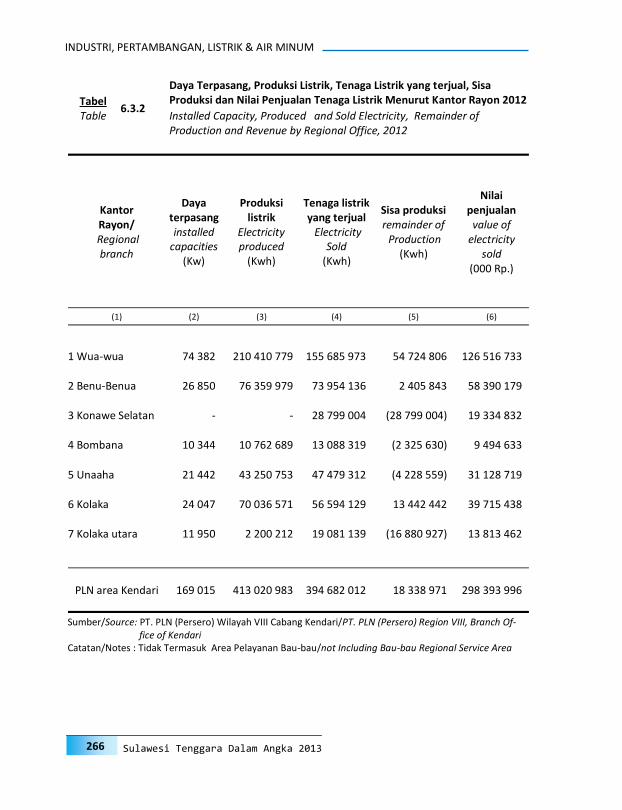
266
INDUSTRI, PERTAMBANGAN, LISTRIK & AIR MINUM
Sulawesi Tenggara Dalam Angka 2013
Kantor Rayon/
Regional branch
Daya terpasang installed
capacities (Kw)
Produksi listrik
Electricity produced
(Kwh)
Tenaga listrik yang terjual Electricity
Sold (Kwh)
Sisa produksi remainder of Production
(Kwh)
Nilai penjualan
value of electricity
sold (000 Rp.)
(1) (2) (3) (4) (5) (6)
1 Wua-wua 74 382 210 410 779 155 685 973 54 724 806 126 516 733
2 Benu-Benua 26 850 76 359 979 73 954 136 2 405 843 58 390 179
3 Konawe Selatan - - 28 799 004 (28 799 004) 19 334 832
4 Bombana 10 344 10 762 689 13 088 319 (2 325 630) 9 494 633
5 Unaaha 21 442 43 250 753 47 479 312 (4 228 559) 31 128 719
6 Kolaka 24 047 70 036 571 56 594 129 13 442 442 39 715 438
7 Kolaka utara 11 950 2 200 212 19 081 139 (16 880 927) 13 813 462
PLN area Kendari 169 015 413 020 983 394 682 012 18 338 971 298 393 996
6.3.2
Daya Terpasang, Produksi Listrik, Tenaga Listrik yang terjual, Sisa Produksi dan Nilai Penjualan Tenaga Listrik Menurut Kantor Rayon 2012 Tabel
Table Installed Capacity, Produced and Sold Electricity, Remainder of Production and Revenue by Regional Office, 2012
Sumber/Source: PT. PLN (Persero) Wilayah VIII Cabang Kendari/PT. PLN (Persero) Region VIII, Branch Of-fice of Kendari
Catatan/Notes : Tidak Termasuk Area Pelayanan Bau-bau/not Including Bau-bau Regional Service Area

INDUSTRY, MINING, ELECTRICITY AND WATER SUPPLY
267 Sulawesi Tenggara in Figures 2013
6.3.3
Daya Terpasang, Produksi Listrik, Tenaga Listrik yang terjual, Sisa Produksi dan Nilai Penjualan Tenaga Listrik Menurut Kategori Pelanggan 2012 Tabel
Table Installed Capacity, Produced and Sold Electricity, Remainder of Production and Revenue by Costumer Category, 2012
Kategori Pelanggan Costumer Category
Tenaga Listrik Yang
Terjual Total of Sold
Electricity (Kwh)
Nilai Penjualan Revenue of
Sold Electricity (000 Rp)
Jumlah Pelanggan Number of Customers
(1) (2) (3) (4)
1 Industri/Industry 84 19 972 119 15 753 660
2 Bisnis/Business*) 9 789 77 563 632 78 355 039
3 Penerangan Jalan/ 234 9 852 517 8 078 763
Road Lamp
4 Jawatan/ 1 645 16 410 839 17 215 761
Government Institution
5 Rumahtangga/ 175 367 256 354 774 167 110 139
Household
6 Sosial/Social 3 363 10 733 341 7 037 993
7 Lainnya/Others **) 337 3 794 790 4 842 641
J u m l a h/T o t a l 190 819 394 682 012 298 393 996
Sumber/Source: PT. PLN (Persero) Wilayah VIII Cabang Kendari/ PT. PLN (Persero) Region VIII, Branch
Office of Kendari Catatan/Notes : Tidak Termasuk Area Pelayanan Bau-bau/not Including Bau-bau Regional Service Area
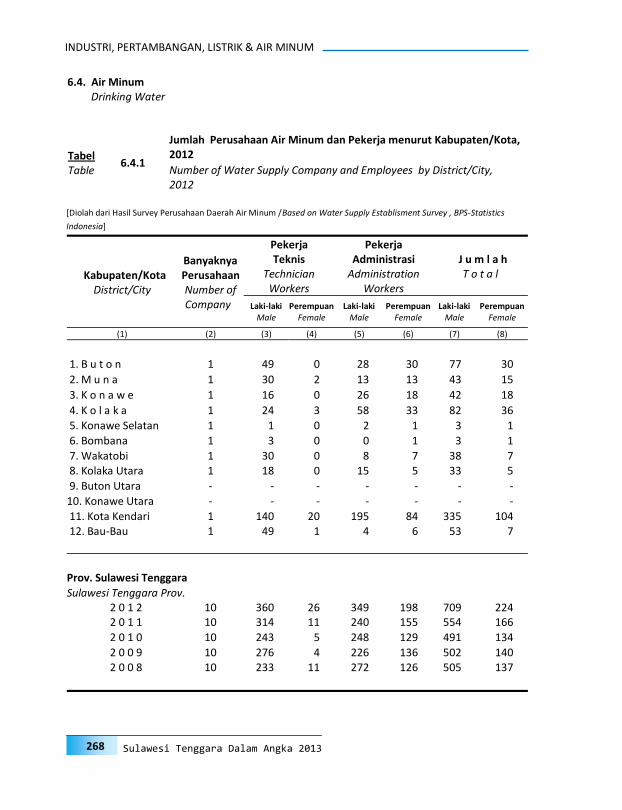
268
INDUSTRI, PERTAMBANGAN, LISTRIK & AIR MINUM
Sulawesi Tenggara Dalam Angka 2013
6.4. Air Minum Drinking Water
Kabupaten/Kota District/City
Banyaknya Perusahaan Number of Company
Pekerja Teknis
Technician Workers
Pekerja Administrasi
Administration Workers
J u m l a h T o t a l
Laki-laki Male
Perempuan Female
Laki-laki Male
Perempuan Female
Laki-laki Male
Perempuan Female
(1) (2) (3) (4) (5) (6) (7) (8)
1. B u t o n 1 49 0 28 30 77 30
2. M u n a 1 30 2 13 13 43 15
3. K o n a w e 1 16 0 26 18 42 18
4. K o l a k a 1 24 3 58 33 82 36
5. Konawe Selatan 1 1 0 2 1 3 1
6. Bombana 1 3 0 0 1 3 1
7. Wakatobi 1 30 0 8 7 38 7 8. Kolaka Utara 1 18 0 15 5 33 5
9. Buton Utara - - - - - - -
10. Konawe Utara - - - - - - -
11. Kota Kendari 1 140 20 195 84 335 104 12. Bau-Bau 1 49 1 4 6 53 7
Prov. Sulawesi Tenggara
Sulawesi Tenggara Prov. 2 0 1 2 10 360 26 349 198 709 224 2 0 1 1 10 314 11 240 155 554 166
2 0 1 0 10 243 5 248 129 491 134
2 0 0 9 10 276 4 226 136 502 140 2 0 0 8 10 233 11 272 126 505 137
6.4.1
Jumlah Perusahaan Air Minum dan Pekerja menurut Kabupaten/Kota, 2012 Tabel
Table Number of Water Supply Company and Employees by District/City, 2012
[Diolah dari Hasil Survey Perusahaan Daerah Air Minum /Based on Water Supply Establisment Survey , BPS-Statistics
Indonesia]

INDUSTRY, MINING, ELECTRICITY AND WATER SUPPLY
269 Sulawesi Tenggara in Figures 2013
Kategori Pelanggan Type of Customers
2 0 0 9 2 0 1 0 2 0 1 1 2 0 1 2
(1) (2) (3) (4) (5)
1. Rumah tempat tinggal/ 35 064 48 420 57 874 64 899 Residence
2. Hotel dan Obyek Pariwisata, 10 414 1 918 2 824 2 581 Toko,Perusahaan & Industri/ Hotels and Tourism Resort, Shops, Company and Industry
3. Badan-badan Sosial, Rumah 620 691 923 822 sakit dan Umum/Social Instution, Hospital and Public
4. Instansi Pemerintah 1 176 5 206 987 1 569 Goverment Institutions
5. Lain-lain/Others 5 091 386 1 80
Jumlah / Total 52 365 56 621 62 609 69 951
6.4.2 Jumlah Pelanggan Air Minum menurut Kategori Pelanggan, 2009-2012 Tabel
Table Number Customers of Water Supply Establishment Type of by Customers,
2009-2012
[Diolah dari Hasil Survey Perusahaan Daerah Air Minum /Based on Water Supply Establisment Survey , BPS-Statistics
Indonesia]
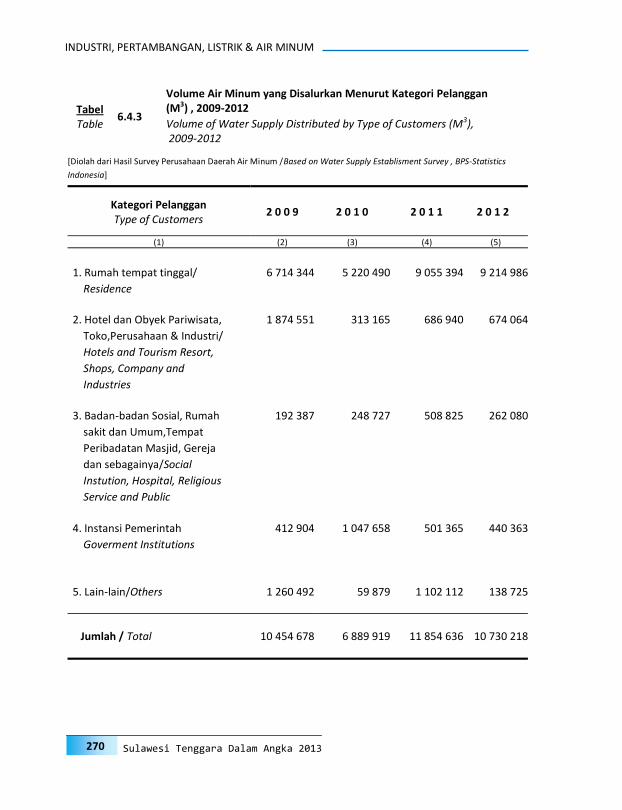
270
INDUSTRI, PERTAMBANGAN, LISTRIK & AIR MINUM
Sulawesi Tenggara Dalam Angka 2013
Kategori Pelanggan Type of Customers
2 0 0 9 2 0 1 0 2 0 1 1 2 0 1 2
(1) (2) (3) (4) (5)
1. Rumah tempat tinggal/ 6 714 344 5 220 490 9 055 394 9 214 986
Residence
2. Hotel dan Obyek Pariwisata, 1 874 551 313 165 686 940 674 064
Toko,Perusahaan & Industri/
Hotels and Tourism Resort,
Shops, Company and
Industries
3. Badan-badan Sosial, Rumah 192 387 248 727 508 825 262 080
sakit dan Umum,Tempat
Peribadatan Masjid, Gereja
dan sebagainya/Social
Instution, Hospital, Religious
Service and Public
4. Instansi Pemerintah 412 904 1 047 658 501 365 440 363
Goverment Institutions
5. Lain-lain/Others 1 260 492 59 879 1 102 112 138 725
Jumlah / Total 10 454 678 6 889 919 11 854 636 10 730 218
6.4.3
Volume Air Minum yang Disalurkan Menurut Kategori Pelanggan (M3) , 2009-2012 Tabel
Table Volume of Water Supply Distributed by Type of Customers (M3), 2009-2012
[Diolah dari Hasil Survey Perusahaan Daerah Air Minum /Based on Water Supply Establisment Survey , BPS-Statistics
Indonesia]
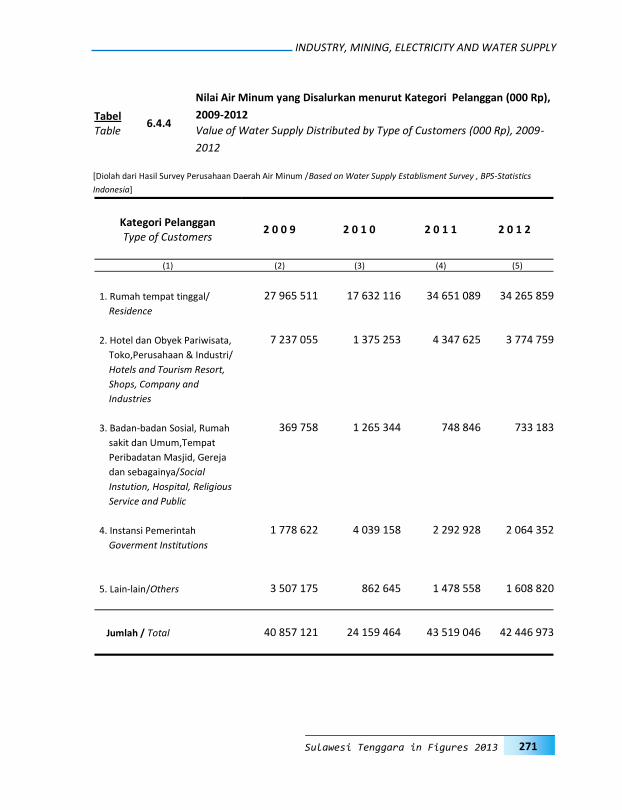
INDUSTRY, MINING, ELECTRICITY AND WATER SUPPLY
271 Sulawesi Tenggara in Figures 2013
Kategori Pelanggan Type of Customers
2 0 0 9 2 0 1 0 2 0 1 1 2 0 1 2
(1) (2) (3) (4) (5)
1. Rumah tempat tinggal/ 27 965 511 17 632 116 34 651 089 34 265 859 Residence
2. Hotel dan Obyek Pariwisata, 7 237 055 1 375 253 4 347 625 3 774 759 Toko,Perusahaan & Industri/
Hotels and Tourism Resort,
Shops, Company and
Industries
3. Badan-badan Sosial, Rumah 369 758 1 265 344 748 846 733 183 sakit dan Umum,Tempat
Peribadatan Masjid, Gereja
dan sebagainya/Social
Instution, Hospital, Religious
Service and Public
4. Instansi Pemerintah 1 778 622 4 039 158 2 292 928 2 064 352 Goverment Institutions
5. Lain-lain/Others 3 507 175 862 645 1 478 558 1 608 820
Jumlah / Total 40 857 121 24 159 464 43 519 046 42 446 973
6.4.4
Nilai Air Minum yang Disalurkan menurut Kategori Pelanggan (000 Rp),
2009-2012 Tabel Table Value of Water Supply Distributed by Type of Customers (000 Rp), 2009-
2012
[Diolah dari Hasil Survey Perusahaan Daerah Air Minum /Based on Water Supply Establisment Survey , BPS-Statistics
Indonesia]
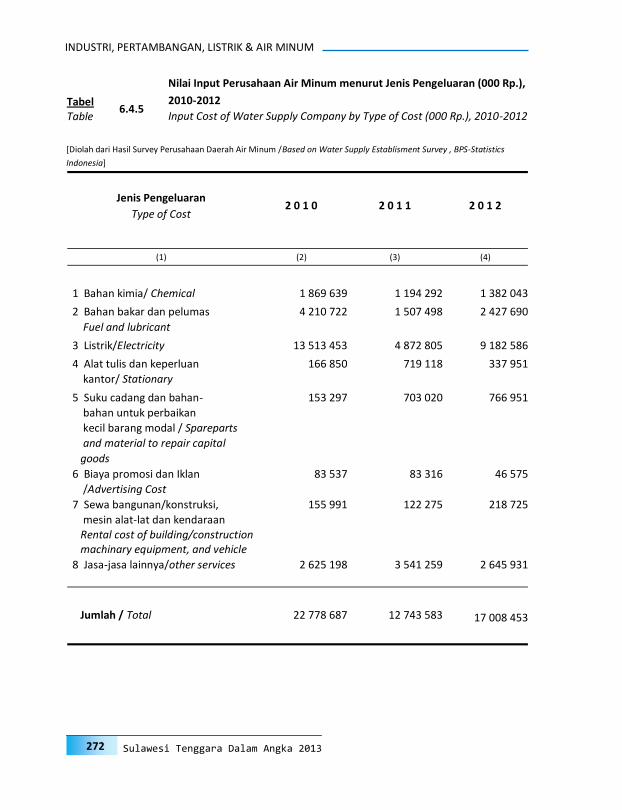
272
INDUSTRI, PERTAMBANGAN, LISTRIK & AIR MINUM
Sulawesi Tenggara Dalam Angka 2013
Jenis Pengeluaran
2 0 1 0 2 0 1 1 2 0 1 2 Type of Cost
(1) (2) (3) (4)
1 Bahan kimia/ Chemical 1 869 639 1 194 292 1 382 043
2 Bahan bakar dan pelumas 4 210 722 1 507 498 2 427 690
Fuel and lubricant
3 Listrik/Electricity 13 513 453 4 872 805 9 182 586
4 Alat tulis dan keperluan 166 850 719 118 337 951
kantor/ Stationary
5 Suku cadang dan bahan- 153 297 703 020 766 951
bahan untuk perbaikan
kecil barang modal / Spareparts
and material to repair capital
goods
6 Biaya promosi dan Iklan 83 537 83 316 46 575
/Advertising Cost
7 Sewa bangunan/konstruksi, 155 991 122 275 218 725
mesin alat-lat dan kendaraan Rental cost of building/construction machinary equipment, and vehicle
8 Jasa-jasa lainnya/other services 2 625 198 3 541 259 2 645 931
Jumlah / Total 22 778 687 12 743 583 17 008 453
6.4.5
Nilai Input Perusahaan Air Minum menurut Jenis Pengeluaran (000 Rp.),
2010-2012 Tabel Table Input Cost of Water Supply Company by Type of Cost (000 Rp.), 2010-2012
[Diolah dari Hasil Survey Perusahaan Daerah Air Minum /Based on Water Supply Establisment Survey , BPS-Statistics
Indonesia]
T R A D EPERDAGANGAN7
TRADE
275 Sulawesi Tenggara in Figures 2013
PENJELASAN TEKNIS
1. Sistem pencatatan Statistik Ekspor dan Impor adalah "General Trade" dengan wilayah pencatatan meliputi seluruh wilayah kepabeanan Indonesia. Sebelum tahun 2008, sistem pencatatan Statistik Impor adalah "Special Trade" dengan wilayah pencatatan meliputi seluruh wilayah kepabeanan Indonesia kecuali Kawasan Berikat yang dianggap/diperlakukan sebagai luar negeri.
2. Pengesahan dokumen kepabeanan ekspor
dan impor dilakukan oleh Bea dan Cukai berdasarkan Persetujuan Muat/Bongkar Barang.
3. Data ekspor berasal dari dokumen kepabeanan BC 3.0 atau yang disebut dokumen Pemberitahuan Ekspor Barang (PEB) yang diisi oleh eksportir.
4. Data impor berasal dari dokumen
kepabeanan BC 2.0 atau yang disebut dokumen Pemberitahuan Impor Barang (PIB) dan dokumen kepabeanan BC 2.3 yang mencatat impor barang dari Luar Negeri ke Kawasan Berikat.
5. Barang-barang yang dikirim keluar negeri
untuk diolah dicatat sebagai ekspor, se-dangkan hasil olahan yang dikembalikan ke Indonesia dicatat sebagai impor.
6. Barang-barang luar negeri yang diolah di
dalam negeri dicatat sebagai barang im-por meskipun barang olahan tersebut akan kembali keluar negeri.
7. Barang-barang yang tidak dicakup dalam pencatatan :
TECHNICAL NOTES
1. The recording of Export and Import Statistics is based on General Trade System covering all Indonesian cus-toms areas. Before 2008, the record-ing of import statistics is based on Special Trade System, which covers all Indonesian customs areas except bounded zone, which are regarded as "abroad".
2. The legalization of customs export and
import documents is conducted by the Customs and Excise Office.
3. The export data are compiled based
on customs export documents BC 3.0 or known as Export Declarations (PEB), filled by exporters.
4. The import data are compiled based
on customs import documents BC 2.0 or known as Import Declarations Form (PIB) and customs import documents BC 2.3 which records import goods from foreign country to Bounded Zones Area.
5. Goods sent abroad for processing
purposes are recorded as export while its product sent to Indonesia are rec-orded as import.
6. Foreign goods processed in Indonesia are still recorded as imports although the products will be sent to abroad.
7. The following goods are not included in the statistics:

PERDAGANGAN
276 Sulawesi Tenggara Dalam Angka 2013
a. Pakaian dan barang-barang perhia-san penumpang.
b. Barang-barang bawaan penumpang dari luar negeri untuk dipakai sendiri, kecuali lemari es, pesawat televise dan sebagainya.
c. Barang-barang untuk keperluan per-wakilan kedutaan suatu negara.
d. Barang-barang ekspedisi dan ekshibisi atau pameran.
e. Barang-barang untuk militer, yang diimpor langsung oleh angkatan bersenjata
f. Pembungkus/peti kemas untuk diisi kembali.
g. Uang dan surat-surat berharga. h. Barang-barang contoh
8. Sistem pengolahan dokumen impor/ekspor Indonesia adalah sistem "Carry Over" yaitu dokumen ditunggu selama satu bulan, setelah bulan berjalan, se-dangkan dokumen-dokumen yang terlam-bat akan diolah pada bulan berikutnya.
Dengan demikian dokumen bulan-bulan sebelumnya yang terlambat diterima dan masuk pada bulan berjalan, diperlakukan sebagai dokumen bulan pengolahan.
9. Negara utama adalah negara yang
mempunyai nilai ekspor/importer besar. 10. Pelabuhan utama adalah pelabuhan yang
mempunyai nilai ekspor/impor terbesar.
11. Ekspor, Jika dilihat peranan setiap sektor ekonomi/jenis komoditas ekspor terhadap total nilai ekspor, maka komoditi yang dominan adalah sektor pertambangan dan hasil perkebunan.
a. Clothings and passengers' jewel-ry.
b. Luggage of passengers for own use, except refrigerators, televi-sion sets, etc.
c. Goods imported for the use of foreign representative coun-tries/embassies.
d. Goods for expeditions, and shows or exhibitions.
e. Military goods directly imported by the Armed Forces.
f. Packings/containers to be re-filled.
g. Bank notes and securities h. Sample goods
8. The carry-over system is used in pro-cessing Indonesian export and import documents. Documents are processed one month after the current month, while those received later will be pro-cessed for the succeeding month.
This means previous documents re-ceived in the current month will be treated as processed documents.
9. Major country is country which record-
ed the biggest of export or import value.
10. Major port is port which recorded the
biggest of export or import value.
11. Export, If you see the role of each economic sector / type of commodity exports to total export value, then the dominant commodity is mining and plantation products sector.

TRADE
277 Sulawesi Tenggara in Figures 2013
12. Perdagangan Antar Pulau Dalam kegiatan perdagangan antar pulau,
barang-barang yang diperdagangkan di Sulawesi Tenggara terdiri dari dua kelompok. Kelompok pertama adalah komoditas hasil bumi yang meliputi: hasil pertanian, perkebunan, peternakan dan hasil hutan. Sedangkan kelompok kedua adalah komoditas hasil laut, yang meliputi ikan dan hasil-hasil laut lainnya.
12. Inter Island Trade In the inter is land trade, the traded
goods in Sulawesi Tenggara consist of two groups. The first group is a crops commodity which includes agriculture, estate crop, animal husbandry and forest products. Whereas the second group is the sea product commodities, including fish and other sea products.
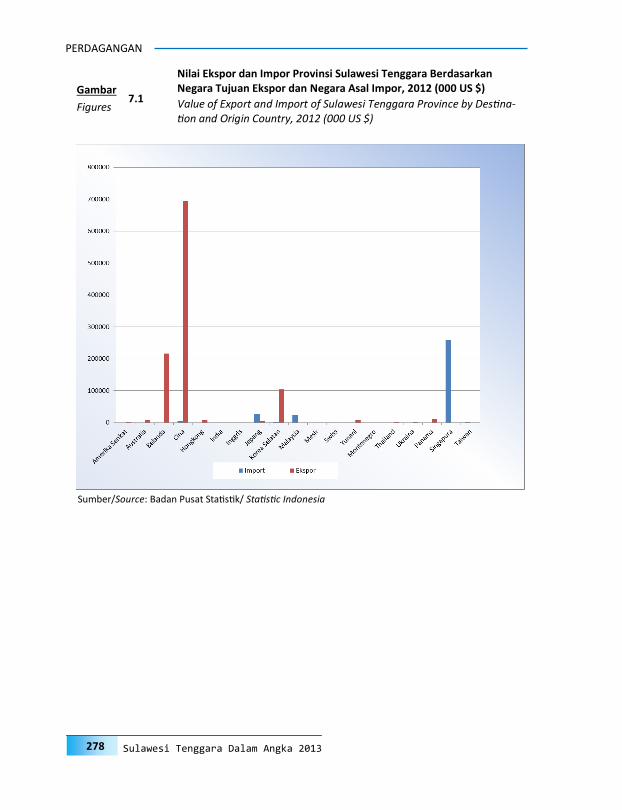
PERDAGANGAN
278 Sulawesi Tenggara Dalam Angka 2013
7.1
Nilai Ekspor dan Impor Provinsi Sulawesi Tenggara Berdasarkan Negara Tujuan Ekspor dan Negara Asal Impor, 2012 (000 US $) Gambar
Figures Value of Export and Import of Sulawesi Tenggara Province by Destina-tion and Origin Country, 2012 (000 US $)
Sumber/Source: Badan Pusat Statistik/ Statistic Indonesia
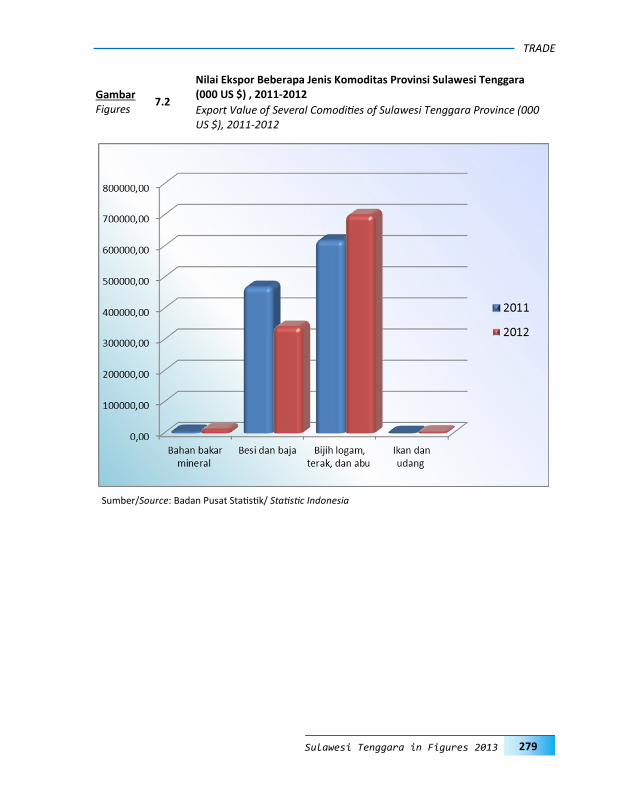
TRADE
279 Sulawesi Tenggara in Figures 2013
7.2
Nilai Ekspor Beberapa Jenis Komoditas Provinsi Sulawesi Tenggara (000 US $) , 2011-2012 Gambar
Figures Export Value of Several Comodities of Sulawesi Tenggara Province (000 US $), 2011-2012
Sumber/Source: Badan Pusat Statistik/ Statistic Indonesia

PERDAGANGAN
280 Sulawesi Tenggara Dalam Angka 2013
7.3
Persentase Nilai Perdagangan Antar Pulau Menurut Jenis Komoditas , 2012 Gambar
Figures Percentage of Value of Interisland Trade by Kind of Commodity, 2012
Sumber/Source: Badan Pusat Statistik/ Statistic Indonesia
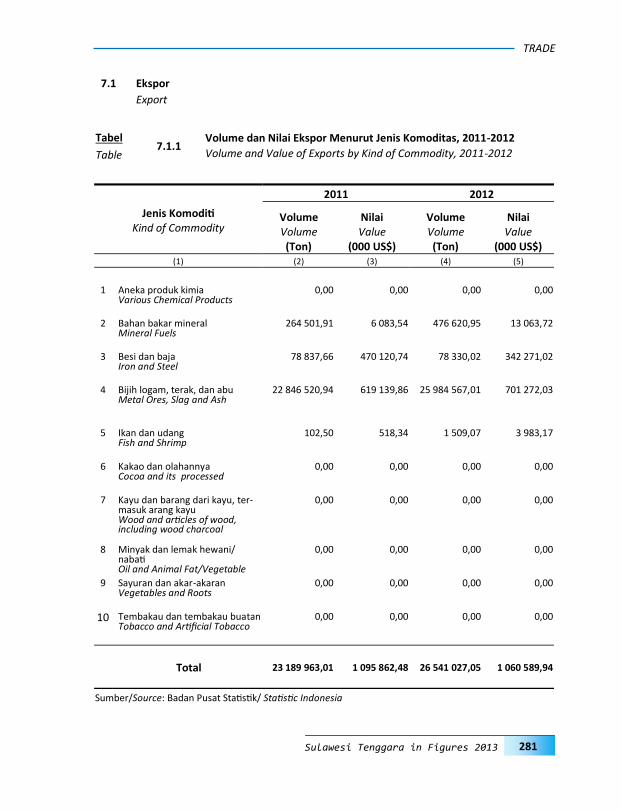
TRADE
281 Sulawesi Tenggara in Figures 2013
Jenis Komoditi Kind of Commodity
2011 2012
Volume Volume (Ton)
Nilai Value
(000 US$)
Volume Volume (Ton)
Nilai Value
(000 US$) (1) (2) (3) (4) (5)
1 Aneka produk kimia
Various Chemical Products 0,00 0,00 0,00 0,00
2 Bahan bakar mineral Mineral Fuels
264 501,91 6 083,54 476 620,95 13 063,72
3 Besi dan baja Iron and Steel
78 837,66 470 120,74 78 330,02 342 271,02
4 Bijih logam, terak, dan abu Metal Ores, Slag and Ash
22 846 520,94 619 139,86 25 984 567,01 701 272,03
5 Ikan dan udang Fish and Shrimp
102,50 518,34 1 509,07 3 983,17
6 Kakao dan olahannya Cocoa and its processed
0,00 0,00 0,00 0,00
7 Kayu dan barang dari kayu, ter-masuk arang kayu Wood and articles of wood, including wood charcoal
0,00 0,00 0,00 0,00
8 Minyak dan lemak hewani/nabati Oil and Animal Fat/Vegetable
0,00 0,00 0,00 0,00
9 Sayuran dan akar-akaran Vegetables and Roots
0,00 0,00 0,00 0,00
10 Tembakau dan tembakau buatan Tobacco and Artificial Tobacco
0,00 0,00 0,00 0,00
Total 23 189 963,01 1 095 862,48 26 541 027,05 1 060 589,94
7.1.1 Volume dan Nilai Ekspor Menurut Jenis Komoditas, 2011-2012 Tabel
Table Volume and Value of Exports by Kind of Commodity, 2011-2012
Sumber/Source: Badan Pusat Statistik/ Statistic Indonesia
7.1 Ekspor
Export
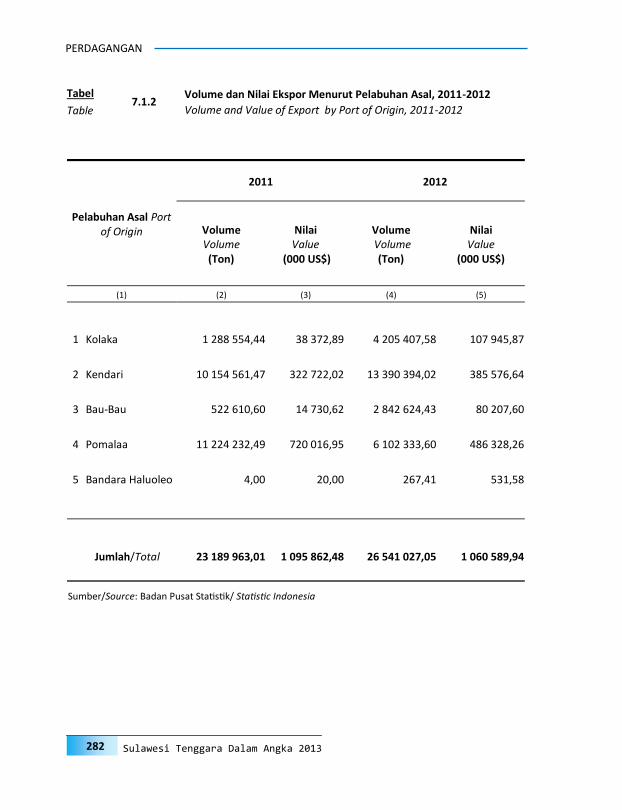
PERDAGANGAN
282 Sulawesi Tenggara Dalam Angka 2013
Pelabuhan Asal Port of Origin
2011 2012
Volume Volume (Ton)
Nilai Value
(000 US$)
Volume Volume
(Ton)
Nilai Value
(000 US$)
(1) (2) (3) (4) (5)
1 Kolaka 1 288 554,44 38 372,89 4 205 407,58 107 945,87
2 Kendari 10 154 561,47 322 722,02 13 390 394,02 385 576,64
3 Bau-Bau 522 610,60 14 730,62 2 842 624,43 80 207,60
4 Pomalaa 11 224 232,49 720 016,95 6 102 333,60 486 328,26
5 Bandara Haluoleo 4,00 20,00 267,41 531,58
Jumlah/Total 23 189 963,01 1 095 862,48 26 541 027,05 1 060 589,94
Sumber/Source: Badan Pusat Statistik/ Statistic Indonesia
7.1.2 Volume dan Nilai Ekspor Menurut Pelabuhan Asal, 2011-2012 Tabel
Table Volume and Value of Export by Port of Origin, 2011-2012
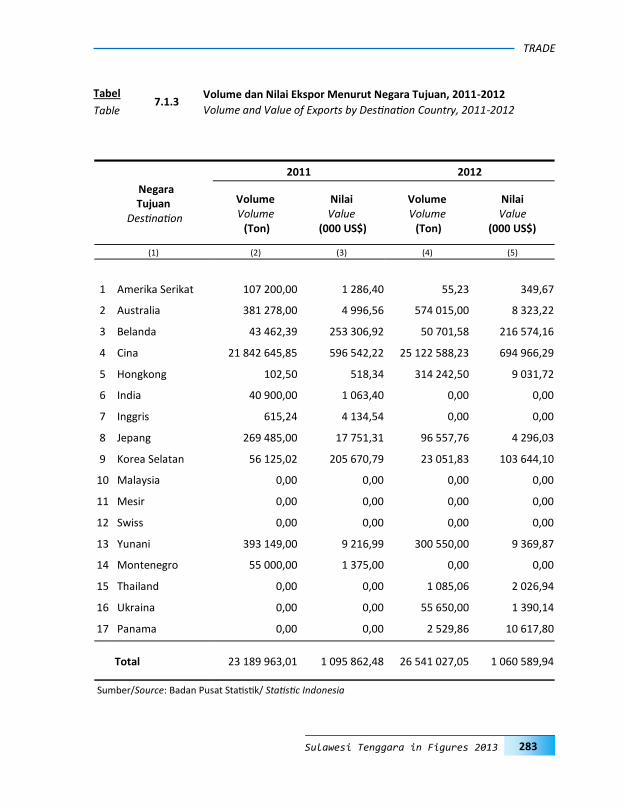
TRADE
283 Sulawesi Tenggara in Figures 2013
2011 2012
Negara Tujuan
Destination
Volume Volume (Ton)
Nilai Value
(000 US$)
Volume Volume (Ton)
Nilai Value
(000 US$)
(1) (2) (3) (4) (5)
1 Amerika Serikat 107 200,00 1 286,40 55,23 349,67
2 Australia 381 278,00 4 996,56 574 015,00 8 323,22
3 Belanda 43 462,39 253 306,92 50 701,58 216 574,16
4 Cina 21 842 645,85 596 542,22 25 122 588,23 694 966,29
5 Hongkong 102,50 518,34 314 242,50 9 031,72
6 India 40 900,00 1 063,40 0,00 0,00
7 Inggris 615,24 4 134,54 0,00 0,00
8 Jepang 269 485,00 17 751,31 96 557,76 4 296,03
9 Korea Selatan 56 125,02 205 670,79 23 051,83 103 644,10
10 Malaysia 0,00 0,00 0,00 0,00
11 Mesir 0,00 0,00 0,00 0,00
12 Swiss 0,00 0,00 0,00 0,00
13 Yunani 393 149,00 9 216,99 300 550,00 9 369,87
14 Montenegro 55 000,00 1 375,00 0,00 0,00
15 Thailand 0,00 0,00 1 085,06 2 026,94
16 Ukraina 0,00 0,00 55 650,00 1 390,14
17 Panama 0,00 0,00 2 529,86 10 617,80
Total 23 189 963,01 1 095 862,48 26 541 027,05 1 060 589,94
7.1.3 Volume dan Nilai Ekspor Menurut Negara Tujuan, 2011-2012 Tabel
Table Volume and Value of Exports by Destination Country, 2011-2012
Sumber/Source: Badan Pusat Statistik/ Statistic Indonesia
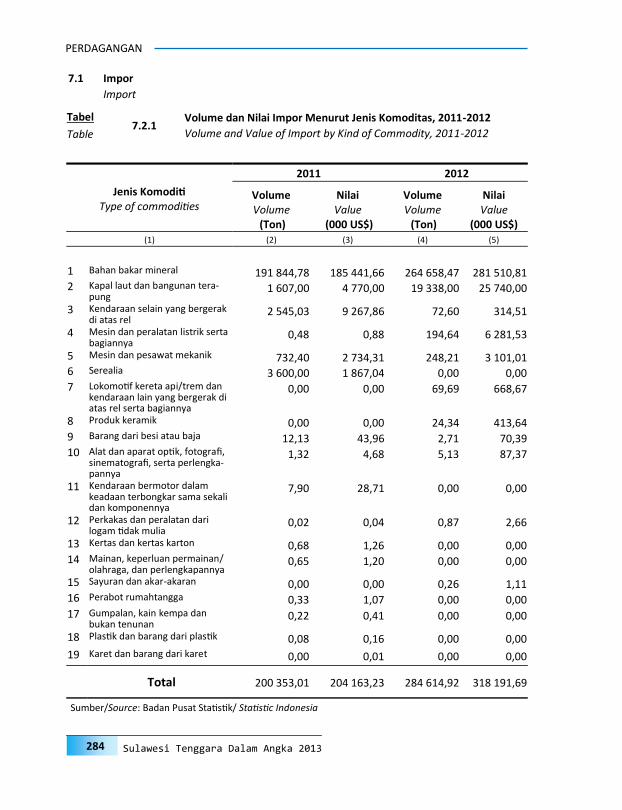
PERDAGANGAN
284 Sulawesi Tenggara Dalam Angka 2013
2011 2012
Jenis Komoditi Type of commodities
Volume Volume (Ton)
Nilai Value
(000 US$)
Volume Volume (Ton)
Nilai Value
(000 US$) (1) (2) (3) (4) (5)
1 Bahan bakar mineral 191 844,78 185 441,66 264 658,47 281 510,81 2 Kapal laut dan bangunan tera-
pung 1 607,00 4 770,00 19 338,00 25 740,00
3 Kendaraan selain yang bergerak di atas rel
2 545,03 9 267,86 72,60 314,51
4 Mesin dan peralatan listrik serta bagiannya
0,48 0,88 194,64 6 281,53
5 Mesin dan pesawat mekanik 732,40 2 734,31 248,21 3 101,01 6 Serealia 3 600,00 1 867,04 0,00 0,00 7 Lokomotif kereta api/trem dan
kendaraan lain yang bergerak di atas rel serta bagiannya
0,00 0,00 69,69 668,67
8 Produk keramik 0,00 0,00 24,34 413,64 9 Barang dari besi atau baja 12,13 43,96 2,71 70,39 10 Alat dan aparat optik, fotografi,
sinematografi, serta perlengka-pannya
1,32 4,68 5,13 87,37
11 Kendaraan bermotor dalam keadaan terbongkar sama sekali dan komponennya
7,90 28,71 0,00 0,00
12 Perkakas dan peralatan dari logam tidak mulia
0,02 0,04 0,87 2,66
13 Kertas dan kertas karton 0,68 1,26 0,00 0,00 14 Mainan, keperluan permainan/
olahraga, dan perlengkapannya 0,65 1,20 0,00 0,00
15 Sayuran dan akar-akaran 0,00 0,00 0,26 1,11 16 Perabot rumahtangga 0,33 1,07 0,00 0,00 17 Gumpalan, kain kempa dan
bukan tenunan 0,22 0,41 0,00 0,00
18 Plastik dan barang dari plastik 0,08 0,16 0,00 0,00
19 Karet dan barang dari karet 0,00 0,01 0,00 0,00
Total 200 353,01 204 163,23 284 614,92 318 191,69
7.2.1 Volume dan Nilai Impor Menurut Jenis Komoditas, 2011-2012 Tabel
Table Volume and Value of Import by Kind of Commodity, 2011-2012
Sumber/Source: Badan Pusat Statistik/ Statistic Indonesia
7.1 Impor
Import

TRADE
285 Sulawesi Tenggara in Figures 2013
Pelabuhan Masuk Port of Origin
2011 2012
Volume Volume (Ton)
Nilai Value
(000 US$)
Volume Volume
(Ton)
Nilai Value
(000 US$)
(1) (2) (3) (4) (5)
1 Bau-Bau 186 129,65 182 112,05 264 658,47 281 510,81
2 Kendari 14 223,36 22 051,19 1 294,19 4 754,62
3 Pomalaa 0,00 0,00 18 650,46 31 890,04
4 Kolaka 0,00 0,00 11,81 36,23
Jumlah/Total 200 353,01 204 163,23 284 614,92 318 191,69
Sumber/Source: Badan Pusat Statistik/ Statistic Indonesia
7.2.2 Volume dan Nilai Impor Menurut Pelabuhan Masuk, 2011-2012 Tabel
Table Volume and Value of Import by Entry Port, 2011-2012
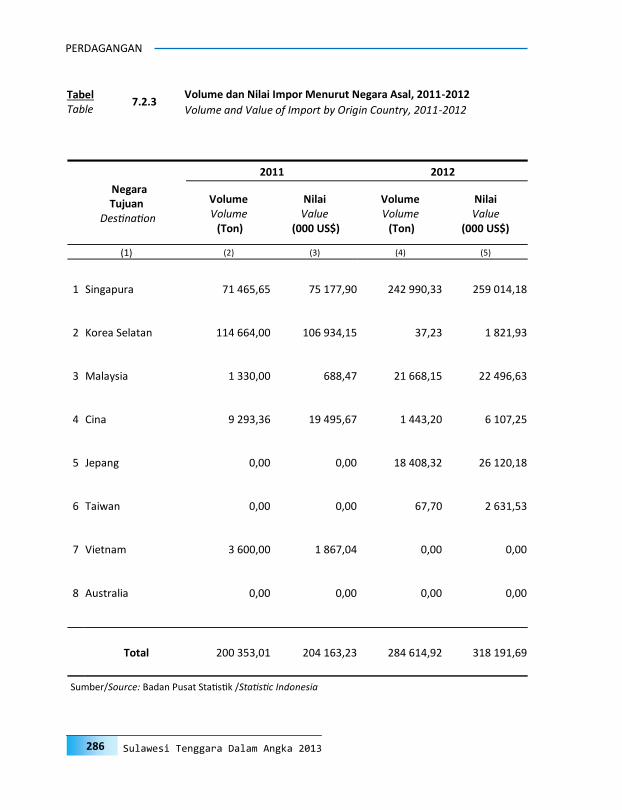
PERDAGANGAN
286 Sulawesi Tenggara Dalam Angka 2013
Negara Tujuan
Destination
2011 2012
Volume Volume (Ton)
Nilai Value
(000 US$)
Volume Volume (Ton)
Nilai Value
(000 US$)
(1) (2) (3) (4) (5)
1 Singapura 71 465,65 75 177,90 242 990,33 259 014,18
2 Korea Selatan 114 664,00 106 934,15 37,23 1 821,93
3 Malaysia 1 330,00 688,47 21 668,15 22 496,63
4 Cina 9 293,36 19 495,67 1 443,20 6 107,25
5 Jepang 0,00 0,00 18 408,32 26 120,18
6 Taiwan 0,00 0,00 67,70 2 631,53
7 Vietnam 3 600,00 1 867,04 0,00 0,00
8 Australia 0,00 0,00 0,00 0,00
Total 200 353,01 204 163,23 284 614,92 318 191,69
7.2.3 Volume dan Nilai Impor Menurut Negara Asal, 2011-2012 Tabel
Table Volume and Value of Import by Origin Country, 2011-2012
Sumber/Source: Badan Pusat Statistik /Statistic Indonesia
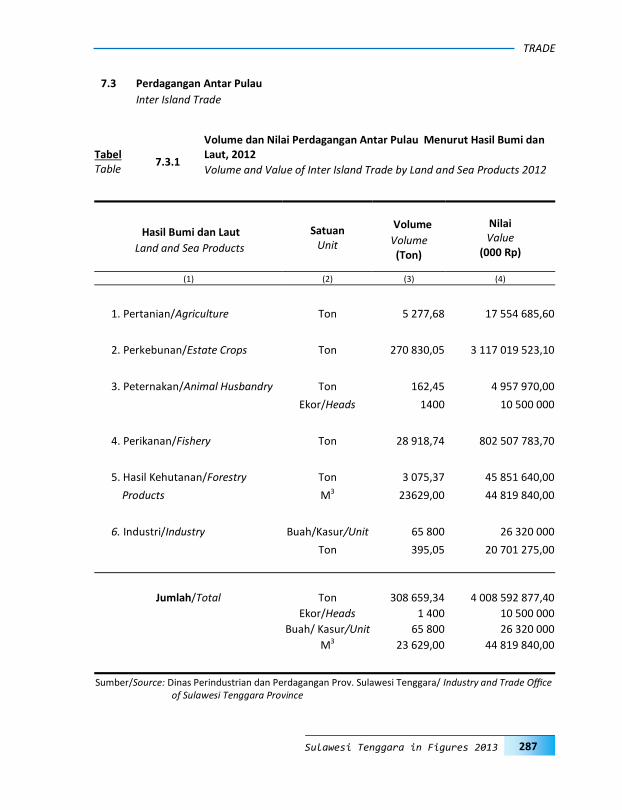
TRADE
287 Sulawesi Tenggara in Figures 2013
Satuan
Unit
Volume
Volume (Ton)
Nilai Value
(000 Rp)
Hasil Bumi dan Laut
Land and Sea Products
(1) (2) (3) (4)
1. Pertanian/Agriculture Ton 5 277,68 17 554 685,60
2. Perkebunan/Estate Crops Ton 270 830,05 3 117 019 523,10
3. Peternakan/Animal Husbandry Ton 162,45 4 957 970,00
Ekor/Heads 1400 10 500 000
4. Perikanan/Fishery Ton 28 918,74 802 507 783,70
5. Hasil Kehutanan/Forestry Ton 3 075,37 45 851 640,00
Products M3 23629,00 44 819 840,00
6. Industri/Industry Buah/Kasur/Unit 65 800 26 320 000
Ton 395,05 20 701 275,00
Jumlah/Total Ton 308 659,34 4 008 592 877,40
Ekor/Heads 1 400 10 500 000
Buah/ Kasur/Unit 65 800 26 320 000
M3 23 629,00 44 819 840,00
Sumber/Source: Dinas Perindustrian dan Perdagangan Prov. Sulawesi Tenggara/ Industry and Trade Office of Sulawesi Tenggara Province
7.3.1
Volume dan Nilai Perdagangan Antar Pulau Menurut Hasil Bumi dan Laut, 2012 Tabel
Table Volume and Value of Inter Island Trade by Land and Sea Products 2012
7.3 Perdagangan Antar Pulau
Inter Island Trade

PERDAGANGAN
288 Sulawesi Tenggara Dalam Angka 2013
Jenis Barang S a t u a n Volume Nilai
Kind of Commodity U n i t Volume Value
(Ton) (000 Rp)
(1) (2) (3) (4)
1. Kacang Kedelai/Soybeans T o n 44,44 355 544
2. Kacang Hijau/Green peas T o n 69,52 521 415
3. Kacang Tanah Gelondongan/ T o n 13,44 33 610
Peanuts
4. Kacang Tanah Kupas/ T o n 60,63 151 580
Peeled Peanuts
5. Beras/Rice T o n 286,50 1 933 875
6. Bawang Merah/Shallot T o n 5,17 82 722
7. Bawang Putih/Garlic T o n 0,00 0
8. Jeruk/Orange T o n 386,52 1 546 064
9. Dedak/Bran T o n 0,00 0
10. Beras Ketan/Glutinous Rice T o n 171,08 996 440
11. Jagung/Maize T o n 869,88 3 479 520
12. Gaplek/Dried Cassava T o n 689,04 2 067 120
13. Sagu/Meroxylon Sago T o n 2 646,08 3 969 119
14. Ubi Jalar/Sweet Potatoes T o n 1,18 2 366 400
15. Pisang/Banana T o n 32,41 48 621
16. Labu/Pumpkin T o n 1,77 2 657
Jumlah/Total
2 0 1 2 T o n 5 277,68 17 554 686
2 0 1 1 T o n 2 793,88 19 146 530
2 0 1 0 T o n 2 248,98 15 930 914
2 0 0 9 T o n 5 903,35 12 550 479
2 0 0 8 T o n 5 735,75 10 566 476
Sumber/Source: Dinas Perindustrian dan Perdagangan Prov. Sulawesi Tenggara/ Industry and Trade
Office of Sulawesi Tenggara Province
7.3.2
Volume dan Nilai Perdagangan Antar Pulau Tanaman Pangan Menurut
Jenis Barang, 2012 Tabel
Table Volume and Value of Inter Island Trade of Food Crops by Kind of Commodity, 2012
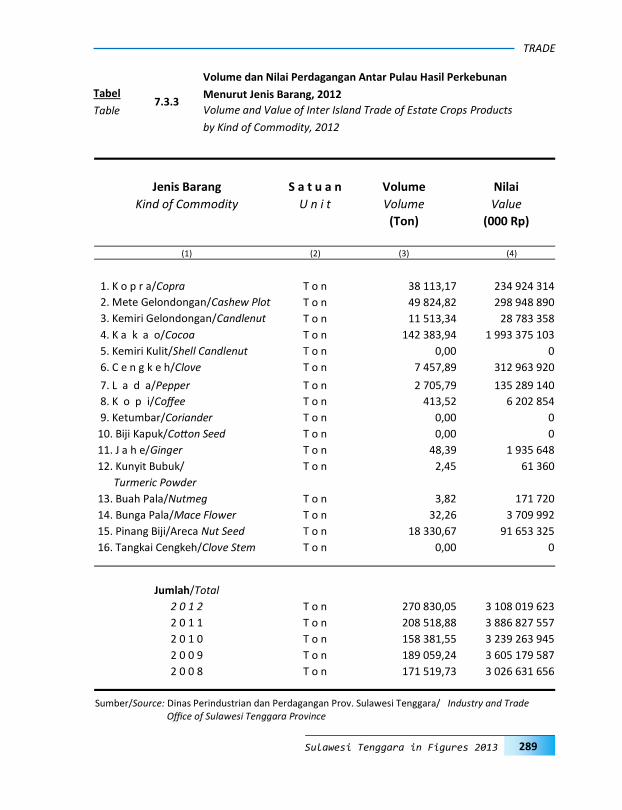
TRADE
289 Sulawesi Tenggara in Figures 2013
Jenis Barang S a t u a n Volume Nilai
Kind of Commodity U n i t Volume Value
(Ton) (000 Rp)
(1) (2) (3) (4)
1. K o p r a/Copra T o n 38 113,17 234 924 314
2. Mete Gelondongan/Cashew Plot T o n 49 824,82 298 948 890
3. Kemiri Gelondongan/Candlenut T o n 11 513,34 28 783 358
4. K a k a o/Cocoa T o n 142 383,94 1 993 375 103
5. Kemiri Kulit/Shell Candlenut T o n 0,00 0
6. C e n g k e h/Clove T o n 7 457,89 312 963 920
7. L a d a/Pepper T o n 2 705,79 135 289 140
8. K o p i/Coffee T o n 413,52 6 202 854
9. Ketumbar/Coriander T o n 0,00 0
10. Biji Kapuk/Cotton Seed T o n 0,00 0
11. J a h e/Ginger T o n 48,39 1 935 648
12. Kunyit Bubuk/ T o n 2,45 61 360
Turmeric Powder
13. Buah Pala/Nutmeg T o n 3,82 171 720
14. Bunga Pala/Mace Flower T o n 32,26 3 709 992
15. Pinang Biji/Areca Nut Seed T o n 18 330,67 91 653 325
16. Tangkai Cengkeh/Clove Stem T o n 0,00 0
Jumlah/Total
2 0 1 2 T o n 270 830,05 3 108 019 623
2 0 1 1 T o n 208 518,88 3 886 827 557
2 0 1 0 T o n 158 381,55 3 239 263 945
2 0 0 9 T o n 189 059,24 3 605 179 587
2 0 0 8 T o n 171 519,73 3 026 631 656
Sumber/Source: Dinas Perindustrian dan Perdagangan Prov. Sulawesi Tenggara/ Industry and Trade Office of Sulawesi Tenggara Province
7.3.3
Volume dan Nilai Perdagangan Antar Pulau Hasil Perkebunan
Menurut Jenis Barang, 2012 Tabel
Table Volume and Value of Inter Island Trade of Estate Crops Products
by Kind of Commodity, 2012

PERDAGANGAN
290 Sulawesi Tenggara Dalam Angka 2013
Jenis Barang S a t u a n Volume Nilai
Kind of Commodity U n i t Volume Value
(Ton) (000 Rp)
(1) (2) (3) (4)
1. Tulang/Ekor Sapi T o n 1,54 61 760
Bone/Tail Cow
2. Sapi/Kerbau Potong Ekor/Heads 1 400,00 10 500 000
Cow/Buffalo
3. Kulit Ternak Kering T o n 73,56 1 839 100
Dried Livestock Skin
4. A y a m/Chicken T o n 0,00 0
5. Sapi/Kerbau Bibit Ekor/Heads 0,00 0
Breed Cow/Buffalo
6. Daging Sapi/Beef T o n 0,00 0
7. Daging Babi/Pork T o n 0,00 0
8. Kulit Ternak Garam/Salted T o n 87,35 3 057 110
Livestock Skin
Jumlah/Total 2 0 1 2 T o n 162,45 4 957 970
Ekor/Heads 1 400,00 10 500 000
2 0 1 1 T o n 130,64 884 644
Ekor/Heads 1 382,00 6 757 128
2 0 1 0 T o n 108,87 737 203
Ekor/Heads 1 152,00 4 504 752
2 0 0 9 T o n 98,97 670 186
Ekor/Heads 10 464,00 3 662 400
2 0 0 8 T o n 82,48 558 488
Ekor/Heads 872,00 3 052 000
Sumber/Source: Dinas Perindustrian dan Perdagangan Prov. Sulawesi Tenggara/ Industry and Trade Office of Sulawesi Tenggara Province
7.3.4
Volume dan Nilai Perdagangan Antar Pulau Hasil Peternakan
Menurut Jenis Barang, 2012 Tabel
Table Volume and Value of Inter Island Trade of Animal Husbandry Products
by Kind of Commodity, 2012
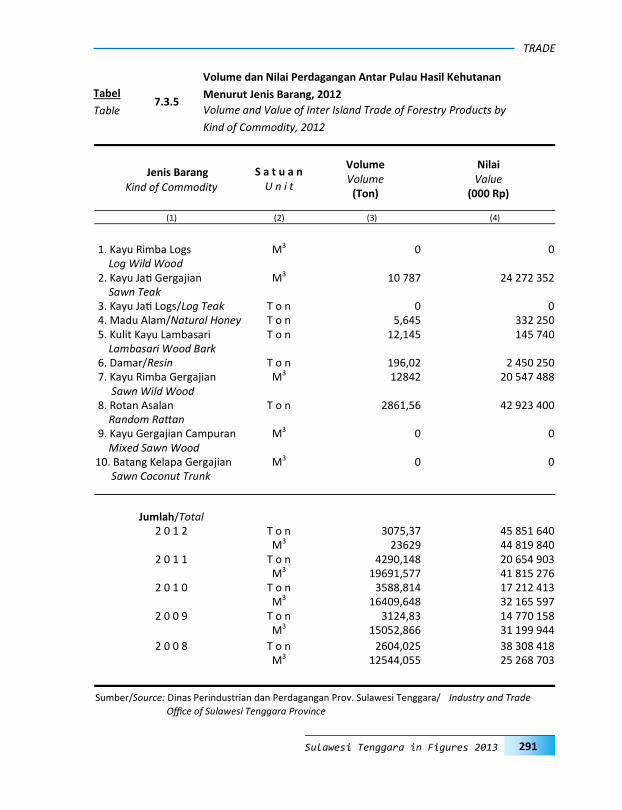
TRADE
291 Sulawesi Tenggara in Figures 2013
Jenis Barang Kind of Commodity
S a t u a n U n i t
Volume Volume
(Ton)
Nilai Value
(000 Rp)
(1) (2) (3) (4)
1. Kayu Rimba Logs M3 0 0 Log Wild Wood 2. Kayu Jati Gergajian M3 10 787 24 272 352 Sawn Teak 3. Kayu Jati Logs/Log Teak T o n 0 0 4. Madu Alam/Natural Honey T o n 5,645 332 250 5. Kulit Kayu Lambasari T o n 12,145 145 740 Lambasari Wood Bark 6. Damar/Resin T o n 196,02 2 450 250 7. Kayu Rimba Gergajian M3 12842 20 547 488 Sawn Wild Wood 8. Rotan Asalan T o n 2861,56 42 923 400 Random Rattan 9. Kayu Gergajian Campuran M3 0 0 Mixed Sawn Wood 10. Batang Kelapa Gergajian M3 0 0 Sawn Coconut Trunk
Jumlah/Total 2 0 1 2 T o n 3075,37 45 851 640
M3 23629 44 819 840 2 0 1 1 T o n 4290,148 20 654 903
M3 19691,577 41 815 276 2 0 1 0 T o n 3588,814 17 212 413
M3 16409,648 32 165 597 2 0 0 9 T o n 3124,83 14 770 158
M3 15052,866 31 199 944
2 0 0 8 T o n 2604,025 38 308 418 M3 12544,055 25 268 703
Sumber/Source: Dinas Perindustrian dan Perdagangan Prov. Sulawesi Tenggara/ Industry and Trade
Office of Sulawesi Tenggara Province
7.3.5
Volume dan Nilai Perdagangan Antar Pulau Hasil Kehutanan
Menurut Jenis Barang, 2012 Tabel
Table Volume and Value of Inter Island Trade of Forestry Products by
Kind of Commodity, 2012
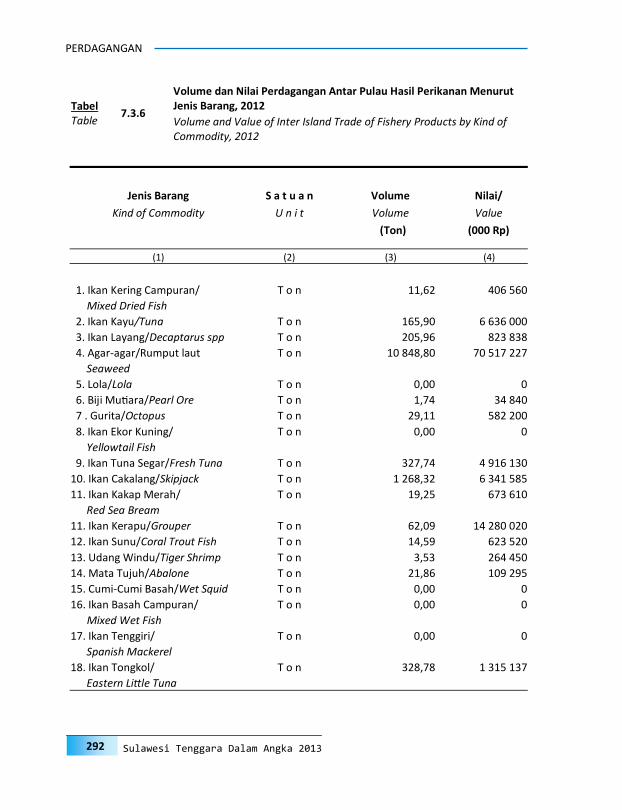
PERDAGANGAN
292 Sulawesi Tenggara Dalam Angka 2013
Jenis Barang S a t u a n Volume Nilai/
Kind of Commodity U n i t Volume Value
(Ton) (000 Rp)
(1) (2) (3) (4)
1. Ikan Kering Campuran/ T o n 11,62 406 560
Mixed Dried Fish
2. Ikan Kayu/Tuna T o n 165,90 6 636 000
3. Ikan Layang/Decaptarus spp T o n 205,96 823 838
4. Agar-agar/Rumput laut T o n 10 848,80 70 517 227
Seaweed
5. Lola/Lola T o n 0,00 0
6. Biji Mutiara/Pearl Ore T o n 1,74 34 840
7 . Gurita/Octopus T o n 29,11 582 200
8. Ikan Ekor Kuning/ T o n 0,00 0
Yellowtail Fish
9. Ikan Tuna Segar/Fresh Tuna T o n 327,74 4 916 130
10. Ikan Cakalang/Skipjack T o n 1 268,32 6 341 585
11. Ikan Kakap Merah/ T o n 19,25 673 610
Red Sea Bream
11. Ikan Kerapu/Grouper T o n 62,09 14 280 020
12. Ikan Sunu/Coral Trout Fish T o n 14,59 623 520
13. Udang Windu/Tiger Shrimp T o n 3,53 264 450
14. Mata Tujuh/Abalone T o n 21,86 109 295
15. Cumi-Cumi Basah/Wet Squid T o n 0,00 0
16. Ikan Basah Campuran/ T o n 0,00 0
Mixed Wet Fish
17. Ikan Tenggiri/ T o n 0,00 0
Spanish Mackerel
18. Ikan Tongkol/ T o n 328,78 1 315 137
Eastern Little Tuna
7.3.6
Volume dan Nilai Perdagangan Antar Pulau Hasil Perikanan Menurut Jenis Barang, 2012 Tabel
Table Volume and Value of Inter Island Trade of Fishery Products by Kind of Commodity, 2012
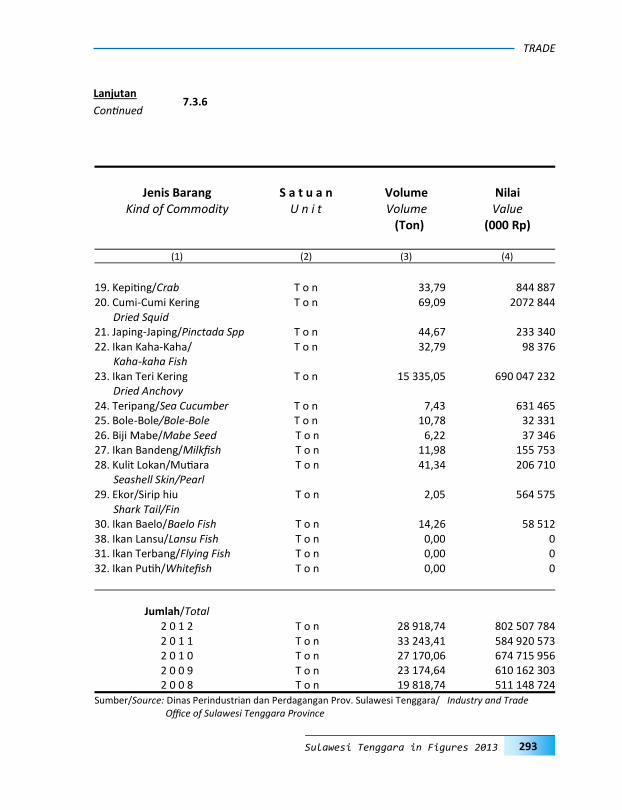
TRADE
293 Sulawesi Tenggara in Figures 2013
Jenis Barang S a t u a n Volume Nilai
Kind of Commodity U n i t Volume Value (Ton) (000 Rp)
(1) (2) (3) (4)
19. Kepiting/Crab T o n 33,79 844 887 20. Cumi-Cumi Kering T o n 69,09 2072 844 Dried Squid 21. Japing-Japing/Pinctada Spp T o n 44,67 233 340 22. Ikan Kaha-Kaha/ T o n 32,79 98 376 Kaha-kaha Fish 23. Ikan Teri Kering T o n 15 335,05 690 047 232 Dried Anchovy 24. Teripang/Sea Cucumber T o n 7,43 631 465 25. Bole-Bole/Bole-Bole T o n 10,78 32 331 26. Biji Mabe/Mabe Seed T o n 6,22 37 346 27. Ikan Bandeng/Milkfish T o n 11,98 155 753 28. Kulit Lokan/Mutiara T o n 41,34 206 710 Seashell Skin/Pearl 29. Ekor/Sirip hiu T o n 2,05 564 575 Shark Tail/Fin 30. Ikan Baelo/Baelo Fish T o n 14,26 58 512 38. Ikan Lansu/Lansu Fish T o n 0,00 0 31. Ikan Terbang/Flying Fish T o n 0,00 0 32. Ikan Putih/Whitefish T o n 0,00 0
Jumlah/Total
2 0 1 2 T o n 28 918,74 802 507 784 2 0 1 1 T o n 33 243,41 584 920 573 2 0 1 0 T o n 27 170,06 674 715 956 2 0 0 9 T o n 23 174,64 610 162 303 2 0 0 8 T o n 19 818,74 511 148 724
Sumber/Source: Dinas Perindustrian dan Perdagangan Prov. Sulawesi Tenggara/ Industry and Trade Office of Sulawesi Tenggara Province
Lanjutan
Continued 7.3.6
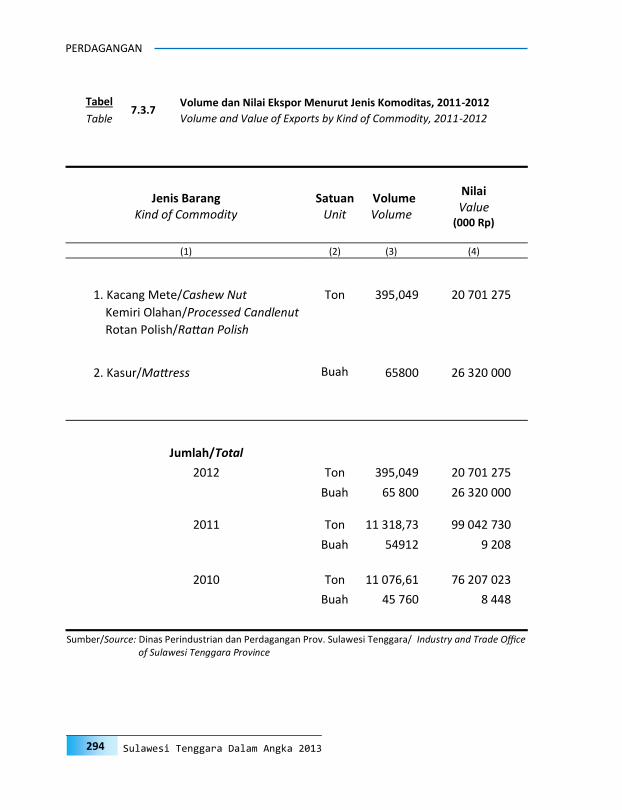
PERDAGANGAN
294 Sulawesi Tenggara Dalam Angka 2013
Jenis Barang Kind of Commodity
Satuan Unit
Volume Volume
Nilai Value
(000 Rp)
(1) (2) (3) (4)
1. Kacang Mete/Cashew Nut Ton 395,049 20 701 275
Kemiri Olahan/Processed Candlenut
Rotan Polish/Rattan Polish
2. Kasur/Mattress Buah 65800 26 320 000
Jumlah/Total
2012 Ton 395,049 20 701 275
Buah 65 800 26 320 000
2011 Ton 11 318,73 99 042 730
Buah 54912 9 208
2010 Ton 11 076,61 76 207 023
Buah 45 760 8 448
Sumber/Source: Dinas Perindustrian dan Perdagangan Prov. Sulawesi Tenggara/ Industry and Trade Office of Sulawesi Tenggara Province
7.3.7 Volume dan Nilai Ekspor Menurut Jenis Komoditas, 2011-2012 Tabel
Table Volume and Value of Exports by Kind of Commodity, 2011-2012
T R A N S P O R T A T I O N A N D
TRANSPORTASI DANKOMUNIKASI8 C O M M U N I C A T I O N

TRANSPORTATION AND COMMUNICATION
297 Sulawesi Tenggara in Figures 2013
PENJELASAN TEKNIS 1 Data transportasi dan komunikasi
meliputi: a Panjang Jalan Jalan merupakan prasarana angkutan da-
rat yang sangat penting dalam memperlan-car kegiatan hubungan perekonomian, baik antara satu kota dengan kota lainnya, maupun antara kota dengan desa dan antara satu desa dengan desa lainnya Kondisi jalan yang baik akan memudahkan mobilitas penduduk dalam mengadakan hubungan perekonomian dan kegiatan sosial lainnya
b Angkutan Darat Sarana angkutan darat seperti kendaraan
bermotor di samping dapat dipergunakan oleh masyarakat sebagai angkutan penumpang, juga dapat dipergunakan sebagai angkutan barang-barang produksi hasil pertanian, kehutanan dan hasil-hasil lainnya
Jenis sarana angkutan darat yang dicakup disini adalah kendaraan bermotor yang meliputi mobil penumpang, mobil beban, otobis dan sepeda motor
c Angkutan Laut Sebagian besar wilayah Sulawesi Tengga-
ra adalah berupa kepulauan Karena itu diperlukan sarana angkutan laut sebagai alat transportasi dari daerah yang satu ke daerah yang lain
Pemerintah Sulawesi Tenggara mengu-
payakan berbagai jenis usaha pelayaran Jenis-jenis usaha pelayaran yang sedang beroperasi di Sulawesi Tenggara dewasa ini terdiri dari pelayaran umum, pelaya-ran rakyat, pelayaran perintis dan angku-tan penyeberangan Dan sesuai dengan
TECHNICAL NOTES 1 Data on transportations and commu-
nications cover: a Length of Road Road is the land transportation infra-
structure that is very important in speeding up the economic relations activities, both between one city to another city, between villages and cities, and between one village to another village A good road condi-tions would facilitate the mobility of the population in carrying out the economic relations and conduct oth-er social activities
b Land Transportation Land transportation as well as motor
vehicles can be used by the communi-ty as a passenger transportation It also can be used as a goods transpor-tation of agricultural production, forestry and other results
Types of land transportation facilities
covered here is motor vehicles includ-ing passenger cars, car load, auto-buses and motorcycle
c Sea Transportation Most of the region of Sulawesi
Tenggara are island Therefore, sea transportation is required as a means of transportation from one area to another area
The Government of Sulawesi Tengga-
ra today seek a variety of voyage business Types of businesses that are operating cruises in Sulawesi Tengga-ra today consists of a general voy-age, people voyage, pioneer voyage, and crossing transportation Accord-
ANGKUTAN DAN KOMUNIKASI
298 Sulawesi Tenggara Dalam Angka 2013
kebutuhan telah berkembang pula jenis pelayaran lain yang disebut pelayaran khusus
d Angkutan Udara Sarana pelabuhan udara di Sulawesi
Tenggara yang dapat disinggahi pesawat udara sebagai angkutan penumpang dan barang serta aktif dipakai adalah Pelabu-han Udara Wolter Monginsidi di Kendari, Pelabuhan Udara Betoambari di Bau Bau, Pelabuhan Udara Matahora di Wakatobi dan Pelabuhan Udara Sangia Nibandera di Kolaka Pelabuhan Udara Wolter Mon-ginsidi ini memegang peranan yang san-gat penting dalam menghubungkan Sulawesi Tenggara dengan Ujung Pan-dang dan Jakarta serta kota-kota lainnya di Indonesia
e Pos dan Telekomunikasi Pembangunan pos dan giro diarahkan
untuk memperlancar pelayanan arus informasi ke seluruh penjuru tanah air Untuk memperlancar pelayanan informa-si di Sulawesi Tenggara, dewasa ini telah dibangun berbagai fasilitas fisik pos dan giro sampai tingkat pedesaan yang meli-puti kantor pos, kantor pos tambahan, kantor pos dan giro pembantu, pos keli-ling kota, pos keliling desa, rumah pos, kotak pos dan bis surat
Dengan tersedianya sarana fasilitas pela-
yanan jasa pos dan giro yang tersebar di semua kabupaten/kota, maka kelancaran pertukaran informasi antara manusia, organisasi dan lembaga pemerintah di Sulawesi Tenggara akan semakin mening-kat Demikian pula pelayanan benda-benda pos seperti surat, wesel dan lain-lain kepada masyarakat sampai kepelosok
ing to the needs, there is a develop-ment on the other types of voyage called a special voyage
d Air Transportation Airport facilities in Sulawesi Tengga-
ra which can stop off the aircraft as a passenger and goods transportation and can be actively used are Wolter Monginsidi Airport in Kendari and Betoambari Airport in Bau Bau, Ma-tahora Airport in Wakatobi, and San-gia Nibandera Airport in Kolaka The Wolter Monginsidi Airport holds a very important role in connecting Sulawesi Tenggara to Ujung Pan-dang, Jakarta and other cities in In-donesia
e Post and Telecommunication Development on giro and post is
directed to expedite the services of information flow throughout the country To facilitate information services in Sulawesi Tenggara, physi-cal facilities of post and postal clear-ing has been built to the village level which include the post office, the additional post office, the auxiliary post and giro office, urban mobile post, rural mobile post, mailing house, post office box, and mail post
By providing the means of post and
postal clearing service facilities ac-count and spread over all districts/cities, then the smooth exchange of information between people, organi-zations and government agencies in Sulawesi Tenggara will increase Similarly, the post goods service such as letter, money order, etc will be
TRANSPORTATION AND COMMUNICATION
299 Sulawesi Tenggara in Figures 2013
pedesaan akan semakin lancar 2 Kendaraan bermotor adalah setiap kenda-
raan yang digerakkan oleh peralatan tek-nik yang ada pada kendaraan tersebut, biasanya digunakan untuk angkutan orang atau barang di atas jalan raya selain kendaraan yang berjalan di atas rel Ken-daraan bermotor yang dicatat adalah semua jenis kendaraan kecuali kendaraan bermotor TNI/Polri dan Korps Diplomatik
Mobil penumpang adalah setiap kendara-an bermotor yang dilengkapi dengan tempat duduk untuk sebanyak-banyaknya delapan orang, tidak termasuk tempat duduk untuk pengemudi, baik dilengkapi atau tidak dilengkapi bagasi
4 Mobil bis adalah setiap kendaraan bermo-
tor yang dilengkapi dengan tempat duduk untuk lebih dari delapan orang, tidak termasuk tempat duduk untuk pengemu-di, baik dilengkapi atau tidak dilengkapi bagasi
5 Mobil truk adalah setiap kendaraan ber-
motor yang digunakan untuk angkutan barang, selain mobil penumpang, mobil bis dan kendaraan bermotor roda dua
6 Data panjang jalan yang disajikan dalam
publikasi ini, untuk jalan negara dan jalan provinsi bersumber dari Kementerian Pekerjaan Umum Sedangkan jalan kabu-paten/kota bersumber dari Dinas Peker-jaan Umum Kabupaten/Kota, diolah dari daftar PJ-II/5
Kunjungan kapal adalah kapal yang da-
tang di pelabuhan baik untuk berlabuh di perairan maupun bersandar di dermaga
going along more smoothly to the people in remote areas
2 Motor vehicles are any kind of vehi-
cles motorized by machine set up in those vehicles They are usually used for transporting peoples and goods on roads except vehicles moving along a railway line The data cover all kinds of motor vehicles except those belong to Indonesia Army Force, Indonesian State Police and Diplomatic Corps
3 Passengers cars are any motor vehi-
cle with no more than eight seats excluding seat for driver It can be with or without boot
4 Buses are passengers cars having
seats for more than eight passengers, excluding seat for driver It can be with or without boot
5 Trucks are any motor vehicles used to
transport goods excluding passenger cars, buses, and motorcycles
6 Data on the length of state and pro-
vincial roads were taken from the Ministry of Public Works, while the regency/city roads data were taken from District/City Public Work Offic-es, based on PJ-II/5
Ships call is a ship arriving at a port either for docking or berthing
ANGKUTAN DAN KOMUNIKASI
300 Sulawesi Tenggara Dalam Angka 2013
8 Sumber data transportasi berasal dari masing-masing instansi terkait, dikumpul-kan oleh BPS Provinsi Sulawesi Tenggara setiap bulan/tahun
9 Kantor Pos adalah pemberi pelayanan
pengiriman barang, uang, dsb, dari suatu tempat ke tempat yang lain Pengguna pelayanan biasanya diharuskan menempel perangko yang cukup pada sampul surat, kartu pos, pos wesel, war-kat pos, paket dsb Rumah pos berfungsi sama seperti kantor pos dan kantor pos pembantu, bedanya rumah pos biasanya terletak di daerah terpencil
10 Telekomunikasi adalah setiap
pemancaran, pengiriman dan atau penerimaan dari setiap informasi dalam bentuk tanda-tanda, isyarat, tulisan, gambar, suara dan bunyi melalui sistem kawat, optik, radio atau sistem elektromagnetik lainnya
11 Jaringan telekomunikasi adalah rangkaian
perangkat telekomunikasi dan kelengkapannya yang digunakan dalam rangka bertelekomunikasi
8 Data on transportations are compiled by the BPS Provinvial Office of Sula-wesi Tenggara These data are ob-tained from relevant institutions monthly/annually
9 Post office is an establishment deal-
ing with the delivery of goods, letters, money, etc from one place to anoth-er place Service users usually put postage stamps on the envelope and postcard or are charged with amount of money in obtaining services such as money order, aerogramme, pack-age post, etc A mailing house has the same function as post office and auxiliary post office It is usually lo-cated in remote areas
10 Telecommunication includes every
transmitting, delivering and/or re-ceiving from every information of marking, signal, article, picture, sound and voice through strand of wire systems, optic, radio or other electromagnetic system
11 Telecommunication network is pe-
ripheral network of telecommunica-tion and its equipment used in the means of telecommunication

TRANSPORTATION AND COMMUNICATION
301 Sulawesi Tenggara in Figures 2013
0
500
1000
1500
2000
2500
3000
3500
4000
2004 2005 2006 2007 2008 2009 2010 2011 2012
Negara
Provinsi
Kabupaten
8.1
Panjang Jalan yang Diaspal Menurut Tingkat Kewenangan Pemerintahan
(Km) , 2004 - 2012 Gambar
Figures Length of asphalted Roads by Level Government Authority(Km) , 2004 - 2012
Sumber/Source : Dinas Pekerjaan Umum Kota dan Kabupaten Se-Sultra/ Public Works Service in all cities/regencies across Sulawesi Tenggara Province

ANGKUTAN DAN KOMUNIKASI
302 Sulawesi Tenggara Dalam Angka 2013
8.2
Panjang Jalan menurut Kondisi Permukaan Jalan dan Tingkat Kewenangan
Pemerintahan (Km) 2012 Gambar
Figures Length of Roads by Road Surface Condition and Level Government Authority
(Km) , 2012
Sumber/Source : Dinas Pekerjaan Umum Kota dan Kabupaten Se-Sultra/ Public Works Service in all cities/regencies across Sulawesi Tenggara Province
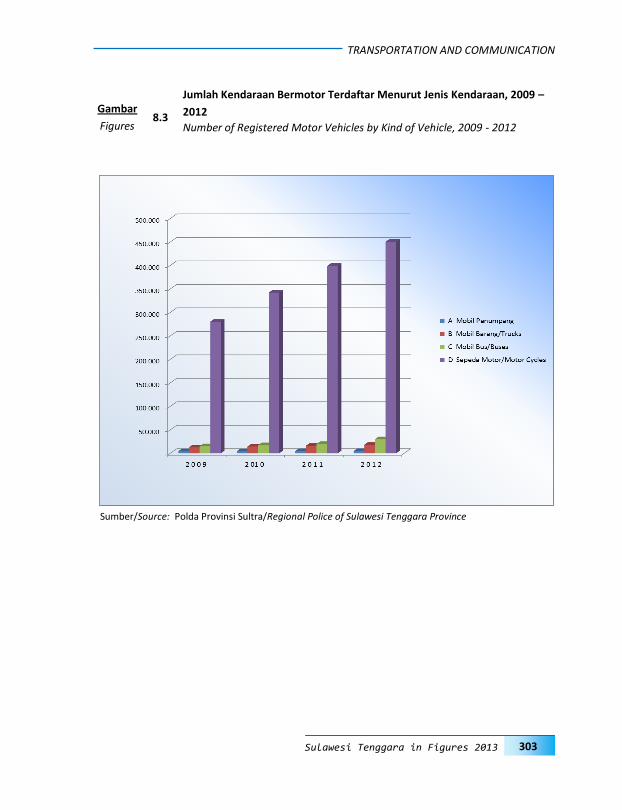
TRANSPORTATION AND COMMUNICATION
303 Sulawesi Tenggara in Figures 2013
8.3
Jumlah Kendaraan Bermotor Terdaftar Menurut Jenis Kendaraan, 2009 –
2012 Gambar
Figures Number of Registered Motor Vehicles by Kind of Vehicle, 2009 - 2012
Sumber/Source: Polda Provinsi Sultra/Regional Police of Sulawesi Tenggara Province

ANGKUTAN DAN KOMUNIKASI
304 Sulawesi Tenggara Dalam Angka 2013
8.4
Lalu Lintas Barang, Bagasi dan Pos Paket Melalui Pelabuhan Udara di Sulawesi Tenggara (Kg) , 2012 Gambar
Figures Cargo, Baggage and Parcels Traffic at Airport in Sulawesi Tenggara (Kg) , 2012
Sumber/Source: Bandar Udara Se-Sulawesi Tenggara/Airport in Sulawesi Tenggara

TRANSPORTATION AND COMMUNICATION
305 Sulawesi Tenggara in Figures 2013
Tahun
Year
Negara State
Provinsi Provincial
Kabupaten District
Non Status Non Status
Diaspal Asphalted
Tidak Diaspal
Non-Asphalted
Diaspal Asphalted
Tidak Diaspal
Non-Asphalted
Diaspal Asphalted
Tidak Diaspal
Non-Asphalted
Diaspal Asphalted
Tidak Diaspal
Non-Asphalted
(1) (2) (3) (4) (5) (6) (7) (8) (9)
2 0 0 4 896,92 396,95 373,9 114,9 1 720,24 4 122,27 - -
2 0 0 5 929,00 364,87 347,80 141,00 1 581,89 3 900,42 - -
2 0 0 6 944,42 349,45 373,90 114,90 2 022,34 3 980,61 - -
2 0 0 7 1 064,67 264,25 364,80 124,20 3 010,41 3 594,44 - -
2 0 0 8 1 067,38 226,49 481,02 706,61 3 383,06 4 269,39 - -
2 0 0 9 1 131,02 166,70 373,27 115,53 3 350,94 4 567,15 - -
2 0 1 0 1 201,92 195,13 423,51 482,58 3 350,94 4 567,15 - -
2 0 1 1 1 217,41 179,64 476,51 429,68 2 240,50 5 278,41 - -
2 0 1 2 1 155,88 2 365,78 5 343,66 - -
Sumber/Source : Dinas Pekerjaan Umum Kota dan Kabupaten Se-Sultra/ Public Works Service in all
cities/regencies across Sulawesi Tenggara Province
8.1.1
Panjang Jalan Negara, Propinsi dan Kabupaten menurut Jenis Permukaan (Km) , 2004-2012 Tabel
Table Length of State, Provincial and Regency Road by Type of Surface (Km) , 2004-2012
8.1 Jalan Raya
Road way
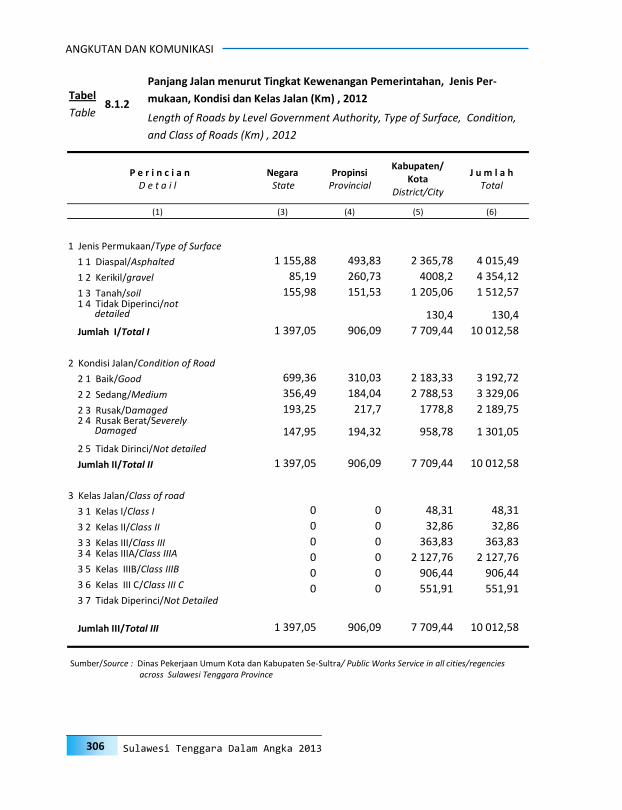
ANGKUTAN DAN KOMUNIKASI
306 Sulawesi Tenggara Dalam Angka 2013
P e r i n c i a n D e t a i l
Negara State
Propinsi Provincial
Kabupaten/Kota
District/City
J u m l a h Total
(1) (3) (4) (5) (6)
1 Jenis Permukaan/Type of Surface
1 1 Diaspal/Asphalted 1 155,88 493,83 2 365,78 4 015,49
1 2 Kerikil/gravel 85,19 260,73 4008,2 4 354,12
1 3 Tanah/soil 155,98 151,53 1 205,06 1 512,57 1 4 Tidak Diperinci/not _____detailed 130,4 130,4
Jumlah I/Total I 1 397,05 906,09 7 709,44 10 012,58
2 Kondisi Jalan/Condition of Road
2 1 Baik/Good 699,36 310,03 2 183,33 3 192,72
2 2 Sedang/Medium 356,49 184,04 2 788,53 3 329,06
2 3 Rusak/Damaged 193,25 217,7 1778,8 2 189,75 2 4 Rusak Berat/Severely _____Damaged 147,95 194,32 958,78 1 301,05
2 5 Tidak Dirinci/Not detailed
Jumlah II/Total II 1 397,05 906,09 7 709,44 10 012,58
3 Kelas Jalan/Class of road
3 1 Kelas I/Class I 0 0 48,31 48,31
3 2 Kelas II/Class II 0 0 32,86 32,86
3 3 Kelas III/Class III 0 0 363,83 363,83 3 4 Kelas IIIA/Class IIIA 0 0 2 127,76 2 127,76 3 5 Kelas IIIB/Class IIIB 0 0 906,44 906,44 3 6 Kelas III C/Class III C 0 0 551,91 551,91 3 7 Tidak Diperinci/Not Detailed
Jumlah III/Total III 1 397,05 906,09 7 709,44 10 012,58
Sumber/Source : Dinas Pekerjaan Umum Kota dan Kabupaten Se-Sultra/ Public Works Service in all cities/regencies
across Sulawesi Tenggara Province
8.1.2
Panjang Jalan menurut Tingkat Kewenangan Pemerintahan, Jenis Per-
mukaan, Kondisi dan Kelas Jalan (Km) , 2012 Tabel
Table Length of Roads by Level Government Authority, Type of Surface, Condition,
and Class of Roads (Km) , 2012

TRANSPORTATION AND COMMUNICATION
307 Sulawesi Tenggara in Figures 2013
8.1.3
Panjang Jalan Kabupaten menurut Kabupaten/Kota, Jenis Permukaan,
Kondisi dan Kelas Jalan (Km) , 2012 Tabel
Table Length of district road by District/City, Type of Surface, Condition and Class
of Road (Km) , 2012
P e r i n c i a n D e t a i l
Buton Muna Konawe Kolaka Konawe
Selatan Bombana
Waka-tobi
(1) (2) (3) (4) (5) (6) (7) (8)
1 Jenis Permukaan/
Type of Surface
1 1 Diaspal/Asphalted 428,12 490,69 181,72 294,8 120,5 20,04 187,49
1 2 Kerikil/gravel 0 495,15 534,98 715,77 824,89 409,11 87,35
1 3 Tanah/soil 353,06 106,29 20,75 120,58 86,65 232,03 107,37
1 4 Tidak Diperinci/ not detailed
129,51 0 0 0 0 0 0
Jumlah I/Total I 910,69 1092,13 737,45 1131,15 1032,04 661,18 382,21
2 Kondisi Jalan/ Condition of Road
2 1 Baik/Good 292,82 223,23 178,5 294,8 326,25 231,48 140,18
2 2 Sedang/Medium 218,42 558,57 533,25 593,87 233,57 149,37 44,25
2 3 Rusak/Damaged 298,67 310,33 25,7 120,1 315,15 92,51 61,17
2 4 Rusak Berat/ Severely Damaged 100,78 0 0 122,38 157,07 187,82 136,61
Jumlah II/Total II 910,69 1092,13 737,45 1131,15 1032,04 661,18 382,21
3 Kelas Jalan/Class of road
3 1 Kelas I/Class I 0 0 0 0 0 0 0
3 2 Kelas II/Class II 0 0 0 0 0 0 0
3 3 Kelas III/Class III 0 0 0 47,06 0 0 0
3 4 Kelas IIIA/Class IIIA 910,69 0 0 361,8 855,27 0 0
3 5 Kelas IIIB/Class IIIB 0 0 0 620,76 0 0 0
3 6 Kelas III C/Class III C 0 0 0 101,53 0 0 346,42
3 7 Tidak Diperinci/ Not Detailed 0 1092,13 737,45 0 176,77 661,18 35,79
Jumlah III/Total III 910,69 1092,13 737,45 1131,15 1032,04 661,18 382,21
Sumber/Source : Dinas Pekerjaan Umum Kota dan Kabupaten Se-Sultra/ Public Works Service in all cities/regencies across Sulawesi Tenggara Province

ANGKUTAN DAN KOMUNIKASI
308 Sulawesi Tenggara Dalam Angka 2013
Lanjutan Tabel 8.1.3
Continued Table
P e r i n c i a n D e t a i l
Kolaka Utara
Buton Utara
Konawe Utara
Kota Kendari
Kota Bau-Bau
Total
(1) (2) (3) (4) (5) (6) (7)
1 Jenis Permukaan/
Type of Surface
1 1 Diaspal/Asphalted 80,7 81,1 11,29 331,568 137,76 2365,778
1 2 Kerikil/gravel 298,55 236,9 306,89 48,618 49,99 4008,198
1 3 Tanah/soil 18,69 131,5 18,69 9,454 0 1205,064
1 4 Tidak Diperinci/ not detailed
0 0 0,89 0 0 130,4
Jumlah I/Total I 397,94 449,5 337,76 389,64 187,75 7709,44
2 Kondisi Jalan/
Condition of Road 2 1 Baik/Good 33,22 80,7 20,92 190,508 170,72 2183,328
2 2 Sedang/Medium 24,24 193,71 132,78 96,003 10,5 2788,533
2 3 Rusak/Damaged 306,54 10,8 148,73 82,568 6,53 1778,798
2 4 Rusak Berat/ Severely Damaged 33,94 164,29 35,33 20,562 0 958,782
Jumlah II/Total II 397,94 449,5 337,76 389,641 187,75 7709,441
3 Kelas Jalan/Class of road 3 1 Kelas I/Class I 48,31 0 0 0 0 48,31
3 2 Kelas II/Class II 32,86 0 0 0 0 32,86
3 3 Kelas III/Class III 316,77 0 0 0 0 363,83
3 4 Kelas IIIA/Class IIIA 0 0 0 0 0 2127,76
3 5 Kelas IIIB/Class IIIB 0 0 0 285,68 0 906,44
3 6 Kelas III C/Class III C 0 0 0 103,96 0 551,91
3 7 Tidak Diperinci/ Not Detailed 0 449,5 337,76 0 187,75 3678,33
Jumlah III/Total III 397,94 449,5 337,76 389,64 187,75 7709,44
Sumber/Source : Dinas Pekerjaan Umum Kota dan Kabupaten Se-Sultra/ Public Works Service in all cities/regencies across Sulawesi Tenggara Province
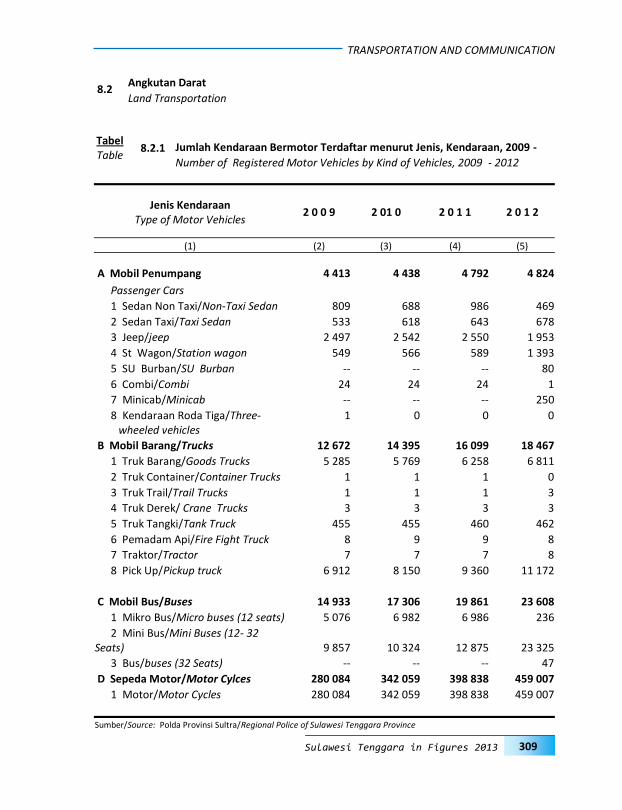
TRANSPORTATION AND COMMUNICATION
309 Sulawesi Tenggara in Figures 2013
2 0 0 9 2 01 0 2 0 1 1 2 0 1 2 Jenis Kendaraan
Type of Motor Vehicles
(1) (2) (3) (4) (5)
A Mobil Penumpang 4 413 4 438 4 792 4 824
Passenger Cars
1 Sedan Non Taxi/Non-Taxi Sedan 809 688 986 469
2 Sedan Taxi/Taxi Sedan 533 618 643 678
3 Jeep/jeep 2 497 2 542 2 550 1 953
4 St Wagon/Station wagon 549 566 589 1 393
5 SU Burban/SU Burban -- -- -- 80
6 Combi/Combi 24 24 24 1
7 Minicab/Minicab -- -- -- 250
8 Kendaraan Roda Tiga/Three-____wheeled vehicles
1 0 0 0
B Mobil Barang/Trucks 12 672 14 395 16 099 18 467
1 Truk Barang/Goods Trucks 5 285 5 769 6 258 6 811
2 Truk Container/Container Trucks 1 1 1 0
3 Truk Trail/Trail Trucks 1 1 1 3
4 Truk Derek/ Crane Trucks 3 3 3 3
5 Truk Tangki/Tank Truck 455 455 460 462
6 Pemadam Api/Fire Fight Truck 8 9 9 8
7 Traktor/Tractor 7 7 7 8
8 Pick Up/Pickup truck 6 912 8 150 9 360 11 172
C Mobil Bus/Buses 14 933 17 306 19 861 23 608
1 Mikro Bus/Micro buses (12 seats) 5 076 6 982 6 986 236
2 Mini Bus/Mini Buses (12- 32 Seats) 9 857 10 324 12 875 23 325
3 Bus/buses (32 Seats) -- -- -- 47
D Sepeda Motor/Motor Cylces 280 084 342 059 398 838 459 007
1 Motor/Motor Cycles 280 084 342 059 398 838 459 007
Sumber/Source: Polda Provinsi Sultra/Regional Police of Sulawesi Tenggara Province
8.2.1 Jumlah Kendaraan Bermotor Terdaftar menurut Jenis, Kendaraan, 2009 - Tabel Table
Number of Registered Motor Vehicles by Kind of Vehicles, 2009 - 2012
8.2 Angkutan Darat
Land Transportation
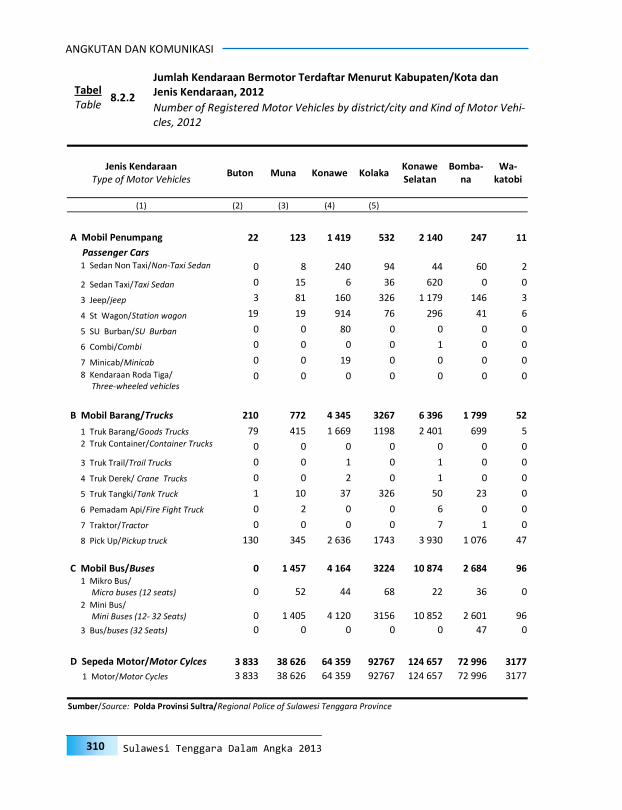
ANGKUTAN DAN KOMUNIKASI
310 Sulawesi Tenggara Dalam Angka 2013
Buton Muna Konawe Kolaka Jenis Kendaraan
Type of Motor Vehicles Konawe Selatan
Bomba-na
Wa-katobi
(1) (2) (3) (4) (5)
A Mobil Penumpang 22 123 1 419 532 2 140 247 11
Passenger Cars 1 Sedan Non Taxi/Non-Taxi Sedan 0 8 240 94 44 60 2
2 Sedan Taxi/Taxi Sedan 0 15 6 36 620 0 0
3 Jeep/jeep 3 81 160 326 1 179 146 3
4 St Wagon/Station wagon 19 19 914 76 296 41 6
5 SU Burban/SU Burban 0 0 80 0 0 0 0
6 Combi/Combi 0 0 0 0 1 0 0
7 Minicab/Minicab 0 0 19 0 0 0 0
8 Kendaraan Roda Tiga/ Three-wheeled vehicles
0 0 0 0 0 0 0
B Mobil Barang/Trucks 210 772 4 345 3267 6 396 1 799 52
1 Truk Barang/Goods Trucks 79 415 1 669 1198 2 401 699 5 2 Truk Container/Container Trucks 0 0 0 0 0 0 0
3 Truk Trail/Trail Trucks 0 0 1 0 1 0 0
4 Truk Derek/ Crane Trucks 0 0 2 0 1 0 0
5 Truk Tangki/Tank Truck 1 10 37 326 50 23 0
6 Pemadam Api/Fire Fight Truck 0 2 0 0 6 0 0
7 Traktor/Tractor 0 0 0 0 7 1 0
8 Pick Up/Pickup truck 130 345 2 636 1743 3 930 1 076 47
C Mobil Bus/Buses 0 1 457 4 164 3224 10 874 2 684 96 1 Mikro Bus/
Micro buses (12 seats) 0 52 44 68 22 36 0 2 Mini Bus/
Mini Buses (12- 32 Seats) 0 1 405 4 120 3156 10 852 2 601 96
3 Bus/buses (32 Seats) 0 0 0 0 0 47 0
D Sepeda Motor/Motor Cylces 3 833 38 626 64 359 92767 124 657 72 996 3177
1 Motor/Motor Cycles 3 833 38 626 64 359 92767 124 657 72 996 3177
Sumber/Source: Polda Provinsi Sultra/Regional Police of Sulawesi Tenggara Province
8.2.2
Jumlah Kendaraan Bermotor Terdaftar Menurut Kabupaten/Kota dan Jenis Kendaraan, 2012 Tabel
Table Number of Registered Motor Vehicles by district/city and Kind of Motor Vehi-cles, 2012

TRANSPORTATION AND COMMUNICATION
311 Sulawesi Tenggara in Figures 2013
Jenis Kendaraan Type of Motor Vehicles
Kolaka Utara
Buton Utara
Konawe Utara
Kota Kendari
Kota Bau-Bau
Total
(1) (2) (3) (4) (5)
A Mobil Penumpang 18 69 5 238 0 4 824
Passenger Cars 1 Sedan Non Taxi/Non-Taxi Sedan 6 14 0 1 0 469
2 Sedan Taxi/Taxi Sedan 0 1 0 0 0 678
3 Jeep/jeep 10 34 5 6 0 1 953
4 St Wagon/Station wagon 2 20 0 0 0 1 393
5 SU Burban/SU Burban 0 0 0 0 0 80
6 Combi/Combi 0 0 0 0 0 1
7 Minicab/Minicab 0 0 0 231 0 250 8 Kendaraan Roda Tiga/
Three-wheeled vehicles 0 0 0 0 0 0
B Mobil Barang/Trucks 282 1 034 99 160 51 18 467
1 Truk Barang/Goods Trucks 72 208 20 34 11 6 811 2 Truk Container/Container Trucks 0 0 0 0 0 0
3 Truk Trail/Trail Trucks 0 0 1 0 0 3
4 Truk Derek/ Crane Trucks 0 0 0 0 0 3
5 Truk Tangki/Tank Truck 1 14 0 0 0 462
6 Pemadam Api/Fire Fight Truck 0 0 0 0 0 8
7 Traktor/Tractor 0 0 0 0 0 8
8 Pick Up/Pickup truck 209 812 78 126 40 11 172
C Mobil Bus/Buses 366 707 0 0 36 23 608 1 Mikro Bus/
Micro buses (12 seats) 1 12 0 0 1 236 2 Mini Bus/
Mini Buses (12- 32 Seats) 365 695 0 0 35 23 325
3 Bus/buses (32 Seats) 0 0 0 0 0 47
D Sepeda Motor/Motor Cylces 12 486 34 958 6 408 3 490 1 250 459 007
1 Motor/Motor Cycles 12 486 34 958 6 408 3 490 1 250 459 007
Sumber/Source: Polda Provinsi Sultra/Regional Police of Sulawesi Tenggara Province
Lanjutan Tabel 8.2.2
Continued Table

ANGKUTAN DAN KOMUNIKASI
312 Sulawesi Tenggara Dalam Angka 2013
J e n i s Pelayaran
Type of Voyage
Call Kapal Num-ber of Ship Calls
G R T
Barang (Ton) Cargo(Ton)
Barang (M3) Cargo(M3)
Bongkar Unloaded
Muat Loaded
Bongkar Unloaded
Muat Loaded
(1) (2) (3) (4) (5) (6) (7)
1 Dalam Negeri/ 31 222 35 754 819 5 293 913 4 619 931 91 971 64 126 406
Domestic
a Umum/public 13 872 25 499 608 4 290 229 383 042 80 478 64 019 703
b Rakyat/People 7 557 557 644 75 166 48 417 7 365 20 906
c Perintis/pioneer 386 185 535 1 407 876 0 6
d Khusus/special 774 2 633 471 568 455 370 730 0 0
e Penyeberangan / ferry 8 271 3 695 765 293 728 183 789 3 028 85 332
f Nusantara / Archipelago 345 3 171 778 64 928 3 633 078 1 100 458
g Lainnya/others 17 11 018 0 0 0 0
2 Luar Negeri /
international 941 33 689197 1 127 545 6 921 566 660 6 867 924
J u m l a h/T o t a l
2 0 1 2 32 163 105 198 835 11 715 371 16 161428 184 601 135 120 735
2 0 1 1 35 750 56 152 914 39 623 435 35 309 708 785 531 147 063
2 0 1 0 29 870 28 078 135 33 317 841 7 182 039 394 015 1 402 036
2 0 0 9 29 549 20 026 289 1 851 692 3 167 045 7 146 782 144 183
2 0 0 8 27 127 13 632 586 2 017 320 690 071 398 231 90 539
2 0 0 7 24 566 10 122 460 1 710 684 4 894 893 79 929 73 946
Sumber/Source: Administrator Pelabuhan Se-Sultra/Port Administrator of Sulawesi Tenggara Province
8.3.1
Kunjungan Kapal, Arus Barang, Hewan dan Penumpang menurut Jenis Pelayaran, 2012 Tabel
Table Number Of Ship Calls, Traffic of Cargo, Animal and Passenger by Type of Voyage, 2012
8.3 Angkutan Laut
Marine Transportation
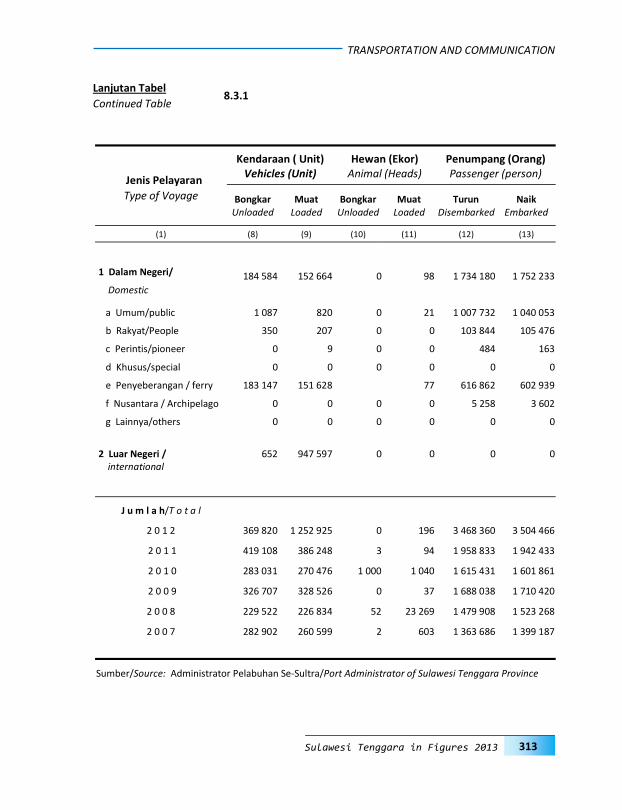
TRANSPORTATION AND COMMUNICATION
313 Sulawesi Tenggara in Figures 2013
Jenis Pelayaran
Type of Voyage
Kendaraan ( Unit) Vehicles (Unit)
Hewan (Ekor) Animal (Heads)
Penumpang (Orang) Passenger (person)
Bongkar Unloaded
Muat Loaded
Bongkar Unloaded
Muat Loaded
Turun Disembarked
Naik Embarked
(1) (8) (9) (10) (11) (12) (13)
1 Dalam Negeri/ 184 584 152 664 0 98 1 734 180 1 752 233
Domestic
a Umum/public 1 087 820 0 21 1 007 732 1 040 053
b Rakyat/People 350 207 0 0 103 844 105 476
c Perintis/pioneer 0 9 0 0 484 163
d Khusus/special 0 0 0 0 0 0
e Penyeberangan / ferry 183 147 151 628 77 616 862 602 939
f Nusantara / Archipelago 0 0 0 0 5 258 3 602
g Lainnya/others 0 0 0 0 0 0
2 Luar Negeri /
international 652 947 597 0 0 0 0
J u m l a h/T o t a l
2 0 1 2 369 820 1 252 925 0 196 3 468 360 3 504 466
2 0 1 1 419 108 386 248 3 94 1 958 833 1 942 433
2 0 1 0 283 031 270 476 1 000 1 040 1 615 431 1 601 861
2 0 0 9 326 707 328 526 0 37 1 688 038 1 710 420
2 0 0 8 229 522 226 834 52 23 269 1 479 908 1 523 268
2 0 0 7 282 902 260 599 2 603 1 363 686 1 399 187
Sumber/Source: Administrator Pelabuhan Se-Sultra/Port Administrator of Sulawesi Tenggara Province
Lanjutan Tabel 8.3.1
Continued Table
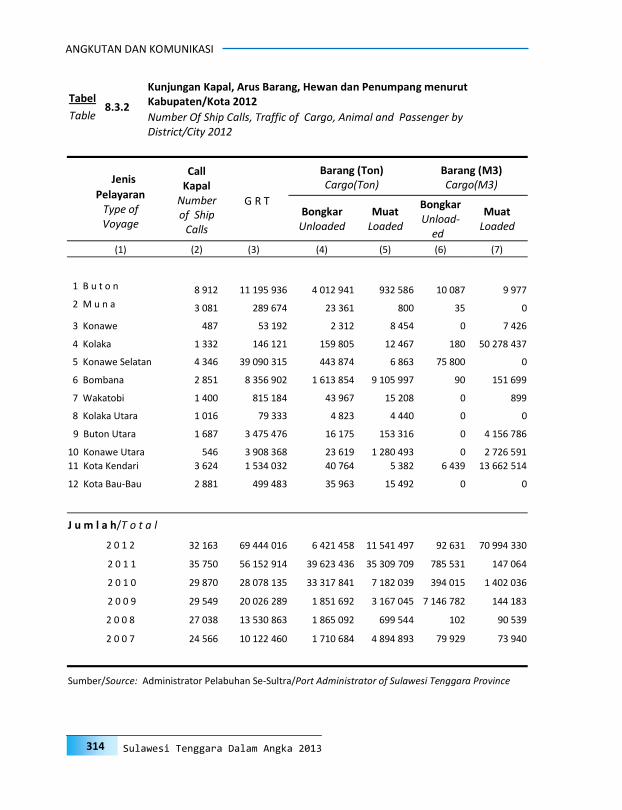
ANGKUTAN DAN KOMUNIKASI
314 Sulawesi Tenggara Dalam Angka 2013
Jenis
Pelayaran Type of Voyage
Call Kapal
Number of Ship
Calls
G R T
Barang (Ton) Cargo(Ton)
Barang (M3) Cargo(M3)
Bongkar Unloaded
Muat Loaded
Bongkar Unload-
ed
Muat Loaded
(1) (2) (3) (4) (5) (6) (7)
1 B u t o n 8 912 11 195 936 4 012 941 932 586 10 087 9 977
2 M u n a 3 081 289 674 23 361 800 35 0
3 Konawe 487 53 192 2 312 8 454 0 7 426
4 Kolaka 1 332 146 121 159 805 12 467 180 50 278 437
5 Konawe Selatan 4 346 39 090 315 443 874 6 863 75 800 0
6 Bombana 2 851 8 356 902 1 613 854 9 105 997 90 151 699
7 Wakatobi 1 400 815 184 43 967 15 208 0 899
8 Kolaka Utara 1 016 79 333 4 823 4 440 0 0
9 Buton Utara 1 687 3 475 476 16 175 153 316 0 4 156 786
10 Konawe Utara 546 3 908 368 23 619 1 280 493 0 2 726 591
11 Kota Kendari 3 624 1 534 032 40 764 5 382 6 439 13 662 514
12 Kota Bau-Bau 2 881 499 483 35 963 15 492 0 0
J u m l a h/T o t a l
2 0 1 2 32 163 69 444 016 6 421 458 11 541 497 92 631 70 994 330
2 0 1 1 35 750 56 152 914 39 623 436 35 309 709 785 531 147 064
2 0 1 0 29 870 28 078 135 33 317 841 7 182 039 394 015 1 402 036
2 0 0 9 29 549 20 026 289 1 851 692 3 167 045 7 146 782 144 183
2 0 0 8 27 038 13 530 863 1 865 092 699 544 102 90 539
2 0 0 7 24 566 10 122 460 1 710 684 4 894 893 79 929 73 940
Sumber/Source: Administrator Pelabuhan Se-Sultra/Port Administrator of Sulawesi Tenggara Province
8.3.2
Kunjungan Kapal, Arus Barang, Hewan dan Penumpang menurut Kabupaten/Kota 2012 Tabel
Table Number Of Ship Calls, Traffic of Cargo, Animal and Passenger by District/City 2012
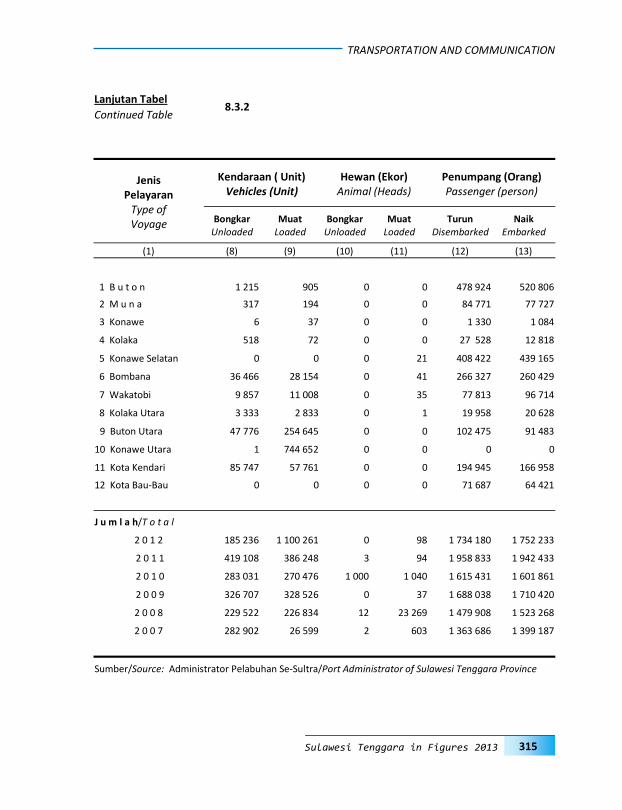
TRANSPORTATION AND COMMUNICATION
315 Sulawesi Tenggara in Figures 2013
Jenis Pelayaran
Type of Voyage
Kendaraan ( Unit) Vehicles (Unit)
Hewan (Ekor) Animal (Heads)
Penumpang (Orang) Passenger (person)
Bongkar Unloaded
Muat Loaded
Bongkar Unloaded
Muat Loaded
Turun Disembarked
Naik Embarked
(1) (8) (9) (10) (11) (12) (13)
1 B u t o n 1 215 905 0 0 478 924 520 806
2 M u n a 317 194 0 0 84 771 77 727
3 Konawe 6 37 0 0 1 330 1 084
4 Kolaka 518 72 0 0 27 528 12 818
5 Konawe Selatan 0 0 0 21 408 422 439 165
6 Bombana 36 466 28 154 0 41 266 327 260 429
7 Wakatobi 9 857 11 008 0 35 77 813 96 714
8 Kolaka Utara 3 333 2 833 0 1 19 958 20 628
9 Buton Utara 47 776 254 645 0 0 102 475 91 483
10 Konawe Utara 1 744 652 0 0 0 0
11 Kota Kendari 85 747 57 761 0 0 194 945 166 958
12 Kota Bau-Bau 0 0 0 0 71 687 64 421
J u m l a h/T o t a l
2 0 1 2 185 236 1 100 261 0 98 1 734 180 1 752 233
2 0 1 1 419 108 386 248 3 94 1 958 833 1 942 433
2 0 1 0 283 031 270 476 1 000 1 040 1 615 431 1 601 861
2 0 0 9 326 707 328 526 0 37 1 688 038 1 710 420
2 0 0 8 229 522 226 834 12 23 269 1 479 908 1 523 268
2 0 0 7 282 902 26 599 2 603 1 363 686 1 399 187
Sumber/Source: Administrator Pelabuhan Se-Sultra/Port Administrator of Sulawesi Tenggara Province
Lanjutan Tabel 8.3.2
Continued Table

ANGKUTAN DAN KOMUNIKASI
316 Sulawesi Tenggara Dalam Angka 2013
B u l a n Month
Lalu Lintas Pesawat Udara Aircraft Traffic
Lalu Lintas Penumpang (Orang) Passenger (Person)
Datang Arrival
Berangkat Departure
Datang Arrival
Berangkat Departure
Transit Transit
(1) (2) (3) (4) (5) (6)
Januari/January 508 508 42 458 42 209 -
Februari/February 521 521 41 281 41 516 -
Maret/March 580 580 44 935 46 840 -
April/April 581 581 48 530 46 404 -
Mei/May 589 589 46 781 46 525 -
Juni/June 607 607 45 617 52 178 -
Juli/July 584 584 48 790 51 232 -
Agustus/August 527 527 45 000 48 865 -
September/September 505 505 48 696 46 432 -
Oktober/October 477 477 45 056 45 136 -
Nopember/November 487 487 46 972 47 259 -
Desember/December 495 494 51 694 46 753 -
Jumlah/Total 6 461 6 460 555 810 561 349 -
Sumber/Source: Bandar Udara Se-Sulawesi Tenggara/Airport in Sulawesi Tenggara
8.4.1
Lalu Lintas Pesawat Terbang dan Penumpang melalui Pelabuhan Udara Se- Sulawesi Tenggara, 2012 Tabel
Table Aircraft and Passenger Traffic at Sulawesi Tenggara Province, 2012
8.4 Angkutan Udara
Air Transportation
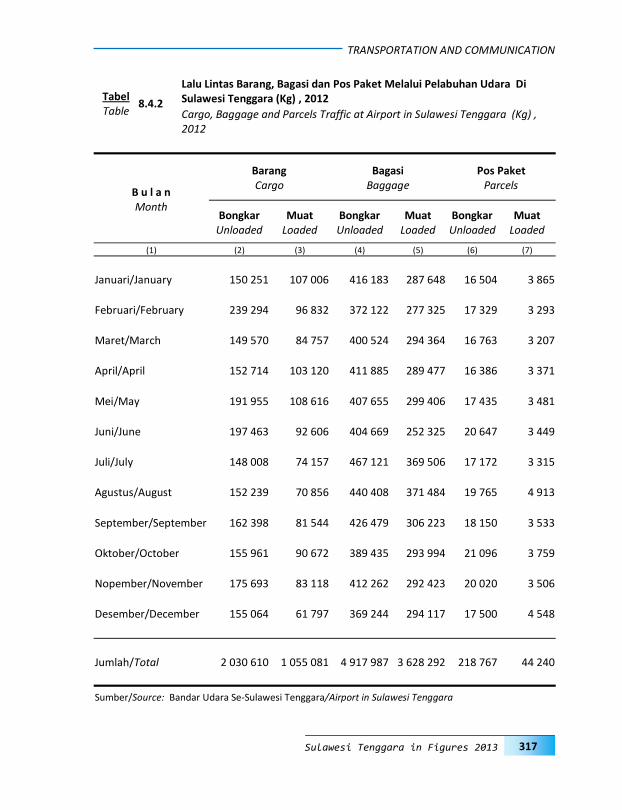
TRANSPORTATION AND COMMUNICATION
317 Sulawesi Tenggara in Figures 2013
B u l a n Month
Barang Cargo
Bagasi Baggage
Pos Paket Parcels
Bongkar Unloaded
Muat Loaded
Bongkar Unloaded
Muat Loaded
Bongkar Unloaded
Muat Loaded
(1) (2) (3) (4) (5) (6) (7)
Januari/January 150 251 107 006 416 183 287 648 16 504 3 865
Februari/February 239 294 96 832 372 122 277 325 17 329 3 293
Maret/March 149 570 84 757 400 524 294 364 16 763 3 207
April/April 152 714 103 120 411 885 289 477 16 386 3 371
Mei/May 191 955 108 616 407 655 299 406 17 435 3 481
Juni/June 197 463 92 606 404 669 252 325 20 647 3 449
Juli/July 148 008 74 157 467 121 369 506 17 172 3 315
Agustus/August 152 239 70 856 440 408 371 484 19 765 4 913
September/September 162 398 81 544 426 479 306 223 18 150 3 533
Oktober/October 155 961 90 672 389 435 293 994 21 096 3 759
Nopember/November 175 693 83 118 412 262 292 423 20 020 3 506
Desember/December 155 064 61 797 369 244 294 117 17 500 4 548
Jumlah/Total 2 030 610 1 055 081 4 917 987 3 628 292 218 767 44 240
Sumber/Source: Bandar Udara Se-Sulawesi Tenggara/Airport in Sulawesi Tenggara
8.4.2
Lalu Lintas Barang, Bagasi dan Pos Paket Melalui Pelabuhan Udara Di Sulawesi Tenggara (Kg) , 2012 Tabel
Table Cargo, Baggage and Parcels Traffic at Airport in Sulawesi Tenggara (Kg) , 2012
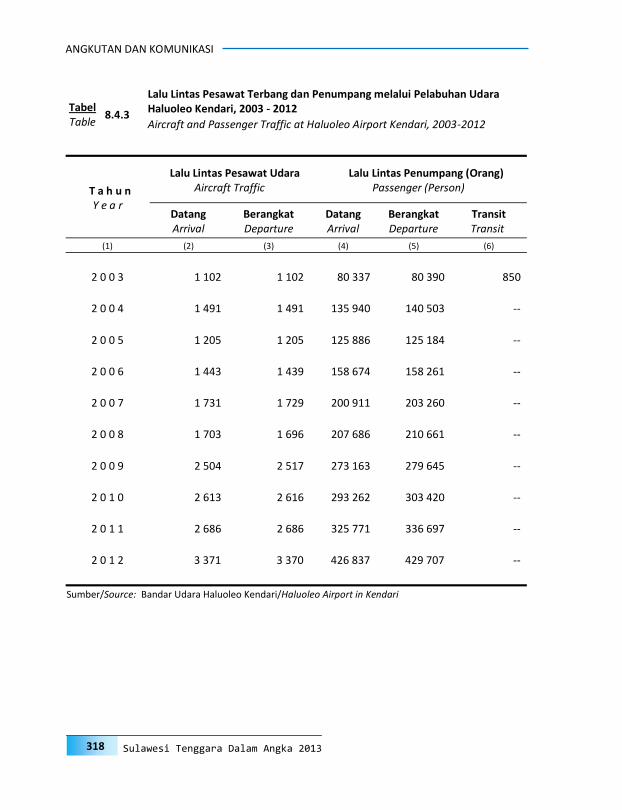
ANGKUTAN DAN KOMUNIKASI
318 Sulawesi Tenggara Dalam Angka 2013
T a h u n Y e a r
Lalu Lintas Pesawat Udara Aircraft Traffic
Lalu Lintas Penumpang (Orang) Passenger (Person)
Datang Arrival
Berangkat Departure
Datang Arrival
Berangkat Departure
Transit Transit
(1) (2) (3) (4) (5) (6)
2 0 0 3 1 102 1 102 80 337 80 390 850
2 0 0 4 1 491 1 491 135 940 140 503 --
2 0 0 5 1 205 1 205 125 886 125 184 --
2 0 0 6 1 443 1 439 158 674 158 261 --
2 0 0 7 1 731 1 729 200 911 203 260 --
2 0 0 8 1 703 1 696 207 686 210 661 --
2 0 0 9 2 504 2 517 273 163 279 645 --
2 0 1 0 2 613 2 616 293 262 303 420 --
2 0 1 1 2 686 2 686 325 771 336 697 --
2 0 1 2 3 371 3 370 426 837 429 707 --
Sumber/Source: Bandar Udara Haluoleo Kendari/Haluoleo Airport in Kendari
8.4.3
Lalu Lintas Pesawat Terbang dan Penumpang melalui Pelabuhan Udara Haluoleo Kendari, 2003 - 2012 Tabel
Table Aircraft and Passenger Traffic at Haluoleo Airport Kendari, 2003-2012

TRANSPORTATION AND COMMUNICATION
319 Sulawesi Tenggara in Figures 2013
T a h u n Y e a r
Lalu Lintas Pesawat Udara Aircraft Traffic
Lalu Lintas Penumpang (Orang) Passenger (Person)
Datang Arrival
Berangkat Departure
Datang Arrival
Berangkat Departure
Transit Transit
(1) (2) (3) (4) (5) (6)
2 0 0 8 243 243 6 805 4 710 -
2 0 0 9 282 282 5 778 5 250 7
2 0 1 0 1 224 1 224 37 055 34 853 2 818
2 0 1 1 1 431 1 433 48 750 43 658 0
2 0 1 2 1 471 1 471 57 988 56 773 -
Sumber/Source: Pelabuhan Udara Betoambari Bau-Bau/ Betoambari Bau-Bau Airport Catatan/notes : Pelabuhan Udara Betoambari baru beroperasi mulai akhir tahun 2007/ Betoambari Air-
port Starts to Operate since late 2007
8.4.4
Lalu Lintas Pesawat Terbang dan Penumpang melalui Pelabuhan Udara Betoambari Bau-Bau, 2012 Tabel
Table Aircraft and Aircraft Passenger Traffic at Betoambari Bau-Bau Airport, 2012

ANGKUTAN DAN KOMUNIKASI
320 Sulawesi Tenggara Dalam Angka 2013
T a h u n Y e a r
Lalu Lintas Pesawat Udara Aircraft Traffic
Lalu Lintas Penumpang (Orang) Passenger (Person)
Datang Arrival
Berangkat Departure
Datang Arrival
Berangkat Departure
Transit Transit
(1) (2) (3) (4) (5) (6)
2 0 0 8 -- -- -- -- --
2 0 0 9 -- -- -- -- --
2 0 1 0 226 226 11 613 12 846 --
2 0 1 1 730 730 46 635 47 509 --
2 0 1 2 1 012 1 012 56 998 59 302 -
Sumber/Source: Pelabuhan Udara Sangia Ni Bandera Kolaka/ Sangia Ni Bandera Airport, Kolaka Catatan/notes : Pelabuhan Udara Sangia Ni Bandera baru beroperasi mulai tahun 2010
Sangia Ni Bandera Airport Starts to Operate since 2010
8.4.5
Lalu Lintas Pesawat Terbang dan Penumpang melalui Pelabuhan Udara Sangia Ni Bandera Kolaka, 2012 Tabel
Table Aircraft and Aircraft Passenger Traffic at Sangia Ni Bandera Airport, Kolaka, 2012
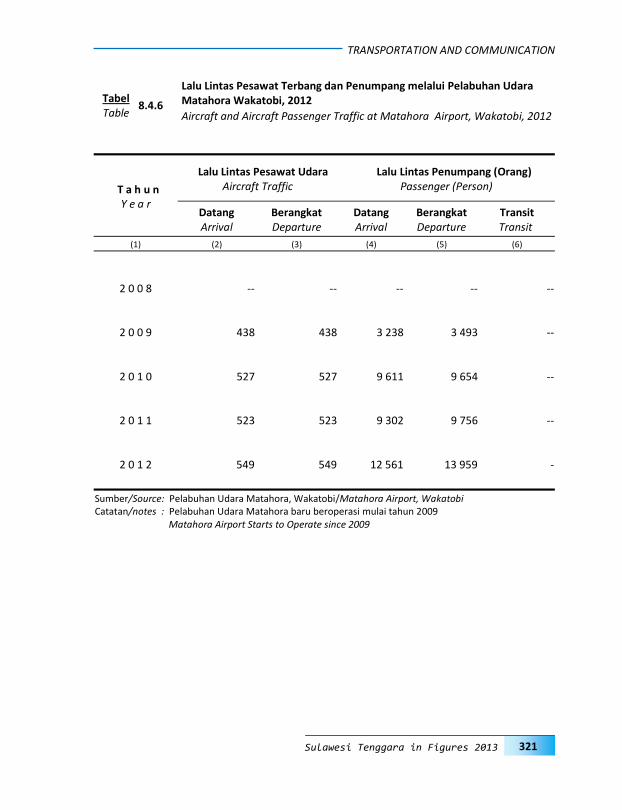
TRANSPORTATION AND COMMUNICATION
321 Sulawesi Tenggara in Figures 2013
T a h u n Y e a r
Lalu Lintas Pesawat Udara Aircraft Traffic
Lalu Lintas Penumpang (Orang) Passenger (Person)
Datang Arrival
Berangkat Departure
Datang Arrival
Berangkat Departure
Transit Transit
(1) (2) (3) (4) (5) (6)
2 0 0 8 -- -- -- -- --
2 0 0 9 438 438 3 238 3 493 --
2 0 1 0 527 527 9 611 9 654 --
2 0 1 1 523 523 9 302 9 756 --
2 0 1 2 549 549 12 561 13 959 -
Sumber/Source: Pelabuhan Udara Matahora, Wakatobi/Matahora Airport, Wakatobi Catatan/notes : Pelabuhan Udara Matahora baru beroperasi mulai tahun 2009
Matahora Airport Starts to Operate since 2009
8.4.6
Lalu Lintas Pesawat Terbang dan Penumpang melalui Pelabuhan Udara Matahora Wakatobi, 2012 Tabel
Table Aircraft and Aircraft Passenger Traffic at Matahora Airport, Wakatobi, 2012
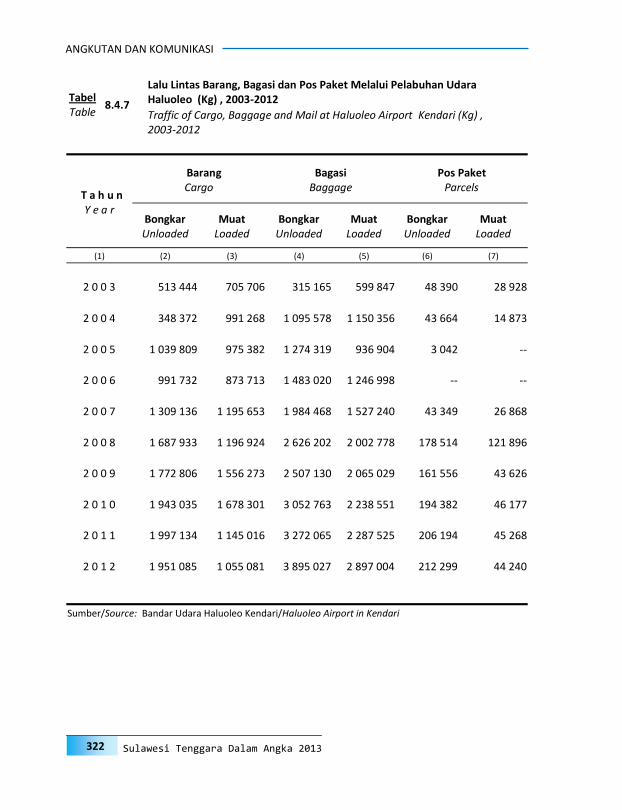
ANGKUTAN DAN KOMUNIKASI
322 Sulawesi Tenggara Dalam Angka 2013
T a h u n Y e a r
Barang Cargo
Bagasi Baggage
Pos Paket Parcels
Bongkar Unloaded
Muat Loaded
Bongkar Unloaded
Muat Loaded
Bongkar Unloaded
Muat Loaded
(1) (2) (3) (4) (5) (6) (7)
2 0 0 3 513 444 705 706 315 165 599 847 48 390 28 928
2 0 0 4 348 372 991 268 1 095 578 1 150 356 43 664 14 873
2 0 0 5 1 039 809 975 382 1 274 319 936 904 3 042 --
2 0 0 6 991 732 873 713 1 483 020 1 246 998 -- --
2 0 0 7 1 309 136 1 195 653 1 984 468 1 527 240 43 349 26 868
2 0 0 8 1 687 933 1 196 924 2 626 202 2 002 778 178 514 121 896
2 0 0 9 1 772 806 1 556 273 2 507 130 2 065 029 161 556 43 626
2 0 1 0 1 943 035 1 678 301 3 052 763 2 238 551 194 382 46 177
2 0 1 1 1 997 134 1 145 016 3 272 065 2 287 525 206 194 45 268
2 0 1 2 1 951 085 1 055 081 3 895 027 2 897 004 212 299 44 240
Sumber/Source: Bandar Udara Haluoleo Kendari/Haluoleo Airport in Kendari
8.4.7
Lalu Lintas Barang, Bagasi dan Pos Paket Melalui Pelabuhan Udara Haluoleo (Kg) , 2003-2012 Tabel
Table Traffic of Cargo, Baggage and Mail at Haluoleo Airport Kendari (Kg) , 2003-2012

TRANSPORTATION AND COMMUNICATION
323 Sulawesi Tenggara in Figures 2013
T a h u n Y e a r
Barang Cargo
Bagasi Baggage
Pos Paket Parcels
Bongkar Unloaded
Muat Loaded
Bongkar Unloaded
Muat Loaded
Bongkar Unloaded
Muat Loaded
(1) (2) (3) (4) (5) (6) (7)
2 0 0 8 1 171 -- 58 592 23 606 -- --
2 0 0 9 181 -- 45 484 35 969 -- --
2 0 1 0 3 833 -- 252 691 197 535 -- --
2 0 1 1 -- -- 388 532 279 774 -- --
2 0 1 2
-
- 494 198 350 099
-
-
Sumber/Source: Pelabuhan Udara Betoambari Bau-Bau/ Betoambari Bau-Bau Airport Catatan/notes : Pelabuhan Udara Betoambari baru beroperasi mulai akhir tahun 2007
Betoambari Airport Starts to Operate since late 2007
8.4.8
Lalu Lintas Barang, Bagasi dan Pos Paket Melalui Pelabuhan Udara Betoambari Bau-Bau (Kg) , 2012 Tabel
Table Cargo, Baggage and Parcels Traffic at Betoambari Bau-bau Airport (Kg) , 2012
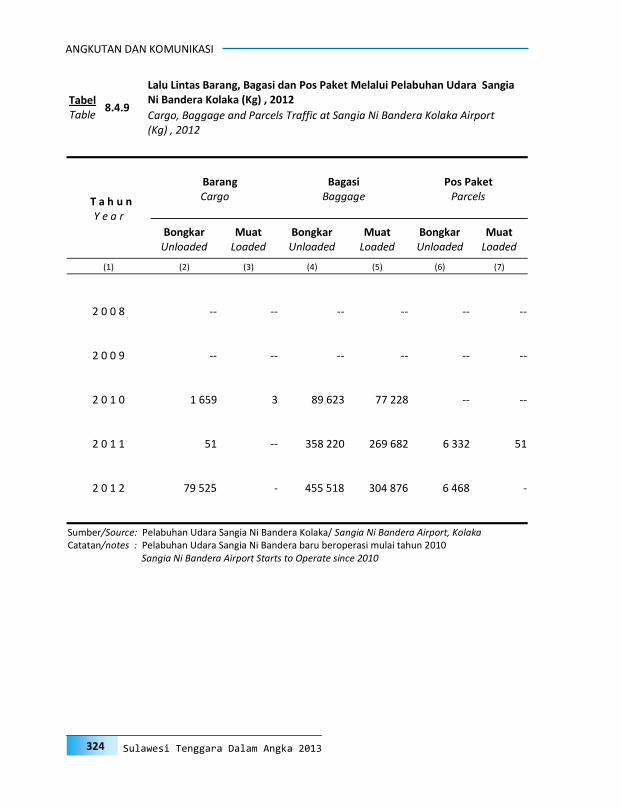
ANGKUTAN DAN KOMUNIKASI
324 Sulawesi Tenggara Dalam Angka 2013
T a h u n Y e a r
Barang Cargo
Bagasi Baggage
Pos Paket Parcels
Bongkar Unloaded
Muat Loaded
Bongkar Unloaded
Muat Loaded
Bongkar Unloaded
Muat Loaded
(1) (2) (3) (4) (5) (6) (7)
2 0 0 8 -- -- -- -- -- --
2 0 0 9 -- -- -- -- -- --
2 0 1 0 1 659 3 89 623 77 228 -- --
2 0 1 1 51 -- 358 220 269 682 6 332 51
2 0 1 2 79 525
- 455 518 304 876 6 468 -
Sumber/Source: Pelabuhan Udara Sangia Ni Bandera Kolaka/ Sangia Ni Bandera Airport, Kolaka Catatan/notes : Pelabuhan Udara Sangia Ni Bandera baru beroperasi mulai tahun 2010
Sangia Ni Bandera Airport Starts to Operate since 2010
8.4.9
Lalu Lintas Barang, Bagasi dan Pos Paket Melalui Pelabuhan Udara Sangia Ni Bandera Kolaka (Kg) , 2012 Tabel
Table Cargo, Baggage and Parcels Traffic at Sangia Ni Bandera Kolaka Airport (Kg) , 2012
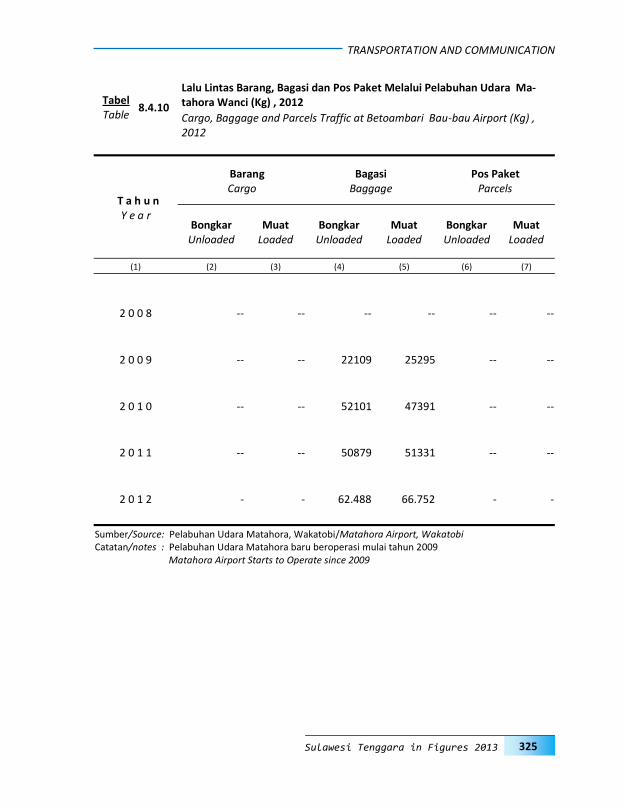
TRANSPORTATION AND COMMUNICATION
325 Sulawesi Tenggara in Figures 2013
T a h u n Y e a r
Barang Cargo
Bagasi Baggage
Pos Paket Parcels
Bongkar Unloaded
Muat Loaded
Bongkar Unloaded
Muat Loaded
Bongkar Unloaded
Muat Loaded
(1) (2) (3) (4) (5) (6) (7)
2 0 0 8 -- -- -- -- -- --
2 0 0 9 -- -- 22109 25295 -- --
2 0 1 0 -- -- 52101 47391 -- --
2 0 1 1 -- -- 50879 51331 -- --
2 0 1 2
-
-
62.488
66.752 - -
Sumber/Source: Pelabuhan Udara Matahora, Wakatobi/Matahora Airport, Wakatobi Catatan/notes : Pelabuhan Udara Matahora baru beroperasi mulai tahun 2009
Matahora Airport Starts to Operate since 2009
8.4.10
Lalu Lintas Barang, Bagasi dan Pos Paket Melalui Pelabuhan Udara Ma-tahora Wanci (Kg) , 2012 Tabel
Table Cargo, Baggage and Parcels Traffic at Betoambari Bau-bau Airport (Kg) , 2012
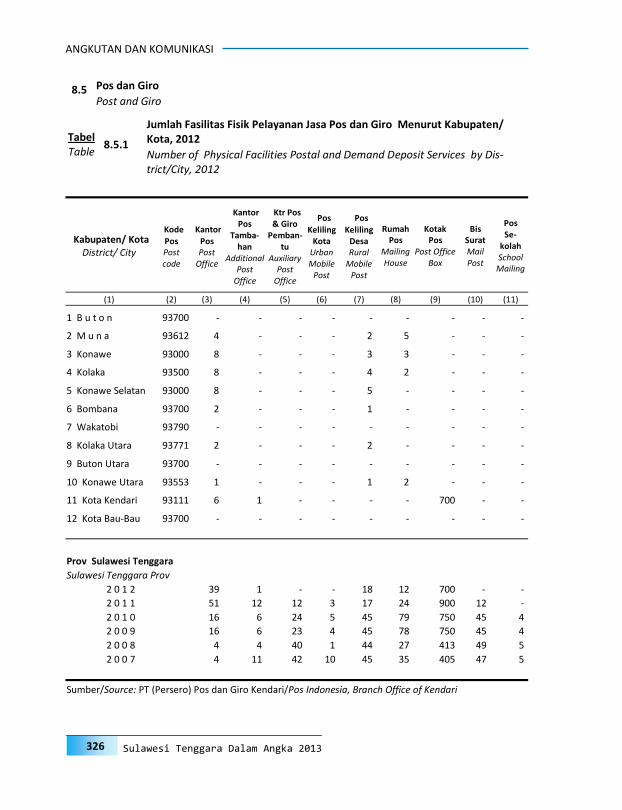
ANGKUTAN DAN KOMUNIKASI
326 Sulawesi Tenggara Dalam Angka 2013
Kode
Pos Post code
Kantor
Pos Post
Office
Kantor Pos
Tamba-han
Additional Post
Office
Ktr Pos & Giro
Pemban-tu
Auxiliary Post
Office
Pos
Keliling Kota
Urban Mobile
Post
Pos
Keliling Desa Rural
Mobile Post
Rumah Pos
Mailing House
Kotak Pos
Post Office Box
Bis Surat Mail Post
Pos Se-
kolah School
Mailing
Kabupaten/ Kota District/ City
(1) (2) (3) (4) (5) (6) (7) (8) (9) (10) (11)
1 B u t o n 93700 - - - - - - - - -
2 M u n a 93612 4 - - - 2 5 - - -
3 Konawe 93000 8 - - - 3 3 - - -
4 Kolaka 93500 8 - - - 4 2 - - -
5 Konawe Selatan 93000 8 - - - 5 - - - -
6 Bombana 93700 2 - - - 1 - - - -
7 Wakatobi 93790 - - - - - - - - -
8 Kolaka Utara 93771 2 - - - 2 - - - -
9 Buton Utara 93700 - - - - - - - - -
10 Konawe Utara 93553 1 - - - 1 2 - - -
11 Kota Kendari 93111 6 1 - - - - 700 - -
12 Kota Bau-Bau 93700 - - - - - - - - -
Prov Sulawesi Tenggara
Sulawesi Tenggara Prov
2 0 1 2 39 1 - - 18 12 700 - -
2 0 1 1 51 12 12 3 17 24 900 12 -
2 0 1 0 16 6 24 5 45 79 750 45 4
2 0 0 9 16 6 23 4 45 78 750 45 4
2 0 0 8 4 4 40 1 44 27 413 49 5
2 0 0 7 4 11 42 10 45 35 405 47 5
Sumber/Source: PT (Persero) Pos dan Giro Kendari/Pos Indonesia, Branch Office of Kendari
8.5.1
Jumlah Fasilitas Fisik Pelayanan Jasa Pos dan Giro Menurut Kabupaten/Kota, 2012 Tabel
Table Number of Physical Facilities Postal and Demand Deposit Services by Dis-trict/City, 2012
8.5 Pos dan Giro
Post and Giro
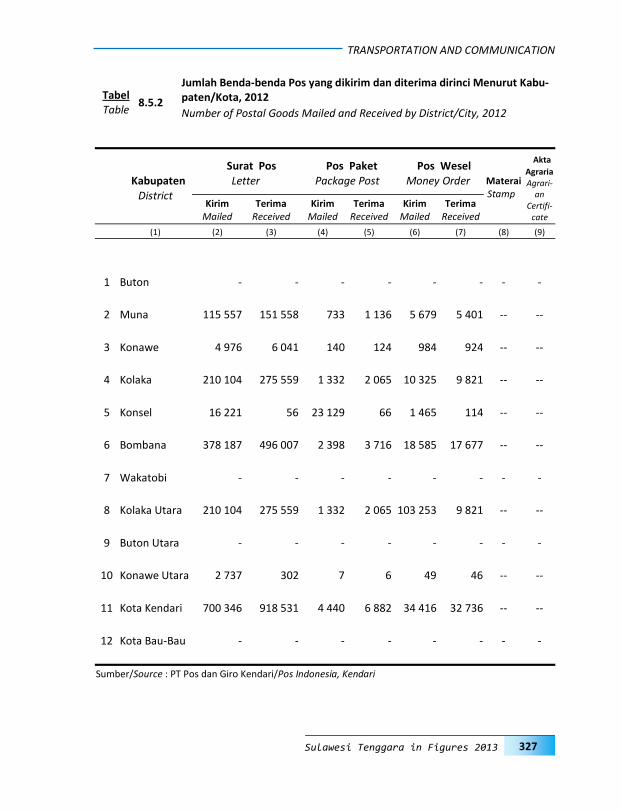
TRANSPORTATION AND COMMUNICATION
327 Sulawesi Tenggara in Figures 2013
Kabupaten
District
Surat Pos Letter
Pos Paket Package Post
Pos Wesel Money Order Materai
Stamp
Akta
Agraria Agrari-
an Certifi-
cate
Kirim Mailed
Terima Received
Kirim Mailed
Terima Received
Kirim Mailed
Terima Received
(1) (2) (3) (4) (5) (6) (7) (8) (9)
1 Buton - - - - - - - -
2 Muna 115 557 151 558 733 1 136 5 679 5 401 -- --
3 Konawe 4 976 6 041 140 124 984 924 -- --
4 Kolaka 210 104 275 559 1 332 2 065 10 325 9 821 -- --
5 Konsel 16 221 56 23 129 66 1 465 114 -- --
6 Bombana 378 187 496 007 2 398 3 716 18 585 17 677 -- --
7 Wakatobi - - - - - - - -
8 Kolaka Utara 210 104 275 559 1 332 2 065 103 253 9 821 -- --
9 Buton Utara - - - - - - - -
10 Konawe Utara 2 737 302 7 6 49 46 -- --
11 Kota Kendari 700 346 918 531 4 440 6 882 34 416 32 736 -- --
12 Kota Bau-Bau - - - - - - - -
Sumber/Source : PT Pos dan Giro Kendari/Pos Indonesia, Kendari
8.5.2
Jumlah Benda-benda Pos yang dikirim dan diterima dirinci Menurut Kabu-paten/Kota, 2012 Tabel
Table Number of Postal Goods Mailed and Received by District/City, 2012

ANGKUTAN DAN KOMUNIKASI
328 Sulawesi Tenggara Dalam Angka 2013
Jenis Pengiriman Kind of Dispatch
D i k i r i m D i t e r i m a
S e n t Received
Dalam Negeri Luar Negeri Dalam Negeri Luar Negeri
Domestic International Domestic International
(1) (2) (3) (4) (5)
1 Surat biasa (surat, warkat 112 722 6 041 167 990 924
pos, kartu pos, barang
cetakan, surat kabar,
surat pos dinas)/standard
mail (letter, aerogramme,
post card, form, newspaper,
official mail)
2 Surat kilat/pos kilat 220 467 4 330 340 790 6 698
khusus/express mail
3 Surat pos tercatat kilat 271 986 0 417 514 0
express-registered mail
4 Surat pos tercatat biasa 0 215 0 334
standard-registered mail
5 Surat pos terdaftar 540 0 837 0
Registered mail
6 Pos paket/Package post 4 580 78 6 882 121
7 Pos wesel/money order 35 221 0 32 736 0
Junlah/Total
2 0 1 2 645 516 10 664 966 749 8 077
2 0 1 1 2 736 880 7 214 3 929 816 21 322
2 0 1 0 362 143 34 166 1 974 320 38 608
2 0 0 9 979 435 33 125 1 735 255 31 928
2 0 0 8 947 044 18 211 1 079 123 9 713
2 0 0 7 647 275 4 911 898 726 12 131
2 0 0 6 510 779 6 494 558 783 15 011
Sumber/Source: PT (Persero) Pos dan Giro Kendari/Pos Indonesia, Kendari
8.5.3
Banyaknya Benda-benda Pos yang Dikirim dan Diterima dari Dalam dan
Luar Negeri menurut Jenis Pengiriman (Kg) , 2012 Tabel
Table Number of Postal Goods Sent and Receivedthrough Domestic and Interna-
tional Traffic (Kg), 2012

TRANSPORTATION AND COMMUNICATION
329 Sulawesi Tenggara in Figures 2013
8.5.4
Kapasitas Sentral dan Sambungan Telepon menurut Unit Pengelola Tehnik
(UPT), 2012 Tabel
Table Central Capacity and Telephone Connection by UPT (Technical Administrator
Unit), 2012
Kapasitas Sentral Sambungan Telepon
Kantor/ Office Otomatis Telephone Connection
Automatic Induk Cabang
Central Capacity Central Branch
(1) (2) (3) (4)
1. Bau-Bau 6.346 5.763 0
2. R a h a 3.092 2.204 0
3. Kendari 16.840 16.593 0
4. Kolaka 4.346 3.624 0
5. Wanci 1.000 457 0
6. Unaaha 1.970 1.674 0
Prov. Sulawesi Tenggara
Sulawesi Tenggara Prov.
2 0 1 2 33.594 30.315 0
2 0 1 1 32.004 28.707 -
2 0 1 0 21.970 16.253 -
2 0 0 9 33.490 28.433 -
Sumber/Source: PT (Persero) Pos dan Giro Kendari/Pos Indonesia, Kendari
ANGKUTAN DAN KOMUNIKASI
330 Sulawesi Tenggara Dalam Angka 2013
Halaman ini sengaja dikosongkan This page left blank intentionally

H O T E L A N D T O U R I S M
HOTEL DAN 9PARIWISATA
HOTEL AND TOURISM
333 Sulawesi Tenggara in Figures 2013
PENJELASAN TEKNIS
1. Konsep dan definisi pariwisata mengikuti
rekomendasi World Tourism Organization (WTO) dan International Union of Office Travel Organization (IUOTO).
2. Wisatawan mancanegara ialah setiap pengunjung yang mengunjungi suatu negara di luar tempat tinggalnya, didorong oleh satu atau beberapa keperluan tanpa bermaksud memperoleh penghasilan di tempat yang dikunjungi dan lamanya kun-jungan tersebut tidak lebih dari satu tahun (12 bulan). Definisi ini mencakup 2 (dua) kategori wisatawan mancanegara, yaitu :
a. Wisatawan (turis) ialah setiap pengunjung seperti definisi di atas yang tinggal paling sedikit 24 jam, akan tetapi tidak lebih dari 1 (satu) tahun di tempat yang dikunjungi, dengan maksud antara lain: berlibur, rekreasi, olah raga, bisnis, menghadiri pertemuan, studi dan kunjungan dengan alasan kesehatan.
b. Excursionist ialah setiap pengunjung
seperti definisi di atas yang tinggal kurang dari 24 jam di tempat yang dikunjungi (termasuk “Cruise Passen-gers”). Cruise Passengers ialah setiap pengunjung yang tiba di suatu negara di mana mereka tidak menginap di akomodasi yang tersedia di negara tersebut, misalnya dengan kapal laut.
3. Penerimaan negara dari wisatawan
mancanegara adalah hasil kali antara rata-rata pengeluaran wisman per kunjungan dengan jumlah kunjungan wisman.
TECHNICAL NOTES
1. The concept and definition of tourism
refers to the recommendations of the World Tourism Organization (WTO) and International Union of Office Travel Organizations (IUOTO).
2. A foreign visitor is any person visiting a country other than his usual place of residence for any reason other than for earning income in the country visited, and the length of stay is no more than one year (12 months). This definition covers two categories of foreign visi-tors, namely :
a. “Tourist” is any visitor staying for at
least 24 hours, but not more than one year, in the country visited, with the intention of visiting, and for any of these purposes such as: Pleasure, recreation and sports, Business, visiting friends and rela-tives, missions, attending meetings, conferences, visit for health reasons and study.
b. “Excursionist” is any visitor staying less than 24 hours in the country visited including “Cruise Passen-gers”, i.e. visitors arriving in a coun-try without staying in any accom-modation available in the visited country.
3. Revenue from foreign visitor is the
number of foreign visitors in Indonesia multiplied by the average expendi-tures per visit.

HOTEL DAN PARIWISATA
334 Sulawesi Tenggara Dalam Angka 2013
4. Akomodasi ialah suatu usaha yang
menggunakan suatu bangunan atau seba-gian bangunan yang disediakan secara khusus, dan setiap orang dapat menginap, makan serta memperoleh pelayanan dan fasilitas lainnya dengan pembayaran. Akomodasi dibedakan anta-ra hotel dan akomodasi lainnya. Ciri khu-sus dari hotel adalah mempunyai restoran yang berada di bawah mana-jemen hotel tersebut.
5. Hotel berbintang yaitu hotel yang telah memenuhi persyaratan yang telah diten-tukan seperti persyaratan fisik, bentuk pelayanan yang diberikan, kualifikasi tenaga kerja, jumlah kamar dan lainnya. Hotel tidak berbintang yaitu hotel yang tidak memenuhi persyaratan yang telah ditentukan.
6. Tingkat penghunian kamar hotel adalah
persentase banyaknya malam kamar yang dihuni terhadap banyaknya malam kamar yang tersedia.
7. Rata-rata lamanya tamu menginap adalah
hasil bagi antara banyaknya malam tem-pat tidur yang terpakai dengan banyak-nya tamu yang menginap di hotel dan akomodasi lainnya.
4. An accommodation is an establish-
ment using a building or a part of a building, prepared commercially for any person to stay, eat and obtain service as well as other facilities. Ac-commodation is segregated into hotel and other accommodations. The spe-cial characteristic of a hotel is having a restaurant under the hotel manage-ment.
5. A classified hotel is an accommoda-
tion which meets specified standards regarding physical requirements, ser-vices provided, manpower qualifica-tions, number of rooms available, etc. A non-classified hotel is an accommo-dation which has not met the require-ments previously mentioned.
6. Room Occupancy Rate is the number
of roomnights occupied divided by the number of roomnights available, mul-tiplied by 100 percent.
7. Average length of stay is the number
of bed-nights used divided by the number of guests staying at the ac-commodation.

HOTEL AND TOURISM
335 Sulawesi Tenggara in Figures 2013
9.1
Jumlah Hotel/Akomodasi, Kamar dan Tempat Tidur menurut Kabupaten/Kota, 2012 Gambar
Figure Number of Hotels/Acomodation, Rooms and Beds by District/City, 2012
Sumber/Source : Badan Pusat Statistik/BPS-Statistics Indonesia

HOTEL DAN PARIWISATA
336 Sulawesi Tenggara Dalam Angka 2013
9.2
Jumlah Tamu pada Hotel Bintang dan Non Bintang menurut Kabupaten/Kota, 2012 Gambar
Figure Number of Guests at Classified and Non Classified Hotel by District/City, 2012
Sumber/Source : Badan Pusat Statistik/BPS-Statistics Indonesia

HOTEL AND TOURISM
337 Sulawesi Tenggara in Figures 2013
9.3
Rata-rata Lamanya Menginap Tamu Dalam Negeri dan Tamu Asing
pada Hotel Bintang dan Non Bintang (Hari), 2012 Gambar Figure Average Length of Stay of Domestic and Foreign Guest at Classified
Non Classified Hotels (Days), 2012
Sumber/Source : Badan Pusat Statistik/BPS-Statistics Indonesia
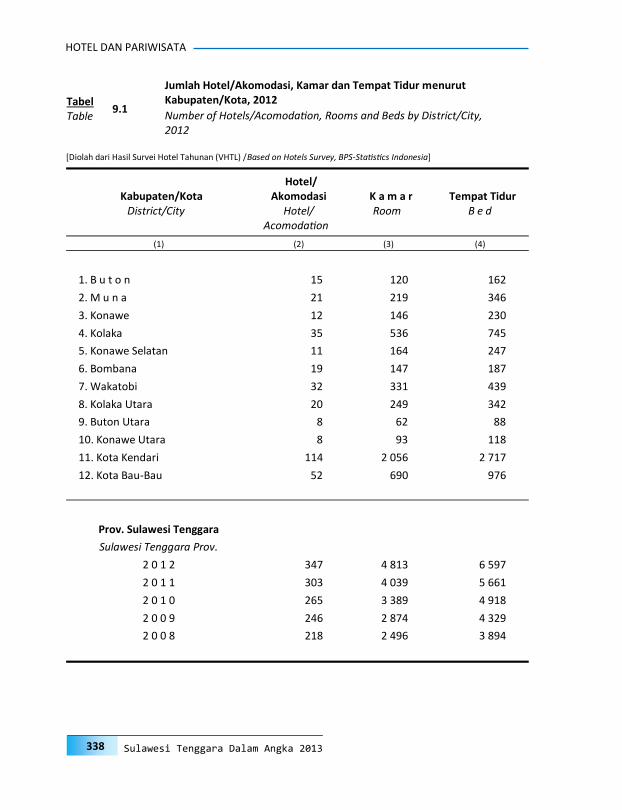
HOTEL DAN PARIWISATA
338 Sulawesi Tenggara Dalam Angka 2013
Kabupaten/Kota District/City
Hotel/Akomodasi
Hotel/Acomodation
K a m a r Room
Tempat Tidur B e d
(1) (2) (3) (4)
1. B u t o n 15 120 162
2. M u n a 21 219 346
3. Konawe 12 146 230
4. Kolaka 35 536 745
5. Konawe Selatan 11 164 247
6. Bombana 19 147 187
7. Wakatobi 32 331 439
8. Kolaka Utara 20 249 342
9. Buton Utara 8 62 88
10. Konawe Utara 8 93 118
11. Kota Kendari 114 2 056 2 717
12. Kota Bau-Bau 52 690 976
Prov. Sulawesi Tenggara
Sulawesi Tenggara Prov.
2 0 1 2 347 4 813 6 597
2 0 1 1 303 4 039 5 661
2 0 1 0 265 3 389 4 918
2 0 0 9 246 2 874 4 329
2 0 0 8 218 2 496 3 894
9.1
Jumlah Hotel/Akomodasi, Kamar dan Tempat Tidur menurut Kabupaten/Kota, 2012 Tabel
Table Number of Hotels/Acomodation, Rooms and Beds by District/City, 2012
[Diolah dari Hasil Survei Hotel Tahunan (VHTL) /Based on Hotels Survey, BPS-Statistics Indonesia]
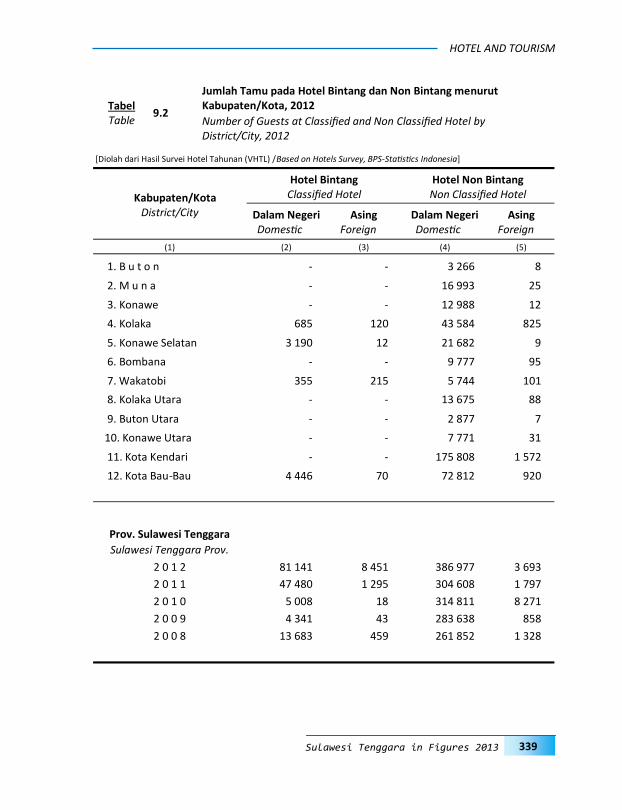
HOTEL AND TOURISM
339 Sulawesi Tenggara in Figures 2013
Kabupaten/Kota District/City
Hotel Bintang Classified Hotel
Hotel Non Bintang Non Classified Hotel
Dalam Negeri Domestic
Asing Foreign
Dalam Negeri Domestic
Asing Foreign
(1) (2) (3) (4) (5)
1. B u t o n - - 3 266 8
2. M u n a - - 16 993 25
3. Konawe - - 12 988 12
4. Kolaka 685 120 43 584 825
5. Konawe Selatan 3 190 12 21 682 9
6. Bombana - - 9 777 95
7. Wakatobi 355 215 5 744 101
8. Kolaka Utara - - 13 675 88
9. Buton Utara - - 2 877 7
10. Konawe Utara - - 7 771 31
11. Kota Kendari - - 175 808 1 572
12. Kota Bau-Bau 4 446 70 72 812 920
Prov. Sulawesi Tenggara
Sulawesi Tenggara Prov.
2 0 1 2 81 141 8 451 386 977 3 693
2 0 1 1 47 480 1 295 304 608 1 797
2 0 1 0 5 008 18 314 811 8 271
2 0 0 9 4 341 43 283 638 858
2 0 0 8 13 683 459 261 852 1 328
9.2
Jumlah Tamu pada Hotel Bintang dan Non Bintang menurut Kabupaten/Kota, 2012 Tabel
Table Number of Guests at Classified and Non Classified Hotel by District/City, 2012
[Diolah dari Hasil Survei Hotel Tahunan (VHTL) /Based on Hotels Survey, BPS-Statistics Indonesia]

HOTEL DAN PARIWISATA
340 Sulawesi Tenggara Dalam Angka 2013
Kabupaten/Kota District/City
Hotel Bintang Classified Hotel
Hotel Non Bintang Non Classified Hotel
Kamar Room
T. Tidur Bed
Kamar Room
T. Tidur Bed
(1) (2) (3) (4) (5)
1. B u t o n - - 120 162
2. M u n a - - 219 346
3. Konawe - - 146 230
4. Kolaka 93 133 443 612
5. Konawe Selatan 48 78 116 169
6. Bombana - - 147 187
7. Wakatobi 29 34 302 405
8. Kolaka Utara - - 249 342
9. Buton Utara - - 62 88
10. Konawe Utara - - 93 118
11. Kota Kendari 568 776 1 488 1 941
12. Kota Bau-Bau 32 56 658 920
Prov. Sulawesi Tenggara
Sulawesi Tenggara Prov.
2 0 1 2 770 1 077 4 043 5 520
2 0 1 1 487 715 3 552 4 946
2 0 1 0 32 56 3 357 4 862
2 0 0 9 32 56 2 842 4 273
2 0 0 8 105 166 2 391 3 728
9.3
Jumlah Kamar dan Tempat Tidur pada Hotel Bintang dan Hotel Non
Berbintang menurut Kabupaten/Kota, 2012 Tabel Table Number of Rooms and Beds at Classified and Non Classified Hotel by Dis-
trict/City, 2012
[Diolah dari Hasil Survei Hotel Tahunan (VHTL) /Based on Hotels Survey, BPS-Statistics Indonesia]
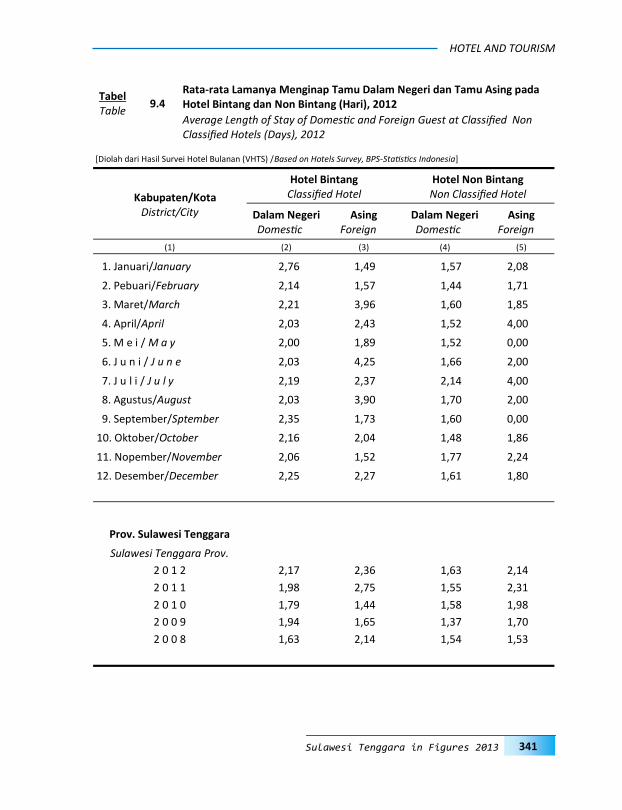
HOTEL AND TOURISM
341 Sulawesi Tenggara in Figures 2013
Kabupaten/Kota District/City
Hotel Bintang Classified Hotel
Hotel Non Bintang Non Classified Hotel
Dalam Negeri Domestic
Asing Foreign
Dalam Negeri Domestic
Asing Foreign
(1) (2) (3) (4) (5)
1. Januari/January 2,76 1,49 1,57 2,08
2. Pebuari/February 2,14 1,57 1,44 1,71
3. Maret/March 2,21 3,96 1,60 1,85
4. April/April 2,03 2,43 1,52 4,00
5. M e i / M a y 2,00 1,89 1,52 0,00
6. J u n i / J u n e 2,03 4,25 1,66 2,00
7. J u l i / J u l y 2,19 2,37 2,14 4,00
8. Agustus/August 2,03 3,90 1,70 2,00
9. September/Sptember 2,35 1,73 1,60 0,00
10. Oktober/October 2,16 2,04 1,48 1,86
11. Nopember/November 2,06 1,52 1,77 2,24
12. Desember/December 2,25 2,27 1,61 1,80
Prov. Sulawesi Tenggara
Sulawesi Tenggara Prov.
2 0 1 2 2,17 2,36 1,63 2,14
2 0 1 1 1,98 2,75 1,55 2,31
2 0 1 0 1,79 1,44 1,58 1,98
2 0 0 9 1,94 1,65 1,37 1,70
2 0 0 8 1,63 2,14 1,54 1,53
9.4 Rata-rata Lamanya Menginap Tamu Dalam Negeri dan Tamu Asing pada Hotel Bintang dan Non Bintang (Hari), 2012
Tabel Table
Average Length of Stay of Domestic and Foreign Guest at Classified Non Classified Hotels (Days), 2012
[Diolah dari Hasil Survei Hotel Bulanan (VHTS) /Based on Hotels Survey, BPS-Statistics Indonesia]
HOTEL DAN PARIWISATA
342 Sulawesi Tenggara Dalam Angka 2013
Halaman ini sengaja dikosongkan This page intentionally left blank
F I N A N C E A N D P R I C E S
KEUANGAN DAN
10HARGA-HARGA
345
FINANCE AND PRICES
Sulawesi Tenggara in Figures 2013
PENJELASAN TEKNIS
1. Data harga yang disajikan meliputi : a. Harga eceran beberapa jenis barang
di pasar Kendari b. Indeks Harga Konsumen (IHK) dan
inflasi c. Indeks harga yang diterima dan
dibayar Petani.
2. Harga eceran beberapa jenis barang di Kota Kendari diolah dari hasil survei mingguan, dua mingguan, dan bulanan BPS Provinsi Sulawesi Tenggara.
Indeks Harga Konsumen (IHK) yang meru-pakan indikator inflasi di Kota Kendari, mencakup sekitar 349 komoditas yang dihitung berdasarkan pola konsumsi hasil Survei Biaya Hidup (SBH) di Kota Kendari tahun 2007.
4. IHK mencakup 7 kelompok yaitu: bahan
makanan; makanan jadi, minuman, rokok, dan tembakau; perumahan, air, listrik, gas, dan bahan bakar; sandang; kesehatan; pendidikan, rekreasi, dan olahraga; transpor, komunikasi, dan jasa keuangan.
5. Metoda yang digunakan dalam penghi-
tungan Indeks Harga Konsumen (IHK) adalah Formula Laspeyres yang telah dimodifikasi.
Inflasi/Deflasi
a. Persentase (%) perubahan IHK (inflasi/ deflasi) bulanan diperoleh dari rumus,
TECHNICAL NOTES
1. Price statistics cover : a. Retail prices of several commodi-
ties in Kendari b. Consumer Price Index (CPI) and
inflation rates c. Indices of prices received and
paid by farmers.
2. The retail prices of several commodities in Kendari are compiled from the weekly, forthnightly, and monthly survey conducted by the BPS-Provincial Office of Sulawesi Tengara.
The Consumer Price Index (CPI) which
is the indicator of inflation, has been developed from the consumption pat-pattern of the 2007 Cost of Living Sur-vey (CLS) conducted in Kendari, cover-ing 349 commodities.
4. Commodities of CPI consist of 7 groups
as follows: foodstuff; prepare food, beverages, and tobacco products; housing, water, electricity, gas and fuel; clothing; health; education, recre-ation and sports; transportation, com-munication, and financial services.
5. The method used in calculating Con-
sumer Price Indices (CPI) is the modi-fied Laspeyres formula .
6. Inflation/Deflation
a. The percentage change of the monthly CPI (inflation rate) is obtained from the formula,
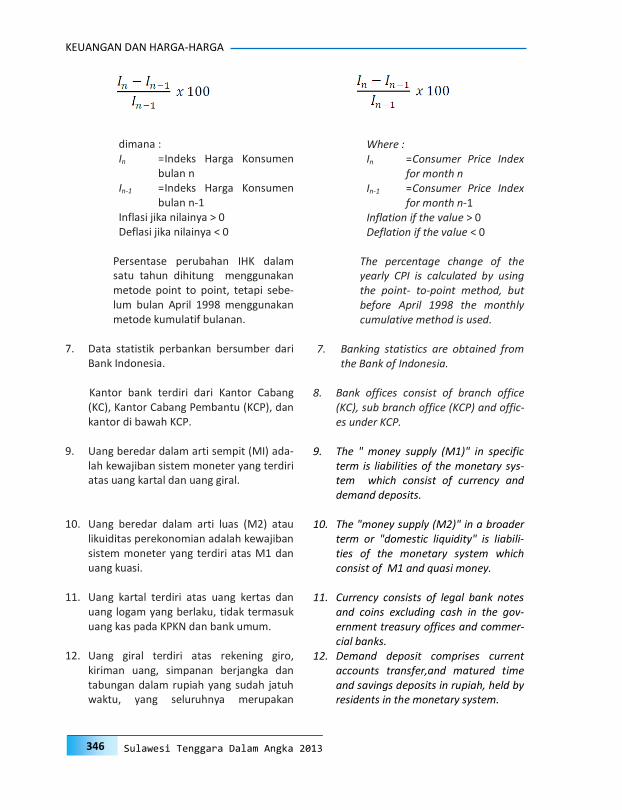
346
KEUANGAN DAN HARGA-HARGA
Sulawesi Tenggara Dalam Angka 2013
dimana : In = Indeks Harga Konsumen
bulan n In-1 = Indeks Harga Konsumen
bulan n-1 Inflasi jika nilainya > 0 Deflasi jika nilainya < 0
Persentase perubahan IHK dalam
satu tahun dihitung menggunakan metode point to point, tetapi sebe-lum bulan April 1998 menggunakan metode kumulatif bulanan.
7. Data statistik perbankan bersumber dari
Bank Indonesia.
Kantor bank terdiri dari Kantor Cabang (KC), Kantor Cabang Pembantu (KCP), dan kantor di bawah KCP.
9. Uang beredar dalam arti sempit (MI) ada-
lah kewajiban sistem moneter yang terdiri atas uang kartal dan uang giral.
10. Uang beredar dalam arti luas (M2) atau
likuiditas perekonomian adalah kewajiban sistem moneter yang terdiri atas M1 dan uang kuasi.
11. Uang kartal terdiri atas uang kertas dan
uang logam yang berlaku, tidak termasuk uang kas pada KPKN dan bank umum.
12. Uang giral terdiri atas rekening giro,
kiriman uang, simpanan berjangka dan tabungan dalam rupiah yang sudah jatuh waktu, yang seluruhnya merupakan
Where : In = Consumer Price Index
for month n In-1 = Consumer Price Index
for month n-1 Inflation if the value > 0 Deflation if the value < 0
The percentage change of the
yearly CPI is calculated by using the point- to-point method, but before April 1998 the monthly cumulative method is used.
7. Banking statistics are obtained from
the Bank of Indonesia.
8. Bank offices consist of branch office (KC), sub branch office (KCP) and offic-es under KCP.
9. The " money supply (M1)" in specific
term is liabilities of the monetary sys-tem which consist of currency and demand deposits.
10. The "money supply (M2)" in a broader
term or "domestic liquidity" is liabili-ties of the monetary system which consist of M1 and quasi money.
11. Currency consists of legal bank notes and coins excluding cash in the gov-ernment treasury offices and commer-cial banks.
12. Demand deposit comprises current accounts transfer,and matured time and savings deposits in rupiah, held by residents in the monetary system.

347
FINANCE AND PRICES
Sulawesi Tenggara in Figures 2013
simpanan penduduk dalam rupiah pada sistem moneter.
Uang kuasi terdiri atas simpanan
berjangka dan tabungan penduduk pada bank umum,baik dalam rupiah maupun valuta asing.
14. Data statistik penanaman modal yang
disetujui pemerintah terdiri dari Penanaman Modal Asing (PMA) dan Penanaman Modal Dalam Negeri (PMDN) bersumber dari Badan Koordinasi Penanaman Modal (BKPM). Data mengenai realisasi investasi penanaman modal tidak termasuk sektor minyak, asuransi dan perbankan. Data telah memperhatikan perubahan investasi yang beralih status dan juga pengurangan investasi yang dicabut izin usahanya.
15. Data perusahaan asuransi bersumber dari
Departemen Keuangan. Jenis asuransi terdiri dari:
Asuransi Jiwa
Asuransi Kerugian
Reasuransi
Penyelenggara program asuransi
sosial dan Jamsostek
Penyelenggara asuransi untuk PNS
dan TNI Polri
Data perkoperasian bersumber dari Dinas Koperasi dan UKM. Data koperasi yang disajikan meliputi :
Jumlah usaha koperasi Volume usaha koperasi Sisa hasil usaha
Quasi money consists of time and savings deposits in rupiah and foreign currency held by residents in commer-cial banks.
14. Data on foreign and domestic invest-
ments approved by government are obtained from the Investment Coordi-nating Board (BKPM). Realization of investment in current year exclude those investments in petroleum pro-duction, insurance, and banking sec-tors. Changes in investment status and those who their license was take off have been taken into account.
15. Data for insurances are generated
from the Department of Finance. Types of insurance are:
Life insurance
Non life insurance
Reinsurance
Company which runs social in-
surance program and Worker Social Insurance
Company which runs insurance
program for Civil Servant and Army Forces-Police.
16. Data for cooperatives are generated
from the Service of Cooperatives and Small and Medium Enterprises. Types of cooperatives data are :
Number of cooperatives Cooperative scale Net income
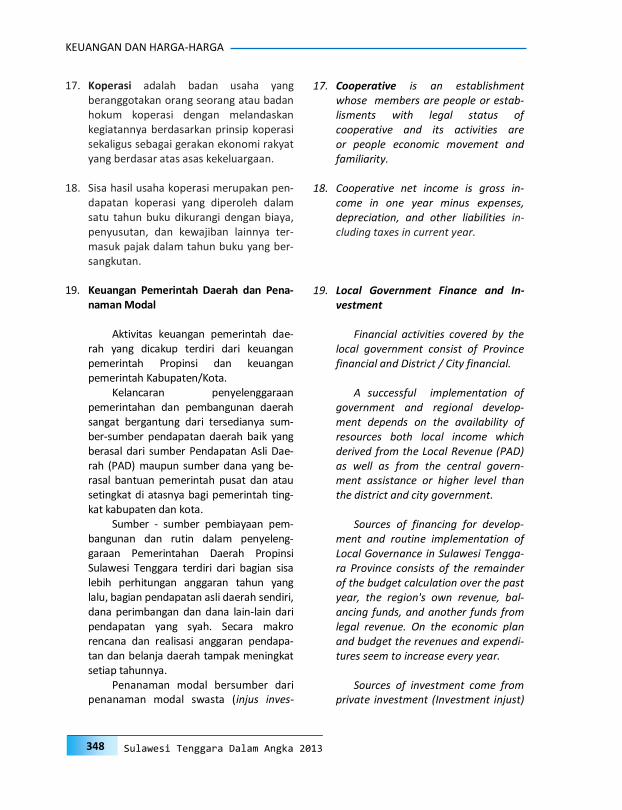
348
KEUANGAN DAN HARGA-HARGA
Sulawesi Tenggara Dalam Angka 2013
17. Koperasi adalah badan usaha yang beranggotakan orang seorang atau badan hokum koperasi dengan melandaskan kegiatannya berdasarkan prinsip koperasi sekaligus sebagai gerakan ekonomi rakyat yang berdasar atas asas kekeluargaan.
18. Sisa hasil usaha koperasi merupakan pen-
dapatan koperasi yang diperoleh dalam satu tahun buku dikurangi dengan biaya, penyusutan, dan kewajiban lainnya ter-masuk pajak dalam tahun buku yang ber-sangkutan.
19. Keuangan Pemerintah Daerah dan Pena-
naman Modal
Aktivitas keuangan pemerintah dae-rah yang dicakup terdiri dari keuangan pemerintah Propinsi dan keuangan pemerintah Kabupaten/Kota.
Kelancaran penyelenggaraan pemerintahan dan pembangunan daerah sangat bergantung dari tersedianya sum-ber-sumber pendapatan daerah baik yang berasal dari sumber Pendapatan Asli Dae-rah (PAD) maupun sumber dana yang be-rasal bantuan pemerintah pusat dan atau setingkat di atasnya bagi pemerintah ting-kat kabupaten dan kota.
Sumber - sumber pembiayaan pem-bangunan dan rutin dalam penyeleng-garaan Pemerintahan Daerah Propinsi Sulawesi Tenggara terdiri dari bagian sisa lebih perhitungan anggaran tahun yang lalu, bagian pendapatan asli daerah sendiri, dana perimbangan dan dana lain-lain dari pendapatan yang syah. Secara makro rencana dan realisasi anggaran pendapa-tan dan belanja daerah tampak meningkat setiap tahunnya.
Penanaman modal bersumber dari penanaman modal swasta (injus inves-
17. Cooperative is an establishment whose members are people or estab-lisments with legal status of cooperative and its activities are or people economic movement and familiarity.
18. Cooperative net income is gross in-
come in one year minus expenses, depreciation, and other liabilities in-cluding taxes in current year.
19. Local Government Finance and In-
vestment
Financial activities covered by the local government consist of Province financial and District / City financial.
A successful implementation of
government and regional develop-ment depends on the availability of resources both local income which derived from the Local Revenue (PAD) as well as from the central govern-ment assistance or higher level than the district and city government.
Sources of financing for develop-
ment and routine implementation of Local Governance in Sulawesi Tengga-ra Province consists of the remainder of the budget calculation over the past year, the region's own revenue, bal-ancing funds, and another funds from legal revenue. On the economic plan and budget the revenues and expendi-tures seem to increase every year.
Sources of investment come from
private investment (Investment injust)

349
FINANCE AND PRICES
Sulawesi Tenggara in Figures 2013
ment) baik PMDN maupun PMA dan pe-nanaman modal dari pemerintah (autonomous invesment). Umumnya kedua jenis penanaman modal tersebut memiliki ciri khas yang sangat berbeda dalam pengembalian modal. Bagi penana-man modal swasta orientasinya dalam jangka waktu pendek, sedangkan modal/investasi yang bersumber dari modal pemerintah pengembalian modal di-lakukan dalam jangka waktu panjang.
Lahirnya Undang-Undang Otonomi Daerah dan Undang-Undang Perim-bangan Ekonomi Pusat dan Daerah, me-mungkinkan bagi pemerintah daerah untuk meningkatkan penggalian sumber-sumber pendapatan daerah. Upaya pe-ningkatan melalui investasi atau penana-man modal di daerah semakin mem-berikan peluang yang lebih besar. Potensi sumber daya alam Sulawesi Tenggara yang memiliki share dan prospektif untuk dikembangkan masih terbatas pada sek-tor pertanian dan sektor jasa lainnya.
20. Perpajakan, Pajak di Sulawesi Tenggara
yang terdiri dari pajak pendapatan daerah, pajak perusahaan dan pajak bumi dan bangunan (PBB)
21. Perbankan, Peranan perbankan di Sula-
wesi Tenggara dapat dilihat dari per-kembangan jumlah kantor, jumlah dana yang tersedia di bank dan jumlah kredit/pinjaman yang disalurkan oleh bank.
22. Koperasi, Kebijaksanaan pemerintah da-lam pembinaan koperasi ditujukan agar koperasi menjadi lembaga ekonomi yang kuat dan menjadi wadah utama untuk membina kemampuan usaha golongan ekonomi lemah.
both foreign and domestic investment and the government investment (autonomous Investment). Generally these two types of investments have characteristics that differ greatly in the return on capital. For the orienta-tion of private investment is capital return in a short term, while the government source of investment is in the long term.
The establishment of the Regional Autonomy Law and the Fiscal Balance Law between the Central Government and the regions allows the local governments to improve the extraction of the regional sources. Efforts to increase through investment or regional investment provide a greater opportunity. The potential of natural resources of Sulawesi Tengga-ra province whose share and prospec-tive to be developed is still limited to the agricultural sector and other ser-vice sectors.
20. Taxes, Taxes in Sulawesi Tenggara
consist of local income tax, corporate tax and property tax (PBB).
21. Banking, The role of banks in Sulawesi
Tenggara can be seen from the increasing number of offices, the amount of funds available in the bank and the amount of loans provided by banks.
Cooperative, Government policy guid-
ance is intended to guide cooperatives to become strong economic institu-tions and the main source for building the business skills of the economically weak class.

350
KEUANGAN DAN HARGA-HARGA
Sulawesi Tenggara Dalam Angka 2013
23. Harga-Harga, Kegiatan pendataan harga pada kurun waktu tertentu merupakan suatu aktivitas dalam rangka memantau kegiatan perekonomian, karena harga merupakan salah satu indikator makro untuk mengukur tingkat stabilitas ekonomi atau keseimbangan antara penawaran dan permintaan akan barang dan jasa.
23. Prices, Price data collection activities at a particular time is an activity to monitor the economic movement, because the price is an indicator to measure the level of macro economic stability or the balance between sup-ply and demand for goods and ser-vices.
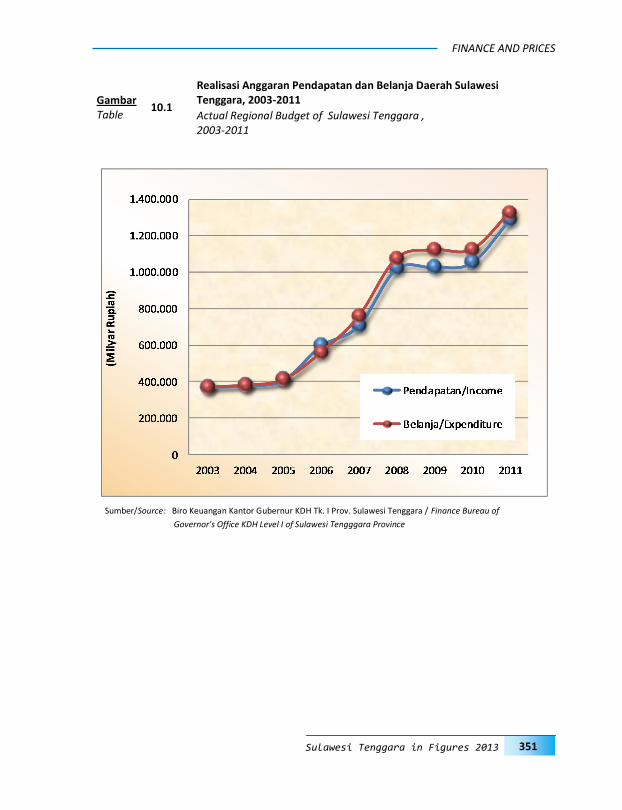
351
FINANCE AND PRICES
Sulawesi Tenggara in Figures 2013
10.1
Realisasi Anggaran Pendapatan dan Belanja Daerah Sulawesi Tenggara, 2003-2011 Gambar
Table Actual Regional Budget of Sulawesi Tenggara , 2003-2011
Sumber/Source: Biro Keuangan Kantor Gubernur KDH Tk. I Prov. Sulawesi Tenggara / Finance Bureau of
Governor's Office KDH Level I of Sulawesi Tengggara Province
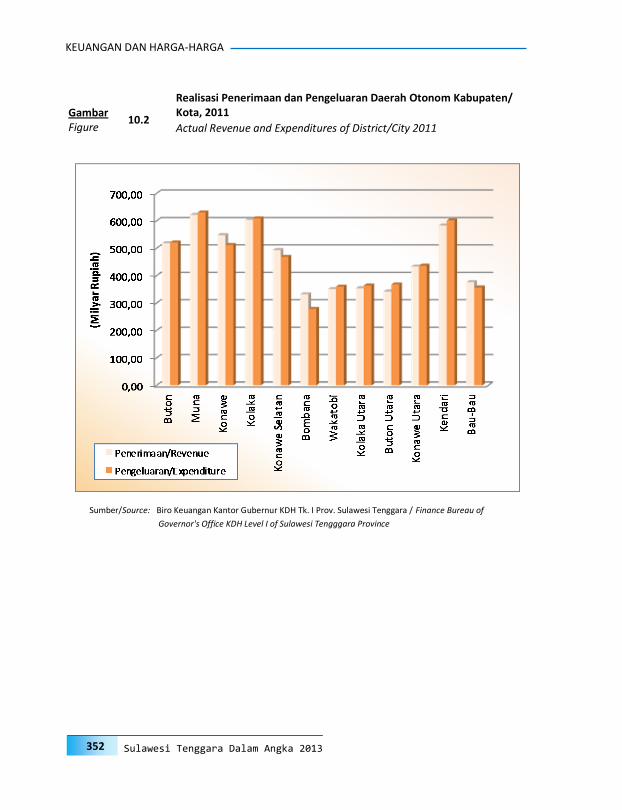
352
KEUANGAN DAN HARGA-HARGA
Sulawesi Tenggara Dalam Angka 2013
10.2
Realisasi Penerimaan dan Pengeluaran Daerah Otonom Kabupaten/Kota, 2011 Gambar
Figure Actual Revenue and Expenditures of District/City 2011
Sumber/Source: Biro Keuangan Kantor Gubernur KDH Tk. I Prov. Sulawesi Tenggara / Finance Bureau of
Governor's Office KDH Level I of Sulawesi Tengggara Province
353
FINANCE AND PRICES
Sulawesi Tenggara in Figures 2013
10.3
Perkembangan Giro, Deposito dan Tabungan Keadaan 31 Desember 2003- 2012 Gambar
Figure Giro, Deposit Bank and Saving Progress at December 31St
2003-2012
Sumber/Source: Bank Indonesia Cabang Kendari/Bank of Indonesia, Branch Office of Kendari
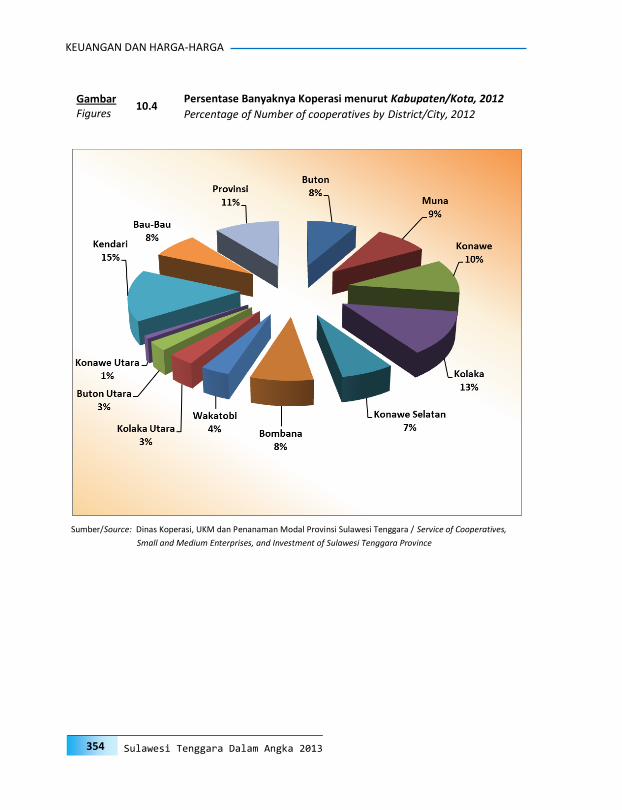
354
KEUANGAN DAN HARGA-HARGA
Sulawesi Tenggara Dalam Angka 2013
10.4 Persentase Banyaknya Koperasi menurut Kabupaten/Kota, 2012 Gambar
Figures Percentage of Number of cooperatives by District/City, 2012
Sumber/Source: Dinas Koperasi, UKM dan Penanaman Modal Provinsi Sulawesi Tenggara / Service of Cooperatives,
Small and Medium Enterprises, and Investment of Sulawesi Tenggara Province

355
FINANCE AND PRICES
Sulawesi Tenggara in Figures 2013
Pendapatan (Juta Rp) Belanja (Juta Rp)
T a h u n Revenues (Million Rps) Expenditures (Million Rps)
Y e a r Rencana Realisasi Rencana Realisasi
Planning Realization Planning Realization
(1) (2) (3) (4) (5)
2 0 0 3 369 815 371 501 369 815 371 501
2 0 0 4 390 070 381 326 393 631 381 299
2 0 0 5 416 506 411 362 416 505 411 352
2 0 0 6 604 261 598 369 629 283 561 198
2 0 0 7 686 970 709 299 682 928 759 061
2 0 0 8 908 701 1 021 376 883 699 1 077 454
2 0 0 9 1 268 219 1 030 720 1 378 708 1 123 906
2 0 1 0 1 147 217 1 055 174 1 320 577 1 125 688
2 0 1 1 1 220 580 1 288 980 1 405 830 1 328 025
Sumber/Source: Biro Keuangan Kantor Gubernur KDH Tk. I Prov. Sulawesi Tenggara / Finance Bureau of Governor's Office KDH Level I of Sulawesi Tengggara Province
10.1.1
Rencana dan Realisasi Anggaran Pendapatan dan Belanja Daerah Provinsi Sulawesi Tenggara, 2003 - 2011 Tabel
Table Planning and Realization of Regional Budget of Sulawesi Tenggara Province, 2003 - 2011
10.1. Keuangan Finance
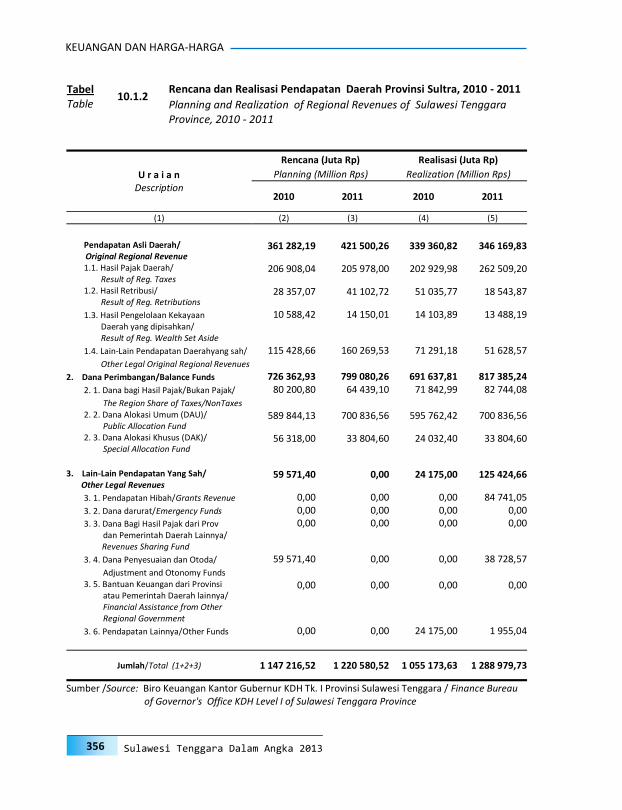
356
KEUANGAN DAN HARGA-HARGA
Sulawesi Tenggara Dalam Angka 2013
Rencana (Juta Rp) Realisasi (Juta Rp)
U r a i a n Planning (Million Rps) Realization (Million Rps)
Description 2010 2011 2010 2011
(1) (2) (3) (4) (5)
Pendapatan Asli Daerah/
Original Regional Revenue 361 282,19 421 500,26 339 360,82 346 169,83
1.1. Hasil Pajak Daerah/ Result of Reg. Taxes
206 908,04 205 978,00 202 929,98 262 509,20
1.2. Hasil Retribusi/ Result of Reg. Retributions
28 357,07 41 102,72 51 035,77 18 543,87
1.3. Hasil Pengelolaan Kekayaan 10 588,42 14 150,01 14 103,89 13 488,19 Daerah yang dipisahkan/ Result of Reg. Wealth Set Aside
1.4. Lain-Lain Pendapatan Daerahyang sah/ 115 428,66 160 269,53 71 291,18 51 628,57 Other Legal Original Regional Revenues
2. Dana Perimbangan/Balance Funds 726 362,93 799 080,26 691 637,81 817 385,24 2. 1. Dana bagi Hasil Pajak/Bukan Pajak/ 80 200,80 64 439,10 71 842,99 82 744,08 The Region Share of Taxes/NonTaxes 2. 2. Dana Alokasi Umum (DAU)/ Public Allocation Fund
589 844,13 700 836,56 595 762,42 700 836,56
2. 3. Dana Alokasi Khusus (DAK)/ Special Allocation Fund
56 318,00 33 804,60 24 032,40 33 804,60
3. Lain-Lain Pendapatan Yang Sah/ Other Legal Revenues
59 571,40 0,00 24 175,00 125 424,66
3. 1. Pendapatan Hibah/Grants Revenue 0,00 0,00 0,00 84 741,05 3. 2. Dana darurat/Emergency Funds 0,00 0,00 0,00 0,00 3. 3. Dana Bagi Hasil Pajak dari Prov 0,00 0,00 0,00 0,00 dan Pemerintah Daerah Lainnya/
Revenues Sharing Fund
3. 4. Dana Penyesuaian dan Otoda/ 59 571,40 0,00 0,00 38 728,57 Adjustment and Otonomy Funds 3. 5. Bantuan Keuangan dari Provinsi atau Pemerintah Daerah lainnya/
0,00 0,00 0,00 0,00
Financial Assistance from Other Regional Government
3. 6. Pendapatan Lainnya/Other Funds 0,00 0,00 24 175,00 1 955,04
Jumlah/Total (1+2+3) 1 147 216,52 1 220 580,52 1 055 173,63 1 288 979,73
Sumber /Source: Biro Keuangan Kantor Gubernur KDH Tk. I Provinsi Sulawesi Tenggara / Finance Bureau of Governor's Office KDH Level I of Sulawesi Tenggara Province
10.1.2 Rencana dan Realisasi Pendapatan Daerah Provinsi Sultra, 2010 - 2011 Tabel
Table Planning and Realization of Regional Revenues of Sulawesi Tenggara Province, 2010 - 2011
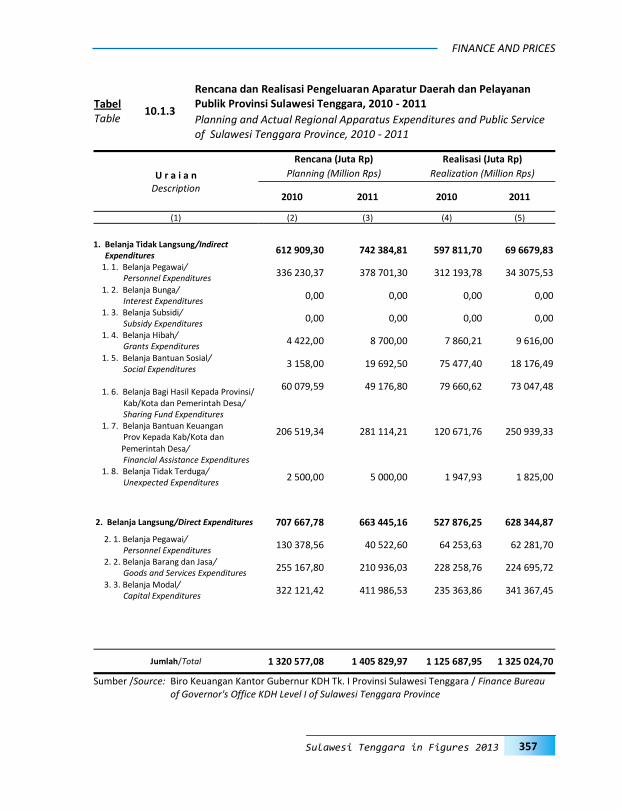
357
FINANCE AND PRICES
Sulawesi Tenggara in Figures 2013
Rencana (Juta Rp) Realisasi (Juta Rp)
U r a i a n Planning (Million Rps) Realization (Million Rps)
Description 2010 2011 2010 2011
(1) (2) (3) (4) (5)
1. Belanja Tidak Langsung/Indirect
Expenditures 612 909,30 742 384,81 597 811,70 69 6679,83
1. 1. Belanja Pegawai/ Personnel Expenditures
336 230,37 378 701,30 312 193,78 34 3075,53
1. 2. Belanja Bunga/ Interest Expenditures
0,00 0,00 0,00 0,00
1. 3. Belanja Subsidi/ Subsidy Expenditures
0,00 0,00 0,00 0,00
1. 4. Belanja Hibah/ Grants Expenditures
4 422,00 8 700,00 7 860,21 9 616,00
1. 5. Belanja Bantuan Sosial/ Social Expenditures
3 158,00 19 692,50 75 477,40 18 176,49
1. 6. Belanja Bagi Hasil Kepada Provinsi/ 60 079,59 49 176,80 79 660,62 73 047,48
Kab/Kota dan Pemerintah Desa/ Sharing Fund Expenditures
1. 7. Belanja Bantuan Keuangan Prov Kepada Kab/Kota dan
206 519,34 281 114,21 120 671,76 250 939,33
Pemerintah Desa/ Financial Assistance Expenditures
1. 8. Belanja Tidak Terduga/ Unexpected Expenditures
2 500,00 5 000,00 1 947,93 1 825,00
2. Belanja Langsung/Direct Expenditures 707 667,78 663 445,16 527 876,25 628 344,87
2. 1. Belanja Pegawai/ Personnel Expenditures
130 378,56 40 522,60 64 253,63 62 281,70
2. 2. Belanja Barang dan Jasa/ Goods and Services Expenditures
255 167,80 210 936,03 228 258,76 224 695,72
3. 3. Belanja Modal/ Capital Expenditures
322 121,42 411 986,53 235 363,86 341 367,45
Jumlah/Total 1 320 577,08 1 405 829,97 1 125 687,95 1 325 024,70
Sumber /Source: Biro Keuangan Kantor Gubernur KDH Tk. I Provinsi Sulawesi Tenggara / Finance Bureau of Governor's Office KDH Level I of Sulawesi Tenggara Province
10.1.3
Rencana dan Realisasi Pengeluaran Aparatur Daerah dan Pelayanan Publik Provinsi Sulawesi Tenggara, 2010 - 2011 Tabel
Table Planning and Actual Regional Apparatus Expenditures and Public Service of Sulawesi Tenggara Province, 2010 - 2011

358
KEUANGAN DAN HARGA-HARGA
Sulawesi Tenggara Dalam Angka 2013
Rencana (Juta Rp) Realisasi (Juta Rp)
U r a i a n Planning (Million Rps) Realization (Million Rps)
Explanation 2010 2011 2010 2011
(1) (2) (3) (4) (5)
PEMBIAYAAN DAERAH (1-2)/Regional Financing -- 185 249,46 78 841,98 43 406,53
Penerimaan Pembiayaan Daerah/
Regional Revenue -- 311 279,05 106 197,61 198 733,02
1. 1. Sisa Lebih Perhitungan Anggaran -- 31 279,05 31 279,10 8 327,66 Tahun Anggaran Sebelumnya/Remaining
Balance of the Previous Fiscal
1. 2. Pencairan Dana Cadangan/Disbursement of Reserve Funds
-- 0,00 0,00 0,00
1. 3. Hasil Penjualan Kekayaan Daerah/Result of Reg.Wealth Exploitation
-- 0,00 0,00 0,00
1. 4. Penerimaan Pinjaman Daerah/Revenue on Regional Loans
-- 280 000,00 0,00 190 000,00
1. 5. Penerimaan Kembali Pemberian Pinjaman/Revenue on Loans
-- 0,00 74 787,21 405,36
1. 6. Penerimaan Piutang Daerah/Revenue on Regional Claims
-- 0,00 0,00 0,00
1. 7. Penerimaan Lainnya/Other Revenue -- 0,00 131,30 0,00
2. Pengeluaran Pembiayaan Daerah/ Regional Expenditures -- 126 029,59 27 355,63 155 326,49
2. 1. Pembentukan dana Cadangan/Establishing Reserve Funds
-- 0,00 0,00 0,00
2. 2. Penyertaan Modal(Investasi) -- 10 000,00 14 800,00 1 905,88 Pemerintah Daerah/Capital Inclusion
(Investment)
2. 3. Pembayaran Pokok Utang/Payment of Main Debts
-- 116 029,59 12 555,63 78 633,40
2. 4. Pemberian Pinjaman Daerah/Regional Loan Management
-- 0,00 0,00 0,00
2. 5. Pengeluaran Lainnya/Other Expenditures -- 0,00 0,00 74 787,21
3. Sisa Lebih Pembiayaan Anggaran/Budget Financing Revenue -- 0,01 8 327,66 7 361,56
Sumber/Source : Biro Keuangan Kantor Gubernur KDH Tk.I Provinsi Sulawesi Tenggara /Finance Bureau of Governor's Office KDH Level I of Sulawesi Tenggara Province
10.1.4
Rencana dan Realisasi Pembiayaan Pemerintah Daerah Provinsi Sulawesi Tenggara Menurut Jenis Pembiayaan, 2010 - 2011 Tabel
Table Planning and Financing Realization of Sulawesi Tenggara Provincial Goverment by Kind of Financing, 2010 - 2011

359
FINANCE AND PRICES
Sulawesi Tenggara in Figures 2013
Pendapatan Belanja Pembiayaan (Juta Rp)
Kabupaten/Kota (Juta Rp) (Juta Rp) Financing (Milllion Rps)
District/City Revenues Expenditures Penerimaan Pengeluaran
(Million Rps) (Million Rps) Revenues Expenditures (1) (2) (3) (4) (5)
1. B u t o n 639 235,91 614 678,45 45 892,03 755,65
2. M u n a 691 128,09 698 081,04 9 598,51 2 645,56
3. Konawe 667 968,28 662 320,60 78 523,66 66 256,82
4. Kolaka 717 761,92 676 021,51 20 077,21 30 453,15
5. Konawe Selatan 581 012,86 575 071,68 15 662,97 8 000,16
6. Bombana 426 363,12 374 191,66 56 075,92 340,00
7. Wakatobi 407 740,34 389 190,77 15944,26 1 382,38
8. Kolaka Utara 420 916,08 431 592,74 17 076,00 6 399,34
9. Buton Utara 352 965,62 365 762,32 29 784,93 4 947,91
10. Konawe Utara 476 212,36 477 244,37 2 607,01 1 575,00
11. Kendari 696 804,77 684 117,22 23 523,83 16 066,68
12. Bau-Bau 488 779,83 451 092,76 17 008,79 1 198,64
Jumlah/Total 6 566 889,18 6 399 365,12 331 775,12 140 021,29
Sumber /Source: Biro Keuangan Kantor Gubernur KDH Tk. I Provinsi Sulawesi Tenggara/ Finance Bureau of Governor's Office KDH Level I of Sulawesi Tenggara Province
10.1.5
Realisasi Pendapatan, Belanja dan Pembiayaan Daerah Kabupaten/Kota Menurut Jenis Pendapatan, 2011 Tabel
Table Realization of Regional Income, Expenditures, and Financing of District/City by Kind of Income, 2011
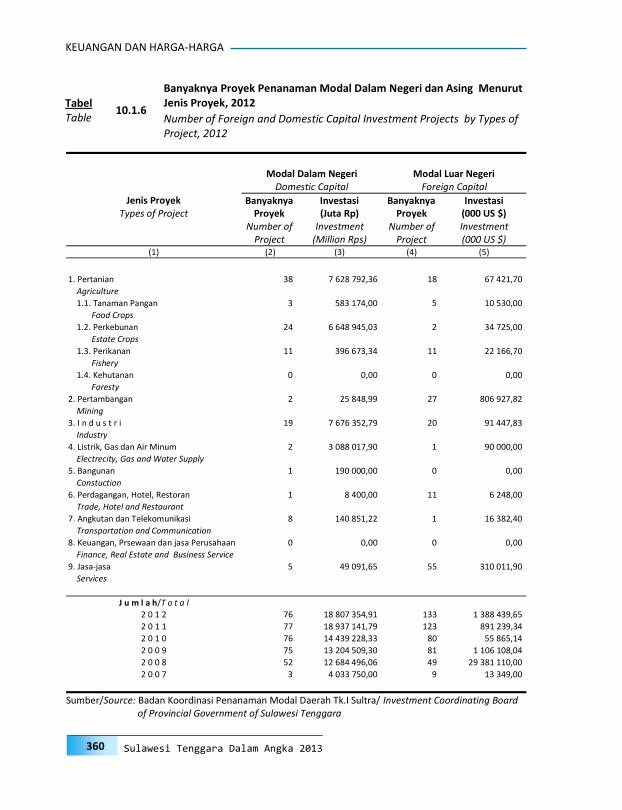
360
KEUANGAN DAN HARGA-HARGA
Sulawesi Tenggara Dalam Angka 2013
Modal Dalam Negeri Modal Luar Negeri
Domestic Capital Foreign Capital
Jenis Proyek Banyaknya Investasi Banyaknya Investasi Types of Project Proyek (Juta Rp) Proyek (000 US $)
Number of Investment Number of Investment Project (Million Rps) Project (000 US $)
(1) (2) (3) (4) (5)
1. Pertanian 38 7 628 792,36 18 67 421,70
Agriculture
1.1. Tanaman Pangan 3 583 174,00 5 10 530,00
Food Crops
1.2. Perkebunan 24 6 648 945,03 2 34 725,00
Estate Crops
1.3. Perikanan 11 396 673,34 11 22 166,70
Fishery
1.4. Kehutanan 0 0,00 0 0,00
Foresty
2. Pertambangan 2 25 848,99 27 806 927,82
Mining
3. I n d u s t r i 19 7 676 352,79 20 91 447,83
Industry
4. Listrik, Gas dan Air Minum 2 3 088 017,90 1 90 000,00
Electrecity, Gas and Water Supply
5. Bangunan 1 190 000,00 0 0,00
Constuction
6. Perdagangan, Hotel, Restoran 1 8 400,00 11 6 248,00
Trade, Hotel and Restaurant
7. Angkutan dan Telekomunikasi 8 140 851,22 1 16 382,40
Transportation and Communication
8. Keuangan, Prsewaan dan jasa Perusahaan 0 0,00 0 0,00
Finance, Real Estate and Business Service
9. Jasa-jasa 5 49 091,65 55 310 011,90
Services
J u m l a h/T o t a l
2 0 1 2 76 18 807 354,91 133 1 388 439,65
2 0 1 1 77 18 937 141,79 123 891 239,34
2 0 1 0 76 14 439 228,33 80 55 865,14
2 0 0 9 75 13 204 509,30 81 1 106 108,04
2 0 0 8 52 12 684 496,06 49 29 381 110,00
2 0 0 7 3 4 033 750,00 9 13 349,00
Sumber/Source: Badan Koordinasi Penanaman Modal Daerah Tk.I Sultra/ Investment Coordinating Board of Provincial Government of Sulawesi Tenggara
10.1.6
Banyaknya Proyek Penanaman Modal Dalam Negeri dan Asing Menurut Jenis Proyek, 2012 Tabel
Table Number of Foreign and Domestic Capital Investment Projects by Types of Project, 2012
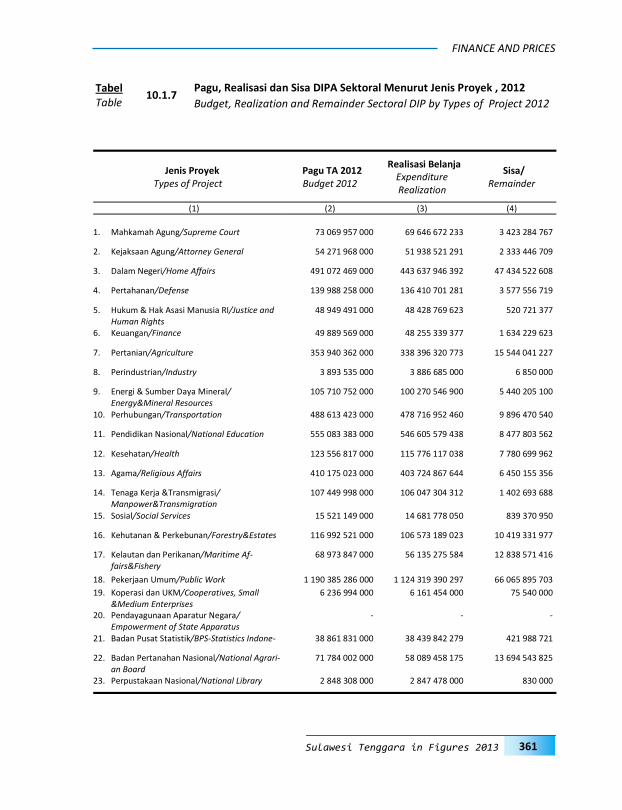
361
FINANCE AND PRICES
Sulawesi Tenggara in Figures 2013
Jenis Proyek Types of Project
Pagu TA 2012 Budget 2012
Realisasi Belanja Expenditure Realization
Sisa/ Remainder
(1) (2) (3) (4)
1. Mahkamah Agung/Supreme Court 73 069 957 000 69 646 672 233 3 423 284 767
2. Kejaksaan Agung/Attorney General 54 271 968 000 51 938 521 291 2 333 446 709
3. Dalam Negeri/Home Affairs 491 072 469 000 443 637 946 392 47 434 522 608
4. Pertahanan/Defense 139 988 258 000 136 410 701 281 3 577 556 719
5. Hukum & Hak Asasi Manusia RI/Justice and Human Rights
48 949 491 000 48 428 769 623 520 721 377
6. Keuangan/Finance 49 889 569 000 48 255 339 377 1 634 229 623
7. Pertanian/Agriculture 353 940 362 000 338 396 320 773 15 544 041 227
8. Perindustrian/Industry 3 893 535 000 3 886 685 000 6 850 000
9. Energi & Sumber Daya Mineral/Energy&Mineral Resources
105 710 752 000 100 270 546 900 5 440 205 100
10. Perhubungan/Transportation 488 613 423 000 478 716 952 460 9 896 470 540
11. Pendidikan Nasional/National Education 555 083 383 000 546 605 579 438 8 477 803 562
12. Kesehatan/Health 123 556 817 000 115 776 117 038 7 780 699 962
13. Agama/Religious Affairs 410 175 023 000 403 724 867 644 6 450 155 356
14. Tenaga Kerja &Transmigrasi/Manpower&Transmigration
107 449 998 000 106 047 304 312 1 402 693 688
15. Sosial/Social Services 15 521 149 000 14 681 778 050 839 370 950
16. Kehutanan & Perkebunan/Forestry&Estates 116 992 521 000 106 573 189 023 10 419 331 977
17. Kelautan dan Perikanan/Maritime Af-fairs&Fishery
68 973 847 000 56 135 275 584 12 838 571 416
18. Pekerjaan Umum/Public Work 1 190 385 286 000 1 124 319 390 297 66 065 895 703
19. Koperasi dan UKM/Cooperatives, Small &Medium Enterprises
6 236 994 000 6 161 454 000 75 540 000
20. Pendayagunaan Aparatur Negara/Empowerment of State Apparatus
- - -
21. Badan Pusat Statistik/BPS-Statistics Indone- 38 861 831 000 38 439 842 279 421 988 721
22. Badan Pertanahan Nasional/National Agrari-an Board
71 784 002 000 58 089 458 175 13 694 543 825
23. Perpustakaan Nasional/National Library 2 848 308 000 2 847 478 000 830 000
10.1.7 Pagu, Realisasi dan Sisa DIPA Sektoral Menurut Jenis Proyek , 2012 Tabel
Table Budget, Realization and Remainder Sectoral DIP by Types of Project 2012

362
KEUANGAN DAN HARGA-HARGA
Sulawesi Tenggara Dalam Angka 2013
Jenis Proyek Types of Project
Pagu TA 2012 Budget Year 2012
Realisasi Belanja Expenditure Realization
Sisa/ Remainder
(1) (2) (3) (4)
24. Komunikasi dan Informatika/
Communication&Informatics 7 107 066 000 6 226 998 141 880 067 859
25. Kepolisian Negara RI/Indonesian Police 410 353 112 000 429 070 383 058 -18 717 271 058
26. Subsidi dan Transfer/Subsidy&Transfer - - -
27. Badan POM/National Agency of Drugs&Foods Control
12 331 902 000 10 614 297 108 1 717 604 892
28. BKKBN/National Family Planning Coordinating Board
21 461 436 000 21 102 154 055 359 281 945
29. Belanja Lain-lain/Other Expenditures - - -
30. Dana Perimbangan/Balance Fund - - -
31. Dana otonomi Khusus & Penyeimbang/Special Autonomy Allocation&Balancing Funds
- - -
32. B M G/Meteorology&Geophysics Board 5 498 933 000 5 235 062 137 263 870 863
33. Komisi Pemilihan Umum/General Election Com-mission
37 933 226 000 27 482 400 892 10 450 825 108
34. Arsip Nasional/National Archives 139 9 51 000 139 531 000 420 000
35. B P K P/Audit&Development Supervising Board 11 313 580 000 11 081 131 519 232 448 481
36. Perdagangan/Trade 5 269 799 000 5 141 244 800 128 554 200
37. Pemuda dan Olah Raga/Youth&Sport Affairs 5 730 473 000 5 688 774 500 41 698 500
38. Badan Pemeriksa Keuangan/Audit Board 20 096 696 000 18 125 129 452 1 971 566 548
39. Kebudayaan dan Pariwisata/Culture&Tourism 3 200 000 000 3 159 091 434 40 908 566
40. Kementerian Negara Lingkungan Hidup/State Ministry of Environment
4 200 562 000 3 370 813 700 829 748 300
41. Badan Koordinasi Penanaman Modal/Investment Coordinating Board
500 000 000 497 400 000 2 600 000
42. Kementerian Negara Perumahan Rakyat/State Ministry for Public Housing
435 766 000 378 239 100 57 526 900
43. Badan SAR Nasional/Search&Rescue Board 14 567 431 000 13 282 759 962 1 284 671 038
44. Badan Narkotika Nasional/ 10 052 504 000 8 758 511 883 1 293 992 117
Jumlah/ Total 5 087 461 380 000 4 868 344 111 911 219 117 268 089
Sumber /Source : Kantor Wilayah XXV Direktorat Jendral Anggaran Kendari / XXV Regional Office of Kendari, Directorate-General of Budget
Lanjutan tabel Continued table
10.1.7
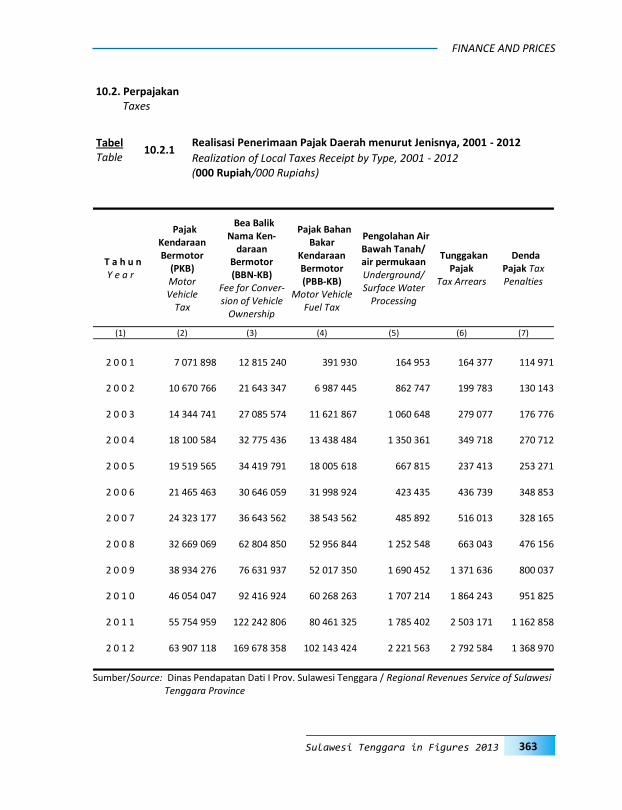
363
FINANCE AND PRICES
Sulawesi Tenggara in Figures 2013
T a h u n Y e a r
Pajak Kendaraan Bermotor
(PKB) Motor Vehicle
Tax
Bea Balik Nama Ken-
daraan Bermotor (BBN-KB)
Fee for Conver-sion of Vehicle
Ownership
Pajak Bahan Bakar
Kendaraan Bermotor (PBB-KB)
Motor Vehicle Fuel Tax
Pengolahan Air Bawah Tanah/air permukaan Underground/Surface Water
Processing
Tunggakan Pajak
Tax Arrears
Denda Pajak Tax Penalties
(1) (2) (3) (4) (5) (6) (7)
2 0 0 1 7 071 898 12 815 240 391 930 164 953 164 377 114 971
2 0 0 2 10 670 766 21 643 347 6 987 445 862 747 199 783 130 143
2 0 0 3 14 344 741 27 085 574 11 621 867 1 060 648 279 077 176 776
2 0 0 4 18 100 584 32 775 436 13 438 484 1 350 361 349 718 270 712
2 0 0 5 19 519 565 34 419 791 18 005 618 667 815 237 413 253 271
2 0 0 6 21 465 463 30 646 059 31 998 924 423 435 436 739 348 853
2 0 0 7 24 323 177 36 643 562 38 543 562 485 892 516 013 328 165
2 0 0 8 32 669 069 62 804 850 52 956 844 1 252 548 663 043 476 156
2 0 0 9 38 934 276 76 631 937 52 017 350 1 690 452 1 371 636 800 037
2 0 1 0 46 054 047 92 416 924 60 268 263 1 707 214 1 864 243 951 825
2 0 1 1 55 754 959 122 242 806 80 461 325 1 785 402 2 503 171 1 162 858
2 0 1 2 63 907 118 169 678 358 102 143 424 2 221 563 2 792 584 1 368 970
Sumber/Source: Dinas Pendapatan Dati I Prov. Sulawesi Tenggara / Regional Revenues Service of Sulawesi Tenggara Province
10.2.1 Realisasi Penerimaan Pajak Daerah menurut Jenisnya, 2001 - 2012 Tabel
Table Realization of Local Taxes Receipt by Type, 2001 - 2012 (000 Rupiah/000 Rupiahs)
10.2. Perpajakan Taxes

364
KEUANGAN DAN HARGA-HARGA
Sulawesi Tenggara Dalam Angka 2013
Tahun Anggaran 2011/ FiscalYear 2011
Tahun Anggaran 2012/ FiscalYear 2012
Jenis Pajak
Target (000 Rp) Target
(000 Rps)
Realisasi
Target (000 Rp) Target
(000 Rps)
Realisasi Type of Tax Realization Realization
Nilai (000 Rp)
Value (000 Rps)
%
Nilai (000Rp) Value
(000 Rps)
%
(1) (2) (3) (4) (5) (6) (7)
1. Pajak Kendaraan
BermotorMotor Vehicle Tax
47 937 154 58 755 404 122,57% 68 697 154 63 907 118 93,03%
2. Bea Balik Nama ( B B N ) 95 052 520 119 598 605 125,82% 121 382 812 169 678 358 139,79%
Fee for Conversion of Vehicle Ownership
3. Pajak Bahan Bakar Kendaraan Bermotor
69 072 013 80 461 325 116,49% 91 072 013 102 143 424 112,16%
PBB - KB/ Motor Vehicle Fuel Tax
4. Pengolahan air permukaan Air Bawah Tanah
1 298 707 1 881 478 144,87% 1 650 000 2 221 563 134,64%
Underground/Surface Water Processing
5. Tunggakan Pajak 2 086 209 2 445 130 117,20% 2 475 678 2 792 584 112,80%
Tax Arrears
6. Denda Pajak 738 835 1 162 858 157,39% 738 835 1 368 970 185,29%
Tax Penalties
Jumlah/Total 216 185 437 264 304 801 122,26% 286 016 492 342 112 018 119,61%
Sumber/Source: Dinas Pendapatan Dati I Prov. Sulawesi Tenggara / Regional Revenues Service of Sulawesi Tenggara Province
10.2.2 Target dan Realisasi Penerimaan Pajak Pendapatan Daerah, 2011 - 2012 Tabel
Table Target and Realization of Regional Income Taxe Revenues, 2011 - 2012
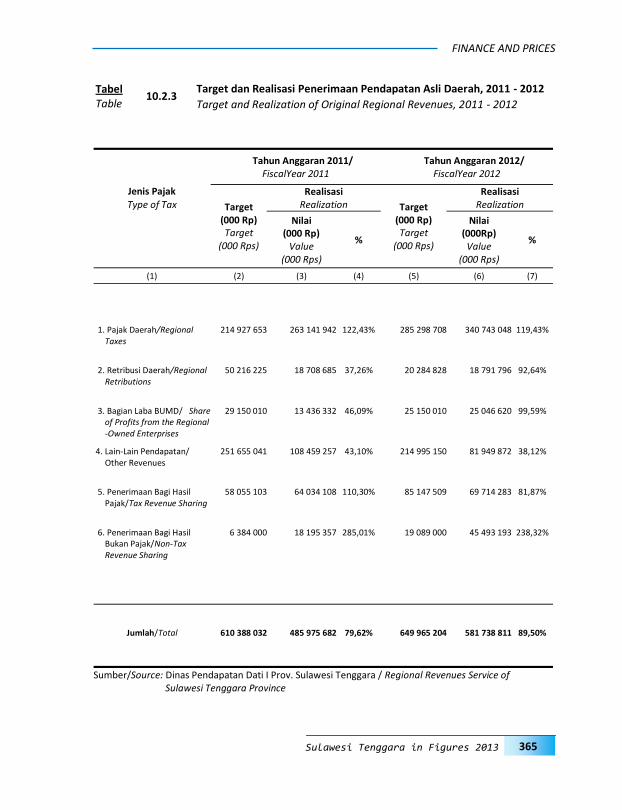
365
FINANCE AND PRICES
Sulawesi Tenggara in Figures 2013
Tahun Anggaran 2011/ FiscalYear 2011
Tahun Anggaran 2012/ FiscalYear 2012
Jenis Pajak
Target (000 Rp) Target
(000 Rps)
Realisasi
Target (000 Rp) Target
(000 Rps)
Realisasi Type of Tax Realization Realization
Nilai (000 Rp)
Value (000 Rps)
%
Nilai (000Rp) Value
(000 Rps)
%
(1) (2) (3) (4) (5) (6) (7)
1. Pajak Daerah/Regional
Taxes 214 927 653 263 141 942 122,43% 285 298 708 340 743 048 119,43%
2. Retribusi Daerah/Regional Retributions
50 216 225 18 708 685 37,26% 20 284 828 18 791 796 92,64%
3. Bagian Laba BUMD/ Share of Profits from the Regional-Owned Enterprises
29 150 010 13 436 332 46,09% 25 150 010 25 046 620 99,59%
4. Lain-Lain Pendapatan/Other Revenues
251 655 041 108 459 257 43,10% 214 995 150 81 949 872 38,12%
5. Penerimaan Bagi Hasil Pajak/Tax Revenue Sharing
58 055 103 64 034 108 110,30% 85 147 509 69 714 283 81,87%
6. Penerimaan Bagi Hasil Bukan Pajak/Non-Tax Revenue Sharing
6 384 000 18 195 357 285,01% 19 089 000 45 493 193 238,32%
Jumlah/Total 610 388 032 485 975 682 79,62% 649 965 204 581 738 811 89,50%
Sumber/Source: Dinas Pendapatan Dati I Prov. Sulawesi Tenggara / Regional Revenues Service of Sulawesi Tenggara Province
10.2.3 Target dan Realisasi Penerimaan Pendapatan Asli Daerah, 2011 - 2012 Tabel
Table Target and Realization of Original Regional Revenues, 2011 - 2012

366
KEUANGAN DAN HARGA-HARGA
Sulawesi Tenggara Dalam Angka 2013
Kabupaten 2008 2009 2010 2011 2012
District
(1) (2) (3) (4) (5) (6)
1. B u t o n 1 469 722 1 749 453 589 313 609 234 --
2. M u n a 27 792 237 45 215 778 35 158 225 55 657 655 --
3. Konawe 30 338 471 15 583 740 28 868 400 37 005 949 39 205 261
4. Kolaka 72 241 501 65 617 198 71 081 091 103 210 249 466 010 448
5. Kota Kendari 210 585 274 216 868 979 231 943 657 434 487 598 --
6. Kota Bau-Bau 1 296 206 1 467 120 1 341 691 1 531 053 --
7. Wakatobi 189 469 210 673 182 738 192 886 --
8. Bombana 4 796 875 8 323 527 9 751 911 15 951 191 --
9. Konsel 40 385 467 15 538 808 24 448 148 28 202 976 34 025 261
10. Kolaka Utara 8 597 509 17 479 742 16 855 592 19 532 507 --
11. Konawe Utara 18 607 514 4 134 533 10 351 378 7 332 101 10 438 736
12. Buton Utara -- -- -- -- --
J u m l a h/T o t a l 416 300 244 392 189 550 430 572 144 703 713 400 549 679 705
Sumber/Source: Kantor Pelayanan Pajak Pratama Kendari, Kolaka dan Baubau/ Tax Services Office of Kendari, Kolaka and Baubau
Catatan/Note : Penerimaan diatas adalah penerimaan kotor (bruto) belum dikurangi dengan SPH kirim retribusi /The above mentioned revenues are gross revenues which has not been reduced by retribution of sent SPH
10.2.4 Realisasi Penerimaan Pajak menurut Kabupaten/Kota, 2008 - 2012 Tabel
Table Realization of Tax Receipts by District/City, 2008 - 2012 (000 Rp)/ (000 Rps)

367
FINANCE AND PRICES
Sulawesi Tenggara in Figures 2013
Kabupaten/ Kota District/City
Perde saan Rural
Perkotaan Urban
Perke bunan Estate Crops
Kehu tanan
Forestry
Pertam bangan Mining
Bea Perolehan
Hak atas Tanah dan Bangunan Fee for Land and Building Ownership
Rights
Jumlah Total
(1) (2) (3) (4) (5) (6) (7) (8)
1. B u t o n -- -- -- -- -- -- --
2. M u n a -- -- -- -- -- -- --
3. Konawe 792 141 0 0 9 -- 942
4. Kolaka -- -- -- -- -- -- --
5. Konawe Selatan 1 495 218 0 0 775 -- 2 488
6. Bombana -- -- -- -- -- -- --
7. Wakatobi -- -- -- -- -- -- --
8. Kolaka Utara -- -- -- -- -- -- --
9. Buton Utara -- -- -- -- -- -- --
10. Konawe Utara 5 0 435 0 2 527 -- 2 968
11. Kota Kendari 0 4 886 0 0 0 -- 4 886
12. Kota Bau-Bau -- -- -- -- -- -- --
Prov. Sulawesi Tenggara Sulawesi Tenggara Prov.
2 0 1 2 2 292 5 246 435 0 3 311 -- 11 284
2 0 1 1 9 383 8 691 568 0 203 577 1 013 222 219
2 0 1 0 6 655 5 513 230 0 159 645 7 664 179 707
2 0 0 9 9 382 7 239 116 0 207 397 11 147 235 279
2 0 0 8 3 958 12 964 0 0 181 122 136 626 207 752
Sumber/Source : Kantor Pelayanan Pajak Bumi dan Bangunan Kota Kendari, Kota Bau-Bau dan Kab. Ko-laka /Land and Building Tax Services Office of Kendari, Kolaka and Baubau
10.2.5
Realisasi Penerimaan PBB, IPEDA menurut Kabupaten/Kota dan Sektor, 2012 (Juta Rupiah) Tabel
Table Realization of Receipts of Land and Building Tax, Regional Development Contribution by District/City and Sector, 2012 (Million Rupiahs)

368
KEUANGAN DAN HARGA-HARGA
Sulawesi Tenggara Dalam Angka 2013
P r o d u k s i P o r t o F o l i o
P r o d u c t i o n Portfolio
T a h u n Polis Pertanggun-
gan Premi Polis Per-
tanggungan Premi Y e a r Policy (Juta Rp) (Ribu Rp) Policy (Juta Rp) (Ribu Rp)
Sum Insured Premium Sum Insured Premium
(Million Rps) (000 Rps) (Million
Rps) (000 Rps)
(1) (2) (3) (4) (5) (6) (7)
2 0 0 1 2 127 22 336 779 12 577 74 905 3 711
2 0 0 2 2 139 21 964 671 517 9 490 65 858 3 015
2 0 0 3 1 219 17 777 885 26 028 196 684 7 944
2 0 0 4 6 158 467 655 4 415 730 32 186 664 339 12 359
2 0 0 5 2 260 32 754 6 081 593 34 446 697 093 18 441
2 0 0 6 585 809 669 304 669 28 680 9 411 21 892
2 0 0 7 729 1 012 380 836 35 850 11 764 27 366
2 0 0 8 1 606 215 661 2 203 000 39 435 12 352 59 081
2 0 0 9 1 091 233 473 2 643 600 47 322 14 822 51 388
2 0 1 0 2 022 210 334 5 366 254 49 344 16 320 61 954
2 0 1 1 1 056 22 942 2 934 211 50 400 39 262 11 755 343
2 0 1 2 -- -- -- -- -- --
Sumber/Source: AJB Bumiputera 1912 Rayon Utama Kendari /AJB Bumi Putera 1912 Main Area of Kendari
10.3.1
Produksi dan Porto Folio Polis, Jumlah Uang Pertanggungan dan Premi
2001 - 2012 Tabel
Table Production and Portfolio of Policy, Sum Insured and Premium, 2001 - 2012
10.3. Asuransi Insurance

369
FINANCE AND PRICES
Sulawesi Tenggara in Figures 2013
P r o d u k s i P o r t o F o l i o
P r o d u c t i o n Portfolio
T a h u n Polis Pertanggun-
gan Premi Polis Pertanggun-
gan Premi Y e a r Policy (Juta Rp) (Ribu Rp) Policy (Juta Rp) (Ribu Rp)
Sum Insured Premium Sum Insured Premium
(Million Rps) (000 Rps) (Million Rps) (000 Rps)
(1) (2) (3) (4) (5) (6) (7)
2 0 0 1 1 700 9 345 9 924 5 946 38 852 2 251 805
2 0 0 2 1 602 8 639 4 628 7 104 43 657 4 468 232
2 0 0 3 2 872 20 244 6 932 9 700 59 257 8 064 400
2 0 0 4 5 867 23 610 5 851 15 346 78 634 8 169 115
2 0 0 5 1 789 16 440 5 224 4 497 40 375 9 658 000
2 0 0 6 1 083 25 440 4 174 904 8 617 30 529 7 634 000
2 0 0 7 1 677 38 760 6 872 380 9 208 43 849 14 486 380
2 0 0 8 3 458 1 854 7 803 355 3 425 26 297 12 570 831
2 0 0 9 3 236 16 400 5 952 064 3 211 20 633 17 700 255
2 0 1 0 2 871 128 295 11 016 256 5 697 256 928 20 532 295
2 0 1 1 2 639 104 741 12 925 758 5 850 125 374 30 626 013
2 0 1 2 314 20 125 7 763 426 6 164 20 251 9 988 257
Sumber/Source: PT. Asuransi Jiwasraya Kendari
10.3.2
Produksi dan Porto Folio Polis, Jumlah Uang Pertanggungan dan Premi
2001 - 2012 Tabel
Table Production and Portfolio of Policy, Sum Insured and Premium 2001 - 2012
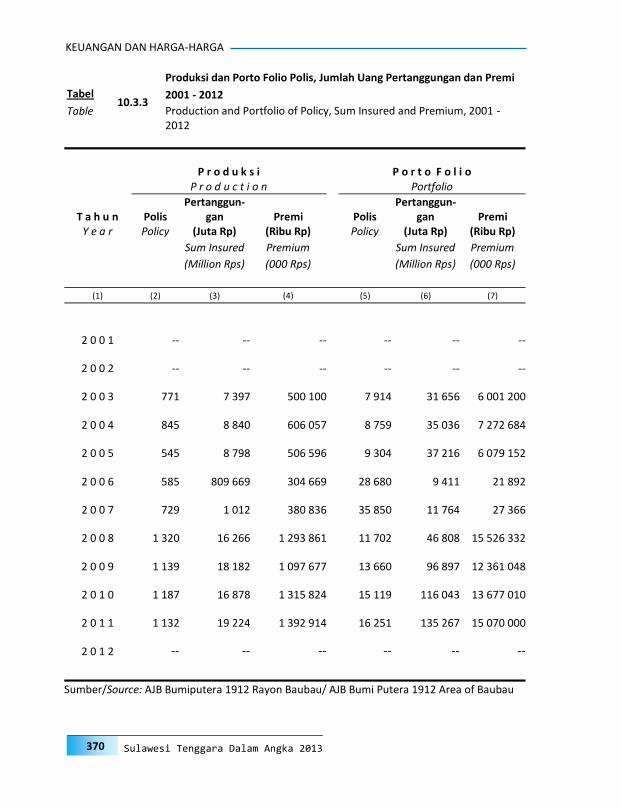
370
KEUANGAN DAN HARGA-HARGA
Sulawesi Tenggara Dalam Angka 2013
P r o d u k s i P o r t o F o l i o
P r o d u c t i o n Portfolio
T a h u n Polis Pertanggun-
gan Premi Polis Pertanggun-
gan Premi Y e a r Policy (Juta Rp) (Ribu Rp) Policy (Juta Rp) (Ribu Rp)
Sum Insured Premium Sum Insured Premium
(Million Rps) (000 Rps) (Million Rps) (000 Rps)
(1) (2) (3) (4) (5) (6) (7)
2 0 0 1 -- -- -- -- -- --
2 0 0 2 -- -- -- -- -- --
2 0 0 3 771 7 397 500 100 7 914 31 656 6 001 200
2 0 0 4 845 8 840 606 057 8 759 35 036 7 272 684
2 0 0 5 545 8 798 506 596 9 304 37 216 6 079 152
2 0 0 6 585 809 669 304 669 28 680 9 411 21 892
2 0 0 7 729 1 012 380 836 35 850 11 764 27 366
2 0 0 8 1 320 16 266 1 293 861 11 702 46 808 15 526 332
2 0 0 9 1 139 18 182 1 097 677 13 660 96 897 12 361 048
2 0 1 0 1 187 16 878 1 315 824 15 119 116 043 13 677 010
2 0 1 1 1 132 19 224 1 392 914 16 251 135 267 15 070 000
2 0 1 2 -- -- -- -- -- --
Sumber/Source: AJB Bumiputera 1912 Rayon Baubau/ AJB Bumi Putera 1912 Area of Baubau
10.3.3
Produksi dan Porto Folio Polis, Jumlah Uang Pertanggungan dan Premi
2001 - 2012 Tabel
Table Production and Portfolio of Policy, Sum Insured and Premium, 2001 - 2012
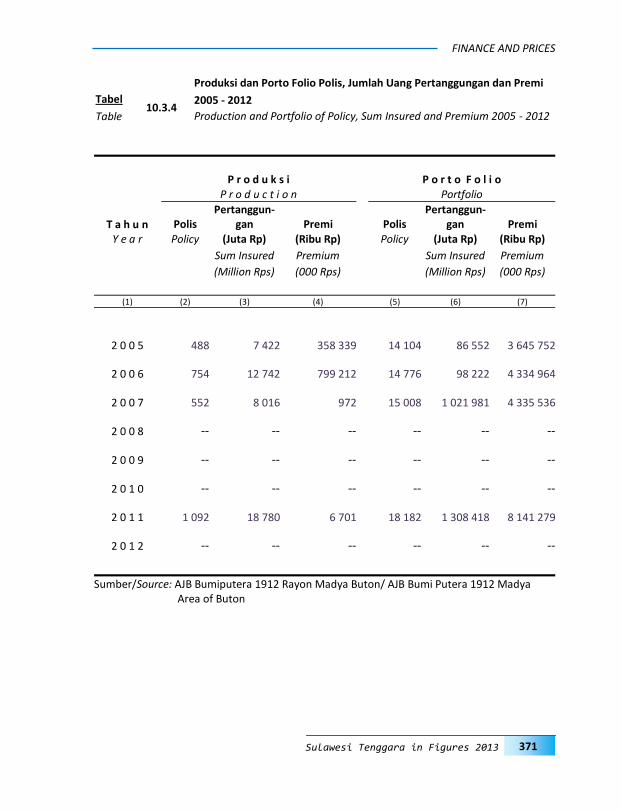
371
FINANCE AND PRICES
Sulawesi Tenggara in Figures 2013
P r o d u k s i P o r t o F o l i o
P r o d u c t i o n Portfolio
T a h u n Polis Pertanggun-
gan Premi Polis Pertanggun-
gan Premi Y e a r Policy (Juta Rp) (Ribu Rp) Policy (Juta Rp) (Ribu Rp)
Sum Insured Premium Sum Insured Premium
(Million Rps) (000 Rps) (Million Rps) (000 Rps)
(1) (2) (3) (4) (5) (6) (7)
2 0 0 5 488 7 422 358 339 14 104 86 552 3 645 752
2 0 0 6 754 12 742 799 212 14 776 98 222 4 334 964
2 0 0 7 552 8 016 972 15 008 1 021 981 4 335 536
2 0 0 8 -- -- -- -- -- --
2 0 0 9 -- -- -- -- -- --
2 0 1 0 -- -- -- -- -- --
2 0 1 1 1 092 18 780 6 701 18 182 1 308 418 8 141 279
2 0 1 2 -- -- -- -- -- --
Sumber/Source: AJB Bumiputera 1912 Rayon Madya Buton/ AJB Bumi Putera 1912 Madya Area of Buton
10.3.4
Produksi dan Porto Folio Polis, Jumlah Uang Pertanggungan dan Premi
2005 - 2012 Tabel
Table Production and Portfolio of Policy, Sum Insured and Premium 2005 - 2012

372
KEUANGAN DAN HARGA-HARGA
Sulawesi Tenggara Dalam Angka 2013
Meninggal Habis Kontrak Jual/Nilai Tebus Pinjaman Polis
Death Finish Selling/Redemption Policy
Contract Value Loans
T a h u n Polis Versi-
cherungspolice
Pertang- Polis Versi-
cherungspolice
Pertang- Polis Versi-
cherungspolice
Pertang- Pertang- Polis Versi-
cherungspolice
Y e a r gungan gungan gungan gungan (Juta Rp) (Juta Rp) (Juta Rp) (Juta Rp)
Insured Insured Insured Insured
(Mill. Rps) (Mill. Rps) (Mill. Rps) (Mill. Rps) (1) (2) (3) (4) (5) (6) (7) (8) (9)
2 0 0 1 30 343 88 630 60 820 524 625
2 0 0 2 19 94 107 634 45 706 576 688
2 0 0 3 31 80 116 672 81 500 6 569 805
2 0 0 4 62 1 359 142 942 127 595 461 816
2 0 0 5 37 182 211 1 857 149 764 713 1 130
2 0 0 6 129 6 450 161 2 050 80 2 650 286 3 840
2 0 0 7 161 8 063 201 2 563 100 3 312 358 4 800
2 0 0 8 21 281 202 783 26 246 189 778
2 0 0 9 33 310 225 812 20 156 177 625
2 0 1 0 10 209 210 2 848 32 246 101 498
2 0 1 1 17 750 352 3 110 51 1 505 170 856
2 0 1 2 -- -- -- -- -- -- -- --
Sumber/Source: AJB Bumiputera 1912 Rayon Madya Buton/ AJB Bumi Putera 1912 Madya Area of Buton
10.3.5 Pembayaran Klaim dan Penerimaan Pinjaman Polis, 2001 - 2012 Tabel
Table Payment of Claims and Policy Loan Revenues, 2001 - 2012
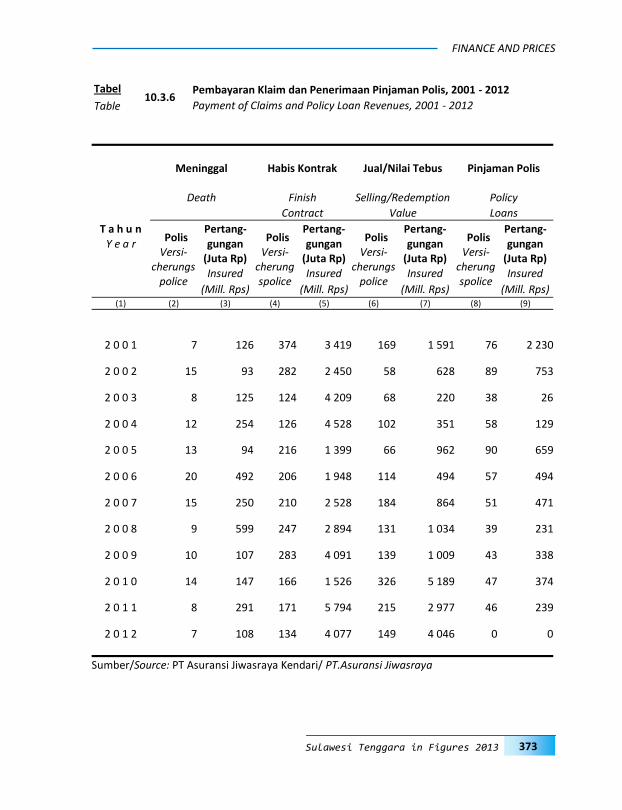
373
FINANCE AND PRICES
Sulawesi Tenggara in Figures 2013
Meninggal Habis Kontrak Jual/Nilai Tebus Pinjaman Polis
Death Finish Selling/Redemption Policy
Contract Value Loans
T a h u n Polis Versi-
cherungspolice
Pertang- Polis Versi-
cherungspolice
Pertang- Polis Versi-
cherungspolice
Pertang- Pertang- Polis Versi-
cherungspolice
Y e a r gungan gungan gungan gungan (Juta Rp) (Juta Rp) (Juta Rp) (Juta Rp)
Insured Insured Insured Insured
(Mill. Rps) (Mill. Rps) (Mill. Rps) (Mill. Rps) (1) (2) (3) (4) (5) (6) (7) (8) (9)
2 0 0 1 7 126 374 3 419 169 1 591 76 2 230
2 0 0 2 15 93 282 2 450 58 628 89 753
2 0 0 3 8 125 124 4 209 68 220 38 26
2 0 0 4 12 254 126 4 528 102 351 58 129
2 0 0 5 13 94 216 1 399 66 962 90 659
2 0 0 6 20 492 206 1 948 114 494 57 494
2 0 0 7 15 250 210 2 528 184 864 51 471
2 0 0 8 9 599 247 2 894 131 1 034 39 231
2 0 0 9 10 107 283 4 091 139 1 009 43 338
2 0 1 0 14 147 166 1 526 326 5 189 47 374
2 0 1 1 8 291 171 5 794 215 2 977 46 239
2 0 1 2 7 108 134 4 077 149 4 046 0 0
Sumber/Source: PT Asuransi Jiwasraya Kendari/ PT.Asuransi Jiwasraya
10.3.6 Pembayaran Klaim dan Penerimaan Pinjaman Polis, 2001 - 2012 Tabel
Table Payment of Claims and Policy Loan Revenues, 2001 - 2012

374
KEUANGAN DAN HARGA-HARGA
Sulawesi Tenggara Dalam Angka 2013
Meninggal Death
Habis Kontrak Finish Contract
Jual/Nilai Tebus Selling/Redemption
Value
Pinjaman Polis Policy Loans
T a h u n Polis Versi-
cherungspolice
Pertang- Polis Versi-
cherungspolice
Pertang- Polis Versi-
cherungspolice
Pertang- Polis Versi-
cherungspolice
Pertang- Y e a r gungan gungan gungan gungan
(Juta Rp) (Juta Rp) (Juta Rp) (Juta Rp)
Insured Insured Insured Insured
(Mill. Rps) (Mill. Rps) (Mill. Rps) (Mill. Rps) (1) (2) (3) (4) (5) (6) (7) (8) (9)
2 0 0 1 -- -- -- -- -- -- -- --
2 0 0 2 -- -- -- -- -- -- -- --
2 0 0 3 25 225,00 75 135,96 101 218,65 403 196,16
2 0 0 4 23 212,73 70 135,96 101 218,65 403 196,16
2 0 0 5 27 261,79 90 135,96 101 218,65 403 196,16
2 0 0 6 25 346,31 85 748,65 196 370,19 175 421,71
2 0 0 7 25 255,54 120 1 058,31 141 319,25 172 455,75
2 0 0 8 35 591,95 129 1 246,09 132 864,42 164 443,42
2 0 0 9 20 353,00 165 1 570,00 65 178,00 205 519,00
2 0 1 0 31 248,00 256 1 797,00 180 670,00 136 866,00
2 0 1 1 33 401,00 395 2 120,00 219 649,00 106 850,00
2 0 1 2 -- -- -- -- -- -- -- --
Sumber/Source: AJB Bumiputera 1912 Rayon Baubau/ AJB Bumi Putera 1912 Area of Baubau
10.3.7 Pembayaran Klaim dan Penerimaan Pinjaman Polis, 2001 - 2012 Tabel
Table Payment of Claims and Policy Loan Revenues, 2001 - 2012

375
FINANCE AND PRICES
Sulawesi Tenggara in Figures 2013
Meninggal Habis Kontrak Jual/Nilai Tebus Pinjaman Polis
Death Finish Selling/Redemption Policy
Contract Value Loans
T a h u n Polis Versi-
cherungspolice
Pertang- Polis Versi-
cherungspolice
Pertang- Polis Versi-
cherungspolice
Pertang- Pertang- Polis Versi-
cherungspolice
Y e a r gungan gungan gungan gungan (Juta Rp) (Juta Rp) (Juta Rp) (Juta Rp)
Insured Insured Insured Insured
(Mill. Rps) (Mill. Rps) (Mill. Rps) (Mill. Rps) (1) (2) (3) (4) (5) (6) (7) (8) (9)
2 0 0 1 29 126 41 126 110 340 391 2 440
2 0 0 2 -- -- -- -- -- -- -- --
2 0 0 3 -- -- -- -- -- -- -- --
2 0 0 4 -- -- -- -- -- -- -- --
2 0 0 5 8 102 53 468 168 329 216 432 000
2 0 0 6 41 220 108 827 132 528 362 782 671
2 0 0 7 -- -- -- -- -- -- -- --
2 0 0 8 -- -- -- -- -- -- -- --
2 0 0 9 -- -- -- -- -- -- -- --
2 0 1 0 -- -- -- -- -- -- -- --
2 0 1 1 27 256 934 179 2 229 409 106 497 028 484 2 420 000
2 0 1 2 -- -- -- -- -- -- -- --
Sumber/Source: AJB Bumiputera 1912 Rayon Madya Kolaka/ AJB Bumi Putera 1912 Madya Area of Kolaka
10.3.8 Pembayaran Klaim dan Penerimaan Pinjaman Polis, 2001 - 2012 Tabel
Table Payment of Claims and Policy Loan Revenues, 2001 - 2012

376
KEUANGAN DAN HARGA-HARGA
Sulawesi Tenggara Dalam Angka 2013
Bank Tabungan
Pemerintah Bank Swasta Nasional
Kabupaten/Kota Government Bank National Private bank
District/City BI
BR
I
BN
I'46
Man
diri
BTN
BP
D
PT. B
II
Dan
amo
n
PT. B
CA
Arth
a Grah
a
Mu
amalat
PA
NIN
MEG
A
BP
R
(1) (2) (3) (4) (5) (6) (7) (8) (9) (10) (11) (12) (13) (14) (15)
1. B u t o n 0 2 0 0 1 1 0 0 0 0 0 0 0 1 2. M u n a 0 7 1 0 1 2 0 2 0 0 0 0 0 1 3. K o n a w e 0 3 1 0 2 1 0 1 0 0 1 0 0 3 4. K o l a k a 0 9 1 3 2 2 0 3 0 0 1 1 0 4 5. Konawe Selatan 0 3 0 1 0 2 0 1 0 0 0 0 0 3 6. Bombana 0 3 0 0 0 1 0 1 0 0 1 0 0 1 7. Wakatobi 0 1 1 0 1 1 0 1 0 0 0 0 0 1 8. Kolaka Utara 0 4 0 1 1 2 0 1 0 0 0 0 0 0 9. Buton Utara 0 1 0 0 0 1 0 0 0 0 0 0 0 0 10. Konawe Utara 0 1 0 0 0 1 0 0 0 0 0 0 0 1 11. Kota Kendari 1 8 3 7 4 5 1 6 1 1 3 1 1 2 12. Kota Bau-Bau 0 3 1 1 1 1 0 2 0 0 1 1 0 2
Prov. Sulawesi Tenggara
Sulawesi Tenggara Prov. 2 0 1 2 1 45 8 13 13 20 1 18 1 1 7 3 1 19 2 0 1 1 1 45 8 13 13 20 1 18 1 1 7 2 1 22 2 0 1 0 1 40 6 7 12 19 1 10 1 1 8 2 1 12 2 0 0 9 1 37 6 5 7 17 1 9 1 1 5 3 1 11 2 0 0 8 1 36 6 5 8 17 1 9 1 1 6 2 1 1 2 0 0 7 1 33 6 4 8 17 1 -- 1 1 4 1 1 5
Sumber/Source: Bank Indonesia Cabang Kendari/Bank of Indonesia, Branch Office of Kendari
10.4.1 Banyaknya Kantor Bank menurut Kabupaten/Kota, 2012 Tabel
Table Number of Bank Offices by District/City, 2012
10.4. Perbankan Banking

377
FINANCE AND PRICES
Sulawesi Tenggara in Figures 2013
Bank Swasta Nasional
Kabupaten/Kota Jumlah National Private bank
District/City NISP
BTP
N
Sinarm
as
Syariah
M
and
iri
Pu
nd
i
Mayap
ada
CIM
BN
iaga
Total
BR
I Syariah
BN
I Syariah
(1) (16) (17) (18) (19) (20) (21) (22) (25) (23) (24)
1. B u t o n 0 1 0 0 0 0 0 6 0 0 2. M u n a 0 1 0 0 0 0 0 15 0 0 3. K o n a w e 0 0 0 0 0 0 0 12 0 0 4. K o l a k a 0 1 0 0 1 0 0 28 0 0 5. Konawe Selatan 0 0 0 0 0 0 0 10 0 0 6. Bombana 0 0 0 0 0 0 0 7 0 0 7. Wakatobi 0 0 0 0 0 0 0 6 0 0 8. Kolaka Utara 0 0 0 0 0 0 0 9 0 0 9. Buton Utara 0 0 0 0 0 0 0 2 0 0 10. Konawe Utara 0 0 0 0 0 0 0 3 0 0 11. Kota Kendari 1 3 1 1 1 1 1 55 1 1 12. Kota Bau-Bau 0 1 0 0 1 0 0 15 0 0
Prov. Sulawesi Tenggara Sulawesi Tenggara Prov.
2 0 1 2 1 7 1 1 3 1 1 168 1 1 2 0 1 1 1 7 1 1 3 1 1 168 0 0 2 0 1 0 1 6 1 1 0 0 0 130 0 0 2 0 0 9 1 3 1 - 0 0 0 110 0 0 2 0 0 8 1 - - - 0 0 0 96 0 0 2 0 0 7 7 - - - 0 0 0 90 0 0
Sumber/Source: Bank Indonesia Cabang Kendari/Bank of Indonesia, Branch Office of Kendari
Lanjutan tabel
Continued table 10.4.1

378
KEUANGAN DAN HARGA-HARGA
Sulawesi Tenggara Dalam Angka 2013
Kabupaten BRI Unit Desa
District BRI Village Unit
(1) (2)
1. B u t o n 2
2. M u n a 6
3. K o n a w e 2
4. K o l a k a 7
5. Kota Kendari 6
6. Kota Bau-Bau 2
7. Wakatobi 1
8. Bombana 3
9. Konawe Selatan 3
10. Kolaka Utara 3
11. Konawe Utara 1
12. Buton Utara 1
Prov. Sulawesi Tenggara
Sulawesi Tenggara Prov.
2 0 1 2 37
2 0 1 1 37
2 0 1 0 33
2 0 0 9 38
2 0 0 8 36
2 0 0 7 33
Sumber/Source: Bank Indonesia Cabang Kendari/Bank of Indonesia, Branch Office of Kendari
10.4.2 Banyaknya BRI Unit Desa menurut Kabupaten, 2012 Tabel
Table Number of BRI Village Unit by Regency, 2012

379
FINANCE AND PRICES
Sulawesi Tenggara in Figures 2013
G i r o Deposito Tabungan J u m l a h
Demand Deposits Deposits Savings T o t a l
T a h u n Rekening Nilai Rekening Nilai Rekening Nilai Rekening Nilai
Y e a r Accounts (Juta Rp) Accounts (Juta Rp) Accounts (Juta Rp) Accounts (Juta Rp)
Values Values Values Values
(Mill. Rps) (Mill. Rps) (Mill. Rps) (Mill. Rps)
(1) (2) (3) (4) (5) (6) (7) (8) (9)
2 0 0 2 11 097 531 619 6 859 334 963 442 332 808 903 460 288 1 675 485
2 0 0 3 11 637 538 337 6 445 396 112 461 009 1 024 623 479 091 1 959 072
2 0 0 4 10 656 440 796 5 363 306 429 455 615 1 236 030 471 634 1 983 255
2 0 0 5 10 047 592 008 5 450 440 708 453 139 1 201 421 468 636 2 234 137
2 0 0 6 14 898 1 000 570 5 943 586 878 445 913 1 701 549 466 754 3 288 997
2 0 0 7 13 418 1 084 828 6 067 618 001 492 123 2 316 095 511 608 4 018 925
2 0 0 8 11 889 938 383 6 442 835 906 533 645 2 841 855 551 976 4 616 144
2 0 0 9 13 247 788 020 6 892 1 048 971 609 046 3 424 902 629 185 5 261 893
2 0 1 0 10 413 918 782 7 348 1 227 349 692 053 3 880 829 709 814 6 026 960
2 0 1 1 11 606 1 310 322 8 452 1 811 082 769 952 5 362 858 790 010 8 484 262
2 0 1 2 12 472 1 712 692 9 253 1 934 046 919 409 6 264 985 941 134 9 911 722
Sumber/Source: Bank Indonesia Cabang Kendari/Bank of Indonesi, Branch Office of Kendari Catatan/Note : Termasuk Bank Umum Syariah dan BPR/ Including Sharia Commercial Bank and Rural
Banks
10.4.3
Perkembangan Giro, Deposito dan Tabungan Keadaan 31 Desember
2002 - 2012 Tabel
Table Progress of Demand Deposits,Time Deposits and Savings in December
31st, 2002 - 2012

380
KEUANGAN DAN HARGA-HARGA
Sulawesi Tenggara Dalam Angka 2013
Jenis Kredit Jumlah Rekening Nilai (Juta Rp.)
Types of Credit Number of Accounts Value (Million Rps)
(1) (2) (3)
1. Modal Kerja 66 207 3 419 934
Capital
2. Investasi 5 806 1 120 806
Investment
3. Konsumsi 107 026 6 127 150
Consumption
4. Lainnya 0 0
Others
J u m l a h/T o t a l
2 0 1 2 179 039 10 667 890
2 0 1 1 157 207 8 209 366
2 0 1 0 138 341 6 139 765
2 0 0 9 126 408 4 788 584
2 0 0 8 103 465 3 825 769
2 0 0 7 82 264 2 815 518
Sumber/Source: Bank Indonesia Cabang Kendari/Bank of Indonesi, Branch Office of Kendari Catatan/Note : Termasuk Bank Umum Syariah dan BPR/ Including Sharia Commercial Bank and Rural
Banks
10.4.4 Kredit Perbankan menurut Jenis Kredit di Sulawesi Tenggara, 2012 Tabel
Table Bank Credit by Types of Credit in Sulawesi Tenggara, 2012
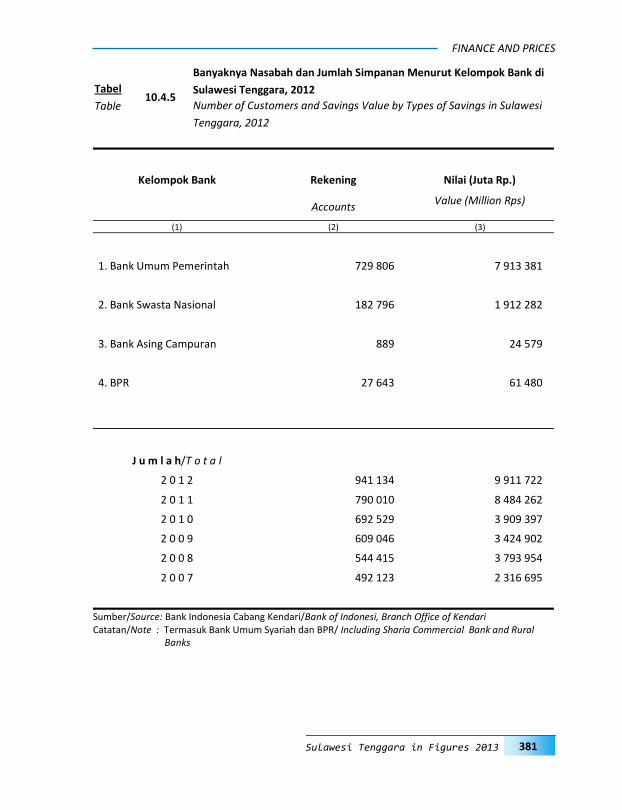
381
FINANCE AND PRICES
Sulawesi Tenggara in Figures 2013
Kelompok Bank Rekening Nilai (Juta Rp.)
Accounts
Value (Million Rps)
(1) (2) (3)
1. Bank Umum Pemerintah 729 806 7 913 381
2. Bank Swasta Nasional 182 796 1 912 282
3. Bank Asing Campuran 889 24 579
4. BPR 27 643 61 480
J u m l a h/T o t a l
2 0 1 2 941 134 9 911 722
2 0 1 1 790 010 8 484 262
2 0 1 0 692 529 3 909 397
2 0 0 9 609 046 3 424 902
2 0 0 8 544 415 3 793 954
2 0 0 7 492 123 2 316 695
Sumber/Source: Bank Indonesia Cabang Kendari/Bank of Indonesi, Branch Office of Kendari Catatan/Note : Termasuk Bank Umum Syariah dan BPR/ Including Sharia Commercial Bank and Rural
Banks
10.4.5
Banyaknya Nasabah dan Jumlah Simpanan Menurut Kelompok Bank di
Sulawesi Tenggara, 2012 Tabel
Table Number of Customers and Savings Value by Types of Savings in Sulawesi
Tenggara, 2012

382
KEUANGAN DAN HARGA-HARGA
Sulawesi Tenggara Dalam Angka 2013
T a b a n a s T a s k a Lainnya J u m l a h
National Term Insurance Other Savings T o t a l
Development Savings
T a h u n Savings Y e a r s
Penabung Depositor
Nilai (Juta Rp)
Values
(Mill. Rps)
Penabung Depositor
Nilai (Juta Rp)
Values
(Mill. Rps)
Penabung Depositor
Nilai (Juta Rp)
Values
(Mill. Rps)
Penabung Depositor
Nilai (Juta Rp)
Values
(Mill. Rps)
(1) (2) (3) (4) (5) (6) (7) (8) (9)
2 0 0 2 - - - - 442 332 808 903 442 332 808 903
2 0 0 3 - - - - 461 009 1 024 623 461 009 1 024 623
2 0 0 4 - - - - 455 615 1 236 030 455 615 1 236 030
2 0 0 5 - - - - 453 139 1 201 421 453 139 1 201 421
2 0 0 5 - - - - 453 139 1 201 421 453 139 1 201 421
2 0 0 6 - - - - 445 913 1 701 549 445 913 1 701 549
2 0 0 7 - - - - 492 123 2 316 095 492 123 2 316 095
2 0 0 8 - - - - 523 266 2 789 575 523 266 2 789 575
2 0 0 9 - - - - 609 046 3 424 902 609 046 3 424 902
2 0 1 0 - - - - 671 493 3 853 785 671 493 3 853 785
2 0 1 1 - - - - 769 952 5 362 858 769 952 5 362 858
2 0 1 2 - - - - 919 409 6 264 985 919 409 6 264 985
Sumber/Source: Bank Indonesia Cabang Kendari/Bank of Indonesi, Branch Office of Kendari Catatan/Note : Termasuk Bank Umum Syariah dan BPR/ Including Sharia Commercial Bank and Rural
Banks Sejak Tahun 1991 data jenis tabungan mengalami perubahan, yaitu: /There has been changes on types of savings data since 1991: - Tabungan setiap saat dapat ditarik/Savings which can be withdrawn at anytime - Tabungan Berjangka/Term Savings - Tabungan Lainnya/Other Savings
10.4.6
Perkembangan Tabanas, Taska dan Tabungan Lainnya Keadaan 31
Desember 2002 - 2012 Tabel
Table Progress of National Development Savings, Term Insurance Savings and Other Savings on December 31st, 2002 - 2012

383
FINANCE AND PRICES
Sulawesi Tenggara in Figures 2013
Sektor Ekonomi Jumlah Rekening Nilai (Juta Rp.)
Economic Sectors Debtor Value (Million Rps)
(1) (2) (3)
1. Pertanian/Agriculture 6 174 232 941
2. Pertambangan/Mining 135 29 171
3. Perindustrian/Industry 1 749 72 570
4. Listrik, Gas dan Air Minum/ 32 943
Electricity, Gas & Water Suply
5. Konstruksi/Construction 426 258 813
6. Perdagangan/Trade 37 663 2 135 128
7. Pengangkutan/Transportation 530 43 306
8. Jasa-Jasa dan Lainnya/ 111 541 5 458 667
Services and Others
J u m l a h/T o t a l
2 0 1 2 158 250 8 231 539
2 0 1 1 157 207 8 209 366
2 0 1 0 138 242 6 185 972
2 0 0 9 126 408 4 775 971
2 0 0 8 103 465 3 825 770
2 0 0 7 86 188 2 815 518
2 0 0 6 80 587 2 012 388
2 0 0 5 72 326 1 599 173
Sumber/Source: Bank Indonesia Cabang Kendari/Bank of Indonesi, Branch Office of Kendari Catatan/Note : Termasuk Bank Umum Syariah dan BPR/ Including Sharia Commercial Bank and Rural
Banks
10.4.7
Posisi Pinjaman Perbankan menurut Sektor Ekonomi di Sulawesi
Tenggara, 2012 Tabel
Table Banking Borrowing Position by Economic Sectors in Sulawesi Tenggara,
2012

384
KEUANGAN DAN HARGA-HARGA
Sulawesi Tenggara Dalam Angka 2013
Kabupaten District
Banyaknya Koperasi (Unit)
Number of Cooperatives
Anggota (Orang) Members (Persons)
Aset Assets
(Juta RP) (Million
Rps)
Volume Usaha
(Juta RP) Asset Scale
(Million Rps)
Modal (Juta RP)
Capital (Million Rps)
S H U (Juta RP) Net Profit
(Million Rps) Aktif (Active)
Tidak Aktif Non Active)
(1) (2) (3) (4) (5) (6) (7)
1. B u t o n 199 16 15 087 -- 4 620 712 2 862
2. M u n a 214 65 14 980 -- 11 970 1 222 10 570
3. Konawe 247 64 12 880 -- 3 900 600 3 250
4. Kolaka 315 194 38 621 -- 4 210 871 7 124
5. Konawe Selatan 165 106 3 713 -- 3 829 792 7 450
6. Bombana 194 57 13 700 -- 2 970 611 2 990
7. Wakatobi 90 84 7 834 -- 1 200 318 1 620
8. Kolaka Utara 83 58 6 165 -- 2 150 512 1 050
9. Buton Utara 69 2 7 790 -- 980 77 570
10. Konawe Utara 23 28 1 540 -- 939 74 528
11. Kota Kendari 376 124 13 565 -- 54 817 3 745 21 670
12. Kota Bau-Bau 188 6 17 517 -- 5 400 940 7 530
13. Provinsi 258 2 7 600 -- 4 417 234 4 150
J u m l a h/T o t a l 2 421 806 160 992 -- 101 402 10 708 71 364
Sumber/Source: Dinas Koperasi, UKM dan Penanaman Modal Prop. Sulawesi Tenggara /Service of Cooper-atives, Small and Medium Enterprises, and Investment of Sulawesi Tenggara Province
10.5.1 Banyaknya Koperasi menurut Kabupaten dan Kota, 2012 Tabel
Table Number of Cooperatives by District and City, 2012
10.5. Koperasi Cooperation
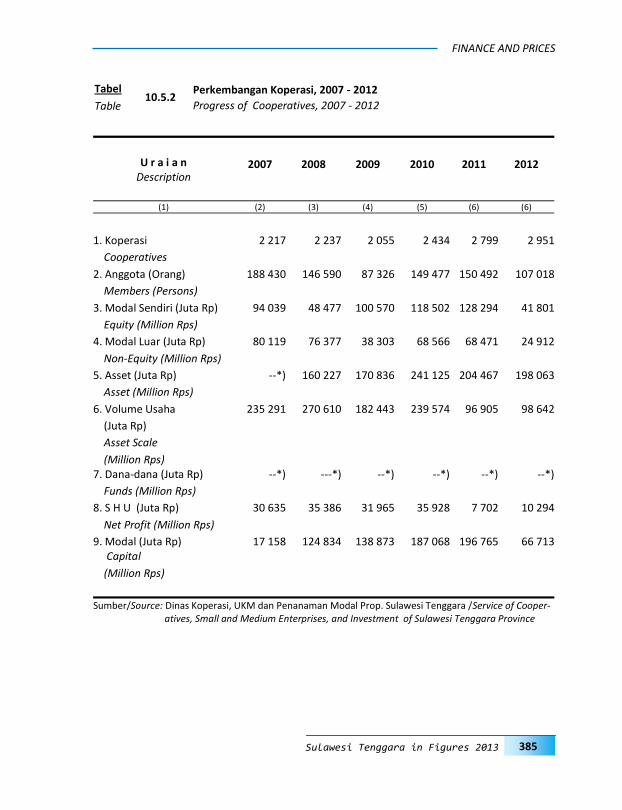
385
FINANCE AND PRICES
Sulawesi Tenggara in Figures 2013
U r a i a n Description
2007 2008 2009 2010 2011 2012
(1) (2) (3) (4) (5) (6) (6)
1. Koperasi 2 217 2 237 2 055 2 434 2 799 2 951
Cooperatives
2. Anggota (Orang) 188 430 146 590 87 326 149 477 150 492 107 018
Members (Persons)
3. Modal Sendiri (Juta Rp) 94 039 48 477 100 570 118 502 128 294 41 801
Equity (Million Rps)
4. Modal Luar (Juta Rp) 80 119 76 377 38 303 68 566 68 471 24 912
Non-Equity (Million Rps)
5. Asset (Juta Rp) --*) 160 227 170 836 241 125 204 467 198 063
Asset (Million Rps)
6. Volume Usaha 235 291 270 610 182 443 239 574 96 905 98 642
(Juta Rp)
Asset Scale
(Million Rps) 7. Dana-dana (Juta Rp) --*) ---*) --*) --*) --*) --*)
Funds (Million Rps)
8. S H U (Juta Rp) 30 635 35 386 31 965 35 928 7 702 10 294
Net Profit (Million Rps)
9. Modal (Juta Rp) 17 158 124 834 138 873 187 068 196 765 66 713 Capital
(Million Rps)
Sumber/Source: Dinas Koperasi, UKM dan Penanaman Modal Prop. Sulawesi Tenggara /Service of Cooper-atives, Small and Medium Enterprises, and Investment of Sulawesi Tenggara Province
10.5.2 Perkembangan Koperasi, 2007 - 2012 Tabel
Table Progress of Cooperatives, 2007 - 2012

386
KEUANGAN DAN HARGA-HARGA
Sulawesi Tenggara Dalam Angka 2013
10.5.3 Perkembangan Koperasi Non KUD, 2007 - 2012 Tabel
Table Progress of Non Village Unit Cooperatives, 2007 - 2012
U r a i a n Description
2007 2008 2009 2010 2011 2012
(1) (2) (3) (4) (5) (6) (6)
1. Koperasi 2 217 2 237 2 055 2 434 2 799 2951
Cooperatives
2. Anggota (Orang) 188 430 146 590 87 326 149 477 150 492 107 018
Members (Persons)
3. Modal Sendiri (Juta Rp) 94 039 48 477 100 570 118 502 128 294 41 801
Equity (Million Rps)
4. Modal Luar (Juta Rp) 80 119 76 377 38 303 68 566 68 471 24 912
Non-Equity (Million Rps)
5. Asset (Juta Rp) --*) 160 227 170 836 241 125 204 467 198 063
Asset (Million Rps)
6. Volume Usaha 235 291 270 610 182 443 239 574 96 905 98 642
(Juta Rp)
Asset Scale
(Million Rps)
7. Dana-dana (Juta Rp) --*) ---*) --*) --*) --*) --*)
Funds (Million Rps)
8. S H U (Juta Rp) 30 635 35 386 31 965 35 928 7 702 10 294
Net Profit (Million Rps)
9. Modal (Juta Rp) 17 158 124 834 138 873 187 068 196 765 66 713
Capital
(Million Rps)
Sumber/Source: Dinas Koperasi, UKM dan Penanaman Modal Prop. Sulawesi Tenggara /Service of Cooper-atives, Small and Medium Enterprises, and Investment of Sulawesi Tenggara Province
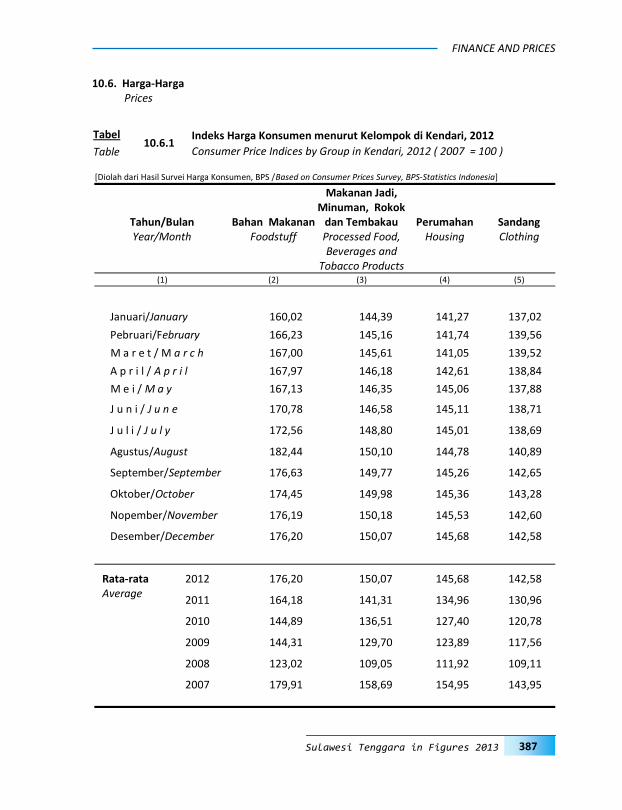
387
FINANCE AND PRICES
Sulawesi Tenggara in Figures 2013
Tahun/Bulan Year/Month
Bahan Makanan Foodstuff
Makanan Jadi, Minuman, Rokok
dan Tembakau Processed Food, Beverages and
Tobacco Products
Perumahan Housing
Sandang Clothing
(1) (2) (3) (4) (5)
Januari/January 160,02 144,39 141,27 137,02
Pebruari/February 166,23 145,16 141,74 139,56
M a r e t / M a r c h 167,00 145,61 141,05 139,52
A p r i l / A p r i l 167,97 146,18 142,61 138,84
M e i / M a y 167,13 146,35 145,06 137,88
J u n i / J u n e 170,78 146,58 145,11 138,71
J u l i / J u l y 172,56 148,80 145,01 138,69
Agustus/August 182,44 150,10 144,78 140,89
September/September 176,63 149,77 145,26 142,65
Oktober/October 174,45 149,98 145,36 143,28
Nopember/November 176,19 150,18 145,53 142,60
Desember/December 176,20 150,07 145,68 142,58
Rata-rata 2012 176,20 150,07 145,68 142,58 Average
2011 164,18 141,31 134,96 130,96
2010 144,89 136,51 127,40 120,78
2009 144,31 129,70 123,89 117,56
2008 123,02 109,05 111,92 109,11
2007 179,91 158,69 154,95 143,95
10.6.1 Indeks Harga Konsumen menurut Kelompok di Kendari, 2012 Tabel
Table Consumer Price Indices by Group in Kendari, 2012 ( 2007 = 100 )
10.6. Harga-Harga Prices
[Diolah dari Hasil Survei Harga Konsumen, BPS /Based on Consumer Prices Survey, BPS-Statistics Indonesia]
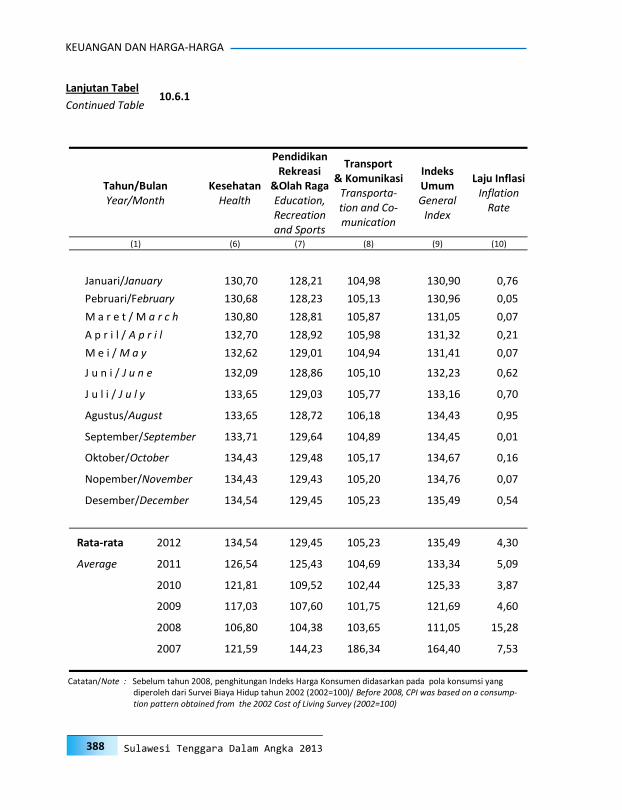
388
KEUANGAN DAN HARGA-HARGA
Sulawesi Tenggara Dalam Angka 2013
Tahun/Bulan Year/Month
Kesehatan Health
Pendidikan Rekreasi
&Olah Raga Education, Recreation and Sports
Transport & Komunikasi
Transporta- tion and Co-munication
Indeks Umum General
Index
Laju Inflasi Inflation
Rate
(1) (6) (7) (8) (9) (10)
Januari/January 130,70 128,21 104,98 130,90 0,76
Pebruari/February 130,68 128,23 105,13 130,96 0,05
M a r e t / M a r c h 130,80 128,81 105,87 131,05 0,07
A p r i l / A p r i l 132,70 128,92 105,98 131,32 0,21
M e i / M a y 132,62 129,01 104,94 131,41 0,07
J u n i / J u n e 132,09 128,86 105,10 132,23 0,62
J u l i / J u l y 133,65 129,03 105,77 133,16 0,70
Agustus/August 133,65 128,72 106,18 134,43 0,95
September/September 133,71 129,64 104,89 134,45 0,01
Oktober/October 134,43 129,48 105,17 134,67 0,16
Nopember/November 134,43 129,43 105,20 134,76 0,07
Desember/December 134,54 129,45 105,23 135,49 0,54
Rata-rata 2012 134,54 129,45 105,23 135,49 4,30
Average 2011 126,54 125,43 104,69 133,34 5,09
2010 121,81 109,52 102,44 125,33 3,87
2009 117,03 107,60 101,75 121,69 4,60
2008 106,80 104,38 103,65 111,05 15,28
2007 121,59 144,23 186,34 164,40 7,53
Catatan/Note : Sebelum tahun 2008, penghitungan Indeks Harga Konsumen didasarkan pada pola konsumsi yang diperoleh dari Survei Biaya Hidup tahun 2002 (2002=100)/ Before 2008, CPI was based on a consump-tion pattern obtained from the 2002 Cost of Living Survey (2002=100)
Lanjutan Tabel
Continued Table 10.6.1

389
FINANCE AND PRICES
Sulawesi Tenggara in Figures 2013
Tahun/Bulan Year/Month
Bahan Makanan Foodstuff
Makanan Jadi, Minuman, Rokok
dan Tembakau Processed Food, Beverages and
Tobacco Products
Perumahan Housing
Sandang Clothing
(1) (2) (3) (4) (5)
Januari/January 0,62 0,88 2,46 -0,36
Pebruari/February 3,88 0,53 0,33 1,85
M a r e t / M a r c h 0,46 0,31 -0,49 -0,03
A p r i l / A p r i l 0,58 0,40 1,10 -0,49
M e i / M a y -0,50 0,12 1,72 -0,69
J u n i / J u n e 2,81 0,16 0,03 0,60
J u l i / J u l y 1,04 1,51 -0,07 -0,01
Agustus/August 5,73 0,87 -0,16 1,59
September/September -3,18 -0,22 0,33 1,25
Oktober/October -1,23 0,14 0,07 0,44
Nopember/November 1,00 0,13 0,12 -0,47
Desember/December 0,01 -0,07 0,10 -0,01
Rata-rata 2012 10,79 4,85 5,66 3,69 Average
2011 2,33 3,48 7,22 9,89
2010 10,07 3,84 2,13 4,30
2009 3,90 12,50 6,48 6,72
2008 32,02 16,36 15,72 7,56
2007 13,28 7,67 6,07 9,99
10.6.2 Inflasi Kota Kendari menurut Kelompok Pengeluaran, 2012 Tabel
Table Inflation Rate of Kendari City by Expenditure Group, 2012 ( 2007 = 100 )
[Diolah dari Hasil Survei Harga Konsumen /Based on Consumer Prices Survey, BPS-Statistics Indonesia]
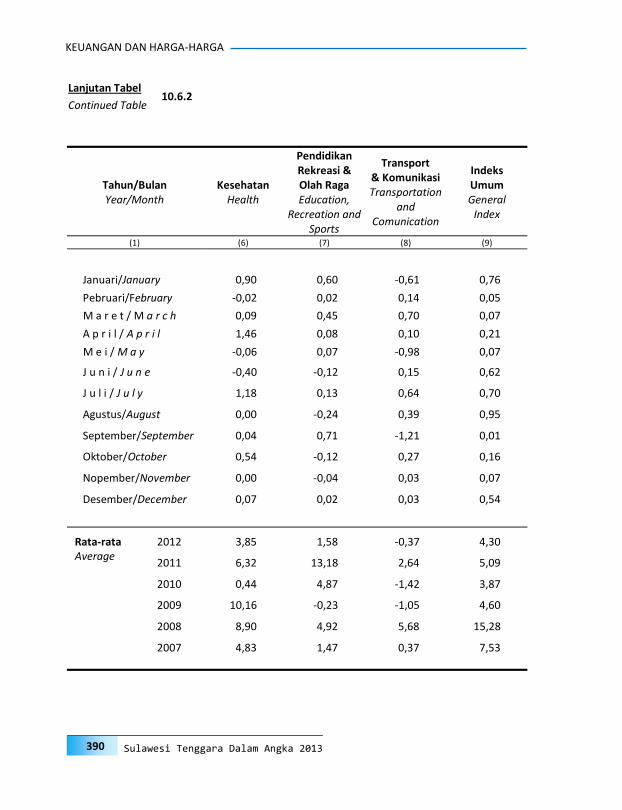
390
KEUANGAN DAN HARGA-HARGA
Sulawesi Tenggara Dalam Angka 2013
Tahun/Bulan Year/Month
Kesehatan Health
Pendidikan Rekreasi & Olah Raga Education,
Recreation and Sports
Transport & Komunikasi Transportation
and Comunication
Indeks Umum General
Index
(1) (6) (7) (8) (9)
Januari/January 0,90 0,60 -0,61 0,76
Pebruari/February -0,02 0,02 0,14 0,05
M a r e t / M a r c h 0,09 0,45 0,70 0,07
A p r i l / A p r i l 1,46 0,08 0,10 0,21
M e i / M a y -0,06 0,07 -0,98 0,07
J u n i / J u n e -0,40 -0,12 0,15 0,62
J u l i / J u l y 1,18 0,13 0,64 0,70
Agustus/August 0,00 -0,24 0,39 0,95
September/September 0,04 0,71 -1,21 0,01
Oktober/October 0,54 -0,12 0,27 0,16
Nopember/November 0,00 -0,04 0,03 0,07
Desember/December 0,07 0,02 0,03 0,54
Rata-rata 2012 3,85 1,58 -0,37 4,30 Average
2011 6,32 13,18 2,64 5,09
2010 0,44 4,87 -1,42 3,87
2009 10,16 -0,23 -1,05 4,60
2008 8,90 4,92 5,68 15,28
2007 4,83 1,47 0,37 7,53
Lanjutan Tabel
Continued Table 10.6.2
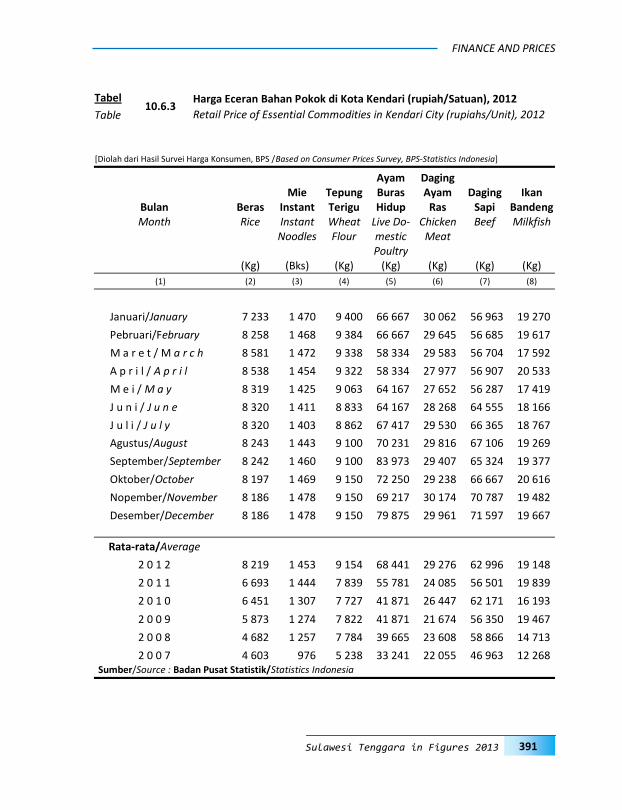
391
FINANCE AND PRICES
Sulawesi Tenggara in Figures 2013
Beras Mie
Instant Tepung Terigu
Ayam Buras Hidup
Daging Ayam
Ras Daging
Sapi Ikan
Bandeng
Bulan Month Rice Instant
Noodles Wheat Flour
Live Do-mestic Poultry
Chicken Meat
Beef Milkfish
(Kg) (Bks) (Kg) (Kg) (Kg) (Kg) (Kg) (1) (2) (3) (4) (5) (6) (7) (8)
Januari/January 7 233 1 470 9 400 66 667 30 062 56 963 19 270
Pebruari/February 8 258 1 468 9 384 66 667 29 645 56 685 19 617
M a r e t / M a r c h 8 581 1 472 9 338 58 334 29 583 56 704 17 592
A p r i l / A p r i l 8 538 1 454 9 322 58 334 27 977 56 907 20 533
M e i / M a y 8 319 1 425 9 063 64 167 27 652 56 287 17 419
J u n i / J u n e 8 320 1 411 8 833 64 167 28 268 64 555 18 166
J u l i / J u l y 8 320 1 403 8 862 67 417 29 530 66 365 18 767
Agustus/August 8 243 1 443 9 100 70 231 29 816 67 106 19 269
September/September 8 242 1 460 9 100 83 973 29 407 65 324 19 377
Oktober/October 8 197 1 469 9 150 72 250 29 238 66 667 20 616
Nopember/November 8 186 1 478 9 150 69 217 30 174 70 787 19 482
Desember/December 8 186 1 478 9 150 79 875 29 961 71 597 19 667
Rata-rata/Average
2 0 1 2 8 219 1 453 9 154 68 441 29 276 62 996 19 148
2 0 1 1 6 693 1 444 7 839 55 781 24 085 56 501 19 839
2 0 1 0 6 451 1 307 7 727 41 871 26 447 62 171 16 193
2 0 0 9 5 873 1 274 7 822 41 871 21 674 56 350 19 467
2 0 0 8 4 682 1 257 7 784 39 665 23 608 58 866 14 713
2 0 0 7 4 603 976 5 238 33 241 22 055 46 963 12 268
10.6.3 Harga Eceran Bahan Pokok di Kota Kendari (rupiah/Satuan), 2012 Tabel
Table Retail Price of Essential Commodities in Kendari City (rupiahs/Unit), 2012
Sumber/Source : Badan Pusat Statistik/Statistics Indonesia
[Diolah dari Hasil Survei Harga Konsumen, BPS /Based on Consumer Prices Survey, BPS-Statistics Indonesia]
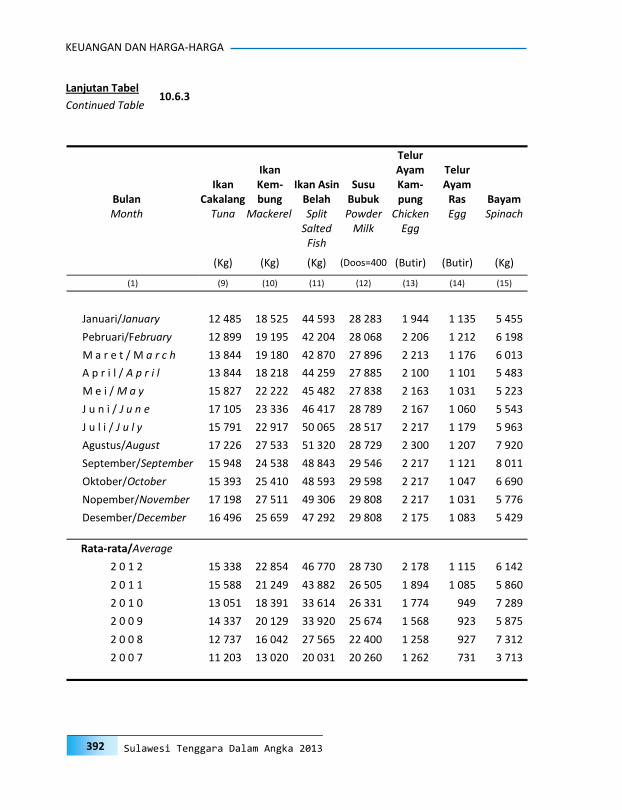
392
KEUANGAN DAN HARGA-HARGA
Sulawesi Tenggara Dalam Angka 2013
Ikan Cakalang
Ikan Kem-bung
Ikan Asin Belah
Susu Bubuk
Telur Ayam Kam-pung
Telur Ayam
Ras Bayam
Bulan Month Tuna Mackerel Split
Salted Fish
Powder Milk
Chicken Egg
Egg Spinach
(Kg) (Kg) (Kg) (Doos=400 (Butir) (Butir) (Kg)
(1) (9) (10) (11) (12) (13) (14) (15)
Januari/January 12 485 18 525 44 593 28 283 1 944 1 135 5 455
Pebruari/February 12 899 19 195 42 204 28 068 2 206 1 212 6 198
M a r e t / M a r c h 13 844 19 180 42 870 27 896 2 213 1 176 6 013
A p r i l / A p r i l 13 844 18 218 44 259 27 885 2 100 1 101 5 483
M e i / M a y 15 827 22 222 45 482 27 838 2 163 1 031 5 223
J u n i / J u n e 17 105 23 336 46 417 28 789 2 167 1 060 5 543
J u l i / J u l y 15 791 22 917 50 065 28 517 2 217 1 179 5 963
Agustus/August 17 226 27 533 51 320 28 729 2 300 1 207 7 920
September/September 15 948 24 538 48 843 29 546 2 217 1 121 8 011
Oktober/October 15 393 25 410 48 593 29 598 2 217 1 047 6 690
Nopember/November 17 198 27 511 49 306 29 808 2 217 1 031 5 776
Desember/December 16 496 25 659 47 292 29 808 2 175 1 083 5 429
Rata-rata/Average
2 0 1 2 15 338 22 854 46 770 28 730 2 178 1 115 6 142
2 0 1 1 15 588 21 249 43 882 26 505 1 894 1 085 5 860
2 0 1 0 13 051 18 391 33 614 26 331 1 774 949 7 289
2 0 0 9 14 337 20 129 33 920 25 674 1 568 923 5 875
2 0 0 8 12 737 16 042 27 565 22 400 1 258 927 7 312
2 0 0 7 11 203 13 020 20 031 20 260 1 262 731 3 713
Lanjutan Tabel
Continued Table 10.6.3

393
FINANCE AND PRICES
Sulawesi Tenggara in Figures 2013
Kangkung Kacang Tanah
Tahu Mentah Tempe
Jeruk Manis Pepaya
Bawang Merah
Bulan Month Water
Spinach Peanuts Tofu Tempe Orange Papaya Red Onion
(Kg) (Kg) (Kg) (Kg) (Kg) (Kg) (Kg)
(1) (16) (17) (18) (19) (20) (21) (22)
Januari/January 4 822 19 452 8 219 9 158 15 792 5 917 18 736
Pebruari/February 5 211 19 235 8 361 9 348 15 542 5 083 17 859
M a r e t / M a r c h 5 347 18 552 8 377 9 434 15 320 3 917 17 816
A p r i l / A p r i l 5 300 18 546 8 122 9 447 14 778 4 000 19 273
M e i / M a y 5 105 18 167 6 497 8 375 14 722 2 562 21 736
J u n i / J u n e 5 449 18 058 5 871 8 502 14 667 2 377 23 920
J u l i / J u l y 5 773 18 275 5 973 9 413 14 833 2 585 21 645
Agustus/August 6 694 18 857 6 038 10 949 16 347 3 237 18 863
September/September 6 678 18 411 5 793 10 975 18 583 3 054 18 153
Oktober/October 5 890 18 275 5 860 11 005 18 361 4 315 17 855
Nopember/November 4 879 19 521 5 678 11 786 18 583 3 980 17 385
Desember/December 4 846 19 377 5 789 11 735 18 583 4 237 19 901
Rata-rata/Average
2 0 1 2 5 500 18 727 6 715 10 011 16 343 3 772 19 429
2 0 1 1 5 188 16 384 7 946 11 193 6 532 5 906 25 167
2 0 1 0 5 405 13 738 6 722 8 692 5 116 4 409 27 055
2 0 0 9 4 735 12 913 5 006 10 000 5 153 4 103 17 624
2 0 0 8 4 821 12 510 4 479 7 222 4 252 3 534 18 828
2 0 0 7 3 237 9 961 3 514 3 921 - 2 665 11 800
Lanjutan Tabel
Continued Table 10.6.3
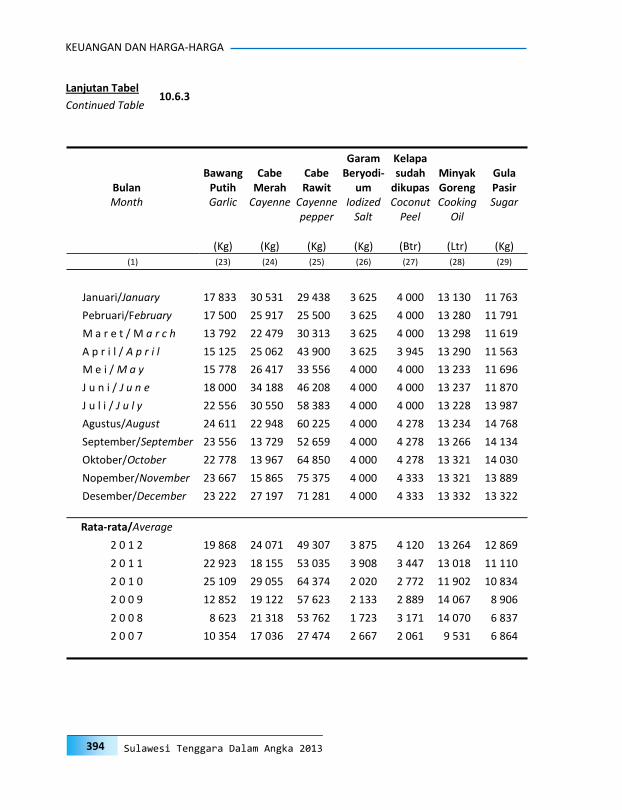
394
KEUANGAN DAN HARGA-HARGA
Sulawesi Tenggara Dalam Angka 2013
Bawang Putih
Cabe Merah
Cabe Rawit
Garam Beryodi-
um
Kelapa sudah
dikupas Minyak Goreng
Gula Pasir
Bulan Month Garlic Cayenne Cayenne
pepper Iodized
Salt Coconut
Peel Cooking
Oil Sugar
(Kg) (Kg) (Kg) (Kg) (Btr) (Ltr) (Kg) (1) (23) (24) (25) (26) (27) (28) (29)
Januari/January 17 833 30 531 29 438 3 625 4 000 13 130 11 763
Pebruari/February 17 500 25 917 25 500 3 625 4 000 13 280 11 791
M a r e t / M a r c h 13 792 22 479 30 313 3 625 4 000 13 298 11 619
A p r i l / A p r i l 15 125 25 062 43 900 3 625 3 945 13 290 11 563
M e i / M a y 15 778 26 417 33 556 4 000 4 000 13 233 11 696
J u n i / J u n e 18 000 34 188 46 208 4 000 4 000 13 237 11 870
J u l i / J u l y 22 556 30 550 58 383 4 000 4 000 13 228 13 987
Agustus/August 24 611 22 948 60 225 4 000 4 278 13 234 14 768
September/September 23 556 13 729 52 659 4 000 4 278 13 266 14 134
Oktober/October 22 778 13 967 64 850 4 000 4 278 13 321 14 030
Nopember/November 23 667 15 865 75 375 4 000 4 333 13 321 13 889
Desember/December 23 222 27 197 71 281 4 000 4 333 13 332 13 322
Rata-rata/Average
2 0 1 2 19 868 24 071 49 307 3 875 4 120 13 264 12 869
2 0 1 1 22 923 18 155 53 035 3 908 3 447 13 018 11 110
2 0 1 0 25 109 29 055 64 374 2 020 2 772 11 902 10 834
2 0 0 9 12 852 19 122 57 623 2 133 2 889 14 067 8 906
2 0 0 8 8 623 21 318 53 762 1 723 3 171 14 070 6 837
2 0 0 7 10 354 17 036 27 474 2 667 2 061 9 531 6 864
Lanjutan Tabel
Continued Table 10.6.3
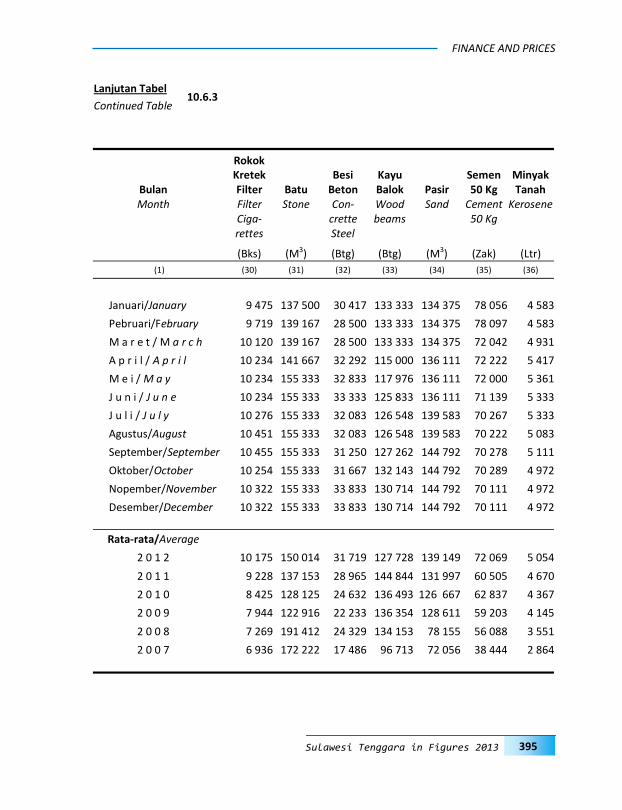
395
FINANCE AND PRICES
Sulawesi Tenggara in Figures 2013
Rokok Kretek Filter Batu
Besi Beton
Kayu Balok Pasir
Semen 50 Kg
Minyak Tanah
Bulan Month Filter
Ciga-rettes
Stone Con-crette Steel
Wood beams
Sand Cement 50 Kg
Kerosene
(Bks) (M3) (Btg) (Btg) (M3) (Zak) (Ltr)
(1) (30) (31) (32) (33) (34) (35) (36)
Januari/January 9 475 137 500 30 417 133 333 134 375 78 056 4 583
Pebruari/February 9 719 139 167 28 500 133 333 134 375 78 097 4 583
M a r e t / M a r c h 10 120 139 167 28 500 133 333 134 375 72 042 4 931
A p r i l / A p r i l 10 234 141 667 32 292 115 000 136 111 72 222 5 417
M e i / M a y 10 234 155 333 32 833 117 976 136 111 72 000 5 361
J u n i / J u n e 10 234 155 333 33 333 125 833 136 111 71 139 5 333
J u l i / J u l y 10 276 155 333 32 083 126 548 139 583 70 267 5 333
Agustus/August 10 451 155 333 32 083 126 548 139 583 70 222 5 083
September/September 10 455 155 333 31 250 127 262 144 792 70 278 5 111
Oktober/October 10 254 155 333 31 667 132 143 144 792 70 289 4 972
Nopember/November 10 322 155 333 33 833 130 714 144 792 70 111 4 972
Desember/December 10 322 155 333 33 833 130 714 144 792 70 111 4 972
Rata-rata/Average
2 0 1 2 10 175 150 014 31 719 127 728 139 149 72 069 5 054
2 0 1 1 9 228 137 153 28 965 144 844 131 997 60 505 4 670
2 0 1 0 8 425 128 125 24 632 136 493 126 667 62 837 4 367
2 0 0 9 7 944 122 916 22 233 136 354 128 611 59 203 4 145
2 0 0 8 7 269 191 412 24 329 134 153 78 155 56 088 3 551
2 0 0 7 6 936 172 222 17 486 96 713 72 056 38 444 2 864
Lanjutan Tabel
Continued Table 10.6.3

396
KEUANGAN DAN HARGA-HARGA
Sulawesi Tenggara Dalam Angka 2013
Gas Elpiji 12 Kg Kulkas
Lemari Pakaian
Sabun Cair Cuci
Piring
Sabun Bubuk
De-tergetn
Bahan Baju
Sersin Telepon Seluler
Bulan Month LPG 12
Kgs Refrigera-
tor Wardrobe Liquid
Dish Soap
Deter-gent
Powder Soap
Dress material
Sersin
Cellular Phone
(Tabung) (Buah) (Buah) (Kemas) (Kemas) (M) (Buah)
(1) (37) (38) (39) (40) (41) (42) (43)
Januari/January 120 667 1 670 413 667 222 6 813 14 072 12 875 806 827
Pebruari/February 123 333 1 686 097 667 222 6 886 14 072 12 917 806 827
M a r e t / M a r c h 116 333 1 686 097 683 889 6 886 14 072 12 917 812 172
A p r i l / A p r i l 115 000 1 686 097 697 778 6 688 14 122 13 334 812 172
M e i / M a y 115 000 1 833 497 678 333 6 750 13 876 13 417 813 244
J u n i / J u n e 115 000 1 824 248 678 333 6 771 13 969 13 417 813 244
J u l i / J u l y 115 000 1 800 779 678 333 6 854 13 969 13 417 813 244
Agustus/August 120 667 1 800 779 678 333 6 844 14 221 14 500 814 247
September/September 113 000 1 800 779 678 333 6 844 14 221 14 500 814 247
Oktober/October 113 000 1 800 779 678 333 6 844 13 849 14 500 814 247
Nopember/November 113 000 1 800 779 678 333 6 750 13 849 14 500 818 899
Desember/December 113 000 1 800 779 678 333 6 706 13 849 14 500 818 899
Rata-rata/Average
2 0 1 2 116 083 1 765 927 678 565 6 803 14 012 13 733 813 189
2 0 1 1 120 028 1 820 130 600 694 6 366 13 811 12 830 862 362
2 0 1 0 116 843 1 786 327 482 222 5 646 12 977 11 788 395 582
2 0 0 9 115 167 1 727 257 474 884 5 588 16 328 15 100 343 853
2 0 0 8 108 287 1 314 815 433 958 4 815 16 036 15 625 -
2 0 0 7 75 000 1 294 444 458 542 4 560 13 467 15 000 -
Lanjutan Tabel
Continued Table 10.6.3

397
FINANCE AND PRICES
Sulawesi Tenggara in Figures 2013
Emas
Perhia-san
Dokter Spesialis
Obat Dengan Resep Dokter
Pasta Gigi
Sabun Mandi
Surat Kabar Harian
Angkutan Udara
Bulan Month Jewelry
Gold Specialis Doctor
Prescrip-tion
Medicine
Tooth-paste
Toilet Soap
Daily News-paper
Air Trans-portation
(Gr) (Pasien) (Resep) (Tube) (Buah) (Eks) (Kdi-Jkt)
(1) (44) (45) (46) (47) (48) (49) (50)
Januari/January 458 765 56 667 10 868 5 458 2 330 3 550 1 705 213
Pebruari/February 486 785 56 667 10 868 5 708 2 302 3 550 1 612 616
M a r e t / M a r c h 485 856 56 667 9 979 5 708 2 302 3 550 1 631 552
A p r i l / A p r i l 479 090 64 333 9 979 5 708 2 350 4 383 1 655 877
M e i / M a y 471 249 64 333 9 979 5 708 2 350 4 383 1 653 746
J u n i / J u n e 475 421 64 333 9 769 5 708 2 350 4 433 1 684 020
J u l i / J u l y 474 250 64 333 9 769 5 708 2 350 4 433 1 784 446
Agustus/August 487 450 64 333 9 769 5 708 2 350 4 433 1 805 639
September/September 511 309 64 333 9 769 5 708 2 350 4 433 1 590 111
Oktober/October 515 725 67 667 9 769 5 708 2 350 4 433 1 649 093
Nopember/November 505 470 67 667 9 769 5 708 2 350 4 433 1 648 398
Desember/December 505 175 67 667 9 771 5 708 2 350 4 433 1 657 308
Rata-rata/Average
2 0 1 2 488 045 63 250 10 005 5 688 2 340 4 204 1 673 168
2 0 1 1 427 981 48 889 11 315 5 284 2 380 3 550 1 686 474
2 0 1 0 357 149 50 000 11 053 4 663 2 353 3 539 1 493 665
2 0 0 9 335 757 50 000 11 701 5 900 2 789 3 533 1 331 043
2 0 0 8 272 028 47 222 6 087 4 216 2 934 3 766 1 225 500
2 0 0 7 201 602 41 690 6 751 3 704 2 461 3 370 1 147 575
Lanjutan Tabel
Continued Table 10.6.3
Sumber/Source : Badan Pusat Statistik/Statistics Indonesia
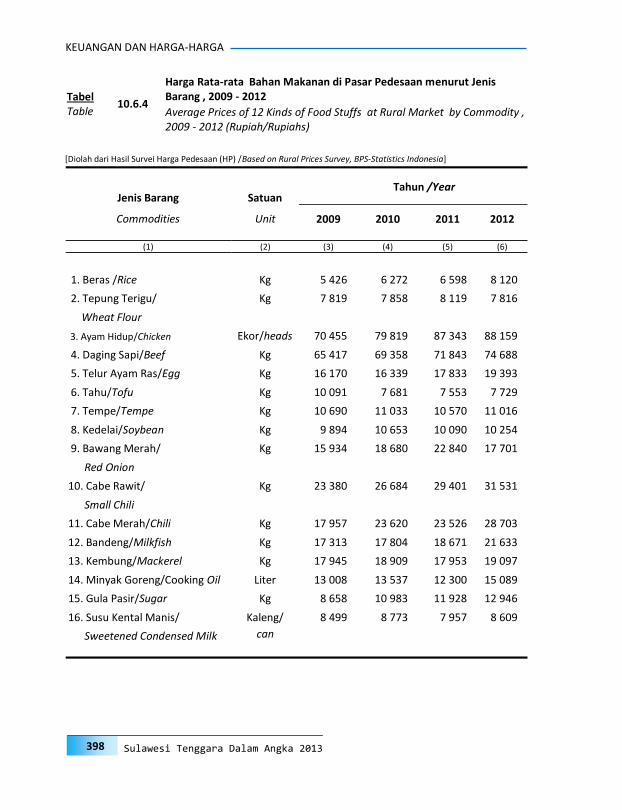
398
KEUANGAN DAN HARGA-HARGA
Sulawesi Tenggara Dalam Angka 2013
Tahun /Year
Jenis Barang Satuan
Commodities Unit 2009 2010 2011 2012
(1) (2) (3) (4) (5) (6)
1. Beras /Rice Kg 5 426 6 272 6 598 8 120
2. Tepung Terigu/ Kg 7 819 7 858 8 119 7 816
Wheat Flour
3. Ayam Hidup/Chicken Ekor/heads 70 455 79 819 87 343 88 159
4. Daging Sapi/Beef Kg 65 417 69 358 71 843 74 688
5. Telur Ayam Ras/Egg Kg 16 170 16 339 17 833 19 393
6. Tahu/Tofu Kg 10 091 7 681 7 553 7 729
7. Tempe/Tempe Kg 10 690 11 033 10 570 11 016
8. Kedelai/Soybean Kg 9 894 10 653 10 090 10 254
9. Bawang Merah/ Kg 15 934 18 680 22 840 17 701
Red Onion
10. Cabe Rawit/ Kg 23 380 26 684 29 401 31 531
Small Chili
11. Cabe Merah/Chili Kg 17 957 23 620 23 526 28 703
12. Bandeng/Milkfish Kg 17 313 17 804 18 671 21 633
13. Kembung/Mackerel Kg 17 945 18 909 17 953 19 097
14. Minyak Goreng/Cooking Oil Liter 13 008 13 537 12 300 15 089
15. Gula Pasir/Sugar Kg 8 658 10 983 11 928 12 946
16. Susu Kental Manis/ Kaleng/ 8 499 8 773 7 957 8 609
Sweetened Condensed Milk can
10.6.4
Harga Rata-rata Bahan Makanan di Pasar Pedesaan menurut Jenis Barang , 2009 - 2012 Tabel
Table Average Prices of 12 Kinds of Food Stuffs at Rural Market by Commodity , 2009 - 2012 (Rupiah/Rupiahs)
[Diolah dari Hasil Survei Harga Pedesaan (HP) /Based on Rural Prices Survey, BPS-Statistics Indonesia]

G D R PPDRB11
GRDP
401 Sulawesi Tenggara in Figures 2013
PENJELASAN TEKNIS
1. Produk Domestik Bruto (PDB) pada ting-kat nasional serta Produk Domestik Re-gional Bruto (PDRB) pada tingkat regional (provinsi) menggambarkan kemampuan suatu wilayah untuk menciptakan output (nilai tambah) pada suatu waktu tertentu. Untuk menyusun PDB maupun PDRB pada penyajian ini digunakan 2 pendeka-tan yaitu sektoral dan penggunaan. Keduanya menyajikan komposisi data nilai tambah dirinci menurut sumber kegiatan ekonomi (sektoral) dan menurut komponen penggunaannya. PDB maupun PDRB dari sisi sektoral merupakan pen-jumlahan seluruh komponen nilai tambah bruto yang mampu diciptakan oleh sektor-sektor ekonomi atas berbagai aktivitas produksinya. Sedangkan dari sisi penggunaan menjelaskan tentang penggunaan dari nilai tambah tersebut.
2. Penyajian PDB menurut sektor dirinci
menurut total nilai tambah dari seluruh sektor ekonomi yang mencakup sektor Pertanian; Pertambangan & Penggalian; Industri Pengolahan; Listrik, Gas & Air Bersih; Konstruksi; Perdagangan, Restoran & Hotel; Pengangkutan & Komu-nikasi; Lembaga Keuangan; dan Jasa-Jasa.
3. PDB menurut penggunaan dirinci
menurut komponen pengeluaran kon-sumsi rumah tangga (termasuk lembaga nirlaba), pengeluaran konsumsi pemerintah, pembentukan modal tetap bruto, perubahan inventori, ekspor dan impor.
4. Pengeluaran konsumsi rumah tangga mencakup berbagai pengeluaran konsum-si akhir rumah tangga atas barang dan
TECHNICAL NOTES
1. The basic measure of the output arising from economic activity is known as Gross Domestic Product (GDP) at the national level and Gross Regional Do-mestic Product (GRDP) at the regional level (provinces/districts/cities). To compile these statistics, two approach-es have been used, i.e. "production approach" and "expenditure ap-proach". The first approach is to meas-ure value added produced by various kinds of economic activities, while the second approach is to measure final uses of the country's output. In other words, GDP/GRDP is the sum of total value added produced by all economic sectors (activities) and the way of using it.
GDP by sector is classified by types of economic activities such as Agricul-ture; Mining & Quarrying; Manufac-turing; Electricity, Gas & Water Sup-ply; Construction; Wholesale & Retail Trade, Restaurants & Hotels; Transport and Communication; Fi-nance, Insurance, Real Estate & Busi-ness Services; and other Services.
3. GDP by type of expenditures is classi-
fied into: Private consumption expendi-ture (household and non-profit institu-tion); Government consumption ex-penditure; Gross fixed capital for-mation; Changes in inventories; Exports and Imports.
4. Household consumption expenditures consist of expenditures incurred by households, which are used for both

PDRB
402 Sulawesi Tenggara Dalam Angka 2013
jasa untuk memenuhi kebutuhan individu ataupun kelompok secara langsung. Pengeluaran rumah tangga di sini men-cakup pembelian untuk makanan dan bukan makanan (barang dan jasa) di-dalam negeri maupun diluar negeri. Ter-masuk pula disini pengeluaran lembaga nirlaba yang tujuan usahanya adalah un-tuk melayani keperluan rumah tangga.
5. Pengeluaran konsumsi pemerintah men-
cakup pengeluaran pemerintah untuk belanja pegawai, penyusutan maupun belanja barang (termasuk biaya perjalan-an, pemeliharaan dan pengeluaran rutin lainnya), baik yang dilakukan oleh pemerintah pusat maupun pemerintah daerah.
6. Pembentukan Modal Tetap Bruto men-
cakup pengadaan, pembuatan dan pem-belian barang modal. Barang modal di-maksud adalah barang barang yang digunakan untuk proses produksi, tahan lama atau yang mempunyai umur pemakaian lebih dari satu tahun seperti bangunan, mesin-mesin dan alat angku-tan. Termasuk pula di sini perbaikan be-sar (berat) yang sifatnya memperpanjang umur atau mengubah bentuk atau kapasi-tas barang modal tersebut. Pengeluaran barang modal untuk keperluan militer tidak dicakup di sini tetapi digolongkan sebagai konsumsi pemerintah.
7. Ekspor barang dan jasa merupakan
transaksi perdagangan barang dan jasa dari penduduk (residen) ke bukan penduduk (non-residen). Impor barang dan jasa adalah transaksi perdagangan dari bukan penduduk ke penduduk. Ek-spor atau impor barang terjadi pada saat terjadi perubahan hak kepemilikan ba-
individual or collective needs. House-hold consumptions are classified into food and non-food (goods and ser-vices) expenditures that may take place in domestic or abroad. Expenditures here include expenditures of nonprofit institutions serving households.
5. Government consumption expenditures consist of expenditures for the compen-sation of employees, capital consump-tion (depreciation) and intermediate consumption (including travel allow-ance, maintenance cost, and other routine expenditures) spent by either central or local government.
6. Gross fixed capital formation consists
of resident producers acquisitions, less disposals, of fixed assets during a given period plus certain addition to the val-ue of non-produced assets done by the productive activity of producer or insti-tutional units. Fixed assets are tangible and intangible assets produced as out-puts from processes of production that are used by themselves and repeatedly, or continuously in process of produc-tion for more than one year. The ex-penditure for military purposes are classified as government expenditure not as capital formation.
7. Exports of goods and services consist of
transactions of goods and services from residents to non-residents. Im-ports of goods and services consist of transaction of goods and services from non-residents to residents. Exports and imports of goods occur when there are changes in ownership of goods be-

GRDP
403 Sulawesi Tenggara in Figures 2013
rang antara penduduk dengan bukan penduduk (dengan atau tanpa perpinda-han fisik barang tersebut).
8. PDB maupun agregat turunannya
disajikan dalam dua versi penilaian, yaitu atas dasar "harga berlaku" dan atas dasar "harga konstan". Disebut sebagai harga berlaku karena seluruh agregat dinilai dengan menggunakan harga pada tahun berjalan, sedangkan harga konstan penilaiannya didasarkan atas harga satu tahun dasar tertentu. Dalam publikasi ini digunakan harga tahun 2000 sebagai dasar penilaian.
9. Laju pertumbuhan Produk Domestik Bruto diperoleh dari perhitungan PDB atas dasar harga konstan. Diperoleh dengan cara mengurangi nilai PDB pada tahun ke-n terhadap nilai pada tahun ke n-1 (tahun sebelumnya), dibagi dengan nilai pada tahun ke n-1, kemudian dikalikan dengan 100 persen. Laju pertumbuhan menunjukkan perkembangan agregat pendapatan dari satu waktu tertentu terhadap waktu sebelumnya.
10. Output adalah nilai dari seluruh produk yang dihasilkan oleh sektor-sektor produksi dengan memanfaatkan faktor produksi yang tersedia di suatu wilayah (negara, propinsi dan sebagainya) dalam suatu periode waktu tertentu (umumnya satu tahun), tanpa memperhatikan asal-usul pelaku produksinya.
11. Input antara adalah seluruh biaya yang dikeluarkan untuk barang dan jasa yang digunakan habis dalam proses produksi. Komponen input antara terdiri dari barang tidak tahan lama dan jasa yang
tween residents & nonresidents (with or without physical movements of goods across frontiers).
8. GDP and its aggregations are present-
ed in two forms: at current market prices and at constant base year mar-ket prices. In presenting current market prices, all aggregates are valued at current market prices, while base year constant market prices are shown by valuing all aggregates at fixed base year prices. Year of 2000 is used as the base year in this publication.
9. Growth rate of Gross Domestic Product (GDP) is derived from GDP at constant market prices. It is obtained by sub-tracting the value of GDP year n with the value of GDP year n-1, divided by the value of GDP year n-1 then multi-plied by 100 percent. The growth rate of GDP explains the income growth during the given period.
10. Output is the value of products pro-
duced by production sectors utilizing all production factors available in the region during a given period, without taking into account the origin of pro-ducers.
11. Intermediate Inputs are all costs of
obtaining goods and services that are fully utilized in the production process. The intermediate input components consist of non-durable goods and ser-

PDRB
404 Sulawesi Tenggara Dalam Angka 2013
dapat berupa hasil produksi dalam negeri atau impor.
12. Input primer adalah input atau biaya yang
timbul sebagai akibat dari pemakaian faktor produksi dalam suatu kegiatan ekonomi. Faktor produksi antara lain : tenaga kerja, tanah, modal dan kewiraswastaan.
13. Permintaan akhir adalah permintaan atas
barang dan jasa yang digunakan untuk konsumsi akhir. Sesuai dengan pengertian ini maka permintaan akhir tidak men-cakup barang jasa yang digunakan untuk kegiatan produksi. Permintaan akhir terdiri dari pengeluaran konsumsi rumah tangga, pengeluaran konsumsi pemerintah, pembentukan modal tetap bruto, perubahan stok dan ekspor. Ba-rang dan jasa yang digunakan untuk me-menuhi permintaan akhir dapat berupa barang dan jasa hasil produksi dalam negeri (domestik) atau barang dan jasa yang diperoleh dari impor.
14. Berdasarkan hal ini jelas bahwa impor adalah komponen penyediaan dan bukan merupakan bagian dari permintaan akhir. Namun demikian dalam sistem penyajian tabel I-O, permintaan akhir dan impor disajikan dalam satu kuadran (kuadran II). Itulah sebabnya dalam konteks tabel I-O, pembahasan permintaan akhir digabung dengan impor.
Upah/gaji adalah nilai tambah yang dibayarkan sebagai balas jasa atas penggunaan faktor produksi tenaga kerja (termasuk imputasi upah dan gaji).
16. Pendapatan rumah tangga adalah penda-
patan yang diterima oleh rumah tangga,
vices in the form of both domestic production and imports.
12. Primary Inputs are costs relating to the
utilization of production factors in an economic activity. Production factors include workers, land, capital and en-trepreneurship.
13. Final demand is the demand for goods
and services utilized for final consump-tion. In line with this definition, final demand excludes goods and services utilized in the production process. Final demand includes household consump-tion expenditures, government con-sumption expenditures, gross fixed capital formation, change in stock, and exports. Goods and services used to fulfill the final demand can be in the form of goods and services resulted from either the domestic production or imports.
14. Based on the above concept, import is
a component of supply, not a part of final demand. However, in the Input-Output (I-O) Table, final demand and imports are presented in one quadrant (quadrant II). That is why in the context of I-O Table, discussion of final demand is integrated with that of imports.
Wage/salary is value added paid as reward of employing labor production factor (including imputation of wage and salary).
16.Household income is defined as incomes
received by all household members.

GRDP
405 Sulawesi Tenggara in Figures 2013
baik yang berasal dari pendapatan kepala rumah tangga maupun anggota rumah tangga. Pendapatan rumah tangga dapat berasal dari balas jasa faktor produksi tenaga kerja (upah & gaji, keuntungan, bonus, dll), balas jasa kapital (sewa, bagi hasil, dll) maupun pendapatan yang be-rasal dari pemberian pihak lain (transfer).
17. Jumlah pendapatan rumah tangga adalah total pendapatan yang diterima oleh ru-mah tangga, baik yang berasal dari pen-dapatan kepala rumah tangga maupun pendapatan anggota rumah tangga.
18. Pendapatan rumah tangga setelah pajak adalah pendapatan rumah tangga setelah dikurangkan pajak.
19. Pendapatan disposabel adalah pendapa-
tan rumah tangga setelah dikurangi dengan beban yang harus dibayar oleh rumah tangga.
20. Pendapatan kapital adalah nilai tambah yang dibayarkan sebagai balas jasa atas penggunaan faktor produksi bukan tena-ga kerja termasuk keuntungan, dividen, bunga, sewa tanah, dan sejenisnya.
21. Pengeluaran konsumsi adalah penge-luaran aktual rumah tangga untuk kon-sumsi akhir terhadap berbagai jenis produk seperti sandang,pangan, papan (tidak termasuk pengeluaran transfer). Pengeluaran konsumsi ini mencakup pembelian berbagai jenis barang dan jasa hasil produksi domestik maupun impor.
22. Pajak yang dimaksud disini adalah pajak langsung yakni jenis pungutan pemerintah secara langsung dikumpulkan dari pihak yang wajib membayar pajak.
Household income can be in the form of production factors compensation (wages and salaries, profits, bonuses, etc.), capital compensation (rent, profit sharing, etc.), or incomes from transfer.
17.Total household income is total income
received by all household members (head of household and its members).
18.Household income after tax is house-
hold income minus tax. 19.Disposable income is household income
minus liabilities that must be paid by household.
20.Capital income is value added paid as a
result of the utilization of non-worker production factors. It includes profits, dividend, interest, land renting, and others in the same category.
21.Consumption expenditure is actual ex-
penditure of household for final con-sumption spent for various goods and services (excluding transfer). Consump-tion expenditure includes spending for various goods and services resulted from domestic production and imports.
22. Tax, defined here, refers to direct tax, which is defined as government charg-es directly collected from tax payers.

PDRB
406 Sulawesi Tenggara Dalam Angka 2013
23. Rumah tangga adalah seseorang atau sekelompok orang yang tinggal dalam satu atap dan makan dari satu dapur.
24. Tenaga kerja pertanian adalah tenaga
kerja dalam usaha pertanian termasuk perkebunan, perikanan, kehutanan, dan perburuan, yang atas nama sendiri atau bersama dengan pihak lain, memimpin, menyelenggarakan, mengawasi, atau melaksanakan usaha pertanian, peter-nakan, kehutanan, perikanan, perburuan dan penangkapan hewan dan usaha-usaha yang berhubungan dengan itu.
25. Tenaga kerja produksi, operator alat
angkutan, manual adalah tenaga kerja yang yang melaksanakan kegiatan peng-galian dan pengolahan bahan tambang, minyak dan gas bumi; proses pemuatan barang; konstruksi, perawatan, dan per-baikan berbagai jenis jalan, bangunan, mesin dan lain-lain, termasuk di da-lamnya tenaga kerja yang mengerjakan bahan-bahan, mengemudikan alat angku-tan dan peralatan lain serta melaksanakan tugas yang terutama menggunakan tenaga jasmani.
26. Tenaga kerja tata-usaha, penjualan dan
jasa adalah tenaga kerja dalam berbagai jabatan tata usaha yang meliputi pekerja pengawas tata usaha, pejabat pelaksana pemerintah, pengawas pelaksanaan jasa angkutan dan komunikasi, penyusun dan pemelihara catatan transaksi keuangan termasuk pengurus kas, pencatat, baik lisan atau tertulis (steno, mesin dan ketik), melayani mesin kantor, peralatan telepon dsb, termasuk penyelenggara angkutan darat bagi penumpang, distri-busi barang kiriman dan tugas lainnya.
23.Household is an individual or a group of people living in a physical/ census building unit or part thereof who make common provision for food and other essentials of living.
24.Agricultural worker is someone working
in the agricultural sector including estates, fishery, forestry, and hunting, whether working as an individual or in collaboration with other parties, lead-ing, supervising, and conducting activi-ties in agriculture, estates, forestry, fishery, and hunting as well as related activities.
25.Production, operator, and manual
workers are those having activities of quarrying and processing mining ore, oil and gas; processing of stuffing; con-structing, maintaining, and repairing roads, buildings, machineries, etc, those who are implementing their knowledge in technological, social, economic, and industrial problems, as well as experts, arts, and sports. includ-ing workers who prepares materials, driving & operating vehicles and other equipments and other physical jobs.
26.Clerical, sales and services workers con-
sist of administration supervisors, gov-ernmental officers, supervisors of transportation and communication activities, staff of financial transaction activities, including distributors of ship-ment articles, and other related jobs.
GRDP
407 Sulawesi Tenggara in Figures 2013
27. Tenaga kerja profesional, teknisi, mana-
jer, militer meliputi pejabat legislatif dan tenaga manajemen; manajer (utama, produksi, kecuali produksi pertanian, pemasaran, keuangan, administrasi, per-sonalia, litbang) dan direktur, sedangkan tenaga profesional dan teknisi adalah mereka yang dalam pekerjaannya dengan menerapkan ilmu pengetahuan untuk memecahkan berbagai persoalan teknologi, sosial, ekonomi, industri serta melakukan fungsi keahlian, teknis, kese-nian dan yang berhubungan dengan itu di berbagai bidang termasuk olahraga. Tenaga kerja penerima upah gaji meliputi buruh/karyawan/pegawai dan pekerja bebas (pertanian/nonpertanian).
Tenaga kerja bukan penerima upah gaji meliputi tenaga kerja yang status peker-jaannya berusaha sendiri, berusaha dibantu buruh tidak tetap/buruh tak dibayar, berusaha dibantu buruh tetap/ dibayar dan pekerja keluarga/tak dibayar.
29. Rumah tangga buruh tani adalah rumah
tangga dengan kepala rumah tangga atau penerima pendapatan terbesar bekerja sebagai buruh tani.
30. Rumah tangga petani gurem adalah ru-
mah tangga yang kepala rumah tanggan-ya atau penerima pendapatan terbesar menerima pendapatan dari hasil mengu-sahakan lahan pertanian yang memiliki lahan pertanian kurang dari 0,5 ha.
31. PDRB Produk Domestik Regional Bruto
(PDRB) dapat didefinisikan sebagai keseluruhan nilai tambah barang dan
27.Professional, technician, managerial,
and non-civilian workers consist of managers (main, production excluding agricultural production, marketing, financial, administration, HRD, and research and development) and direc-tor. Meanwhile, professional and tech-nician are Paid workers consist of la-bors/employees and free labors (agricultural and non-agricultural).
28.Unpaid workers consist of own workers,
own workers with temporary/unpaid workers, own workers with permanent/paid workers, and family workers.
29. Agricultural labor household is a house-
hold with household head working as agricultural labor or the main income being from working as agricultural laborer.
30. Operator, land owner 0.0-0.5 ha agri-
cultural household is defined as house-hold with household's head working for or the main income being from utilizing agricultural land of less than 0.5 ha.
31. GRDP Gross Regional Domestic Product
(GRDP) can be defined as the total value-added of goods and services
PDRB
408 Sulawesi Tenggara Dalam Angka 2013
jasa yang dihasilkan oleh seluruh unit usaha dalam suatu wilayah tertentu dalam waktu satu tahun. Nilai PDRB mencerminkan kemajuan ekonomi suatu daerah.
32. Struktur PDRB Dalam struktur perekonomian Sulawesi
Tenggara, sektor pertanian masih merupakan sektor yang mempunyai peran terbesar terhadap PDRB atas dasar harga berlaku.
33. PDRB Perkapita Salah satu tolok ukur untuk mengetahui
tingkat kemakmuran suatu daerah dapat dilihat dari besarnya PDRB per kapita. Rata-rata peningkatan PDRB per kapita penduduk Sulawesi Tenggara memperlihatkan angka diatas 10 persen, ini menunjukkan tingkat kemakmuran yang semakin baik.
34. PDRB Menurut Penggunaan Secara umum PDRB dikelompokkan
menjadi tiga kelompok penggunaan yaitu konsumsi, investasi, dan kelompok penggunaan diluar wilayah neto. Ketiga kelompok ini merupakan komponen permintaan akhir dari seluruh Produk Domestik Regional Bruto Sulawesi Tenggara yang mempunyai efek multiplier. Bila salah satu komponen berubah maka akan berpengaruh kepada komponen yang lain, begitu pula apabila terjadi kenaikan PDRB maka masing-masing komponen akan berubah sesuai dengan polanya masing-masing.
produced by all business units in a par-ticular area within a year. GRDP reflects the economic progress of a region.
32. GRDP Structure In Sulawesi Tenggara economic struc-
ture, the agricultural sector still has the biggest contribution for GRDP at cur-rent market prices.
33. Per Capita GRDP One of the benchmarks to determine
the level of prosperity of a region is the amount of per capita GRDP. The aver-age increase in per capita GRDP of Sulawesi Tenggara showed figure of above 10 percent. It shows an improv-ing level of prosperity.
34. GRDP by Expenditure Generally, GRDP is classified into
three expenditure classifications, namely consumption, investment, and non-net use. These three classifica-tions are the component of the final demand of the entire Gross Regional Domestic Product in Sulawesi Tenggara which had a multiplier effect. If one component changes, it will affect other components, as well as in the event of an increase in the GRDP, then each component will change in accordance with their re-spective patterns.

GRDP
409 Sulawesi Tenggara in Figures 2013
35. Kelompok Investasi Pembentukan modal tetap bruto (PMTB)
adalah penambahan barang-barang modal dari seluruh sektor perekonomian yang terjadi dalam satu tahun.
35. Investment Group Gross fixed capital formation (GFCF) is
the addition of capital goods from all economic sectors occurred within one year.
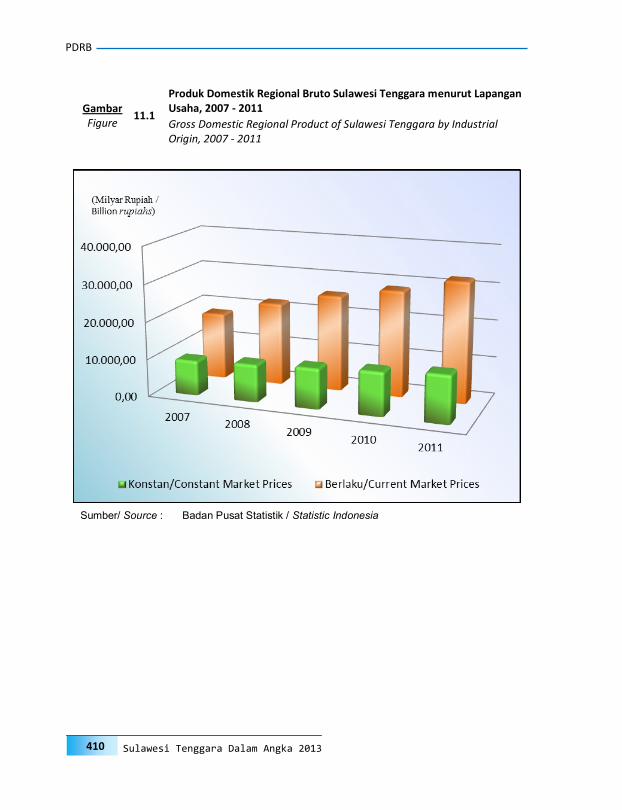
PDRB
410 Sulawesi Tenggara Dalam Angka 2013
11.1
Produk Domestik Regional Bruto Sulawesi Tenggara menurut Lapangan Usaha, 2007 - 2011 Gambar
Figure Gross Domestic Regional Product of Sulawesi Tenggara by Industrial Origin, 2007 - 2011
Sumber/ Source : Badan Pusat Statistik / Statistic Indonesia
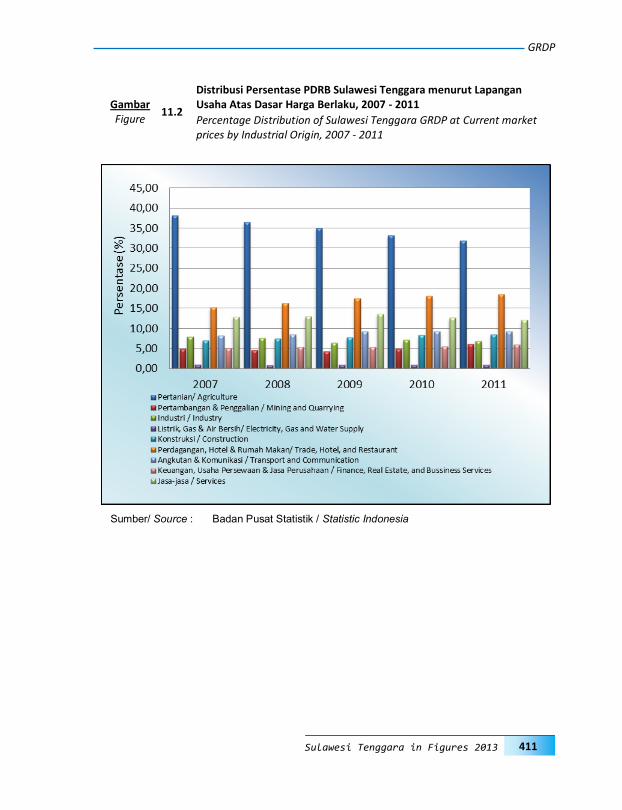
GRDP
411 Sulawesi Tenggara in Figures 2013
Sumber/ Source : Badan Pusat Statistik / Statistic Indonesia
11.2
Distribusi Persentase PDRB Sulawesi Tenggara menurut Lapangan Usaha Atas Dasar Harga Berlaku, 2007 - 2011 Gambar
Figure Percentage Distribution of Sulawesi Tenggara GRDP at Current market prices by Industrial Origin, 2007 - 2011
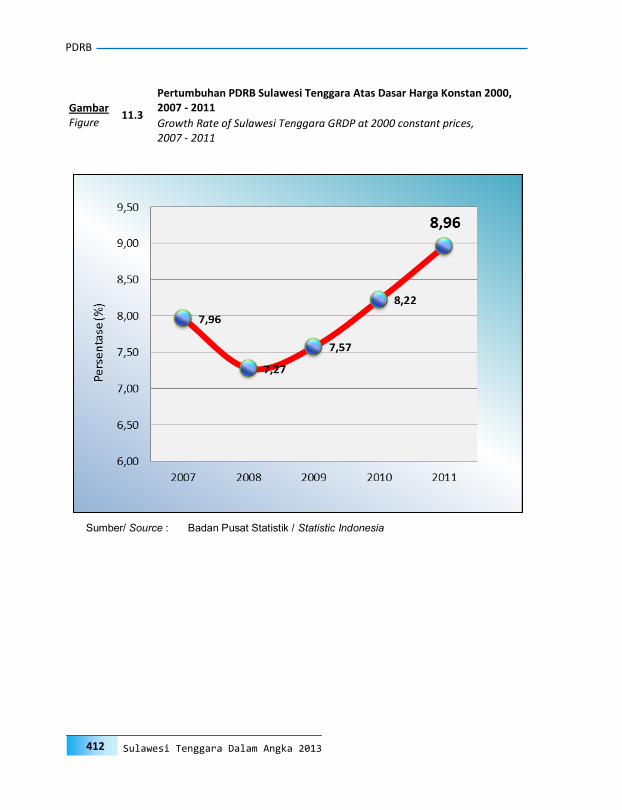
PDRB
412 Sulawesi Tenggara Dalam Angka 2013
11.3
Pertumbuhan PDRB Sulawesi Tenggara Atas Dasar Harga Konstan 2000, 2007 - 2011 Gambar
Figure Growth Rate of Sulawesi Tenggara GRDP at 2000 constant prices, 2007 - 2011
Sumber/ Source : Badan Pusat Statistik / Statistic Indonesia
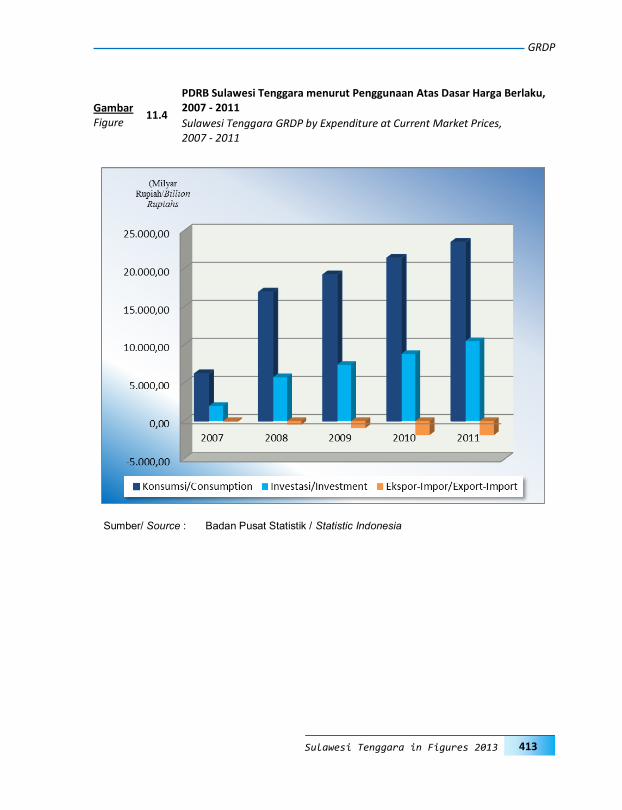
GRDP
413 Sulawesi Tenggara in Figures 2013
Sumber/ Source : Badan Pusat Statistik / Statistic Indonesia
11.4
PDRB Sulawesi Tenggara menurut Penggunaan Atas Dasar Harga Berlaku, 2007 - 2011 Gambar
Figure Sulawesi Tenggara GRDP by Expenditure at Current Market Prices, 2007 - 2011

PDRB
414 Sulawesi Tenggara Dalam Angka 2013
11.5
PDRB Sulawesi Tenggara menurut Penggunaan Atas Dasar Harga Konstan 2000, 2007 - 2011 Gambar
Figure Sulawesi Tenggara GRDP by Expenditure at 2000 Constant Market Prices, 2007 - 2011
Sumber/Source : Badan Pusat Statistik / Statistic Indonesia
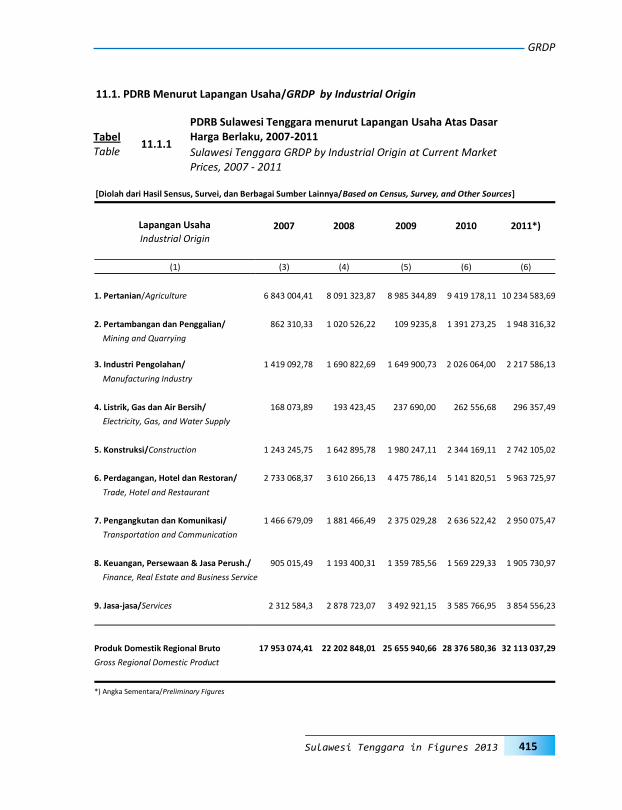
GRDP
415 Sulawesi Tenggara in Figures 2013
Lapangan Usaha 2007 2008 2009 2010 2011*) Industrial Origin
(1) (3) (4) (5) (6) (6)
1. Pertanian/Agriculture 6 843 004,41 8 091 323,87 8 985 344,89 9 419 178,11 10 234 583,69
2. Pertambangan dan Penggalian/ 862 310,33 1 020 526,22 109 9235,8 1 391 273,25 1 948 316,32
Mining and Quarrying
3. Industri Pengolahan/ 1 419 092,78 1 690 822,69 1 649 900,73 2 026 064,00 2 217 586,13
Manufacturing Industry
4. Listrik, Gas dan Air Bersih/ 168 073,89 193 423,45 237 690,00 262 556,68 296 357,49
Electricity, Gas, and Water Supply
5. Konstruksi/Construction 1 243 245,75 1 642 895,78 1 980 247,11 2 344 169,11 2 742 105,02
6. Perdagangan, Hotel dan Restoran/ 2 733 068,37 3 610 266,13 4 475 786,14 5 141 820,51 5 963 725,97
Trade, Hotel and Restaurant
7. Pengangkutan dan Komunikasi/ 1 466 679,09 1 881 466,49 2 375 029,28 2 636 522,42 2 950 075,47
Transportation and Communication
8. Keuangan, Persewaan & Jasa Perush./ 905 015,49 1 193 400,31 1 359 785,56 1 569 229,33 1 905 730,97
Finance, Real Estate and Business Service
9. Jasa-jasa/Services 2 312 584,3 2 878 723,07 3 492 921,15 3 585 766,95 3 854 556,23
Produk Domestik Regional Bruto 17 953 074,41 22 202 848,01 25 655 940,66 28 376 580,36 32 113 037,29
Gross Regional Domestic Product
*) Angka Sementara/Preliminary Figures
11.1.1
PDRB Sulawesi Tenggara menurut Lapangan Usaha Atas Dasar Harga Berlaku, 2007-2011 Tabel
Table Sulawesi Tenggara GRDP by Industrial Origin at Current Market Prices, 2007 - 2011
11.1. PDRB Menurut Lapangan Usaha/GRDP by Industrial Origin
[Diolah dari Hasil Sensus, Survei, dan Berbagai Sumber Lainnya/Based on Census, Survey, and Other Sources]

PDRB
416 Sulawesi Tenggara Dalam Angka 2013
Lapangan Usaha 2007 2008 2009 2010 2011*) Industrial Origin
(1) (3) (4) (5) (6) (6)
1. Pertanian/Agriculture 3 303 470,98 3469 894,91 3 564 767,39 3 610 532,84 3 702 808,97
2. Pertambangan dan Penggalian/ 536 667,15 519 175,06 550 582,51 677 167,15 914 990,55
Mining and Quarrying
3. Industri Pengolahan/ 835 499,92 887 092,82 862 645,26 1 024 638,80 1 091 287,72
Manufacturing Industry
4. Listrik, Gas dan Air Bersih/ 64 491,61 69 556,67 80 434,84 87 502,02 97 217,90
Electricity, Gas, and Water Supply
5. Konstruksi/Construction 732 814,84 815 608,87 919 170,64 1 060 548,57 1 195 882,84
6. Perdagangan, Hotel dan Restoran/ 1 427 412,11 1 577 137,62 1 807 817,91 2 023 227,69 2 249 444,67
Trade, Hotel and Restaurant
7. Pengangkutan dan Komunikasi/ 694 483,10 789 659,51 944 051,20 1 029 413,72 1 128 516,51
Transportation and Communication
8. Keuangan, Persewaan & Jasa Perush./ 516 842,9 576 339,93 618 325,07 700 137,69 825 544,69
Finance, Real Estate and Business Service
9. Jasa-jasa/Services 1 220 037,34 1 306 120,96 1 420 782,37 1 440 737,93 1 492 426,92
Produk Domestik Regional Bruto 9 331 719,95 10 010 586,35 10 768 577,19 11 653 906,41 12 698 120,77
Gross Regional Domestic Product
*) Angka Sementara/Preliminary Figures
11.1.2
PDRB Sulawesi Tenggara menurut Lapangan Usaha Atas Dasar Harga Konstan 2000 (Jutaan Rupiah), 2007-2011 Tabel
Table GRDP of Sulawesi Tenggara by Industrial Origin at 2000 Constant Mar-ket Prices (Million Rupiahs), 2007-2011
[Diolah dari Hasil Sensus, Survei, dan Berbagai Sumber Lainnya/Based on Census, Survey, and Other Sources]
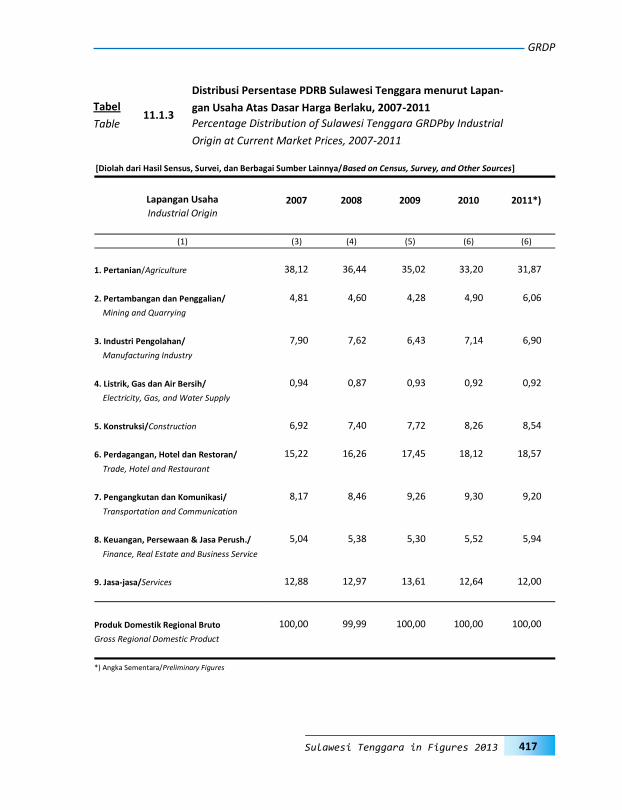
GRDP
417 Sulawesi Tenggara in Figures 2013
Lapangan Usaha 2007 2008 2009 2010 2011*) Industrial Origin
(1) (3) (4) (5) (6) (6)
1. Pertanian/Agriculture 38,12 36,44 35,02 33,20 31,87
2. Pertambangan dan Penggalian/ 4,81 4,60 4,28 4,90 6,06
Mining and Quarrying
3. Industri Pengolahan/ 7,90 7,62 6,43 7,14 6,90
Manufacturing Industry
4. Listrik, Gas dan Air Bersih/ 0,94 0,87 0,93 0,92 0,92
Electricity, Gas, and Water Supply
5. Konstruksi/Construction 6,92 7,40 7,72 8,26 8,54
6. Perdagangan, Hotel dan Restoran/ 15,22 16,26 17,45 18,12 18,57
Trade, Hotel and Restaurant
7. Pengangkutan dan Komunikasi/ 8,17 8,46 9,26 9,30 9,20
Transportation and Communication
8. Keuangan, Persewaan & Jasa Perush./ 5,04 5,38 5,30 5,52 5,94
Finance, Real Estate and Business Service
9. Jasa-jasa/Services 12,88 12,97 13,61 12,64 12,00
Produk Domestik Regional Bruto 100,00 99,99 100,00 100,00 100,00
Gross Regional Domestic Product
*) Angka Sementara/Preliminary Figures
11.1.3
Distribusi Persentase PDRB Sulawesi Tenggara menurut Lapan-
gan Usaha Atas Dasar Harga Berlaku, 2007-2011 Tabel
Table Percentage Distribution of Sulawesi Tenggara GRDPby Industrial
Origin at Current Market Prices, 2007-2011
[Diolah dari Hasil Sensus, Survei, dan Berbagai Sumber Lainnya/Based on Census, Survey, and Other Sources]

PDRB
418 Sulawesi Tenggara Dalam Angka 2013
Lapangan Usaha 2007 2008 2009 2010 2011*) Industrial Origin
(1) (3) (4) (5) (6) (6)
1. Pertanian/Agriculture 35,40 34,66 33,11 30,98 29,16
2. Pertambangan dan Penggalian/ 5,75 5,19 5,12 5,81 7,21
Mining and Quarrying
3. Industri Pengolahan/ 8,97 8,87 8,02 8,80 8,59
Manufacturing Industry
4. Listrik, Gas dan Air Bersih/ 0,69 0,70 0,74 0,75 0,76
Electricity, Gas, and Water Supply
5. Konstruksi/Construction 7,85 8,15 8,54 9,10 9,42
6. Perdagangan, Hotel dan Restoran/ 15,29 15,75 16,79 17,36 17,71
Trade, Hotel and Restaurant
7. Pengangkutan dan Komunikasi/ 7,44 7,89 8,76 8,83 8,89
Transportation and Communication
8. Keuangan, Persewaan & Jasa Perush./ 5,53 5,76 5,74 6,01 6,50
Finance, Real Estate and Business Service
9. Jasa-jasa/Services 13,08 13,04 13,18 12,36 11,76
Produk Domestik Regional Bruto 100,00 100,01 100,00 100,00 100,00
Gross Regional Domestic Product
*) Angka Sementara/Preliminary Figures
11.1.4
Distribusi Persentase PDRB Sulawesi Tenggara menurut Lapangan Usaha Atas Dasar Harga Konstan 2000, 2007-2011 Tabel
Table Percentage Distribution of Sulawesi Tenggara GRDP by Industrial Origin at 2000 Constant Market Prices, 2007-2011
[Diolah dari Hasil Sensus, Survei, dan Berbagai Sumber Lainnya/Based on Census, Survey, and Other Sources]

GRDP
419 Sulawesi Tenggara in Figures 2013
Lapangan Usaha 2007 2008 2009 2010 2011*) Industrial Origin
(1) (3) (4) (5) (6) (6)
1. Pertanian/Agriculture 316,38 374,10 415,43 435,49 473,19
2. Pertambangan dan Penggalian/ 376,95 446,11 480,52 608,18 851,69
Mining and Quarrying
3. Industri Pengolahan/ 242,92 289,44 282,43 346,82 379,61
Manufacturing Industry
4. Listrik, Gas dan Air Bersih/ 567,03 652,55 801,89 885,78 999,81
Electricity, Gas, and Water Supply
5. Konstruksi/Construction 278,38 367,87 443,40 524,89 613,99
6. Perdagangan, Hotel dan Restoran/ 309,49 408,83 506,84 582,26 675,33
Trade, Hotel and Restaurant
7. Pengangkutan dan Komunikasi/ 414,15 531,27 670,64 744,48 833,02
Transportation and Communication
8. Keuangan, Persewaan & Jasa Perush./ 427,33 563,49 642,06 740,95 899,84
Finance, Real Estate and Business Service
9. Jasa-jasa/Services 264,73 329,53 399,84 410,47 441,24
Produk Domestik Regional Bruto 310,89 384,49 444,29 491,40 556,10
Gross Regional Domestic Product
*) Angka Sementara/Preliminary Figures
11.1.5
Indeks Perkembangan PDRB Sulawesi Tenggara menurut Lapan-gan Usaha Atas Dasar Harga Berlaku, 2007-2011 Tabel
Table Growth Index of Sulawesi Tenggara GRDP by Industrial Origin at Current Market Prices, 2007-2011
[Diolah dari Hasil Sensus, Survei, dan Berbagai Sumber Lainnya/Based on Census, Survey, and Other Sources]
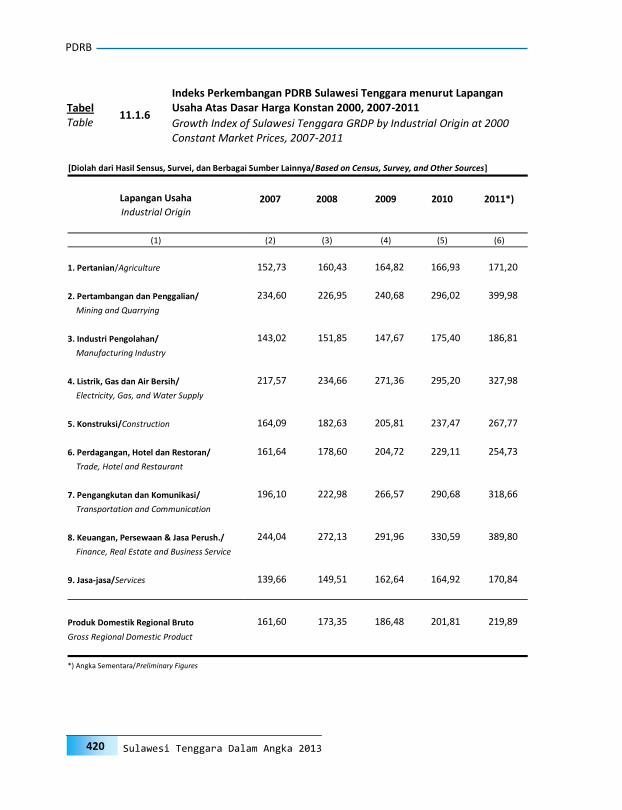
PDRB
420 Sulawesi Tenggara Dalam Angka 2013
Lapangan Usaha 2007 2008 2009 2010 2011*) Industrial Origin
(1) (2) (3) (4) (5) (6)
1. Pertanian/Agriculture 152,73 160,43 164,82 166,93 171,20
2. Pertambangan dan Penggalian/ 234,60 226,95 240,68 296,02 399,98
Mining and Quarrying
3. Industri Pengolahan/ 143,02 151,85 147,67 175,40 186,81
Manufacturing Industry
4. Listrik, Gas dan Air Bersih/ 217,57 234,66 271,36 295,20 327,98
Electricity, Gas, and Water Supply
5. Konstruksi/Construction 164,09 182,63 205,81 237,47 267,77
6. Perdagangan, Hotel dan Restoran/ 161,64 178,60 204,72 229,11 254,73
Trade, Hotel and Restaurant
7. Pengangkutan dan Komunikasi/ 196,10 222,98 266,57 290,68 318,66
Transportation and Communication
8. Keuangan, Persewaan & Jasa Perush./ 244,04 272,13 291,96 330,59 389,80
Finance, Real Estate and Business Service
9. Jasa-jasa/Services 139,66 149,51 162,64 164,92 170,84
Produk Domestik Regional Bruto 161,60 173,35 186,48 201,81 219,89
Gross Regional Domestic Product
*) Angka Sementara/Preliminary Figures
11.1.6
Indeks Perkembangan PDRB Sulawesi Tenggara menurut Lapangan Usaha Atas Dasar Harga Konstan 2000, 2007-2011 Tabel
Table Growth Index of Sulawesi Tenggara GRDP by Industrial Origin at 2000 Constant Market Prices, 2007-2011
[Diolah dari Hasil Sensus, Survei, dan Berbagai Sumber Lainnya/Based on Census, Survey, and Other Sources]
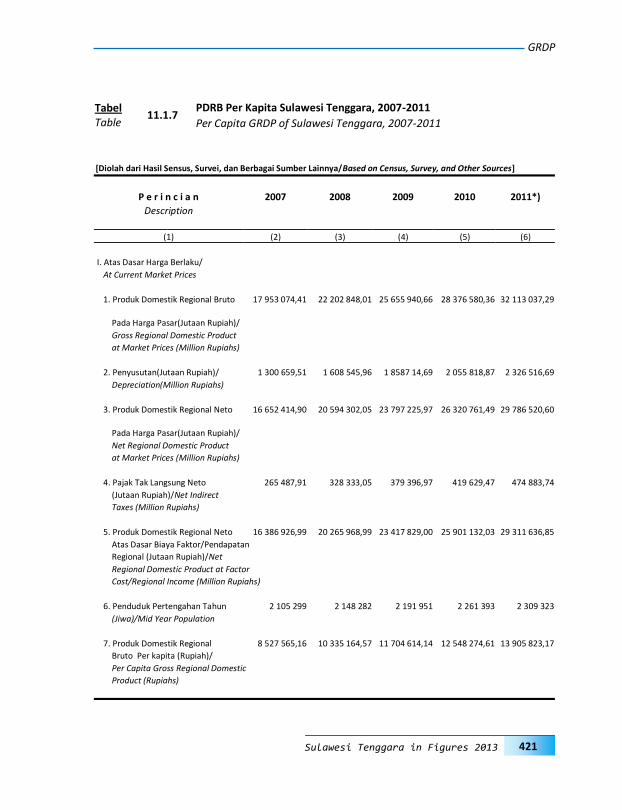
GRDP
421 Sulawesi Tenggara in Figures 2013
P e r i n c i a n 2007 2008 2009 2010 2011*)
Description
(1) (2) (3) (4) (5) (6)
I. Atas Dasar Harga Berlaku/
At Current Market Prices
1. Produk Domestik Regional Bruto 17 953 074,41 22 202 848,01 25 655 940,66 28 376 580,36 32 113 037,29
Pada Harga Pasar(Jutaan Rupiah)/
Gross Regional Domestic Product
at Market Prices (Million Rupiahs)
2. Penyusutan(Jutaan Rupiah)/ 1 300 659,51 1 608 545,96 1 8587 14,69 2 055 818,87 2 326 516,69
Depreciation(Million Rupiahs)
3. Produk Domestik Regional Neto 16 652 414,90 20 594 302,05 23 797 225,97 26 320 761,49 29 786 520,60
Pada Harga Pasar(Jutaan Rupiah)/
Net Regional Domestic Product
at Market Prices (Million Rupiahs)
4. Pajak Tak Langsung Neto 265 487,91 328 333,05 379 396,97 419 629,47 474 883,74
(Jutaan Rupiah)/Net Indirect
Taxes (Million Rupiahs)
5. Produk Domestik Regional Neto 16 386 926,99 20 265 968,99 23 417 829,00 25 901 132,03 29 311 636,85
Atas Dasar Biaya Faktor/Pendapatan
Regional (Jutaan Rupiah)/Net
Regional Domestic Product at Factor
Cost/Regional Income (Million Rupiahs)
6. Penduduk Pertengahan Tahun 2 105 299 2 148 282 2 191 951 2 261 393 2 309 323
(Jiwa)/Mid Year Population
7. Produk Domestik Regional 8 527 565,16 10 335 164,57 11 704 614,14 12 548 274,61 13 905 823,17
Bruto Per kapita (Rupiah)/
Per Capita Gross Regional Domestic
Product (Rupiahs)
11.1.7 PDRB Per Kapita Sulawesi Tenggara, 2007-2011 Tabel
Table Per Capita GRDP of Sulawesi Tenggara, 2007-2011
[Diolah dari Hasil Sensus, Survei, dan Berbagai Sumber Lainnya/Based on Census, Survey, and Other Sources]

PDRB
422 Sulawesi Tenggara Dalam Angka 2013
P e r i n c i a n 2007 2008 2009 2010 2011*)
Description
(1) (2) (3) (4) (5) (6)
I. Atas Dasar Harga Konstan 2000/
At Constan Prices 2000
1. Produk Domestik Regional Bruto 9 331 719,95 10 010 586,35 10 768 577,19 11 653 906,41 12 698 120,77
Pada Harga Pasar(Jutaan Rupiah)/
Gross Regional Domestic Product
at Market Prices (Million Rupiahs)
2. Penyusutan(Jutaan Rupiah)/ 718 825,23 771 118,52 829 506,78 897 703,96 978 140,11
Depreciation(Million Rupiahs)
3. Produk Domestik Regional Neto 8 612 894,72 9239 467,83 9 939 070,41 10 756 202,45 11 719 980,66
Pada Harga Pasar(Jutaan Rupiah)/
Net Regional Domestic Product
at Market Prices (Million Rupiahs)
4. Pajak Tak Langsung Neto 138 143,44 148 193,14 159 414,16 172 520,26 187 978,43
(Jutaan Rupiah)/Net Indirect
Taxes (Million Rupiahs)
5. Produk Domestik Regional Neto 8 474 751,28 9 091 274,70 9 779 656,25 10 583 682,19 11 532 002,22
Atas Dasar Biaya Faktor/Pendapatan
Regional (Jutaan Rupiah)/Net
Regional Domestic Product at Factor
Cost/Regional Income (Million Rupiahs)
6. Penduduk Pertengahan Tahun 2 105 299 2 148 282 2 191 951 2 261 393 2 309 323
(Jiwa)/Mid Year Population
7. Produk Domestik Regional 4 432 491,51 4 659 810,19 4 912 781,90 5 153 419,33 5 498 633,48
Bruto Per kapita (Rupiah)/
Per Capita Gross Regional Domestic
Product (Rupiahs)
Lanjutan Tabel
Continued Table 11.1.7
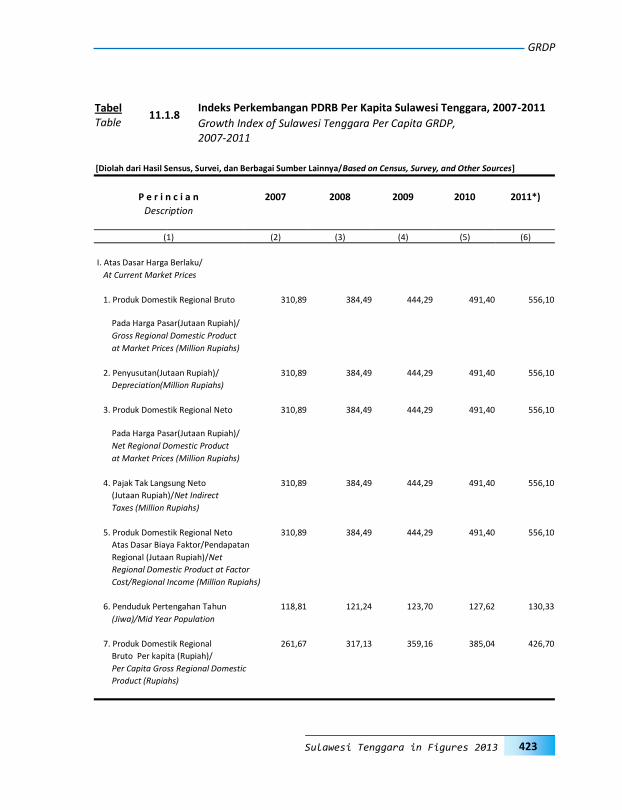
GRDP
423 Sulawesi Tenggara in Figures 2013
P e r i n c i a n 2007 2008 2009 2010 2011*)
Description
(1) (2) (3) (4) (5) (6)
I. Atas Dasar Harga Berlaku/
At Current Market Prices
1. Produk Domestik Regional Bruto 310,89 384,49 444,29 491,40 556,10
Pada Harga Pasar(Jutaan Rupiah)/
Gross Regional Domestic Product
at Market Prices (Million Rupiahs)
2. Penyusutan(Jutaan Rupiah)/ 310,89 384,49 444,29 491,40 556,10
Depreciation(Million Rupiahs)
3. Produk Domestik Regional Neto 310,89 384,49 444,29 491,40 556,10
Pada Harga Pasar(Jutaan Rupiah)/
Net Regional Domestic Product
at Market Prices (Million Rupiahs)
4. Pajak Tak Langsung Neto 310,89 384,49 444,29 491,40 556,10
(Jutaan Rupiah)/Net Indirect
Taxes (Million Rupiahs)
5. Produk Domestik Regional Neto 310,89 384,49 444,29 491,40 556,10
Atas Dasar Biaya Faktor/Pendapatan
Regional (Jutaan Rupiah)/Net
Regional Domestic Product at Factor
Cost/Regional Income (Million Rupiahs)
6. Penduduk Pertengahan Tahun 118,81 121,24 123,70 127,62 130,33
(Jiwa)/Mid Year Population
7. Produk Domestik Regional 261,67 317,13 359,16 385,04 426,70
Bruto Per kapita (Rupiah)/
Per Capita Gross Regional Domestic
Product (Rupiahs)
11.1.8 Indeks Perkembangan PDRB Per Kapita Sulawesi Tenggara, 2007-2011 Tabel
Table Growth Index of Sulawesi Tenggara Per Capita GRDP, 2007-2011
[Diolah dari Hasil Sensus, Survei, dan Berbagai Sumber Lainnya/Based on Census, Survey, and Other Sources]
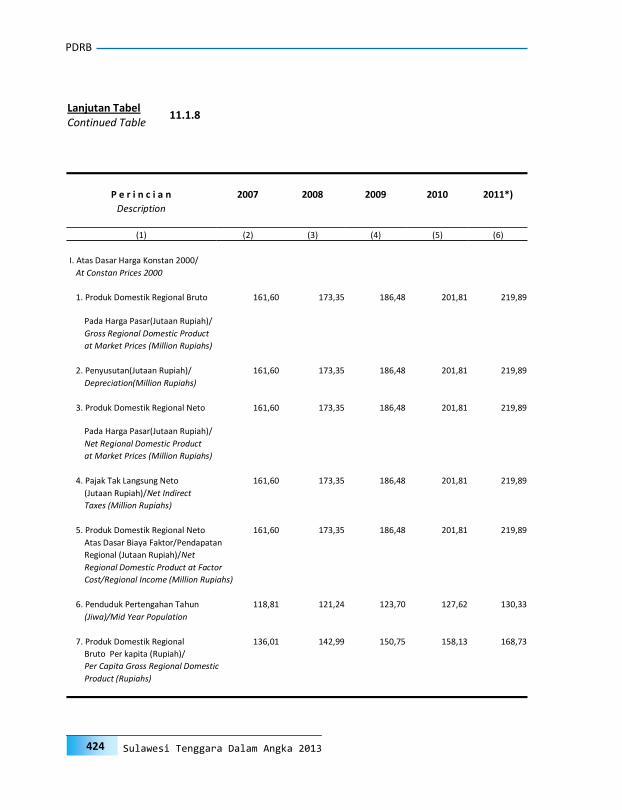
PDRB
424 Sulawesi Tenggara Dalam Angka 2013
P e r i n c i a n 2007 2008 2009 2010 2011*)
Description
(1) (2) (3) (4) (5) (6)
I. Atas Dasar Harga Konstan 2000/
At Constan Prices 2000
1. Produk Domestik Regional Bruto 161,60 173,35 186,48 201,81 219,89
Pada Harga Pasar(Jutaan Rupiah)/
Gross Regional Domestic Product
at Market Prices (Million Rupiahs)
2. Penyusutan(Jutaan Rupiah)/ 161,60 173,35 186,48 201,81 219,89
Depreciation(Million Rupiahs)
3. Produk Domestik Regional Neto 161,60 173,35 186,48 201,81 219,89
Pada Harga Pasar(Jutaan Rupiah)/
Net Regional Domestic Product
at Market Prices (Million Rupiahs)
4. Pajak Tak Langsung Neto 161,60 173,35 186,48 201,81 219,89
(Jutaan Rupiah)/Net Indirect
Taxes (Million Rupiahs)
5. Produk Domestik Regional Neto 161,60 173,35 186,48 201,81 219,89
Atas Dasar Biaya Faktor/Pendapatan
Regional (Jutaan Rupiah)/Net
Regional Domestic Product at Factor
Cost/Regional Income (Million Rupiahs)
6. Penduduk Pertengahan Tahun 118,81 121,24 123,70 127,62 130,33
(Jiwa)/Mid Year Population
7. Produk Domestik Regional 136,01 142,99 150,75 158,13 168,73
Bruto Per kapita (Rupiah)/
Per Capita Gross Regional Domestic
Product (Rupiahs)
Lanjutan Tabel Continued Table
11.1.8

GRDP
425 Sulawesi Tenggara in Figures 2013
Lapangan Usaha 2007 2008 2009 2010 2011*) Industrial Origin
(1) (3) (4) (5) (6) (6)
1. Pertanian/Agriculture 110,02 118,24 111,05 104,83 108,66
2. Pertambangan dan Penggalian/ 139,27 118,35 107,71 126,57 140,04
Mining and Quarrying
3. Industri Pengolahan/ 135,65 119,15 97,58 122,80 109,45
Manufacturing Industry
4. Listrik, Gas dan Air Bersih/ 109,24 115,08 122,89 110,46 112,87
Electricity, Gas, and Water Supply
5. Konstruksi/Construction 121,18 132,15 120,53 118,38 116,98
6. Perdagangan, Hotel dan Restoran/ 124,30 132,10 123,97 114,88 115,98
Trade, Hotel and Restaurant
7. Pengangkutan dan Komunikasi/ 126,28 128,28 126,23 111,01 111,89
Transportation and Communication
8. Keuangan, Persewaan & Jasa Perush./ 111,66 131,87 113,94 115,40 121,44
Finance, Real Estate and Business Service
9. Jasa-jasa/Services 113,64 124,48 121,34 102,66 107,50
Produk Domestik Regional Bruto 117,57 123,67 115,55 110,60 113,17
Gross Regional Domestic Product
*) Angka Sementara/Preliminary Figures
11.1.9
Indeks Berantai PDRB Sulawesi Tenggara Menurut Lapangan Usaha ADHB, 2007-2011 Tabel
Table Link Index of Sulawesi Tenggara GRDP by Industrial Origin at Current Market Prices, 2007-2011
[Diolah dari Hasil Sensus, Survei, dan Berbagai Sumber Lainnya/Based on Census, Survey, and Other Sources]

PDRB
426 Sulawesi Tenggara Dalam Angka 2013
Lapangan Usaha 2007 2008 2009 2010 2011*) Industrial Origin
(1) (3) (4) (5) (6) (6)
1. Pertanian/Agriculture 105,60 105,04 102,73 101,28 102,56
2. Pertambangan dan Penggalian/ 123,84 96,74 106,05 122,99 135,12
Mining and Quarrying
3. Industri Pengolahan/ 110,42 106,18 97,24 118,78 106,50
Manufacturing Industry
4. Listrik, Gas dan Air Bersih/ 106,39 107,85 115,64 108,79 111,10
Electricity, Gas, and Water Supply
5. Konstruksi/Construction 109,05 111,30 112,70 115,38 112,76
6. Perdagangan, Hotel dan Restoran/ 109,32 110,49 114,63 111,92 111,18
Trade, Hotel and Restaurant
7. Pengangkutan dan Komunikasi/ 105,83 113,70 119,55 109,04 109,63
Transportation and Communication
8. Keuangan, Persewaan & Jasa Perush./ 107,83 111,51 107,28 113,23 117,91
Finance, Real Estate and Business Service
9. Jasa-jasa/Services 105,99 107,06 108,78 101,40 103,59
Produk Domestik Regional Bruto 107,96 107,27 107,57 108,22 108,96
Gross Regional Domestic Product
*) Angka Sementara/Preliminary Figures
11.1.10
Indeks Berantai PDRB Sulawesi Tenggara Menurut Lapangan Usaha ADHK, 2007-2011 Tabel
Table Link Index of Sulawesi Tenggara GRDP by Industrial Origin at Constant Market Prices, 2007-2011
[Diolah dari Hasil Sensus, Survei, dan Berbagai Sumber Lainnya/Based on Census, Survey, and Other Sources]

GRDP
427 Sulawesi Tenggara in Figures 2013
Lapangan Usaha 2007 2008 2009 2010 2011*) Industrial Origin
(1) (3) (4) (5) (6) (6)
1. Pertanian/Agriculture 207,15 233,19 252,06 260,88 276,40
2. Pertambangan dan Penggalian/ 160,68 196,57 199,65 205,45 212,93
Mining and Quarrying
3. Industri Pengolahan/ 169,85 190,60 191,26 197,73 203,21
Manufacturing Industry
4. Listrik, Gas dan Air Bersih/ 260,61 278,08 295,51 300,06 304,84
Electricity, Gas, and Water Supply
5. Konstruksi/Construction 169,65 201,43 215,44 221,03 229,30
6. Perdagangan, Hotel dan Restoran/ 191,47 228,91 247,58 254,14 265,12
Trade, Hotel and Restaurant
7. Pengangkutan dan Komunikasi/ 211,19 238,26 251,58 256,12 261,41
Transportation and Communication
8. Keuangan, Persewaan & Jasa Perush./ 175,10 207,07 219,91 224,13 230,85
Finance, Real Estate and Business Service
9. Jasa-jasa/Services 175,10 207,07 219,91 224,13 230,85
Produk Domestik Regional Bruto 189,55 220,40 245,84 248,88 258,27
Gross Regional Domestic Product
*) Angka Sementara/Preliminary Figures
11.1.11
Indeks Implisit PDRB Sulawesi Tenggara Menurut Lapangan Usaha, 2007-2011 Tabel
Table Implicit Index of Sulawesi Tenggara GRDP by Industrial Origin 2007-2011
[Diolah dari Hasil Sensus, Survei, dan Berbagai Sumber Lainnya/Based on Census, Survey, and Other Sources]
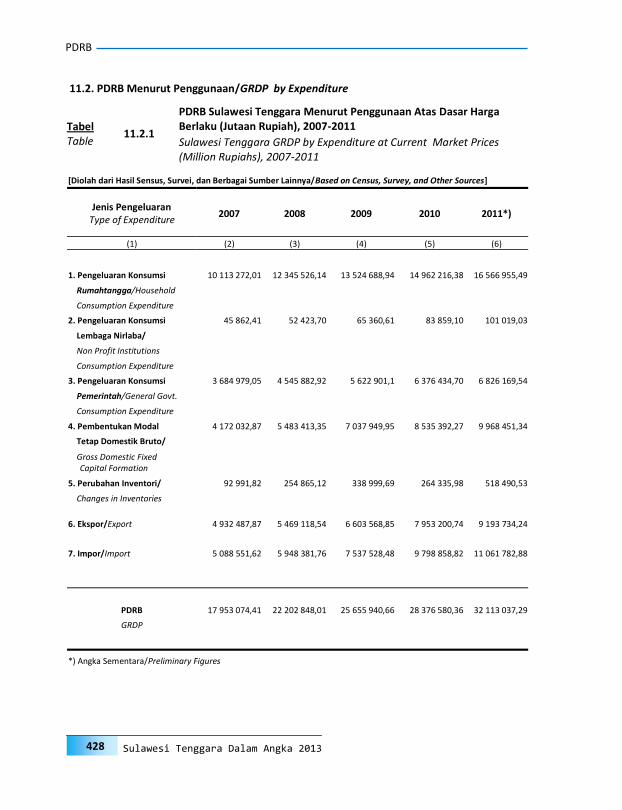
PDRB
428 Sulawesi Tenggara Dalam Angka 2013
Jenis Pengeluaran Type of Expenditure
2007 2008 2009 2010 2011*)
(1) (2) (3) (4) (5) (6)
1. Pengeluaran Konsumsi 10 113 272,01 12 345 526,14 13 524 688,94 14 962 216,38 16 566 955,49
Rumahtangga/Household
Consumption Expenditure
2. Pengeluaran Konsumsi 45 862,41 52 423,70 65 360,61 83 859,10 101 019,03
Lembaga Nirlaba/
Non Profit Institutions
Consumption Expenditure
3. Pengeluaran Konsumsi 3 684 979,05 4 545 882,92 5 622 901,1 6 376 434,70 6 826 169,54
Pemerintah/General Govt.
Consumption Expenditure
4. Pembentukan Modal 4 172 032,87 5 483 413,35 7 037 949,95 8 535 392,27 9 968 451,34
Tetap Domestik Bruto/
Gross Domestic Fixed Capital Formation
5. Perubahan Inventori/ 92 991,82 254 865,12 338 999,69 264 335,98 518 490,53
Changes in Inventories
6. Ekspor/Export 4 932 487,87 5 469 118,54 6 603 568,85 7 953 200,74 9 193 734,24
7. Impor/Import 5 088 551,62 5 948 381,76 7 537 528,48 9 798 858,82 11 061 782,88
PDRB 17 953 074,41 22 202 848,01 25 655 940,66 28 376 580,36 32 113 037,29
GRDP
*) Angka Sementara/Preliminary Figures
11.2.1
PDRB Sulawesi Tenggara Menurut Penggunaan Atas Dasar Harga Berlaku (Jutaan Rupiah), 2007-2011 Tabel
Table Sulawesi Tenggara GRDP by Expenditure at Current Market Prices (Million Rupiahs), 2007-2011
11.2. PDRB Menurut Penggunaan/GRDP by Expenditure
[Diolah dari Hasil Sensus, Survei, dan Berbagai Sumber Lainnya/Based on Census, Survey, and Other Sources]

GRDP
429 Sulawesi Tenggara in Figures 2013
Jenis Pengeluaran Type of Expenditure
2007 2008 2009 2010 2011*)
(1) (2) (3) (4) (5) (6)
1. Pengeluaran Konsumsi 5 122 072,08 5439913,11 5744438,84 5973721,53 6295642,54
Rumahtangga/Household
Consumption Expenditure
2. Pengeluaran Konsumsi 25 403,73 26540,91 28967,23 34954,94 39459,27
Lembaga Nirlaba/
Non Profit Institutions
Consumption Expenditure
3. Pengeluaran Konsumsi 1 866 799,35 1996444,68 2146611,14 2364881,70 2453469,96
Pemerintah/General Govt.
Consumption Expenditure
4. Pembentukan Modal 2 380 349,55 2737020,21 3085375,13 3583357,47 3986435,85
Tetap Domestik Bruto/
Gross Domestic Fixed Capital Formation
5. Perubahan Inventori/ 39 190,84 93394,54 176613,03 201792,85 376666,34
Changes in Inventories
6. Ekspor/Export 3 022 493,96 2955752,74 3121268,42 3586892,81 3957073,08
7. Impor/Import 3 124 589,57 3238479,84 3534696,60 4091694,89 4410626,27
PDRB 9 331 719,94 10010586,35 10768577,19 11653906,41 12698120,77
GRDP
*) Angka Sementara/Preliminary Figures
11.2.2
PDRB Sulawesi Tenggara Menurut Penggunaan Atas Dasar Harga Konstan (Jutaan Rupiah), 2007-2011 Tabel
Table Sulawesi Tenggara GRDP by Expenditure at Constant Market Prices (Million Rupiahs), 2007-2011
[Diolah dari Hasil Sensus, Survei, dan Berbagai Sumber Lainnya/Based on Census, Survey, and Other Sources]
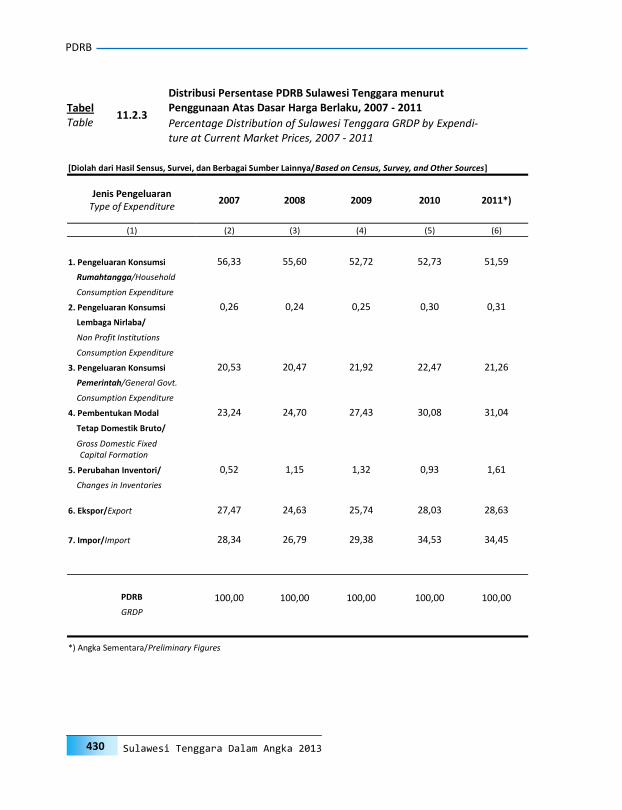
PDRB
430 Sulawesi Tenggara Dalam Angka 2013
Jenis Pengeluaran Type of Expenditure
2007 2008 2009 2010 2011*)
(1) (2) (3) (4) (5) (6)
1. Pengeluaran Konsumsi 56,33 55,60 52,72 52,73 51,59
Rumahtangga/Household
Consumption Expenditure
2. Pengeluaran Konsumsi 0,26 0,24 0,25 0,30 0,31
Lembaga Nirlaba/
Non Profit Institutions
Consumption Expenditure
3. Pengeluaran Konsumsi 20,53 20,47 21,92 22,47 21,26
Pemerintah/General Govt.
Consumption Expenditure
4. Pembentukan Modal 23,24 24,70 27,43 30,08 31,04
Tetap Domestik Bruto/
Gross Domestic Fixed Capital Formation
5. Perubahan Inventori/ 0,52 1,15 1,32 0,93 1,61
Changes in Inventories
6. Ekspor/Export 27,47 24,63 25,74 28,03 28,63
7. Impor/Import 28,34 26,79 29,38 34,53 34,45
PDRB 100,00 100,00 100,00 100,00 100,00
GRDP
*) Angka Sementara/Preliminary Figures
11.2.3
Distribusi Persentase PDRB Sulawesi Tenggara menurut Penggunaan Atas Dasar Harga Berlaku, 2007 - 2011 Tabel
Table Percentage Distribution of Sulawesi Tenggara GRDP by Expendi-ture at Current Market Prices, 2007 - 2011
[Diolah dari Hasil Sensus, Survei, dan Berbagai Sumber Lainnya/Based on Census, Survey, and Other Sources]

GRDP
431 Sulawesi Tenggara in Figures 2013
Jenis Pengeluaran Type of Expenditure
2007 2008 2009 2010 2011*)
(1) (2) (3) (4) (5) (6)
1. Pengeluaran Konsumsi 54,89 54,34 53,34 51,26 49,58
Rumahtangga/Household
Consumption Expenditure
2. Pengeluaran Konsumsi 0,27 0,27 0,27 0,30 0,31
Lembaga Nirlaba/
Non Profit Institutions
Consumption Expenditure
3. Pengeluaran Konsumsi 20,00 19,94 19,93 20,29 19,32
Pemerintah/General Govt.
Consumption Expenditure
4. Pembentukan Modal 25,51 27,34 28,65 30,75 31,39
Tetap Domestik Bruto/
Gross Domestic Fixed Capital Formation
5. Perubahan Inventori/ 0,42 0,93 1,64 1,73 2,97
Changes in Inventories
6. Ekspor/Export 32,39 29,53 28,98 30,78 31,16
7. Impor/Import 33,48 32,35 32,82 35,11 34,73
PDRB 100,00 100,00 100,00 100,00 100,00
GRDP
*) Angka Sementara/Preliminary Figures
11.2.4
Distribusi Persentase PDRB Sulawesi Tenggara menurut Penggunaan Atas Dasar Harga Konstan 2000, 2007 - 2011 Tabel
Table Percentage Distribution of Sulawesi Tenggara GRDP by by Ex-penditure at 2000 Constant Market Prices, 2007 - 2011
[Diolah dari Hasil Sensus, Survei, dan Berbagai Sumber Lainnya/Based on Census, Survey, and Other Sources]

PDRB
432 Sulawesi Tenggara Dalam Angka 2013
Jenis Pengeluaran Type of Expenditure
2007 2008 2009 2010 2011*)
(1) (2) (3) (4) (5) (6)
1. Pengeluaran Konsumsi 296,51 361,95 396,52 438,67 485,72
Rumahtangga/Household
Consumption Expenditure
2. Pengeluaran Konsumsi 315,65 360,81 449,84 577,16 695,26
Lembaga Nirlaba/
Non Profit Institutions
Consumption Expenditure
3. Pengeluaran Konsumsi 309,09 381,30 471,63 534,84 572,56
Pemerintah/General Govt.
Consumption Expenditure
4. Pembentukan Modal 335,50 440,95 565,96 686,38 801,62
Tetap Domestik Bruto/
Gross Domestic Fixed Capital Formation
5. Perubahan Inventori/ -125,79 -344,75 -458,55 -357,56 -701,34
Changes in Inventories
6. Ekspor/Export 443,56 499,27 553,59 668,42 805,03
7. Impor/Import 452,68 508,62 594,57 753,41 979,44
PDRB 264,44 310,89 384,49 444,29 831,96
GRDP
*) Angka Sementara/Preliminary Figures
11.2.5
Indeks Perkembangan PDRB Sulawesi Tenggara menurut Penggunaan Atas Dasar Harga Berlaku, 2007 - 2011 Tabel
Table Growth Index of Sulawesi Tenggara GRDP by Expenditure at Cur-rent Market Prices, 2007 - 2011
[Diolah dari Hasil Sensus, Survei, dan Berbagai Sumber Lainnya/Based on Census, Survey, and Other Sources]

GRDP
433 Sulawesi Tenggara in Figures 2013
Jenis Pengeluaran Type of Expenditure
2007 2008 2009 2010 2011*)
(1) (2) (3) (4) (5) (6)
1. Pengeluaran Konsumsi 150,17 159,49 168,42 175,14 184,58
Rumahtangga/Household
Consumption Expenditure
2. Pengeluaran Konsumsi 174,84 182,67 199,37 240,58 271,58
Lembaga Nirlaba/
Non Profit Institutions
Consumption Expenditure
3. Pengeluaran Konsumsi 156,58 167,46 180,05 198,36 205,79
Pemerintah/General Govt.
Consumption Expenditure
4. Pembentukan Modal 191,42 220,10 248,11 288,16 320,57
Tetap Domestik Bruto/
Gross Domestic Fixed Capital Formation
5. Perubahan Inventori/ -53,01 -126,33 -238,90 -272,96 -509,50
Changes in Inventories
6. Ekspor/Export 305,94 299,18 315,94 363,07 400,54
7. Impor/Import 312,32 323,70 353,31 408,98 440,86
PDRB 161,60 173,35 186,48 201,81 219,89
GRDP
*) Angka Sementara/Preliminary Figures
11.2.6
Indeks Perkembangan PDRB Sulawesi Tenggara menurut Penggunaan Atas Dasar Harga Konstan 2000, 2007 - 2011 Tabel
Table Growth Index of Sulawesi Tenggara GRDP by Expenditure at 2000 Constant Market Prices, 2007 - 2011
[Diolah dari Hasil Sensus, Survei, dan Berbagai Sumber Lainnya/Based on Census, Survey, and Other Sources]

PDRB
434 Sulawesi Tenggara Dalam Angka 2013
Jenis Pengeluaran Type of Expenditure
2007 2008 2009 2010 2011*)
(1) (2) (3) (4) (5) (6)
1. Pengeluaran Konsumsi 115,82 122,07 109,55 110,63 110,73
Rumahtangga/Household
Consumption Expenditure
2. Pengeluaran Konsumsi 113,35 114,31 124,68 128,30 120,46
Lembaga Nirlaba/
Non Profit Institutions
Consumption Expenditure
3. Pengeluaran Konsumsi 110,29 123,36 123,69 113,40 107,05
Pemerintah/General Govt.
Consumption Expenditure
4. Pembentukan Modal 115,95 131,43 128,35 121,28 116,79
Tetap Domestik Bruto/
Gross Domestic Fixed Capital Formation
5. Perubahan Inventori/ -31,53 274,07 133,01 77,98 196,15
Changes in Inventories
6. Ekspor/Export 112,56 110,88 120,74 120,44 115,60
7. Impor/Import 112,36 116,90 126,72 130,00 112,89
PDRB 117,57 123,67 115,55 110,60 113,17
GRDP
*) Angka Sementara/Preliminary Figures
11.2.7
Indeks Berantai PDRB Sulawesi Tenggara menurut Penggunaan Atas Dasar Harga Berlaku, 2007 - 2011 Tabel
Table Link Index of Sulawesi Tenggara GRDP by Expenditure at Current Market Prices, 2007 - 2011
[Diolah dari Hasil Sensus, Survei, dan Berbagai Sumber Lainnya/Based on Census, Survey, and Other Sources]
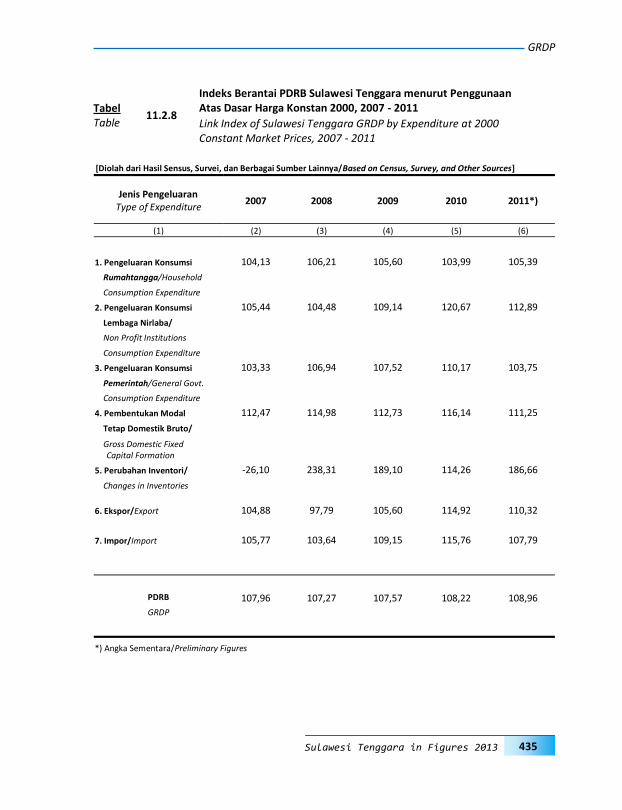
GRDP
435 Sulawesi Tenggara in Figures 2013
Jenis Pengeluaran Type of Expenditure
2007 2008 2009 2010 2011*)
(1) (2) (3) (4) (5) (6)
1. Pengeluaran Konsumsi 104,13 106,21 105,60 103,99 105,39
Rumahtangga/Household
Consumption Expenditure
2. Pengeluaran Konsumsi 105,44 104,48 109,14 120,67 112,89
Lembaga Nirlaba/
Non Profit Institutions
Consumption Expenditure
3. Pengeluaran Konsumsi 103,33 106,94 107,52 110,17 103,75
Pemerintah/General Govt.
Consumption Expenditure
4. Pembentukan Modal 112,47 114,98 112,73 116,14 111,25
Tetap Domestik Bruto/
Gross Domestic Fixed Capital Formation
5. Perubahan Inventori/ -26,10 238,31 189,10 114,26 186,66
Changes in Inventories
6. Ekspor/Export 104,88 97,79 105,60 114,92 110,32
7. Impor/Import 105,77 103,64 109,15 115,76 107,79
PDRB 107,96 107,27 107,57 108,22 108,96
GRDP
*) Angka Sementara/Preliminary Figures
11.2.8
Indeks Berantai PDRB Sulawesi Tenggara menurut Penggunaan Atas Dasar Harga Konstan 2000, 2007 - 2011 Tabel
Table Link Index of Sulawesi Tenggara GRDP by Expenditure at 2000 Constant Market Prices, 2007 - 2011
[Diolah dari Hasil Sensus, Survei, dan Berbagai Sumber Lainnya/Based on Census, Survey, and Other Sources]

PDRB
436 Sulawesi Tenggara Dalam Angka 2013
Jenis Pengeluaran
Type of Expenditure 2007 2008 2009 2010 2011*)
(1) (2) (3) (4) (5) (6)
1. Pengeluaran Konsumsi 197,44 226,94 235,44 250,47 263,15
Rumahtangga/Household
Consumption Expenditure
2. Pengeluaran Konsumsi 180,53 197,52 225,64 239,91 256,01
Lembaga Nirlaba/
Non Profit Institutions
Consumption Expenditure
3. Pengeluaran Konsumsi 197,40 227,70 261,94 269,63 278,23
Pemerintah/General Govt.
Consumption Expenditure
4. Pembentukan Modal 175,27 200,34 228,11 238,20 250,06
Tetap Domestik Bruto/
Gross Domestic Fixed Capital Formation
5. Perubahan Inventori/ 237,28 272,89 191,94 130,99 137,65
Changes in Inventories
6. Ekspor/Export 163,19 185,03 211,57 221,73 232,34
7. Impor/Import 162,86 183,68 213,24 239,48 250,80
PDRB 192,39 221,79 238,25 243,49 252,90
GRDP
*) Angka Sementara/Preliminary Figures
11.2.9
Indeks Implisit PDRB Sulawesi Tenggara menurut Penggunaan, 2007 - 2011 Tabel
Table Implicit Index of Sulawesi Tenggara GRDP by Expenditure, 2007 - 2011
[Diolah dari Hasil Sensus, Survei, dan Berbagai Sumber Lainnya/Based on Census, Survey, and Other Sources]
C O M P A R I S O N W I T H O T H E R P R O V I N C E
PERBANDINGAN DENGANPROVINSI LAIN12

COMPARISON WITH OTHER PROVINCE
439 Sulawesi Tenggara in Figures 2013
PENJELASAN TEKNIS
1. Produk Domestik Regional Bruto (PDRB)
adalah nilai tambah bruto (gross value added) yang timbul dari seluruh sektor perekonomian di suatu wilayah pada kurun waktu tertentu.
2. Laju pertumbuhan PDRB diperoleh dari
PDRB atas dasar harga konstan dengan cara mengurangi nilai PDRB pada tahun ke-n terhadap tahun ke n-1 (tahun sebe-lumnya), dibagi dengan nilai PDRB tahun ke n-1, kemudian dikalikan 100 persen. Laju pertumbuhan menunjukan perkem-bangan agregat pendapatan dari satu waktu tertentu terhadap tahun sebe-lumnya.
3. Kemiskinan adalah ketidak-mampuan dari
sisi ekonomi untuk memenuhi kebutuhan dasar makanan dan bukan makanan yang diukur dari sisi pengeluaran.
4. Penduduk miskin adalah penduduk yang
memiliki rata-rata pengeluaran per kapita per bulan berada dibawah suatu batas yang disebut garis kemiskinan.
5. Garis kemiskinan adalah nilai rupiah yang
harus dikeluarkan seseorang dalam me-menuhi kebutuhan hidup minimumnya, baik itu kebutuhan hidup minimum ma-kanan (beras, umbi-umbian, ikan, dsb) maupun kebutuhan hidup minimum bukan makanan (perumahan, kesehatan, pendidikan, transportasi, dsb).
6. Indeks Pembangunan Manusia (IPM)
adalah indeks komposit yang disusun dari tiga indikator : a. Lama hidup yang diukur dengan
angka harapan hidup ketika lahir,
TECHNICAL NOTES
1. Gross Regional Domestic Product
(GRDP) is gross value added that arise from all sectors of the economy in a region at a certain time.
2. GRDP growth rate is obtained from the GRDP at constant prices by re-ducing the value of GRDP in year n to year n-1 (previous year), divided by the value of GRDP in the year n-1, and then multiplied by 100 percent. It shows the growth rate of aggregate growth of income of a particular time of the previous year.
3. Poverty is the inability of the economy to meet the basic needs of food and non food as measured from the ex-penditure side.
4. The poor are the people who have an
average per capita expenditure per month is below the limit of the so-called poverty line.
5. The poverty line is the value of the
rupiah which a person must be issued in minimum subsistence, whether it needs a minimum of food (rice, root crops, fish, etc) and the minimum non-food needs (housing, health, education, transportation, etc.).
6. Human Development Index (HDI) is a composite index composed of three indicators: a. Long life as measured by life ex-
pectancy at birth, the average

PERBANDINGAN DENGAN PROVINSI LAIN
440 Sulawesi Tenggara Dalam Angka 2013
rata-rata perkiraan banyak tahun yang dapat ditempuh oleh seseorang selama hidup
b. Pendidikan yang diukur berdasarkan rata-rata lama sekolah (rata-rata jumlah tahun yang telah dihabiskan oleh penduduk usia 15 tahun keatas diseluruh jenjang pendidikan formal yang dijalani) dan angka melek huruf (persentase dari penduduk usia 15 tahun keatas yang bias membaca dan menulis huruf latin atau lainnya terhadap jumlah penduduk usia 15 tahun atau lebih)
c. Standar Hidup yang diukur dengan pengeluaran per kapita (PPP-purchasing power parity/ paritas daya beli dalam rupiah)
7. Indeks Kemahalan Konstruksi (IKK) adalah
angka indeks yang menggambarkan per-bandingan tingkat kemahalan harga bangunan/konstruksi (TKK) suatu kabu-paten/kota atau provinsi terhadap TKK kabupaten/kota atau provinsi lain. Sejak tahun 2010, penghitungan IKK menggunakan Kota Samarinda dan Provinsi Kalimantan Timur sebagai acuan (sama dengan 100).
estimate of many years that can be taken by a person during life
b. Education is measured by the average length of the school (the average number of years have been spent by the population aged 15 years and above in all levels of formal education is do-ing) and the literacy rate (percentage of population aged 15 years and above are biased to read and write Latin letters or more of the population aged 15 years or more)
c. Living standards as measured by expenditure per capita (PPP-purchasing power parity in rupiahs)
7. Construction Cost Index (CCI) is a num-
ber that describes the ratio of index price level overpriced building/construction of a district/city or prov-ince to other district/city or province. Since 2010, Samarinda city and Kali-mantan Timur Province was set as reference region in CCI formulation (equal to 100).
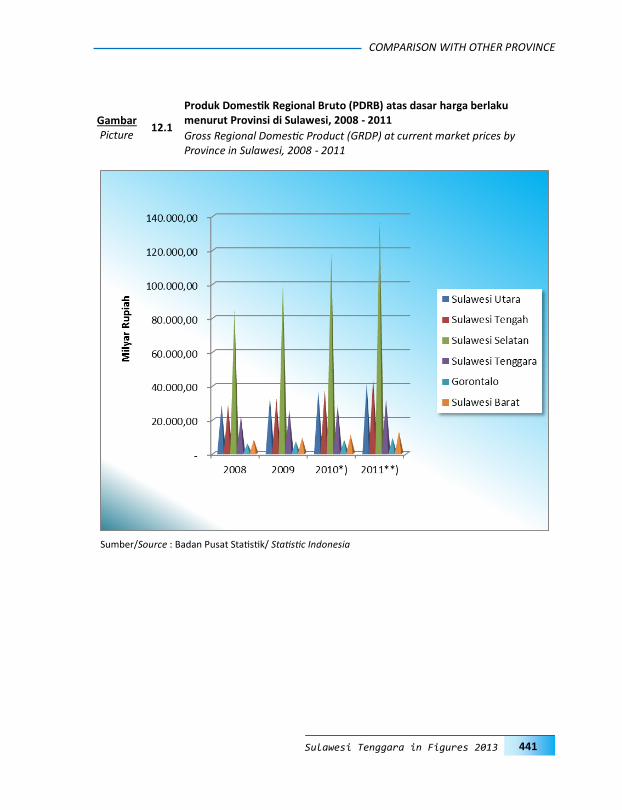
COMPARISON WITH OTHER PROVINCE
441 Sulawesi Tenggara in Figures 2013
12.1
Produk Domestik Regional Bruto (PDRB) atas dasar harga berlaku menurut Provinsi di Sulawesi, 2008 - 2011 Gambar
Picture Gross Regional Domestic Product (GRDP) at current market prices by Province in Sulawesi, 2008 - 2011
Sumber/Source : Badan Pusat Statistik/ Statistic Indonesia
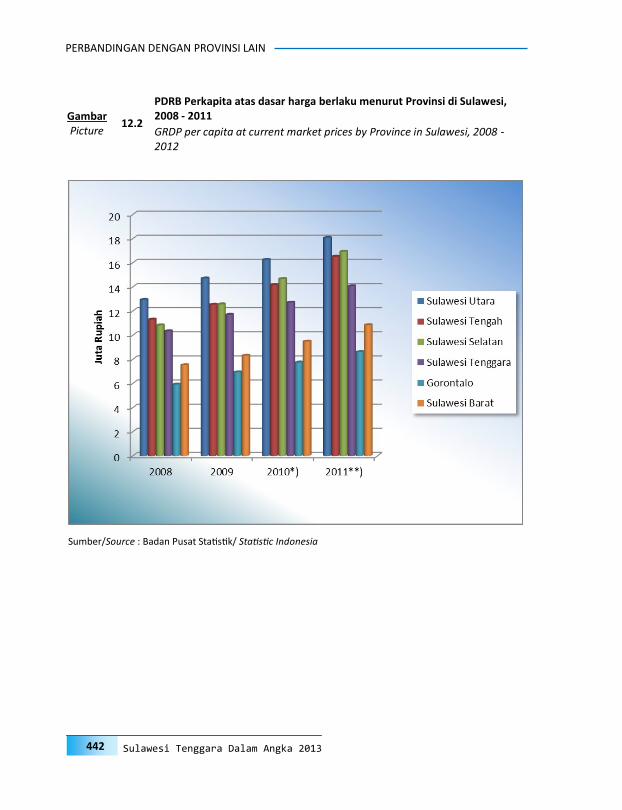
PERBANDINGAN DENGAN PROVINSI LAIN
442 Sulawesi Tenggara Dalam Angka 2013
12.2
PDRB Perkapita atas dasar harga berlaku menurut Provinsi di Sulawesi, 2008 - 2011 Gambar
Picture GRDP per capita at current market prices by Province in Sulawesi, 2008 - 2012
Sumber/Source : Badan Pusat Statistik/ Statistic Indonesia
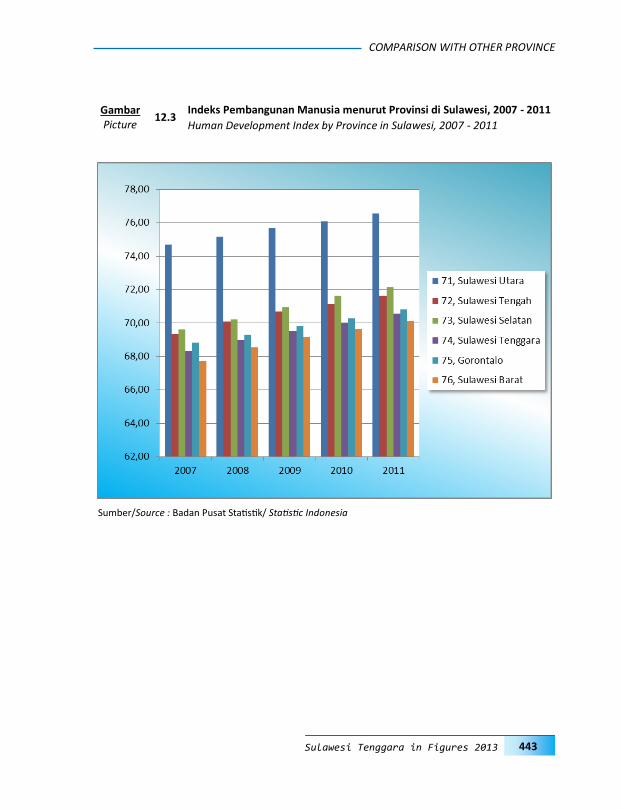
COMPARISON WITH OTHER PROVINCE
443 Sulawesi Tenggara in Figures 2013
12.3 Indeks Pembangunan Manusia menurut Provinsi di Sulawesi, 2007 - 2011 Gambar
Picture Human Development Index by Province in Sulawesi, 2007 - 2011
Sumber/Source : Badan Pusat Statistik/ Statistic Indonesia
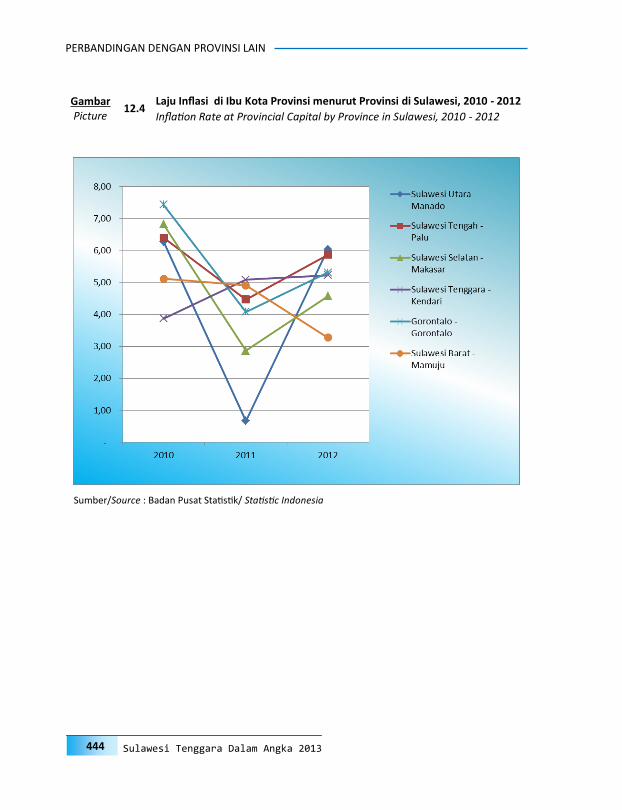
PERBANDINGAN DENGAN PROVINSI LAIN
444 Sulawesi Tenggara Dalam Angka 2013
12.4 Laju Inflasi di Ibu Kota Provinsi menurut Provinsi di Sulawesi, 2010 - 2012 Gambar
Picture Inflation Rate at Provincial Capital by Province in Sulawesi, 2010 - 2012
Sumber/Source : Badan Pusat Statistik/ Statistic Indonesia
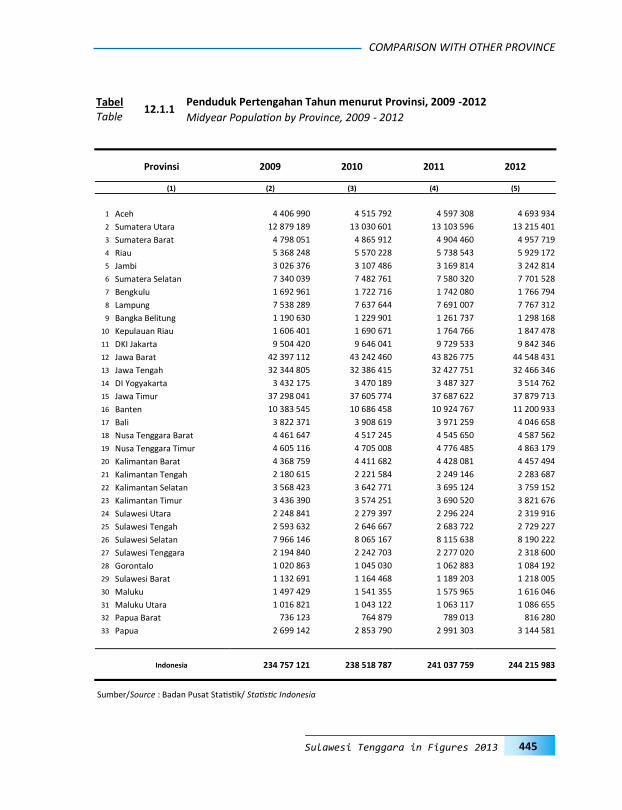
COMPARISON WITH OTHER PROVINCE
445 Sulawesi Tenggara in Figures 2013
12.1.1 Penduduk Pertengahan Tahun menurut Provinsi, 2009 -2012 Tabel
Table Midyear Population by Province, 2009 - 2012
Provinsi 2009 2010 2011 2012
(1) (2) (3) (4) (5)
1 Aceh 4 406 990 4 515 792 4 597 308 4 693 934
2 Sumatera Utara 12 879 189 13 030 601 13 103 596 13 215 401
3 Sumatera Barat 4 798 051 4 865 912 4 904 460 4 957 719
4 Riau 5 368 248 5 570 228 5 738 543 5 929 172
5 Jambi 3 026 376 3 107 486 3 169 814 3 242 814
6 Sumatera Selatan 7 340 039 7 482 761 7 580 320 7 701 528
7 Bengkulu 1 692 961 1 722 716 1 742 080 1 766 794
8 Lampung 7 538 289 7 637 644 7 691 007 7 767 312
9 Bangka Belitung 1 190 630 1 229 901 1 261 737 1 298 168
10 Kepulauan Riau 1 606 401 1 690 671 1 764 766 1 847 478
11 DKI Jakarta 9 504 420 9 646 041 9 729 533 9 842 346
12 Jawa Barat 42 397 112 43 242 460 43 826 775 44 548 431
13 Jawa Tengah 32 344 805 32 386 415 32 427 751 32 466 346
14 DI Yogyakarta 3 432 175 3 470 189 3 487 327 3 514 762
15 Jawa Timur 37 298 041 37 605 774 37 687 622 37 879 713
16 Banten 10 383 545 10 686 458 10 924 767 11 200 933
17 Bali 3 822 371 3 908 619 3 971 259 4 046 658
18 Nusa Tenggara Barat 4 461 647 4 517 245 4 545 650 4 587 562
19 Nusa Tenggara Timur 4 605 116 4 705 008 4 776 485 4 863 179
20 Kalimantan Barat 4 368 759 4 411 682 4 428 081 4 457 494
21 Kalimantan Tengah 2 180 615 2 221 584 2 249 146 2 283 687
22 Kalimantan Selatan 3 568 423 3 642 771 3 695 124 3 759 152
23 Kalimantan Timur 3 436 390 3 574 251 3 690 520 3 821 676
24 Sulawesi Utara 2 248 841 2 279 397 2 296 224 2 319 916
25 Sulawesi Tengah 2 593 632 2 646 667 2 683 722 2 729 227
26 Sulawesi Selatan 7 966 146 8 065 167 8 115 638 8 190 222
27 Sulawesi Tenggara 2 194 840 2 242 703 2 277 020 2 318 600
28 Gorontalo 1 020 863 1 045 030 1 062 883 1 084 192
29 Sulawesi Barat 1 132 691 1 164 468 1 189 203 1 218 005
30 Maluku 1 497 429 1 541 355 1 575 965 1 616 046
31 Maluku Utara 1 016 821 1 043 122 1 063 117 1 086 655
32 Papua Barat 736 123 764 879 789 013 816 280
33 Papua 2 699 142 2 853 790 2 991 303 3 144 581
Indonesia 234 757 121 238 518 787 241 037 759 244 215 983
Sumber/Source : Badan Pusat Statistik/ Statistic Indonesia

PERBANDINGAN DENGAN PROVINSI LAIN
446 Sulawesi Tenggara Dalam Angka 2013
Provinsi 2008 2009 2010*) 2011**)
(1) (2) (3) (4) (5)
1 Aceh 73 548 71 987 77 984 85 538
2 Sumatera Utara 213 932 236 354 275 700 314 157
3 Sumatera Barat 70 955 76 753 87 221 98 917
4 Riau 276 400 297 173 345 661 413 350
5 Jambi 41 056 44 127 53 817 63 268
6 Sumatera Selatan 133 665 137 332 157 535 181 776
7 Bengkulu 14 916 16 385 18 650 21 150
8 Lampung 73 719 88 935 108 379 128 409
9 Kep. Bangka Belitung 21 421 22 998 26 565 30 255
10 Kep. Riau 58 575 63 893 71 615 80 243
11 DKI Jakarta 677 045 757 697 862 090 982 540
12 Jawa Barat 633 283 689 841 771 594 861 006
13 Jawa Tengah 367 136 397 904 444 692 498 615
14 DI, Yogyakarta 38 102 41 407 45 626 51 782
15 Jawa Timur 621 392 686 848 778 566 884 144
16 Banten 139 865 152 556 171 690 192 219
17 Bali 51 916 60 292 66 691 73 478
18 Kalimantan Barat 49 133 54 281 60 502 66 780
19 Kalimantan Tengah 32 760 37 162 42 621 49 073
20 Kalimantan Selatan 45 844 51 460 59 821 68 235
21 Kalimantan Timur 314 814 285 591 321 905 390 639
22 Sulawesi Utara 28 698 33 034 36 912 41 505
23 Sulawesi Tengah 28 728 32 461 37 319 44 318
24 Sulawesi Selatan 85 143 99 955 117 862 137 390
25 Sulawesi Tenggara 22 203 25 656 28 369 32 032
26 Gorontalo 5 907 7 069 8 057 9 154
27 Sulawesi Barat 8 297 9 403 10 987 12 895
28 Nusa Tenggara Barat 35 315 44 015 49 560 48 729
29 Nusa Tenggara Timur 21 656 24 179 27 739 31 204
30 Maluku 6 270 7 070 8 085 9 595
31 Maluku Utara 3 862 4 691 5 390 6 057
32 Papua Barat 13 975 18 144 26 880 36 170
33 Papua 61 516 76 887 87 777 76 371
Jumlah 33 Provinsi 4 271 045 4 653 539 5 293 857 6 020 994
Indonesia 4 948 688 5 606 203 6 446 852 7 422 781
Catatan/Notes : Perbedaan antara jumlah PDRB 33 PROVINSI dan PDB Indonesia antara lain disebabkan oleh diskrepansi statistik Different figure between Indonesian GDP and Sum of 33 Province, due to Statistic Discrepantion.
Sumber/Source : Badan Pusat Statistik/ Statistic Indonesia
12.2.1
PDRB Atas Dasar Harga Berlaku dirinci Menurut Provinsi (Miliar Rupiah) 2008 -2011 Tabel
Table GRDP at Current Market Prices by Province, (Billion Rupiahs) 2008 - 2011
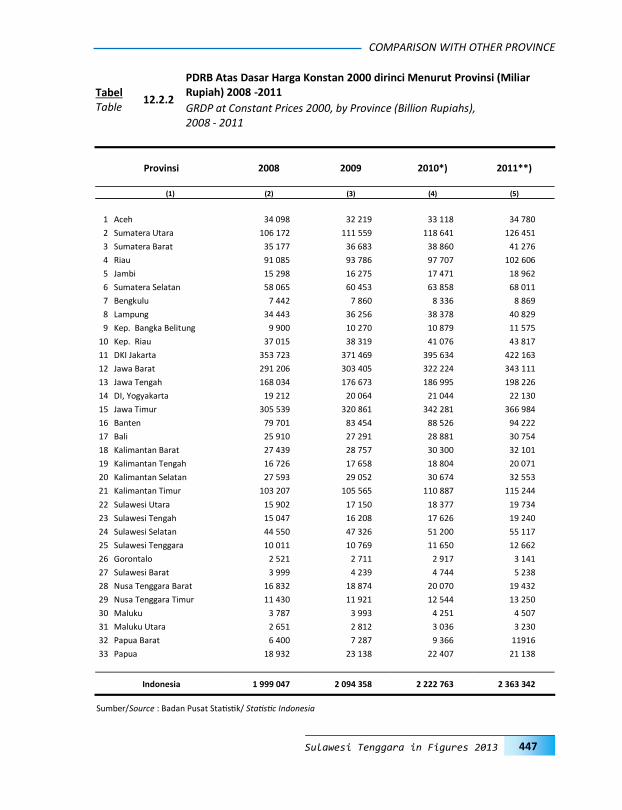
COMPARISON WITH OTHER PROVINCE
447 Sulawesi Tenggara in Figures 2013
Provinsi 2008 2009 2010*) 2011**)
(1) (2) (3) (4) (5)
1 Aceh 34 098 32 219 33 118 34 780
2 Sumatera Utara 106 172 111 559 118 641 126 451
3 Sumatera Barat 35 177 36 683 38 860 41 276
4 Riau 91 085 93 786 97 707 102 606
5 Jambi 15 298 16 275 17 471 18 962
6 Sumatera Selatan 58 065 60 453 63 858 68 011
7 Bengkulu 7 442 7 860 8 336 8 869
8 Lampung 34 443 36 256 38 378 40 829
9 Kep. Bangka Belitung 9 900 10 270 10 879 11 575
10 Kep. Riau 37 015 38 319 41 076 43 817
11 DKI Jakarta 353 723 371 469 395 634 422 163
12 Jawa Barat 291 206 303 405 322 224 343 111
13 Jawa Tengah 168 034 176 673 186 995 198 226
14 DI, Yogyakarta 19 212 20 064 21 044 22 130
15 Jawa Timur 305 539 320 861 342 281 366 984
16 Banten 79 701 83 454 88 526 94 222
17 Bali 25 910 27 291 28 881 30 754
18 Kalimantan Barat 27 439 28 757 30 300 32 101
19 Kalimantan Tengah 16 726 17 658 18 804 20 071
20 Kalimantan Selatan 27 593 29 052 30 674 32 553
21 Kalimantan Timur 103 207 105 565 110 887 115 244
22 Sulawesi Utara 15 902 17 150 18 377 19 734
23 Sulawesi Tengah 15 047 16 208 17 626 19 240
24 Sulawesi Selatan 44 550 47 326 51 200 55 117
25 Sulawesi Tenggara 10 011 10 769 11 650 12 662
26 Gorontalo 2 521 2 711 2 917 3 141
27 Sulawesi Barat 3 999 4 239 4 744 5 238
28 Nusa Tenggara Barat 16 832 18 874 20 070 19 432
29 Nusa Tenggara Timur 11 430 11 921 12 544 13 250
30 Maluku 3 787 3 993 4 251 4 507
31 Maluku Utara 2 651 2 812 3 036 3 230
32 Papua Barat 6 400 7 287 9 366 11916
33 Papua 18 932 23 138 22 407 21 138
Indonesia 1 999 047 2 094 358 2 222 763 2 363 342
12.2.2
PDRB Atas Dasar Harga Konstan 2000 dirinci Menurut Provinsi (Miliar Rupiah) 2008 -2011 Tabel
Table GRDP at Constant Prices 2000, by Province (Billion Rupiahs), 2008 - 2011
Sumber/Source : Badan Pusat Statistik/ Statistic Indonesia
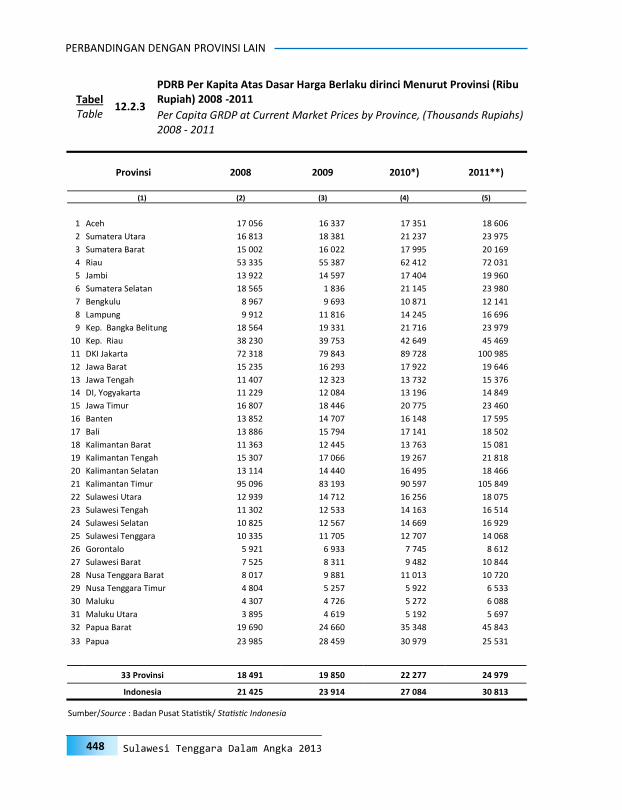
PERBANDINGAN DENGAN PROVINSI LAIN
448 Sulawesi Tenggara Dalam Angka 2013
Provinsi 2008 2009 2010*) 2011**)
(1) (2) (3) (4) (5)
1 Aceh 17 056 16 337 17 351 18 606
2 Sumatera Utara 16 813 18 381 21 237 23 975
3 Sumatera Barat 15 002 16 022 17 995 20 169
4 Riau 53 335 55 387 62 412 72 031
5 Jambi 13 922 14 597 17 404 19 960
6 Sumatera Selatan 18 565 1 836 21 145 23 980
7 Bengkulu 8 967 9 693 10 871 12 141
8 Lampung 9 912 11 816 14 245 16 696
9 Kep. Bangka Belitung 18 564 19 331 21 716 23 979
10 Kep. Riau 38 230 39 753 42 649 45 469
11 DKI Jakarta 72 318 79 843 89 728 100 985
12 Jawa Barat 15 235 16 293 17 922 19 646
13 Jawa Tengah 11 407 12 323 13 732 15 376
14 DI, Yogyakarta 11 229 12 084 13 196 14 849
15 Jawa Timur 16 807 18 446 20 775 23 460
16 Banten 13 852 14 707 16 148 17 595
17 Bali 13 886 15 794 17 141 18 502
18 Kalimantan Barat 11 363 12 445 13 763 15 081
19 Kalimantan Tengah 15 307 17 066 19 267 21 818
20 Kalimantan Selatan 13 114 14 440 16 495 18 466
21 Kalimantan Timur 95 096 83 193 90 597 105 849
22 Sulawesi Utara 12 939 14 712 16 256 18 075
23 Sulawesi Tengah 11 302 12 533 14 163 16 514
24 Sulawesi Selatan 10 825 12 567 14 669 16 929
25 Sulawesi Tenggara 10 335 11 705 12 707 14 068
26 Gorontalo 5 921 6 933 7 745 8 612
27 Sulawesi Barat 7 525 8 311 9 482 10 844
28 Nusa Tenggara Barat 8 017 9 881 11 013 10 720
29 Nusa Tenggara Timur 4 804 5 257 5 922 6 533
30 Maluku 4 307 4 726 5 272 6 088
31 Maluku Utara 3 895 4 619 5 192 5 697
32 Papua Barat 19 690 24 660 35 348 45 843
33 Papua 23 985 28 459 30 979 25 531
33 Provinsi 18 491 19 850 22 277 24 979
Indonesia 21 425 23 914 27 084 30 813
12.2.3
PDRB Per Kapita Atas Dasar Harga Berlaku dirinci Menurut Provinsi (Ribu Rupiah) 2008 -2011 Tabel
Table Per Capita GRDP at Current Market Prices by Province, (Thousands Rupiahs) 2008 - 2011
Sumber/Source : Badan Pusat Statistik/ Statistic Indonesia
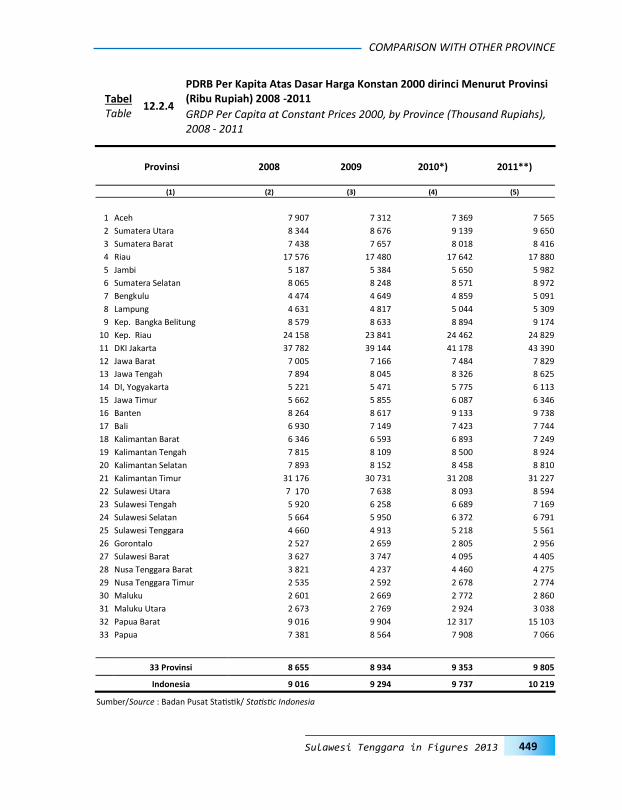
COMPARISON WITH OTHER PROVINCE
449 Sulawesi Tenggara in Figures 2013
Provinsi 2008 2009 2010*) 2011**)
(1) (2) (3) (4) (5)
1 Aceh 7 907 7 312 7 369 7 565
2 Sumatera Utara 8 344 8 676 9 139 9 650
3 Sumatera Barat 7 438 7 657 8 018 8 416
4 Riau 17 576 17 480 17 642 17 880
5 Jambi 5 187 5 384 5 650 5 982
6 Sumatera Selatan 8 065 8 248 8 571 8 972
7 Bengkulu 4 474 4 649 4 859 5 091
8 Lampung 4 631 4 817 5 044 5 309
9 Kep. Bangka Belitung 8 579 8 633 8 894 9 174
10 Kep. Riau 24 158 23 841 24 462 24 829
11 DKI Jakarta 37 782 39 144 41 178 43 390
12 Jawa Barat 7 005 7 166 7 484 7 829
13 Jawa Tengah 7 894 8 045 8 326 8 625
14 DI, Yogyakarta 5 221 5 471 5 775 6 113
15 Jawa Timur 5 662 5 855 6 087 6 346
16 Banten 8 264 8 617 9 133 9 738
17 Bali 6 930 7 149 7 423 7 744
18 Kalimantan Barat 6 346 6 593 6 893 7 249
19 Kalimantan Tengah 7 815 8 109 8 500 8 924
20 Kalimantan Selatan 7 893 8 152 8 458 8 810
21 Kalimantan Timur 31 176 30 731 31 208 31 227
22 Sulawesi Utara 7 170 7 638 8 093 8 594
23 Sulawesi Tengah 5 920 6 258 6 689 7 169
24 Sulawesi Selatan 5 664 5 950 6 372 6 791
25 Sulawesi Tenggara 4 660 4 913 5 218 5 561
26 Gorontalo 2 527 2 659 2 805 2 956
27 Sulawesi Barat 3 627 3 747 4 095 4 405
28 Nusa Tenggara Barat 3 821 4 237 4 460 4 275
29 Nusa Tenggara Timur 2 535 2 592 2 678 2 774
30 Maluku 2 601 2 669 2 772 2 860
31 Maluku Utara 2 673 2 769 2 924 3 038
32 Papua Barat 9 016 9 904 12 317 15 103
33 Papua 7 381 8 564 7 908 7 066
33 Provinsi 8 655 8 934 9 353 9 805
Indonesia 9 016 9 294 9 737 10 219
12.2.4
PDRB Per Kapita Atas Dasar Harga Konstan 2000 dirinci Menurut Provinsi (Ribu Rupiah) 2008 -2011 Tabel
Table GRDP Per Capita at Constant Prices 2000, by Province (Thousand Rupiahs), 2008 - 2011
Sumber/Source : Badan Pusat Statistik/ Statistic Indonesia
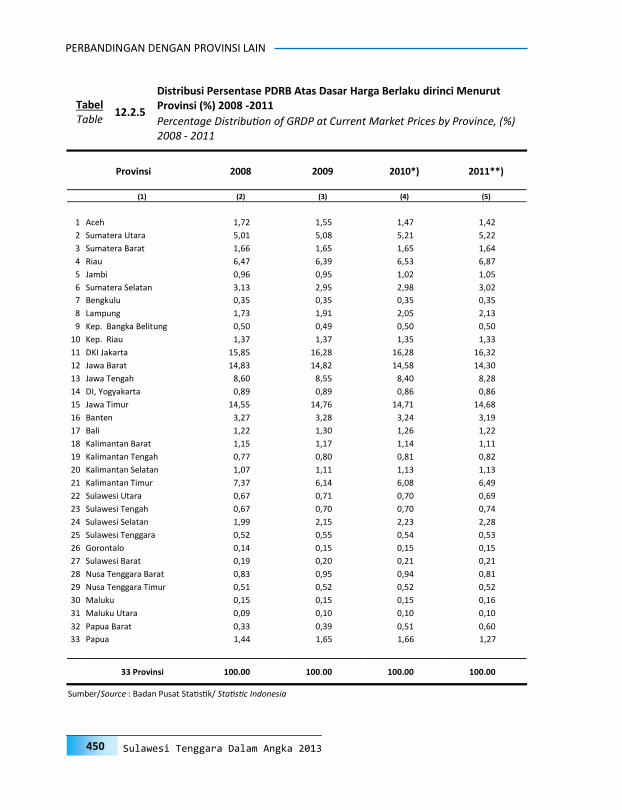
PERBANDINGAN DENGAN PROVINSI LAIN
450 Sulawesi Tenggara Dalam Angka 2013
Provinsi 2008 2009 2010*) 2011**)
(1) (2) (3) (4) (5)
1 Aceh 1,72 1,55 1,47 1,42
2 Sumatera Utara 5,01 5,08 5,21 5,22
3 Sumatera Barat 1,66 1,65 1,65 1,64
4 Riau 6,47 6,39 6,53 6,87
5 Jambi 0,96 0,95 1,02 1,05
6 Sumatera Selatan 3,13 2,95 2,98 3,02
7 Bengkulu 0,35 0,35 0,35 0,35
8 Lampung 1,73 1,91 2,05 2,13
9 Kep. Bangka Belitung 0,50 0,49 0,50 0,50
10 Kep. Riau 1,37 1,37 1,35 1,33
11 DKI Jakarta 15,85 16,28 16,28 16,32
12 Jawa Barat 14,83 14,82 14,58 14,30
13 Jawa Tengah 8,60 8,55 8,40 8,28
14 DI, Yogyakarta 0,89 0,89 0,86 0,86
15 Jawa Timur 14,55 14,76 14,71 14,68
16 Banten 3,27 3,28 3,24 3,19
17 Bali 1,22 1,30 1,26 1,22
18 Kalimantan Barat 1,15 1,17 1,14 1,11
19 Kalimantan Tengah 0,77 0,80 0,81 0,82
20 Kalimantan Selatan 1,07 1,11 1,13 1,13
21 Kalimantan Timur 7,37 6,14 6,08 6,49
22 Sulawesi Utara 0,67 0,71 0,70 0,69
23 Sulawesi Tengah 0,67 0,70 0,70 0,74
24 Sulawesi Selatan 1,99 2,15 2,23 2,28
25 Sulawesi Tenggara 0,52 0,55 0,54 0,53
26 Gorontalo 0,14 0,15 0,15 0,15
27 Sulawesi Barat 0,19 0,20 0,21 0,21
28 Nusa Tenggara Barat 0,83 0,95 0,94 0,81
29 Nusa Tenggara Timur 0,51 0,52 0,52 0,52
30 Maluku 0,15 0,15 0,15 0,16
31 Maluku Utara 0,09 0,10 0,10 0,10
32 Papua Barat 0,33 0,39 0,51 0,60
33 Papua 1,44 1,65 1,66 1,27
33 Provinsi 100.00 100.00 100.00 100.00
12.2.5
Distribusi Persentase PDRB Atas Dasar Harga Berlaku dirinci Menurut Provinsi (%) 2008 -2011 Tabel
Table Percentage Distribution of GRDP at Current Market Prices by Province, (%) 2008 - 2011
Sumber/Source : Badan Pusat Statistik/ Statistic Indonesia
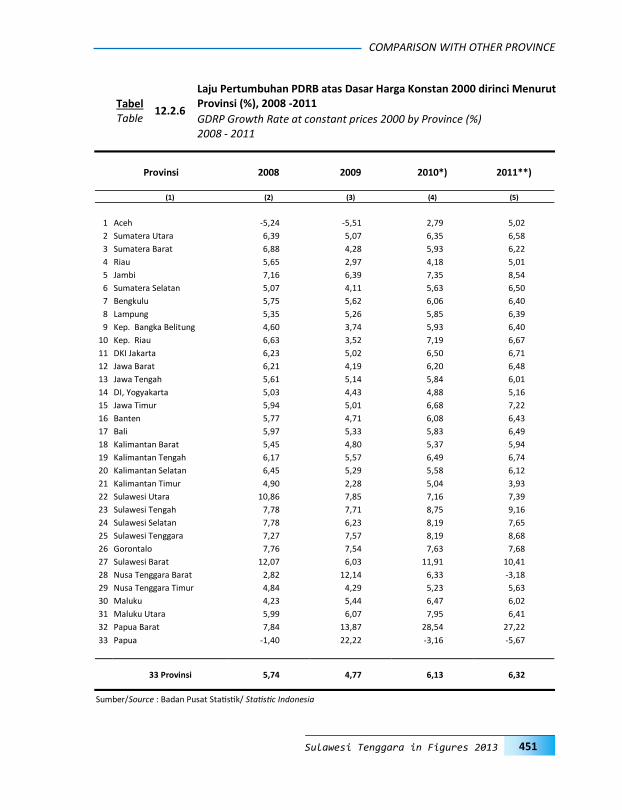
COMPARISON WITH OTHER PROVINCE
451 Sulawesi Tenggara in Figures 2013
Provinsi 2008 2009 2010*) 2011**)
(1) (2) (3) (4) (5)
1 Aceh -5,24 -5,51 2,79 5,02
2 Sumatera Utara 6,39 5,07 6,35 6,58
3 Sumatera Barat 6,88 4,28 5,93 6,22
4 Riau 5,65 2,97 4,18 5,01
5 Jambi 7,16 6,39 7,35 8,54
6 Sumatera Selatan 5,07 4,11 5,63 6,50
7 Bengkulu 5,75 5,62 6,06 6,40
8 Lampung 5,35 5,26 5,85 6,39
9 Kep. Bangka Belitung 4,60 3,74 5,93 6,40
10 Kep. Riau 6,63 3,52 7,19 6,67
11 DKI Jakarta 6,23 5,02 6,50 6,71
12 Jawa Barat 6,21 4,19 6,20 6,48
13 Jawa Tengah 5,61 5,14 5,84 6,01
14 DI, Yogyakarta 5,03 4,43 4,88 5,16
15 Jawa Timur 5,94 5,01 6,68 7,22
16 Banten 5,77 4,71 6,08 6,43
17 Bali 5,97 5,33 5,83 6,49
18 Kalimantan Barat 5,45 4,80 5,37 5,94
19 Kalimantan Tengah 6,17 5,57 6,49 6,74
20 Kalimantan Selatan 6,45 5,29 5,58 6,12
21 Kalimantan Timur 4,90 2,28 5,04 3,93
22 Sulawesi Utara 10,86 7,85 7,16 7,39
23 Sulawesi Tengah 7,78 7,71 8,75 9,16
24 Sulawesi Selatan 7,78 6,23 8,19 7,65
25 Sulawesi Tenggara 7,27 7,57 8,19 8,68
26 Gorontalo 7,76 7,54 7,63 7,68
27 Sulawesi Barat 12,07 6,03 11,91 10,41
28 Nusa Tenggara Barat 2,82 12,14 6,33 -3,18
29 Nusa Tenggara Timur 4,84 4,29 5,23 5,63
30 Maluku 4,23 5,44 6,47 6,02
31 Maluku Utara 5,99 6,07 7,95 6,41
32 Papua Barat 7,84 13,87 28,54 27,22
33 Papua -1,40 22,22 -3,16 -5,67
33 Provinsi 5,74 4,77 6,13 6,32
12.2.6
Laju Pertumbuhan PDRB atas Dasar Harga Konstan 2000 dirinci Menurut Provinsi (%), 2008 -2011 Tabel
Table GDRP Growth Rate at constant prices 2000 by Province (%) 2008 - 2011
Sumber/Source : Badan Pusat Statistik/ Statistic Indonesia

PERBANDINGAN DENGAN PROVINSI LAIN
452 Sulawesi Tenggara Dalam Angka 2013
Provinsi 2008 2009 2010 2012 2011
(1) (2) (3) (4) (6) (5)
1 Aceh 960 893 862 909 895
2 Sumatera Utara 1 614 1 500 1 491 1 407 1 481
3 SumateraBarat 477 429 430 405 442
4 Riau 567 528 500 483 482
5 Jambi 260 250 242 272 273
6 SumateraSelatan 1 250 1 168 1 126 1 057 1 075
7 Bengkulu 352 324 325 312 304
8 Lampung 1 592 1 558 1 480 1 254 1 299
9 BangkaBelitung 87 77 68 71 72
10 KepulauanRiau 136 128 130 131 130
11 DKIJakarta 380 323 312 363 363
12 JawaBarat 5 322 4 984 4 774 4 478 4 649
13 JawaTengah 6 190 5 726 5 369 4 977 5 107
14 DI Yogyakarta 616 586 577 565 561
15 JawaTimur 6 651 6 023 5 529 5 071 5 356
16 Banten 817 788 758 653 690
17 Bali 216 182 175 169 166
18 NusaTenggaraBarat 1 081 1 051 1 009 853 895
19 NusaTenggaraTimur 1 098 1 013 1 014 1 013 1 013
20 KalimantanBarat 509 435 429 363 380
21 KalimantanTengah 200 166 164 148 147
22 Kalimantanselatan 219 176 182 190 195
23 KalimantanTimur 286 239 243 253 248
24 SulawesiUtara 224 220 207 189 195
25 SulawesiTengah 525 490 475 419 424
26 SulawesiSelatan 1 032 964 913 826 833
27 SulawesiTenggara 436 434 401 316 330
28 Gorontalo 222 225 210 187 198
29 SulawesiBarat 171 158 141 161 165
30 Maluku 391 380 379 350 360
31 MalukuUtara 105 98 91 92 97
32 PapuaBarat 247 257 256 230 250
33 Papua 733 760 762 967 945
33 Provinsi 34 963 32 530 31 023 29 132 30 019
12.3.1 Jumlah Penduduk Miskin Dirinci Menurut Provinsi, 2008 -2012 (000 Jiwa) Tabel
Table Number of poor people by Province, 2008 - 2012 (000 people)
Sumber/Source : Badan Pusat Statistik/ Statistic Indonesia
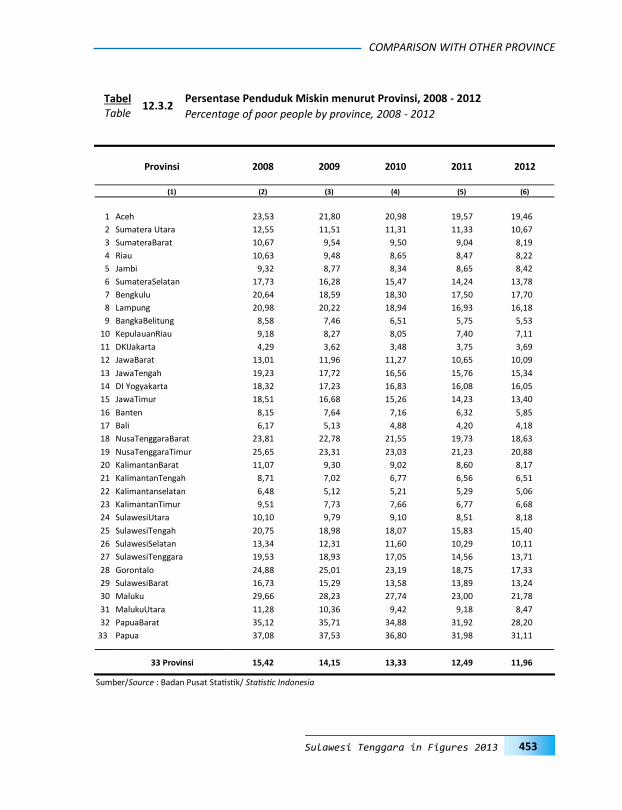
COMPARISON WITH OTHER PROVINCE
453 Sulawesi Tenggara in Figures 2013
Provinsi 2008 2009 2010 2012 2011
(1) (2) (3) (4) (6) (5)
1 Aceh 23,53 21,80 20,98 19,46 19,57
2 Sumatera Utara 12,55 11,51 11,31 10,67 11,33
3 SumateraBarat 10,67 9,54 9,50 8,19 9,04
4 Riau 10,63 9,48 8,65 8,22 8,47
5 Jambi 9,32 8,77 8,34 8,42 8,65
6 SumateraSelatan 17,73 16,28 15,47 13,78 14,24
7 Bengkulu 20,64 18,59 18,30 17,70 17,50
8 Lampung 20,98 20,22 18,94 16,18 16,93
9 BangkaBelitung 8,58 7,46 6,51 5,53 5,75
10 KepulauanRiau 9,18 8,27 8,05 7,11 7,40
11 DKIJakarta 4,29 3,62 3,48 3,69 3,75
12 JawaBarat 13,01 11,96 11,27 10,09 10,65
13 JawaTengah 19,23 17,72 16,56 15,34 15,76
14 DI Yogyakarta 18,32 17,23 16,83 16,05 16,08
15 JawaTimur 18,51 16,68 15,26 13,40 14,23
16 Banten 8,15 7,64 7,16 5,85 6,32
17 Bali 6,17 5,13 4,88 4,18 4,20
18 NusaTenggaraBarat 23,81 22,78 21,55 18,63 19,73
19 NusaTenggaraTimur 25,65 23,31 23,03 20,88 21,23
20 KalimantanBarat 11,07 9,30 9,02 8,17 8,60
21 KalimantanTengah 8,71 7,02 6,77 6,51 6,56
22 Kalimantanselatan 6,48 5,12 5,21 5,06 5,29
23 KalimantanTimur 9,51 7,73 7,66 6,68 6,77
24 SulawesiUtara 10,10 9,79 9,10 8,18 8,51
25 SulawesiTengah 20,75 18,98 18,07 15,40 15,83
26 SulawesiSelatan 13,34 12,31 11,60 10,11 10,29
27 SulawesiTenggara 19,53 18,93 17,05 13,71 14,56
28 Gorontalo 24,88 25,01 23,19 17,33 18,75
29 SulawesiBarat 16,73 15,29 13,58 13,24 13,89
30 Maluku 29,66 28,23 27,74 21,78 23,00
31 MalukuUtara 11,28 10,36 9,42 8,47 9,18
32 PapuaBarat 35,12 35,71 34,88 28,20 31,92
33 Papua 37,08 37,53 36,80 31,11 31,98
33 Provinsi 15,42 14,15 13,33 11,96 12,49
12.3.2 Persentase Penduduk Miskin menurut Provinsi, 2008 - 2012 Tabel
Table Percentage of poor people by province, 2008 - 2012
Sumber/Source : Badan Pusat Statistik/ Statistic Indonesia
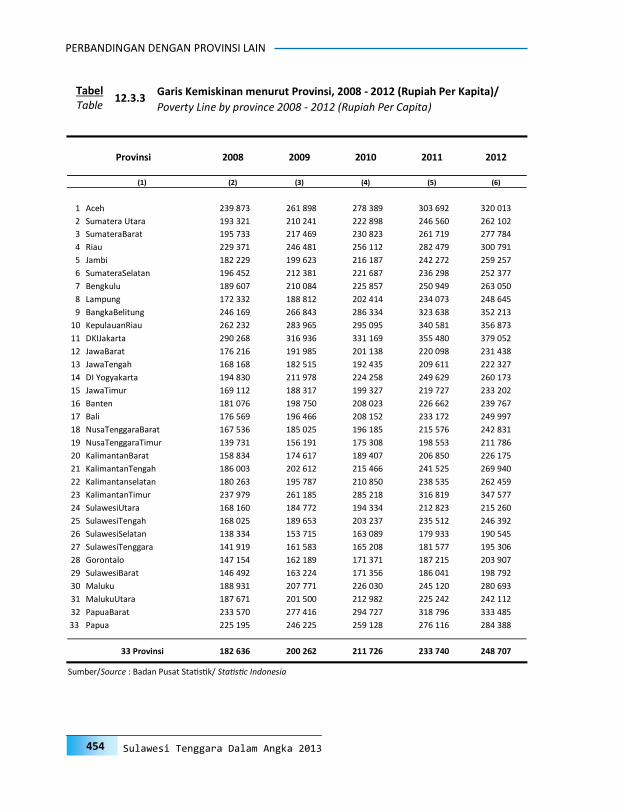
PERBANDINGAN DENGAN PROVINSI LAIN
454 Sulawesi Tenggara Dalam Angka 2013
Provinsi 2008 2009 2010 2012 2011
(1) (2) (3) (4) (6) (5)
1 Aceh 239 873 261 898 278 389 320 013 303 692
2 Sumatera Utara 193 321 210 241 222 898 262 102 246 560
3 SumateraBarat 195 733 217 469 230 823 277 784 261 719
4 Riau 229 371 246 481 256 112 300 791 282 479
5 Jambi 182 229 199 623 216 187 259 257 242 272
6 SumateraSelatan 196 452 212 381 221 687 252 377 236 298
7 Bengkulu 189 607 210 084 225 857 263 050 250 949
8 Lampung 172 332 188 812 202 414 248 645 234 073
9 BangkaBelitung 246 169 266 843 286 334 352 213 323 638
10 KepulauanRiau 262 232 283 965 295 095 356 873 340 581
11 DKIJakarta 290 268 316 936 331 169 379 052 355 480
12 JawaBarat 176 216 191 985 201 138 231 438 220 098
13 JawaTengah 168 168 182 515 192 435 222 327 209 611
14 DI Yogyakarta 194 830 211 978 224 258 260 173 249 629
15 JawaTimur 169 112 188 317 199 327 233 202 219 727
16 Banten 181 076 198 750 208 023 239 767 226 662
17 Bali 176 569 196 466 208 152 249 997 233 172
18 NusaTenggaraBarat 167 536 185 025 196 185 242 831 215 576
19 NusaTenggaraTimur 139 731 156 191 175 308 211 786 198 553
20 KalimantanBarat 158 834 174 617 189 407 226 175 206 850
21 KalimantanTengah 186 003 202 612 215 466 269 940 241 525
22 Kalimantanselatan 180 263 195 787 210 850 262 459 238 535
23 KalimantanTimur 237 979 261 185 285 218 347 577 316 819
24 SulawesiUtara 168 160 184 772 194 334 215 260 212 823
25 SulawesiTengah 168 025 189 653 203 237 246 392 235 512
26 SulawesiSelatan 138 334 153 715 163 089 190 545 179 933
27 SulawesiTenggara 141 919 161 583 165 208 195 306 181 577
28 Gorontalo 147 154 162 189 171 371 203 907 187 215
29 SulawesiBarat 146 492 163 224 171 356 198 792 186 041
30 Maluku 188 931 207 771 226 030 280 693 245 120
31 MalukuUtara 187 671 201 500 212 982 242 112 225 242
32 PapuaBarat 233 570 277 416 294 727 333 485 318 796
33 Papua 225 195 246 225 259 128 284 388 276 116
33 Provinsi 182 636 200 262 211 726 248 707 233 740
12.3.3 Garis Kemiskinan menurut Provinsi, 2008 - 2012 (Rupiah Per Kapita)/ Tabel
Table Poverty Line by province 2008 - 2012 (Rupiah Per Capita)
Sumber/Source : Badan Pusat Statistik/ Statistic Indonesia

COMPARISON WITH OTHER PROVINCE
455 Sulawesi Tenggara in Figures 2013
Provinsi 2007 2008 2009 2010 2011
(1) (2) (3) (4) (5) (6)
11. Aceh 70.35 70.76 71.31 71.70 72.16
12. Sumatera Utara 72.78 73.29 73.80 74.19 74.65
13. Sumatera Barat 72.23 72.96 73.44 73.78 74.28
14. Riau 74.63 75.09 75.60 76.07 76.53
15. Jambi 71.46 71.99 72.45 72.74 73.30
16. Sumatera Selatan 71.40 72.05 72.61 72.95 73.42
17. Bengkulu 71.57 72.14 72.55 72.92 73.40
18. Lampung 69.78 70.30 70.93 71.42 71.94
19. Bangka Belitung 71.62 72.19 72.55 72.86 73.37
20. Kep. Riau 73.68 74.18 74.54 75.07 75.78
31. DKI Jakarta 76.59 77.03 77.36 77.60 77.97
32. Jawa Barat 70.71 71.12 71.64 72.29 72.73
33. Jawa Tengah 70.92 71.60 72.10 72.49 72.94
34. Yogyakarta 74.15 74.88 75.23 75.77 76.32
35. Jawa Timur 69.78 70.38 71.06 71.62 72.18
36. Banten 69.29 69.70 70.06 70.48 70.95
51. Bali 70.53 70.98 71.52 72.28 72.84
52. Nusa Tenggara Barat 63.71 64.12 64.66 65.20 66.23
53. Nusa Tenggara Timur 65.36 66.15 66.60 67.26 67.75
61. Kalimantan Barat 67.53 68.17 68.79 69.15 69.66
62. Kalimantan Tengah 73.49 73.88 74.36 74.64 75.06
63. Kalimantan Selatan 68.01 68.72 69.30 69.92 70.44
64. Kalimantan Timur 73.77 74.52 75.11 75.56 76.22
71. Sulawesi Utara 74.68 75.16 75.68 76.09 76.54
72. Sulawesi Tengah 69.34 70.09 70.70 71.14 71.62
73. Sulawesi Selatan 69.62 70.22 70.94 71.62 72.14
74. Sulawesi Tenggara 68.32 69.00 69.52 70.00 70.55
75. Gorontalo 68.83 69.29 69.79 70.28 70.82
76. Sulawesi Barat 67.72 68.55 69.18 69.64 70.11
81. Maluku 69.96 70.38 70.96 71.42 71.87
82. Maluku Utara 67.82 68.18 68.63 69.03 69.47
91. Irian Jaya Barat 67.28 67.95 68.58 69.15 69.65
94. Papua 63.41 64.00 64.53 64.94 65.36
Indonesia (BPS) 70.59 71.17 71.76 72.27 72.77
12.4.1 Indeks Pembangunan Manusia (IPM) menurut provinsi 2007 - 2011 Tabel
Table Human Development Index (HDI) by province 2007 - 2012
Sumber/Source : Badan Pusat Statistik/ Statistic Indonesia
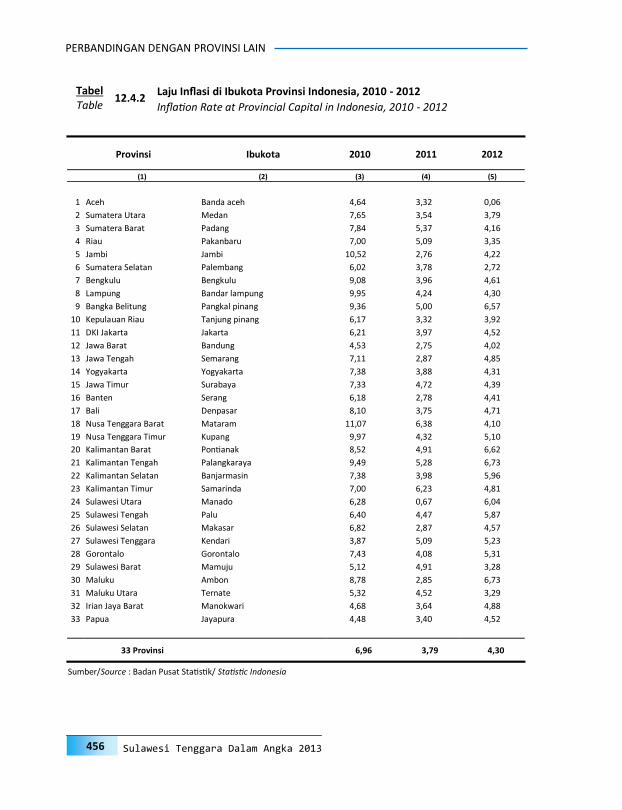
PERBANDINGAN DENGAN PROVINSI LAIN
456 Sulawesi Tenggara Dalam Angka 2013
Provinsi Ibukota 2010 2011 2012
(1) (2) (3) (4) (5)
1 Aceh Banda aceh 4,64 3,32 0,06
2 Sumatera Utara Medan 7,65 3,54 3,79
3 Sumatera Barat Padang 7,84 5,37 4,16
4 Riau Pakanbaru 7,00 5,09 3,35
5 Jambi Jambi 10,52 2,76 4,22
6 Sumatera Selatan Palembang 6,02 3,78 2,72
7 Bengkulu Bengkulu 9,08 3,96 4,61
8 Lampung Bandar lampung 9,95 4,24 4,30
9 Bangka Belitung Pangkal pinang 9,36 5,00 6,57
10 Kepulauan Riau Tanjung pinang 6,17 3,32 3,92
11 DKI Jakarta Jakarta 6,21 3,97 4,52
12 Jawa Barat Bandung 4,53 2,75 4,02
13 Jawa Tengah Semarang 7,11 2,87 4,85
14 Yogyakarta Yogyakarta 7,38 3,88 4,31
15 Jawa Timur Surabaya 7,33 4,72 4,39
16 Banten Serang 6,18 2,78 4,41
17 Bali Denpasar 8,10 3,75 4,71
18 Nusa Tenggara Barat Mataram 11,07 6,38 4,10
19 Nusa Tenggara Timur Kupang 9,97 4,32 5,10
20 Kalimantan Barat Pontianak 8,52 4,91 6,62
21 Kalimantan Tengah Palangkaraya 9,49 5,28 6,73
22 Kalimantan Selatan Banjarmasin 7,38 3,98 5,96
23 Kalimantan Timur Samarinda 7,00 6,23 4,81
24 Sulawesi Utara Manado 6,28 0,67 6,04
25 Sulawesi Tengah Palu 6,40 4,47 5,87
26 Sulawesi Selatan Makasar 6,82 2,87 4,57
27 Sulawesi Tenggara Kendari 3,87 5,09 5,23
28 Gorontalo Gorontalo 7,43 4,08 5,31
29 Sulawesi Barat Mamuju 5,12 4,91 3,28
30 Maluku Ambon 8,78 2,85 6,73
31 Maluku Utara Ternate 5,32 4,52 3,29
32 Irian Jaya Barat Manokwari 4,68 3,64 4,88
33 Papua Jayapura 4,48 3,40 4,52
33 Provinsi 6,96 3,79 4,30
12.4.2 Laju Inflasi di Ibukota Provinsi Indonesia, 2010 - 2012 Tabel
Table Inflation Rate at Provincial Capital in Indonesia, 2010 - 2012
Sumber/Source : Badan Pusat Statistik/ Statistic Indonesia
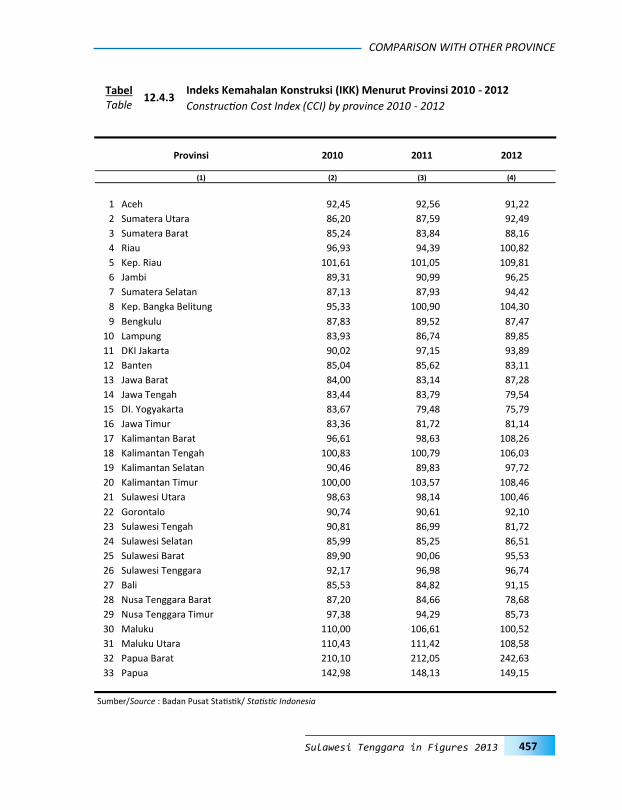
COMPARISON WITH OTHER PROVINCE
457 Sulawesi Tenggara in Figures 2013
Provinsi 2010 2011 2012
(1) (2) (3) (4)
1 Aceh 92,45 92,56 91,22
2 Sumatera Utara 86,20 87,59 92,49
3 Sumatera Barat 85,24 83,84 88,16
4 Riau 96,93 94,39 100,82
5 Kep. Riau 101,61 101,05 109,81
6 Jambi 89,31 90,99 96,25
7 Sumatera Selatan 87,13 87,93 94,42
8 Kep. Bangka Belitung 95,33 100,90 104,30
9 Bengkulu 87,83 89,52 87,47
10 Lampung 83,93 86,74 89,85
11 DKI Jakarta 90,02 97,15 93,89
12 Banten 85,04 85,62 83,11
13 Jawa Barat 84,00 83,14 87,28
14 Jawa Tengah 83,44 83,79 79,54
15 DI. Yogyakarta 83,67 79,48 75,79
16 Jawa Timur 83,36 81,72 81,14
17 Kalimantan Barat 96,61 98,63 108,26
18 Kalimantan Tengah 100,83 100,79 106,03
19 Kalimantan Selatan 90,46 89,83 97,72
20 Kalimantan Timur 100,00 103,57 108,46
21 Sulawesi Utara 98,63 98,14 100,46
22 Gorontalo 90,74 90,61 92,10
23 Sulawesi Tengah 90,81 86,99 81,72
24 Sulawesi Selatan 85,99 85,25 86,51
25 Sulawesi Barat 89,90 90,06 95,53
26 Sulawesi Tenggara 92,17 96,98 96,74
27 Bali 85,53 84,82 91,15
28 Nusa Tenggara Barat 87,20 84,66 78,68
29 Nusa Tenggara Timur 97,38 94,29 85,73
30 Maluku 110,00 106,61 100,52
31 Maluku Utara 110,43 111,42 108,58
32 Papua Barat 210,10 212,05 242,63
33 Papua 142,98 148,13 149,15
12.4.3 Indeks Kemahalan Konstruksi (IKK) Menurut Provinsi 2010 - 2012 Tabel
Table Construction Cost Index (CCI) by province 2010 - 2012
Sumber/Source : Badan Pusat Statistik/ Statistic Indonesia

PERBANDINGAN DENGAN PROVINSI LAIN
458 Sulawesi Tenggara Dalam Angka 2013
Halaman ini sengaja dikosongkan This page left blank intentionally