Embed Size (px)
Citation preview
7/31/2019 Sumitomo Metals Q1presentation
http://slidepdf.com/reader/full/sumitomo-metals-q1presentation 1/28
1
5405:JP
:
u y ,
7/31/2019 Sumitomo Metals Q1presentation
http://slidepdf.com/reader/full/sumitomo-metals-q1presentation 2/28
7/31/2019 Sumitomo Metals Q1presentation
http://slidepdf.com/reader/full/sumitomo-metals-q1presentation 3/28
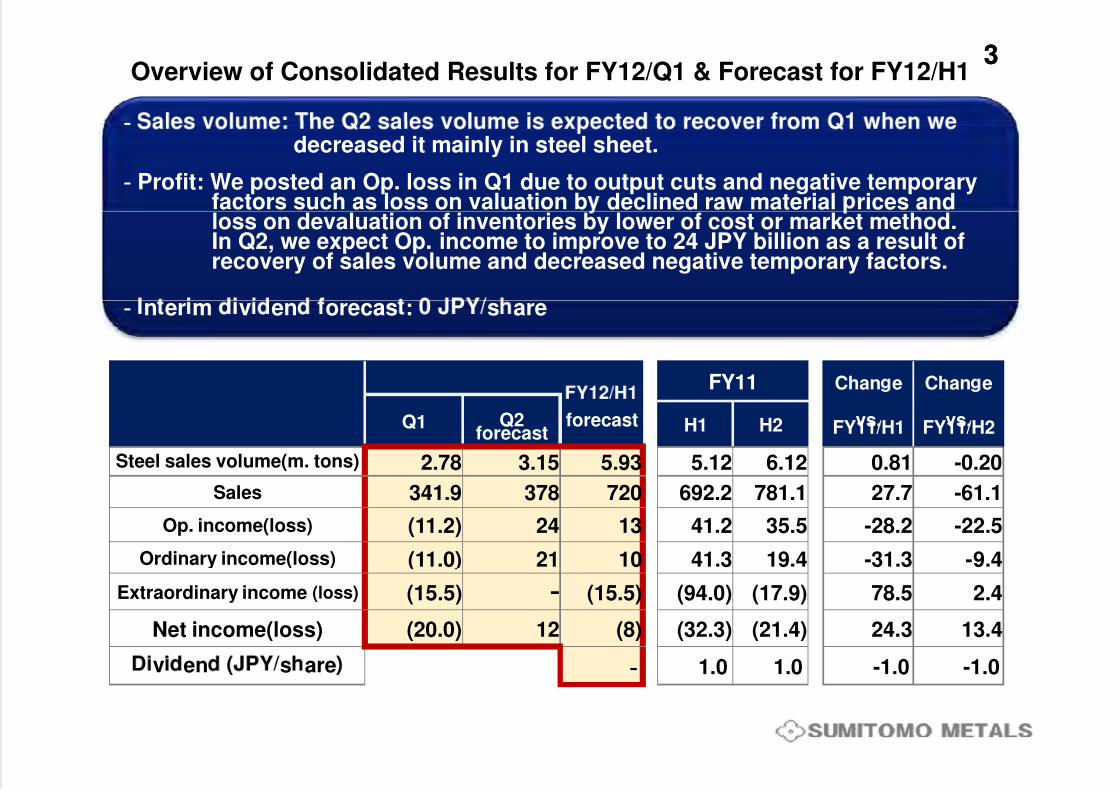
33Overview of Consolidated Results for FY12/Q1 & Forecast for FY12/H1
- decreased it mainly in steel sheet.
- Profit: We posted an Op. loss in Q1 due to output cuts and negative temporaryfactors such as loss on valuation b declined raw material rices andloss on devaluation of inventories by lower of cost or market method.In Q2, we expect Op. income to improve to 24 JPY billion as a result ofrecovery of sales volume and decreased negative temporary factors.
- n er m v en orecas : s are
FY11 Chan e Chan e
forecast vs.FY11/H1 vs.FY11/H2Q1 Q2forecast H1 H2
Steel sales volume(m. tons) 2.78 3.15 5.93 5.12 6.12 0.81 -0.20
Sales 341.9 378 720 692.2 781.1 27.7 -61.1
Op. income(loss) (11.2) 24 13 41.2 35.5 -28.2 -22.5
Ordinary income(loss) (11.0) 21 10 41.3 19.4 -31.3 -9.4
Extraordinary income (loss) (15.5) - (15.5) (94.0) (17.9) 78.5 2.4
Net income(loss) (20.0) 12 (8) (32.3) (21.4) 24.3 13.4
v en s are - 1.0 1.0 -1.0 -1.0
7/31/2019 Sumitomo Metals Q1presentation
http://slidepdf.com/reader/full/sumitomo-metals-q1presentation 4/28
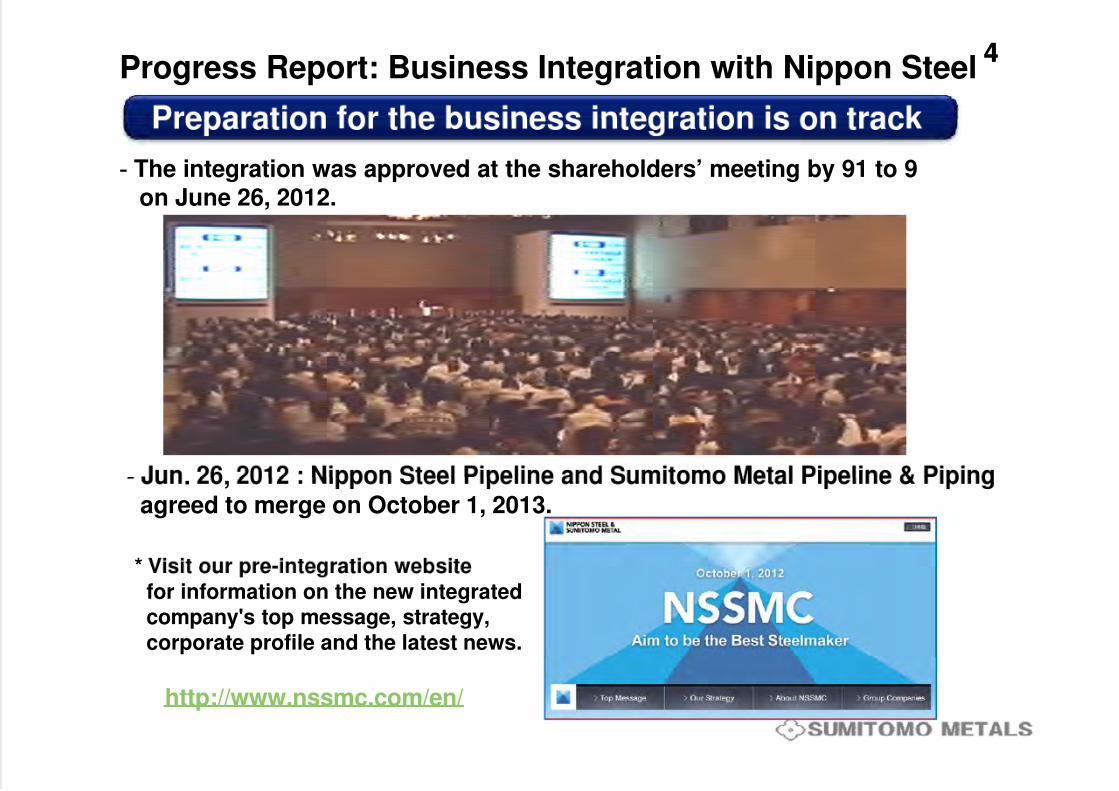
44Progress Report: Business Integration with Nippon Steel
- The integration was approved at the shareholders’ meeting by 91 to 9on June 26, 2012.
.
-
*
. ,agreed to merge on October 1, 2013.
for information on the new integratedcompany's top message, strategy,corporate profile and the latest news.
http://www.nssmc.com/en/
7/31/2019 Sumitomo Metals Q1presentation
http://slidepdf.com/reader/full/sumitomo-metals-q1presentation 5/28
5
esu sesu s
FY2012/H1 ForecastFY2012/H1 Forecast
7/31/2019 Sumitomo Metals Q1presentation
http://slidepdf.com/reader/full/sumitomo-metals-q1presentation 6/28
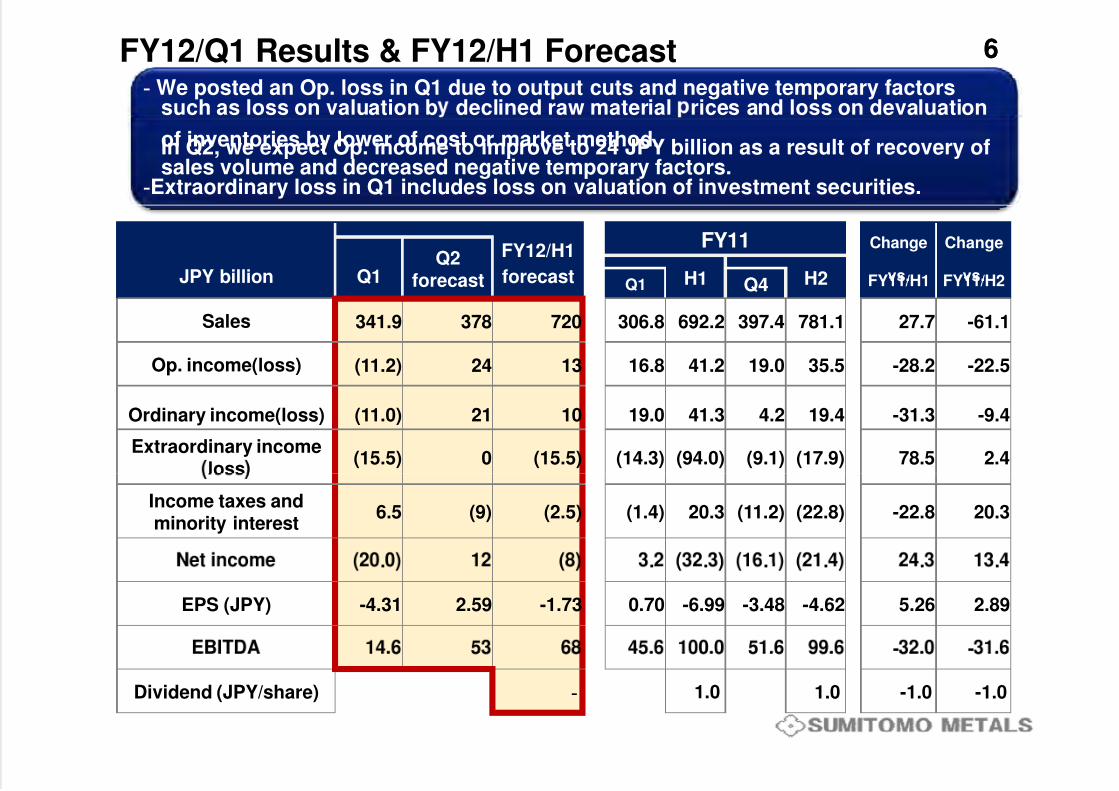
66FY12/Q1 Results & FY12/H1 Forecast- We posted an Op. loss in Q1 due to output cuts and negative temporary factors
such as loss on valuation b declined raw material rices and loss on devaluation
of inventories by lower of cost or market method.In Q2, we expect Op. income to improve to 24 JPY billion as a result of recovery ofsales volume and decreased negative temporary factors.
-Extraordinary loss in Q1 includes loss on valuation of investment securities.
JPY billion
FY12/H1
forecast
FY11 Change
vs.FY11/H1
Change
vs.FY11/H2Q1Q2
forecast H1 H2Q1 Q4
Sales 341.9 378 720 306.8 692.2 397.4 781.1 27.7 -61.1
Op. income(loss) (11.2) 24 13 16.8 41.2 19.0 35.5 -28.2 -22.5
Ordinary income(loss) (11.0) 21 10 19.0 41.3 4.2 19.4 -31.3 -9.4
Extraordinary incomeloss
(15.5) 0 (15.5) (14.3) (94.0) (9.1) (17.9) 78.5 2.4
Income taxes andminority interest
6.5 (9) (2.5) (1.4) 20.3 (11.2) (22.8) -22.8 20.3
. . . . . . .
EPS (JPY) -4.31 2.59 -1.73 0.70 -6.99 -3.48 -4.62 5.26 2.89
- -
Dividend (JPY/share) - 1.0 1.0 -1.0 -1.0
7/31/2019 Sumitomo Metals Q1presentation
http://slidepdf.com/reader/full/sumitomo-metals-q1presentation 7/28
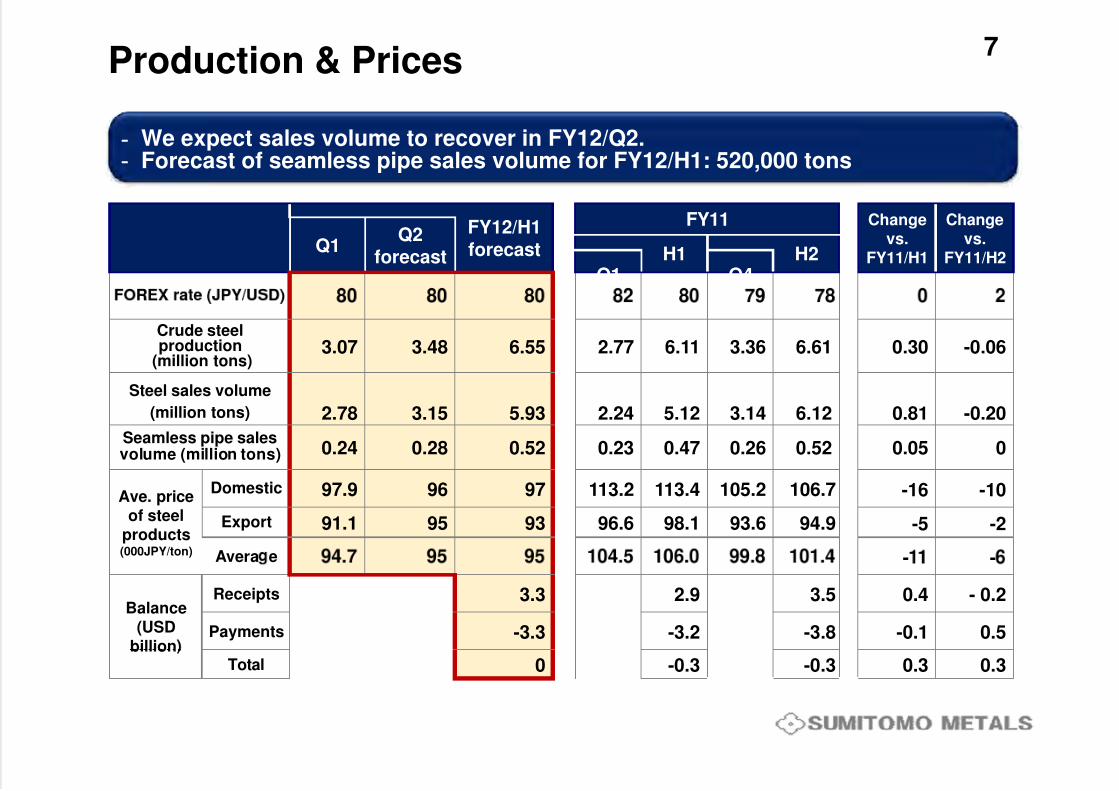
7Production & Prices
- We expect sales volume to recover in FY12/Q2.- Forecast of seamless pipe sales volume for FY12/H1: 520,000 tons
FY12/H1forecast
FY11 Changevs.
FY11/H1
Changevs.
FY11/H2Q1
Q2forecast H1 H2
Q1 Q4
Crude steelproduction
(million tons)3.07 3.48 6.55 2.77 6.11 3.36 6.61 0.30 -0.06
Steel sales volume
(million tons) 2.78 3.15 5.93 2.24 5.12 3.14 6.12 0.81 -0.20
Seamless pipe salesvolume (million tons) 0.24 0.28 0.52 0.23 0.47 0.26 0.52 0.05 0
Ave. priceof steel
products(000JPY/ton)
Domestic 97.9 96 97 113.2 113.4 105.2 106.7 -16 -10
Export 91.1 95 93 96.6 98.1 93.6 94.9 -5 -2
Avera e - -
Balance(USD
billion
Receipts 3.3 2.9 3.5 0.4 - 0.2
Payments -3.3 -3.2 -3.8 -0.1 0.5
Total 0 -0.3 -0.3 0.3 0.3
7/31/2019 Sumitomo Metals Q1presentation
http://slidepdf.com/reader/full/sumitomo-metals-q1presentation 8/28
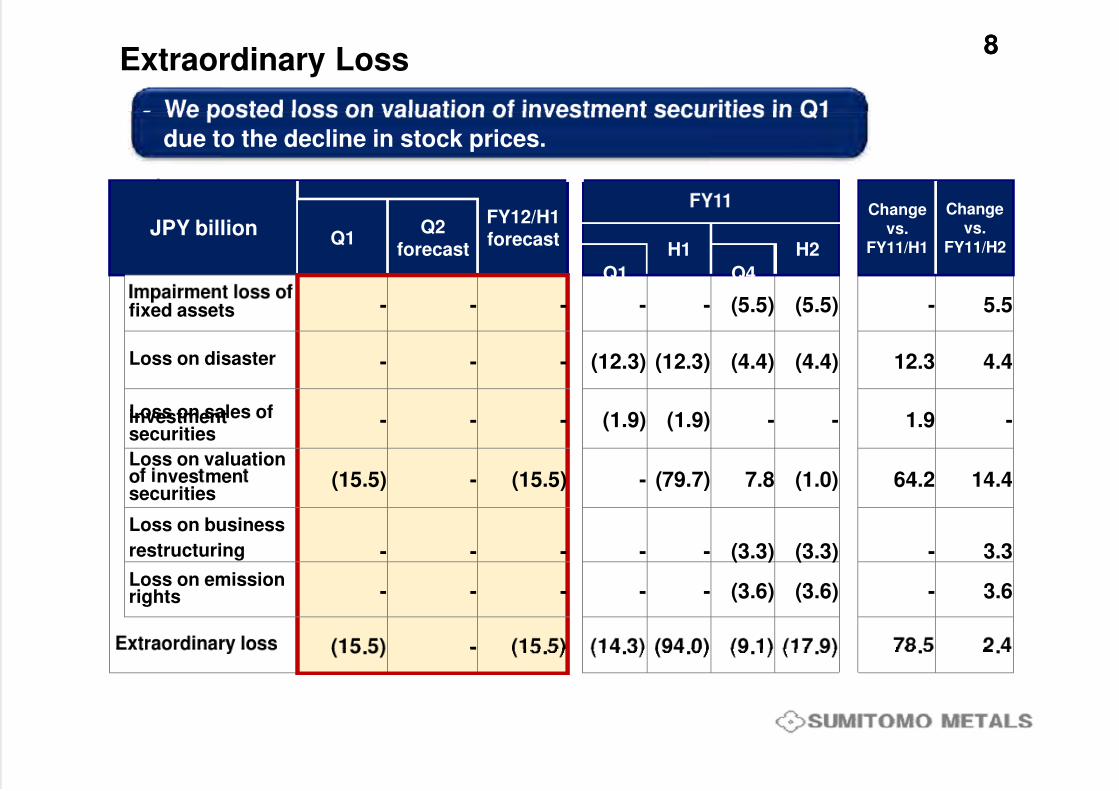
88Extraordinary Loss
- due to the decline in stock prices.
JPY billionFY12/H1forecast
Changevs.
FY11/H1
Changevs.
FY11/H2Q1
Q2forecast H1 H2
Q1 Q4
fixed assets - - - - - (5.5) (5.5) - 5.5
Loss on disaster - - - (12.3) (12.3) (4.4) (4.4) 12.3 4.4
Loss on sales ofinvestmentsecurities
- - - (1.9) (1.9) - - 1.9 -
Loss on valuationo nves mensecurities
(15.5) - (15.5) - (79.7) 7.8 (1.0) 64.2 14.4
Loss on business
restructuring - - - - - (3.3) (3.3) - 3.3
Loss on emissionrights - - - - - (3.6) (3.6) - 3.6
-. . . . . . . .
7/31/2019 Sumitomo Metals Q1presentation
http://slidepdf.com/reader/full/sumitomo-metals-q1presentation 9/28
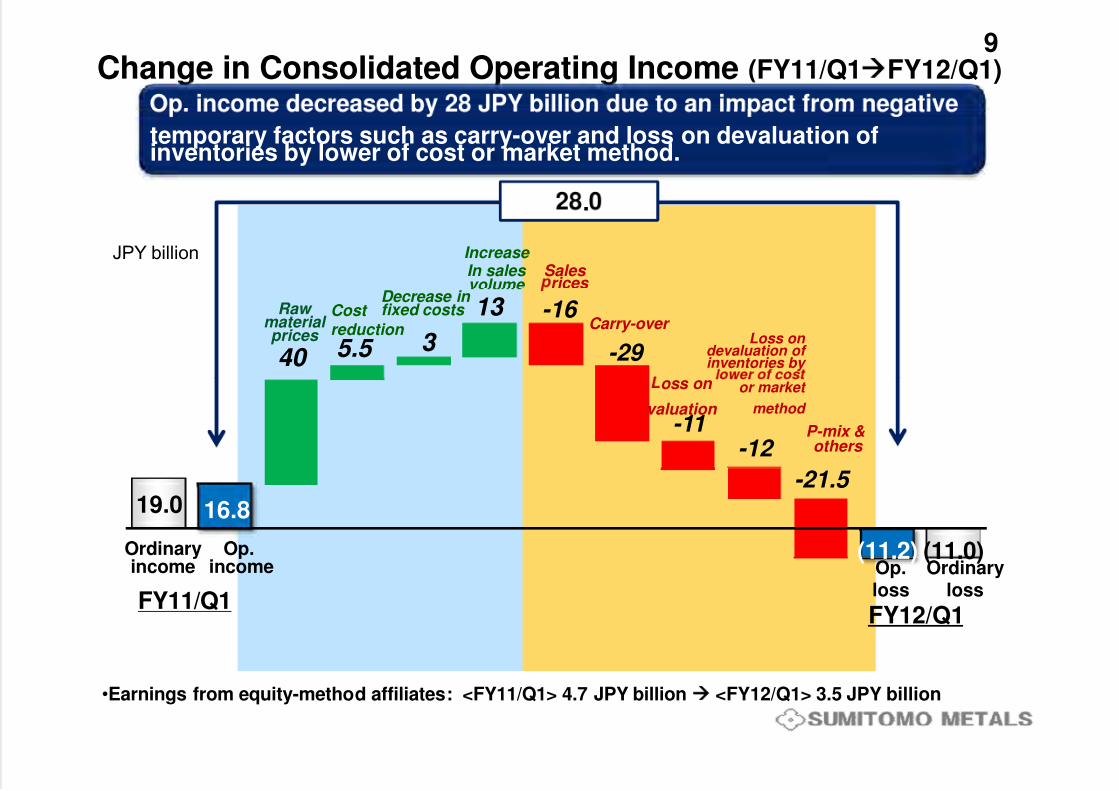
9Change in Consolidated Operating Income (FY11/Q1 FY12/Q1)
temporary factors such as carry-over and loss on devaluation ofinventories by lower of cost or market method.
.
JPY billion Increase In sales volume
Sales rices
40 5.5 3
13 -16
-29
Raw material prices
Cost reduction Carry-over
Decrease in fixed costs
Loss on devaluation of inventories by
-11-12
P-mix &others
oss on
valuation
or market
method
19.0
(11.0)
16.8
(11.2)
-21.5
Ordinary Op.
FY12/Q1FY11/Q1
Ordinaryloss
Op.loss
income income
•Earnings from equity-method affiliates: <FY11/Q1> 4.7 JPY billion <FY12/Q1> 3.5 JPY billion
7/31/2019 Sumitomo Metals Q1presentation
http://slidepdf.com/reader/full/sumitomo-metals-q1presentation 10/28
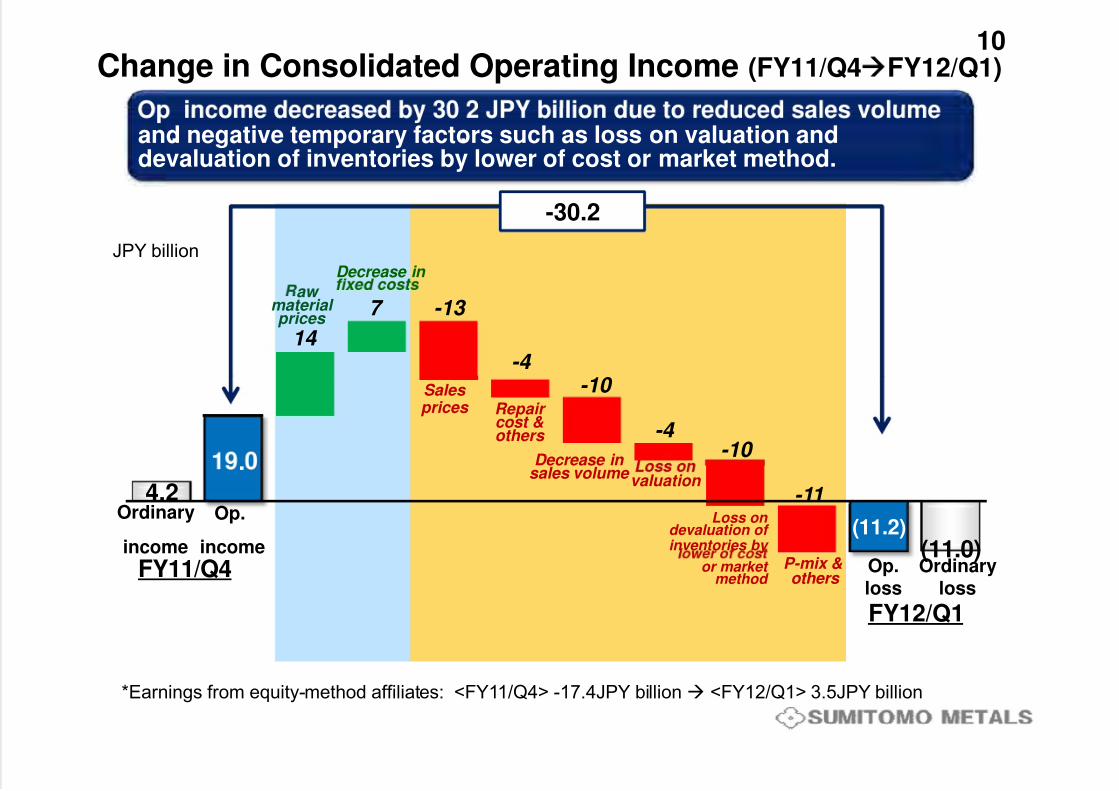
10Change in Consolidated Operating Income (FY11/Q4 FY12/Q1)
. .and negative temporary factors such as loss on valuation anddevaluation of inventories by lower of cost or market method.
-30.2
JPY billionDecrease in
14
7 -13
-4
aw material prices
-10
-10
-4
Sales prices Repair
cost &others
Decrease in
4.2
(11.0)
.
(11.2)
-11Ordinary
income
Op.
income
valuation
Loss on devaluation of inventories by
sales volume
FY12/Q1
FY11/Q4 Ordinaryloss
Op.loss
P-mix &others
or market
method
*Earnings from equity-method affiliates: <FY11/Q4> -17.4JPY billion <FY12/Q1> 3.5JPY billion
7/31/2019 Sumitomo Metals Q1presentation
http://slidepdf.com/reader/full/sumitomo-metals-q1presentation 11/28
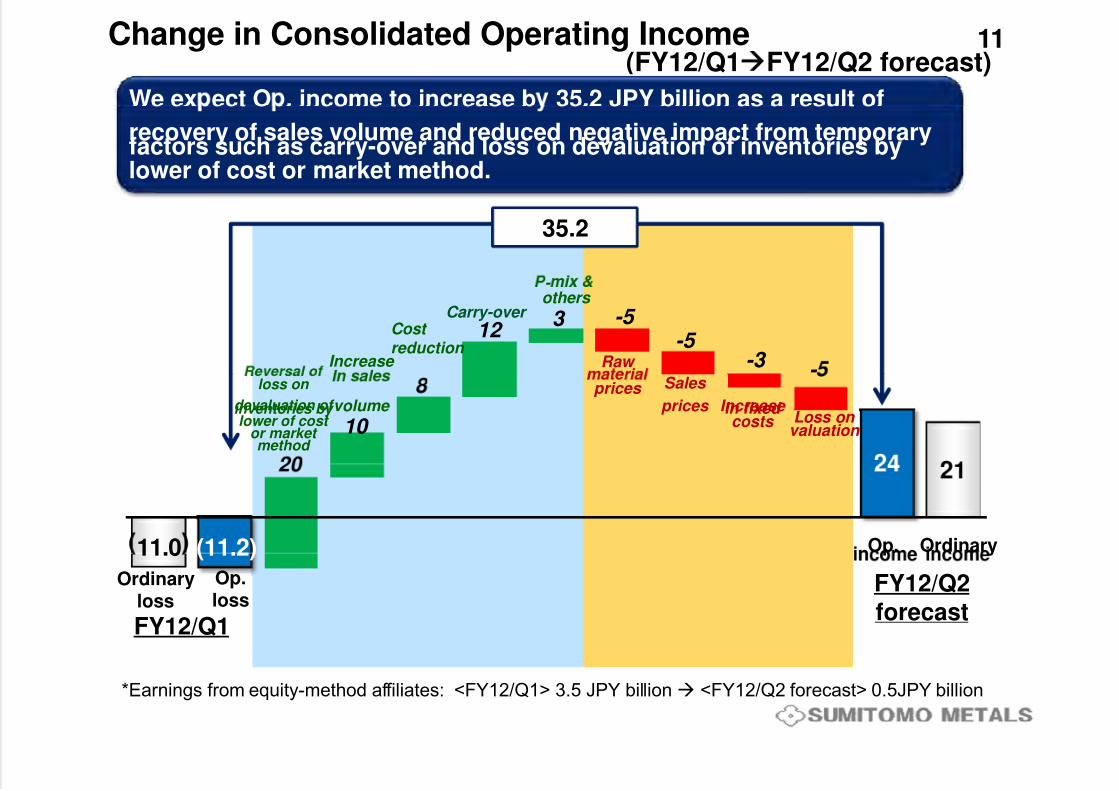
11Change in Consolidated Operating Income(FY12/Q1 FY12/Q2 forecast)
We ex ect O . income to increase b 35.2 JPY billion as a result of
recovery of sales volume and reduced negative impact from temporaryfactors such as carry-over and loss on devaluation of inventories bylower of cost or market method.
35.2
-
12 3 -5
-5 -3 - Raw
Cost reduction
Increase
others Carry-over
10
prices Sales
prices Loss on
valuation
Increase in fixed costs
volume
loss on
devaluation of inventories by lower of cost
or market method
11.0 (11.2) OrdinaryOp.
FY12/Q1
Ordinaryloss
Op.loss
FY12/Q2forecast
*Earnings from equity-method affiliates: <FY12/Q1> 3.5 JPY billion <FY12/Q2 forecast> 0.5JPY billion
7/31/2019 Sumitomo Metals Q1presentation
http://slidepdf.com/reader/full/sumitomo-metals-q1presentation 12/28
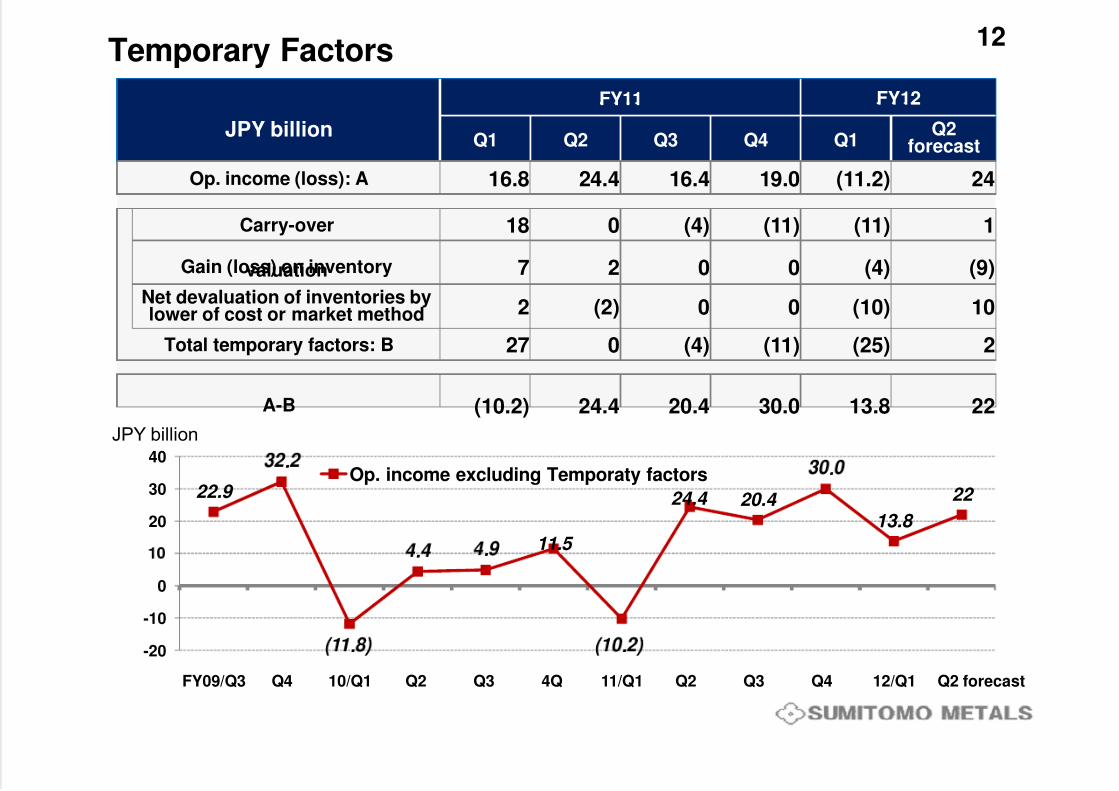
12Temporary Factors
FY11 FY12
JPY billionQ1 Q2 Q3 Q4 Q1
Q2forecast
Op. income (loss): A 16.8 24.4 16.4 19.0 (11.2) 24
Carry-over 18 0 (4) (11) (11) 1
Gain (loss) on inventoryvaluation 7 2 0 0 (4) (9)
Net devaluation of inventories bylower of cost or market method 2 (2) 0 0 (10) 10
Total temporary factors: B 27 0 (4) (11) (25) 2
A-B (10.2) 24.4 20.4 30.0 13.8 22
40
JPY billion
22.9
.
11.5
24.4 20.4
.
13.8
22
20
30Op. income excluding Temporaty factors
. .
-10
0
. .-20
FY09/Q3 Q4 10/Q1 Q2 Q3 4Q 11/Q1 Q2 Q3 Q4 12/Q1 Q2 forecast
7/31/2019 Sumitomo Metals Q1presentation
http://slidepdf.com/reader/full/sumitomo-metals-q1presentation 13/28
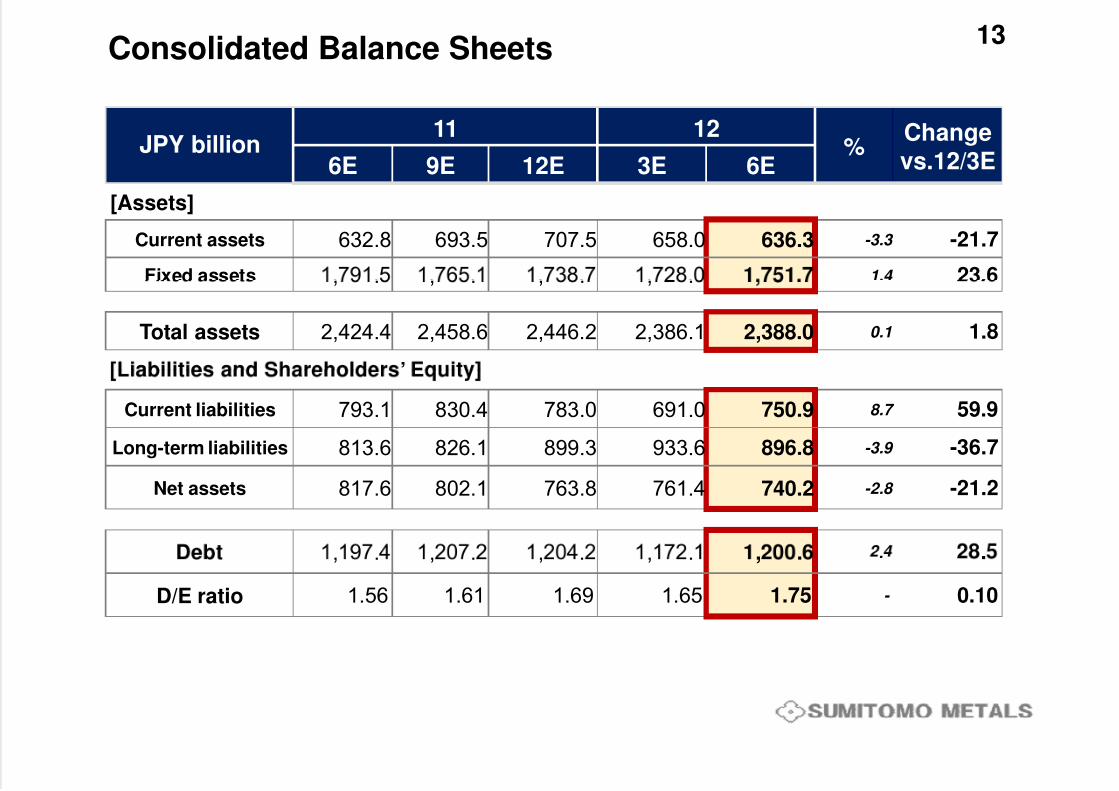
13Consolidated Balance Sheets
JPY billion11 12
%Changevs.12/3E6E 9E 12E 3E 6E
[Assets]
Current assets 632.8 693.5 707.5 658.0 636.3 -3.3 -21.7
Fixed assets 1.4 23.6, . , . , . , .
Total assets 2,424.4 2,458.6 2,446.2 2,386.1 2,388.0 0.1 1.8
’
Current liabilities 793.1 830.4 783.0 691.0 750.9 8.7 59.9
Long-term liabilities 813.6 826.1 899.3 933.6 896.8 -3.9 -36.7
Net assets 817.6 802.1 763.8 761.4 740.2 -2.8 -21.2
, . , . , . , . , . . .
D/E ratio 1.56 1.61 1.69 1.65 1.75 - 0.10
7/31/2019 Sumitomo Metals Q1presentation
http://slidepdf.com/reader/full/sumitomo-metals-q1presentation 14/28
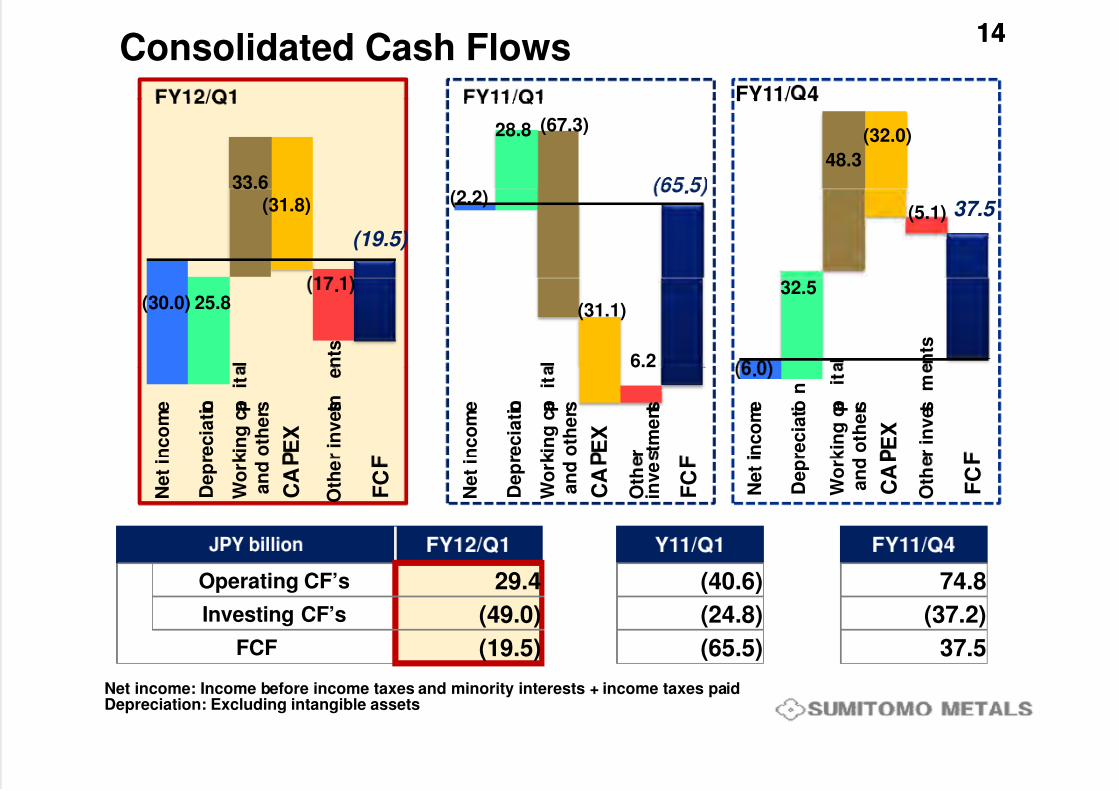
1414Consolidated Cash Flows
FY11/ 4
(67.3)28.8 (32.0)
48.3
33.6 .(2.2)
(5.1) 37.5
(19.5)
(31.8)
6.2
(31.1)
32.5.25.8(30.0)
n t s
l l n t s
l.
n c o m e
e c
i a t i o n
r i n v e s t m
e
E X
i n g c a p
i t
o t h e r s
n c o m e
e c
i a t i o n
r t m e n t s
E X
i n g c a p
i t
o t h e r s
n c o m e
r e c
i a t i o n
r i n v e s t m
E X
k i n g c a p
i t
o t h e r s
N e
t i
D e p
O t h e
F C
C A
W o r
a n
d
N e
t i
D e p
O t h
i n v e
F C
C A
W o r
a n
d
N e
t
D e p
O t h
F C
C A
W o r
a n
d
Operating CF’s 29.4 (40.6) 74.8
Investing CF’s (49.0) (24.8) (37.2)
FCF (19.5) (65.5) 37.5
Net income: Income before income taxes and minority interests + income taxes paidDepreciation: Excluding intangible assets
7/31/2019 Sumitomo Metals Q1presentation
http://slidepdf.com/reader/full/sumitomo-metals-q1presentation 15/28
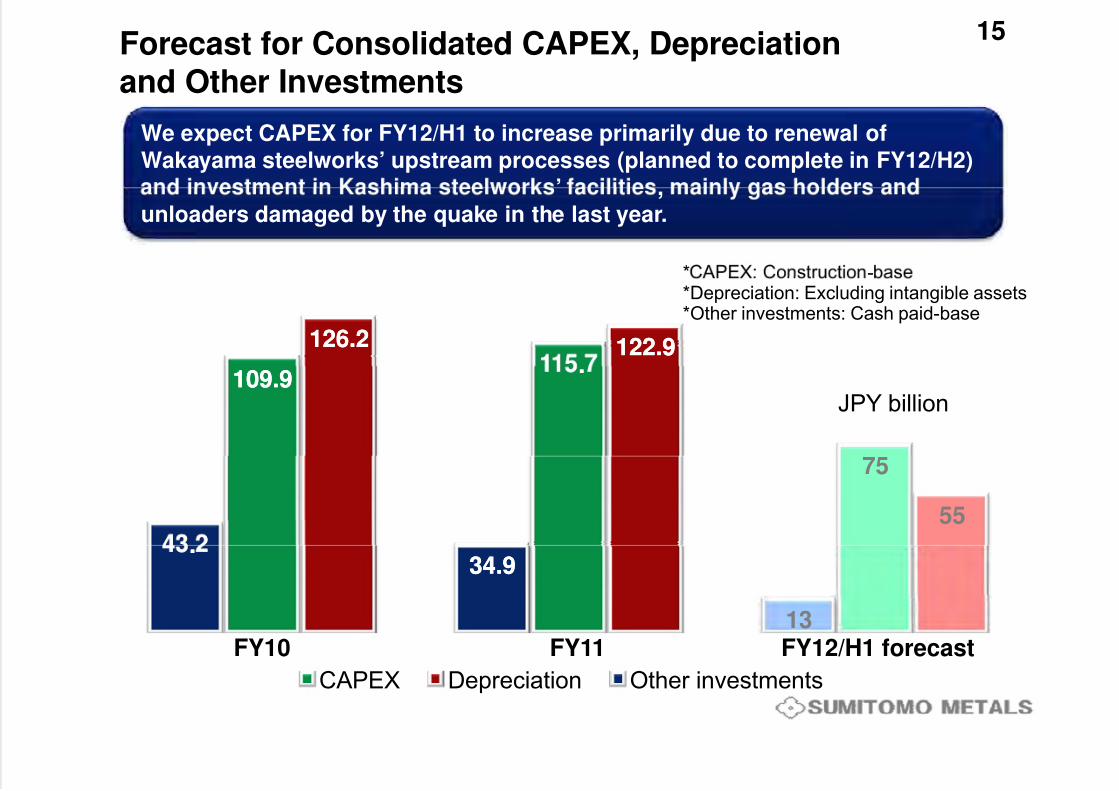
15Forecast for Consolidated CAPEX, Depreciationand Other Investments
We expect CAPEX for FY12/H1 to increase primarily due to renewal of
Wakayama steelworks’ upstream processes (planned to complete in FY12/H2)
’
* -
,unloaders damaged by the quake in the last year.
126.2126.2 122.9122.9
*Depreciation: Excluding intangible assets*Other investments: Cash paid-base
109.9109.9..
JPY billion
75
55
..34.934.9
13
CAPEX Depreciation Other investments
FY10 FY11 FY12/H1 forecast
7/31/2019 Sumitomo Metals Q1presentation
http://slidepdf.com/reader/full/sumitomo-metals-q1presentation 16/28
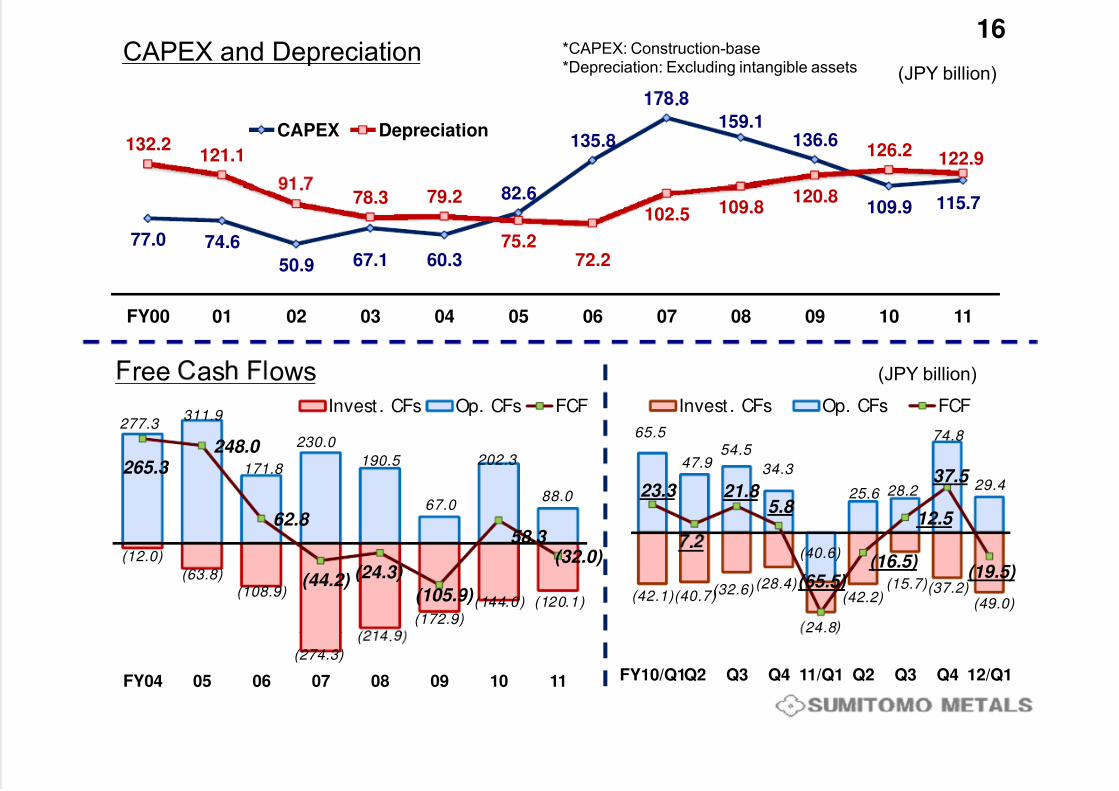
16CAPEX and Depreciation
(JPY billion)
*CAPEX: Construction-base*Depreciation: Excluding intangible assets
135.8
.
159.1136.6132.2
121.1 126.2 122.9
CAPEX Depreciation
77.0 74.6
50.9 67.1 60.3
82.6109.9 115.7
.78.3 79.2
75.272.2
102.5 109.8120.8
FY00 01 02 03 04 05 06 07 08 09 10 11
277.3 311.9
230.0 248.0
Invest . CFs Op. CFs FCF
65.5
54.5 74.8
Invest . CFs Op. CFs FCF
ree as ows (JPY billion)
171.8 190.5
67.0
202.3
88.0
265.3
62.8 58.3
47.9 34.3
25.6 28.2 29.4 23.3 21.8
5.8 12.5
37.5
(12.0)
(63.8)(108.9)
(172.9)(144.0) (120.1)
(44.2) (24.3)
(105.9)
(32.0) (40.6)
(42.1)(40.7)(32.6)(28.4)
24.8
(42.2)(15.7)(37.2)
(49.0)
.
(65.5) (16.5)
(19.5)
(274.3)
.
FY04 05 06 07 08 09 10 11 FY10/Q1Q2 Q3 Q4 11/Q1 Q2 Q3 Q4 12/Q1
7/31/2019 Sumitomo Metals Q1presentation
http://slidepdf.com/reader/full/sumitomo-metals-q1presentation 17/28
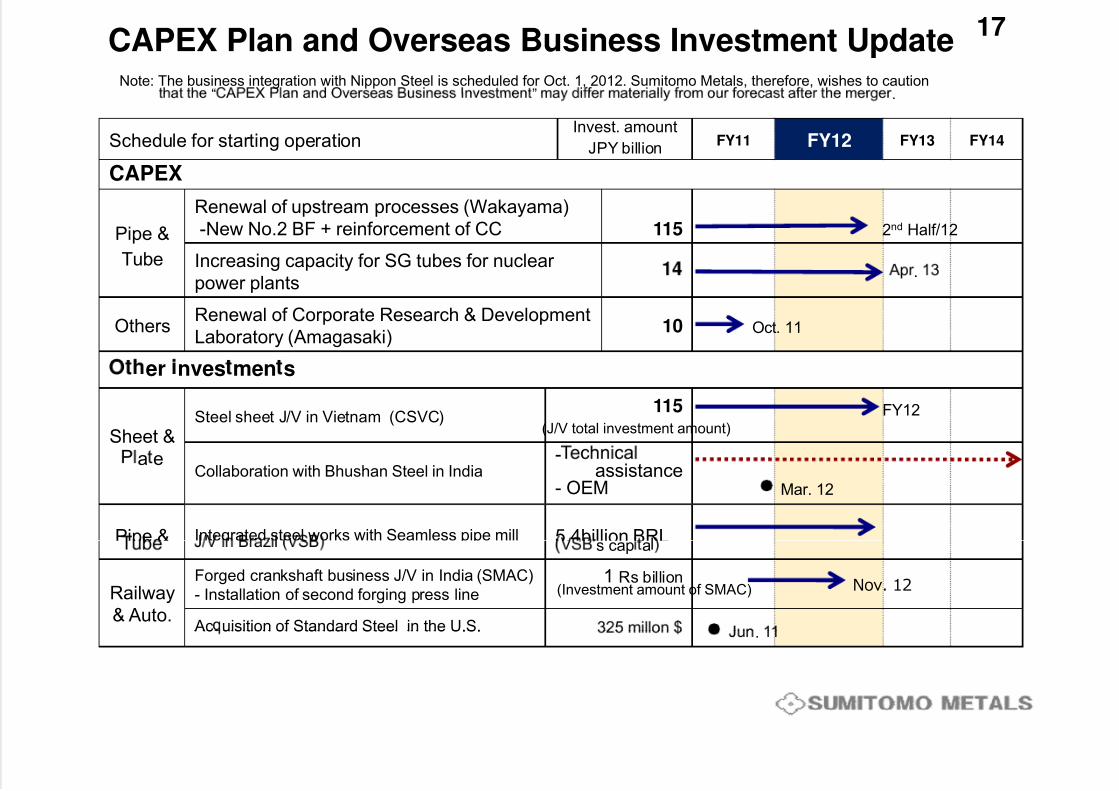
17CAPEX Plan and Overseas Business Investment Update
Note: The business integration with Nippon Steel is scheduled for Oct. 1, 2012. Sumitomo Metals, therefore, wishes to caution“ ”
Schedule for starting operationInvest. amount
JPY billionFY11 FY12 FY13 FY14
CAPEX
.
Pipe &
Tube
Renewal of upstream processes (Wakayama)-New No.2 BF + reinforcement of CC 115
Increasing capacity for SG tubes for nuclear
2nd Half/12
power plants
OthersRenewal of Corporate Research & DevelopmentLaboratory (Amagasaki)
10 Oct. 11
.
er nves men s
Sheet &Steel sheet J/V in Vietnam (CSVC)
115(J/V total investment amount)
FY12
a eCollaboration with Bhushan Steel in India
-assistance
- OEM
Pipe & Integrated steel works with Seamless pipe mill 5.4billion BRL’
Mar. 12
s cap a
Railway& Auto.
Forged crankshaft business J/V in India (SMAC)- Installation of second forging press line
1 Rs billion
Ac uisition of Standard Steel in the U.S.
(Investment amount of SMAC) Nov. 12
. . .
7/31/2019 Sumitomo Metals Q1presentation
http://slidepdf.com/reader/full/sumitomo-metals-q1presentation 18/28
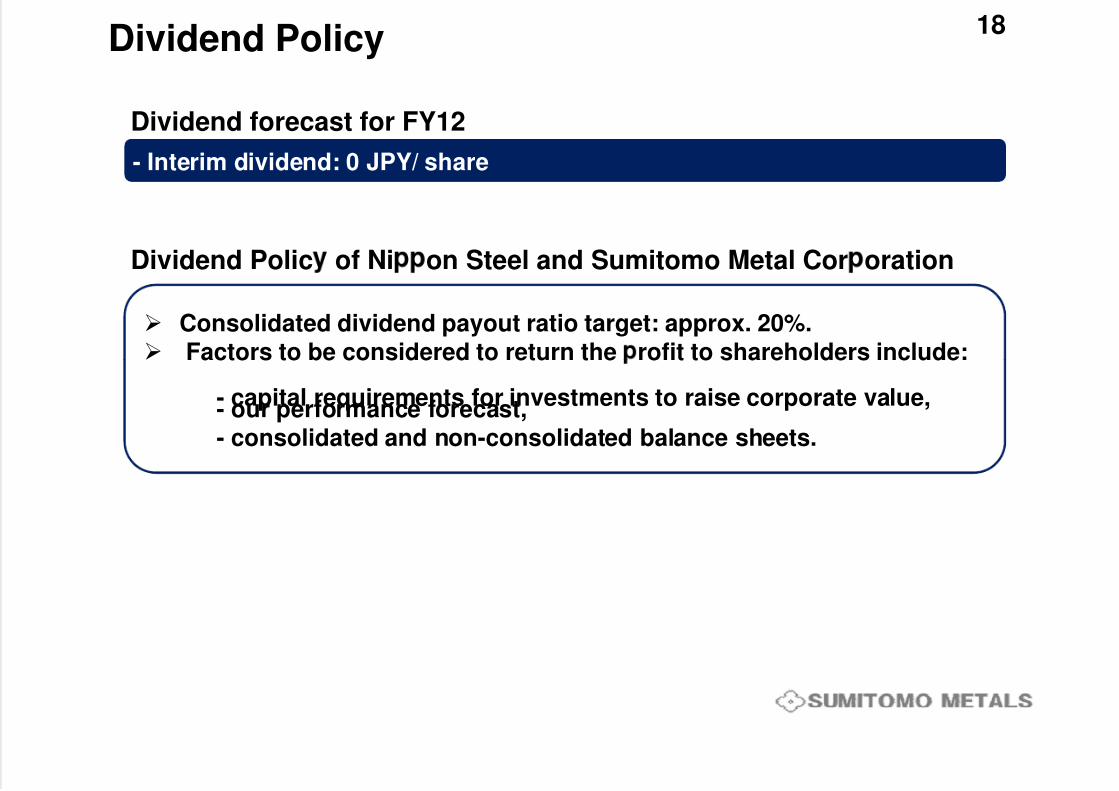
18Dividend Policy
Dividend forecast for FY12
- Interim dividend: 0 JPY/ share- Interim dividend: 0 JPY/ share
Dividend Polic of Ni on Steel and Sumitomo Metal Cor oration
Consolidated dividend payout ratio target: approx. 20%. Factors to be considered to return the rofit to shareholders include:
- capital requirements for investments to raise corporate value,- our performance forecast,- consolidated and non-consolidated balance sheets.
7/31/2019 Sumitomo Metals Q1presentation
http://slidepdf.com/reader/full/sumitomo-metals-q1presentation 19/28
19
7/31/2019 Sumitomo Metals Q1presentation
http://slidepdf.com/reader/full/sumitomo-metals-q1presentation 20/28
20
JPY billionFY12/H1
FY11 FY11 Changevs.
Changevs.Q2
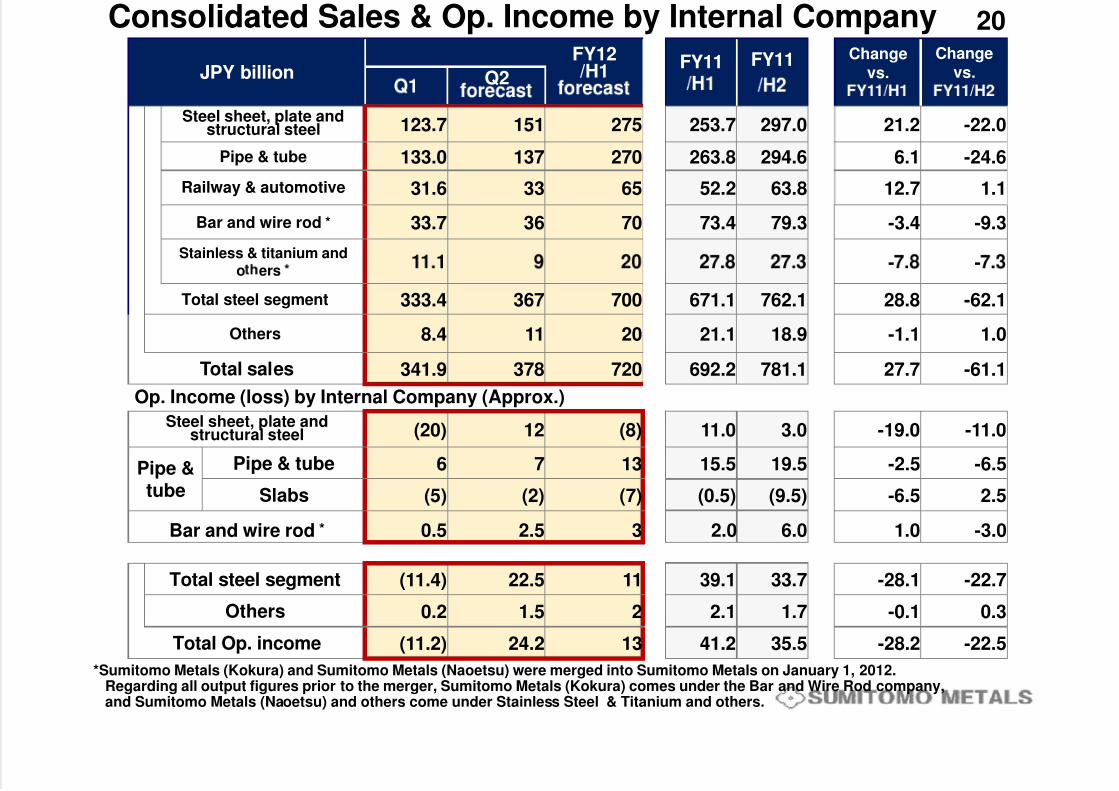
Consolidated Sales & Op. Income by Internal Company
Steel sheet, plate andstructural steel 123.7 151 275 253.7 297.0 21.2 -22.0
Pipe & tube 133.0 137 270 263.8 294.6 6.1 -24.6
Railway & automotive 31.6 33 65 52.2 63.8 12.7 1.1
Bar and wire rod * 33.7 36 70 73.4 79.3 -3.4 -9.3
Stainless & titanium and- -o ers
Total steel segment 333.4 367 700 671.1 762.1 28.8 -62.1
Others 8.4 11 20 21.1 18.9 -1.1 1.0
Total sales 341.9 378 720 692.2 781.1 27.7 -61.1
Op. Income (loss) by Internal Company (Approx.)
Steel sheet, plate andstructural steel (20) 12 (8) 11.0 3.0 -19.0 -11.0
Pipe &tube
Pipe & tube 6 7 13 15.5 19.5 -2.5 -6.5
Slabs (5) (2) (7) (0.5) (9.5) -6.5 2.5
Bar and wire rod * 0.5 2.5 3 2.0 6.0 1.0 -3.0
Total steel segment (11.4) 22.5 11 39.1 33.7 -28.1 -22.7
Others 0.2 1.5 2 2.1 1.7 -0.1 0.3
Total Op. income (11.2) 24.2 13 41.2 35.5 -28.2 -22.5
*Sumitomo Metals (Kokura) and Sumitomo Metals (Naoetsu) were merged into Sumitomo Metals on January 1, 2012.Regarding all output figures prior to the merger, Sumitomo Metals (Kokura) comes under the Bar and Wire Rod company,and Sumitomo Metals (Naoetsu) and others come under Stainless Steel & Titanium and others.
7/31/2019 Sumitomo Metals Q1presentation
http://slidepdf.com/reader/full/sumitomo-metals-q1presentation 21/28
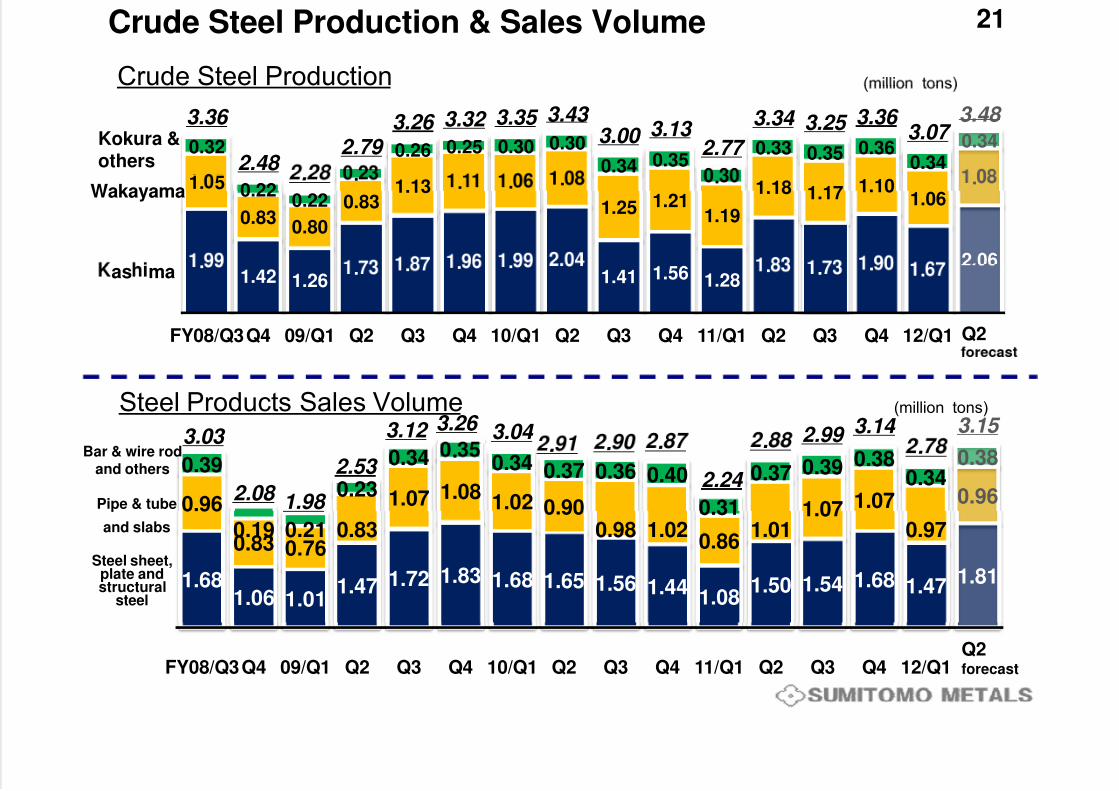
21Crude Steel Production & Sales Volume
Crude Steel Production
0.32 0.26 0.25 0.30 0.30
0.34 0.350.33 0.35 0.36
0.340.34
3.36
2.48 2.79
3.26 3.32 3.35 3.43 3.00 3.13
2.77
3.34 3.25 3.36 3.07
3.48 Kokura &others
2.06
1. 5
0.830.80
0.831.13 . . .
1.25 1.211.19
1.18 1.17 1.101.06
.0.22
0.22
. ..Wakayama
.1.42 1.26
. . . .1.41 1.56 1.28
. . . .
FY08/Q3Q4 09/Q1 Q2 Q3 Q4 10/Q1 Q2 Q3 Q4 11/Q1 Q2 Q3 Q4 12/Q1
as ma
Q2
3.03 3.12 3.26 3.04 2.99 3.14 3.15 (million tons)Steel Products Sales Volume
0.96
0.83
1.07 1.081.02 0.90
0.98 1.02 1.011.07 1.07
0.97
0.96
0.39
0.19 0.21
0.23
0.34 .0.34 0.37 0.36 0.40
0.31
0.37 0.39 0.380.34
0.38
2.08 1.98
2.53 . . .
2.24
. .
Pipe & tube
and slabs
Bar & wire rodand others
1.681.06 1.01
1.47 1.72 1.83 1.68 1.65 1.56 1.441.08
1.50 1.54 1.68 1.47 1.81
0.83 0.76 0.86Steel sheet,
plate andstructural
steel
FY08/Q3Q4 09/Q1 Q2 Q3 Q4 10/Q1 Q2 Q3 Q4 11/Q1 Q2 Q3 Q4 12/Q1Q2forecast
7/31/2019 Sumitomo Metals Q1presentation
http://slidepdf.com/reader/full/sumitomo-metals-q1presentation 22/28
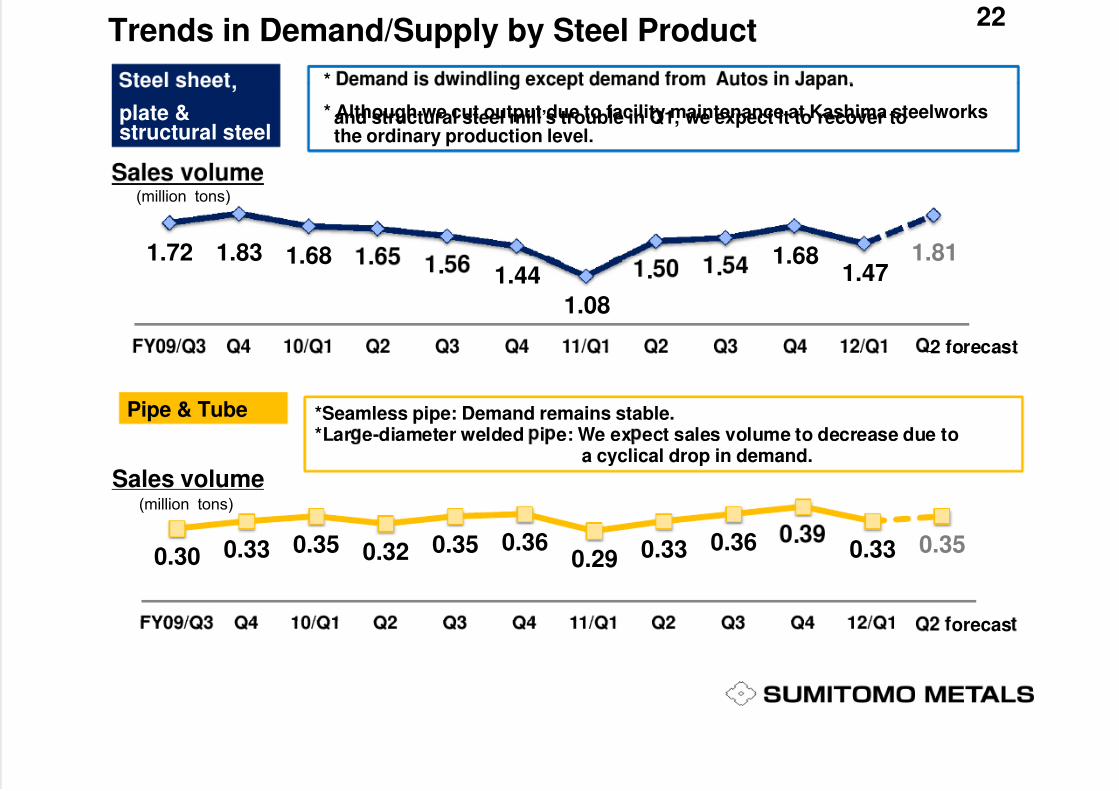
22Trends in Demand/Supply by Steel Product
* .
* Although we cut output due to facility maintenance at Kashima steelworksand structural steel mill’s trouble in Q1, we expect it to recover tothe ordinary production level.
,
plate &structural steel
1.72 1.83 1.68 1.68 1.81
(million tons)
. 1.44
1.08
. . 1.47
2 forecast
*Seamless pipe: Demand remains stable.*Lar e-diameter welded i e: We ex ect sales volume to decrease due to
Pipe & Tube
a cyclical drop in demand.
Sales volume(million tons)
0.30 0.33 0.35 0.32 0.35 0.360.29 0.33 0.36 .
0.33 0.35
orecas
7/31/2019 Sumitomo Metals Q1presentation
http://slidepdf.com/reader/full/sumitomo-metals-q1presentation 23/28
23Trends in Demand/Supply by Steel Product
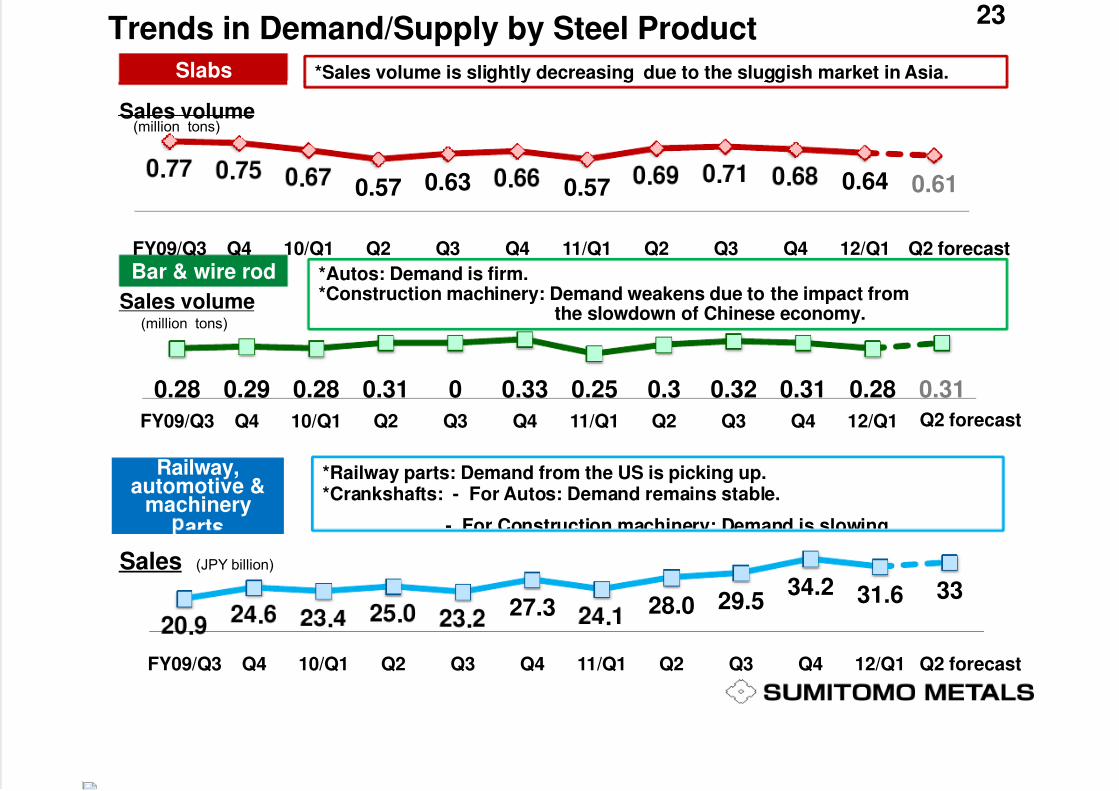
*Sales volume is slightly decreasing due to the sluggish market in Asia.Slabs
Sales volume(million tons)
. . . 0.57 0.63 . 0.57 . . . 0.64 0.61
FY09/Q3 Q4 10/Q1 Q2 Q3 Q4 11/Q1 Q2 Q3 Q4 12/Q1 Q2 forecast
*Autos: Demand is firm.*Construction machinery: Demand weakens due to the impact from
the slowdown of Chinese economy.
Bar & wire rod
Sales volume(million tons)
0.28 0.29 0.28 0.31 0 0.33 0.25 0.3 0.32 0.31 0.28 0.31
FY09/Q3 Q4 10/Q1 Q2 Q3 Q4 11/Q1 Q2 Q3 Q4 12/Q1 Q2 forecast
*Railway parts: Demand from the US is picking up.*Crankshafts: - For Autos: Demand remains stable.
- For Construction machinery: Demand is slowing.
Railway,automotive &
machineryarts
27.3 28.0 29.534.2 31.6 33
Sales (JPY billion)
. . . . . .
FY09/Q3 Q4 10/Q1 Q2 Q3 Q4 11/Q1 Q2 Q3 Q4 12/Q1 Q2 forecast
7/31/2019 Sumitomo Metals Q1presentation
http://slidepdf.com/reader/full/sumitomo-metals-q1presentation 24/28
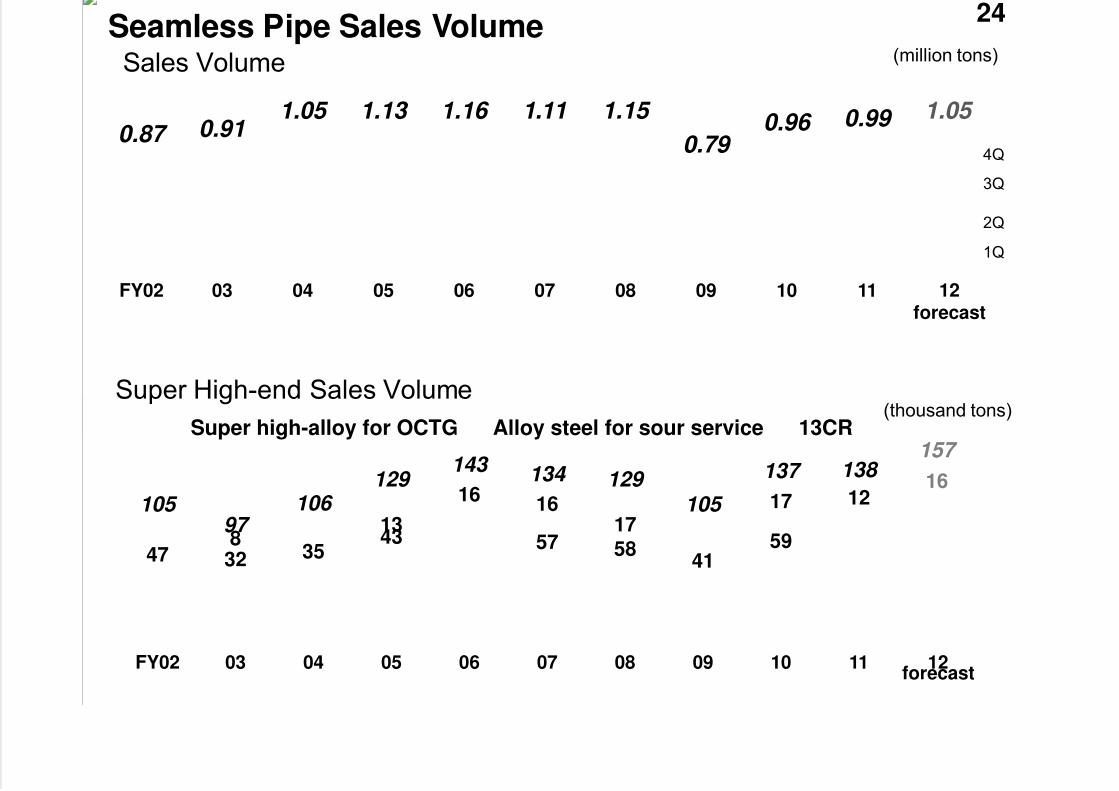
24Seamless Pipe Sales Volume
Sales Volume (million tons)
0.29 0.28 0.280.26
0.87 0.911.05 1.13 1.16 1.11 1.15
0.79 0.96 0.99 1.05
4Q
0.30 0.29 0.30
0.170.23 0.25 0.28
. 0.28 0.31
0.20.23 0.260.23 3Q
2Q
1Q. . . . . .
FY02 03 04 05 06 07 08 09 10 11 12forecast
Super high-alloy for OCTG Alloy steel for sour service 13CR
Super High-end Sales Volume(thousand tons)
13
16 1617
17 1216
105 97
106 129
143 134 129 105
137 138 157
54 57 63 73 8861 54 51 61 66 70
47 32 3543 57 58
41598
FY02 03 04 05 06 07 08 09 10 11 12forecast
7/31/2019 Sumitomo Metals Q1presentation
http://slidepdf.com/reader/full/sumitomo-metals-q1presentation 25/28
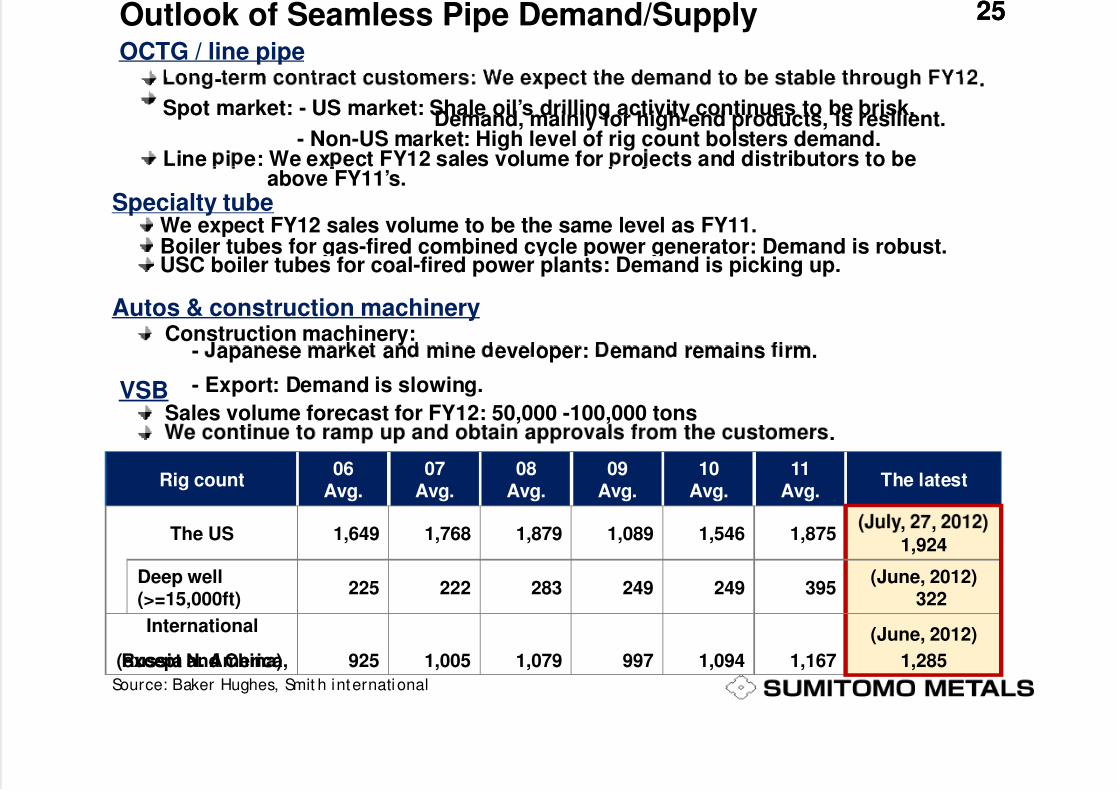
2525Outlook of Seamless Pipe Demand/SupplyOCTG / line pipe
- .
Spot market: - US market: Shale oil’s drilling activity continues to be brisk.Demand, mainly for high-end products, is resilient.
- Non-US market: High level of rig count bolsters demand.Line i e: We ex ect FY12 sales volume for ro ects and distributors to be
Specialty tubeabove FY11’s.
We expect FY12 sales volume to be the same level as FY11.Boiler tubes for gas-fired combined cycle power generator: Demand is robust.
Autos & construction machinery
USC boiler tubes for coal-fired power plants: Demand is picking up.
Construction machinery:
VSB
- apanese mar e an m ne eve oper: eman rema ns rm.
- Export: Demand is slowing.
Sales volume forecast for FY12: 50,000 -100,000 tons
Rig count06
Avg.07
Avg.08
Avg.09
Avg.10
Avg.11
Avg.The latest
.
The US 1,649 1,768 1,879 1,089 1,546 1,875, ,1,924
Deep well(>=15,000ft)
225 222 283 249 249 395(June, 2012)
322
International
(except N. America,Russia and China) 925 1,005 1,079 997 1,094 1,167
(June, 2012)
1,285
Source: Baker Hughes, Smit h international
26
7/31/2019 Sumitomo Metals Q1presentation
http://slidepdf.com/reader/full/sumitomo-metals-q1presentation 26/28
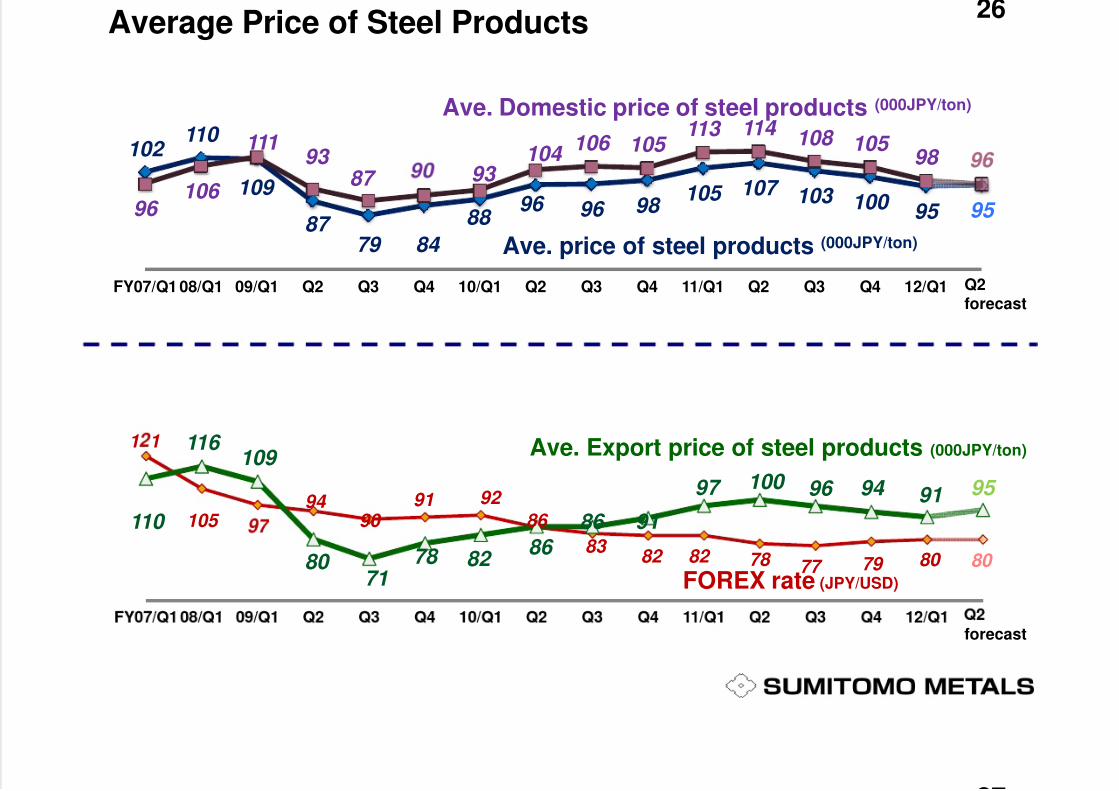
26Average Price of Steel Products
102 110 111
93 104 106 105
113 114 108 105 9 8
Ave. Domestic price of steel products (000JPY/ton)
109
87 79 84
88 96 96 98
105 107 103 100 95 95 96 106
87 93
Ave. price of steel products (000JPY/ton)
FY07/Q1 08/Q1 09/Q1 Q2 Q3 Q4 10/Q1 Q2 Q3 Q4 11/Q1 Q2 Q3 Q4 12/Q1 Q2forecast
1 1
105 94
90 91 92
86 110
116 109
86 91
97 100 96 94 91 95
Ave. Export price of steel products (000JPY/ton)
83 82 82 78 77 79 80 80 80
7178 82
86
FOREX rate (JPY/USD)
forecast
27
7/31/2019 Sumitomo Metals Q1presentation
http://slidepdf.com/reader/full/sumitomo-metals-q1presentation 27/28
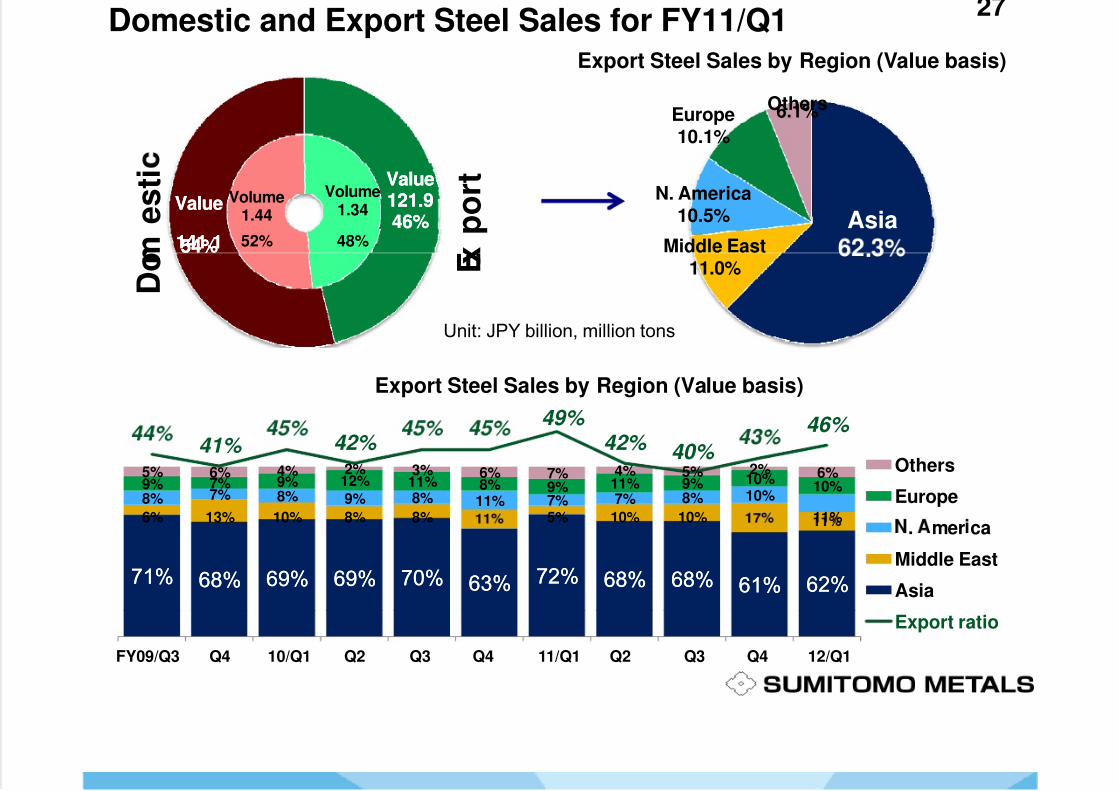
27Domestic and Export Steel Sales for FY11/Q1
Export Steel Sales by Region (Value basis)
Others6.1%Europe10.1%
Volume1.34
48%
Volume1.44
52%
ValueValue121.9121.946%46%
ValueValue
141.1141.154%54%
AsiaMiddle East
N. America10.5%
m
e s
t i
x p o r t
.11.0%
Unit: JPY billion, million tons
D o E
49% 46%
Export Steel Sales by Region (Value basis)
6% 13% 10% 8% 8% 5% 10% 10%
8% 7% 8% 9% 8% 11% 7% 7% 8% 10%
11%
9% 7% 9% 12% 11% 8% 9% 11% 9% 10%10%
5% 6% 4% 2% 3% 6% 7% 4% 5% 2% 6%
41% 42% 42% 40% Others
Europe
71%71% 68%68% 69%69% 69%69% 70%70% 63%63% 72%72% 68%68% 68%68% 61%61% 62%62%
. mer ca
Middle East
Asia
FY09/Q3 Q4 10/Q1 Q2 Q3 Q4 11/Q1 Q2 Q3 Q4 12/Q1
Export ratio
28
7/31/2019 Sumitomo Metals Q1presentation
http://slidepdf.com/reader/full/sumitomo-metals-q1presentation 28/28
28
October 1 2012October 1 2012NIPPON STEEL & SUMITOMO METAL CORPORATIONNIPPON STEEL & SUMITOMO METAL CORPORATION
Aim to be the Best SteelmakerAim to be the Best Steelmaker