Embed Size (px)
Citation preview
1
Network Effects in Multimodal Intercity Transport System Turkish HSR Development Case
Huseyin TIRTOM a, Hiromichi YAMAGUCHI b, Makoto OKUMURA c, a,b Graduate School of Engineering, Tohoku University ,Sendai, 980-8577, Japan a E-mail: [email protected] b E-mail: [email protected] c International Research Institute of Disaster Science, Tohoku University, Sendai,
980-8577,Japan; E-mail:[email protected] Abstract: Naturally, transport projects require substantial funds and take years to complete. Under time and budget constraints, planning agencies try to prioritize projects to get the maximum public welfare increase, generally by using benefit cost ratio comparison. However, studies imply that when two or more projects are implemented, total impact of projects is not simply the sum of the impact of individual projects but also includes a network effect which is related to competitive or complementary interaction of links in the network. Therefore, it is important to take network effects into account in national assessment of projects. Object of this study is to analyze those network effects in HSR development projects of Turkey. Optimal modal-mix planning model was applied to Turkish intercity network to find out optimal link frequencies. Project impact is measured as the improvement in the total generalized cost to passengers versus project cost. Results indicate that network effects can be significant and it is useful to include them in the project assessment process. Keywords: multimodal, intercity passenger, network analysis, MILP 1. INTRODUCTION Generally, transport agencies are tasked to select most efficient infrastructure projects to be implemented among several appealing projects under a budget limitation. Because of the long construction duration and interdependency of transport projects they also need to arrange construction order carefully to get maximum benefit for the society. To be able to perform this task, many agencies especially in developing countries depend on the classical cost benefit analysis (CBA) comparison. CBA considers a range of benefits and costs, and translates them into monetary terms by using appropriate unit valuation factors derived from actual cost or willingness-to-pay estimates (Schutte and Brits, 2012). In its classical form CBA deals individual projects with isolation and does not consider spillover or network effects. However, studies imply that when two or more projects are implemented, total impact of projects is not simply the sum of the impact of individual projects but also includes a network effect which is related to competitive or complementary interaction of links in the network (Exel et al, 2002). Therefore, it is important to take transport network effects (TNEs) into account in national assessment of projects. Aim of this study is to investigate the existence of TNEs in HSR development projects of Turkey considering multimodal journeys. Optimal modal-mix planning model was applied to Turkish intercity network to find out optimal link frequencies. Project impact was measured as the improvement in the total generalized cost to passengers versus project cost. The paper is organized as follows. In Section 2, we give a short background to the TNEs. In
2
Section 3, optimal modal-mix planning model is explained. In Section 4, study network and used data are explained. Analysis of transport network effects and results are discussed in Section 5. 2. BACKGROUND For this study, we adopt the definition of transport network effects of Laird et al (2003) as: “Transport network effects (TNEs) are the changes that occur on the transport network (trip patterns, volumes, travel times, etc.) that are the effect of interactions between conditions in one part of the network and another part.” For example, a road investment project may have the impacts such as; increase demand on complementary links, decrease demand on competitive links, change the OD demand pattern or change the modal share in the network. Furthermore, transport network effects are categorized in two groups as direct and indirect effects (Mackie et al, 2001). Direct TNEs are changes in the travel behavior by the change of generalized cost of travel while indirect TNEs are changes in travel behavior caused by the wider economic impacts on other sectors. Therefore, land use changes need to be included in the measurement of the indirect TNEs while direct TNEs can be measured by pure transport models (Laird et al, 2003). While it is accepted within the literature that direct transport effects are important for the evaluation of transport projects, generally, they are still neglected in practice. But, their exclusion in appraisal process can lead to underestimation or overestimation of total project impacts (Laird et al, 2005). As Laird et al (2003) demonstrated in conceptual level, if the network or link that is excluded from the transport CBA (TCBA) is congestible and is complementary to the new transport project, then the TCBA will overestimate the economic impact. If, however, the new transport infrastructure acts as a substitute for the excluded and congested part of the transport network then the TCBA will underestimate the economic impact. In order to provide a better assessment tool for of large scale, interregional or multinational transport projects, there is a growing interest towards using the concept of transport network effects. In one of the earlier studies, Exel et al (2002) defines the network effects as “the traffic distributive and generative impacts of a localized change (e.g. a new road link) that appear on interconnected networks (road, rail, airport, etc.) and resulting spatial distribution of economic activities as the result of the re-distribution of traffic within and across the different networks.” They argue that for Trans-European Network projects it is possible to measure network effects at European level and these effects can be used for better justification of projects especially for cross border projects which in some cases may provide more benefit to the neighboring countries rather than the project country. Laird et al (2005) provide very detailed analysis on network effects phenomena. They review the concept of network effects; relate them to transport appraisal practice, and link to the concept of total economic impact. They suggest that if projects are to be implemented simultaneously or sequentially, the correct appraisal should account for all interactions between projects including network effects. Vickerman (2007) mentions network effects in the scope of problems with cost benefit
3
analysis in the appraisal of large-scale infrastructure projects. He draws attention to the negative network effects and states that network effects should not be used as a convenient way of trying to boost the benefits from a project which is failing to deliver a sufficiently attractive benefit cost ration. Gutiérrez et al (2010) tries to measure and monetize spatial spillovers (including network effects) of transport infrastructure investment according to the regional distribution of the potential accessibility benefits using accessibility analyses and GIS. They suggested that network effects can be detected with a twofold consideration: identifying the geographical dimension of the effects of new transport infrastructure investment in those regions that are affected by these new infrastructures; and determining the grade or intensity of these effects. In a more recent study, Bataille and Steinmetz (2013) have analyzed network effects in the context of intermodal competition between inter urban buses and railways. They showed that external effects of individual routes of the network are fundamental for the profitability of the network as a whole. That is because, under the assumption that a network is operated by the same operator, some links act as feeder lines and even if they are unprofitable they play crucial role for the profitability of whole network. Therefore, efficient intermodal competition on those links might cause the abandoning of other routes that are not facing any competition.
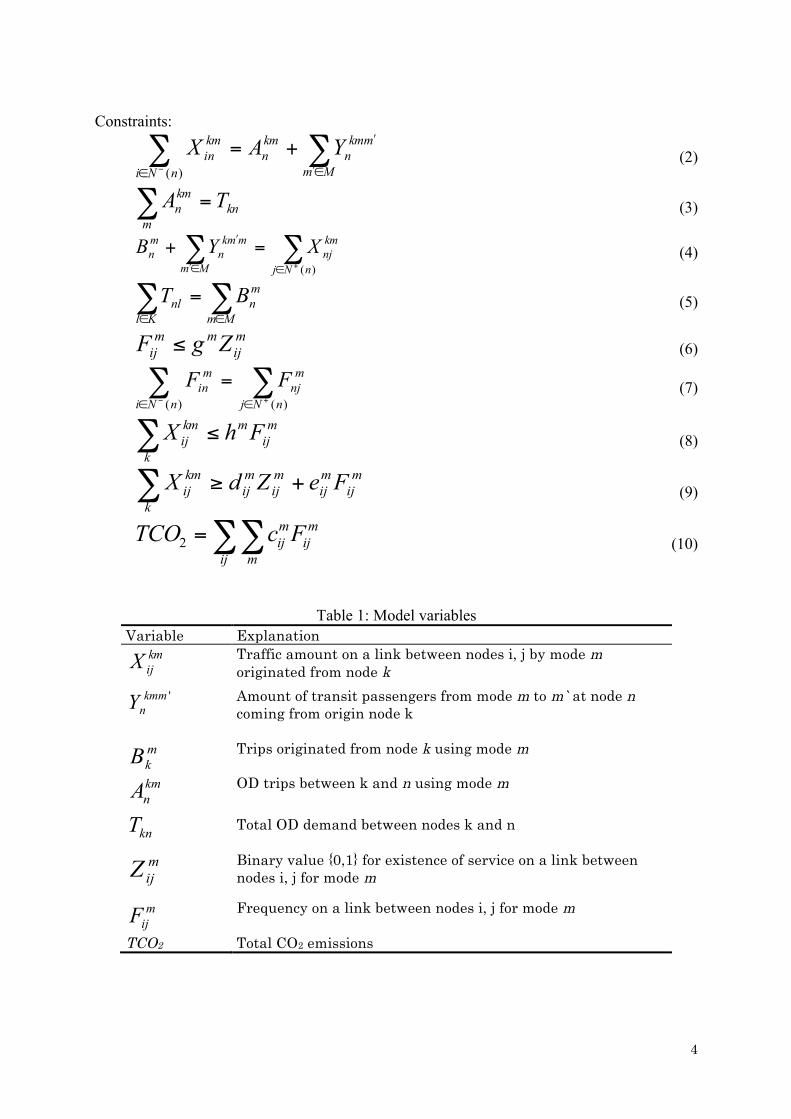
3. MODEL In this study, project impact was measured as the improvement in the total generalized cost to passengers versus project cost. Calculating link frequencies and passenger numbers on each link were necessary for measuring generalized cost change before and after the realization of a project. Therefore, optimal modal-mix planning model, developed by Okumura et al. (2012) was used to find out optimal link frequencies and passenger numbers. The model determines the most effective network link frequencies and the number of passengers assigned to support the service, and it is formulated as a mixed integer linear programming model which tries to minimize a linear function subject to several linear constraints similar to Chang et al. (2000). Although, the original model permits more than one objective function, minimizing total generalized cost to users was considered as the only objective function in this study. It is the summation of link fare, link travel time and transfer time as expressed in Equation (1). Equations (2)-(5) show the constraints to preserve the traffic amount while Equations (6)-(8) show the constraints for incoming and outgoing frequencies to prevent exceeding link users than link capacity. Equation (9) is the sustainability condition and it states that in order to provide a service on a link, certain number of passengers are necessary to cover operating costs. Finally, Equation (10) gives the calculation of total CO2 emissions in the network. Variables and parameters of resulting MILP model are explained in Table 1 and Table 2. This model was constructed and solved by R using lpSolve package, an open source mixed integer programming tool. Objective function:
`
, , , , ,min ( )m m mm
ij ij nX Y B A Z F ij mf vt vτ+ +∑∑ (1)
4
Constraints:
∑ ∑−∈ ∈ʹ′
ʹ′+=)(nNi Mm
mkmn
kmn
kmin YAX (2)
∑ =m
knkmn TA (3)
∑∑+∈∈ʹ′
ʹ′ =+)(nNj
kmnj
Mm
mmkn
mn XYB (4)
∑∑∈∈
=Mm
mn
Klnl BT (5)
mij
mmij ZgF ≤ (6)
∑ ∑− +∈ ∈
=)( )(nNi nNj
mnj
min FF (7)
∑ ≤k
mij
mkmij FhX (8)
∑ +≥k
mij
mij
mij
mij
kmij FeZdX (9)
2m mij ij
ij mTCO c F=∑∑ (10)
Table 1: Model variables Variable Explanation
kmijX
Traffic amount on a link between nodes i, j by mode m originated from node k
'kmmnY Amount of transit passengers from mode m to m` at node n
coming from origin node k
mkB
Trips originated from node k using mode m
kmnA
knT
OD trips between k and n using mode m
Total OD demand between nodes k and n
mijZ
Binary value {0,1} for existence of service on a link between nodes i, j for mode m
mijF
Frequency on a link between nodes i, j for mode m
TCO2 Total CO2 emissions
5
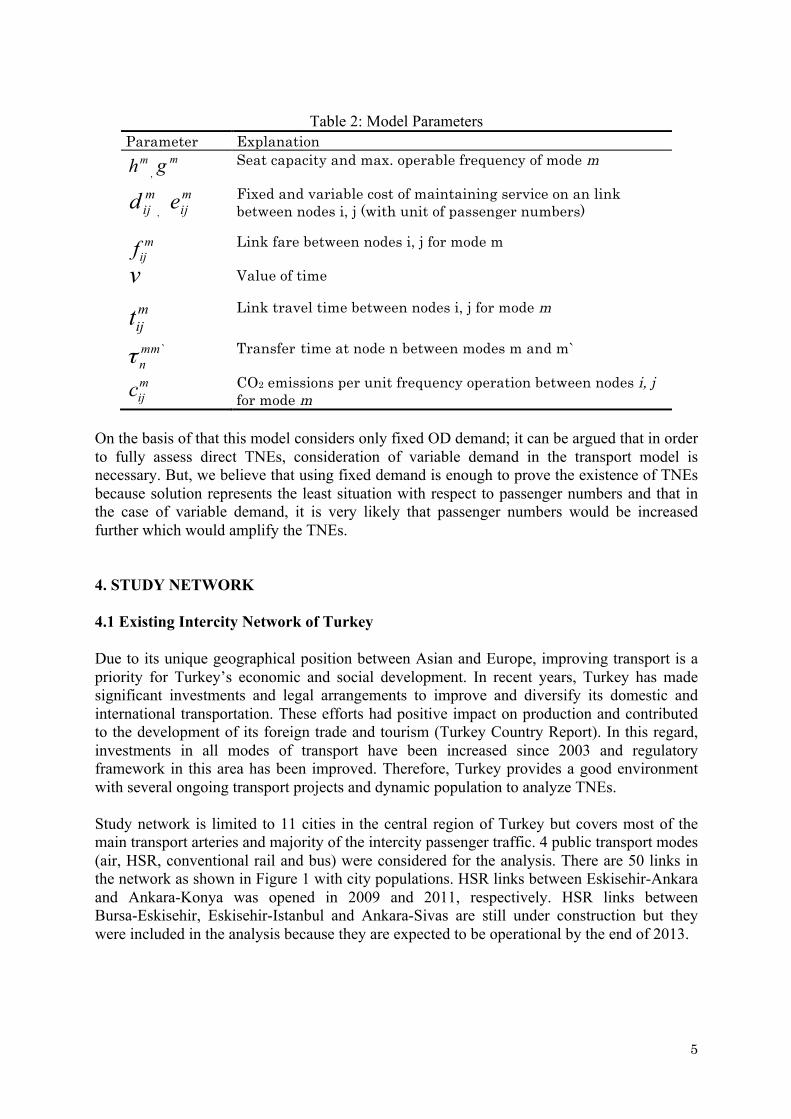
Table 2: Model Parameters Parameter Explanation mh ,
mg Seat capacity and max. operable frequency of mode m
mijd ,
mije
Fixed and variable cost of maintaining service on an link between nodes i, j (with unit of passenger numbers)
mijf Link fare between nodes i, j for mode m
v Value of time
mijt
Link travel time between nodes i, j for mode m
`mmnτ
Transfer time at node n between modes m and m`
mijc
CO2 emissions per unit frequency operation between nodes i, j for mode m
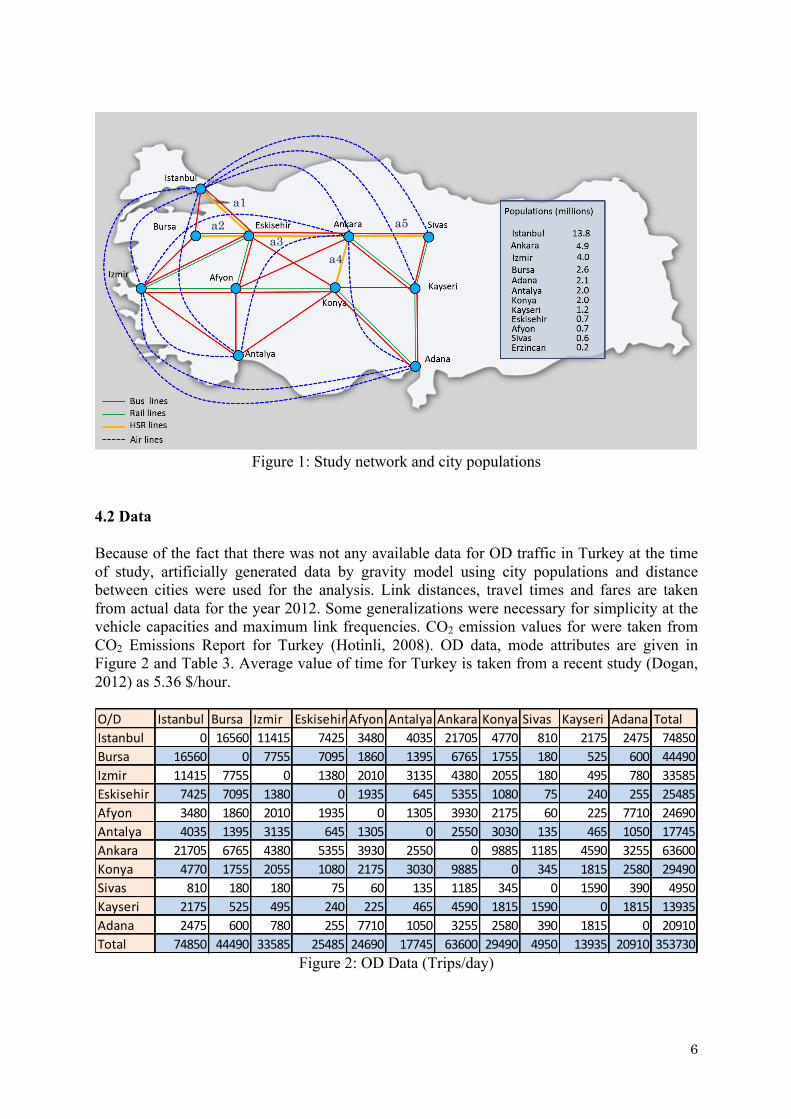
On the basis of that this model considers only fixed OD demand; it can be argued that in order to fully assess direct TNEs, consideration of variable demand in the transport model is necessary. But, we believe that using fixed demand is enough to prove the existence of TNEs because solution represents the least situation with respect to passenger numbers and that in the case of variable demand, it is very likely that passenger numbers would be increased further which would amplify the TNEs. 4. STUDY NETWORK 4.1 Existing Intercity Network of Turkey Due to its unique geographical position between Asian and Europe, improving transport is a priority for Turkey’s economic and social development. In recent years, Turkey has made significant investments and legal arrangements to improve and diversify its domestic and international transportation. These efforts had positive impact on production and contributed to the development of its foreign trade and tourism (Turkey Country Report). In this regard, investments in all modes of transport have been increased since 2003 and regulatory framework in this area has been improved. Therefore, Turkey provides a good environment with several ongoing transport projects and dynamic population to analyze TNEs. Study network is limited to 11 cities in the central region of Turkey but covers most of the main transport arteries and majority of the intercity passenger traffic. 4 public transport modes (air, HSR, conventional rail and bus) were considered for the analysis. There are 50 links in the network as shown in Figure 1 with city populations. HSR links between Eskisehir-Ankara and Ankara-Konya was opened in 2009 and 2011, respectively. HSR links between Bursa-Eskisehir, Eskisehir-Istanbul and Ankara-Sivas are still under construction but they were included in the analysis because they are expected to be operational by the end of 2013.
6
Figure 1: Study network and city populations
4.2 Data Because of the fact that there was not any available data for OD traffic in Turkey at the time of study, artificially generated data by gravity model using city populations and distance between cities were used for the analysis. Link distances, travel times and fares are taken from actual data for the year 2012. Some generalizations were necessary for simplicity at the vehicle capacities and maximum link frequencies. CO2 emission values for were taken from CO2 Emissions Report for Turkey (Hotinli, 2008). OD data, mode attributes are given in Figure 2 and Table 3. Average value of time for Turkey is taken from a recent study (Dogan, 2012) as 5.36 $/hour. O/D Istanbul Bursa Izmir Eskisehir Afyon Antalya Ankara Konya Sivas Kayseri Adana TotalIstanbul 0 16560 11415 7425 3480 4035 21705 4770 810 2175 2475 74850Bursa 16560 0 7755 7095 1860 1395 6765 1755 180 525 600 44490Izmir 11415 7755 0 1380 2010 3135 4380 2055 180 495 780 33585Eskisehir 7425 7095 1380 0 1935 645 5355 1080 75 240 255 25485Afyon 3480 1860 2010 1935 0 1305 3930 2175 60 225 7710 24690Antalya 4035 1395 3135 645 1305 0 2550 3030 135 465 1050 17745Ankara 21705 6765 4380 5355 3930 2550 0 9885 1185 4590 3255 63600Konya 4770 1755 2055 1080 2175 3030 9885 0 345 1815 2580 29490Sivas 810 180 180 75 60 135 1185 345 0 1590 390 4950Kayseri 2175 525 495 240 225 465 4590 1815 1590 0 1815 13935Adana 2475 600 780 255 7710 1050 3255 2580 390 1815 0 20910Total 74850 44490 33585 25485 24690 17745 63600 29490 4950 13935 20910 353730
Figure 2: OD Data (Trips/day)
a1
a2 a3
a4
a5
7
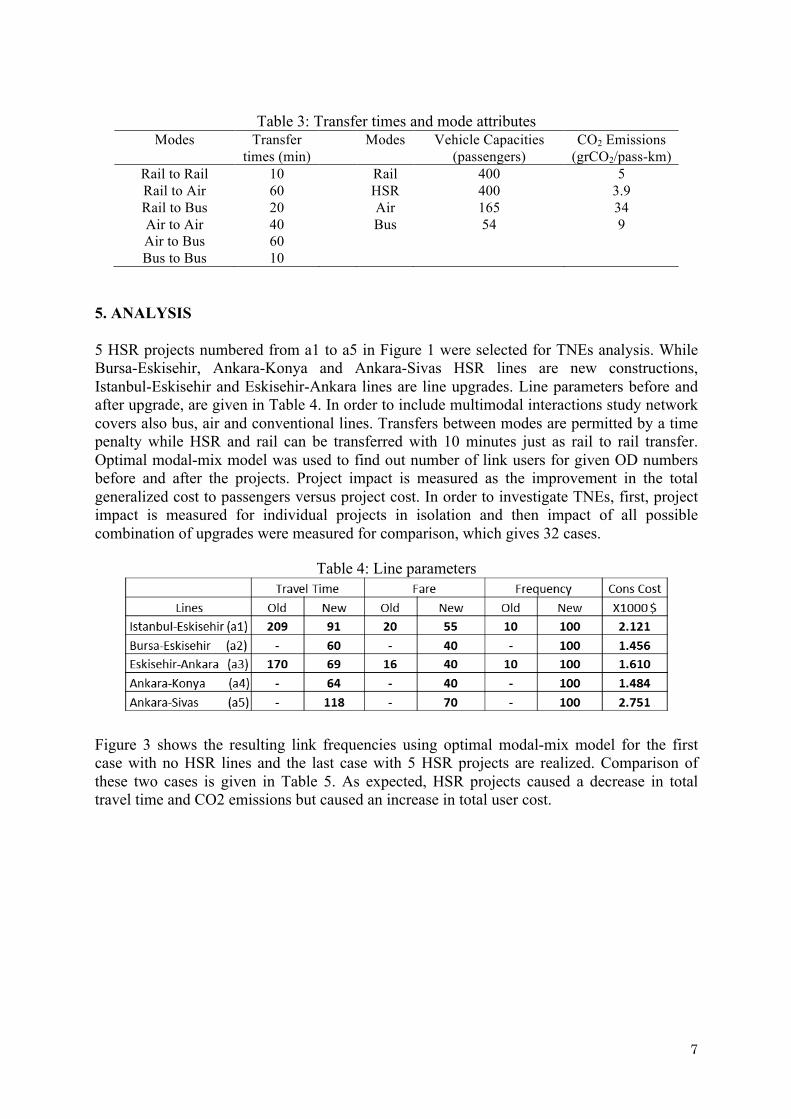
Table 3: Transfer times and mode attributes Modes Transfer
times (min) Modes Vehicle Capacities
(passengers) CO2 Emissions
(grCO2/pass-km) Rail to Rail 10 Rail 400 5 Rail to Air 60 HSR 400 3.9 Rail to Bus 20 Air 165 34 Air to Air 40 Bus 54 9 Air to Bus 60 Bus to Bus 10
5. ANALYSIS 5 HSR projects numbered from a1 to a5 in Figure 1 were selected for TNEs analysis. While Bursa-Eskisehir, Ankara-Konya and Ankara-Sivas HSR lines are new constructions, Istanbul-Eskisehir and Eskisehir-Ankara lines are line upgrades. Line parameters before and after upgrade, are given in Table 4. In order to include multimodal interactions study network covers also bus, air and conventional lines. Transfers between modes are permitted by a time penalty while HSR and rail can be transferred with 10 minutes just as rail to rail transfer. Optimal modal-mix model was used to find out number of link users for given OD numbers before and after the projects. Project impact is measured as the improvement in the total generalized cost to passengers versus project cost. In order to investigate TNEs, first, project impact is measured for individual projects in isolation and then impact of all possible combination of upgrades were measured for comparison, which gives 32 cases.
Table 4: Line parameters
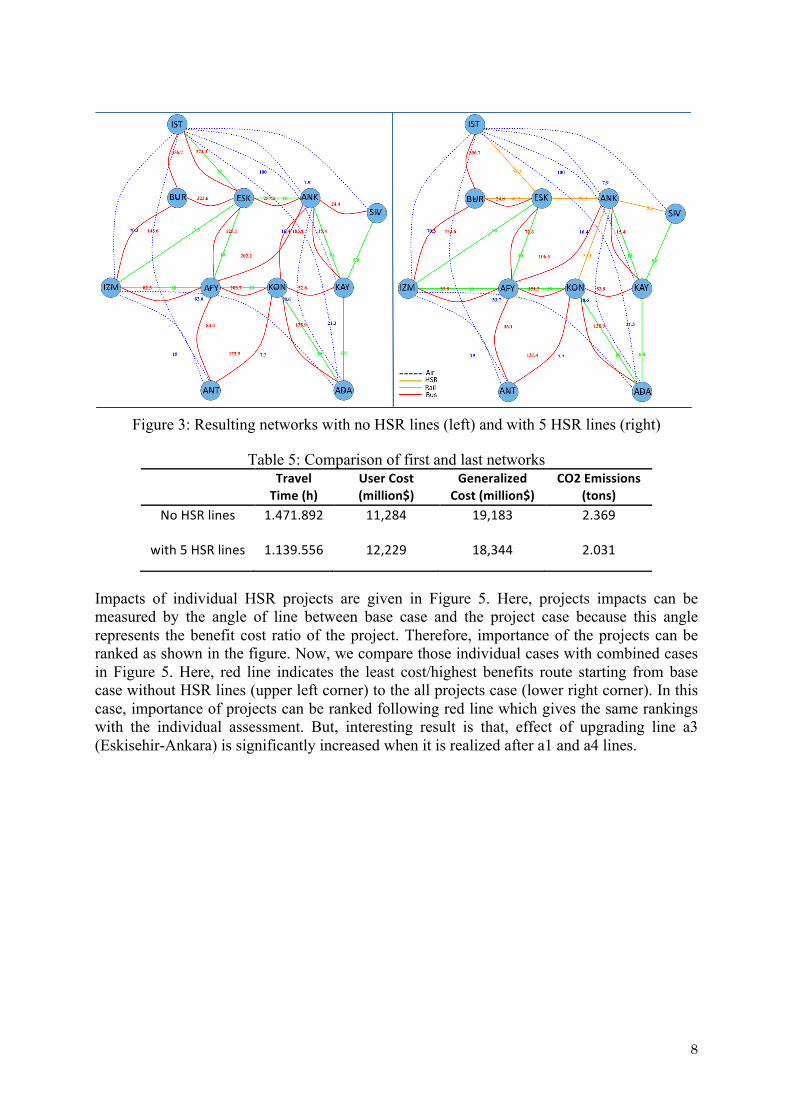
Figure 3 shows the resulting link frequencies using optimal modal-mix model for the first case with no HSR lines and the last case with 5 HSR projects are realized. Comparison of these two cases is given in Table 5. As expected, HSR projects caused a decrease in total travel time and CO2 emissions but caused an increase in total user cost.
8
Figure 3: Resulting networks with no HSR lines (left) and with 5 HSR lines (right)
Table 5: Comparison of first and last networks
Travel Time (h)
User Cost (million$)
Generalized Cost (million$)
CO2 Emissions (tons)
No HSR lines 1.471.892 11,284 19,183 2.369 with 5 HSR lines 1.139.556 12,229 18,344 2.031
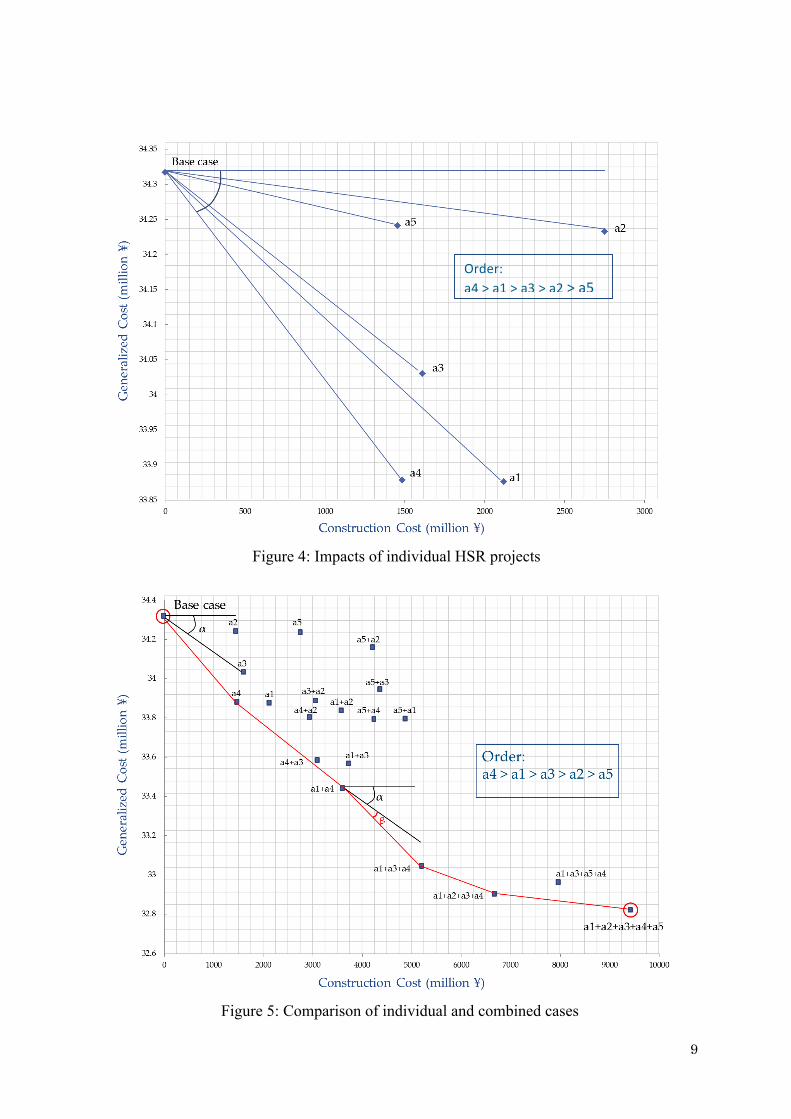
Impacts of individual HSR projects are given in Figure 5. Here, projects impacts can be measured by the angle of line between base case and the project case because this angle represents the benefit cost ratio of the project. Therefore, importance of the projects can be ranked as shown in the figure. Now, we compare those individual cases with combined cases in Figure 5. Here, red line indicates the least cost/highest benefits route starting from base case without HSR lines (upper left corner) to the all projects case (lower right corner). In this case, importance of projects can be ranked following red line which gives the same rankings with the individual assessment. But, interesting result is that, effect of upgrading line a3 (Eskisehir-Ankara) is significantly increased when it is realized after a1 and a4 lines.
9
Figure 4: Impacts of individual HSR projects
Figure 5: Comparison of individual and combined cases
Order: a4 > a1 > a3 > a2 > a5
10
This situation can be explained by TNEs which caused by competitive or complementary interaction of links in the network. In this case, completion of line a3 after lines a1 and a4 makes it possible to use this route as an alternative to the bus route between Eskisehir-Konya through Afyon, thus shifting a number of bus users to high speed rail routes. Although, TNEs did not change importance order in this setting, it may change the ranking for other settings. The conclusion can be drawn from this result is that TNEs can play an important role for the assessment and ranking of several projects and it is better to investigate TNEs when realizing large scale transport investments. 6. CONCLUSION In conclusion, the direct transport network effects were analyzed in Turkish intercity transport network using optimal modal-mix model. Impacts of 5 HSR projects were calculated individually and in combinations by comparing generalized cost improvement versus project cost. It is shown that TNEs can improve the impact of a project which in some cases may affect the approval decision. We had to use hypothetical data due to the lack or inaccessibility of real data in this study. More reliable result can be achieved by using actual data for further analyses. Moreover, an improvement of the model to consider variable demand can provide more significant results due to the possible increase in the passenger numbers.
REFERENCES Bataille, M. Steinmetz A. (2013). Intermodal competition on some routes in
transportation networks: The case of inter urban buses and railways, DICE Discussion Paper, No. 84, ISBN 978-3-86304-083-3
Chang, Yu-Hern, Chung-Hsing Yeh, and Ching-Cheng Shen (2000), A Multiobjective
Model for Passenger Train Services Planning: Application to Taiwan's High-Speed Rail Line. Transportation Research Part B: Methodological 34.2: 91-106.
Dogan M (2012), Passenger Time Value for Konya Province in the context of
Ankara-Konya High Speed Railway Project (in Turkish). Akademik Bakis Dergisi, Sayi:33 Kasim-Aralik 2012
Gutiérrez, J., Condeço-Melhorado, A., & Martín, J. C. (2010). Using accessibility
indicators and GIS to assess spatial spillovers of transport infrastructure investment. Journal of Transport Geography, 18(1), 141-152.
Hotinli G. (2008), CO2 Emissions Report for Turkey (in Turkish), Acik Toplum Enstitusu
Turkiye Temsilciligi, Istanbul Laird, J. J., Mackie, P. J., Nellthorp, J., Burgess, A., Renes, G., Bröcker, J., &
Oosterhaven, J. (2003). Development of a Methodology for the Assessment of Network Effects in Transport Networks.
Laird, J. J., Nellthorp, J., & Mackie, P. J. (2005). Network effects and total economic
11
impact in transport appraisal. Transport Policy, 12(6), 537-544. Mackie, P.J., Nellthorp, J., Kiel, J., Schade, W., Nokkala, M., (2001). IASON Project
Assessment Baseline. IASON Deliverable 1. Funded by 5th Framework RTD Programme. TNO Inro. Delft. Netherlands.
Müller, Guido, Sebastian Bührmann, P. Riley, H. W. Rowlands, T. Asperges, H.
Verbruggen, I. Vleugels, P. Pug-Pey, and P. Holloway (2004), Towards Passenger Intermodality in the EU.
Okumura M., Tirtom H., Yamaguchi H. (2012), Planning Model of Optimal Modal-Mix
in Intercity Passenger Transportation. Proceedings of LTLGB 2012 Schutte, I. C., & Brits, A. (2013). Prioritising transport infrastructure projects: towards a
multi-criterion analysis. Southern African Business Review, 16(3), 97-117. Turkey Ministry of Transport and Communication (TMCT) (2011), Transport and
Telecommunication Strategy for Turkey, Target 2023 (in Turkish), Ankara van Exel, J., Rienstra, S., Gommers, M., Pearman, A., & Tsamboulas, D. (2002). EU
involvement in TEN development: network effects and European value added. Transport Policy, 9(4), 299-311.
Vickerman, R. (2007). Cost-benefit analysis and large-scale infrastructure projects: state
of the art and challenges. Environment and Planning B Planning and Design, 34(4), 598