Embed Size (px)
Citation preview
Environmental Goods and Services Series
Issue Paper No. 12
Technology Mapping of the Renewable Energy, Buildings, and Transport Sectors: Policy Drivers and International Trade AspectsAn ICTSD Synthesis Paper
By Rene Vossenaar, Independant Consultant Veena Jha, Warwick University
ICTSD Programme on Trade and EnvironmentMay 2010 |
l ICTSD Programme on Trade and Environment
By René Vossenaar Independent Consultant Veena Jha University of Warwick
Technology Mapping of the Renewable Energy, Buildings, and Transport Sectors: Policy Drivers and International Trade AspectsAn ICTSD Synthesis Paper*
Issue Paper No. 12
May 2010
* This paper synthesizes findings from technology mapping studies of three sectors: renewable energy supply, residential and commercial buildings, and transport. The studies were commissioned by the International Centre for Trade and Sustainable Development (ICTSD) and prepared by, respectively, the Energy Research Centre of the Netherlands (ECN), the Tata Energy and Resources Institute (TERI) in India, and the Energy Research Institute (ERI) in China. The objective of the mapping studies was to identify key climate-mitigation technologies and associated goods. This paper also analyses the following issues: the key drivers of technology deployment; policies and measures that help overcome barriers to renewable energy generation and improved energy efficiency; and certain aspects of international trade. The analysis of each area was accomplished by drawing on complementary papers prepared for ICTSD and additional research. The views expressed in this paper are those of the authors and do not necessarily reflect the views of ICTSD or the funding institutions. The full versions of the mapping studies are available, or will be made available soon, on www.ictsd.org
ii R. Vossenaar, V Jha - Technology Mapping of the Renewable Energy, Buildings, and Transport Sectors: Policy Drivers and International Trade Aspects
Published by
International Centre for Trade and Sustainable Development (ICTSD)International Environment House 27 Chemin de Balexert, 1219 Geneva, SwitzerlandTel: +41 22 917 8492 Fax: +41 22 917 8093E-mail: [email protected] Internet: www.ictsd.org
Chief Executive: Ricardo Meléndez-Ortiz Programmes Director: Christophe Bellmann Programme Officers: Mahesh Sugathan and Joachim Monkelbaan
Acknowledgments
The author is grateful to Mahesh Sugathan for his collaboration and valuable assistance in shaping the final version of this paper. The paper is published under ICTSD’s Global Platform, an initiative supported by DANIDA (Denmark); the Ministry of Foreign Affairs of Finland; the Department for International Development (U.K.); the Ministry for Foreign Affairs of Sweden; the Ministry of Foreign Affairs of Norway; the Commonwealth Secretariat; Oxfam Novib and ICTSD’s institutional partners and project supporters such as the Netherlands Directorate-General of Development Cooperation (DGIS), the Swedish International Development Cooperation Agency (SIDA); the Commonwealth Secretariat; the Inter American Development Bank (IADB); and the Bill & Melinda Gates Foundation.
For more information about ICTSD’s work on Environmental Goods and Services and the Global Platform on Trade and Climate Change, visit our website: www.ictsd.org
ICTSD welcomes feedback on this document. These can be forwarded to Mahesh Sugathan, [email protected] and Joachim Monkelbaan, [email protected]
Citation: Vossenaar, R.(2010). Technology Mapping of the Renewable Energy, Buildings and Transport Sectors: Policy Drivers and International Trade Aspects, ICTSD Synthesis Paper, International Centre for Trade and Sustainable Development, Geneva, Switzerland.
Copyright © ICTSD, 2010. Readers are encouraged to quote this material for educational and nonprofit purposes, provided the source is acknowledged.
This work is licensed under the Creative Commons Attribution-Non-commercial-No-Derivative Works 3.0 License. To view a copy of this license, visit http://creativecommons.org/licenses/by-nc-nd/3.0/ or send a letter to Creative Commons, 171 Second Street, Suite 300, San Francisco,California, 94105, USA.
The views expressed in this publication are those of the author and do not necessarily reflect the views of ICTSD or the funding institutions.
ISSN 1816-6970
iiiICTSD Programme on Trade and Environment
TABLE OF CONTENTS
LIST OF ABBREVIATIONS AND ACRONYMS ivLIST OF TABLES AND FIGURES vFOREWORD vi1. INTRODUCTION 1
1.1 Background 1
1.2 Structure Of The Paper 1
2. RENEWABLE ENERGY SUPPLY 22.1 Mapping Renewable Energy Technologies 2
2.2 Renewable Energy Supply In Perspective 3
2.3 Policies And Measures 6
3. RESIDENTIAL AND COMMERCIAL BUILDINGS 73.1 Mapping Technologies 7
3.2 Policies And Measures 8
4. TRANSPORT 94.1 Mapping Technologies 9
4.2 Policies And Measures 10
5. SOME INTERNATIONAL TRADE ASPECTS 115.1 Drivers Of International Trade 11
5.2 Tariffs,Non-TariffMeasuresAndSubsidies 12
6. CONCLUSIONS 17ENDNOTES 18REFERENCES 23ANNEX 25
iv R. Vossenaar, V Jha - Technology Mapping of the Renewable Energy, Buildings, and Transport Sectors: Policy Drivers and International Trade Aspects
LIST OF ABBREVIATIONS AND ACRONYMS
ARRA American Recovery and Reinvestment Act
BAT Best available technology
CFL Compact fluorescent lamp
CN Common Nomenclature (European Union)
CSP Concentrating solar power
CVT Continuously variable transmission
ECN Energy Research Centre (the Netherlands)
EE Energy efficiency
ETP Energy Technology Perspectives (published by the IEA)
EuP Energy-using product
FCV Fuel-cell vehicle
FFV Flex-fuel vehicle
GHG Greenhouse gas
GW Gigawatt (1000 MW)
GWEC Global Wind Energy Council
HTSUS Harmonized Tariff Schedule of the United States
ICE Internal combustion engine
IPCC Intergovernmental Panel on Climate Change
MEPS Minimum energy performance standard
MW Megawatt
LDV Light-duty vehicle
PV Photovoltaic
RE Renewable energy
REHC Renewable energy heating and cooling
RS Reference scenario (IEA in WEO, 2009)
SWH Solar water heating
TERI Tata Energy Research Institute (India)
USITC United States International Trade Commission
WEO World Energy Outlook
WITS World Integrated Trade Solution (World Bank software)
vICTSD Programme on Trade and Environment
LIST OF TABLES AND FIGURES
Table 1: World primary energy demand by fuel in the IEA Reference scenario
Table 2: Cumulated installed renewable energy capacity (GW) in the IEA Reference scenario
Table 3: Wind and solar energy capacity additions in the IEA 450 scenario (GW)
Table A.1: Technologies in renewables available on a commercial basis
Table A.2: Technologies in renewables with strong prospects for commercialization
Table A.3 Technologies and components in residential and commercial buildings
Table A.4: Technologies in road transport (passenger cars)
Table A.5: Exports of photosensitive semiconductor devices, including PV cells, 2004-2008
Table A.6: Exports of wind turbines, 2004-2008
Table A.7: Annual wind-energy capacity additions (MW), 2004-2009
Table A.8: US imports of wind-energy turbines and selected wind-energy components
Table A.9: Grid-connected solar PV capacity additions MW), 2004-2008
Table A.10: EU imports of solar PV equipment (CN 85414090), 2004-2009
Table A.11: Exports of compact fluorescent lamps (CFLs), 2004-2008
Table A.12: Top exporters of batteries that may be used in electric cars, 2008
Table A.13: EU imports of electric cars, nickel hydride and lithium-ion accumulators in 2008
Table A.14: Top exporters and importers of climate-friendly products and components
Table A.15: Applied tariffs for wind-energy turbines and selected components
Figure 1: Tariffs on products and components associated with climate-friendly technologies
vi R. Vossenaar, V Jha - Technology Mapping of the Renewable Energy, Buildings, and Transport Sectors: Policy Drivers and International Trade Aspects
The global effort to address climate change will require a fundamental transformation of our economies and of the ways in which we use energy. Addressing climate change requires the internalisation of carbon costs, which will have significant effects on what we produce, where we produce, what we trade and how we trade. For international co-operation on climate change to be effective, international regulatory frameworks need to support this effort.
The current phase of negotiations under the UN Framework Convention on Climate Change (UNFCCC) is set to lay the groundwork for the necessary policy reforms, and will require concerted and cooperative efforts by individual countries, the business sector and civil society. Innovation – with regard to both the technologies of the future and the regulatory frameworks used to usher them in at the scale needed – will be key to the successful implementation of the Convention. In this context, both the global trade regime through the World Trade Organization (WTO) and regional trading arrangements may need to be moulded and reformed to support action on climate change.
Addressing climate change and energy security requires massive and rapid deployment of more efficient, cleaner technologies that promote clean growth and economic gain. Carefully crafted trade policies could contribute to a rapid diffusion and transfer of clean technologies around the world and provide new incentives for innovation and investment in climate-friendly technologies.
In this regard, ICTSD’S Global Platform on Climate Change, Trade, and Sustainable Energy (the Global Platform) launched a mapping exercise of commercially available technologies and goods as well as those undergoing R&D (with a strong prospect of commercialization in a five- to 10-year time horizon) in three sectors: renewable energy supply, buildings, and transport. Once peer reviewed by Intergovernmental Panel on Climate Change lead experts, these mapping studies set the stage for customs classification and a subsequent detailed analysis of their market drivers, trade flows, and trade barriers. The mapping study for the renewable energy supply, residential and commercial buildings and transportation sectors were prepared by experts from the Energy Research Centre of the Netherlands (“ECN”), the Energy and Resources Institute (TERI), India and the Energy Research Institute (ERI), China respectively. These sectors have been identified by the Intergovernmental Panel on Climate Change (“IPCC”) as one of the critical sectors for mitigation of greenhouse gas (GHG) emissions.
This paper synthesizes findings from these three mapping studies commissioned by the International Centre for Trade and Sustainable Development (“ICTSD”) and also includes an overview of key policies and measures important for the uptake of some of the technologies identified in these mapping studies. It also includes some findings on international trade in many of the products associated with these technologies and the trading opportunities, particularly for developing countries.
The views expressed in this paper are those of the author and do not necessarily reflect the views of ICTSD or the funding institutions. The full version of the mapping studies as well as detailed analyses on international trade are available or will be made available shortly on www.ictsd.org.
Rene Vossenaar is from the Netherlands and presently lives in Brasilia, Brazil. He worked for the Economic Commission for Latin America and the Caribbean (ECLAC) and was also the Head of the Trade, Environment and Development Branch at the United Nations Conference on Trade and Development (UNCTAD). Since his retirement in March 2005, he has carried out work for UNCTAD and other institutions as an independent consultant as well as a resource person.
FOREWORD

viiICTSD Programme on Trade and Environment
The paper is part of a series of issue papers commissioned in the context of ICTSD’s Global Platform. One of the objectives of the Platform is to provide options for identifying and liberalizing trade in climate-friendly environmental goods and services that effectively contribute to sound environmental management while preserving developing countries’ ability to promote industry and economic development. We hope you will find this paper to be stimulating and informative reading and useful for your work.
Ricardo Meléndez-Ortiz Chief Executive, ICTSD
1 R. Vossenaar, V Jha - Technology Mapping of the Renewable Energy, Buildings, and Transport Sectors: Policy Drivers and International Trade Aspects
The deployment of renewable energy (RE) technologies and the promotion of energy efficiency (EE) are of crucial importance for climate mitigation and provide opportunities for low-carbon growth, trade, and employment, including for developing countries. To support understanding of these opportunities, ICTSD has commissioned technology mapping studies of (a) the RE supply sector and of (b) climate-friendly technologies in two end-use sectors: residential and commercial buildings, and transport.1 The mapping studies also identify products and, where relevant, components associated with these technologies, including goods that may be traded internationally. This provides a link for an analysis of market access conditions and market opportunities that may arise from the deployment of such technologies, especially for producers in developing countries.
The mapping studies illustrate the large potential for climate-change mitigation that can be achieved by deploying climate-friendly technologies in developed and developing countries. Additional sector-specific papers will complement the mapping studies in two ways: by analysing the factors that drive RE and EE technology deployment, and by analysing the policies and measures that
help overcome barriers to EE improvements and RE generation. Market forces alone are insufficient to bring about a rapid deployment of RE and EE technologies. The deployment of RE and investment in EE are largely driven by regulations and incentives, including economic stimulus packages. The case is made that trade can help promote market transformation, but that trade liberalisation alone will have little impact. Therefore, integrated packages are needed to stimulate the successful deployment of RE and EE technologies in developing countries.
The next three sections summarize the key climate-friendly technologies that were iden-tified in the mapping studies, according to each sector. Renewable energy supply is described in Section II, residential and commercial buil-dings in Section III, and transport in Section IV. Each of these sections analyses the primary factors that drive technology deployment. In addition, each section analyses the policies and measures that promote the wider use of climate-friendly technologies in developed and developing countries. Some international trade implications are then examined in Section V. The principal conclusions are presented in Section VI.
1. INTRODUCTION
1.1 Background
1.2 Structure of the Paper
2ICTSD Programme on Trade and Environment
The mapping study of renewable energy (RE) technologies was prepared for ICTSD by the Energy Research Centre (ECN) in the Netherlands. It identifies two broad categories of technologies. The first category is a set of technologies and goods that are available for commercial purchase and use. The second category is a range of technologies still in development, but for which a strong likelihood of commercial deployment is foreseen in the near-to-medium-term future (i.e. five to ten years). The RE technologies covered in the mapping study include: solar energy, wind energy, ocean energy, geothermal energy, hydropower, and biomass. The study breaks down these technologies into subcategories and identifies the main components used in each subcategory (See Annex, Tables A.1 and A.2).
The key characteristics of RE supply techno-logies and goods available on a commercial basis are shown below.
• Solar energy has three subcategories:
- Concentrating solar power (CSP), or “solar thermal power,” has been around for about twenty-five years but has only recently gathered momentum. There are two technologies that are relatively mature: solar trough and solar tower systems. Two other CSP technologies—solar dish and Fresnel-lens systems—are advancing fast. The advance of these technologies has been facilitated by financial incentives for CSP plants in Spain, the United States, and a number of other countries.
- Solar heating and cooling has become a mainstream RE technology. The tech-nology is used predominantly for hot water and space heating where solar thermal collectors are typically mounted on the rooftops of buildings. The
installed capacity of solar water heating (SWH) systems is often measured by the total surface area of solar collectors (evacuated tube collectors, glazed flat-plate collectors, and unglazed collectors). China accounted for more than half of the global SWH capacity in operation by the end of 2007, followed by the United States, Turkey, Germany and Japan (Weiss et. al. 2009).
- Photovoltaic (PV) power is used for grid-connected systems and off-grid systems, the latter being used predominantly in developing countries. Photovoltaic power is based on PV modules, which include PV cells and the balance of system (BOS). The latter includes the inverter, battery, electronics, and other components. Pho-tovoltaic power has been experiencing high growth rates in Europe (particularly in Germany and Spain), Japan, and the United States. As a consequence, costs are generally decreasing. China is a large producer of PV cells and modules, and other developing countries are also becoming significant producers.
• Wind energy is now a mainstream technology. Onshore wind-energy technology is being applied mainly in Europe, the United States, India, and China. Know-how with regard to onshore wind-turbine manufacturing is spreading fast. With regard to offshore wind, much experience exists in a number of European countries. However, the United States and a number of countries in Southeast Asia are also developing offshore wind farms. The main components associated with wind-energy technology include: wind-turbine blades, gearboxes, generators, bearings, towers, and wind electronic control equipment. In addition to these components, offshore wind-energy capacity installations also create demand for infield and export cables, offshore high voltage stations, and support structures (Table A.1). According to the Global Wind Energy Council (GWEC), the countries with
2. RENEWABLE ENERGY SUPPLY
2.1 Mapping Renewable Energy Technologies
3 R. Vossenaar, V Jha - Technology Mapping of the Renewable Energy, Buildings, and Transport Sectors: Policy Drivers and International Trade Aspects
the largest installed capacity by the end of 2009 were, in descending order, the United States, Germany, China, Spain, and India (GWEC, 2010). In 2009, China added more wind-energy capacity than any other country and the European Union as a whole (Table A.7).
• With respect to ocean energy, tidal stream power and wave power technologies are entering the commercial stage. There are three tidal stream power technologies in research and development (R&D) and demonstration stages. At least four wave-power technologies are being developed and demonstrated with a medium-term outlook for commercial application.
• Geothermal energy has three main appli-cations: power generation, direct heat, and ground-source heat pumps. Concepts relating to deep geothermal heat and small-scale applications are currently under development, with prospects for rapid commercialization. Direct use of heat for buildings and industry is a commercial technology, and ground-source heat pumps are experiencing fast growth and cost reduction. The countries with the largest installed capacity by the end of 2008 were, in descending order, the United States, the Philippines, Indonesia, Mexico, and Italy (REN21, 2009).
• Hydropower operates in three scales: large (>10 MW), small (1 to 10 MW), and micro (<1 MW). The countries with the greatest installed small hydropower capacity by the end of 2008 were, in descending order, China, Japan, the United States, Italy, and Brazil (REN21, 2009).
• Biomass (including traditional biomass) is currently the most important renewable energy source, at least in terms of primary energy supply on a global scale (Table 1). There is much experience with commercial medium and large-scale biomass-based combustion systems to produce power, heat, and combined heat and power (CHP). The three countries with the largest
existing biomass power capacity by the end of 2008 were, in descending order; the United States, Brazil, and the Philippines. Important existing applications of biomass include first-generation biofuels and first-generation biodiesel. In 2008, world production of ethanol reached 67 billion litres while world biodiesel production reached twelve billion litres. The United States, Brazil, and France were the largest producers of ethanol. Germany, the United States, France, Brazil, and Argentina were the largest producers of biodiesel (REN21, 2009).
Shown in Table A1 are the RE technologies available on a commercial basis along with their associated components. Key technologies undergoing research and development with strong prospects for commercialization inclu- de PV nanotechnology, floating offshore wind, and second-generation bio-ethanol and bio-diesel (Table A.2).
The purpose of this section is to place RE technology deployment and the demand for associated products and components into a market perspective. Specifically, this section describes the RE capacity installed in 2008, which is based largely on data from the Renewables Global Status Report: 2009 Update published by the Renewable Energy Network for the twenty-first century (RNE21, 2009). Also used as a source for this section were scenarios for the period 2007-2030, based largely on the World Energy Outlook 2009, which was published by the International Energy Agency (IEA, 2009).
Renewable energy capacity in 2008
The global renewables power capacity by the end of 2008 was 1,140 gigawatts (GW) or 280 GW if large hydropower is excluded. The countries with the largest existing capacity were, in descending order; China, the United States, Germany, Spain, and India (RNE21, 2009).
2.2 Renewable Energy Supply in Perspective
4ICTSD Programme on Trade and Environment
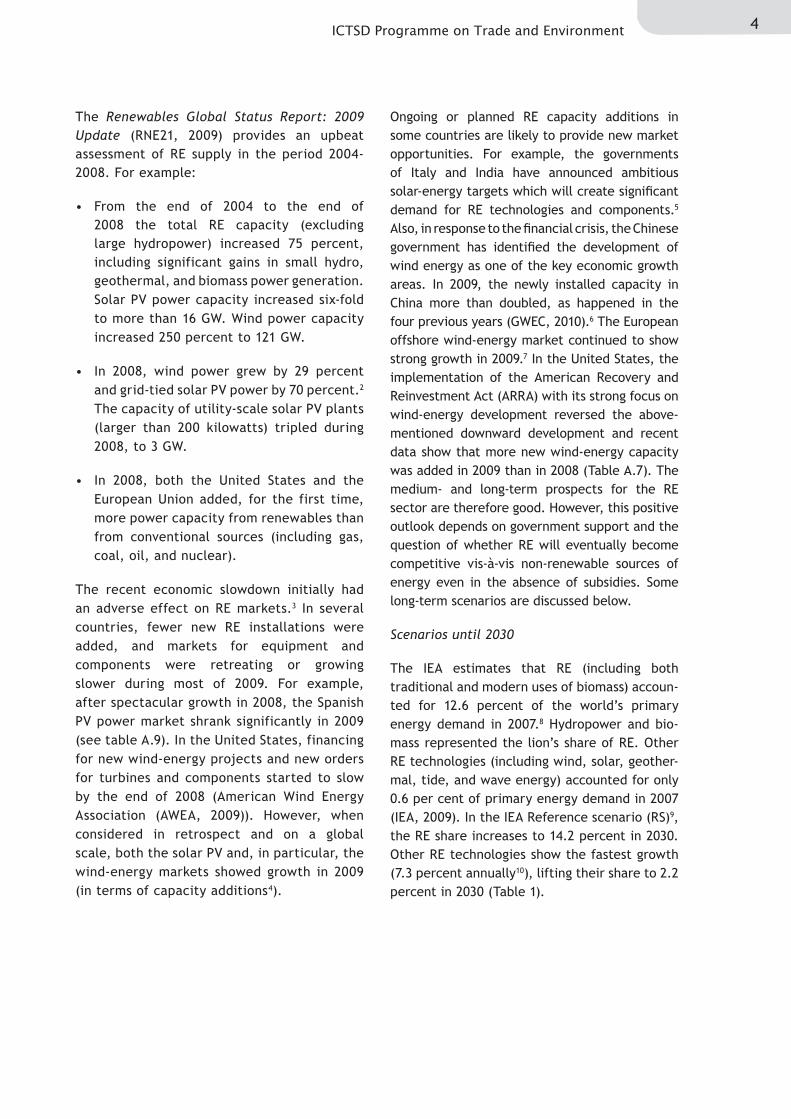
The Renewables Global Status Report: 2009 Update (RNE21, 2009) provides an upbeat assessment of RE supply in the period 2004-2008. For example:
• From the end of 2004 to the end of 2008 the total RE capacity (excluding large hydropower) increased 75 percent, including significant gains in small hydro, geothermal, and biomass power generation. Solar PV power capacity increased six-fold to more than 16 GW. Wind power capacity increased 250 percent to 121 GW.
• In 2008, wind power grew by 29 percent and grid-tied solar PV power by 70 percent.2 The capacity of utility-scale solar PV plants (larger than 200 kilowatts) tripled during 2008, to 3 GW.
• In 2008, both the United States and the European Union added, for the first time, more power capacity from renewables than from conventional sources (including gas, coal, oil, and nuclear).
The recent economic slowdown initially had an adverse effect on RE markets.3 In several countries, fewer new RE installations were added, and markets for equipment and components were retreating or growing slower during most of 2009. For example, after spectacular growth in 2008, the Spanish PV power market shrank significantly in 2009 (see table A.9). In the United States, financing for new wind-energy projects and new orders for turbines and components started to slow by the end of 2008 (American Wind Energy Association (AWEA, 2009)). However, when considered in retrospect and on a global scale, both the solar PV and, in particular, the wind-energy markets showed growth in 2009 (in terms of capacity additions4).
Ongoing or planned RE capacity additions in some countries are likely to provide new market opportunities. For example, the governments of Italy and India have announced ambitious solar-energy targets which will create significant demand for RE technologies and components.5 Also, in response to the financial crisis, the Chinese government has identified the development of wind energy as one of the key economic growth areas. In 2009, the newly installed capacity in China more than doubled, as happened in the four previous years (GWEC, 2010).6 The European offshore wind-energy market continued to show strong growth in 2009.7 In the United States, the implementation of the American Recovery and Reinvestment Act (ARRA) with its strong focus on wind-energy development reversed the above-mentioned downward development and recent data show that more new wind-energy capacity was added in 2009 than in 2008 (Table A.7). The medium- and long-term prospects for the RE sector are therefore good. However, this positive outlook depends on government support and the question of whether RE will eventually become competitive vis-à-vis non-renewable sources of energy even in the absence of subsidies. Some long-term scenarios are discussed below.
Scenarios until 2030
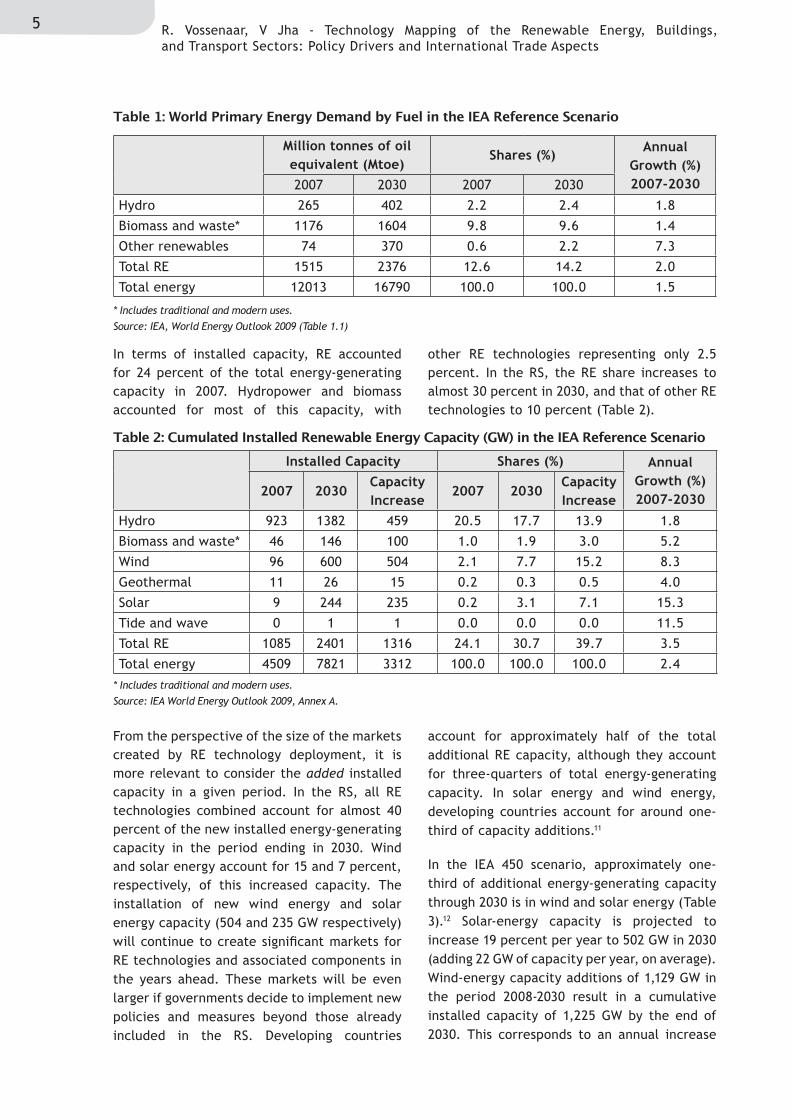
The IEA estimates that RE (including both traditional and modern uses of biomass) accoun-ted for 12.6 percent of the world’s primary energy demand in 2007.8 Hydropower and bio-mass represented the lion’s share of RE. Other RE technologies (including wind, solar, geother-mal, tide, and wave energy) accounted for only 0.6 per cent of primary energy demand in 2007 (IEA, 2009). In the IEA Reference scenario (RS)9, the RE share increases to 14.2 percent in 2030. Other RE technologies show the fastest growth (7.3 percent annually10), lifting their share to 2.2 percent in 2030 (Table 1).
5 R. Vossenaar, V Jha - Technology Mapping of the Renewable Energy, Buildings, and Transport Sectors: Policy Drivers and International Trade Aspects
In terms of installed capacity, RE accounted for 24 percent of the total energy-generating capacity in 2007. Hydropower and biomass accounted for most of this capacity, with
other RE technologies representing only 2.5 percent. In the RS, the RE share increases to almost 30 percent in 2030, and that of other RE technologies to 10 percent (Table 2).
From the perspective of the size of the markets created by RE technology deployment, it is more relevant to consider the added installed capacity in a given period. In the RS, all RE technologies combined account for almost 40 percent of the new installed energy-generating capacity in the period ending in 2030. Wind and solar energy account for 15 and 7 percent, respectively, of this increased capacity. The installation of new wind energy and solar energy capacity (504 and 235 GW respectively) will continue to create significant markets for RE technologies and associated components in the years ahead. These markets will be even larger if governments decide to implement new policies and measures beyond those already included in the RS. Developing countries
account for approximately half of the total additional RE capacity, although they account for three-quarters of total energy-generating capacity. In solar energy and wind energy, developing countries account for around one-third of capacity additions.11
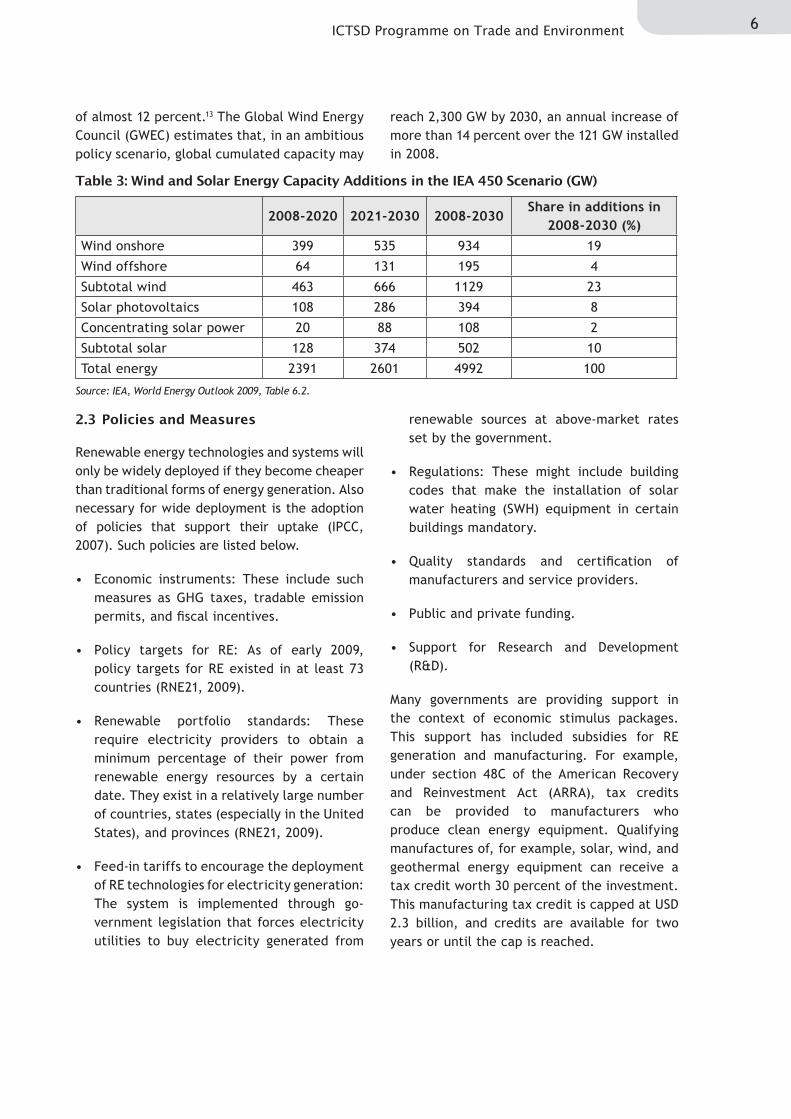
In the IEA 450 scenario, approximately one-third of additional energy-generating capacity through 2030 is in wind and solar energy (Table 3).12 Solar-energy capacity is projected to increase 19 percent per year to 502 GW in 2030 (adding 22 GW of capacity per year, on average). Wind-energy capacity additions of 1,129 GW in the period 2008-2030 result in a cumulative installed capacity of 1,225 GW by the end of 2030. This corresponds to an annual increase
Table 1: World Primary Energy Demand by Fuel in the IEA Reference Scenario
Million tonnes of oil equivalent (Mtoe)
Shares (%)Annual
Growth (%) 2007-20302007 2030 2007 2030
Hydro 265 402 2.2 2.4 1.8
Biomass and waste* 1176 1604 9.8 9.6 1.4
Other renewables 74 370 0.6 2.2 7.3
Total RE 1515 2376 12.6 14.2 2.0
Total energy 12013 16790 100.0 100.0 1.5
* Includes traditional and modern uses. Source: IEA, World Energy Outlook 2009 (Table 1.1)
Table 2: Cumulated Installed Renewable Energy Capacity (GW) in the IEA Reference Scenario
* Includes traditional and modern uses. Source: IEA World Energy Outlook 2009, Annex A.
Installed Capacity Shares (%) Annual Growth (%) 2007-2030
2007 2030Capacity Increase
2007 2030Capacity Increase
Hydro 923 1382 459 20.5 17.7 13.9 1.8
Biomass and waste* 46 146 100 1.0 1.9 3.0 5.2
Wind 96 600 504 2.1 7.7 15.2 8.3
Geothermal 11 26 15 0.2 0.3 0.5 4.0
Solar 9 244 235 0.2 3.1 7.1 15.3
Tide and wave 0 1 1 0.0 0.0 0.0 11.5
Total RE 1085 2401 1316 24.1 30.7 39.7 3.5
Total energy 4509 7821 3312 100.0 100.0 100.0 2.4
6ICTSD Programme on Trade and Environment
of almost 12 percent.13 The Global Wind Energy Council (GWEC) estimates that, in an ambitious policy scenario, global cumulated capacity may
reach 2,300 GW by 2030, an annual increase of more than 14 percent over the 121 GW installed in 2008.
Table 3: Wind and Solar Energy Capacity Additions in the IEA 450 Scenario (GW)
Source: IEA, World Energy Outlook 2009, Table 6.2.
2008-2020 2021-2030 2008-2030Share in additions in
2008-2030 (%)Wind onshore 399 535 934 19
Wind offshore 64 131 195 4
Subtotal wind 463 666 1129 23
Solar photovoltaics 108 286 394 8
Concentrating solar power 20 88 108 2
Subtotal solar 128 374 502 10
Total energy 2391 2601 4992 100
Renewable energy technologies and systems will only be widely deployed if they become cheaper than traditional forms of energy generation. Also necessary for wide deployment is the adoption of policies that support their uptake (IPCC, 2007). Such policies are listed below.
• Economic instruments: These include such measures as GHG taxes, tradable emission permits, and fiscal incentives.
• Policy targets for RE: As of early 2009, policy targets for RE existed in at least 73 countries (RNE21, 2009).
• Renewable portfolio standards: These require electricity providers to obtain a minimum percentage of their power from renewable energy resources by a certain date. They exist in a relatively large number of countries, states (especially in the United States), and provinces (RNE21, 2009).
• Feed-in tariffs to encourage the deployment of RE technologies for electricity generation: The system is implemented through go-vernment legislation that forces electricity utilities to buy electricity generated from
renewable sources at above-market rates set by the government.
• Regulations: These might include building codes that make the installation of solar water heating (SWH) equipment in certain buildings mandatory.
• Quality standards and certification of manufacturers and service providers.
• Public and private funding.
• Support for Research and Development (R&D).
Many governments are providing support in the context of economic stimulus packages. This support has included subsidies for RE generation and manufacturing. For example, under section 48C of the American Recovery and Reinvestment Act (ARRA), tax credits can be provided to manufacturers who produce clean energy equipment. Qualifying manufactures of, for example, solar, wind, and geothermal energy equipment can receive a tax credit worth 30 percent of the investment. This manufacturing tax credit is capped at USD 2.3 billion, and credits are available for two years or until the cap is reached.
2.3 Policies and Measures
7 R. Vossenaar, V Jha - Technology Mapping of the Renewable Energy, Buildings, and Transport Sectors: Policy Drivers and International Trade Aspects
3. RESIDENTIAL AND COMMERCIAL BUILDINGS
Energy use in buildings represents 30 to 40 percent of total energy use. In 2007, direct CO2 emissions from fossil-fuel combustion (mainly for water heating, space heating, and cooling) accounted for less than 10 percent of CO2 emissions (IEA, 2009). However, to-tal emissions, including indirect emissions associated with electricity and heat, were much higher (indirect emissions depend mainly on the carbon-intensity of electricity use).14
According to the IPCC, improving energy efficiency (EE) in new and existing buildings encompasses “the most diverse, largest, and most cost-effective mitigation opportunities in buildings” (IPCC, 2007). Energy efficiency improvements in building environments can be achieved through the wider deployment of best available technologies (BAT) for heating, ventilation and air conditioning (HVAC), appli-ances, lighting, and cooking. Further reductions are possible by increasing RE use in buildings. Examples of this would include the active collection and transformation of solar energy in buildings and small-scale renewable energy heating and cooling (REHC) systems, such as geothermal heat pumps and wood-pellet stoves. A mapping study prepared by the Tata Energy Research Institute (TERI) identifies a wide range of climate-mitigation technologies and components that are commercially available in the residential and commercial buildings sector (Goswami, Dasgupta and Nanda, 2009). The same study also identifies technologies undergoing research and development.
The TERI mapping study analyses technologies in several key areas (see also Table A.3), as shown below.
• The building envelope: This includes a variety of commercially available insula-tion products (such as foamed plastic, fibreglass, rock wool, cellular concrete, and cellulose), and glazing technologies like tinted glasses.
• Heating, ventilation, and air conditioning (HVAC): Enhanced EE in HVAC and refrige-ration makes an important contribution to energy savings. The TERI study describes specific, highly efficient technologies, such as condensing boilers, which are more energy efficient than most other central heating boilers. Ground-source (geothermal) heat pumps are among the most efficient cooling technologies available; they may also be used for heating. In the near future, micro-CHP (combined heat and power) units are expected to operate in the same manner as domestic central heating boilers. They will also deliver low-carbon electricity into the home and thus reduce the need to buy electricity. The drive toward higher EE creates demand for electronic control and other components that incorporate semiconductors. Such components might include variable-speed drives in air condi-tioners and control instruments (such as programmable thermostats) for air condi-tioning, refrigeration, or heating systems. The TERI study also covers certain household stoves, particularly wood-pellet burning stoves (for heating) and solar cooking stoves.
• Lighting: Very large energy savings are possible in residential and commercial settings when fully commercialized lighting technologies are deployed. For example, switching from incandescent lamps to lighting that uses light-emitting diodes (LED) is one of the cheapest and least capital-intensive GHG abatement options (McKinsey, 2009). Efficient lighting systems include compact fluorescent lamps (CFLs), high-pressure sodium (HPS) lamps, and LED lamps. The TERI study also covers ballasts and control equipment, such as time-scheduled switches, occupancy sensors, and daylight-responsive dimming systems.
• Active collection and transformation of solar energy in buildings: Buildings can serve as collectors and transformers of solar energy, meeting a large part of their energy needs
3.1 Mapping Technologies
8ICTSD Programme on Trade and Environment
on a sustainable basis (IPCC, 2007). Solar energy technologies are discussed in detail in the mapping study on renewable energies (Lako, 2008). Some of these technologies, however, are installed mainly on the rooftops of buildings and can be considered part of the buildings sector. These include solar PV power for electricity generation and solar water heating (SWH), usually for hot water preparation and space heating.
• Appliances: Consumer goods and electronics account for a significant share of energy use in residential and commercial buildings. Most of these products, in particular com-puters, are only loosely connected with the buildings sector, but are heavily traded internationally.
High energy prices generally stimulate de-mand for energy efficient products. How-ever, because there are many obstacles to implementing EE improvements, many deve-loped and developing countries have instigated regulatory requirements, such as minimum energy performance standards (MEPS) and energy labelling, in order to promote market transformation for HVAC, lighting, and appli-ances. Energy efficiency requirements in building codes and incentives for building renovations stimulate demand for insulation materials.15 These requirements also encou-rage people to replace inefficient HVAC with
more efficient models. Fiscal incentives and subsidies (including in the context of stimulus packages) also drive demand for certain energy-efficient products and those that use renewable energy. Examples of new products that have gained market share in recent years are condensing gas boilers and highly efficient heat pumps. Some governments seek to collaborate with energy suppliers in order to improve end-use EE. Feed-in tariffs provide households with an incentive to install small-scale renewable energy systems (for example, a residential PV panel) because the electricity generated can be sold to the utility at an above-market price.
It is suggested that developing countries need to strengthen or develop EE requirements in building codes; develop standards and guidelines for appliances and materials used in buildings (including lighting and insulation); promote energy audits to identify cost-effective opportunities to improve EE and reduce CO2 emissions in buildings; establish standards for household electrical appliances; and provide consumer information about household pro-ducts. In addition, removing obstacles to EE and RE will require these countries to strengthen local capacities (including better quality control); strengthen the capacities of small and medium-sized enterprises (SMEs); and develop or strengthen supply chains and distribution channels. Reaching the very large number of small and dispersed end-users represents a major challenge (Vossenaar and Jha, 2009).
3.2 Policies and Measures
9 R. Vossenaar, V Jha - Technology Mapping of the Renewable Energy, Buildings, and Transport Sectors: Policy Drivers and International Trade Aspects
4. TRANSPORTThe transport sector accounted for approxi-mately 23 percent of global energy related CO2 emissions in 2007. Road transport was responsible for 73 percent of the sector’s CO2 emissions, followed by aviation (11 percent), international shipping (9 percent), and other transport (7 percent) (IEA, 2009). This section focuses on technology options for road tran-sport, which offers the largest potential for future CO2 savings. According to the IEA, improving the fuel economy of light-duty vehicles (LDVs) is one of the most important and cost-effective mitigation measures in the transport sector (IEA, 2008a).
Most of the future CO2 savings in road transport, from a technology point of view, are likely to occur due to a combination of (a) more efficient petroleum-powered vehicles, (b) larger market penetration of alternative, low-carbon vehicles such as hybrid cars,16 plug-in hybrids, electric cars, and (c) increased consumption of biofuels (IPCC, 2007; IEA, 2008a; and IEA, 2009). These three factors are analysed below.17
More efficient petroleum-powered vehicles
There are several ways to make petroleum-powered vehicles more efficient. Listed here are some of the options.
• Further improvements to gasoline and diesel internal-combustion engines (ICEs) are possible with advanced direct injection (DI). Other options include the use of more efficient powertrain options, such as using continuously variable transmissions (CVT), and six-speed or variable transmissions.18
• Non-engine technologies are available that improve auxiliary systems, such as lighting and air conditioning systems. It’s also possible to use rolling-resistant tyres.
• The use of lightweight materials, such as high-strength steel (HSS) or aluminium, is also possible.19
Larger market penetration of low-carbon vehicles
The larger market penetration of electrically powered vehicles depends to a large extent on the availability of incentives and cost-effective components, especially for energy storage. Further development of battery technologies is of critical importance. Several battery technologies are analysed in the mapping study, such as for nickel-metal hybride (NiMH) and lithium-ion (Li-ion) batteries. According to the IEA, Li-ion batteries may become the dominant choice within a few years given their technical advantages over NiMH and other battery types (IEA, 2008a). Further research and development efforts are needed for the future use of hydrogen and fuel-cell vehicles (FCVs).
The move to electric cars is expected to be gradual. Hybrids are the first step, with the ultimate goal being vehicles that run completely on batteries or hydrogen fuel cells.
According to the IEA, the share of hybrids in the global fleet was only 0.15 percent in 2007. The RS includes limited policy support, such as subsidies for hybrids, electric cars, and fuel-cell vehicles in China, the United States, and some European countries. Without larger policy support, the share of non-plug-in hybrids in the global fleet reaches about 8 percent by 2030, but plug-in hybrids and electric cars remain marginal, accounting for only 0.2 percent of the global fleet in 2030. However, in the 450 scenario, the share of conventional ICEs falls to about 40 percent of sales (down from 90 percent in 2007). Hybrids take 30 percent while plug-in hybrids and electric vehicles make up the remainder (IEA, 2009).
Apart from the high prices caused by expensive battery technologies, there are other factors that complicate the introduction of electric vehicles to the market. There is the limited driving range, reduced vehicle performance, and the need to create a battery charging infrastructure, just to name a few. Finally, whereas higher market shares for electric
4.1 Mapping Technologies
10ICTSD Programme on Trade and Environment
vehicles and plug-in hybrids are desirable for reaching policy-driven climate targets, they are insufficient if they are not accompanied by the decarbonisation of the power sector (IEA, 2009).
Biofuels
Biofuel consumption has increased largely as a result of blending policies and, in some countries, the introduction of flex-fuel vehi-cles (FFV), which are able to use any mixture of gasoline and ethanol. Nevertheless, bio-fuels met only around 2 percent of the total world road transport energy demand in 2008 (IEA, 2009).
The 2007 and 2008 increase in biofuel use occurred in the OECD, mainly in North America and Europe (IEA, 2009). The IEA notes that the recent increased demand for biofuels is not expected to continue in the near-term because of concerns that biofuels will affect food prices by diverting crops from food to biofuels. There are also questions about the magnitude of the GHG emissions-savings associated with switching to biofuels and doubts about the environmental sustainability of certain biofuels.21 However, in the RS, biofuels recover and meet 5 percent of total world road transport energy demand by 2030. Close to one-quarter of this increase comes from second-generation technologies (which may be deployed around 2020). In the 450 scenario, the share of world road-transport energy demand met by biofuels almost doubles. Second-generation technologies may be deployed by 2015 (See also Lako, 2008).
Policies and measures include the following factors.
• Fuel-economy or CO2 emissions standards: These may be combined with long-term targets that set tighter standards to help manufacturers plan for the future and provide incentives for continuous improvements.
• Taxes and tax incentives: These may be differentiated on the basis of vehicle efficiency and/or CO2 emissions.
• Penalties imposed on car manufacturers: Penalties can be imposed if the CO2 emissions of a vehicle are above a certain limit.
• Tax credits and “feebates”: These are a combination of fees and rebates, whereby fees on inefficient cars are used to fund rebates for more efficient cars, thus promoting the purchase of low-emission cars.
• Fuel-pricing.
• Fuel-efficient tyres.
• Labelling: Labels include information about EE and CO2 emission performances.
• Car-scrapping.
• Blending mandates: This is done to increase the use of biofuels in road transport.22
In this context, governments in several coun-tries provide tax credits and other incentives that cover several of the areas mentioned above, including manufacturing tax credits. For example, in the United States, under section 48C of the ARRA (see Section I above), tax credits can also be provided to companies that manufacture electric cars, batteries used in electric vehicles, fuel cells, and renewable-fuel refining or blending technologies.
4.2 Policies and Measures
11 R. Vossenaar, V Jha - Technology Mapping of the Renewable Energy, Buildings, and Transport Sectors: Policy Drivers and International Trade Aspects
5. SOME INTERNATIONAL TRADE ASPECTS
In addition to the technology mapping studies, ICTSD has commissioned complementary papers designed to increase public understanding about how the deployment of climate-friendly technologies, and the associated policies and measures, affect international trade. These papers also assess the extent to which import tariffs and non-tariff barriers drive trade flows related to climate-friendly technologies, and evaluate other policy drivers, such as regulations and incentives. Such analysis may be particularly relevant in the context of the WTO negotiations on Environmental Goods and Services (EGS).23
The deployment of RE and EE technologies provides trading opportunities, including for certain developing countries. Some deve-loping countries have a competitive edge in certain technologies.24 For example, China has overtaken Japan as the world’s largest exporter of PV cells and modules (Table A.5); exports from Chinese Chinese Taipei and India are also growing rapidly.25 India was the world’s third largest exporter of wind turbines in 2008 (Table A.6).26 Brazil dominates world exports of bio-ethanol, whereas Argentina, Indonesia, Malaysia and Singapore are significant expor-ters of biodiesel. Brazil, China, Chinese Taipei, India, the Republic of Korea, Malaysia, Mexico, Singapore, and Thailand are significant exporters of several components associated with technologies analyzed in the RE mapping study. However, other developing countries only have a small participation in exports of RE technologies and components (Jha, 2009).27
Capacity additions are often an important driver of international trade. For example, Jha (2009) found that nine of the ten countries that most expanded their wind energy capacity in 2008 are also among the top twenty importers of wind turbines (India being the exception). The United States, which has witnessed strong growth in installed wind-energy capacity (Table A.7), is by far the largest import market for
wind turbines, representing two-thirds of the world’s imports (excluding intra-EU trade) in 2007 (US imports are shown in Table A.8). A United States International Trade Commission (USITC) study found that from 1998 to 2005 changes in imports of wind turbines were closely correlated with annual changes in wind-energy capacity installations. However, that correlation has subsequently weakened, largely because a rise in domestic manufacturing led to a reduction in imports (USITC, 2009). The rapid growth of the US market also induced foreign manufacturers to establish production facilities in the United States (see below). In 2009, the value of US imports of wind turbines was 9 percent lower than in 2008 (Table A.8), although wind-energy capacity additions were 19 percent higher than the year before (Table A.7).
Similarly, very large additions to the installed PV solar capacity in Spain and Germany, especially in 2008 (Table A.9), resulted in significant import increases of PV cells and modules into these markets, particularly from China.28 In 2008, Spanish PV imports from China increased 240 percent to EUR 2.8 billion. Germany’s PV imports from China increased by 91 percent to EUR 2.1 billion. Chinese exports of solar PV cells and modules jumped from USD 5.3 billion in 2007 to USD 11.7 billion in 2008 with exports to Spain and Germany together accounting for almost 70 percent of this increase (Table A.5).29 Although recent developments, in particular in the Spanish PV market, coupled with the economic crisis, led to declining global demand at the end of 2008,30 long-term perspectives for the PV industry are generally good (see Section II).31
As suggested in the case of US wind energy, the correlation between RE installations and imports may weaken over time. This is possible because as countries add more installed capacity, domestic industry will develop more capacity to supply RE equipment and components.32 Governments that play a key role in stimulating the take-off of RE capacity by providing incentives may seek to ensure
5.1 Drivers of International Trade
12ICTSD Programme on Trade and Environment
maximum benefit for domestic industry and employment, especially when incentives are provided through stimulus packages. In addition, companies that operate at a global scale may prefer to supply RE equipment and components through subsidiaries or joint ventures, rather than as direct exports.33 This would also allow them to benefit from incentives provided to local manufacturers. For example, subsidies provided under ARRA for the generation of wind-energy and the manufacturing of components may have attracted foreign companies to set up production facilities to the United States.
Countries that have added wind-energy capacity, such as China and the United States, are also expanding exports of wind turbines and components. For example, the value of US exports of wind turbines showed a large increase in 2009 (although from a low base), reaching USD 117 million.
Investment in EE improvements may also create markets for new products34 and become a driver of trade. An important issue in the area of EE is market transformation, i.e. the larger market participation of (relatively more) energy-efficient products, including in international trade. A study of the residential and commercial buildings sector carried out for the ICTSD found that the share of energy-efficient lamps (CFL and HPS) in worldwide trade (including developing country imports) increased in 2002-2008. Meanwhile, the share of (generally inefficient) incandescent and tungsten halogen lamps has been decreasing (Vossenaar and Jha, 2009). China is the world’s largest exporter of CFL (Table A.11) and has played an important role in market transformation,35 as have multilateral efforts to help developing countries set up certification mechanisms for high-quality products.36
A large share of the air conditioners, refri-geration equipment, and appliances imported into the EU (excluding intra-EU trade), the United States, and Japan come from a small number of developing countries. The most prominent of these exporters are China, Malaysia, the Republic of Korea, and Thailand. Producers in developing countries are often
subsidiaries of transnational corporations or large contract manufacturers for companies in importing countries. These countries are also major suppliers to other developing countries. Exporters from these countries have already made efforts to comply with stringent EE requirements in their export markets, as well as with those of their own MEPS and EE programmes. As a result, they have the potential to contribute significantly to global market transformation.
International trade in electric cars and the batteries used in electric motor vehicles is still very small. The value of 2008 EU imports of electric vehicles37 was only EUR 43 million, of which EUR 16 million was intra-EU trade (Table A.12). The value of world exports (excluding intra-EU trade) of batteries that are most likely to be used in electric cars38 was USD 11.3 billion, with Japan, China and other Asian countries dominating the market (Table A.13). The value of US imports of batteries used in electric cars was USD 42 million in 2008 and USD 23 million in 2009.39
Some aggregated trade figures for the products and components that may be associated with the deployment of climate-friendly tech-nologies in the three sectors covered by the mapping studies (renewable energy supply, buildings and road transport) are shown in Table A.14. These figures are obtained from COMTRADE statistics at the 6-digit HS level and must be interpreted very carefully. The trade values shown are much larger than actual trade in relevant products and components. First, most 6-digit HS codes include unrelated products. Second, in the case of components, total trade under the provisions of a particular 6-digit HS code is included, although only a small part, if any, may be related to the deployment of renewable energy technologies and products (see Jha, 2009).
The reduction of tariff and non-tariff barriers may contribute to the diffusion of climate-friendly technologies by reducing the cost of
5.2 Tariffs, Non-Tariff Measures, and Subsidies
13 R. Vossenaar, V Jha - Technology Mapping of the Renewable Energy, Buildings, and Transport Sectors: Policy Drivers and International Trade Aspects
equipment and components. Jha (2009) found that tariffs are, in general, a less significant explanatory variable for the increased exports or imports of RE equipment and components than other variables such as subsidies and other incentives. Similarly, a recent study of the wind-energy industry, published by the World Resources Institute (WRI), found that the principal obstacles to global integration in the wind-energy industry are formal and informal non-tariff barriers that distort investment decisions.40 These barriers played a larger role than import tariffs and intellectual property rights (Kirkegaard, Hanemann and Weischer, 2009). However, Jha (2009) found that patents were important in promoting exports of RE equipment and components.
Tariffs
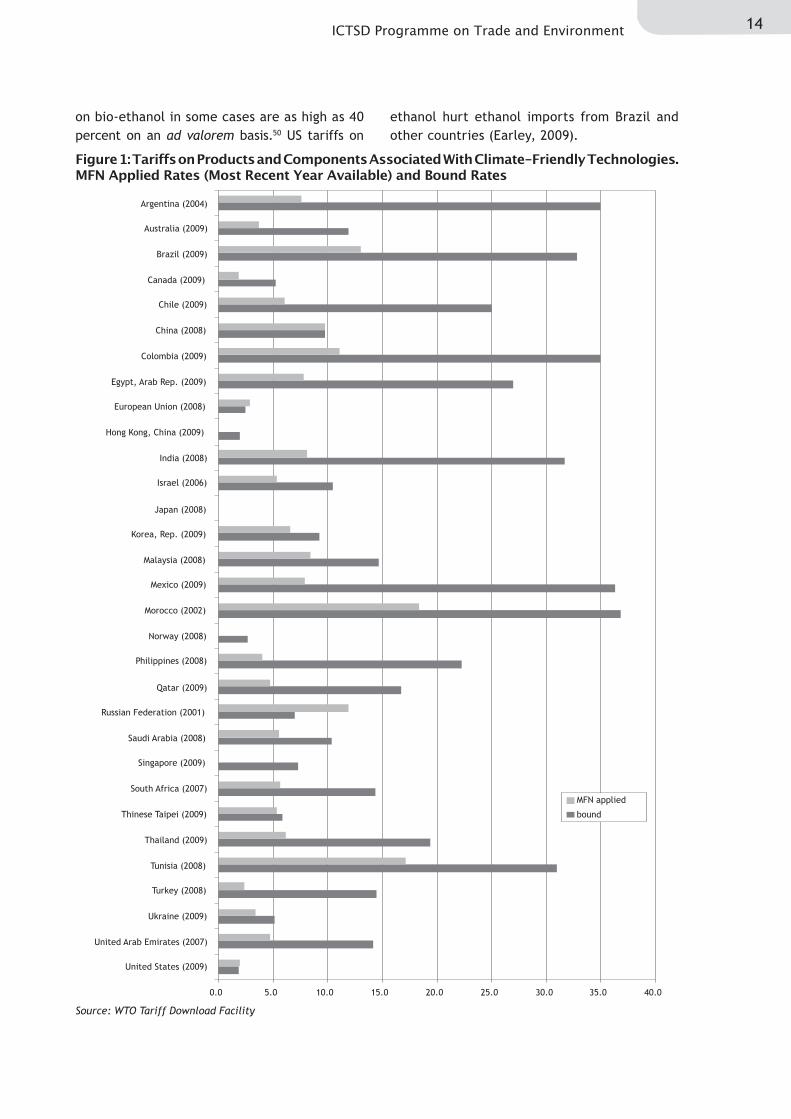
In developed countries, MFN tariffs are very low. In many developing countries, MFN applied tariffs for products and components that may be associated with climate-friendly are more significant (See Figure 1).41
In China, MFN applied tariffs are mostly in the 8 to 12 percent range and the simple average is close to 10 percent.42 In India, most MFN applied tariffs are either 7.5 or 10 percent, with a simple average of slightly above 8 percent. In Brazil, the simple average of MFN applied rates is around 13 percent. In South Africa, most tariffs are in the 0 to 15 percent range, with a simple average of around 5 per cent.
Solar cells and panels (which are part of HS 854140) enter most markets (including China and India) duty-free.43 As much as 99.5 per-cent of the world’s solar panel imports in 200844 (in value terms and excluding intra-EU trade) enjoyed zero MFN applied rates. (For developing country importers alone this portion was 98.5 percent). However, in many developing countries MFN applied rates for solar water heaters (which are part of HS 841919) are rather high (for example, 20 per-cent in Brazil and 35 percent in China).
Import tariffs for wind turbines (HS 850231) are, in general, relatively low (5 percent or
less in most countries).45 The simple average of import tariffs is 3.8 percent and the trade-weighted (2008 imports) average is around 2 percent. The United States, by far the largest importer, applies an import duty of 1.3 per-cent. Applied rates in several developing countries are higher: 7.5 percent in India and 8 percent in China and the Republic of Korea. Some relatively important developing country importers of wind turbines have applied rates of 10 percent (e.g. Mexico and Chinese Taipei). Brazil recently increased its applied rate to 14 per cent. In most developing countries, applied rates for wind-energy components46 are in the 5 to 10 percent range. (In Brazil, the rate for most components used in wind-energy is in the 14 to 16 percent range.)
In the case of building insulation products, the simple average applied rate for selected products47 is between 5 and 8 percent (Vos-senaar and Jha, 2009). Some countries (e.g. Belarus, China, India, Malaysia, Mexico, the Russian Federation, and South Africa) have applied rates of 10 percent or more.
In the transport sector, applied rates for electric vehicles (which are part of HS 8703.90) are generally the same as for petroleum-based vehicles (HS 870321-870333). Tariffs are quite high in most developing countries (the simple average applied rate in 25 developing countries is over 25 percent). Therefore, lowering tariffs on electric vehicles could, in principle, help to make electric cars more attractive vis-à-vis other vehicles. Lower tariffs on NiMH and Li-ion batteries (which are part of HS 8507.80) may also reduce the cost of electric cars. However, domestic taxes and incentives may be more efficient for promoting electric cars. In any case, other measures are needed to facilitate the market penetration of electric cars, such as the creation of an electric-charging infrastructure.
In the case of bio-ethanol,48 the removal or reduction of import duties in key markets may have significant impacts on trade. The United States, for example, applies an ad valorem tariff of 2.5 percent, but there is a secondary duty of 14.27 cents per litre.49 Specific tariffs
14ICTSD Programme on Trade and Environment
on bio-ethanol in some cases are as high as 40 percent on an ad valorem basis.50 US tariffs on
ethanol hurt ethanol imports from Brazil and other countries (Earley, 2009).
Figure 1: Tariffs on Products and Components Associated With Climate-Friendly Technologies. MFN Applied Rates (Most Recent Year Available) and Bound Rates
Source: WTO Tariff Download Facility
15 R. Vossenaar, V Jha - Technology Mapping of the Renewable Energy, Buildings, and Transport Sectors: Policy Drivers and International Trade Aspects
While there is a large convergence of views that promoting enhanced EE and the larger use of RE are desirable and offer potential for environmental, developmental and trade gains, building consensus on how tariff liberalisation may best help to harness such potential has proven to be complicated. This is an issue of particular concern where the environmental benefits of tariff reductions are uncertain, as may often be the case of most multiple-use products.
It is sometimes suggested that tariff liberalisa-tion could focus on products with predominantly single-environmental use with a view to minimising problems related to multiple-use products. Smaller developing countries which seek to promote the deployment of RE and EE technologies often do not have (or find it difficult to develop) the capacity to produce products and components across the supply chain. As a result, they may focus on liberalising imports of finished products (such as solar PV modules and wind turbines) with clear environmental benefits.
However, focusing liberalisation on finished products may affect tariff structures and, in some cases, result in negative effective rates of protection. For example, until recently, Brazil applied a zero import duty on imports of wind turbines, but a 14 to 16 percent rate on importable components (towers, blades, ball bearings, gear boxes, generators, and motor parts). In theory, this resulted in a negative effective rate of protection. In China and India, however, the tariff rates applied to wind turbines and components are roughly the same (around 8 and 7.5 percent, respectively, see table A.15).
Larger developing countries that are imple-menting policies to promote the deployment of RE technologies through ambitious tar-gets, incentives, and regulations tend to attach high priority to developing strong domestic manufacturing capacities across the supply chain. For example, one important consideration in Brazil’s recent decision to
increase import tariffs on wind-turbines was to attract companies that operate globally to set up production facilities in Brazil (see also footnote 55). In India, one of the objectives of the Jawaharlal Nehru National Solar Mission is to transform India into a solar energy hub with a leadership role in low-cost, high quality solar manufacturing across the supply chain, including balance of system components.51
The above trend may have implications for tariff policies. Developing countries with a sufficiently large domestic market to develop cost-effective manufacturing capacities at different stages of the supply chain may be more interested in liberalising imports of certain intermediate products (such as solar cells, silicon ingots, gear boxes, and electronic control equipment). India’s National Solar Mission, for example, recommends that concessions be made available in the area of import and excise duties on specific capital equipment, critical materials and components, and project imports.
Subsidies and other incentives
Analysis of the RE supply and buildings sectors show that many RE and EE technologies only take off with substantial government intervention, such as through regulations, incentives (in the form of tax credits and subsidies), and other forms of support measures, often backed up by targets. For example, feed-in tariffs and large support through stimulus packages have played a crucial role in the deployment of RE technologies for electricity generation.52
In some cases, subsidies and other incen-tives (which may be rapidly reduced or discontinued53) may also contribute to erratic market developments, as is illustrated by the exponential growth (in 2008) and the sub-sequent contraction (in 2009) of Spanish and German imports of PV cells and modules. The Chinese and Indian PV industry may have been overly dependent on the European market, which is supported by government subsidies and feed-in tariffs. The reduction of these
16ICTSD Programme on Trade and Environment
incentives, for example in Spain, contributed to a slowdown of imports and to over capacity, including in China and India. These countries are now adopting ambitious targets and introducing subsidies to strengthen the domestic market for PV cells and modules. India, for example, could “change from a production hub into one of the largest PV markets in the world” (SolarPlaza, 2010).
Certain subsidies may be justified, particularly in the case of renewables, because econo-mies of scale are necessary to decrease costs and to promote the broader deployment of technologies, including in developing countries.
However, subsidies should be phased out over time to stimulate technological progress and reduce costs. Developing countries have less capacity to provide subsidies that promote investment in RE generation. Where there is sufficient economic capacity to develop equipment associated with RE products and components, tariffs may play a role in attracting foreign direct investment and helping manufacturers to develop the capacity to participate cost-effectively in supply chains.54 Some incentives and measures that benefit domestic equipment manufacturers, including localization requirements, may have trade-distorting effects.
17 R. Vossenaar, V Jha - Technology Mapping of the Renewable Energy, Buildings, and Transport Sectors: Policy Drivers and International Trade Aspects
6. CONCLUSIONSThe mapping studies carried out for ICTSD illustrate the large potential to reduce CO2 emissions by using energy more efficiently. Also, emissions can be reduced by increasing the share of renewables in energy generation through the deployment of existing and proven technologies. Large increases in RE generating capacity (in particular of solar and wind energy which, among all renewables, may have the clearest and largest implications for international trade) and the drive toward EE improvements have been creating markets for climate-friendly technologies and their components. Despite some set-backs in the short run, such markets are expected to continue to grow long-term, especially as governments commit to more ambitious climate-mitigation policies. Although the share of renewables (excluding traditional biomass) in the global primary energy mix was only 7 percent in 2006, in the IEA 450 scenario, solar and wind energy capacity additions may account for approximately one third of total energy capacity additions from 2008 until 2030 (Table 3).
A number of developing countries have made progress in improving EE and in increasing the share of renewables in their energy mix. Some have gained a competitive edge in the supply of climate-friendly technologies and their com-ponents. However, in many developing coun- tries a number of non-technological and eco-nomic factors stand in the way of the de-ployment of RE technologies. These include insufficient technical knowledge and absor-ption capacity to produce these innovative technologies locally; insufficient market size to justify local production units; and insufficient purchasing power and financial resources to acquire the innovative products (Jha, 2009).
Trade liberalisation, or the reduction of tariff and non-tariff barriers, may make climate-friendly technologies and components cheaper and more easily available, particularly in
developing countries. On the other hand, deve-loping countries may need a certain level of tariff protection to build up local capacities, where economically viable, to supply goods and components associated with the deployment of RE and EE technologies, in particular if the scope for other support measures is limited. Tariffs may also play a role in attracting FDI. Moreover, trade liberalisation alone is unlikely to stimulate a significant uptake of EE and renewable energy technologies. As the experience of developed countries shows, the deployment of such tech-nologies is largely driven by regulations and incentives. Therefore, trade liberalisation may be effective in promoting the uptake of RE and energy-efficient technologies in developing countries, only if it is implemented as part of an integrated national policy that includes targets, incentives and regulations. Such policy should be supported and enabled by sharing knowledge about technologies, financing, and capacity-building.
The analysis of the buildings and transport sectors indicates that negotiating trade libera-lisation based on EE criteria may face significant conceptual and practical challenges. However, beyond the EGS negotiations, trade and FDI may contribute to market transformation through the diffusion of EE technologies.
Incentives are expected to continue to play an important role in promoting the deployment of RE technologies. Certain incentives and measures that benefit domestic equipment manufacturers, such as localization requirements and subsidies for the manufacturing of RE equipment and components, may have trade-distorting effects. Subsidies should not be implemented in a way that adversely affects developing countries that are attempting to develop national capacities in RE supply. Subsidy implementation also should not hinder suppliers in developing countries from participating in global supply chains.
18ICTSD Programme on Trade and Environment
ENDNOTES1 This note focuses on the use of technologies as a major determinant of energy use and/
or CO2 emissions. Non-technological options (such as changes in behaviour) also play an important role in reducing energy use and CO2 emissions, but are not analysed.
2 Annual growth rates may be lower in the future. For example, in the United States, the level of new wind installations in 2008 was more than double the level considered necessary by the US Department of Energy (DOE) to meet its long-term targets. The DOE determination was based on its goal of increasing the contribution of wind energy to US electricity supply to 20 per cent by 2030. Under the DOE’s 20 per cent wind scenario, new wind-power capacity installations would increase to more than 16,000 MW per year by 2018, and continue at roughly that rate through 2030 (US Department of Energy, 2008).
3 The global financial crisis had a significant impact on investment in sustainable energy in the second half of 2008. That year investment was 17 per cent lower than in the first half of 2007 and 23 per cent lower than in the last half of 2007. Total investment in 2008 was USD 155 billion, an increase of only 5 per cent over 2007 (in stark contrast to the growth rates of over 50 per cent in previous years). The USD 155 billion invested in companies and projects globally in 2008 was more than four times more than the amount invested in 2004. The largest investments were in wind energy, solar energy, and biofuels (UNEP, 2009).
4 The solar PV market may have shrunk in value terms as a result of lower prices.
5 In late 2009, India’s government announced an ambitious target to expand cumulative installed solar power from 110 MW in 2008 to 20,000 MW in 2022. Cumulative installed solar power in India is only 110 MW, with only 3 MW added in 2008 (SolarPlaza, 2010).
6 The GWEC estimates that 13,000 MW of new capacity was added in 2009, resulting in an accumulated capacity of 25,000 MW at the end of 2009, compared to 12,000 at the end of 2008 (GWEC, 2010).
7 The EUR 5 billion EU Economic Recovery Plan includes EUR 255 million for offshore wind energy.
8 According to the IEA World Energy Outlook 2008, if traditional biomass is excluded, the share of renewables (including modern biomass) in the global primary energy mix was 7 per cent in 2006 (IEA, 2008b). In developing countries, the traditional use of biomass in general entails inefficient combustion, often combined with significant local and indoor air pollution, and an unsustainable use of biomass resources such as native vegetation (Lako, 2008).
9 The RS assumes that governments make no changes to their existing policies and measures.
10 Annual growth rates presented in this note are compounded average annual growth rates.
11 In the case of hydropower, 80 per cent of new capacity is installed in developing countries.
12 The 450 scenario assumes that collective policy action is taken to limit the long-term concentration of GHG in the atmosphere to 450 parts per million of CO2-equivalent (ppm CO2-eq). The 450 scenario assumes a large-scale shift to renewables, which typically have
19 R. Vossenaar, V Jha - Technology Mapping of the Renewable Energy, Buildings, and Transport Sectors: Policy Drivers and International Trade Aspects
lower overall utilisation rates. Therefore, more capacity has to be added to meet the same electricity demand (IEA, 2009).
13 This is lower than the 25 per cent annual growth achieved in 2004-2008 (from a very low base).
14 Stern found that (in 2004) buildings accounted for 8 per cent of global GHG emissions, or 20 per cent if indirect emissions are included (Stern, 2007).
15 A recent survey (Janda, 2009) found that, in 2009, 61 countries (including twenty-seven developing countries and Kazakhstan) had some form of mandatory and/or voluntary energy standards for buildings, whereas eleven countries (including six developing countries) had proposed standards. In some cases, such standards covered only non-residential buildings.
16 Hybrid cars combine a fuel-driven power source, such as a conventional internal combustion engine with an electric drive train (electric motor/generator and a battery).
17 The technology mapping study prepared for ICTSD by the Energy Research Institute, China (Kejun, 2009), closely follows the IPCC analysis (see Table A.4).
18 In the United States, transmissions have become more efficient for two reasons. First, electric control systems have been increasingly substituted by lockup or semi-automatic lockup control systems (the share of CVT in total new light-vehicle control systems increased from 1.2 per cent in 2004 to 7.8 per cent in 2008). Second, available now are transmissions with a larger number of speeds, which allows the engine to operate at its optimum efficiency for a greater period of time. The market share of six-gear transmission systems has increased from 3 to 18.6 per cent over the same period. Transmission suppliers played a key role in this particular shift toward higher efficiency (US Department of Energy, 2009).
19 In the United States, the overall share of advanced materials (HHS, stainless steel, other advanced steels, aluminium, magnesium, and plastic and plastic composites) in an average light vehicle increased from 29.6 per cent in 2003 to 31.4 per cent in 2007. Meanwhile, the share of regular steel declined from 41.4 to 40.3 per cent. The average weight of new vehicles nevertheless increased between 2004 and 2008 (0.7 per cent increase for light-duty vehicles and a 2.3 per cent increase for cars) as consumers bought vehicles with more powerful engines (US Department of Energy, 2009).
20 In Brazil, the introduction of FFVs rejuvenated the market for ethanol as a motor fuel by protecting motorists from wide swings in the price of either fuel (IPCC, 2007). In 2008, FFVs represented 90 per cent of new vehicles sold in Brazil. By the end of 2008, FFVs represented 24 per cent of the 27.8 million passenger cars in circulation. Cars running only on biofuels represented another 10 per cent, and cars fuelled by diesel represented 8 per cent. Only 58 per cent of cars in circulation are fuelled by gasoline only (InfoMoney, 2009). In the United States, there are more than seven million FFVs in operation and these vehicles can be fuelled by gasoline, E85 (a fuel made from 85 per cent ethanol and 15 per cent gasoline), or any combination of the two (US Department of Energy, 2009).
21 For example, Germany has reduced its blending target for 2009 from 6.25 to 5.25 per cent.
22 In early 2009 some twenty-three countries, including seventeen developing countries (Argentina, Bolivia, Brazil, Chile, China, Colombia, Dominican Republic, India, Jamaica,
20ICTSD Programme on Trade and Environment
the Republic of Korea, Malaysia, Paraguay, Peru, the Philippines, South Africa, Thailand, and Uruguay) had biofuels blending mandates. For details see Renewables Global Status Report: 2009 Update, Table R12.
23 The EGS negotiations may be relevant for the deployment of part of the climate-friendly technologies identified by the IPCC. Most of these technologies are in the area of RE, such as wind and solar energy (see also Wooders, 2009). However, EGS negotiations (in particular on tariffs) may have no discernable impact on several other technology options analysed in the mapping studies, e.g. those aimed at improving the fuel-efficiency of vehicles. Similarly, negotiating trade liberalisation based on EE criteria faces significant conceptual and practical challenges, in particular where tariff classifications do not allow to differentiate (relatively more) energy-efficient products from other products in the same category (e.g. appliances, a heavily-traded product group in the buildings sector). However, beyond the EGS negotiations, trade may contribute to market transformation through the diffusion of EE technologies.
24 In 2008, ten of the world’s twenty largest PV power suppliers were from developing countries (six from China, three from Chinese Taipei and one from India). Their share in the market (held by the twenty largest suppliers) in terms of MW was 41 per cent (EDN, 2008).
25 Assembling of imported intermediate goods may have played a relatively important role in the increase of Indian exports.
26 Three of the ten largest wind-turbine manufacturers are from developing countries (two from China and one from India) (Lako, 2008).
27 In terms of value, developing countries accounted for approximately 40 per cent of the world’s RE technology and component exports in 2008 (excluding intra-EU trade), as identified in Jha (2009). China accounted for almost half of this. The thirteen largest exporters (in descending order) were China, Korea, Chinese Taipei, Singapore, Brazil, Mexico, India, Malaysia, Thailand, Turkey, Argentina, the Philippines, and South Africa. These nations accounted for 97 per cent of the value of total RE technology and component exports from developing countries. These countries are also the key exporters of industrial products (HS 28-97) in general. Trade figures on RE technologies and components have to be interpreted very carefully (for a discussion see Jha, 2009).
28 Trade figures expressed in value terms may hide strong price (and exchange rate) fluctuations. For example, since prices of PV panels have been falling significantly in recent years, trade flows expressed in value terms underestimate the strong growth in import demand for PV panels. In 2009, EU imports of PV panels from outside the EU declined 3 per cent in value (euro) terms, but increased significantly in volume terms (Table A.10).
29 Spanish and German import demand also induced Indian PV cell and module manufacturers to increase export-oriented production capacity (SolarPlaza, 2010). In 2008, Indian exports to Spain and Germany grew by a factor of five to more than USD 400 million, which was more than three-fourths of total Indian exports.
30 The size of the Spanish PV market shrank as new-installed capacity eligible for incentives in the form of feed-in tariffs were capped at 500 MW in 2009. This implies that the size of the Spanish PV market would be 2,100 MW (80 per cent) lower than in 2008. Reports show that many of the hundreds of PV module manufacturers had gone out of
21 R. Vossenaar, V Jha - Technology Mapping of the Renewable Energy, Buildings, and Transport Sectors: Policy Drivers and International Trade Aspects
business (SolarPlaza, 2009). However, significant new incentives were introduced in other countries, for example in China (e.g. the Golden Sun Programme) and Japan (subsidies and feed-in tariffs).
31 Solarbuzz estimates that the world solar PV market (in terms of annual installed capacity additions) increased by approximately 5 per cent in 2009 (Solarbuzz, 2010). There was strong growth in Germany, in part in anticipation of reductions in feed-in tariffs in 2010.
32 The growing wind power market in China has encouraged domestic production of wind turbines and components. In addition, the Chinese manufacturing industry is becoming increasingly mature, stretching over the whole supply chain (GWEC, 2008).
33 The rapid growth of the US market has turned the United States into an important destination for FDI. Almost all leading European, Japanese, and Indian wind turbine producers operated production facilities in the United States or planned to begin operating there by 2010. China has experienced a similar, if smaller, recent boom of FDI in wind energy equipment manufacturing (Kirkegaard, Hanemann and Weischer, 2009).
34 One study (McKinsey, 2009b) estimates that the size of the global market for smart home solutions (technologies that intelligently regulate a household’s or company’s energy use by lowering the temperature or switching off the lights in a room that is not in use) is around EUR 400 million a year. The study argues that this market is still in its early stages because there are so few mature products and because potential customers are hesitant. Still the market could grow by a factor of five by 2020.
35 According to the US ENERGYSTAR website, out of 260 CFL manufacturers participating in the programme, eighty are located in China.
36 Such as the Efficient Lighting Initiative (ELI) supported by the International Finance Corporation and the Global Environment Facility.
37 Tariff item CN 8703.90.10 (cars with electric motors).
38 HS 850780 “Other accumulators,” which include nickel-metal hydride and lithium-ion accumulators.
39 The Harmonized Tariff Schedule of the United States (HTSUS) has separate tariff lines for batteries used in electric cars.
40 According to the WRI study, these include local content requirements, divergent national industrial standards and licensing demands, and, especially, political expectations.
41 Some developing countries may apply relatively high import tariffs at the border, but grant significant fiscal incentives (e.g. internal tax reductions or exemptions). In Brazil, for example, there are fiscal incentives for solar and wind-energy products.
42 Averages are calculated for a subset of products identified in ICTSD studies.
43 According to WTO tariff information, 68 out of 119 WTO members (including all developed members) have zero MFN applied rates. Only about twenty countries (including, for example, Nigeria and the Russian Federation) apply import tariffs of 10 per cent or more. Information on average applied rates, contained in the WTO Integrated Data Base (IDB), was accessed in January 2010, using the WTO Tariff Download Facility (http://tariffdata.wto.org/). Brazil applies a 12 per cent rate to PV panels (8541.40.3 of the Common External Tariff).
22ICTSD Programme on Trade and Environment
44 This concerns imports by WTO Members that have reported 2008 import statistics to COMTRADE (and actually imported solar panels).
45 According to WTO tariff information, 93 out of 119 WTO members apply tariffs of 5 per cent or less, with forty-four of them granting duty-free access on an MFN basis. Only twenty-two WTO members apply rates of 10 per cent or more. In terms of 2008 trade values, 87 per cent of global wind turbine imports faced applied rates of 5 per cent or less.
46 Such as towers, blades, gearboxes, generators, and ball bearings (see Table A.1).
47 This concerns products with a (predominantly) “environmental end-use,” particularly slag wool and rock wool (HS 680610), mineral insulating materials and articles (HS 680690), multiple-walled insulating units of glass (HS 700800), and glass-fibre insulation products (HS 701939).
48 Bio-ethanol is not an industrial product in the WTO context.
49 In the United States, the general rate of duty for imports of biodiesel (HTSUS code 3824.90.4020) is 4.6 percent ad valorem. In the EU, the third country rate of duty for biodiesel (CN 38249091) is 6.5 per cent ad valorem (Jha, 2009).
50 In the European Union, the MFN applied and the bound tariff for imports of undenatured alcohol, are both 19.2 EUR/hl; for denatured alcohol they are 10.2 EUR/hl. The ad valorem equivalents of these tariffs have been estimated at 63 and 39 per cent respectively (Erixon, 2009).
51 South Africa’s government policy, which has set a target to install more than three million SWH systems over the next five years, is to develop local industry. Due to the lack of local production capacity, SWH must be imported in the short- to medium- term future (Tudor-Jones, 2009).
52 The IEA, in its World Energy Outlook 2009 (Figure 4.4), estimates that G20 stimulus packages committed in 2009 (for a total of USD 2.6 trillion) had a “low-carbon” or “green energy” component (covering green energy generation and EE) of USD 242 billion (this includes only additional commitments to stimulate investment, newly announced in 2009). Of this amount, USD 67 billion is to be invested in the buildings sector, USD 21 billion in vehicle efficiency and USD 20 billion in RE. Another USD 108 billion will be invested in rail transport (IEA, 2009).
53 Delays in the extension of production tax credits have contributed to erratic development of annual wind-energy capacity additions in the period 2000 to 2004.
54 In June 2009, Brazil increased import tariffs on wind turbines with capacity of up to 3,300kVA from zero to 14 per cent. This increase was a national exception to the MERCOSUR Common External Tariff. It should be noted that the bound tariff is 35 per cent. The government preferred the tariff increase over other measures affecting imports. The Brazilian Ministry of Mines and Energy (MME) held the first wind-energy auction in December 2009, as part of the ongoing Program of Incentives for Alternative Electricity Sources (PROINFA). This government programme aims to promote the use of renewable technologies for electricity production. Through that auction, 71 wind energy projects were contracted for a total capacity of 1800 MW.
23 R. Vossenaar, V Jha - Technology Mapping of the Renewable Energy, Buildings, and Transport Sectors: Policy Drivers and International Trade Aspects
REFERENCES
American Wind Energy Association (AWEA), 2009. U.S. and China in Race to the Top of Global Wind Industry. February 2, 2009.
Earley, J (2009). U.S. Trade Policies on Biofuels and Sustainable Development, ICTSD, Geneva, Switzerland.
Erixon F (2009). Green Protectionism in the European Union: How Europe’s Biofuels Policy and the Renewable Energy Directive Violate WTO Commitments. Fredrik Erixon, European Centre for International Policy Economy (ECIPE). ECIPE Occasional Paper No. 1/2009, Brussels, 2009.
Global Trade Alert (2009). “Brazil: Public Procurement ban and tariff increase on imported wind turbines”. Published 6th August 2009. Accessed at: http://www.globaltradealert.org/measure/brazil-public-procurement-ban-and-tariff-increase-imported-wind-turbines.
Goswami A, Dasgupta M and Nanda N (2009). Mapping Climate Mitigation Technologies and Associated Goods within the Buildings Sector. The Energy and Resources Institute (TERI), India. Study for the ICTSD.
GWEC (2008). Global Wind Energy Report 2008. Global Wind Energy Council. Belgium, 2009.
GWEC (2010) Global Wind Energy Report 2009. Global Wind Energy Council. Belgium, 2010.
IEA (2008a). Energy Technology Perspectives: Scenarios & Strategies to 2050. OECD/IEA, 2008.
IEA (2008b). World Energy Outlook 2008. OECD/IEA 2008.
IEA (2009). World Energy Outlook 2009. OECD/IEA 2008.
InfoMoney (2009). Roberta de Matos Vilas Boas. Participação de carros flex na frota brasileira cresce de 16% para 24% em um ano. Published 21/08/09. Accessed at: http://web.infomoney.com.br/templates/news/view.asp?codigo=1655491&path=/suasfinancas/carros/cotidiano/.
IPCC (2007). B. Metz, O.R. Davidson, P.R. Bosch, R. Dave, L.A. Meyer (eds). Fourth Assessment Report (AR4). Climate Change 2007: Mitigation of Climate Change. Contribution of Working Group III to the Fourth Assessment Report of the Intergovernmental Panel on Climate Change, 2007. Cambridge University Press, Cambridge, United Kingdom and New York, NY, USA.
Janda K B (2009). “Worldwide Status of Energy Standards for Buildings: A 2009 Update.” In Proceedings of the ECEEE Summer Study, June 1-6, 2009 (Colle Sur Loop, France). Vol. 1, pp. 485-491. European Council for an Energy-Efficient Economy.
Jha V (2009). Climate Change, Trade and Production of Renewable Energy Supply Goods: The Need to Level the Playing Field. Paper prepared for the ICTSD.
Kejun J (2009). Mapping Climate-Mitigation Technologies/Goods within the Transport Sector. Draft study prepared for the ICTSD by Jiang Kejun, Energy Research Institute, China.
Kirkegaard J F, Hanemann T and Weischer L (2009). It should be a breeze: harnessing the potential of open trade and investment flows in the wind energy industry. World Resources Institute, Working Paper Series. WP 09-14. December 2009. Washington.
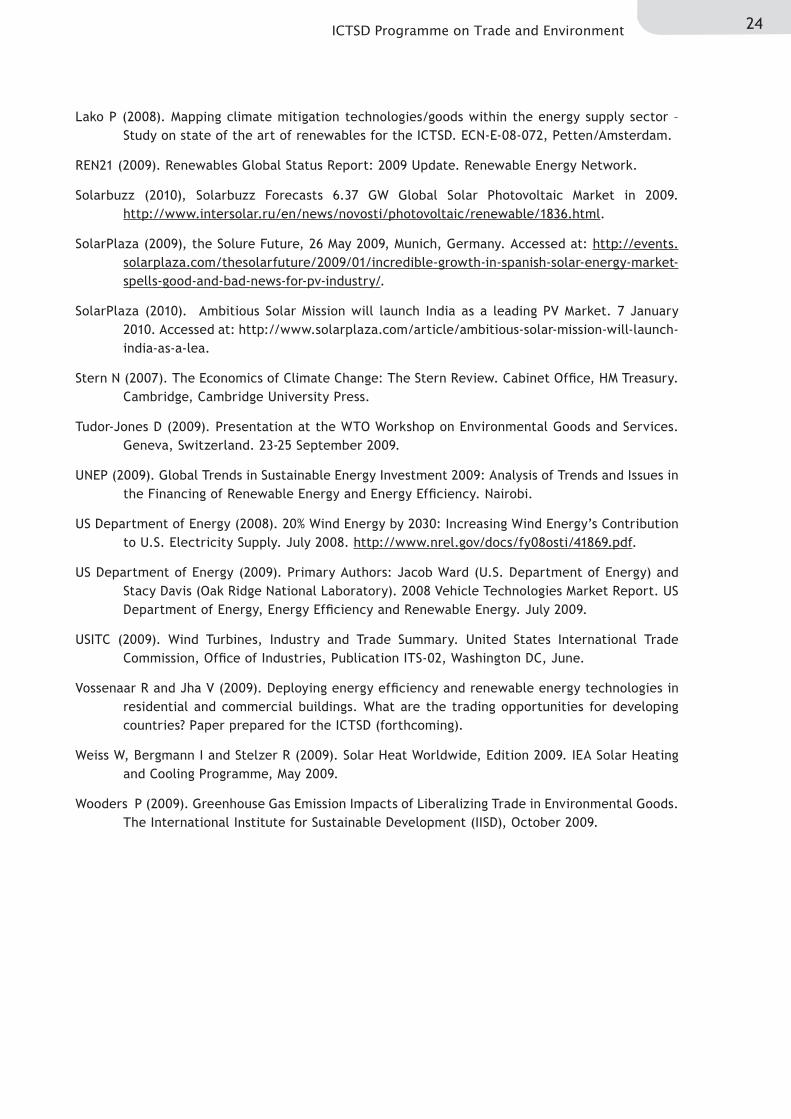
24ICTSD Programme on Trade and Environment
Lako P (2008). Mapping climate mitigation technologies/goods within the energy supply sector – Study on state of the art of renewables for the ICTSD. ECN-E-08-072, Petten/Amsterdam.
REN21 (2009). Renewables Global Status Report: 2009 Update. Renewable Energy Network.
Solarbuzz (2010), Solarbuzz Forecasts 6.37 GW Global Solar Photovoltaic Market in 2009. http://www.intersolar.ru/en/news/novosti/photovoltaic/renewable/1836.html.
SolarPlaza (2009), the Solure Future, 26 May 2009, Munich, Germany. Accessed at: http://events.solarplaza.com/thesolarfuture/2009/01/incredible-growth-in-spanish-solar-energy-market-spells-good-and-bad-news-for-pv-industry/.
SolarPlaza (2010). Ambitious Solar Mission will launch India as a leading PV Market. 7 January 2010. Accessed at: http://www.solarplaza.com/article/ambitious-solar-mission-will-launch-india-as-a-lea.
Stern N (2007). The Economics of Climate Change: The Stern Review. Cabinet Office, HM Treasury. Cambridge, Cambridge University Press.
Tudor-Jones D (2009). Presentation at the WTO Workshop on Environmental Goods and Services. Geneva, Switzerland. 23-25 September 2009.
UNEP (2009). Global Trends in Sustainable Energy Investment 2009: Analysis of Trends and Issues in the Financing of Renewable Energy and Energy Efficiency. Nairobi.
US Department of Energy (2008). 20% Wind Energy by 2030: Increasing Wind Energy’s Contribution to U.S. Electricity Supply. July 2008. http://www.nrel.gov/docs/fy08osti/41869.pdf.
US Department of Energy (2009). Primary Authors: Jacob Ward (U.S. Department of Energy) and Stacy Davis (Oak Ridge National Laboratory). 2008 Vehicle Technologies Market Report. US Department of Energy, Energy Efficiency and Renewable Energy. July 2009.
USITC (2009). Wind Turbines, Industry and Trade Summary. United States International Trade Commission, Office of Industries, Publication ITS-02, Washington DC, June.
Vossenaar R and Jha V (2009). Deploying energy efficiency and renewable energy technologies in residential and commercial buildings. What are the trading opportunities for developing countries? Paper prepared for the ICTSD (forthcoming).
Weiss W, Bergmann I and Stelzer R (2009). Solar Heat Worldwide, Edition 2009. IEA Solar Heating and Cooling Programme, May 2009.
Wooders P (2009). Greenhouse Gas Emission Impacts of Liberalizing Trade in Environmental Goods. The International Institute for Sustainable Development (IISD), October 2009.
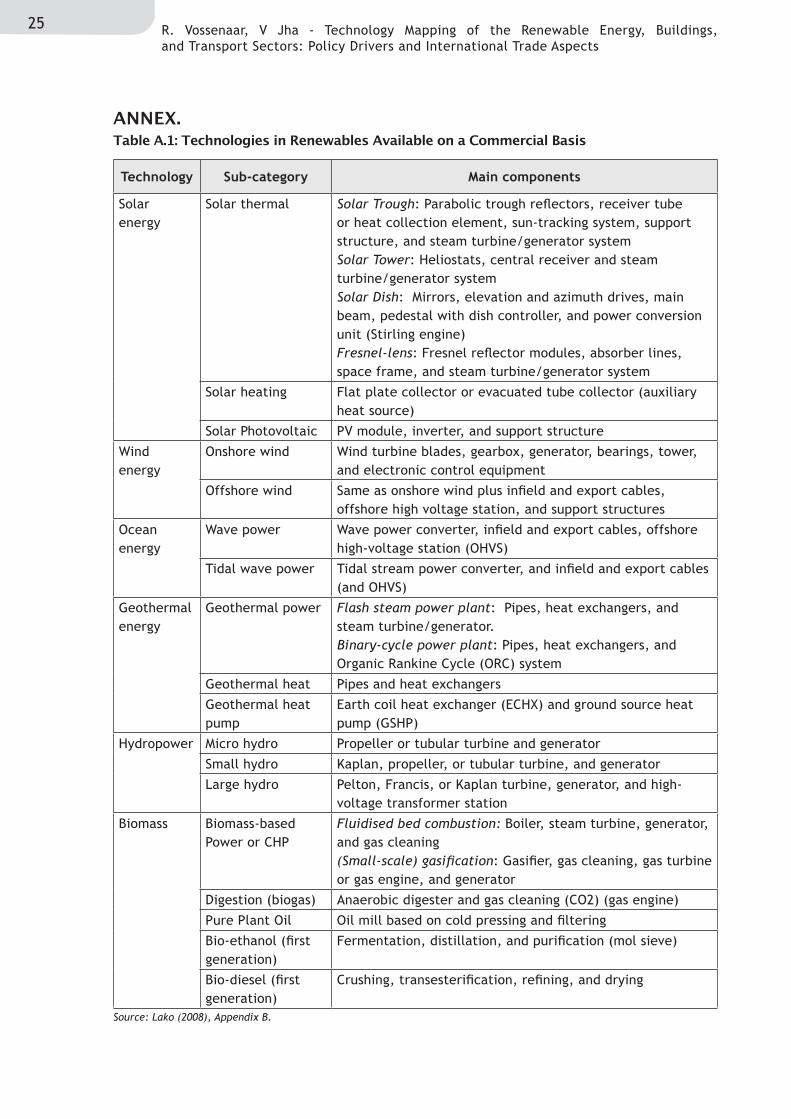
25 R. Vossenaar, V Jha - Technology Mapping of the Renewable Energy, Buildings, and Transport Sectors: Policy Drivers and International Trade Aspects
ANNEX.Table A.1: Technologies in Renewables Available on a Commercial Basis
Source: Lako (2008), Appendix B.
Technology Sub-category Main components
Solar energy
Solar thermal Solar Trough: Parabolic trough reflectors, receiver tube or heat collection element, sun-tracking system, support structure, and steam turbine/generator systemSolar Tower: Heliostats, central receiver and steam turbine/generator systemSolar Dish: Mirrors, elevation and azimuth drives, main beam, pedestal with dish controller, and power conversion unit (Stirling engine)Fresnel-lens: Fresnel reflector modules, absorber lines, space frame, and steam turbine/generator system
Solar heating Flat plate collector or evacuated tube collector (auxiliary heat source)
Solar Photovoltaic PV module, inverter, and support structure
Wind energy
Onshore wind Wind turbine blades, gearbox, generator, bearings, tower, and electronic control equipment
Offshore wind Same as onshore wind plus infield and export cables, offshore high voltage station, and support structures
Ocean energy
Wave power Wave power converter, infield and export cables, offshore high-voltage station (OHVS)
Tidal wave power Tidal stream power converter, and infield and export cables (and OHVS)
Geothermal energy
Geothermal power Flash steam power plant: Pipes, heat exchangers, and steam turbine/generator.Binary-cycle power plant: Pipes, heat exchangers, and Organic Rankine Cycle (ORC) system
Geothermal heat Pipes and heat exchangers
Geothermal heat pump
Earth coil heat exchanger (ECHX) and ground source heat pump (GSHP)
Hydropower Micro hydro Propeller or tubular turbine and generator
Small hydro Kaplan, propeller, or tubular turbine, and generator
Large hydro Pelton, Francis, or Kaplan turbine, generator, and high-voltage transformer station
Biomass Biomass-based Power or CHP
Fluidised bed combustion: Boiler, steam turbine, generator, and gas cleaning(Small-scale) gasification: Gasifier, gas cleaning, gas turbine or gas engine, and generator
Digestion (biogas) Anaerobic digester and gas cleaning (CO2) (gas engine)
Pure Plant Oil Oil mill based on cold pressing and filtering
Bio-ethanol (first generation)
Fermentation, distillation, and purification (mol sieve)
Bio-diesel (first generation)
Crushing, transesterification, refining, and drying
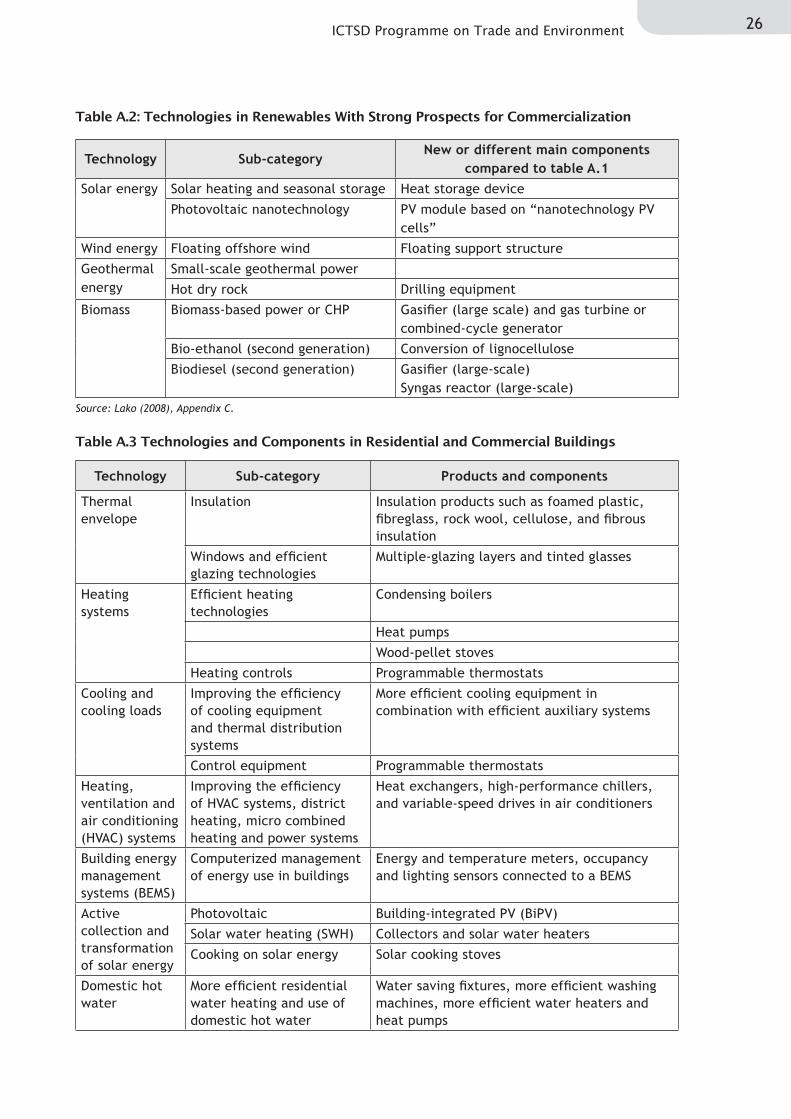
26ICTSD Programme on Trade and Environment
Table A.2: Technologies in Renewables With Strong Prospects for Commercialization
Source: Lako (2008), Appendix C.
Technology Sub-categoryNew or different main components
compared to table A.1Solar energy Solar heating and seasonal storage Heat storage device
Photovoltaic nanotechnology PV module based on “nanotechnology PV cells”
Wind energy Floating offshore wind Floating support structure
Geothermal energy
Small-scale geothermal power
Hot dry rock Drilling equipment
Biomass Biomass-based power or CHP Gasifier (large scale) and gas turbine or combined-cycle generator
Bio-ethanol (second generation) Conversion of lignocellulose
Biodiesel (second generation) Gasifier (large-scale) Syngas reactor (large-scale)
Table A.3 Technologies and Components in Residential and Commercial Buildings
Technology Sub-category Products and components
Thermal envelope
Insulation Insulation products such as foamed plastic, fibreglass, rock wool, cellulose, and fibrous insulation
Windows and efficient glazing technologies
Multiple-glazing layers and tinted glasses
Heating systems
Efficient heating technologies
Condensing boilers
Heat pumps
Wood-pellet stoves
Heating controls Programmable thermostats
Cooling and cooling loads
Improving the efficiency of cooling equipment and thermal distribution systems
More efficient cooling equipment in combination with efficient auxiliary systems
Control equipment Programmable thermostats
Heating, ventilation and air conditioning (HVAC) systems
Improving the efficiency of HVAC systems, district heating, micro combined heating and power systems
Heat exchangers, high-performance chillers, and variable-speed drives in air conditioners
Building energy management systems (BEMS)
Computerized management of energy use in buildings
Energy and temperature meters, occupancy and lighting sensors connected to a BEMS
Active collection and transformation of solar energy
Photovoltaic Building-integrated PV (BiPV)
Solar water heating (SWH) Collectors and solar water heaters
Cooking on solar energy Solar cooking stoves
Domestic hot water
More efficient residential water heating and use of domestic hot water
Water saving fixtures, more efficient washing machines, more efficient water heaters and heat pumps
27 R. Vossenaar, V Jha - Technology Mapping of the Renewable Energy, Buildings, and Transport Sectors: Policy Drivers and International Trade Aspects
Source: IPCC (2007), Goswami A, Dasgupta M and Nanda N (2009).
Table A.3 Continued
Technology Sub-category Products and components
Lighting Most efficient lighting systems
Compact fluorescent lamps (CFL), high pressure sodium (HPS) lamps, light-emitting diodes (LED), ballast for discharge lamps and control equipment
Day lighting Switches for daylight-responsive dimming, light sensors and actuators to control artificial lighting
Appliances Make appliances more efficient Reduce standby energy use
More energy-efficient household appliances, consumer electronics, office and control equipment
Source: IPCC (2007), Kejun (2009).
Table A.4: Technologies in Road Transport (Passenger Cars)
Technology Sub-category Products and components
Reducing vehicle loads
Using lightweight materials High-strength steel (HHS), stainless steel, other advanced steels, aluminium, magnesium, plastic, and plastic composites
Non-engine components More efficient air conditioners and lighting
Improving drive-train efficiency
Advanced Direct Injection (DI) gasoline / diesel transmissions
Advanced DI engines
More efficient transmissions Continuously variable transmission (CVT) and six-speed or variable transmission
Hybrid-electric drivetrains Electric motor/generator and battery (or ultracapacitor)
Alternative fuels
Biofuel Bio-ethanol (see tables A.1 and A.2), biodiesel (see tables A.1 and A.2) and flex-fuel vehicles (FFV)
Natural Gas (CNG / LNG / GTL)
Natural gas
Plug-in hybrids and electric vehicles
Batteries (such as nickel-metal hybride (NiMH) and lithium-ion (Li-ion) batteries)
Hydrogen / fuel cells Fuel-cell systems and energy-storage systems
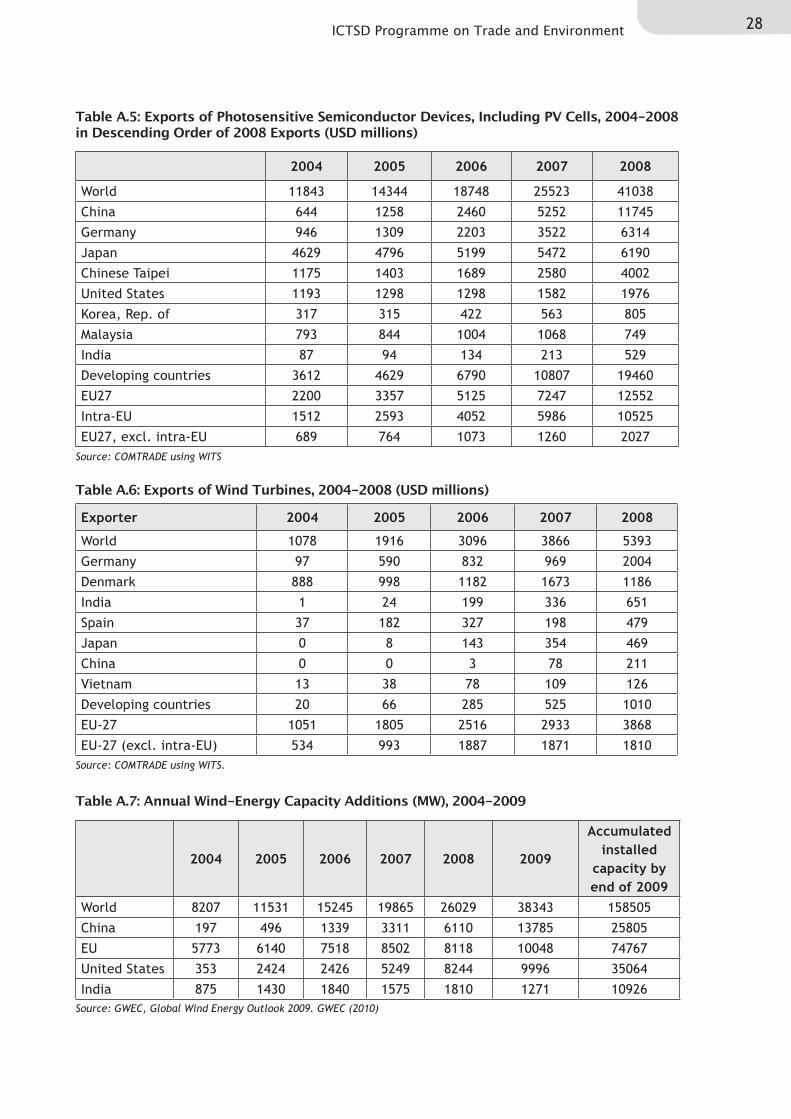
28ICTSD Programme on Trade and Environment
Source: COMTRADE using WITS
Table A.5: Exports of Photosensitive Semiconductor Devices, Including PV Cells, 2004-2008 in Descending Order of 2008 Exports (USD millions)
2004 2005 2006 2007 2008
World 11843 14344 18748 25523 41038
China 644 1258 2460 5252 11745
Germany 946 1309 2203 3522 6314
Japan 4629 4796 5199 5472 6190
Chinese Taipei 1175 1403 1689 2580 4002
United States 1193 1298 1298 1582 1976
Korea, Rep. of 317 315 422 563 805
Malaysia 793 844 1004 1068 749
India 87 94 134 213 529
Developing countries 3612 4629 6790 10807 19460
EU27 2200 3357 5125 7247 12552
Intra-EU 1512 2593 4052 5986 10525
EU27, excl. intra-EU 689 764 1073 1260 2027
Source: COMTRADE using WITS.
Table A.6: Exports of Wind Turbines, 2004-2008 (USD millions)
Exporter 2004 2005 2006 2007 2008
World 1078 1916 3096 3866 5393
Germany 97 590 832 969 2004
Denmark 888 998 1182 1673 1186
India 1 24 199 336 651
Spain 37 182 327 198 479
Japan 0 8 143 354 469
China 0 0 3 78 211
Vietnam 13 38 78 109 126
Developing countries 20 66 285 525 1010
EU-27 1051 1805 2516 2933 3868
EU-27 (excl. intra-EU) 534 993 1887 1871 1810
Source: GWEC, Global Wind Energy Outlook 2009. GWEC (2010)
Table A.7: Annual Wind-Energy Capacity Additions (MW), 2004-2009
2004 2005 2006 2007 2008 2009
Accumulated installed
capacity by end of 2009
World 8207 11531 15245 19865 26029 38343 158505
China 197 496 1339 3311 6110 13785 25805
EU 5773 6140 7518 8502 8118 10048 74767
United States 353 2424 2426 5249 8244 9996 35064
India 875 1430 1840 1575 1810 1271 10926
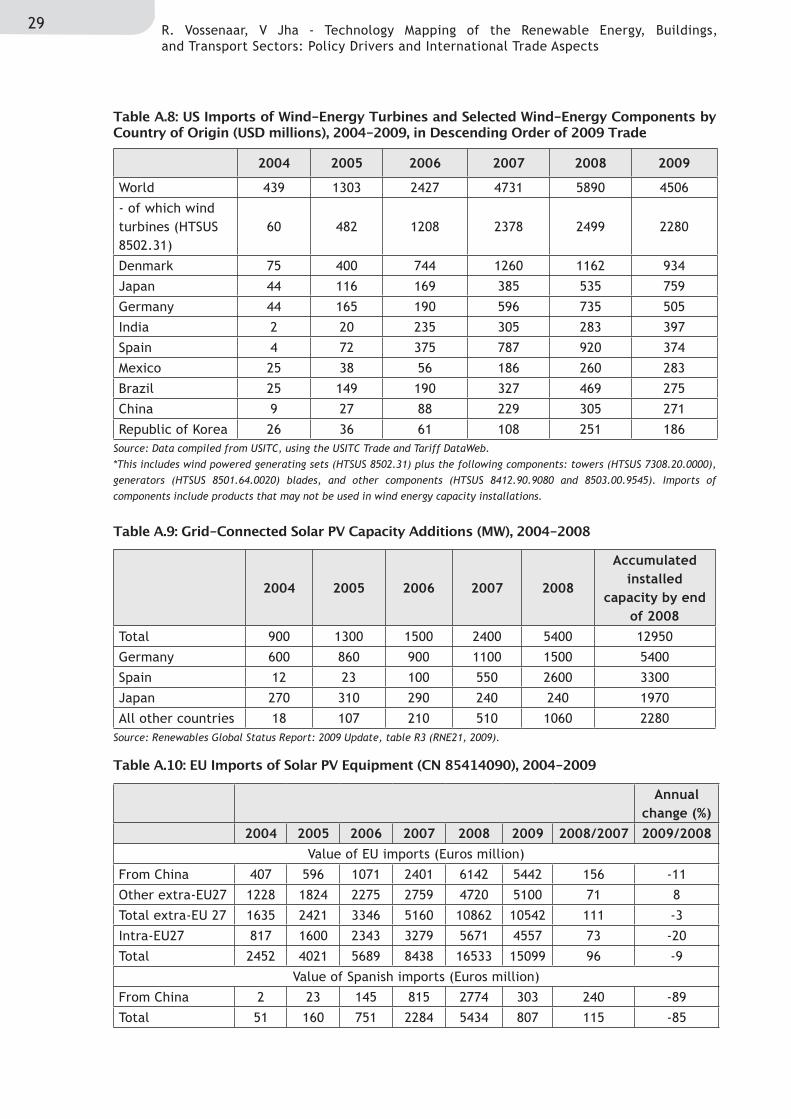
29 R. Vossenaar, V Jha - Technology Mapping of the Renewable Energy, Buildings, and Transport Sectors: Policy Drivers and International Trade Aspects
Source: Data compiled from USITC, using the USITC Trade and Tariff DataWeb. *This includes wind powered generating sets (HTSUS 8502.31) plus the following components: towers (HTSUS 7308.20.0000), generators (HTSUS 8501.64.0020) blades, and other components (HTSUS 8412.90.9080 and 8503.00.9545). Imports of components include products that may not be used in wind energy capacity installations.
Table A.8: US Imports of Wind-Energy Turbines and Selected Wind-Energy Components by Country of Origin (USD millions), 2004-2009, in Descending Order of 2009 Trade
2004 2005 2006 2007 2008 2009
World 439 1303 2427 4731 5890 4506
- of which wind turbines (HTSUS 8502.31)
60 482 1208 2378 2499 2280
Denmark 75 400 744 1260 1162 934
Japan 44 116 169 385 535 759
Germany 44 165 190 596 735 505
India 2 20 235 305 283 397
Spain 4 72 375 787 920 374
Mexico 25 38 56 186 260 283
Brazil 25 149 190 327 469 275
China 9 27 88 229 305 271
Republic of Korea 26 36 61 108 251 186
Source: Renewables Global Status Report: 2009 Update, table R3 (RNE21, 2009).
Table A.9: Grid-Connected Solar PV Capacity Additions (MW), 2004-2008
2004 2005 2006 2007 2008
Accumulated installed
capacity by end of 2008
Total 900 1300 1500 2400 5400 12950
Germany 600 860 900 1100 1500 5400
Spain 12 23 100 550 2600 3300
Japan 270 310 290 240 240 1970
All other countries 18 107 210 510 1060 2280
Table A.10: EU Imports of Solar PV Equipment (CN 85414090), 2004-2009
Annual change (%)
2004 2005 2006 2007 2008 2009 2008/2007 2009/2008Value of EU imports (Euros million)
From China 407 596 1071 2401 6142 5442 156 -11
Other extra-EU27 1228 1824 2275 2759 4720 5100 71 8
Total extra-EU 27 1635 2421 3346 5160 10862 10542 111 -3
Intra-EU27 817 1600 2343 3279 5671 4557 73 -20
Total 2452 4021 5689 8438 16533 15099 96 -9
Value of Spanish imports (Euros million)
From China 2 23 145 815 2774 303 240 -89
Total 51 160 751 2284 5434 807 115 -85
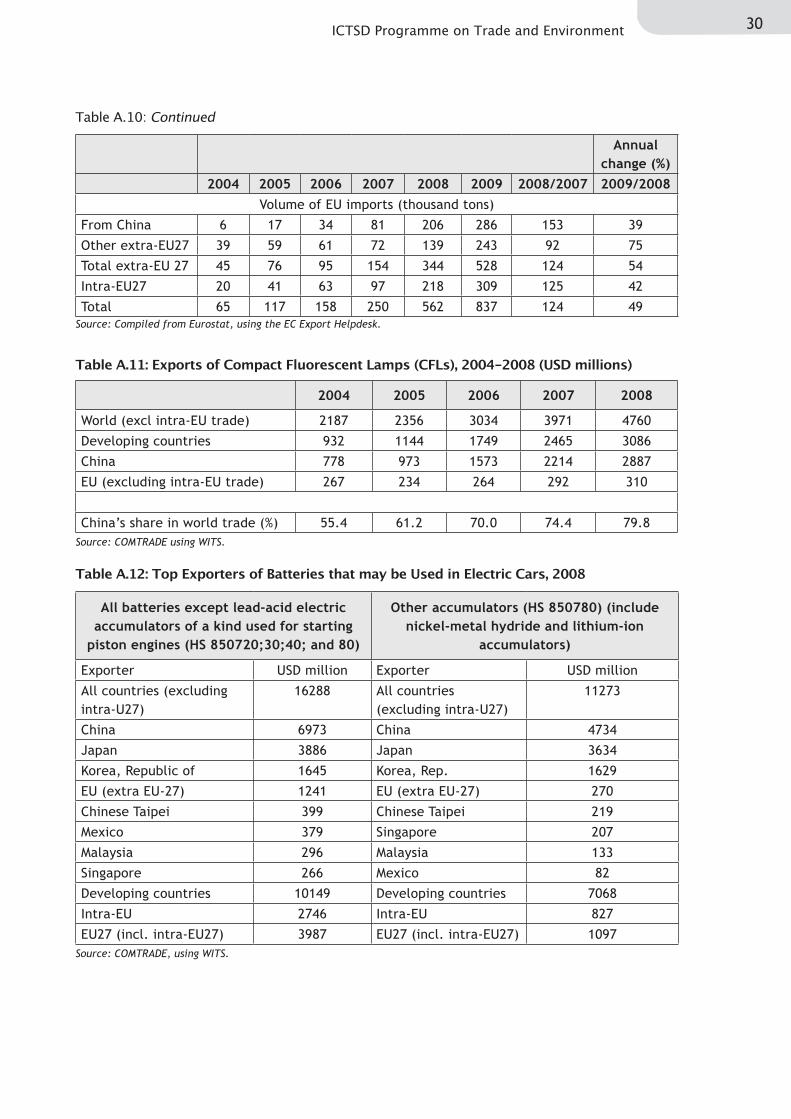
30ICTSD Programme on Trade and Environment
Source: Compiled from Eurostat, using the EC Export Helpdesk.
Table A.10: Continued
Annual change (%)
2004 2005 2006 2007 2008 2009 2008/2007 2009/2008Volume of EU imports (thousand tons)
From China 6 17 34 81 206 286 153 39
Other extra-EU27 39 59 61 72 139 243 92 75
Total extra-EU 27 45 76 95 154 344 528 124 54
Intra-EU27 20 41 63 97 218 309 125 42
Total 65 117 158 250 562 837 124 49
Source: COMTRADE using WITS.
Table A.11: Exports of Compact Fluorescent Lamps (CFLs), 2004-2008 (USD millions)
2004 2005 2006 2007 2008
World (excl intra-EU trade) 2187 2356 3034 3971 4760
Developing countries 932 1144 1749 2465 3086
China 778 973 1573 2214 2887
EU (excluding intra-EU trade) 267 234 264 292 310
China’s share in world trade (%) 55.4 61.2 70.0 74.4 79.8
Source: COMTRADE, using WITS.
Table A.12: Top Exporters of Batteries that may be Used in Electric Cars, 2008
All batteries except lead-acid electric accumulators of a kind used for starting
piston engines (HS 850720;30;40; and 80)
Other accumulators (HS 850780) (include nickel-metal hydride and lithium-ion
accumulators)
Exporter USD million Exporter USD million
All countries (excluding intra-U27)
16288 All countries (excluding intra-U27)
11273
China 6973 China 4734
Japan 3886 Japan 3634
Korea, Republic of 1645 Korea, Rep. 1629
EU (extra EU-27) 1241 EU (extra EU-27) 270
Chinese Taipei 399 Chinese Taipei 219
Mexico 379 Singapore 207
Malaysia 296 Malaysia 133
Singapore 266 Mexico 82
Developing countries 10149 Developing countries 7068
Intra-EU 2746 Intra-EU 827
EU27 (incl. intra-EU27) 3987 EU27 (incl. intra-EU27) 1097
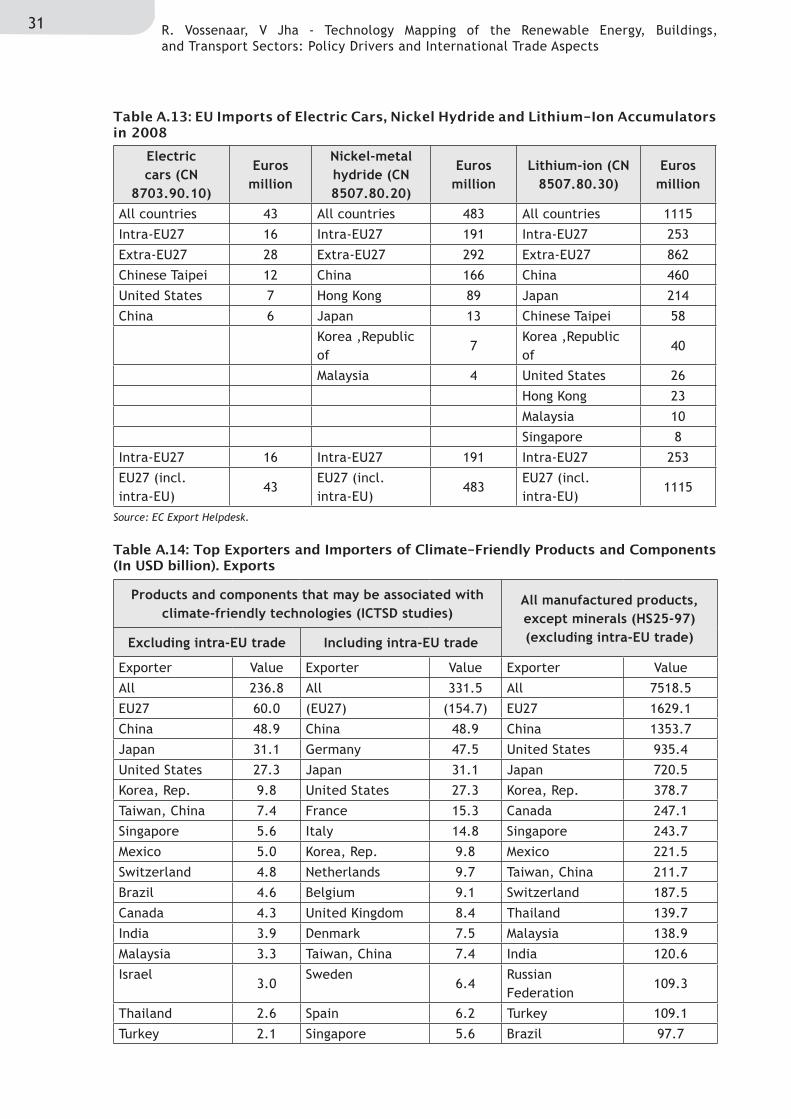
31 R. Vossenaar, V Jha - Technology Mapping of the Renewable Energy, Buildings, and Transport Sectors: Policy Drivers and International Trade Aspects
Source: EC Export Helpdesk.
Table A.13: EU Imports of Electric Cars, Nickel Hydride and Lithium-Ion Accumulators in 2008
Electric cars (CN
8703.90.10)
Euros million
Nickel-metal hydride (CN 8507.80.20)
Euros million
Lithium-ion (CN 8507.80.30)
Euros million
All countries 43 All countries 483 All countries 1115
Intra-EU27 16 Intra-EU27 191 Intra-EU27 253
Extra-EU27 28 Extra-EU27 292 Extra-EU27 862
Chinese Taipei 12 China 166 China 460
United States 7 Hong Kong 89 Japan 214
China 6 Japan 13 Chinese Taipei 58
Korea ,Republic of
7Korea ,Republic of
40
Malaysia 4 United States 26
Hong Kong 23
Malaysia 10
Singapore 8
Intra-EU27 16 Intra-EU27 191 Intra-EU27 253
EU27 (incl. intra-EU)
43EU27 (incl. intra-EU)
483EU27 (incl. intra-EU)
1115
Table A.14: Top Exporters and Importers of Climate-Friendly Products and Components (In USD billion). Exports
Products and components that may be associated with climate-friendly technologies (ICTSD studies)
All manufactured products, except minerals (HS25-97) (excluding intra-EU trade)Excluding intra-EU trade Including intra-EU trade
Exporter Value Exporter Value Exporter Value
All 236.8 All 331.5 All 7518.5
EU27 60.0 (EU27) (154.7) EU27 1629.1
China 48.9 China 48.9 China 1353.7
Japan 31.1 Germany 47.5 United States 935.4
United States 27.3 Japan 31.1 Japan 720.5
Korea, Rep. 9.8 United States 27.3 Korea, Rep. 378.7
Taiwan, China 7.4 France 15.3 Canada 247.1
Singapore 5.6 Italy 14.8 Singapore 243.7
Mexico 5.0 Korea, Rep. 9.8 Mexico 221.5
Switzerland 4.8 Netherlands 9.7 Taiwan, China 211.7
Brazil 4.6 Belgium 9.1 Switzerland 187.5
Canada 4.3 United Kingdom 8.4 Thailand 139.7
India 3.9 Denmark 7.5 Malaysia 138.9
Malaysia 3.3 Taiwan, China 7.4 India 120.6
Israel3.0
Sweden6.4
Russian Federation
109.3
Thailand 2.6 Spain 6.2 Turkey 109.1
Turkey 2.1 Singapore 5.6 Brazil 97.7
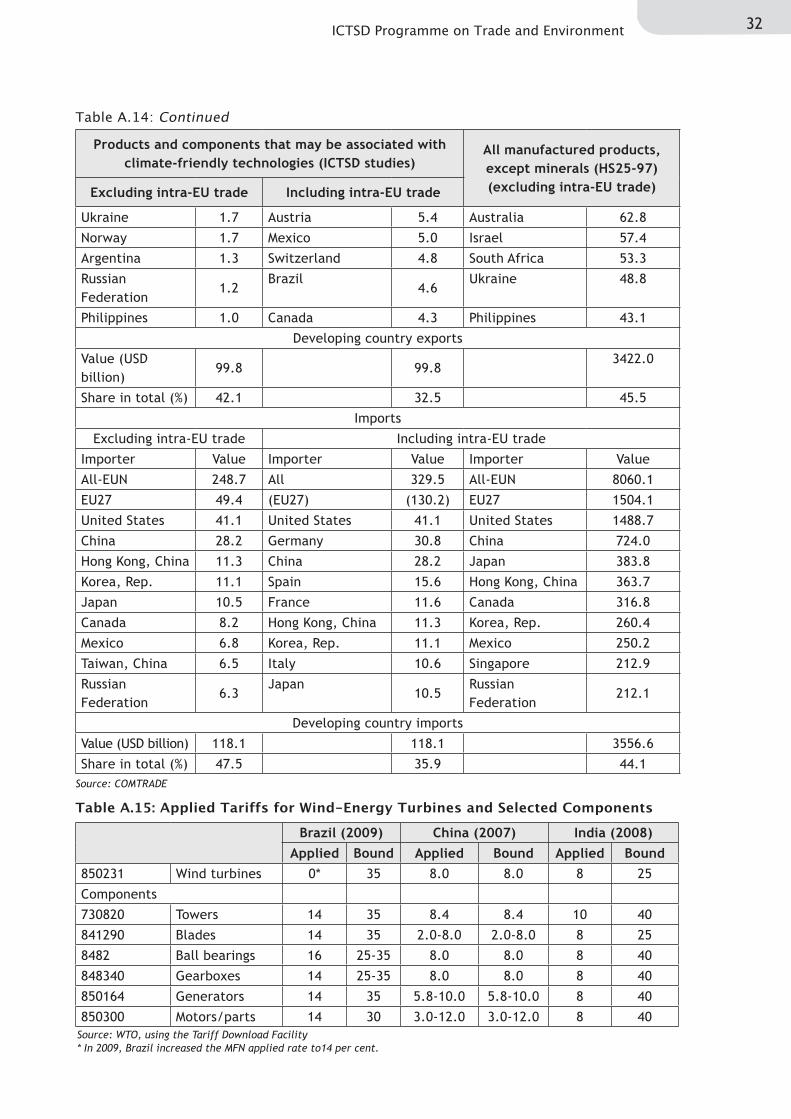
32ICTSD Programme on Trade and Environment
Source: COMTRADE
Table A.14: Continued
Products and components that may be associated with climate-friendly technologies (ICTSD studies)
All manufactured products, except minerals (HS25-97) (excluding intra-EU trade)Excluding intra-EU trade Including intra-EU trade
Ukraine 1.7 Austria 5.4 Australia 62.8
Norway 1.7 Mexico 5.0 Israel 57.4
Argentina 1.3 Switzerland 4.8 South Africa 53.3
Russian Federation
1.2Brazil
4.6Ukraine 48.8
Philippines 1.0 Canada 4.3 Philippines 43.1
Developing country exports
Value (USD billion)
99.8 99.83422.0
Share in total (%) 42.1 32.5 45.5
Imports
Excluding intra-EU trade Including intra-EU trade
Importer Value Importer Value Importer Value
All-EUN 248.7 All 329.5 All-EUN 8060.1
EU27 49.4 (EU27) (130.2) EU27 1504.1
United States 41.1 United States 41.1 United States 1488.7
China 28.2 Germany 30.8 China 724.0
Hong Kong, China 11.3 China 28.2 Japan 383.8
Korea, Rep. 11.1 Spain 15.6 Hong Kong, China 363.7
Japan 10.5 France 11.6 Canada 316.8
Canada 8.2 Hong Kong, China 11.3 Korea, Rep. 260.4
Mexico 6.8 Korea, Rep. 11.1 Mexico 250.2
Taiwan, China 6.5 Italy 10.6 Singapore 212.9
Russian Federation
6.3Japan
10.5Russian Federation
212.1
Developing country imports
Value (USD billion) 118.1 118.1 3556.6
Share in total (%) 47.5 35.9 44.1
Table A.15: Applied Tariffs for Wind-Energy Turbines and Selected Components
Brazil (2009) China (2007) India (2008)Applied Bound Applied Bound Applied Bound
850231 Wind turbines 0* 35 8.0 8.0 8 25
Components
730820 Towers 14 35 8.4 8.4 10 40
841290 Blades 14 35 2.0-8.0 2.0-8.0 8 25
8482 Ball bearings 16 25-35 8.0 8.0 8 40
848340 Gearboxes 14 25-35 8.0 8.0 8 40
850164 Generators 14 35 5.8-10.0 5.8-10.0 8 40
850300 Motors/parts 14 30 3.0-12.0 3.0-12.0 8 40Source: WTO, using the Tariff Download Facility * In 2009, Brazil increased the MFN applied rate to14 per cent.
SELECTED ICTSD ISSUE PAPERSAgricultural Trade and Sustainable Development
How Would a Trade Deal on Sugar Affect Exporting and Importing Countries? .By Amani Elobeid. Issue Paper No.24, 2009.
Constructing a Composite Index of Market Acess.By Tim Josling. Issue Paper No.23, 2009.
Comparing safeguard measures in regional and bilateral agreements. By Paul Kruger, Willemien Denner and JB Cronje, Issue Paper No.22, 2009.
How would a WTO agreement on bananas affect exporting and importing countries? By Giovanni Anania, Issue Paper No.21, 2009.
Biofuels Subsidies and the Law of the World Trade Organisation. By Toni Harmer, Issue Paper No.20, 2009.
Biofuels Certification and the Law of the World Trade Organisation. By Marsha A. Echols, Issue Paper No.19, 2009.
Competitiveness and Sustainable Development
The Potential Role of Non Traditional Donors ‘Aid in Africa. Issue Paper No.11 by Peter Kragelund, 2010.
Resilience Amidst Rising Tides: An Issue Paper on Trade, Climate Change and Competitiveness in the Tourism Sector in the Caribbean. Issue Paper No.9 by Keron Niles, 2010.
Aid for Trade and Climate Change Financing Mechanisms: Best Practices and Lessons Learned for LDCs and SVEs in Africa. Issue Paper No. 8 by Vinaye Dey Ancharaz, 2010.
Hoja de ruta para el sector textil y confección y desarrollo sostenible en Nicaragua. Documento de Trabajo No.2 por Ana Victoria Portocarrero Lacayo, 2010.
Hoja de ruta para el sector textil y confección y desarrollo sostenible en Guatemala. Documento de Trabajo No.1 por Pedro Prado et al, 2010.
El sector textil y confección y el desarrollo sostenible en Nicaragua. Documento de Fondo No.7 por Ana Victoria Portocarrero Lacayo, 2010.
El sector textil y confección y el desarrollo sostenible en Guatemala. Documento de Fondo No.6 por Pedro prado et al, 2010.
Dispute Settlement and Legal Aspects of International Trade
Trading Profiles and Developing Country Participation in the WTO Dispute Settlement System. By Joseph Francois and Henrik Horn. Issue Paper No. 6, 2008.
Developing Countries, Countermeasures and WTO Law: Reinterpreting the DSU against the Background of International Law. By Andrea Bianchi and Lorenzo Gradoni. Issue Paper No. 5, 2008.
Does Legal Capacity Matter? Explaining Dispute Initiation and Antidumping actions in the WTO. By Marc L. Busch, Eric Reinhardt and Gregory Shaffer. Issue Paper No. 4, 2008.
Fisheries, International Trade and Sustainable Development
The Importance of Sanitary and Phytosanitary Measures to Fisheries Negotiations in Economic Partnership Agreements. By Martin Doherty. Issue Paper No. 6, 2008.
Fisheries, Aspects of ACP-EU Interim Economic Partnership Agreements: Trade and Sustainable Development Implications. By Liam Campling. Issue Paper No. 6, 2008.
Fisheries, International Trade and Sustainable Development. Policy Discussion Paper, By ICTSD, 2006.
Intellectual Property Rights and Sustainable Development
The Technical Assistance Principles of the WIPO Development Agenda and their Practical Implementation. By C. Deere-Birkbeck and R. Marchant, Issue Paper No.28, 2010.
Free Trade of Pharmaceutical Products: The Limits of Intellectual Property Enforcement at the Border. By Xavier Seuba, Issue Paper No.27, 2010.
Evaluación del impacto de las disposiciones de ADPIC + en el mercado institucional de medicamentos de Costa Rica. Por Grevin Hernandez-González y Max Valverde, Documento de Fondo No. 26, 2009.
Access to Climate Change Technology by Developing Countries: A Practical Strategy. By Cynthia Cannady, Issue Paper No. 25, 2009.
Trade in Services and Sustainable Development
Facilitating Temporary Labour Mobility in African Least-Developed Countries: Addressing Mode 4 Supply-Side Constraints. By Sabrina Varma, Issue Paper No.10, 2009.
Advancing Services Export Interests of Least-Developed Countries: Towards GATS Commitments on the Temporary Movement of natural Persons for the Supply of Low-Skilled and Semi-Skilled Services. By Daniel Crosby, Issue Paper No. 9, 2009.
Maritime Transport and Related Logistics Services in Egypt. By Ahmed F. Ghoneim, and Omneia A. Helmy, Issue Paper No. 8, 2007.
Environmental Goods and Services Programme
Market Drivers in Renewable Energy Supply Goods: The Need to Level the Playing Field. By Veena Jha, Issue Paper No.10, 2009.
Environmental Priorities and Trade policy for Environmental Goods: A Reality Check., By Veena Jha, Issue Paper No.7, 2008.
Trade and Sustainable Energy
Climate Change and Trade on the Road to Copenhagen. Policy Discussion Paper, 2009.
Trade, Climate Change and Global Competitiveness: Opportunities and Challenge for Sustainable Development in China and Beyond. By ICTSD Selected Issue Briefs No.3, 2008.
Intellectual Property and Access to Clean Energy Technologies in Developing Countries: An Analysis of Solar Photovoltaic, Biofuel and Wind Technologies. By John H. Barton, Issue Paper No. 2, 2007.
Regionalism and EPAs
Revisiting Regional Trade Agreements and their Impact on Services and Trade, by Mario Marconini, Issue Paper No.4, 2009.
Trade Agreements and their Relation to Labour Standards: The Current Situation by Pablo Lazo Grandi, Issue Paper No.3, 2009.
Legal and Systematic Issues in the Interim Economic Partnership Agreements: Which Way Now? by Cosmas Milton Obote Ochieng, Issue Paper No.2, 2009.
Environmental Issues in Economic Partnership Agreements: Implications for Developing Countries, by Beatrice Chaytor, Issue Paper No.1, 2009.
Global Economic Policy and Institutions
The Microcosm of Climate Change Negotiations: What Can the World Learn from the European Union? By Håkan Nordström, Issue Paper No.1.
These and other ICTSD resources are available at http://www.ictsd.org
www.ictsd.org
The ICTSD project on Bridging Trade and Sustainable Development on Environmental Goods and Services aims to enhance developing countries’ capacity to understand trade and sustainable development issue linkages with respect to environmental goods and services (EGS) and reflect regional perspectives and priorities in regional and multilateral trade negotiations. Project publications include:
• TradeFlows,BarriersandMarketDriversinRenewableEnergySupplyGoods:TheNeedtoLevelthePlayingField.IssuePaperNo.10byVeenaJha,2009.
• Una Aproximación a Las Negociaciones Comerciales Sobre Servicios Ambientales. Issue PaperNo.9byAlanFairlieReinoso,2008.
• HaciaUnaListaPotencialDeBienesAmbientalesParaSudamérica:CriteriosParaUnaPerspectivaDeDesarrollóSostenible.IssuePaperNo.8byJaimeGarcia,2008.
• EnvironmentalPrioritiesandTradePolicyforEnvironmentalGoods:ARealityCheck.IssuePaperNo.7byVeenaJha,2008.
• TradeinEnvironmentalGoodsandServicesandSustainableDevelopment:DomesticConsiderationsand Strategies for WTO Negotiations. Policy Discussion Paper, 2007.
• TechnologyTransferIssuesinEnvironmentalGoodsandServices:AnIllustrativeAnalysisofSectorsRelevanttoAir-pollutionandRenewableEnergy.IssuePaperNo.6byLynnMytelka,2007.
• WTONegotiatingStrategyonEnvironmentalGoodsandServicesforAsianDevelopingCountries.ByVicentePaoloYuIII,2007.
• Building SupplyCapacity for Environmental Services inAsia: TheRoleofDomestic andTradePolicies. Issue Paper No. 5 by Aparna Sawhney, 2007.
Forfurtherinformation,visitwww.ictsd.org
ABOUT ICTSD
Founded in 1996, the International Centre for Trade and Sustainable Development (ICTSD) is anindependent non-profit and non-governmental organization based in Geneva. By empowering stakeholders in trade policy through information, networking, dialogue, well-targeted research and capacity building, the centre aims to influence the international trade system such that it advances the goal of sustainable development.


![Pre-Engineered Buildings Structural Steel Buildings ...€¦ · Pre-Engineered Buildings Structural Steel Buildings LEADERS IN THE STEEL BUILDINGS INDUSTRY mKÁúeTsk_ vis½y]sSahkmµ](https://img.pdfslide.tips/doc/110x75/5f069e707e708231d418e449/pre-engineered-buildings-structural-steel-buildings-pre-engineered-buildings.jpg)