Embed Size (px)
Citation preview
Paper PS6-6
PS6-6.1
THE CONSTRUCTION OF JAPAN’S FIRST LNG SATELLITE TERMINAL FOR LARGE INDUSTRIAL CUSTOMERS
Atsuhiko Hattori
Masaru Sekiguchi
Kazuyuki Yamaguchi
Energy Production Deputy Tokyo Gas Co., Ltd.
Tokyo, Japan [email protected]
[email protected] [email protected]
Kou Sutou
LNG Engineering Section Tokyo Gas Engineering Co., Ltd.
Tokyo, Japan
ABSTRACT
To meet gas demand in remote areas where it is difficult to access existing pipelines, Tokyo Gas began a first trial in April 2006 regarding the Sowa satellite terminal in the western part of Ibaraki Prefecture. This project involved the construction and ownership of a LNG satellite terminal and local pipelines and the supplying of gas to a number of large industrial customers.
The location for this satellite terminal was limited in a small section of an industrial area, even though the gasification capacity had to be large enough to vaporize 40,000 tons of LNG per year—an amount equivalent to that of the largest LNG satellite terminal in Japan. Moreover, it was necessary to reduce LNG unloading time so as to increase the transportation efficiency of LNG lorries. Higher reliability was required due to a lack of backup supply sources for the satellite terminal. This situation differed from that of ordinary LNG terminals, which are generally connected to each other by pipelines.
To satisfy the above difficulties, Tokyo Gas’s entire body of knowledge related to LNG equipment was consolidated and examined, and new solutions were found. The following engineering achievements of the Sowa satellite terminal are spotlighted and backed up with actual data.
- Reduction in space by adoption of atmospheric vaporizers with hot air generators
- Improvement of LNG lorry transportation efficiency with the reduction of LNG unloading time by half
- Reliability analysis using Tokyo gas operational data for major forms of equipment from over 30 years
Paper PS6-6
PS6-6.2
Trends of LNG Utilization in Japan and Satellite Terminals
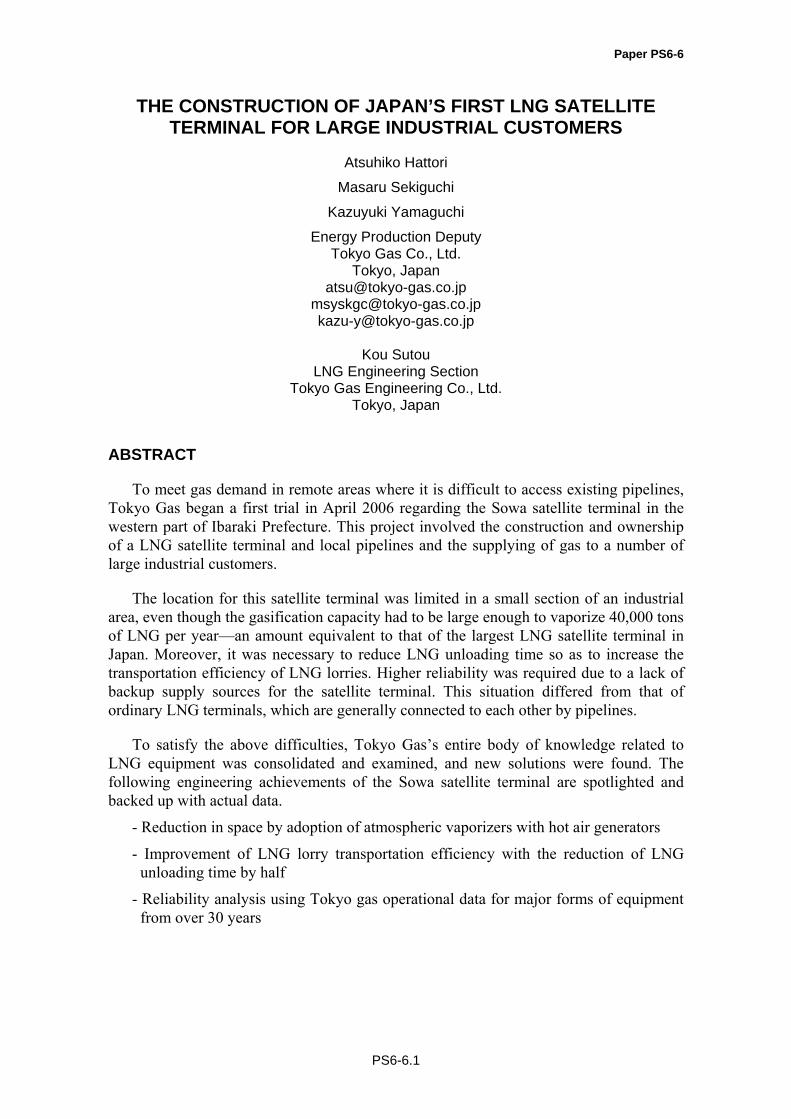
Japan is surrounded by the sea and relies predominantly on imported energy resources. About 97% of natural gas imports are made in the form of LNG. Figure 1 shows that demand for natural gas has been growing as a proportion of the energy utilized in Japan. This is largely due to growth in demand for industrial and commercial applications.
Figure 1 LNG utilization trends in Japan
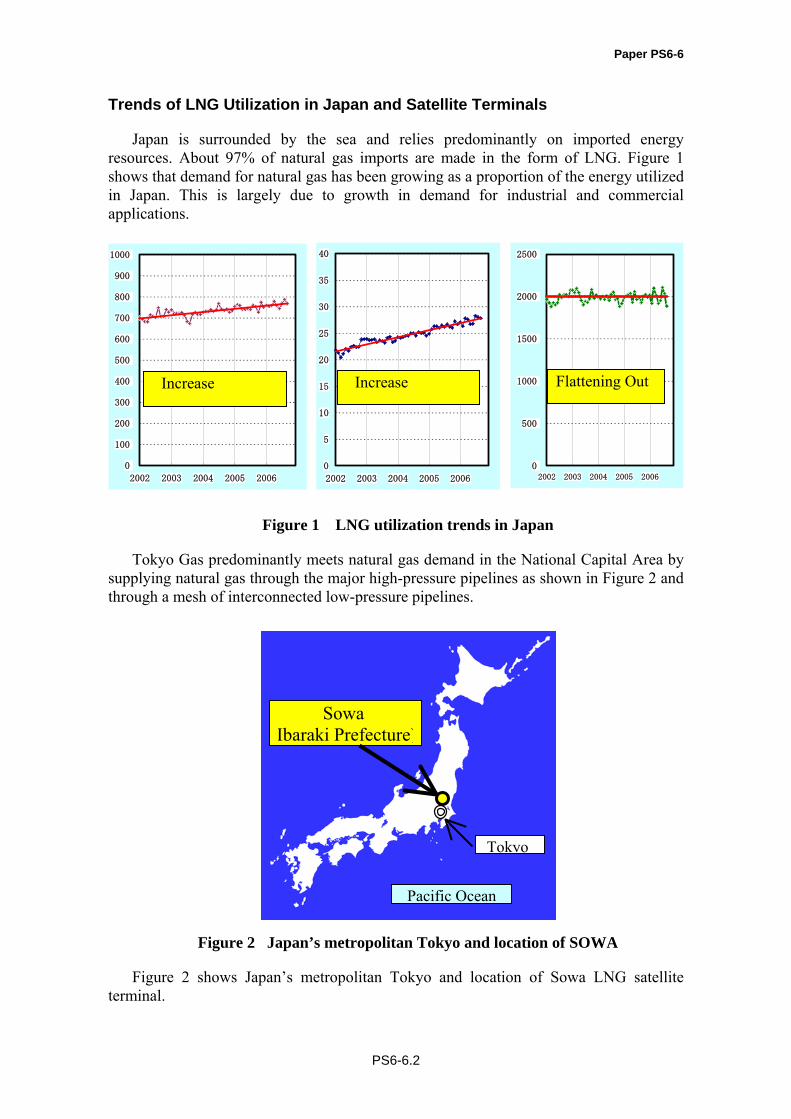
Tokyo Gas predominantly meets natural gas demand in the National Capital Area by supplying natural gas through the major high-pressure pipelines as shown in Figure 2 and through a mesh of interconnected low-pressure pipelines.
Figure 2 Japan’s metropolitan Tokyo and location of SOWA
Figure 2 shows Japan’s metropolitan Tokyo and location of Sowa LNG satellite terminal.
0
100
200
300
400
500
600
700
800
900
1000
2002 2003 2004 2005 20060
5
10
15
20
25
30
35
40
2002 2003 2004 2005 2006
0
500
1000
1500
2000
2500
2002 2003 2004 2005 2006
Increase Increase Flattening Out
Tokyo
Pacific Ocean
Sowa Ibaraki Prefecture)
Paper PS6-6
PS6-6.3
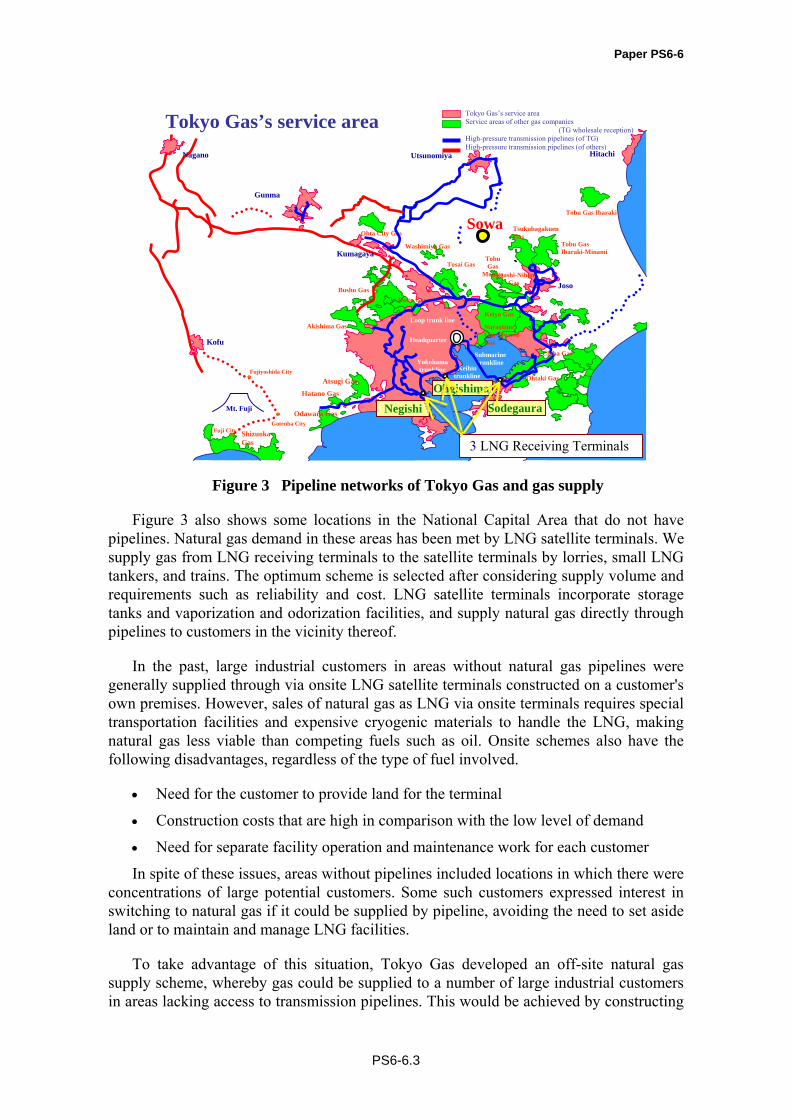
Figure 3 Pipeline networks of Tokyo Gas and gas supply
Figure 3 also shows some locations in the National Capital Area that do not have pipelines. Natural gas demand in these areas has been met by LNG satellite terminals. We supply gas from LNG receiving terminals to the satellite terminals by lorries, small LNG tankers, and trains. The optimum scheme is selected after considering supply volume and requirements such as reliability and cost. LNG satellite terminals incorporate storage tanks and vaporization and odorization facilities, and supply natural gas directly through pipelines to customers in the vicinity thereof.
In the past, large industrial customers in areas without natural gas pipelines were generally supplied through via onsite LNG satellite terminals constructed on a customer's own premises. However, sales of natural gas as LNG via onsite terminals requires special transportation facilities and expensive cryogenic materials to handle the LNG, making natural gas less viable than competing fuels such as oil. Onsite schemes also have the following disadvantages, regardless of the type of fuel involved.
• Need for the customer to provide land for the terminal
• Construction costs that are high in comparison with the low level of demand
• Need for separate facility operation and maintenance work for each customer
In spite of these issues, areas without pipelines included locations in which there were concentrations of large potential customers. Some such customers expressed interest in switching to natural gas if it could be supplied by pipeline, avoiding the need to set aside land or to maintain and manage LNG facilities.
To take advantage of this situation, Tokyo Gas developed an off-site natural gas supply scheme, whereby gas could be supplied to a number of large industrial customers in areas lacking access to transmission pipelines. This would be achieved by constructing
Gotenba City Fuji City Shizuoka
Gas
Nagano
Gunma
Kumagaya
Utsunomiya Hitachi
Kofu
Washimiya Gas
Tosai Gas
Tobu Gas Ibaraki
Tobu Gas Ibaraki-Minami
Tsukubagakuen Gas
Ohtaki Gas
Keiyo Gas
Bushu Gas
Akishima Gas
Atsugi Gas
Hatano Gas
Higashi-NihonGas
Odawara Gas
Joso
Daito Gas
Ohta City Gas
Tobu Gas
Moriya
Mt. Fuji
Fujiyoshida City
Tokyo Gas’s service area Tokyo Gas’s service area Service areas of other gas companies
(TG wholesale reception)High-pressure transmission pipelines (of TG) High-pressure transmission pipelines (of others)
Narashino City-Owned Gas
Submarine trunkline
Keihin trunkline
Yokohama trunkline
Headquarter
Loop trunk line
Chiba Gas
SodegauraNegishi
Ohgishima
3 LNG Receiving Terminals
Sowa
Paper PS6-6
PS6-6.4
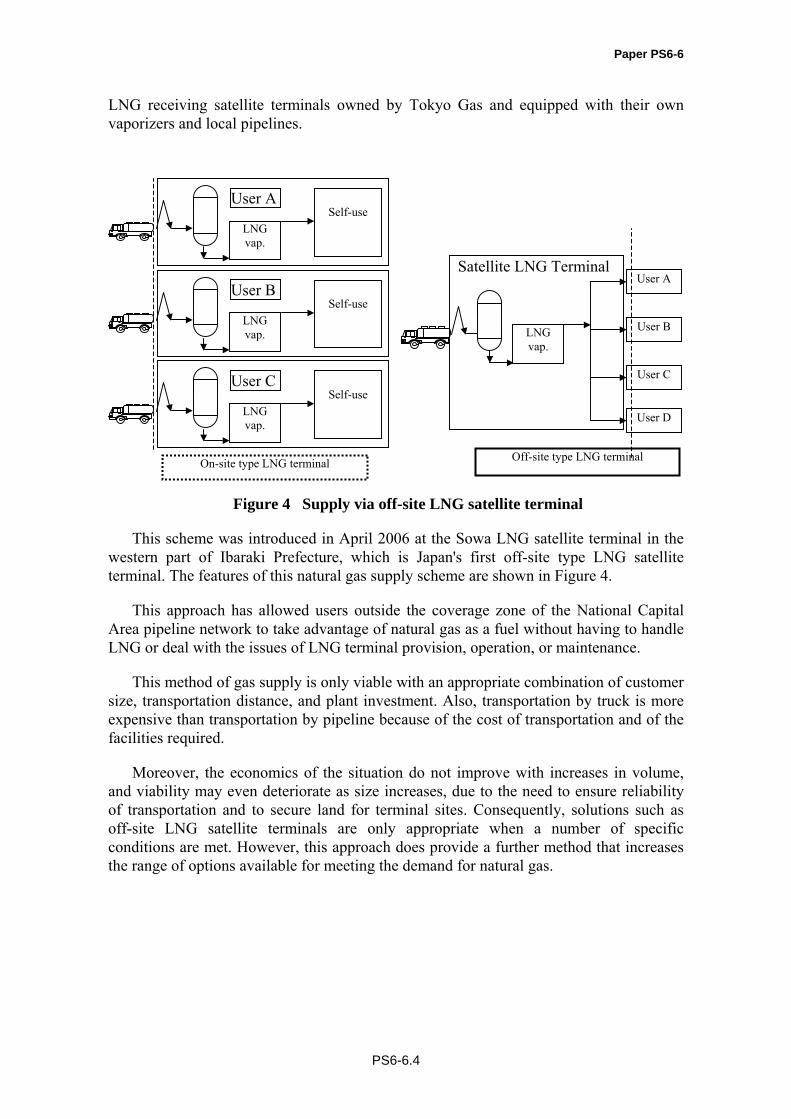
LNG receiving satellite terminals owned by Tokyo Gas and equipped with their own vaporizers and local pipelines.
Figure 4 Supply via off-site LNG satellite terminal
This scheme was introduced in April 2006 at the Sowa LNG satellite terminal in the western part of Ibaraki Prefecture, which is Japan's first off-site type LNG satellite terminal. The features of this natural gas supply scheme are shown in Figure 4.
This approach has allowed users outside the coverage zone of the National Capital Area pipeline network to take advantage of natural gas as a fuel without having to handle LNG or deal with the issues of LNG terminal provision, operation, or maintenance.
This method of gas supply is only viable with an appropriate combination of customer size, transportation distance, and plant investment. Also, transportation by truck is more expensive than transportation by pipeline because of the cost of transportation and of the facilities required.
Moreover, the economics of the situation do not improve with increases in volume, and viability may even deteriorate as size increases, due to the need to ensure reliability of transportation and to secure land for terminal sites. Consequently, solutions such as off-site LNG satellite terminals are only appropriate when a number of specific conditions are met. However, this approach does provide a further method that increases the range of options available for meeting the demand for natural gas.
Satellite LNG Terminal
Off-site type LNG terminal
User A
On-site type LNG terminal
LNG vap.
User B
User C
User D
Self-use
LNG vap.
User A
Self-use
LNG vap.
User B
Self-use
LNG vap.
User C
Paper PS6-6
PS6-6.5
The Construction of the Sowa LNG Satellite Terminal
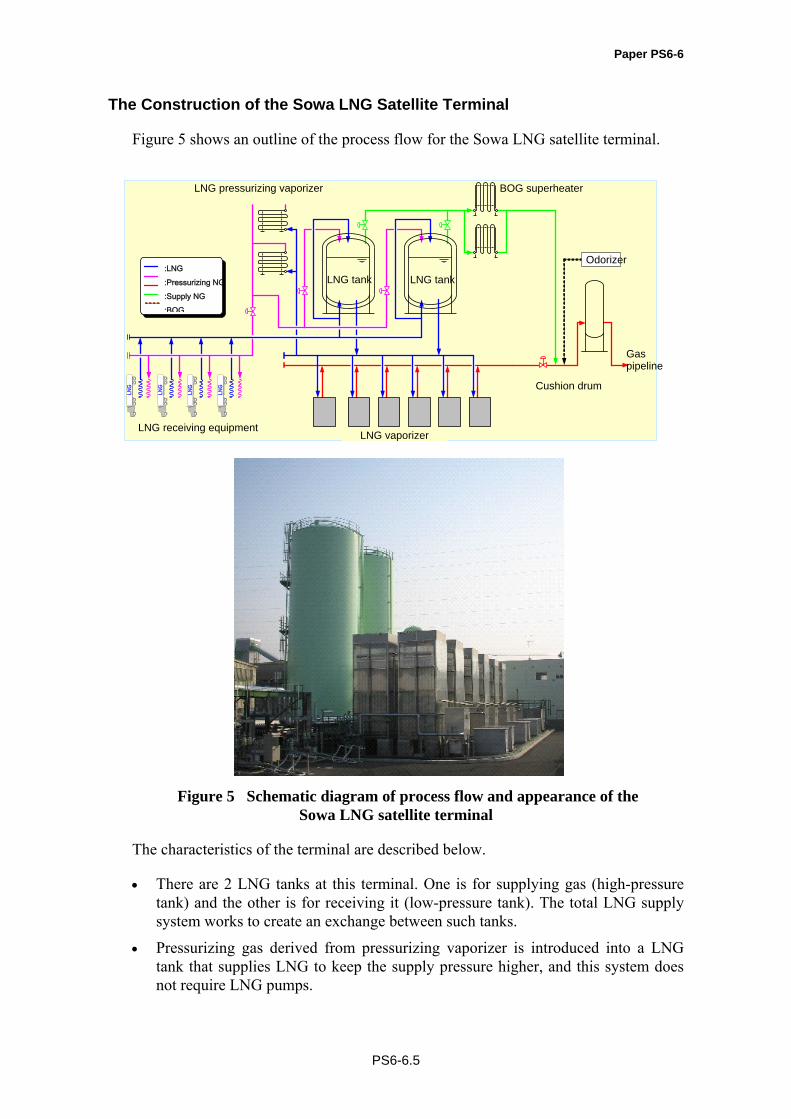
Figure 5 shows an outline of the process flow for the Sowa LNG satellite terminal.
Figure 5 Schematic diagram of process flow and appearance of the Sowa LNG satellite terminal
The characteristics of the terminal are described below.
• There are 2 LNG tanks at this terminal. One is for supplying gas (high-pressure tank) and the other is for receiving it (low-pressure tank). The total LNG supply system works to create an exchange between such tanks.
• Pressurizing gas derived from pressurizing vaporizer is introduced into a LNG tank that supplies LNG to keep the supply pressure higher, and this system does not require LNG pumps.
LNG
LNG
LNG
LNG
ガス導管
LNG気化器ローリー受入設備
LNG加圧蒸発器
LNG貯槽
BOG加温器
クッションドラム
LNG貯槽
HAV HAV HAV HAV HAV HAV
付臭設備: LNG:加圧用NG:送出用NG
:付臭剤: BOG
LNG receiving equipment
LNG vaporizer
BOG superheater LNG pressurizing vaporizer
Cushion drum
Gas pipeline
Odorizer
LNG tankLNG tank:LNG
:Pressurizing NG
:Supply NG
:BOG
Paper PS6-6
PS6-6.6
This system is superior to a system that uses LNG pumps because of its extremely low power consumption, lack of necessity to restart pumps when a power blackout occurs, and low maintenance requirements.
Certain topics pertaining to the construction of the terminal are examined below.
(1) Efficient Utilization of Narrow Construction Space
It was necessary to rationally configure the required facilities in a limited space because this terminal was set up in a small section of an industrial area, although the amount of LNG to be handled was about 40,000 tons per year (domestic maximum scale).
By means of adopting various designation methods, a reduction of space and cost-cutting for operation of the terminal were achieved. Such measures included reduction of receiving lanes as a minimum requirement, increasing the number of runs from the LNG receiving terminal to the satellite terminal, and use of a LNG vaporizer with the adoption of the HAV, which has large capacity for vaporizing gas and does not require a boiler.
(2) High Efficiency of Transportation and Low Management Costs at the Terminal
The Sowa terminal is located at Koga city in Ibaraki prefecture, more than 140 km from the nearest LNG receiving terminal. As for this satellite terminal, because the transportation costs for gas supply via lorries are higher than those for pipelines, it has been necessary to reduce the required costs and to construct and manage the terminal with an eye to business profits to as great an extent as possible.
From the point of view of reduction of initial costs and transportation costs, higher transportation efficiency has necessitated the use of fewer lorries.
Moreover, from a safety viewpoint, it was determined that lorries should be operated during the daytime.
A one-way trip from the LNG receiving terminal to the satellite terminal involves travel over a long distance (more than 140 km) and it takes quite a long time (about 3 hours). Time is increased because traffic jams often occur in metropolitan areas.
In general, it takes more than 90 minutes to receive LNG, involving tasks such as connecting flexible tubes and purging gas. However, at the Sowa terminal, it became possible to radically shorten the required time to about 45 minutes at the most with the implementation of the following measures.
• A constant supply of high-pressure gas from the terminal
• In general, lorries are equipped with vaporizers. During the unloading process, some of the supplied LNG is directed into the vaporizer, and highly pressurized vapor gas is introduced into the lorry tank to pressurize the LNG loading line. However, pressure decreases with this method as the unloading of the LNG progresses, so it is difficult to shorten the time of unloading. This defect is avoided by constantly introducing the pressurized gas from the vaporizer in the terminal to the LNG receiving line
Paper PS6-6
PS6-6.7
• Pipes with large diameters for LNG receiving lines
• In the unloading of LNG, if the diameter of a receiving pipe is too small, then pressure loss becomes large and the unloading time becomes longer. To avoid this problem, we adopted pipes with larger diameters.
• An automatic control system
• Many satellite terminals have implemented manual operation systems to open and close their valves. By adopting the automated control system mentioned below for the operation of valves, it was possible to shorten the operation time.
(3) Highly Reliable Gas Supply
LNG receiving terminals are connected with each other via gas pipelines, so if one terminal fails to supply gas, the total amount of gas supplied may be kept constant by supplying more gas from other terminals. As the Sowa terminal does not connect with other terminals or pipelines and no gas holder exists, if there is a failure of the under stream line of LNG tanks, it would become impossible to satisfy the target gas demand. Therefore, it was necessary to design a highly reliable facility. Above all, in the case of designing the P&ID of terminal, based on the conclusions of data from reliability analysis, we were able to quantitatively evaluate the critical conditions that ensure the reliability of the entire terminal. This allows for the successful supply of gas and feedback for the terminal.
The following material describes some aspects of the above matters in greater detail.
Adoption of Hot Air Draft Superheater with Air Fin Vaporizer (HAV)
At domestic satellite terminals, the most common means of vaporizing LNG involves the use of natural draft air fin vaporizers. Such equipment utilizes ambient heat, and thus costs very little to operate. However, due to the accumulation of frost on the heat exchange surface, the vaporizers can be continuously operated for only a limited duration, making changeover vaporizers essential.
Moreover, in colder regions, hot water vaporizers and accompanying hot water generation equipment are also needed to counter drops in the temperature of gas as it exits air fin vaporizers. As a result, the overall vaporizer system becomes very complex, making for high construction costs. The large amount of fuel required as a heat source for hot water vaporizers in winter also makes operation very expensive.
To overcome these problems, we adopted the HAV (a hot air draft superheater with air fin vaporizer), which was developed by Tokyo Gas and Tokyo Gas Engineering. The HAV is a low-cost, energy-efficient vaporizer that incorporates a hot air source into a single unit based on a conventional air fin vaporizer.
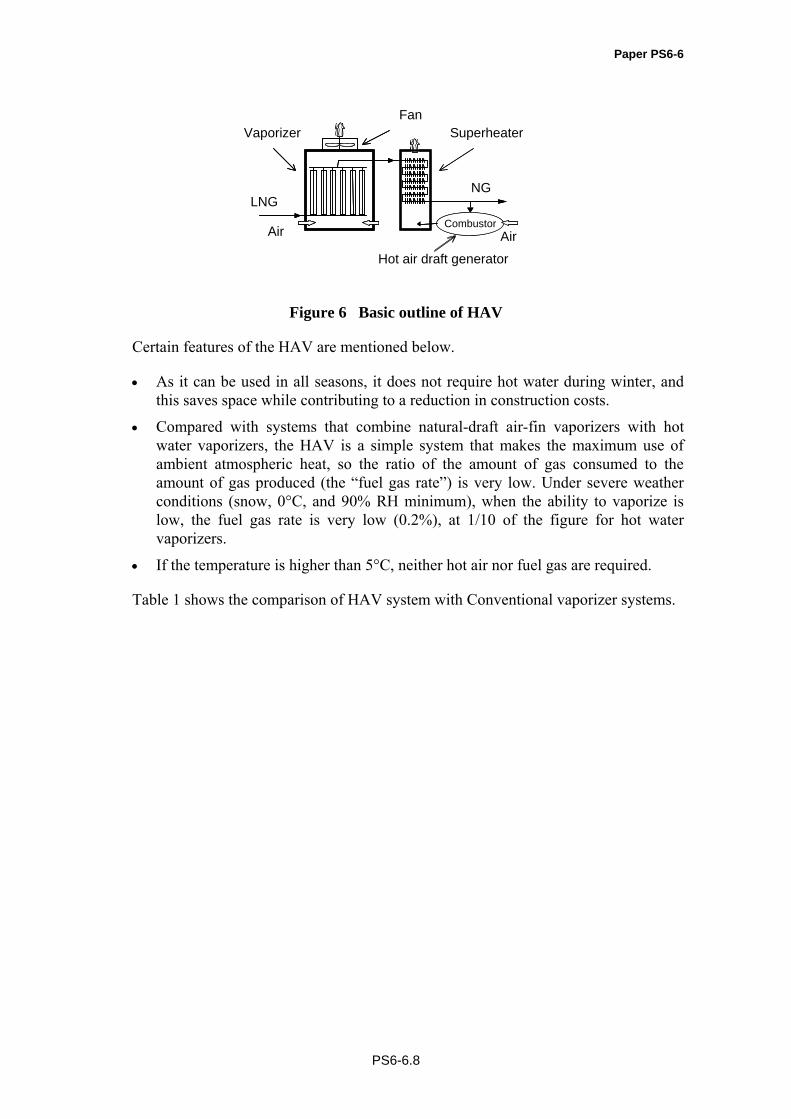
Such vaporizer consists of a vaporizer, superheater, and hot air draft generator as shown in Figure 6. After the forced-draft vaporizer makes maximum use of the ambient atmospheric heat to vaporize the LNG (-162°C in its liquid form), an auxiliary hot air draft is produced in the superheater to boost the temperature of the gas.
Paper PS6-6
PS6-6.8
Figure 6 Basic outline of HAV
Certain features of the HAV are mentioned below.
• As it can be used in all seasons, it does not require hot water during winter, and this saves space while contributing to a reduction in construction costs.
• Compared with systems that combine natural-draft air-fin vaporizers with hot water vaporizers, the HAV is a simple system that makes the maximum use of ambient atmospheric heat, so the ratio of the amount of gas consumed to the amount of gas produced (the “fuel gas rate”) is very low. Under severe weather conditions (snow, 0°C, and 90% RH minimum), when the ability to vaporize is low, the fuel gas rate is very low (0.2%), at 1/10 of the figure for hot water vaporizers.
• If the temperature is higher than 5°C, neither hot air nor fuel gas are required.
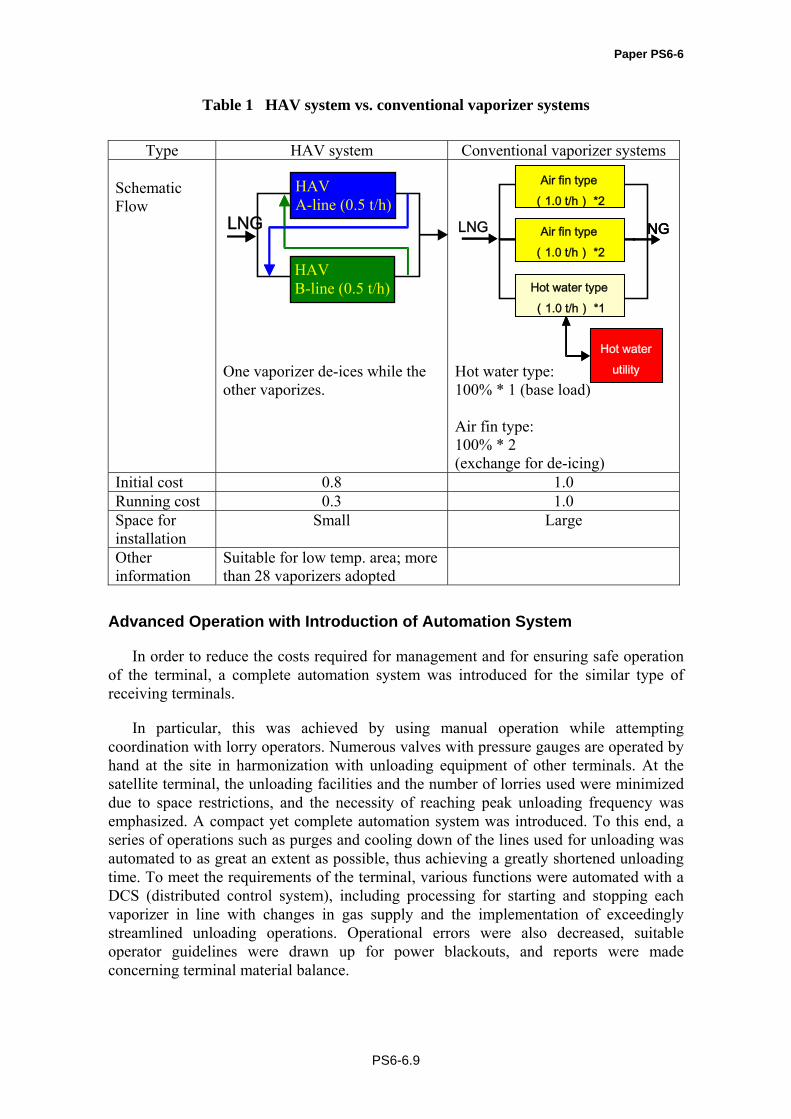
Table 1 shows the comparison of HAV system with Conventional vaporizer systems.
Hot air draft generator
Air Air Combustor
LNGNG
SuperheaterFan
Vaporizer
Paper PS6-6
PS6-6.9
Table 1 HAV system vs. conventional vaporizer systems
Advanced Operation with Introduction of Automation System
In order to reduce the costs required for management and for ensuring safe operation of the terminal, a complete automation system was introduced for the similar type of receiving terminals.
In particular, this was achieved by using manual operation while attempting coordination with lorry operators. Numerous valves with pressure gauges are operated by hand at the site in harmonization with unloading equipment of other terminals. At the satellite terminal, the unloading facilities and the number of lorries used were minimized due to space restrictions, and the necessity of reaching peak unloading frequency was emphasized. A compact yet complete automation system was introduced. To this end, a series of operations such as purges and cooling down of the lines used for unloading was automated to as great an extent as possible, thus achieving a greatly shortened unloading time. To meet the requirements of the terminal, various functions were automated with a DCS (distributed control system), including processing for starting and stopping each vaporizer in line with changes in gas supply and the implementation of exceedingly streamlined unloading operations. Operational errors were also decreased, suitable operator guidelines were drawn up for power blackouts, and reports were made concerning terminal material balance.
Type HAV system Conventional vaporizer systems Schematic Flow
One vaporizer de-ices while the other vaporizes.
Hot water type: 100% * 1 (base load) Air fin type: 100% * 2 (exchange for de-icing)
Initial cost 0.8 1.0 Running cost 0.3 1.0 Space for installation
Small Large
Other information
Suitable for low temp. area; more than 28 vaporizers adopted
LNG NG
温水 設備
空温式1.0t/h
空温式1.0t/hNG
Hot water
utility
Air fin type
(1.0 t/h) *2
Air fin type
(1.0 t/h) *2
Hot water type
(1.0 t/h) *1
LNG
HAV A-line (0.5 t/h)
HAV B-line (0.5 t/h)
Paper PS6-6
PS6-6.10
As a result, it was possible to minimize the number of required operators to a single person in many cases (and to only two persons in the case of unloading work).
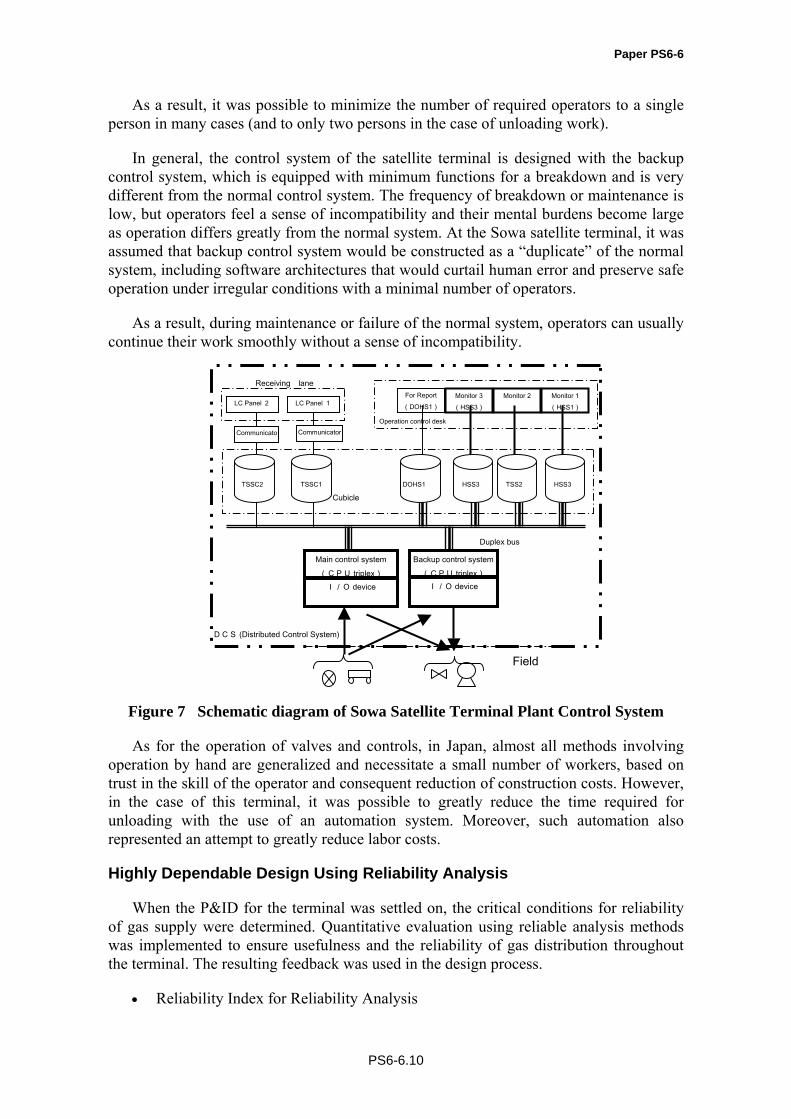
In general, the control system of the satellite terminal is designed with the backup control system, which is equipped with minimum functions for a breakdown and is very different from the normal control system. The frequency of breakdown or maintenance is low, but operators feel a sense of incompatibility and their mental burdens become large as operation differs greatly from the normal system. At the Sowa satellite terminal, it was assumed that backup control system would be constructed as a “duplicate” of the normal system, including software architectures that would curtail human error and preserve safe operation under irregular conditions with a minimal number of operators.
As a result, during maintenance or failure of the normal system, operators can usually continue their work smoothly without a sense of incompatibility.
Figure 7 Schematic diagram of Sowa Satellite Terminal Plant Control System
As for the operation of valves and controls, in Japan, almost all methods involving operation by hand are generalized and necessitate a small number of workers, based on trust in the skill of the operator and consequent reduction of construction costs. However, in the case of this terminal, it was possible to greatly reduce the time required for unloading with the use of an automation system. Moreover, such automation also represented an attempt to greatly reduce labor costs.
Highly Dependable Design Using Reliability Analysis
When the P&ID for the terminal was settled on, the critical conditions for reliability of gas supply were determined. Quantitative evaluation using reliable analysis methods was implemented to ensure usefulness and the reliability of gas distribution throughout the terminal. The resulting feedback was used in the design process.
• Reliability Index for Reliability Analysis
Monitor 3
(HSS3)
Monitor 2
Monitor 1
(HSS1)
For Report
(DOHS1) LC Panel 2
DOHS1 HSS3 HSS3 TSS2
LC Panel 1
TSSC2 TSSC1
Communicato CommunicatorOperation control desk
Receiving lane
Cubicle
Main control system
(CPU triplex)
Backup control system
(CPU triplex)I/O device I/O device
Field
Duplex bus
DCS (Distributed Control System)
Paper PS6-6
PS6-6.11
Target demand
Time
Evaluation period T
Designed demand
Dem
and
of T
erm
inal
t1 t2
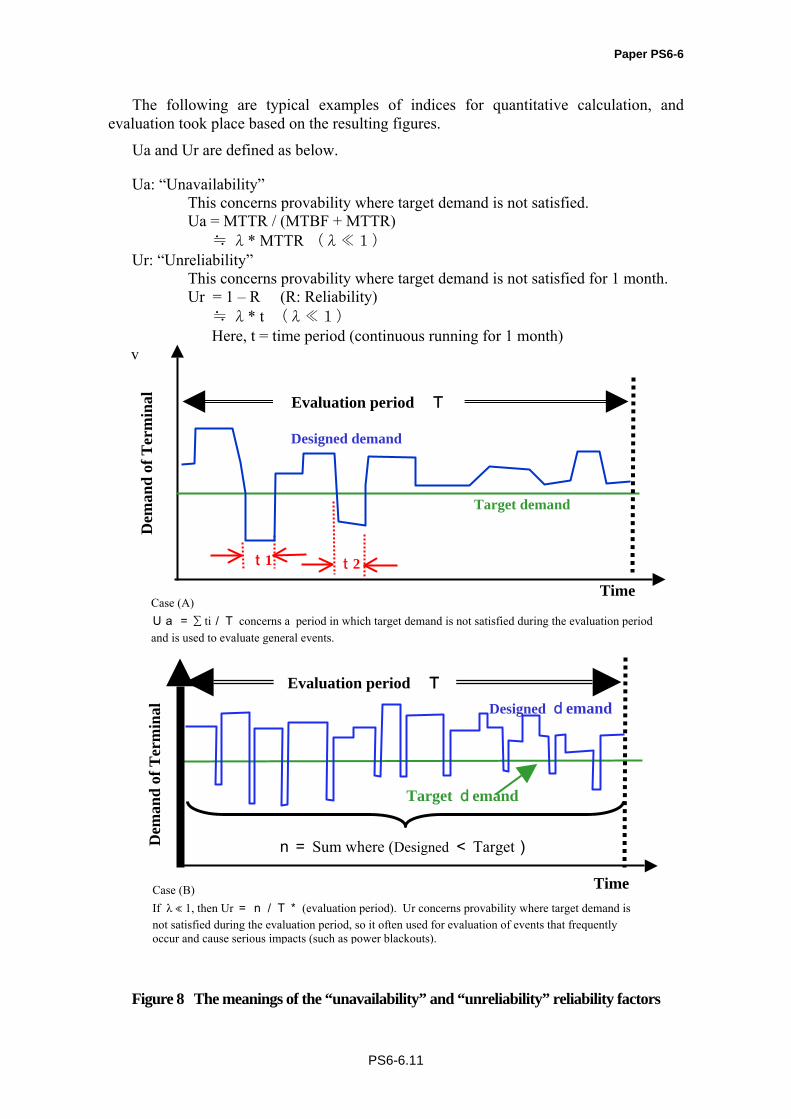
Case (A) Ua = ∑ ti/T concerns a period in which target demand is not satisfied during the evaluation period and is used to evaluate general events.
Target demand
Time
Dem
and
of T
erm
inal
Evaluation period TDesigned demand
n= Sum where (Designed < Target)
Case (B) If λ ≪ 1, then Ur = n/T* (evaluation period). Ur concerns provability where target demand is not satisfied during the evaluation period, so it often used for evaluation of events that frequently occur and cause serious impacts (such as power blackouts).
The following are typical examples of indices for quantitative calculation, and evaluation took place based on the resulting figures.
Ua and Ur are defined as below.
Ua: “Unavailability” This concerns provability where target demand is not satisfied. Ua = MTTR / (MTBF + MTTR)
≒ λ* MTTR (λ≪1) Ur: “Unreliability”
This concerns provability where target demand is not satisfied for 1 month. Ur = 1 – R (R: Reliability)
≒ λ* t (λ≪1) Here, t = time period (continuous running for 1 month)
v
Figure 8 The meanings of the “unavailability” and “unreliability” reliability factors
Paper PS6-6
PS6-6.12
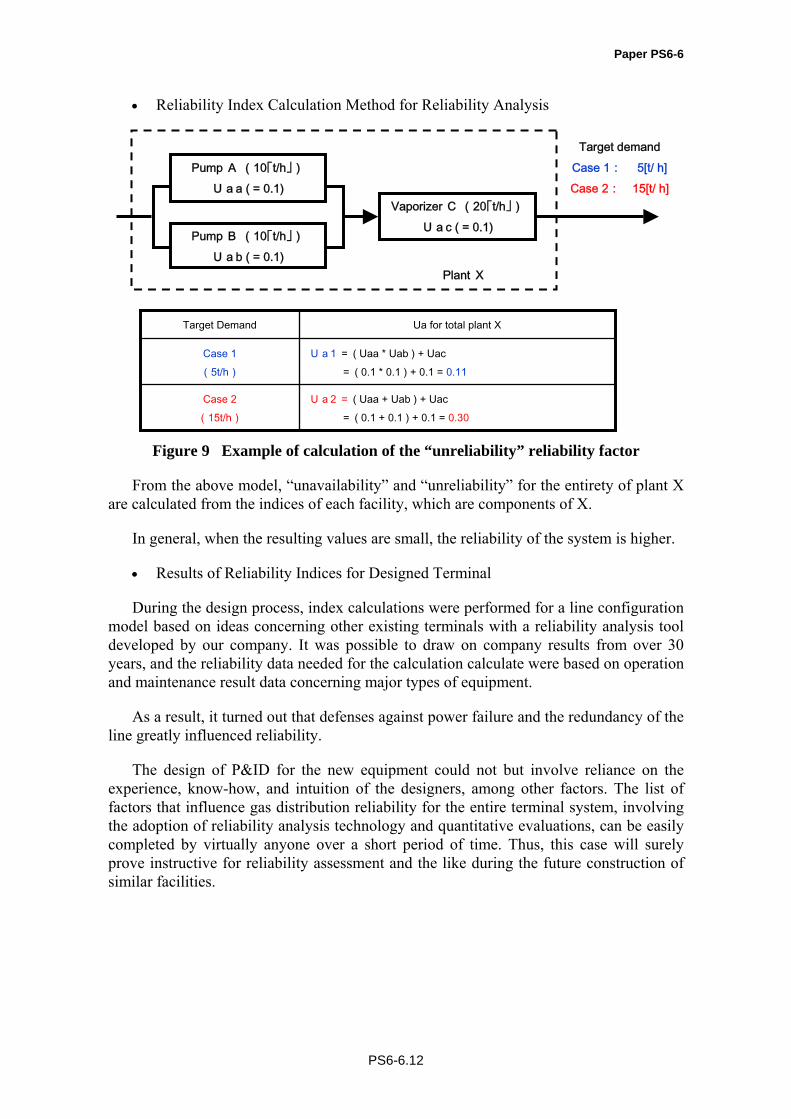
• Reliability Index Calculation Method for Reliability Analysis
Figure 9 Example of calculation of the “unreliability” reliability factor
From the above model, “unavailability” and “unreliability” for the entirety of plant X are calculated from the indices of each facility, which are components of X.
In general, when the resulting values are small, the reliability of the system is higher.
• Results of Reliability Indices for Designed Terminal
During the design process, index calculations were performed for a line configuration model based on ideas concerning other existing terminals with a reliability analysis tool developed by our company. It was possible to draw on company results from over 30 years, and the reliability data needed for the calculation calculate were based on operation and maintenance result data concerning major types of equipment.
As a result, it turned out that defenses against power failure and the redundancy of the line greatly influenced reliability.
The design of P&ID for the new equipment could not but involve reliance on the experience, know-how, and intuition of the designers, among other factors. The list of factors that influence gas distribution reliability for the entire terminal system, involving the adoption of reliability analysis technology and quantitative evaluations, can be easily completed by virtually anyone over a short period of time. Thus, this case will surely prove instructive for reliability assessment and the like during the future construction of similar facilities.
Pump A (10「t/h」)
Uaa ( = 0.1)
Pump B (10「t/h」)
Uab ( = 0.1)
Target demand
Case 1: 5[t/ h]
Case 2: 15[t/ h]
Plant X
Vaporizer C (20「t/h」)
Uac ( = 0.1)
Ua2 = ( Uaa + Uab ) + Uac
= ( 0.1 + 0.1 ) + 0.1 = 0.30
Case 2
(15t/h)
Ua1 = ( Uaa * Uab ) + Uac
= ( 0.1 * 0.1 ) + 0.1 = 0.11
Case 1
(5t/h)
Ua for total plant X Target Demand
Paper PS6-6
PS6-6.13
Conclusion
This case represents the first attempt at construction of a satellite terminal of maximum scale in Japan targeting only big customers.
The Sowa terminal was constructed in a compact space while conserving costs and using highly reliable equipment.
For many reasons, it is believed that industrial customers will increase in number, and thus it is thought that similar terminals will be constructed in the future. It is possible to contribute to the expansion of natural gas use, providing clean energy with low environmental impact in Japan, if various conditions are met, such as those involving pipes, receiving terminals, and locations.