Embed Size (px)
Citation preview
THE WORLD BANK
W O R L D B A N K W O R K I N G P A P E R N O . 1 8 2
The Education Systemin Malawi
Pub
lic D
iscl
osur
e A
utho
rized
Pub
lic D
iscl
osur
e A
utho
rized
Pub
lic D
iscl
osur
e A
utho
rized
Pub
lic D
iscl
osur
e A
utho
rized
Pub
lic D
iscl
osur
e A
utho
rized
Pub
lic D
iscl
osur
e A
utho
rized
Pub
lic D
iscl
osur
e A
utho
rized
Pub
lic D
iscl
osur
e A
utho
rized

W O R L D B A N K W O R K I N G P A P E R N O . 1 8 2
The�Education�System��in�Malawi��������������������������
�
��

�
Copyright�©�2010�The�International�Bank�for�Reconstruction�and�Development�/�The�World�Bank�1818�H�Street,�N.W.�Washington,�D.C.�20433,�U.S.A.�All�rights�reserved�Manufactured�in�the�United�States�of�America�First�Printing:�January�2010��
�Printed�on�recycled�paper�
1�2�3�4�5� � � 13�12�11�10���World� Bank� Working� Papers� are� published� to� communicate� the� results� of� the� Bank’s� work� to� the�development�community�with�the�least�possible�delay.�The�manuscript�of�this�paper�therefore�has�not�been�prepared� in�accordance�with� the�procedures�appropriate� to� formally�edited� texts.�Some�sources�cited�in�this�paper�may�be�informal�documents�that�are�not�readily�available.��
The�findings,�interpretations,�and�conclusions�expressed�herein�are�those�of�the�author(s)�and�do�not� necessarily� reflect� the� views� of� the� International� Bank� for� Reconstruction� and�Development/The�World�Bank�and�its�affiliated�organizations,�or�those�of�the�Executive�Directors�of�The�World�Bank�or�the�governments�they�represent.��
The� World� Bank� does� not� guarantee� the� accuracy� of� the� data� included� in� this� work.� The�boundaries,�colors,�denominations,�and�other�information�shown�on�any�map�in�this�work�do�not�imply�any�judgment�on�the�part�of�The�World�Bank�of�the�legal�status�of�any�territory�or�the�endorsement�or�acceptance�of�such�boundaries.�
The�material�in�this�publication�is�copyrighted.�Copying�and/or�transmitting�portions�or�all�of�this�work� without� permission� may� be� a� violation� of� applicable� law.� The� International� Bank� for�Reconstruction� and� Development/The� World� Bank� encourages� dissemination� of� its� work� and� will�normally�grant�permission�promptly�to�reproduce�portions�of�the�work.�
For�permission�to�photocopy�or�reprint�any�part�of�this�work,�please�send�a�request�with�complete�information� to� the�Copyright�Clearance�Center,� Inc.,�222�Rosewood�Drive,�Danvers,�MA�01923,�USA,�Tel:�978�750�8400,�Fax:�978�750�4470,�www.copyright.com.�
All�other�queries�on�rights�and� licenses,� including�subsidiary�rights,� should�be�addressed� to� the�Office�of�the�Publisher,�The�World�Bank,�1818�H�Street�NW,�Washington,�DC�20433,�USA,�Fax:�202�522�2422,�email:�[email protected].���ISBN�13:�978�0�8213�8198�4�eISBN:�978�0�8213�8199�1�ISSN:�1726�5878� DOI:�10.1596/978�0�8213�8198�4��Library�of�Congress�Cataloging�in�Publication�Data���The�education�system�in�Malawi�:�country�status�report.��p.�cm.��ISBN�978�0�8213�8198�4�1.�Education��Malawi.�I.�World�Bank.���LA1551.E385�2010��370.96897��dc22�� 2009045470����
iii
Contents�
Foreword�from�the�Minister�of�Education,�Government�of�Malawi�..........................�xviii�
Foreword�from�the�World�Bank�............................................................................................�xx�
Acknowledgments�...............................................................................................................�xxiv�
Acronyms�and�Abbreviations�............................................................................................�xxvi�
Executive�Summary�...........................................................................................................�xxviii�
Policy�Recommendations�Matrix�by�Sub�Sector�............................................................�lii�Technical,�Entrepreneurial,�and�Vocational�Education�and�Training�(TEVET)�....�lviii�Higher�Education�............................................................................................................�lxiii�
1.�Demographics,�Social�Development,�and�Macroeconomic�Conditions�......................�1�
Summary�of�the�Chapter�....................................................................................................�1�Demographics�.....................................................................................................................�2�Social�Development�............................................................................................................�4�Macroeconomic�Conditions�...............................................................................................�5�
2.�Enrollment�Patterns�............................................................................................................�12�
Summary�of�the�Chapter�..................................................................................................�12�The�Education�System�in�Malawi�...................................................................................�13�Coverage�in�Primary�and�Secondary�Education:�Schooling�and�Survival�
Profiles�........................................................................................................................�18�Understanding�Dropouts�at�the�Primary�Level�............................................................�26�
3.�Education�Expenditure�and�Financing�............................................................................�32�
Summary�of�the�Chapter�..................................................................................................�32�Total�Public�Recurrent�Expenditure�for�Education�......................................................�34�Public�Recurrent�Expenditure�by�Level�of�Schooling�..................................................�38�Public�Recurrent�Unit�Costs�by�Level�of�Schooling�......................................................�42�Household�Financing�.......................................................................................................�46�Donor�Financing�for�the�Education�Sector�(2005–2008)�...............................................�51�Comparisons�of�School�Construction�Costs�..................................................................�52�
4.�Internal�Efficiency,�Learning�Outcomes,�and�Management�Issues�............................�54�
Summary�of�the�Chapter�..................................................................................................�54�Internal�Efficiency�of�the�Education�System�.................................................................�57�Quality�and�Learning�Outcomes�....................................................................................�64�Administration�Management�..........................................................................................�76�Pedagogical�Management:�Transforming�Inputs�into�Learning�Outcomes�..............�96�
iv Contents
5.�Equity�and�Disparities�......................................................................................................�101�
Summary�of�the�Chapter�................................................................................................�101�Disparities�among�Social�Groups�.................................................................................�102�Equity�in�Distribution�of�Public�Resources�for�Education�.........................................�114�
6.�Technical,�Entrepreneurial,�and�Vocational�Education�and�Training�.....................�118�
Summary�of�the�Chapter�................................................................................................�118�Introduction�.....................................................................................................................�119�Enrollment�.......................................................................................................................�121�Equity�...............................................................................................................................�124�Costs�and�Financing�.......................................................................................................�127�Internal�Efficiency�and�Quality�.....................................................................................�135�Governance�Issues�and�Institutional�Set�up�................................................................�141�
7.�Higher�Education�...............................................................................................................�147�
Summary�of�the�Chapter�................................................................................................�147�The�Genesis�and�Growth�of�Higher�Education�in�Malawi�........................................�148�Higher�Education�Enrollments�and�Fields�of�Study�..................................................�149�Financing�..........................................................................................................................�158�Internal�Efficiency�...........................................................................................................�169�Equity�in�Higher�Education�...........................................................................................�175�Governance�and�Management�......................................................................................�177�
8.�External�Efficiency�............................................................................................................�182�
Summary�of�the�Chapter�................................................................................................�182�Education�and�Human�Development�in�Malawi........................................................�183�Relevance�of�Education�for�the�Labor�Market�............................................................�187�
Appendixes�.............................................................................................................................�206�
Appendix�1.1:�Demographic�and�Social�Development�Indicators�...........................�207�Appendix�1.2:�Context�Index,�Methodology�of�Calculation�.....................................�211�Appendix�2.1:�Education�System�Structure�.................................................................�212�Appendix�2.2:�Enrollment�Trends�................................................................................�213�Appendix�2.3:�Population�Estimates�for�the�Malawi�CSR�.........................................�215�Appendix�2.4:�Cross�Sectional�Schooling�Profiles�According�to�EMIS�and�UN�
Population�Data�.......................................................................................................�224�Appendix�2.5:�How�to�Read�Educational�Pyramids?�.................................................�226�Appendix�2.6:�Factors�Explaining�Why�Some�Children�Never�Go�to�Primary�
Education�..................................................................................................................�228�Appendix�2.7:�Model�Result�for�Retention�Explanation,�Based�on�EMIS�Data�......�231�Appendix�2.8:�Quantitative�Efficiency�of�Education�Expenditure�...........................�232�Appendix�3.1:�Expenditure�by�Type�and�Source�of�Funding�...................................�235�

Contents v
Appendix�3.2:�Ministries�with�Some�Education�Activities�and�Education�Institutions�Outside�of�the�Ministry�of�Education�..............................................�237�
Appendix�3.3:�Recurrent�and�Capital�Allocations�to�ECD�and�Adult�Literacy�......�238�Appendix�3.4:�Adjustment�Methodology�for�Comparing�Distribution�of�
Recurrent�Expenditure�by�Level�of�Education�....................................................�239�Appendix�3.5:�Comparative�Data�on�Expenditure�Breakdown�in�Higher�
Education�..................................................................................................................�240�Appendix�3.6:�Teachers’�Salaries�in�Primary�and�Secondary�Education�by�
Category�of�Teachers�..............................................................................................�241�Appendix�4.1:�Internal�Efficiency�and�Resources�Management�...............................�242�Appendix�4.2:�SACMEQ�Levels�Definitions�...............................................................�247�Appendix�4.3:�Examination�Pass�Rates�Analysis�........................................................�248�Appendix�4.4:�Consistency�in�Resource�Allocations�..................................................�251�Appendix�4.5:�Teacher�Training�....................................................................................�253�Appendix�5.1:�Internal�Efficiency�Tables�by�Gender�..................................................�256�Appendix�5.2:�Disparities�..............................................................................................�257�Appendix�6.1:�TEVET�Recurrent�Unit�Cost�and�Financial�Management�Issues�....�264�Appendix�6.2:�Other�TEVET�Indicators�.......................................................................�265�Appendix�7:�Higher�Education�.....................................................................................�272�Appendix�8.1:�Duration�of�Job�Search�..........................................................................�283�Appendix�8.2:�Results�of�the�Impact�of�Education�on�Social�Behavior�
Calculations�..............................................................................................................�284�Appendix�8.3:�Rates�of�Return�of�Education�Investments:�Calculation�Method�....�288�Appendix�8.4:�Employment�and�Income�Data�............................................................�293�
Appendix�9:�Tracer�Study�of�TEVET�and�Higher�Education�Completers�...................�295�
Part�I:�General�Background�.................................................................................................�297�
1.�Introduction�.................................................................................................................�297�2.�Objectives�of�the�Study�...............................................................................................�298�3.�Methodology�...............................................................................................................�299�
Part�II:�Higher�Education�Tracer�Study�.............................................................................�301�
Introduction:�The�Context�of�the�University�System�in�Malawi�...............................�301�1.�Methodology�...............................................................................................................�302�2.�Results�of�Graduate�Study�.........................................................................................�304�3.�Results�of�Dropout�Study...........................................................................................�313�4.�Summary�and�Conclusions�........................................................................................�315�5.�Conclusions�and�Recommendations�........................................................................�316�
Part�III:�TEVET�Tracer�Study�..............................................................................................�318�
Introduction:�The�Context�of�the�TEVET�System�in�Malawi�.....................................�318�1.�Methodology�...............................................................................................................�319�
vi Contents
2.�Results�of�TEVET�Study�.............................................................................................�320�4.�Summary�and�Conclusions�........................................................................................�331�
Part�IV:�Final�Remarks�.........................................................................................................�334�
References�...............................................................................................................................�335�
�
Tables�
Table�1:�STR�in�Public�Schools�by�Level�of�Education�(2007)�.............................................�xl�Table�2:�Higher�Education�Teachers’�Average�Salary,�as�Units�of�GDP�Per�
Capita�for�Countries�with�GDP�per�Capita�Lower�than�US$500�(2007�or�last�year�available)�...............................................................................................................�xlvii�
Table�3:�Annual�Average�Income�and�Expected�Annual�Income�According�to�Level�of�Education�.........................................................................................................�xlix�
Table�1.1:�Evolution�in�Real�GDP�Growth,�Inflation,�and�Exchange�Rate�(MK/US$)�............................................................................................................................�6�
Table�1.2:�Evolution�in�Total�Government�Revenue�and�Expenditure�and�Deficit�..........�7�Table�1.3:�GDP�Per�Capita�and�Domestic�Resources�as�a�Percentage��of�GDP�for�
SADC�Countries�(ca.�2006)................................................................................................�8�Table�1.4:�Annual�External�Aid�for�Education�as�Percentage�of�GDP��(2004–2006�
Average)�..............................................................................................................................�9�Table�2.1:�Enrollment�Trends�per�Education�Level�(1998–2007)�.......................................�15�Table�2.2:�Schooling�Coverage�by�Level�of�Education�(2000–2007)�..................................�17�Table�2.3:�International�Comparison�on�GER�(SADC�countries)�......................................�18�Table�2.4:�Percent�of�Repeaters�in�Primary�Education�According�to�Different�
Data�Sources�(in�%)�..........................................................................................................�19�Table�2.5:�Construction�of�Survival�Profile�..........................................................................�23�Table�2.6:�Share�of�Schools�and�Pupils�According�to�the�Number�of�Standards�
Supplied�............................................................................................................................�26�Table�2.7:�Percentage�of�Pupils�Who�Cannot�Continue�on�to�the�Next�Standard�
in�the�Same�School,�2006–07�(in�%)�................................................................................�27�Table�2.8:�Main�Reasons�for�Dropping�Out�of�School�Declared�by�School�Heads�
(in�%)�..................................................................................................................................�29�Table�2.9:�Main�Reasons�for�Dropping�Out�of�School,�Declared�by�Pupils�(in�%)�..........�29�Table�3.1�Education�Public�Recurrent�Expenditure�............................................................�35�Table�3.2:�Percentages�for�Education�in�Public�Recurrent�Expenditure,�SADC�
countries�............................................................................................................................�35�Table�3.3:�Breakdown�of�Total�Public�Recurrent�Expenditure�by�Nature�of�
Spending�and�by�Level�of�Education�(in�%)�.................................................................�37�Table�3.4:�Breakdown�of�Public�Recurrent�Expenditure�(revised�07/08�budget)�
by�level�of�Schooling�........................................................................................................�39�Table�3.5:�Distribution�of�Recurrent�Expenditure�by�Level�of�Schooling,�SADC�
Countries,�(2008�or�last�year�available)�.........................................................................�40�Table�3.6:�Public�Recurrent�Unit�Costs�by�Level�of�Schooling...........................................�43�Table�3.7:�Primary�and�Secondary�Public�Recurrent�Unit�Costs,�SADC�Countries�
(2007�or�last�year�available)�............................................................................................�44�

Contents vii
Table�3.8:�Higher�Education�Teachers’�Average�Salary,�as�Units�of�GDP�Per�Capita�for�Countries�with�GDP�per�Capita�Lower�than�US$500�(2007�or�last�year�available)�..................................................................................................................�45�
Table�3.9:�Student�Teacher�Ratios�in�Public�Schools,�2007�.................................................�46�Table�3.10:�Estimated�Breakdown�of�the�Household�Expenditure�by�Level�of�
Education�and�Household�Unit�Costs,�2007�.................................................................�47�Table�3.11:�Decomposition�of�Household�Education�Expenditure�(in�%)�.......................�49�Table�3.12:�Cross�country�Comparison�of�Distribution�of�Household�Education�
Expenditure�......................................................................................................................�50�Table�3.13:�Share�of�Education�in�Household�Expenditure�by�Quintile�of�
Household�Income�...........................................................................................................�50�Table�3.14:�Donor�Financing�and�Extra�Budgetary�Grants�to�Education�(MK�
Millions)�............................................................................................................................�51�Table�3.15:�Unit�Construction�Costs�in�Primary�School�Construction�(US$)�...................�52�Table�4.1:�Trend�in�Repetition�Rates�by�Standard�in�Primary�Schools�of�All�
Types�(1999�and�2006)�(in�%)�..........................................................................................�60�Table�4.2:�Repetition�Rates�by�Form�in�Secondary�Schools�of�All�Types�(2006)�
(in�%)�..................................................................................................................................�60�Table�4.3:�Dropout�Rates�at�the�Primary�Level�in�All�Types�of�Schools�(1999�and�
2006)�(in�%)�.......................................................................................................................�62�Table�4.4:�Dropout�Rates�at�the�Secondary�level�in�All�Types�of�Schools�(2006)�
(in�%)�..................................................................................................................................�62�Table�4.5:�Internal�Efficiency�Coefficient�in�Primary�and�Secondary�Schooling�
(1999/00–2006/07)�.............................................................................................................�63�Table�4.6:�Reading�(English)�and�Mathematics�Scores�and�Percentage�of�
Students�Reaching�Minimum�and�Desirable�Levels�of�Reading�Mastery�(SACMEQ�I�and�II)�..........................................................................................................�65�
Table�4.7:�Leaving�School�Examination�Results�at�the�Primary�Level�by�School�Type�in�%�(2006)�...............................................................................................................�67�
Table�4.8:�JCE�and�MSCE�Examination�Results�(2006)�.......................................................�68�Table�4.9:�JCE�and�MSCE�Examinations�Pass�Rates�by�School�Types�in�%�(2006)�..........�68�Table�4.10:�Determinants�of�PSLE�Results�at�the�National�Level�(2006)—�
Marginal�Effect�.................................................................................................................�71�Table�4.11:�Determinants�of�MSCE�Results�at�the�National�Level�(2006)—�
Marginal�Effect�.................................................................................................................�75�Table�4.12:�Teacher�Status�by�Location�(in�%),�Government�Funded�Primary�
Schools�(2007)�...................................................................................................................�78�Table�4.13:�Teacher�Distribution�by�Gender�and�Location�(in�%),�Government�
Funded�Primary�Schools�(2007)�.....................................................................................�78�Table�4.14:�Teacher�Qualifications�and�Training�Status�by�Location�and�Gender�
(in�%),�Government�Funded�Primary�Schools�(2007)�.................................................�79�Table�4.15:�Types�of�Training�among�Trained�Teachers�(in�%),�Government�
Funded�Primary�Schools�(2007)�.....................................................................................�79�Table�4.16:�Reasons�for�Attrition�among�Government�Funded�Primary�Schools�..........�80�Table�4.17:�STR�by�Location�in�All�Government�Funded�Schools�(1999�and�2007)�........�80�

viii Contents
Table�4.18:�STRs�and�Class�Size,�Standards�1–8,�in�Government�Funded�Public�Schools�(2000�and�2007)�...................................................................................................�82�
Table�4.19:�Degree�of�Randomness�at�Division�Level,�Government�Funded�Schools�(2007)�...................................................................................................................�85�
Table�4.20:�Book�Allocation�by�Standards�in�Government�Aided�Schools�(2007)�..........�87�Table�4.21:�Book�Allocation�Coherence�by�Standards�in�Government�Aided�
Schools�(2007)�(in�%)�........................................................................................................�88�Table�4.22:�Teacher�Characteristics�in�Government�Funded�Secondary�Schools�
by�Type�of�School�(2007)�(in�%)�......................................................................................�90�Table�4.23:�Teacher�Attrition�by�Reason�at�the�Secondary�Level�(2007)�...........................�91�Table�4.24:�STR�by�Types�of�Schools�and�Location,�Government�Funded�
Secondary�Schools�(2007)�................................................................................................�92�Table�4.25:�Recap�of�the�Funds�Allocated�to�Secondary�Schools�......................................�93�Table�4.26:�Relationship�between�the�Wage�Unit�Cost�and�the�Number�of�
Students�at�the�Primary�Level�........................................................................................�94�Table�4.27:�Relationship�between�the�Wage�Unit�Cost�(Teachers�Only)�and�the�
Number�of�Students�at�the�Secondary�Level�................................................................�95�Table�5.1:�Social�Structure�by�Highest�Level�of�Education�and�Comparison�
Group,��5–24�Years�Old�(in�%)�......................................................................................�102�Table�5.2:�Gender�Parity�Indexes�at�Different�Education�Levels,�2000–2007�.................�103�Table�5.3:�Percentage�of�Pupils�Reaching�Minimum�and�Desirable�Levels�of�
Reading�Mastery�(SACMEQ�II)�....................................................................................�105�Table�5.4:�Leaving�School�Examination�Results�at�the�Primary�Level�by�Gender�
(2006)�...............................................................................................................................�106�Table�5.5:�JCE�and�MSCE�Examination�Results�at�the�Secondary�Level��by�
Gender�(2006)�.................................................................................................................�106�Table�5.6:�Differences�of�Access�and�Completion�Rates�in�Primary�and�
Secondary�Education�.....................................................................................................�107�Table�5.7:�Survival�Rates�and�Transition�Across�Levels�(in�%)�.......................................�110�Table�5.8:�Percentage�of�Pupils�Reaching�Minimum�and�Desirable�Levels�of�
Reading�Mastery�(SACMEQ�II)�....................................................................................�113�Table�5.9:�Distribution�of�Public�Education�Spending�According�to�the�Highest�
Level�Attended�(Pseudo�Cohort�of�100�Children)�.....................................................�114�Table�5.18:�Benefit�Incidence�................................................................................................�117�Table�6.1:�Synopsis�of�Different�TEVET�Provider�Types�in�Malawi�...............................�119�Table�6.2�Number�of�Regular�and�Parallel�Students�in�Technical�Colleges�(2007)�.......�122�Table�6.3:�Sources�of�TEVET�Funding�by�Training�Provider�System�.............................�128�Table�6.4:�Total�Public�Spending�for�TEVET�2007/08�(MK)�.............................................�129�Table�6.5:�Summary�per�Trainee�of�Public�Allocations�to�TCs,�2007/08�.........................�130�Table�6.6:�Expenditure�in�TC�2007/08�(Revised�Budget)�by�Subprograms�(in�%)�.........�131�Table�6.7:�TEVETA�Income�from�2003–2007�(MK)�............................................................�132�Table�6.8:�TEVETA�Expenditure�Structure�2002/03�to�2006/07�(in�%)�............................�133�Table�6.9:�Qualifications�of�Teachers�in�TCs�(2007)�...........................................................�140�Table�7.1:�Enrollment,�Actual�Number,�and�Number�per�100,000�Inhabitants�.............�149�Table�7.2:�Fields�of�Study�(2008)�..........................................................................................�152�Table�7.3:�Postgraduate�Students�by�Fields�of�Study�and�College�(2008)�......................�156�
Contents ix
Table�7.4:�Comparison�of�Fees�in�Public�and�Private�Universities�(in�MK)�...................�160�Table�7.5:�Surplus�and�Deficit�in�Expenditures�.................................................................�164�Table�7.6a:�Unit�Cost�Per�Expenditure�Category:�UNIMA�(in�MK)�...............................�166�Table�7.6b:�Unit�Cost�per�Expenditure�Category:�MZUNI�(in�MK)�................................�166�Table�7.7:�Staff�Profile�in�Public�and�Private�Universities�................................................�169�Table�7.8:�Qualifications�of�Staff�in�Public�Institutions�....................................................�170�Table�7.9:�Student/Staff�Ratios�for�2008�..............................................................................�171�Table�7.10:�Cumulative�University�Graduate�Output�(2003–2007)�.................................�172�Table�7.11:�Enrollment�of�Women�by�Fields�of�Study�(2008)�...........................................�176�Table�8.1:�Simulated�Net�Impact�of�Education�on�Social�Behaviors�in�Malawi�............�184�Table�8.2:�Impact�of�a�Mother’s�Education�on�Various�Adult�Behaviors�(Share�
for�the�Different�Cycles)�(in�%)�....................................................................................�187�Table�8.3:�Distribution�of�Workforce�by�Level�of�Education�and�Type�of�
Employment�in�Percentages�for�15�years�old�and�Over�(2004)�...............................�188�Table�8.4:�Annual�Average�Income�and�Expected�Annual�Income�According�to�
Level�of�Schooling�..........................................................................................................�189�Table�8.5:�Months�Needed�by�HE�Graduates�to�Properly�Carry�out�Professional�
Tasks�................................................................................................................................�193�Table�8.7:�Employment�Status�of�TEVET�Completers�......................................................�194�Table�8.8:�Employment�(of�All�Kinds)�Rate�of�TEVET�Graduates�or�Leavers,�
Aged�25–34�and�35–59�in�Different�African�Countries�(in�%)�..................................�195�Table�8.9:�Position�of�TEVET�Completers�at�First�Employment�and�Time�of�Study�
(in�%)�................................................................................................................................�198�Table�8.10:�Private�and�Social�Rates�of�Return�to�Education�...........................................�200�Table�8.11:�ROR�in�Malawi�Compared�to�Selected�Other�African�Countries�................�200�Table�8.12:�Percentage�of�Firms�that�Report�Labor�Regulations�and�Skill�Levels�
of�Workers�as�a�Major�or�Severe�Constraint�in�Malawi�............................................�202�Table�1A.1:�5�16�Year�Old�Population�as�%�of�Total,�SADC�Countries�(2008)�..............�208�Table�1A.2:�Population�Living�Below�Poverty�Lines�and�Gini�Index�(2005�or�
Closest�Year)�(in�%)�........................................................................................................�208�Table�1A.3:�Orphans�(0–17�Years)�Due�to�AIDS,�SADC�Countries�(2007)�.....................�209�Table�1A.4:�African�Context�Indexes�..................................................................................�209�Table�1A.5:�Other�Social�Development�Indicators�............................................................�210�Table�2A.1:�Outreach�Population�by�Literacy�Programs�..................................................�214�Table�2A.2:�Expected�School�Age�Population�for�2006�and�2007,�NSO�Projections�.....�217�Table�2A.3:�Differences�of�Estimates�(2006)�.......................................................................�222�Table�2A.4:�Comparison�of�Some�Schooling�Indicators�According�to�the�Sources�
of�Data�Used�for�the�Population�Estimates�(2006)�.....................................................�223�Table�2A.5:�Evolution�of�Gross�Intake�Rate�(Access�Rate�to�Standard�1)�since�
2000�..................................................................................................................................�225�Table�2A.6:�Model�for�Access�Rate�to�Standard�1�Using�Household�Survey�Data�.......�228�Table�2A.7:�Main�Reason�Declared�for�Having�Never�Attended�School�(in�%)�............�229�Table�2A.8:�Results�of�Econometric�Model�Explaining�Retention�Rate�at�the�
School�Level�....................................................................................................................�231�Table�2A.9:�ASR�and�School�Life�Expectancy�Calculation�for�Malawi�(2007)�...............�232�
x Contents
Table�2A.10:�School�Life�Expectancy,�Recurrent�Expenditure�for�Education�as�a�Share�of�GDP�and�Index,�Low�Income�African�Countries�(2007�or�closest�Year)�.................................................................................................................................�233�
Table�3A.1:�Methodology�of�Recalibration�to�a�6–7�Year�Duration�Structure�...............�239�Table�3A.2:�Recalibration�of�Malawian�2008�Recurrent�Expenditure�Data�...................�239�Table�3A.3:�Breakdown�of�Public�Recurrent�Expenditure�in�Higher�Education,�
African�Countries�(2007�or�last�year�available)�..........................................................�240�Table�3A.4:�Primary�Education�Salaries�.............................................................................�241�Table�3A.5:�Secondary�Education�Salaries�.........................................................................�241�Table�4A.1:�Degree�of�Randomness�(1�–�R2)�in�Public�Teacher�Allocations�in�
Various�African�Countries�(2002–2007)�......................................................................�243�Table�4A.2:�Reading�and�Mathematics�Skill�Levels�..........................................................�247�Table�4A.3:�Correlates�of�PSLE�Results�at�National�Level�(2006)—Basic�Statistics�......�248�Table�4A.4:�Correlates�of�MSCE�Results�at�National�Level�(2006)—Basic�
Statistics�...........................................................................................................................�249�Table�4A.5:�Some�Characteristics�of�CSSs�and�CDSSs�......................................................�250�Table�4A.6:�Consistency�of�Teacher�Allocation�across�Government�Funded�
Primary�Schools�at�District�Level�(2007)�.....................................................................�251�Table�4A.7:�Consistency�in�Book�Allocation�across�Government�Funded�
Primary�Schools,�by�Divisions:�R2�Analysis�...............................................................�252�Table�5A.1:�Repetition�Rate�Trends�by�Standard�in�Primary,�1999�and�2006��(All�
Types�of�Schools)�...........................................................................................................�256�Table�5A.2:�Repetition�Rates�by�Form�in�Secondary,�2007�(All�Types�of�Schools)�.......�256�Table�5A.3�Dropout�Rates�in�Primary�By�Gender,�1999�and�2006�(All�Types�of�
Schools)�...........................................................................................................................�256�Table�5A.4�Dropout�Rates�in�Secondary�by�Gender,�2006�(All�Types�of�Schools)�........�256�Table�5A.5:�GER�and�PCR�for�the�28�Administrative�Districts�(2007)�............................�258�Table�5A.6:�Leaving�School�Examination�Results�at�the�Primary�Level�by�School�
Types,�Location,�Division�and�Gender�(2006)�............................................................�259�Table�5A.7:�JCE�and�MSCE�Examination�Pass�Rates�by�School�Types,�Location,�
Division,�and�Gender�(2006)�.........................................................................................�259�Table�5A.8:�Access�Rates�to�Standard�8�and�GER,�According�to�Education�
Division�and�Gender�.....................................................................................................�260�Table�5A.9:�Access�Rates�to�Different�Forms�and�GER�on�Secondary�Education,�
According�to�Region,�Education�Division,�and�Gender�...........................................�261�Table�5A.10:�Probability�of�Enrollment�in�Standards�1–8�of�Primary�School,�by�
District�.............................................................................................................................�262�Table�5A.11:�Probability�of�Enrollment�in�Forms�1–4�of�Secondary�School,�by�
District�.............................................................................................................................�263�Table�6A.1:�Number�of�Regular�and�Parallel�Students�in�Technical�Colleges�
(2007)�...............................................................................................................................�265�Table�6A.2:�Records�of�the�TEVET�Provider�Directory�1999�...........................................�265�Table�6A.3:�Enrollment�in�Regular�Apprenticeship�Programs�(2003–2007)�..................�265�Table�6A.4:�Female�Participation�in�TEVETA�Sponsored�Courses�by�
Applications,�Short�Listing,�and�Enrollment�from�2001�to�2008�..............................�266�
Contents xi
Table�6A.5:�Girls’�Participation�in�Malawi�Craft�and�Malawi�Advanced�Craft�Examinations�(in�%)�.......................................................................................................�266�
Table�6A.6:�Expenditure�in�Public�Technical�Colleges�2007/08�(Revised�Budgeted)�by�Subprograms�(in�%)�..............................................................................�266�
Table�6A.7:�Budget�Execution�Rates�for�Technical�Colleges�(2005/06)�...........................�267�Table�6A.8:�TEVETA�Expenditure�2002/03–2006/7,�in�’000�MK�......................................�267�Table�6A.9:�Examination�Fees�for�Malawian�Qualification�.............................................�268�Table�6A.10:�Calculation�of�Private�Cost�(Tuition�Fees,�Boarding,�Testing�Fees)�
for�Formal�TEVET�in�Technical�Colleges�(Prices�as�of�2008)�....................................�268�Table�6A.11:�Synopsis�of�Programs�Offered�and�Qualifications�Achieved�in�the�
Malawian�TEVET�Environment�...................................................................................�269�Table�6A.12:�STR�in�Technical�Colleges�(2007)�..................................................................�269�Table�6A.13:�Trade�Test�Participation�by�Grade�................................................................�270�Table�6A.14:�Trade�Testing�Candidates�by�Trade�and�Gender�(2003–2008)�..................�270�Table�6A.15:�Trade�Testing�Pass�Rate�by�Type�of�Institution�..........................................�271�Table�7A.1:�Categories�of�Expenditure�as�Percentage�of�Total�Expenditure:�
UNIMA�...........................................................................................................................�274�Table�7A.2:�Categories�of�Expenditure�as�Percentage�of�Total�Expenditure:�
MZUNI�............................................................................................................................�274�Table�7A.3:�Categories�of�Expenditure�as�Percentage�of�Total�Expenditure:�
Livingstonia�....................................................................................................................�275�Table�7A.4:�Categories�of�Expenditure�as�Percentage�of�Total�Expenditure:�
Catholic�...........................................................................................................................�275�Table�7A.5:�Enrollments�in�Higher�Education�by�Gender�...............................................�277�Table�7A.6:�Sources�of�Income�for�UNIMA�.......................................................................�278�Table�7A.7:�Percentages�of�Sources�of�Income�for�UNIMA�.............................................�279�Table�7A.8:�Sources�of�Income�for�MZUNI�........................................................................�279�Table�7A.9:�Percentages�of�Sources�of�Income�for�MZUNI�..............................................�279�Table�7A.10:�UNIMA�Actual�Expenditure:�2003/04�to�2006/07�.......................................�280�Table�7A.11:�MZUNI�Actual�Expenditure:�2003/04�to�2006/07�........................................�280�Table�7A.12:�Unit�Cost�by�Institution�.................................................................................�280�Table�7A.13:�Percentage�of�Females�in�Postgraduate�Studies�.........................................�282�Table�8A.1:�Mincerian�Earning�Function�of�Malawi�(2004)�.............................................�288�Table�8A.2:�Job�Sector�of�Employed�People�According�to�Their�Education�Level,��
15+�Years�Old�..................................................................................................................�289�Table�8A.3:�Means�of�Variables�Other�Than�the�Highest�Grade�Completed�.................�289�Table�8A.4:�Logarithm�of�Annual�Income�According�to�Education�Level�....................�290�Table�8A.5:�Expected�Income�According�to�Education�Level,�15+�Years�Old�...............�290�Table�8A.6:�Schooling�Duration,�Unit�Cost,�and�Rates�of�the�Different�Education�
Levels�...............................................................................................................................�291�Table�8A.7:�Mean�Income�by�Education�Level�as�Units�of�GDP�per�Capita�in�
Selected�African�Countries�...........................................................................................�293�Table�8A.8:�Expected�Annual�Income�by�Job�Sector�Taking�into�Account�
Unemployment�Risk�(MK)�...........................................................................................�293�Sampling�Frame�.....................................................................................................................�303�Table�A9.1:�Rating�of�Study�Condition�and�Provision�.....................................................�304�
xii Contents
Table�A9.2:�General�Satisfaction�with�Studies�...................................................................�305�Table�A9.3:�Rating�Usefulness�of�Studies�...........................................................................�305�Table�A9.4:�Occupational�Situation�after�Graduation�and�Present�(in�%)�.....................�308�Table�A9.5:�Extent�of�Use�of�Qualification�.........................................................................�310�Table�A9.6:�Degree�of�Abilities�and�Knowledge�of�the�Graduates�.................................�311�Table�A9.7:�Extent�of�Appropriateness�of�Professional�Situation�...................................�312�Sampling�Frame�.....................................................................................................................�320�Table�A9.8:�Type�and�Grade�of�Qualification�....................................................................�321�Table�A9.9:�Duration�of�Training�Courses�.........................................................................�321�Table�A9.10:�Changes�as�Result�of�Program/Course�........................................................�323�Table�A9.11:�Weaknesses�of�Program/Course�...................................................................�323�Table�A9.12:�Current�Employment�Status�..........................................................................�324�Table�A9.13:�Duration�of�Employment�Seeking�................................................................�324�Table�A9.13:�Level�of�Position�..............................................................................................�325�Table�A9.14:�Number�of�Employees�...................................................................................�325�Table�A9.15:�Relative�Risk�of�Unemployment�for�High�Risk�Groups�............................�325�Table�A9.16:�Mean�Income�by�Positional�Level�.................................................................�327�Table�A9.17:�Mean�Income�by�Occupational�Status�..........................................................�327�Table�A9.18:�Mean�Income�by�Way�of�Getting�Skills........................................................�327�Table�A9.19:�Mean�Income�by�Field�of�Occupation�..........................................................�328�Table�A9.20:�Mean�Income�by�Type�and�Level�of�Certificates�........................................�329�Table�A9.21:�Degree�of�Abilities�and�Knowledge�of�TEVET�Completers�by�Type�
and�Level�.........................................................................................................................�330��
Figures�
Figure�1:�Educational�Pyramids�for�Malawi�and�Sub�Saharan�Africa�...........................�xxx�Figure�2:�Access�Rate�to�Each�Grade�(2007)�......................................................................�xxxi�Figure�3:�SACMEQ�Scores�in�English�and�Mathematics�(SACMEQ�II)�.......................�xxxii�Figure�4:�Teacher�Allocation�in�Government�Funded�Schools�(2007)�.........................�xxxiii�Map�1a:�STR�at�the�District�Level�.....................................................................................�xxxiv�Map�1b.�SqTR�at�the�District�Level�...................................................................................�xxxiv�Figure�5:�Access�Rates�to�the�Different�Grades�According�to�Wealth�Index�...............�xxxv�Figure�6:�Share�of�Public�Education�Expenditure�for�the�10�Percent��Most�
Educated,�Africa�Region�............................................................................................�xxxvi�Map�2a:�Primary�Completion�Rates�by�District�.............................................................�xxxvii�Map�2b:�Secondary�Completion�Rates�by�District�........................................................�xxxvii�Figure�7:�Evolution�of�the�Distribution�of�Recurrent�Expenditure�by�Level�of�
Schooling�...................................................................................................................�xxxviii�Figure�8:�Contribution�of�Public�Financing�by�Level�of�Education�(2007)�........................�xl�Figure�9:�Flows�of�Funds�to�TEVET�.....................................................................................�xlii�Figure�10:�Number�of�Higher�Education�Students�per�100,000�Inhabitants�in�
Sub�Saharan�Africa�........................................................................................................�xliv�Figure�11:�Higher�Education�Public�Recurrent�Unit�Costs�(2007�or�last�year�
available)�.........................................................................................................................�xlvi�Figure�12:�Job�Insertion�Rate�(Modern�Sector�Only)�of�Higher�Education�Leavers�..�xlviii�

Contents xiii
Figure�13:�Mean�Income�by�Education�Level�in�Relation�to�GDP�Per�Capita�....................�l�Figure�14:�Unmet�Labor�Demand�as�a�Percentage�of�Employed�in�Selected�
TEVET�Occupations...........................................................................................................�li�Figure�1.1:�Trends�and�Projections�of�School�Age�Populations�(1998–2018)�.....................�3�Figure�1.2:�Evolution�in�Real�GDP�Per�Capita�(1987–2008)..................................................�7�Figure�2.1:�Cross�Sectional�Schooling�Profile�with�Revised�Repetition�Structure�
from�IHS�2�........................................................................................................................�20�Figure�2.2:�International�Comparison�for�Gross�Intake�Rate�and�Primary�
Completion�Rate�(Access�Rate�to�Grade�6�to�Be�Comparable�Across�Countries)�.........................................................................................................................�21�
Figure�2.3:�Percentage�of�People�Who�Have�Ever�Attended�Primary�School�(by�Age)�.............................................................................................................................�22�
Figure�2.4:�Probalistic�Schooling�Profile�...............................................................................�22�Figure�2.5:�Evolution�of�Survival�Profile�in�Primary�and�Secondary�Education,��
2003–2007�..........................................................................................................................�24�Figure�2.6:�Educational�Pyramid�for�Malawi�(2007)�...........................................................�25�Figure�2.7:�Educational�Pyramid�for�Sub�Saharan�Africa�(2005/06)�.................................�25�Figure�3.1:�Domestic�Resources�as�a�Percentage�of�GDP�and�Budget�Allocation�
Towards�Education,�SSA�Countries�..............................................................................�36�Figure�3.2:�Evolution�of�the�Distribution�of�Recurrent�Expenditure�by�Level�of�
Schooling�...........................................................................................................................�39�Figure�3.3:�Distribution�of�Recurrent�Expenditure�by�Level�of�Schooling,�SADC�
Countries,�(2008�or�Last�Available�Year)�......................................................................�41�Figure�3.4:�Higher�Education�Public�Recurrent�Unit�Costs,�Sub�Saharan�
Countries�(2007�or�last�year�available)�..........................................................................�44�Figure�3.5:�Contribution�of�Public�Financing�by�Level�of�Education�(2007)�....................�48�Figure�4.1:�Repetition�Rate�at�Primary�and�Secondary�Levels�in�SADC�Countries��
(2006�or�Closest�Year)�(in�%)�...........................................................................................�61�Figure�4.2:�Percentage�of�Students�Reaching�Literacy�and�Mathematics�
Competency�Levels�in�Malawi�(SACMEQ�II)�..............................................................�65�Figure�4.3:�Mean�for�the�Reading�and�Mathematics�Test�Scores�of�Learners�in�All�
SACMEQ�Countries�(SACMEQ�II)�................................................................................�66�Figure�4.4:�STR�at�the�Primary�Level,�SADC�Countries�(2006�or�Closest�Year)�..............�81�Figure�4.5:�Teacher�Allocation�in�Government�Funded�Schools�(2007)�...........................�83�Figure�4.6:�STRs�by�Location�(1999�and�2007)�......................................................................�84�Figure�4.7:�STR�in�Government�Funded�Primary�Schools,�by�Division�(2000�and�
2007)�...................................................................................................................................�84�Map�4.1a:�STR�at�the�District�Level�.......................................................................................�86�Map�4.1b:�SqTR�at�the�District�Level�.....................................................................................�86�Figure�4.8:�Relationship�between�the�Wage�Unit�Cost�and�the�Number�of�
Students�(School�Level)�at�the�Primary�Level�..............................................................�95�Figure�4.9:�Relationship�between�the�Unit�Cost�(for�Teachers�and�All�School�
Staff)�and�the�Number�of�Students�at�the�Secondary�Level�.......................................�96�Figure�4.10:�Relation�between�PSLE�Results�and�Spending�on�Cost�per�Student�
at�the�Primary�Level�(Government�Funded�Schools)�.................................................�97�Figure�5.1:�Access�to�and�Completion�of�the�Different�Levels�by�Gender�.....................�104�

xiv Contents
Figure�5.2:�Access�to�and�Completion�of�the�Different�Levels�by�Wealth�Quintile�......�107�Figure�5.3:�Access�Probability�to�the�Different�Grades�According�to�Living�Area�.......�108�Figure�5.4:�PCR�Urban�/PCR�Rural�in�Some�African�Countries�......................................�108�Figure�5.5:�Regional�Disparities�...........................................................................................�109�Map�5.1a:�Access�Rate�to�S1��by�District�.............................................................................�111�Map�5.1b:�Primary�Completion�Rate��by�District�..............................................................�111�Maps�5.2a:�Access�Rate�to�Form�1��by�District�...................................................................�112�Map�5.2b:�Secondary�Completion�Rate��by�District�..........................................................�112�Figure�5.6:�Education�Lorenz�Curve�...................................................................................�115�Figure�5.7:�Share�of�Public�Resources�for�the�10�percent�Most�Educated,��African�
Countries�.........................................................................................................................�116�Figure�6.1:�Number�of�Formal�Apprentices�Recruited�.....................................................�122�Figure�6.2:�TEVET�Students�per�100,000�Inhabitants�in�Selected�SADC�Countries�......�123�Figure�6.3:�Female�Participation�in�Malawi�(Advanced)�Craft�Examinations�(2003–
2007)�.................................................................................................................................�125�Figure�6.4:�Malawi�Craft�Pass�Rates�by�Gender�and�Year�...............................................�125�Figure�6.5:�Poverty�and�TEVET�Admission�by�District�(2005�Compared�to�2008)�.......�127�Figure�6.6:�Pass�Rates�for�MC�and�MAC�Examinations�by�Trades�(2003–2007)�...........�136�Figure�6.7:�STRs�in�TCs�for�Regular�Programs�and�Total�Enrollment�(2007)�................�139�Figure�7.1:�Enrollments�in�Higher�Education�in�Malawi�(2003–2008)�............................�150�Figure�7.2:�Percentage�of�Non�Residential�Students�(2003–2008)�...................................�151�Figure�7.3:�Postgraduate�Students�in�the�Total�Enrollment�(%�of)�..................................�155�Figure�7.4:�Sources�of�Income�for�UNIMA�Colleges�and�Central�Office�(2004/05–
2007/08)�............................................................................................................................�159�Figure�7.5:�Sources�of�Income�for�MZUNI:�2002/03–2004/05�...........................................�159�Figure�7.6:�Unit�Cost�(in�relation�to�GDP�Per�Capita�........................................................�165�Figure�7.7:�Trends�in�Graduate�Output�by�Institution�by�Year�.......................................�173�Figure�7.8:�Trends�in�Graduate�Output�by�Field�of�Study�...............................................�173�Figure�7.9:�Masters�Graduates�by�Gender�and�by�Institution�(2003–2008)�....................�174�Figure�8.1:�Relations�between�Education,�Income,�and�Behavior�...................................�183�Figure�8.2:�Mean�Income�by�Level�of�Education�in�Relation�to�GDP�per�Capita�
(in�%)�................................................................................................................................�189�Figure�8.3:�Occupational�Situation�of�HE�graduates�by�Field�of�Study�.........................�190�Figure�8.4:�Employment�Rate�(Modern�Sector�Only)�of�Higher�Education�
Leavers�in�Different�Age�Groups�in�Different�African�Countries�...........................�191�Figure�8.5:�Mean�Monthly�Income�of�HE�Graduates�by�Field�of�Study,�Degree,�
and�Work�Situation�........................................................................................................�192�Figure�8.6:�Duration�of�Job�Search�of�TEVET�Completers:�Findings�from�Two�
Tracer�Studies�(2008)�(in�%)�..........................................................................................�196�Figure�8.7:�Net�Income�per�Month�of�TEVET�Graduates�(MK)�.......................................�196�Figure�8.8:�Level�of�Position�of�TEVET�Graduates�in�Employment�(in�%)�....................�197�Figure�8.9:�Mean�Monthly�Net�Income�of�TEVET�Completers�.......................................�199�Figure�8.10:�Distribution�of�Employed�by�Economic�Sector�............................................�202�Figure�8.11:�Unmet�Labor�Demand�as�a�Percentage�of�Employed�in�Selected�
TEVET�Occupations�(in�%)�...........................................................................................�204�Map�1A.1:�Population�Density�by�District�(2008)�..............................................................�207�

Contents xv
Figure�2A.1:�Structure�of�the�Education�System�in�Malawi�.............................................�212�Figure�2A.2:�Enrollment�Trends�in�Primary�Education�(in�Thousands)�........................�213�Figure�2A.3:�Enrollment�Trends�in�Secondary�Education�Since�2000,�by�Provider��
(in�Thousands)�................................................................................................................�213�Figure�2A.4:�Projections�of�the�Malawian�Population,�Based�on�the�1998�
National�Census�(1999–2023)�........................................................................................�215�Figure�2A.5:�Projections�of�Single�Age�Population�...........................................................�216�Figure�2A.6:�Population�Projections�for�the�Rural�Blantyre�District�...............................�218�Figure�2A.7:�Single�Age�Population�for�Malawi�in�2006�According�to�MICS�Data�......�218�Figure�2A.8:�Projections�of�Malawian�Population,�Compared�to�the�UN�and�
NSO�..................................................................................................................................�220�Figure�2A.9:�Malawian�Population�per�Age�for�1998,�Comparison�between�NSO�
and�UN�............................................................................................................................�220�Figure�2A.10:�Malawian�Population�Projections�per�Single�Ages,�According�to�
the�UN�.............................................................................................................................�221�Figure�2A.11:�Difference�between�the�Two�Estimates�(2007)�..........................................�222�Figure�2A.12:�Cross�Sectional�Schooling�Profile,�School�Year�2006�and�2007�...............�224�Figure�2A.13:�Educational�Pyramid�....................................................................................�227�Figure�2A.14:�International�Comparison�on�School�Life�Expectancy��(2007�or�
Closest�Year)�...................................................................................................................�232�Figure�2A.15:�School�Life�Expectancy�and�Current�Expenditure�for�Education�as�
a�Share�of�GDP�for�Some�Low�Income�African�Countries�(2007�or�Closest�Year)�.................................................................................................................................�234�
Figure�3A.1:�Teachers’�Average�Salary�(Primary�and�Secondary)�as�Units�of�GDP�Per�Capita�for�Countries�with�GDP�Per�Capita�Lower�than�US$500�(2007�or�last�year�available)�..........................................................................................�235�
Figure�3A.2:�Public�Recurrent�Expenditure�Excluding�Teachers’�Salaries�As�a�Percentage�of�Total�Recurrent�Expenditure�(Primary�Education)�(2007�or�last�year�available)�.........................................................................................................�235�
Figure�3A.3:�Household�Education�Expenditure�As�a�Percentage�of�GDP�...................�236�Figure�3A.4:�Education�Household�Expenditure�as�a�Percentage�of�Total�
Household�Expenditure�................................................................................................�236�Figure�3A.5:�Evolution�of�Budget�Allocation�to�ECD�and�Adult�Literacy�(in�MK�
Millions)�...........................................................................................................................�238�Figure�4A.1:�Trend�of�Repetition�Rates�by�Cycle�(2000–2006)�.........................................�242�Figure�4A.2:�Student�Flow�Efficiency�Index�in�Various�SADC�Countries,�(2006�or�
Closest�Year)�...................................................................................................................�242�Figure�4A.3:�Internal�Efficiency�Coefficient�(IEC)�in�SADC�Countries�(2006�or�
Closest�Year)�...................................................................................................................�243�Figure�4A.4:�Consistency�of�Allocation�of�ORT�at�the�Primary�Level�According�
to�Enrollment�at�the�District�Level�(2007/08)�..............................................................�244�Figure�4A.5:�Teacher�Allocation�in�All�Secondary�Publicly�Funded�Schools�
(2007)�...............................................................................................................................�244�Figure�4A.6:�Coherence�on�Allocation�of�ORT�Funds�at�the�Secondary�School�
Level�(For�Cost�Center�Schools�and�Grant�Aided�Secondary�Schools)�..................�245�
xvi Contents
Figure�4A.7:�Relation�between�JCE�Results�and�Spending�on�Cost�of�Salaries�per�Student�at�the�Secondary�Level�(Government�Funded�Schools)�.............................�245�
Figure�4A.8:�Relation�between�MSCE�Results�and�Spending�on�Cost�of�Salaries�per�Student�at�the�Secondary�Level�(Government�Funded�Schools)�......................�246�
Figure�5A.1:�Urban�Completion�Rate/Rural�Completion�Rate�for�Lower�Secondary�in�Some�African�Countries�(ca.�2007)�.......................................................�257�
Figure�6A.1:�TEVET�Public�Recurrent�Unit�Cost�as�a�Percentage�of�GDP�per�Capita�in�Selected�African�Countries�..........................................................................�264�
Figure�6A.2:�Trade�Testing�Candidates�by�Training�Background�and�Year�.................�269�Figure�6A.3:�Trade�Test�Candidates�by�Gender�and�Year�(2003–2008)�..........................�270�Figure�6A.4:�Trade�Testing�Pass�Rates�by�Gender�(2003–2008)�.......................................�271�Figure�7A.1:�Comparison�of�Enrollments�per�100,000�Inhabitants�in�SSA�....................�272�Figure�7A.2:�Percent�of�Sources�of�Income�for�UNIMA�Colleges�and�Central�
Office�(2004/05–2007/0)�..................................................................................................�272�Figure�7A.3:�Percent�of�Sources�of�Income�for�UNIMA�Colleges�and�Central�
Office�(2004/05–2007/08)�................................................................................................�273�Figure�7A.4:�Percentage�of�Female�Enrollment�by�Type�of�Institution�..........................�273�Figure�7A.5:�Comparison�of�Average�Annual�Change�in�Enrollments�per�100,000�
Inhabitants�......................................................................................................................�276�Figure�7A.6:�Enrollment�by�Institution:�2003–2008�...........................................................�276�Figure�7A.7:�Postgraduate�Enrollments�by�Field�of�Study�(2003–2008)�.........................�277�Figure�7A.8:�Education�Expenditure�in�Tertiary�as�a�Percentage�of�Total�
Education�Expenditure�.................................................................................................�278�Figure�7A.9:�Student/Lecturer�Ratios�for�Selected�SSA�Countries�(2006)�......................�281�Figure�7A.10:�Percentage�of�Females�Enrolled�in�Fields�of�Study�..................................�281�Figure�8A.1:�Duration�of�Job�Search�after�Leaving�University,�HE�
Grads/Dropouts�.............................................................................................................�283�Figure�8A.2:�Probability�of�Antenatal�Care�According�to�Education�Level�(in�%)�.......�284�Figure�8A.3:�Probability�of�Using�Iron�Tablets�During�Pregnancy,�According�to�
Education�Level�(in�%)�..................................................................................................�284�Figure�8A.4:�Probability�for�Women�to�Be�Assisted�at�Delivery,�According�to�
Education�Level�(in�%)�..................................................................................................�285�Figure�8A.5:�Probability�of�Using�Anti�Malaria�Treatments�for�Children�Under�
the�Age�of�Five�(in�%)�....................................................................................................�285�Figure�8A.6:�Average�Woman’s�Age�at�Her�First�Birth�....................................................�286�Figure�8A.7:�Birth�Interval�(in�Years)�..................................................................................�286�Figure�8A.8:�Knowledge�about�HIV/AIDS�(on�[0–11]�Scale)�...........................................�287�Figure�8A.9:�Probability�for�Women�to�Be�Literate�According�to�Education�Level�
(in�%)�................................................................................................................................�287�Figure�A9.1:�Predominant�Job�Situation�since�Graduation�by�Year�of�Completing�.....�306�Figure�A9.2:�General�Satisfaction�with�Professional�Situation�(in�%)�.............................�307�Figure�A9.3:�Gross�Income�per�Month�in�Malawi�Kwacha�..............................................�308�Figure�A9.4:�Average�Income�in�the�First�and�the�Actual�Occupation�by�Cohort�........�309�Figure�A9.5:�Differences�between�Graduates�from�Different�Institutions�.....................�312�Figure�A9.6:�Reasons�for�Dropping�Out�(in�%)�.................................................................�314�Figure�A9.7:�Rating�of�Professional�Opportunities�in�the�Next�Years�(in�%)�................�315�

Contents xvii
Figure�A9.8:�Rating�of�Usefulness�of�Training�(in�%)�.......................................................�322�Figure�A9.9:�Net�Income�per�Month�in�Malawi�Kwacha�(in�%)�......................................�326�Figure�A9.10:�Differences�between�Completers�from�Different�Institutions�(in�%)�.....�331�
Boxes�
Box�3.1:�Why�Use�the�Reference�to�GDP�Per�Capita?�.........................................................�42�Box�4.1:�The�Impact�of�Repetition�on�Schooling�Efficiency�................................................�57�Box�6.1:�More�about�the�TEVET�Levy�Fund�.......................................................................�132�Box�6.2:�The�Malawian�TEVET�Landscape—A�Jungle�of�Qualifications�and�
Programs�.........................................................................................................................�137�Box�2A.1:�Data�Used�by�the�UN�Population�Unit�to�Estimate�and�Project�the�
Population�for�Malawi�..................................................................................................�219�Box�6A.1:�Financial�Management�Issues�in�Technical�Colleges�......................................�264������

xviii
Foreword�from�the�Minister�of�Education,�Government�of�Malawi�
he�Country�Status�Report�is�an�important�tool�in�diagnosing�the�problems�that�the�education�sector�is�facing�in�the�county.�It�intends�to�provide�an�accurate�snapshot�
of�the�current�status�of�the�education�in�Malawi�and�thus�offer�policy�makers�and�their�development�partners�a�solid�basis�for�policy�dialogue�and�decision�making.��
This�study�on�the�education�sector�in�Malawi�adds�to�the�growing�list�of�country�status�reports�that�the�World�Bank�has�been�sponsoring�in�the�Africa�region.�As�with�similar� reports,� its�preparation� involved� the� collaboration�of� a�national� team�and� the�donor� community.�The� team� included�members� of� government� education�ministries;�staff�from�the�World�Bank;�and�staff�from�development�partners,�particularly�the�Pôle�de� Dakar� team� from� UNESCO� BREDA� (the� UNESCO� regional� office� in� Dakar,�Senegal).�
This�Country�Status�Report�not�only�updates�the�original�report�completed�in�2004,�but� also� includes� deeper� analysis� of� areas� such� as� early� childhood� development;�literacy;�external�efficiency;�and,�particularly,�technical,�entrepreneurial,�and�vocational�education� and� training� (TEVET)� and� higher� education.� This� report� comes� at� a� time�when�the�government� is� finalizing�the�National�Education�Sector�Plan�and�preparing�for�a�funding�request�to�the�Education�for�All�Fast�Track�Initiative�catalytic�fund.�The�findings� of� this� report� are� therefore� very� useful� for� providing� analytical� inputs� for�future�reforms.��
This� report� has� a� number� of� important� features,� two� of� which� deserve� special�mention.�First,�it�was�prepared�through�a�combined�effort�by�a�dedicated�government�team� and� its� counterparts� in� the� donor� community.� The� report� is� therefore� not� an�external�evaluation�of�the�system�but�a�collaborative�attempt�to�deepen�understanding�of�the�sector�and�the�challenges�it�faces�and�to�create�a�common�ground�of�joint�action.�In�this�sense,�the�report�is�a�tangible�arrangement�for�implanting�the�aspirations�of�the�Paris�declarations�on�aid�effectiveness.�In�addition,�this�collaboration�also�built�capacity�for�sector�analysis�within�Malawi’s�Ministry�of�Education,�Science�and�Technology�and�other� involved�ministries.�Second,� the� report’s�methodology�and� information�sources�go�beyond�the�ordinary.�The�team�has�taken�advantage�of�existing�data�sources,�mostly�from�ministry�administrative� sources,� as�well� as�household� surveys� to�develop�more�in�depth�indicators�than�the�basic�indicators�of�enrollment�that�typify�education�system�monitoring.�For�example,�a�trace�study�of�TEVET�and�higher�education�graduation�was�prepared�to�rigorously�examine�skills�needs�and�the�links�between�education�and�the�labor�market.��
T

Foreword xix
�
The� report� highlights� some� recent� achievements� and� challenges� in� the� education�sector.� More� broadly,� it� offers� a� valuable� and� comprehensive� resource� for� anyone�interested�in�education�in�Malawi.�It�is�the�hope�of�the�ministry�that�this�document�will�be�of�use�to�all�stakeholders�in�the�education�sector.�
�Dr.�George�T.�Chaponda�MP�
Minister�of�Education,�Science�and�Technology�
���

xx
Foreword�from��the�World�Bank�
his� study�on� the�education� sector� in�Malawi�adds� to� the�growing� list�of�Country�Status�Reports� (CSRs),�which� the�World� Bank�has� been� sponsoring� in� the�Africa�
Region.�As�with�other�similar�reports,�it�involved�the�collaboration�of�a�national�team�consisting� of� members� from� the� government� ministries—including� the� ministries� in�charge� of� education—and� staff� from� the� World� Bank� and� development� partners,�particularly� the� Pôle� de� Dakar� team� from� the� UNESCO� regional� office� in� Dakar,�Senegal�(UNESCO�BREDA).�The�report�is�intended�to�provide�an�accurate�snapshot�of�the� current� status� of� education� in�Malawi,� and� thus� to�offer�policy�makers� and� their�development�partners�a�solid�basis�for�policy�dialogue�and�decision�making.�
In� recent�years,� the�development� context� for� education�has�evolved� in�ways� that�increase� the� relevance� and� demand� for� this� type� of� analytic�work.�Governments� are�striving� toward� poverty� reduction� and� the�Millennium�Development�Goals,� and� the�international� development� community� has� pledged� to� complement� their� efforts� by�providing�financial�assistance�to�implement�credible�plans�for�sector�development.�The�launch� of� the� Education� for� All�Fast� Track� Initiative� (EFA�FTI)� in� 2002� has� put� the�necessary�aid�architecture�in�place�and�as�of�September�2009,�21�African�countries�have�already� received� grants� (a� total� of� $1,233�million)� to� implement� sector� development�plans�that�have�been�endorsed�by�the�EFA�FTI�partners.�
This�is�the�second�CSR�for�Malawi.�It�not�only�updates�the�original�CSR�completed�in� 2004,� but� also� includes� a� more� in�depth� analysis� of� some� areas,� such� as� early�childhood� development,� literacy,� external� efficiency,� and� particularly� technical,�entrepreneurial,�and�vocational�education�and�training�(TEVET)�and�higher�education.�The�report�comes�at�a� time�when�the�government� is� finalizing�the�national�education�sector� plan.� The� findings� of� this� report� are� therefore� very� useful� for� providing�analytical�inputs�in�this�process.�
This�report�has�a�number�of�noteworthy�features—two�of�which�are�worth�special�mention� here.� First,� it� was� prepared� through� a� combined� effort� by� a� dedicated�government�team�and�its�counterparts�in�the�donor�community.�The�report�is�therefore�not� an� external� evaluation� of� the� system,� but� a� collaborative� attempt� to� deepen�understanding�of�the�sector�and�the�challenges�it�faces�and�to�create�common�ground�for�joint�action.�In�this�sense,�the�report�is�a�tangible�arrangement�for�implementing�the�aspirations�of�the�Paris�Declaration�on�Aid�Effectiveness.�In�addition,�this�collaboration�also� had� the� benefit� of� building� capacity� for� sector� analysis� within� the� Malawian�Ministry�of�Education�and�other�involved�ministries.�Second,�the�report’s�methodology�and� information� sources� go� beyond� the� ordinary.� The� team� has� taken� advantage� of�existing� data� sources,� mostly� from� ministry� administrative� sources� as� well� as�household� surveys,� to� develop�more� in�depth� indicators� than� the� basic� indicators� of�enrollment� that� typify� monitoring� education� systems.� For� this� report,� a� TEVET� and�higher�education�graduates�tracer�study�was�also�prepared�to�provide�a�more�in�depth�
T

Foreword xxi
�
examination�of�the�issue�of�skill�needs�and�the�links�between�education�and�the�labor�market.�
This�CSR�highlights�some�recent�achievements,�among�them�the�following:��� Between�2004�and�2007,�enrollments�increased�considerably�in�early�childhood�
development�programs�(+44�percent�per�year),�in�adult�literacy�programs�(+19�percent),� in� secondary� education� (+� 5� percent),� and� in� higher� education� (+4�percent).�
� Education� in� Malawi� has� an� important� impact� on� social� development.�Education�in�general,�particularly�for�girls,�has�a�strong�impact�on�behavior�in�terms� of� reproductive� health,� maternal� and� child� health,� and� knowledge� of�HIV/AIDS.�The�primary�cycle� contributes� to�almost�half�of� the� total�effect�of�education�on�social�development.�
� External� efficiency� in� relation� to� employability� and� income� is� high,� in�particular�for�TEVET�and�higher�education�graduates.�The� job�insertion�rates�of�higher�education�graduates�are�among�the�highest� in�Africa�and�the�wage�premium� for� higher� education� is� extremely� high� in� relation� to� comparable�countries.�TEVET�completers�also�show�a�high�acceptance�in�the�labor�market�when�recording�the�job�insertion�rates�of�all�African�countries.�
�The� CSR� also� points� to� the� key� challenges� in� the� coming� years� for� educational�
development�in�Malawi,�among�them:���� Increasing� the�amount�of�public� resources� to�primary�education.�The�share�
of� recurrent� education� expenditure� allocated� to� primary� education� (when�calibrated� to� a� six�year� duration� for� comparative� purposes)� is� only� 32�percent—far� from� the� African� average� of� 44� percent.� This� lack� of� budget�priority� leads� to� a� student�teacher� ratio� (STR)� of� 80:1� for�primary� education,�twice� the�Southern�African�Development�Community’s� average�value,�while�the� higher� education� student�teacher� ratio� of� 11:1� is� better� than� the�Organisation�for�Economic�Co�operation�and�Development’s�average�of�16:1.�
� Reducing� the� high� dropout� rates� in� primary� education.� Currently� only� 35�children� out� of� every� 100� complete� primary� school.� Promising� reforms� for�reducing� dropout� rates� include:� (i)� building� new� classrooms� to� complete�incomplete�schools�(13�percent�of�pupils�attend�a�school�that�does�not�provide�a� continuous� educational� supply� up� to� Standard� 8);� (ii)� decreasing� the�repetition� rate�with� both� pedagogical� and� administrative�measures;� and� (iii)�reducing� the� number� of� overloaded� classes� by� improving� consistency� in� the�deployment�of�teachers�in�schools.�
� Raising� the� level� of� student� achievement.� Evaluations� show� that�Malawian�children�perform�far�below�expectations.�Malawi�has�the�weakest�performance�in�English� reading�and� the� second�weakest� in�mathematics� among� countries�whose�pupils�have�been�tested�using�the�same�Southern�African�Consortium�for�Monitoring�Educational�Quality�standardized� tests.�A�possible�option� for�raising� learning� achievement�may�be� to� improve� the�management� of� official�instructional� time.� An� estimated� 20� percent� of� teaching� time� is� lost� due� to�
xxii Foreword
�
teacher� absenteeism� and� 16� percent� of� schools� use� overlapping� shifts.�Moreover,�pupil�absenteeism,�holidays,�and�other�events�that�cause�schools�to�close�also�contribute�to�a�decrease�in�teaching�time.�
� Reducing� the� repetition� rate.� In� primary� education,� repetition� rates� have�increased�to�20�percent�from�1999–2006;�this�level�is�the�highest�in�the�region.�Evidence,� at� the� national� and� international� level,� shows� that� high� repetition�rates�do�not�favor�a�better�mastery�of�school�subjects,�have�adverse�effects�on�STR,� and� increase� dropouts� and� costs.� An� estimated�MK1.97� billion� is� used�annually� to� deliver� primary� education� services� to� repeaters.� A� promising�option� is� to� reorganize� the� primary� cycle� into� subcycles,� within� which�repetition�would� not� be� allowed,� in� addition� to� implementing�measures� on�quality�improvement.�
� Improving�consistency�in�the�deployment�of�teaching�staff�to�schools.�Large�disparities� exist� among� education� divisions� and� schools� in� Malawi.� While�some� schools� have� only� two� teachers� for� 200� pupils,� others� have� twelve�teachers� for� the� same� number� of� pupils.� The� Shire� Highlands� and� South�Eastern� divisions� have� the� lowest� allocated� number� of� government�funded�teachers�compared�to�the�number�of�students.�
� Improving� the� coordination� and� flexibility� of� TEVET.� Three� parallel�qualification� systems� currently� co�exist—trade� testing,� Malawi� (Advanced)�Craft,� and� the� TEVET�Authority/Competency�Based�Education� and�Training�(TEVETA/CBET)—which� all�maintain� their� own�assessment� and� certification�structures.�This� is�unnecessarily� costly� for� students�and� the�government�and�hampers�quality� improvements�at� the� school� level.�TEVETA,� the�Ministry�of�Education,�Science,�and�Technology,�and�the�Ministry�of�Labour�need�to�agree�on� an� approach� to� integrate� all� formal� TEVET� and� the� trade� testing� system�under�the�TEVETA/CBET�system�so�that�it�becomes�the�one�and�only�national�benchmark�of�recognized�TEVET�provision�in�Malawi.�
� Increasing� cost�sharing� in� higher� education.� Higher� education� is� highly�subsidized� by�public� resources� and� is� delivered� at� an� extremely�high�public�unit�cost�when�compared�to�countries�with�similar�incomes.�Higher�education�is� the� level�of�education� to�which�households�contribute� the� least,�while� it� is�also� the� level� with� the� lowest� share� of� students� from� the� poorest� families.�Giving� universities� the� latitude� to� charge� higher� fees� and� improving� the�mechanism� to� recover� student� loans� once� graduates� get� a� job� could� be� a�promising�reform�avenue�to�implement.�
�These� and�other� findings� in� the�CSR�have�already� stimulated�discussions�within�
the�government�and�between�the�government�and�its�development�partners�regarding�the� challenges� for� the� country� in� the� education� sector.� They� have� informed� the�finalization� of� the� education� sector� plan� and� the� preparation� of� the� EFA�FTI�endorsement�process.��
More�broadly,�this�CSR�offers�a�valuable�and�comprehensive�resource�for�anyone�interested� in� education� in� Malawi.� It� is,� however,� a� snapshot� of� the� system� at� a�particular�time.�Thus,�as�the�country�makes�progress� in� implementing�its�sector�plan,�this� report’s� findings� are� likely� to� become�dated.� I� therefore� look� forward� to� a� third�
Foreword xxiii
�
CSR� in� the�years�ahead.�Hopefully,� the�effort�would�be� led�by�a�national� team,�with�minimal�support�from�external�technical�assistance.�This�approach�has�started�to�take�hold�in�other�countries,�highlighting�strong�ownership�for�this�type�of�product�and�has�enhanced�ownership�for�the�product.�I�hope�the�third�CSR�will�reveal�tangible�evidence�of�continued�educational�progress�in�Malawi,�both�in�the�number�of�children�who�gain�access�to�better�quality�schooling�and�in�the�number�of�youth�who�exit�the�system�with�the�skills�and�competencies�to�support�the�country’s�democratic,�social,�and�economic�development.�
��
Yaw�Ansu�Director�
Human�Development�Department�Africa�Region�
The�World�Bank��
���
xxiv
Acknowledgments�
his�country�status�report�was�prepared�in�close�collaboration�with�the�government�of�Malawi,�the�World�Bank,�UNESCO/Pôle�de�Dakar,�and�the�GtZ.��The�government�team�consisted�of�staff�from�the�different�ministries� in�charge�of�
education,� as� well� as� other� relevant� ministries� and� departments:� the� Ministry� of�Education,� Science� and� Technology� (MOEST),� the� Ministry� of� Finance� (MOF),� the�Ministry�of�Labour�(MOL),�the�Ministry�of�Women�and�Child�Welfare�(MOWCW),�the�National� Statistical� Office� (NSO),� the� Technical,� Entrepreneurial,� and� Vocational�Education�and�Training�Authority�(TEVETA),�and�public�and�private�universities.��
The� government� team� was� led� by� Mathews� Makalande,� Deputy� Director� of�Research� and� Planning� (MOEST),� under� the� overall� leadership� of� Bernard� Sande,�Principal�Secretary�I�(MOEST)�and�Moffat�Chitimbe,�Principal�Secretary�II�(MOEST).�It�consisted� of� Lamulo� Nsanja� (Chapter� Head/MOEST),� Stanley� Nkhata� (MOF),� and�Dunstan�Matekenya� (NSO)� for�Chapter�1;�Martin�Masanche� (Chapter�Head/MOEST),�Charles�Mkunga�(MOWCW),�and�B.�V.�Kayala�(MOWCW)�for�Chapter�2;�Grace�Banda�(Chapter�Head/MOEST)�and�Lamulo�Nsanja� (MOEST)� for�Chapter�3;� Job�Mwamlima�(Chapter�Head/MOEST)�and�McNight�Kalanda�(MOEST)�for�Chapter�4;�Grace�Milner�(Chapter� Head/MOEST),� C.P.� Inani� (MOEST),� and� Chikondi� Maleta� (MOEST)� for�Chapter� 5;� Ackim� Phiri� (Chapter� Head,� TEVETA),� Aubrey� Mathemba� (MOEST),�Wesley�Muwalo� (MOL),�Modesto�Gomani� (TEVETA),� and� Brain�Ng’oma� (MOL)� for�Chapters� 6� and� 8;� and� Amlata� Persaud� (Chapter� Head/MOEST)� and� John� Bisika�(University�of�Malawi)�for�Chapter�7.�
The�World�Bank� team�consisted�of�Mathieu�Brossard� (Task�Team�Leader,�Senior�Education�Economist),�Michael�Mambo�(Co�Task�Team�Leader,�then�Consultant),�Jutta�Franz,� Koffi� Segniagbeto,� and� Gerald� Chiunda� (Consultants),� under� the� overall�guidance�of�Christopher�Thomas� (Sector�Manager),� Luis�Benveniste� (Lead�Education�Specialist),�and�Jee�Peng�Tan�(Adviser).�The�UNESCO/Pôle�de�Dakar�team�consisted�of�Nicolas� Reuge� and� Diane� Coury� (Education� Policy� Analysts)� under� the� overall�guidance�of� Jean�Pierre� Jarousse� (Head�of�Pôle�de�Dakar).�The�GtZ�team�consisted�of�Dietmar�Pfeiffer� (Consultant� in�charge�of� the� tracer� survey)�under� the�supervision�of�Wilfried�Goertler�and�Friis�Jorgen.�Borel�Foko�and�Jean�Marc�Bernard�(Pôle�de�Dakar)�also�contributed�to�the�preparation�of�this�report.�The�team�also�gives�thanks�to�Amina�Sharma� and�Kara� Suter� for� their� editing�work.�Administrative� support�was� received�from� Maggie� Mwaisufanana� Mshanga� and� Pauline� Kayuni� (World� Bank� Lilongwe�office)�and�Brigida�Arriaza�de�Figueroa�(World�Bank�Headquarter).��
The�team�received�very�precious�comments�from�the�peer�reviewers�Carlos�Rojas,�Robert�Prouty,�Muna�Meky,�Riham�Shendy,�Kirsten�Maajgard,�and�Michael�Drabble.�
The�Development�Partners�group� (first� led�by�Sandra�Burton,�DFID�and� then�by�Simon�Mphisa,�UNICEF)� provided� valuable� inputs� at� the� concept� note� stage,� strong�support� throughout� the� process,� and� facilitated� the� policy� dialogue� during� the�presentation�of�the�findings�of�the�report.�
T

Acknowledgments xxv
�
The� report�was�mainly� funded�by� the�Education�Program�Development�Fund,� a�trust�fund�of�the�Education�for�All/Fast�Track�Initiative�managed�by�the�World�Bank.�The�Tracer�Study�(Appendix�9�of�the�report)�was�jointly�funded�by�GTZ�and�the�World�Bank.�
���
�
xxvi
Acronyms�and�Abbreviations�
�AIR� Apparent�Intake�Rate�ASR� average�schooling�ratio�CDSS� Community�Day�Secondary�Schools�CIDA� Canadian�International�Development�Agency�CPD� Continued�Professional�Development�CSS� Conventional�Secondary�Schools�DFID� Department�For�International�Development�DTED� Department�of�Teacher�Education�and�Development�ECD� early�childhood�care�and�development�EFA�FTI� Education�for�All�Fast�Track�Initiative�EGRA� Early�Grade�Reading�Assessment�EFA� Education�for�All��EMIS� Education�Management�Information�System��FPE� Free�Primary�Education��GER� gross�enrollment�ratio�GTZ� German�Society�for�Technical�Cooperation�HE� higher�education�IEC� internal�efficiency�coefficient�IPTE� Initial�Primary�Teachers�Education�Programme�JICA� Japan�International�Cooperation�Agency�JCE� Junior�Certificate�Examination�KFW� Kreditanstalt�Für�Wiederaufbau�(German�Development�Bank)�LMI� labor�market�information�MANEB� Malawi�National�Examinations�Board�MASTEP� Malawi�Special�Teacher�Education�Programme�MGDS� Malawi�Growth�and�Development�Strategy��MDG� Millennium�Development�Goal�MICS� Multi�Indicators�Cluster�Survey�MIITEP� Malawi�Integrated�In�service�Teacher�Education�Programme�MIT� Malawi�Institute�of�Tourism�MOEST� Ministry�of�Education,�Science�and�Technology�MOL� Ministry�of�Labour�MSCE� Malawi�School�Certificate�of�Examination�NCHE� National�Council�for�Higher�Education�NESP� National�Education�Sector�Plan�NSO� National�Statistical�Office�NUSLT� National�University�Student�Loan�Trust�OECD� Organisation�for�Economic�Co�operation�and�Development��ODL� Open�and�Distance�Learning��ODSS� Open�Day�Secondary�Schools�

Acronyms and Abbreviations xxvii
�
ORT� other�recurrent�transactions�PCAR� Primary�Curriculum�and�Assessment�Reform�PETS� Public�Expenditure�Tracking�Survey�PSLE� Primary�School�Leaving�Examination�PSLCE� Primary�School�Leaving�Certificate�of�Education�PTA� Parent�Teacher�Association��PTR� pupil�teacher�ratio�SACMEQ� Southern�African�Consortium�for�Monitoring�Educational�Quality�SADC� Southern�African�Development�Community�SIDA� Swedish�International�Development�Cooperation�Agency�SLE� school�life�expectancy�SMASSE� Strengthening�Mathematics�and�Science�in�Secondary�Education��SMC� School�Management�Committee�SqTR� student�to�qualified�teacher�ratio�STR� student�teacher�ratio�TEVET� technical,�entrepreneurial,�and�vocational�education�and�training�TTC� teacher�training�college��UNIMA� University�of�Malawi��UPE� Universal�Primary�Education�USAID� United�States�Agency�for�International�Development������
xxviii
Executive�Summary�
he�context�of�the�education�system�in�Malawi�is�strongly�marked�by�demographic�pressure,�a�high�prevalence�of�HIV/AIDS,�striking�poverty,�and�very�low�human�
and�social�development.��The� Malawian� education� system� has� to� develop� within� a� heavier� demographic�
context� than� that� of� its� neighboring� countries.�Malawi’s� population,� estimated� at� 13�million�inhabitants�in�2008,� is� increasing�at�the�rate�of�2.4�percent�per�year.�The�5–16�year�old� age� group� represents� 37� percent� of� the� total� population.� This� is� the� highest�proportion�of�that�age�group�in�the�entire�Southern�African�Development�Community�(SADC)�region.�It�is�estimated�that�the�population�growth�rate�will�slowly�decrease,�but�that�the�primary�school�age�group�(6–13�years�old)�will�increase�by�20�percent�between�now�and�2018.� If�universal�primary�education� is�reached�before�2018,�primary�school�places�for�4.8�million�children1�will�be�needed�in�2018.�This�represents�45�percent�more�primary�school�places�compared�to�2008.�
The� large�majority� of� the� population� (82� percent)� still� lives� in� rural� areas�where�school�supply�and�demand�are�weaker.�Sixty�three�percent�of�Malawians� live�on� less�than�US$2�a�day.�Malawi�has�the�highest�malnutrition�prevalence�in�the�SADC�region�and� an�overwhelming� 44�percent� of�preschoolers�have� stunted�growth.�There� are� an�estimated�122�children�per�1,000�who�die�before�the�age�of�five,�which�is�similar�to�the�SADC�average.�The�adult�(15�years�and�older)�literacy�rate�is�estimated�to�be�69�percent�in�Malawi,�which� is� lower� than� the� SADC� average� (75� percent).� Illiteracy� of� parents�impedes� the�achievement�of� education� for�all�because� these�parents� are� less� likely� to�enroll�their�children�in�school�than�literate�parents.�
The� HIV/AIDS� pandemic� also� dramatically� affects� the� development� of� the�education� sector,� because� of� the� deaths� of� both� teachers� and� parents.� The� pandemic�also�increases�teachers’�absenteeism�and�the�number�of�orphans,�who�are�less�likely�to�go�to�school�than�children�with�families.�The�adult�(15–49�years�old)�prevalence�rate�is�12�percent,�whereas�children�orphaned�by�AIDS�represent�7�percent�of�the�children�under�17�years�old�(in�addition�to�the�5�percent�of�children�orphaned�by�other�reasons).�HIV/AIDS�occurrences�are�highest�in�the�Southern�region�and�are�concentrated�in�urban�areas.��The�Malawian�economy�is�getting�better�but�still�remains�one�of�the�poorest�in�the�world.�
�Malawi’s� economy� has� been� growing� steadily� since� 2005,� mainly� due� to� recent�
sound� economic� policies� and� favorable� weather� conditions� for� agriculture.� The�continual�increase�in�economic�growth�has�allowed�Malawi�to�reach�a�GDP�per�capita�of�around�US$300�in�2008.� In�comparison�to�the�entire�SADC�region,�Malawi�still�has�the�third�lowest�GDP�per�capita�and�one�of� the�five� lowest� in�all�of�Africa.�However,�with� the� government’s� increased� emphasis� on� value� addition� on� domestic� products,�coupled�with�the�discovery�and�mining�of�uranium,�there�is�the�prospect�of�improved�GDP�levels.�
T
Executive Summary xxix
�
Compared� to� countries� with� a� comparable� level� of� economic� development,�Malawi’s�performance�is�very�satisfactory�for�mobilization�of�public�revenue.�The�rate�of� domestic� revenue� as� a� proportion� of� GDP� is� higher� in� Malawi� than� the� average�observed� in� low�income� non�oil� producing� African� countries� (19� compared� to� 17�percent).� Thus,� while� reducing� the� budget� deficit� at� around� 1� percent� of� GDP,� the�government�has�increased�the�volume�of�its�expenditures�up�to�more�than�33�percent�of�GDP.�This�creates�a�good�opportunity�to�increase�spending�for�the�education�sector.�
�The� ratio� of� enrollment� increased� very� differently� for� the� different� levels� of�education.� Compared� to� other�African� countries,� education� coverage� remains� very�low,�for�post�primary�levels�in�particular.�
�Since�2000,�the�gross�enrollment�ratio�(GER)�has�decreased�in�primary�education.�
In�2007,�it�was�101�percent.�In�the�same�period,�early�childhood�care�and�development�showed� a� very� high� increase� in� the� enrollment� ratio� (from� 2� to� 23� percent),� while�coverage� in� secondary� education� stayed� stable� (16� percent).� Enrollment� in� adult�literacy�programs�is�1,074�learners�per�100,000�inhabitants.�
Compared�to�other�Sub�Saharan�African�(SSA)�countries,�Malawi�performs�worse�in� post�primary� levels� and� technical,� entrepreneurial,� vocational� education� and�training�(TEVET)�(see�the�educational�pyramids�in�figure�1).�
�Malawi� still� stands� far� from� the� Education� Millennium� Development� Goal� of�universal�primary� completion�because�of� the�high�number�of�dropouts�within� the�primary�cycle.��
Access�to�Standard�1�in�primary�education�is�almost�universal�but�the�dropout�rate�is�still�very�high,� leading�to�only�a�35�percent�primary�completion�rate.�The�retention�rate�within�the�primary�cycle�improved�from�23�percent�in�2004�to�32�percent�in�2007,�but� remains� largely� insufficient.� The� retention� rate� in� secondary� education� is� much�better,�with�very�few�dropouts�within�the�cycle�(see�figure�2).�
The�poor�retention�rate�in�primary�education�comes�from�a�lack�of�school�demand,�in� particular� among� the� poorest.� Economic� difficulties� and� behavior� such� as� early�marriage,� pregnancy,� and� family� responsibilities� explain� the� fragility� of� school�demand.�The�lack�of�supply�(crowded�classrooms,�open�air�or�temporary�classrooms,�and� incomplete� schools)� also� has� a� negative� effect� on� retention.� Sixteen� percent� of�pupils�are�enrolled� in�a�school� that�does�not�provide� the�eight�grades�of� the�primary�cycle�and�these�students�are�likely�to�drop�out�before�completion.���

xxx Executive Summary
�
Figure 1: Educational Pyramids for Malawi and Sub-Saharan Africa
Malawi (2007)
678910111213
Prim
ary
35%
100%
GER = 101%
49%
1415
Low
erS
econ
dary
18%17%GER = 18%
64%
1617
Upp
erS
econ
dary
Theoreticalages
14%12%GER = 14%
Technical/Vocational : 2% of Total secondary
Tertiary : 52 st./100,000 inhab.
���
Sub-Saharan Africa (2005/06)
67891011
Prim
ary
61%
100%
GER = 99%
74%
121314
Low
erS
econ
dary 35%
45%GER = 47%
60%
151617
Upp
erS
econ
dary
Theoreticalages
17%
21%GER = 25%
Technical/Vocational : 6% of Total secondary
Tertiary : 538 st./100,000 inhab.
�
Sources:�Calculation�from�EMIS,�UN�population�data,�and�World�Bank�database.��

Executive Summary xxxi
�
Figure 2: Access Rate to Each Grade (2007)
97%
88%
76%
66%
46%
35%
14%12%18%17%
52%
100%
0
20
40
60
80
100
std1 std2 std3 std4 std5 std6 std7 std8 F1 F2 F3 F4Grade
Per
cent
�
Sources:�Calculation�with�EMIS�2007�database,�IHS�2004�repetition�structure,�and�UN�population�data.���The� internal� efficiency� of� the� system� is� weak,� in� particular� due� to� very� high�repetition�rates.��
The�internal�efficiency�coefficient�(IEC)�at�the�primary�level�is�particularly�low�(35�percent),�which� implies� that� 65�percent� of� public� resources� are�wasted� in�paying� for�repeated� grades� or� schooling� for� students� who� dropout� before� cycle� completion.�Currently,� the�system�requires�23�student�years� to�produce�one�Standard�8�graduate,�instead�of�8�years�with�an�ideal�internal�efficiency.�The�situation�has�slightly�worsened�since� 1999,� when� the� IEC� was� 39� percent.� A� higher� level� of� repetition� is� mainly�responsible�for�this�degradation.��
Repetition� rates�have� increased�over� the�1999–2006�period� to� reach�20�percent� in�primary� education—a� level� that� is� the� highest� in� the� region.� At� the� national� and�international�level,�evidence�shows�that�too�high�repetition�rates�do�not�favor�a�better�mastery�of�learning,�increase�the�risk�of�dropping�out,�and�have�adverse�effects�on�the�STR�(student�teacher�ratio)�and�costs.�An�estimated�MK1.97�billion�is�used�annually�to�deliver�primary�education�services�to�repeaters.�
The� Ministry� of� Education,� Science� and� Technology� is� well� aware� of� the� issue,�especially� as� it� affects� standards� 1� to� 4� of� the� primary� cycle,� where� the� highest�repetition� rates� are� to� be� found.� The� Ministry,� inspired� by� success� stories� in� other�countries,� is�thinking�of�a�policy�to�favor�direct�promotion�between�certain�standards�and�for� the�others,� (such�as�4,�6,�and�8)�allowing�a�student� to�repeat�only�after� failing�to�achieve�a�50�percent�pass�in�two�subjects�(standards�4�and�6),�and�after�failing�Standard�8.��
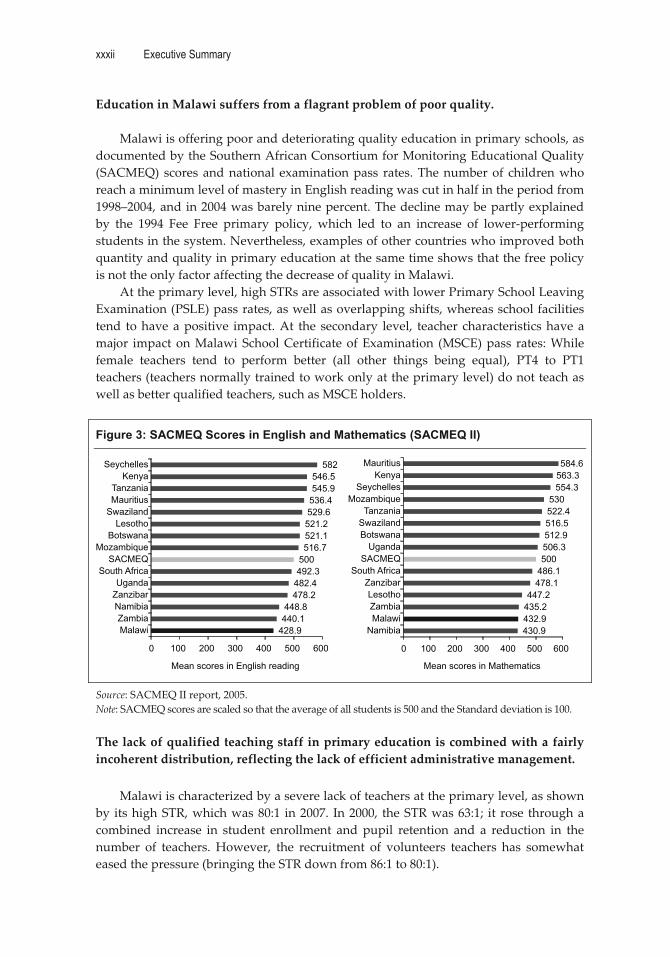
xxxii Executive Summary
�
Education�in�Malawi�suffers�from�a�flagrant�problem�of�poor�quality.���
Malawi�is�offering�poor�and�deteriorating�quality�education�in�primary�schools,�as�documented�by�the�Southern�African�Consortium�for�Monitoring�Educational�Quality�(SACMEQ)� scores�and�national� examination�pass� rates.�The�number�of� children�who�reach�a�minimum�level�of�mastery�in�English�reading�was�cut�in�half�in�the�period�from�1998–2004,�and�in�2004�was�barely�nine�percent.�The�decline�may�be�partly�explained�by� the� 1994� Fee� Free� primary� policy,� which� led� to� an� increase� of� lower�performing�students�in�the�system.�Nevertheless,�examples�of�other�countries�who�improved�both�quantity�and�quality�in�primary�education�at�the�same�time�shows�that�the�free�policy�is�not�the�only�factor�affecting�the�decrease�of�quality�in�Malawi.�
At�the�primary�level,�high�STRs�are�associated�with�lower�Primary�School�Leaving�Examination�(PSLE)�pass�rates,�as�well�as�overlapping�shifts,�whereas�school�facilities�tend� to�have�a�positive� impact.�At� the� secondary� level,� teacher� characteristics�have�a�major� impact�on�Malawi�School�Certificate�of�Examination� (MSCE)�pass� rates:�While�female� teachers� tend� to� perform� better� (all� other� things� being� equal),� PT4� to� PT1�teachers�(teachers�normally�trained�to�work�only�at�the�primary�level)�do�not�teach�as�well�as�better�qualified�teachers,�such�as�MSCE�holders.��
Figure 3: SACMEQ Scores in English and Mathematics (SACMEQ II)
428.9440.1448.8
478.2482.4492.3500516.7521.1521.2529.6536.4545.9546.5
582
0 100 200 300 400 500 600
MalawiZambia
NamibiaZanzibarUganda
South AfricaSACMEQ
MozambiqueBotswana
LesothoSwazilandMauritiusTanzania
KenyaSeychelles
Mean scores in English reading
430.9432.9435.2447.2
478.1486.1500506.3512.9516.5522.4530
554.3563.3584.6
0 100 200 300 400 500 600
NamibiaMalawiZambiaLesotho
ZanzibarSouth Africa
SACMEQUganda
BotswanaSwazilandTanzania
MozambiqueSeychelles
KenyaMauritius
Mean scores in Mathematics �
Source:�SACMEQ�II�report,�2005.�Note:�SACMEQ�scores�are�scaled�so�that�the�average�of�all�students�is�500�and�the�Standard�deviation�is�100.���The�lack�of�qualified�teaching�staff�in�primary�education�is�combined�with�a�fairly�incoherent�distribution,�reflecting�the�lack�of�efficient�administrative�management.���
Malawi�is�characterized�by�a�severe�lack�of�teachers�at�the�primary�level,�as�shown�by� its�high�STR,�which�was�80:1� in�2007.� In�2000,� the�STR�was�63:1;� it� rose� through�a�combined� increase� in� student� enrollment� and�pupil� retention� and� a� reduction� in� the�number� of� teachers.�However,� the� recruitment� of� volunteers� teachers� has� somewhat�eased�the�pressure�(bringing�the�STR�down�from�86:1�to�80:1).�
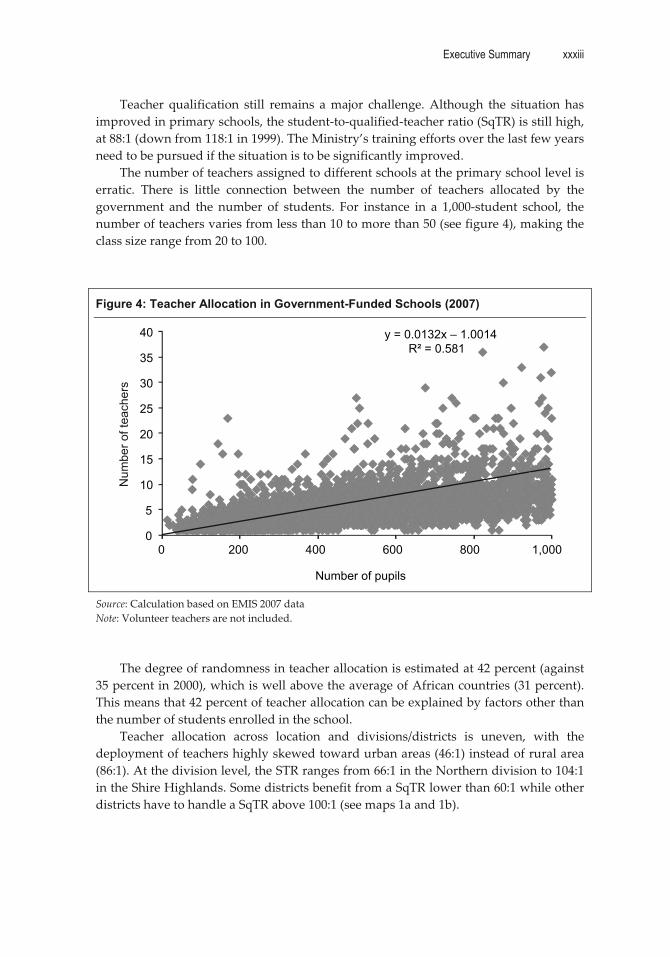
Executive Summary xxxiii
�
Teacher� qualification� still� remains� a�major� challenge.�Although� the� situation� has�improved�in�primary�schools,�the�student�to�qualified�teacher�ratio�(SqTR)�is�still�high,�at�88:1�(down�from�118:1�in�1999).�The�Ministry’s�training�efforts�over�the�last�few�years�need�to�be�pursued�if�the�situation�is�to�be�significantly�improved.�
The�number�of�teachers�assigned�to�different�schools�at�the�primary�school�level�is�erratic.� There� is� little� connection� between� the� number� of� teachers� allocated� by� the�government� and� the� number� of� students.� For� instance� in� a� 1,000�student� school,� the�number�of�teachers�varies�from�less�than�10�to�more�than�50�(see�figure�4),�making�the�class�size�range�from�20�to�100.���Figure 4: Teacher Allocation in Government-Funded Schools (2007)
Num
ber o
f tea
cher
s
y = 0.0132x – 1.0014R² = 0.581
0
5
10
15
20
25
30
35
40
0 200 400 600 800 1,000
Number of pupils �
Source:�Calculation�based�on�EMIS�2007�data�Note:�Volunteer�teachers�are�not�included.��
��The�degree�of�randomness�in�teacher�allocation�is�estimated�at�42�percent�(against�
35�percent�in�2000),�which�is�well�above�the�average�of�African�countries�(31�percent).�This�means�that�42�percent�of�teacher�allocation�can�be�explained�by�factors�other�than�the�number�of�students�enrolled�in�the�school.��
Teacher� allocation� across� location� and� divisions/districts� is� uneven,� with� the�deployment�of�teachers�highly�skewed�toward�urban�areas�(46:1)�instead�of�rural�area�(86:1).�At�the�division�level,�the�STR�ranges�from�66:1�in�the�Northern�division�to�104:1�in�the�Shire�Highlands.�Some�districts�benefit�from�a�SqTR�lower�than�60:1�while�other�districts�have�to�handle�a�SqTR�above�100:1�(see�maps�1a�and�1b).���

xxxiv Executive Summary
�
Map 1a: STR at the District Level Map 1b. SqTR at the District Level
Dedza
Dowa
Kasungu
Mchinji
Nkhotakota
Ntchisi
Salima
ChitipaKaronga
Mzimba
Nkhata Bay
Rumphi
ChikwawaThyolo
Nsanje
MulanjeChiradzulu
Phalombe
Mangochi
Ntcheu
Likoma
BalakaMachinga
Lake Malawi
< 60:1
Between 60:1 and 80:1
Between 80:1 and 100:1
> 100:1
Lil R.
East
ZombaMwanza
Blantyre
Mzuzu
Lil R.
West
Neno
Lilongwe City
Dedza
Dowa
Kasungu
Mchinji
Nkhotakota
Ntchisi
Salima
ChitipaKaronga
Mzimba
Nkhata Bay
Rumphi
ChikwawaThyolo
Nsanje
MulanjeChiradzulu
Phalombe
Mangochi
Ntcheu
Likoma
BalakaMachinga
Lake Malawi
< 60:1
Between 60:1 and 80:1
Between 80:1 and 100:1
> 100:1
Lil R.
East
ZombaMwanzaBlantyre
Mzuzu
Lil R.
West
Neno
Lilongwe City
�
Source:�EMIS,�2007�
��At�the�secondary�level,�coherence�in�teacher�deployment�is�better�but�there�are�still�discrepancies� between� Conventional� Secondary� Schools� (CSSs)� and� Community�Day�Secondary�Schools�(CDSSs),�to�the�detriment�of�the�latter.�
�At� the� secondary� level,� in� spite� of� a� relatively� good� average� STR,�more� than� 60�
percent�of� teachers�are�underqualified,�with�a�SqTR� ratio�of� 51:1.�Most�of� the�under�qualified�teachers�work�in�CDSSs;�81�percent�of�the�CDSS�teaching�force�is�unqualified�and� 27� percent� of� the� teachers� in�CSSs� are� unqualified.�Globally,� CDSSs� have� fewer�resources�than�other�schools,�although�they�enroll�nearly�half�of�the�secondary�student�population.� They� are� generally�underfunded,� have�underqualified� teachers,� a� poorer�learning� environment,� and� lack� appropriate� teaching� and� learning� materials� and�equipment.��
Teacher�deployment�across�secondary�schools� is� fairly�consistent,�as�indicated�by�the�value�of�the�statistical�coefficient�of�determination�(R2)�of�72�percent.�This�is�a�sharp�improvement�from�2000,�when�only�41�percent�of�the�variation�in�teacher�deployment�was� explained� by� school� size.� Yet,� there� remains� room� for� improvement� throughout�the�system,�since�28�percent�of�teacher�allocation�still�depends�on�factors�other�than�the�number�of�students�enrolled�in�each�school.��
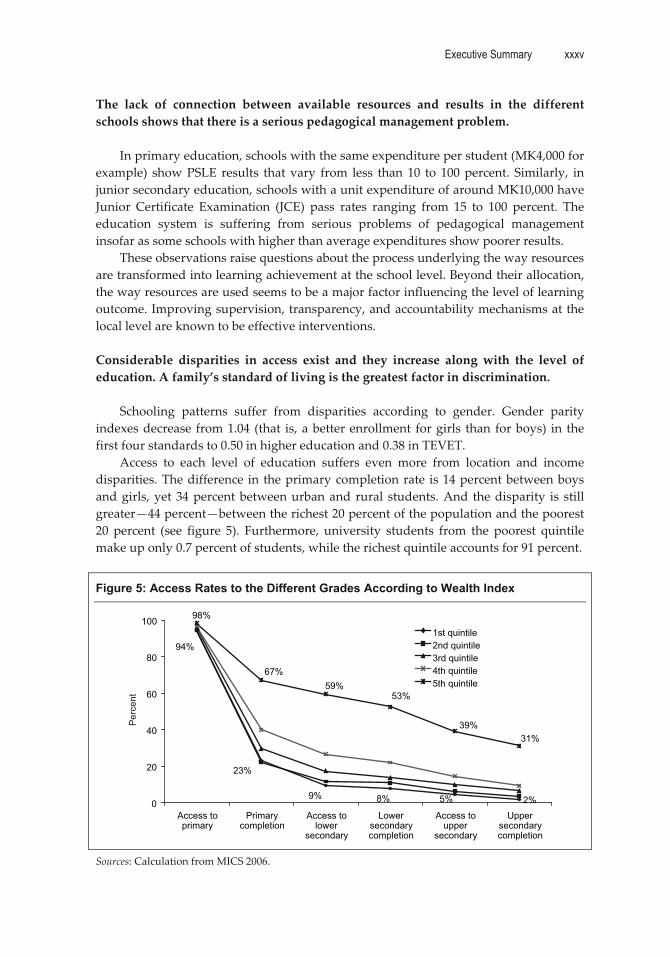
Executive Summary xxxv
�
The� lack� of� connection� between� available� resources� and� results� in� the� different�schools�shows�that�there�is�a�serious�pedagogical�management�problem.��
In�primary�education,�schools�with�the�same�expenditure�per�student�(MK4,000�for�example)� show�PSLE� results� that�vary� from� less� than� 10� to� 100�percent.� Similarly,� in�junior�secondary�education,�schools�with�a�unit�expenditure�of�around�MK10,000�have�Junior� Certificate� Examination� (JCE)� pass� rates� ranging� from� 15� to� 100� percent.� The�education� system� is� suffering� from� serious� problems� of� pedagogical� management�insofar�as�some�schools�with�higher�than�average�expenditures�show�poorer�results.�
These�observations�raise�questions�about�the�process�underlying�the�way�resources�are�transformed�into�learning�achievement�at�the�school�level.�Beyond�their�allocation,�the�way�resources�are�used�seems�to�be�a�major�factor�influencing�the�level�of�learning�outcome.�Improving�supervision,�transparency,�and�accountability�mechanisms�at�the�local�level�are�known�to�be�effective�interventions.��Considerable� disparities� in� access� exist� and� they� increase� along�with� the� level� of�education.�A�family’s�standard�of�living�is�the�greatest�factor�in�discrimination.��
�Schooling� patterns� suffer� from� disparities� according� to� gender.� Gender� parity�
indexes�decrease� from�1.04� (that� is,�a�better�enrollment� for�girls� than� for�boys)� in� the�first�four�standards�to�0.50�in�higher�education�and�0.38�in�TEVET.�
Access� to� each� level� of� education� suffers� even� more� from� location� and� income�disparities.�The�difference� in� the�primary�completion�rate� is�14�percent�between�boys�and�girls,�yet�34�percent�between�urban�and�rural� students.�And� the�disparity� is� still�greater—44�percent—between�the�richest�20�percent�of�the�population�and�the�poorest�20� percent� (see� figure� 5).� Furthermore,� university� students� from� the� poorest� quintile�make�up�only�0.7�percent�of�students,�while�the�richest�quintile�accounts�for�91�percent.��
Figure 5: Access Rates to the Different Grades According to Wealth Index
23%
94%
9% 8% 5% 2%
98%
67%59%
53%
39%31%
0
20
40
60
80
100
Access toprimary
Primarycompletion
Access tolower
secondary
Lowersecondarycompletion
Access toupper
secondary
Uppersecondarycompletion
1st quintile2nd quintile3rd quintile4th quintile5th quintile
Per
cent
�
Sources:�Calculation�from�MICS�2006.���
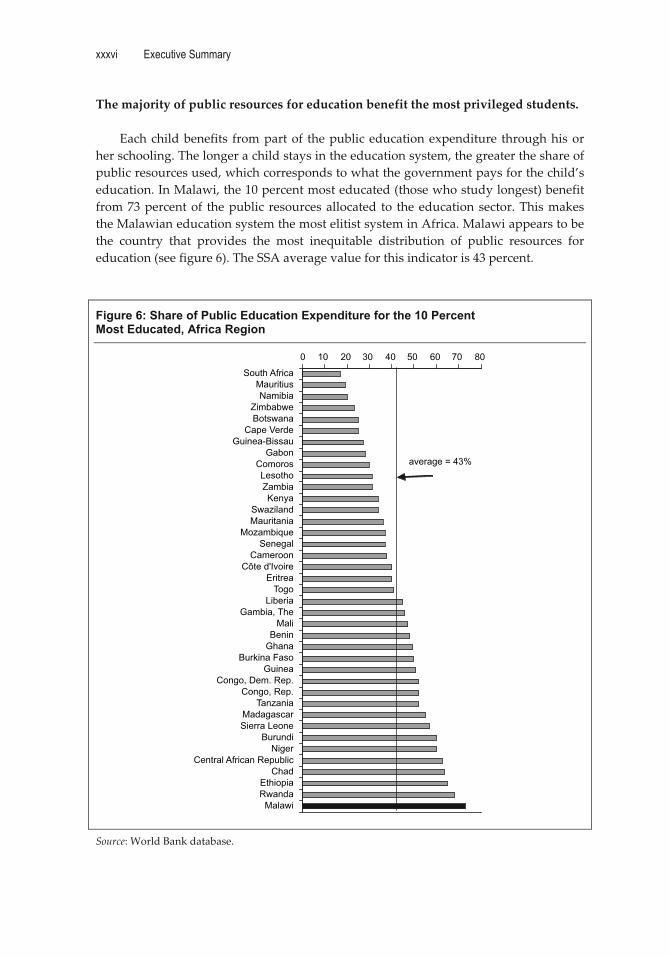
xxxvi Executive Summary
�
The�majority�of�public�resources�for�education�benefit�the�most�privileged�students.��Each�child�benefits� from�part�of� the�public�education�expenditure� through�his�or�
her�schooling.�The�longer�a�child�stays�in�the�education�system,�the�greater�the�share�of�public�resources�used,�which�corresponds�to�what�the�government�pays�for�the�child’s�education.�In�Malawi,�the�10�percent�most�educated�(those�who�study�longest)�benefit�from�73�percent�of� the�public� resources�allocated� to� the�education�sector.�This�makes�the�Malawian�education�system�the�most�elitist�system�in�Africa.�Malawi�appears�to�be�the� country� that� provides� the� most� inequitable� distribution� of� public� resources� for�education�(see�figure�6).�The�SSA�average�value�for�this�indicator�is�43�percent.���
Figure 6: Share of Public Education Expenditure for the 10 Percent Most Educated, Africa Region
0 10 20 30 40 50 60 70 80
South AfricaMauritiusNamibia
ZimbabweBotswana
Cape VerdeGuinea-Bissau
GabonComorosLesothoZambiaKenya
SwazilandMauritania
MozambiqueSenegal
CameroonCôte d'Ivoire
EritreaTogo
LiberiaGambia, The
MaliBenin
GhanaBurkina Faso
GuineaCongo, Dem. Rep.
Congo, Rep.Tanzania
MadagascarSierra Leone
BurundiNiger
Central African RepublicChad
EthiopiaRwanda
Malawi
average = 43%
�
Source:�World�Bank�database.���
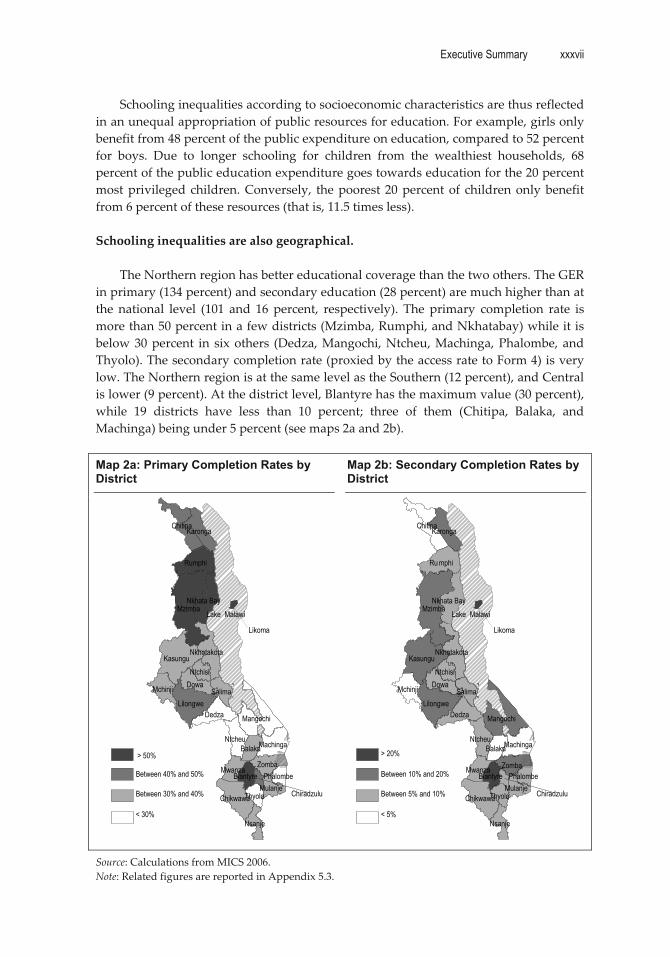
Executive Summary xxxvii
�
Schooling�inequalities�according�to�socioeconomic�characteristics�are�thus�reflected�in�an�unequal�appropriation�of�public�resources�for�education.�For�example,�girls�only�benefit�from�48�percent�of�the�public�expenditure�on�education,�compared�to�52�percent�for� boys.� Due� to� longer� schooling� for� children� from� the� wealthiest� households,� 68�percent�of�the�public�education�expenditure�goes�towards�education�for�the�20�percent�most�privileged�children.�Conversely,� the�poorest� 20�percent�of� children�only�benefit�from�6�percent�of�these�resources�(that�is,�11.5�times�less).��Schooling�inequalities�are�also�geographical.��
�The�Northern�region�has�better�educational�coverage�than�the�two�others.�The�GER�
in�primary�(134�percent)�and�secondary�education�(28�percent)�are�much�higher�than�at�the� national� level� (101� and� 16� percent,� respectively).� The� primary� completion� rate� is�more�than�50�percent�in�a�few�districts�(Mzimba,�Rumphi,�and�Nkhatabay)�while�it�is�below�30�percent� in� six�others� (Dedza,�Mangochi,�Ntcheu,�Machinga,�Phalombe,�and�Thyolo).�The�secondary�completion�rate�(proxied�by�the�access�rate�to�Form�4)�is�very�low.�The�Northern�region�is�at�the�same�level�as�the�Southern�(12�percent),�and�Central�is�lower�(9�percent).�At�the�district�level,�Blantyre�has�the�maximum�value�(30�percent),�while� 19� districts� have� less� than� 10� percent;� three� of� them� (Chitipa,� Balaka,� and�Machinga)�being�under�5�percent�(see�maps�2a�and�2b).��Map 2a: Primary Completion Rates by District
Map 2b: Secondary Completion Rates by District
Dedza
Dowa
Kasungu
Lilongwe
Mchinji
Nkhotakota
Ntchisi
Salima
ChitipaKaronga
MzimbaNkhata Bay
Ru mphi
ZombaBlantyre
ChikwawaThyolo
Nsanje
Mulanje Chiradzulu
Phalombe
Mangochi
Ntcheu
Likoma
BalakaMachinga
Mwanza
Lake Malawi
> 20%
Between 10% and 20%
Between 5% and 10%
< 5%
Dedza
Dowa
Kasungu
Lilongwe
Mchinji
Nkhotakota
Ntchisi
Salima
ChitipaKaronga
MzimbaNkhata Bay
Rumphi
ZombaBlantyre
ChikwawaThyolo
Nsanje
Mulanje Chiradzulu
Phalombe
Mangochi
Ntcheu
Likoma
BalakaMachinga
Mwanza
Lake Malawi
Between 40% and 50%
Between 30% and 40%
< 30%
> 50%
�
Source:�Calculations�from�MICS�2006.�Note:�Related�figures�are�reported�in�Appendix�5.3.��
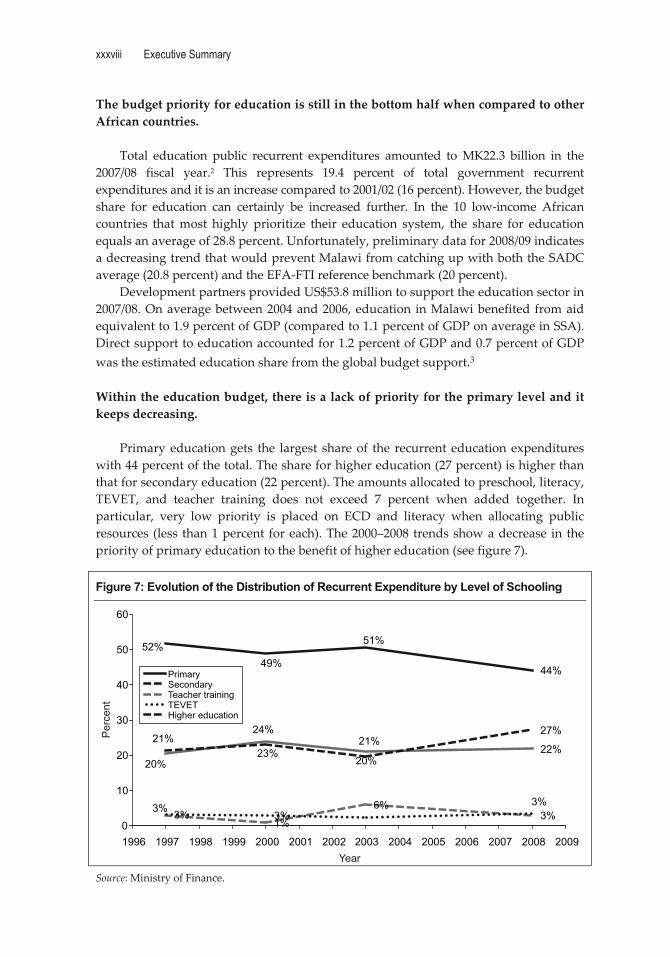
xxxviii Executive Summary
�
The�budget�priority�for�education�is�still�in�the�bottom�half�when�compared�to�other�African�countries.��
�Total� education� public� recurrent� expenditures� amounted� to�MK22.3� billion� in� the�
2007/08� fiscal� year.2� This� represents� 19.4� percent� of� total� government� recurrent�expenditures�and�it�is�an�increase�compared�to�2001/02�(16�percent).�However,�the�budget�share� for� education� can� certainly� be� increased� further.� In� the� 10� low�income� African�countries� that�most� highly� prioritize� their� education� system,� the� share� for� education�equals�an�average�of�28.8�percent.�Unfortunately,�preliminary�data�for�2008/09�indicates�a�decreasing�trend�that�would�prevent�Malawi�from�catching�up�with�both�the�SADC�average�(20.8�percent)�and�the�EFA�FTI�reference�benchmark�(20�percent).�
Development�partners�provided�US$53.8�million�to�support�the�education�sector�in�2007/08.�On�average�between�2004�and�2006,�education� in�Malawi�benefited�from�aid�equivalent�to�1.9�percent�of�GDP�(compared�to�1.1�percent�of�GDP�on�average�in�SSA).�Direct�support�to�education�accounted�for�1.2�percent�of�GDP�and�0.7�percent�of�GDP�was�the�estimated�education�share�from�the�global�budget�support.3��Within�the�education�budget,�there�is�a�lack�of�priority�for�the�primary�level�and�it�keeps�decreasing.��
�Primary�education�gets� the� largest� share�of� the� recurrent� education�expenditures�
with�44�percent�of�the�total.�The�share�for�higher�education�(27�percent)�is�higher�than�that�for�secondary�education�(22�percent).�The�amounts�allocated�to�preschool,�literacy,�TEVET,� and� teacher� training� does� not� exceed� 7� percent� when� added� together.� In�particular,� very� low� priority� is� placed� on� ECD� and� literacy� when� allocating� public�resources� (less� than�1�percent� for�each).�The�2000–2008�trends�show�a�decrease� in� the�priority�of�primary�education�to�the�benefit�of�higher�education�(see�figure�7).��
Figure 7: Evolution of the Distribution of Recurrent Expenditure by Level of Schooling
44%
22%
1%
6%3%3% 3%
27%
52%49%
51%
20%
24%21%
3% 3%
21%23%
20%
0
10
20
30
40
50
60
1996 1997 1998 1999 2000 2001 2002 2003 2004 2005 2006 2007 2008 2009
PrimarySecondaryTeacher trainingTEVETHigher education
Per
cent
Year �Source:�Ministry�of�Finance.�

Executive Summary xxxix
�
In� 2008,� Malawi’s� allocation� to� primary� education,� when� calibrated� to� a� 6�year�cycle�(as�is�common�in�most�African�countries),�was�one�of�the�lowest�(32.5�percent)�in�a� continent�where� the� average� is� 44.4� percent.�Compared� to� other� countries,�Malawi�prioritizes� higher� and� secondary� education� above� primary� education.� Malawi’s�recurrent� allocations� to� secondary� (40.4� percent� when� adjusted� to� a� 7�year� cycle�duration� for�a� comparative�perspective)�and�higher�education� (27�percent)� are�above�average—the� SSA� average� is� 34.4� percent� for� secondary� and� 21� percent� for� higher�education.��As�a�result�of�making�comparatively�poor�budget�allocations�to�primary�education,�the� public� recurrent� unit� cost� for� primary� is� very� low� and� the� unit� costs� for�secondary�and�higher�education�are�very�high.���
In� 2007/08,� the� recurrent� expenditure� per� student� in� primary� education� was�around�MK3,000,�which�is�equivalent�to�only�8.3�percent�of�GDP�per�capita�(compared�to�an�average�of�12�percent�in�the�SADC�region�and�11�percent�in�SSA).��
At�the�secondary�level,�the�public�unit�cost�is�estimated�to�be�MK30,300�(83�percent�GDP�per�capita�versus�30�percent�for�the�SSA�average)�and�it� is�four�times�higher�(in�terms� of� GDP� per� capita)� than� it� was� in� 2000.� However,� this� average� unit� cost� for�secondary� hides� the� disparities� that� exist� between� the� CSSs� and� the� CDSSs,� to� the�detriment� of� the� latter.� TEVET,� when� parallel� students� are� included,� costs� the�government�MK136,500�per�year�per�student�(equivalent�to�45�times�the�primary�unit�cost).��
Larger� secondary� schools� would� help� to� reduce� the� unit� cost.� While� potential�economies� of� scale� are� modest� in� primary� schools,� they� are� quite� important� at� the�secondary�level.�This�has�to�do�with�student�teacher�ratio�levels�and�school�size:�While�the�average�number�of�students�in�secondary�schools�is�relatively�low�at�212,�it�reaches�an� average� of� 642� pupils� in� primary� schools.� Scale� economies� are� possible� at� the�secondary� level,�by� favoring� larger� schools�of�more� than�150�students�and� increasing�the�STR�level.��
The�public�recurrent�unit�cost�of�university�education�is�the�highest�in�the�world�in�terms�of�GDP�per�capita�(2,147�percent�of�GDP�per�capita,�or�seven�times�more�than�the�SSA�average).�One�year�of�study�for�one�university�student�costs�the�same�amount�to�the�government�as�259�school�years�of�primary�pupils.�
�Consequently,� schooling� conditions� are� comparatively� very� bad� in� primary�education�and�better�than�average�in�secondary�and�higher�education.��
Unit� cost� in� primary� education� is� low�mainly� because� of� the� very� high� student�teacher�ratio—80:1�vs.�48:1�for�the�SSA�average�(see�table�1)�and�the�low�rate�of�other�recurrent�transactions�(ORT)�allocated�to�primary�education.�Inversely,�the�secondary�education�unit�cost�is�high�because�the�student�teacher�ratio�is�low�(20:1�compared�to�28:1� for� the� SSA� average)� while� the� ORT� rate� is� relatively� higher� than� in� primary�education.��
The� extremely� high� unit� cost� in� higher� education� is� mainly� due� to� a� very� low�student�lecturer� ratio� and� comparatively� high� teacher� salaries.� The� student�lecturer�
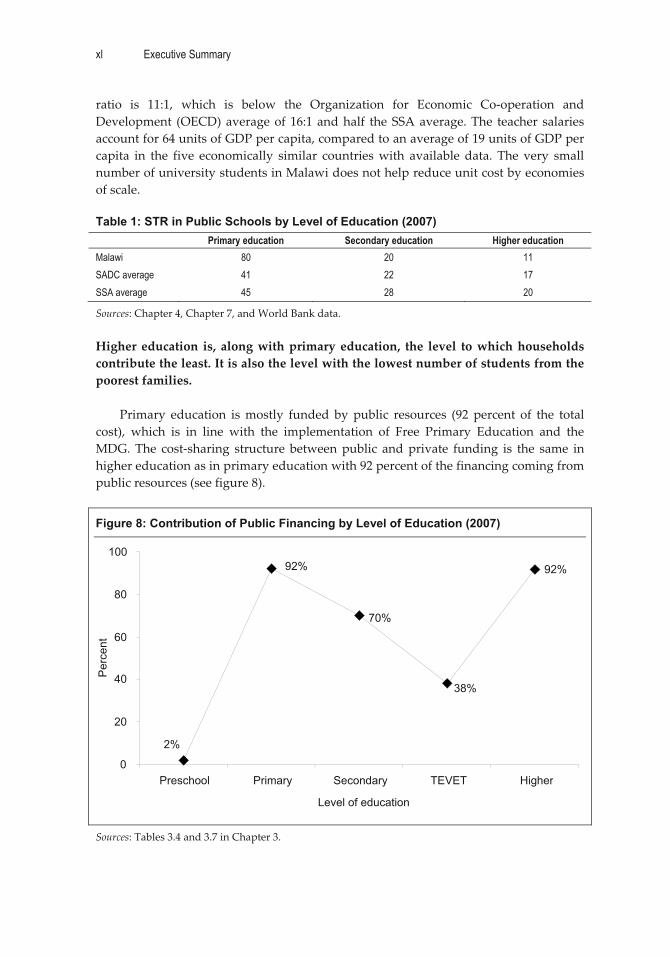
xl Executive Summary
�
ratio� is� 11:1,� which� is� below� the� Organization� for� Economic� Co�operation� and�Development� (OECD)�average�of�16:1�and�half� the�SSA�average.�The� teacher� salaries�account�for�64�units�of�GDP�per�capita,�compared�to�an�average�of�19�units�of�GDP�per�capita� in� the� five� economically� similar� countries�with� available� data.� The� very� small�number�of�university�students�in�Malawi�does�not�help�reduce�unit�cost�by�economies�of�scale.��Table 1: STR in Public Schools by Level of Education (2007)
Primary education Secondary education Higher education Malawi 80 20 11 SADC average 41 22 17 SSA average 45 28 20
Sources:�Chapter�4,�Chapter�7,�and�World�Bank�data.���Higher� education� is,� along�with�primary�education,� the� level� to�which�households�contribute�the�least.�It�is�also�the�level�with�the�lowest�number�of�students�from�the�poorest�families.��
Primary� education� is�mostly� funded� by� public� resources� (92� percent� of� the� total�cost),� which� is� in� line� with� the� implementation� of� Free� Primary� Education� and� the�MDG.�The� cost�sharing� structure� between�public� and�private� funding� is� the� same� in�higher�education�as�in�primary�education�with�92�percent�of�the�financing�coming�from�public�resources�(see�figure�8).���
Figure 8: Contribution of Public Financing by Level of Education (2007)
�
Sources:�Tables�3.4�and�3.7�in�Chapter�3.��
92%
2%
92%
70%
38%
0�
20�
40�
60�
80�
100�
Preschool Primary� Secondary TEVET Higher�
Per
cent�
Level of education
Executive Summary xli
�
This�raises�an�equity� issue�in�the�way�public�resources�are�allocated�to�education�because� 90� percent� of� the� students� in� higher� education� are� from� the� wealthiest� 20�percent� of� households� (see� Chapter� 5)� and� these� students� get� a� very� high� level� of�private� return� (salaries)�when�working� after� graduation� (see�Chapter� 8).� It�would�be�relevant�to�discuss�ways�to�create�a�more�equitable�cost�sharing�of�the�higher�education�service�delivery.��The�TEVET�system�is�very�fragmented�and�formal�general�TEVET�programs�enroll�very�few�learners.��
The�TEVET�system� in�Malawi� is�highly�diverse,� fragmented,�and�uncoordinated,�with� multiple� private� and� public� provider� systems.� Reasonable,� robust� data� are�available�only�for�the�formal�general�TEVET�provided�in�public�technical�colleges�(TCs)�under� the� auspices� of� the�Ministry� of� Science,� Education� and� Technology� (MOEST).�Access� to� the� regular� TEVET� programs� is� very� low;� these� are� regulated� and�administered� by� the� TEVET�Authority� (TEVETA)� and� provided�mainly� as� four�year�apprenticeship�training.��
With� an� annual� intake� of� around� 700,� only� 3.9� percent� of�MSCE�graduates� have�access.� Including� so�called� “parallel”� students,� who� are� directly� recruited� by� the�TEVET�institutions,�annual�enrollment�in�the�public�TEVET�system�under�MOEST�was�4,807� in� 2007.� This� represents� 35� TEVET� students� per� 100,000� inhabitants,� by� far� the�lowest�access�rate�in�the�group�of�SADC�countries�for�which�data�are�available.�TEVET�enrollment� in� Malawi� represents� only� two� percent� of� the� secondary� education�enrollment,�three�times�less�than�the�African�average�of�six�percent;�see�the�educational�pyramids�in�figure�1.�
The�training�supply�in�the�formal�system�is�limited�to�mainly�traditional�technical�trades.�Additional� skill� development� opportunities� are� provided� by� other�ministries,�NGOs,� and� church�run� schools� in� the� private� training� market� and,� not� least,� by�companies.� Of� particular� importance� for� the� informal� sector,� and� for� low� income�groups,�is�the�system�of�traditional�apprenticeship�(mastercraftsman�training).��
�As� far� as� the� formal� TEVET� system� is� concerned,� access� is� biased� against� girls,�school�leavers�from�poorer�districts,�and�those�with�lower�educational�attainment.�
�The� female� participation� rates� in� the� country’s� main� TEVET� examination�
systems—trade�testing�and�Malawi�(Advanced)�Craft—are�10�percent�and�23�percent,�respectively.�This�indicates�the�low�access�girls�have�to�TEVET.�However,�at�least�in�the�public�TCs,�the�female�share�is�slowly�increasing�to�30�percent,�which�is�the�result�of�an�antidiscrimination�policy�employed�by�TEVETA.�
School� leavers� from� the�Northern� region� are� overrepresented� in� regular� TEVET.�Access� to� regular� TEVET� programs� has� recently� been� limited� to� MSCE� holders,�effectively�excluding�the�majority�of�the�country’s�youth�from�the�publicly�subsidized�general�TEVET�system.���
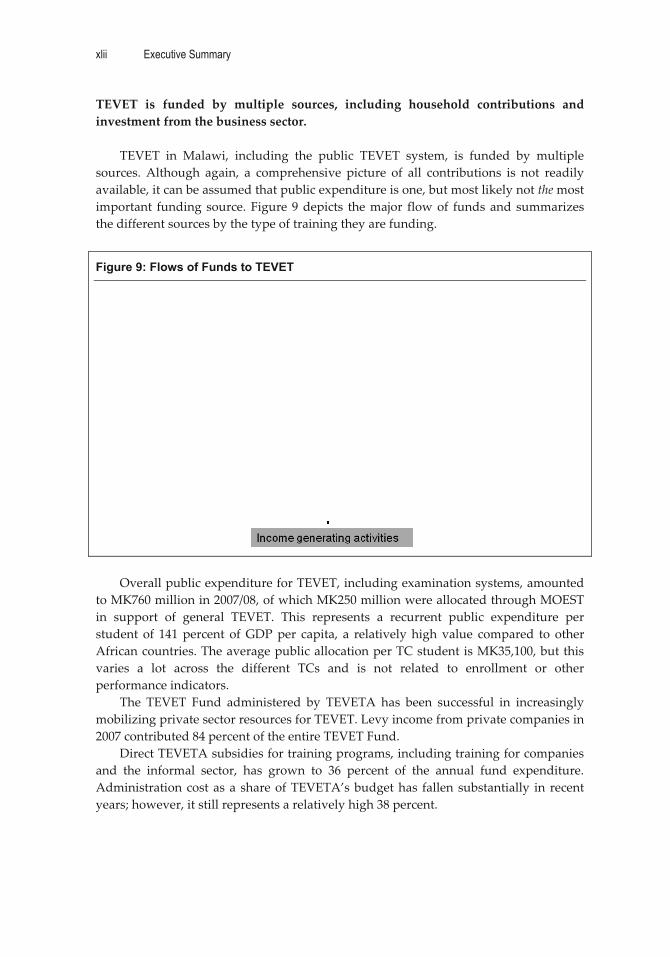
xlii Executive Summary
�
TEVET� is� funded� by� multiple� sources,� including� household� contributions� and�investment�from�the�business�sector.��
�TEVET� in� Malawi,� including� the� public� TEVET� system,� is� funded� by� multiple�
sources.� Although� again,� a� comprehensive� picture� of� all� contributions� is� not� readily�available,�it�can�be�assumed�that�public�expenditure�is�one,�but�most�likely�not�the�most�important� funding� source.� Figure�9�depicts� the�major� flow�of� funds�and�summarizes�the�different�sources�by�the�type�of�training�they�are�funding.��
�Figure 9: Flows of Funds to TEVET
�
�Overall�public�expenditure�for�TEVET,�including�examination�systems,�amounted�
to�MK760�million�in�2007/08,�of�which�MK250�million�were�allocated�through�MOEST�in� support� of� general� TEVET.� This� represents� a� recurrent� public� expenditure� per�student� of� 141�percent� of�GDP�per� capita,� a� relatively�high�value� compared� to� other�African�countries.�The�average�public�allocation�per�TC�student�is�MK35,100,�but�this�varies� a� lot� across� the� different� TCs� and� is� not� related� to� enrollment� or� other�performance�indicators.��
The� TEVET� Fund� administered� by� TEVETA� has� been� successful� in� increasingly�mobilizing�private�sector�resources�for�TEVET.�Levy�income�from�private�companies�in�2007�contributed�84�percent�of�the�entire�TEVET�Fund.��
Direct�TEVETA�subsidies�for�training�programs,�including�training�for�companies�and� the� informal� sector,� has� grown� to� 36� percent� of� the� annual� fund� expenditure.�Administration�cost�as�a� share�of�TEVETA’s�budget�has� fallen�substantially� in� recent�years;�however,�it�still�represents�a�relatively�high�38�percent.��
Executive Summary xliii
�
Household� contribution� is� highly� differentiated� according� to� the� status� of� the�students.���
Private�households�contribute�significantly�to�the�cost�of�TEVET�in�Malawi,�mainly�through�fees�(tuition�and�examination),�boarding�fees,�the�cost�of�living�of�trainees�(if�boarding� is� not� an� option),� as� well� as� opportunity� costs� if� a� trainee� would� have�otherwise�been�employed�and�earned�an�income.�
In� the� formal� TEVET� programs� provided� in� the� TCs,� private� contributions� are�highly�differentiated�according�to�the�status�of�the�students—whether�they�are�regular�(TEVETA�sponsored)� apprentices� or� parallel� students� recruited� directly� by� the�colleges.� The� former� are� subsidized� by� TEVETA� and� the� public� budget� (through�MOEST� base�funding� of� the� institutions).� Over� the� entire� four�year� training� period,�parallel� students� pay� 5� to� 6.6� times� the� amount� of� regular� students.� It� should� be�recalled�that�admission�to�TEVETA�sponsored�apprenticeships�is�limited�to�around�700�students�annually,�which�represent�only�38�percent�of�all�students�in�enrolled�TCs.���The� quality� of� the� TEVET� provision� is� negatively� affected� by� multiple� factors,�including�lack�of�clarity�about�the�roles�of�main�stakeholders.��
The� main� factors� affecting� quality� are� inadequate� equipment� and� facilities;� a�shortage�of�training�materials�due�to�financial�constraints;�and,�in�particular,�deficient�practical� competences� of� TEVET� teachers� coupled� with� an� absence� of� a� systematic�TEVET� teachers� training� system.�A� low�quality�of� training� leads� to� low�pass� rates� in�national�examinations�of�between�50�and�67�percent.��
The� most� important� impediment� to� sustainable� quality� improvement� is� the�coexistence�of�the�three�local�qualification�systems—trade�testing,�Malawi�(Advanced)�Craft,� and� CBET� (implemented� by� TEVETA),� which� prevents� the� development� of� a�unified� employer�involved� quality� assurance� system,� and� forces� teachers� to� train� on�the�basis�of�parallel�curricula.��
The�lack�of�clarity�about�the�division�of�roles�and�responsibilities�among�the�main�actors—TEVETA,� MOEST,� and� the� Ministry� of� Labour� (MOL)—and� major�stakeholders�such�as�the�private�sector,�has�been�a�major�reason�why�implementation�of�the�agreed�TEVET�sector�reform�has�been�slow.�It�also�affects�the�status�of�the�public�TCs,�whose� current� scope� of� responsibility� is� not� appropriate� to� the�diverse� funding�and�program�structures�they�have�to�manage.���Higher�education�enrollment�is�one�of�the�smallest�in�the�world�but�it�is�growing�at�a�quick�pace.��
Malawi,� with� 51� students� per� 100,000� inhabitants,� has� the� lowest� university�enrollment�when�compared�to�other�African�countries�whose�average�is�337�(see�figure�10).� Nevertheless,� university� enrollments� almost� doubled� from� 2003–2008,� in� partly�because�of�the�enrollment�of�non�residential�students�and�the�establishment�of�private�universities,�which�contributed�12.4�percent�of�the�total�enrollment�in�2008.���

xliv Executive Summary
�
Figure 10: Number of Higher Education Students per 100,000 Inhabitants in Sub-Saharan Africa
957
337
51
0 200 400 600 800 1,000 1,200
Malawi
Niger
Burundi
Central African Republic
Tanzania
Mozambique
Guinea
Burkina Faso
Rwanda
Madagascar
Ethiopia
Mali
Angola
Lesotho
Average
Ghana
Namibia
Swaziland
Nigeria
Botswana
Cameroon
Mauritius
Cape Verde
South Africa
Students per 10,000 inhabitants
�
Sources:�Table�7.1of�Chapter�7�and�UNESCO�Institute�for�Statistics�data.��
Postgraduate� enrollments� account� for� less� than� 10� percent� of� total� enrollment.�Private�colleges�are�not�offering�postgraduate�programs�yet.�The�highest�enrollments�are� in� the� social� sciences� and� sciences.� Areas� critical� to� the� implementation� of� the�Malawi�Growth�and�Development�Strategy�are�not�adequately�covered.���There�are�still�huge�gender�disparities�in�the�access�to�higher�education.��
Female� enrollment� has� remained� around� 30� percent� in� public� institutions� and�around�45�percent� in�private� institutions.�There�are�a�number�of� reasons�why� female�enrollments�are�low�in�higher�education.�The�first�has�to�do�with�the�dropout�rates�for�
Executive Summary xlv
�
females�throughout�the�education�cycle�in�primary�and�secondary�levels�(see�Chapter�2).� This� reduces� the� percentage� of� females� who� enter� for� the�MSCE� examination� to�below� that� of�males.� In� addition,� the� percentage� pass� for� female�to�female4� is� lower�than�that�for�male�to�male.�As�a�result,� there� is�a�double�screening�in�the�numbers�of�females�that�eventually�qualify�for�university�entry.��
Bed� space� is� also� an� important� constraint� in� enrolling� more� females� as� the�institutions� have�more� bed� space� allocated� for�males� than� females.� In� 2008,� the� total�bed�space�for�all�the�University�of�Malawi�(UNIMA)�colleges�was�2,761�for�males�and�1,383�for�females.��
The� introduction�of�non�residential�programs�has� increased�enrollments� for�both�genders� but� the� enrollment� statistics� show� that� the� percentage� of� non�residential�female�students�is�consistently�lower�than�that�for�males�and�also�lower�than�that�for�residential�female�students.�This�may�be�attributed�to�problems�of�financing,�having�to�live�alone�in�rented�accommodations,�and�commuting�to�college�daily.���Higher� education� is� highly� subsidized� by� public� resources� and� is� delivered� at� an�extremely�high�unit�cost�when�compared�to�other�countries.��
The�percentage�of� the� education�public� budget� allocated� to�higher� education� (27�percent)� is� higher� than� the� average� (21� percent)� for� SSA� countries.� The� subventions�account�for�over�80�percent�of�the�income�of�public�universities,�while�student�fees�and�other�income�contribute�less�than�10�percent�each.�Student�fees�are�the�main�source�of�income�for�private�universities.�
The�higher� education� recurrent�unit� cost� of� 21.5� times� the�GDP�per� capita� is� the�highest�among�all� the�SSA�countries,�whose�average�is�3.14�times�the�GDP�per�capita�(see�figure�11).�It�varies�widely�from�one�institution�to�another.���The�way�public�universities�use�expenditures�is�not�efficient.��
Emoluments� and� benefits� consume� more� than� 50� percent� of� expenditures� in�public� institutions.� Very� little� is� spent� on� teaching�materials� and� equipment,� books�and�periodicals,�and�research.�Emolument�comprises� less� than�40�percent�of� the� total�expenditure�in�private�universities,�which�also�spend�more�on�teaching�materials�than�public�institutions.�
The�average�student/lecturer�ratio�at�11:1�is�very�low,�compared�to�other�countries�in�SSA�of�similar�GDP�whose�average�is�20.4:1.�Lecturer�salaries�expressed�at�65.8�times�GDP� per� capita� are� also� higher� compared� to� other� SSA� countries� with� similar� GDP�whose�average�is�24.3�times�GDP�per�capita�(see�table�2).�This�also�contributes�to�a�very�high�unit�cost.���

xlvi Executive Summary
�
Figure 11: Higher Education Public Recurrent Unit Costs (2007 or last year available)
(in relation to GDP per capita)
0 5 10 15 20 25
MalawiMozambique
LesothoRwandaEthiopia
NigerTanzania
BotswanaEritreaChad
BurundiSri Lanka
ZambiaKenya
GambiaSenegal
SwazilandBurkina Faso
ZimbabweCentral African Republic
Côte d’IvoireGhana
Congo, Rep. ofUganda
MaliMadagascar
LiberiaGuinea
TogoBenin
ComorosGuinea-Bissau
NigeriaSudan
MauritiusNamibia
CameroonCongo, Dem. Rep. of �
Sources:�Revised�07/08�budget�(Ministry�of�Finance�and�our�own�calculations)�and�World�Bank�data.�

Executive Summary xlvii
�
Table 2: Higher Education Teachers’ Average Salary, as Units of GDP Per Capita for Countries with GDP per Capita Lower than US$500 (2007 or last year available)
Higher Education Average Lecturers’ Salaries
as Units of GDP Per Capita Congo, Dem. Rep. of 4.1 Guinea 10.3 Mali 12.1 Madagascar 12.8 Malawi 65.8 Ethiopia 27.1 Burundi 37.2 Average 7 countries 24.2
Sources:�Malawian�higher�education�institutions�and�World�Bank�data.��The�student�loan�scheme�is�inefficient�and�not�targeted�to�the�neediest.��
Initially,� students�were� provided�with� a� straight� grant.� Around� 1994,� the� policy�shifted� to� a� loan� system� in�which� students�were� expected� to� repay� their� loans� after�graduation.� However,� recovery� mechanisms� were� not� established� and� the� loans�effectively� became� grants.� In� 2005,� there� was� another� policy� shift� that� led� to� the�National�University�Student�Loan�Trust,�which�would�lend�and�recover�the�loans�from�the� graduates.� The� Malawi� model� is� the� mortgage�type� loan� with� a� fixed� rate� of�payment� over� a� period� of� time.�Other� countries� use� the� income� contingency� system,�which� is� based� on� a� percentage� of� the� salary� of� the� borrowers� when� they� are� in�employment�until�the�loan�is�repaid.�
As� currently� constituted,� recovery� relies� on� the� cooperation� of� the� employers� as�there�is�no�legal�framework�in�place�that�obligates�employers�to�report�on�graduates�in�their� employment� and� deduct� repayments� and� remit� these� to� the� Trust.� A� serious�backlog�of�loans�is�building�up.�
Countries� like� Zimbabwe� and� South� Africa� have� such� legal� frameworks,� which�have�proved�effective�in�improving�loan�repayments.�A�legal�framework�that�spells�out�the� responsibilities� and� obligations� of� all� parties� and� the� sanctions� applicable� is�therefore�a�critical�prerequisite�to�the�success�of�this�scheme.�
The�Loan�Trust�meant�for�the�needy�does�not�apply�a�“Means�Test,”�and�as�result�almost� all� applicants� access� it.�The� system� is�not� equitable�because� those�who�access�loans�are�mainly�among�the�wealthiest�in�the�country.���Education�has�an�important�impact�on�social�development.�Primary�education�is�the�level�of�education�that�has�the�greatest�impact.��
Education� in� general� (particularly� for� girls)� has� a� strong� impact� on� literacy,� on�behavior�in�terms�of�reproduction�and�maternal�and�child�health,�and�on�knowledge�of�HIV/AIDS.�For� example,�with�all� else�being� equal,�women�who�have�never� attended�school� benefit� from�medical� help� at� childbirth� in� only� 43� percent� of� all� cases,�while�those� who� have� completed� primary� education� do� so� in� 67� percent� of� all� cases,� and�those�who�have�completed�secondary�education�do�so�in�79�percent�of�all�cases.��
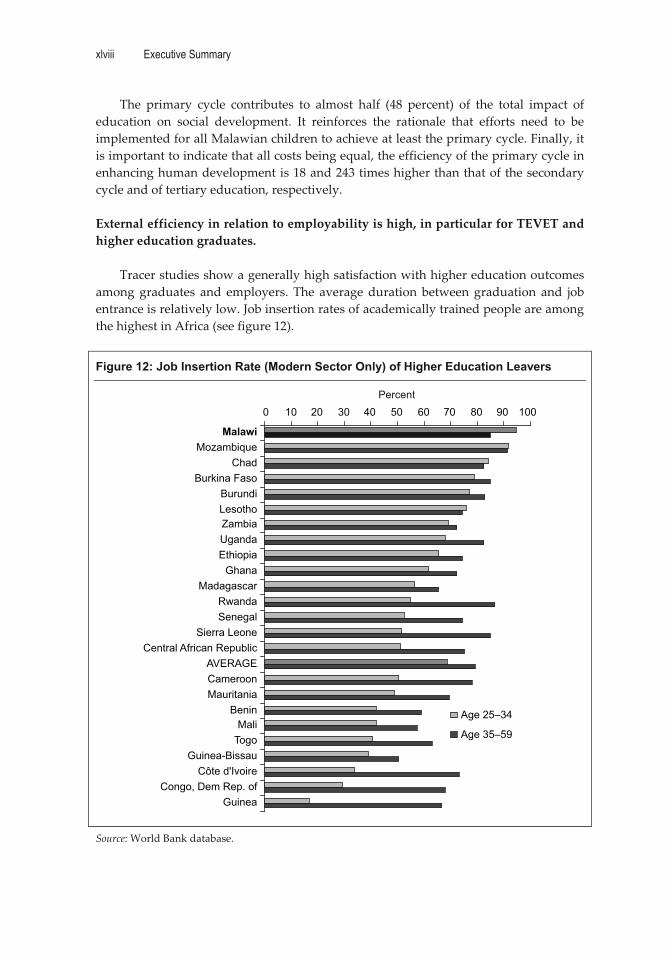
xlviii Executive Summary
�
The� primary� cycle� contributes� to� almost� half� (48� percent)� of� the� total� impact� of�education� on� social� development.� It� reinforces� the� rationale� that� efforts� need� to� be�implemented�for�all�Malawian�children�to�achieve�at�least�the�primary�cycle.�Finally,�it�is�important�to�indicate�that�all�costs�being�equal,�the�efficiency�of�the�primary�cycle�in�enhancing�human�development�is�18�and�243�times�higher�than�that�of�the�secondary�cycle�and�of�tertiary�education,�respectively.��External�efficiency�in�relation�to�employability�is�high,�in�particular�for�TEVET�and�higher�education�graduates.��
Tracer�studies�show�a�generally�high�satisfaction�with�higher�education�outcomes�among�graduates� and� employers.� The� average�duration� between�graduation� and� job�entrance�is�relatively�low.�Job�insertion�rates�of�academically�trained�people�are�among�the�highest�in�Africa�(see�figure�12).��
Figure 12: Job Insertion Rate (Modern Sector Only) of Higher Education Leavers
0 10 20 30 40 50 60 70 80 90 100
MalawiMozambique
ChadBurkina Faso
BurundiLesothoZambiaUgandaEthiopia
GhanaMadagascar
RwandaSenegal
Sierra LeoneCentral African Republic
AVERAGECameroonMauritania
BeninMali
TogoGuinea-Bissau
Côte d'IvoireCongo, Dem Rep. of
Guinea
Age 25–34
Age 35–59
Percent
�
Source:�World�Bank�database.��
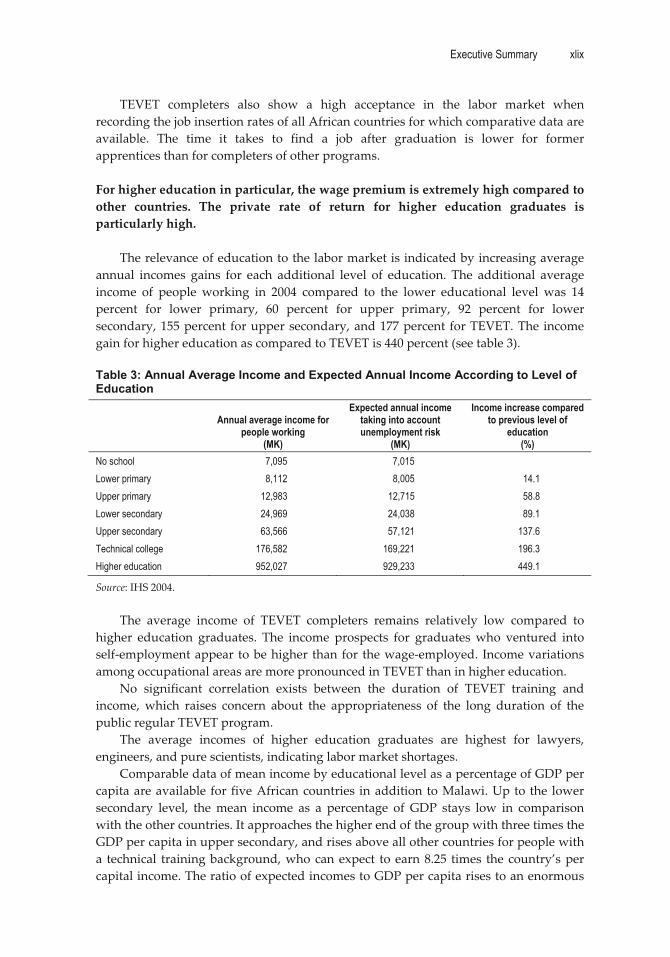
Executive Summary xlix
�
TEVET� completers� also� show� a� high� acceptance� in� the� labor� market� when�recording�the�job�insertion�rates�of�all�African�countries�for�which�comparative�data�are�available.� The� time� it� takes� to� find� a� job� after� graduation� is� lower� for� former�apprentices�than�for�completers�of�other�programs.��For�higher�education�in�particular,�the�wage�premium�is�extremely�high�compared�to�other� countries.� The� private� rate� of� return� for� higher� education� graduates� is�particularly�high.��
The�relevance�of�education�to�the�labor�market�is�indicated�by�increasing�average�annual� incomes� gains� for� each� additional� level� of� education.� The� additional� average�income� of� people� working� in� 2004� compared� to� the� lower� educational� level� was� 14�percent� for� lower� primary,� 60� percent� for� upper� primary,� 92� percent� for� lower�secondary,�155�percent� for�upper�secondary,�and�177�percent� for�TEVET.�The� income�gain�for�higher�education�as�compared�to�TEVET�is�440�percent�(see�table�3).���Table 3: Annual Average Income and Expected Annual Income According to Level of Education
Annual average income for people working
(MK)
Expected annual income taking into account unemployment risk
(MK)
Income increase compared to previous level of
education (%)
No school 7,095 7,015 Lower primary 8,112 8,005 14.1 Upper primary 12,983 12,715 58.8 Lower secondary 24,969 24,038 89.1 Upper secondary 63,566 57,121 137.6 Technical college 176,582 169,221 196.3 Higher education 952,027 929,233 449.1
Source:�IHS�2004.��
The� average� income� of� TEVET� completers� remains� relatively� low� compared� to�higher� education� graduates.� The� income� prospects� for� graduates�who� ventured� into�self�employment�appear� to�be�higher� than�for� the�wage�employed.� Income�variations�among�occupational�areas�are�more�pronounced�in�TEVET�than�in�higher�education.��
No� significant� correlation� exists� between� the� duration� of� TEVET� training� and�income,�which� raises� concern� about� the� appropriateness� of� the� long� duration� of� the�public�regular�TEVET�program.�
The� average� incomes� of� higher� education� graduates� are� highest� for� lawyers,�engineers,�and�pure�scientists,�indicating�labor�market�shortages.�
Comparable�data�of�mean�income�by�educational�level�as�a�percentage�of�GDP�per�capita�are�available� for� five�African�countries� in�addition�to�Malawi.�Up�to� the� lower�secondary� level,� the�mean� income� as� a� percentage� of� GDP� stays� low� in� comparison�with�the�other�countries.�It�approaches�the�higher�end�of�the�group�with�three�times�the�GDP�per�capita�in�upper�secondary,�and�rises�above�all�other�countries�for�people�with�a� technical� training�background,�who�can�expect� to�earn�8.25� times� the�country’s�per�capital�income.�The�ratio�of�expected�incomes�to�GDP�per�capita�rises�to�an�enormous�

l Executive Summary
�
44.5�for�people�with�a�higher�education�background,�way�beyond�what�was�found�in�other�countries�(see�figure�13).��Figure 13: Mean Income by Education Level in Relation to GDP Per Capita
Education level
0
5
10
15
20
25
30
35
40
45
50
No school Primary Lowersecondary
Uppersecondary
TEVET Tertiary
Mali 2004
Mauritania 2004
Benin 2006
Burkina 2003
Congo, Rep. of 2005
Malawi 2004
Per
cent
�Source:�World�Bank�database.��
The� rates� of� return� (ROR)� to� education� in�Malawi� are�very�high,� in�particular� at�higher�education�levels,�which�reflect�Malawi’s�low�overall�access�to�education.�Private�ROR�of�54�percent�for�TEVET�and�171�percent�for�higher�education�also�indicate�severe�shortages� of� skilled� and� highly� educated� human� resources,� demonstrating� the�country’s�urgent�need�to�ensure�greater�access�rates�to�stimulate�growth.��
A�comparison�between�social�and�private�ROR�at�different�education�levels�again�reflects� the� high� public� subsidization� for� higher� education,� although� the� benefits� are�mainly�private.��Some� indications� exist� regarding� skill� demands�but� there� is� a� need� for� additional�surveys.��
Recently,�only�the�TEVETA�Labour�Market�Survey�(JIMAT,�2008)�tried�to�identify�skill� demands� in� more� concrete� terms.� According� to� JIMAT,� which� focused� on�occupational�areas�for�which�formal�TEVET�programs�exist,�unmet�training�needs�are�significant�in�advanced�mechanics,�welding�and�fabrication,�general�fitting,�electronics,�administration,� building,� calibration� equipment,� computer� knowledge,� machine�maintenance,�plant�operators,�steel�fixing,�advanced�molding,�and�fire�drill�evacuation.��
A� lack� of� practical� skills� was� recorded� as� a� key� weakness� by� the� majority� of�companies.�JIMAT�also�found�that�on�average�across�occupational�fields,�the�demand�
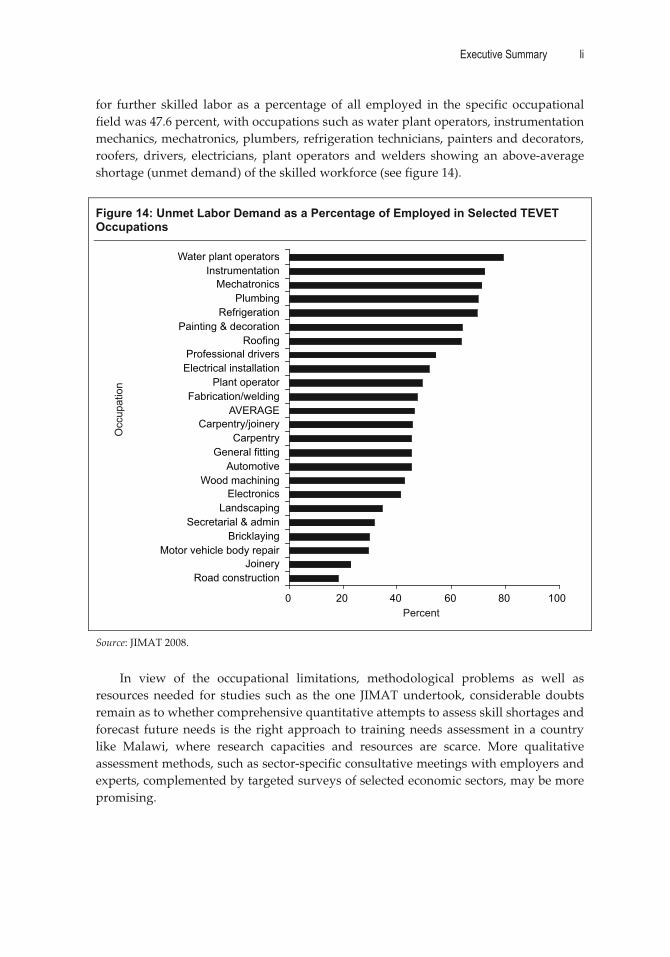
Executive Summary li
�
for� further� skilled� labor� as� a� percentage� of� all� employed� in� the� specific� occupational�field�was�47.6�percent,�with�occupations�such�as�water�plant�operators,�instrumentation�mechanics,�mechatronics,�plumbers,�refrigeration�technicians,�painters�and�decorators,�roofers,� drivers,� electricians,� plant� operators� and�welders� showing� an� above�average�shortage�(unmet�demand)�of�the�skilled�workforce�(see�figure�14).��
Figure 14: Unmet Labor Demand as a Percentage of Employed in Selected TEVET Occupations
0 20 40 60 80 100
Road constructionJoinery
Motor vehicle body repairBricklaying
Secretarial & adminLandscaping
ElectronicsWood machining
AutomotiveGeneral fitting
CarpentryCarpentry/joinery
AVERAGEFabrication/welding
Plant operatorElectrical installationProfessional drivers
RoofingPainting & decoration
RefrigerationPlumbing
MechatronicsInstrumentation
Water plant operators
Percent
Occ
upat
ion
�
Source:�JIMAT�2008.�
�In� view� of� the� occupational� limitations,� methodological� problems� as� well� as�
resources�needed� for� studies� such� as� the� one� JIMAT�undertook,� considerable�doubts�remain�as�to�whether�comprehensive�quantitative�attempts�to�assess�skill�shortages�and�forecast� future�needs� is� the� right�approach� to� training�needs�assessment� in�a�country�like� Malawi,� where� research� capacities� and� resources� are� scarce.� More� qualitative�assessment�methods,�such�as�sector�specific�consultative�meetings�with�employers�and�experts,�complemented�by�targeted�surveys�of�selected�economic�sectors,�may�be�more�promising.��
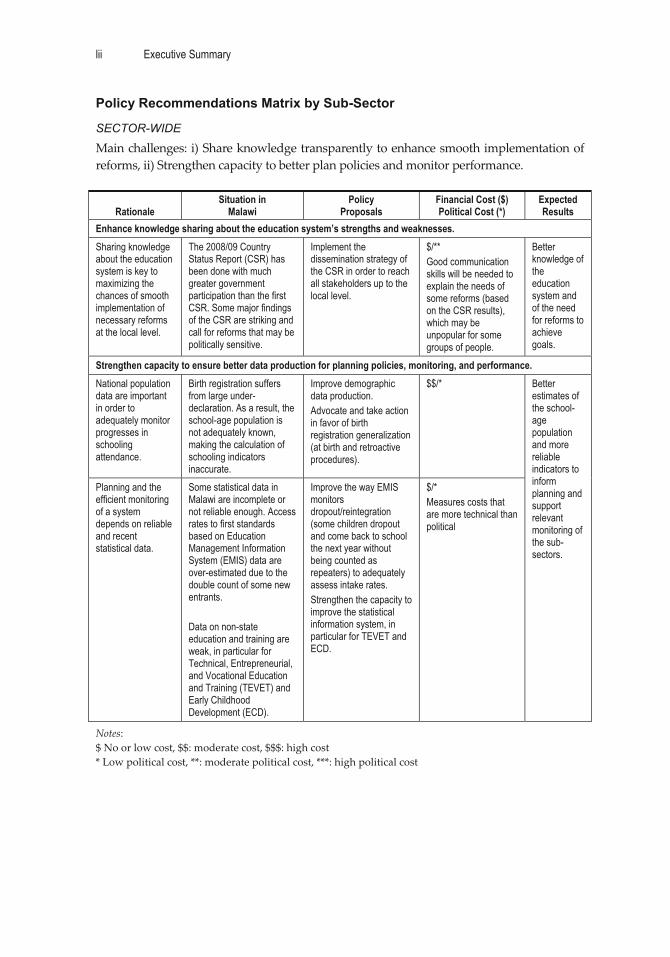
lii Executive Summary
�
Policy Recommendations Matrix by Sub-Sector
SECTOR-WIDE Main�challenges:�i)�Share�knowledge�transparently�to�enhance�smooth�implementation�of�reforms,�ii)�Strengthen�capacity�to�better�plan�policies�and�monitor�performance.���
Rationale Situation in
Malawi Policy
Proposals Financial Cost ($) Political Cost (*)
Expected Results
Enhance knowledge sharing about the education system’s strengths and weaknesses. Sharing knowledge about the education system is key to maximizing the chances of smooth implementation of necessary reforms at the local level.
The 2008/09 Country Status Report (CSR) has been done with much greater government participation than the first CSR. Some major findings of the CSR are striking and call for reforms that may be politically sensitive.
Implement the dissemination strategy of the CSR in order to reach all stakeholders up to the local level.
$/** Good communication skills will be needed to explain the needs of some reforms (based on the CSR results), which may be unpopular for some groups of people.
Better knowledge of the education system and of the need for reforms to achieve goals.
Strengthen capacity to ensure better data production for planning policies, monitoring, and performance. National population data are important in order to adequately monitor progresses in schooling attendance.
Birth registration suffers from large under-declaration. As a result, the school-age population is not adequately known, making the calculation of schooling indicators inaccurate.
Improve demographic data production. Advocate and take action in favor of birth registration generalization (at birth and retroactive procedures).
$$/* Better estimates of the school-age population and more reliable indicators to inform planning and support relevant monitoring of the sub-sectors.
Planning and the efficient monitoring of a system depends on reliable and recent statistical data.
Some statistical data in Malawi are incomplete or not reliable enough. Access rates to first standards based on Education Management Information System (EMIS) data are over-estimated due to the double count of some new entrants. Data on non-state education and training are weak, in particular for Technical, Entrepreneurial, and Vocational Education and Training (TEVET) and Early Childhood Development (ECD).
Improve the way EMIS monitors dropout/reintegration (some children dropout and come back to school the next year without being counted as repeaters) to adequately assess intake rates. Strengthen the capacity to improve the statistical information system, in particular for TEVET and ECD.
$/* Measures costs that are more technical than political
Notes:�$�No�or�low�cost,�$$:�moderate�cost,�$$$:�high�cost�*�Low�political�cost,�**:�moderate�political�cost,�***:�high�political�cost�
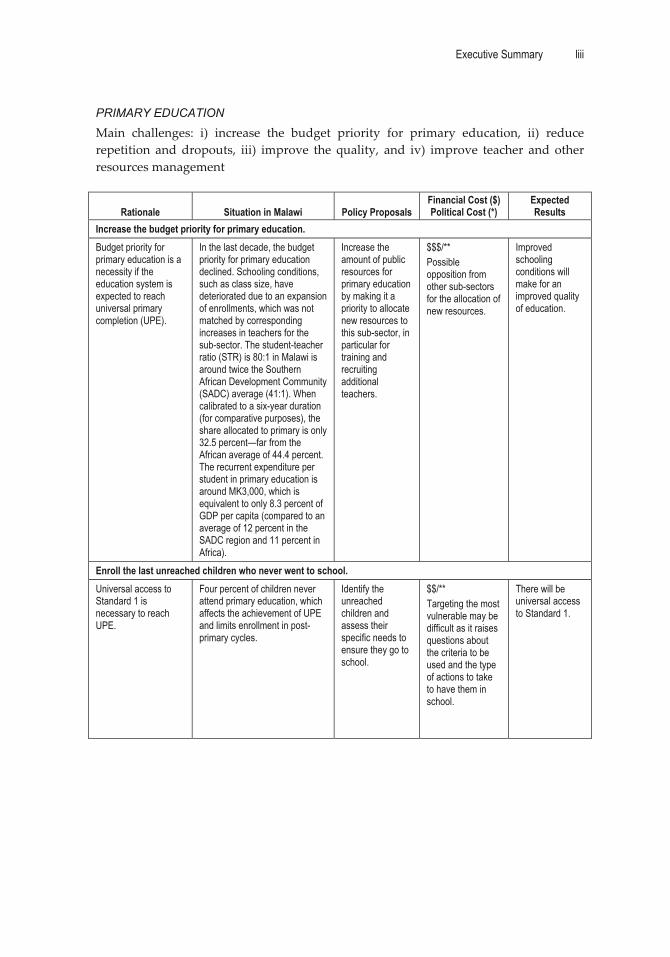
Executive Summary liii
�
PRIMARY EDUCATION
Main� challenges:� i)� increase� the� budget� priority� for� primary� education,� ii)� reduce�repetition� and�dropouts,� iii)� improve� the� quality,� and� iv)� improve� teacher� and� other�resources�management��
Rationale Situation in Malawi Policy Proposals Financial Cost ($) Political Cost (*)
Expected Results
Increase the budget priority for primary education. Budget priority for primary education is a necessity if the education system is expected to reach universal primary completion (UPE).
In the last decade, the budget priority for primary education declined. Schooling conditions, such as class size, have deteriorated due to an expansion of enrollments, which was not matched by corresponding increases in teachers for the sub-sector. The student-teacher ratio (STR) is 80:1 in Malawi is around twice the Southern African Development Community (SADC) average (41:1). When calibrated to a six-year duration (for comparative purposes), the share allocated to primary is only 32.5 percent—far from the African average of 44.4 percent. The recurrent expenditure per student in primary education is around MK3,000, which is equivalent to only 8.3 percent of GDP per capita (compared to an average of 12 percent in the SADC region and 11 percent in Africa).
Increase the amount of public resources for primary education by making it a priority to allocate new resources to this sub-sector, in particular for training and recruiting additional teachers.
$$$/** Possible opposition from other sub-sectors for the allocation of new resources.
Improved schooling conditions will make for an improved quality of education.
Enroll the last unreached children who never went to school. Universal access to Standard 1 is necessary to reach UPE.
Four percent of children never attend primary education, which affects the achievement of UPE and limits enrollment in post-primary cycles.
Identify the unreached children and assess their specific needs to ensure they go to school.
$$/** Targeting the most vulnerable may be difficult as it raises questions about the criteria to be used and the type of actions to take to have them in school.
There will be universal access to Standard 1.

liv Executive Summary
�
Rationale Situation in Malawi Policy Proposals Financial Cost ($) Political Cost (*)
Expected Results
Reduce dropouts within the cycle. UPE requires that all children access and complete the full primary cycle.
Due to very frequent dropouts within the primary cycle, the primary completion rate is only 35 percent. Poor student retention comes from both the supply and demand side. Incomplete schools are still an issue because 13 percent of pupils attend a school that does not provide a continuous educational supply up to Standard 8, making them more likely to dropout if another school does not exist close to their home. Crowded classrooms, open-air, and temporary classrooms also significantly affect retention rates. Economic difficulties and behavior such as early marriage, pregnancy, or family responsibilities are reported as major reasons for dropping out.
Build new classrooms and hire and train new teachers to complete incomplete schools. Enhance school demand among the poorest population (via cash transfers, school meals, and advocacy for the school). Advocate in favor of postponing pregnancies and early marriages
$$$/** Building classrooms is expensive. Targeting the most vulnerable may be difficult as it raises questions about i) the criteria to be used, ii) the type of actions to take to have them in school (e.g., grants/in kind advantages), and iii) the type of monitoring mechanism to be put in place. Some resistance may arise concerning issues related to early marriages and pregnancies.
The completion rate will be improved.
Reduce repetition rate. A rate of repetition that is too high negatively affects educational outcomes and costs.
Repetition rates have increased over the 1999–2006 period to reach 20 percent in primary education—a level that is the highest in the region. Evidence, at national and international level, shows that high repetition rates do not favor a better mastery of school subjects, have adverse effects on STR, and increase dropouts and costs. An estimated MK1.97 billion is used annually to deliver primary education services to repeaters.
Reorganize the primary cycle into sub-cycles (Std1-Std2, Std3-Std4, Std5-Std6), within which repetition would not be allowed. Sensitize/train school participants (e.g., head teachers, teachers, parents, inspectors) on the real impact and cost of repetition.
$/** Possible resistance from some parents and teachers who may believe that repetition has a positive effect on learning outcomes.
Repetition will decrease, the completion rate will improve, and the use of public expenditures will be more efficient.
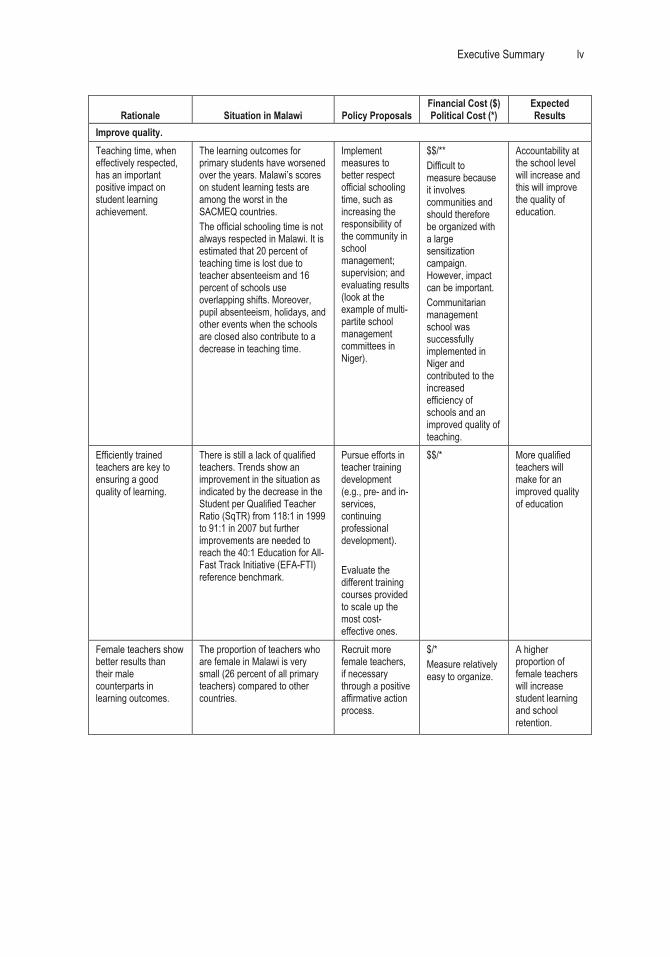
Executive Summary lv
�
Rationale Situation in Malawi Policy Proposals Financial Cost ($) Political Cost (*)
Expected Results
Improve quality. Teaching time, when effectively respected, has an important positive impact on student learning achievement.
The learning outcomes for primary students have worsened over the years. Malawi’s scores on student learning tests are among the worst in the SACMEQ countries. The official schooling time is not always respected in Malawi. It is estimated that 20 percent of teaching time is lost due to teacher absenteeism and 16 percent of schools use overlapping shifts. Moreover, pupil absenteeism, holidays, and other events when the schools are closed also contribute to a decrease in teaching time.
Implement measures to better respect official schooling time, such as increasing the responsibility of the community in school management; supervision; and evaluating results (look at the example of multi-partite school management committees in Niger).
$$/** Difficult to measure because it involves communities and should therefore be organized with a large sensitization campaign. However, impact can be important. Communitarian management school was successfully implemented in Niger and contributed to the increased efficiency of schools and an improved quality of teaching.
Accountability at the school level will increase and this will improve the quality of education.
Efficiently trained teachers are key to ensuring a good quality of learning.
There is still a lack of qualified teachers. Trends show an improvement in the situation as indicated by the decrease in the Student per Qualified Teacher Ratio (SqTR) from 118:1 in 1999 to 91:1 in 2007 but further improvements are needed to reach the 40:1 Education for All-Fast Track Initiative (EFA-FTI) reference benchmark.
Pursue efforts in teacher training development (e.g., pre- and in-services, continuing professional development). Evaluate the different training courses provided to scale up the most cost-effective ones.
$$/* More qualified teachers will make for an improved quality of education
Female teachers show better results than their male counterparts in learning outcomes.
The proportion of teachers who are female in Malawi is very small (26 percent of all primary teachers) compared to other countries.
Recruit more female teachers, if necessary through a positive affirmative action process.
$/* Measure relatively easy to organize.
A higher proportion of female teachers will increase student learning and school retention.
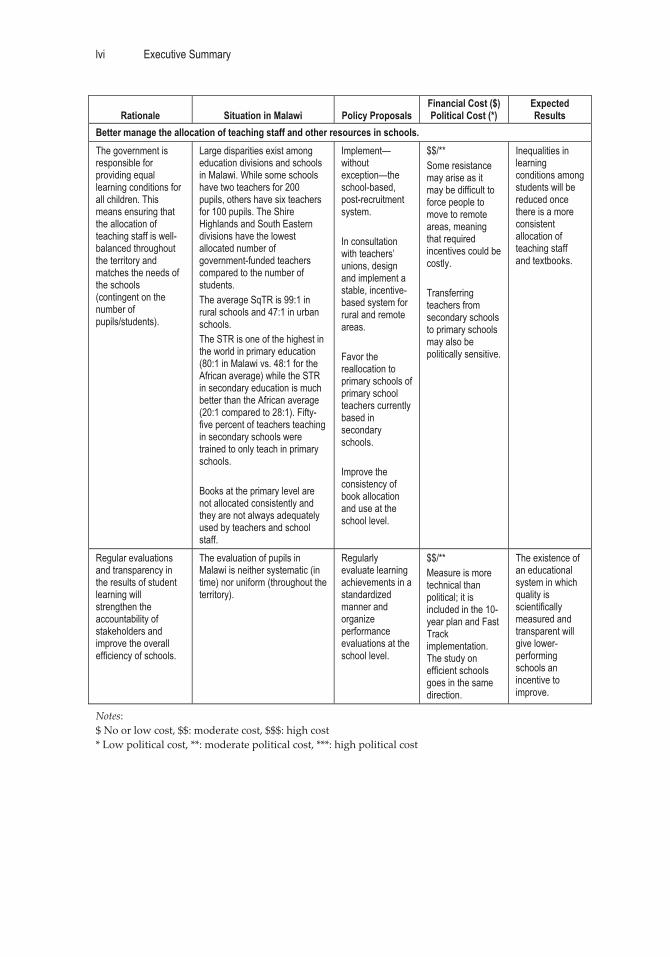
lvi Executive Summary
�
Rationale Situation in Malawi Policy Proposals Financial Cost ($) Political Cost (*)
Expected Results
Better manage the allocation of teaching staff and other resources in schools. The government is responsible for providing equal learning conditions for all children. This means ensuring that the allocation of teaching staff is well-balanced throughout the territory and matches the needs of the schools (contingent on the number of pupils/students).
Large disparities exist among education divisions and schools in Malawi. While some schools have two teachers for 200 pupils, others have six teachers for 100 pupils. The Shire Highlands and South Eastern divisions have the lowest allocated number of government-funded teachers compared to the number of students. The average SqTR is 99:1 in rural schools and 47:1 in urban schools. The STR is one of the highest in the world in primary education (80:1 in Malawi vs. 48:1 for the African average) while the STR in secondary education is much better than the African average (20:1 compared to 28:1). Fifty-five percent of teachers teaching in secondary schools were trained to only teach in primary schools. Books at the primary level are not allocated consistently and they are not always adequately used by teachers and school staff.
Implement—without exception—the school-based, post-recruitment system. In consultation with teachers’ unions, design and implement a stable, incentive-based system for rural and remote areas. Favor the reallocation to primary schools of primary school teachers currently based in secondary schools. Improve the consistency of book allocation and use at the school level.
$$/** Some resistance may arise as it may be difficult to force people to move to remote areas, meaning that required incentives could be costly. Transferring teachers from secondary schools to primary schools may also be politically sensitive.
Inequalities in learning conditions among students will be reduced once there is a more consistent allocation of teaching staff and textbooks.
Regular evaluations and transparency in the results of student learning will strengthen the accountability of stakeholders and improve the overall efficiency of schools.
The evaluation of pupils in Malawi is neither systematic (in time) nor uniform (throughout the territory).
Regularly evaluate learning achievements in a standardized manner and organize performance evaluations at the school level.
$$/** Measure is more technical than political; it is included in the 10-year plan and Fast Track implementation. The study on efficient schools goes in the same direction.
The existence of an educational system in which quality is scientifically measured and transparent will give lower-performing schools an incentive to improve.
Notes:�$�No�or�low�cost,�$$:�moderate�cost,�$$$:�high�cost�*�Low�political�cost,�**:�moderate�political�cost,�***:�high�political�cost��

Executive Summary lvii
�
SECONDARY EDUCATION
Main�challenges:�i)�Improve�the�equity�in�learning�conditions,�ii)�improve�quality,�and�iii)�increase�efficiency.���
Rationale Situation in Malawi Policy Proposals Financial Cost ($) Political Cost (*)
Expected Results
Development of a better quality, more equitable and efficient secondary education. Providing equal learning conditions for all secondary students is very important in increasing equity.
The allocation of other recurrent transactions (ORT) to secondary schools is very weakly related to the number of students. Community Day Secondary Schools (CDSSs) are systematically less well endowed (in teachers and in ORT per student) than are Conventional Secondary Schools (CSSs).
Ensure more equitable teachers and resource allocation among secondary schools and in particular between CSSs and CDSSs (revise the allocation formula of ORT to include school environment and hardship).
$/** Some resistance may arise because it may be difficult to force teachers to move from CSSs to CDSSs.
Inequalities in learning conditions among students will be reduced.
Economies of scale are possible in secondary education to improve efficiency
The average school size in secondary schools is very low (212 students in secondary vs. 642 students in primary education). Economies of scale savings are possible by favoring bigger secondary schools (of more than 150 students).
Build new classrooms and deploy new teachers with priority given to the smallest secondary schools (in areas with a population density large enough to attract a sufficient amount of students).
$$$/* In the short-term, building new classrooms will be very costly, but mid-term it saves resources because a more efficient service delivery comes from economies of scale.
Secondary education service delivery will be more efficient.
Textbooks are vital to ensuring a good quality education. Labs in secondary school are very important to enhance effective learning in science.
All other things being equal, textbooks and labs are associated with better exam pass rates. The average number of textbooks per student is 3.7, but some schools have no textbooks at all. Only 23 percent of secondary schools have a lab.
Increase the number of textbooks and labs in secondary schools.
$$/* Textbooks are not expensive. Labs are more costly.
The quality of learning will be increased.
The knowledge economy requires better human capital skills, particularly in scientific and technological fields.
There is a dramatic lack of secondary teachers in the sciences.
Pursue the program called Strengthening Mathematics and Science in Secondary Education (SMASSE).
$$/* Measure already implemented. This was tested from 2004–2007 in the South Eastern education division. This is now being rolled out to the remaining divisions.
A higher quality general secondary education will emerge, more in line with the needs of the modern economy
Notes:�$�No�or�low�cost,�$$:�moderate�cost,�$$$:�high�cost�*�Low�political�cost,�**:�moderate�political�cost,�***:�high�political�cost�

lviii Executive Summary
�
Technical, Entrepreneurial, and Vocational Education and Training (TEVET)
Main� challenges:� i)� Improve� flexibility,� coordination� and� clarify� roles,� ii)� increase�access,� in� particular� for� training� focused� on� the� informal� job� sector,� iii)� increase�efficiency�by�revising�the�duration�of�the�longest�programs.��
Rationale Situation in Malawi Policy Proposals Financial Cost ($) Political Cost (*)
Expected Results
Development of a more coordinated and flexible TEVET.
A stringent and transparent TEVET qualification system provides the base for the testing and quality assurance of the TEVET programs, and quality benchmarks for TEVET providers. In order to ensure labor market responsiveness, qualification systems are usually built as outcome-based systems, founded on occupational standards that are set by experts from the world of work.
In Malawi, three parallel qualification systems currently co-exist—trade testing, Malawi (Advanced) Craft, and the TEVET Authority /Competency-Based Education and Training (TEVETA/CBET)—which all maintain their own assessment and certification structures. This is unnecessarily costly for students and government and hampers quality improvements at the school level. Two of the qualification systems can be considered outcome-based, however only the TEVETA/CBET approach is based on the updated demands of today’s market. The CBET approach developed and administered by TEVETA was initiated in the late 1990s to overcome the parallel qualification structure of Malawi (Advanced) Craft and trade testing. Instead, a third parallel qualification system has now been introduced in practice.
TEVETA, the Ministry of Education, Science, and Technology, and the Ministry of Labour agree on an approach to integrate all formal TEVET and the trade testing system under the TEVETA/ CBET system to become the one and only national benchmark of recognized TEVET provision in Malawi.
$/ * Integration might affect vested interests in different ministries to maintain existing structures. Substantial financial gains can be expected from integration, as no parallel structures would need to be maintained. However, a universal orientation towards CBET qualifications will increase quality assurance costs by TEVETA for standard setting, certification, and accreditation.
There will be one recognized outcome-based TEVET qualification system based on occupational standards developed by experts from the world of work, applicable to all TEVET provisions, and in line with SADC standards. An indirect result will be an improved quality of training and a more well-trained Malawian workforce.

Executive Summary lix
�
Rationale Situation in Malawi Policy Proposals Financial Cost ($) Political Cost (*)
Expected Results
Due to its provider and program diversity and multi-stakeholder nature, TEVET systems require an integrative and conducive governance structure. Such a structure would ensure effective stakeholder involvement, the articulation of different provider systems, and broad-based coverage of accepted quality assurance mechanisms. In many countries, this is reflected by the emergence of more or less independent, stakeholder-governed TEVET regulatory bodies in charge of regulation, facilitation, and quality assurance, while training provision and delivery remains with a variety of different actors in accordance with the needs of specific target groups.
The TEVET Policy of 1998 and the TEVET Act of 1999 assigned the regulatory and policy-making authority for the broad TEVET system to the newly created TEVET Authority (TEVETA). Stakeholder involvement is inter alia facilitated through the TEVET Board. However, TEVETA’s role does not appear to be unanimously accepted by all major ministerial stakeholders, as is shown in the parallel initiatives of standard and curriculum development and examination regulations. This lack of clarity about roles and responsibilities in the national TEVET system reinforces existing obstacles to the development of an integrated and labor-market driven TEVET system. It particularly affects training quality in a negative way as scarce resources available at the TEVET institution level are used to accommodate the different requirements, procedures, and standards of various authorities with regulatory functions.
Facilitate a clarification of roles and responsibilities in the national TEVET system, confirm or adjust existing policies and legal documents as needed, and ensure subsequent implementation.
$ ** Financial savings expected through avoidance of parallel development activities, such as standard and curriculum development. Considerable opposition can be expected against an institutional reform that may reduce the scope of responsibility of existing institutions.
There will be a functioning TEVET authority with broad responsibilities for the regulation, standard development, and quality assurance of the entire public and private TEVET provision.
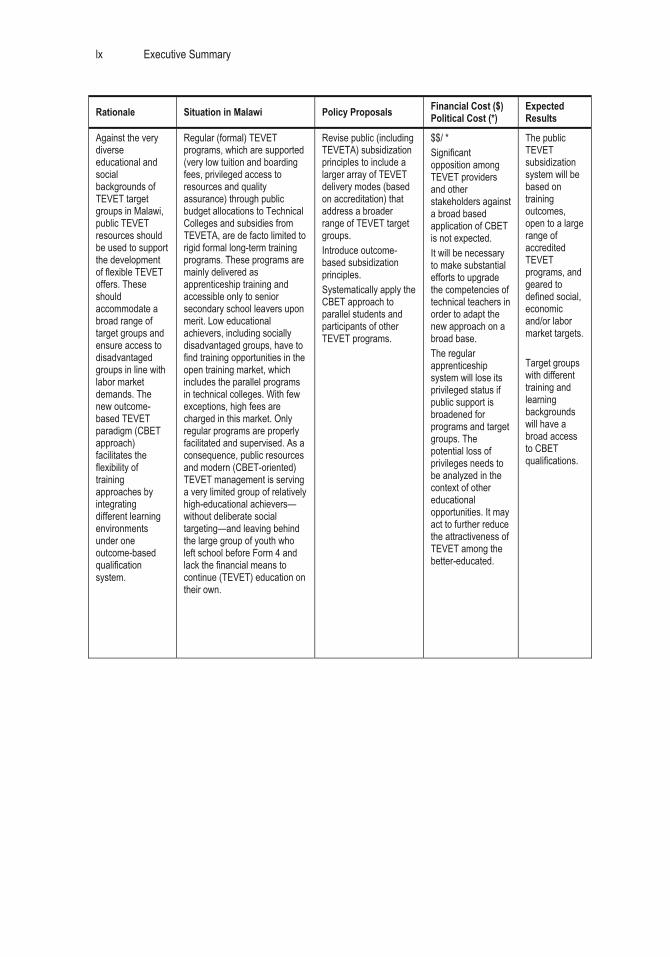
lx Executive Summary
�
Rationale Situation in Malawi Policy Proposals Financial Cost ($) Political Cost (*)
Expected Results
Against the very diverse educational and social backgrounds of TEVET target groups in Malawi, public TEVET resources should be used to support the development of flexible TEVET offers. These should accommodate a broad range of target groups and ensure access to disadvantaged groups in line with labor market demands. The new outcome-based TEVET paradigm (CBET approach) facilitates the flexibility of training approaches by integrating different learning environments under one outcome-based qualification system.
Regular (formal) TEVET programs, which are supported (very low tuition and boarding fees, privileged access to resources and quality assurance) through public budget allocations to Technical Colleges and subsidies from TEVETA, are de facto limited to rigid formal long-term training programs. These programs are mainly delivered as apprenticeship training and accessible only to senior secondary school leavers upon merit. Low educational achievers, including socially disadvantaged groups, have to find training opportunities in the open training market, which includes the parallel programs in technical colleges. With few exceptions, high fees are charged in this market. Only regular programs are properly facilitated and supervised. As a consequence, public resources and modern (CBET-oriented) TEVET management is serving a very limited group of relatively high-educational achievers—without deliberate social targeting—and leaving behind the large group of youth who left school before Form 4 and lack the financial means to continue (TEVET) education on their own.
Revise public (including TEVETA) subsidization principles to include a larger array of TEVET delivery modes (based on accreditation) that address a broader range of TEVET target groups. Introduce outcome-based subsidization principles. Systematically apply the CBET approach to parallel students and participants of other TEVET programs.
$$/ * Significant opposition among TEVET providers and other stakeholders against a broad based application of CBET is not expected. It will be necessary to make substantial efforts to upgrade the competencies of technical teachers in order to adapt the new approach on a broad base. The regular apprenticeship system will lose its privileged status if public support is broadened for programs and target groups. The potential loss of privileges needs to be analyzed in the context of other educational opportunities. It may act to further reduce the attractiveness of TEVET among the better-educated.
The public TEVET subsidization system will be based on training outcomes, open to a large range of accredited TEVET programs, and geared to defined social, economic and/or labor market targets. Target groups with different training and learning backgrounds will have a broad access to CBET qualifications.

Executive Summary lxi
�
Rationale Situation in Malawi Policy Proposals Financial Cost ($) Political Cost (*)
Expected Results
The informal sector is an important employment destination mainly for TEVET graduates in Malawi. Labor-market responsive TEVET offers and delivery modes have to take the sector’s special requirements into account. An integration of trade testing with the CBET qualification system would provide an important avenue for skills improvement and modernization in the informal sector.
Recent research (tracer studies) have demonstrated that the informal sector is not only an important target labor market for TEVET graduates in terms of numbers absorbed, but also a rather attractive destination as incomes tend to be relatively high. The formal TEVET system, however, is still largely oriented on formal sector needs. For example, informal entrepreneurs are not targeted as cooperation partners in the formal apprenticeship training. The trade testing system is accessible and presents the most important avenue to formal skills certification for informal sector operators and traditional apprentices. However, the system’s standards are outdated.
Systematically incorporate the informal sector into TEVET as a target employment destination (with special modules oriented towards work in the informal sector); as apprenticeship providers (including in the formal apprenticeship system); and as a partner in TEVET planning (including labor market assessments). Revive previous activities to strengthen traditional apprenticeship training in order to increase quality and enrollment. Integrate trade testing with the CBET qualification system.
$/ * There is a substantial history of TEVETA working with and for informal sector operators on which to build. Current informal sector activities by TEVETA need to be extended and approaches mainstreamed in the TEVET system. Some resistance expected among TEVET stakeholders to systematically integrating informal sector operators into formal training.
TEVET programs will be more responsive to the needs and conditions of the informal sector labor market. The quality and relevance of the TEVET provided in the informal sector will be increased.
A flexible TEVET system of delivery modes and program duration ensures better targeting to specific competence and qualification requirements. in the labor market. A flexibilization, which may lead to shortened average training durations, increased cost effectiveness of the TEVET system.
The TEVET tracer study showed that no correlations exist between the duration of training and expected incomes. This means that graduates of four-year apprenticeship programs are not significantly better remunerated than graduates from shorter TEVET programs, suggesting that the market is not honoring the long-training duration that is common in the formal TEVET system.
Reconsider the predominance of four-year programs in the formal TEVET system in accordance with labor market needs for specific occupational areas. Provide incentives for flexible TEVET provision.
$/** The four-year apprenticeship system has a long tradition in Malawi as the heart of formal TEVET. The system is getting more flexible with the introduction of the modular CBET programs.
Will provide flexible TEVET programs that are in line with labor market needs. Will engender the increased cost-effectiveness of TEVET and a larger enrollment (through lower unit cost via shortened duration).
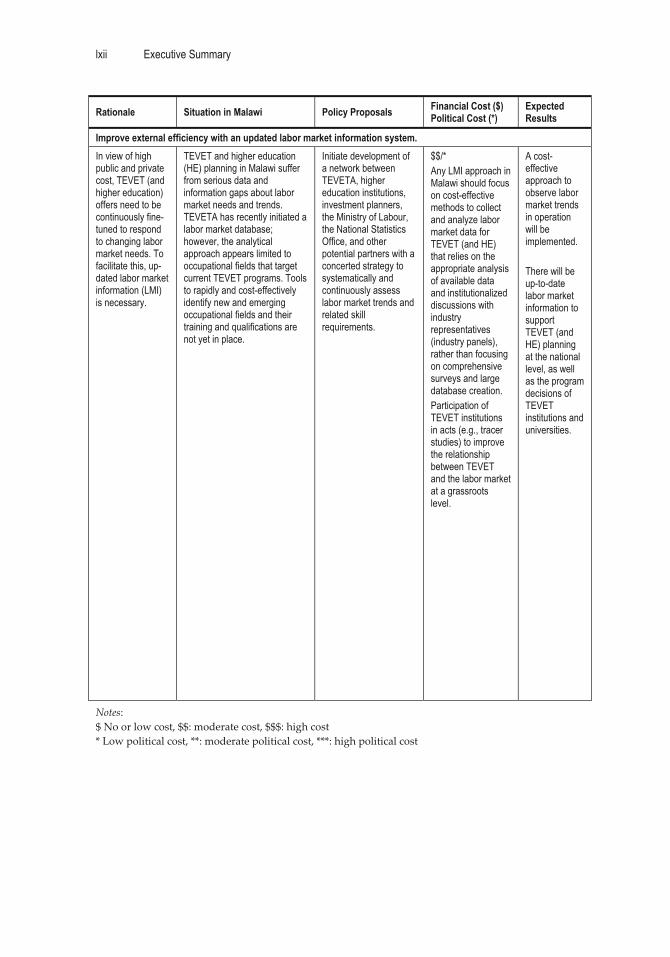
lxii Executive Summary
�
Rationale Situation in Malawi Policy Proposals Financial Cost ($) Political Cost (*)
Expected Results
Improve external efficiency with an updated labor market information system. In view of high public and private cost, TEVET (and higher education) offers need to be continuously fine-tuned to respond to changing labor market needs. To facilitate this, up-dated labor market information (LMI) is necessary.
TEVET and higher education (HE) planning in Malawi suffer from serious data and information gaps about labor market needs and trends. TEVETA has recently initiated a labor market database; however, the analytical approach appears limited to occupational fields that target current TEVET programs. Tools to rapidly and cost-effectively identify new and emerging occupational fields and their training and qualifications are not yet in place.
Initiate development of a network between TEVETA, higher education institutions, investment planners, the Ministry of Labour, the National Statistics Office, and other potential partners with a concerted strategy to systematically and continuously assess labor market trends and related skill requirements.
$$/* Any LMI approach in Malawi should focus on cost-effective methods to collect and analyze labor market data for TEVET (and HE) that relies on the appropriate analysis of available data and institutionalized discussions with industry representatives (industry panels), rather than focusing on comprehensive surveys and large database creation. Participation of TEVET institutions in acts (e.g., tracer studies) to improve the relationship between TEVET and the labor market at a grassroots level.
A cost-effective approach to observe labor market trends in operation will be implemented. There will be up-to-date labor market information to support TEVET (and HE) planning at the national level, as well as the program decisions of TEVET institutions and universities.
Notes:�$�No�or�low�cost,�$$:�moderate�cost,�$$$:�high�cost�*�Low�political�cost,�**:�moderate�political�cost,�***:�high�political�cost�
�
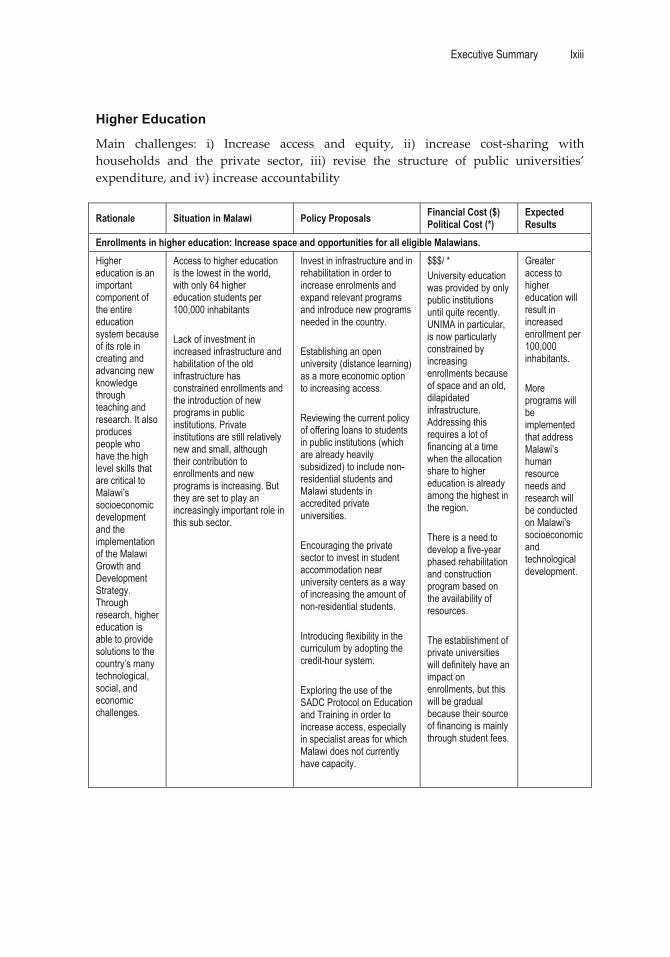
Executive Summary lxiii
�
Higher Education
Main� challenges:� i)� Increase� access� and� equity,� ii)� increase� cost�sharing� with�households� and� the� private� sector,� iii)� revise� the� structure� of� public� universities’�expenditure,�and�iv)�increase�accountability��
Rationale Situation in Malawi Policy Proposals Financial Cost ($) Political Cost (*)
Expected Results
Enrollments in higher education: Increase space and opportunities for all eligible Malawians. Higher education is an important component of the entire education system because of its role in creating and advancing new knowledge through teaching and research. It also produces people who have the high level skills that are critical to Malawi’s socioeconomic development and the implementation of the Malawi Growth and Development Strategy. Through research, higher education is able to provide solutions to the country’s many technological, social, and economic challenges.
Access to higher education is the lowest in the world, with only 64 higher education students per 100,000 inhabitants Lack of investment in increased infrastructure and habilitation of the old infrastructure has constrained enrollments and the introduction of new programs in public institutions. Private institutions are still relatively new and small, although their contribution to enrollments and new programs is increasing. But they are set to play an increasingly important role in this sub sector.
Invest in infrastructure and in rehabilitation in order to increase enrolments and expand relevant programs and introduce new programs needed in the country. Establishing an open university (distance learning) as a more economic option to increasing access. Reviewing the current policy of offering loans to students in public institutions (which are already heavily subsidized) to include non-residential students and Malawi students in accredited private universities. Encouraging the private sector to invest in student accommodation near university centers as a way of increasing the amount of non-residential students. Introducing flexibility in the curriculum by adopting the credit-hour system. Exploring the use of the SADC Protocol on Education and Training in order to increase access, especially in specialist areas for which Malawi does not currently have capacity.
$$$/ * University education was provided by only public institutions until quite recently. UNIMA in particular, is now particularly constrained by increasing enrollments because of space and an old, dilapidated infrastructure. Addressing this requires a lot of financing at a time when the allocation share to higher education is already among the highest in the region. There is a need to develop a five-year phased rehabilitation and construction program based on the availability of resources. The establishment of private universities will definitely have an impact on enrollments, but this will be gradual because their source of financing is mainly through student fees.
Greater access to higher education will result in increased enrollment per 100,000 inhabitants. More programs will be implemented that address Malawi’s human resource needs and research will be conducted on Malawi’s socioeconomic and technological development.
�

lxiv Executive Summary
�
������
Rationale Situation in Malawi Policy Proposals Financial Cost ($) Political Cost (*)
Expected Results
Reduce disparities at both the gender and the socioeconomic level and take people with disabilities into account. Issues of equity are important for social, political, and economic stability. The Millennium Development Goals place great emphasis on equity issues, particularly in relation to gender. Malawi is signatory to many international and regional conventions that require equity issues to be addressed so that all citizens have opportunities to develop themselves and actively participate in national development.
Gender disparities are huge in spite of affirmative action at UNIMA. The situation is particularly bad in science, engineering, and ICT. Over 90 percent of the students enrolled in higher education come from the wealthiest quintile. Regular students are heavily subsidized while non-residential students are not aided. Few institutions have facilities for students with physical handicaps.
Provide bridging courses to upgrade females to the required entry levels, especially for the targeted fields of science and engineering. Provide grants to girls in these targeted areas and explore the possibility of private-sector involvement in such a scheme. Increase bed-space for female students and prioritize accommodations for females in non-residential programs. Increase the enrollment of low-income students by addressing the shortcomings of the Student Loan Trust to ensure that it benefits the needy from low-income families, and by implementing a means-test on loan applications. Provide facilities for physically disabled students in the institutions.
$$/ * Providing grants and expanding access to the Student Loan Trust will require moderate additional funding, but with good management and efficient recovery methods, the long-term cost will be small compared to the benefits to be derived. Introducing equity measures can only have positive political advantages.
An equitable higher education system will be in place, allowing all Malawians to have an equal opportunity to develop to their fullest potential. This would benefit the socioeconomic development of the country and aid in the alleviation of poverty.
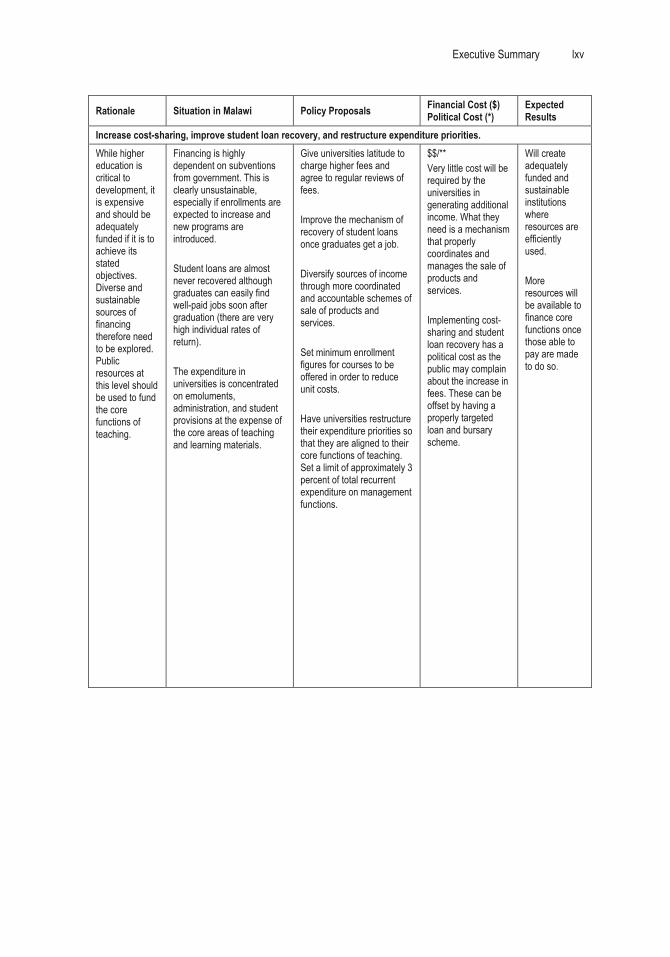
Executive Summary lxv
�
Rationale Situation in Malawi Policy Proposals Financial Cost ($) Political Cost (*)
Expected Results
Increase cost-sharing, improve student loan recovery, and restructure expenditure priorities. While higher education is critical to development, it is expensive and should be adequately funded if it is to achieve its stated objectives. Diverse and sustainable sources of financing therefore need to be explored. Public resources at this level should be used to fund the core functions of teaching.
Financing is highly dependent on subventions from government. This is clearly unsustainable, especially if enrollments are expected to increase and new programs are introduced. Student loans are almost never recovered although graduates can easily find well-paid jobs soon after graduation (there are very high individual rates of return). The expenditure in universities is concentrated on emoluments, administration, and student provisions at the expense of the core areas of teaching and learning materials.
Give universities latitude to charge higher fees and agree to regular reviews of fees. Improve the mechanism of recovery of student loans once graduates get a job. Diversify sources of income through more coordinated and accountable schemes of sale of products and services. Set minimum enrollment figures for courses to be offered in order to reduce unit costs. Have universities restructure their expenditure priorities so that they are aligned to their core functions of teaching. Set a limit of approximately 3 percent of total recurrent expenditure on management functions.
$$/** Very little cost will be required by the universities in generating additional income. What they need is a mechanism that properly coordinates and manages the sale of products and services. Implementing cost-sharing and student loan recovery has a political cost as the public may complain about the increase in fees. These can be offset by having a properly targeted loan and bursary scheme.
Will create adequately funded and sustainable institutions where resources are efficiently used. More resources will be available to finance core functions once those able to pay are made to do so.

lxvi Executive Summary
�
Rationale Situation in Malawi Policy Proposals Financial Cost ($) Political Cost (*)
Expected Results
Make management of public institutions more accountable and more focused on reducing inefficiencies. Good management is critical to the efficiency of any organization. The autonomy of higher education institutions is also critical to their success. Autonomy, however, also comes with accountability—especially in institutions that are heavily dependent on public resources. Good management and good decision making should be backed by current and reliable data and information about the institution.
Public universities are quite autonomous and the decentralization of management functions from the University Office of UNIMA to the UNIMA constituent colleges is underway. However, guidelines for implementing the decentralization were not developed and this has created problems in a number of areas. Staff management and the allocation of staff have led to inefficiencies that resulted in very low student-lecturer ratios and extremely high unit costs. Institutions have not established robust management information systems, and as a result data and information on many aspects of the universities are not readily available. Institutions also lack performance indicators against which they can measure their performance and make themselves accountable for the resources entrusted to them.
Review university structure and governing bodies to determine whether there are financial and administrative advantages that can accrue from converting the UNIMA colleges into fully-fledged independent universities, in view of the decentralization that is already taking place. Expedite the passage of the Higher Education Act and the establishment of the National Council for Higher Education (NCHE). This is critical for maintaining standards and quality in higher education institutions. University councils should create guidelines for the roles and responsibilities of all stakeholders in the higher education sector and for the ongoing decentralization process at UNIMA colleges. Set up a monitoring and evaluation mechanism to assess the achievement of outsourcing objectives. Ensure that universities have accountability mechanisms based on good Management Information Systems and key outcome indicators to periodically assess their performance and support policy-decision making.
$/* The policy options proposed are not costly as they require some reorganization of resources that are already available. Converting UNIMA colleges into free-standing universities may have some political cost due to resistance but this can be overcome if there are benefits to be accrued, given that the decentralization process is already underway. Some resources may be needed for setting up Management Information Systems and training personnel in their use, but cost is low.
Will provide for a well-managed, effective, and efficient higher education system, accountable for its mandate to the public and consumers of the system. Information on operations and functions of the universities will be easily available and used for policy-decision making.
Notes:�$�No�or�low�cost,�$$:�moderate�cost,�$$$:�high�cost�*�Low�political�cost,�**:�moderate�political�cost,�***:�high�political�cost���
Executive Summary lxvii
�
Notes�1�The�assumption�used�is�that�repetition�rate�will�stay�constant�between�2008�and�2018;�20�percent�of�the�students�would�be�repeaters.�2�This�figure�includes�all�education�expenditures�from�the�Ministry�of�Education�(MOE)�and�all�other�ministries�outside�of�MOE.�3� For� cross�country� comparisons,� the� usual� assumption� is� to� estimate� that� 20� percent� of� global�budget�support�goes�to�the�education�sector�(that�is,�the�average�share�for�education�in�recurrent�budgets�in�SSA�countries).�4�This�refers�to�the�percentage�of�females�passing�against�the�number�of�females�who�entered�the�examination.��

lxviii

1
CHAPTER �1 �
Demographics,�Social�Development,�and�
Macroeconomic�Conditions�
Summary of the Chapter
The�Malawian�education�system�has�to�develop�within�a�heavier�demographic�context�than� those� of� its� neighboring� countries.� The� country’s� population,� estimated� at� 13�million�people�in�2008,�is�increasing�at�the�rate�of�2.4�percent�per�year.�The�5�to�16�year�old� age� group� represents� 37� percent� of� the� total� population,� which� is� the� highest�proportion�of�this�age�group�in�the�entire�Southern�African�Development�Community�(SADC)� region.� The� population� growth� rate� is� estimated� to� decrease� slowly,� but� the�primary�school�age�group�(6�to�13�year�olds)�will�increase�by�20�percent�between�now�and� 2018.� If� universal� primary� completion� is� reached� before� 2018,� primary� school�places� for� 4.8�million� children1�will� be� needed� in� 2018.� This� represents� a� 45� percent�increase�from�2008.�
The� large�majority� of� the� population� (82� percent)� still� lives� in� rural� areas�where�school�supply�and�demand�are�weaker.�Sixty�three�percent�of�Malawians� live�on� less�than�US$2�a�day.�Malawi�has�the�highest�rate�of�malnutrition�in�the�SADC�region�and�an� overwhelming� 44� percent� of� preschoolers� have� stunted� growth.� There� are� an�estimated�122�children�per�1,000�who�die�before�the�age�of�five,�which�is�similar�to�the�SADC�average.�The�adult�(15�years�and�older)�literacy�rate�is�estimated�to�be�69�percent�in�Malawi,�which� is� lower� than� the� SADC� average� (75� percent).� Illiteracy� of� parents�impedes� the�achievement�of� education� for�all�because� these�parents� are� less� likely� to�enroll�their�children�in�school�than�literate�parents.�
The�HIV/AIDS� pandemic� dramatically� affects� the� development� of� the� education�sector�because�of�the�deaths�of�both�teachers�and�parents.�The�pandemic�also�increases�teachers’�absenteeism�and�the�number�of�orphans,�who�are� less� likely�to�go�to�school�than�children�with�families.�The�adult�(15–49�years�old)�prevalence�rate�is�12�percent,�whereas�children�orphaned�by�AIDS�represent�7�percent�of�the�children�under�17�years�of�age�(in�addition�to�the�5�percent�of�children�orphaned�by�other�reasons).�HIV/AIDS�occurrences�are�highest�in�the�Southern�region�and�are�concentrated�in�urban�areas.�
Malawi’s� economy� has� been� growing� steadily� since� 2005,� mainly� due� to� recent�sound� economic� policies� and� favorable� weather� conditions� for� agriculture.� The�continual�increase�in�economic�growth�has�allowed�Malawi�to�reach�a�GDP�per�capita�

2 World Bank Working Paper
�
of�around�US$300�million� in�2008.� In�comparison� to� the�entire�SADC�region,�Malawi�still� has� the� third� lowest�GDP�per� capita� and� one� of� the� five� lowest� in� all� of�Africa.�However,�with� the� government’s� increased� emphasis� on� value� addition� on�domestic�products,�coupled�with�the�discovery�and�mining�of�uranium,�there�is�the�prospect�of�improved�GDP�levels.��
Compared� to� countries� with� a� comparable� level� of� economic� development,�Malawi’s�performance�is�very�satisfactory�for�mobilization�of�public�revenue.�The�rate�of� domestic� revenue� as� a� proportion� of� GDP� is� higher� in� Malawi� than� the� average�observed� in� low�income,� non�oil� producing� African� countries� (19� compared� to� 17�percent).� Thus,� while� reducing� the� budget� deficit� at� around� 1� percent� of� GDP,� the�government�has�increased�the�volume�of�its�expenditures�up�to�more�than�33�percent�of�GDP.�This�creates�a�good�opportunity�to�increase�spending�for�the�education�sector.�
Development�partners�provided�US$53.8�million�in�support�of�the�education�sector�in� 2007/08.�On�average,� between�2004�and�2006,� education� in�Malawi�benefited� from�aid�equivalent�to�1.9�percent�of�GDP�(compared�to�1.1�percent�of�the�average�GDP�in�Sub�Saharan�Africa).�Direct�support� to�education�accounted�for�1.2�percent�of�GDP,�and�0.7�percent�of�GDP�was�the�estimated�education�share�from�global�budget�support.2�
*�*�*�
An� education� system� develops� within� a� national� context,� which� is� largely�determined� by� the� socio�demographic� characteristics� of� the� population,� the� strength�and� size� of� the� economy� (the� macroeconomic� conditions),� and� by� decisions� about�expenditure� on� education� versus� other� sectors.� Chapter� 1� is� a� discussion� of� the�demographic�makeup,� social� context,� and�macroeconomic� environment� affecting� the�education�sector�in�Malawi.�This�chapter�is�divided�in�three�parts:�i)�the�demographic�trends� (with� a� particular� focus� on� the� school�age� population),� ii)� the� social�development� context� (including� the� prevalence� of� HIV/AIDS),� and� iii)� the�macroeconomic�conditions.��
Demographics
General Information
Located� in� southeast� Africa,� Malawi� is� a� land�locked� country� of� 118,484� square�kilometers—20�percent�of�which�is�water.�Eighty�two�percent�of�the�population�lives�in�rural�areas�where�the�main�means�of�subsistence�is�smallholder,�rain�fed�agriculture.��
From�1987�to�2008,�the�population�of�Malawi�grew�at�an�average�annual�rate�of�2.4�percent.�The�2008�Population�and�Housing�Census�conducted�by�the�Malawi�National�Statistics� Office� estimated� the� country’s� population� to� be� slightly� greater� than� 13�million—a�39�percent�increase�from�1987’s�estimate�of�8�million�inhabitants.�In�2008,�49�percent�of�the�population�was�male�and�51�percent�was�female.�
Population Density across Regions and Districts
The�Southern�region�of�Malawi�is�the�most�densely�populated,�with�5.9�million�people�(45� percent� of� the� total� population).� The� Central� region� has� 5.5� million� people� (42�percent).�The�Northern� region� is� the� least�urbanized�and�has� the� lowest� share� of� the�population�with�only�1.7�million�people�(13�percent).�
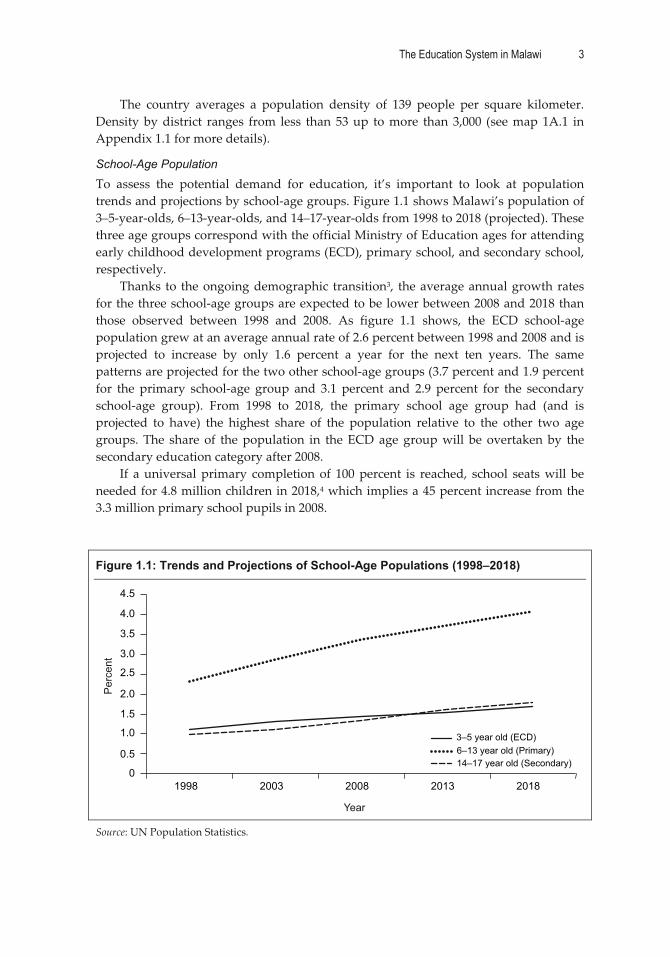
The Education System in Malawi 3
�
The� country� averages� a� population� density� of� 139� people� per� square� kilometer.�Density�by�district� ranges� from� less� than�53�up� to�more� than�3,000� (see�map�1A.1� in�Appendix�1.1�for�more�details).��
School-Age Population
To� assess� the� potential� demand� for� education,� it’s� important� to� look� at� population�trends�and�projections�by�school�age�groups.�Figure�1.1�shows�Malawi’s�population�of�3–5�year�olds,�6–13�year�olds,�and�14–17�year�olds�from�1998�to�2018�(projected).�These�three�age�groups�correspond�with�the�official�Ministry�of�Education�ages�for�attending�early�childhood�development�programs�(ECD),�primary�school,�and�secondary�school,�respectively.�
Thanks� to� the�ongoing�demographic� transition3,� the�average�annual�growth�rates�for�the�three�school�age�groups�are�expected�to�be�lower�between�2008�and�2018�than�those� observed� between� 1998� and� 2008.� As� figure� 1.1� shows,� the� ECD� school�age�population�grew�at�an�average�annual�rate�of�2.6�percent�between�1998�and�2008�and�is�projected� to� increase� by� only� 1.6� percent� a� year� for� the� next� ten� years.� The� same�patterns�are�projected�for�the�two�other�school�age�groups�(3.7�percent�and�1.9�percent�for� the� primary� school�age� group� and� 3.1� percent� and� 2.9� percent� for� the� secondary�school�age� group).� From� 1998� to� 2018,� the� primary� school� age� group� had� (and� is�projected� to� have)� the� highest� share� of� the� population� relative� to� the� other� two� age�groups.�The� share� of� the�population� in� the�ECD�age�group�will� be� overtaken� by� the�secondary�education�category�after�2008.�
If� a�universal�primary� completion�of� 100�percent� is� reached,� school� seats�will� be�needed�for�4.8�million�children�in�2018,4�which�implies�a�45�percent�increase�from�the�3.3�million�primary�school�pupils�in�2008.���
Figure 1.1: Trends and Projections of School-Age Populations (1998–2018)
0
0.5
1.0
1.5
2.0
2.5
3.0
3.5
4.0
4.5
1998 2003 2008 2013 2018
3–5 year old (ECD)6–13 year old (Primary)14–17 year old (Secondary)
Per
cent
Year �Source:�UN�Population�Statistics.���
4 World Bank Working Paper
�
To�assess�the�demographic�burden�in�Malawi�compared�to�the�other�South�African�Development�Communities�(SADC)�countries,�it�is�useful�to�compare�the�share�of�5–16�year�olds� to� the� total� population.� This� age� group� comprises� the� bulk� of� the� children�expected�to�attend�primary�and�secondary�school�in�most�countries.�In�2008,�Malawi’s�proportion�of�children�ages�5–16�was�37�percent.�This�is�the�highest�in�the�SADC�region�and�much� higher� than� in� the� country� with� the� next� largest� share—Zambia� with� 33�percent�(see�table�1A.1�in�Appendix�1.1).�This�implies�that�the�demographic�burden�for�the�education�sector�in�Malawi�is�heavier�than�that�of�its�neighboring�countries.�
Social Development5
Poverty and Inequality
According�to�the�last�United�Nations�Development�Programme�(UNDP)�development�report�(2007/08),�63�percent�of�the�Malawian�population�is�living�below�the�US$2�a�day�income�poverty�line�and�21�percent�below�the�US$1�a�day�poverty�line.6�Nevertheless,�those� percentages� are� lower� than� the� SADC� average� (41� percent� and� 69� percent,�respectively).��
The� Gini� index7� (39� in� Malawi)� indicates� significant� inequalities� in� access� to�resources,�services,�and�opportunities�among�Malawians.�There�is�a�large�discrepancy�between� the� average� per� capita� income� of� the� richest� and� poorest� sections� of� the�population.�The�richest�10�percent�of�Malawi’s�population�have�an�average�per�capita�income� that� is� 11� times� higher� than� the� average�per� capita� income� of� the�poorest� 10�percent.�Nevertheless,�when� compared� to� other� SADC� countries,�Malawi� appears� as�one�of�the�least�unequal�countries.�The�SADC�average�of�the�Gini�index�stands�at�52.�
Malnutrition and the Child Mortality Rate
Malnutrition� in�Malawi� is� extensive� and� a�major� social� development� challenge.� The�prevalence� of� malnutrition8� is� estimated� to� be� 49� percent.� Dietary� diversity� and� the�average�amount�of� calories� consumed�daily� are� low�across� the� country� (for� instance,�rural� people� eat�mainly�maize).�Nationwide� in� 2008,� an� overwhelming� 44�percent� of�preschoolers�were�stunted�(with�18�percent�being�severely�stunted).�These�figures�have�remained�more�or�less�constant�over�the�past�15�years.��
Malawi�has�the�highest�malnutrition�in�the�SADC�region�(the�SADC�average�is�33�percent).�Malawi’s�mortality�rate�for�children�below�the�age�of�five�is�122�children�per�every�1,000,�which�is�similar�to�the�SADC�average�of�131.�
HIV/AIDS
The� HIV/AIDS� pandemic� has� affected� all� levels� of� social� development� in� Malawi,�including� mortality,� life� expectancy,� and� infant� mortality.� In� the� education� sector,�HIV/AIDS� is� killing� both� teachers� and� parents.� It� also� contributes� to� teachers’�absenteeism,�since�the�affected�teachers�are�often�sick.�The�pandemic�has�significantly�increased�the�number�of�orphans�in�the�country�and�these�children�are�less�likely�to�go�to�school�than�children�with�families�(World�Bank,�2008).��
Malawi’s�HIV/AIDS�prevalence�rate�is�11.9�percent—this�is�the�sixth�lowest�rate�in�the�region,�out�of�the�14�countries.�Nevertheless,�the�prevalence�rate�in�Malawi�is�much�higher�than�the�African�average�of�6.7�percent.�

The Education System in Malawi 5
�
HIV/AIDS�occurrences�are�higher� in�urban�areas� than� in� rural�one�and�higher� in�the�more�populous�south�of� the�country�compared�to�other�regions.�The� incidence�of�HIV/AIDS� is� reportedly� higher� among� women� (13� percent)� than� men� (10� percent).�Overall,� 97�percent�of�women�and�almost�all�men� report�having�heard�of�HIV/AIDS.�However,�the�number�of�adults�who�report�knowing�all�the�main�ways�of�preventing�HIV�transmission�is�low�(52�percent).��
Other Social Development Indicators
Adult�Literacy�Rates�When�parents�are�more�literate,�they�are�more�likely�to�enroll�their�children�in�school.�The�adult�literacy�rate�is�clearly�a�context�factor�for�school�demand�and�it�is�noteworthy�to�compare�Malawi�to�other�countries�in�that�regard.�The�adult�(meaning�15�years�and�older)� literacy� rate� in�Malawi� is� estimated� to�be�69�percent,9�which� is�better� than� the�African� average� (62.9� percent)� but� lower� than� the� SADC� countries� average� (75.3�percent).��
Urbanization�Rate�The� percentage� of� people� living� in� an� urban� setting� is� also� an� important� context�indicator�because�the�demand�for�education�is�higher�in�urban�areas�than�in�rural�ones�and�it’s�easier�to�deliver�education�services�in�urban�areas�(probably�because�it’s�easier�to� allocate� teachers� in� urban� areas).� Malawi� however,� has� one� of� the� lowest�urbanization� rates� with� only� 17.7� percent� of� the� population� living� in� cities.� This�proportion�is�much�lower�than�both�the�African�average�(37.9�percent)�and�the�SADC�countries�average�(35.9�percent).��
Composite�Index�of�Social�Context��The�World�Bank� recently� computed�an�aggregate� social� context� index� that� takes� into�account� demographic� dependency,� malnutrition� rate,� the� child� mortality� rate,� the�HIV/AIDS�prevalence� rate,� the�adult� literacy� rate,� and� the�urbanization� rate.�On� that�scale,� Malawi� with� an� index� of� 39,� is� the� SADC� country� with� the� lowest� value—meaning�that�it�is�the�SADC�country�with�the�most�difficult�social�context.�Among�all�Sub�Saharan� African� (SSA)� countries,� Malawi� is� the� country� with� the� fourth� most�difficult� social� context.� Only� Niger,� Burundi,� and� Ethiopia� have� a� lower� composite�social�context�index.��
Macroeconomic Conditions
Economic Growth and Policy
Since� 2005,� Malawi’s� economy� has� been� growing� rapidly� due� to� sound� economic�government�policies�and� favorable�weather� conditions� for�agriculture.�This� follows�a�prolonged�period�of�weak�policy�implementation,�which�resulted�in�the�rapid�build�up�of�domestic�debt,�accelerating�inflation,�dwindling�external�reserves,�and�low�economic�growth� rates.� Due� to� these� fiscal� policy� slippages,� the� International�Monetary� Fund�(IMF)�suspended�its�balance�of�payments�to�support�the�Malawi�government�in�April�2004�under�the�Poverty�Reduction�and�Growth�Facility�(PRGF).��

6 World Bank Working Paper
�
After� the� third� multiparty� general� elections� in� May� 2004,� the� new� government�began�implementing�the�IMF�Staff�Monitored�Programme�(SMP),�which�was�aimed�at�dealing�with�impediments�to�sound�fiscal�and�economic�management.�The�government�successfully�implemented�the�SMP,�leading�to�the�approval�of�a�PRGF�arrangement�by�the� IMF� in� August� 2005.� After� further� progress� in� economic� management,� the�international�community�approved�a�significant�debt�relief�package�for�Malawi�under�the�Heavily�Indebted�Poor�Countries�(HIPC)�program�and�the�Multilateral�Debt�Relief�Initiative� (MDRI).� Consequently,� the� external� debt� stock� was� reduced� significantly�from� US$3� billion� to� US$0.5� billion� in� 2006.� This� has� lead� to� the� availability� of�significant� debt� service� savings� for� poverty� reducing� expenditures� in� education,�healthcare,�and�other�sectors.��
This� strengthening� of� the� country’s� fiscal� position� has� led� to� macroeconomic�stability,� lowered� domestic� debt,� and� lowered� interest� rates.� The� exchange� rate� has�stabilized�at�MK140�per�U.S.�dollar�over�the�past�two�years.�A�stable�exchange�rate�and�sound� agricultural� policies� have� helped� reduce� inflation� from� 13.3� percent� in� the�2005/06�financial�year.�Inflation�stayed�at�single�digit� levels�in�2008�despite�the�recent�surge� in� international� food� and�petroleum�prices.�Economic�growth�has�been� strong,�averaging�7.3�percent� for�2005–08,�compared� to�4.0�percent� in�2002–04� (see� table�1.1).�Continued� favorable� conditions� and� policies� in� 2008� will� allow� Malawi’s� output�growth�to�remain�above�7�percent�in�real�terms.���Table 1.1: Evolution in Real GDP Growth, Inflation, and Exchange Rate (MK/US$)
Variable 2003/04 2004/05 2005/06 2006/07 2007/08 Real GDP growth rates 5 2.6 5.2 8.1 8.7 Inflation 12.3 10.5 13.3 8.8 7 Exchange rate (MK/US$, average) 103.1 113.6 127.2 138 140.3
Source:�Ministry�of�Finance.���
The�recent�increase�in�economic�growth�allowed�Malawi�to�reach�a�GDP�per�capita�slightly�over�MK42,000�in�2008,�a�value�similar�to�what�was�observed�at�the�end�of�the�1990s� before� weather� conditions� (lack� of� rain� that� led� to� famine� in� 2002)� and�macroeconomic�instability�reduced�GDP�per�capita�(see�figure�1.2).�
Government Revenues and Expenditures
Government�revenues,�including�grants,�have�increased�significantly�from�19.4�percent�of� the� GDP� in� the� 2003/04� financial� year� to� 32.3� percent� in� 2007/08,� largely� due� to�improved�domestic� tax�administration�and� increases� in�donor�support� in� the� form�of�both�grants�and�loans.�As�indicated�in�table�1.2,�domestic�revenues�increased�from�16.4�percent�of�the�GDP�to�19.2�percent�during�the�2004–2008�period,�while�grants�increased�from�8.8�percent�of�the�GDP�to�13.2�percent.���

The Education System in Malawi 7
�
Figure 1.2: Evolution in Real GDP Per Capita (1987–2008)
GDP per Capita (MK 2008 Constant Prices)
20,000
25,000
30,000
35,000
40,000
45,000
50,000
1987
1988
1989
1990
1991
1992
1993
1994
1995
1996
1997
1998
1999
2000
2001
2002
2003
2004
2005
2006
2007
2008
�
Source:�World�Bank�Live�Database�and�additional�calculations.��On� the� other� hand,� expenditures� have� increased� only� marginally� during� the� same�period�because�of�strengthened�control�over�the�wage�bill�and�utility�payments.�(These�were� the�main�sources�of�over�expenditure� in� the�period� leading�up� to�2003/04.�As�a�proportion�to�GDP,�expenditures�increased�from�30.9�percent�in�2003/04�to�33.4�percent�in�2007/08.�Most�of�this�expenditure�is�on�recurrent�activities.�However,�the�proportion�of� development� expenditure� to� GDP� has� risen� significantly� during� the� 2004–2008�period,�from�8�percent�to�12�percent,�reflecting�the�government’s�policy�of�investing�in�and�improving�infrastructural�development.��
Consequently,� the� fiscal� deficit� has� been� reduced� from� 8.5� percent� of� GDP� in�2002/03�to�1.1�percent�in�2007/08.10���Table 1.2: Evolution in Total Government Revenue and Expenditure and Deficit
Variable 2003/04 2004/05 2005/06 2006/07 2007/08
Total govt. rev. (including grants) as % of GDP 25.2 27.2 30.5 31.8 32.3
- Revenue (excluding grants) as % of GDP 16.4 18.2 17.5 18.1 19.2
- Grants as % of GDP 8.8 9 12.9 13.6 13.2
Total govt. expenditures as % of GDP 30.9 31.2 31.2 31.7 33.4
- Recurrent expenditure as % of GDP 22.8 23 24.4 20 21.4
- Development expenditure as % of GDP 8 8 6.8 11.6 12
Deficit including grants as % of GDP –5.6 –3.9 –0.8 0.1 –1.1
Deficit excluding grants as % of GDP –14.5 –13 –13.6 –13.5 –14.2
Source:�Ministry�of�Finance.�

8 World Bank Working Paper
�
Comparisons to Other African Countries
GDP�Per�Capita�and�Domestic�Resources�as�a�Percentage�of�GDP�In� comparison� to� the� SADC� region� and� SSA,� and� in� spite� of� the� recent� good�macroeconomics� performance,� Malawi’s� GDP� per� capita� and� domestic� resources�(excluding�grants)�as�a�percentage�of�GDP�remain�relatively�low.�With�the�exception�of�the�Democratic�Republic�of�Congo,�Malawi�has�the�lowest�GDP�per�capita�in�the�SADC�region� at� US$263� million� (see� table� 1.3).� This� is� far� below� the� SADC� average� of�US$2.413�million�and�the�SSA�average�of�US$1.7�million.�This�is�partly�because�Malawi�has�comparatively� fewer�precious�minerals�available�and� low� levels�of�manufactured�exports.� However,� with� the� government’s� increased� emphasis� on� value� addition� on�domestic�products�coupled�with�the�discovery�and�mining�of�uranium,�the�prospect�of�having�improved�GDP�levels�is�brighter.��
The�Malawian�value�of�19.2�percent�of�GDP� for�domestic� resources� is�also� lower�than� both� the� SADC� average� (29� percent)� and� the� SSA� average� (23.5� percent).�Nevertheless,�when�compared�with�similar�GDP�per�capita�countries,�this�indicator�is�relatively�high�in�Malawi.����Table 1.3: GDP Per Capita and Domestic Resources as a Percentage of GDP for SADC Countries (ca. 2006)
SADC country GDP per capita
(US$)
Domestic resources (excluding grants)
as % GDP Angola 2,728 46.4
Botswana 5,704 41.4
Congo, Dem. Rep. of 141 18.0
Lesotho 749 50.8
Madagascar 287 11.2
Malawi 263 19.2
Mauritius 5,071 19.6
Mozambique 326 15.6
Namibia 3,208 28.1
Swaziland 2,336 29.7
South Africa 5,285 26.7
Tanzania 324 12.9
Seychelles 8,600 52.5
Zambia 918 17.2
Zimbabwe 260 45.0
Average for SADC countries 2,413 30.0
Average for SSA countries 1,700 23.5
Source:�World�Bank.��
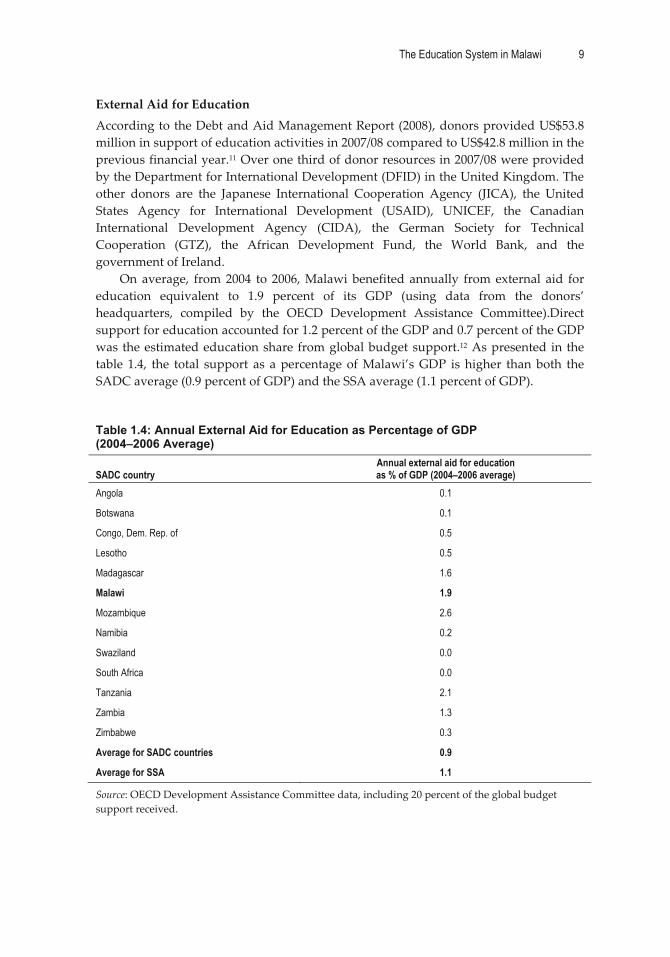
The Education System in Malawi 9
�
External�Aid�for�Education�According�to�the�Debt�and�Aid�Management�Report�(2008),�donors�provided�US$53.8�million�in�support�of�education�activities�in�2007/08�compared�to�US$42.8�million�in�the�previous�financial�year.11�Over�one�third�of�donor�resources�in�2007/08�were�provided�by�the�Department�for�International�Development�(DFID)�in�the�United�Kingdom.�The�other� donors� are� the� Japanese� International� Cooperation� Agency� (JICA),� the� United�States� Agency� for� International� Development� (USAID),� UNICEF,� the� Canadian�International� Development� Agency� (CIDA),� the� German� Society� for� Technical�Cooperation� (GTZ),� the� African� Development� Fund,� the� World� Bank,� and� the�government�of�Ireland.��
On� average,� from�2004� to� 2006,�Malawi�benefited�annually� from�external� aid� for�education� equivalent� to� 1.9� percent� of� its� GDP� (using� data� from� the� donors’�headquarters,� compiled� by� the� OECD� Development� Assistance� Committee).Direct�support�for�education�accounted�for�1.2�percent�of�the�GDP�and�0.7�percent�of�the�GDP�was�the�estimated�education�share� from�global�budget�support.12�As�presented� in� the�table� 1.4,� the� total� support� as� a�percentage�of�Malawi’s�GDP� is� higher� than�both� the�SADC�average�(0.9�percent�of�GDP)�and�the�SSA�average�(1.1�percent�of�GDP).����Table 1.4: Annual External Aid for Education as Percentage of GDP (2004–2006 Average)
SADC country Annual external aid for education as % of GDP (2004–2006 average)
Angola 0.1
Botswana 0.1
Congo, Dem. Rep. of 0.5
Lesotho 0.5
Madagascar 1.6
Malawi 1.9
Mozambique 2.6
Namibia 0.2
Swaziland 0.0
South Africa 0.0
Tanzania 2.1
Zambia 1.3
Zimbabwe 0.3
Average for SADC countries 0.9
Average for SSA 1.1
Source:�OECD�Development�Assistance�Committee�data,�including�20�percent�of�the�global�budget�support�received.��

10 World Bank Working Paper
�
Composite�Index�of�Economic�Context�and�Composite�Index�of�Context�The�World� Bank� recently� computed� an� aggregate� economic� context� index� that� takes�into�account�GDP�per�capita,�domestic�resources�as�a�percentage�of�GDP,�external�aid�for�education,�and�the�percentage�of�students�enrolled�in�private�education.13�On�that�scale,�Malawi�with�an�index�of�41.5�is�the�SADC�country�with�the�second�lowest�value�(right� after� the�Democratic� Republic� of�Congo),�meaning� that� it� is� the� second� SADC�country�with� the�most�difficult�economic�context� for� the�education�sector.�Among�all�SSA� countries,� Malawi� is� ranked� as� the� country� with� the� seventh� most� difficult�economic� context,� right� after� DRC,� Ethiopia,� Sierra� Leone,� Niger,� Central� African�Republic,�and�Burundi.��
A�composite�index�of�global�context�has�also�been�computed�by�the�World�Bank,�by� combining� the� composite� index� of� social� context� (see� part� II.4.3� above)� and� the�composite� index�of�economic�context.�On�this�global�context� index,�Malawi� is,�with�a�value�of�39,�ranked�as�the�SADC�country�with�the�most�difficult�global�context�and�the�fourth� among� all� SSA� countries� (right� after� Niger,� Burundi,� and� Ethiopia).� See�Appendix�1.1.��
Notes �1�The�assumption�used�is�that�repetition�rate�will�stay�constant�between�2008�and�2018;�20�percent�of�the�students�would�be�repeaters.�2� For� cross�country� comparisons,� the� usual� assumption� is� to� estimate� that� 20� percent� of� global�budget� support� goes� to� the� education� sector� (i.e.,� the� average� share� for� education� in� recurrent�budgets�in�Sub�Saharan�countries).�3� Demographic� transition� happens�when� the� population� growth� starts� to� decrease,� even� if� the�population�itself�is�increasing.�4�This�figure�is�estimated�using�the�assumption�than�the�repetition�rate�for�2018�will�be�the�same�as�in�2008.�5�See�Appendix�1.1�for�data�for�all�African�countries.�6� Income� poverty� lines� are� calculated� at� 1985� international� prices� and� adjusted� for�purchasing�power�parity.�7� The� Gini� index� measures� the� extent� to� which� the� distribution� of� income� (or� consumption)�among�individuals�or�households�within�a�country�deviates�from�a�perfectly�equal�distribution.�A�Lorenz�curve�plots� the�cumulative�percentages�of� total� income�received�against� the�cumulative�number�of�recipients,�starting�with�the�poorest�individual�or�household.�The�Gini�index�measures�the�area�between� the�Lorenz�curve�and�a�hypothetical� line�of� absolute�equality,� expressed�as�a�percentage�of�the�maximum�area�under�the�line.�A�value�of�0�represents�absolute�equality,�a�value�of�100�absolute�inequality�(one�individual�concentrating�100�percent�of�the�national�income).�An�education�Gini�index�is�also�presented�in�Chapter�5�of�this�report.�8�The�prevalence�of� child�malnutrition� (height� for�age)� is� the�percentage�of� children�under� five�whose� height� for� age� is� more� than� two� standard� deviations� below� the� median� for� the�international�reference�population�ages�0–59�months.�For�children�up�to�two�years�of�age,�height�is� measured� by� recumbent� length.� For� older� children,� height� is� measured� by� stature� while�standing.�The�reference�population�adopted�by�the�WHO�in�1983�is�based�on�children�from�the�United�States,�who�are�assumed�to�be�well�nourished�(source:�World�Health�Organization,�Global�Database�on�Child�Growth�and�Malnutrition).�9�Source:�United�Nations�Educational,�Scientific�and�Cultural�Organization� (UNESCO)� Institute�for�Statistics.��
The Education System in Malawi 11
�
�10�The�domestic�debt�has�been�reduced�from�25�percent�in�2003/04�to�16�percent�in�2007/08.�11� These� amounts� are� based� on� the� information� that� development� partners� reported� to� the�Ministry�of�Finance�for�inclusion�in�the�budget.�However,�donor�support�that�is�not�reported�at�the�time�of�budget�preparation�is�treated�as�off�budget,�together�with�resources�that�are�directly�managed�by�donors�even�though�they�may�be�in�support�of�government�activities.��12�For� cross�country� comparisons,� the�usual�assumption� is� to�estimate� that�20�percent�of�global�budget� support� goes� to� the� education� sector� (i.e.,� the� average� share� for� education� in� recurrent�budgets�in�Sub�Saharan�countries).�13�The�percentage�of�students�enrolled�in�private�education�is�included�in�the�index�of�economic�context� because�when�more� children� go� to� private� schools,� the� government� has� to� pay� less� to�enroll�students�in�public�schools.�
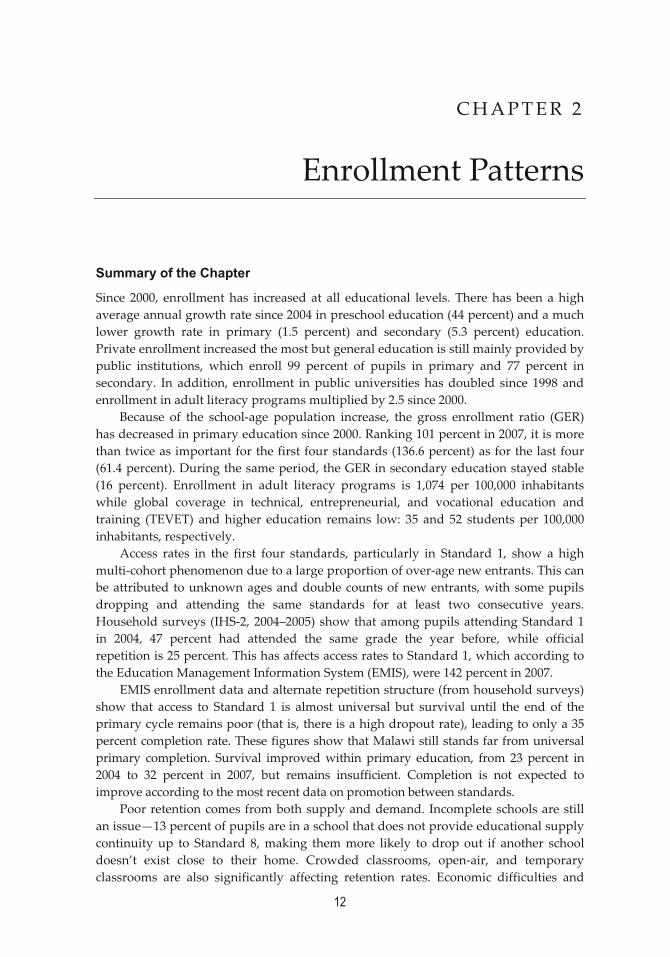
12
CHAPTER �2 �
Enrollment�Patterns�
Summary of the Chapter
Since� 2000,� enrollment�has� increased� at� all� educational� levels.� There�has� been� a�high�average�annual�growth�rate�since�2004�in�preschool�education�(44�percent)�and�a�much�lower� growth� rate� in� primary� (1.5� percent)� and� secondary� (5.3� percent)� education.�Private�enrollment�increased�the�most�but�general�education�is�still�mainly�provided�by�public� institutions,� which� enroll� 99� percent� of� pupils� in� primary� and� 77� percent� in�secondary.� In� addition,� enrollment� in�public�universities�has�doubled� since� 1998�and�enrollment�in�adult�literacy�programs�multiplied�by�2.5�since�2000.�
Because� of� the� school�age� population� increase,� the� gross� enrollment� ratio� (GER)�has�decreased�in�primary�education�since�2000.�Ranking�101�percent�in�2007,�it�is�more�than�twice�as�important�for�the�first�four�standards�(136.6�percent)�as�for�the�last�four�(61.4�percent).�During�the�same�period,�the�GER�in�secondary�education�stayed�stable�(16� percent).� Enrollment� in� adult� literacy� programs� is� 1,074� per� 100,000� inhabitants�while� global� coverage� in� technical,� entrepreneurial,� and� vocational� education� and�training� (TEVET)� and�higher� education� remains� low:� 35� and� 52� students� per� 100,000�inhabitants,�respectively.��
Access� rates� in� the� first� four� standards,� particularly� in� Standard� 1,� show� a� high�multi�cohort�phenomenon�due�to�a�large�proportion�of�over�age�new�entrants.�This�can�be�attributed�to�unknown�ages�and�double�counts�of�new�entrants,�with�some�pupils�dropping� and� attending� the� same� standards� for� at� least� two� consecutive� years.�Household�surveys� (IHS�2,�2004–2005)�show�that�among�pupils�attending�Standard�1�in� 2004,� 47� percent� had� attended� the� same� grade� the� year� before,� while� official�repetition�is�25�percent.�This�has�affects�access�rates�to�Standard�1,�which�according�to�the�Education�Management�Information�System�(EMIS),�were�142�percent�in�2007.��
EMIS�enrollment�data�and�alternate�repetition�structure�(from�household�surveys)�show� that� access� to� Standard� 1� is� almost� universal� but� survival� until� the� end� of� the�primary�cycle�remains�poor�(that�is,�there�is�a�high�dropout�rate),�leading�to�only�a�35�percent�completion�rate.�These�figures�show�that�Malawi�still�stands�far�from�universal�primary� completion.� Survival� improved�within� primary� education,� from� 23� percent� in�2004� to� 32� percent� in� 2007,� but� remains� insufficient.� Completion� is� not� expected� to�improve�according�to�the�most�recent�data�on�promotion�between�standards.�
Poor�retention�comes�from�both�supply�and�demand.�Incomplete�schools�are�still�an�issue—13�percent�of�pupils�are�in�a�school�that�does�not�provide�educational�supply�continuity�up� to� Standard� 8,�making� them�more� likely� to�drop� out� if� another� school�doesn’t� exist� close� to� their� home.� Crowded� classrooms,� open�air,� and� temporary�classrooms� are� also� significantly� affecting� retention� rates.� Economic� difficulties� and�

The Education System in Malawi 13
�
early� marriage,� pregnancy,� and� family� responsibilities� are� also� reported� as� major�reasons�for�dropping�out.�The�schools�with�higher�repetition�rates�show�a�significantly�higher�dropout�rate�as�well.��
*�*�*��
This�chapter�describes�the�enrollment�patterns�of�all�education�levels�in�Malawi.�It�focuses�primarily�on�general�education�(preschool,�primary,�and�secondary)�as�well�as�non�formal� education.� Technical,� entrepreneurial,� and� vocational� education� and�training�(TEVET)�and�higher�education�will�be�analyzed�in�more�detail�in�subsequent�chapters.�Chapter�2�provides�a�global�description�of� the�education�system�in�Malawi,�with�an�overview�of�enrollment�trends�from�19981�for�each�level�and�type�of�schooling.�Education� is� then� addressed� for:� i)� global� coverage,�which� compares� enrollments� by�level�and�the�age�group�that�can�attend;�ii)�actual�coverage,�which�uses�the�schooling�profile�on�primary�and�secondary�education;�and� iii)� the�main�reasons�dropping�out,�which�are�identified�by�different�analytical�methodologies�and�data�sources.�
The Education System in Malawi
The Structure
In�general,�basic�education�has�three�main�components:�ECD;�adult�literacy,�including�out�of�school� youth� literacy;� and� primary� education.� In� Malawi� however,� basic�education� is�synonymous�only�with�primary�education.� Indeed,�while�ECD�is�part�of�infant� care� and� support,� adult� and� out�of�school� youth� literacy� are� considered� non�formal�education.�
The�formal�education�system�in�Malawi�follows�an�8–4–4�structure:�eight�years�of�primary�education�(Standard�1–Standard�8),�four�years�of�secondary�(Form�1–Form�4),�and�four�years�of�university�level�education1�(see�figure�2A.1�in�Appendix�2.1).��
At� the� end� of� their� primary� education,� students� take� the� Primary� School�Leaving� Certificate� Examination� (PSLE),� which� determines� their� eligibility� for�entry�into�secondary�school.��
Public� school� secondary� students� attend� either� Community� Day� Secondary�Schools�(CDSSs,�previously�MCDE)�or�Conventional�Secondary�Schools�(CSSs).�At�the�end�of�two�years�of�secondary�education,�pupils�take�the�national�Junior�Certificate�of�Secondary�Education�(JCE),�which�is�followed�by�the�Malawi� School�Certificate�Examination�(MSCE)�two�years�later.��
Tertiary� education� is� provided� by� an� array� of� educational� institutions,�including�primary�and�secondary�teacher�training�colleges,�technical�and�vocational�training� schools,� and� university� colleges.� For� university� entrance� and� for� the�secondary� teacher� training� college,� an� MSCE� certificate� is� required.� For� primary�teacher�training,�the�policy�is�to�take�MSCE�graduates,�but�those�who�passed�the�JCE�may� also� be� accepted.� Technical� and� vocational� training� can� start� after� either�JCE�or�MSCE.��
Primary,�secondary,�teacher,�and�higher�education�levels�fall�under�the�authority�of�the�Ministry�of�Education�Science�and�Technology.��

14 World Bank Working Paper
�
Early�Childhood�Development�in�Malawi�falls�under�the�authority�of�the�Ministry�of�Women�and�Child�Development�and�contains�programs� for�children� from�birth� to�age� five.� Its� main� purpose� is� to� protect� children’s� rights� and� foster� full� cognitive,�emotional,� social,� and� physical� development.� Examples� of� ECD� activities� include�opening�preschool�centers,�recruiting�caregivers,�and�providing�instructional�materials�and�some�nutrition.�ECD�services�are�categorized�into�two�levels.�The�first—baby�care�centers� for� children� aged� 0–2� years—is� usually� offered� by� the� private� sector.� The�second� level—for� children� aged� 2–5� years—is� either� provided� by� the� private� sector�(preschools/nurseries)� or� the� public� sector� (community�based� childcare� centers),� and�the� government� contributes� by� training� caregivers� and� sometimes� providing�instructional�materials.�
Adult� literacy� tries� to� give� adults� (aged� 15� years� and� older)� a� second� chance� at�learning� opportunities� that� may� have� been� missed� when� they� were� young.� The�programs� teach� the� specialized� knowledge,� skills,� and� attitudes� that� are� needed� to�independently� engage� in� active� citizenship.� Improving� adult� literacy� in� Malawi�involves�opening�adult� literacy�classes,� recruiting� instructors,�and�providing�teaching�and� learning� materials.� It� also� involves� giving� adults� opportunities� for� post�literacy�activities�that�may�include�easy�reading�booklets,�skill�training,�and�information�about�small�business� management.� These� programs� are� free� but� provided� by� both�governmental� and� non�state� entities,� including� NGOs� and� private�sector� and� faith�based�organizations.��
Enrollment Trends
ECD��As�table�2.1�shows,�enrollment�grew�steadily�from�38,166�children�in�1998�to�683,826�in�2007.�Growth�can�be�mainly�explained�by�an�increased�advocacy�for�ECD�in�early�2000,�which� allowed� private� and� public� institutions� to� join� in� the� government’s� efforts� to�provide�ECD�education.�
Primary�education�Growth�was�constant�from�1998�to�2001�(figure�2A.2�in�Appendix�2.2).�High�enrollment�in�primary�education�is�a�direct�result�of�the�introduction�of�free�primary�education�in�1994.�The�sudden�decline�in�2002�and�2003�was�a�result�of�a�famine�brought�on�by�lack�of� rain� and� resulted� in�most�pupils,� especially� the�youngest,�dropping�out�of� school.�There�was�a�noticeable�increase�in�enrollment�from�2004�to�2007,�reaching�1.5�percent�annually.�Enrollment�in�private�institutions�(table�2.1)�grew�more�quickly�(17.1�percent�per�year)�than�in�public�institutions�(1.3�percent),�likely�a�result�of�a�national�policy�to�authorize� education� provisioned� by� private� institutions� that�was� set� up� in� the� early�2000s.� Nevertheless,� primary� education� in� Malawi� is� mainly� provided� by� public�institutions� (religious� agencies� and� the� government),� which� still� enrolled� nearly� 99�percent�of� the� total�pupils� attending� that� level� of� education� in� 2007.�Annual�growth� is�higher� in� the� last� four� grades� of� primary� schooling� (3.4� percent)� than� in� the� first� (0.7�percent):� This� could� be� the� consequence� of� the� previous� increase� in� Standard� 1’s�enrollment�consecutive�to�the�introduction�of�free�primary�education�in�1994.�

The Education System in Malawi 15
�
Table 2.1: Enrollment Trends per Education Level (1998–2007)
1998 2001 2004 2006 2007
Average Annual
Growth Rate 2001–2004
Average Annual
Growth Rate 2004–2007
ECD 38,166 72,760 229,823 615,478 683,826 47% 44% Primary Education 2,805,785 3,187,835 3,166,786 3,280,714 3,306,926 0% 1%
public n.a. n.a. 3,140,440 3,242,483 3,264,594 n.a. 1% private n.a. n.a. 26,346 38,231 42,332 n.a. 17%
Including: Std1–Std4 2,090,728 2,296,039 2,315,171 2,379,302 2,365,307 0% 1%
public n.a. n.a. 2,298,971 2,356,063 n.a. n.a. 1%* private n.a. n.a. 16,200 23,239 n.a. n.a. 20%*
Std5–Std8 715,057 891,796 851,615 901,412 941,619 –2% 3% public n.a. n.a. 841,469 886,420 n.a. n.a. 3%* private n.a. n.a. 10,146 14,992 n.a. n.a. 22%*
Secondary Education Form1–Form4 59,636 176,252 180,157 218,310 210,325 1% 5%
Public n.a. 153,119 137,822 166,307 161,575 –3% 5% CDSS n.a. 114,751 83,492 104,161 99,172 –10% 6% conventional n.a. 25,738 36,051 47,996 42,734 12% 6% grant-aided n.a. 8,764 16,322 9,717 12,730 23% –8% open school n.a. 3,866 1,957 4,433 6,939 –20% 52%
Private n.a. 23,133 42,335 52,003 48,750 22% 5% Adult Literacy 63,035 88,240 103,965 146,301 n.a. 6% 19%*
state 63,035 85,807 95,515 128,967 n.a. 4% 16%* non-state n.a. 2,433 8,450 17,334 n.a. 51% 43%*
University 3,385 4,304 6,478 6,346 7,263 15% 4% Public 3,385 4,304 6,478 6,346 6,458 15% 0%
Bunda 490 592 666 780 886 4% 10% Chancellor 1,292 1,555 2,017 2,252 1,108 9% –18% Kamuzu Nursing 263 180 331 251 454 23% 11% Polytechnic 1,031 1,239 2,345 1,980 2,147 24% –3% Medicine 93 88 179 n.a. 419 27% 33% Mzuzu n.a. 264 475 1,083 1,444 22% 45% Board of Governors 216 386 465 n.a. n.a. 6% n.a.
Private n.a. n.a. n.a. n.a. 805 n.a. n.a. TEVET n.a. n.a. n.a. n.a. 4,807 n.a. n.a.
Source:�Education�Management�Information�System�(EMIS)�data�from�the�Ministry�of�Education�Science�and�Technology�and�from�the�Ministry�of�Women�and�Child�Development.��n.a.:�not�available.��*Due�to�the�absence�of�2007�data,�the�average�annual�growth�rate�is�calculated�for�those�levels�from�2004�to�2006.��
The� increased� enrollment� in� open� schools�was� the� highest� overall� for� the� recent�period:� 52.5� percent� on� average� annually� since� 2004.� This� trend� can� be� explained� by�open�schools�absorbing�most�of�the�increase�in�the�demand�for�secondary�school.�Thus�in�2007,�records�show�that�77�percent�pupils�were�enrolled�in�public�institutions,�most�of� them�attending�either�CDSS� (47�percent)�or� conventional� schools� (20�percent).�The�share� of� open� school� and� grant�aided� schools� remains� low� among� the� global�enrollment�in�secondary�education:�3�percent�and�6�percent.��

16 World Bank Working Paper
�
Adult�literacy�Enrollment�increased�substantially,�from�63,035�students�in�1998�to�146,301�in�2006.�The�average�annual�growth�in�enrollment�since�2001�was�a�high�10.6�percent.�Data�for�non�state�providers�became�available�in�2001�and�since�then,�their�share�has�increased.�They�showed� a� 48� percent� average� annual� growth� rate� from� 2001–2006,�while� the� rate� for�state�providers�was�about� 8�percent.�However,� the� state� continues� to�be� the�primary�provider�of�the�adult�literacy�program;�it�enrolled�88�percent�of�students�in�2006.�
TEVET�Data�regarding�TEVET�are�scarce�in�Malawi;�the�only�figures�available�are�for�2007�and�concern� only� the� number� of� students� enrolled� in� formal� public� technical� colleges.�Chapter�6�of�this�CSR�discusses�TEVET�in�more�detail.�
Higher�education�Enrollment�showed�an�8.9�percent�average�annual�growth�rate�between�1998�and�2007.�This�figure�is�based�primarily�on�public�institutions,�as�data�on�private�structures�were�not�available.�In�2007,�enrollment�in�higher�education�was�mainly�public�(89�percent);�Polytechnic,�Chancellor�College,�and�Mzuzu�University�enroll�about�65�percent�of�the�total�number�of�students.�Higher�education�is�examined�in�greater�depth�in�Chapter�7.�
I.3 Enrollment Ratio Evolution
It� is� important� to� analyze� enrollment� trends� in� the� context� of� overall� changes� in�population� demographics.� In� other� words,� enrollment� patterns� can� be� better�understood�when� compared� to� the� theoretical� population� that�would� be� expected� to�attend�certain� levels�of�school�over�time.�Table�2.2�displays�the�evolution�of�coverage�indicators�from�2000–2007�for�all�educational�levels�in�Malawi.��
ECD��
� Enrollment�has�picked�up�since�2002,�reaching�23�percent�in�2007.��� The� gradual� increase,� in� particular� since� 2005,� suggests� that� the� support� of�
non�state�institutions�(UNICEF�and�NGOs)�greatly�helped�increase�coverage.��� However,�the�majority�of�children�still�enter�primary�education�without�being�
exposed�to�ECD�services.��
Primary�Education�
� The� GER� decreased� from� 120� percent� in� 2000� to� 101� percent� in� 2007.2� This�value� still�means� that� the� system� is� potentially� able� to� accommodate� all� the�pupils� within� the� school�age� group,� according� to� the� present� schooling�conditions�(which�are�very�bad,�with�a�student�to�teacher�ratio�(STR)�of�80:1.�See�Chapter�4�for�more�information.)��
� Nevertheless,�this�GER�does�not�ensure�universal�primary�completion�because�of� the� high� level� of� repetition� and� over�age� enrollment,3� which� artificially�inflate� the� GER,� and� the� high� number� of� dropouts� throughout� the� primary�cycle�(in�particular�between�the�two�sub�cycles).�
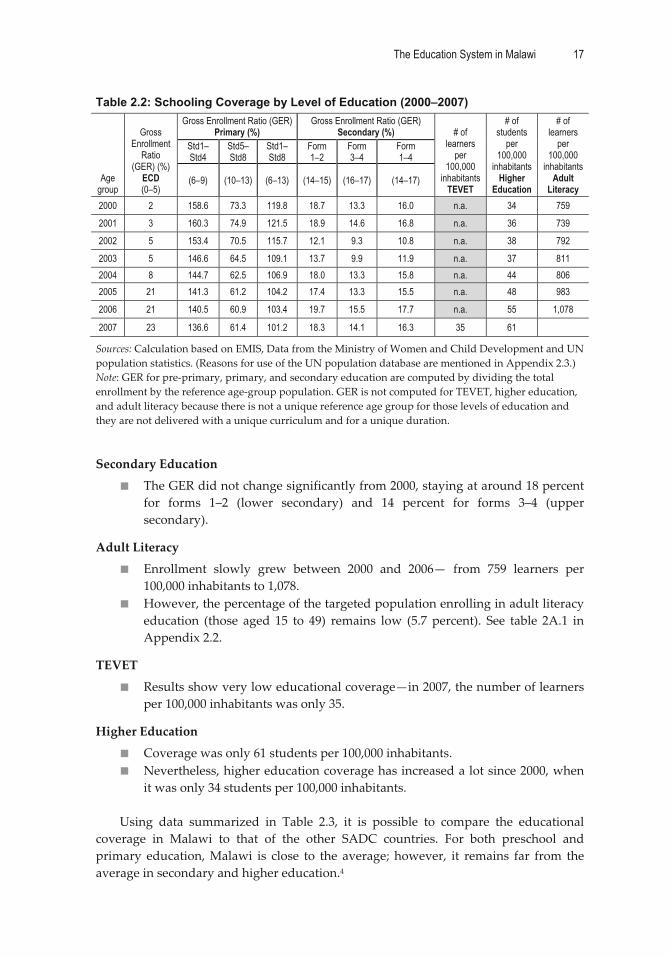
The Education System in Malawi 17
�
Table 2.2: Schooling Coverage by Level of Education (2000–2007)
Age group
Gross Enrollment
Ratio (GER) (%)
ECD (0–5)
Gross Enrollment Ratio (GER) Primary (%)
Gross Enrollment Ratio (GER) Secondary (%) # of
learners per
100,000 inhabitants
TEVET
# of students
per 100,000
inhabitants Higher
Education
# of learners
per 100,000
inhabitants Adult
Literacy
Std1–Std4
Std5–Std8
Std1–Std8
Form 1–2
Form 3–4
Form 1–4
(6–9) (10–13) (6–13) (14–15) (16–17) (14–17)
2000 2 158.6 73.3 119.8 18.7 13.3 16.0 n.a. 34 759
2001 3 160.3 74.9 121.5 18.9 14.6 16.8 n.a. 36 739
2002 5 153.4 70.5 115.7 12.1 9.3 10.8 n.a. 38 792
2003 5 146.6 64.5 109.1 13.7 9.9 11.9 n.a. 37 811 2004 8 144.7 62.5 106.9 18.0 13.3 15.8 n.a. 44 806 2005 21 141.3 61.2 104.2 17.4 13.3 15.5 n.a. 48 983
2006 21 140.5 60.9 103.4 19.7 15.5 17.7 n.a. 55 1,078
2007 23 136.6 61.4 101.2 18.3 14.1 16.3 35 61
Sources:�Calculation�based�on�EMIS,�Data�from�the�Ministry�of�Women�and�Child�Development�and�UN�population�statistics.�(Reasons�for�use�of�the�UN�population�database�are�mentioned�in�Appendix�2.3.)�Note:�GER�for�pre�primary,�primary,�and�secondary�education�are�computed�by�dividing�the�total�enrollment�by�the�reference�age�group�population.�GER�is�not�computed�for�TEVET,�higher�education,�and�adult�literacy�because�there�is�not�a�unique�reference�age�group�for�those�levels�of�education�and�they�are�not�delivered�with�a�unique�curriculum�and�for�a�unique�duration.���
Secondary�Education�
� The�GER�did�not�change�significantly�from�2000,�staying�at�around�18�percent�for� forms� 1–2� (lower� secondary)� and� 14� percent� for� forms� 3–4� (upper�secondary).��
Adult�Literacy�
� Enrollment� slowly� grew� between� 2000� and� 2006—� from� 759� learners� per�100,000�inhabitants�to�1,078.��
� However,�the�percentage�of�the�targeted�population�enrolling�in�adult�literacy�education� (those� aged� 15� to� 49)� remains� low� (5.7� percent).� See� table� 2A.1� in�Appendix�2.2.�
TEVET�
� Results�show�very�low�educational�coverage—in�2007,�the�number�of�learners�per�100,000�inhabitants�was�only�35.��
Higher�Education�
� Coverage�was�only�61�students�per�100,000�inhabitants.��� Nevertheless,�higher�education�coverage�has�increased�a�lot�since�2000,�when�
it�was�only�34�students�per�100,000�inhabitants.��
Using� data� summarized� in� Table� 2.3,� it� is� possible� to� compare� the� educational�coverage� in� Malawi� to� that� of� the� other� SADC� countries.� For� both� preschool� and�primary� education,�Malawi� is� close� to� the� average;� however,� it� remains� far� from� the�average�in�secondary�and�higher�education.4��

18 World Bank Working Paper
�
Table 2.3: International Comparison on GER (SADC countries)
ECD Primary Lower
Secondary Upper
Secondary Higher
Education Malawi 23 101 18 14 52 Angola n.a. 64 22 11 299 Botswana 15 107 89 58 596 Congo, Dem Rep of. 1 61 30 18 411 Lesotho 18 114 45 24 426 Madagascar 8 139 32 11 259 Mozambique n.a. 105 22 5 138 Mauritius 101 102 100 80 1,340 Namibia 22 107 74 30 644 Seychelles 109 125 116 106 n.a. Swaziland 17 106 56 33 502 South Africa 38 106 98 92 1,536 Tanzania 28 110 8 3 133 Zambia 117 53 18 235 Zimbabwe 43 101 58 31 416 SADC average 35 104 55 36 518 Africa average 22 98 47 25 416 Malawi/SADC 0.71 0.97 0.33 0.39 0.10
Sources:�EMIS�data�for�Malawi,�World�Bank�database�for�the�other�countries.�
Note:�Data�are�from�2007�or�thereabouts.�
Coverage in Primary and Secondary Education: Schooling and Survival Profiles
While�the�GER�gives�an�indication�for�a�given�cycle�of�the�system’s�capacity�to�enroll�students�of�the�corresponding�age�groups,�its�value�can�be�inflated�by�repetition�rates.�These� can� result� in� an� average�measure� of� coverage�without� reflecting� the� schooling�history� of� a� cohort� at� each� grade.� It� is� preferable� to� compute� schooling� profiles� that�describe�access�at�each�grade,�thereby�measuring�the�proportion�of�children�that�have�access�to�Standard�1�and�the�proportion�of�pupils�that�stay�in�school.��
There�are�several�methods�and�data�sources�available�for�computing�schooling�and�survival�profiles.5�Two�different� schooling�profiles�exist:� the�cross�sectional� schooling�profile�and�the�probalistic�schooling�profile.�The�cross�sectional�computes�access�rate�to�each� grade� by� dividing� the� new� repeaters� (repeaters� are� not� counted� for� avoiding�double� count)� by� the� population� of� the� theoretical� single� age� for� that� grade.� Some�access�rates�of�the�cross�sectional�profile�may�be�higher�than�100�percent�due�to�multi�cohort�phenomena�(over�age�enrollment).�The�probalistic�schooling�profile�is�made�by�computing�for�each�cohort�(a�single�age�population�group)�the�share�of�children�who�attend�or�have�attended�each�grade.�Access�rates�of�a�probalistic�schooling�profile�are�always�below�or�equal�to�100�percent.�
A�survival�profile�differs�from�a�schooling�profile�because�it�does�not�reference�the�total� population� of� children� but� only� those�who� entered� Standard� 1.� It� is� computed�
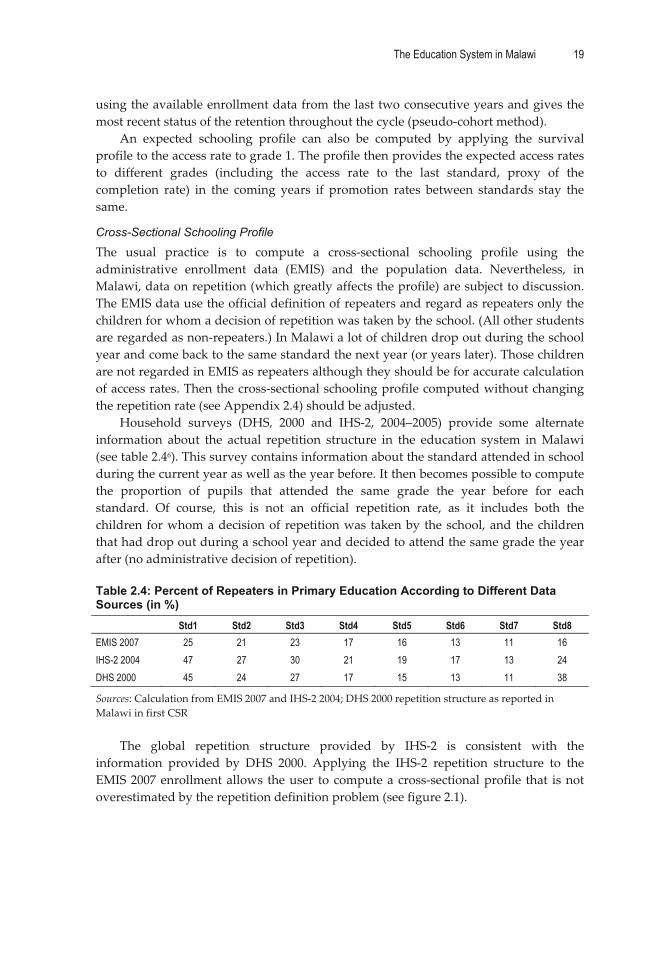
The Education System in Malawi 19
�
using�the�available�enrollment�data�from�the�last�two�consecutive�years�and�gives�the�most�recent�status�of�the�retention�throughout�the�cycle�(pseudo�cohort�method).�
An� expected� schooling� profile� can� also� be� computed� by� applying� the� survival�profile�to�the�access�rate�to�grade�1.�The�profile�then�provides�the�expected�access�rates�to� different� grades� (including� the� access� rate� to� the� last� standard,� proxy� of� the�completion� rate)� in� the� coming� years� if� promotion� rates� between� standards� stay� the�same.�
Cross-Sectional Schooling Profile
The� usual� practice� is� to� compute� a� cross�sectional� schooling� profile� using� the�administrative� enrollment� data� (EMIS)� and� the� population� data.� Nevertheless,� in�Malawi,�data�on�repetition�(which�greatly�affects�the�profile)�are�subject�to�discussion.�The�EMIS�data�use�the�official�definition�of�repeaters�and�regard�as�repeaters�only�the�children�for�whom�a�decision�of�repetition�was�taken�by�the�school.�(All�other�students�are�regarded�as�non�repeaters.)�In�Malawi�a�lot�of�children�drop�out�during�the�school�year�and�come�back�to�the�same�standard�the�next�year�(or�years�later).�Those�children�are�not�regarded�in�EMIS�as�repeaters�although�they�should�be�for�accurate�calculation�of�access�rates.�Then�the�cross�sectional�schooling�profile�computed�without�changing�the�repetition�rate�(see�Appendix�2.4)�should�be�adjusted.�
Household� surveys� (DHS,� 2000� and� IHS�2,� 2004–2005)� provide� some� alternate�information� about� the� actual� repetition� structure� in� the� education� system� in�Malawi�(see�table�2.46).�This�survey�contains�information�about�the�standard�attended�in�school�during�the�current�year�as�well�as�the�year�before.�It�then�becomes�possible�to�compute�the� proportion� of� pupils� that� attended� the� same� grade� the� year� before� for� each�standard.� Of� course,� this� is� not� an� official� repetition� rate,� as� it� includes� both� the�children�for�whom�a�decision�of� repetition�was� taken�by�the�school,�and�the�children�that�had�drop�out�during�a�school�year�and�decided�to�attend�the�same�grade�the�year�after�(no�administrative�decision�of�repetition).��Table 2.4: Percent of Repeaters in Primary Education According to Different Data Sources (in %)
Std1 Std2 Std3 Std4 Std5 Std6 Std7 Std8 EMIS 2007 25 21 23 17 16 13 11 16 IHS-2 2004 47 27 30 21 19 17 13 24 DHS 2000 45 24 27 17 15 13 11 38
Sources:�Calculation�from�EMIS�2007�and�IHS�2�2004;�DHS�2000�repetition�structure�as�reported�in�Malawi�in�first�CSR��
The� global� repetition� structure� provided� by� IHS�2� is� consistent� with� the�information� provided� by� DHS� 2000.� Applying� the� IHS�2� repetition� structure� to� the�EMIS�2007�enrollment�allows� the�user� to�compute�a�cross�sectional�profile� that� is�not�overestimated�by�the�repetition�definition�problem�(see�figure�2.1).��
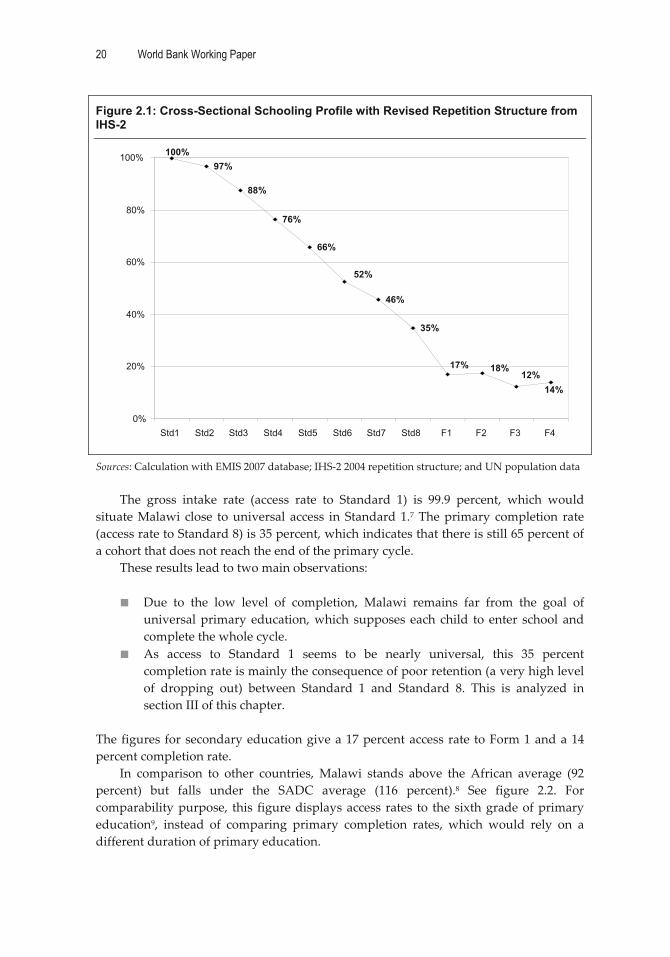
20 World Bank Working Paper
�
Figure 2.1: Cross-Sectional Schooling Profile with Revised Repetition Structure from IHS-2
�
Sources:�Calculation�with�EMIS�2007�database;�IHS�2�2004�repetition�structure;�and�UN�population�data��
The� gross� intake� rate� (access� rate� to� Standard� 1)� is� 99.9� percent,� which� would�situate�Malawi� close� to�universal� access� in�Standard�1.7�The�primary� completion� rate�(access�rate�to�Standard�8)�is�35�percent,�which�indicates�that�there�is�still�65�percent�of�a�cohort�that�does�not�reach�the�end�of�the�primary�cycle.�
These�results�lead�to�two�main�observations:��� Due� to� the� low� level� of� completion,� Malawi� remains� far� from� the� goal� of�
universal�primary� education,�which� supposes� each� child� to� enter� school� and�complete�the�whole�cycle.�
� As� access� to� Standard� 1� seems� to� be� nearly� universal,� this� 35� percent�completion�rate�is�mainly�the�consequence�of�poor�retention�(a�very�high�level�of� dropping� out)� between� Standard� 1� and� Standard� 8.� This� is� analyzed� in�section�III�of�this�chapter.��
�The�figures� for�secondary�education�give�a�17�percent�access�rate� to�Form�1�and�a�14�percent�completion�rate.�
In� comparison� to� other� countries,�Malawi� stands� above� the� African� average� (92�percent)� but� falls� under� the� SADC� average� (116� percent).8� See� figure� 2.2.� For�comparability�purpose,� this� figure�displays�access� rates� to� the�sixth�grade�of�primary�education9,� instead� of� comparing� primary� completion� rates,� which� would� rely� on� a�different�duration�of�primary�education.��
97%
88%
76%
66%
46%
35%
14%�12%�18%�17%
52%
100%
0%
20%�
40%�
60%�
80%�
100%�
Std1 Std2 Std3� Std4 Std5 Std6 Std7 Std8 F1 F2 F3� F4�
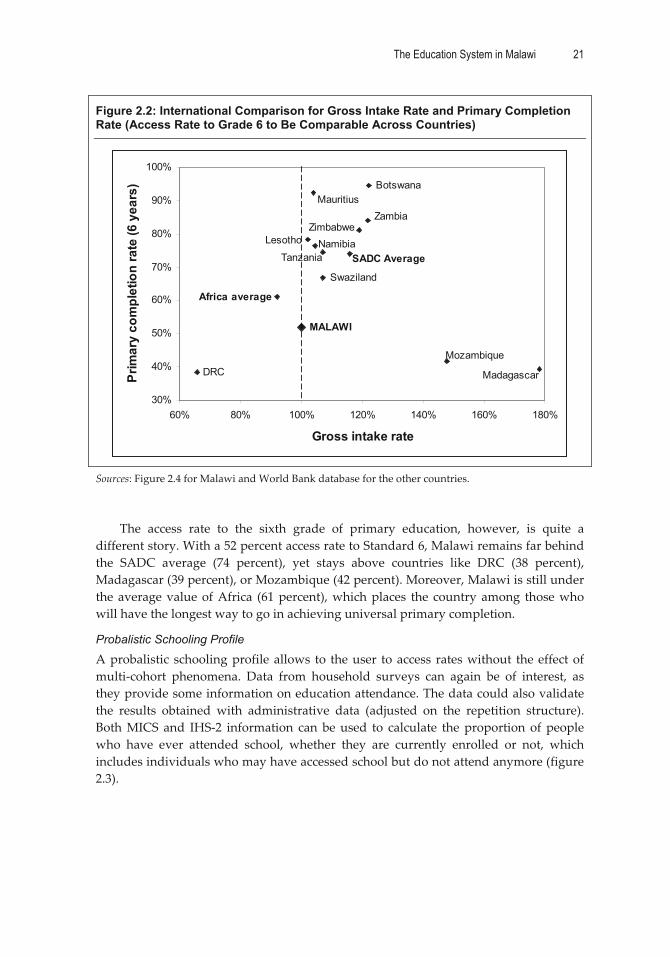
The Education System in Malawi 21
�
Figure 2.2: International Comparison for Gross Intake Rate and Primary Completion Rate (Access Rate to Grade 6 to Be Comparable Across Countries)
MALAWI
Botswana
DRC
Lesotho
Madagascar
Mozambique
Mauritius
Namibia
Swaziland
Tanzania
ZambiaZimbabwe
SADC Average
Africa average
30%
40%
50%
60%
70%
80%
90%
100%
60% 80% 100% 120% 140% 160% 180%
Gross intake rate
Prim
ary
com
plet
ion
rate
(6 y
ears
)
�
Sources:�Figure�2.4�for�Malawi�and�World�Bank�database�for�the�other�countries.���
The� access� rate� to� the� sixth� grade� of� primary� education,� however,� is� quite� a�different�story.�With�a�52�percent�access�rate�to�Standard�6,�Malawi�remains�far�behind�the� SADC� average� (74� percent),� yet� stays� above� countries� like� DRC� (38� percent),�Madagascar�(39�percent),�or�Mozambique�(42�percent).�Moreover,�Malawi�is�still�under�the�average�value�of�Africa� (61�percent),�which�places� the� country�among� those�who�will�have�the�longest�way�to�go�in�achieving�universal�primary�completion.�
Probalistic Schooling Profile
A�probalistic� schooling�profile�allows� to� the�user� to�access� rates�without� the�effect�of�multi�cohort� phenomena.� Data� from� household� surveys� can� again� be� of� interest,� as�they�provide�some�information�on�education�attendance.�The�data�could�also�validate�the� results� obtained� with� administrative� data� (adjusted� on� the� repetition� structure).�Both�MICS� and� IHS�2� information� can� be�used� to� calculate� the�proportion� of� people�who� have� ever� attended� school,� whether� they� are� currently� enrolled� or� not,� which�includes�individuals�who�may�have�accessed�school�but�do�not�attend�anymore�(figure�2.3).�

22 World Bank Working Paper
�
Figure 2.3: Percentage of People Who Have Ever Attended Primary School (by Age)
0%
20%
40%
60%
80%
100%
5 6 7 8 9 10 11 12 13 14 15 16 17 18 19 20
IHS 2004MICS 2006
�
Sources:�Calculation�from�MICS�2006�and�IHS�2�2004�databases.�Note:�In�the�MICS�questionnaire,�this�item�concerns�only�people�above�age�five.��
The�two�curves�are�almost�identical,�which�suggests�consistency�in�the�results.�The�proportion�of�individuals�who�have�accessed�Standard�1�is�only�60�percent�for�six�year�olds,� while� this� age�specific� group� is� the� official� one� that� should� access� school� each�year.�This�figure�is�40�percent�for�five�year�olds,�and�becomes�higher�for�children�ages�seven�and�above.�The�maximum�value�is�reached�for�age�11�(96�percent),�meaning�that�there�should�be�a� lot�of� late�enrollments,�and� little�probability�of�entering�Standard�1�after� 11.10� The� probability� for� a� cohort� to� access� Standard� 1� can� be� estimated� at� 96�percent.�The�full�probalistic�schooling�profile�computed�from�MICS�2006�is�presented�in�figure�2.4.11���
Figure 2.4: Probalistic Schooling Profile
72%
11%15%
21%25%
37%
48%
60%
80%
96%93%
88%
0%
20%
40%
60%
80%
100%
S1 S2 S3 S4 S5 S6 S7 S8 F1 F2 F3 F4 �
Source:�Calculation�from�MICS�2006�data.�

The Education System in Malawi 23
�
These� figures� are� consistent�with� those� based� on� administrative� data:� There� is� a�high� access� to� Standard� 1� of� primary� education,�with� an� estimated�probability� of� 96�percent,�which�would�confirm�a�near�universal�access�to�first�grade�(there�would�still�be� 4� percent� of� a� cohort�with� no� access� at� all� to� school).� Access� to� Standard� 8� is� 37�percent,�which� is� nearly� the� same� as� the� access� rate� computed�with� EMIS� data.� The�enrollment� for� secondary� education� is� different� (with� an� access� rate� to� Form� 1� of� 25�percent),� but�MICS� does� not� differentiate� between� general� secondary� education� and�technical�and�vocational�secondary�education,�so�this�figure�includes�part�of�TEVET.�
Survival Profile and Expected Schooling Profile (Pseudo-Cohort Analysis)
Focusing�now�on�the�children�that�entered�school,�it�is�possible�to�compute�a�survival�profile� (using�a�pseudo�cohort�method).�This� computes� the�share�of�pupils�attending�Standard� 1� who� will� access� the� other� standards:� Each� point� of� this� profile� is� the�retention� or� survival� rate� to� the� corresponding� standard,� calculated� from� the� actual�promotion�rates�of�one�standard�to�the�next�(see�table�2.5).���Table 2.5: Construction of Survival Profile
Estimated Non-Repeaters Using EMIS enrollment and
IHS-2 Repetition Rates* Promotion Rate
from One Standard to the Next One
Survival Profile 2006 2007
Standard 1 470,738 449,722 100% 100% Standard 2 416,945 424,851 424,851 / 470,738 = 90% 90 x 100 = 90% Standard 3 371,760 374,219 374,219 / 416,945 = 90% 90 x 90 x 100 = 81% Standard 4 307,873 316,741 316,741 / 307,873 = 85% 69% Standard 5 254,181 265,329 86% 59% Standard 6 197,270 205,288 81% 48% Standard 7 164,978 172,563 87% 42% Standard 8 119,641 125,674 76% 32%
Form 1 60,179 58,729 49% 16% Form 2 60,167 58,010 96% 15% Form 3 44,038 38,644 64% 10% Form 4 40,301 41,521 94% 9%
Source:�Calculations�from�EMIS�data�and�HIS�2�data.�*These�non�repeaters�are�not�reported�by�EMIS�but�estimated�with�EMIS�2006�and�2007�enrollment�per�grade,�on�which�was�applied�the�repetition�structure�reported�by�IHS�2�2004.��
If� the�promotion�rates�between�each�standard�remain�unchanged,� the�probability�for� a� child� attending� Standard� 1� to� reach� Standard� 6� is� 48� percent� and� to� reach�Standard�8�is�only�32�percent:12�This�clearly�remains�insufficient�to�reach�the�target�of�universal� primary� completion.� Figure� 2.5� shows� a� graphical� representation� of� the�survival�profile�from�2003–2007�using�the�same�method.���

24 World Bank Working Paper
�
Figure 2.5: Evolution of Survival Profile in Primary and Secondary Education, 2003–2007
5%10%
42%
59%
69%
81%
90%
100%
32%
48%
15%16%
3%7%
23%
0%
10%
20%
30%
40%
50%
60%
70%
80%
90%
100%
std1 std2 std3 std4 std5 std6 std7 std8 F1 F2 F3 F4
2007simplified 2003
�
Sources:�Calculation�from�EMIS�database�and�IHS�2�repetition�structure�for�primary�education.��
A�positive�evolution�of�retention�within�the�primary�level�can�be�seen,�even�if�it�is�still� lacking.� It� grew� from� 23� percent� in� 2003� to� 32� percent� in� 2007.� In� secondary�education,�retention�declined�after�2003.�
Finally,�combining�a�gross�intake�rate�(access�rate�to�Standard�1)�and�the�survival�profile13� can� lead� to� the� expected� schooling� profile� if� the� access� to� Standard� 1� and�retention�rates�remain�the�same�as�they�are�now.�For�Malawi,�since�the�gross�intake�rate�is�estimated�at�100�percent,�the�expected�schooling�profile�and�survival�profile�are�the�same.� If� the� present� condition� of� intake� and� promotion� between� grades� remains�unchanged,�it�is�expected�to�face�a�32�percent�primary�completion�rate�within�the�eight�years,�which�would�denote� a� decline,� considering� the� present� value� of� 35�percent� in�2007.��
Summary of Schooling Coverage: the Educational Pyramid Compared to Africa
The� educational� pyramid� (see� figure� 2.6� and� Appendix� 2.5� for� the� detailed�methodology)� summarizes� the� different� results� obtained� in� the� section� regarding�access,� retention,� and� completion� of� the� different� levels� of� primary� and� secondary�education,� as�well� as� coverage� in�higher� education� and�TEVET.�These� results� can�be�compared�to�the�SSA�average�pyramid�(see�figure�2.7).���

The Education System in Malawi 25
�
Figure 2.6: Educational Pyramid for Malawi (2007)
678910111213
Prim
ary
35%
100%
GER = 101%
49%
1415
Low
erS
econ
dary
18%17%GER = 18%
64%
1617
Upp
erS
econ
dary
Theoreticalages
14%12%GER = 14%
Technical/Vocational : 2% of Total secondary
Tertiary : 52 st./100,000 inhab.
�
Sources:�Calculation�from�EMIS�and�UN�population�data.��
Figure 2.7: Educational Pyramid for Sub-Saharan Africa (2005/06)
67891011
Prim
ary
61%
100%
GER = 99%
74%
121314
Low
erS
econ
dary 35%
45%GER = 47%
60%
151617
Upp
erS
econ
dary
Theoreticalages
17%
21%GER = 25%
Technical/Vocational : 6% of Total secondary
Tertiary : 538 st./100,000 inhab.
�
Source:�World�Bank�database.�

26 World Bank Working Paper
�
Understanding Dropouts at the Primary Level
Educational Supply Continuity
The�low�primary�completion�rate�is�mainly�due�to�high�level�of�dropouts�rather�than�to�a�lack�of�first�access�to�children�in�Standard�1.14�One�main�reason�that�students�drop�out�is�that�some�schools�are�incomplete.�A�school�that�does�not�provide�all�standards�forces�children� to� find� another� school� if� they� want� to� continue� primary� education.� This�introduces�the�problem�of�distance�and�some�pupils�drop�out�if�they�cannot�continue�attending� school� in� the� same� place.� Table� 2.6� shows� the� distribution� of� schools�according�to�the�number�of�standards�supplied�and�the�corresponding�share�of�pupils�enrolled�in�these�schools�in�2006�and�2007.���Table 2.6: Share of Schools and Pupils According to the Number of Standards Supplied
Number of Standards Supplied 2006 2007
% of Schools % of Pupils % of Schools % of Pupils 1 standard only 0.2 0.0 0.1 0.0 2 standards 1.8 0.4 1.5 0.4 3 standards 2.3 0.7 2.5 0.7 4 standards 7.1 2.9 7.2 2.9 5 standards 7.9 3.8 8.3 4.1 6 standards 6.8 3.9 6.4 3.8 7 standards 5.8 3.8 6.3 4.0 Total Incomplete Schools 31.9 15.5 32.3 16.0 8 standards 68.1 84.5 67.7 84.0 Total 100.0 100.0 100.0 100.0
Source:�Calculation�from�EMIS�databases.��
The� proportion� of� incomplete� primary� schools� is� around� 32� percent� and� the�corresponding� schools� enroll� 16� percent� of� the� pupils.� Among� them,� some� will�probably�be�exposed�to�a�high�dropout�risk.��
This�result�is�based�on�a�static�analysis�and�probably�overestimates�the�number�of�cases�where�pupils�face�discontinuity�in�the�educational�supply.�Indeed,�among�those�incomplete�schools,�some�are�likely�to�provide�educational�continuity�from�one�year�to�another�by�setting�up�new�classes�as�the�students�progress�through�the�primary�cycle.�(This�can�be�the�case�with�new�schools.)�With�data�from�two�consecutive�school�years�the�number�of�pupils�who�couldn’t�attend�the�next�standard�in�the�following�year�can�be�measured.�Table�2.7�shows�the�results�for�Malawi,�based�on�2006–2007�school�data.��
At� the� national� level,� there� are� few� situations� of� supply� discontinuity� between�Standard�1�and�Standard�4.�For�instance,�only�0.11�percent�of�pupils�attending�Standard�1�in�2006�were�in�a�school�that�didn’t�provide�Standard�2�in�2007.�This�discontinuity�is�0.69�percent�between�standards�2�and�3,�and�0.83�percent�between�standards�3�and�4.�In�2006,�only�1.6�percent15�of�pupils�attending�Standard�1�were�enrolled�in�a�school�that�did�not�provide� supply� continuity� until� Standard� 4.� This� small� proportion� should� not� have�strong�consequences�on�retention�within�the�first�four�standards.��
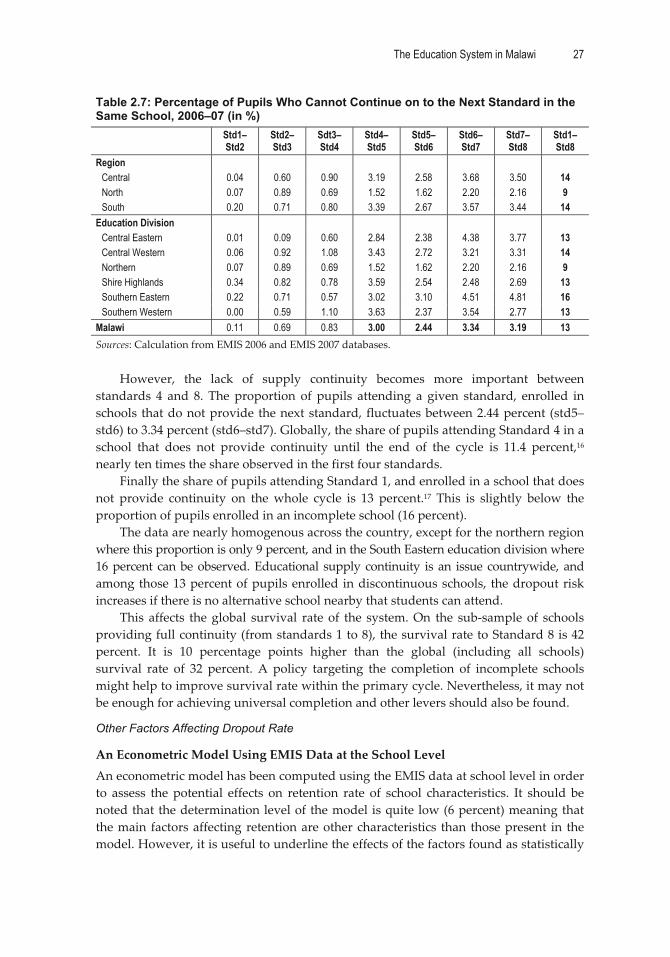
The Education System in Malawi 27
�
Table 2.7: Percentage of Pupils Who Cannot Continue on to the Next Standard in the Same School, 2006–07 (in %)
Std1–Std2
Std2–Std3
Sdt3–Std4
Std4–Std5
Std5–Std6
Std6–Std7
Std7–Std8
Std1–Std8
Region Central 0.04 0.60 0.90 3.19 2.58 3.68 3.50 14 North 0.07 0.89 0.69 1.52 1.62 2.20 2.16 9 South 0.20 0.71 0.80 3.39 2.67 3.57 3.44 14
Education Division Central Eastern 0.01 0.09 0.60 2.84 2.38 4.38 3.77 13 Central Western 0.06 0.92 1.08 3.43 2.72 3.21 3.31 14 Northern 0.07 0.89 0.69 1.52 1.62 2.20 2.16 9 Shire Highlands 0.34 0.82 0.78 3.59 2.54 2.48 2.69 13 Southern Eastern 0.22 0.71 0.57 3.02 3.10 4.51 4.81 16 Southern Western 0.00 0.59 1.10 3.63 2.37 3.54 2.77 13
Malawi 0.11 0.69 0.83 3.00 2.44 3.34 3.19 13 Sources:�Calculation�from�EMIS�2006�and�EMIS�2007�databases.��
However,� the� lack� of� supply� continuity� becomes� more� important� between�standards� 4� and� 8.� The� proportion� of� pupils� attending� a� given� standard,� enrolled� in�schools� that�do�not�provide�the�next�standard,� fluctuates�between�2.44�percent� (std5–std6)�to�3.34�percent�(std6–std7).�Globally,�the�share�of�pupils�attending�Standard�4�in�a�school� that� does� not� provide� continuity� until� the� end� of� the� cycle� is� 11.4� percent,16�nearly�ten�times�the�share�observed�in�the�first�four�standards.�
Finally�the�share�of�pupils�attending�Standard�1,�and�enrolled�in�a�school�that�does�not� provide� continuity� on� the�whole� cycle� is� 13� percent.17� This� is� slightly� below� the�proportion�of�pupils�enrolled�in�an�incomplete�school�(16�percent).��
The�data�are�nearly�homogenous�across�the�country,�except�for�the�northern�region�where�this�proportion�is�only�9�percent,�and�in�the�South�Eastern�education�division�where�16�percent� can�be�observed.�Educational� supply�continuity� is� an� issue� countrywide,� and�among�those�13�percent�of�pupils�enrolled� in�discontinuous�schools,� the�dropout�risk�increases�if�there�is�no�alternative�school�nearby�that�students�can�attend.�
This� affects� the�global� survival� rate�of� the� system.�On� the� sub�sample�of� schools�providing�full�continuity�(from�standards�1�to�8),�the�survival�rate�to�Standard�8�is�42�percent.� It� is� 10� percentage� points� higher� than� the� global� (including� all� schools)�survival� rate� of� 32� percent.� A� policy� targeting� the� completion� of� incomplete� schools�might�help�to�improve�survival�rate�within�the�primary�cycle.�Nevertheless,�it�may�not�be�enough�for�achieving�universal�completion�and�other�levers�should�also�be�found.�
Other Factors Affecting Dropout Rate
An�Econometric�Model�Using�EMIS�Data�at�the�School�Level�An�econometric�model�has�been�computed�using�the�EMIS�data�at�school�level�in�order�to� assess� the�potential� effects� on� retention� rate� of� school� characteristics.� It� should� be�noted�that�the�determination�level�of�the�model�is�quite�low�(6�percent)�meaning�that�the�main� factors�affecting� retention�are�other�characteristics� than� those�present� in� the�model.�However,�it�is�useful�to�underline�the�effects�of�the�factors�found�as�statistically�

28 World Bank Working Paper
�
significant�for�explaining�differences�on�retention�rate�across�schools�(see�the�model�in�Appendix�2.5).�
Repetition� and� the� student�teacher� ratio� have� negative� significant� effects� on�retention.18�Repetition�is�the�factor�that�has�the�highest�quantitative�negative�effect.�This�must� be� related� to� parents’� perception� of� school.� A� high� repetition� rate� in� primary�education� may� be� considered� by� parents� as� a� reason� why� their� children� shouldn’t�continue� to� attend� school,� increasing� the� dropout� risk.� International� studies� (Mingat�and� Sosale,� 2001)� done� in� 50� countries� have� confirmed� this,� showing� that� one�percentage�point�less�of�repetition�is�associated�with�an�increase�of�survival�rate�by�0.8�percentage�point�(for�more�details�see�Chapter�4).��
Temporary�and�open�air�classrooms�also�have�a�negative�effect�on�child�retention�within�the�whole�primary�cycle.�“However,�there�is�no�empirical�evidence�proving�that�school�equipment�(e.g.,�electricity,�water,� library,�and�latrine)�has�a�negative�effect�on�retention.”�
A�policy� targeting� i)� the� completion�of� incomplete� schools� and� ii)� a� reduction� in�repetition�(from�20�percent�to�10�percent)�might�help�to�increase�the�global�retention�in�primary�education�from�32�to�50�percent.�Ten�percent�more�would�be�due�to�the�supply�of� educational� continuity� and� 8� percent�more� (0.8� x� (20%� –� 10%))�would� come� from�repetition�reduction.�
Reasons�for�Dropping�Out�As�Declared�by�School�Heads�and�Students�It� is� useful� to� complement� the� previous� quantitative� analysis� with� more� qualitative�information�that�could�be�gathered�from�declarations�of�school�heads�(EMIS�2007)�and�from�students�themselves�(IHS�2�2004).��
In� EMIS� 2007� (table� 2.8),� the�main� reason� given� by� school� heads� for� explaining�dropout� is� the� family� responsibilities� of� the� students� (44� percent� for� boys� and� 41�percent�for�girls).�Hidden�within�this�reason�could�be�children�who�drop�out�of�school�because�they�become�heads�of�household�as�a�result�of�the�death�of�their�parents.��
Marriage�appears�to�be�a�major�issue,�particularly�for�girls.�Marriage�is�responsible�for�9�percent�of�dropouts�as�declared�by�school�heads.�It�increases�after�Standard�5�and�reaches�41�percent�at�the�end�of�the�cycle.��
Pregnancy� is� also� the� reason� that� 4� percent� of� all� girls� drop� out,� starting�with� 2�percent�in�Standard�4�and�reaching�21�percent�in�Standard�8.�These�figures�seem�to�be�consistent�with�information�from�EMIS�2007,�stating�that�69�percent�of�girls�attending�Standard� 8� are� over�age� (more� than� 13� years� old),� with� 22� percent� being� over� 16.�Another�report�(MICS,�2006)�mentions�that�15�percent�of�women�have�their�first�birth�between�16�and�18�years�of�age.��
Employment� is� stated� as� the� main� reason� in� 12� percent� of� the� cases� for� boys;�sickness�and�death�account�for�a�total�4�percent.�
IHS�2� 2004� provides� similar� information,� but� this� time� as� declared� by� students�themselves�(see�table�2.9).�
Three� main� reasons� (75� percent� of� the� explanations)� are� given� by� students� to�explain�dropouts:���
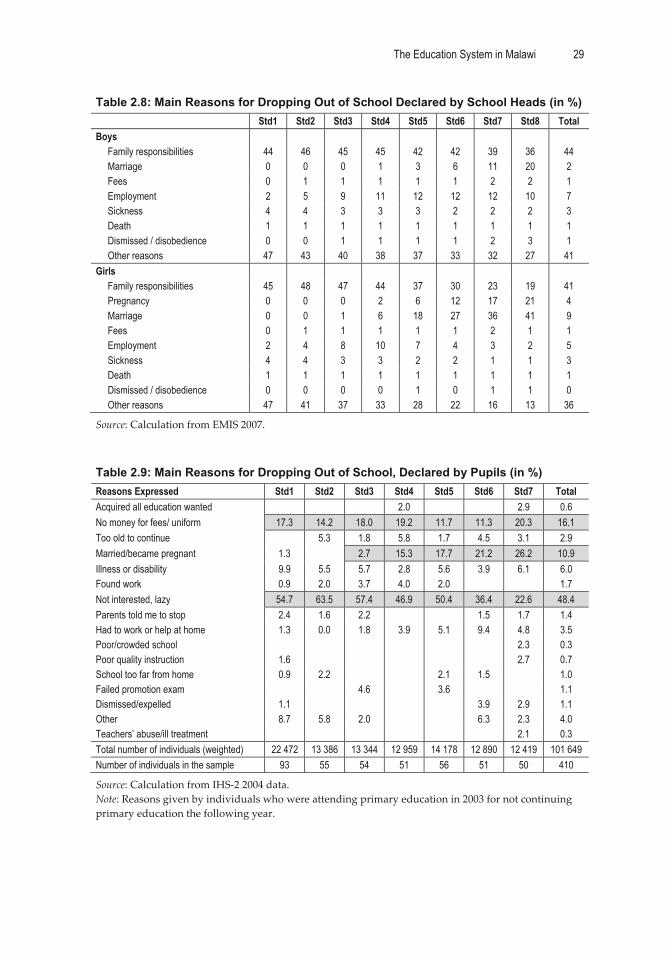
The Education System in Malawi 29
�
Table 2.8: Main Reasons for Dropping Out of School Declared by School Heads (in %) Std1 Std2 Std3 Std4 Std5 Std6 Std7 Std8 Total Boys
Family responsibilities 44 46 45 45 42 42 39 36 44 Marriage 0 0 0 1 3 6 11 20 2 Fees 0 1 1 1 1 1 2 2 1 Employment 2 5 9 11 12 12 12 10 7 Sickness 4 4 3 3 3 2 2 2 3 Death 1 1 1 1 1 1 1 1 1 Dismissed / disobedience 0 0 1 1 1 1 2 3 1 Other reasons 47 43 40 38 37 33 32 27 41
Girls Family responsibilities 45 48 47 44 37 30 23 19 41 Pregnancy 0 0 0 2 6 12 17 21 4 Marriage 0 0 1 6 18 27 36 41 9 Fees 0 1 1 1 1 1 2 1 1 Employment 2 4 8 10 7 4 3 2 5 Sickness 4 4 3 3 2 2 1 1 3 Death 1 1 1 1 1 1 1 1 1 Dismissed / disobedience 0 0 0 0 1 0 1 1 0 Other reasons 47 41 37 33 28 22 16 13 36
Source:�Calculation�from�EMIS�2007.���Table 2.9: Main Reasons for Dropping Out of School, Declared by Pupils (in %) Reasons Expressed Std1 Std2 Std3 Std4 Std5 Std6 Std7 Total Acquired all education wanted 2.0 2.9 0.6 No money for fees/ uniform 17.3 14.2 18.0 19.2 11.7 11.3 20.3 16.1 Too old to continue 5.3 1.8 5.8 1.7 4.5 3.1 2.9 Married/became pregnant 1.3 2.7 15.3 17.7 21.2 26.2 10.9 Illness or disability 9.9 5.5 5.7 2.8 5.6 3.9 6.1 6.0 Found work 0.9 2.0 3.7 4.0 2.0 1.7 Not interested, lazy 54.7 63.5 57.4 46.9 50.4 36.4 22.6 48.4 Parents told me to stop 2.4 1.6 2.2 1.5 1.7 1.4 Had to work or help at home 1.3 0.0 1.8 3.9 5.1 9.4 4.8 3.5 Poor/crowded school 2.3 0.3 Poor quality instruction 1.6 2.7 0.7 School too far from home 0.9 2.2 2.1 1.5 1.0 Failed promotion exam 4.6 3.6 1.1 Dismissed/expelled 1.1 3.9 2.9 1.1 Other 8.7 5.8 2.0 6.3 2.3 4.0 Teachers’ abuse/ill treatment 2.1 0.3 Total number of individuals (weighted) 22 472 13 386 13 344 12 959 14 178 12 890 12 419 101 649 Number of individuals in the sample 93 55 54 51 56 51 50 410
Source:�Calculation�from�IHS�2�2004�data.�Note:�Reasons�given�by�individuals�who�were�attending�primary�education�in�2003�for�not�continuing�primary�education�the�following�year.�
�
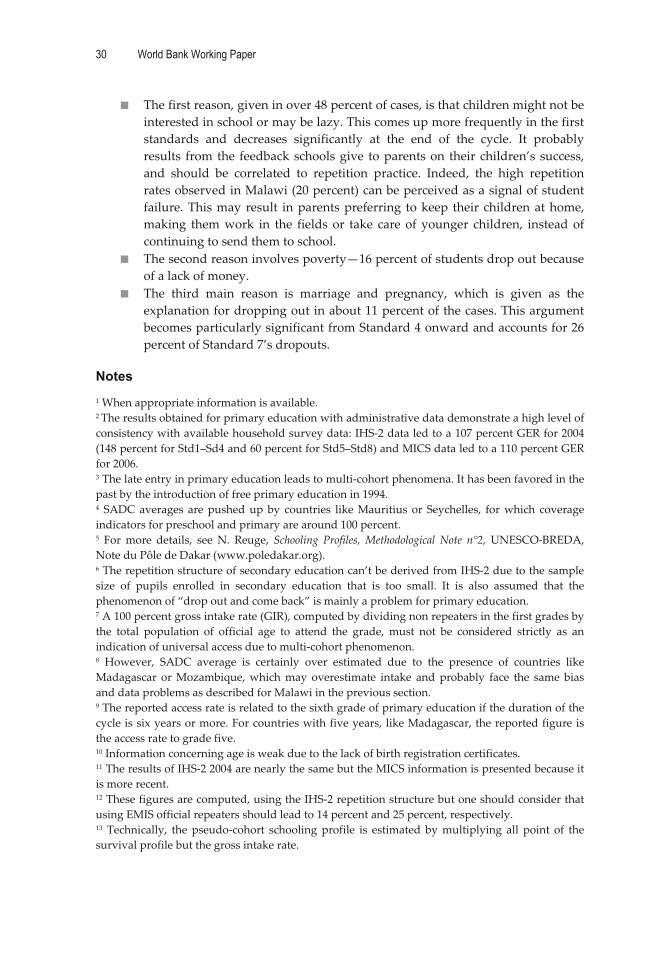
30 World Bank Working Paper
�
� The�first�reason,�given�in�over�48�percent�of�cases,�is�that�children�might�not�be�interested�in�school�or�may�be�lazy.�This�comes�up�more�frequently�in�the�first�standards� and� decreases� significantly� at� the� end� of� the� cycle.� It� probably�results� from�the� feedback�schools�give� to�parents�on� their� children’s� success,�and� should� be� correlated� to� repetition� practice.� Indeed,� the� high� repetition�rates�observed�in�Malawi�(20�percent)�can�be�perceived�as�a�signal�of�student�failure.�This�may�result� in�parents�preferring� to�keep� their� children�at�home,�making� them�work� in� the� fields� or� take� care� of� younger� children,� instead�of�continuing�to�send�them�to�school.��
� The�second�reason�involves�poverty—16�percent�of�students�drop�out�because�of�a�lack�of�money.�
� The� third� main� reason� is� marriage� and� pregnancy,� which� is� given� as� the�explanation�for�dropping�out�in�about�11�percent�of�the�cases.�This�argument�becomes�particularly�significant�from�Standard�4�onward�and�accounts�for�26�percent�of�Standard�7’s�dropouts.�
Notes �1�When�appropriate�information�is�available.�2�The�results�obtained�for�primary�education�with�administrative�data�demonstrate�a�high�level�of�consistency�with�available�household�survey�data:�IHS�2�data�led�to�a�107�percent�GER�for�2004�(148�percent�for�Std1–Sd4�and�60�percent�for�Std5–Std8)�and�MICS�data�led�to�a�110�percent�GER�for�2006.�3�The�late�entry�in�primary�education�leads�to�multi�cohort�phenomena.�It�has�been�favored�in�the�past�by�the�introduction�of�free�primary�education�in�1994.�4� SADC�averages� are�pushed�up�by� countries� like�Mauritius�or� Seychelles,� for�which� coverage�indicators�for�preschool�and�primary�are�around�100�percent.�5� For�more� details,� see�N.� Reuge,� Schooling� Profiles,�Methodological� Note� n°2,�UNESCO�BREDA,�Note�du�Pôle�de�Dakar�(www.poledakar.org).�6�The�repetition�structure�of�secondary�education�can’t�be�derived�from�IHS�2�due�to�the�sample�size� of� pupils� enrolled� in� secondary� education� that� is� too� small.� It� is� also� assumed� that� the�phenomenon�of�“drop�out�and�come�back”�is�mainly�a�problem�for�primary�education.�7�A�100�percent�gross�intake�rate�(GIR),�computed�by�dividing�non�repeaters�in�the�first�grades�by�the� total� population� of� official� age� to� attend� the� grade,� must� not� be� considered� strictly� as� an�indication�of�universal�access�due�to�multi�cohort�phenomenon.�8� However,� SADC� average� is� certainly� over� estimated� due� to� the� presence� of� countries� like�Madagascar� or�Mozambique,�which�may� overestimate� intake� and� probably� face� the� same�bias�and�data�problems�as�described�for�Malawi�in�the�previous�section.�9�The�reported�access�rate�is�related�to�the�sixth�grade�of�primary�education�if�the�duration�of�the�cycle�is�six�years�or�more.�For�countries�with�five�years,� like�Madagascar,�the�reported�figure�is�the�access�rate�to�grade�five.��10�Information�concerning�age�is�weak�due�to�the�lack�of�birth�registration�certificates.�11�The�results�of�IHS�2�2004�are�nearly�the�same�but�the�MICS�information�is�presented�because�it�is�more�recent.�12�These�figures�are�computed,�using�the�IHS�2�repetition�structure�but�one�should�consider�that�using�EMIS�official�repeaters�should�lead�to�14�percent�and�25�percent,�respectively.��13� Technically,� the� pseudo�cohort� schooling�profile� is� estimated� by�multiplying� all� point� of� the�survival�profile�but�the�gross�intake�rate.��
The Education System in Malawi 31
�
�14�Analysis� of� the� factors� explaining� the� lack�of� access� some� children�have� to� Standard� 1� (four�percent� according� to� the� probalistic� schooling� profile)� has� also� been� done.� The� results� of� this�analysis�are�presented�in�Appendix�2.4.�15�1.6%�=�1�(1�0.11%)�x�(1�0.69%)�x�(1�0.83%)�16�11.4%�=�1�(1�3%)�x�(1�2.44%)�x�(1�3.34%)�x�(1�3.19%)�17�13%=�1�(1�0.11%)�x�(1�0.69%)�x�(1�0.83%)�x�(1�3%)�x�(1�2.44%)�x�(1�3.34%)�x�(1�3.19%)�18� Even� if� there� is� a� link� between� repetition� and� the� student�teacher� ratio,� non�collinearity� is�observed�between�those�two�variables.�

32
CHAPTER �3 �
Education�Expenditure��and�Financing�
Summary of the Chapter
The�total�public�recurrent�expenditure�for�education�amounted�to�MK22.3�billion�in�the�2007/08� fiscal� year.� This� represents� 19.4� percent� of� total� government� recurrent�expenditures�and�is�an�increase�compared�to�2001/02�(16�percent).�However,�the�budget�share� for�education�can�certainly�be� increased� further.� In� the� ten� low�income�African�countries� that�most� highly� prioritize� their� education� system,� the� share� for� education�averages� 28.8� percent.� Unfortunately,� preliminary� data� for� 2008/09� indicates� a�decreasing� trend� that�would� prevent�Malawi� from� catching� up�with� both� the� SADC�average� (20.8� percent)� and� the� Education� for� All�Fast� Track� Initiative� (EFA�FTI)�reference�benchmark�(20�percent).�
The�2000–2008�trends�show�a�decrease�in�the�priority�of�primary�education�to�the�benefit�of�higher�education.�In�2008,�Malawi’s�allocation�to�primary�education�is�one�of�the� lowest� (at� 32.5� percent)� in� the� continent� where� the� average� is� 44.4� percent.�Compared� to� other� countries,� Malawi� prioritizes� higher� and� secondary� education�above�primary�education.�Malawi’s�recurrent�allocations�to�both�secondary�and�higher�education�are�above�average—40.4�percent�against�an�SSA�average�of�34.4�percent�for�secondary� education� and� 27� percent� against� an� average� of� 21� percent� in� higher�education.�
Malawi�has�made�comparatively�poor�budget�allocations�to�the� largest�education�sub�sector—primary�education—so� the�public� recurrent�unit� cost� for�primary� is�very�low.� In�2007/08,� the� recurrent�expenditure�per� student� in�primary�education� stood�at�around�MK3,000�which�is�equivalent�to�only�8.3�percent�of�GDP�per�capita�(compared�to�12�percent�on�average�in�the�SADC�region�and�11�percent�in�SSA).�At�the�secondary�level,� the�public�unit� cost� is�estimated� to�be�MK30,300� (83�percent�of�GDP�per�capita�versus�30�percent�for�the�SSA�average)�and�it�is�four�times�higher�(in�terms�of�GDP�per�capita)� than� it�was� in� 2000.�However,� this� average� unit� cost� for� secondary� hides� the�disparities� that� exist� between� the� conventional� and� the� Community� Day� Secondary�Schools,� at� the� detriment� of� the� latter.� TEVET,�when� parallel� students� are� included,�costs� the� government� MK136,500� per� year� per� student� (equivalent� to� 45� times� the�primary�unit�cost).�Finally,�the�public�recurrent�unit�cost�of�university�education�is�the�highest� in� the� world� in� terms� of� GDP� per� capita� (2,147� percent� of� GDP� per� capita,�which� is� seven� times�more� than� the� SSA�average).� In� fact,� one�year�of� study� for� one�
The Education System in Malawi 33
�
university� student�costs� the�same�amount� to� the�government�as�one�year�of� study�of�259�primary�school�pupils.�
Unit� cost� in�primary� education� is� low,�mainly�because�of� the�very�high� student�teacher�ratio�(80:1�vs.�48:1�for�the�SSA�average)�and�the�small�amount�of�other�recurrent�transactions�(ORT)�allocated�to�primary�education.�Inversely,�the�secondary�education�unit�cost�is�high�because�the�student�teacher�ratio�is�low�(20:1�compared�to�28:1�for�the�SSA� average)� while� their� ORT� is� relatively� higher� than� in� primary� education.� The�extremely� high� unit� cost� in� higher� education� is� mainly� due� to� a� very� low� student�lecturer� ratio� (11:1�which� is� below� the�Organisation� for� Economic� Co�operation� and�Development� [OECD]� average� of� 16:1� and� equivalent� to� half� the� SSA� average)� and�comparatively� high� teacher� salaries� (64� units� of� GDP� per� capita,� compared� to� an�average�of�19�units�of�GDP�per�capita� in� the� five�economically�similar�countries�with�available�data).�Malawi�has�a�very�small�university�student�population,�which�does�not�help�reduce�unit�cost�by�economies�of�scale.�
The�total�household�spending�on�education�is�estimated�to�be�1.43�percent�of� the�GDP�(MK4.4�billion�in�2004),�a�relatively�low�value�when�compared�to�the�2�percent�of�GDP� average� in� SSA.� Primary� education� is� mostly� funded� by� public� resources� (92�percent� of� the� total� cost),� which� is� in� line� with� the� implementation� of� free� primary�education�and� the�Millennium�Development�Goal� (MDG).�The� cost�sharing� structure�between� public� and� private� funding� is� the� same� in� higher� education� as� in� primary�education�with�92�percent�of� the� financing�coming�from�public�resources.� It� raises�an�equity�issue�in�the�way�education�public�resources�are�allocated�because�i)�90�percent�of�the�students�at�higher�education�are�from�the�wealthiest�20�percent�of�households�(see�Chapter� 5),� and� ii)� the� students� get� very� high� level� of� private� returns� (salaries)�when�working� after� graduation� (see� Chapter� 8).� It� would� be� relevant� to� discuss� ways� to�progress�towards�a�more�equitable�cost�sharing�of�the�higher�education�service�delivery.��
*�*�*��This� chapter� analyzes� and� reviews� recurrent� and� development� expenditures� in� the�education�sector�and�is�divided�into�six�sections:�
� Section�I�analyzes�the�2007/08�total�public�recurrent�expenditure�for�education�activities,� compares� the� budget� priority� for� education� with� other� countries,�and� presents� the� breakdown� of� recurrent� expenditure� by� the� nature� of�spending.��
� Section� II� presents� the� breakdown� of� total� public� recurrent� expenditure� by�level� of� schooling,� its� evolution� from� 1995/96� to� 2007/08� and� compares� the�2007/08�situation�with�comparable�countries.��
� Section� III�analyzes� recurrent�unit� costs�by� level�of�education�and� includes�a�comparative�analysis�of�teachers’�salaries.��
� Section�IV�discusses�household�education�financing�by�type�of�spending�and�by�family�level�of�income.��
� Section�V�presents�development�partners�for�education�expenditures.�� Section�VI�addresses�school�building�costs.��
34 World Bank Working Paper
�
Total Public Recurrent Expenditure for Education
Malawi’s Budgetary System (with Adjustments Made for Analytical Purposes)
Education� sector� public� expenditures� fall� into� two� categories:� recurrent� and�development� (or� capital).� The� recurrent� expenditures� are� financed� by� domestic�revenues�from�taxes�and�non�tax�sources�and�from�budget�support�grants.��
The�development�expenditures�are�financed�by�multilateral�and/or�bilateral� loans�or�grants�and�from�governments’�own�resource�counterparts.�In�the�Malawian�budget�typology,� the� recurrent� expenditures� are� divided� in� two� main� categories:� personal�emolument�(PE)�and�other�recurrent�transactions�(ORT).��
For� analytical� purposes,� several� adjustments� have� been� made� for� analyzing�expenditures�in�a�more�detailed�way�and�for�capturing�all�expenditures�for�education�and� training� activities.� The� first� type� of� adjustment� was� made� to� the� different�categories� of� recurrent� expenditures.� In� order� to� get� more� details� and� to� be� more�accurate,�a�thorough�review�was�done�of�all�budget�lines�by�cost�center�for�reallocating�the�different�recurrent�expenditures�into�four�categories:��
� personal�expenditures;��� student�welfare�expenditures;��� subventions�to�institutions;�and��� ORT.��
It� is� important� to� note� that� leave� grant/disturbance� allowances� have� been� subtracted�from�ORT�and�included�in�personal�expenditures�and�that�student�welfare�expenditure�includes�boarding�expenses�and�student�grants.�
The�second� type�of�budget�data�adjustments�captures�all�public�expenditures� for�the�education�sector�by�including�expenditures�for�education/training�activities�that�are�charged�to�ministries�other�than�the�Ministry�of�Education.�Such�is�the�case�with:�
� decentralized� expenditures� reported� in� the� budget� under� city� and� district�assemblies;��
� early� childhood� development� and� literacy� program� expenditures� that� are�charged�under�the�Ministry�of�Women�and�Child�Development;��
� the� subventions� to� public� universities� and� to� some� other� education� or�education�related� institutions� (other� subvented�organizations),� as�well� as� the�student�grants�that�are�reported�in�the�Ministry�of�Finance�budget;�and��
� the�public�expenditures�devoted� to�some�vocational� training� institutions� that�are�charged�under�different�ministries,�such�as�the�Ministry�of�Agriculture�or�Ministry�of�Energy�and�Mines�(the�full�list�is�presented�in�Appendix�3.2).�
Share for Education in the Total Public Recurrent Expenditure and Comparison with Other Countries (2007/08)
The� data� presented� are� based� on� the� 2007/08� revised� estimates,� which� are� more�accurate� than� the� 2007/08� approved� budget� and�more� recent� than� available� data� on�actual�expenditures.1�When� including�all� the�expenses�on�education�activities�outside�the� Ministry� of� Education� budget,� the� 2007/08� recurrent� expenditures� add� up� to�MK22.3� billion,� compared� to� MK14.5� billion� when� only� counting� the� expenditure�reported� under� the� Ministry� of� Education� (see� table� 3.1).� This� is� a� significant� raise�

The Education System in Malawi 35
�
compared�to�2001/02�(16�percent�of�total�public�recurrent�expenditure�and�3.7�percent�of� GDP),� which� shows� an� increase� in� the� priority� given� to� education� in� budget�allocation.�Nevertheless,�it�will�be�important�to�follow�up�in�the�coming�years�because�the�first�data�available�for�the�2008/09�budget�seems�to�show�a�decrease�from�2007/08.���Table 3.1 Education Public Recurrent Expenditure
Ministry of Education Only All Ministries with Education Activities Education Recurrent Expenditure (MK millions) 14,520 22,311
as a % of total recurrent expenditure 12.6 19.4 as a % of GDP 3.1 4.8
Source:�Calculations�from�the�revised�07/08�Ministry�of�Finance�budget���
When� compared� to� other� SADC� countries,� Malawi� positions� itself� as� a� median�country�in�terms�of�budget�priority�for�the�education�sector�(see�table�3.2).�Out�of�the�12�countries� with� recent� available� data,� Malawi� ranks� 6th� for� its� share� of� recurrent�expenditures� devoted� to� education.� Malawi� is� slightly� below� the� SADC� countries�average� (19.4� percent� versus� 20.8� percent)� and� the� SSA� average� (20.3� percent).� The�budget�priority�for�education�in�Malawi�is�still�much�smaller�than�what�is�observed�in�countries�like�Madagascar,�Tanzania,�Lesotho,�or�Kenya�where�the�share�for�education�is�around�30�percent�or�above.���Table 3.2: Percentages for Education in Public Recurrent Expenditure, SADC countries
Percentages for Education in
Public Recurrent Expenditures Lesotho 31.5 Tanzania 29.7 Madagascar 28.7 Botswana 27.6 Mozambique 25.6 Malawi 19.4 South Africa 18.6 Swaziland 17.7 Zambia 16.8 Seychelles 13.5 Mauritius 13.0 Congo, Dem. Rep. 7.1 Average SADC countries 20.8 Average SSA countries 20.3
Sources:�Calculations�from�the�revised�07/08�Ministry�of�Finance�budget�for�Malawi�and�the�World�Bank�for�the�other�countries.�Note:�Data�are�from�2008�or�thereabouts.��

36 World Bank Working Paper
�
Figure 3.1: Domestic Resources as a Percentage of GDP and Budget Allocation Towards Education, SSA Countries
CAR
Niger
Mada
Cam
Guinea
BF
TanzSL
Uga
Com
Rwan
Moz
Mali
EthioZamb
BeninTogo
DRC
RCI
Sudan
Malawi 2008
Malawi 2002
Bur
Bissau
Gamb
Kenya
GhanaSen
Mauritania
Chad
CV S Af.
GabonSwaz
Eritrea
Botswana
Nigeria Congo
0
5
10
15
20
25
30
35
40
5 10 15 20 25 30 35 40 45 50
Domestic resources as % of GDP (excl. grants)
% o
f edu
catio
n in
recu
rrent
expe
nditu
re
Better macroeconomics context but lower budget priority for education
Worse macroeconomics context but higher budget priority for education
Worse macroeconomics context and lower budget priority for education
�
Sources:�Calculations�from�the�revised�07/08�Ministry�of�Finance�budget�and�World�Bank�data.�Note:�Data�are�from�2008�or�thereabouts.� �
Figure� 3.1� combines� the� data� on� domestic� resources� (as� a� percentage� of� GDP—described� in� Chapter� 1� of� this� report)� and� on� the� share� for� education� in� recurrent�expenditures� for� 37� African� countries.� If� the� two� indicators� are� high,� a� country�will�have�a�good�amount�of�resources�for�education�activities.�This�is�the�ideal�situation�for�all�SSA�countries.��
Countries� in� the� top�right� quadrant� of� figure� 3.1� have� a� good� macroeconomic�scenario� and� a� high� allocation� of� the� total� national� budget� towards� education.� The�countries� in� the� bottom�right� quadrant� have� a� better� than� average� macroeconomic�context�but�a� lower� than�average�allocation� towards�education.�Countries� situated� in�the� top�left� quadrant� have� a� below�average� macroeconomic� context� but� a� high�allocation�of�the�total�national�budget�towards�education.�Countries�in�the�bottom�left�quadrant� have� both� a� below�average� macroeconomic� scenario� and� a� below�average�budget�allocation�towards�education.��
Although�Malawi�is�progressing�towards�the�average�mark,�which�happens�to�be�the�point�of�intersection�of�the�four�quadrants,�the�country�still�falls�into�the�bottom�left�quadrant.� This� indicates� that� Malawi� still� needs� to� improve� its� macroeconomic�condition�and�also�allocate�more�of�its�total�national�budget�towards�education.��
Decomposition of Total Public Recurrent Expenditure by Type of Spending
In�addition�to�the�information�in�section�I.1�regarding�data�adjustments,�it�is�important�to� note� two� additional� methodological� points� on� the� following� estimations.� First,� it�appeared� after� cross�checking� the� budget� data�with� the�EMIS�data� that� the� salary� of�some�secondary�school�teachers�(those�who�have�the�certificate�for�normally�teaching�

The Education System in Malawi 37
�
only�in�primary�schools)�was�reported�in�the�budget�data�under�the�primary�education�component� instead� of� being� included� in� the� secondary� education� component.2�Therefore,�an�adjustment�has�been�made�to�reallocate�those�teachers’�salaries�under�the�secondary� education� component.� The� second� methodological� point� relates� to� the�administrative� costs� that� cannot� be�primarily� allocated� to� one� single� specific� level� of�schooling� (for� example� the� expenditure� of� central� level� administration� units).� For�analytic� and� comparative� purposes,� calculations� have� been� done� to� make� pro�rata�distributions�of�this�kind�of�expenditure�across�the�different�levels�of�schooling.3�
With� this� done,� the� education� public� recurrent� expenditures� for� financial� year�2007/08� can� be� broken� down� into� the� four�major� functional� groups� (as� described� in�section�I.1)�and�by�level�of�education.�Table�3.3�shows�the�result�of�this�breakdown.��
In�the�education�sector�as�a�whole,�the�highest�share�of�recurrent�expenditures�(70�percent)� was� allocated� to� personal� expenditure� while� 24� percent� of� all� recurrent�expenditures�went� towards� operating� costs� (for� example,� transport,� travels,� funerals�allowance)�or�ORT.�Student�welfare�and� subventions� to� institutions� together�account�for�6�percent�of�total�recurrent�expenditures.��
A� large� share� (58� percent)� of� the� division’s� budget� for� ORT� was� passed� on� to�teachers� in� the� form� of� allowances� and� other� subsidies� such� as� coffins,� while�departments�spent�nearly�their�entire�budget�on�transport�costs,�of�which�funeral�use�reportedly�accounted�for�more�than�half�of�vehicle�usage�(Bellew,�2008).�Coffins�alone�consumed� an� estimated� 11�percent� of� the�divisions’�ORT�budgets.� Expenditures� that�directly�benefit�students,�schools,�and�the�community�were�a�miniscule�share�of� total�expenditure� and� came� mainly� through� donor�financed� projects,� such� as� the� School�Grant�Whole�School�Development�pilot.���Table 3.3: Breakdown of Total Public Recurrent Expenditure by Nature of Spending and by Level of Education (in %)
Teachers’
Emolument Non-Teachers’
Emolument ORT
Student Welfare (boarding, feeding,
student loans) Subventions to
Institutions Total ECD 15 85 0 0 100 Literacy 74 26 0 0 100 Primary 82 1 16 0 0 100 Secondary 57 8 29 5 0 100 Teacher training 39 44 17 0 100 TEVET 43 43 5 9 100 Higher education 38 21 26 13 2 100% Total (in %) 70 24 5 1 100 Total (Millions MK) 15,634 5,268 1,186 222 22,311
Source:�Calculations�from�the�revised�07/08�Ministry�of�Finance�budget.���

38 World Bank Working Paper
�
When� analyzing� the� expenditure� breakdown� by� level� of� education,� the� main�findings�are�as�follows:�
� The�public�recurrent�expenditures�on�ECD�are�mainly�ORT�(85�percent).�This�is�consistent�with�the�fact�that�this�level�receives�a�very�low�public�allocation�(see�table�3.4).�
� In�the�literacy�and�primary�education�sub�sectors,�the�largest�share�goes�to�PEs�(74�percent�and�83�percent,�respectively)�and�only�a�minor�share�goes�to�ORT�(26�percent�and�16�percent,�respectively).�
� In�secondary�education,�the�breakdown�is�more�balanced,�with�65�percent�for�PE,�29�percent�for�ORT,�and�5�percent�for�student�welfare.�The�share�for�ORT�being�higher�in�secondary�than�in�primary�is�consistent�with�reports�on�other�countries.�Secondary�education�needs�more�learning�material�per�student�than�primary�education�does.�
� In� teacher� training� and� TEVET,� the� share� of� expenditure� for� ORT� is� higher�than�in�the�other�levels�of�education�(44�percent�and�43�Percent,�respectively).�In� teacher� education,� 17� percent� of� recurrent� expenditure� goes� to� student�welfare�(5�percent�in�TEVET).�More�details�on�the�financing�and�expenditure�of�TEVET�can�be�found�in�Chapter�6.�
� In�higher�education,�59�percent�goes�to�PE,�26�percent�to�ORT,�and�13�percent�to� student� welfare.� Comparative� data� are� provided� in� Appendix� 3.5� and� a�more�detailed�analysis�of�cost�and�financing�of�the�higher�education�subsector�is�provided�in�Chapter�7.�
Public Recurrent Expenditure by Level of Schooling
After�analyzing�the�level�of�the�education�recurrent�expenditure�and�its�breakdown�by�type�of�spending,� it� is� important� to� look�at� the�distribution�by� level�of�schooling�and�compare�it�to�other�countries�over�time.�
Distribution by Level of Schooling in 2007/08
Table�3.4�shows�the�situation�in�2007/08�and�points�out�the�main�findings:�
� Primary� education� gets� the� largest� share� (44.2� percent)� of� public� recurrent�expenditures.�
� The� share� for�higher� education� (27�percent)� is�higher� than� that�of� secondary�education�(22�percent).�
� The�share�of�public�recurrent�resources�allocated�to�teacher�education,�TEVET�together�with�ECD�and�adult� literacy�does�not�exceed�7�percent�when�added�together.�In�particular,�ECD�accounts�for�only�0.1�percent�and�Literacy�for�only�0.3�percent.�
�
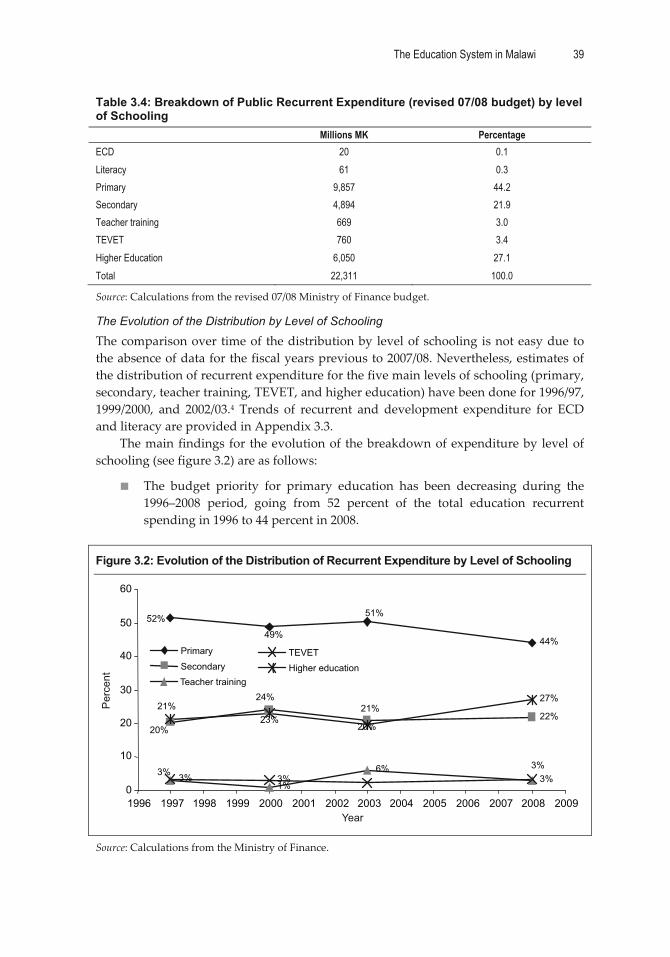
The Education System in Malawi 39
�
Table 3.4: Breakdown of Public Recurrent Expenditure (revised 07/08 budget) by level of Schooling
Millions MK Percentage ECD 20 0.1 Literacy 61 0.3 Primary 9,857 44.2 Secondary 4,894 21.9 Teacher training 669 3.0 TEVET 760 3.4 Higher Education 6,050 27.1 Total 22,311 100.0
Source:�Calculations�from�the�revised�07/08�Ministry�of�Finance�budget.��
The Evolution of the Distribution by Level of Schooling
The�comparison�over�time�of� the�distribution�by�level�of�schooling�is�not�easy�due�to�the�absence�of�data�for�the�fiscal�years�previous�to�2007/08.�Nevertheless,�estimates�of�the�distribution�of�recurrent�expenditure�for�the�five�main�levels�of�schooling�(primary,�secondary,�teacher�training,�TEVET,�and�higher�education)�have�been�done�for�1996/97,�1999/2000,� and� 2002/03.4� Trends� of� recurrent� and� development� expenditure� for� ECD�and�literacy�are�provided�in�Appendix�3.3.�
The�main�findings� for� the�evolution�of� the�breakdown�of�expenditure�by� level�of�schooling�(see�figure�3.2)�are�as�follows:�
� The� budget� priority� for� primary� education� has� been� decreasing� during� the�1996–2008� period,� going� from� 52� percent� of� the� total� education� recurrent�spending�in�1996�to�44�percent�in�2008.�
�
Figure 3.2: Evolution of the Distribution of Recurrent Expenditure by Level of Schooling
Year
44%
22%
1%
6%3%3% 3%
27%
52%
49%
51%
20%
24%21%
3%3%
21%23%
20%
0
10
20
30
40
50
60
1996 1997 1998 1999 2000 2001 2002 2003 2004 2005 2006 2007 2008 2009
Primary
SecondaryTeacher training
TEVETHigher education
Per
cent
�
Source:�Calculations�from�the�Ministry�of�Finance.�
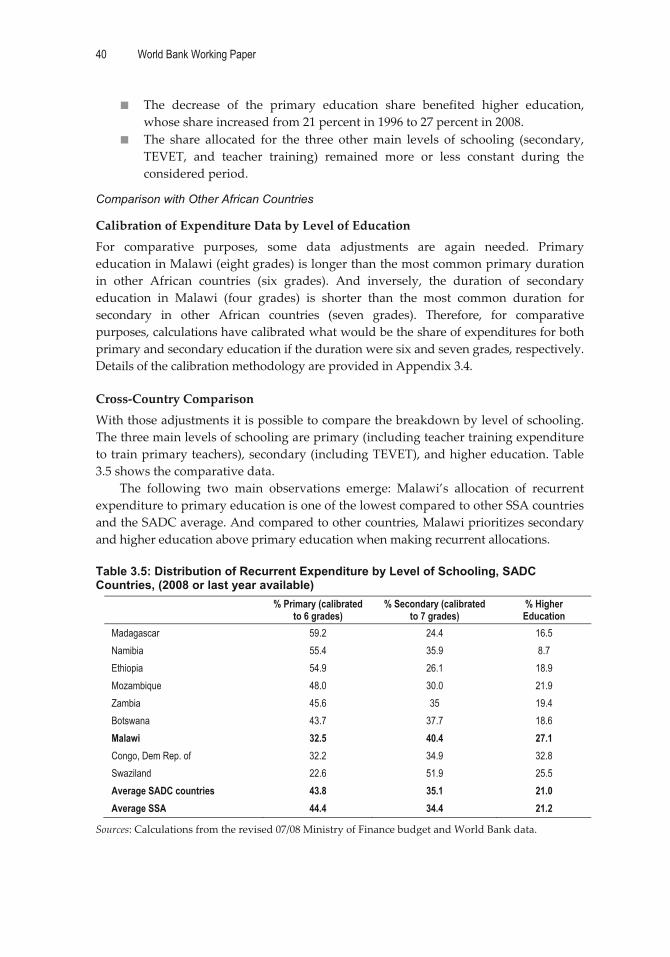
40 World Bank Working Paper
�
� The� decrease� of� the� primary� education� share� benefited� higher� education,�whose�share�increased�from�21�percent�in�1996�to�27�percent�in�2008.�
� The� share� allocated� for� the� three� other�main� levels� of� schooling� (secondary,�TEVET,� and� teacher� training)� remained� more� or� less� constant� during� the�considered�period.�
Comparison with Other African Countries
Calibration�of�Expenditure�Data�by�Level�of�Education�For� comparative� purposes,� some� data� adjustments� are� again� needed.� Primary�education�in�Malawi�(eight�grades)�is�longer�than�the�most�common�primary�duration�in� other� African� countries� (six� grades).� And� inversely,� the� duration� of� secondary�education� in� Malawi� (four� grades)� is� shorter� than� the� most� common� duration� for�secondary� in� other� African� countries� (seven� grades).� Therefore,� for� comparative�purposes,�calculations�have�calibrated�what�would�be�the�share�of�expenditures�for�both�primary�and�secondary�education�if�the�duration�were�six�and�seven�grades,�respectively.�Details�of�the�calibration�methodology�are�provided�in�Appendix�3.4.�
Cross�Country�Comparison�With�those�adjustments�it�is�possible�to�compare�the�breakdown�by�level�of�schooling.�The�three�main�levels�of�schooling�are�primary�(including�teacher�training�expenditure�to�train�primary�teachers),�secondary�(including�TEVET),�and�higher�education.�Table�3.5�shows�the�comparative�data.�
The� following� two� main� observations� emerge:� Malawi’s� allocation� of� recurrent�expenditure�to�primary�education�is�one�of�the�lowest�compared�to�other�SSA�countries�and�the�SADC�average.�And�compared�to�other�countries,�Malawi�prioritizes�secondary�and�higher�education�above�primary�education�when�making�recurrent�allocations.���Table 3.5: Distribution of Recurrent Expenditure by Level of Schooling, SADC Countries, (2008 or last year available)
% Primary (calibrated
to 6 grades) % Secondary (calibrated
to 7 grades) % Higher Education
Madagascar 59.2 24.4 16.5 Namibia 55.4 35.9 8.7 Ethiopia 54.9 26.1 18.9 Mozambique 48.0 30.0 21.9 Zambia 45.6 35 19.4 Botswana 43.7 37.7 18.6 Malawi 32.5 40.4 27.1 Congo, Dem Rep. of 32.2 34.9 32.8 Swaziland 22.6 51.9 25.5 Average SADC countries 43.8 35.1 21.0 Average SSA 44.4 34.4 21.2
Sources:�Calculations�from�the�revised�07/08�Ministry�of�Finance�budget�and�World�Bank�data.��
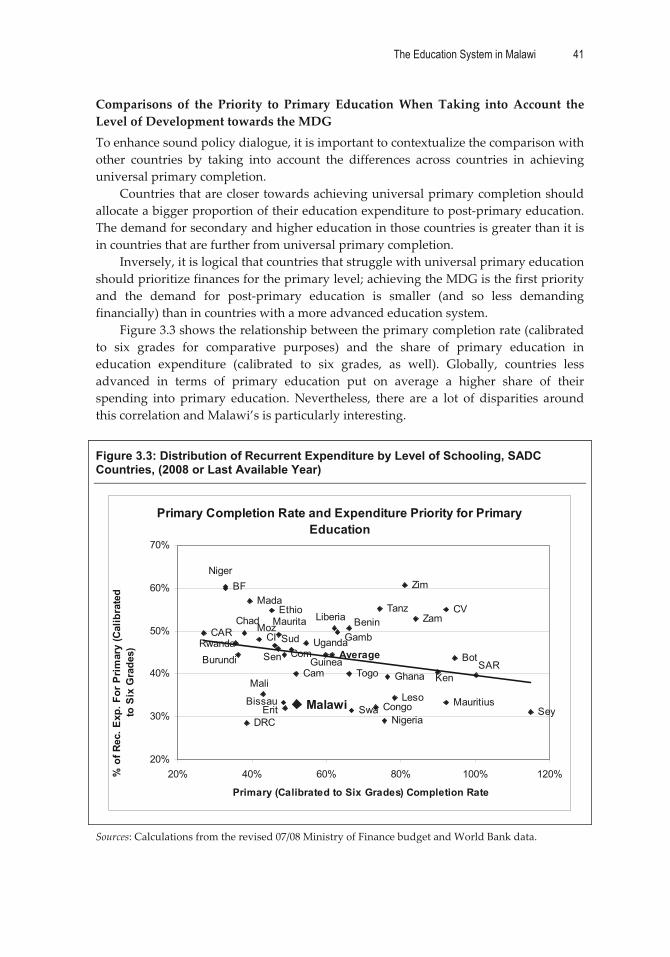
The Education System in Malawi 41
�
Comparisons� of� the� Priority� to� Primary� Education�When�Taking� into�Account� the�Level�of�Development�towards�the�MDG�To�enhance�sound�policy�dialogue,�it�is�important�to�contextualize�the�comparison�with�other� countries� by� taking� into� account� the� differences� across� countries� in� achieving�universal�primary�completion.��
Countries�that�are�closer�towards�achieving�universal�primary�completion�should�allocate�a�bigger�proportion�of�their�education�expenditure�to�post�primary�education.�The�demand�for�secondary�and�higher�education�in�those�countries�is�greater�than�it�is�in�countries�that�are�further�from�universal�primary�completion.��
Inversely,�it�is�logical�that�countries�that�struggle�with�universal�primary�education�should�prioritize�finances�for�the�primary�level;�achieving�the�MDG�is�the�first�priority�and� the� demand� for� post�primary� education� is� smaller� (and� so� less� demanding�financially)�than�in�countries�with�a�more�advanced�education�system.�
Figure�3.3�shows�the�relationship�between�the�primary�completion�rate�(calibrated�to� six� grades� for� comparative� purposes)� and� the� share� of� primary� education� in�education� expenditure� (calibrated� to� six� grades,� as� well).� Globally,� countries� less�advanced� in� terms� of� primary� education� put� on� average� a� higher� share� of� their�spending� into� primary� education.�Nevertheless,� there� are� a� lot� of� disparities� around�this�correlation�and�Malawi’s�is�particularly�interesting.���
Figure 3.3: Distribution of Recurrent Expenditure by Level of Schooling, SADC Countries, (2008 or Last Available Year)
Primary Completion Rate and Expenditure Priority for Primary Education
CAR
NigerBF
RwandaBurundi
Chad
DRC
Mada
Moz
Mali
Ethio
CI Sud
Maurita
Bissau
Sen
Erit
Com
Cam
Malawi
Uganda
GuineaAverage
Liberia
GambBenin
Togo
Swa Congo
Tanz
Nigeria
Ghana
Leso
Zim
Zam
Ken
CV
Mauritius
BotSAR
Sey
20%
30%
40%
50%
60%
70%
20% 40% 60% 80% 100% 120%
Primary (Calibrated to Six Grades) Completion Rate
% o
f Rec
. Exp
. For
Prim
ary
(Cal
ibra
ted
to S
ix G
rade
s)
�
Sources:�Calculations�from�the�revised�07/08�Ministry�of�Finance�budget�and�World�Bank�data.��
42 World Bank Working Paper
�
Compared� to� countries�with�a� similar�primary�completion� rate� (52�percent�when�calibrated� to� six� grades),� the� share� of� expenditure� devoted� to� primary� education� is�particularly� low� in� Malawi.� The� data� suggest� that� finding� ways� to� increase� future�resources� for� primary� education� (even�more� than� the� resources� for� the� other� levels)�would�be�useful.�
Public Recurrent Unit Costs by Level of Schooling
Public Recurrent Unit Costs and Comparisons over Time
Public�recurrent�unit�costs�are�calculated�by�dividing�the�public�recurrent�expenditure�devoted� to� each� level� by� the� number� of� students� in� public� schools� and� institutions�enrolled�in�the�same�level.�They�are�interpreted�as�the�average�cost�per�student�for�one�year�of�schooling.��
Table� 3.6� shows� the� recurrent� unit� costs,� including� administrative� costs,� for� the�seven�levels�of�education�using�2007/08�revised�recurrent�budget�figures�and�the�2007�EMIS�enrollment�in�public�schools.�The�costs�are�expressed�in�MK�and�in�terms�of�the�percentage� of� GDP� per� capita.� For� comparing� trends� over� time,� the� values� in� 2000�(from�the�first�CSR�done�in�Malawi)�are�also�reported.��
Box 3.1: Why Use the Reference to GDP Per Capita?
The reference to GDP (Gross Domestic Product) per capita is very important because it leads to thinking about cost in terms of sustainability. The GDP per capita is an estimate of the average wealth produced by a Malawian. As an example, if a year of study for one person costs 50 percent of GDP per capita, it means that the cost of one year of study is equivalent to half the average Malawian annual production (value of his work). Also, if a teacher’s salary is five units of GDP per capita, then the production of five average Malawians is needed to pay this teacher’s salary. The reference to GDP per capita gives costs of education service delivery (and in particular recurrent costs, meaning repeated annual costs) related to the domestic annual resources available in the country. Because the bulk of recurrent expenditure is paid by domestic resources, the reference to GDP per capita is key for thinking about education expansion in a sustainable way.
Another advantage of using finance indicators in reference to GDP per capita is for making comparisons. The use of the GDP per capita reference allows comparisons between countries that do not use the same currency. Nevertheless, the countries compared should have similar GDP per capita.
�The�main�findings�from�table�3.6�are�as�follows:�
1. In�primary�education,�per�student�public�recurrent�expenditure�is�MK3,019.�In�GDP�per�capita,�this�unit�cost�has�doubled�since�2000.�
2. The�public�recurrent�unit�cost�at�the�secondary�level�is�ten�times�higher�than�at�the�primary�level.�In�terms�of�GDP�per�capita,� it�has�grown�four�times�larger�since�2000.�It�is�worth�noting�that�there�are�huge�disparities�between�CDSS�and�CSS�unit�costs.�Full�unit�costs�has�not�been�separately�calculated�for�those�two�types�of� secondary�schools�but� the� information� from�EMIS� indicates� that� the�government� grant� received� by�CSS� is�much� higher� on� average� than� the� one�received�by�CDSS�(see�Chapter�4�for�details).�
�

The Education System in Malawi 43
�
Table 3.6: Public Recurrent Unit Costs by Level of Schooling 2007 2000
Students (in public
institutions)
Public Recurrent
Expenditure (MK million)
Public Recurrent Unit cost
(MK)
As % of GDP Per Capita
As a Multiple of
Primary Education
As % of GDP Per Capita
ECD (level 2) 287,206 20 69 0.20 0.02 n.a. Literacy 128,967 61 476 1.3 0.16 n.a. Primary 3,264,594 9,857 3,019 8.3 1 4 Secondary 161,575 4,894 30,292 83 10 21 TEVET (technical colleges) 4,807 247 51,408 141 17 n.a. TEVET (technical colleges with only residential students)
1,810 247 136,529 376 45 355
Teacher training 6,029 669 110,905 305 37 n.a. Higher education 7,700 6,010 780,479 2,147 259 1,489
Sources:�Calculations�from�the�revised�07/08�Ministry�of�Finance�budget;�EMIS�data.��
3. One�year�of�study�in�TEVET�costs�17�times�the�primary�level�unit�cost�(and�45�times�the�primary�level�unit�if�“parallel”�students�are�not�taken�into�account).�It�has�stayed�more�or�less�stable�since�2000�in�GDP�per�capita.�
4. The�per�student�recurrent�costs�for�teacher�training�is�305�percent�of�GDP�per�capita�and�37�times�the�primary�level�unit�cost.�
5. The�higher�education�recurrent�unit�cost�is�very�high�(21.5�times�the�GDP�per�capita)� and� has� increased� a� lot� since� 2000.� The� public� annual� cost� of� one�student� in� a� public� university� is� equivalent� to� the� public� annual� cost� of� 259�primary�level�students.�The�small�number�of�students�in�Malawi�(see�chapters�2�and�7)�does�not�help�for�having�economies�of�scale�and�constitutes�one�of�the�main�reasons�why�the�unit�cost�is�so�high.�Other�reasons�that�explain�the�high�public�unit�cost�of�higher�education�are�explained�in�this�section�of�the�chapter�and�in�Chapter�7.�
6. Public� unit� costs� for� ECD� and� adult� literacy� are� negligible� when� compared�with�the�other�levels�of�education.�
Comparison of Public Recurrent Unit Costs with Other African Countries
Table�3.7�compares�public�primary�and�secondary�unit�costs�in�Malawi�with�other�SADC�countries.� In�primary�education,�Malawi�and�Zambia�are� the�SADC�countries�with� the�lowest�unit�cost� in�GDP�per�capita.�With�8�percent�of�GDP�per�capita,�Malawi� is�much�lower�than�both�the�SADC�average�(12�percent)�and�the�SSA�average�(11�percent).�
In� secondary� education,� the� reverse� is� true:�Malawi� shows� the� highest� unit� cost�among�all� SADC�countries�with�available�data.�The�Malawian� secondary�public�unit�cost�is�more�than�two�times�higher�than�SADC�and�SSA�averages.�
In�higher�education,�the�comparison�with�other�African�countries�is�similar�to�what�can�be�observed�in�secondary�education.�The�Malawian�unit�cost�is�highest�among�all�African� countries� (see� figure� 3.4),� with� a� unit� cost� 6.8� times� higher� than� the� SSA�average� (314� percent� of� GDP� per� capita).� The� very� high� unit� cost� at� this� level� of�education�is�partly�due�to�the�fact�that�the�number�of�higher�education�students�is�very�small�in�Malawi�compared�to�the�other�countries.�

44 World Bank Working Paper
�
Table 3.7: Primary and Secondary Public Recurrent Unit Costs, SADC Countries (2007 or last year available)
Public Recurrent Unit Cost in Primary Education
(in % of GDP per capita)
Public Recurrent Unit Cost in Secondary Education (in % of GDP per capita)
Botswana n.a. 41 Congo, Dem. Rep. of 15 n.a Lesotho 18 50 Madagascar 9 13 Malawi 8 83 Mauritius 9 17 Mozambique 9 75 Namibia 21 22 Seychelles n.a 17 South Africa 14 17 Swaziland 11 44 Tanzania 12 n.a Zambia 7 8 Zimbabwe 13 21 SADC average 12 34 SSA average 11 30
Sources:�Calculations�from�the�revised�07/08�Ministry�of�Finance�budget�and�World�Bank�data.���
Figure 3.4: Higher Education Public Recurrent Unit Costs, Sub-Saharan Countries (2007 or last year available)
Uni
ts o
f GD
P pe
r cap
ita
0
5
10
15
20
25
Malawi
Mozambiq
ueLes
otho
Rwanda
EthiopiaNige
r
Tanzan
ia
Botswana
EritreaChad
Burundi
Sierra L
eoneZam
biaKeny
aGam
bia
Senegal
Swazilan
d
Burkina
Faso
Zimbabwe
Central
African
Republic
Côte d'I
voireGhan
a
Congo, R
ep. of
Uganda Mali
Madagas
carLib
eriaGuin
ea TogoBeni
n
Comoro
s
Guinea-
BissauNige
riaSuda
n
Mauritan
ia
Namibia
Camero
on
Congo, D
em. R
ep. of
Country �
Source:�Calculations�from�the�revised�07/08�Ministry�of�Finance�budget�and�World�Bank�data.���
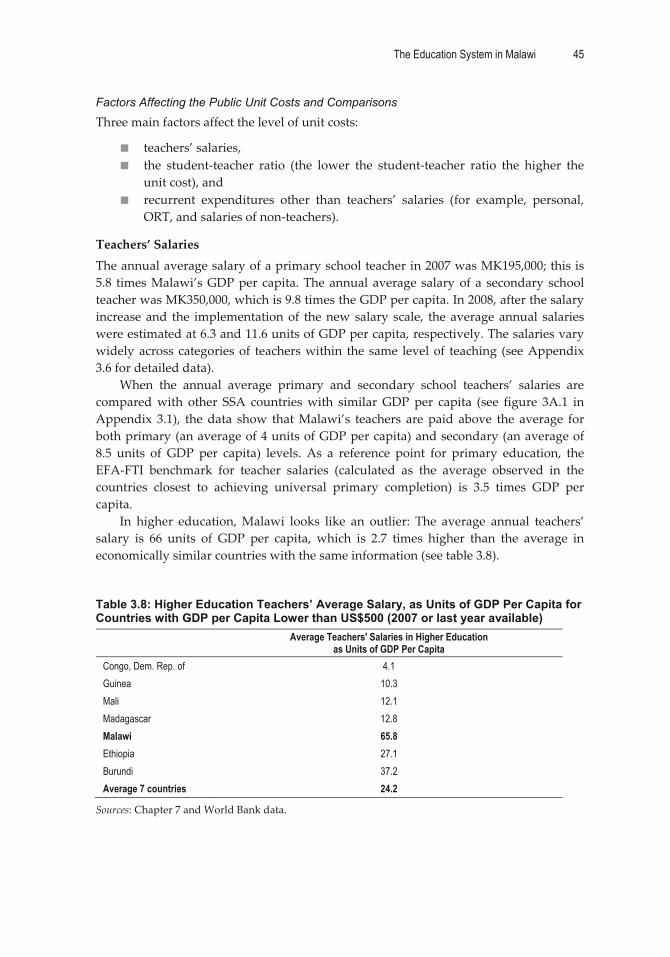
The Education System in Malawi 45
�
Factors Affecting the Public Unit Costs and Comparisons
Three�main�factors�affect�the�level�of�unit�costs:��
� teachers’�salaries,�� the� student�teacher� ratio� (the� lower� the� student�teacher� ratio� the� higher� the�
unit�cost),�and��� recurrent� expenditures� other� than� teachers’� salaries� (for� example,� personal,�
ORT,�and�salaries�of�non�teachers).��
Teachers’�Salaries�The�annual�average�salary�of�a�primary�school�teacher�in�2007�was�MK195,000;�this�is�5.8� times�Malawi’s�GDP�per�capita.�The�annual�average�salary�of�a� secondary� school�teacher�was�MK350,000,�which�is�9.8�times�the�GDP�per�capita.�In�2008,�after�the�salary�increase�and� the� implementation�of� the�new�salary� scale,� the�average�annual� salaries�were�estimated�at�6.3�and�11.6�units�of�GDP�per�capita,�respectively.�The�salaries�vary�widely�across�categories�of� teachers�within� the�same� level�of� teaching� (see�Appendix�3.6�for�detailed�data).�
When� the� annual� average� primary� and� secondary� school� teachers’� salaries� are�compared�with� other� SSA� countries�with� similar�GDP� per� capita� (see� figure� 3A.1� in�Appendix� 3.1),� the�data� show� that�Malawi’s� teachers� are� paid� above� the� average� for�both�primary�(an�average�of�4�units�of�GDP�per�capita)�and�secondary�(an�average�of�8.5� units� of� GDP� per� capita)� levels.� As� a� reference� point� for� primary� education,� the�EFA�FTI� benchmark� for� teacher� salaries� (calculated� as� the� average� observed� in� the�countries� closest� to� achieving� universal� primary� completion)� is� 3.5� times� GDP� per�capita.�
In� higher� education,�Malawi� looks� like� an� outlier:� The� average� annual� teachers’�salary� is� 66� units� of� GDP� per� capita,� which� is� 2.7� times� higher� than� the� average� in�economically�similar�countries�with�the�same�information�(see�table�3.8).���Table 3.8: Higher Education Teachers’ Average Salary, as Units of GDP Per Capita for Countries with GDP per Capita Lower than US$500 (2007 or last year available)
Average Teachers' Salaries in Higher Education
as Units of GDP Per Capita Congo, Dem. Rep. of 4.1 Guinea 10.3 Mali 12.1 Madagascar 12.8 Malawi 65.8 Ethiopia 27.1 Burundi 37.2 Average 7 countries 24.2
Sources:�Chapter�7�and�World�Bank�data.��

46 World Bank Working Paper
�
Student�Teacher�Ratios�The�second�factor�that�affects�the�level�of�unit�cost�is�the�student�teacher�ratio.�The�very�low�unit�cost�for�primary�education�in�Malawi�is�mainly�explained�by�this�factor.�With�a� student�teacher� ratio� in�government�funded� schools�of� 80:1,�Malawi�has�one�of� the�highest� values� in� Africa,� equal� to� twice� the� SADC� average� (41:1).� In� contrast,� the�student�teacher�ratio�of�20:1�in�secondary�is�very�low�compared�to�other�countries�(the�SSA� average� is� 28:1)� and� contributes� significantly� to� the� high� unit� costs.� Higher�education�is�similar�with�a�ratio�of�11:1�for�Malawi�and�an�average�of�20:1�for�the�SSA�(see�table�3.9�and�Chapter�7�for�more�details).��Table 3.9: Student-Teacher Ratios in Public Schools, 2007
Primary Education Secondary Education Higher Education
Malawi 80 20 11
SADC average 41 22 17
SSA average 45 28 20
Sources:�Chapter�4,�Chapter�7,�and�World�Bank�data.���
Recurrent�Expenditure�Excluding�Teachers’�Salaries�(Primary�Education)�The� third�main� factor� affecting� the� unit� cost� is� the� remaining� recurrent� expenditure�excluding�teachers’�salaries.�For�this�indicator,�only�primary�level�data�is�available�for�comparison� with� other� countries.� As� previously� noted,� expenditures� for� spending�outside�of�salaries�are�very�small�in�Malawi.�Out�of�all�African�countries�with�available�data,�Malawi�has�the�fourth�lowest�share�for�this�type�of�spending�(see�figure�3A.2�in�Appendix�3.1).�In�addition�to�the�high�pupil�teacher�ratio,�this�factor�contributes�to�the�low�unit�cost�observed�in�primary�education�in�Malawi.�
Household Financing
Total Household Education Expenditure and Comparisons
The�household� education� expenditure� includes�both� the�monetary� (for� example,� fees�and� other� financial� contributions� by� parents)� and� non�monetary� support� that�communities�are�encouraged�to�contribute�for�rehabilitating�schools�and�other�building�projects.� According� to� the� 2004� Integrated� Household� Survey,� Malawi’s� total�household�spending�on�education�is�estimated�at�MK4.4�billion,�which�is�1.43�percent�of�GDP.�
Compared� to� other� African� countries� with� available� data,� Malawi� is� the� in� the�middle�in�terms�of�household�contribution�to�education�(in�9�countries�the�contribution�as� a� percentage� of� GDP� is� lower� than� in� Malawi� and� in� eight� other� countries� it� is�higher).�Malawi’s�contribution�is�slightly� lower�than�the�average�calculated�on�the�18�African�countries�with�available�data�(1.4�percent�of�GDP�vs.�2�percent,�see�figure�3A.3�in�Appendix�3.1).�
Compared� to� other�African� countries,� the� share� of� education� to� total� household�expenditures� in�Malawi� is� in� the� bottom�half� (see� figure� 3A.4� in�Appendix� 3.1).� The�share� of� education� expenditures� accounts� for� only� 1.7� percent� of� total� household�expenditures,�compared�to�an�SSA�average�of�3.6�percent.�This�is� likely�related�to�the�
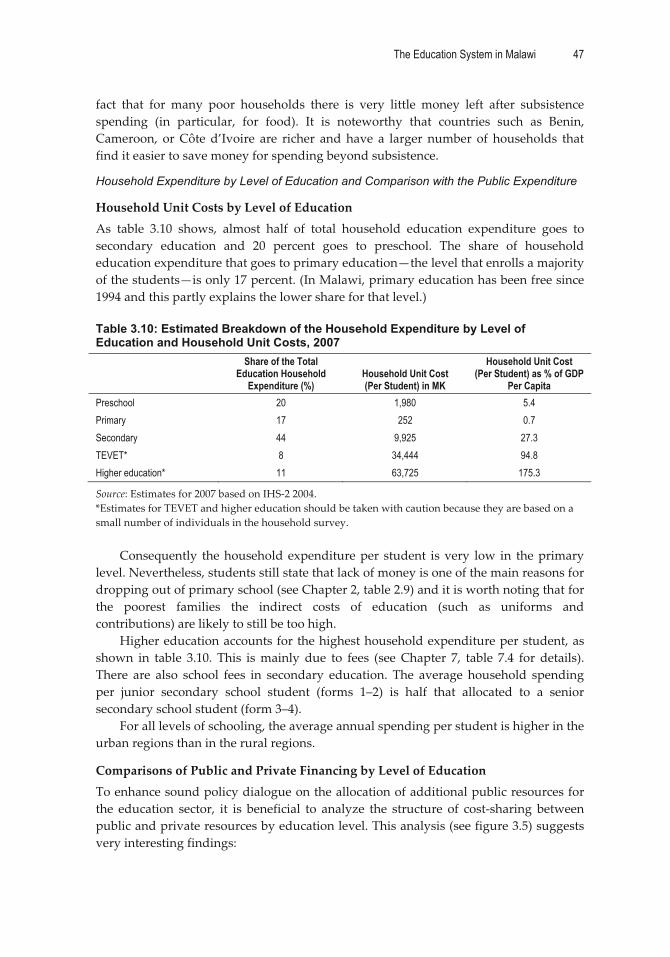
The Education System in Malawi 47
�
fact� that� for� many� poor� households� there� is� very� little� money� left� after� subsistence�spending� (in� particular,� for� food).� It� is� noteworthy� that� countries� such� as� Benin,�Cameroon,� or�Côte� d’Ivoire� are� richer� and� have� a� larger� number� of� households� that�find�it�easier�to�save�money�for�spending�beyond�subsistence.��
Household Expenditure by Level of Education and Comparison with the Public Expenditure
Household�Unit�Costs�by�Level�of�Education�As� table� 3.10� shows,� almost� half� of� total� household� education� expenditure� goes� to�secondary� education� and� 20� percent� goes� to� preschool.� The� share� of� household�education�expenditure�that�goes�to�primary�education—the�level�that�enrolls�a�majority�of�the�students—is�only�17�percent.�(In�Malawi,�primary�education�has�been�free�since�1994�and�this�partly�explains�the�lower�share�for�that�level.)��Table 3.10: Estimated Breakdown of the Household Expenditure by Level of Education and Household Unit Costs, 2007
Share of the Total Education Household
Expenditure (%) Household Unit Cost (Per Student) in MK
Household Unit Cost (Per Student) as % of GDP
Per Capita Preschool 20 1,980 5.4 Primary 17 252 0.7 Secondary 44 9,925 27.3 TEVET* 8 34,444 94.8 Higher education* 11 63,725 175.3
Source:�Estimates�for�2007�based�on�IHS�2�2004.�*Estimates�for�TEVET�and�higher�education�should�be�taken�with�caution�because�they�are�based�on�a�small�number�of�individuals�in�the�household�survey.��
Consequently� the�household�expenditure�per� student� is�very� low� in� the�primary�level.�Nevertheless,�students�still�state�that�lack�of�money�is�one�of�the�main�reasons�for�dropping�out�of�primary�school�(see�Chapter�2,�table�2.9)�and�it�is�worth�noting�that�for�the� poorest� families� the� indirect� costs� of� education� (such� as� uniforms� and�contributions)�are�likely�to�still�be�too�high.�
Higher�education�accounts�for�the�highest�household�expenditure�per�student,�as�shown� in� table� 3.10.� This� is�mainly� due� to� fees� (see�Chapter� 7,� table� 7.4� for� details).�There� are� also� school� fees� in� secondary� education.� The� average� household� spending�per� junior� secondary� school� student� (forms� 1–2)� is� half� that� allocated� to� a� senior�secondary�school�student�(form�3–4).��
For�all�levels�of�schooling,�the�average�annual�spending�per�student�is�higher�in�the�urban�regions�than�in�the�rural�regions.��
Comparisons�of�Public�and�Private�Financing�by�Level�of�Education�To�enhance�sound�policy�dialogue�on�the�allocation�of�additional�public�resources�for�the� education� sector,� it� is� beneficial� to� analyze� the� structure� of� cost�sharing� between�public�and�private�resources�by�education�level.�This�analysis�(see�figure�3.5)�suggests�very�interesting�findings:���
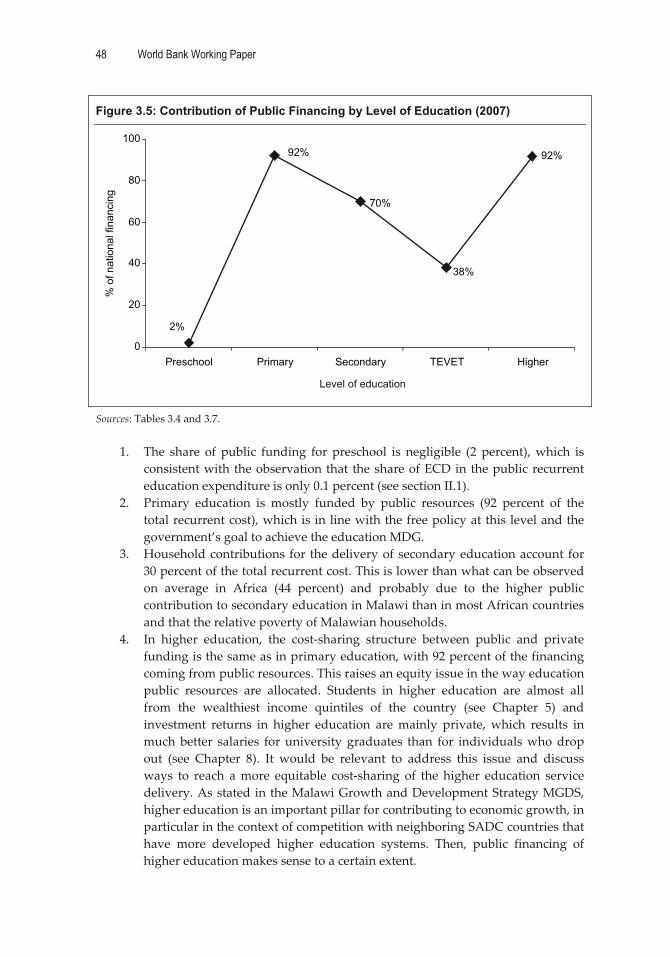
48 World Bank Working Paper
�
Figure 3.5: Contribution of Public Financing by Level of Education (2007) %
of n
atio
nal f
inan
cing
92%
2%
92%
70%
38%
0
20
40
60
80
100
Preschool Primary Secondary TEVET Higher
Level of education �
Sources:�Tables�3.4�and�3.7.��
1. The� share� of� public� funding� for� preschool� is� negligible� (2� percent),�which� is�consistent�with�the�observation�that� the�share�of�ECD�in�the�public�recurrent�education�expenditure�is�only�0.1�percent�(see�section�II.1).�
2. Primary� education� is� mostly� funded� by� public� resources� (92� percent� of� the�total�recurrent�cost),�which�is�in�line�with�the�free�policy�at�this�level�and�the�government’s�goal�to�achieve�the�education�MDG.�
3. Household�contributions� for� the�delivery�of�secondary�education�account� for�30�percent�of�the�total�recurrent�cost.�This�is�lower�than�what�can�be�observed�on� average� in� Africa� (44� percent)� and� probably� due� to� the� higher� public�contribution�to�secondary�education�in�Malawi�than�in�most�African�countries�and�that�the�relative�poverty�of�Malawian�households.�
4. In� higher� education,� the� cost�sharing� structure� between� public� and� private�funding�is�the�same�as�in�primary�education,�with�92�percent�of�the�financing�coming�from�public�resources.�This�raises�an�equity�issue�in�the�way�education�public� resources� are� allocated.� Students� in� higher� education� are� almost� all�from� the� wealthiest� income� quintiles� of� the� country� (see� Chapter� 5)� and�investment� returns� in� higher� education� are�mainly� private,�which� results� in�much�better� salaries� for� university� graduates� than� for� individuals�who�drop�out� (see� Chapter� 8).� It� would� be� relevant� to� address� this� issue� and� discuss�ways� to� reach� a�more� equitable� cost�sharing� of� the� higher� education� service�delivery.�As�stated�in�the�Malawi�Growth�and�Development�Strategy�MGDS,�higher�education�is�an�important�pillar�for�contributing�to�economic�growth,�in�particular�in�the�context�of�competition�with�neighboring�SADC�countries�that�have� more� developed� higher� education� systems.� Then,� public� financing� of�higher�education�makes�sense�to�a�certain�extent.��

The Education System in Malawi 49
�
5. Nevertheless,� international� research� shows� that� for� the� poorest� countries�primary�education�is�the�level�of�education�that�contributes�most�to�economic�growth.5�Consequently,�primary�education�has�a�greater�legitimacy�to�be�seen�as�a�“public�good”�for�which�government�involvement�is�crucial.�
6. Ultimately,�it�is�a�question�of�going�towards�the�right�balance�of�public�private�cost�sharing.�In�terms�of�scarcity�of�resources,�a�high�level�of�public�financing�for�higher�education�should�not�exist�at� the�detriment�of�primary�education,�where�unit� costs�are� so� low� that� they� impede�student� retention�and� learning�achievements,�which�are�important�drivers�of�economic�growth.�
Decomposition of Household Education Expenditure by Type of Spending
Out�of�the�total�MK4.4�billion�that�households�spend�annually�for�education�in�Malawi,�the�largest�share�goes�to�tuition�(58�percent).�School�uniforms�account�for�10�percent�of�the�spending,�boarding�school�fees�for�9.6�percent�and�school�books�(and�other�learning�materials)� for� 8.3� percent.� Table� 3.11� shows� the� percentages� allocated� to� each� of� the�different�categories.��Table 3.11: Decomposition of Household Education Expenditure (in %)
Type of Spending % of total Tuition (including any extra tuition fees) 58.1 School books and other materials 8.3 School uniform clothing 10.0 Boarding school fees 9.6 Contribution for school building or maintenance 2.6 Parent association & other school related fees 0.9
Other expenses 10.6
Total 100.0
Source:�IHS�2�2004.���
For� comparative� purposes,� it� is� necessary� to� reclassify� household� education�expenditures� into� three� broad� categories:� “Tuition,”� “School� Books� and� Other�Materials,”�and�“Other�Education�Expenses.”�Using�these�three�categories,�it�is�possible�to� better� understand� how� Malawian� households� prioritize� their� expenditures�compared� to� households� in� other� countries.� Table� 3.12� shows� a� cross�country�comparison�among�12�African�countries.�Malawi’s�household�allocations�to�tuition�and�other�education�expenses�are�slightly�above�the�cross�country�average�while�inversely,�the�allocations�to�school�books�and�other�materials�are�below�average.�
These� findings�are�consistent�with� the�high�allocation� in�Malawi.�The�number�of�pupils�taking�tutoring�increased�from�22�percent�in�1998�to�80�percent�in�2005�(Bellew,�2008).�It�illustrates�the�increasing�loss�of�trust�families�have�in�the�quality�of�education�and�emphasizes�the�need�for�improving�this�quality�(see�Chapter�4�for�analytical�inputs�that�should�lead�to�policy�reforms�meant�to�improve�the�quality�of�learning).���

50 World Bank Working Paper
�
Table 3.12: Cross-country Comparison of Distribution of Household Education Expenditure
Country Tuition School Books/Other Materials Other Education Expenses Benin 48.4 37.2 14.4 Burkina Faso 63.7 29.4 6.9 Cameroon 45.7 37.4 16.9 Côte d'Ivoire 36.3 40.1 23.6 Madagascar 33.6 30.9 35.5 Malawi 59.0 18.2 22.8 Mauritania 37.8 37.2 25.0 Niger 48.9 38.2 12.9 Uganda 73.0 13.3 13.7 Sierra Leone 20.9 48.5 30.6 Tanzania 62.4 26.4 11.2 Togo 53.4 37.8 8.8 Average 48.6 32.9 18.5
Sources:�IHS�2�2004�and�F.�Ndem,�Education�Household�Expenditure,�Senegal:�Pôle�de�Dakar,�2008.�
Household Education Expenditure According to Family Income
The�information�on�family�income�in�the�IHS�2004�survey�enables�comparisons�of�the�priority� given� to� education� expenditure� according� to� family� income� quintiles.� As�presented�in�table�3.13,�in�Malawi�the�share�of�spending�that�a�household�allocates�to�education�increases�according�to�the�economic�status�of�the�household.�On�average,�the�20�percent�richest�households�allocate�2.8�percent�of�their�total�spending�to�education.�This� is� nine� times� higher� than� the� proportion� that� the� poorest� 20� percent� allocate� to�education�(0.3�percent�of�their�total�expenditure).���Table 3.13: Share of Education in Household Expenditure by Quintile of Household Income
Household Income Quintile Share of Education in Total Household Spending (in %)
Q1 (20% poorest) 0.31
Q2 0.53
Q3 0.64
Q4 0.90
Q5 (20% richest) 2.84
Source:�IHS�2�2004.��
As�noted�before�when�comparing�countries,�the�poorest�households�cannot�afford�education� spending� that� is� proportionate� to� the�wealthiest� households� because� they�need�to�first�pay�for�subsistence�(in�particular,�for�food).�This�is�consistent�with�the�fact�that� non�schooling� and� dropping� out� are� mainly� an� issue� of� lack� of� demand� (see�Chapter�2)�and�that�lack�of�demand�is�exacerbated�by�poverty.�In�the�coming�years,�it�will� be� interesting� to� follow� up� with� the� findings� of� the� Zomba� Cash� Conditional�transfers�pilot�project� for� girls� in� school� (or�who�dropped�out� school�during� the� last�three� years).� The� preliminary� results� of� this� pilot� project� show� that� stimulating� the�
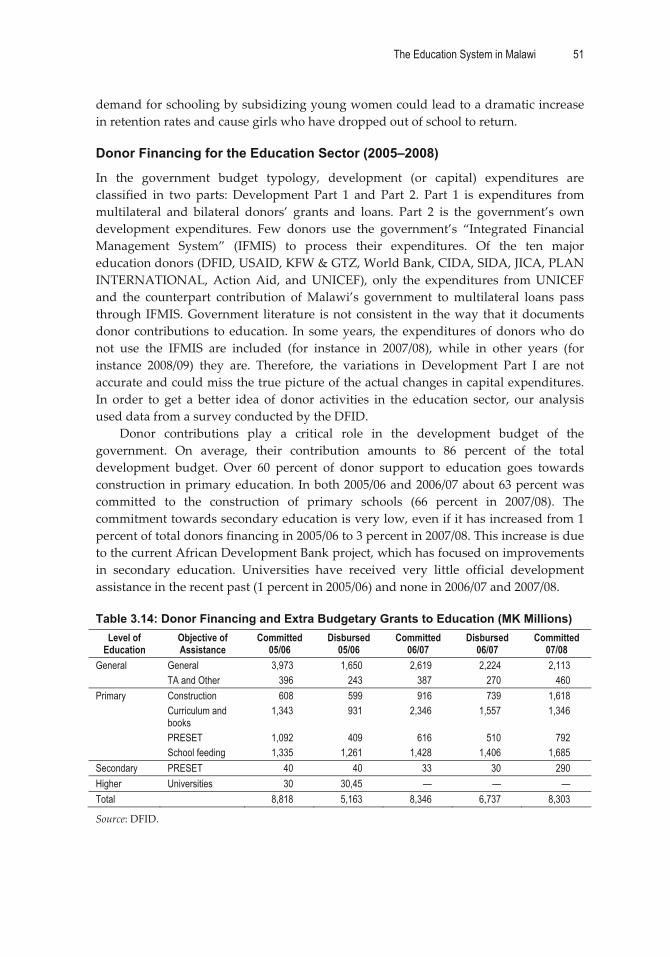
The Education System in Malawi 51
�
demand�for�schooling�by�subsidizing�young�women�could�lead�to�a�dramatic�increase�in�retention�rates�and�cause�girls�who�have�dropped�out�of�school�to�return.�
Donor Financing for the Education Sector (2005–2008)
In� the� government� budget� typology,� development� (or� capital)� expenditures� are�classified� in� two� parts:� Development� Part� 1� and� Part� 2.� Part� 1� is� expenditures� from�multilateral� and� bilateral� donors’� grants� and� loans.� Part� 2� is� the� government’s� own�development� expenditures.� Few� donors� use� the� government’s� “Integrated� Financial�Management� System”� (IFMIS)� to� process� their� expenditures.� Of� the� ten� major�education�donors�(DFID,�USAID,�KFW�&�GTZ,�World�Bank,�CIDA,�SIDA,�JICA,�PLAN�INTERNATIONAL,�Action�Aid,� and�UNICEF),� only� the� expenditures� from�UNICEF�and� the� counterpart� contribution� of�Malawi’s� government� to�multilateral� loans� pass�through� IFMIS.�Government� literature� is�not� consistent� in� the�way� that� it�documents�donor�contributions� to�education.� In� some�years,� the�expenditures�of�donors�who�do�not� use� the� IFMIS� are� included� (for� instance� in� 2007/08),� while� in� other� years� (for�instance� 2008/09)� they� are.� Therefore,� the� variations� in� Development� Part� I� are� not�accurate�and�could�miss�the�true�picture�of�the�actual�changes�in�capital�expenditures.�In� order� to� get� a� better� idea� of� donor� activities� in� the� education� sector,� our� analysis�used�data�from�a�survey�conducted�by�the�DFID.��
Donor� contributions� play� a� critical� role� in� the� development� budget� of� the�government.� On� average,� their� contribution� amounts� to� 86� percent� of� the� total�development� budget.� Over� 60� percent� of� donor� support� to� education� goes� towards�construction�in�primary�education.� In�both�2005/06�and�2006/07�about�63�percent�was�committed� to� the� construction� of� primary� schools� (66� percent� in� 2007/08).� The�commitment�towards�secondary�education�is�very�low,�even�if�it�has�increased�from�1�percent�of�total�donors�financing�in�2005/06�to�3�percent�in�2007/08.�This�increase�is�due�to�the�current�African�Development�Bank�project,�which�has�focused�on�improvements�in� secondary� education.� Universities� have� received� very� little� official� development�assistance�in�the�recent�past�(1�percent�in�2005/06)�and�none�in�2006/07�and�2007/08.��Table 3.14: Donor Financing and Extra Budgetary Grants to Education (MK Millions)
Level of Education
Objective of Assistance
Committed 05/06
Disbursed 05/06
Committed 06/07
Disbursed 06/07
Committed 07/08
General General 3,973 1,650 2,619 2,224 2,113 TA and Other 396 243 387 270 460
Primary Construction 608 599 916 739 1,618 Curriculum and books
1,343 931 2,346 1,557 1,346
PRESET 1,092 409 616 510 792 School feeding 1,335 1,261 1,428 1,406 1,685
Secondary PRESET 40 40 33 30 290 Higher Universities 30 30,45 — — — Total 8,818 5,163 8,346 6,737 8,303
Source:�DFID.�
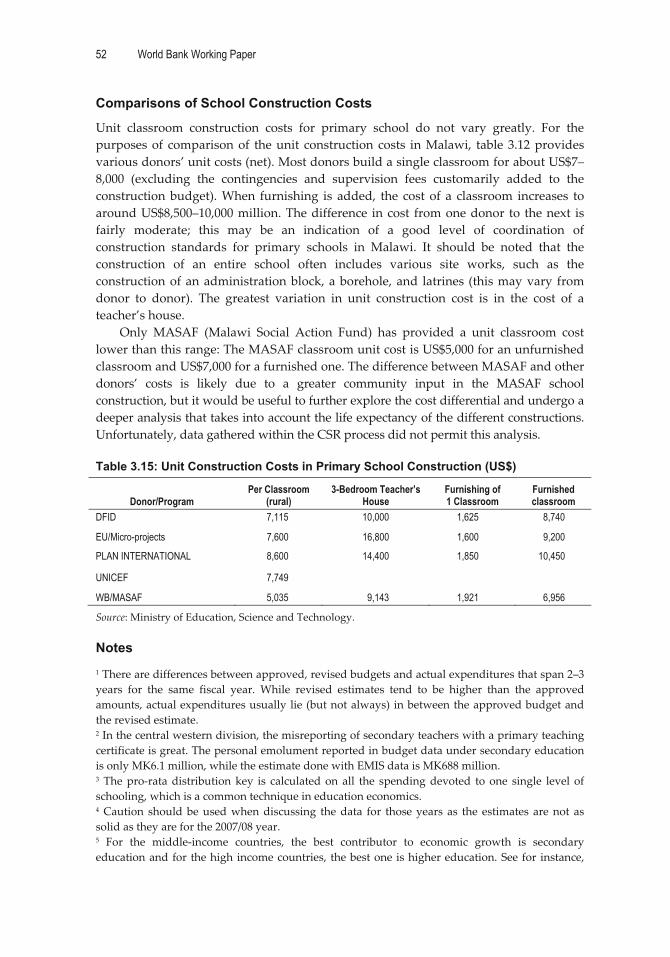
52 World Bank Working Paper
�
Comparisons of School Construction Costs
Unit� classroom� construction� costs� for� primary� school� do� not� vary� greatly.� For� the�purposes�of� comparison�of� the�unit� construction�costs� in�Malawi,� table�3.12�provides�various�donors’�unit�costs�(net).�Most�donors�build�a�single�classroom�for�about�US$7–8,000� (excluding� the� contingencies� and� supervision� fees� customarily� added� to� the�construction�budget).�When� furnishing� is� added,� the� cost�of� a� classroom� increases� to�around�US$8,500–10,000�million.�The�difference� in�cost� from�one�donor� to� the�next� is�fairly� moderate;� this� may� be� an� indication� of� a� good� level� of� coordination� of�construction� standards� for� primary� schools� in� Malawi.� It� should� be� noted� that� the�construction� of� an� entire� school� often� includes� various� site� works,� such� as� the�construction�of�an�administration�block,�a�borehole,�and� latrines� (this�may�vary� from�donor� to� donor).� The� greatest� variation� in� unit� construction� cost� is� in� the� cost� of� a�teacher’s�house.��
Only� MASAF� (Malawi� Social� Action� Fund)� has� provided� a� unit� classroom� cost�lower�than�this�range:�The�MASAF�classroom�unit�cost�is�US$5,000�for�an�unfurnished�classroom�and�US$7,000�for�a�furnished�one.�The�difference�between�MASAF�and�other�donors’� costs� is� likely� due� to� a� greater� community� input� in� the� MASAF� school�construction,�but�it�would�be�useful�to�further�explore�the�cost�differential�and�undergo�a�deeper�analysis�that�takes�into�account�the�life�expectancy�of�the�different�constructions.�Unfortunately,�data�gathered�within�the�CSR�process�did�not�permit�this�analysis.���Table 3.15: Unit Construction Costs in Primary School Construction (US$)
Donor/Program Per Classroom
(rural) 3-Bedroom Teacher’s
House Furnishing of 1 Classroom
Furnished classroom
DFID 7,115 10,000 1,625 8,740
EU/Micro-projects 7,600 16,800 1,600 9,200
PLAN INTERNATIONAL 8,600 14,400 1,850 10,450
UNICEF 7,749
WB/MASAF 5,035 9,143 1,921 6,956
Source:�Ministry�of�Education,�Science�and�Technology.��
Notes �1�There�are�differences�between�approved,�revised�budgets�and�actual�expenditures�that�span�2–3�years� for� the� same� fiscal� year.� While� revised� estimates� tend� to� be� higher� than� the� approved�amounts,�actual�expenditures�usually�lie�(but�not�always)� in�between�the�approved�budget�and�the�revised�estimate.�2�In�the�central�western�division,�the�misreporting�of�secondary�teachers�with�a�primary�teaching�certificate�is�great.�The�personal�emolument�reported�in�budget�data�under�secondary�education�is�only�MK6.1�million,�while�the�estimate�done�with�EMIS�data�is�MK688�million.�3� The�pro�rata�distribution�key� is� calculated�on� all� the� spending�devoted� to�one� single� level� of�schooling,�which�is�a�common�technique�in�education�economics.�4�Caution� should�be�used�when�discussing� the�data� for� those�years� as� the� estimates� are�not� as�solid�as�they�are�for�the�2007/08�year.�5� For� the� middle�income� countries,� the� best� contributor� to� economic� growth� is� secondary�education�and�for� the�high� income�countries,� the�best�one� is�higher�education.�See�for� instance,��

The Education System in Malawi 53
�
�UNESCO� BREDA,� Education� for� All� in� Africa:� Top� Priority� for� Integrated� Sector�Wide� Policies,�Dakar+7:� UNESCO,� Dakar� 2007� and� also� B.� Foko� and� M.� Brossard,� Couverture� scolaire� des�années� 1970� et� impacts� sur� la� croissance� entre� 1970� et� 2003,� UNESCO�BREDA,� Document� de�travail�du�Pôle�de�Dakar�(www.poledakar.org),�2007.�

54
CHAPTER �4 �
Internal�Efficiency,��Learning�Outcomes,�and�
Management�Issues�
Summary of the Chapter
Internal� efficiency� coefficient� (IEC)� at� the�primary� level� remained�particularly� low� in�2007� (35� percent),� which� implies� that� 65� percent� of� public� resources� are� lost� due� to�repetition� and� dropouts� before� cycle� completion.� Currently,� the� system� requires� 23�student�years� to� produce� one� graduate,� instead� of� 8� years� with� perfect� internal�efficiency.� The� situation� has� worsened� slightly� since� 1999,� when� the� IEC� was� 39�percent.�An�increase�in�repetition�is�mainly�responsible�for�this�degradation.�However,�high� dropout� rates� have� the� greatest� adverse� effect� on� the� internal� efficiency� of� the�system.�At� the� secondary� level,� internal� efficiency� is� slightly�better,�with�an� index�of�55.4�in�2007.�Yet,�the�situation�has�significantly�deteriorated�over�the�period�from�1999–2006.� Inefficiencies� resulting� from� repetition� remained� low� over� the� period� (5–6�percent).�Major�problems�came�from�dropouts,�which�alone�led�to�a�29�percent�waste�of�public� resources� in� 2007.� Much� gain� in� internal� efficiency� could� be� realized� from� a�reduction�in�dropouts�and�repetitions.��
Repetition�rates�have�increased�over�the�1999–2006�period�and�are�now�20�percent�in� primary� education—a� level� that� is� the� highest� in� the� region.� Yet,� evidence� at� the�national�and� international� level,� shows� that� such�high�repetition� rates�do�not� favor�a�better�mastery�of�learning�and�have�adverse�effects�on�student�teacher�ratios,�retention,�and�costs.��
Malawi�is�offering�poor�and�deteriorating�quality�education�in�primary�schools,�as�can� be� concluded� by� the� Southern� African� Consortium� for� Monitoring� Educational�Quality� (SACMEQ)� scores� and� national� examination� pass� rates.� The� percentage� of�children� who� reached� a� minimum� level� of� mastery� in� reading� in� English� has� been�reduced� by� half� over� the� 1998–2004� period,� and� was� barely� 9� percent� in� 2004.� In�mathematics,�98�percent�of�the�students�did�not�possess�skills�beyond�basic�numeracy�and� none� of� them� had� skills� beyond� competent� numeracy.� Compared� to� other�countries,�Malawi� fares� poorly,� being� at� the� bottom�of� all� the� SACMEQ� countries� in�English� reading� and� next� to� last� in� mathematics.� There� is� a� strong� need� to� further�investigate�those�results�and�better�understand�why�competency�levels�are�so�poor�and�have�fallen�over�the�last�past�years.�

The Education System in Malawi 55
�
Failure� rates� in� national� examinations� vary� from� 74� percent� for� the� PSLE,� 62�percent�for�the�JCE,�and�44�percent�for�the�MSCE.�The�low�achievement�in�the�MSCE�is�striking� and� raises� serious� issues� about� the� skill� level� acquired� throughout� the�schooling�system.�At�the�secondary�level,�poorer�outcomes�are�associated�mainly�with�CDSSs.��
At�the�primary�level,�high�STRs�are�associated�with�lower�PSLE�pass�rates,�as�well�as�overlapping�shifts,�whereas�school� facilities� tend� to�have�a�positive� impact.�At� the�secondary�level,�teacher�characteristics�have�a�major�impact�on�MSCE�pass�rates:�While�female� teachers� tend� to� perform� better� (all� other� things� being� equal),� PT4� to� PT1�teachers�fare�less�well�than�their�better�qualified�peers,�as�MSCE�holders�fare�less�well�than�higher�education�graduates.��
Malawi� is� characterized� by� a� severe� lack� of� teachers� at� the� primary� level,� as�illustrated� by� its� high� STR� of� 80:1� in� 2007.� The� concomitant� increase� in� student�enrollment� and� pupil� retention� and� the� reduction� in� teachers� have� led� to� a�deterioration�of�the�STR;�this�was�63:1�in�2000.�However,�the�recruitment�of�volunteer�teachers�has�been�somewhat�able�to�ease�the�pressure�(reducing�the�STR�from�86:1�to�80:1).�This�is�in�sharp�contrast�to�what�can�be�found�at�the�secondary�level,�where�STRs�stood�at�20:1�in�2007—one�of�the�lowest�levels�in�Africa.��
Teacher� qualification� still� remains� a� major� challenge,� both� at� primary� and�secondary�levels.�Although�the�situation�has�improved�in�primary�schools,�the�student�to�qualified�teacher�Ratio�(SqTR)�is�still�high—currently�reduced�to�88:1�from�a�level�of�118:1�in�1999.�The�ministry’s�training�efforts�over�the�last�years�need�to�be�pursued�to�significantly� improve� the� situation.� At� the� secondary� level,�more� than� 60� percent� of�teachers� are� underqualified,� with� a� SqTR� ratio� of� 51:1.� Most� of� the� underqualified�teachers�work�in�CDSSs—�81�percent�of�their�teaching�force�is�unqualified�compared�to�27�percent�in�CSSs.��
Improvement� in� the� administrative� management� of� human� resources� at� the�primary�level�will�be�crucial.�The�degree�of�randomness�for�primary�teacher�allocation�is� somewhat� high,� 42� percent� in� 2007� (against� 35� percent� in� 2000),� well� above� the�average� observed� in� a� sample� of� African� countries� (31� percent).� This�means� that� 42�percent�of� the�allocation�of� teachers� is�explained�by� factors�other� than� the�number�of�students� enrolled� in� the� school.� The� situation� is� different� from� that� of� secondary�schools;� teacher�deployment� across�public� schools� is� fairly� consistent� as� indicated�by�the� value� of� R2� of� 72� percent.� This� is� a� sharp� improvement� on� the� situation� in� 2000,�where�41�percent�of� teacher�deployment�variation�was�explained�by�school� size.�Yet,�there� remains� room� for� improvement� throughout� the� system,� 28� percent� of� teacher�allocation�still�depends�on�factors�other�than�the�number�of�students�enrolled�in�each�school.��
Teacher�allocation�across�location�and�divisions/districts�is�quite�uneven,�with�their�deployment�highly� skewed� toward�urban� zones� (46:1� against� 86:1� in� rural� areas).�At�the�division� level,� the� STR� ranges� from�66:1� in� the�Northern�division� to� 104:1� in� the�Shire� Highlands� division.� Teacher� deployment� shows� even� more� disparities� when�qualified�teachers�are�taken�into�account.�Their�allocation�has�benefited�urban�settings�(47:1),� leaving� rural� areas� seriously� deprived� of� qualified� teachers� (95:1).� This�highlights�the�challenges�of�having�teachers�work�and�remain�in�rural�settings.�

56 World Bank Working Paper
�
Globally,�CDSSs�are� less�well� resourced� than�other� schools,� although� they� enroll�nearly� half� of� the� secondary� student� population.� They� generally� are� underfunded,�staffed� by� underqualified� teachers,� have� a� poorer� learning� environment,� and� lack�appropriate�teaching�and�learning�materials�and�equipment.��
While�economies�of�scale�are�modest�in�primary�schools,�they�are�quite�important�at� the�secondary� level.�This� is�very�much�related�to�student�teacher�ratios�and�school�size.�The�average�number�of�students�in�secondary�schools�is�relatively�low�at�212,�but�it�reaches�642�pupils�in�primary�schools.�Scale�economies�are�possible�at�the�secondary�level�by�favoring�bigger�schools�of�more�than�150�students�and�increasing�the�PTR�level.��
Finally,� there� is� a� particularly� weak� relationship� at� the� school� level� between�national� examination� pass� rate� results� and� spending� per� pupil� (at� primary� and�secondary� levels).�This� raises�questions�about� the�underlying�process� that� transforms�resources�into�learning�achievement.�Beyond�the�issue�of�resource�allocation,�the�way�they� are� used� seems� to� be� a� major� influence� on� the� level� of� learning� outcome.�Improving�supervision�and�accountability�mechanisms�at�the�local�level�are�known�to�be�effective�interventions.���
*�*�*��
It� is� important� that� all� children� have� access� to� and� remain� in� school,� but� it� is�equally� crucial� that� those� enrolled� acquire� the� relevant� human� capital� and� cognitive�skills.�This�raises�the�issue�of�the�quality�of�the�education�services�being�offered,�which�needs� to� be� considered� along�with� the� efficient� use� of� education� resources.� A� given�education�system�needs�to�have�a�maximum�number�of�students�reach�the�end�of�the�cycle�(rather�than�dropping�out)�in�a�minimum�amount�of�time�(by�repeating�as�little�as�possible).��
There� are� many� ways� to� organize� the� education� process� for� a� given� level� of�resources�per�student.�For�classroom�organization,�a�school�can�have�40�or�60�students�per�classroom�and�offer�or�not�offer�multi�grade�classes�or�double�shifting�courses.�A�school� may� recruit� teachers� after� 9� or� 12� years� of� schooling� followed� by� a� specific�training� of� 1� or� 3� years.� School� buildings� can� be� modern� buildings� of� international�quality�or�more�traditional�ones�built�by�the�community.�The�system�may�or�may�not�allow� for� a� high� level� of� repetition.� These� are� all� normative,� often� contradictory,�decisions�on�education�policies�and�school�management,�so�it�is�crucial�to�get�objective�empirical�evidence�to�support�the�decision�making�process.��
In� Chapter� 4,� these� aspects� of� internal� efficiency,� quality,� and� education� system�management�are�examined�and�addressed�in�four�sections:�
� Section�I�deals�with�the�internal�efficiency�of�the�education�system.�It�provides�a� close� look� at� the� capacity� of� the� education� system� to� bring� the�maximum�number�of�students� that�enter� the�cycle� to� the�end� in�a�minimum�number�of�years.� Student� flows,� repetition,� dropout� trends,� and� the� loss� in� internal�efficiency�due�to�dropouts�and�repetition�are�examined.��
� Section� II� addresses� the� issue� of� quality� through� analyses� of� the� SACMEQ�standardized� test� scores�of� Standard�6�primary� school� students� and�national�examination�pass�rates�at�primary�and�secondary�levels.��
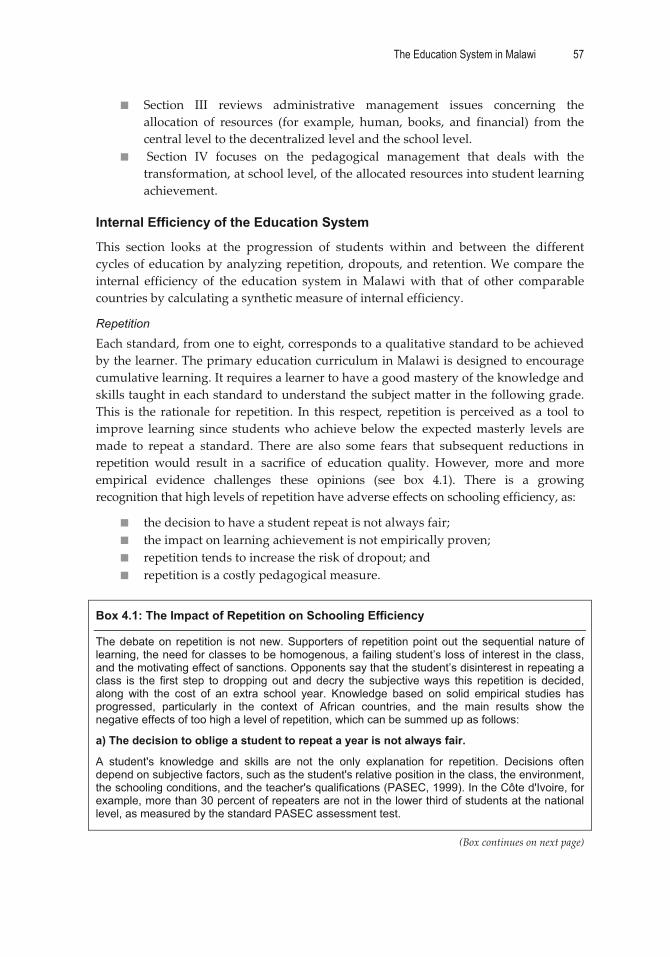
The Education System in Malawi 57
�
� Section� III� reviews� administrative� management� issues� concerning� the�allocation� of� resources� (for� example,� human,� books,� and� financial)� from� the�central�level�to�the�decentralized�level�and�the�school�level.��
� �Section� IV� focuses� on� the� pedagogical� management� that� deals� with� the�transformation,�at�school�level,�of�the�allocated�resources�into�student�learning�achievement.��
Internal Efficiency of the Education System
This� section� looks� at� the� progression� of� students� within� and� between� the� different�cycles�of�education�by�analyzing�repetition,�dropouts,�and�retention.�We�compare�the�internal� efficiency� of� the� education� system� in�Malawi�with� that� of� other� comparable�countries�by�calculating�a�synthetic�measure�of�internal�efficiency.��
Repetition
Each�standard,�from�one�to�eight,�corresponds�to�a�qualitative�standard�to�be�achieved�by�the�learner.�The�primary�education�curriculum�in�Malawi�is�designed�to�encourage�cumulative�learning.�It�requires�a�learner�to�have�a�good�mastery�of�the�knowledge�and�skills�taught�in�each�standard�to�understand�the�subject�matter�in�the�following�grade.�This� is� the� rationale� for� repetition.� In� this� respect,� repetition� is�perceived�as�a� tool� to�improve� learning� since� students�who�achieve�below� the� expected�masterly� levels� are�made� to� repeat� a� standard.� There� are� also� some� fears� that� subsequent� reductions� in�repetition� would� result� in� a� sacrifice� of� education� quality.� However,� more� and� more�empirical� evidence� challenges� these� opinions� (see� box� 4.1).� There� is� a� growing�recognition�that�high�levels�of�repetition�have�adverse�effects�on�schooling�efficiency,�as:�
� the�decision�to�have�a�student�repeat�is�not�always�fair;��� the�impact�on�learning�achievement�is�not�empirically�proven;��� repetition�tends�to�increase�the�risk�of�dropout;�and��� repetition�is�a�costly�pedagogical�measure.�
�
Box 4.1: The Impact of Repetition on Schooling Efficiency
The debate on repetition is not new. Supporters of repetition point out the sequential nature of learning, the need for classes to be homogenous, a failing student’s loss of interest in the class, and the motivating effect of sanctions. Opponents say that the student’s disinterest in repeating a class is the first step to dropping out and decry the subjective ways this repetition is decided, along with the cost of an extra school year. Knowledge based on solid empirical studies has progressed, particularly in the context of African countries, and the main results show the negative effects of too high a level of repetition, which can be summed up as follows:
a) The decision to oblige a student to repeat a year is not always fair.
A student's knowledge and skills are not the only explanation for repetition. Decisions often depend on subjective factors, such as the student's relative position in the class, the environment, the schooling conditions, and the teacher's qualifications (PASEC, 1999). In the Côte d'Ivoire, for example, more than 30 percent of repeaters are not in the lower third of students at the national level, as measured by the standard PASEC assessment test.
(Box�continues�on�next�page)��

58 World Bank Working Paper
�
Box 4.1 (continued)
The debate on repetition is not new. Supporters of repetition point out the sequential nature of learning, the need for classes to be homogenous, a failing student’s loss of interest in the class, and the motivating effect of sanctions. Opponents say that the student’s disinterest in repeating a class is the first step to dropping out and decry the subjective ways this repetition is decided, along with the cost of an extra school year. Knowledge based on solid empirical studies has progressed, particularly in the context of African countries, and the main results show the negative effects of too high a level of repetition, which can be summed up as follows:
a) The decision to oblige a student to repeat a year is not always fair.
A student's knowledge and skills are not the only explanation for repetition. Decisions often depend on subjective factors, such as the student's relative position in the class, the environment, the schooling conditions, and the teacher's qualifications (PASEC, 1999). In the Côte d'Ivoire, for example, more than 30 percent of repeaters are not in the lower third of students at the national level, as measured by the standard PASEC assessment test.
b) The impact of repetition on learning achievement is not empirically proven.
Macroanalyses show that the argument aimed at justifying students' repetition for reasons linked to the quality of the education cannot be verified empirically (Mingat and Sosale, 2000). Good education systems (that is, a high level of student learning) can have a high or low repetition rate; there is no significant relationship between the students' learning achievement and the frequency of repetitions. The same is shown in the studies at the school level (for instance in Benin, Chad, and Cameroon) which conclude that with equal resources and environment, schools where the students have repeated the most grades do not have better results at the end of the cycle (Brossard, 2003; World Bank 2004, 2005). Finally, analyses at an individual level show that the students (excepting the especially weak) who are made to repeat a year do not improve more by repeating than by moving on to the next grade (PASEC, 1999; PASEC 2004b).
c) There is a significant negative effect on students who drop out.
Studies at country, school, and individual levels reinforce this point. At the macro level, Mingat and Sosale (2000) and Pôle de Dakar (2002) studies show that repetition increases the dropout rates during the cycle, and this remains the main disincentive for reaching Universal Primary Enrollment (UPE);. The families of students who repeat a year feel that is the students are unsuccessful and do not benefit from being at school. As the opportunity costs always create an argument against school attendance, repetition encourages parents to take their children out of school. Mingat and Sosale estimate that one more percentage point of repeaters results in a 0.8 percentage point increase in the dropout rate. They also show that these negative effects are even more distinct among the population groups where the demand for schooling is already low (for example, girls, children from underprivileged economic environments). For girls, the effect of one more percentage point is estimated to be a 1.1 point increase in the dropout rate.
The results of analyses at the school level take the same direction. In Chad, with all other factors being equal, one more percentage point of repetition is related to a 0.53 percent less survival rate (World Bank, 2005). At the individual level, studies also confirm this trend. In Senegal, at a given student level, the decision to make a grade 2 student repeat a year increases the risk of the student dropping out at the end of the year by 11 percent (PASEC, 2004).
(Box�continues�on�next�page)���
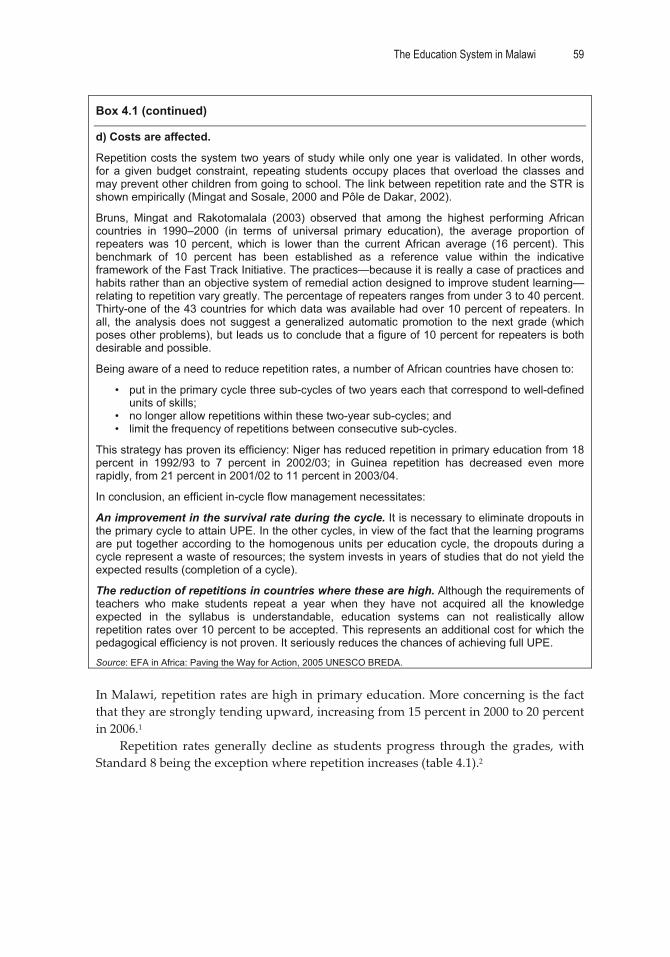
The Education System in Malawi 59
�
Box 4.1 (continued)
d) Costs are affected.
Repetition costs the system two years of study while only one year is validated. In other words, for a given budget constraint, repeating students occupy places that overload the classes and may prevent other children from going to school. The link between repetition rate and the STR is shown empirically (Mingat and Sosale, 2000 and Pôle de Dakar, 2002).
Bruns, Mingat and Rakotomalala (2003) observed that among the highest performing African countries in 1990–2000 (in terms of universal primary education), the average proportion of repeaters was 10 percent, which is lower than the current African average (16 percent). This benchmark of 10 percent has been established as a reference value within the indicative framework of the Fast Track Initiative. The practices—because it is really a case of practices and habits rather than an objective system of remedial action designed to improve student learning—relating to repetition vary greatly. The percentage of repeaters ranges from under 3 to 40 percent. Thirty-one of the 43 countries for which data was available had over 10 percent of repeaters. In all, the analysis does not suggest a generalized automatic promotion to the next grade (which poses other problems), but leads us to conclude that a figure of 10 percent for repeaters is both desirable and possible.
Being aware of a need to reduce repetition rates, a number of African countries have chosen to:
• put in the primary cycle three sub-cycles of two years each that correspond to well-defined units of skills;
• no longer allow repetitions within these two-year sub-cycles; and • limit the frequency of repetitions between consecutive sub-cycles.
This strategy has proven its efficiency: Niger has reduced repetition in primary education from 18 percent in 1992/93 to 7 percent in 2002/03; in Guinea repetition has decreased even more rapidly, from 21 percent in 2001/02 to 11 percent in 2003/04.
In conclusion, an efficient in-cycle flow management necessitates:
An improvement in the survival rate during the cycle. It is necessary to eliminate dropouts in the primary cycle to attain UPE. In the other cycles, in view of the fact that the learning programs are put together according to the homogenous units per education cycle, the dropouts during a cycle represent a waste of resources; the system invests in years of studies that do not yield the expected results (completion of a cycle).
The reduction of repetitions in countries where these are high. Although the requirements of teachers who make students repeat a year when they have not acquired all the knowledge expected in the syllabus is understandable, education systems can not realistically allow repetition rates over 10 percent to be accepted. This represents an additional cost for which the pedagogical efficiency is not proven. It seriously reduces the chances of achieving full UPE.
Source: EFA in Africa: Paving the Way for Action, 2005 UNESCO BREDA.
�In�Malawi,�repetition�rates�are�high�in�primary�education.�More�concerning�is�the�fact�that�they�are�strongly�tending�upward,�increasing�from�15�percent�in�2000�to�20�percent�in�2006.1��
Repetition� rates� generally� decline� as� students� progress� through� the� grades,�with�Standard�8�being�the�exception�where�repetition�increases�(table�4.1).2��
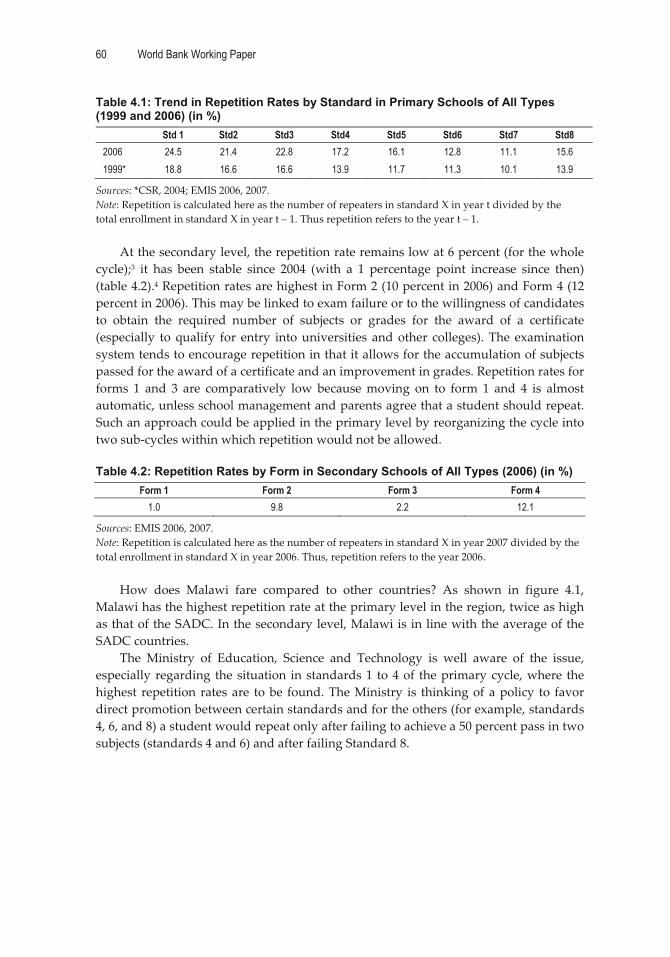
60 World Bank Working Paper
�
Table 4.1: Trend in Repetition Rates by Standard in Primary Schools of All Types (1999 and 2006) (in %)
Std 1 Std2 Std3 Std4 Std5 Std6 Std7 Std8 2006 24.5 21.4 22.8 17.2 16.1 12.8 11.1 15.6 1999* 18.8 16.6 16.6 13.9 11.7 11.3 10.1 13.9
Sources:�*CSR,�2004;�EMIS�2006,�2007.�Note:�Repetition�is�calculated�here�as�the�number�of�repeaters�in�standard�X�in�year�t�divided�by�the�total�enrollment�in�standard�X�in�year�t�–�1.�Thus�repetition�refers�to�the�year�t�–�1.���
At�the�secondary�level,�the�repetition�rate�remains�low�at�6�percent�(for�the�whole�cycle);3� it� has� been� stable� since� 2004� (with� a� 1� percentage� point� increase� since� then)�(table�4.2).4�Repetition�rates�are�highest�in�Form�2�(10�percent�in�2006)�and�Form�4�(12�percent�in�2006).�This�may�be�linked�to�exam�failure�or�to�the�willingness�of�candidates�to� obtain� the� required� number� of� subjects� or� grades� for� the� award� of� a� certificate�(especially� to�qualify� for� entry� into�universities� and�other� colleges).�The� examination�system�tends�to�encourage�repetition�in�that�it�allows�for�the�accumulation�of�subjects�passed�for�the�award�of�a�certificate�and�an�improvement�in�grades.�Repetition�rates�for�forms� 1� and� 3� are� comparatively� low� because�moving� on� to� form� 1� and� 4� is� almost�automatic,�unless�school�management�and�parents�agree�that�a�student�should�repeat.�Such�an�approach�could�be�applied�in�the�primary�level�by�reorganizing�the�cycle�into�two�sub�cycles�within�which�repetition�would�not�be�allowed.���Table 4.2: Repetition Rates by Form in Secondary Schools of All Types (2006) (in %)
Form 1 Form 2 Form 3 Form 4 1.0 9.8 2.2 12.1
Sources:�EMIS�2006,�2007.�Note:�Repetition�is�calculated�here�as�the�number�of�repeaters�in�standard�X�in�year�2007�divided�by�the�total�enrollment�in�standard�X�in�year�2006.�Thus,�repetition�refers�to�the�year�2006.���
How� does� Malawi� fare� compared� to� other� countries?� As� shown� in� figure� 4.1,�Malawi�has�the�highest�repetition�rate�at�the�primary�level�in�the�region,�twice�as�high�as�that�of�the�SADC.�In�the�secondary�level,�Malawi�is�in�line�with�the�average�of�the�SADC�countries.��
The� Ministry� of� Education,� Science� and� Technology� is� well� aware� of� the� issue,�especially�regarding� the�situation� in�standards�1� to�4�of� the�primary�cycle,�where� the�highest� repetition� rates�are� to�be� found.�The�Ministry� is� thinking�of�a�policy� to� favor�direct�promotion�between�certain�standards�and�for�the�others�(for�example,�standards�4,�6,�and�8)�a�student�would�repeat�only�after�failing�to�achieve�a�50�percent�pass�in�two�subjects�(standards�4�and�6)�and�after�failing�Standard�8.��
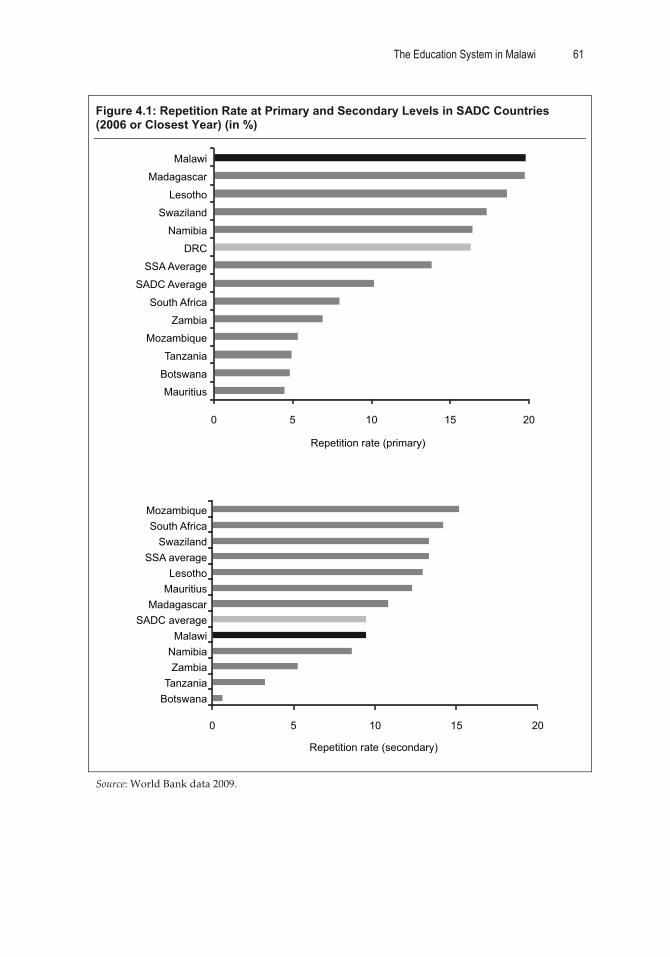
The Education System in Malawi 61
�
Figure 4.1: Repetition Rate at Primary and Secondary Levels in SADC Countries (2006 or Closest Year) (in %)
0 5 10 15 20
Mauritius
Botswana
Tanzania
Mozambique
Zambia
South Africa
SADC Average
SSA Average
DRC
Namibia
Swaziland
Lesotho
Madagascar
Malawi
Repetition rate (primary)
0 5 10 15 20
BotswanaTanzania
ZambiaNamibia
MalawiSADC average
MadagascarMauritiusLesotho
SSA averageSwaziland
South AfricaMozambique
Repetition rate (secondary) �
Source:�World�Bank�data�2009.��
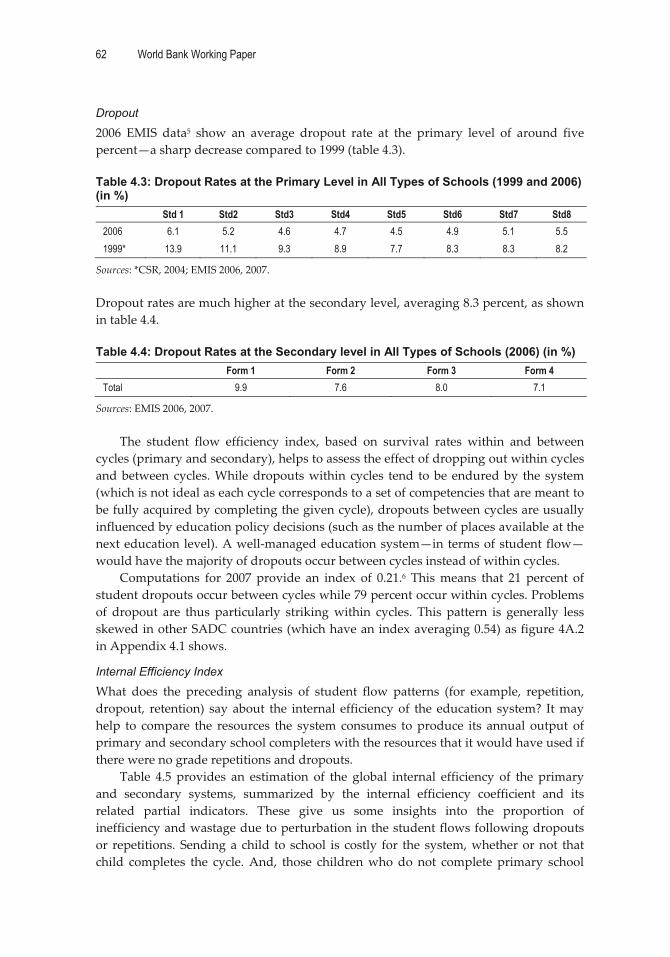
62 World Bank Working Paper
�
Dropout
2006� EMIS� data5� show� an� average� dropout� rate� at� the� primary� level� of� around� five�percent—a�sharp�decrease�compared�to�1999�(table�4.3).���Table 4.3: Dropout Rates at the Primary Level in All Types of Schools (1999 and 2006) (in %)
Std 1 Std2 Std3 Std4 Std5 Std6 Std7 Std8 2006 6.1 5.2 4.6 4.7 4.5 4.9 5.1 5.5 1999* 13.9 11.1 9.3 8.9 7.7 8.3 8.3 8.2
Sources:�*CSR,�2004;�EMIS�2006,�2007.��Dropout�rates�are�much�higher�at�the�secondary�level,�averaging�8.3�percent,�as�shown�in�table�4.4.���Table 4.4: Dropout Rates at the Secondary level in All Types of Schools (2006) (in %)
Form 1 Form 2 Form 3 Form 4 Total 9.9 7.6 8.0 7.1
Sources:�EMIS�2006,�2007.��
The� student� flow� efficiency� index,� based� on� survival� rates� within� and� between�cycles�(primary�and�secondary),�helps�to�assess�the�effect�of�dropping�out�within�cycles�and�between�cycles.�While�dropouts�within� cycles� tend� to�be�endured�by� the� system�(which�is�not�ideal�as�each�cycle�corresponds�to�a�set�of�competencies�that�are�meant�to�be�fully�acquired�by�completing�the�given�cycle),�dropouts�between�cycles�are�usually�influenced�by�education�policy�decisions�(such�as�the�number�of�places�available�at�the�next�education�level).�A�well�managed�education�system—in�terms�of�student�flow—would�have�the�majority�of�dropouts�occur�between�cycles�instead�of�within�cycles.��
Computations� for� 2007� provide� an� index� of� 0.21.6� This�means� that� 21� percent� of�student�dropouts�occur�between�cycles�while�79�percent�occur�within�cycles.�Problems�of� dropout� are� thus� particularly� striking�within� cycles.� This� pattern� is� generally� less�skewed�in�other�SADC�countries�(which�have�an�index�averaging�0.54)�as�figure�4A.2�in�Appendix�4.1�shows.�
Internal Efficiency Index
What� does� the� preceding� analysis� of� student� flow� patterns� (for� example,� repetition,�dropout,� retention)� say�about� the� internal� efficiency�of� the� education� system?� It�may�help� to� compare� the� resources� the� system� consumes� to�produce� its� annual� output� of�primary�and�secondary�school�completers�with�the�resources�that�it�would�have�used�if�there�were�no�grade�repetitions�and�dropouts.��
Table� 4.5� provides� an� estimation� of� the� global� internal� efficiency� of� the� primary�and� secondary� systems,� summarized� by� the� internal� efficiency� coefficient� and� its�related� partial� indicators.� These� give� us� some� insights� into� the� proportion� of�inefficiency�and�wastage�due�to�perturbation�in�the�student�flows�following�dropouts�or� repetitions.�Sending�a� child� to� school� is� costly� for� the� system,�whether�or�not� that�child� completes� the� cycle.�And,� those� children�who�do� not� complete� primary� school�

The Education System in Malawi 63
�
have� very� little� chance� of� getting� literate.� The� consumption� of� student�years� by�students�dropping�out�before�the�end�of�the�cycle�entails�a�waste�of�public�resources.�Similarly,� repetition� creates� extra� charges� for� the� system,� as� it� costs� two� or� more�schooling�years�to�validate�only�one�year.�The�consumption�of�unproductive�years�of�schooling� following� dropouts� or� repetition� can� lead� to� an� inefficient� use� of� already�scare�public�resources.��
The�IEC�is�defined�as�the�ratio�between�the�cumulative�student�years�invested�in�a�system� with� no� student� flow� problems� and� the� actual� cumulative� student�years�invested�given�the�current�pattern�of�dropout�and�grade�repetition�(for�example,�those�additional� years� due� to� repetition� and� those� useless� years� due� to� dropouts).� An�education� system� with� no� dropouts� and� no� repetitions� would� have� a� coefficient�of�100.7,8��Table 4.5: Internal Efficiency Coefficient in Primary and Secondary Schooling (1999/00–2006/07)
1999/00* 2006/07 Primary Internal efficiency coefficient 39% 35%
Dropout related (w/o repetitions) 50% 49% Repetition related (w/o dropouts) 80% 71% Student-years required to produce one graduate 20.1 23
Secondary (lower and upper) Internal efficiency coefficient 76% 66%
Dropout related (w/o repetitions) 81% 71% Repetition related (w/o dropouts) 95% 94% Student-years required to produce one graduate 5.2 6
Sources:�*CSR�2004,�EMIS�2006,�2007;�HIS�2004�for�repetition�structure.��
The�internal�efficiency�coefficient�at�the�primary�level�remains�particularly�low�(35�percent�in�2007).�This�implies�that�65�percent�of�public�resources�are�used�for�repeated�years�or�for�school�years�of�students�who�are�dropping�out�before�completing�the�cycle.�Indeed,� the� system� requires� 23� student�years� to� produce� one� graduate� instead� of� 8�years�with�a�perfect� efficiency.�The� situation�has� slightly�worsened� since� 1999,�when�the� IEC� was� 39� percent.� An� increase� in� repetition� is� mainly� responsible� for� this�degradation�and�the�related�rise�in�wasted�resources.�In�1999,�repetition�induced�a�20�percent�waste�of�resources� (partial� IEC�of�80�percent);� in�2007,� the�waste�of�resources�was�29�percent�(partial�index�of�efficiency�of�71�percent).�Dropout�also�remains�a�major�issue,�inducing�a�50�percent�waste�of�resources.�Indeed,�in�a�system�with�no�repetitions,�the�partial�efficiency�index�(dropout�related�only)�would�be�49�percent.�High�dropout�rates�have�the�greatest�adverse�affect�on�the�efficiency�of�the�system.��
Internal�efficiency�at�the�secondary�level� is�slightly�better,�with�a�coefficient�of�66�percent� in� 2007,� although� the� situation�has� significantly�deteriorated�over� the�period�(the�IEC�was�76�percent�in�1999).�Thirty�four�percent�of�resources�are�currently�used�for�repeated�years�or�for�school�years�of�students�who�drop�out�before�cycle�completion.�It�takes� six� student�years� to� produce� a� graduate� instead� of� the� four� years� theoretically�needed.� This� is� higher� than� in� 1999/00,� when� 5.2� years� were� required� to� produce� a�

64 World Bank Working Paper
�
graduate.� Inefficiencies� resulting� from� repetitions� remained� low�over� the�period� (5–6�percent);�major� problems� stemming� from� dropouts,�which� alone� led� to� a� 29� percent�wastage� of� public� resources� in� 2007.� Additional� efforts� are� necessary,� despite�constraints�on�resources,�to�reduce�student�dropout�rates.��
Allowing� for� international� comparisons� sheds� some� light� on� the� magnitude� of�inefficiencies�in�the�Malawian�education�system.�As�shown�below,�Malawi�fares�poorly�on�that�issue�compared�to�other�countries�in�the�region.�Indeed,�the�internal�efficiency�coefficient�(computed�over�a�primary�cycle�of�six�years)9�stands�at�0.45�(or�45�percent):�the�lowest�level�among�the�SADC�countries.��
Quality and Learning Outcomes
The�quality�of�education�is�becoming�a�major�issue�for�most�education�sector�planners�in� Africa� and� constitutes� a� specific� EFA� goal.� Yet,� what� does� this� notion� cover?�Defining�quality�is�actually�tricky�and�measuring�it�is�even�trickier.�In�many�instances,�the�measure�of�quality�refers�to�the�level�and�type�of�resources�poured�into�the�system,�such� as� the� STR,� the� level� of� teacher� training,� or� the� type� of� school� buildings.� This�measure� is� often� favored�when� there� is� a� lack� of� adequate� data� on� student� learning�outcomes.�Yet,�as�many�studies�have�shown,�the�relationship�between�education�inputs�and�learning�outcomes�is�somewhat�weak.�Indeed,�if�resources�do�matter,�the�way�they�are�being�used�tends�to�matter�even�more.�
Referring� to� the� EFA� goal� on� quality,10� quality� can� be� defined� as�what� students�actually�learn.�In�that�context,�the�level�of�learning�achievement�becomes�a�major�issue�as� it� provides� interesting� insights� into� the� level� of� human� capital� build,� which� are�crucial�for�the�development�of�the�nation.�To�assess�quality�and�learning�outcomes,�two�major� sources� of� data� are�mobilized:� i)� standardized� tests� performed� at� the� primary�level—Southern�African�Consortium� for�Monitoring� Educational� Quality� (SACMEQ)�data—and�ii)�national�examinations�at�the�primary�and�secondary�levels.��
Level of Learning Outcomes
SACMEQ�Scores�Malawi,�along�with�other�13�countries� in� the�region,� is�participating� in� the�SACMEQ�which� is� measuring� student� performances� in� grade� 6� in� English� reading� and�mathematics.� Malawi� is� currently� undergoing� its� third� round;� yet� data� will� not� be�available� for� this� report.� We� will� therefore� rely� on� the� results� of� the� last� SACMEQ�surveys�conducted�in�2004�and�1999.��
Evidence� from� SACMEQ� data� gathered� in� table� 4.6� would� suggest� a� decline� in�quality�of�learning,11�as�expressed�by�the�score�in�English�reading,�which�dropped�from�463� (SACMEQ� I)� to� 429� (SACMEQ� II).� The� percentage� of� children� who� attained� a�minimum�level�of�mastery�in�English�reading�fell�by�50�percent�from�1999�to�2004,�to�reach�barely�9�percent� in�2004.�This�poor�result� is�a�major�concern� in� itself,�and�since�English�is�the�language�used�in�instruction,�this�overall�poor�performance�could�have�very�adverse�effects�on�the�entire�student�learning�process.��
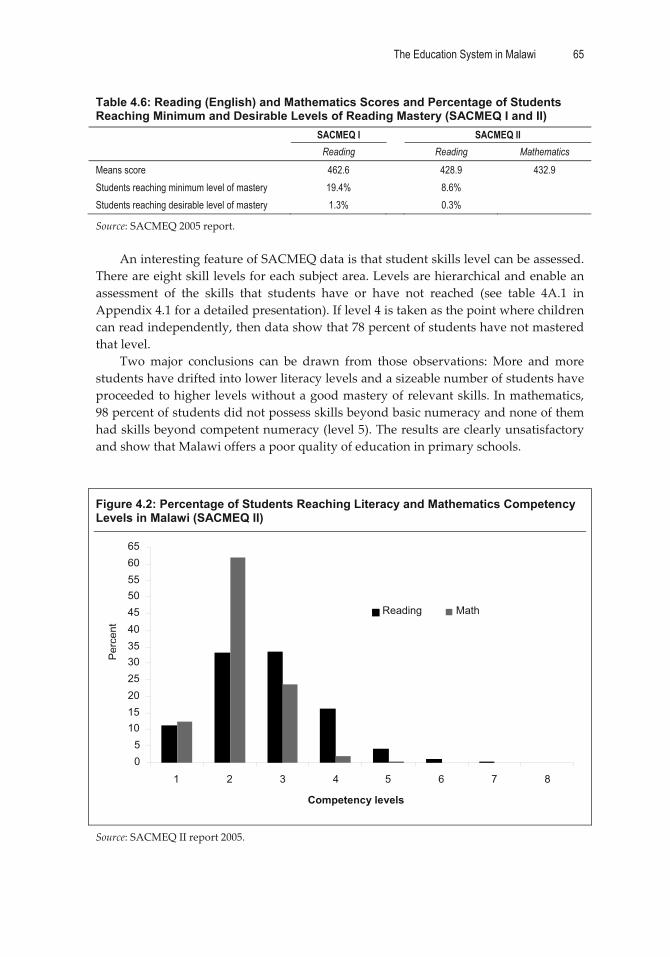
The Education System in Malawi 65
�
Table 4.6: Reading (English) and Mathematics Scores and Percentage of Students Reaching Minimum and Desirable Levels of Reading Mastery (SACMEQ I and II) SACMEQ I SACMEQ II
Reading Reading Mathematics
Means score 462.6 428.9 432.9 Students reaching minimum level of mastery 19.4% 8.6% Students reaching desirable level of mastery 1.3% 0.3%
Source:�SACMEQ�2005�report.��
An�interesting�feature�of�SACMEQ�data�is�that�student�skills�level�can�be�assessed.�There�are�eight�skill�levels�for�each�subject�area.�Levels�are�hierarchical�and�enable�an�assessment� of� the� skills� that� students� have� or� have� not� reached� (see� table� 4A.1� in�Appendix�4.1�for�a�detailed�presentation).�If�level�4�is�taken�as�the�point�where�children�can�read�independently,�then�data�show�that�78�percent�of�students�have�not�mastered�that�level.��
Two�major� conclusions� can� be� drawn� from� those� observations:� More� and�more�students�have�drifted�into�lower�literacy�levels�and�a�sizeable�number�of�students�have�proceeded�to�higher�levels�without�a�good�mastery�of�relevant�skills.�In�mathematics,�98�percent�of�students�did�not�possess�skills�beyond�basic�numeracy�and�none�of�them�had�skills�beyond�competent�numeracy�(level�5).�The�results�are�clearly�unsatisfactory�and�show�that�Malawi�offers�a�poor�quality�of�education�in�primary�schools.����
Figure 4.2: Percentage of Students Reaching Literacy and Mathematics Competency Levels in Malawi (SACMEQ II)
�
Source:�SACMEQ�II�report�2005.�
0 5
10 15 20 25 30 35 40 45 50 55 60 65
1 2 3 4 5 6 7 8
Competency levels
Per
cent
Reading Math

66 World Bank Working Paper
�
Compared�to�other�countries,�Malawi� fares�poorly,�being�at� the�bottom�of�all� the�SACMEQ� countries� in� English� reading� and� next� to� last� in� mathematics� (figure� 4.3).�Students� were� among� the� lowest� achievers� in� the� region,� indicating� that� Malawi�provided�the�lowest�quality�of�primary�schooling.���
Figure 4.3: Mean for the Reading and Mathematics Test Scores of Learners in All SACMEQ Countries (SACMEQ II)
�
�
Source:�SACMEQ�II�report,�2005.�Note:�SACMEQ�scores�are�scaled�so�that�the�average�of�all�students�is�500�and�the�standard�deviation�is�100.�

The Education System in Malawi 67
�
There� is� a� strong�need� to� further� investigate� these� results� and�better�understand�why�competency�levels�are�so�poor�and�have�fallen�over�the�past� few�years.�Could�it�result� from� the� rapid� increase� in� access� (of� lower�achieving� students� from� poorer�households)� and� class� size� following� the� elimination� of� school� fees� in� 1994?� Yet,� an�increase�in�school�enrollment�does�not�systematically�lead�to�a�deterioration�of�learning�achievement,� as� illustrated� by� Madagascar,� which� has� experienced� significant�progresses�over�the�past�years,�both�school�coverage�and�quality�of�learning�(UNESCO�BREDA,�2007).�The�release�of�the�third�SACMEQ�results�will�prove�very�insightful� in�that� regard,� by� confirming� or� denying� current� trends� and� enabling� a� longitudinal�analysis�of�potential�determinants.�In�addition,�relying�on�innovative�assessment�tools,�such�as�the�Early�Grade�Reading�Assessment�(EGRA),�could�prove�beneficial�in�better�understanding�the�quality�issues�at�stake.��
National�Examination�Pass�Rates��National� examination� pass� rates� provide� another� way� to� look� at� quality� issues.12�Results�on�national� examinations�administrated�at� the�end�of� each� cycle�or� sub�cycle�have� the� advantage�of� being� available� at� the�national� level� and� represent� a� common�test� taken� by� all� students� from� a� given� grade.� One� usually� finds� homogeneous�conditions�in�taking�the�test�and�in�the�protocol�of�correction.�These�data�present�some�limits:��
� they� do� not� cover� all� competencies� and� learning� achievement� acquired�throughout� a� cycle� (and� therefore� are� not� the� most� appropriate� data� for�assessing�learning�achievement,�unlike�SACMEQ);�
� they�do�not�have�information�on�students’�backgrounds,�as�data�are�not�made�available�on�an�individual�level;�and��
� they�do�not�allow�for�international�comparisons.��
PSLE�Pass�Rates13�In� 2006,� 93� percent� of� Standard� 8� students� sat� for� the� PSLE,� and� 74� percent� passed�(table�4.7).14�This�means�there�is�still�one�student�out�of�four�who�has�failed�the�exam.�Some�differences�emerge�according�to�the�type�of�school:�private�schools�show�better�results� than� public� ones� with� an� eight�point� difference� in� their� favor.� The� fact� that�private� schools� tend� to� be� located� in� urban� areas15� (which� may� attract� better� and�wealthier�students)�and�have�more�educational�inputs16�could�explain�these�results.��Table 4.7: Leaving School Examination Results at the Primary Level by School Type in % (2006)
Government Religious Total Public Private Total Sat rate (%) 93.9 93.0 93.3 95.1 93.4 Pass rate (%) 74.9 72.7 73.5 82.0 73.7
Source:�EMIS�2007.�Note:�Sat�rate=�nb�of�students�in�Std.�8�who�sit�the�exam/nb�of�student�in�Std�8;�Pass�rate=�nb�of�students�in�Std�8�who�pass�the�exam/nb�of�student�in�Std.�8�who�sit�the�exam.���
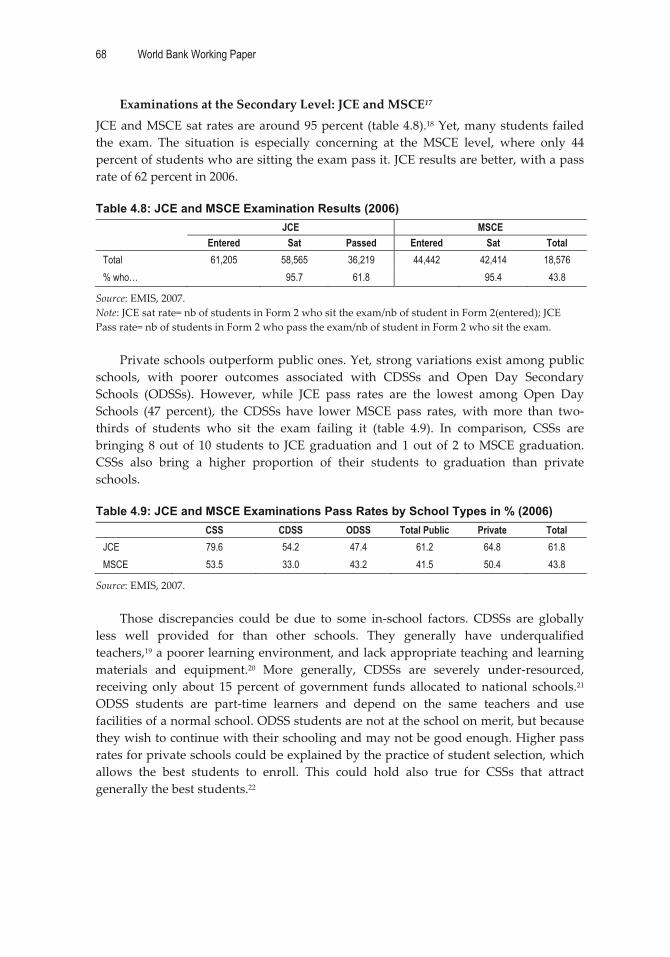
68 World Bank Working Paper
�
Examinations�at�the�Secondary�Level:�JCE�and�MSCE17�JCE�and�MSCE�sat�rates�are�around�95�percent�(table�4.8).18�Yet,�many�students�failed�the� exam.� The� situation� is� especially� concerning� at� the� MSCE� level,� where� only� 44�percent�of�students�who�are�sitting�the�exam�pass�it.�JCE�results�are�better,�with�a�pass�rate�of�62�percent�in�2006.���Table 4.8: JCE and MSCE Examination Results (2006)
JCE MSCE Entered Sat Passed Entered Sat Total
Total 61,205 58,565 36,219 44,442 42,414 18,576 % who… 95.7 61.8 95.4 43.8
Source:�EMIS,�2007.�Note:�JCE�sat�rate=�nb�of�students�in�Form�2�who�sit�the�exam/nb�of�student�in�Form�2(entered);�JCE�Pass�rate=�nb�of�students�in�Form�2�who�pass�the�exam/nb�of�student�in�Form�2�who�sit�the�exam.��
Private�schools�outperform�public�ones.�Yet,�strong�variations�exist�among�public�schools,� with� poorer� outcomes� associated� with� CDSSs� and� Open� Day� Secondary�Schools� (ODSSs).� However,� while� JCE� pass� rates� are� the� lowest� among� Open� Day�Schools� (47� percent),� the� CDSSs� have� lower�MSCE� pass� rates,� with�more� than� two�thirds� of� students� who� sit� the� exam� failing� it� (table� 4.9).� In� comparison,� CSSs� are�bringing�8�out�of� 10� students� to� JCE�graduation�and�1�out�of� 2� to�MSCE�graduation.�CSSs� also� bring� a� higher� proportion� of� their� students� to� graduation� than� private�schools.���Table 4.9: JCE and MSCE Examinations Pass Rates by School Types in % (2006)
CSS CDSS ODSS Total Public Private Total JCE 79.6 54.2 47.4 61.2 64.8 61.8 MSCE 53.5 33.0 43.2 41.5 50.4 43.8
Source:�EMIS,�2007.���
Those� discrepancies� could� be� due� to� some� in�school� factors.� CDSSs� are� globally�less� well� provided� for� than� other� schools.� They� generally� have� underqualified�teachers,19�a�poorer�learning�environment,�and�lack�appropriate�teaching�and�learning�materials� and� equipment.20� More� generally,� CDSSs� are� severely� under�resourced,�receiving� only� about� 15� percent� of� government� funds� allocated� to� national� schools.21�ODSS� students� are� part�time� learners� and� depend� on� the� same� teachers� and� use�facilities�of�a�normal�school.�ODSS�students�are�not�at�the�school�on�merit,�but�because�they�wish�to�continue�with�their�schooling�and�may�not�be�good�enough.�Higher�pass�rates�for�private�schools�could�be�explained�by�the�practice�of�student�selection,�which�allows� the� best� students� to� enroll.� This� could� hold� also� true� for� CSSs� that� attract�generally�the�best�students.22��
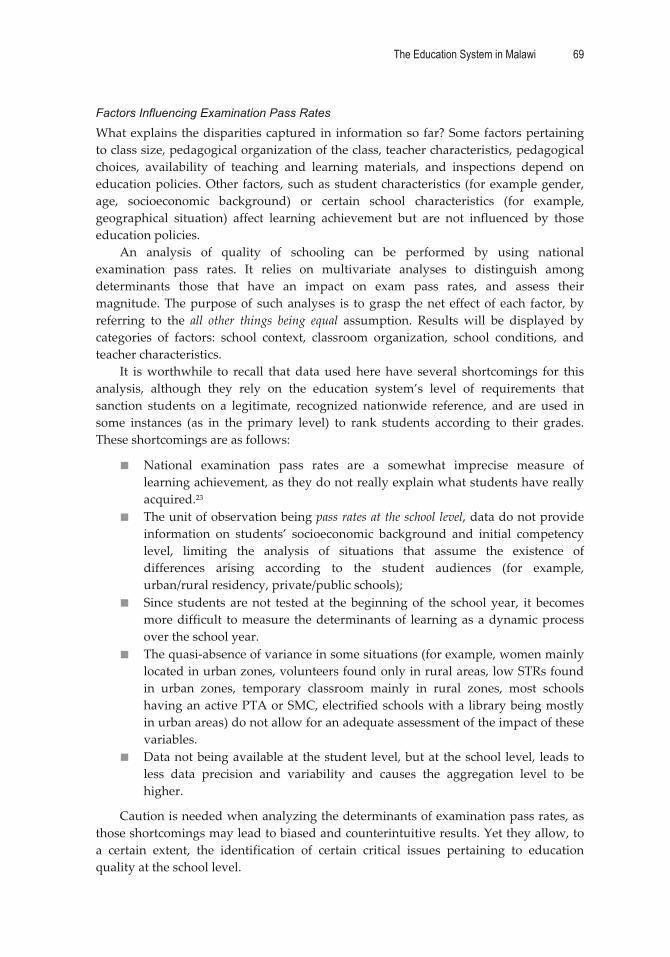
The Education System in Malawi 69
�
Factors Influencing Examination Pass Rates
What�explains�the�disparities�captured�in� information�so�far?�Some�factors�pertaining�to�class�size,�pedagogical�organization�of�the�class,�teacher�characteristics,�pedagogical�choices,� availability� of� teaching� and� learning� materials,� and� inspections� depend� on�education�policies.�Other� factors,�such�as�student�characteristics� (for�example�gender,�age,� socioeconomic� background)� or� certain� school� characteristics� (for� example,�geographical� situation)� affect� learning� achievement� but� are� not� influenced� by� those�education�policies.�
An� analysis� of� quality� of� schooling� can� be� performed� by� using� national�examination� pass� rates.� It� relies� on� multivariate� analyses� to� distinguish� among�determinants� those� that� have� an� impact� on� exam� pass� rates,� and� assess� their�magnitude.�The�purpose�of� such�analyses� is� to�grasp� the�net�effect�of� each� factor,�by�referring� to� the� all� other� things� being� equal� assumption.� Results� will� be� displayed� by�categories� of� factors:� school� context,� classroom� organization,� school� conditions,� and�teacher�characteristics.��
It� is�worthwhile� to� recall� that� data�used�here� have� several� shortcomings� for� this�analysis,� although� they� rely� on� the� education� system’s� level� of� requirements� that�sanction� students� on� a� legitimate,� recognized� nationwide� reference,� and� are� used� in�some� instances� (as� in� the� primary� level)� to� rank� students� according� to� their� grades.�These�shortcomings�are�as�follows:�
� National� examination� pass� rates� are� a� somewhat� imprecise� measure� of�learning�achievement,�as�they�do�not�really�explain�what�students�have�really�acquired.23�
� The�unit�of�observation�being�pass�rates�at�the�school�level,�data�do�not�provide�information� on� students’� socioeconomic� background� and� initial� competency�level,� limiting� the� analysis� of� situations� that� assume� the� existence� of�differences� arising� according� to� the� student� audiences� (for� example,�urban/rural�residency,�private/public�schools);�
� Since� students� are�not� tested�at� the�beginning�of� the� school�year,� it� becomes�more�difficult� to�measure� the�determinants�of� learning�as�a�dynamic�process�over�the�school�year.�
� The�quasi�absence�of�variance�in�some�situations�(for�example,�women�mainly�located�in�urban�zones,�volunteers�found�only�in�rural�areas,�low�STRs�found�in� urban� zones,� temporary� classroom� mainly� in� rural� zones,� most� schools�having�an�active�PTA�or�SMC,�electrified�schools�with�a�library�being�mostly�in�urban�areas)�do�not�allow�for�an�adequate�assessment�of�the�impact�of�these�variables.��
� Data�not�being�available�at� the�student� level,�but�at� the�school� level,� leads�to�less� data� precision� and� variability� and� causes� the� aggregation� level� to� be�higher.�
Caution�is�needed�when�analyzing�the�determinants�of�examination�pass�rates,�as�those�shortcomings�may�lead�to�biased�and�counterintuitive�results.�Yet�they�allow,�to�a� certain� extent,� the� identification� of� certain� critical� issues� pertaining� to� education�quality�at�the�school�level.��
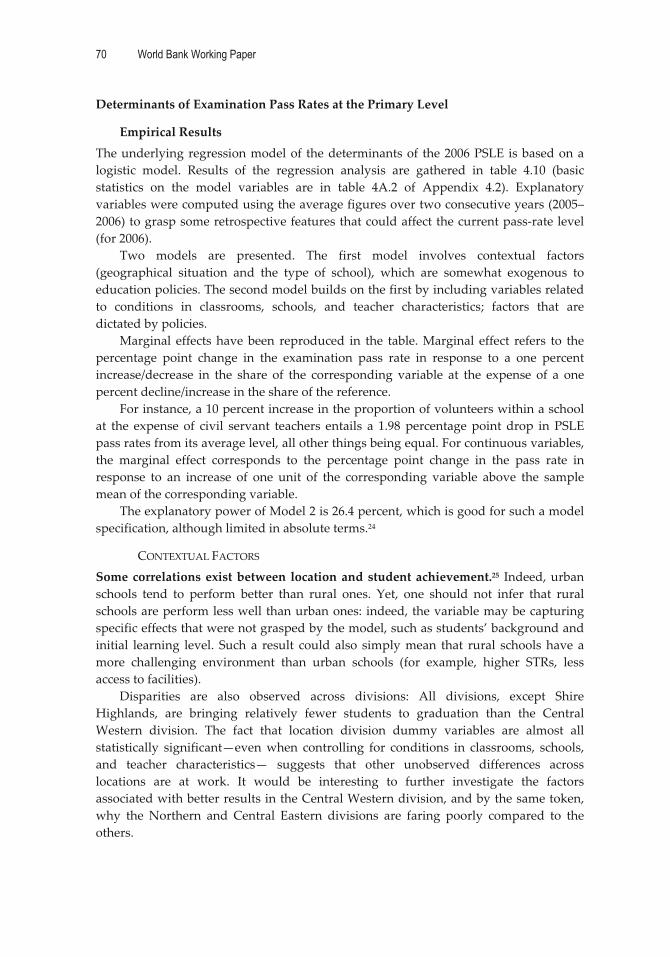
70 World Bank Working Paper
�
Determinants�of�Examination�Pass�Rates�at�the�Primary�Level�
Empirical�Results�The�underlying�regression�model�of� the�determinants�of� the�2006�PSLE�is�based�on�a�logistic� model.� Results� of� the� regression� analysis� are� gathered� in� table� 4.10� (basic�statistics� on� the� model� variables� are� in� table� 4A.2� of� Appendix� 4.2).� Explanatory�variables�were�computed�using�the�average�figures�over�two�consecutive�years�(2005–2006)�to�grasp�some�retrospective�features�that�could�affect�the�current�pass�rate�level�(for�2006).��
Two� models� are� presented.� The� first� model� involves� contextual� factors�(geographical� situation� and� the� type� of� school),� which� are� somewhat� exogenous� to�education�policies.�The�second�model�builds�on�the�first�by�including�variables�related�to� conditions� in� classrooms,� schools,� and� teacher� characteristics;� factors� that� are�dictated�by�policies.��
Marginal� effects�have�been� reproduced� in� the� table.�Marginal� effect� refers� to� the�percentage� point� change� in� the� examination� pass� rate� in� response� to� a� one� percent�increase/decrease� in� the� share� of� the� corresponding� variable� at� the� expense� of� a� one�percent�decline/increase�in�the�share�of�the�reference.��
For�instance,�a�10�percent�increase�in�the�proportion�of�volunteers�within�a�school�at� the� expense� of� civil� servant� teachers� entails� a� 1.98� percentage�point� drop� in�PSLE�pass�rates�from�its�average�level,�all�other�things�being�equal.�For�continuous�variables,�the� marginal� effect� corresponds� to� the� percentage� point� change� in� the� pass� rate� in�response� to� an� increase� of� one� unit� of� the� corresponding� variable� above� the� sample�mean�of�the�corresponding�variable.��
The�explanatory�power�of�Model�2�is�26.4�percent,�which�is�good�for�such�a�model�specification,�although�limited�in�absolute�terms.24��
CONTEXTUAL�FACTORS�Some�correlations�exist�between� location�and�student�achievement.25� Indeed,�urban�schools� tend� to� perform� better� than� rural� ones.� Yet,� one� should� not� infer� that� rural�schools�are�perform�less�well�than�urban�ones:� indeed,�the�variable�may�be�capturing�specific�effects�that�were�not�grasped�by�the�model,�such�as�students’�background�and�initial� learning� level.� Such� a� result� could�also� simply�mean� that� rural� schools�have�a�more� challenging� environment� than� urban� schools� (for� example,� higher� STRs,� less�access�to�facilities).�
Disparities� are� also� observed� across� divisions:� All� divisions,� except� Shire�Highlands,� are� bringing� relatively� fewer� students� to� graduation� than� the� Central�Western� division.� The� fact� that� location� division� dummy� variables� are� almost� all�statistically� significant—even�when� controlling� for� conditions� in� classrooms,� schools,�and� teacher� characteristics—� suggests� that� other� unobserved� differences� across�locations� are� at� work.� It� would� be� interesting� to� further� investigate� the� factors�associated�with�better�results�in�the�Central�Western�division,�and�by�the�same�token,�why� the� Northern� and� Central� Eastern� divisions� are� faring� poorly� compared� to� the�others.����
The Education System in Malawi 71
�
Table 4.10: Determinants of PSLE Results at the National Level (2006)— Marginal Effect
Model 1 Model 2 R2 15% 26%
Average pass rate 75.5 73.5 Number of observations 3 198 3 163
Marginal effect Marginal effect Contextual factors
Division Northern –0.181 *** –0.179 ***
Central Eastern –0.138 *** –0.143 *** Central Western Ref Ref
Southern Eastern –0.051 *** –0.065 *** Southern Western –0.041 *** –0.044 ***
Shire Highlands –0.007 –0.004 Location
Urban Ref Ref Rural –0.160 *** –0.053 ***
Type of school Government Ref Ref
Religious agency 0.005 0.011 Private 0.073 *** 0.069 ***
Classroom/pedagogical organization STR>60:1(Ref: STR<=60:1) –0.043 ***
% of repeaters 0.015 *** Week teaching time (hour) 0.001 ***
At least 1 book for 2 students (Chichewa) (Ref: less than one book per two students) 0.013 *** At least 1 book for 2 students (English)(Ref: less than one book per two students) 0.014
At least 1 book for 2 students (Mathematics)(Ref: less than one book per two students) –0.008 School conditions
Overlapping shift (Ref: Single shift) –0.012 *** Type of classroom
Proportion of Permanent classrooms Pseudo–ref Proportion of Temporary classrooms –0.042 ***
Proportion of Open air classrooms 0.008 School facilities
Has a library 0.040 *** Has latrines 0.062 ***
Has electricity 0.071 *** Has water 0.010
Parent-teacher association/school management committee is active (Ref: not active) 0.009 Teacher characteristics
Proportion of female teachers 0.216 *** Proportion of teachers who are
Civil servants Pseudo–ref Temporary –0.051
Month–to–Month –0.041 Volunteers –0.198 ***
Proportion of teachers with PSLE –0.008
JCE –0.128 *** MSLE Pseudo–ref
Higher education diploma/degree 0.097
Sources:�Econometric�models�using�EMIS�2005,�2006,�2007.�Pseudo�reference�is�used�and�it�is�not�a�reference�per�se�because�variables�refer�to�percentage�and�not�to�a�regular�categorical�variable.��Notes:�Reading:�A�10�percent�point�drop�in�the�share�of�teachers�with�a�JCE�to�the�benefit�of�MSCE�teachers�would�increase�the�pass�rate�by�1.52�percent�(from�its�current�average�level).�The�marginal�impact�of�the�variable�is�positive,�indicating�that�the�higher�the�level�of�marginal�effect,�the�better�its�performance�as�measured�by�the�PSLE�pass�rate.��***:�significant�at�1%,�**�at�5%,�*�at�10%��

72 World Bank Working Paper
�
Private�schools�have�better�results�than�public�ones—whether�government�based�or� religious—even� when� controlling� for� factors� such� as� location,� classroom�organization,� school� conditions,� and� teacher� characteristics.� Unobserved� factors� are�likely� too.� Indeed,� data� do� not� allow� a� control� for� student� characteristics� and� some�teacher� features.�Private�schools�may�attract�students�from�higher�socioeconomic�and�cultural�backgrounds�(which�are�often�correlated�with�better�scoring).�In�addition,�it�is�believed� that� teachers� in� private� schools� display� greater� dedication� since� they� are�accountable�to�their�immediate�bosses�whose�bait�for�higher�enrollment�and/or�prices�is�a�good�pass�rate.��
CLASSROOM/PEDAGOGICAL�ORGANIZATION�Class�size�has�a�significantly�negative�effect�on�student�performances.�Classes�of�big�size—proxied�here�by�an�STR�of�more�than�60:1—are�showing�worse�results�than�smaller�size�classes.�This�could�imply�that�teachers�might�be�finding�it�difficult�to�adapt�their�pedagogy�and�devote�enough�time�to�each�student�when�dealing�with�a�sizable�number�of�students.�The�national�policy�to�bring�down�the�STR�to�60:1�could�have�a�positive�impact�on�student�learning�achievement.��
The�availability�of�books�has�little�significant�impact�on�learning�achievement.�Indeed,�only�Chichewa�books�tend�to�have�a�positive�impact.�More�generally,�issues�related� to�book�use� at� school� and� class� levels�may�be� at� stake.� Indeed,� there� is� some�evidence� that� books� are� being� kept� in� head� teacher’s� offices� to� prevent� them� from�deterioration.�The�books�might�be�available�at�schools�but�not�in�students’�hands,�thus�having�no�effect�on�learning.��
Instructional�time�has�a�significant�and�positive�impact�on�pass�rates.�Teaching�time� is�a�key�element� in� learning�outcomes.� In�Malawi,� the� total� instructional� time� in�primary�schools�amounts�to�721�hours,�far�below�the�theoretical�910�hours.�On�average,�a�student�is�taught�18.5�hours�per�week,�or�3.7�hours�per�day.�This�ranges�from�around�3� hours� in� the� lower� grades� to� close� to� 4� hours� in� the� upper� ones.� This� figure� is�overevaluated,� as� teacher� absenteeism� is� not� recorded� here.� A� Public� Expenditure�Tracking�Survey�(PETS)�conducted�in�2004�estimated�teacher�absenteeism�at�20�percent�on� any� given� day,� which� would� mean� an� estimated� average� volume� of� annual�instructional�time�of�only�577�hours.�In�addition,�late�entry,�strikes,�and�casual�holidays�are�all�bringing�down�teaching�time.�Student�absenteeism,�whether�linked�to�sickness,�household� chores,� or� productive� labor,� may� further� reduce� the� number� of� hours� a�student�is�being�taught.�Addressing�this�issue,�as�well�as�that�of�teacher�absenteeism,�is�crucial�to�improving�learning�outcomes.��
A�lower�percentage�of�repetition�at� the�school� level� tends�to�have�a�significant�and� positive� effect� on� learning� achievement.� There� is� an� array� of� literature� on� the�effect� repetition�has� on�dropouts� (see�box�4.1).� Students� remaining� in� the� system�are�certainly�the�best�ones,�allowing�for�a�higher�level�of�pass�rates.�This�result�could�be�a�simple�reflection�of�the�selection�process�in�place�at�the�school�level.��
CONDITIONS�IN�SCHOOLS��Overlapping� shift� is� having� a� significant� negative� impact� on� pass� rate� levels.�Teachers�might�find�it�difficult�in�such�an�organizational�mode�to�adapt�their�pedagogy�and�teaching.��
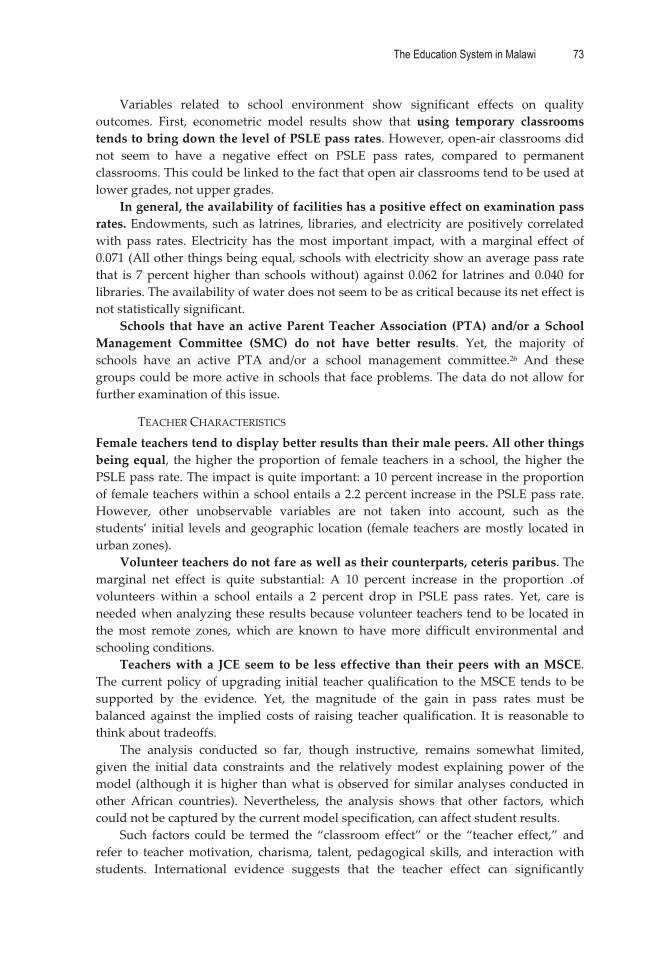
The Education System in Malawi 73
�
Variables� related� to� school� environment� show� significant� effects� on� quality�outcomes.� First,� econometric� model� results� show� that� using� temporary� classrooms�tends�to�bring�down�the�level�of�PSLE�pass�rates.�However,�open�air�classrooms�did�not� seem� to� have� a� negative� effect� on� PSLE� pass� rates,� compared� to� permanent�classrooms.�This�could�be�linked�to�the�fact�that�open�air�classrooms�tend�to�be�used�at�lower�grades,�not�upper�grades.��
In�general,�the�availability�of�facilities�has�a�positive�effect�on�examination�pass�rates.�Endowments,�such�as� latrines,� libraries,�and�electricity�are�positively�correlated�with� pass� rates.� Electricity� has� the�most� important� impact,�with� a�marginal� effect� of�0.071�(All�other�things�being�equal,�schools�with�electricity�show�an�average�pass�rate�that� is� 7�percent�higher� than� schools�without)� against� 0.062� for� latrines�and�0.040� for�libraries.�The�availability�of�water�does�not�seem�to�be�as�critical�because�its�net�effect�is�not�statistically�significant.��
Schools� that�have� an� active�Parent�Teacher�Association� (PTA)� and/or� a� School�Management� Committee� (SMC)� do� not� have� better� results.� Yet,� the� majority� of�schools� have� an� active� PTA� and/or� a� school� management� committee.26� And� these�groups�could�be�more�active�in�schools�that�face�problems.�The�data�do�not�allow�for�further�examination�of�this�issue.�
TEACHER�CHARACTERISTICS�Female�teachers�tend�to�display�better�results�than�their�male�peers.�All�other�things�being�equal,� the�higher� the�proportion�of� female� teachers� in�a� school,� the�higher� the�PSLE�pass�rate.�The�impact�is�quite�important:�a�10�percent�increase�in�the�proportion�of�female�teachers�within�a�school�entails�a�2.2�percent�increase�in�the�PSLE�pass�rate.�However,� other� unobservable� variables� are� not� taken� into� account,� such� as� the�students’� initial� levels�and�geographic� location� (female� teachers�are�mostly� located� in�urban�zones).��
Volunteer�teachers�do�not�fare�as�well�as�their�counterparts,�ceteris�paribus.�The�marginal� net� effect� is� quite� substantial:� A� 10� percent� increase� in� the� proportion� .of�volunteers� within� a� school� entails� a� 2� percent� drop� in� PSLE� pass� rates.� Yet,� care� is�needed�when�analyzing�these�results�because�volunteer�teachers�tend�to�be�located�in�the�most� remote� zones,�which� are� known� to� have�more� difficult� environmental� and�schooling�conditions.��
Teachers�with�a� JCE� seem� to�be� less� effective� than� their�peers�with�an�MSCE.�The�current�policy�of�upgrading� initial� teacher�qualification� to� the�MSCE� tends� to�be�supported� by� the� evidence.� Yet,� the� magnitude� of� the� gain� in� pass� rates� must� be�balanced� against� the� implied� costs� of� raising� teacher�qualification.� It� is� reasonable� to�think�about�tradeoffs.��
The� analysis� conducted� so� far,� though� instructive,� remains� somewhat� limited,�given� the� initial� data� constraints� and� the� relatively�modest� explaining� power� of� the�model� (although� it� is�higher� than�what� is�observed� for� similar�analyses�conducted� in�other� African� countries).� Nevertheless,� the� analysis� shows� that� other� factors,� which�could�not�be�captured�by�the�current�model�specification,�can�affect�student�results.��
Such� factors� could� be� termed� the� “classroom� effect”� or� the� “teacher� effect,”� and�refer� to� teacher�motivation,� charisma,� talent,� pedagogical� skills,� and� interaction�with�students.� International� evidence� suggests� that� the� teacher� effect� can� significantly�

74 World Bank Working Paper
�
influence� student� learning.� It�would� be�useful� to� identify� and�visit� strong� schools� to�have� a� better� understanding� of�what�works� and�what�does� not� and� reproduce� good�practices� in�poorer�performing� schools.� Producing�more� adapted�methodology� (such�as� the�value�added�approach)�and�data� to�adequately�grasp�determinants�of� learning�achievement�could�also�be�helpful.��
Determinants�of�Pass�Rates�at�the�Secondary�Level�A�similar� logistic�model�was�used� to�assess� the�determinants�of�2006�MSCE�results.27�As� with� the� analysis� on� PSLE� pass� rates,� two� models� were� run.� The� first� model�included� only� contextual� variables,� the� second� one� added� variables� related� to�conditions�in�classrooms�and�schools,�as�well�as�teacher�characteristics�(factors�that�are�dictated� by� policies).� Marginal� effects� are� presented� in� table� 4.11.� The� explanatory�power�of� the�second�model� reaches�39�percent,�which� is�very�good�for�such�a�model�specification.� Yet� again,� data� suffers� from� significant� flaws� that� limit� the� overall�relevancy� of� the� analysis� (see� the� beginning� of� section� II.2),� although� the� issue� of�limited�data�variation�is�less�marked�at�the�secondary�level�than�the�primary�level.��
Empirical�Results�
CONTEXTUAL�FACTORS�The�geographical�situation�shows�no�significant�impact�on�MSCE�results.�Indeed,�no�significant� differences� are� observed� between� schools� located� in� rural� areas� or� urban�ones.�This�may�be�related�to�the�fact�that�unlike�primary�schools,�secondary�schools�are�not�located�in�the�most�remote�rural�zones.�In�addition,�no�strong�pattern�arises�across�divisions,�except�in�the�Southern�Western�division,�which�seems�to�fare�worse�than�the�others� (significant� negative� marginal� effect).� This� feature� remains� even� when�controlling� for� conditions� in� classroom� and� school� and� teacher� characteristics,�suggesting�that�other�unobserved�differences�are�at�work�here.��
CSSs�(and�to�a�lesser�extent,�private�schools)�tend�to�have�far�better�results�than�CDSSs,� even� when� controlling� for� factors� such� as� classroom� organization,� school�conditions,� and� teacher� characteristics.� Unobserved� factors� are� also� likely.�Unfortunately,�available�data�do�not�allow�for�control�of�student�characteristics�and�for�some� teacher� features.� CSSs� and� private� schools� may� indeed� attract� students� from�higher� socioeconomic� and� cultural� backgrounds� (which�are�often� correlated� to�better�scoring).� Enrollment� strategies�may� also� differ� from� one� type� of� school� to� the� other,�further�exacerbating�social�selection.��
CLASSROOM/PEDAGOGICAL�ORGANIZATION�Class� size,� proxied� by� the� STR,� is� not� statistically� significant.� The� STR� in� the�secondary� level� is� generally� low,� averaging� 21:1;� being� slightly� higher� in�CSSs� (25:1)�than� in� CDSSs� (20:1)� and� private� schools� (21:1).� It� seems� that� there� should� be� some�leeway�to�increase�the�STR�without�harming�student�learning�conditions.�
The�availability�of�books�has�a�positive,�statistically�significant�impact�on�MSCE�pass�rates.���
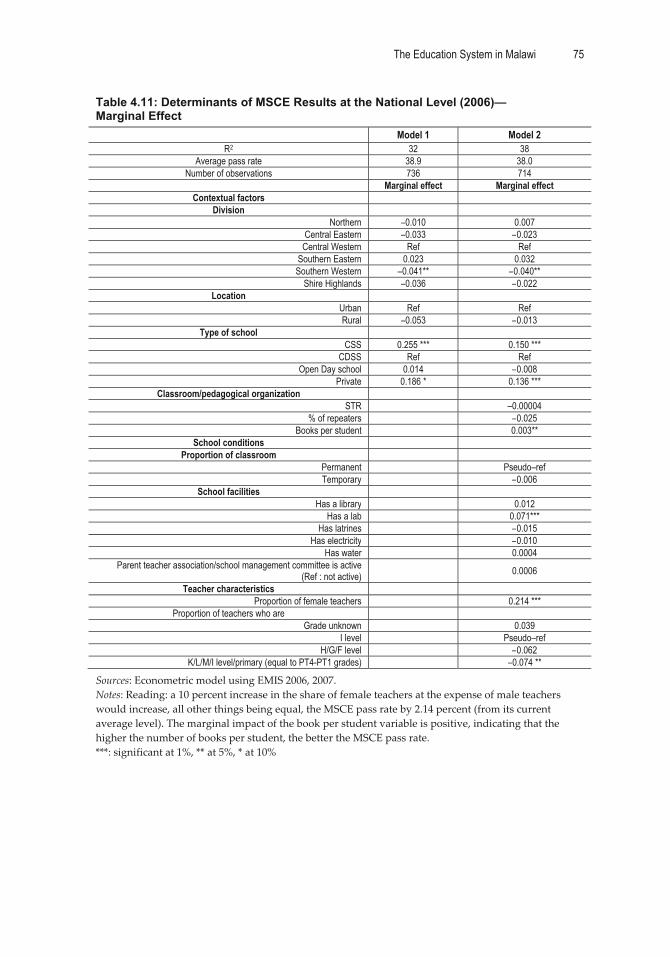
The Education System in Malawi 75
�
Table 4.11: Determinants of MSCE Results at the National Level (2006)— Marginal Effect
Model 1 Model 2 R2 32 38
Average pass rate 38.9 38.0 Number of observations 736 714
Marginal effect Marginal effect Contextual factors
Division Northern –0.010 0.007
Central Eastern –0.033 –0.023 Central Western Ref Ref
Southern Eastern 0.023 0.032 Southern Western –0.041** –0.040**
Shire Highlands –0.036 –0.022 Location
Urban Ref Ref Rural –0.053 –0.013
Type of school CSS 0.255 *** 0.150 ***
CDSS Ref Ref Open Day school 0.014 –0.008
Private 0.186 * 0.136 *** Classroom/pedagogical organization
STR –0.00004 % of repeaters –0.025
Books per student 0.003** School conditions
Proportion of classroom Permanent Pseudo–ref Temporary –0.006
School facilities Has a library 0.012
Has a lab 0.071*** Has latrines –0.015
Has electricity –0.010 Has water 0.0004
Parent teacher association/school management committee is active (Ref : not active) 0.0006
Teacher characteristics Proportion of female teachers 0.214 ***
Proportion of teachers who are Grade unknown 0.039
I level Pseudo–ref H/G/F level –0.062
K/L/M/I level/primary (equal to PT4-PT1 grades) –0.074 **
Sources:�Econometric�model�using�EMIS�2006,�2007.��Notes:�Reading:�a�10�percent�increase�in�the�share�of�female�teachers�at�the�expense�of�male�teachers�would�increase,�all�other�things�being�equal,�the�MSCE�pass�rate�by�2.14�percent�(from�its�current�average�level).�The�marginal�impact�of�the�book�per�student�variable�is�positive,�indicating�that�the�higher�the�number�of�books�per�student,�the�better�the�MSCE�pass�rate.��***:�significant�at�1%,�**�at�5%,�*�at�10%���
76 World Bank Working Paper
�
CONDITIONS�IN�SCHOOLS��Variables� related� to� school� facilities� have� a� limited� effect.� Whether� a� classroom� is�permanent� or� temporary� does� not� affect� MSCE� pass� rates� (it� is� not� statistically�significant).�Similarly,�the�fact�that�a�school�has�a�library,�latrines,�water,�or�electricity�does�not�help�bring�more�students�to�graduation.�Yet,�having�a�lab�tends�increase�the�level�of�the�MSCE�pass�rate�(a�marginal�effect�of�0.071).�However,�schools�that�possess�a�lab�are�usually�CSSs.�
TEACHER�CHARACTERISTICS�Female�teachers�tend�to�display�better�results�than�their�male�peers.�All�other�things�being� equal,� the�higher� the�proportion� of� female� teachers� in� a� school,� the�higher� the�MSCE� pass� rate.� Again,� it� is� important� not� to� assume� that� male� teachers� are� less�efficient,�because�many�other�unobservable�variables�are�not�taken�into�account,�such�as�the�students’�initial�level.��
PT4� to� PT1� grade� teachers� lead� to� poorer� performances� at� the� school� level�compared�to�Grade�I�teachers.�All�things�being�equal,�the�higher�their�proportion�the�lower� the� examination� pass� rate.� It� is� important� to� note� that� those� teachers� were�initially� intended� to� teach� in� primary� school,� and� may� be� lacking� the� necessary�competences� to� teach� in� secondary� schools.�And,� they�may�be�posted� in� schools� that�face�harsher�working�conditions.�The�great�majority�of�CDSSs�employ�these� teachers,�and�these�schools�are�known�to�be�less�well�endowed�with�quality�educational�inputs.�
A� third� model� was� run� with� the� grade� variable� replaced� by� the� academic�qualification�of�teachers.�Indeed,�the�strong�correlation�existing�between�the�variables�led�to�some�bias.�The�results�(not�shown)�indicate�that�MSCE�holders�are�performing�less�well�than�higher�education�graduates�in�education,�ceteris�paribus.�
Beyond� the� limits� pertaining� to� the� data� in� hand,� the� factors� that� have� been�analyzed�cover�most�school�costs�(for�example,�teacher�salaries,�pedagogical�materials).�That�these�factors�explain�just�a�minor�part�(from�20�to�40�percent)�of�school�differences�in�student�learning�outcomes,�tells�us�that�many�other�factors�are�at�stake.�Additional�in�depth�analyses�of�learning�outcomes�are�required�for�clear�policy�orientations.��
However,� these� results� highlight� the� need� to� question� aspects� of� education�management�by�looking�more�specifically�at:�i)�administrative�management�concerning�the� allocation� of� resources� (human,� material,� and� financial)� from� central� to�decentralized�and�to�school�levels;�and�ii)�pedagogical�management�that�deals�with�the�transformation,� at� school� level,� of� the� allocated� resources� into� student� learning�achievement.�These�two�aspects�are�reviewed�in�the�following�sections.��
Administration Management
This� section�briefly�presents� the� institutional�processes�pertaining� to�human�resource�allocation,�before�turning�to�a�description�of�teacher�characteristics�and�the�consistency�of�their�deployment�across�schools.�A�similar�analysis�will�then�be�undertaken�for�the�allocation�of�books�and�funds.�The�section�ends�with�an�overview�of�possible�economy�of�scale�(based�on�the�size�of�the�schools).��
The Education System in Malawi 77
�
Administrative Management Issues: Are Resources Being Allocated According to Needs?
Primary�Level�
Institutional�Aspects�of�Public�Teacher�Management:�Recruitment�and�Deployment�of�Teacher�
Teachers� in� Malawi� can� be� classified� into� four� categories:� civil� servants,� month�to�month� teachers,� temporary� teachers,� and� volunteers.� Recruitment� and� allocation�processes�depend�very�much�on�their�status.��
Civil�Servants�are�those�who�are� in�normal�service,�recruited�through�interviews�by� the� Teaching� Service� Commission� (TSC).� They� are� allocated� through� a� planned�deployment� system,�which� is� decentralized� to� local� education� authorities.�After� they�finish�training,�the�newly�qualified�teachers�are�allocated�to�primary�education�districts�by� the� Directorate� of� Basic� Education� in� liaison� with� the� Human� Resources� and�Management� division� of� the� Ministry� of� Education.� This� allocation� is� theoretically�based�on�district� needs� as� indicated�by� STRs� and� available�vacancies.�The�ministry’s�policy� is� to� post� a� teacher� where� a� vacancy� exists,� either� by� new� deployment� or�redeployment.�Yet,�teachers�can�request�a�posting�to�another�district�based�on�various�reasons,� some�of�which�are�“following�husband,”�“to�be�close� to�a�big�hospital,”�and�“attending�a�part�time�course,”�among�others.�Movements�of�teachers�from�one�district�to� another,� within� and� outside� the� division,� are� coordinated� at� the� division� level� in�consultation� with� the� Ministry� of� Education’s� headquarters.� No� newly� qualified�teachers� have� been� allocated� to� the� urban� education� districts� of� Blantyre,� Zomba,�Lilongwe,�and�Mzuzu�since�2007.�Teachers�have�to�sign�a�bond�that�ties�them�to�work�in�the�rural�areas�for�at�least�five�years.��
Month�to�month� teachers� are� former� civil� servants� who� have� retired� from�teaching� after� reaching� 55� years� (the� former� retirement� age28)� and� who� have� been�reengaged�on�a�contract�basis�to�fill�staffing�gaps�that�exist�in�rural�schools.�The�process�of� re�engagement� involves� a� declaration� of� vacancies� by� the� district,� through�which�possible�candidates�are�identified�based�on�their�records�of�service�and�a�health�report�from� a� reputable� hospital.� Ministry� of� Education� headquarters� thereafter� follow� the�reengagement�process�with�the�Department�of�Human�Resource�Development.�Month�to�month� contract� teachers� are� qualified� teachers,� but� cannot� be� promoted.� They� are�not�supposed�to�hold�positions�apart�from�teaching�and�are�sent�where�the�needs�are�highest,� especially� in� rural� areas.� They� are� reemployed� on� a� new� contract� after�certifying�that�they�are�physically�fit.��
Temporary� teachers� were� recruited� largely� to� meet� the� teacher� shortage� that�resulted� from� the� 1994� enrollment� boom� (which�was� a� consequence� of� Free� Primary�Education).�Most� of� these� teachers�were� recruited� untrained� in� 1994–1996,� and� have�been� trained� over� the� years� through� the� Malawi� Integrated� In�Service� Teacher�Education�Programme�(MIITEP).�Yet,�there�are�still�some�untrained�temporary�teachers�in�the�system.��
Volunteer� teachers� are� locally� recruited,� typically� hired� by� SMCs,� PTAs,� or�religious�agencies.�They�also�include�teachers�recruited�by�foreign�organizations,�such�as�the�Peace�Corps,�VSO,�and�the�Japanese�Volunteers.�Volunteer�teachers�are�meant�to�address�teacher�shortages�in�rural�schools�where�qualified�teachers�do�not�usually�stay.�These�teachers�are�not�recorded�in�the�payroll,�and�are�normally�local�people�educated�
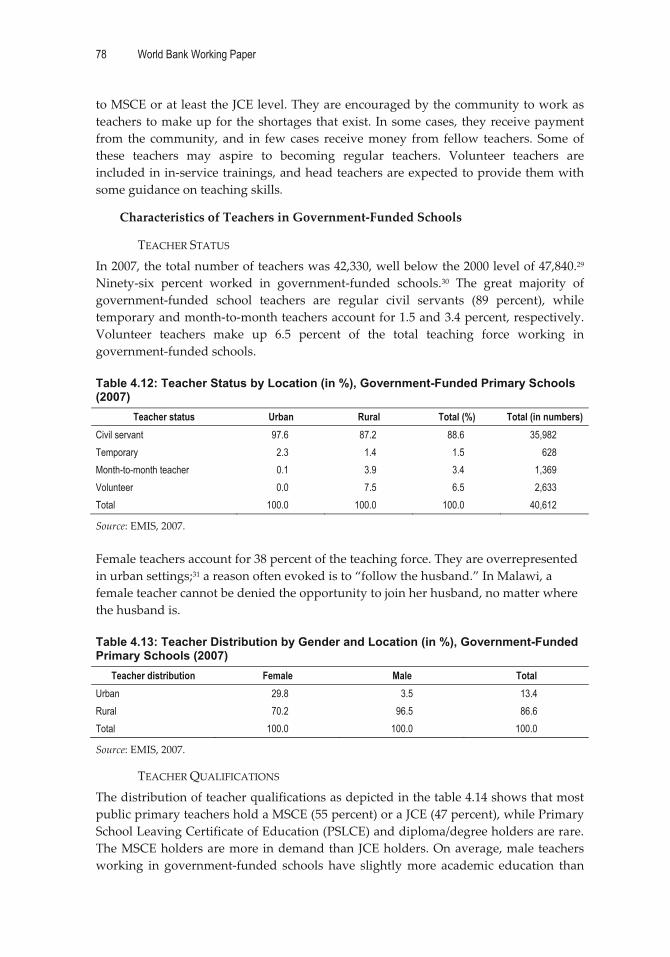
78 World Bank Working Paper
�
to�MSCE�or�at�least�the�JCE�level.�They�are�encouraged�by�the�community�to�work�as�teachers�to�make�up�for�the�shortages�that�exist.� In�some�cases,� they�receive�payment�from� the� community,� and� in� few�cases� receive�money� from� fellow� teachers.� Some�of�these� teachers� may� aspire� to� becoming� regular� teachers.� Volunteer� teachers� are�included�in�in�service�trainings,�and�head�teachers�are�expected�to�provide�them�with�some�guidance�on�teaching�skills.�
Characteristics�of�Teachers�in�Government�Funded�Schools�
TEACHER�STATUS�In�2007,�the�total�number�of�teachers�was�42,330,�well�below�the�2000�level�of�47,840.29�Ninety�six� percent� worked� in� government�funded� schools.30� The� great� majority� of�government�funded� school� teachers� are� regular� civil� servants� (89� percent),� while�temporary�and�month�to�month�teachers�account�for�1.5�and�3.4�percent,�respectively.�Volunteer� teachers� make� up� 6.5� percent� of� the� total� teaching� force� working� in�government�funded�schools.���Table 4.12: Teacher Status by Location (in %), Government-Funded Primary Schools (2007)
Teacher status Urban Rural Total (%) Total (in numbers) Civil servant 97.6 87.2 88.6 35,982 Temporary 2.3 1.4 1.5 628 Month-to-month teacher 0.1 3.9 3.4 1,369 Volunteer 0.0 7.5 6.5 2,633 Total 100.0 100.0 100.0 40,612
Source:�EMIS,�2007.��Female�teachers�account�for�38�percent�of�the�teaching�force.�They�are�overrepresented�in�urban�settings;31�a�reason�often�evoked�is�to�“follow�the�husband.”�In�Malawi,�a�female�teacher�cannot�be�denied�the�opportunity�to�join�her�husband,�no�matter�where�the�husband�is.���Table 4.13: Teacher Distribution by Gender and Location (in %), Government-Funded Primary Schools (2007)
Teacher distribution Female Male Total Urban 29.8 3.5 13.4 Rural 70.2 96.5 86.6 Total 100.0 100.0 100.0
Source:�EMIS,�2007.��
TEACHER�QUALIFICATIONS�The�distribution�of�teacher�qualifications�as�depicted�in�the�table�4.14�shows�that�most�public�primary�teachers�hold�a�MSCE�(55�percent)�or�a�JCE�(47�percent),�while�Primary�School�Leaving�Certificate�of�Education�(PSLCE)�and�diploma/degree�holders�are�rare.�The�MSCE�holders�are�more�in�demand�than�JCE�holders.�On�average,�male�teachers�working� in� government�funded� schools� have� slightly�more� academic� education� than�
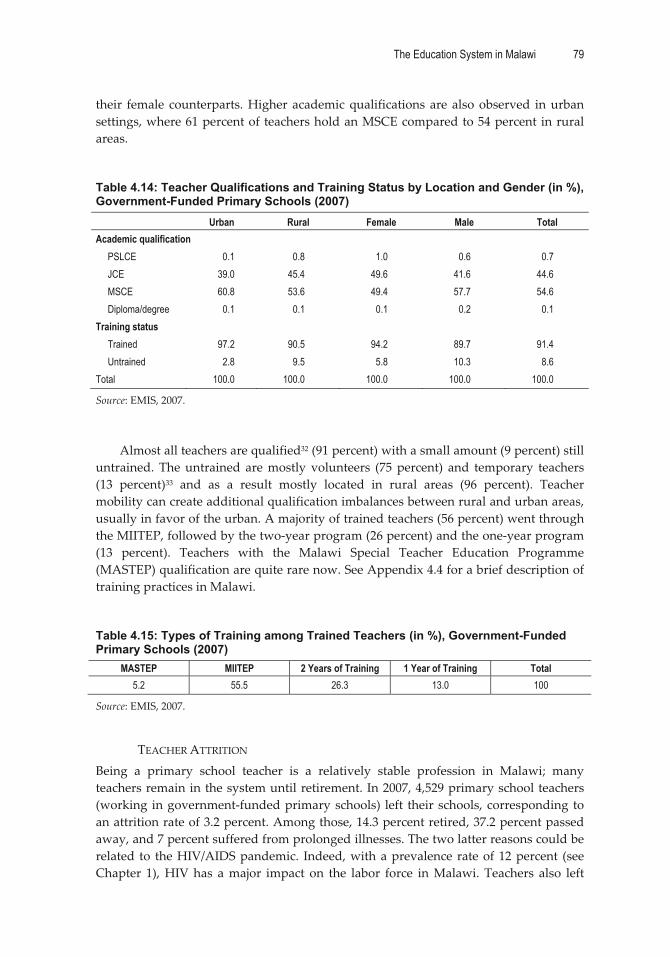
The Education System in Malawi 79
�
their� female� counterparts.�Higher� academic�qualifications� are� also�observed� in�urban�settings,�where�61�percent�of�teachers�hold�an�MSCE�compared�to�54�percent�in�rural�areas.����Table 4.14: Teacher Qualifications and Training Status by Location and Gender (in %), Government-Funded Primary Schools (2007)
Urban Rural Female Male Total Academic qualification
PSLCE 0.1 0.8 1.0 0.6 0.7 JCE 39.0 45.4 49.6 41.6 44.6 MSCE 60.8 53.6 49.4 57.7 54.6 Diploma/degree 0.1 0.1 0.1 0.2 0.1
Training status Trained 97.2 90.5 94.2 89.7 91.4 Untrained 2.8 9.5 5.8 10.3 8.6
Total 100.0 100.0 100.0 100.0 100.0
Source:�EMIS,�2007.���
Almost�all�teachers�are�qualified32�(91�percent)�with�a�small�amount�(9�percent)�still�untrained.� The�untrained� are�mostly� volunteers� (75�percent)� and� temporary� teachers�(13� percent)33� and� as� a� result� mostly� located� in� rural� areas� (96� percent).� Teacher�mobility�can�create�additional�qualification�imbalances�between�rural�and�urban�areas,�usually�in�favor�of�the�urban.�A�majority�of�trained�teachers�(56�percent)�went�through�the�MIITEP,�followed�by�the�two�year�program�(26�percent)�and�the�one�year�program�(13� percent).� Teachers� with� the� Malawi� Special� Teacher� Education� Programme�(MASTEP)�qualification�are�quite�rare�now.�See�Appendix�4.4�for�a�brief�description�of�training�practices�in�Malawi.����Table 4.15: Types of Training among Trained Teachers (in %), Government-Funded Primary Schools (2007)
MASTEP MIITEP 2 Years of Training 1 Year of Training Total 5.2 55.5 26.3 13.0 100
Source:�EMIS,�2007.��
TEACHER�ATTRITION�Being� a� primary� school� teacher� is� a� relatively� stable� profession� in� Malawi;� many�teachers�remain�in�the�system�until�retirement.�In�2007,�4,529�primary�school�teachers�(working� in�government�funded�primary�schools)� left� their�schools,� corresponding� to�an�attrition�rate�of�3.2�percent.�Among�those,�14.3�percent�retired,�37.2�percent�passed�away,�and�7�percent�suffered�from�prolonged�illnesses.�The�two�latter�reasons�could�be�related� to� the�HIV/AIDS�pandemic.� Indeed,�with�a�prevalence� rate�of�12�percent� (see�Chapter� 1),�HIV�has� a�major� impact� on� the� labor� force� in�Malawi.� Teachers� also� left�

80 World Bank Working Paper
�
because� they� were� dismissed� (10.7� percent),� often� for� misconduct� with� students,� or�because�they�preferred�office�work�(7�percent).�Nine�percent�of�teachers�resign.�This�is�quite�limited�if�one�considers�the�already�limited�level�of�attrition�in�public�schools.���Table 4.16: Reasons for Attrition among Government-Funded Primary Schools
Urban Rural Male Female Total Total attrition rate (%) 3.8 3.2 3.5 2.9 3.2 Causes (%)
Died 38.5 36.5 35.2 39.9 37.2 Dismissed 5.8 11.5 10.5 10.7 10.7 Prolonged illness 11.5 6.1 5.8 9.3 7.0 Resigned 8.2 8.6 9.2 7.1 8.5 Retired 10.1 14.9 17.6 7.3 14.3 Transferred to a non-teaching post 3.4 7.7 7.2 6.6 7.0 Reason not known/Other 22.6 14.8 14.5 19.1 16.3
Total 100.0 100.0 100.0 100.0 100.0
Source:�EMIS,�2007.��
Although� available� data� do� not� distinguish� between� teachers� who� are� qualified�and� those�who�are�not,� retaining� qualified� teachers� in� rural� schools� is� a�major,�well�known�issue.�This�is�linked�to�motivation�and�job�satisfaction.�The�Ministry,�with�DFID�support,�intends�to�introduce�a�Special�Allowance�for�teachers�who�work�in�rural�areas�as� an� incentive� to� keep� them� in� school.� The� scheme� is� still� under� discussion� as� the�Ministry�looks�for�ways�to�sustain�it�in�the�future�without�donor�support.��
STR�AVERAGE�Malawi’s�STR�has�deteriorated�over�the�past�decade,�rising�from�63:1�in�2000�to�86:1�in�2007� (or� 80:1� if� volunteer� teachers� are� included).� This� comes� from� a� conjunction� of�parallel� phenomena:� the� increase� in� student� enrollment� and� student� retention� and� a�reduction�in�the�number�of�teachers.��Table 4.17: STR by Location in All Government-Funded Schools (1999 and 2007)
1999 2007 2007 Without Volunteers With Volunteers
Students per teacher 63 86 80 Students per qualified teacher 118 91 88
Sources:�EMIS�1999�(CSR,�2004),�EMIS�2007.��As�indicated�by�figure�4.4,�Malawi�has�the�highest�STR�amongst�the�SADC�countries,�and�is�well�above�the�SADC�average�STR�of�40:1.���
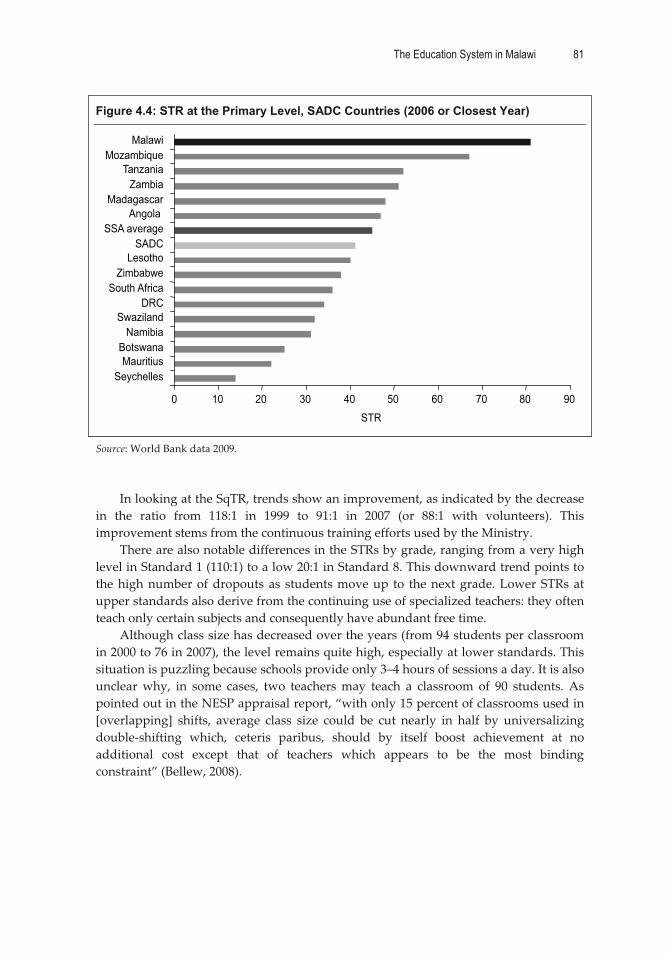
The Education System in Malawi 81
�
Figure 4.4: STR at the Primary Level, SADC Countries (2006 or Closest Year)
0 10 20 30 40 50 60 70 80 90
SeychellesMauritius
BotswanaNamibia
SwazilandDRC
South AfricaZimbabwe
LesothoSADC
SSA averageAngola
MadagascarZambia
TanzaniaMozambique
Malawi
STR �
Source:�World�Bank�data�2009.���
In�looking�at�the�SqTR,�trends�show�an�improvement,�as�indicated�by�the�decrease�in� the� ratio� from� 118:1� in� 1999� to� 91:1� in� 2007� (or� 88:1� with� volunteers).� This�improvement�stems�from�the�continuous�training�efforts�used�by�the�Ministry.��
There�are�also�notable�differences�in�the�STRs�by�grade,�ranging�from�a�very�high�level�in�Standard�1�(110:1)�to�a�low�20:1�in�Standard�8.�This�downward�trend�points�to�the�high�number�of�dropouts�as� students�move�up� to� the�next�grade.�Lower�STRs�at�upper�standards�also�derive�from�the�continuing�use�of�specialized�teachers:�they�often�teach�only�certain�subjects�and�consequently�have�abundant�free�time.��
Although�class�size�has�decreased�over�the�years�(from�94�students�per�classroom�in�2000�to�76�in�2007),�the�level�remains�quite�high,�especially�at�lower�standards.�This�situation�is�puzzling�because�schools�provide�only�3–4�hours�of�sessions�a�day.�It�is�also�unclear�why,� in� some� cases,� two� teachers�may� teach� a� classroom� of� 90� students.�As�pointed�out�in�the�NESP�appraisal�report,�“with�only�15�percent�of�classrooms�used�in�[overlapping]� shifts,� average� class� size� could� be� cut� nearly� in� half� by� universalizing�double�shifting� which,� ceteris� paribus,� should� by� itself� boost� achievement� at� no�additional� cost� except� that� of� teachers� which� appears� to� be� the� most� binding�constraint”�(Bellew,�2008).���

82 World Bank Working Paper
�
Table 4.18: STRs and Class Size, Standards 1–8, in Government-Funded Public Schools (2000 and 2007)
Std 1 Std 2 Std 3 Std 4 Std 5 Std 6 Std 7 Std 8 STR 2000 100 76 64 52 45 39 33 28 2007 110 88 70 55 48 38 30 20 Class size 2007 121 97 92 73 66 55 48 43
Sources:�EMIS�2000�(CSR�2004),�EMIS�2007�(2007�includes�volunteer�teachers).���
Space� availability�may�be� at� stake,� as� reflected�by� the�high�proportion�of� classes�still� held� under� trees� (17� percent).� This,� along� the� high� STRs,� illustrates� difficulties�faced�by�the�education�system�to�meet�its�infrastructure�and�teacher�needs.��
Consistency�in�Teacher�Allocation:�How�Well�Are�Teachers�Being�Allocated�to�Schools?�
A� more� empirical� analysis� of� teacher� deployment� can� be� made� by� quantitatively�assessing�its�consistency.�This�analysis�deals�with�equity�in�schooling�conditions�across�schools�because�the�allocation�of�teachers�according�to�the�number�of�students�at�school�level�is�the�way�to�ensure�equity�in�terms�of�STRs.��
QUANTITATIVE�ANALYSIS�The�analysis�examines�the�relation�between�the�number�of�students�enrolled�in�a�school�and�the�number�of�teachers�deployed�to�that�same�school.�Theoretically,�it�is�expected�that� the�number�of� teachers�allocated� to�a� school� is�proportional�with� the�number�of�students�in�that�school.�A�consistent�deployment�of�teachers�would�imply�that�schools�of�the�same�size�have�the�same�number�of�teachers.��
The� relationship� between� the� number� of� students� and� the� number� of� teachers�(government�paid�only)�in�all�Malawi�public�school�is�plotted�in�figure�4.5.�It�shows�a�global� positive� relationship� between� the� two� variables,� but� wide� variations� can� be�observed�across�schools.�For�instance,�schools�with�200�students�can�have�from�3�to�10�teachers.�These�features�entail�great�STR�variations,�and�by�extension,�huge�disparities�in�schooling�conditions�across�schools.��
The� statistical� analysis� offers� a� global� measure� of� the� consistency� of� teacher�allocation.�This�measure� refers� to� the�R2,�known�as� the� coefficient�of�determination,34�which�is�calculated�on�all�schools�throughout�the�country.�It�allows�for�an�assessment�of�the�extent�to�which�the�number�of�teachers�is�proportional�to�the�number�of�students�enrolled.�In�Malawi,�the�R2�equals�58�percent.35�This�means�that�58�percent�of�the�observed�variations�in�teacher�numbers�are�explained�by�differences�in�the�numbers�of�students.��
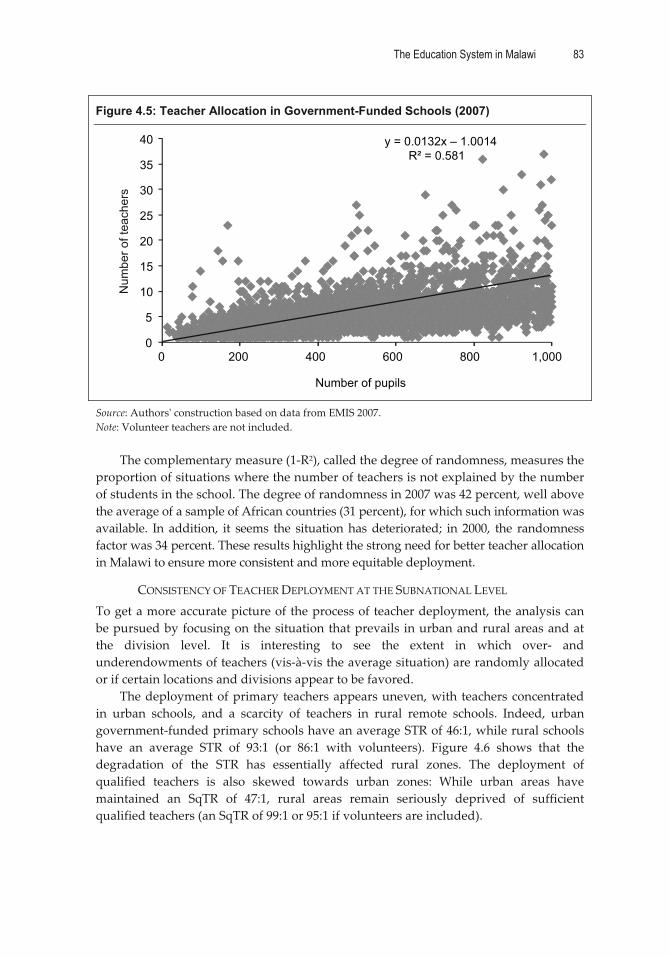
The Education System in Malawi 83
�
Figure 4.5: Teacher Allocation in Government-Funded Schools (2007) N
umbe
r of t
each
ers
y = 0.0132x – 1.0014R² = 0.581
0
5
10
15
20
25
30
35
40
0 200 400 600 800 1,000
Number of pupils �
Source:�Authors��construction�based�on�data�from�EMIS�2007.��Note:�Volunteer�teachers�are�not�included.���
The�complementary�measure�(1�R2),�called�the�degree�of�randomness,�measures�the�proportion�of�situations�where�the�number�of�teachers�is�not�explained�by�the�number�of�students�in�the�school.�The�degree�of�randomness�in�2007�was�42�percent,�well�above�the�average�of�a�sample�of�African�countries�(31�percent),�for�which�such�information�was�available.� In� addition,� it� seems� the� situation�has�deteriorated;� in� 2000,� the� randomness�factor�was�34�percent.�These�results�highlight�the�strong�need�for�better�teacher�allocation�in�Malawi�to�ensure�more�consistent�and�more�equitable�deployment.��
CONSISTENCY�OF�TEACHER�DEPLOYMENT�AT�THE�SUBNATIONAL�LEVEL�To�get�a�more�accurate�picture�of�the�process�of�teacher�deployment,�the�analysis�can�be�pursued�by�focusing�on�the�situation�that�prevails� in�urban�and�rural�areas�and�at�the� division� level.� It� is� interesting� to� see� the� extent� in� which� over�� and�underendowments�of�teachers�(vis�à�vis�the�average�situation)�are�randomly�allocated�or�if�certain�locations�and�divisions�appear�to�be�favored.��
The�deployment�of�primary�teachers�appears�uneven,�with� teachers�concentrated�in� urban� schools,� and� a� scarcity� of� teachers� in� rural� remote� schools.� Indeed,� urban�government�funded�primary�schools�have�an�average�STR�of�46:1,�while�rural�schools�have� an� average� STR� of� 93:1� (or� 86:1� with� volunteers).� Figure� 4.6� shows� that� the�degradation� of� the� STR� has� essentially� affected� rural� zones.� The� deployment� of�qualified� teachers� is� also� skewed� towards� urban� zones:� While� urban� areas� have�maintained� an� SqTR� of� 47:1,� rural� areas� remain� seriously� deprived� of� sufficient�qualified�teachers�(an�SqTR�of�99:1�or�95:1�if�volunteers�are�included).���

84 World Bank Working Paper
�
Figure 4.6: STRs by Location (1999 and 2007)
�Sources:�EMIS�2007,�CSR�2004.��
Teacher� allocation� across� divisions� is� also� quite� uneven,� marked� by� wide�disparities�in�STRs—from�75:1�in�the�Northern�division�to�105:1�in�the�Shire�Highlands.�Including� volunteer� teachers� further� widens� the� gap� between� divisions� (from� 66� to�104),�without�however�affecting�the�ranking�of�divisions�according�to�the�level�of�their�STR.36�Over�the�years,�the�dispersion�across�divisions�has�increased�(from�12�in�1999�to�27� in� 2007),� at� the� expense� of� certain� divisions,� such� as� Shire� Highlands� and� South�Eastern,�which�have�seen� their�STRs�burst� to�105:1�and�104:1,� respectively.�While� the�Southern�Eastern�division�relied�on�volunteers�to�make�up�for�the�shortage�of�teachers,�the�Shire�Highlands�did�not.�As�a�result,�the�Shire�Highlands�has�the�highest�STR.���
Figure 4.7: STR in Government-Funded Primary Schools, by Division (2000 and 2007)
0102030405060708090
100110
Central East Central West
Northern Shire Highlands
South Eastern
South Western
Total
STR 2000
STR 2007 (w/o volunteers)
STR 2007 (with volunteers)
�
Source:�EMIS�2007.���
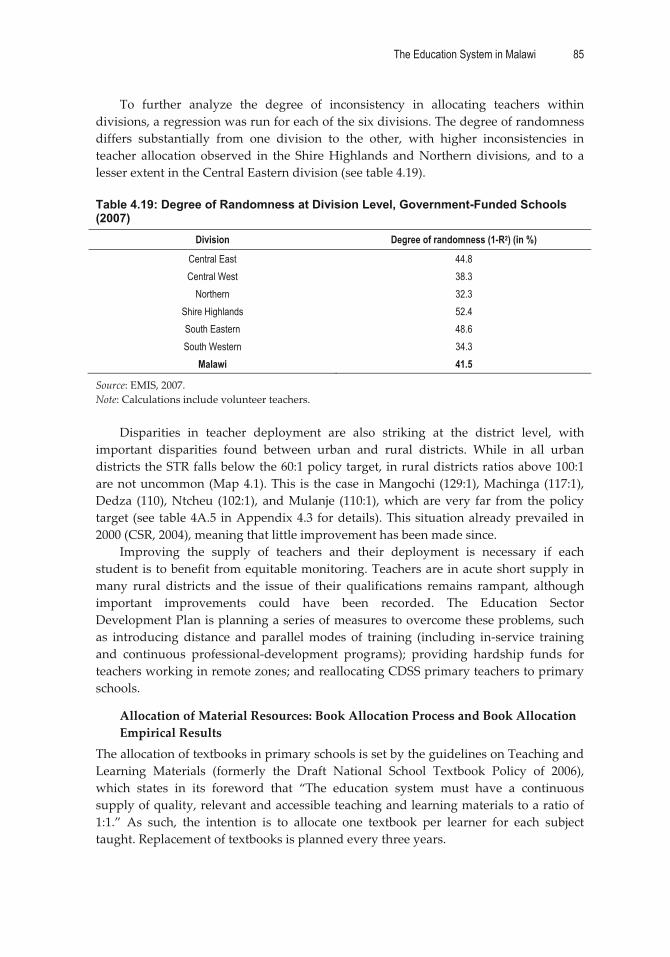
The Education System in Malawi 85
�
To� further� analyze� the� degree� of� inconsistency� in� allocating� teachers� within�divisions,�a�regression�was�run�for�each�of�the�six�divisions.�The�degree�of�randomness�differs� substantially� from� one� division� to� the� other,� with� higher� inconsistencies� in�teacher� allocation� observed� in� the� Shire�Highlands� and�Northern�divisions,� and� to� a�lesser�extent�in�the�Central�Eastern�division�(see�table�4.19).���Table 4.19: Degree of Randomness at Division Level, Government-Funded Schools (2007)
Division Degree of randomness (1-R2) (in %)
Central East 44.8 Central West 38.3
Northern 32.3 Shire Highlands 52.4 South Eastern 48.6 South Western 34.3
Malawi 41.5
Source:�EMIS,�2007.�Note:�Calculations�include�volunteer�teachers.��
Disparities� in� teacher� deployment� are� also� striking� at� the� district� level,� with�important� disparities� found� between� urban� and� rural� districts.� While� in� all� urban�districts�the�STR�falls�below�the�60:1�policy�target,�in�rural�districts�ratios�above�100:1�are�not�uncommon�(Map�4.1).�This� is� the�case� in�Mangochi� (129:1),�Machinga�(117:1),�Dedza� (110),�Ntcheu� (102:1),� and�Mulanje� (110:1),�which�are�very� far� from� the�policy�target� (see� table�4A.5� in�Appendix�4.3� for�details).�This�situation�already�prevailed� in�2000�(CSR,�2004),�meaning�that�little�improvement�has�been�made�since.��
Improving� the� supply� of� teachers� and� their� deployment� is� necessary� if� each�student�is�to�benefit�from�equitable�monitoring.�Teachers�are�in�acute�short�supply�in�many� rural� districts� and� the� issue� of� their� qualifications� remains� rampant,� although�important� improvements� could� have� been� recorded.� The� Education� Sector�Development�Plan�is�planning�a�series�of�measures�to�overcome�these�problems,�such�as� introducing� distance� and� parallel�modes� of� training� (including� in�service� training�and� continuous� professional�development� programs);� providing� hardship� funds� for�teachers�working�in�remote�zones;�and�reallocating�CDSS�primary�teachers�to�primary�schools.��
Allocation�of�Material�Resources:�Book�Allocation�Process�and�Book�Allocation�Empirical�Results�
The�allocation�of�textbooks�in�primary�schools�is�set�by�the�guidelines�on�Teaching�and�Learning� Materials� (formerly� the� Draft� National� School� Textbook� Policy� of� 2006),�which� states� in� its� foreword� that� “The� education� system� must� have� a� continuous�supply�of�quality,�relevant�and�accessible�teaching�and�learning�materials�to�a�ratio�of�1:1.”� As� such,� the� intention� is� to� allocate� one� textbook� per� learner� for� each� subject�taught.�Replacement�of�textbooks�is�planned�every�three�years.���

86 World Bank Working Paper
�
Map 4.1a: STR at the District Level Map 4.1b: SqTR at the District Level
Dedza
Dowa
Kasungu
Mchinji
Nkhotakota
Ntchisi
Salima
ChitipaKaronga
MzimbaNkhata
Bay
Rumphi
ChikwawaThyolo
Nsanje
MulanjeChiradzulu
Phalombe
Mangochi
Ntcheu
Likoma
BalakaMachinga
Lake
Malawi
< 60:1
Between 60:1 and 80:1
Between 80:1 and 100:1
> 100:1
Lil R.
East
ZombaMwanza
Blantyre
Mzuzu
Lil R.
West
Neno
Lilongwe City
Dedza
Dowa
Kasungu
Mchinji
Nkhotakota
Ntchisi
Salima
ChitipaKaronga
MzimbaNkhata
Bay
Rumphi
ChikwawaThyolo
Nsanje
MulanjeChiradzulu
Phalombe
Mangochi
Ntcheu
Likoma
BalakaMachinga
Lake
Malawi
< 60:1
Between 60:1 and 80:1
Between 80:1 and 100:1
> 100:1
Lil R.
East
ZombaMwanzaBlantyre
Mzuzu
Lil R.
West
Neno
Lilongwe City
�Source:�EMIS�2007.��
Textbooks� are� distributed� free� of� cost� to� all� public� schools.� There� is� no� official�policy�on�the�distribution�of�textbooks�to�private�schools,�which�represent�a�little�over�four�percent�of�primary�schools�in�Malawi.�The�current�practice�is�for�private�schools�to�take� textbooks� from� public� schools.� This� results� in� a� negative� skewing� of� the� public�distribution� figures.� There� are,� however,� plans� underway� to� supply� textbooks� to�private� schools� based�on� a� cost�recovery�mechanism.�Reliance�on�donors� is� a� critical�problem� for� the� distribution� of� textbooks� to� schools.� There� is� a� severe� lack� of�government� funds� for� textbooks,�especially�at� the�secondary� level�where� local� school�initiatives�such�as�the�Textbook�Revolving�Fund�represent�the�main�source�of�funds�for�textbooks.��
The�process�of�delivering� textbooks� to�primary� schools� is� chain�like� in� structure.�Firstly,�procurement�requirements�are�calculated�and�compiled�by�the�Basic�Education�Department� at� the� Ministry� of� Education� headquarters.� A� distribution� plan� is�formulated� for� each� school.� Then,� the� procurement� requirements� and� distribution�plans� are� submitted� to� a� procurement� agency� that� handles� bids� and� the� final�identification� of� supplier(s).� Suppliers� are� mostly� located� outside� of� Malawi� due� to�capacity� constraints� in� the� country’s� printing� industry.� Once� the� books� are� printed,�they� are� sent� to� regional� warehouses� from� which� private� distributors� deliver� them�directly�to�schools.�The�district�education�managers�facilitate�the�process�of�distribution�and�the�supplies�unit�is�tasked�with�the�responsibility�of�monitoring�the�process.�

The Education System in Malawi 87
�
There� are� formidable� challenges� associated�with� the� distribution� of� textbooks� to�and�within�schools.�Firstly,�the�remote�location�and�poor�accessibility�to�some�schools�hinders� the�effective�delivery�of�books.�This� is� exacerbated�by� the� targeted� timing�of�delivery,�which�coincides�with�the�wet�season�in�Malawi.�Further,�noninvolvement�on�the�part�of�district�education�managers�at�times�negatively�affects�the�distribution.�At�the�school�itself,�there�are�further�problems�with�distribution�and�utilization�of�books.�Although�the�school�may�have�received�the�requisite�number�of�books�to�achieve�the�desired�1:1�student�textbook�ratio,�the�target�is�not�met�for�a�number�of�other�reasons.�For� example,� teachers� may� be� reluctant� to� let� children� use� the� books� because� of�possible� future� absenteeism,�dropping�out,� and� lack�of� care� for� the� books.�Also,� it� is�reported�that�some�head�teachers�hoard� textbooks� to�offset� the�possibility�of�a� future�shortage.�
Finally,�textbooks�in�primary�schools�have�been�undergoing�a�major�overhaul�with�the�introduction�of�the�Primary�Curriculum�and�Assessment�Reform�(PCAR).�Primary�school� textbooks�are�being� replaced� to� reflect� the�upgraded�curriculum.�This�process�began� in� 2006/07� with� half� of� the� new� Standard� 1� textbooks� and� was� continued� in�2007/08�with�the�remaining�half�of�Standard�1�books,�along�with�those�for�standards�2,�5,� and� 6.� The� target� for� 2008/09� is� replacement� of� standards� 3� and� 7.� These�developments�represent�a�significant�change�in�the�system�that�is�current�and�ongoing�and�may�not�be�reflected�in�the�existing�data.��
EMPIRICAL�RESULTS�The�allocation�of�English,�Chichewa,�and�Mathematics�books�tends�to�follow�the�same�pattern:�On�average,�there�are�0.5�books�per�student,�with�upper�standards�being�better�endowed�than�lower�ones�(table�4.20).�Yet,�almost�a�third�of�students�in�Standard�8�do�not�have�a�book,�most�share�books�in�groups�of�two�or�three.���Table 4.20: Book Allocation by Standards in Government-Aided Schools (2007)
Std1 Std2 Std3 Std4 Std5 Std6 Std7 Std8 Chichewa
Books / students 0.05 0.5 0.4 0.4 0.4 0.5 0.6 0.7 Student-book ratio 18.3:1 2.1:1 2.6:1 2.4:1 2.2:1 1.9:1 1.7:1 1.5:1 % students without book 94 52 62 58 54 49 43 32 % of schools with less than 1 book for 2 students 95 45 39 46 52 61 68 75
English Books / students 0.06 0.5 0.4 0.4 0.5 0.5 0.6 0.7 Student-book ratio 17.4:1 1.9:1 2.4:1 2.3:1 2.2:1 1.9:1 1.6:1 1.4:1 % students without book 94 46 58 56 54 46 37 28 % of schools with less than 1 book for 2 students 95 51 41 47 51 59 68 74
Mathematics Books / students 0.06 0.6 0.5 0.5 0.5 0.6 0.7 0.7 Student-book ratio 17.2:1 1.6:1 2:1. 2.1:1 2:1 1.7:1 1.5:1 1.4:1 % students without book 94 30 51 52 49 40 34 29 % of schools with less than 1 book for 2 students 95 58 47 49 55 65 70 75
Source:�EMIS�2007.�
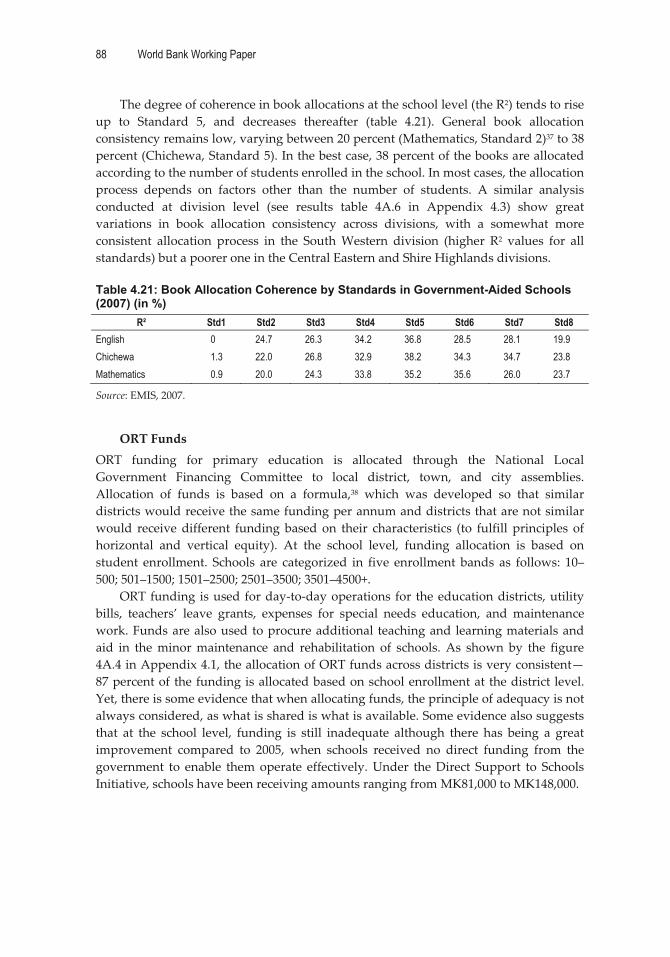
88 World Bank Working Paper
�
The�degree�of�coherence�in�book�allocations�at�the�school�level�(the�R2)�tends�to�rise�up� to� Standard� 5,� and� decreases� thereafter� (table� 4.21).� General� book� allocation�consistency�remains�low,�varying�between�20�percent�(Mathematics,�Standard�2)37�to�38�percent�(Chichewa,�Standard�5).�In�the�best�case,�38�percent�of�the�books�are�allocated�according�to�the�number�of�students�enrolled�in�the�school.�In�most�cases,�the�allocation�process� depends� on� factors� other� than� the� number� of� students.� A� similar� analysis�conducted� at� division� level� (see� results� table� 4A.6� in� Appendix� 4.3)� show� great�variations� in� book� allocation� consistency� across� divisions,� with� a� somewhat� more�consistent� allocation� process� in� the� South�Western� division� (higher� R2� values� for� all�standards)�but�a�poorer�one�in�the�Central�Eastern�and�Shire�Highlands�divisions.��Table 4.21: Book Allocation Coherence by Standards in Government-Aided Schools (2007) (in %)
R² Std1 Std2 Std3 Std4 Std5 Std6 Std7 Std8 English 0 24.7 26.3 34.2 36.8 28.5 28.1 19.9 Chichewa 1.3 22.0 26.8 32.9 38.2 34.3 34.7 23.8 Mathematics 0.9 20.0 24.3 33.8 35.2 35.6 26.0 23.7
Source:�EMIS,�2007.��
ORT�Funds�ORT� funding� for� primary� education� is� allocated� through� the� National� Local�Government� Financing� Committee� to� local� district,� town,� and� city� assemblies.�Allocation� of� funds� is� based� on� a� formula,38� which� was� developed� so� that� similar�districts�would�receive�the�same�funding�per�annum�and�districts�that�are�not�similar�would� receive�different� funding� based� on� their� characteristics� (to� fulfill� principles� of�horizontal� and� vertical� equity).� At� the� school� level,� funding� allocation� is� based� on�student� enrollment.� Schools� are� categorized� in� five� enrollment� bands� as� follows:� 10–500;�501–1500;�1501–2500;�2501–3500;�3501–4500+.��
ORT�funding� is�used� for�day�to�day�operations� for� the�education�districts,�utility�bills,� teachers’� leave� grants,� expenses� for� special� needs� education,� and� maintenance�work.�Funds�are�also�used� to�procure�additional� teaching�and�learning�materials�and�aid� in� the�minor�maintenance� and� rehabilitation� of� schools.� As� shown� by� the� figure�4A.4�in�Appendix�4.1,�the�allocation�of�ORT�funds�across�districts�is�very�consistent—87�percent�of� the�funding�is�allocated�based�on�school�enrollment�at�the�district� level.�Yet,�there�is�some�evidence�that�when�allocating�funds,�the�principle�of�adequacy�is�not�always�considered,�as�what�is�shared�is�what�is�available.�Some�evidence�also�suggests�that� at� the� school� level,� funding� is� still� inadequate� although� there� has� being� a� great�improvement� compared� to� 2005,� when� schools� received� no� direct� funding� from� the�government� to� enable� them�operate� effectively.�Under� the�Direct� Support� to� Schools�Initiative,�schools�have�been�receiving�amounts�ranging�from�MK81,000�to�MK148,000.�
The Education System in Malawi 89
�
Secondary�Level�Secondary� schools� in�Malawi� can� be� put� in� the� following� categories:� CSSs,39� CDSSs,�ODSSs,� and� private� secondary� schools.� CDSSs� currently� account� for� the�majority� of�schools�(55�percent)�and�enroll�almost�half�of�the�students�(47�percent).�The�remaining�students� are� in� CSSs� (26.5� percent)� and� private� schools� (22.8� percent).� A� small�proportion�of�students�attend�ODSSs�(3.3�percent).40��
Institutional�Aspects�of�Teacher�Management:�Recruitment�and�Deployment�Patterns�
Teacher�recruitment�is�done�through�two�routes:�when�students�graduate�from�colleges�and� universities� and� from� direct� application� to� the� Ministry� of� Education.� Once�diploma� and� degree� holder� results� are� out,� deans� of� education� send� names� of�successful� students� to� the� Ministry� of� Education.� The� secondary� school� directorate�allocates� them� to� divisions,� which� in� turn� deploy� them� to� secondary� schools� as� per�demand�according�to�subject�combinations�within�the�division.�Non�education�degree�and�diploma�students�apply�directly�to�the�ministry�for�teaching�posts.�The�secondary�and�human�resource�departments�scrutinize�the�applicant’s�qualifications�to�check�his�or� her� suitability� to� teach.� The� human� resource� department� then� formalizes� the�recruitment�process.��
Main�Teacher�Characteristics�There�are�10,258�secondary�school�teachers�in�Malawi,�of�which�8,02641�are�working�in�government�funded� schools.� Among� public� secondary� schools,� the� CDSSs� have� the�highest� number� of� teachers� (60� percent),� followed� by� the� CSSs� (33� percent)� and� the�ODSSs�(7�percent).�Female�teachers�are�one�fifth�of�the�public�teaching�force.�They�tend�to�be�concentrated� in�urban�and�other�semi�urban�centers�because� they�often�“follow�their� husbands”� (that� is� transfer� from� one� school� to� another� is� determined� by� the�husband’s�duty�station.)�
TEACHER�QUALIFICATIONS�Underqualified�teachers�(60�percent)�in�secondary�schools�still�remain�a�big�challenge.�Most�of�these�teachers�work�in�CDSSs,�which�have�an�unqualified�teaching�force�of�81�percent,�compared�to�27�percent�in�CSSs.�Formerly,�teachers�who�were�trained�to�teach�primary�were�also�sent�to�secondary�schools,�especially�CSSs,�following�the�expansion�of�the�secondary�school�subsector.��
These� teachers� (for� example,� PT1–PT4� teachers)� make� up� the� majority� of� the�teaching� force� in� CDSSs.� Not� surprisingly,� CDSS� teachers� have� lower� academic�qualifications�than�their�peers�in�CSSs�(see�table�4.22).���
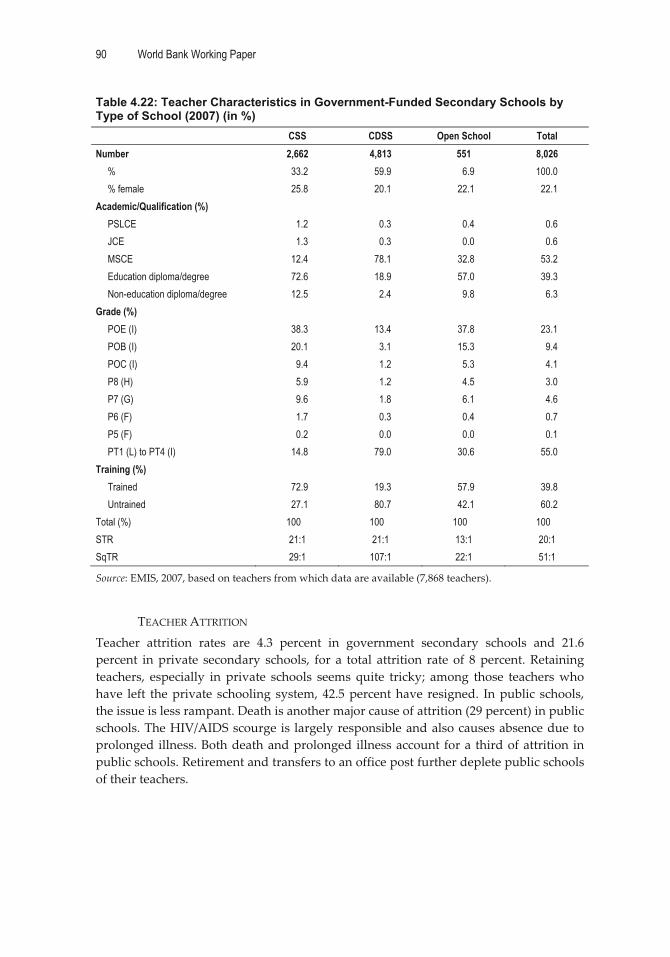
90 World Bank Working Paper
�
Table 4.22: Teacher Characteristics in Government-Funded Secondary Schools by Type of School (2007) (in %)
CSS CDSS Open School Total Number 2,662 4,813 551 8,026
% 33.2 59.9 6.9 100.0 % female 25.8 20.1 22.1 22.1
Academic/Qualification (%) PSLCE 1.2 0.3 0.4 0.6 JCE 1.3 0.3 0.0 0.6 MSCE 12.4 78.1 32.8 53.2 Education diploma/degree 72.6 18.9 57.0 39.3 Non-education diploma/degree 12.5 2.4 9.8 6.3
Grade (%) POE (I) 38.3 13.4 37.8 23.1 POB (I) 20.1 3.1 15.3 9.4 POC (I) 9.4 1.2 5.3 4.1 P8 (H) 5.9 1.2 4.5 3.0 P7 (G) 9.6 1.8 6.1 4.6 P6 (F) 1.7 0.3 0.4 0.7 P5 (F) 0.2 0.0 0.0 0.1 PT1 (L) to PT4 (I) 14.8 79.0 30.6 55.0
Training (%) Trained 72.9 19.3 57.9 39.8 Untrained 27.1 80.7 42.1 60.2
Total (%) 100 100 100 100 STR 21:1 21:1 13:1 20:1 SqTR 29:1 107:1 22:1 51:1
Source:�EMIS,�2007,�based�on�teachers�from�which�data�are�available�(7,868�teachers).��
TEACHER�ATTRITION�Teacher� attrition� rates� are� 4.3� percent� in� government� secondary� schools� and� 21.6�percent� in�private� secondary� schools,� for� a� total� attrition� rate� of� 8� percent.�Retaining�teachers,� especially� in� private� schools� seems� quite� tricky;� among� those� teachers�who�have� left� the�private� schooling� system,�42.5�percent�have� resigned.� In�public� schools,�the�issue�is�less�rampant.�Death�is�another�major�cause�of�attrition�(29�percent)�in�public�schools.�The�HIV/AIDS�scourge�is� largely�responsible�and�also�causes�absence�due�to�prolonged�illness.�Both�death�and�prolonged� illness�account� for�a� third�of�attrition� in�public�schools.�Retirement�and�transfers�to�an�office�post�further�deplete�public�schools�of�their�teachers.��
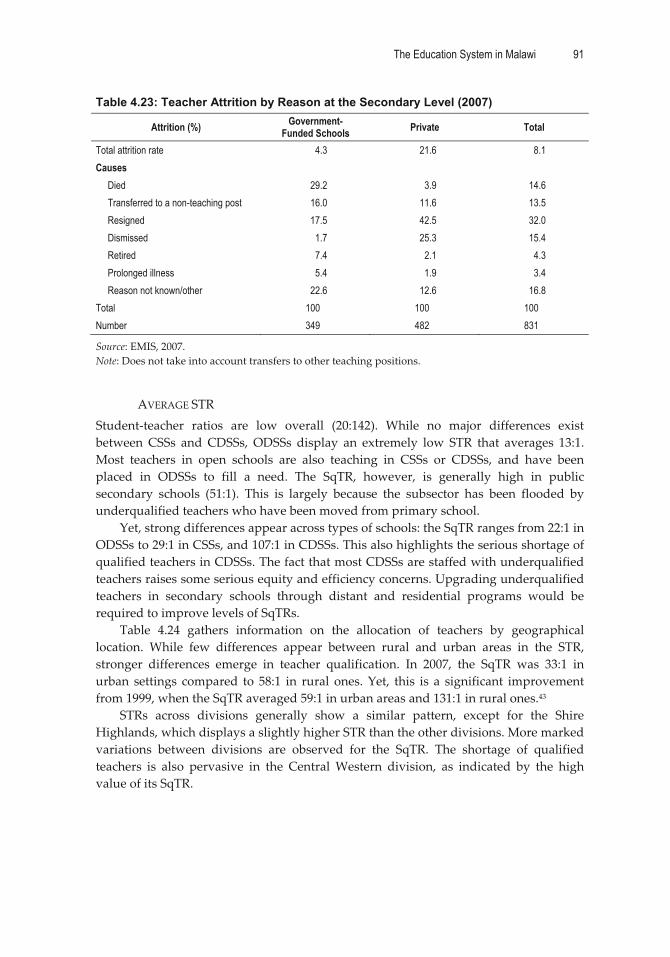
The Education System in Malawi 91
�
Table 4.23: Teacher Attrition by Reason at the Secondary Level (2007)
Attrition (%) Government- Funded Schools Private Total
Total attrition rate 4.3 21.6 8.1 Causes
Died 29.2 3.9 14.6 Transferred to a non-teaching post 16.0 11.6 13.5 Resigned 17.5 42.5 32.0 Dismissed 1.7 25.3 15.4 Retired 7.4 2.1 4.3 Prolonged illness 5.4 1.9 3.4 Reason not known/other 22.6 12.6 16.8
Total 100 100 100 Number 349 482 831
Source:�EMIS,�2007.��Note:�Does�not�take�into�account�transfers�to�other�teaching�positions.���
AVERAGE�STR�Student�teacher� ratios� are� low� overall� (20:142).� While� no� major� differences� exist�between�CSSs� and�CDSSs,� ODSSs� display� an� extremely� low� STR� that� averages� 13:1.�Most� teachers� in� open� schools� are� also� teaching� in� CSSs� or� CDSSs,� and� have� been�placed� in� ODSSs� to� fill� a� need.� The� SqTR,� however,� is� generally� high� in� public�secondary� schools� (51:1).� This� is� largely� because� the� subsector� has� been� flooded� by�underqualified�teachers�who�have�been�moved�from�primary�school.��
Yet,�strong�differences�appear�across�types�of�schools:�the�SqTR�ranges�from�22:1�in�ODSSs�to�29:1�in�CSSs,�and�107:1�in�CDSSs.�This�also�highlights�the�serious�shortage�of�qualified�teachers�in�CDSSs.�The�fact�that�most�CDSSs�are�staffed�with�underqualified�teachers�raises�some�serious�equity�and�efficiency�concerns.�Upgrading�underqualified�teachers� in� secondary� schools� through� distant� and� residential� programs� would� be�required�to�improve�levels�of�SqTRs.��
Table� 4.24� gathers� information� on� the� allocation� of� teachers� by� geographical�location.� While� few� differences� appear� between� rural� and� urban� areas� in� the� STR,�stronger� differences� emerge� in� teacher� qualification.� In� 2007,� the� SqTR� was� 33:1� in�urban� settings� compared� to� 58:1� in� rural� ones.�Yet,� this� is� a� significant� improvement�from�1999,�when�the�SqTR�averaged�59:1�in�urban�areas�and�131:1�in�rural�ones.43��
STRs� across� divisions� generally� show� a� similar� pattern,� except� for� the� Shire�Highlands,�which�displays�a�slightly�higher�STR�than�the�other�divisions.�More�marked�variations� between� divisions� are� observed� for� the� SqTR.� The� shortage� of� qualified�teachers� is� also� pervasive� in� the� Central�Western� division,� as� indicated� by� the� high�value�of�its�SqTR.���
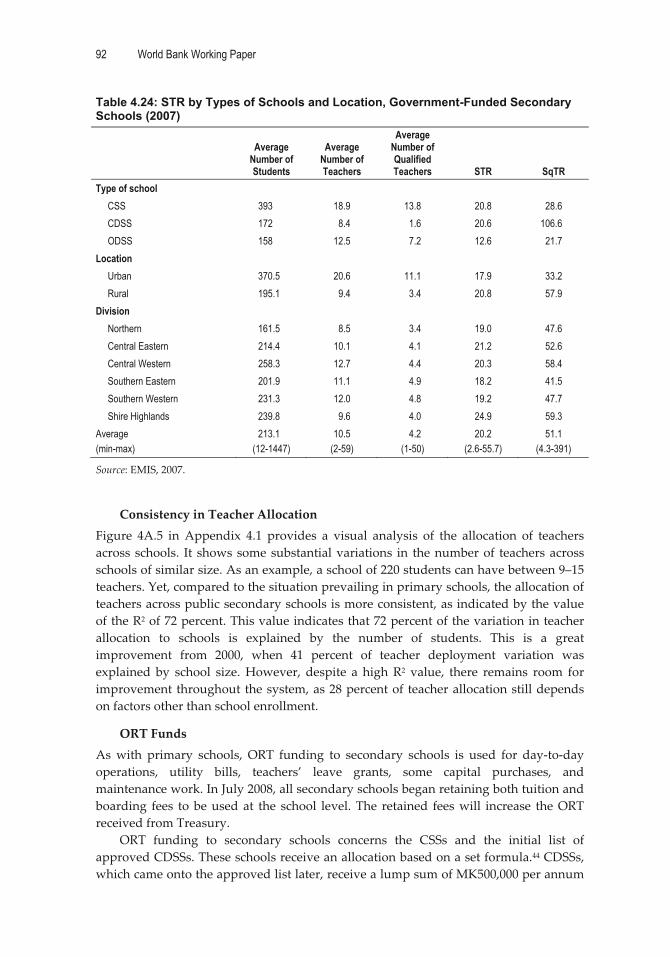
92 World Bank Working Paper
�
Table 4.24: STR by Types of Schools and Location, Government-Funded Secondary Schools (2007)
Average Number of Students
Average Number of Teachers
Average Number of Qualified Teachers STR SqTR
Type of school CSS 393 18.9 13.8 20.8 28.6 CDSS 172 8.4 1.6 20.6 106.6 ODSS 158 12.5 7.2 12.6 21.7
Location Urban 370.5 20.6 11.1 17.9 33.2 Rural 195.1 9.4 3.4 20.8 57.9
Division Northern 161.5 8.5 3.4 19.0 47.6 Central Eastern 214.4 10.1 4.1 21.2 52.6 Central Western 258.3 12.7 4.4 20.3 58.4 Southern Eastern 201.9 11.1 4.9 18.2 41.5 Southern Western 231.3 12.0 4.8 19.2 47.7 Shire Highlands 239.8 9.6 4.0 24.9 59.3
Average (min-max)
213.1 (12-1447)
10.5 (2-59)
4.2 (1-50)
20.2 (2.6-55.7)
51.1 (4.3-391)
Source:�EMIS,�2007.�
Consistency�in�Teacher�Allocation�Figure� 4A.5� in�Appendix� 4.1� provides� a� visual� analysis� of� the� allocation� of� teachers�across� schools.� It� shows�some�substantial�variations� in� the�number�of� teachers�across�schools�of�similar�size.�As�an�example,�a�school�of�220�students�can�have�between�9–15�teachers.�Yet,�compared�to�the�situation�prevailing�in�primary�schools,�the�allocation�of�teachers�across�public�secondary�schools�is�more�consistent,�as�indicated�by�the�value�of�the�R2�of�72�percent.�This�value�indicates�that�72�percent�of�the�variation�in�teacher�allocation� to� schools� is� explained� by� the� number� of� students.� This� is� a� great�improvement� from� 2000,� when� 41� percent� of� teacher� deployment� variation� was�explained� by� school� size.�However,� despite� a� high�R2� value,� there� remains� room� for�improvement�throughout�the�system,�as�28�percent�of� teacher�allocation�still�depends�on�factors�other�than�school�enrollment.��
ORT�Funds�As�with� primary� schools,� ORT� funding� to� secondary� schools� is� used� for� day�to�day�operations,� utility� bills,� teachers’� leave� grants,� some� capital� purchases,� and�maintenance�work.�In�July�2008,�all�secondary�schools�began�retaining�both�tuition�and�boarding� fees� to�be�used�at� the� school� level.�The� retained� fees�will� increase� the�ORT�received�from�Treasury.��
ORT� funding� to� secondary� schools� concerns� the� CSSs� and� the� initial� list� of�approved�CDSSs.�These�schools�receive�an�allocation�based�on�a�set�formula.44�CDSSs,�which�came�onto�the�approved�list�later,�receive�a�lump�sum�of�MK500,000�per�annum�
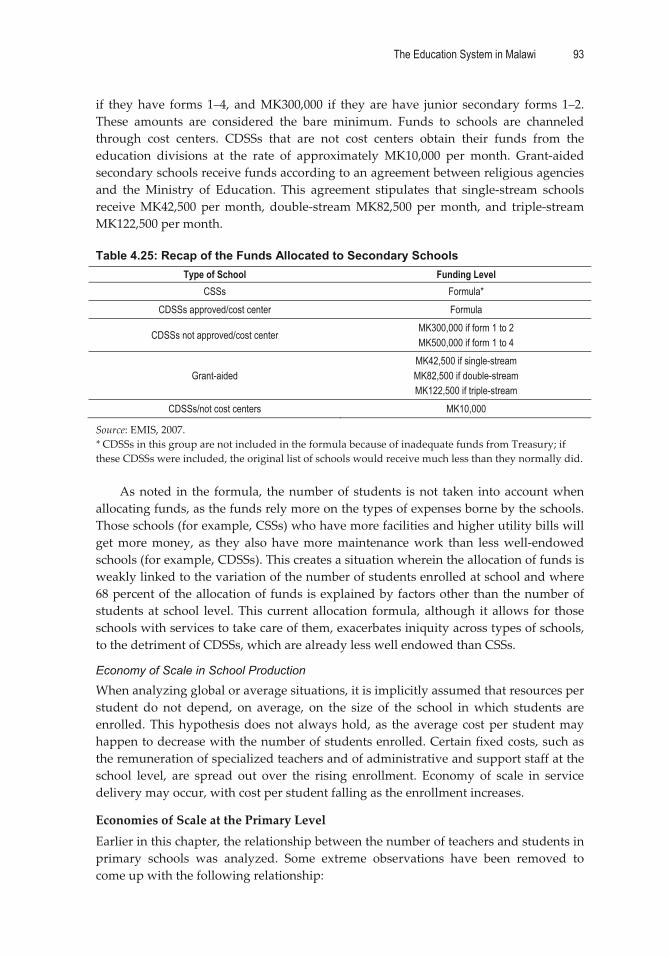
The Education System in Malawi 93
�
if� they�have� forms� 1–4,� and�MK300,000� if� they� are�have� junior� secondary� forms� 1–2.�These� amounts� are� considered� the� bare� minimum.� Funds� to� schools� are� channeled�through� cost� centers.� CDSSs� that� are� not� cost� centers� obtain� their� funds� from� the�education� divisions� at� the� rate� of� approximately� MK10,000� per� month.� Grant�aided�secondary�schools�receive�funds�according�to�an�agreement�between�religious�agencies�and� the�Ministry� of� Education.� This� agreement� stipulates� that� single�stream� schools�receive�MK42,500�per�month,� double�stream�MK82,500�per�month,� and� triple�stream�MK122,500�per�month.��Table 4.25: Recap of the Funds Allocated to Secondary Schools
Type of School Funding Level CSSs Formula*
CDSSs approved/cost center Formula
CDSSs not approved/cost center MK300,000 if form 1 to 2 MK500,000 if form 1 to 4
Grant-aided MK42,500 if single-stream MK82,500 if double-stream MK122,500 if triple-stream
CDSSs/not cost centers MK10,000
Source:�EMIS,�2007.�*�CDSSs�in�this�group�are�not�included�in�the�formula�because�of�inadequate�funds�from�Treasury;�if�these�CDSSs�were�included,�the�original�list�of�schools�would�receive�much�less�than�they�normally�did.��
As�noted� in� the� formula,� the�number�of� students� is�not� taken� into�account�when�allocating�funds,�as�the�funds�rely�more�on�the�types�of�expenses�borne�by�the�schools.�Those�schools�(for�example,�CSSs)�who�have�more�facilities�and�higher�utility�bills�will�get�more�money,� as� they� also� have�more�maintenance�work� than� less�well�endowed�schools�(for�example,�CDSSs).�This�creates�a�situation�wherein�the�allocation�of�funds�is�weakly�linked�to�the�variation�of�the�number�of�students�enrolled�at�school�and�where�68�percent�of� the�allocation�of�funds�is�explained�by�factors�other�than�the�number�of�students�at� school� level.�This� current�allocation� formula,� although� it� allows� for� those�schools�with�services�to�take�care�of�them,�exacerbates�iniquity�across�types�of�schools,�to�the�detriment�of�CDSSs,�which�are�already�less�well�endowed�than�CSSs.��
Economy of Scale in School Production
When�analyzing�global�or�average�situations,�it�is�implicitly�assumed�that�resources�per�student� do� not� depend,� on� average,� on� the� size� of� the� school� in�which� students� are�enrolled.�This�hypothesis�does�not�always�hold,� as� the�average� cost�per� student�may�happen�to�decrease�with�the�number�of�students�enrolled.�Certain�fixed�costs,�such�as�the�remuneration�of�specialized�teachers�and�of�administrative�and�support�staff�at�the�school� level,� are� spread� out� over� the� rising� enrollment.� Economy� of� scale� in� service�delivery�may�occur,�with�cost�per�student�falling�as�the�enrollment�increases.��
Economies�of�Scale�at�the�Primary�Level�Earlier�in�this�chapter,�the�relationship�between�the�number�of�teachers�and�students�in�primary� schools� was� analyzed.� Some� extreme� observations� have� been� removed� to�come�up�with�the�following�relationship:�

94 World Bank Working Paper
�
�(1)� Number�of�teachers=0.046�+�0.011��number�of�students���Multiplying�both�sides�by�the�teacher�mean�wage�(for�example,�MK189,395)�results�in�the�total�wage�bill�(staff�in�primary�schools�are�mainly�teachers)�at�school�level:���(2)� Wage�bill�=�8,712�+�2,083��number�of�students��
In�equation�(2),�the�intercept�8,712�represents�the�school’s�fixed�costs�or�structural�costs.�The�multiplicative�coefficient�of�the�“number�of�students”�variable�corresponds�to�the�marginal�cost�per�student�(what�it�costs�on�average�in�terms�of�the�wage�bill�to�increase� the� number� of� students� by� one� unit).� From� equation� 2,� it� is� possible� to�compute�the�wage�unit�cost�(per�student),�which�refers�to�the�wage�spending�divided�by�the�number�of�students�enrolled:��(3)� Wage�unit�cost�=�2,083�+�8,712/number�of�students��
Equation� (3)� makes� clear� that� the� teacher� wage� unit� cost� corresponds� to� the�addition� of� the� marginal� costs� and� the� allocation� of� fixed� costs� between� students�enrolled.�The�bigger�the�school�size�(for�example,�the�number�of�students�enrolled)�the�bigger�this�latter�component�(fixed�costs�are�being�allocated�among�a�bigger�number�of�students).�Economies�of�scale�can�potentially�occur�in�the�school�production.�Table�4.26�and� its� related� figure� 4.8,� represent� the� relationship� between� the� size� of� enrollments�(school�size)�and�unit�costs�(personnel�cost�per�students)�at�the�primary�level.���Table 4.26: Relationship between the Wage Unit Cost and the Number of Students at the Primary Level
Number of students 80 150 200 325 550 624 835 1,200 1,450 2,275
Wage unit cost (MK) 2,192 2,141 2,127 2,110 2,099 2,097 2,093 2,090 2,089 2,087
Source:�EMIS�2007;�simulation�from�regression.��
A� negative,� somewhat� limited� relationship� between�wage� unit� costs� and� school�size�prevails;�this�phenomenon�is�more�marked�for�schools�of�small�size,�which�enroll�550�students�and�less.�Yet,�the�dispersion�of�unit�costs�among�schools�is�quite�narrow,�varying�from�MK2,192�in�schools�with�80�students�to�MK2,087�in�big�schools�enrolling�2,275�students;�the�difference�corresponding�to�MK105�(US$0.75).��
The�magnitude�of�economies�of�scale�is�quite�modest�at�the�primary�level,45�which�implies�that�large�schools�are�not�cheaper�to�run�than�small�schools,�but�they�may�be�located�farther�from�the�average�student�home.�The�current�network�of�public�schools�tends� to� stress� size� over� proximity.� The� average� school� enrollment� is� 642� in�government�funded�schools�(600�in�public�schools,�667�in�religious�ones)�compared�to�194�in�private�schools.�Among�government�funded�schools,�25�percent�enroll�less�than�325�students�and�10�percent�less�than�200�students.�This�is�a�real�contrast�with�private�schools,�wherein�66�percent�enroll�less�than�250�students�each.���
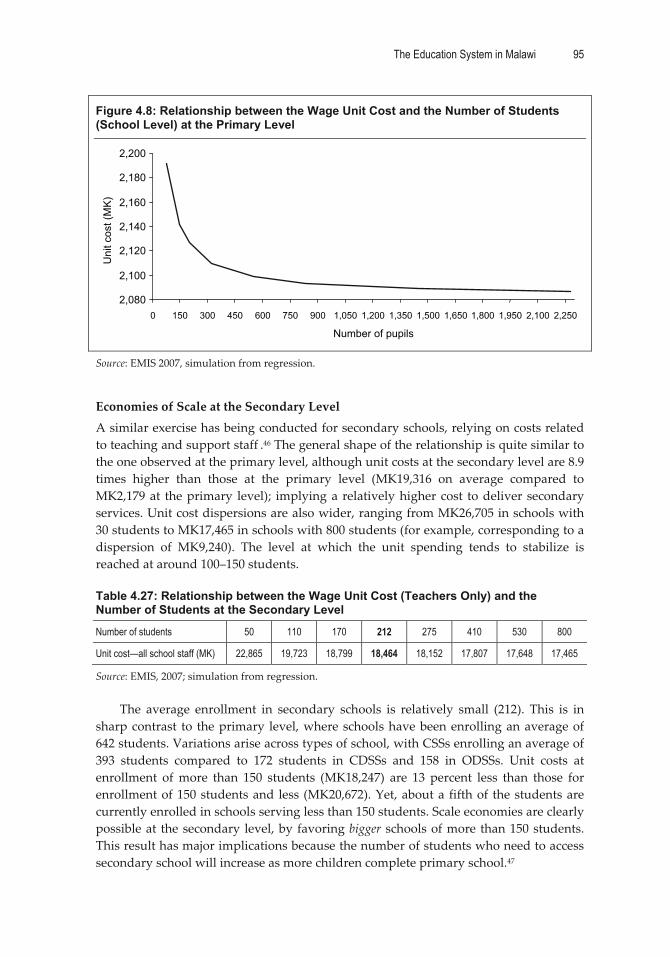
The Education System in Malawi 95
�
Figure 4.8: Relationship between the Wage Unit Cost and the Number of Students (School Level) at the Primary Level
2,080
2,100
2,120
2,140
2,160
2,180
2,200
0 150 300 450 600 750 900 1,050 1,200 1,350 1,500 1,650 1,800 1,950 2,100 2,250
Number of pupils
Uni
t cos
t (M
K)
�
Source:�EMIS�2007,�simulation�from�regression.��
Economies�of�Scale�at�the�Secondary�Level�A�similar�exercise�has�being�conducted�for�secondary�schools,�relying�on�costs�related�to�teaching�and�support�staff�.46�The�general�shape�of�the�relationship�is�quite�similar�to�the�one�observed�at�the�primary�level,�although�unit�costs�at�the�secondary�level�are�8.9�times� higher� than� those� at� the� primary� level� (MK19,316� on� average� compared� to�MK2,179�at� the�primary� level);� implying�a�relatively�higher�cost� to�deliver�secondary�services.�Unit�cost�dispersions�are�also�wider,�ranging�from�MK26,705�in�schools�with�30�students�to�MK17,465�in�schools�with�800�students�(for�example,�corresponding�to�a�dispersion� of� MK9,240).� The� level� at� which� the� unit� spending� tends� to� stabilize� is�reached�at�around�100–150�students.���Table 4.27: Relationship between the Wage Unit Cost (Teachers Only) and the Number of Students at the Secondary Level
Number of students 50 110 170 212 275 410 530 800
Unit cost—all school staff (MK) 22,865 19,723 18,799 18,464 18,152 17,807 17,648 17,465
Source:�EMIS,�2007;�simulation�from�regression.��
The� average� enrollment� in� secondary� schools� is� relatively� small� (212).� This� is� in�sharp�contrast� to� the�primary� level,�where�schools�have�been�enrolling�an�average�of�642�students.�Variations�arise�across�types�of�school,�with�CSSs�enrolling�an�average�of�393� students� compared� to� 172� students� in� CDSSs� and� 158� in� ODSSs.� Unit� costs� at�enrollment� of�more� than� 150� students� (MK18,247)� are� 13� percent� less� than� those� for�enrollment�of�150�students�and� less� (MK20,672).�Yet,�about�a� fifth�of� the�students�are�currently�enrolled�in�schools�serving�less�than�150�students.�Scale�economies�are�clearly�possible�at� the�secondary� level,�by�favoring�bigger� schools�of�more� than�150�students.�This�result�has�major�implications�because�the�number�of�students�who�need�to�access�secondary�school�will�increase�as�more�children�complete�primary�school.47��
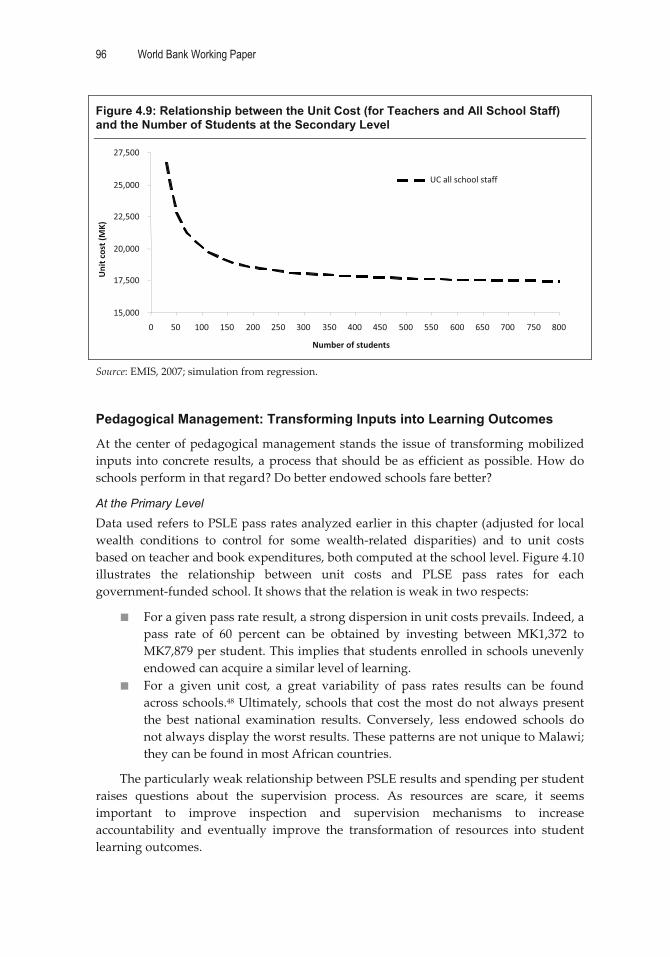
96 World Bank Working Paper
�
Figure 4.9: Relationship between the Unit Cost (for Teachers and All School Staff) and the Number of Students at the Secondary Level
�
Source:�EMIS,�2007;�simulation�from�regression.��
Pedagogical Management: Transforming Inputs into Learning Outcomes
At�the�center�of�pedagogical�management�stands�the� issue�of� transforming�mobilized�inputs� into�concrete�results,�a�process� that�should�be�as�efficient�as�possible.�How�do�schools�perform�in�that�regard?�Do�better�endowed�schools�fare�better?��
At the Primary Level
Data�used�refers�to�PSLE�pass�rates�analyzed�earlier�in�this�chapter�(adjusted�for�local�wealth� conditions� to� control� for� some� wealth�related� disparities)� and� to� unit� costs�based�on�teacher�and�book�expenditures,�both�computed�at�the�school�level.�Figure�4.10�illustrates� the� relationship� between� unit� costs� and� PLSE� pass� rates� for� each�government�funded�school.�It�shows�that�the�relation�is�weak�in�two�respects:��
� For�a�given�pass�rate�result,�a�strong�dispersion�in�unit�costs�prevails.�Indeed,�a�pass� rate� of� 60� percent� can� be� obtained� by� investing� between� MK1,372� to�MK7,879�per�student.�This�implies�that�students�enrolled�in�schools�unevenly�endowed�can�acquire�a�similar�level�of�learning.�
� For� a� given� unit� cost,� a� great� variability� of� pass� rates� results� can� be� found�across�schools.48�Ultimately,�schools�that�cost�the�most�do�not�always�present�the� best� national� examination� results.� Conversely,� less� endowed� schools� do�not�always�display�the�worst�results.�These�patterns�are�not�unique�to�Malawi;�they�can�be�found�in�most�African�countries.�
The�particularly�weak�relationship�between�PSLE�results�and�spending�per�student�raises� questions� about� the� supervision� process.� As� resources� are� scare,� it� seems�important� to� improve� inspection� and� supervision� mechanisms� to� increase�accountability� and� eventually� improve� the� transformation� of� resources� into� student�learning�outcomes.��
15,000�
17,500�
20,000�
22,500�
25,000�
27,500�
0� 50 100 150 200 250 300� 350 400 450 500 550 600 650 700� 750� 800�
Number�of�students
Unit�cost�(MK)�
UC�all�school�staff
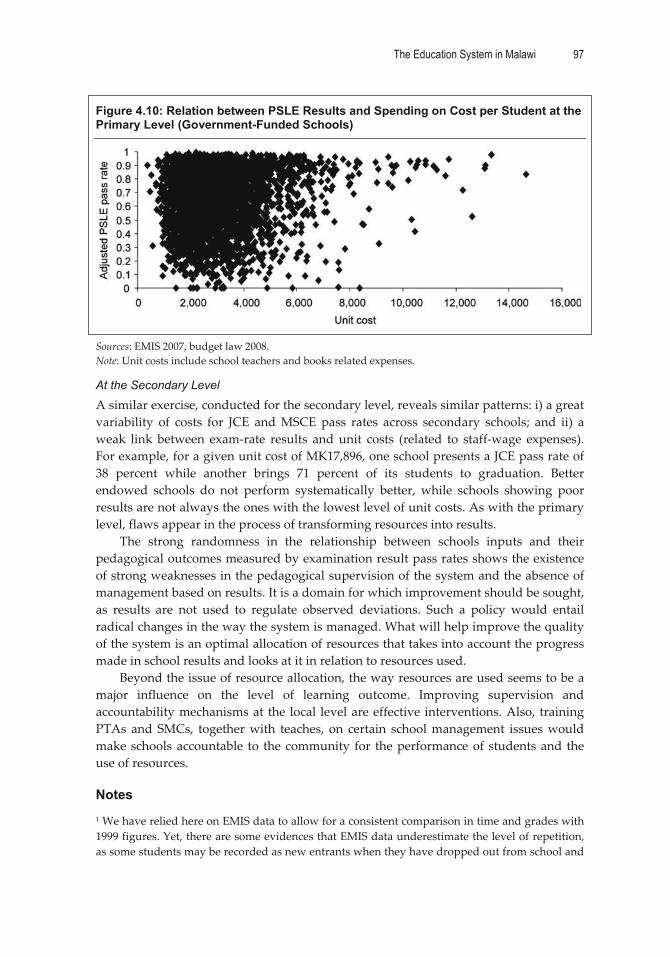
The Education System in Malawi 97
�
Figure 4.10: Relation between PSLE Results and Spending on Cost per Student at the Primary Level (Government-Funded Schools)
�
Sources:�EMIS�2007,�budget�law�2008.�Note:�Unit�costs�include�school�teachers�and�books�related�expenses.��
At the Secondary Level
A�similar�exercise,�conducted�for�the�secondary�level,�reveals�similar�patterns:�i)�a�great�variability� of� costs� for� JCE� and�MSCE� pass� rates� across� secondary� schools;� and� ii)� a�weak� link� between� exam�rate� results� and�unit� costs� (related� to� staff�wage� expenses).�For�example,�for�a�given�unit�cost�of�MK17,896,�one�school�presents�a�JCE�pass�rate�of�38� percent� while� another� brings� 71� percent� of� its� students� to� graduation.� Better�endowed� schools� do� not� perform� systematically� better,� while� schools� showing� poor�results�are�not�always�the�ones�with�the�lowest�level�of�unit�costs.�As�with�the�primary�level,�flaws�appear�in�the�process�of�transforming�resources�into�results.��
The� strong� randomness� in� the� relationship� between� schools� inputs� and� their�pedagogical�outcomes�measured�by�examination�result�pass�rates�shows�the�existence�of�strong�weaknesses�in�the�pedagogical�supervision�of�the�system�and�the�absence�of�management�based�on�results.�It�is�a�domain�for�which�improvement�should�be�sought,�as� results� are� not� used� to� regulate� observed� deviations.� Such� a� policy� would� entail�radical�changes�in�the�way�the�system�is�managed.�What�will�help�improve�the�quality�of�the�system�is�an�optimal�allocation�of�resources�that�takes�into�account�the�progress�made�in�school�results�and�looks�at�it�in�relation�to�resources�used.�
Beyond�the�issue�of�resource�allocation,�the�way�resources�are�used�seems�to�be�a�major� influence� on� the� level� of� learning� outcome.� Improving� supervision� and�accountability�mechanisms�at� the� local� level�are�effective� interventions.�Also,� training�PTAs� and�SMCs,� together�with� teaches,� on� certain� school�management� issues�would�make�schools�accountable� to� the�community� for� the�performance�of�students�and� the�use�of�resources.��
Notes�1�We�have�relied�here�on�EMIS�data�to�allow�for�a�consistent�comparison�in�time�and�grades�with�1999�figures.�Yet,�there�are�some�evidences�that�EMIS�data�underestimate�the�level�of�repetition,�as�some�students�may�be�recorded�as�new�entrants�when�they�have�dropped�out�from�school�and��

98 World Bank Working Paper
�
�returned� to� the� same� grade� the� following� year.� See� Chapter� 2� for� additional� information� on�repetition�issues.�2�Selection� into�Form�1� is�not�automatic�but� is�based�on�merit�and�the�availability�of�secondary�places,�which�may�become�more�limited�as�the�number�of�primary�school�completers�increases.�Higher�repetition�rates�at�Standard�8�may�be�linked�to�the�need�for�some�learners�to�increase�their�chances�to�get�into�the�secondary�level.�3� The� repetition� rate� was� 5.4� percent� at� the� lower� secondary� against� 7.2� percent� at� the� upper�secondary�in�2006.�4�The�quality�of�data�on�repetition�before�2004� is�weak� for� the�secondary� level.�As�a� result,� the�analysis�was�conducted�on�data�from�2004�onward.��5�In�Chapter�2,�an�analysis�of�survival�patterns�was�conducted�using�household�survey�data.�The�survival� rate� is� complementary� to� 100� percent� of� the� dropout� rate.� Dropouts� may� be�overestimated� at� early� grades� as� children�who� are� leaving� school� in� the�middle� of� the� year� to�reintegrate�into�it� the�following�year�are�considered�dropouts�instead�of�repeaters,�as�repetition�refers�to�administrative�decisions�made�at�the�school�level.�6� This� CSR� uses� a� cross�section� schooling� profile� that� relies� on� administrative� data� for� global�enrollment�and�an�IHS�2004�repetition�structure.�7�Dropout�and�repetition�related�coefficients�are�also�useful�to�characterize�the�magnitude�of�the�wastage.�They�are�computed�as� follows:�While� the�numerator�of� the�dropout�related�coefficient�(also� known� as� the� efficiency� coefficient� with� no� repetition)� includes� only� student�years�associated�with�dropping�out,�the�numerator�of�the�repetition�related�coefficient�(also�known�as�the� efficiency� coefficient�with� no� dropouts)� includes� only� student�years� associated�with� grade�repetition.�The�overall�coefficient�(the�IEC,�the�product�of�the�two)�takes�into�account�the�student�years�associated�with�both�dropouts�and�grade�repetitions.�8�The�computation�of�the�coefficient�is�based�on�the�following�assumptions:�i)�it�measures�output�as� the� number� of� graduates;� ii)� it� assigns� no� value� to� skills� acquired� by� dropouts;� and� iii)�repetition�is�considered�wasteful.��9� A� standardized� indicator� is� needed� to� allow� comparisons� with� other� countries,� such� as� an�efficiency�coefficient�based�on�a�primary�education�cycle�of�six�years.�10� Improving� all� aspects� of� the� quality� of� education� and� ensuring� excellence� of� all� so� that�recognized� and� measurable� learning� outcomes� are� achieved� by� all,� especially� in� literacy,�numeracy,�and�essential�life�skills.�11� Yet,� this� finding�may� not� totally� reflect� declining� quality� so� much� as� an� increase� in� lower�achieving� students� in� the� system� following� the� implementation� of� the� fee�free� policy� in� 1994.�Indeed,� abolishing� school� fees� usually� boosts� school� participation� for� students� from� a� lower�socioeconomic�background,�who�usually�face�more�educational�challenges.��12See�Chapter� 2� for�more� about� examinations.� They� are� also� used� to� select� students� for� public�secondary� schools� by� ranking� them�and�deciding�what� type�of� secondary� schools� they�will� be�able�to�attend.�13� EMIS� data� are� used� here.� Sampling� had� to� be� restricted� to� schools� that� had� presented�candidates� in�2006.�The�resulting�dataset�pertains� to�3,539�schools�out�of�5,294�(all�school� types�considered).� For� each� school,� information� is� available� on� exam� pass� rates� as� well� as� on� the�characteristics�of�schools�and�teachers.��14�In�2006,�144,338�students�sat�for�the�exams�and�106,363�passed.��15� Forty� percent� of� private� schools� are� located� in� urban� zones� compared� to� 3.2� percent� of�government�funded�schools.�16�The�STR�is�24:1�in�private�schools�against�80:1�in�public�schools.�Also,�a�private�school�is�more�likely�to�have�access�to�facilities,�such�as�water,�electricity,�and�a�library.�Teachers�are�generally�younger� (35�years�old� compared� to� 39�years�old� in�public� schools)� and�also�more�qualified� (in��
The Education System in Malawi 99
�
�terms�of�academic�qualifications).�However,�very�few�teachers�in�private�schools�(17�percent)�are�trained�in�comparison�to�teachers�in�government�funded�schools�(91�percent).��17� Just� as� for� the� PSLE� computation,� JCE� and�MSCE� computations� are� required� to� work� on� a�sample� of� schools� that� had� students� who� registered� for� the� examination,� and� for� which� the�number�of�students�who�passed�the�exam�was�above�or�equal�to�those�who�sat� it.�This� led�to�a�sample�size�of�968�schools�and�824�schools,� respectively� (out�of�1,046),� for� JCE�and�MSCE�pass�rates�analyses.��18� There� is� little� difference� between� the� number� of� students� who� entered� the� exam� and� the�number�of�students�enrolled�in�Standard�8.��19�While�81�percent�of�CDSS�teachers�are�untrained,�only�27�percent�of�CSS�teachers�are.�This�is�because� numerous� teachers� trained� to� teach� at� the� primary� level� are� loaned� to� secondary� schools,�especially� in� CDSSs,� because� there� is� a� shortage� of� appropriate� teachers� for� the� secondary� school�subsector.�They�represent�79�percent�of�the�teaching�force�in�CDSSs,�compared�to�15�percent�in�CSSs.��20� The� learning� environment� is� also� not� quite� conducive� to� teaching� and� learning;� most�classrooms�lack�desks,�classrooms�themselves�are�in�poor�shape,�teaching�and�learning�materials�including� textbooks,� equipment,� and� facilities� (both� in�normal� classrooms�and� laboratories)�are�grossly�inadequate,�or�nonexistent�in�some�cases.��21�EMIS�data�provide�some�information�on�fund�flow�at� the�school� level.�They�show�that�while�CSSs�receive�86�percent�of�government�funding,�CDSSs�only�get�13�percent.�Although�this�could�be� explained� by� the� fact� that� CSSs� have�more� current� expenditures� to� cover� than� CDSSs� (for�example,� boarding� facilities,� utilities),� this� allocation� of� government� funds� tends� to� reinforce�iniquities�between�types�of�schools.��22�Indeed,�PSLE�results�are�used�to�rank�students,�with�the�best�one�entering�CSSs.��23�In�addition,�pass�rates�are�sometimes�used�to�regulate�students�flows�from�one�cycle�to�the�next.�24� In� many� similar� exercises� conducted� in� various� countries,� the� explanatory� power� of� such�models� tends� to� reach� a� best� 10� percent� (Swaziland:� 5.3� percent;� Niger:� 7.9� percent;� Mali:� 7.6�percent).�Information�comes�from�most�recent�country�specific�CSRs.��25� Schools� are� classified� simply�as� either� rural� or�urban,� and�only� considered�urban� if� they� fall�within�the�urban�administrative�area.�As�a�result,�95�percent�of�schools�are�considered�rural,�and�this�broad�category�includes�many�in�peri�urban�areas�and�those�in�small�towns,�along�with�the�most�isolated�rural�schools.�26�PTAs�and�SMCs�have�currently�have�little�to�do�with�general�school�oversight,�including�monitoring�learning�outcomes.�Indeed,�PTA�activities�are�mainly�linked�to�school�construction�and�maintenance,�and�to�some�extent�to�teacher�pay�and�the�purchase�of�school�supplies�(Bellew,�2008).��27� The�model�was� computed�by� relying� only� on� 2007� (for� the� exam�data)� and� 2006�data.� Basic�statistics�on�the�model�variables�are�in�table�4A.3�of�Appendix�4.2.��28�Since�June�2006,�the�retirement�age�has�been�raised�to�60�years�old.�29�Following�low�teacher�training�outputs�(about�2,500�a�year�over�the�past�years),�the�supply�of�teachers� has� been� inadequate� to� meet� teacher� needs.� The� current� accumulated� shortfall� of�primary�school�teachers�is�estimated�at�13,000�(Bellew,�2008).��30�Volunteers�are�also�included�in�this�analysis,�although�they�are�not�paid�by�the�government.�By�extension,�government�funded�teachers�or�public�teacher�will�be�referred�to�as�well.��31�Female�teachers�have�above�average�allocations�to�Central�West�and�South�West�education�divisions,�while�the�Shire�Highlands�tend�to�have�the�fewest.�The�first�two�divisions�are�urban,�around�Lilongwe�and�Blantyre�where�most�commercial�activities�take�place.�Shire�Highlands�is�rural.��32�A�qualified�teacher�is�defined�as�one�who�has�not�just�an�academic�qualification,�but�has�also�trained�as�a�teacher�for�the�appropriate�level.�A�primary�qualified�teacher�who�is�sent�to�teach�at�a�secondary�school�is�considered�unqualified.�33�Note�that�almost�11�percent�of�the�untrained�teachers�are�civil�servants.���

100 World Bank Working Paper
�
�34�The�value�of�the�indicator�ranges�between�0�and�100�percent�(or�0�and�1) .�The�100�percent�value�corresponds� to� a� functional� relationship� where� all� the� observations� are� located� on� the� mean�relationship�(regression�line),�meaning�that�all�schools�are�being�treated�equally�(perfect�equity)�and�the�number�of�teachers�depends�only�on�the�number�of�students�enrolled�at�school�level.�On�the�other�hand,�a�0�value,� indicates�an�absence�of� relationship�between� the�number�of� teachers�and�the�number�of�students�they�are�teaching.��35�The�inclusion�of�volunteer�teachers�slightly�improves�the�R2�from�58.1�percent�to�58.5�percent.�36�In�some�cases,�their�recruitment�has�helped�ease�the�pressure.�This�is�particularly�the�case�in�the�Southern�Eastern�and�Northern�divisions,�where�the�recruitment�of�volunteers�has�caused�a�decrease�in� the� STR�of� 11� points� and� 9�points,� respectively.�Yet,� the�use� of� volunteer� teachers�has�not� been�systematic,�as�in�the�Shire�Highlands�and�to�a�lesser�extent�in�the�Southern�Western�division.�37�The�analysis�at�Standard�1�is�not�relevant�as�most�students�do�not�have�books.��38�The�formula�is�based�on�district�characteristics�that�are�divided�into�three�major�components:�demographic�data,�economic�data,�and�social�factors.�There�are�variables�under�each�component,�which� are� used� by� the� district� assembly� as� a� basis� for� allocating� funding� and� to� maintain�objectivity.�These�variables�include:�the�proportion�of�children�under�14�years;�land�area;�number�of�schools;�road�length�requiring�reshaping;�education�in�an�urban�setting�(utility�bills);�number�of� special� needs� centers;� STRs;� Primary� school� enrollment,� and� the� number� of� primary� school�teachers.� There� are� four� main� areas� of� expenditure� for� the� district� assemblies� with� respect� to�primary�education:�These�are�leave�grants,�operations,�maintenance,�and�special�needs�education.�These� variables� are�weighted� and� standardized� on� a� 100�point� scale� in� the� formula.� The� total�weighted�points�for�each�variable�determine�how�much�funding�should�go�to�each�type�of�major�area�of�educational�expenditure�at�the�local�assembly�level.�39� CSSs� comprise� four� government� national� schools,� grant�aided� secondary� schools,� district�boarding� secondary� schools,� and� day� secondary� schools.� Grant�aided� schools� are� considered�public�in�the�current�analysis�as�teachers�are�being�funded�by�the�government.��40�Open�day�schools�are�providing�students�with�night�sessions.�CSSs,�private�schools,�and�ODSSs�account�for�13.5�percent,�27.1�percent,�and�4.2�percent�of�the�schools,�respectively.��41�From�that�figure,�discount�the�269�teachers�who�are�working�in�two�schools,�usually�a�CDSS�or�a�CSS�and�an�ODSS.�42�With�such�a�level,�Malawi�is�among�SADC�countries�with�the�lowest�STRs,�ranking�below�the�average�STR�of�the�region�(23:1).��43�Similarly,�the�indicators�for�STR�were�28:1�in�urban�areas�and�36:1�in�rural�areas�(CSR,�2004).��44�The�formula�is�based�on�school�characteristics,�which�are�divided�into�three�components:�basic�school� capacity,� curriculum�enhancement,� and�auxiliary�or� support� factors.�There�are�variables�under�each�component�that�are�referred�to�as�expenditure�drivers/generators.�The�purpose�of�all�these�variables�is�to�base�funding�allocation�on�what�things�will�cause�the�school�to�spend�so�that�there�is�objectivity�in�allocating�funds.��45�The�unit� cost� for� schools�with�550� students�and� less� is�MK2,118�against�MK2,093� for� schools�enrolling�more�than�550�students�(a�1.2�percent�difference).�46�Unit�cost�=�17105+288003/number�of�students.�Teacher�mean�wage�amounted�to�MK343,000�in�2007,�while�the�wage�related�to�all�staff�was�MK292,895.�47�Yet�the�level�of�fixed�costs�(such�as�the�one�related�to�infrastructure�costs)�may�be�a�constraint�on�the�expansion�of�the�secondary�level.��48�For�instance,�for�a�given�unit�cost�of�MK3,287�PSLE�pass�rates�may�vary�from�50�to�100�percent.��

101
CHAPTER �5 �
Equity�and�Disparities�
Summary of the Chapter
Schooling� access� suffers� from� disparities� according� to� gender.� Considering� present�enrollment,�gender�parity� indexes�(calculated�by�dividing�the�GER�of�the�girls�by�the�GER�of�the�boys),�ranged�from�1.04�in�the�first�four�standards�of�primary�education�to�0.50�in�higher�education�and�0.38�in�TEVET.�Five�and�a�half�times�more�girls�than�boys�are� enrolled� in� non�formal� educational� programs.� Boys� are� more� likely� to� repeat�standards� than� girls.� However,� more� girls� drop� out� in� primary� and� secondary�education�and�they�do�not�perform�as�well�as�boys�(as�shown�by�SACMEQ�data�and�results�on�national�examinations).1��
Nevertheless,� access� to�education�suffers�more� from�type�of� location�and� income�disparities� than� from�gender.�The�difference� in� the�primary�completion� rate� (proxied�by�the�access�rate�to�Standard�8)� is�14�percent�between�boys�and�girls,�yet�34�percent�between� urban� and� rural� students.� And� the� disparity� is� still� greater—44� percent—between�the�richest�20�percent�of�the�population�and�the�poorest�20�percent.�For�secondary�completion,�the�difference�is�9�percent�between�boys�and�girls,�26�percent�between�urban�and� rural� students,� and� 29� percent� between� rich� and� poor.� Furthermore,� in� higher�education,�the�students�from�the�richest�20�percent�represent�91�percent�of�the�total�number�of�students�while�those�from�the�poorest�40�percent�account�for�only�0.7�percent.��
The�Northern�region’s�GERs�in�primary�(134�percent)�and�secondary�education�(28�percent)� are� much� higher� than� the� national� averages� (101� percent� and� 16� percent,�respectively).�The�primary�completion�rate� in� the�Northern�region� is�1.8� times�higher�than�the�national�value.�It�rises�above�50�percent�in�a�few�districts�(Mzimba,�Rumphi,�and�Nkhatabay),� and� falls�under�30�percent� in� six�others� (Dedza,�Mangochi,�Ntcheu,�Machinga,� Phalombe,� and� Thyolo).� The� secondary� completion� rate� (proxied� by� the�access�rate�to�Form�4)�is�the�same�in�the�Northern�region�as�the�Southern�(12�percent),�whereas� the� Central� is� lower� (9� percent).� At� the� district� level,� Blantyre� has� the�maximum�value� (30�percent),�while� 19�districts� have� less� than� 10�percent,� 3� of� them�being�under�5�percent:�Chitipa,�Balaka,�and�Machinga.�SACMEQ�shows�that�pupils�in�large� cities� have� a� better� chance� of� reaching� a�minimum�mastery� level� than� those� in�other�areas�and�have�better�national�examination�results� than�students� in�rural�areas.�Moreover,� pupils� in� the� South� Eastern� and� South� Western� education� divisions� are�faring�better�than�those�in�Central�Eastern�and�Northern�regions.�
Seventy�three�percent�of�public� resources�are�appropriated�by�the�most�educated�10� percent� of� students,� which�makes�Malawi� one� of� the� least� equitable� countries� in�Africa.�Moreover,�due�to�social�selectivity�and�the�distribution�of�public� resources�by�education� levels,� urban�people� appropriate� 8.4� times�more� resources� than� rural,� and�

102 World Bank Working Paper
�
the� richest� 20� percent� of� households� get� 11.4� times�more� public� education� spending�than�the�poorest�20�percent.�
* * *
Chapter� 5� examines� education� equity� and� focuses� on� disparities� across� gender,�location,� region,� and� household� income.� Equity� entails� putting� measures� in� place�aimed� at� reducing� the� existing� regional,� district,� and� socioeconomic� disparities� in�educational� access,� retention,� and� learning� at� all� levels� of� the� system.� An� equitable�distribution� of� education� resources� plays� an� important� role� in� reducing� poverty� and�increasing� access� for� more� disadvantaged� groups.� Furthermore,� education� as� an�investment�contributes�to�the�positive�economic�and�social�status�of�individuals�in�their�adult� lives.� It� constitutes� the� largest� government� expenditure� and� has� the� widest�outreach� because� almost� all� families� in� Malawi� have� children,� or� are� guardians� for�children,� and� as� such,� have� the� potential� to� benefit� from� public� subsidies� through�education.�In�this�way,�the�education�sector�can�become�an�effective�fiscal� instrument�for� alleviating� poverty� and� redistributing� income.� Consequently,� this� chapter� also�examines�who�benefits�from�public�spending�on�education.��
Disparities among Social Groups
This�section�focuses�on�the�schooling�distribution�according�to�socioeconomic�criteria.�Table�5.1�shows�the�social�structure�(by�gender,�location,�and�wealth�quintile)�of�people�aged�5–24�years,�according�their�highest�level�of�education.�It�should�be�contrasted�with�the�comparison�group�that�shows�the�entire�population�of�people�in�this�age�group.��Table 5.1: Social Structure by Highest Level of Education and Comparison Group, 5–24 Years Old (in %)
Comparison Group
(5–24 years old)
Highest Level of Education Attended Never Attended
School Non-Formal Education Primary Secondary
Higher Education
Gender Boys 49 50 14 48 53 52 Girls 51 50 86 51 47 48 Total 100 100 100 100 100 100 Location Urban 12 5 11 11 33 76 Rural 88 95 89 89 67 24 Total 100 100 100 100 100 100 Wealth Index Q1 20 29 21 20 7 0.7 Q2 20 25 19 20 10 0.0 Q3 19 21 32 20 14 3.5 Q4 20 16 24 21 19 4.5 Q5 21 9 5 20 50 91.3 Total 100 100 100 100 100 100
Source:�Calculation�from�MICS�2006�data.�Note:�In�this�table,�both�individuals�who�are�currently�attending�as�well�as�those�who�have�dropped�out�are�considered.�For�instance,�89�percent�of�those�who�have�reached�primary�education�are�rural:�This�proportion�refers�to�those�who�are�currently�enrolled�in�primary�(whatever�the�grade)�and�those�who�dropped�out�during�primary.�

The Education System in Malawi 103
�
A� similar� gender� trend� as� the� one� observed� in� the� comparison� group� applies� to�those� for�whom�primary� education� is� the�highest� level� attended:� 52�percent� of� those�who�have�attended�only�primary�are�girls.�More�boys�than�girls�attend�secondary�and�higher� education,� but� the� difference� is� still� very� slight.� Alternatively,�more� girls� (86�percent)�attend�non�formal�education�than�boys.��
The� majority� of� Malawians� (88� percent)� live� in� rural� areas� and� rural� children�represent�most�of�those�who�have�had�no�education�(95�percent)�or�attend�non�formal�education� (89� percent).� Most� primary� students� live� in� rural� areas;� the� percentage�decreases�a�bit� in�secondary�education.�It�is�worth�noting�that�the�four�major�cities�in�Malawi�(Lilongwe,�Blantyre,�Mzuzu,�and�Zomba)�are�the�only�areas�considered�urban�and� the� rest� of� the� country� is� classified� as� rural.� However,� despite� the� small� urban�population,� far�more� students� in� these� areas� go� on� to� higher� education� (76� percent)�compared�to�rural�students.��
Among�the�group�reaching�higher�education,�91.3�percent�belong�to�the�richest�20�percent�of�households,�while�only�0.7�percent�come�from�the�poorest�40�percent.��
Table�5.1�shows�educational�attainment�among�the�5–24�year�olds,�but�the�children�who� are� currently� attending� school� also� need� to� be� looked� at.� This� can� be� done� by�displaying� enrollment� indicators� and� schooling� profiles,� using� either� administrative�data�or�households�surveys.��
Gender Disparities
Schooling�Coverage�at�Different�Levels�of�Education�Table� 5.2� displays� GER� gender� parity� indexes� across� the� educational� system,� from�preschool�(ECD�Level�2)�to�higher�education�(including�adult�literacy�programs),�from�2000–2007.��
Parity�indexes�have�increased�since�2000,�meaning�improved�enrollments�for�girls�at�all�educational� levels.�However,�gender�disparity�varies� from�one� level� to�another;�the�parity�index�starts�at�1.04�in�the�first�four�standards�and�decreases�down�to�0.67�in�the�two�last�forms.���Table 5.2: Gender Parity Indexes at Different Education Levels, 2000–2007
Year
Pre-school (level 2)
Primary Secondary
TEVET Higher
Education Adult
Literacy Std1– Std4
Std5– Std8
Std1– Std8
Form 1–2
Form 3–4
Form 1–4
2000 1.00 0.82 0.94 0.69 0.65 0.67 0.34 6.43 2001 1.00 0.83 0.95 0.74 0.67 0.71 0.33 5.94 2002 1.01 0.90 0.97 0.77 0.70 0.74 0.36 5.39 2003 1.01 0.93 0.99 0.81 0.67 0.75 0.42 5.40 2004 1.04 0.92 1.01 0.81 0.69 0.76 0.45 6.55 2005 1.04 0.94 1.01 0.80 0.68 0.75 0.44 5.67 2006 1.04 0.96 1.02 0.88 0.67 0.79 0.41 5.51 2007 0.87 1.04 0.96 1.02 0.85 0.67 0.77 0.38 0.50 -
Source:�Primary,�secondary,�TEVET,�and�higher�education�data�from�EMIS�2007�(MOEST)�and�preschool�and�adult�literacy�data�from�the�Ministry�of�Women�and�Child�Development��Note:�Parity�indexes�on�enrollment�coverage�are�computed�by�dividing�GER�for�girls�by�GER�for�boys.�The�GER�measure�is�replaced�by�the�number�of�students�or�learners�by�100,000�inhabitants,�if�relevant.�

104 World Bank Working Paper
�
For�gender�disparities�in�primary�and�secondary�education,�international�data�are�available� to� compare� Malawi� with� other� African� countries.� With� parity� of� 1.02� for�primary�education,�Malawi�stands�above�the�SADC�average�(1.00)�and�the�SSA�average�(0.9).� In� lower� secondary� (Form� 1–Form� 2),� Malawi� is� behind� SADC� average� (0.9),�while�it�remains�above�the�African�average�(0.8).�Finally,�for�upper�secondary�Malawi�stands�behind�the�African�average�of�0.8,�which�is�also�the�SADC�average.��
It�was�not�possible� to� find�data�and�produce� trends�of�parity� index� for� technical�and�Vocational�Training�(TEVET).�However,�2007�data�show�that�the�enrolment�of�girls�is�very�low�compared�to�boys:�for�every�100�boys�enrolled,�there�are�only�38�girls.�This�could�be�explained�by�the�fact�that�most�courses�offered�under�TEVET�are�in�subjects�associated�with�traditional�male�occupations.�Female�students�were�introduced�to�the�so�called�non�traditional�courses�in�2002.�
In�higher�education,�the�trend�is�similar�with�a�parity�index�of�50.�However,�there�has�been�a� significant� increase� in�number�of�girls�every�year,�as� the�same� figure�was�around� 0.34� in� 2000.� Many� more� girls� attend� non�formal� education� than� boys�(enrollment� in� adult� literacy�programs� is� 5.5� times� higher� for� girls� than� boys� [2006])�and�this�is�a�consequence�of�the�decreasing�enrollment�of�girls�in�formal�education.��
Figure�5.1�confirms�those�trends�for�primary�and�secondary�education,�displaying�a�simplified�schooling�profile�per�gender,�from�MICS�data.�It�illustrates�that�there�is�a�high�access�(96�percent)�to�Standard�1�for�both�boys�and�girls�in�Malawi.�However,�less�than�50�percent�of�boys� reach�Standard�8�and� the�percentage� for�girls� is�much� lower�(31).�Access� to� lower�and�upper�secondary�education� is� low�for�boys�and�even� lower�for�girls.���
Figure 5.1: Access to and Completion of the Different Levels by Gender
96%
15%
7%10%17%
22%
96%
31%22%
27%
45%
30%
0
10
20
30
40
50
60
70
80
90
100
Access toprimary
Primarycompletion
Access tolower
secondary
Lowersecondarycompletion
Access toupper
secondary
Uppersecondarycompletion
Girls
Boys
Per
cent
Source:�Calculation�according�to�MICS�2006�database.�
The Education System in Malawi 105
�
As� noted� in�Chapter� 2,� issues� of� teenage�pregnancy,� early�marriage,� and� lack� of�tuition�fees�affect�girls’�completion�of�primary�education.�Differences�in�access�to�lower�secondary�education�can�first�be�explained�by�the�primary�completion�rate�figures�but�also� by� some� government� policies,� particularly� on� availability� of� space� in� boarding�schools�for�boys�and�girls.�Generally�all�government�co�education�boarding�schools�in�Malawi�have�an�access�ratio�of�two�boys�to�every�one�girl.�This�difference�contributes�to�the�lower�access�girls�have�to�secondary�education,�although�secondary�day�schools�have�a� ratio�of�1:1�during�selection.� In�addition,� the�selection�policy� from�primary� to�secondary� is� bottlenecked� due� to� limited� space� in� public� secondary� schools.� Most�children�who�pass�national�examinations�at�the�end�of�the�primary�school�cycle�do�not�make�it�to�secondary�school�because�there�aren’t�enough�spaces.��
On Internal Efficiency
In� general,� boys� are� more� likely� to� repeat� than� girls� (see� tables� 5A.1� and� 5A.2� in�Appendix� 5.1).�While� girls� are�more� likely� to� remain� in� school� than�boys�during� the�first�years�of�schooling,�girls�drop�out�at�a�higher�rate�after�Standard�4.�Marriage�and�pregnancy�are�the�two�main�causes.2�For�boys,�family�responsibilities�and�the�need�to�work�are�the�main�reasons�for�dropping�out.�(See�tables�5A.3�and�5A.4�in�Appendix�5.1�for�more�information.)�
On Learning Outcomes
SACMEQ�There� are� gender� differences� in� pupils� reaching� a� minimum� or� desirable� level� of�mastery� in� reading.� Looking� at� the� minimal� level� of� mastery� in� table� 5.3,� girls� fare�worse�than�boys.�A�similar�pattern�is�also�shown�for�pupils�reaching�a�desirable�level�of�mastery.� Under� this� category,� both� boys� and� girls� performed� badly,� but� boys� still�scored�slightly�higher�than�girls.���Table 5.3: Percentage of Pupils Reaching Minimum and Desirable Levels of Reading Mastery (SACMEQ II)
Pupils Reaching Minimum Level of Mastery in Reading (in %) (SE)
Pupils Reaching Desirable Level of Mastery in Reading (in %) (SE)
Gender Boys 10.5 (1.21) 0.5 (0.20) Girls 6.6 (1.09) 0.1 (0.10) Total 8.6 (0.95) 0.3 (0.12)
Source:�SACMEQ�II�report,�2005.�Note:�SE�=�sampling�error.��
National�Exams�PSLE:� Table� 5.4� displays� PSLE� results� for� 2006� by� gender.� In� 2006,� 93� percent� of�students�sat� for� the�exam�and� there�was� little�difference�between�boys�and�girls.�The�total� pass� rate�was� 73.7� percent� in� 2006,�meaning� that� is� one� pupil� out� of� four�who�failed� the�exam.�More�boys�passed� than�girls,�which� is� consistent�with� the�SACMEQ�findings� showing� that� boys� are� scoring� higher� in� English,� reading,� and�mathematics�than�girls.��

106 World Bank Working Paper
�
Table 5.4: Leaving School Examination Results at the Primary Level by Gender (2006) Entered Sat Passed
Male Female Total Male Female Total Male Female Total Total 87,182 67,388 154,570 81,805 62,533 144,338 63,365 42,998 106,363 % who… 93.8 92.8 93.4 77.4 68.8 73.7
Source:�EMIS�2007.���JCE�and�MSCE:�As�can�be�seen�in�table�5.5,�girls�perform�less�well�than�boys�at�both�of�these�secondary�level�exams.�This� is�striking�at� the�JCE�level,�with�52�percent�of�girls�passing�the�exam�compared�with�69�percent�of�boys.�At�the�MSCE�level,�barely�a�third�of�girls�sitting�for�the�exam�passed�compare�to�almost�half�of�the�boys.���Table 5.5: JCE and MSCE Examination Results at the Secondary Level by Gender (2006)
Entered Sat Passed Male Female Total Male Female Total Male Female Total
JCE Total 34,790 26,415 61,205 33,490 25,075 58,565 23,230 12,989 36,219 % who… 96.3 94.9 95.7 69.4 51.8 61.8 MSCE Total 26,749 17,693 44,442 25,703 16,711 42,414 12,522 6,054 18,576 % who… 96.1 94.4 95.4 48.7 36.2 43.8
Sources:�EMIS�2006,�2007.���
Disparities According to Family Income Level
Children�from�the�richest�to�the�poorest�quintiles�access�Standard�1�equally�(see�figure�5.2).�However,�significant�differences�appear�to�be�more�pronounced�between�quintile�5�and�the�rest�of�the�quintiles�when�it�comes�to�primary�and�secondary�completion�and�access� to� secondary� education.� Sixty�seven� percent� of� children� from� the� richest�households� (quintile� 5)� complete� primary� education� as� opposed� to� only� 23� percent�from�the�poorest�groups.�And�less�than�10�percent�of�children�from�the�poorest�groups�less� have� access� to� secondary� education.� The� poorest� group� also� has� very� low�completion� rates� for� lower� and�upper� secondary� education:� 8�percent� and� 2�percent,�respectively.�In�contrast,�more�than�half�the�children�from�the�richest�households�have�access�to�secondary�education�and�complete�lower�secondary�education.���
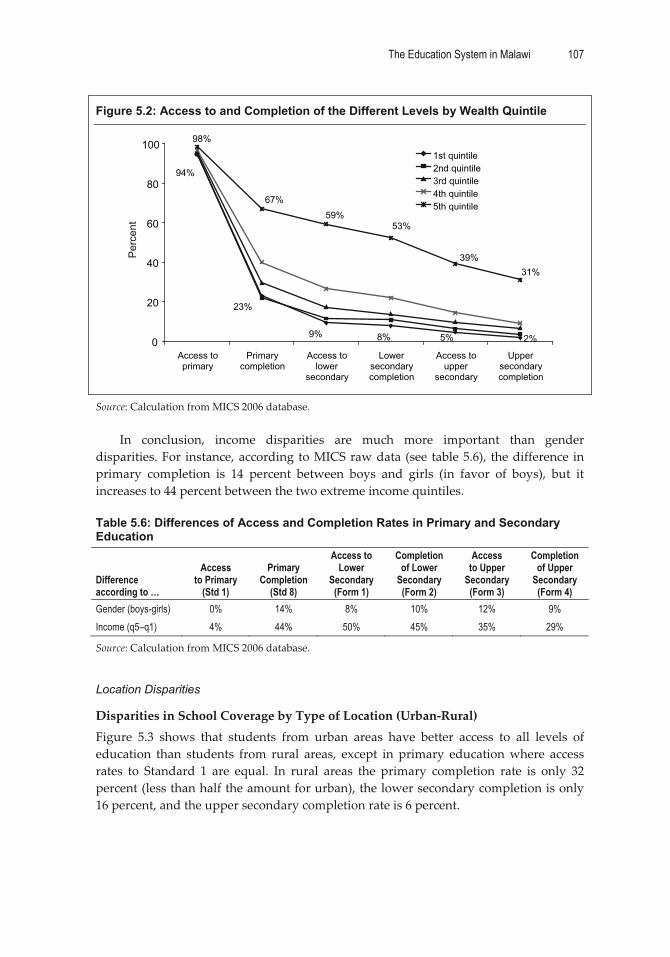
The Education System in Malawi 107
�
Figure 5.2: Access to and Completion of the Different Levels by Wealth Quintile
23%
94%
9% 8% 5% 2%
98%
67%59%
53%
39%31%
0
20
40
60
80
100
Access toprimary
Primarycompletion
Access tolower
secondary
Lowersecondarycompletion
Access toupper
secondary
Uppersecondarycompletion
1st quintile2nd quintile3rd quintile4th quintile5th quintile
Per
cent
Source:�Calculation�from�MICS�2006�database.��
In� conclusion,� income� disparities� are� much� more� important� than� gender�disparities.�For� instance,�according�to�MICS�raw�data� (see� table�5.6),� the�difference� in�primary� completion� is� 14� percent� between� boys� and� girls� (in� favor� of� boys),� but� it�increases�to�44�percent�between�the�two�extreme�income�quintiles.��Table 5.6: Differences of Access and Completion Rates in Primary and Secondary Education
Difference according to …
Access to Primary
(Std 1)
Primary Completion
(Std 8)
Access to Lower
Secondary (Form 1)
Completion of Lower
Secondary (Form 2)
Access to Upper
Secondary (Form 3)
Completion of Upper
Secondary (Form 4)
Gender (boys-girls) 0% 14% 8% 10% 12% 9% Income (q5–q1) 4% 44% 50% 45% 35% 29%
Source:�Calculation�from�MICS�2006�database.��
Location Disparities
Disparities�in�School�Coverage�by�Type�of�Location�(Urban�Rural)�Figure� 5.3� shows� that� students� from� urban� areas� have� better� access� to� all� levels� of�education� than� students� from� rural� areas,� except� in� primary� education�where� access�rates� to� Standard� 1� are� equal.� In� rural� areas� the� primary� completion� rate� is� only� 32�percent�(less�than�half�the�amount�for�urban),�the�lower�secondary�completion�is�only�16�percent,�and�the�upper�secondary�completion�rate�is�6�percent.���

108 World Bank Working Paper
�
Figure 5.3: Access Probability to the Different Grades According to Living Area
96%98%
32%
20% 16%10% 6%
66%
56%52%
41%
0
10
20
30
40
50
60
70
80
90
100
Access toprimary
Primarycompletion
Access tolower
secondary
Lowersecondarycompletion
Access toupper
secondary
Uppersecondarycompletion
rural
urban
Per
cent
�
Source:�Calculation�according�to�MICS�2006�database.���
For�primary�and�lower�secondary�levels,�some�international�data�are�available�for�comparisons� of� Malawi� with� other� African� countries� in� terms� of� rural� and� urban�disparities.� Figure� 5.4� shows� that� on� average� the� primary� completion� rate� for� urban�students�is�2.8�times�higher�than�for�rural�students,�ranking�from�1.17�(Côte�d’Ivoire)�to�8.6� (Niger):� The� situation� for�Malawi� appears� to� be� in� the�middle� in� terms� of� equity�when�compared�to�other�African�countries.��
Figure 5.4: PCR Urban /PCR Rural in Some African Countries
0
1
2
3
4
5
6
7
8
9
Côte d'
Ivoire
Ghana
Nigeria
Ugand
aTo
goKen
ya
Congo
, Rep
.
Leso
tho
Congo
, Dem
. Rep
.
Camero
onBen
in
Sierra
Leon
e
Zambia
Malawi
Gambia
, The
Rwanda
Seneg
al
Maurita
nia Mali
Guinea
CAR
Burund
i
Mozam
bique
Burkina
FasoCha
d
Ethiop
ia
Guinea
-Biss
auNige
r
Average =2.76
PC
R
�Sources:�Calculation�from�MICS�2006�for�Malawi,�World�Bank�data�base�for�the�other�countries.�Note:�Data�are�from�2007�or�thereabouts.�
�

The Education System in Malawi 109
�
Figure� 5A.1� in� Appendix� 5.2� shows� that� the� completion� of� lower� secondary� by�urban�students�appears�to�be�more�favorable�in�Malawi�than�in�other�African�countries.�Malawi’s�urban�rate�is�3.2�times�higher�than�the�rural,�while�the�African�average�is�5.2,�ranging�from�1.5�(Ghana)�to�8.7�(Guinea�Bissau).��
Disparities�by�Region�Identifying� regional� disparities� may� help� to� specifically� target� areas� for� which�education�coverage�within�primary�and�secondary�education�is�lower�than�the�national�level.��
As� figure� 5.5� shows,� there� are� no� disparities� in� access� to� Standard� 1� among�Malawi’s�three�regions.�However,�some�significant�differences�begin�to�appear�in�other�levels.�More�children�from�the�Northern�region�complete�primary�and�lower�secondary�education�and�have�access�to�lower�secondary.�Nevertheless,�the�differences�in�access�among�the�regions�decrease�for�upper�secondary�and�there�is�almost�parity�among�the�regions�when�it�comes�to�completion�of�upper�secondary�education.���
Figure 5.5: Regional Disparities
99%
54%
40%
31%
12%
20% 17%12%
26%23%
17%19%
9%
97%
34%
12%
95%
36%
0
20
40
60
80
100
Access toprimary
Primarycompletion
Access tolower
secondary
Lowersecondarycompletion
Access toupper
secondary
Uppersecondarycompletion
Northern regionCentral regionSouthern region
Per
cent
Source:�Calculation�from�MICS�2006�database.���Table�5.7�provides�additional�information�on�survival�within�each�cycle�and�transitions�between�cycles�by�region.��

110 World Bank Working Paper
�
Table 5.7: Survival Rates and Transition Across Levels (in %)
Survival Rate in Primary
Transition Primary �
Lower Secondary
Survival Rate in Lower
Secondary
Transition Lower �
Upper Secondary
Survival Rate in Upper
Secondary Northern region 55 74 78 62 61 Central region 35 60 86 72 68 Southern region 38 74 88 71 75
Source:�Calculation�from�MICS�2006�database.��There� are� variations� among� the� regions� in� survival� rate� at� primary.� The� primary�survival� rate� in� the� Northern� region� is� 1.5� times� higher� than� in� the� Central� and�Southern�regions.��
In�addition,�EMIS�data�(2007)�show�that�the�Northern�region�has�better�education�indicators�compared�to�other�regions,�such�as�a�pupil/qualified�teacher�ratio.�Survival�rates� in� lower� secondary� seem� to� be� the� reverse� of� survival� rates� in� primary� when�examined� by� region.� The� Southern� region� has� the� highest� survival� rate� for� lower�secondary,� while� Central� is� a� close� second,� and� the� Northern� region� is� worse.� This�means�that�more�children�that�enroll�in�secondary�school�are�retained�in�Southern�and�Central�regions�than�in�the�Northern�region.��
The�Southern�and�Northern�regions�have�equal�transition�rates�from�to�primary�to�lower�secondary�and�the�central�region�has�a� lower�transition�rate.�This�may�indicate�that� the� Central� region� has� fewer� secondary� school� places� compared� to� the� other�regions.� In� Malawi,� secondary� school� selection� is� determined� by� the� availability� of�places.�
Transition�rates�between�lower�and�upper�secondary�show�significant�differences�among� the� regions� and� surprisingly,� the� results� are� the� reverse� of� the� transition� rate�between�primary�and� lower� secondary.�The�Central� region�has� the�highest� transition�rate� for� lower� and� upper� secondary,� closely� followed� by� the� Southern� region.� The�Northern�region�has�the�lowest�transition�rate.�The�results�indicate�that�it�is�likely�that�more�children�in�the�Central�and�Southern�regions�pass�the�JCE�at�the�end�of�two�years�of� secondary� education.� In� Malawi,� the� JCE� determines� who� progresses� to� upper�secondary� education.� Survival� in�upper� secondary� is� highest� in� the� Southern� region,�lower�in�the�Central�region,�and�lowest�in�the�Northern�region.�This�means�that�more�children� in� the� Southern� region� do� not� leave� school� and� are� retained� in� secondary�education.��
Disparities�by�District�Primary� Education:� The� majority� of� the� districts� have� a� GER� above� 100� percent,�meaning�that�they�have�more�children�in�school�than�the�numbers�of�primary�school��official� age� children� (see� table� 5A.5� in�Appendix� 5.2).�However� this� could�also�mean�that�most�children�in�these�districts�are�overage�or�underage.�On�the�other�hand,�some�districts�have�a�GER�that�is�less�than�100�percent.����

The Education System in Malawi 111
�
Map 5.1a: Access Rate to S1 by District
Map 5.1b: Primary Completion Rate by District
Dedza
Dowa
Kasungu
Lilongwe
Mchinji
Nkhotakota
Ntchisi
Salima
ChitipaKaronga
MzimbaNkhata Bay
Rumphi
ZombaBlantyre
ChikwawaThyolo
Nsanje
MulanjeChiradzulu
Phalombe
Mangochi
Ntcheu
Likoma
BalakaMachinga
Mwanza
Lake Malawi
> 95%
Between 90% and 95%
< 90%
Dedza
Dowa
Kasungu
Lilongwe
Mchinji
Nkhotakota
Ntchisi
Salima
ChitipaKaronga
MzimbaNkhata Bay
Rumphi
ZombaBlantyre
ChikwawaThyolo
Nsanje
MulanjeChiradzulu
Phalombe
Mangochi
Ntcheu
Likoma
BalakaMachinga
Mwanza
Lake Malawi
> 50%
Between 40% and 50%
Between 30% and 40%
< 30%
�Source:�from�MICS�2006�estimates.�Note:�Related�figures�are�reported�in�Appendix�5.3.��
Only� a� few�districts� (Mzimba,� Rumphi,�Nkhatabay,� and� Blantyre)� have� primary�completion�rates�above�50�percent.�Most�districts�have�primary�completion�rates�below�40�percent.�Maps�5.1a�and�5.1b�provide�additional�representations�of�the�access�rate�to�Standard�1�and�the�primary�completion�rate�according�to�MICS�data.�
In�most�districts,�access�to�Standard�1�is�above�90�percent�(which�is�consistent�with�administrative� data).� The� only� exception� is� Dedza� which� stand� at� 88� percent.� Eight�districts�range�between�90�and�95�percent�(Nkhotakota,�Mangochi,�Ntcheu,�Machinga,�Phalombe,�Thyolo,�Chikwawa,�and�Nsanje).�
In� all� other� districts,� access� to� Standard� 1� is� above� 95� percent.� There� is� more�variation� in� the�primary� completion� rate.�A� few�district� have� rates� above� 50�percent�(Rumphi,� Nkhatabay,� and� Mzimba),� while� six� districts� have� a� very� low� level� of�completion:�Dedza�(18�percent),�Mangochi�(25�percent),�Ntcheu�(29�percent),�Machinga�(24�percent),�Phalombe�(22�percent),�and�Thyolo�(27�percent).��Secondary� Education:� The� access� rate� to� Form� 1� and� the� secondary� completion� rate�(proxied�by�the�access�rate�to�Form�4)�derived�from�MICS�are�displayed�in�maps�5.2a�and�5.2b.��
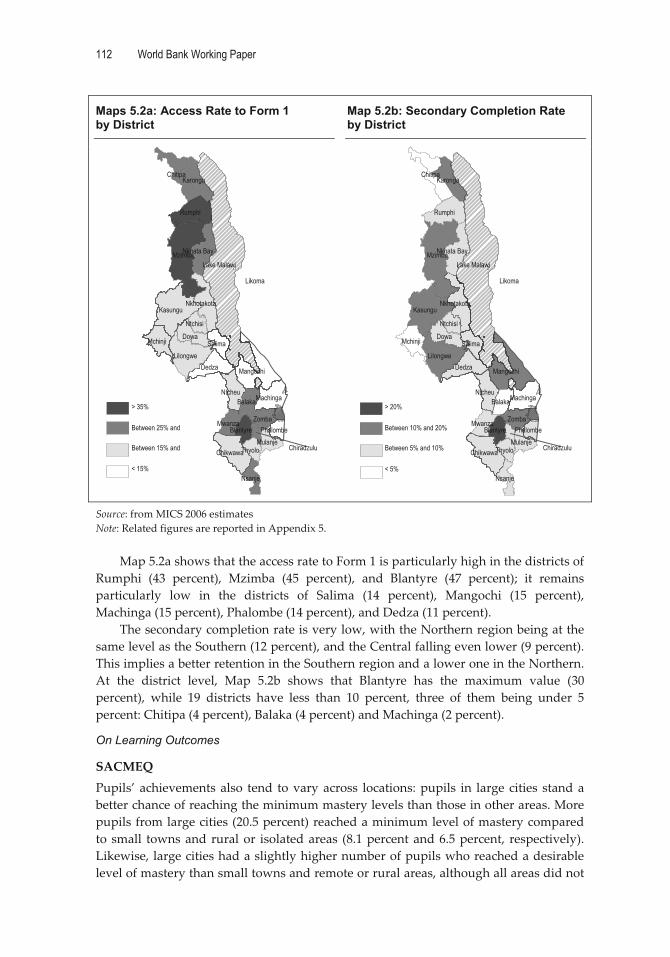
112 World Bank Working Paper
�
Maps 5.2a: Access Rate to Form 1 by District
Map 5.2b: Secondary Completion Rate by District
> 35%
Between 25% and
Between 15% and
< 15%
Dedza
Dowa
Kasungu
Lilongwe
Mchinji
Nkhotakota
Ntchisi
Salima
ChitipaKaronga
MzimbaNkhata Bay
Rumphi
Zomba Blantyre
Chikwawa Thyolo
Nsanje
Mulanje Chiradzulu
Phalombe
Mangochi
Ntcheu
Likoma
Balaka Machinga
Mwanza
Lake Malawi
Dedza
Dowa
Kasungu
Lilongwe
Mchinji
Nkhotakota
Ntchisi
Salima
ChitipaKaronga
MzimbaNkhata Bay
Rumphi
Zomba Blantyre
Chikwawa Thyolo
Nsanje
Mulanje Chiradzulu
Phalombe
Mangochi
Ntcheu
Likoma
Balaka Machinga
Mwanza
Lake Malawi
> 20%
Between 10% and 20%
Between 5% and 10%
< 5%
�Source:�from�MICS�2006�estimates�Note:�Related�figures�are�reported�in�Appendix�5.��
Map�5.2a�shows�that�the�access�rate�to�Form�1�is�particularly�high�in�the�districts�of�Rumphi� (43� percent),� Mzimba� (45� percent),� and� Blantyre� (47� percent);� it� remains�particularly� low� in� the� districts� of� Salima� (14� percent),� Mangochi� (15� percent),�Machinga�(15�percent),�Phalombe�(14�percent),�and�Dedza�(11�percent).��
The�secondary�completion�rate�is�very�low,�with�the�Northern�region�being�at�the�same�level�as�the�Southern�(12�percent),�and�the�Central�falling�even�lower�(9�percent).�This�implies�a�better�retention�in�the�Southern�region�and�a�lower�one�in�the�Northern.�At� the� district� level,� Map� 5.2b� shows� that� Blantyre� has� the� maximum� value� (30�percent),� while� 19� districts� have� less� than� 10� percent,� three� of� them� being� under� 5�percent:�Chitipa�(4�percent),�Balaka�(4�percent)�and�Machinga�(2�percent).�
On Learning Outcomes
SACMEQ�Pupils’� achievements�also� tend� to�vary�across� locations:�pupils� in� large� cities� stand�a�better�chance�of�reaching�the�minimum�mastery�levels�than�those�in�other�areas.�More�pupils�from�large�cities�(20.5�percent)�reached�a�minimum�level�of�mastery�compared�to� small� towns�and�rural�or� isolated�areas� (8.1�percent�and�6.5�percent,� respectively).�Likewise,� large�cities�had�a�slightly�higher�number�of�pupils�who�reached�a�desirable�level�of�mastery�than�small�towns�and�remote�or�rural�areas,�although�all�areas�did�not�
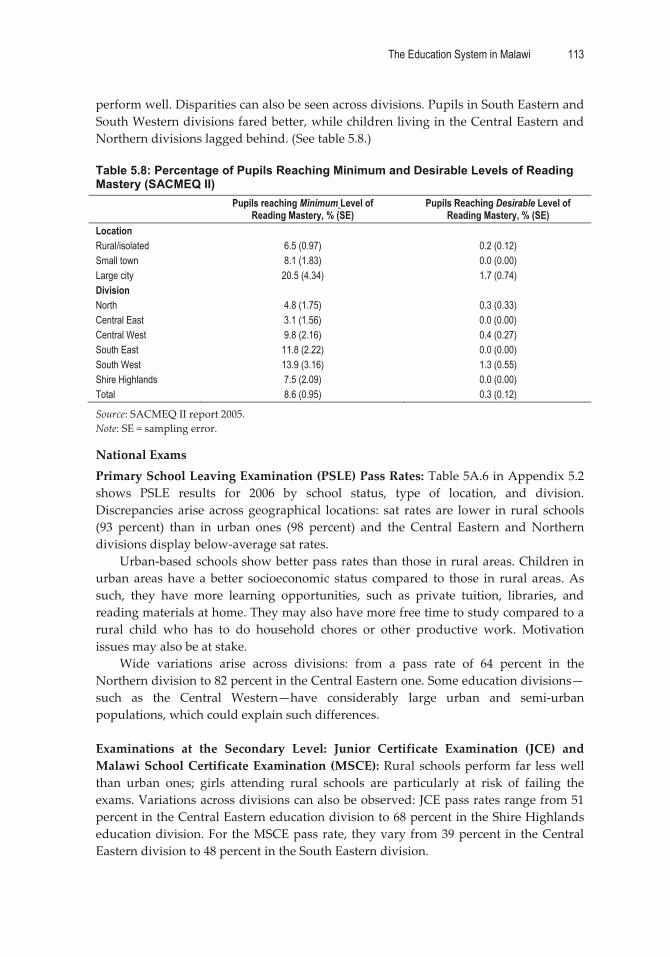
The Education System in Malawi 113
�
perform�well.�Disparities�can�also�be�seen�across�divisions.�Pupils�in�South�Eastern�and�South�Western�divisions�fared�better,�while�children�living�in�the�Central�Eastern�and�Northern�divisions�lagged�behind.�(See�table�5.8.)��Table 5.8: Percentage of Pupils Reaching Minimum and Desirable Levels of Reading Mastery (SACMEQ II)
Pupils reaching Minimum Level of Reading Mastery, % (SE)
Pupils Reaching Desirable Level of Reading Mastery, % (SE)
Location Rural/isolated 6.5 (0.97) 0.2 (0.12) Small town 8.1 (1.83) 0.0 (0.00) Large city 20.5 (4.34) 1.7 (0.74) Division North 4.8 (1.75) 0.3 (0.33) Central East 3.1 (1.56) 0.0 (0.00) Central West 9.8 (2.16) 0.4 (0.27) South East 11.8 (2.22) 0.0 (0.00) South West 13.9 (3.16) 1.3 (0.55) Shire Highlands 7.5 (2.09) 0.0 (0.00) Total 8.6 (0.95) 0.3 (0.12)
Source:�SACMEQ�II�report�2005.�Note:�SE�=�sampling�error.��
National�Exams�Primary�School�Leaving�Examination�(PSLE)�Pass�Rates:�Table�5A.6�in�Appendix�5.2�shows� PSLE� results� for� 2006� by� school� status,� type� of� location,� and� division.�Discrepancies� arise� across� geographical� locations:� sat� rates� are� lower� in� rural� schools�(93� percent)� than� in� urban� ones� (98� percent)� and� the� Central� Eastern� and� Northern�divisions�display�below�average�sat�rates.��
Urban�based�schools�show�better�pass�rates�than�those�in�rural�areas.�Children�in�urban� areas�have� a� better� socioeconomic� status� compared� to� those� in� rural� areas.�As�such,� they� have� more� learning� opportunities,� such� as� private� tuition,� libraries,� and�reading�materials�at�home.�They�may�also�have�more�free�time�to�study�compared�to�a�rural� child� who� has� to� do� household� chores� or� other� productive� work.� Motivation�issues�may�also�be�at�stake.��
Wide� variations� arise� across� divisions:� from� a� pass� rate� of� 64� percent� in� the�Northern�division�to�82�percent�in�the�Central�Eastern�one.�Some�education�divisions—such� as� the� Central� Western—have� considerably� large� urban� and� semi�urban�populations,�which�could�explain�such�differences.��Examinations� at� the� Secondary� Level:� Junior� Certificate� Examination� (JCE)� and�Malawi�School�Certificate�Examination�(MSCE):�Rural�schools�perform�far� less�well�than� urban� ones;� girls� attending� rural� schools� are� particularly� at� risk� of� failing� the�exams.�Variations�across�divisions�can�also�be�observed:�JCE�pass�rates�range�from�51�percent�in�the�Central�Eastern�education�division�to�68�percent�in�the�Shire�Highlands�education�division.�For�the�MSCE�pass�rate,� they�vary�from�39�percent� in�the�Central�Eastern�division�to�48�percent�in�the�South�Eastern�division.��

114 World Bank Working Paper
�
The�situation� for�girls� is�particularly�critical� in� the�Central�Eastern�division,�with�only�39�percent�and�29�percent�of�female�students�passing�the�JCE�and�MSCE�exams,�respectively.�Wider�disparities�between�boys�and�girls�can�be�found�within�CDSSs.�See�table�5A.7�in�Appendix�5.2�for�more�information.�
Equity in Distribution of Public Resources for Education
For� a� given� cohort� (generation),� each� child� will� benefit� from� different� amounts� of�public�education�resources,�due�to�the�different�pathways.�Those�who�will�never�attend�school�will� not� benefit� from� any� public� resources� allocated� to� the� education� system,�while� students�will�benefit� from�an� increasing�amount�of� resources,� according� to� the�number� of� years� they� spend� in� the� system.� In� order� to� estimate� the� share� of� public�resources� granted� to� each� group� of� individuals� according� to� their� highest� education�level,� it� is� necessary� to� determine� the� distribution� of� individuals� and� the� respective�amount�of�public�resources�used�for�their�studies�(see�table�5.9).���Table 5.9: Distribution of Public Education Spending According to the Highest Level Attended (Pseudo-Cohort of 100 Children)
Cohort Public Spending Cumulative
Distribution Per individual Per cohort
Level
Access Rates
(%)
Highest Level
Attended (%)
Public Unit Cost
Number of
Years
Accumulated Cost During
Studies Accumulated
(in MWK) % of Total
Cohort (%)
Public Spending
(%) No school 0.1 0 0 0 0.0 0.0 0.0
S1 99.9 3.1 3,019 1 3,019 93 0.1 3.2 0.1 S2 96.8 9.2 3,019 1 6,039 556 0.7 12.4 0.9 S3 87.6 11.3 3,019 1 9,058 1,023 1.4 23.7 2.2 S4 76.3 10.5 3,019 1 12,078 1,262 1.7 34.2 3.9 S5 65.8 13.3 3,019 1 15,097 2,013 2.7 47.5 6.5 S6 52.5 6.8 3,019 1 18,117 1,234 1.6 54.3 8.2 S7 45.7 11.0 3,019 1 21,136 2,326 3.1 65.3 11.2 S8 34.7 17.7 3,019 1 24,155 4,267 5.6 83.0 16.9 F1 17.0 0.0 30,292 1 54,447 — 0.0 83.0 16.9 F2 17.0 3.9 30,292 1 84,739 3,305 4.4 86.9 21.2 F3 13.1 0.0 30,292 1 115,031 — 0.0 86.9 21.2 F4 13.1 11.8 30,292 1 145,323 17,148 22.7 98.7 43.9
Higher* 1.30 1.3 780,479 4 3,267,240 42,474 56.1 100.0 100.0 Sources:�Calculation�from�EMIS�2007�database,�UN�Population,�and�results�from�Chapter�3�*�The�GER�is�used�here�for�higher�education,�with�18–21�year�olds�as�the�reference�population�group,�and�assuming�a�four�year�duration�of�the�cycle.�
Construction�of�the�table:�For�each�level�the�proportion�of�individuals�for�whom�the�level�was�the�highest�attended�was�computed.�For�example,�the�access�rate�to�Standard�1�is�99.9�percent�and�the�access�rate�to�Standard�2�is�96.8�percent,�so�for�3.1�percent�(99.9�–�96.8)�of�pupils�Standard�1�was�the�highest�level�they�attended.�For�each�highest�level�attended,�the�resources�accumulated�by�an�individual�were�computed.�For�instance,�a�pupil�having�Form�2�as�highest�level�attended�accumulated�8�(number�of�years�of�primary�education)�x�3,019�(public�unit�cost�for�one�year�in�primary)�+�2�(number�of�grades�attended�in�secondary�education)�x�30,292�(public�unit�cost�for�one�year�in�secondary)�=�MK84,736.�Finally,�a�computation�was�done�of�the�accumulated�public�spending�for�all�the�individuals�with�the�same�highest�level�attended�by�multiplying�the�percentage�of�cohort�that�end�up�at�this�level�per�the�cumulated�cost�for�one�pupil�with�that�highest�level�attended.�The�distribution�of�public�spending�according�to�the�highest�level�attended�was�obtained.�Finally,�a�computation�was�made�of�the�cumulative�distribution�of�individuals�and�the�public�education�resources�spent�for�them.�For�example,�the�34�percent�of�the�cohort�who�leave�school�in�Standard�4�or�before�get�only�3.9�percent�of�the�public�resources�dedicated�to�education.��
The Education System in Malawi 115
�
Table� 5.9� shows� the� very� inequitable� distribution� of� public� resources� devoted� to�education.� As� an� example,� the� 83� percent� of� individuals� leaving� school� in� primary�education� appropriate� only� at� 16.9� percent� of� public� spending,� while� the� few� (1.3�percent)�who� reach�higher� education�benefit� from�56�percent�of� those� resources.�The�11.8� percent� that� leave� with� a� complete� secondary� education� will� benefit� from� 22.7�percent�of�public�resources.��
The� education� Lorenz� curve� (resources’� concentration� curve)� can� be� computed�from�the�two�last�columns�of�table�5.9�(see�Figure�5.6).��Figure 5.6: Education Lorenz Curve
0
10
20
30
40
50
60
70
80
90
100
0 10 20 30 40 50 60 70 80 90 100Cumulated % cohort
Cum
ulat
ed %
reso
urce
s
10% mosteducated
73% of public resources approriated per the 10% most educated
�
Sources:�Calculation�from�EMIS�2007�database,�UN�population,�and�results�from�Chapter�3.��
The� diagonal� line� of� this� figure� would� correspond� to� the� situation� of� perfect�equality�in�access�to�education�public�resources�among�all�individuals.�The�curve�itself�is� the� present� situation� of� Malawi� and� it� differs� significantly� from� the� diagonal�reference.�In�order�to�estimate�the�importance�of�this�deviation,�two�indicators�can�be�computed:��
� The�first�one� is� the�Gini� index,�computed�by�dividing�the�surface�of� the�area�between�the�diagonal�and�the�curve�by�the�surface�of� the�area�of�the�triangle�defined� by� the� curves� and� reference� axis.� This� indicator� ranks� from� 0� and� 1�and� its� value� is� as� little� as� the� distribution� of� resources� is� equalitarian.� In�Malawi,�the�Gini�index�is�equal�to�0.78�for�2007;�
� The� second� indicator� is� the� share�of�public� resources�appropriated�by� the�10�percent� most� educated3� (i.e.,� those� who� complete� the� most� schooling).� This�indicator�reaches�73�percent�in�Malawi.��
�
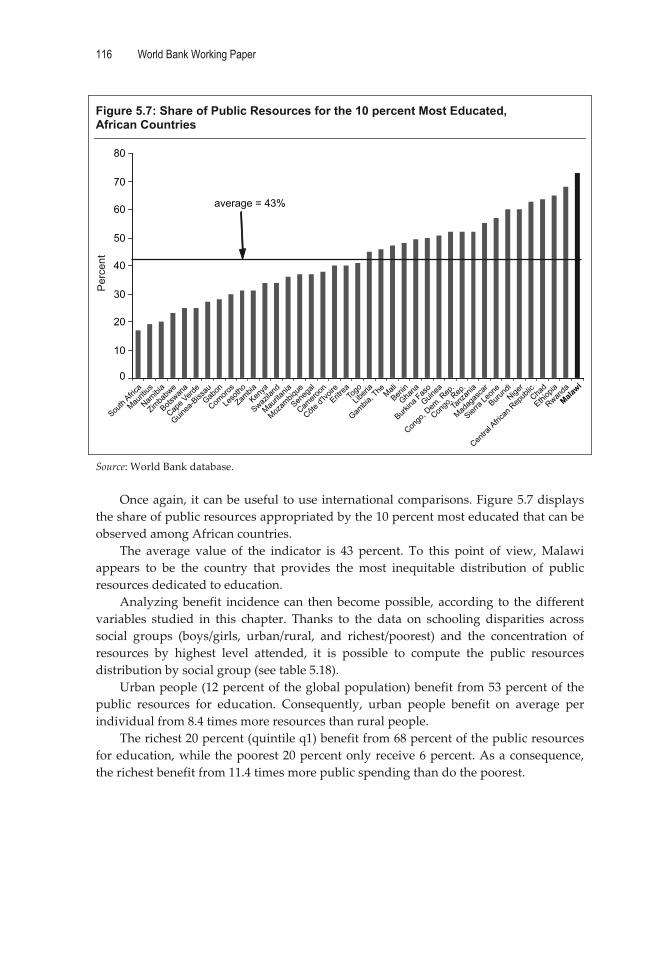
116 World Bank Working Paper
�
Figure 5.7: Share of Public Resources for the 10 percent Most Educated, African Countries
0
10
20
30
40
50
60
70
80
South
Africa
Mauriti
us
Namibi
a
Zimba
bwe
Botswan
a
Cape V
erde
Guinea
-Biss
auGab
on
Comoro
s
Leso
tho
ZambiaKen
ya
Swazila
nd
Maurita
nia
Mozam
bique
Seneg
al
Camero
on
Côte d'
IvoireEritr
eaTo
go
Liberi
a
Gambia
, The Mali
Benin
Ghana
Burkina
Faso
Guinea
Congo
, Dem
. Rep
.
Congo
, Rep
.
Tanz
ania
Madag
asca
r
Sierra
Leon
e
Burund
iNige
r
Centra
l Afric
an R
epub
licCha
d
Ethiop
ia
Rwanda
Malawi
average = 43%
Per
cent
�Source:�World�Bank�database.��
Once�again,� it�can�be�useful�to�use�international�comparisons.�Figure�5.7�displays�the�share�of�public�resources�appropriated�by�the�10�percent�most�educated�that�can�be�observed�among�African�countries.��
The� average� value� of� the� indicator� is� 43� percent.� To� this� point� of� view,�Malawi�appears� to� be� the� country� that� provides� the� most� inequitable� distribution� of� public�resources�dedicated�to�education.�
Analyzing�benefit� incidence�can� then�become�possible,�according� to� the�different�variables� studied� in� this� chapter.� Thanks� to� the� data� on� schooling� disparities� across�social� groups� (boys/girls,� urban/rural,� and� richest/poorest)� and� the� concentration� of�resources� by� highest� level� attended,� it� is� possible� to� compute� the� public� resources�distribution�by�social�group�(see�table�5.18).��
Urban�people�(12�percent�of�the�global�population)�benefit�from�53�percent�of�the�public� resources� for� education.� Consequently,� urban� people� benefit� on� average� per�individual�from�8.4�times�more�resources�than�rural�people.��
The�richest�20�percent�(quintile�q1)�benefit�from�68�percent�of�the�public�resources�for�education,�while�the�poorest�20�percent�only�receive�6�percent.�As�a�consequence,�the�richest�benefit�from�11.4�times�more�public�spending�than�do�the�poorest.���
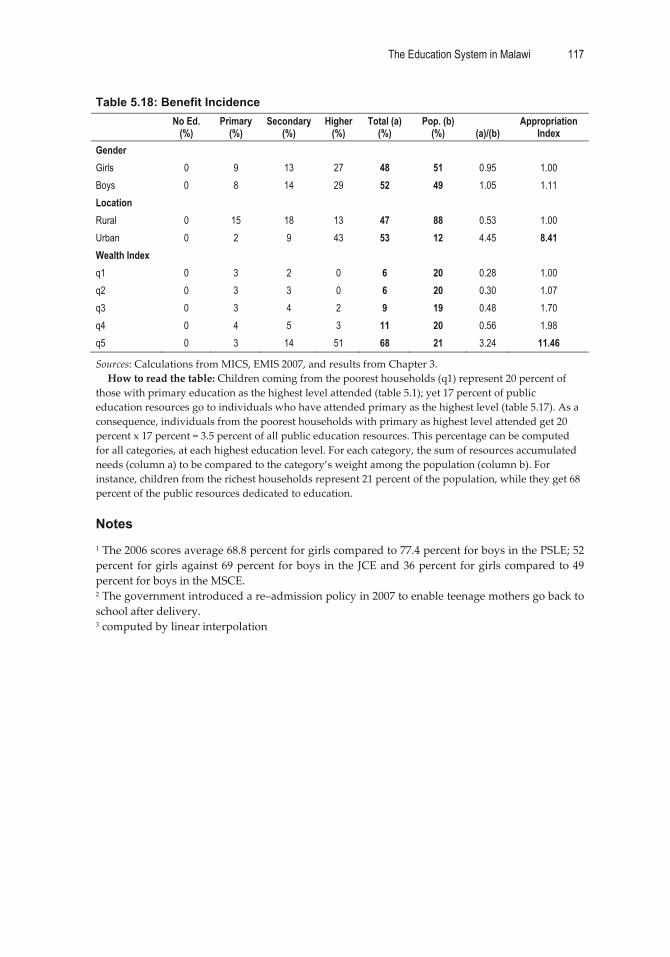
The Education System in Malawi 117
�
Table 5.18: Benefit Incidence
No Ed.
(%) Primary
(%) Secondary
(%) Higher
(%) Total (a)
(%) Pop. (b)
(%) (a)/(b) Appropriation
Index Gender Girls 0 9 13 27 48 51 0.95 1.00 Boys 0 8 14 29 52 49 1.05 1.11 Location Rural 0 15 18 13 47 88 0.53 1.00 Urban 0 2 9 43 53 12 4.45 8.41 Wealth Index q1 0 3 2 0 6 20 0.28 1.00 q2 0 3 3 0 6 20 0.30 1.07 q3 0 3 4 2 9 19 0.48 1.70 q4 0 4 5 3 11 20 0.56 1.98 q5 0 3 14 51 68 21 3.24 11.46
Sources:�Calculations�from�MICS,�EMIS�2007,�and�results�from�Chapter�3.�How�to�read�the�table:�Children�coming�from�the�poorest�households�(q1)�represent�20�percent�of�
those�with�primary�education�as�the�highest�level�attended�(table�5.1);�yet�17�percent�of�public�education�resources�go�to�individuals�who�have�attended�primary�as�the�highest�level�(table�5.17).�As�a�consequence,�individuals�from�the�poorest�households�with�primary�as�highest�level�attended�get�20�percent�x�17�percent�=�3.5�percent�of�all�public�education�resources.�This�percentage�can�be�computed�for�all�categories,�at�each�highest�education�level.�For�each�category,�the�sum�of�resources�accumulated�needs�(column�a)�to�be�compared�to�the�category’s�weight�among�the�population�(column�b).�For�instance,�children�from�the�richest�households�represent�21�percent�of�the�population,�while�they�get�68�percent�of�the�public�resources�dedicated�to�education.��
Notes�1�The�2006�scores�average�68.8�percent�for�girls�compared�to�77.4�percent�for�boys�in�the�PSLE;�52�percent� for�girls�against�69�percent� for�boys� in� the�JCE�and�36�percent� for�girls�compared�to�49�percent�for�boys�in�the�MSCE.�2�The�government�introduced�a�re–admission�policy�in�2007�to�enable�teenage�mothers�go�back�to�school�after�delivery.�3�computed�by�linear�interpolation�

118
CHAPTER �6 �
Technical,�Entrepreneurial,��and�Vocational�Education��
and�Training��
Summary of the Chapter
The�technical,�entrepreneurial,�and�vocational�education�and�training�(TEVET)�system�in�Malawi�is�highly�diverse,�fragmented,�and�uncoordinated,�with�multiple�private�and�public� provider� systems.� Access� to� the� regular� TEVET� programs—regulated� and�administered� by� the� TEVET�Authority� (TEVETA)� and� provided�mainly� as� four�year�apprenticeship� training—is� very� low� compared� to� the� demand.� The� training� in� the�formal� system� is�mainly� limited� to� traditional� technical� trades.� However,� additional�skill�development�opportunities�are�provided�by�other�ministries,�NGOs,�and�church�run�schools�in�the�private�training�market�and,�not�least,�by�companies�that�include�the�informal�sector�(mastercraftsman�training).��
As� far� as� the� formal� TEVET� system� is� concerned,� access� is� biased� against� girls,�those� from� poorer� districts� who� have� left� school,� and� those� with� lower� educational�attainment.�Regarding� the�gender�bias,� the�number�of�women� in� the�public� technical�colleges� (TCs)� is� slowly� increasing� to� 30� percent,� which� is� the� result� of� a� positive�discrimination� policy� administered� by� TEVETA.�Access� to� regular� TEVET� programs�has� recently� been� limited� to�MSCE�holders,� effectively� excluding� the�majority� of� the�country’s�youth�from�the�publicly�subsidized�general�TEVET�system.�
TEVET� is� funded� by�multiple� sources,� including� public� expenditure,� household�contributions,�and�investments�from�Malawi’s�business�sector.�Unit�public�allocation�to�TCs�is�not�related�to�actual�training�costs,�enrollment,�or�other�performance�indicators.�Private� contributions� to� TEVET� are� high� for� students� without� access� to� the� regular�TEVET�programs,�with�annual�tuition�fees�of�up�to�MK120,000.�The�TEVET�Fund�has�been� successful� at�mobilizing�more�private� sector� resources� for�TEVET.�Levy� income�from�private�companies�contributed�84�percent�of�the�entire�TEVET�Fund�in�2007.��
The� quality� of� TEVET� is� negatively� affected� by� multiple� factors,� including�inadequate� equipment� and� facilities,� a� shortage� of� training�material� due� to� financial�constraints,� a� high� trainee/teacher� ratio,� and� in� particular,� deficient� practical�competences� of� TEVET� teachers� coupled� with� the� absence� of� a� systematic� TEVET�teacher� training� system.�A� low�quality�of� training� leads� to� low�pass� rates� in�national�examinations� (50–67�percent).�The�most� important� impediment� to� sustainable�quality�

The Education System in Malawi 119
�
improvement�is�the�co�existence�of�the�three�local�qualification�systems:�trade�testing;�Malawi� (Advanced)� Craft� (MAC);� and� Competency�Based� Education� and� Training�(CBET),� which� is� implemented� by� TEVETA.� This� prevents� the� development� of� a�unified�employer�involved�quality�assurance�system�and�forces�teachers�to�train�on�the�basis�of�parallel�curricula.��
The�lack�of�clarity�about�the�division�of�roles�and�responsibilities�between�the�main�actors�(TEVETA;�the�Ministry�of�Education,�Science�and�Technology�[MOEST];�and�the�Ministry� of� Labor)� and�major� stakeholders� (such� as� the� private� sector)� is� one� of� the�most� important� reasons� why� a� further� implementation� of� the� agreed� TEVET� sector�reform�has�been�very�slow.� It�also�affects� the�status�of� the�public�TCs,�whose�current�scope� of� responsibility� is� not� appropriate� for� the� diverse� funding� and� program�structure�they�have�to�manage.��
*�*�*�
Introduction
The� training� supply� in� Malawi� is� diverse,� fragmented,� and� uncoordinated,� and�provided� through� various� public� and� private� provider� systems.� The�most� important�provider�types�are�briefly�described�in�Table�6.1.���Table 6.1: Synopsis of Different TEVET Provider Types in Malawi Provider Type Brief Description Provision/Qualifications Public formal TEVET: TEVET in public Technical Colleges
Provided in seven TCs, long-term pre-employment training courses form the core of the formal public training supply. These can be further divided into “regular” programs, which are the courses recruited for, sponsored by, and regulated by TEVETA, and which are mainly provided through apprenticeship. The so-called “parallel” programs, on the other hand, include mainly apprenticeship and non-apprenticeship courses offered by the public colleges on their own account and responsibility. Parallel programs also include a range of short-term courses. For regular students, boarding is provided.
TCs receive base funding from the public budget and program funding from TEVETA and charge trainees tuition fees.
Technical colleges are under the Ministry of Education.
Training is geared towards TEVETA CBET qualifications in the case of regular programs, and Malawi (Advanced) Craft and other qualifications in parallel programs.
Private provision: TEVET provided by NGOs and private commercial schools
This is by far the largest provider type, although the total number of institutions and enrollment is unknown. A preliminary provider directory from 1999 identified a total of 130 private and NGO-training providers enrolling close to 10,000 students.
Training institutions cater for a range of training fields that is much wider than the occupational groups provided in the public TCs. Training duration varies, however, many institutions offer formalized courses.
Private commercial institutions offer mainly cheap-to-train commercial trades (for example, accounting, management, secretarial, IT) and are concentrated in urban areas. However, the private training market also stretches into rural areas, and includes more traditional technical trades.
Training courses are financed by a combination of donor and private financing (fees) in the case of NGOs, and are usually fully privately financed (through fees) in the case of private commercial providers.
Schools are self-managed. Many, but not all, programs aim at preparing students for Trade Test, Malawi Craft and Advanced Craft certification examinations, and other international qualifications.
Schools also issue school certificates.
(Table�continues�on�next�page)�
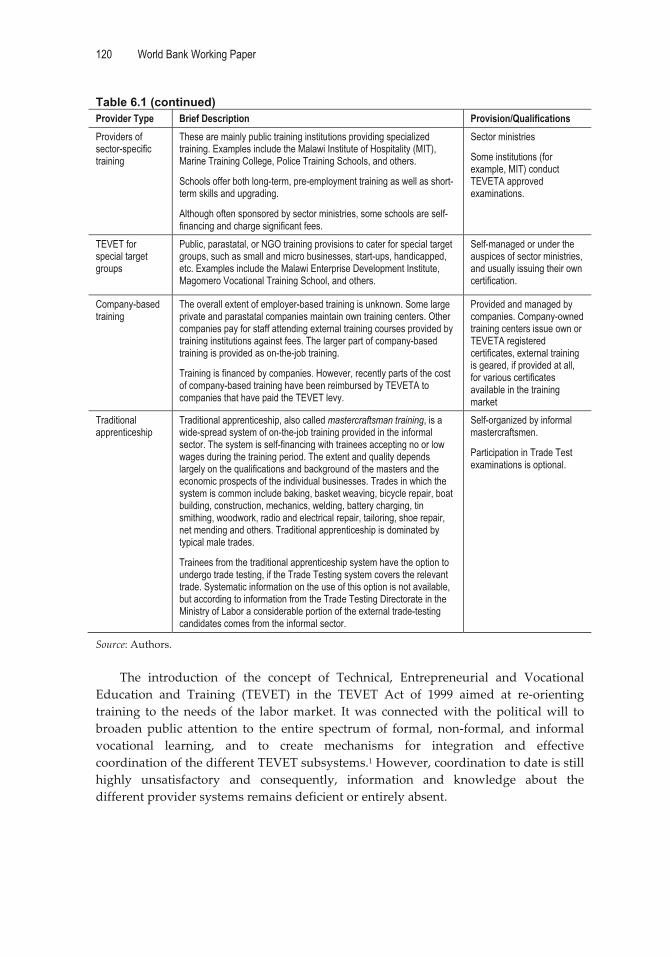
120 World Bank Working Paper
�
Table 6.1 (continued) Provider Type Brief Description Provision/Qualifications Providers of sector-specific training
These are mainly public training institutions providing specialized training. Examples include the Malawi Institute of Hospitality (MIT), Marine Training College, Police Training Schools, and others.
Schools offer both long-term, pre-employment training as well as short-term skills and upgrading.
Although often sponsored by sector ministries, some schools are self-financing and charge significant fees.
Sector ministries
Some institutions (for example, MIT) conduct TEVETA approved examinations.
TEVET for special target groups
Public, parastatal, or NGO training provisions to cater for special target groups, such as small and micro businesses, start-ups, handicapped, etc. Examples include the Malawi Enterprise Development Institute, Magomero Vocational Training School, and others.
Self-managed or under the auspices of sector ministries, and usually issuing their own certification.
Company-based training
The overall extent of employer-based training is unknown. Some large private and parastatal companies maintain own training centers. Other companies pay for staff attending external training courses provided by training institutions against fees. The larger part of company-based training is provided as on-the-job training.
Training is financed by companies. However, recently parts of the cost of company-based training have been reimbursed by TEVETA to companies that have paid the TEVET levy.
Provided and managed by companies. Company-owned training centers issue own or TEVETA registered certificates, external training is geared, if provided at all, for various certificates available in the training market
Traditional apprenticeship
Traditional apprenticeship, also called mastercraftsman training, is a wide-spread system of on-the-job training provided in the informal sector. The system is self-financing with trainees accepting no or low wages during the training period. The extent and quality depends largely on the qualifications and background of the masters and the economic prospects of the individual businesses. Trades in which the system is common include baking, basket weaving, bicycle repair, boat building, construction, mechanics, welding, battery charging, tin smithing, woodwork, radio and electrical repair, tailoring, shoe repair, net mending and others. Traditional apprenticeship is dominated by typical male trades.
Trainees from the traditional apprenticeship system have the option to undergo trade testing, if the Trade Testing system covers the relevant trade. Systematic information on the use of this option is not available, but according to information from the Trade Testing Directorate in the Ministry of Labor a considerable portion of the external trade-testing candidates comes from the informal sector.
Self-organized by informal mastercraftsmen.
Participation in Trade Test examinations is optional.
Source:�Authors.��
The� introduction� of� the� concept� of� Technical,� Entrepreneurial� and� Vocational�Education� and� Training� (TEVET)� in� the� TEVET� Act� of� 1999� aimed� at� re�orienting�training� to� the� needs� of� the� labor�market.� It�was� connected�with� the�political�will� to�broaden� public� attention� to� the� entire� spectrum� of� formal,� non�formal,� and� informal�vocational� learning,� and� to� create� mechanisms� for� integration� and� effective�coordination�of�the�different�TEVET�subsystems.1�However,�coordination�to�date�is�still�highly� unsatisfactory� and� consequently,� information� and� knowledge� about� the�different�provider�systems�remains�deficient�or�entirely�absent.��
The Education System in Malawi 121
�
This�chapter�provides�an�overview�of�the�basic�features�and�issues�of�the�Malawian�TEVET�system,�as� they�pertain� to�enrollment,�equity�of�access,� financing,�and�quality�and�management�issues.�Due�to�the�data�deficiencies,�most�of�the�analyses�are�focused�on� the� formal� public� TEVET� supply� and� those� TEVET� schemes� administered� or�facilitated�by�the�TEVET�Authority�(TEVETA).��
The� TEVET� system� is� supposed� to� specifically� prepare� (or� upgrade)� people� for�employment.� The� ultimate� benchmark� of� success� and� appropriateness� of� a� TEVET�system�is�therefore�its�external�efficiency�and�responsiveness�to�the�needs�of�the�labor�market.�This�issue,�however,�is�not�taken�up�in�this�chapter�but�in�Chapter�Eight,�which�is�devoted�to�the�external�efficiency�of�education.��
Enrollment
The�total�enrollment�in�the�TEVET�system�is�unknown.�It�is�apparent,�however,�that�the�publicly� financed� programs� provided� in� TCs� under� the� auspices� of� MOEST� and�TEVETA�only�cater�to�a�small�fraction�of�the�entire�training�supply�in�Malawi.�It�should�also�be�emphasized�that�even�in�the�formal�TEVET�segment,�data�are�subject�to�a�high�degree�of�uncertainty.2�
Regular Apprenticeship Training
The� core� of� the� public� formal� TEVET� supply� under� the� auspices� of� the� MOEST� is�provided�by�seven�public�technical�colleges�(TCs).�The�colleges�offer�two��to�four��year�training�programs�that�intend�to�provide�initial�(pre�employment)�vocational�training�to� school� leavers.� The� dominant� training� program� is� the� National� Apprenticeship�Program,� managed� and� subsidized� by� TEVETA.� Training� under� the� apprenticeship�program� is� organized� as� cooperative� training� between� the� colleges� and� companies,�with�one�year�of�initial�full�time�training�in�a�TC�followed�by�three�years�split�into�two�terms�of�in�company�training�and�one�term�of�college�instruction�each�year.��
At� the�moment,� the� regular� apprenticeship� system� only� provides� for� an� annual�intake� capacity� of� around� 700� apprentices� against� some� 10,000� applications.� In� 2007,�this�intake�represented�0.21�percent�of�the�relevant�age�group�(16�years)�and�3.9�percent�of�the�MSCE�graduates�of�the�previous�year.�Major�restrictions,�according�to�TEVETA,�include�capacities�in�the�TCs—notably�limitations�in�boarding�places,�the�availability�of�teachers� and� instructors,� and� most� importantly,� the� availability� of� apprenticeship�places�provided�by� the� industry.�Figure� 6.1� shows� the�development�of� annual� intake�into�the�regular�TEVETA�managed�apprenticeship�system�from�2001�to�2008.� In�2006,�all� training� capacities� in� the� TCs� were� redirected� to� regular� TEVETA�managed�programs,3�which�accounts�for�the�steep�increase�from�that�year�on.���
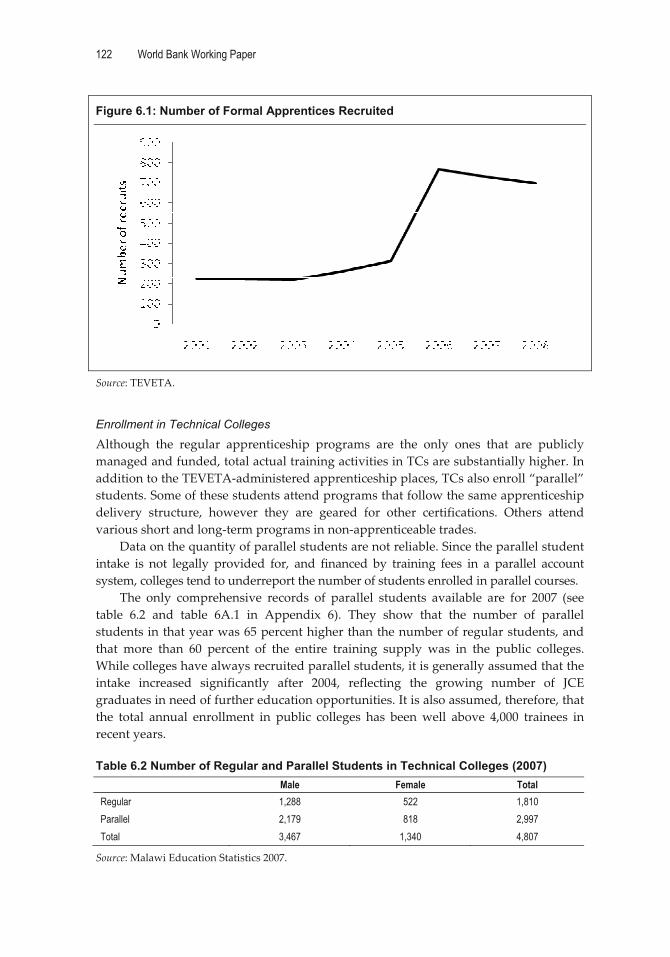
122 World Bank Working Paper
�
Figure 6.1: Number of Formal Apprentices Recruited
�
Source:�TEVETA.��
Enrollment in Technical Colleges
Although� the� regular� apprenticeship� programs� are� the� only� ones� that� are� publicly�managed�and�funded,�total�actual�training�activities�in�TCs�are�substantially�higher.�In�addition�to�the�TEVETA�administered�apprenticeship�places,�TCs�also�enroll�“parallel”�students.�Some�of�these�students�attend�programs�that�follow�the�same�apprenticeship�delivery� structure,� however� they� are� geared� for� other� certifications.� Others� attend�various�short�and�long�term�programs�in�non�apprenticeable�trades.��
Data�on�the�quantity�of�parallel�students�are�not�reliable.�Since�the�parallel�student�intake� is� not� legally� provided� for,� and� financed� by� training� fees� in� a� parallel� account�system,�colleges�tend�to�underreport�the�number�of�students�enrolled�in�parallel�courses.��
The� only� comprehensive� records� of� parallel� students� available� are� for� 2007� (see�table� 6.2� and� table� 6A.1� in� Appendix� 6).� They� show� that� the� number� of� parallel�students�in�that�year�was�65�percent�higher�than�the�number�of�regular�students,�and�that� more� than� 60� percent� of� the� entire� training� supply� was� in� the� public� colleges.�While�colleges�have�always�recruited�parallel�students,�it�is�generally�assumed�that�the�intake� increased� significantly� after� 2004,� reflecting� the� growing� number� of� JCE�graduates�in�need�of�further�education�opportunities.�It�is�also�assumed,�therefore,�that�the� total� annual� enrollment� in� public� colleges� has� been�well� above� 4,000� trainees� in�recent�years.���Table 6.2 Number of Regular and Parallel Students in Technical Colleges (2007)
Male Female Total Regular 1,288 522 1,810 Parallel 2,179 818 2,997 Total 3,467 1,340 4,807
Source:�Malawi�Education�Statistics�2007.��
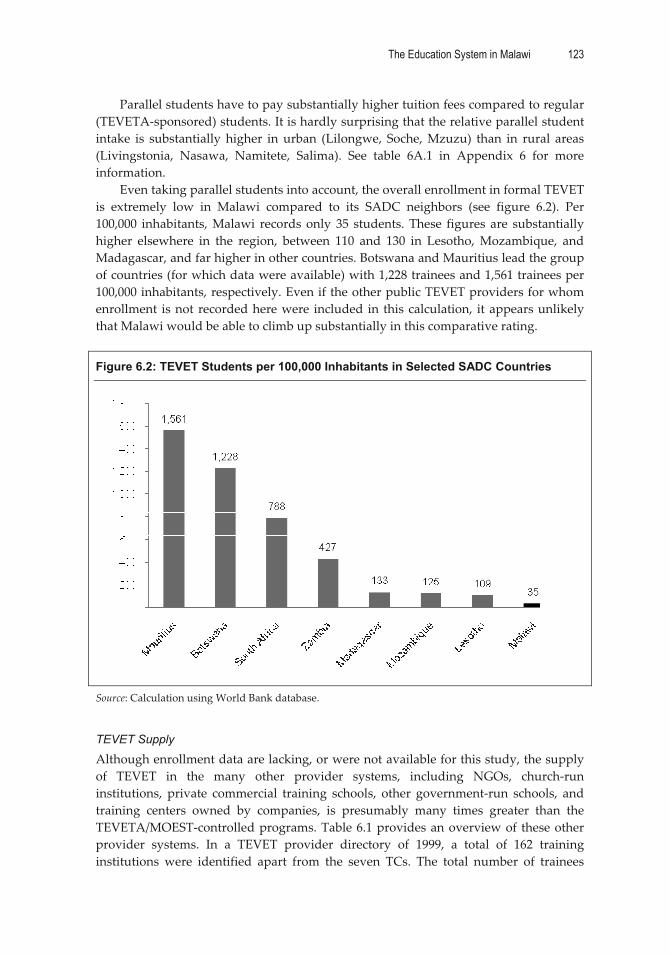
The Education System in Malawi 123
�
Parallel�students�have�to�pay�substantially�higher�tuition�fees�compared�to�regular�(TEVETA�sponsored)�students.�It�is�hardly�surprising�that�the�relative�parallel�student�intake� is� substantially� higher� in� urban� (Lilongwe,� Soche,�Mzuzu)� than� in� rural� areas�(Livingstonia,� Nasawa,� Namitete,� Salima).� See� table� 6A.1� in� Appendix� 6� for� more�information.��
Even�taking�parallel�students�into�account,�the�overall�enrollment�in�formal�TEVET�is� extremely� low� in� Malawi� compared� to� its� SADC� neighbors� (see� figure� 6.2).� Per�100,000� inhabitants,�Malawi� records�only� 35� students.�These� figures� are� substantially�higher� elsewhere� in� the� region,� between� 110� and� 130� in� Lesotho,�Mozambique,� and�Madagascar,�and�far�higher�in�other�countries.�Botswana�and�Mauritius�lead�the�group�of�countries�(for�which�data�were�available)�with�1,228�trainees�and�1,561�trainees�per�100,000�inhabitants,�respectively.�Even�if�the�other�public�TEVET�providers�for�whom�enrollment� is�not� recorded�here�were� included� in� this�calculation,� it�appears�unlikely�that�Malawi�would�be�able�to�climb�up�substantially�in�this�comparative�rating.���
Figure 6.2: TEVET Students per 100,000 Inhabitants in Selected SADC Countries
�Source:�Calculation�using�World�Bank�database.��
TEVET Supply
Although�enrollment�data�are�lacking,�or�were�not�available�for�this�study,�the�supply�of� TEVET� in� the� many� other� provider� systems,� including� NGOs,� church�run�institutions,� private� commercial� training� schools,� other� government�run� schools,� and�training� centers� owned� by� companies,� is� presumably� many� times� greater� than� the�TEVETA/MOEST�controlled�programs.�Table�6.1�provides�an�overview�of� these�other�provider� systems.� In� a� TEVET� provider� directory� of� 1999,� a� total� of� 162� training�institutions� were� identified� apart� from� the� seven� TCs.� The� total� number� of� trainees�
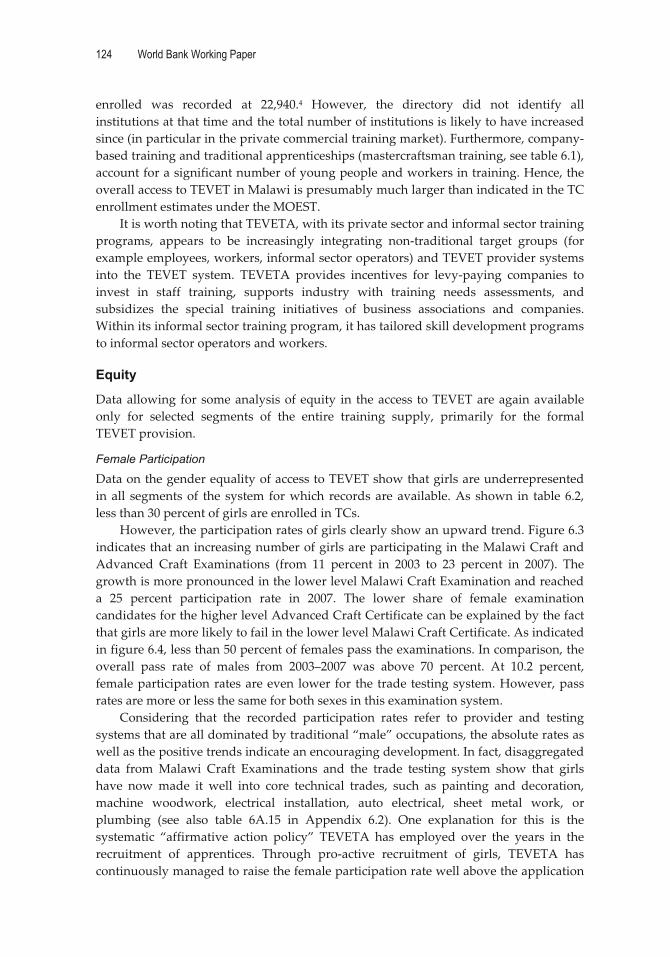
124 World Bank Working Paper
�
enrolled� was� recorded� at� 22,940.4� However,� the� directory� did� not� identify� all�institutions�at�that�time�and�the�total�number�of�institutions�is�likely�to�have�increased�since�(in�particular�in�the�private�commercial�training�market).�Furthermore,�company�based�training�and�traditional�apprenticeships�(mastercraftsman�training,�see�table�6.1),�account�for�a�significant�number�of�young�people�and�workers�in�training.�Hence,�the�overall�access�to�TEVET�in�Malawi�is�presumably�much�larger�than�indicated�in�the�TC�enrollment�estimates�under�the�MOEST.�
It�is�worth�noting�that�TEVETA,�with�its�private�sector�and�informal�sector�training�programs,� appears� to� be� increasingly� integrating� non�traditional� target� groups� (for�example�employees,�workers,�informal�sector�operators)�and�TEVET�provider�systems�into� the� TEVET� system.� TEVETA� provides� incentives� for� levy�paying� companies� to�invest� in� staff� training,� supports� industry� with� training� needs� assessments,� and�subsidizes� the� special� training� initiatives� of� business� associations� and� companies.�Within�its�informal�sector�training�program,�it�has�tailored�skill�development�programs�to�informal�sector�operators�and�workers.��
Equity
Data�allowing� for�some�analysis�of�equity� in� the�access� to�TEVET�are�again�available�only� for� selected� segments� of� the� entire� training� supply,� primarily� for� the� formal�TEVET�provision.�
Female Participation
Data�on�the�gender�equality�of�access�to�TEVET�show�that�girls�are�underrepresented�in�all� segments�of� the� system� for�which� records�are�available.�As� shown� in� table�6.2,�less�than�30�percent�of�girls�are�enrolled�in�TCs.��
However,�the�participation�rates�of�girls�clearly�show�an�upward�trend.�Figure�6.3�indicates�that�an�increasing�number�of�girls�are�participating�in�the�Malawi�Craft�and�Advanced� Craft� Examinations� (from� 11� percent� in� 2003� to� 23� percent� in� 2007).� The�growth�is�more�pronounced�in�the�lower�level�Malawi�Craft�Examination�and�reached�a� 25� percent� participation� rate� in� 2007.� The� lower� share� of� female� examination�candidates�for�the�higher�level�Advanced�Craft�Certificate�can�be�explained�by�the�fact�that�girls�are�more�likely�to�fail�in�the�lower�level�Malawi�Craft�Certificate.�As�indicated�in�figure�6.4,�less�than�50�percent�of�females�pass�the�examinations.�In�comparison,�the�overall� pass� rate� of� males� from� 2003–2007� was� above� 70� percent.� At� 10.2� percent,�female�participation�rates�are�even� lower�for� the� trade�testing�system.�However,�pass�rates�are�more�or�less�the�same�for�both�sexes�in�this�examination�system.�
Considering� that� the� recorded� participation� rates� refer� to� provider� and� testing�systems�that�are�all�dominated�by�traditional�“male”�occupations,�the�absolute�rates�as�well�as�the�positive�trends�indicate�an�encouraging�development.�In�fact,�disaggregated�data� from�Malawi� Craft� Examinations� and� the� trade� testing� system� show� that� girls�have� now�made� it� well� into� core� technical� trades,� such� as� painting� and� decoration,�machine� woodwork,� electrical� installation,� auto� electrical,� sheet� metal� work,� or�plumbing� (see� also� table� 6A.15� in� Appendix� 6.2).� One� explanation� for� this� is� the�systematic� “affirmative� action� policy”� TEVETA� has� employed� over� the� years� in� the�recruitment� of� apprentices.� Through� pro�active� recruitment� of� girls,� TEVETA� has�continuously�managed�to�raise�the�female�participation�rate�well�above�the�application�
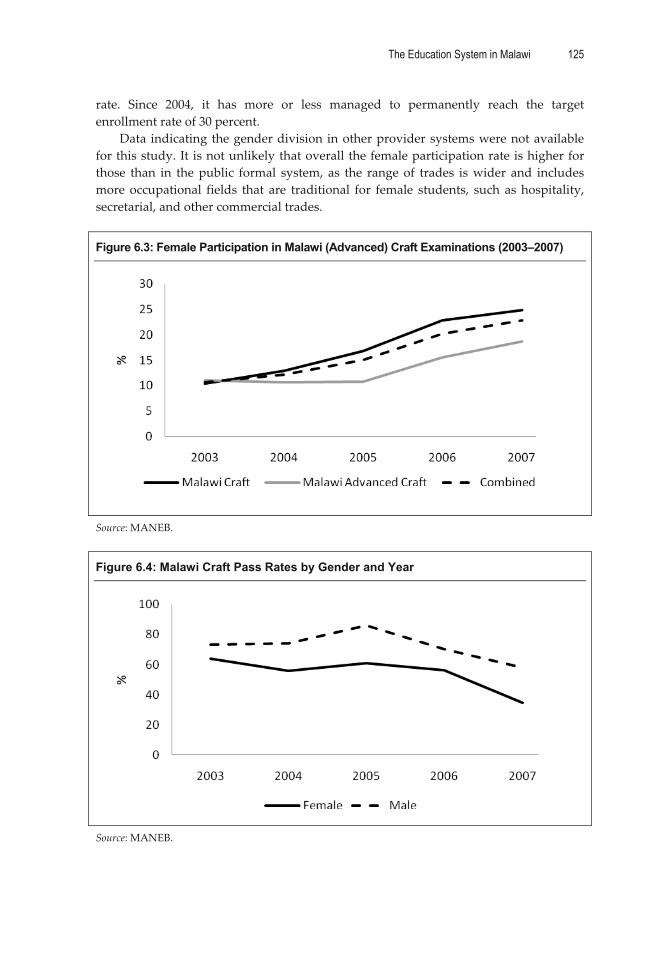
The Education System in Malawi 125
�
rate.� Since� 2004,� it� has� more� or� less� managed� to� permanently� reach� the� target�enrollment�rate�of�30�percent.��
Data� indicating�the�gender�division� in�other�provider�systems�were�not�available�for�this�study.�It� is�not�unlikely�that�overall�the�female�participation�rate�is�higher�for�those� than� in� the�public� formal� system,� as� the� range�of� trades� is�wider� and� includes�more�occupational� fields� that� are� traditional� for� female� students,� such� as�hospitality,�secretarial,�and�other�commercial�trades.��
Figure 6.3: Female Participation in Malawi (Advanced) Craft Examinations (2003–2007)
�
Source:�MANEB.��
Figure 6.4: Malawi Craft Pass Rates by Gender and Year
�Source:�MANEB.�
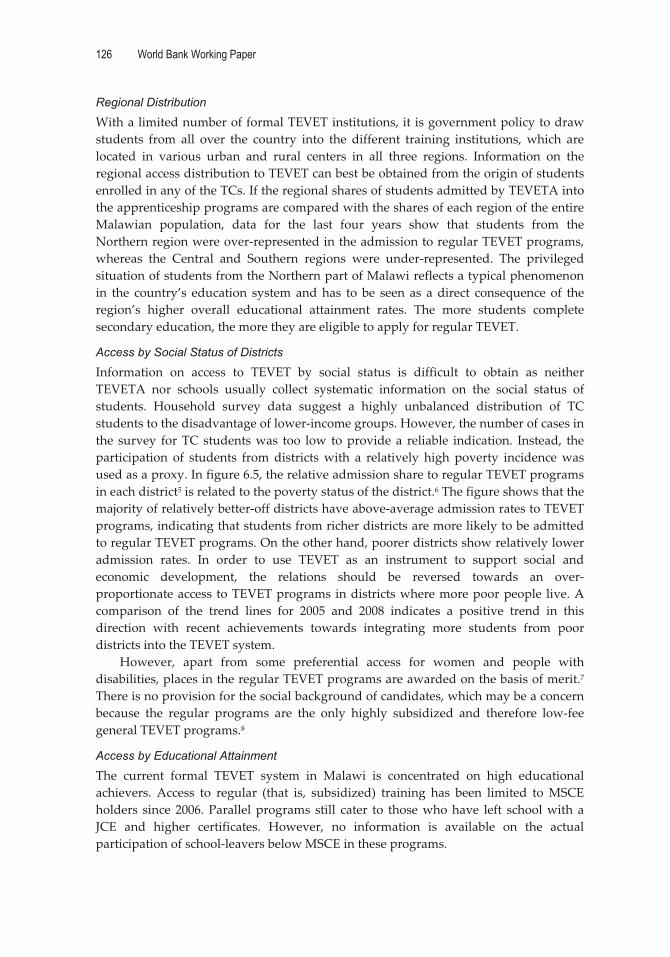
126 World Bank Working Paper
�
Regional Distribution
With�a�limited�number�of�formal�TEVET�institutions,�it�is�government�policy�to�draw�students� from� all� over� the� country� into� the� different� training� institutions,�which� are�located� in� various� urban� and� rural� centers� in� all� three� regions.� Information� on� the�regional�access�distribution�to�TEVET�can�best�be�obtained�from�the�origin�of�students�enrolled�in�any�of�the�TCs.�If�the�regional�shares�of�students�admitted�by�TEVETA�into�the�apprenticeship�programs�are�compared�with�the�shares�of�each�region�of�the�entire�Malawian� population,� data� for� the� last� four� years� show� that� students� from� the�Northern�region�were�over�represented�in�the�admission�to�regular�TEVET�programs,�whereas� the� Central� and� Southern� regions� were� under�represented.� The� privileged�situation�of�students�from�the�Northern�part�of�Malawi�reflects�a�typical�phenomenon�in� the� country’s� education� system�and�has� to� be� seen� as� a� direct� consequence� of� the�region’s� higher� overall� educational� attainment� rates.� The� more� students� complete�secondary�education,�the�more�they�are�eligible�to�apply�for�regular�TEVET.��
Access by Social Status of Districts
Information� on� access� to� TEVET� by� social� status� is� difficult� to� obtain� as� neither�TEVETA� nor� schools� usually� collect� systematic� information� on� the� social� status� of�students.� Household� survey� data� suggest� a� highly� unbalanced� distribution� of� TC�students�to�the�disadvantage�of�lower�income�groups.�However,�the�number�of�cases�in�the� survey� for�TC� students�was� too� low� to�provide�a� reliable� indication.� Instead,� the�participation� of� students� from�districts�with� a� relatively� high� poverty� incidence�was�used�as�a�proxy.�In�figure�6.5,�the�relative�admission�share�to�regular�TEVET�programs�in�each�district5�is�related�to�the�poverty�status�of�the�district.6�The�figure�shows�that�the�majority�of�relatively�better�off�districts�have�above�average�admission�rates�to�TEVET�programs,�indicating�that�students�from�richer�districts�are�more�likely�to�be�admitted�to�regular�TEVET�programs.�On�the�other�hand,�poorer�districts�show�relatively�lower�admission� rates.� In� order� to� use� TEVET� as� an� instrument� to� support� social� and�economic� development,� the� relations� should� be� reversed� towards� an� over�proportionate�access� to�TEVET�programs� in�districts�where�more�poor�people� live.�A�comparison� of� the� trend� lines� for� 2005� and� 2008� indicates� a� positive� trend� in� this�direction� with� recent� achievements� towards� integrating� more� students� from� poor�districts�into�the�TEVET�system.��
However,� apart� from� some� preferential� access� for� women� and� people� with�disabilities,�places�in�the�regular�TEVET�programs�are�awarded�on�the�basis�of�merit.7�There�is�no�provision�for�the�social�background�of�candidates,�which�may�be�a�concern�because� the� regular� programs� are� the� only� highly� subsidized� and� therefore� low�fee�general�TEVET�programs.8��
Access by Educational Attainment
The� current� formal� TEVET� system� in� Malawi� is� concentrated� on� high� educational�achievers.� Access� to� regular� (that� is,� subsidized)� training� has� been� limited� to�MSCE�holders� since� 2006.�Parallel� programs� still� cater� to� those�who�have� left� school�with�a�JCE� and� higher� certificates.� However,� no� information� is� available� on� the� actual�participation�of�school�leavers�below�MSCE�in�these�programs.���
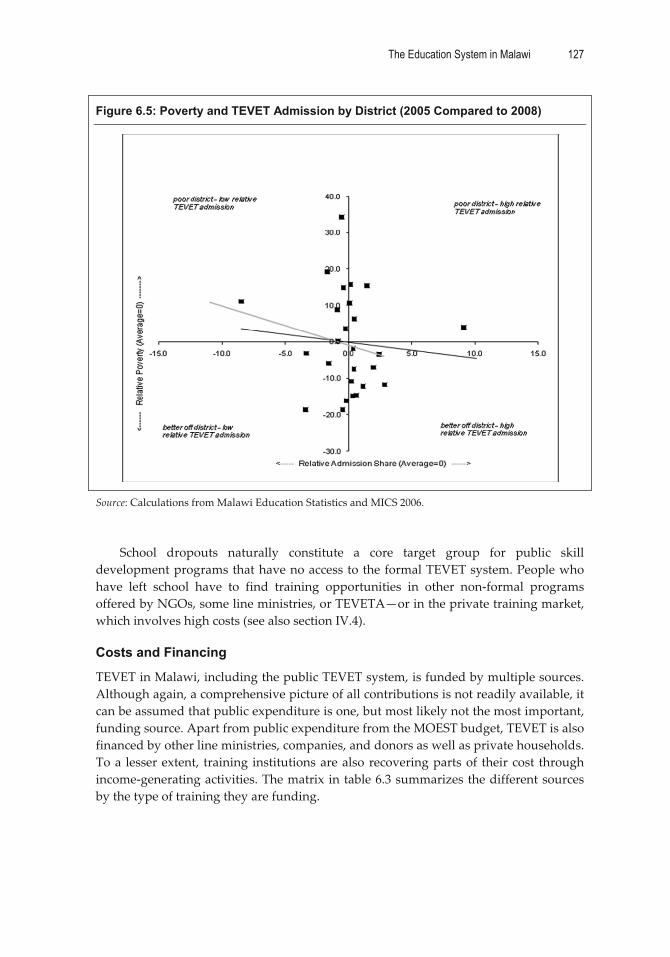
The Education System in Malawi 127
�
Figure 6.5: Poverty and TEVET Admission by District (2005 Compared to 2008)
�
Source:�Calculations�from�Malawi�Education�Statistics�and�MICS�2006.����
School� dropouts� naturally� constitute� a� core� target� group� for� public� skill�development�programs�that�have�no�access�to�the�formal�TEVET�system.�People�who�have� left� school� have� to� find� training� opportunities� in� other� non�formal� programs�offered�by�NGOs,�some�line�ministries,�or�TEVETA—or�in�the�private�training�market,�which�involves�high�costs�(see�also�section�IV.4).�
Costs and Financing
TEVET�in�Malawi,�including�the�public�TEVET�system,�is�funded�by�multiple�sources.�Although�again,�a�comprehensive�picture�of�all�contributions�is�not�readily�available,�it�can�be�assumed�that�public�expenditure�is�one,�but�most�likely�not�the�most�important,�funding�source.�Apart�from�public�expenditure�from�the�MOEST�budget,�TEVET�is�also�financed�by�other�line�ministries,�companies,�and�donors�as�well�as�private�households.�To�a� lesser�extent,� training� institutions�are�also�recovering�parts�of� their�cost� through�income�generating�activities.�The�matrix�in�table�6.3�summarizes�the�different�sources�by�the�type�of�training�they�are�funding.���
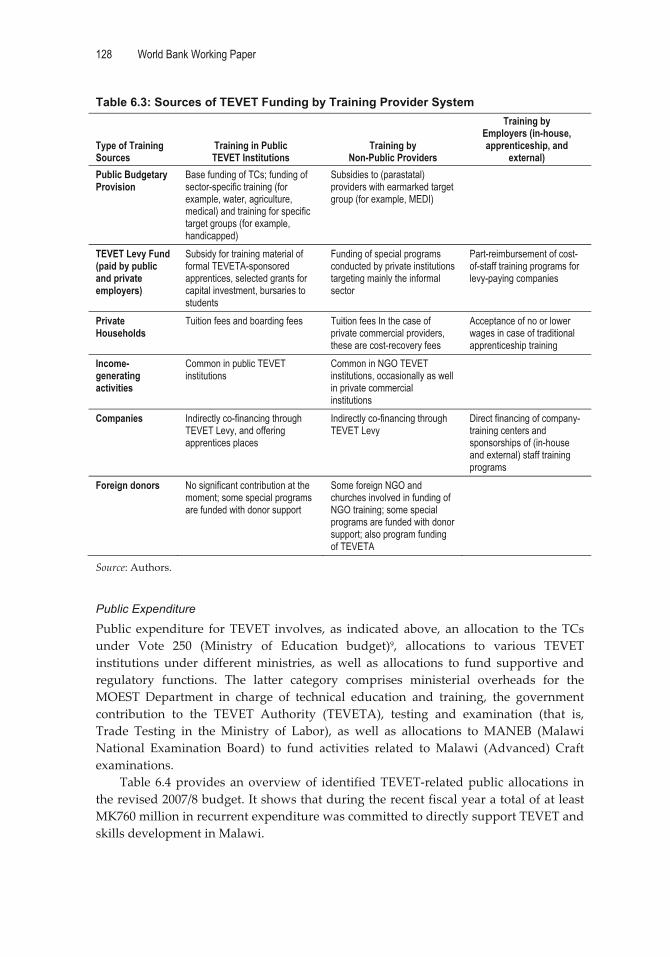
128 World Bank Working Paper
�
Table 6.3: Sources of TEVET Funding by Training Provider System
Type of Training Sources
Training in Public TEVET Institutions
Training by Non-Public Providers
Training by Employers (in-house, apprenticeship, and
external) Public Budgetary Provision
Base funding of TCs; funding of sector-specific training (for example, water, agriculture, medical) and training for specific target groups (for example, handicapped)
Subsidies to (parastatal) providers with earmarked target group (for example, MEDI)
TEVET Levy Fund (paid by public and private employers)
Subsidy for training material of formal TEVETA-sponsored apprentices, selected grants for capital investment, bursaries to students
Funding of special programs conducted by private institutions targeting mainly the informal sector
Part-reimbursement of cost-of-staff training programs for levy-paying companies
Private Households
Tuition fees and boarding fees Tuition fees In the case of private commercial providers, these are cost-recovery fees
Acceptance of no or lower wages in case of traditional apprenticeship training
Income-generating activities
Common in public TEVET institutions
Common in NGO TEVET institutions, occasionally as well in private commercial institutions
Companies Indirectly co-financing through TEVET Levy, and offering apprentices places
Indirectly co-financing through TEVET Levy
Direct financing of company-training centers and sponsorships of (in-house and external) staff training programs
Foreign donors No significant contribution at the moment; some special programs are funded with donor support
Some foreign NGO and churches involved in funding of NGO training; some special programs are funded with donor support; also program funding of TEVETA
Source:�Authors.��
Public Expenditure
Public� expenditure� for� TEVET� involves,� as� indicated� above,� an� allocation� to� the�TCs�under� Vote� 250� (Ministry� of� Education� budget)9,� allocations� to� various� TEVET�institutions� under� different�ministries,� as�well� as� allocations� to� fund� supportive� and�regulatory� functions.� The� latter� category� comprises� ministerial� overheads� for� the�MOEST� Department� in� charge� of� technical� education� and� training,� the� government�contribution� to� the� TEVET� Authority� (TEVETA),� testing� and� examination� (that� is,�Trade� Testing� in� the� Ministry� of� Labor),� as� well� as� allocations� to� MANEB� (Malawi�National� Examination� Board)� to� fund� activities� related� to�Malawi� (Advanced)� Craft�examinations.�
Table� 6.4�provides� an�overview�of� identified�TEVET�related�public� allocations� in�the�revised�2007/8�budget.�It�shows�that�during�the�recent�fiscal�year�a�total�of�at�least�MK760�million�in�recurrent�expenditure�was�committed�to�directly�support�TEVET�and�skills�development�in�Malawi.���
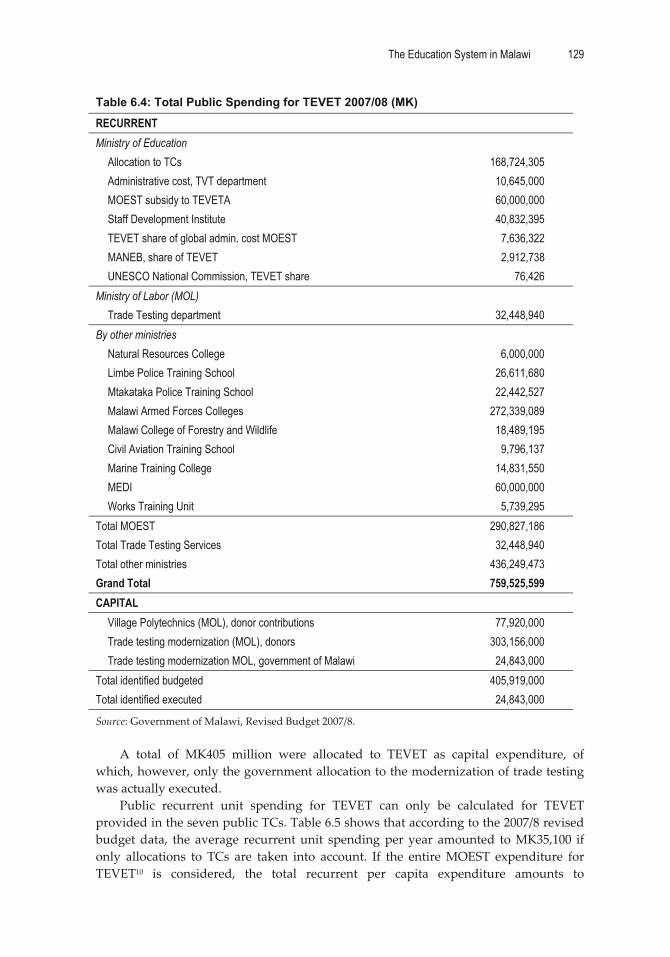
The Education System in Malawi 129
�
Table 6.4: Total Public Spending for TEVET 2007/08 (MK)
RECURRENT Ministry of Education
Allocation to TCs 168,724,305 Administrative cost, TVT department 10,645,000 MOEST subsidy to TEVETA 60,000,000 Staff Development Institute 40,832,395 TEVET share of global admin. cost MOEST 7,636,322 MANEB, share of TEVET 2,912,738 UNESCO National Commission, TEVET share 76,426
Ministry of Labor (MOL) Trade Testing department 32,448,940
By other ministries Natural Resources College 6,000,000 Limbe Police Training School 26,611,680 Mtakataka Police Training School 22,442,527 Malawi Armed Forces Colleges 272,339,089 Malawi College of Forestry and Wildlife 18,489,195 Civil Aviation Training School 9,796,137 Marine Training College 14,831,550 MEDI 60,000,000 Works Training Unit 5,739,295
Total MOEST 290,827,186 Total Trade Testing Services 32,448,940 Total other ministries 436,249,473 Grand Total 759,525,599 CAPITAL
Village Polytechnics (MOL), donor contributions 77,920,000 Trade testing modernization (MOL), donors 303,156,000 Trade testing modernization MOL, government of Malawi 24,843,000
Total identified budgeted 405,919,000 Total identified executed 24,843,000
Source:�Government�of�Malawi,�Revised�Budget�2007/8.��
A� total� of� MK405� million� were� allocated� to� TEVET� as� capital� expenditure,� of�which,�however,�only�the�government�allocation�to�the�modernization�of�trade�testing�was�actually�executed.��
Public� recurrent� unit� spending� for� TEVET� can� only� be� calculated� for� TEVET�provided�in�the�seven�public�TCs.�Table�6.5�shows�that�according�to�the�2007/8�revised�budget�data,� the� average� recurrent�unit� spending�per� year� amounted� to�MK35,100� if�only� allocations� to� TCs� are� taken� into� account.� If� the� entire�MOEST� expenditure� for�TEVET10� is� considered,� the� total� recurrent� per� capita� expenditure� amounts� to�
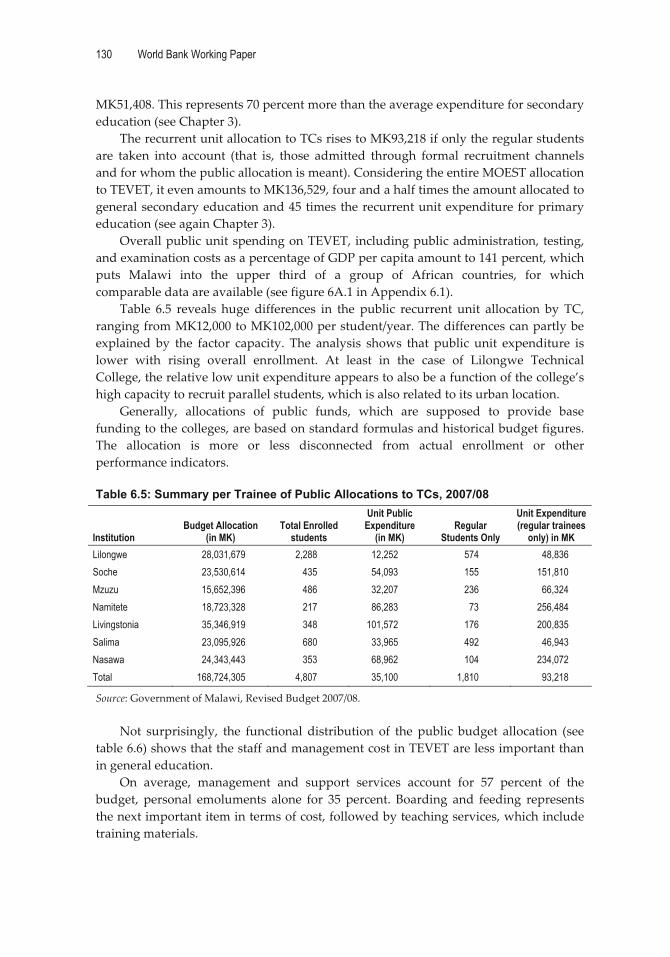
130 World Bank Working Paper
�
MK51,408.�This�represents�70�percent�more�than�the�average�expenditure�for�secondary�education�(see�Chapter�3).��
The�recurrent�unit�allocation�to�TCs�rises�to�MK93,218�if�only�the�regular�students�are� taken� into� account� (that� is,� those� admitted� through� formal� recruitment� channels�and�for�whom�the�public�allocation�is�meant).�Considering�the�entire�MOEST�allocation�to�TEVET,�it�even�amounts�to�MK136,529,�four�and�a�half�times�the�amount�allocated�to�general�secondary�education�and�45�times�the�recurrent�unit�expenditure�for�primary�education�(see�again�Chapter�3).�
Overall�public�unit�spending�on�TEVET,� including�public�administration,� testing,�and�examination�costs�as�a�percentage�of�GDP�per�capita�amount�to�141�percent,�which�puts� Malawi� into� the� upper� third� of� a� group� of� African� countries,� for� which�comparable�data�are�available�(see�figure�6A.1�in�Appendix�6.1).��
Table� 6.5� reveals� huge� differences� in� the� public� recurrent� unit� allocation� by� TC,�ranging�from�MK12,000�to�MK102,000�per�student/year.�The�differences�can�partly�be�explained� by� the� factor� capacity.� The� analysis� shows� that� public� unit� expenditure� is�lower� with� rising� overall� enrollment.� At� least� in� the� case� of� Lilongwe� Technical�College,�the�relative�low�unit�expenditure�appears�to�also�be�a�function�of�the�college’s�high�capacity�to�recruit�parallel�students,�which�is�also�related�to�its�urban�location.��
Generally,� allocations� of� public� funds,� which� are� supposed� to� provide� base�funding�to�the�colleges,�are�based�on�standard�formulas�and�historical�budget�figures.�The� allocation� is� more� or� less� disconnected� from� actual� enrollment� or� other�performance�indicators.���Table 6.5: Summary per Trainee of Public Allocations to TCs, 2007/08
Institution Budget Allocation
(in MK) Total Enrolled
students
Unit Public Expenditure
(in MK) Regular
Students Only
Unit Expenditure (regular trainees
only) in MK Lilongwe 28,031,679 2,288 12,252 574 48,836 Soche 23,530,614 435 54,093 155 151,810 Mzuzu 15,652,396 486 32,207 236 66,324 Namitete 18,723,328 217 86,283 73 256,484 Livingstonia 35,346,919 348 101,572 176 200,835 Salima 23,095,926 680 33,965 492 46,943 Nasawa 24,343,443 353 68,962 104 234,072 Total 168,724,305 4,807 35,100 1,810 93,218
Source:�Government�of�Malawi,�Revised�Budget�2007/08.��
Not� surprisingly,� the� functional� distribution� of� the� public� budget� allocation� (see�table�6.6)�shows�that�the�staff�and�management�cost�in�TEVET�are�less�important�than�in�general�education.��
On� average,� management� and� support� services� account� for� 57� percent� of� the�budget,� personal� emoluments� alone� for� 35� percent.� Boarding� and� feeding� represents�the�next�important�item�in�terms�of�cost,�followed�by�teaching�services,�which�include�training�materials.��
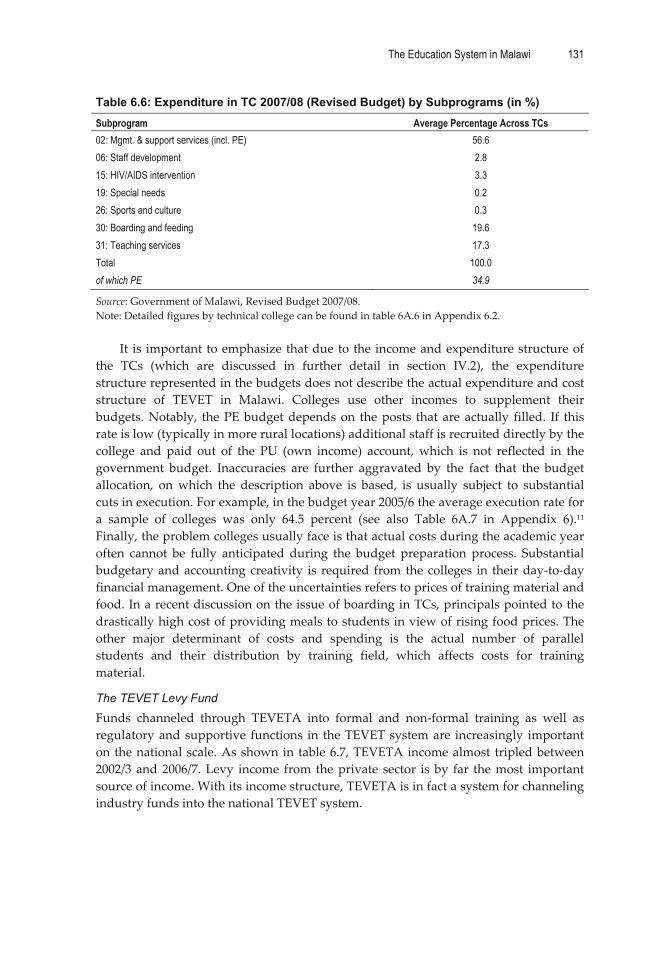
The Education System in Malawi 131
�
Table 6.6: Expenditure in TC 2007/08 (Revised Budget) by Subprograms (in %) Subprogram Average Percentage Across TCs 02: Mgmt. & support services (incl. PE) 56.6 06: Staff development 2.8 15: HIV/AIDS intervention 3.3 19: Special needs 0.2 26: Sports and culture 0.3 30: Boarding and feeding 19.6 31: Teaching services 17.3 Total 100.0 of which PE 34.9
Source:�Government�of�Malawi,�Revised�Budget�2007/08.�Note:�Detailed�figures�by�technical�college�can�be�found�in�table�6A.6�in�Appendix�6.2.��
It� is� important�to�emphasize�that�due�to�the� income�and�expenditure�structure�of�the� TCs� (which� are� discussed� in� further� detail� in� section� IV.2),� the� expenditure�structure�represented�in�the�budgets�does�not�describe�the�actual�expenditure�and�cost�structure� of� TEVET� in� Malawi.� Colleges� use� other� incomes� to� supplement� their�budgets.�Notably,� the�PE�budget�depends�on� the�posts� that�are�actually� filled.� If� this�rate�is�low�(typically�in�more�rural�locations)�additional�staff�is�recruited�directly�by�the�college� and� paid� out� of� the� PU� (own� income)� account,�which� is� not� reflected� in� the�government� budget.� Inaccuracies� are� further� aggravated� by� the� fact� that� the� budget�allocation,� on�which� the� description� above� is� based,� is� usually� subject� to� substantial�cuts�in�execution.�For�example,�in�the�budget�year�2005/6�the�average�execution�rate�for�a� sample� of� colleges� was� only� 64.5� percent� (see� also� Table� 6A.7� in� Appendix� 6).11�Finally,�the�problem�colleges�usually�face�is�that�actual�costs�during�the�academic�year�often� cannot� be� fully� anticipated� during� the� budget� preparation� process.� Substantial�budgetary�and�accounting�creativity� is� required� from�the�colleges� in� their�day�to�day�financial�management.�One�of�the�uncertainties�refers�to�prices�of�training�material�and�food.�In�a�recent�discussion�on�the�issue�of�boarding�in�TCs,�principals�pointed�to�the�drastically�high�cost�of�providing�meals�to�students�in�view�of�rising�food�prices.�The�other� major� determinant� of� costs� and� spending� is� the� actual� number� of� parallel�students� and� their� distribution� by� training� field,� which� affects� costs� for� training�material.�
The TEVET Levy Fund
Funds� channeled� through� TEVETA� into� formal� and� non�formal� training� as� well� as�regulatory�and�supportive� functions� in� the�TEVET�system�are� increasingly� important�on�the�national�scale.�As�shown�in� table�6.7,�TEVETA�income�almost� tripled�between�2002/3�and�2006/7.�Levy� income� from� the�private� sector� is� by� far� the�most� important�source�of�income.�With�its�income�structure,�TEVETA�is�in�fact�a�system�for�channeling�industry�funds�into�the�national�TEVET�system.��
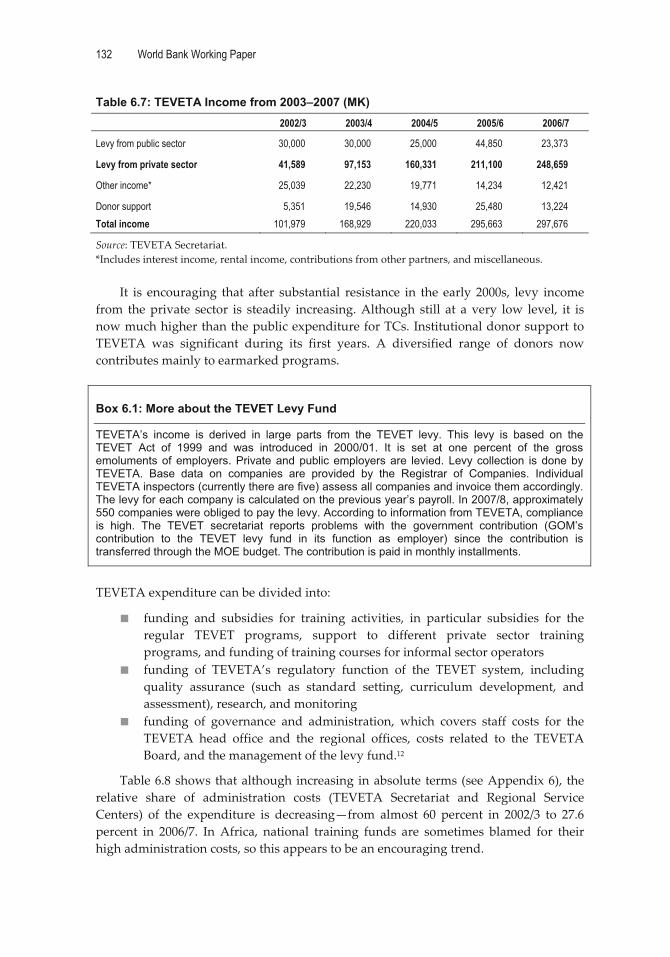
132 World Bank Working Paper
�
Table 6.7: TEVETA Income from 2003–2007 (MK)
2002/3 2003/4 2004/5 2005/6 2006/7
Levy from public sector 30,000 30,000 25,000 44,850 23,373
Levy from private sector 41,589 97,153 160,331 211,100 248,659
Other income* 25,039 22,230 19,771 14,234 12,421
Donor support 5,351 19,546 14,930 25,480 13,224 Total income 101,979 168,929 220,033 295,663 297,676
Source:�TEVETA�Secretariat.�*Includes�interest�income,�rental�income,�contributions�from�other�partners,�and�miscellaneous.��
It� is� encouraging� that� after� substantial� resistance� in� the� early� 2000s,� levy� income�from� the�private� sector� is� steadily� increasing.�Although� still� at� a� very� low� level,� it� is�now�much�higher�than�the�public�expenditure�for�TCs.�Institutional�donor�support�to�TEVETA� was� significant� during� its� first� years.� A� diversified� range� of� donors� now�contributes�mainly�to�earmarked�programs.���
Box 6.1: More about the TEVET Levy Fund
TEVETA’s income is derived in large parts from the TEVET levy. This levy is based on the TEVET Act of 1999 and was introduced in 2000/01. It is set at one percent of the gross emoluments of employers. Private and public employers are levied. Levy collection is done by TEVETA. Base data on companies are provided by the Registrar of Companies. Individual TEVETA inspectors (currently there are five) assess all companies and invoice them accordingly. The levy for each company is calculated on the previous year’s payroll. In 2007/8, approximately 550 companies were obliged to pay the levy. According to information from TEVETA, compliance is high. The TEVET secretariat reports problems with the government contribution (GOM’s contribution to the TEVET levy fund in its function as employer) since the contribution is transferred through the MOE budget. The contribution is paid in monthly installments.
�TEVETA�expenditure�can�be�divided�into:�
� funding� and� subsidies� for� training� activities,� in� particular� subsidies� for� the�regular� TEVET� programs,� support� to� different� private� sector� training�programs,�and�funding�of�training�courses�for�informal�sector�operators�
� funding� of� TEVETA’s� regulatory� function� of� the� TEVET� system,� including�quality� assurance� (such� as� standard� setting,� curriculum� development,� and�assessment),�research,�and�monitoring�
� funding� of� governance� and� administration,� which� covers� staff� costs� for� the�TEVETA� head� office� and� the� regional� offices,� costs� related� to� the� TEVETA�Board,�and�the�management�of�the�levy�fund.12��
Table�6.8�shows�that�although�increasing� in�absolute� terms�(see�Appendix�6),� the�relative� share� of� administration� costs� (TEVETA� Secretariat� and� Regional� Service�Centers)� of� the� expenditure� is� decreasing—from� almost� 60� percent� in� 2002/3� to� 27.6�percent� in� 2006/7.� In�Africa,� national� training� funds� are� sometimes� blamed� for� their�high�administration�costs,�so�this�appears�to�be�an�encouraging�trend.���
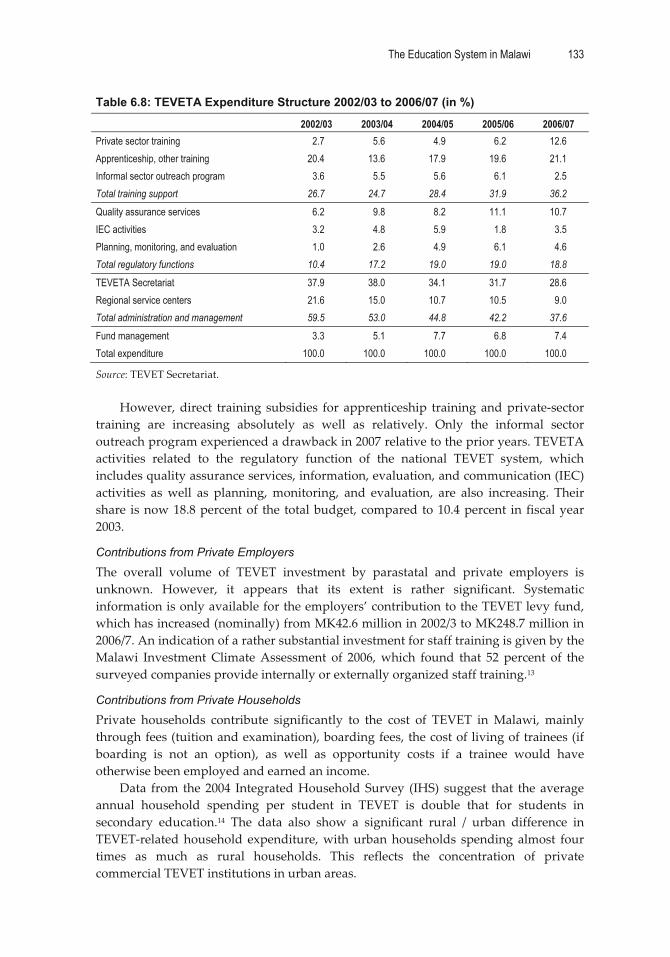
The Education System in Malawi 133
�
Table 6.8: TEVETA Expenditure Structure 2002/03 to 2006/07 (in %)
2002/03 2003/04 2004/05 2005/06 2006/07 Private sector training 2.7 5.6 4.9 6.2 12.6 Apprenticeship, other training 20.4 13.6 17.9 19.6 21.1 Informal sector outreach program 3.6 5.5 5.6 6.1 2.5 Total training support 26.7 24.7 28.4 31.9 36.2
Quality assurance services 6.2 9.8 8.2 11.1 10.7 IEC activities 3.2 4.8 5.9 1.8 3.5 Planning, monitoring, and evaluation 1.0 2.6 4.9 6.1 4.6 Total regulatory functions 10.4 17.2 19.0 19.0 18.8
TEVETA Secretariat 37.9 38.0 34.1 31.7 28.6 Regional service centers 21.6 15.0 10.7 10.5 9.0 Total administration and management 59.5 53.0 44.8 42.2 37.6
Fund management 3.3 5.1 7.7 6.8 7.4 Total expenditure 100.0 100.0 100.0 100.0 100.0
Source:�TEVET�Secretariat.��
However,�direct� training� subsidies� for� apprenticeship� training�and�private�sector�training� are� increasing� absolutely� as� well� as� relatively.� Only� the� informal� sector�outreach�program�experienced�a�drawback�in�2007�relative�to�the�prior�years.�TEVETA�activities� related� to� the� regulatory� function� of� the� national� TEVET� system,� which�includes�quality�assurance�services,�information,�evaluation,�and�communication�(IEC)�activities� as�well� as� planning,�monitoring,� and� evaluation,� are� also� increasing.� Their�share� is�now�18.8�percent�of� the� total�budget,� compared� to�10.4�percent� in� fiscal�year�2003.��
Contributions from Private Employers
The� overall� volume� of� TEVET� investment� by� parastatal� and� private� employers� is�unknown.� However,� it� appears� that� its� extent� is� rather� significant.� Systematic�information�is�only�available�for�the�employers’�contribution�to�the�TEVET�levy�fund,�which�has�increased�(nominally)�from�MK42.6�million�in�2002/3�to�MK248.7�million�in�2006/7.�An�indication�of�a�rather�substantial�investment�for�staff�training�is�given�by�the�Malawi� Investment�Climate�Assessment� of� 2006,�which� found� that� 52� percent� of� the�surveyed�companies�provide�internally�or�externally�organized�staff�training.13��
Contributions from Private Households
Private� households� contribute� significantly� to� the� cost� of� TEVET� in�Malawi,� mainly�through�fees�(tuition�and�examination),�boarding�fees,�the�cost�of�living�of�trainees�(if�boarding� is� not� an� option),� as� well� as� opportunity� costs� if� a� trainee� would� have�otherwise�been�employed�and�earned�an�income.�
Data� from� the�2004� Integrated�Household�Survey� (IHS)� suggest� that� the� average�annual� household� spending� per� student� in� TEVET� is� double� that� for� students� in�secondary� education.14� The� data� also� show� a� significant� rural� /� urban� difference� in�TEVET�related�household� expenditure,�with�urban�households� spending� almost� four�times� as� much� as� rural� households.� This� reflects� the� concentration� of� private�commercial�TEVET�institutions�in�urban�areas.��
134 World Bank Working Paper
�
Tuition� fees� vary� substantially� between� public,� private� non�commercial,� and�private�for�profit� institutions,� and� depend� on� the� training� program.� In� the� formal�TEVET�programs�provided�in�the�TCs,�private�contributions�are�highly�differentiated�according�to�the�status�of�the�students—whether�they�are�regular�(TEVETA�sponsored)�apprentices�or�parallel�students�recruited�directly�by�the�colleges.�In�private�for�profit�institutions,�as�well�as�in�non�subsidized�public�and�non�commercial�institutions,�fees�are�usually�charged�on�a�cost�recovery�basis.�This�normally�equals�the�full�training�cost�(after� the�deduction�of� institutional� income� through�production).� Fees� in� this�TEVET�market�segment�vary�substantially.�Tuition�fees�per�annum�of�between�MK22,500�and�MK120,000�were�established�in�recent�visits�to�training�institutions.��
TEVET�programs�provided�by�NGOs�and� church�related� institutions� are�usually�less� expensive� for�private�households.�However,�with� few�exceptions,� all� institutions�charge�at�least�a�commitment�fee.�Fees�in�visited�institutions�ranged�from�MK10,000�to�MK28,000� per� annum.� In� non�governmental� institutions,� boarding� is� normally� not�available�(again�with�a�few�exceptions).�
If�training�is�geared�towards�formal�qualification,�additional�examination�fees�are�charged.�These�currently�range�between�MK750�(Trade�Test�1)�and�MK2,500�(Malawi�Advanced�Craft).�See�table�6A.9�in�Appendix�6.��
The Total Income of Technical Colleges and Full Unit Cost
It�was�not�possible�to�calculate�the�unit�cost�of�training�in�any�of�the�different�TEVET�provider� systems� in�Malawi� by� taking� the� contributions� of� all� funding� sources� into�account.� Such� a� calculation� would� have� required� the� comprehensive� budgets� of�individual�institutions�and�training�institutions�were�generally�not�prepared�to�provide�access�to�such�financial�data.�Even�the�MOEST�lacks�any�information�about�income�and�the�comprehensive�budget�of�the�technical�colleges,�which�operate�under�it.��
Principally,� TCs� obtain� funding� from� the� following� sources� managed� through�three�different�accounts�(box�6A.1�in�Appendix�6.1):�
� MOEST�(up�to�2005�MOLVT)�subsidy�to�recurrent�cost�� capital�budget�subsidy�from�MOEST�(formerly�MOLVT)�� contributions�made�to�the�recurrent�cost�of�regular�apprenticeship�training�by�
the� TEVET� Fund;� this� contribution,�which� currently� represents� a� lump� sum�across� all� trade� subsidy,� is� accounted� for� separately� and�not� included� in� the�public�budget�of�TCs�
� possibly,�albeit�rarely,�capital�budget�subsidies�from�TEVETA�� income�from�training�fees�for�regular�and�parallel�trainees15�� income� from� commercial� activities,� which� include� “training� consultancies”�
(different� tailor�made� training� programs� fully� paid� by� clients,� which� are�companies� or� other� organizations),� and� other� commercial� activities�(production).�
Lilongwe� Technical� College� is� the� only� public� TEVET� institution� under�MOEST�that�has�provided�some�information�about�its�income�structure.�In�2007/8,�it�received�37�percent�of�its�total�budget�from�MOEST�subsidies.�Less�than�7�percent�were�subsidies�from� TEVETA� and� around� 56� percent� was� generated� through� fees� and� other�commercial� income� of� the� college.� In� total,� this� added� up� to� a� consolidated� annual�
The Education System in Malawi 135
�
recurrent�unit�spending�of�MK46,511,�almost�four�times�higher�than�the�public�subsidy�(see�table�6.5).�Lilongwe�Technical�College’s�data�may�not�be�generalized,�however,�as�the�college�is�able�to�recruit�a�particularly�high�number�of�parallel�students�and�has�an�overall�high�enrollment� that�presumably� results� in�a�much�better� capacity�utilization�than� other� public� TCs.� Scattered� information� from� other� (including� non�public)�training�institutions�that�were�visited�indicates�a�unit�spending�of�around�MK100,000�to�MK200,000�per�annum,16�which�is�generally�much�higher.��
TEVETA� has� started� to� update� unit� cost� data� by� assessing� the� cost� for� training�materials� for� different� occupational� areas,� in� accordance�with� the�CBET� curricula,� to�form�a�future�revision�of� the�TEVETA�per�capita�subsidies�for�regular�apprenticeship�students.�The�total�annuals�found�in�the�study�range�from�MK22,000�to�MK131,000�per�student,�which�in�most�cases�represents�substantially�more�than�the�current�lump�sum�subsidy�of�MK12,000�per�term�across�trades�(Maganga,�2008).�
Internal Efficiency and Quality
In�the�following�section,�available�data�on�the�external�efficiency�of�the�TEVET�system�will� be� examined,� as� well� as� the� factors� affecting� TEVET� quality,� which� can� be�considered�a�cause�of�the�efficiency�problems�observed.��
Internal Efficiency Indicators
Examination�Results,�Dropouts,�and�Repetition�Examination�results�are�among�the�few�systematically�recorded�indicators�for�TEVET’s�internal� efficiency� in�Malawi.� Information� is� available� for� the�MANEB�based�Malawi�(Advanced)�Craft�(MAC)�system�and�for�the�Ministry�of�Labor�administered�National�Trade�Testing�(NTT)�system,�both�of�which�only�target�traditional�technical�trades.��
The�overall�pass�rate�for�MAC�examinations�over�the�last�five�years�for�which�data�were� available� (2003–� 2007)�was� 67.2�percent,� almost� the� same�as� for� the� lower� level�Malawi�Craft�(67�percent)�and�the�higher�level�Malawi�Advanced�Craft�(67.7�percent),�which� indicates� that� more� than� 30� percent� of� the� candidates� do� not� reach� their�educational� goals� after� two� and� four� years� of� training,� respectively.� The� situation� is�even� more� worrisome� for� the� trade� testing� system,� where� only� an� average� of� 52.8�percent�of�students�passed�the�tests�over�the�last�five�years.17��
Results� in� the�MAC�examinations�vary� substantially�by� training� institution,�with�differences� between� the� rates� of� individual� institutions� of� 27� percent� (Malawi� Craft)�and�20�percent�(Malawi�Advanced�Craft).�The�situation�is�similar�for�the�trade�testing�system.� Overall,� however,� those� who� have� completed� training� programs� in� TEVET�institutions�have�a�much�better� success� rate� (57�percent)� than�external� candidates� (40�percent).18��
Substantial� differences� in� examination� results� occur� also� between� the� different�trades� (figure� 6.6).�Again,� the� findings�would�merit� a�more� thorough�analysis,� but� it�can� seen� that� pass� rates� are� particularly� low� in� the� trades� such� as� electrical� and�mechanical,�for�which�training�delivery�is�more�expensive.���
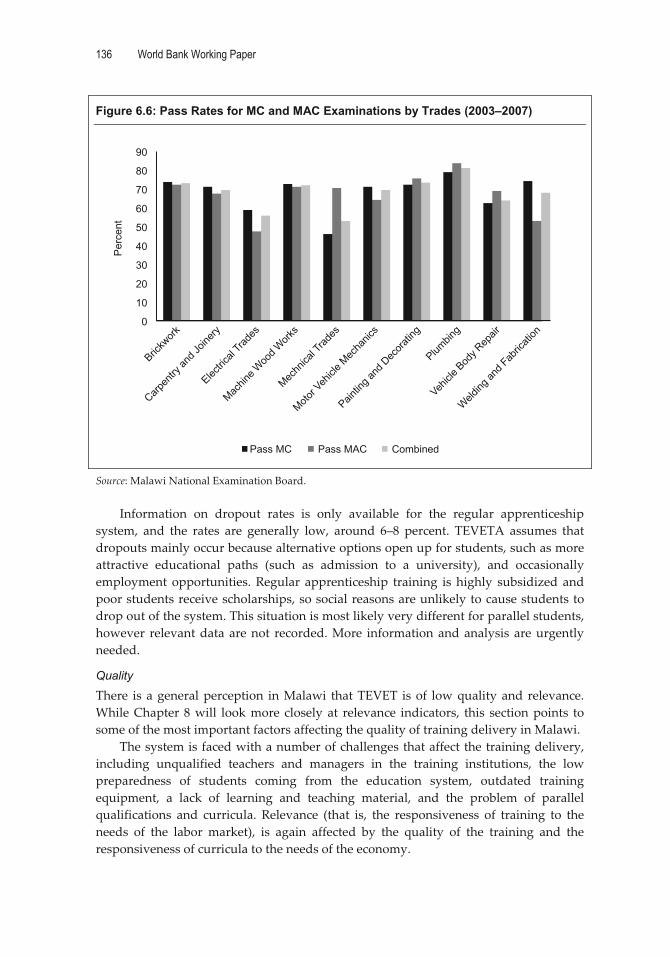
136 World Bank Working Paper
�
Figure 6.6: Pass Rates for MC and MAC Examinations by Trades (2003–2007)
Brickw
ork
Welding
and F
abric
ation
Vehicl
e Bod
y Rep
air
Plumbin
g
Paintin
g and
Dec
oratin
g
Motor V
ehicl
e Mec
hanic
s
Mechn
ical T
rades
Machin
e Woo
d Work
s
Electric
al Tra
des
Carpen
try an
d Join
ery
Pass MC Pass MAC Combined
Per
cent
0
10
20
30
40
50
60
70
80
90
�Source:�Malawi�National�Examination�Board.��
Information� on� dropout� rates� is� only� available� for� the� regular� apprenticeship�system,� and� the� rates� are� generally� low,� around� 6–8� percent.� TEVETA� assumes� that�dropouts�mainly�occur�because�alternative�options�open�up�for�students,�such�as�more�attractive� educational� paths� (such� as� admission� to� a� university),� and� occasionally�employment� opportunities.�Regular� apprenticeship� training� is� highly� subsidized� and�poor�students�receive�scholarships,�so�social�reasons�are�unlikely�to�cause�students�to�drop�out�of�the�system.�This�situation�is�most�likely�very�different�for�parallel�students,�however� relevant�data�are�not� recorded.�More� information�and�analysis�are�urgently�needed.��
Quality
There� is� a�general�perception� in�Malawi� that�TEVET� is�of� low�quality�and� relevance.�While�Chapter�8�will� look�more� closely� at� relevance� indicators,� this� section�points� to�some�of�the�most�important�factors�affecting�the�quality�of�training�delivery�in�Malawi.��
The�system�is�faced�with�a�number�of�challenges�that�affect�the�training�delivery,�including� unqualified� teachers� and� managers� in� the� training� institutions,� the� low�preparedness� of� students� coming� from� the� education� system,� outdated� training�equipment,� a� lack� of� learning� and� teaching� material,� and� the� problem� of� parallel�qualifications� and� curricula.� Relevance� (that� is,� the� responsiveness� of� training� to� the�needs� of� the� labor� market),� is� again� affected� by� the� quality� of� the� training� and� the�responsiveness�of�curricula�to�the�needs�of�the�economy.��

The Education System in Malawi 137
�
Parallel�Qualifications�and�Curricula�One�of�the�major�problems�of�quality�assurance�in�the�Malawian�TEVET�system�is�the�co�existence� of� three� different� Malawian,� and� a� range� of� foreign,� qualification�assessment�systems�(see�box�6.2).�The�situation�seriously�affects�the�quality�of�training�because�of�the�following:�
� Teachers� and� instructors� have� to� teach� according� to� different� curricula� or�parallel� training�plans,� often� in� the� same� class�or�group,� in�order� to�prepare�students�for�different�qualifications.�
� The� murky� state� of� the� TEVET� qualification� system� prevents� the� needed�revision� and� updating� of� the� curricula.� Only� the� new� CBET� qualifications,�recently� defined� with� the� involvement� of� employers,� reflect� the� skill�requirements� of� today’s� labor� market.� However,� the� coverage� of� this� new�system� is� limited� because� it� is� restricted� to� regular� training� programs.� The�other�two�Malawian�qualification�systems�(MAC�and�in�particular,�NTT),�have�not�been�revised�or�updated�for�many�years,�pending�a� final�decision�on�the�integration�path�towards�one�unified�Malawian�TEVET�qualification�system.�
��
Box 6.2: The Malawian TEVET Landscape—A Jungle of Qualifications and Programs
In various attempts over the last decades to consolidate and nationalize TEVET qualifications in Malawi, new qualification systems and principles were added without removing the old ones. Furthermore, as a result of the limited scope and credibility of Malawian qualifications, a significant range of foreign qualifications have also been established in the market.
At the moment, three different national assessment and certification systems co-exist:
1. The three-level National Trade Testing (NTT) System is administered by the Trade Testing Department of the Ministry of Labor. It is the oldest system in Malawi, well known by industry, and recognized in the public salary and national minimum wage scale. Assessment comprises a theory and a practical part, but it is generally perceived to have an emphasis on practical competence. Trade testing is an open assessment and certification scheme, therefore admission to the trade testing system does not require prior attendance in a specified training program. So-called external candidates who work in industry and may never have attended formal training sit for testing along with trainees from various public and private training institutions.
2. The two-tiered Malawi Craft/Advanced Craft system is administered by the Ministry of Education and its examination body, MANEB. The system was developed in the 1980s in an attempt to indigenize the British City & Guilds qualifications, which were previously used as the target qualifications of the National Apprenticeship System. Malawi Craft/Advanced Craft struggled for a long time to receive formal recognition in the public salary and minimum wage scales, which seriously affected its appeal to students. Unlike the NTT system, the Malawi Craft/Advanced Craft system is program-based. Qualifications require the completion of two (Malawi Craft) or four (Malawi Advanced Craft) years of formal training, provided mainly in public and private institutions and implemented as apprenticeship training.
(Box�continues�on�next�page)�
138 World Bank Working Paper
�
Box 6.2 (continued)
3. The new four-level credit-point based CBET system was introduced in 2005 by TEVETA and is currently only used as the target qualification of formal TEVETA-sponsored apprentices and recently, also selected non-apprenticeable training programs for TEVETA-sponsored trainees, for instance for secretarial studies and tailoring. The original intent behind the introduction of the CBET system was to create a unified, integrated TEVET qualification system for Malawi that was in line with the envisaged SADC qualification framework. CBET was meant to eventually replace the Malawi Craft/Advanced Craft and NTT systems. However, although modular and competency-based according to the design principle, CBET certification at the moment requires attendance in a specified training program. In most cases, a CBET qualification requires a certain amount of regulated industrial modules, making it in effect inaccessible to non-TEVETA students. The CBET qualification has recently been gazetted, however is not yet recognized by public salary and minimum wage scales.
In addition to these three, a substantial number of external, foreign qualifications are offered in the Malawi training market. City & Guilds, administered in Malawi by the British Council, is one of the most common, but various others are also offered, in particular in the commercial, accountancy, and IT occupational areas, such as Pitman, PAEC, and CISCO. Furthermore, many training institutions, in particular in the non-public training market, offer in-house certificates after attendance in various long- and short-term training programs.
Principally, a range of local qualifications complemented with international ones are a common pattern reflecting the multiple needs in the labor market. In Malawi, however, the parallel national qualification structure in the mainstream segment of TEVET engenders substantial irritation and a lack of transparency in the labor market. It also causes unnecessary efforts and costs for students.
Training institutions have in the past reacted to the situation with a pragmatic approach. They may offer students preparation for multiple testing, often within the same training programs. The so-called “parallel” apprenticeship students in the public TCs, for example, follow the Malawi Craft/Advanced Craft curriculum, undergo the MANEB examinations, and almost always sit at the same time for the National Trade Tests to maximize their employment chances after graduation. In the course of a four-year apprenticeship program, the normal students collect five different qualifications in two different qualification systems. If resources allow, individual students also try to additionally master the external (and costly) City & Guilds examinations, assuming this will provide an added advantage in the labor market. The situation is also complicated in the case of the TEVETA-sponsored apprenticeship trainees since 2005. They are trained, mainly in public TCs (and often in the same classes with the parallel students), and assessed according to the new CBET system and explicitly discouraged to sit for the other available exams. However, as colleges explained to us, these students also prefer to secure at least NTT qualification and thus “secretly” register as external candidates in the trade testing centers.
Source: Authors.
�In� order� to� solve� the� issue� of� parallel� qualifications,� the� government� has� made�
preparations�to�hold�consultative�meetings�with�all�concerned�stakeholders.��
Parallel�Students�As�previously�indicated,�enrollment�in�parallel�programs�has�increased�substantially�in�recent� years.� Colleges� take� in� additional� parallel� students� to� accommodate� an�increasing�demand�for�training�and�to�supplement�institutional�income.�However,�(as�indicated� in� figure� 6.7),� the� parallel� intake� has� created� an� additional� burden� for� the�teaching� staff� of� most� TCs.� Furthermore,� as� visits� to� training� institutions� suggest,�training� resources� such�as� equipment� and� tools,� training�materials,� and�even�kitchen�facilities� are� not� proportionately� increased,� which� leads� to� a� lower� per� trainee�availability�of�already�scarce�resources.�

The Education System in Malawi 139
�
Figure 6.7: STRs in TCs for Regular Programs and Total Enrollment (2007) S
TR
0
10
20
30
40
50
60
70
80
Soche
Namite
te
Lilon
gwe
Living
stonia
Mzuzu
Nasaw
a
Salima
Averag
e
Regular programs Full enrollment �Source:�MOEST�Teachers�Records;�Education�Statistics�2007.�Note:�The�STR�for�regular�programs�pairs�regular�students�with�formally�recruited�teachers,�while�the�STR�for�full�enrollment�puts�together�all�(regular�and�parallel)�students�with�the�total�number�of�teachers�and�training,�including�establishment�and�part�time�teachers�hired�through�the�PU�account.��
The�Availability�and�Qualifications�of�Technical�Teachers/Instructors�and�Managers�The� quality� of� training� delivery� is� also� negatively� affected� by� the� inadequate�availability� and� lack� of� appropriate� qualifications� and� competences� of� technical�teachers�and�instructors.��
Data�on�employed�teachers�and�vacancies�in�public�TCs�suggest�a�severe�shortage�of� teachers.�Available�data� for� the� second� term�of� the� academic�year� 2007� show� that�only�55�percent�of�all�teaching�positions�listed�in�the�establishment�were�actually�filled.�Rates� of� establishment� posts� filled� between� the� individual� training� institutions� vary�enormously,� ranging� from� 24� percent� for� Salima� Technical� College� to� 85� percent� for�Lilongwe.� Some,� however� not� all,� of� the� vacancies� are� filled� with� contract� teachers�hired�directly�by�the�colleges�through�the�PU�budget.�The�establishment�is�based�on�the�capacities�for�formal�students,�while�actual�enrollment�is�much�higher�through�parallel�students.��
Figure� 6.7� shows� huge� differences� in� the� student/teacher� ratio� in� the� individual�TCs.�Salima�Technical�College�appeared�to�face�a�serious�situation�in�2007:�The�overall�ratio�(that�is,�government�employed�plus�PU�teachers�against�the�entire�enrollment�of�regular�and�parallel�students)�was�above�30:1�on�average,�far�above�the�recommended�rate� of� 7:1,19� and� a� rate� at� which� practical� training� can� no� longer� be� meaningfully�delivered.�
Available� TEVET� teachers� are� often� inadequately� qualified� and� overwhelmingly�not� appropriately� competent.�Malawi� so� far�does�not�have� a�TEVET� teacher� training�institution.��

140 World Bank Working Paper
�
Table 6.9: Qualifications of Teachers in TCs (2007) Highest qualification % of all regular teachers in TCs Bachelor of Science in Technical Education 50.9 Diploma in Technical Education 36.6 Certificate in Technical Education 10.7 Others 1.8 Total 100.0
Source:�Education�Statistics�2007.��
Instructors� in� TEVET� institutions� are� usually� graduates� from� the� Malawi�Polytechnic� (MP)� or� graduates� from� technical� colleges.� The� MP� offers� tertiary�education� in� technical� and� vocational� education� intended� for� teachers� of� practical�subjects� in� secondary� schools.� However,� the� MP’s� training� is� rather� theoretical� and�does�not�create�competent�hands�on�teachers�for�the�TEVET�system.�The�consequence�is�an�overemphasis�of�theoretical�training�in�technical�colleges.��
Table�6.9� shows� that�among� the� teachers� formally� recruited�by�government,� 86.5�percent�can�be�classified�as�qualified�according�to�existing�standards,�which�require�at�least� a� diploma.� For� underqualified� (regular)� teachers,� the�GoM� as�well� as� TEVETA�provide�upgrading�courses,�partly�in�cooperation�with�foreign�partners.�A�major�effort�to� further� develop� TEVET� teacher� training� is� currently� being� undertaken� jointly� by�TEVETA� and� the�MP�with� assistance� from� the� Canadian� International�Development�Agency�(CIDA).�
During� interviews,� however,� colleges� complained� that� often� these� teachers,�who�are� recruited� and�placed� by� the� government,�were� inappropriately� qualified� because�they�were�qualified�for�technical�or�academic�subjects�that�are�different�from�the�ones�actually�needed�in�school.��
No� information� about� competences� and� qualifications� is� available� for� the� 30�percent�of�teachers�in�TCs�who�are�directly�recruited�by�the�colleges.�
Equipment�and�Facilities��Equipment� is�not� sufficiently�available�and� is�often�outdated,�which� is�another�cause�for� low�training�quality.�Most�of� the�equipment�found�in�public�TCs�was�donated�by�the� British� government� in� the� early� 1980s,� when� the� apprenticeship� system� was�introduced.� In� an� attempt� to� address� the� problem,� the� government� has� plans� to�purchase�modern�training�equipment�for�all�public�colleges,�and�procurement�plans�for�fiscal� year� 2008/9�worth� some�US$4�million� are� under� preparation.� Some� equipment�has�also�been�procured�by�TEVETA,�or�donated�by�private�companies�and�occasionally�foreign�donors.��
Apprenticeship�Management�Industrial�attachment�is�a�basic�principle�and�mandatory�in�the�apprenticeship�training�system� from�year� two�onwards.� It� exposes� trainees� to�modern�equipment� that� is�not�available� in� training� institutions� and� to�work� ethics� and� routines.� Since� the� curricula�are� based� on� the� cooperative� training� approach� between� colleges� and� companies,�failure� to� secure� apprenticeship� places� seriously� affects� the� training� quality� and�relevance.� TEVETA� records� show� that� overall,� regularly� recruited� students� were�

The Education System in Malawi 141
�
successfully�provided�with� attachment�places� in� recent�years.� Since� 2001,� attachment�rates� have� been� well� above� 80� percent� and� have� sometimes� reached� 90� percent20.�Students� who� do� not� find� apprenticeship� places� are� usually� able� to� undergo� the�practice� modules� required� in� the� colleges;� however,� they� lack� the� advantages� of�industrial�exposure.��
The� situation� looks� substantially� different� in� the� case� of� parallel� students.� They�have� to� find� attachment� places� mainly� on� their� own.� Places,� however,� are� rare� and�already�a�restricting�factor�in�the�regular�apprenticeship�system.�The�attachment�places�that� parallel� students�manage� to� obtain� are�more� often� found� in� smaller� companies,�which�may�have� less� training�resources�and�equipment.�Although�precise� figures�are�not�available,� the�TEVETA�Labor�Market�Survey,�as�well�as� information�provided�by�TCs,� suggests� a�much� lower� attachment� rate� for� parallel� students.� Furthermore,� the�industrial�attachment�practice� is�not�managed�and�supervised�by�TEVETA,�as� it� is� in�the�case�of�regular�students.��
Quality�Assurance��To�date,�the�Malawian�TEVET�system�lacks�an�appropriate�and�comprehensive�quality�assurance� mechanism.� Quality� assurance� in� TEVET� usually� comprises� appropriate�assessment�systems�and�accreditation�(preferably�oriented�towards�facilitating�quality�management� at� school� level),� as�well� as� quality� control�mechanisms�within�provider�systems.��
TEVETA� is� currently� in� the�process�of�building�up�a�modern,� competency�based�assessment�system.�Implementation�has�just�started�and�so�far�only�covers�the�minority�of�regular�apprentices.��
The�two�most�important�assessment�systems,�MAC�and�NTT,�are�inadequate.�The�MANEB� examinations� system� is� based� only� on� theory� examinations� and� leaves� the�practical�assessment�to�teachers,�who�lack�appropriate�practical�competence.�The�trade�testing� system,� on� the�other�hand,� although�oriented� in�both�practical� and� theory,� is�severely�under�resourced�and�based�on�mainly�outdated� training� standards.� It� is�not�yet�linked�to�the�new�CBET�Standards.��
The� accreditation� of� training� providers� does� not� yet� exist,� although� TEVETA� is�working� on� the� conceptualization� of� a� modern� accreditation� system.� Currently,� the�registration� of� all� TEVET� providers� in� Malawi,� combined� with� institutional�assessments,�can�be�seen�as�a�first�step.��
The�Ministry�of�Education�furthermore�maintains�its�own�system�of�quality�control�of� the�TCs� that� it� administers.�The�ministry� is� supposed� to�ensure� that� colleges�have�enough� qualified� trainers,� sufficient� tools� and� equipment,� appropriate� facilities,� and�that� colleges� follow� the� training� programs� in� accordance� with� public� policies.�Responsibilities� in� the�MOEST� rest�with� the�Department� of� Education,�Methods� and�Advisory�Services.�However,�recently�the�system�has�not�been�effective,�mainly�due�to�a�shortage�of�qualified�inspectors�and�limited�financial�resources.�Only�one�college�has�been�visited�by�MOEST�inspectors�since�2006.��
Governance Issues and Institutional Set-up
Governance� and� management� of� TEVET� usually� poses� a� substantial� challenge� to�policy�makers.� Skill� development� cuts� across� the� interest� of� various� governmental�

142 World Bank Working Paper
�
sectors�and�cannot�successfully�be�implemented�without�the�participation�of�industries�and�employers.�To�make�sure�that�training�programs�are�aligned�to�what�the�different�labor�market�segments�need,�people�who�represent�and�know�the�formal�and�informal�worlds� of� work� need� to� be� incorporated� into� the� planning,� implementation,� and�supervision� processes� in� the� TEVET� system.� The� institutional� set�up� for� TEVET�management�needs�to�be�built�in�a�way�that�can:��
� facilitate�coordination�and�cooperation�between�different�government�sectors,�such�as�education,�labor,�agriculture,�health,�public�works,�and�others��
� regulate� training� delivery� in� all� different� sectors� and� by� different� provider�systems� in� a� way� that� guarantees� a� coordinated� and� articulated� training�approach�
� ensure� that� non�government� stakeholders� (in� particular� industry),� the�informal�sector,�and�civil�society�also�articulate�their� interests�and�views�and�influence�TEVET�development�appropriately.�
Malawi�has�struggled�for�many�years�to�find�the�appropriate�institutional�set�up�as�the� numerous� changes� in�ministerial� responsibility� for� TEVET� over� the� last� decades�demonstrate.� However,� management� problems� still� constitute� one� of� the� major�obstacles�to�TEVET�development�and�to�the�provision�of�appropriately�skilled�human�resources� to� the� Malawian� economy.� As� the� scope� of� this� analysis� is� limited,� the�following� section�concentrates�on� three� relevant� topics:�governance,� the�management�of�training�institutions�and�stakeholder�involvement.��
Governance and Regulatory Functions
The� latest� major� reorientation� of� the� TEVET� system� led� to� the� establishment� of�TEVETA�in�the�late�1990s,�which�came�about�after�several�years�of�diagnostic�work�and�discussion�within�Malawi.�TEVETA�was�formed�with�the�aim�to:�
� facilitate�the�move�from�an�essentially�supply�driven�to�a�demand�responsive�TEVET�system�
� integrate�the�fragmented�TEVET�provider�systems�� overcome� the� situation� of� parallel� qualification� systems�with� the� creation� of�
one�new�CBET�qualification�framework�� develop�modern�methods�of�quality�assurance�and�regulation�and�to�promote�
the� sustainability� of� TEVET� through� the� transformation� of� the� previous�Industrial�Training�Fund�into�the�levy�based�TEVET�Fund.��
The� authority� was� formed� as� an� autonomous� body� that� reflected� the� need� of�responsiveness�to�different�stakeholder�groups—mainly�the�education�sector;�the�labor�sector;� and� the� private� business� sector,� both� formal� and� informal.� It� is� based� on� the�TEVET� Policy� approved� in� 1998� and� the� TEVET�Act� adopted� in� 1999.� According� to�these� documents,� TEVETA’s� main� role� in� the� Malawian� TEVET� system� is� policy�development,�regulation,�quality�assurance�and�facilitation,�while�the�Authority�is�not�supposed�to�be�directly�involved�in�training�delivery.21��
Initially�funded�with�substantial�donor�support,�TEVETA�has�achieved�important�reform�steps,�including�the�establishment�of�the�TEVET�Fund;�the�commencement�of�a�new�CBET�based�qualification� framework;� and� the�promotion�of�non�formal� training�
The Education System in Malawi 143
�
activities,� with� special� emphasis� on� private� and� informal� sector� training,� as� well� as�research�initiatives�to�fill�some�of�the�striking�knowledge�gaps.��
TEVET� delivery� remained� with� the� line� ministries� in� the� case� of� public� TEVET�institutions,� as� well� as� various� private� providers.� Gradually,� but� far� from�comprehensively,�different�providers�have�adopted� the�new�CBET�qualifications� that�are� managed� by� TEVETA.22� For� formal� TEVET� provided� in� the� public� TCs,�responsibility�was�moved� from�the�Ministry�of�Labor�and�Vocational�Training� to� the�MOEST�in�2006.��
Through�their�responsibility�for�the�most�popular�Malawian�TEVET�qualifications,�the�Malawi�National�Examinations�Board�(MANEB)�under�MOEST�and�the�Directorate�of�Trade�Testing�in�the�Ministry�of�Labor�still�assume�core�regulatory�functions�in�the�TEVET� system.�As� an� open� system� allowing� for� recognition� of� prior� learning,� trade�testing�constitutes�an�important�element�of�the�TEVET�reform,�and�would�need�to�align�its�trade�standards�with�the�new�CBET�standards.�However,�further�development�and�updating�of�the�trade�testing�system�has�come�to�a�standstill.�While�trade�testing�is�the�most�important�assessment�system�in�Malawi�in�terms�of�candidates�passing�through�and�acceptance�with�industry,�it�is�underfinanced�and�mainly�relies�on�outdated�trade�standards.��
Management of Public TEVET Institutions
The� problems� inherent� in� the� TEVET� system� translate� into� the� numerous� challenges�TEVET� institutions� are� facing� in� the�day�to�day�delivery�of� training.�These� include�a�shortage�of�appropriately�competent�teaching�staff;� the�unavailability�and�shortage�of�learning,� teaching,� and� training�material;� the� need� to� train� towards� various� parallel�qualification�systems;�and�a�shortage�of�apprenticeship�places�for�students,�which�leads�to� a� higher� demand� on� practical� training� within� the� institutions.23� In� particular,� the�public� TCs� are� substantially� restricted� in� their� ability� to� flexibly� and� creatively� cope�with�these�challenges.�Some�of�the�problems�they�are�facing�include�the�following:��
� TCs�are�forced�to�operate�with�three�different�accounts�reflecting�the�different�revenues� they� receive� from� treasury,� TEVETA,� and� their� own� income.�Only�the�funds�in�the�PU�account�can�be�flexibly�and�independently�used�to�cover�unexpected�expenses,�which�creates�incentives�to�increase�the�parallel�student�intake�irrespective�of�capacity.�
� The�TCs�are�obliged�to�maintain�boarding�facilities�for�regular�students,�which�in� the�past�has� caused� substantial�drains�on� the�available�budget�when� food�prices�rose�unexpectedly.�Boarding�management�consumes�a�substantial�share�of�the�institutions’�management�capabilities.��
� If� not� financed� through� the� PU� account,� colleges� are� dependent� on� a� rather�inflexible� public� procurement� system,� which� causes� delays� in� providing�training�material.��
� Due� to� competing� employment� opportunities� for� well�qualified� technical�teachers,� the�staff� turnover� in�technical� training�institutions�tends�to�be�high.�However,�TCs� lack� the�opportunity� to�directly� recruit�new�staff.�Apart� from�part�time�teachers�paid�from�the�PU�account,�recruitment�is�centrally�done�by�the�Teaching�Services�Commission�in�the�MOEST,�and�it�take�a�year�or�more�from�the�time�a�vacancy�is�reported�until�a�post�is�filled.24�Furthermore,�college�
144 World Bank Working Paper
�
managers� complain� about� the� frequent� recruitment� of� teaching� staff� with�qualifications�that�are�different�from�the�ones�required.��
In�the�beginning�of� the�decade,�a�discussion�was�initiated�and�a�first�draft�policy�paper�prepared�about�granting�TCs�more�operational�autonomy.�This�discussion�came�to� a� standstill� when� the� colleges� were� transferred� to� the� MOEST.� Considering� the�enormous� restrictions� imposed� on� the� technical� colleges� through� being� part� of� the�central� procurement� and� staff� recruitment� system� and� by� needing� to� accommodate�three� separate� financial�management� systems,� the� discussion� about�merits� and� risks�involved�in�granting�more�autonomy�to�TCs�should�be�taken�up�again.��
Stakeholder Involvement
Stakeholder� involvement� in�Malawi’s� TEVET� system� is� institutionalized� in� different�ways;� however,� the� fragmented� structure� in� the� TEVET� system� does� not� always�facilitate�appropriate�dialogues.��
TEVETA�appears�to�have�developed�a�significant�communication�and�involvement�with�employers,�in�particular�with�private�firms�in�the�formal�and�informal�sector�and�their� representative� associations.� Apart� from� sitting� on� TEVETA’s� Board� and�contributing�through�the�TEVET�levy�the�bulk�of�the�Authority’s�budget,�companies,�or�associations� are� increasingly� involved� in� standard� setting� and� the� implementation�of�programs� that� are� tailor�made� for� them.� Companies� are� regularly� approached� by�TEVETA�in�the�context�of� training�needs�assessments�and�are�eligible�to�benefit� from�the�private�sector�training�program.��
Naturally,�MOEST�is�heavily�involved�with�its�TCs,�although�it� lacks�any�day�to�day� or� regular� contact� with� employers.� This� is� partly� caused� by� the� fact� that� the�responsibility� for� organizing� and� supervising� the� industrial� attachment� part� of� the�mainstream�TEVET�system�is�administered�by�TEVETA.25��
Of�the�examination�bodies,�only�the�Directorate�of�Trade�Testing�used�to�maintain�close� relationships�with� industry—for�example,� through� the�Trade�Advisory�Groups,�which�were�instrumental�in�revising�testing�standards.�However,�this�participation�has�practically�dried�up�since�the�future�of�the�trade�testing�system�is�unclear.��
Currently,�the�actual�stakeholder�influence�(mainly�of�employers�and�civil�society)�on� the� public� formal� TEVET� sector� is�mainly� exerted� through�TEVETA.� In� fact� non�governmental� stakeholders� dominate� the� TEVETA� Board,� holding� most� of� the� 10�regular�seats,�while�the�government�is�only�represented�with�four�ex�officio�members.�Considering� the� important� stake� government� has� in� the� provision� and� financing� of�TEVET�in�Malawi,�the�board�structure�may�require�a�restructuring�aiming�at�creating�ownership� of� TEVETA� among� key� government� sectors� (for� example,�MOEST,�MOL,�MOF)�through�inclusion�in�the�decision�making�structures.�
Notes �1What� is� labeled�as� formal,�non�formal,�or� informal� training�varies�among�countries�and�users.�Usually,� the� term� “formal� training”� is� used� to� describe� training� programs� that� are� structured,�provided�in�an�accredited�training�institution,�and�lead�to�a�recognized,�national�qualification.�On�the�other�hand,� “non�formal� training”� refers� to� training�also�provided� in� a� structured�mode�of�delivery�and�following�a�prescribed�curriculum,�yet�normally�not�leading�to�recognized�national��

The Education System in Malawi 145
�
�qualifications�but�rather�to�institutional�certificates.�“Informal�training”�usually�describes�all�kinds�of� non�structured� learning� and� mainly� includes� on�the�job� training,� including� traditional�apprenticeships,�or�self�learning.��In�Malawi,�like�in�many�other�countries,�these�definitions�do�not�sufficiently�capture�the�reality�of�the�TEVET� landscape.�Definition�problems�arise� for�example�with�respect� to� training�programs�geared�towards�international,�but�not�nationally�recognized,�certification,�as�for�example�the�City�and�Guilds�qualifications.�Also,�many�of�the�courses�provided�in�NGOs�that�would�normally�be�classified� as� non�formal,� as� well� as� informal,� on�the� job�learning,� lead� to� Trade� Testing�Certificates,� which� is� a� recognized� national� qualification� system.� In� these� cases,� the� training�would�lead�to�formal�qualifications�but�is�delivered�in�a�non�formal�way.�2�TEVETA�is�systematically�recording�data�on�regular�student�intake�and�enrollment.�The�system�of�data�collection�from�TCs�by�the�MOEST,�however,�remains�rather�weak�and�records�reveal�a�high� level�of� inconsistency.�This� is�most� likely�due� to� the� fact� that� the�questionnaires�meant� to�capture� student� returns� that� sent� out� to� colleges� are� not� clearly�defined,� or�understood�by� the�colleges.� For� example,� return�data� are� unclear�with� respect� to� the� questions,�whether� students�enrolled,�or�only�those�who�are�actually�physically�present�in�the�college,�are�captured.�There�is�a�difference,�as�a�significant�number�of�students�regularly�undergo�industrial�attachment.��3� Between� 2003� and� 2006,� the�Ministry� of� Labor� (which� at� that� time� had� the� responsibility� for�TCs),� also� recruited� parallel� students� in� addition� to� the� regular� apprenticeship� intake�administered�by�TEVETA.��4�The�summary�of� records�of� the�1999�TEVET�Provider�Directory�can�be� found� in� table�6A.2� in�Appendix�6.��5�Relation�of�the�district’s�share�of�TEVET�student�intake�to�the�total�TEVET�intake�to�the�district’s�share�in�the�total�population.��6�Poverty�status�is�measured�by�the�percentage�of�the�population�belonging�to�the�lowest�income�quintile�as�compared�to�the�national�average.��7�The�admission�is�done�through�a�fully�computerized�and�transparent�selection�process.�8�“General”�as�compared�to�the�TEVET�programs�that�prepare�for�specialized�state�employment,�such�as�policy�training,�teacher�education,�etc.�9�Until�2005,�the�colleges�were�under�the�Ministry�of�Labor.��10� See� table� 6.5� for� the� entire� MOEST� TEVET�related� budget� without� the� Staff� Development�Institute.�11�The�execution�rate�is�likely�to�have�recently�improved�as�resources�have�been�directly�disbursed�by�treasury�since�2006.�12�Further�details�on�TEVETA�spending�are�included�in�Appendix�6.�13�Africa�Private�Sector�Group,�Malawi.�Investment�Climate�Assessment�(ICA),�June�23,�2006�14�See�also�Chapter�3.�15� The� tuition� part� of� the� fee� from� regular� apprentices� (MK� 2,000)� has� to� be� transferred� to� a�government�account.�16�It�should�be�noted�that�the�unit�cost�for�training�institutions�in�the�case�of�training�provided�by�apprenticeship�is�generally�lower�than�for�other�institutional�training�schemes,�because�parts�of�the� training� are� provided� by� companies.� In� the� case� of� a� four�year� apprenticeship� training� in�Malawi,�a�student�should�not�spend�more�than�a�total�of�two�years�in�the�technical�college�on�a�net�basis.��17�Interestingly,�pass�rates�are�almost�identical�for�men�and�women.�For�further�details�on�trade�testing�see�Appendix�6A.13.�18� Further� characteristics� of� the� trade� testing� system� and� its� results� can� be� found� in�Appendix�6A.13.�19�This�ratio�includes�workshop�assistants.���
146 World Bank Working Paper
�
�20� The� low� attachment� rate� currently� recorded� for� 2007� can� be� explained� by� the� fact� that�most�students� spent�most� of� their� first� year� in� college,� so� the� actual� attachment� is� just� taking� place�during�the�first�year.��21� For� the� definition� of� TEVETA’s� roles,� see� TEVET�Act,� paragraph� 11� (a);� and� TEVET� Policy,�paragraph�4.1.1.�22�One�example�outside�the�system�of�public�TCs�is�the�Malawi�Institute�of�Tourism�(MIT)�of�the�Ministry� of� Tourism.� Some� private� providers,� for� example� Rumphi� Technical� College,� have�started�to�recruit�regular�students�sponsored�by�TEVETA.�23�This�is�a�particular�concern�for�parallel�students.�24�In�2005�and�2008,�the�Teaching�Service�Commission�in�the�MOEST�was�not�appointed�at�all,�so�no�new�staff�were�recruited.��25�Although� comprehensive� information� is� lacking,� relationships� among� other� sector�ministries�with�TEVET�institutions�and�relevant�employers�appears�to�be�better�overall.��
147
CHAPTER �7 �
Higher�Education�
Summary of the Chapter
University� enrollments� almost� doubled� from� 2003–2008,� partly� because� of� the�enrollment� of� non�residential� students� and� the� establishment� of� private� universities�(which�contributed�12.4�percent�to�the�total�enrollment�in�2008).�Female�enrollment�has�remained�at�around�30�percent�in�public�institutions�and�around�40�percent�in�private�institutions.�
However,� Malawi� still� has� the� lowest� university� enrollment� (51� per� 100,000�inhabitants)� when� compared� to� some� SSA� countries� whose� average� is� 337.� Limited�infrastructure�constrains�the�growth�of�university�education.�
Malawi�universities�offer�18�fields�of�study.�Education,�applied�science,�commerce,�social� sciences,� and� the� humanities� account� for� the� highest� enrollment.� Science� and�engineering� are� each� around� 4.3� percent� of� total� enrollment.� Information� and�communication�technologies�(ICT)�is�around�2.7�percent.�
Post�graduate� studies� account� for� less� than� 10� percent� of� total� enrollment.� The�highest�enrollments�are� in�the�social�sciences�and�science.�Private�colleges�are�not�yet�offering�post�graduate�programs.�Areas� critical� to� the� implementation�of� the�Malawi�Growth�and�Development�Strategy�(MGDS)�are�not�well�covered.�
The�amount�of�the�education�budget�allocated�to�higher�education�(27�percent)�is�higher� than� the� average� (21�percent)� for� SSA� countries.� The� subventions� account� for�over� 80� percent� of� the� income� of� public� universities,� while� student� fees� and� other�income� contribute� less� than� 10� percent� each.� Government� subsidization� of� higher�education�is�a�source�of�great�inequity�because�over�90�percent�of�university�students�come�from�the�wealthiest�20�percent�of�Malawi�households.�Student�fees�are�the�main�source�of�income�for�private�universities.�
Emoluments�and�benefits�consume�more�than�50�percent�of�expenditures�in�public�institutions.� Very� little� is� spent� on� teaching� materials,� equipment,� books,� and�periodicals.�Emoluments�take�up�less�than�40�percent�of�the�total�expenditure�in�private�universities�(which�also�spend�more�on�teaching�materials�than�public�institutions).�
Malawi’s�higher�education�recurrent�unit�cost�of�21.5�times�the�GDP�per�capita�is�the�highest�among�all�the�SSA�countries�(for�which�the�average�is�3.14�times�the�GDP�per� capita).� This� is� because� the� average� student/lecturer� ratio� of� 11:1� for� both�public�and�private�institutions�is�very�low�compared�to�other�countries�in�SSA�(the�average�is�20:4)�of�similar�GDP.�Lecturer’s�salaries,�expressed�at�63.9�times�the�GDP�per�capita,�are�also�higher�compared� to�other�SSA�countries�with�a�similar�GDP�(the�average� is�23.8�times�GDP�per�capita).�This�also�contributes�to�a�very�high�unit�cost.�
148 World Bank Working Paper
�
The�National�University�Student�Loan�Trust�for�needy�students�does�not�apply�a�“Means�Test”�and�as�result�almost�all�applicants�access�it.�The�system�is�not�equitable�because� those� who� take� out� loans� are� among� the� wealthiest,� and� also� because� non�residents� and� students� in�private� universities� are� not� eligible.� The� absence� of� a� legal�framework�means� that� the� loan�recovery�mechanism�has�not�been�established.� In� the�meantime,�a�serious�backlog�of�loans�is�building�up.�The�loans�have�hidden�subsidies,�which�will�result�in�low�repayment�and�recovery�ratios.�As�a�result,�the�Loan�Trust�will�require�continued�allocation�from�the�government.�
Graduates�at�both�the�graduate�and�postgraduate�level�are�very�well�absorbed�into�the� labor�market,�where� their� salaries� expressed� as�GDP�per� capita� are�much�higher�than�those�of�countries�with�a�similar�GDP.�
*�*�*�
This� chapter� provides� an� in�depth� analysis� of� the� higher� education� subsector�(following� the�brief� analysis� that�was�done� in� the�2004�CSR).�The�analysis�highlights�the� status� of� higher� education,� some� key� challenges� the� sector� faces,� and� goes� on� to�propose�policy�options�for�improvement.�A�challenge�in�conducting�this�analysis�was�data�collection,�which�was�done�mainly�by�the�institutions�themselves,�most�of�which�have� yet� to� establish�management� information� systems.�As� a� result,� some�data�were�inadequate�and�at�times�completely�absent.�There�are�gaps�and�inconsistencies�in�data,�yet�these�should�not�invalidate�the�findings�of�this�report.�The�analysis�focuses�on�the�following�areas:��
� the�structure�of�the�higher�education�system;��� the� distribution� and� nature� of� enrollments,� including� the� level� and� field� of�
study�and�the�equity�dimension;�� financing� and� expenditure� patterns� (for� example,� the� fee� structure� and�
sponsorship�of�students);�� staffing�patterns;�� the�internal�efficiency�of�the�sub�sector;�and�� management�and�policy�issues.��
The� chapter� concludes� with� recommendations.� Only� public� and� private�institutions� that� offer� degrees� and� post�graduate� studies� are� covered� in� this� study.�Other�institutions�that�offer�diploma�programs�are�mentioned�in�Chapter�6.��
The Genesis and Growth of Higher Education in Malawi
Public Universities
University�of�Malawi�In�October�1964,�the�first�public�university�in�Malawi�was�established�by�the�University�of�Malawi�(Provisional�Council)�Act.�Over�the�years,�the�university�has�expanded�and�currently�has� five�constituent�colleges:�Chancellor�College�in�Zomba,� the�Polytechnic,�College� of� Medicine,� Bunda� College� of� Agriculture� in� Blantyre,� and� the� Kamuzu�College�of�Nursing�in�Lilongwe.��

The Education System in Malawi 149
�
Mzuzu�University�Noting�the�insatiable�demand�for�higher�education�in�Malawi,�the�government�decided�to�establish�a�second�public�university�in�the�Northern�region.�The�Mzuzu�University�campus�at�Choma�in�Mzuzu�opened�in�1999.��
Private Universities
The� two� public� universities� are� not� able� to� absorb� the�majority� of� secondary� school�graduates� in�Malawi.� Private� universities� in�Malawi� are� a�welcome� development� as�they�augment�the�efforts�of�the�public�universities�in�increasing�enrollments.�There�are�currently� four�private�universities� in�Malawi:�Shareworld�University� (with� campuses�in�Blantyre,�Lilongwe,� and�Mzuzu),�which� started�offering�degree�programs� in� 2006;�Catholic�University�of�Malawi�in�Blantyre,�which�was�established�in�2006;�Livingstonia�University� in� Rumphi,� which� was� established� in� 2003;� and� Adventist� University� of�Malawi� at� Lake�View� in�Ntcheu,�which�was� established� in� 2007.�At� the� time� of� this�writing,�three�of�the�private�universities�were�accredited.1�
Higher Education Enrollments and Fields of Study
Enrollments
Malawi’s� higher� education� system� is� still� very� small� compared� to� those� of� other�countries� in� the� region.� The�public� universities� enroll� the�majority� of� students.� Total�university�enrollment�constitutes�roughly�0.3�percent�of�students�of�eligible�age.��
Table�7.1�shows�the�total�university�enrollment�for�2003–2008�and�enrollment�per�100,000� inhabitants� by� gender.� The� data� show� an� increase� in� enrollment� per� 100,000�inhabitants,�for�both�males�and�females.�The�number�of�female�students�is�much�lower�than�the�number�of�male�students,�which�indicates�a�persistent�gender�disparity.���Table 7.1: Enrollment, Actual Number, and Number per 100,000 Inhabitants
Year
Male (actual
number)
Female (actual
number)
Total (actual
number)
Male (per 100,000 inhabitants)
Female (per 100,000 inhabitants)
Total (per 100,000 inhabitants)
2003 3,262 1,397 4,659 53 22 37 2004 3,877 1,706 5,583 61 26 44 2005 4,208 2,051 6,259 65 31 48 2006 4,947 2,410 7,357 74 36 55 2007 5,686 2,788 8,474 83 40 61 2008 5,964 3,118 9,082 84 44 64 Average 70 33 51
Source:�Data�from�higher�education�institutions.��
Figure�7A.1� in�Appendix�7.1� compares�higher�education�enrollments�per�100,000�inhabitants� (5A� programs� under� the� 1997� International� Standard� Classification� of�Education2).�Malawi,�with� an� average�of� 51� for� 2005–2006,� has� the� lowest�number�of�enrolled� university� students� per� 100,000� inhabitants� in� the� selected� Sub�Saharan�countries�for�which�data�was�available.��
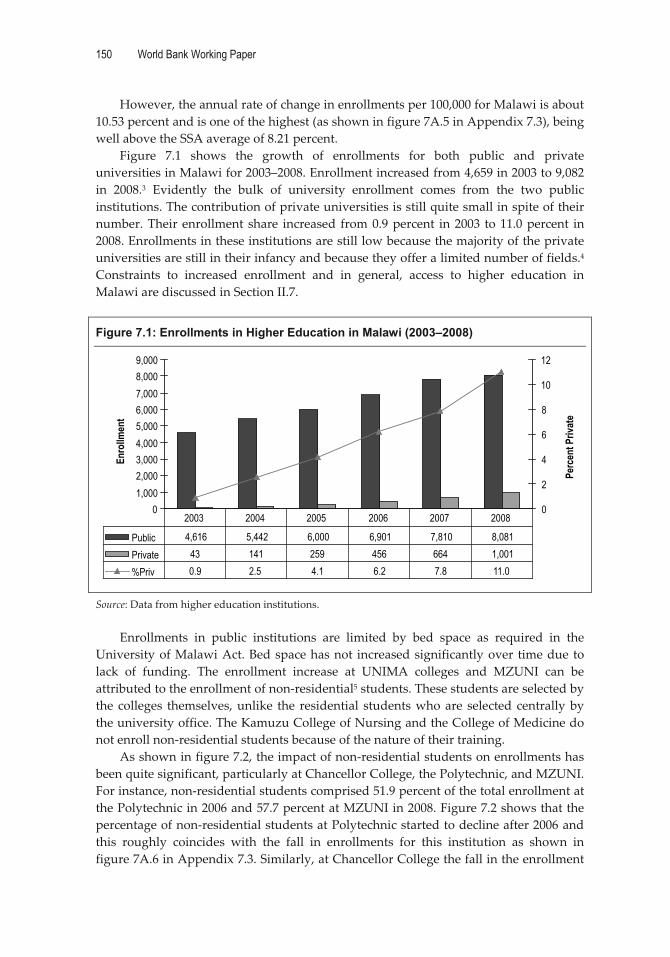
150 World Bank Working Paper
�
However,�the�annual�rate�of�change�in�enrollments�per�100,000�for�Malawi�is�about�10.53�percent�and�is�one�of�the�highest�(as�shown�in�figure�7A.5�in�Appendix�7.3),�being�well�above�the�SSA�average�of�8.21�percent.��
Figure� 7.1� shows� the� growth� of� enrollments� for� both� public� and� private�universities�in�Malawi�for�2003–2008.�Enrollment�increased�from�4,659�in�2003�to�9,082�in� 2008.3� Evidently� the� bulk� of� university� enrollment� comes� from� the� two� public�institutions.�The�contribution�of�private�universities�is�still�quite�small�in�spite�of�their�number.�Their�enrollment� share� increased� from�0.9�percent� in�2003� to�11.0�percent� in�2008.�Enrollments�in�these�institutions�are�still�low�because�the�majority�of�the�private�universities�are�still�in�their�infancy�and�because�they�offer�a�limited�number�of�fields.4�Constraints� to� increased� enrollment� and� in� general,� access� to� higher� education� in�Malawi�are�discussed�in�Section�II.7.��
Figure 7.1: Enrollments in Higher Education in Malawi (2003–2008)
01,0002,0003,0004,0005,0006,0007,0008,0009,000
Enro
llmen
t
0
2
4
6
8
10
12
Perc
ent P
rivat
e
Public 4,616 5,442 6,000 6,901 7,810 8,081Private 43 141 259 456 664 1,001%Priv 0.9 2.5 4.1 6.2 7.8 11.0
2003 2004 2005 2006 2007 2008
�
Source:�Data�from�higher�education�institutions.��
Enrollments� in� public� institutions� are� limited� by� bed� space� as� required� in� the�University�of�Malawi�Act.�Bed�space�has�not� increased�significantly�over� time�due�to�lack� of� funding.� The� enrollment� increase� at� UNIMA� colleges� and� MZUNI� can� be�attributed�to�the�enrollment�of�non�residential5�students.�These�students�are�selected�by�the� colleges� themselves,�unlike� the� residential� students�who�are� selected�centrally�by�the�university�office.�The�Kamuzu�College�of�Nursing�and�the�College�of�Medicine�do�not�enroll�non�residential�students�because�of�the�nature�of�their�training.�
As�shown�in�figure�7.2,�the�impact�of�non�residential�students�on�enrollments�has�been�quite�significant,�particularly�at�Chancellor�College,�the�Polytechnic,�and�MZUNI.�For�instance,�non�residential�students�comprised�51.9�percent�of�the�total�enrollment�at�the�Polytechnic�in�2006�and�57.7�percent�at�MZUNI�in�2008.�Figure�7.2�shows�that�the�percentage�of�non�residential�students�at�Polytechnic�started�to�decline�after�2006�and�this� roughly� coincides� with� the� fall� in� enrollments� for� this� institution� as� shown� in�figure�7A.6�in�Appendix�7.3.�Similarly,�at�Chancellor�College�the�fall�in�the�enrollment�

The Education System in Malawi 151
�
of�non�residential� students� in�2008� is� reflected� in� the� fall�of� total�enrollments� for� that�year.��
A�number�of�external� institutions�provide�access�to�university�education�through�distance� education.� The� number� of� students� accessing� university� education� through�this�route�is�unknown�but�could�be�quite�substantial.�This�is�an�area�that�needs�further�investigation� in� order� get� a� complete� picture� of� higher� education� enrollments� in�Malawi.��
Figure 7.2: Percentage of Non-Residential Students (2003–2008)
0
20
40
60
80
Bunda 6.5 7.1 10.0 13.3 18.3 20.2
Chancellor 13.6 20.0 24.5 39.3 43.2 35.6
Polytechnic 16.5 34.4 37.1 51.9 44.5 37.5
Mzuzu 0 0 5.7 39.3 35.8 57.7
2003 2004 2005 2006 2007 2008
Perce
ntage
�
Source:�Data�from�higher�education�institutions.��
Distribution of Enrollments by Field of Study
This� section� provides� a� breakdown� of� the� fields� of� study� in� both� public� and�private�institutions� for� 2008� (this� year� being� the� one�with� the�most� recent� available� data)� to�determine�to�what�extent�the�areas�offered�are�relevant�to�the�human�resource�needs�of�Malawi.�These�show�the�trends�from�2003�to�2008.�
Table�7.2�shows�the�distribution�by�field�of�study�and�type�of�institution�for�2008.�The�data�for�both�types�of�institutions�show�that�education6�is�the�field�with�the�highest�number� of� students� at� 23.1� percent.� Enrollment� in� education� has� been� enhanced� by�private�universities,�three�of�which�offer�degrees�in�education.�Education�accounts�for�the�highest�number�of�students�in�private�universities,�constituting�31.5�percent�of�the�total�enrollment.�However,�while�education�still�has�the�highest�enrollment�of�all�fields,�the� percentages� at� Chancellor� College,� the� Polytechnic,� and� Mzuzu� University� are�decreasing�as�enrollments�in�new�and�other�fields�are�increasing.�
Enrollments� in�private�universities�are�small�at� this�stage�because�they�offer�only�six�out�of�the�18�fields�of�study�currently�available�in�Malawi�(see�table�7.2).�They�also�offer�the�“soft”�fields�of�education,�humanities,�commerce,�developmental�studies,�and�ICT.�None�offer� the� sciences,� engineering,� and�health�related�programs�at� the�degree�level,�presumably�because�of�the�cost�related�to�establishing�such�programs.�There�are�plans�to�offer�law�at�Catholic�University�and�Shareworld�University.���
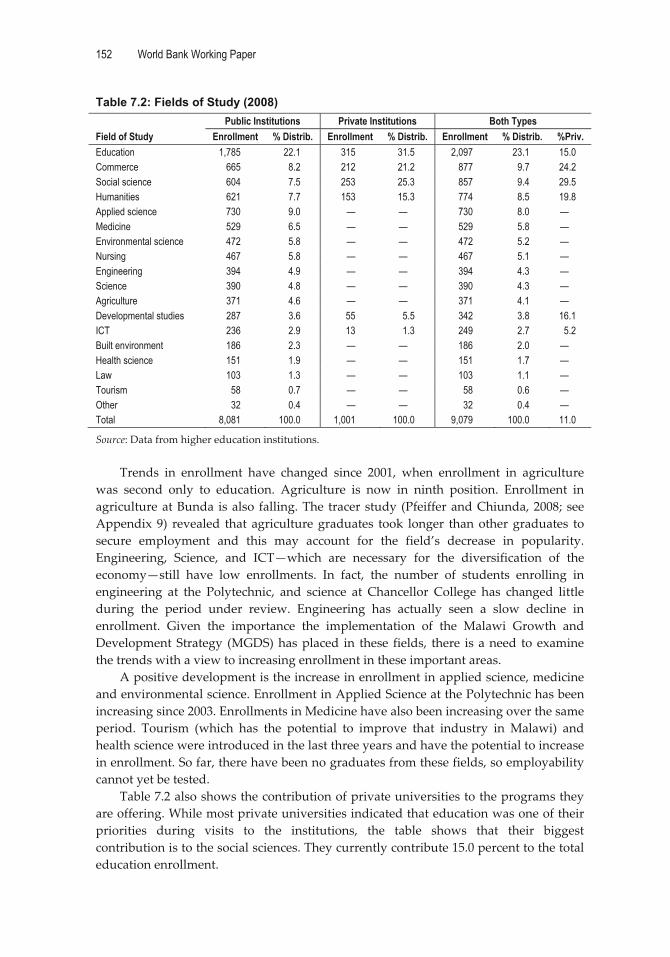
152 World Bank Working Paper
�
Table 7.2: Fields of Study (2008)
Field of Study Public Institutions Private Institutions Both Types
Enrollment % Distrib. Enrollment % Distrib. Enrollment % Distrib. %Priv. Education 1,785 22.1 315 31.5 2,097 23.1 15.0 Commerce 665 8.2 212 21.2 877 9.7 24.2 Social science 604 7.5 253 25.3 857 9.4 29.5 Humanities 621 7.7 153 15.3 774 8.5 19.8 Applied science 730 9.0 — — 730 8.0 — Medicine 529 6.5 — — 529 5.8 — Environmental science 472 5.8 — — 472 5.2 — Nursing 467 5.8 — — 467 5.1 — Engineering 394 4.9 — — 394 4.3 — Science 390 4.8 — — 390 4.3 — Agriculture 371 4.6 — — 371 4.1 — Developmental studies 287 3.6 55 5.5 342 3.8 16.1 ICT 236 2.9 13 1.3 249 2.7 5.2 Built environment 186 2.3 — — 186 2.0 — Health science 151 1.9 — — 151 1.7 — Law 103 1.3 — — 103 1.1 — Tourism 58 0.7 — — 58 0.6 — Other 32 0.4 — — 32 0.4 — Total 8,081 100.0 1,001 100.0 9,079 100.0 11.0
Source:�Data�from�higher�education�institutions.��
Trends� in� enrollment� have� changed� since� 2001,� when� enrollment� in� agriculture�was� second� only� to� education.� Agriculture� is� now� in� ninth� position.� Enrollment� in�agriculture�at�Bunda� is�also� falling.�The� tracer�study� (Pfeiffer�and�Chiunda,�2008;� see�Appendix� 9)� revealed� that� agriculture�graduates� took� longer� than�other�graduates� to�secure� employment� and� this� may� account� for� the� field’s� decrease� in� popularity.�Engineering,� Science,� and� ICT—which� are� necessary� for� the� diversification� of� the�economy—still� have� low� enrollments.� In� fact,� the� number� of� students� enrolling� in�engineering� at� the� Polytechnic,� and� science� at� Chancellor� College� has� changed� little�during� the� period� under� review.� Engineering� has� actually� seen� a� slow� decline� in�enrollment.� Given� the� importance� the� implementation� of� the� Malawi� Growth� and�Development�Strategy� (MGDS)�has�placed� in� these� fields,� there� is� a�need� to�examine�the�trends�with�a�view�to�increasing�enrollment�in�these�important�areas.��
A�positive�development�is�the�increase�in�enrollment�in�applied�science,�medicine�and�environmental�science.�Enrollment�in�Applied�Science�at�the�Polytechnic�has�been�increasing�since�2003.�Enrollments�in�Medicine�have�also�been�increasing�over�the�same�period.� Tourism� (which� has� the� potential� to� improve� that� industry� in� Malawi)� and�health�science�were�introduced�in�the�last�three�years�and�have�the�potential�to�increase�in�enrollment.�So�far,�there�have�been�no�graduates�from�these�fields,�so�employability�cannot�yet�be�tested.�
Table�7.2�also�shows�the�contribution�of�private�universities�to�the�programs�they�are�offering.�While�most�private�universities�indicated�that�education�was�one�of�their�priorities� during� visits� to� the� institutions,� the� table� shows� that� their� biggest�contribution�is�to�the�social�sciences.�They�currently�contribute�15.0�percent�to�the�total�education�enrollment.�

The Education System in Malawi 153
�
Duplication
There� is� duplication� in� some� of� the� fields� offered� by� the� universities.� Education,� for�instance,�is�offered�in�six�of�the�higher�education�institutions.�This�may�not�necessarily�be�negative�given�the�acute�shortage�of�secondary�school�teachers�in�Malawi,�although�there� is� no� accurate� data� to� suggest� what� percentage� of� education� graduates� from�universities�teach�in�schools.�
Given� the� critical� shortage� of� science� teachers� in� Malawi,� it� is� instructive� to�examine� the� distribution� of� enrollments� in� education� between� the� Bachelor� of� Arts�Education� and� Bachelor� of� Science� Education� degrees.� The� total� enrollment� in� the�Bachelor� of� Science� Education� comprised� only� 22.9� percent� of� the� total� education�enrollment�and�5.3�percent�of�the�total�university�enrollment�for�2008.�The�Bachelor�of�Science�(Technical�Education)�offered�at�the�Polytechnic�comprised�only�9.3�percent�of�the� total� education� enrollment.� The� low� enrollment� in� the� Bachelor� of� Science�Education� is� symptomatic� of� the� problems� facing� science� education� in� the� country.�Malawi� needs� to� look� at� innovative� ways� of� addressing� the� challenges� it� faces� in�science�education�if�it�is�to�improve�in�this�field.�Science�and�technology,�together�with�ICT,�are�recognized�as�being�critical�to�the�development�of�Malawi�in�the�MGDS.��
Bunda� College� and� MZUNI� both� offer� degrees� in� Forestry� and� Fisheries,� with�Bunda� also� offering� a�post�graduate�program� in� this� field.�Humanities�programs� are�offered� at� Chancellor� College,� Shareworld� University,� and� Adventist� University� of�Malawi.� Social� sciences� are� offered� at� Chancellor� College� and� Catholic� University.�Chancellor� College� also� offers� postgraduate� programs� in� social� sciences.� The�Polytechnic�offers�a�Bachelor�of�Arts� in� journalism,�while�Chancellor�College�offers�a�Bachelor�of�Arts�in�media�studies�in�the�Faculty�of�Humanities.��
The� bulk� of� the� humanities� programs� are� offered� by� Chancellor� College� while�Shareworld�and�Adventist�University�contribute�21.0�percent�of� the�enrollment.�Most�students�are�studying�for�the�Bachelor�of�Arts�in�humanities.�A�smaller�percentage�(3.2)�are� studying� for� the� Bachelor� of� Arts� in� human� resources� management,� which� is�offered�at�both�Chancellor�College�and�Shareworld.�
Environmental� science� is�an� important� field� for�a� country� like�Malawi,�given� the�scale� of� environmental� degradation� that� is� occurring� and� the� number� of� fishing�activities� in� Lake� Malawi.� Two� programs� in� this� field� are� the� Bachelor� of� Science�(Forestry)�and�the�Bachelor�of�Science�(Fisheries),�both�of�which�are�offered�at�Bunda�College�of�Agriculture�and�MZUNI.�Enrollment�in�fisheries�comprises�12.5�percent�of�the�total�field�of�study,�while�forestry�is�37.9�percent.�For�both�programs,�enrollment�in�the�individual�institutions�increased�very�little�from�2003–2008.��
A�closer�examination�of�the�field�of�commerce�shows�that�45.5�percent�of�students�in�this�field�are�studying�for�the�Bachelor�of�Business�Administration,�which�is�offered�at�the�Polytechnic,�Shareworld,�and�Adventist�universities.�The�two�private�institutions�contribute� only� 16.3� percent� of� the� enrollment.�Accountancy,�which� is� offered� in� the�Polytechnic� is� the� second� largest� program� and� accounts� for� 26.8� percent� of� the�enrollment� in� commerce.� In� social� science,� the� Bachelor� of� Social� Science� has� the�highest�enrollment�at�75.6�percent.�This� is�offered�at�Chancellor�College�and�Catholic�University.�
In� agriculture,� most� students� (41.2� percent)� are� studying� for� the� Bachelor� of�Agriculture.� The� Bachelor� of� Irrigation� Engineering� is� an� important� program� for�
154 World Bank Working Paper
�
Malawi’s�objective�to�ensure�food�security.�It�began�in�2005�and�has�only�17.8�percent�of�the�agriculture�faculty�enrollment.�Given�the�importance�placed�on�irrigation,�water�development,� and� food� security� in� the� MGDS,� we� need� to� examine� strategies� to�increase�enrollments�in�this�program.��
We�have�already�observed�that�enrollments�in�engineering�are�among�the�lowest.�An� examination� of� the� distribution� of� programs� shows� that� both� civil� and� electrical�engineering�programs�have�the�highest�enrollments�within�the�field,�with�a�percentage�of�37.8�and�30.2,�respectively.�Mechanical�engineering�has�only�12.4�percent�of�the�total�engineering�enrollments.�This�is�a�vital�field�where�efforts�should�be�made�to�increase�enrollment�given�the�importance�attached�to�manufacturing�in�the�MGDS.�
Another�necessary�field�of�study�for�Malawi�is�that�of�built�environment,�which�is�offered� in� the� Polytechnic� only.� The� school� offers� Bachelor� of� Science� degrees� in�architecture,� land� surveying,� quantity� surveying,� land� economy,� and� physical�planning.�The�bulk�of�the�students�in�this�field�are�in�architectural�studies�and�quantity�surveying�(33.3�percent�and�39.8�percent�of�the�total�faculty�enrollment,�respectively).�The�Bachelor�of�Science�in�land�economy�and�the�Bachelor�of�Science�in�physical�planning�were�only� established� in� 2008� and� currently� have� very� low� enrollments.� These� areas� need� to�grow�in�order�the�address�the�shortage�of�human�resources�in�these�fields.�
The� question� is� whether� this� duplication� is� desirable.� The� discussion� on�enrollments� has� shown� that� growth� in� enrollments� is� likely� to� come� from� non�residential� students.� Unless� some� programs� are� duplicated� in� the� institutions,� then�access� to� them�might� be� difficult�without� increasing� bed� space� in� the� institutions.� If�fields�are�still�demanded�by�the� labor�market� then�there� is�no�harm�in�duplication�of�fields�in�order�to�ensure�access�to�them.�The�tracer�study�findings�suggest�that�no�fields�are�saturated�yet�on�the�Malawi�labor�market.�However,�the�demand�for�skills�on�the�labor�market�needs�to�be�monitored�to�ensure�that�if�fields�become�saturated,�then�they�do�not�continue�to�be�duplicated�or�proliferated�in�the�universities.��
Postgraduate Enrollments
Postgraduate�programs�are�important�because�they�promote�research,�which�is�critical�to� the�development�of�new�information�and�knowledge.�Enrollments�at� this� level�are�relatively� low� in� relation� to� the� total�enrollment� in�public� institutions,�partly�because�not� all� institutions� offer� postgraduate� programs,� and� in� some� few� programs� are�offered.� As� Figure� 7.3� shows,� Bunda� College� of� Agriculture� (which� started� offering�postgraduate� programs� in� 2005)� and� Chancellor� College� (which� has� been� offering�postgraduate� programs� for� some� time)� offer� the� vast� majority� of� programs� at� the�master’s�level.�The�number�of�postgraduate�students�has�remained�below�12�percent�of�the�total�enrollment�for�both�institutions�with�fluctuations.�The�Polytechnic,�in�spite�of�its� age,� size,�high�undergraduate� enrollment,� and� the�diversity�of�programs� it� offers,�has�a�very�small�postgraduate�enrollment.�It�offers�only�two�postgraduate�programs:�a�Master�of�Business�Administration�and�a�postgraduate�diploma�in�management.�Such�enrollments� have� been� steadily� increasing—from� 1.8� percent� of� the� total� student�enrollment�to�2.8�percent�in�2008.���
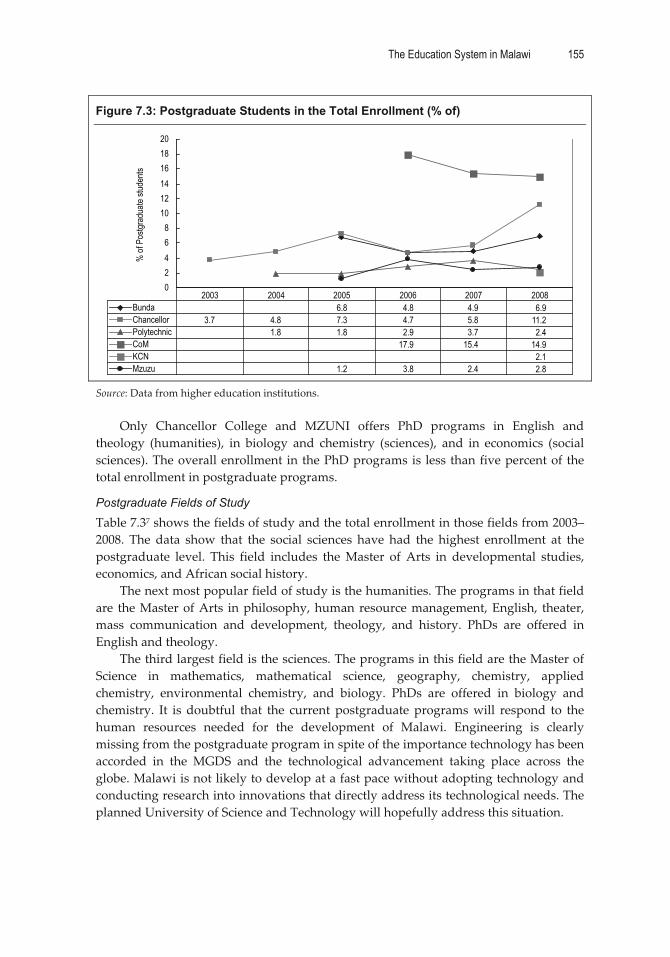
The Education System in Malawi 155
�
Figure 7.3: Postgraduate Students in the Total Enrollment (% of)
02468
101214161820
% of
Pos
tgrad
uate
stude
nts
Bunda 6.8 4.8 4.9 6.9Chancellor 3.7 4.8 7.3 4.7 5.8 11.2Polytechnic 1.8 1.8 2.9 3.7 2.4CoM 17.9 15.4 14.9KCN 2.1Mzuzu 1.2 3.8 2.4 2.8
2003 2004 2005 2006 2007 2008
�
Source:�Data�from�higher�education�institutions.��
Only� Chancellor� College� and� MZUNI� offers� PhD� programs� in� English� and�theology� (humanities),� in� biology� and� chemistry� (sciences),� and� in� economics� (social�sciences).�The�overall�enrollment� in�the�PhD�programs� is� less�than�five�percent�of� the�total�enrollment�in�postgraduate�programs.�
Postgraduate Fields of Study
Table�7.37�shows�the�fields�of�study�and�the�total�enrollment�in�those�fields�from�2003–2008.� The� data� show� that� the� social� sciences� have� had� the� highest� enrollment� at� the�postgraduate� level.� This� field� includes� the�Master� of� Arts� in� developmental� studies,�economics,�and�African�social�history.��
The�next�most�popular�field�of�study�is�the�humanities.�The�programs�in�that�field�are� the�Master�of�Arts� in�philosophy,�human�resource�management,�English,� theater,�mass� communication� and� development,� theology,� and� history.� PhDs� are� offered� in�English�and�theology.��
The�third�largest�field�is�the�sciences.�The�programs�in�this�field�are�the�Master�of�Science� in� mathematics,� mathematical� science,� geography,� chemistry,� applied�chemistry,� environmental� chemistry,� and� biology.� PhDs� are� offered� in� biology� and�chemistry.� It� is� doubtful� that� the� current� postgraduate�programs�will� respond� to� the�human� resources� needed� for� the� development� of� Malawi.� Engineering� is� clearly�missing�from�the�postgraduate�program�in�spite�of�the�importance�technology�has�been�accorded� in� the� MGDS� and� the� technological� advancement� taking� place� across� the�globe.�Malawi�is�not�likely�to�develop�at�a�fast�pace�without�adopting�technology�and�conducting�research�into�innovations�that�directly�address�its�technological�needs.�The�planned�University�of�Science�and�Technology�will�hopefully�address�this�situation.���
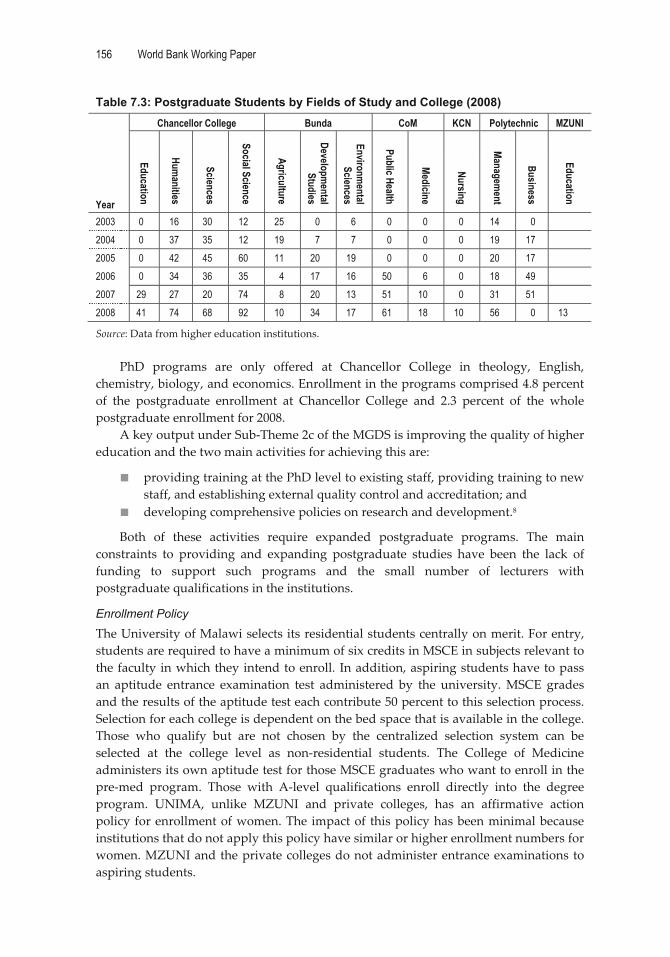
156 World Bank Working Paper
�
Table 7.3: Postgraduate Students by Fields of Study and College (2008)
Year
Chancellor College Bunda CoM KCN Polytechnic MZUNI
Education
Humanities
Sciences
Social Science
Agriculture
Developmental
Studies
Environmental
Sciences
Public Health
Medicine
Nursing
Management
Business
Education
2003 0 16 30 12 25 0 6 0 0 0 14 0 2004 0 37 35 12 19 7 7 0 0 0 19 17 2005 0 42 45 60 11 20 19 0 0 0 20 17 2006 0 34 36 35 4 17 16 50 6 0 18 49 2007 29 27 20 74 8 20 13 51 10 0 31 51 2008 41 74 68 92 10 34 17 61 18 10 56 0 13
Source:�Data�from�higher�education�institutions.��
PhD� programs� are� only� offered� at� Chancellor� College� in� theology,� English,�chemistry,�biology,�and�economics.�Enrollment�in�the�programs�comprised�4.8�percent�of� the� postgraduate� enrollment� at� Chancellor� College� and� 2.3� percent� of� the� whole�postgraduate�enrollment�for�2008.��
A�key�output�under�Sub�Theme�2c�of�the�MGDS�is�improving�the�quality�of�higher�education�and�the�two�main�activities�for�achieving�this�are:�
� providing�training�at�the�PhD�level�to�existing�staff,�providing�training�to�new�staff,�and�establishing�external�quality�control�and�accreditation;�and�
� developing�comprehensive�policies�on�research�and�development.8��
Both� of� these� activities� require� expanded� postgraduate� programs.� The� main�constraints� to� providing� and� expanding� postgraduate� studies� have� been� the� lack� of�funding� to� support� such� programs� and� the� small� number� of� lecturers� with�postgraduate�qualifications�in�the�institutions.��
Enrollment Policy
The�University�of�Malawi�selects�its�residential�students�centrally�on�merit.�For�entry,�students�are�required�to�have�a�minimum�of�six�credits�in�MSCE�in�subjects�relevant�to�the�faculty�in�which�they�intend�to�enroll.� In�addition,�aspiring�students�have�to�pass�an� aptitude� entrance� examination� test� administered� by� the� university.�MSCE� grades�and�the�results�of�the�aptitude�test�each�contribute�50�percent�to�this�selection�process.�Selection�for�each�college�is�dependent�on�the�bed�space�that�is�available�in�the�college.�Those� who� qualify� but� are� not� chosen� by� the� centralized� selection� system� can� be�selected� at� the� college� level� as� non�residential� students.� The� College� of� Medicine�administers�its�own�aptitude�test�for�those�MSCE�graduates�who�want�to�enroll�in�the�pre�med� program.� Those� with� A�level� qualifications� enroll� directly� into� the� degree�program.� UNIMA,� unlike� MZUNI� and� private� colleges,� has� an� affirmative� action�policy� for�enrollment�of�women.�The� impact�of� this�policy�has�been�minimal�because�institutions�that�do�not�apply�this�policy�have�similar�or�higher�enrollment�numbers�for�women.�MZUNI�and�the�private�colleges�do�not�administer�entrance�examinations� to�aspiring�students.�
The Education System in Malawi 157
�
Constraints on Increased Access
On�average,�all�higher�education� institutions�receive�more�applications� than�they�can�accommodate.� In� 2007,� MZUNI� received� over� 6,000� applications� for� 800� places.�Adventist� University� selected� 40� students� out� of� 300� applications.� In� 2008,� UNIMA�received� approximately� 4,000� applications.�Of� these,� approximately� 3,500� passed� the�entrance�examination�and�980�were�selected,�reflecting�an�absorption�rate�of�28�percent�of� those�who� passed� and� 24.5� percent� of� those�who� applied.� Each� year,� universities�have�absorbed�less�than�40�percent�of�the�MSCE�graduate�from�the�previous�year.�As�a�result,�a�backlog�of�students�from�previous�years�is�building�up,�until�such�time�as�new�strategies�are�adopted�to�enroll�a�large�of�students.�
The� current� infrastructure� at� both� public� and� private� universities� has� been� the�single� largest� constraint� on� expanding� enrollment� in� higher� education.� In� the� public�institutions,� the� existing� infrastructure�was� designed� for� small� classes� and�programs�that�did�not�require�extensive�facilities.�It�is�difficult�to�adapt�them�in�order�to�increase�enrollments�and�accommodate�the�diverse�programs�and�levels�of�teaching�universities�have� started� to� offer� over� the� last� few� years.� In� addition,� there� has� been� insufficient�funding�allocated�to�maintain�the�infrastructure,�which�is�in�very�poor�condition.�There�is� limited� student� accommodation;� insufficient� classrooms,� laboratory,� and� library�space;� and� dilapidated� buildings.� Libraries� are� poorly� resourced� and� ICT� is� not� yet�widespread� because� of� its� cost.� This,� together� with� inadequate� and� in� some� cases�obsolete� teaching� and� learning�materials,� has� limited� the� expansion� of� public� higher�education�enrollment�and�to�some�extent�affected�the�quality�of�education.��
While� the� introduction� of� non�residential� students� has� increased� enrollment,� the�shortage� of� facilities� limits� the� growth� of� enrollment� in� public� institutions.� The�expansion� of� the� non�residential� programs�will� also� be� limited� by� the� availability� of�decent� low�cost� accommodations� that� are� close� to� the� institutions,� as� well� as� the�escalating�cost�of�commuting.�Because�of�their�isolated�locations,�it�will�be�difficult�for�the� private� universities� to� introduce� non�residential� programs.� That� means� that�enrollment� in� these� institutions� will� necessarily� be� limited� by� bed� space� and� the�resources�needed�to� increase�accommodation�facilities,�especially�given�that� they�rely�mainly�on�student� fees� for� their�operations.�The�universities�should�therefore�explore�the� use� of� distance� education� as� a� way� of� reaching� more� eligible� students,� as� has�happened� in� some� countries� in� the� region.� Examples� of� these� are� Tanzania’s� Open�University,�which�has�enrolled�over�10,000�students�and�the�Zimbabwe�Open�University,�which� has� enrolled� over� 18,000� (Bloom,� Canning,� and� Chan,� 2006).� Malawi� needs� to�seriously�consider�establishing�an�open�university—rather� than�having�each� institution�establish�its�own�distance�education�program,�as�appears�to�be�the�current�plan.��
In�addition,�Malawi�should�explore�ways� in�which� it� can�benefit� from�the�SADC�Protocol�on�Education�and�Training,9�which�provides�for�the�education�and�training�of�students� from�member� countries� in� institutions� that� are� available� in� the� region.� This�could� be� an� expedient� and� less� costly� option� of� addressing� those� areas� for� which�Malawi� does� not� currently� have� adequate� capacity� (especially� at� the� postgraduate�level),�given�that�under�the�protocol�the�students�are�expected�to�pay�local�fees�and�not�external�fees.��
158 World Bank Working Paper
�
The� rigid� curriculum� offered� in� public� institutions� that� require� students� to� take�courses�over�a�four�year�period�limits�enrollment�because�once�enrolled,�students�are�forced�to�stay�in�college�for�the�next�four�years�before�they�can�acquire�a�qualification.�Changing�the�curriculum�to�a�credit�hour�system,�as�practiced� in�some�of� the�private�universities,� could� introduce� flexibility� in� how� long� students� are� required� to� study�before� they� can� graduate.� It�would� also� provide� flexibility� for� how� students� finance�their�studies�in�that�they�can�take�courses�as�and�when�they�have�the�resources�while�accumulating�the�required�credit�hours�to�graduate.��
Staffing� at� both� the� undergraduate� and� graduate� level� has� also� had� a� negative�effect� on� enrollments.� Student/lecturer� ratios� in� some� departments� and� faculties� are�very� low,� and� if� adjusted� could� result� in� higher� enrollments.� The� fact� that� all�institutions�have�to�rely�on�staff�associates�who�are�not�technically�qualified�to�teach�at�this� level� is� evidence� that� institutions� are� not� able� to� recruit� adequately� qualified�teaching�staff.�Both�public�and�private�universities�have�used�adjunct�staff�in�order�to�address�their�staffing�gaps.�The�lack�of�staff�also�means�that�the�infrastructure�is�under�utilized,� as� evidenced� by� the� fact� that�most� of� the� infrastructure� lies� idle� during� the�evenings,�weekends,�and�college�breaks.�This�is�also�as�a�result�of�the�rigid�structure�of�the�curriculum�mentioned�above.��
Financing
Sources of Financing for Public and Private Universities
The� main� source� of� financing� for� the� public� institutions� of� UNIMA� and�MZUNI� is�subvention�from�government�for�both�capital�and�recurrent�expenditures.�Government�recurrent� expenditure�on�higher� education� in� 2008�made�up�27.1�percent�of� the� total�government�recurrent�expenditure�on�education,�which�is�high�compared�to�other�SSA�countries.10� Figure� 7.4� shows� income� from� government� subvention,� tuition� fees,� and�other�income�for�the�UNIMA�colleges�for�2004/05�to�2007/08.�Figure�7.5�shows�the�same�for� MZUNI� for� 2002/03� to� 2004/05.11� Details� of� the� actual� figures� are� shown� in�Appendix�7.4.�
The� figures� show� that� subventions� from� the� government� to� all� institutions� have�been�increasing�at�different�rates�during�the�period.�Allocations�for�2007/08�are�much�higher� than� allocations� for� previous� years.� The� level� of� subventions� also� varies� by�institution,�and�is�related�to�enrollment.�Although�the�subvention�from�government�to�the�public� institutions�has�been� increasing�with� the�number�of� students� enrolled,� the�allocations� are� not� adequate� to�meet� the� requirements� of� the� institutions.� Generally,�public�universities�receive�about�50�percent�of�what�they�request�from�the�government�and� have� to� augment� this� with� tuition� fees� and� other� income.� As� can� be� seen� from�figures� 7.4� and� 7.5,� these� sources� of� income� are� much� lower� than� the� government�subvention.��

The Education System in Malawi 159
�
Figure 7.4: Sources of Income for UNIMA Colleges and Central Office (2004/05–2007/08)
0
200,000,000
400,000,000
600,000,000
800,000,000
1,000,000,000
1,200,000,000
1,400,000,000
Subv
entio
n
Bunda Chancellor
Othe
r
Fees
Fees
Subv
entio
n
CoM KCN UO
Othe
r
Fees
Subv
entio
n
Othe
r
Fees
Subv
entio
n
Othe
r
Fees
Subv
entio
n
Othe
r
Subv
entio
n
Othe
r
Polytechnic
Incom
e (MK
)
2004/052005/062006/072007/08
�
Source:�Audited�Financial�Statements:�2004/05–2007/08�from�the�University�Office.��
Figure 7.5: Sources of Income for MZUNI: 2002/03–2004/05
0
50,000,000
100,000,000
150,000,000
200,000,000
250,000,000
300,000,000
Subvention Fees Donations Other
Incom
e (MK
)
2002/03
2003/04
2004/05
�Source:�MZUNI�audited�financial�statements:�2002/03–2004/05.��
Figures�7A.2�and�7.A.3�in�Appendix�7.112�contain�the�percentage�of�subvention�to�total�income�for�all�the�colleges.�Figure�7A.2�shows�that�for�most�colleges,�government�subvention�is�above�80�percent,�except�for�the�College�of�Medicine,�whose�percentage�is�49.6�percent�of�total�income�in�2007/8.�The�subvention�percentage�for�MZUNI�was�73.5�percent� in�2002/03.� It� fell� to�61.4�percent� in�2003/04�and� rose�again� to�72.8�percent� in�2004/05.�This�emphasizes�the�extent�to�which�public�institutions�are�highly�dependent�on� government� subvention.� The� percentage� of� subvention� to� total� income� for� the�College�of�Medicine�declined�from�93.5�percent�in�2004/05�to�49.6�percent�in�2007/2008.�Currently,� less� than� 12� percent� of� the� government� subvention� goes� to� the� university�office� responsible� for� carrying� out� some� key� functions� of� the� university� before�decentralization.� This� percentage� has� increased� from� 4.2� percent� in� 2004/05� to� 5.9�percent�in�2007/08.�
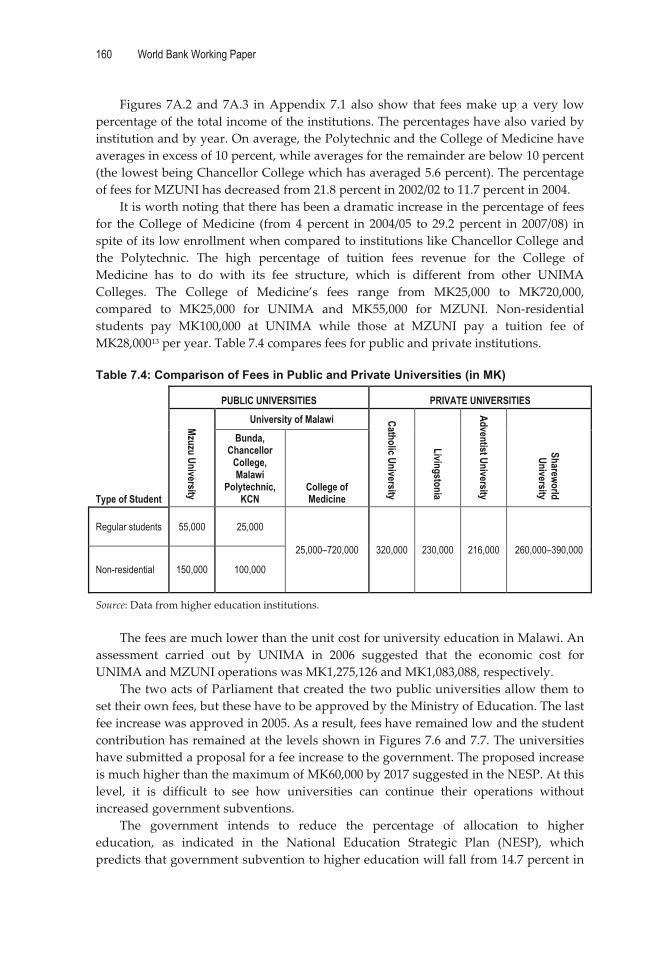
160 World Bank Working Paper
�
Figures� 7A.2� and� 7A.3� in�Appendix� 7.1� also� show� that� fees�make�up� a�very� low�percentage�of�the�total�income�of�the�institutions.�The�percentages�have�also�varied�by�institution�and�by�year.�On�average,�the�Polytechnic�and�the�College�of�Medicine�have�averages�in�excess�of�10�percent,�while�averages�for�the�remainder�are�below�10�percent�(the�lowest�being�Chancellor�College�which�has�averaged�5.6�percent).�The�percentage�of�fees�for�MZUNI�has�decreased�from�21.8�percent�in�2002/02�to�11.7�percent�in�2004.��
It�is�worth�noting�that�there�has�been�a�dramatic�increase�in�the�percentage�of�fees�for� the�College�of�Medicine� (from�4�percent� in� 2004/05� to� 29.2�percent� in� 2007/08)� in�spite�of�its�low�enrollment�when�compared�to�institutions�like�Chancellor�College�and�the� Polytechnic.� The� high� percentage� of� tuition� fees� revenue� for� the� College� of�Medicine� has� to� do� with� its� fee� structure,� which� is� different� from� other� UNIMA�Colleges.� The� College� of� Medicine’s� fees� range� from� MK25,000� to� MK720,000,�compared� to� MK25,000� for� UNIMA� and� MK55,000� for� MZUNI.� Non�residential�students� pay� MK100,000� at� UNIMA� while� those� at� MZUNI� pay� a� tuition� fee� of�MK28,00013�per�year.�Table�7.4�compares�fees�for�public�and�private�institutions.���Table 7.4: Comparison of Fees in Public and Private Universities (in MK)
Type of Student
PUBLIC UNIVERSITIES PRIVATE UNIVERSITIES
Mzuzu University
University of Malawi Catholic University
Livingstonia
Adventist University
Shareworld University
Bunda, Chancellor
College, Malawi
Polytechnic, KCN
College of Medicine
Regular students 55,000 25,000
25,000–720,000 320,000 230,000 216,000 260,000–390,000
Non-residential 150,000 100,000
Source:�Data�from�higher�education�institutions.��
The�fees�are�much�lower�than�the�unit�cost�for�university�education�in�Malawi.�An�assessment� carried� out� by� UNIMA� in� 2006� suggested� that� the� economic� cost� for�UNIMA�and�MZUNI�operations�was�MK1,275,126�and�MK1,083,088,�respectively.��
The�two�acts�of�Parliament�that�created�the�two�public�universities�allow�them�to�set�their�own�fees,�but�these�have�to�be�approved�by�the�Ministry�of�Education.�The�last�fee�increase�was�approved�in�2005.�As�a�result,�fees�have�remained�low�and�the�student�contribution�has�remained�at�the�levels�shown�in�Figures�7.6�and�7.7.�The�universities�have�submitted�a�proposal�for�a�fee�increase�to�the�government.�The�proposed�increase�is�much�higher�than�the�maximum�of�MK60,000�by�2017�suggested�in�the�NESP.�At�this�level,� it� is� difficult� to� see� how� universities� can� continue� their� operations� without�increased�government�subventions.��
The� government� intends� to� reduce� the� percentage� of� allocation� to� higher�education,� as� indicated� in� the� National� Education� Strategic� Plan� (NESP),� which�predicts�that�government�subvention�to�higher�education�will�fall�from�14.7�percent�in�
The Education System in Malawi 161
�
2008�to�10.4�percent�in�201714.�However,�the�proposed�reduction�in�the�percentage�does�not�necessarily�mean�a�reduction�of�the�subventions�in�real�terms.�If�the�GDP�increases�as�anticipated,� then�the�percentage�allocated�to�education�in�the�budget�will� increase.�In� turn,� the�allocation� to�higher�education� in� real� terms�may�also� increase�even� if� its�share�related�to�the�global�education�sector�may�decrease.�
Tuition�fees�are�the�main�source�of�income�in�the�private�colleges.�The�fees�range�from�MK230,000� at� Livingstonia� to�MK390,000� at� Shareworld,� as� shown� in� table� 7.4.�The� tuition� fees� at� Adventist� University� are� charged� per� credit� hour15.� This� has�increased� from�MK2,000� in�2004� to�MK�4,000� in�2008.�Students�at�Adventist�also�pay�boarding�fees�in�addition�to�the�tuition�fees.�Livingstonia�University�has�relied�a�great�deal� on� support� from� private� organizations.� Other� resources� are� generated� from�linkages� with� external� universities� in� the� United� States.� The� other� church�related�universities� also� receive�minimal� funding� from� their� church� organizations� (less� than�three�percent�of�their�total�income).�Shareworld�University�relies�solely�on�tuition�fees,�which� range� from� 260,000� to� 390,000.� The� fees� in� private� institutions� are� therefore�significantly�higher�than�those�in�public�institutions,�with�the�exception�of�the�College�of�Medicine.�The� tuition� fees�of�private�universities,�which� rely�almost� solely�on� this�income� source,� are� well� below� the� determined� economic� costs� for� the� public�institutions.�This� raises� the�question�of�how�the� institutions�are�managing� to�provide�education�at�costs�so�well�below�assessed�economic�unit�costs�for�Malawi.�
The� third� source� of� income� is� funds� generated� by� the� institution� through�consultancy�services.�Figure�7.4� indicates� that� the�UNIMA�colleges�have�been�able� to�generate�their�own�resources�at�varying�levels.�The�data�show�that�College�of�Medicine�generated�the�highest�percentage�of�its�income�(21.2)�while�Chancellor�College�had�the�lowest�(4.4)�in�2007/08.�The�MIM�report16�suggested�that�there�is�scope�for�universities�to�generate�higher�levels�of�their�own�resources.�The�departments/faculties�can�retain�a�certain� percent� of� the� income� it� generates� but� the� percentages� vary� from� college� to�college.� A� substantial� amount� of� resources� generated� in� the� departments� are� not�accounted�for�because�of�lack�of�a�coordinated�system�to�monitor�the�income.��
MZUNI� also� receives� donations� generated� by� a� fund�raising� committee� that� has�been� created� for� this�purpose.� From�2003/04–2004/05,�donations�have�provided�more�income�than�other�sources�generated�within�the�institution.�While�donations�made�up�only�0.8�percent�of� total� income� in�2002/03,� they� increased� to�15.4�percent� in�2003/04;�other� resources� contributed� 3.9� percent� in� 2002/03� and� increased� to� 6.8� percent� in�2003/4.��
Given� the� government’s� intention� to� reduce� the� percentage� of� the� education�budget� allocated� to� higher� education� and� the� noted� delay� in� increasing� tuition� fees,�universities�need�to�consider�generating�their�own�resources�if�they�are�to�survive.�
Expenditure
The� actual� expenditures� for� both� UNIMA� colleges� and� MZUNI� for� other� recurrent�transactions� (ORT)� for�2003–2008�are� shown� in� tables�7A.1017�and�7A.11� in�Appendix�7.4.��
162 World Bank Working Paper
�
Expenditure�Trends�Tables� 7A.1,� 7A.2,� 7A.3,� and� 7A.4� in� Appendix� 7.2� show� the� percentage� of� selected�categories�of�expenditure�for�UNIMA,�MZUNI,�Livingstonia�University,�and�Catholic�University,� respectively.18� The� data� show� difference� in� their� expenditure� patterns,�which�could�be�attributed�to�differences�in�management�structure,�practices,�programs�offered,� and� the� age� of� the� institutions.� The� analysis� shows� that� for� the� four�institutions,� emoluments� and� benefits� of� staff� consumed� that� largest� share� of� the�expenditures.�While� the� percentages� for� these� categories� fluctuated� over� the� period,�they�were�at� their�highest� in�2006/07�for� the�public� institutions.�UNIMA�has�a�higher�percentage�of�its�expenditure�in�this�category�than�MZUNI.�
For� MZUNI,� the� second� highest� expenditure� item� is� student�provisions/allowances,�which� decreased� from� 17.4� percent� in� 2003/04� to� 9� percent� in�2006/07�with� increased�enrollments.�This� is� substantial� for�an�expenditure� that� is�not�considered� a� core� business� of� the� university.� The� public� institutions� are� hoping� to�reduce� this� category� through� outsourcing� (expected� to� start� in� 2009).� For� UNIMA,�except� for� Bunda,� the� second� largest� expenditure� category� was� common� services,�which�includes�general�administration.�
UNIMA’s�student�provisions/allowances�fell�into�third�place.�The�costs�captured�in�the�data�do�not�include�all� the�additional�administrative�costs�incurred�by�the�central�office.�If�this�was�taken�into�account,�the�percentage�for�general�administration�would�be�higher�for�UNIMA.��
Provision�of�common�services�was�the�third�highest�expenditure�for�MZUNI,�but�this�expenditure�has�decreased�over� time.�Lease� financing�and� the�purchase�of�assets�was� MZUNI’s� fourth� largest� expenditure� category� (except� for� 2004/05),� closely�followed� by� the� expenditures� for� teaching� materials/equipment.� The� increase� in�teaching� materials/equipment� is� a� step� in� the� right� direction� because� this� is� a� core�function�expenditure.�
Quality�related�inputs�such�as�teaching�materials�have�shown�low�expenditure�and�the�category�has�remained�below�one�percent�at�UNIMA.�Books�and�periodicals�have�also�been�a�low�priority�in�both�public�institutions,�especially�at�UNIMA�where�again�the�percentage�allocation�has�remained�below�one�percent,�with�no�expenditure�at�all�in�2003/04.�An�analysis�of� the�expenditure�patterns� for� the� individual� colleges� shows�that� all� colleges� have� spent� very� little� or� nothing� on� these� two� important� categories�despite� the� great� shortage� of� teaching� materials,� books,� and� periodicals� in� these�institutions.�
Allocations� to� staff� development� are� low� for� the� two� public� institutions,� falling�below� two� percent.� Publications� and� research� allocations� are� also� low� and� not�conducive�to�promoting�research�in�the�institutions.�However,�visits�to�the�institutions�have�revealed�that�some�research�is�going�on,�in�some�cases�with�funding�from�external�sources.�But�reliance�on�donor�support�for�research�is�not�sustainable�and�the�work�so�supported�may�not�necessarily�address�the�research�needs�of�Malawi.�
It�has�not�been�possible�to�carry�out�an�in�depth�analysis�of�expenditure�patterns�in�private� universities� because� of� a� lack� of� data.� Tables� 7.5c� and� 7.5d� show� the�expenditure� patterns� for� Livingstonia� University� and� Catholic� University� for� which�expenditure� was�made� available.� The� tables� show� that� the� expenditure� patterns� are�somewhat� different� from� that� of� public� institutions.� One� major� difference� is� the�
The Education System in Malawi 163
�
percentage� spent� on� remuneration,�which� is�much� lower� than� in� public� institutions.�Livingstonia� also� tends� to� spend� a� higher� percentage� of� its� income� on� student�provisions,� although� this� has� been� decreasing� over� the� years.� Student�provision/allowances� for� Livingstonia� University� exceeded� the� percentage� of�emoluments� in�2003/04�and�have�remained�above�20�percent.�Teaching�materials�and�equipment� have� been� receiving� a� much� higher� allocation� at� Livingstonia� than� at�UNIMA.�Yet�books�and�periodicals�were�allocated�3.1�percent� in�2003/04�but� little�or�nothing� in� subsequent� years.� Catholic� University� has� spent� small� percentages� on�teaching�materials/equipment� and� on� books� and� periodicals� over� the� last� two� years.�The� other� private� colleges� spend� a� much� lower� percentage� of� their� revenue� on�emoluments,�however�an� increase�has�been�observed� in� this�category�of�expenditure.�For�instance,�at�Adventist�University�the�percentage�has�increased�from�10.1�percent�in�2004�to�27.4�percent�in�2008.19�The�expenditure�at�Catholic�is� in�the�same�range�of�the�public� universities� and� set� to� get� even� higher� according� to� the� budget� estimate� for�2008/09,�when�the�numbers�will�reach�74.5�percent.�Shareworld�spent�only�31.7�percent�of�its�expenditure�on�emoluments�and�benefits.20��
Livingstonia� University� provides� meals� for� students,� which� might� explain� the�large� percentage� of� expenditure� on� student� provisions/allowances.� At� Adventist�University,�the�students�pay�accommodation�fees�that�are�used�to�finance�their�meals�and� these� fees� are� reviewed�upwards�annually.�At�Catholic�University,�parents�have�taken� charge� of� student� meals� and� the� food� has� been� completely� outsourced� to� a�private�company,�with�the�university�only�providing�a�supervisor�to�ensure�quality�of�service.� This� is� reflected� in� the� reduction� in� the� percentage� of� the� expenditure� on�student�provisions/allowances,�which�has�decreased�from�17.2�percent�in�2006/07�and�is�anticipated�to�drop�to�0.9�percent� in�the�current�financial�year.�Shareworld�is�not�a�residential�institution�but�does�assist�students�in�finding�accommodation�with�private�lodge�owners�and�therefore�does�not�incur�any�serious�costs�for�this�category.��
Surpluses�and�Deficits�Table�7.5�shows�the�surpluses�and�deficits�of�the�expenditures�for�the�UNIMA�colleges.�The�data� show� that� all� colleges,� including� the�University�Office,�have� incurred� some�deficits�in�their�expenditure.�Of�particular�note�is�Bunda�College,�which�has�deficits�for�2005/06–2007/08.� Its� trend� shows� a� surplus� of�MK1,815,000� in� 2004/05,� leading� to� an�increased�deficit�of�MK�222,461,001�in�2007/08.�The�deficit�for�2006/07�was�34.6�percent�of� the� total� income� for� that� year.� The� deficit� for� 2007/08�was� 26.7� percent.� This� is� a�substantial� over�expenditure� and� it� suggests� either� serious� underfunding� or� lack� of�financial� controls� and� oversight.�Chancellor�College� had� an� over�expenditure� of� 18.8�percent� in� 2006/07� but� this� was� reduced� to� �2.3� percent� in� 2007/08.� The� College� of�Medicine,� which� incurred� an� 18.7� percent� surplus� in� 2005/06� incurred� a� deficit� of� 5�percent� in� 2007/08.� Both� Kamuzu� College� of� Nursing� and� the� Polytechnic� incurred�surpluses�of�11.6�and�7.6�percent�in�2007/08,�having�sustained�respective�deficits�of�7.5�and�10.6�percent�in�the�previous�year.����
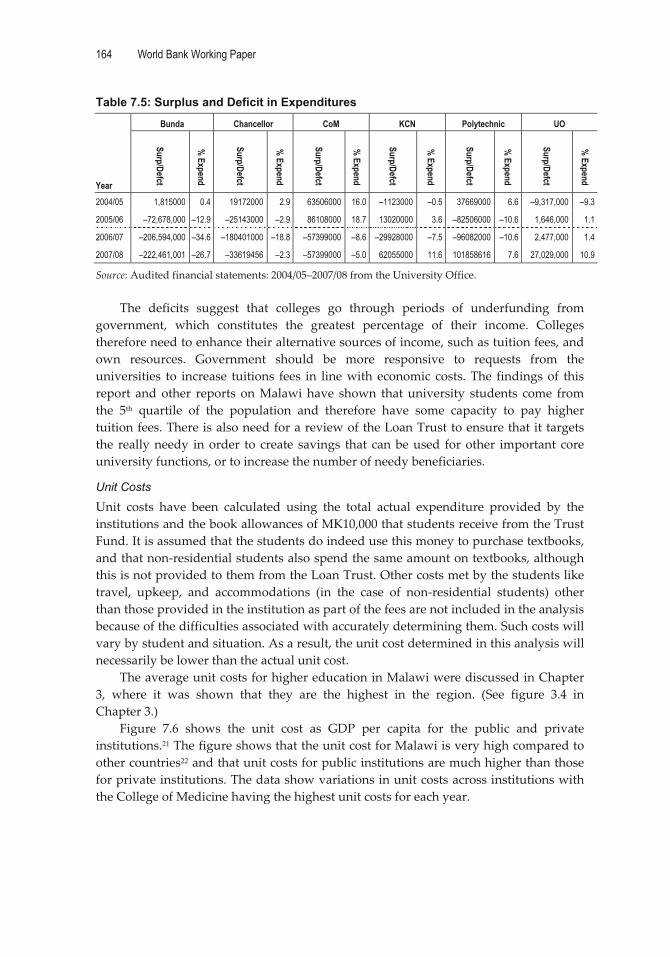
164 World Bank Working Paper
�
Table 7.5: Surplus and Deficit in Expenditures
Year
Bunda Chancellor CoM KCN Polytechnic UO
Surp/Defct
% Expend
Surp/Defct
% Expend
Surp/Defct
% Expend
Surp/Defct
% Expend
Surp/Defct
% Expend
Surp/Defct
% Expend
2004/05 1,815000 0.4 19172000 2.9 63506000 16.0 –1123000 –0.5 37669000 6.6 –9,317,000 –9.3
2005/06 –72,678,000 –12.9 –25143000 –2.9 86108000 18.7 13020000 3.6 –82506000 –10.6 1,646,000 1.1
2006/07 –206,594,000 –34.6 –180401000 –18.8 –57399000 –8.6 –29928000 –7.5 –96082000 –10.6 2,477,000 1.4
2007/08 –222,461,001 –26.7 –33619456 –2.3 –57399000 –5.0 62055000 11.6 101858616 7.6 27,029,000 10.9
Source:�Audited�financial�statements:�2004/05–2007/08�from�the�University�Office.��
The� deficits� suggest� that� colleges� go� through� periods� of� underfunding� from�government,� which� constitutes� the� greatest� percentage� of� their� income.� Colleges�therefore�need�to�enhance�their�alternative�sources�of�income,�such�as�tuition�fees,�and�own� resources.� Government� should� be� more� responsive� to� requests� from� the�universities� to� increase� tuitions� fees� in� line�with� economic� costs.�The� findings�of� this�report� and�other� reports� on�Malawi�have� shown� that�university� students� come� from�the� 5th� quartile� of� the� population� and� therefore� have� some� capacity� to� pay� higher�tuition�fees.�There�is�also�need�for�a�review�of�the�Loan�Trust�to�ensure�that�it�targets�the� really�needy� in�order� to� create� savings� that� can�be�used� for�other� important� core�university�functions,�or�to�increase�the�number�of�needy�beneficiaries.�
Unit Costs
Unit� costs� have� been� calculated� using� the� total� actual� expenditure� provided� by� the�institutions�and�the�book�allowances�of�MK10,000�that�students�receive�from�the�Trust�Fund.�It�is�assumed�that�the�students�do�indeed�use�this�money�to�purchase�textbooks,�and�that�non�residential�students�also�spend�the�same�amount�on�textbooks,�although�this�is�not�provided�to�them�from�the�Loan�Trust.�Other�costs�met�by�the�students�like�travel,� upkeep,� and� accommodations� (in� the� case� of� non�residential� students)� other�than�those�provided�in�the�institution�as�part�of�the�fees�are�not�included�in�the�analysis�because�of�the�difficulties�associated�with�accurately�determining�them.�Such�costs�will�vary�by�student�and�situation.�As�a�result,�the�unit�cost�determined�in�this�analysis�will�necessarily�be�lower�than�the�actual�unit�cost.��
The�average�unit�costs�for�higher�education�in�Malawi�were�discussed�in�Chapter�3,� where� it� was� shown� that� they� are� the� highest� in� the� region.� (See� figure� 3.4� in�Chapter�3.)�
Figure� 7.6� shows� the� unit� cost� as� GDP� per� capita� for� the� public� and� private�institutions.21�The�figure�shows�that�the�unit�cost�for�Malawi�is�very�high�compared�to�other�countries22�and�that�unit�costs�for�public�institutions�are�much�higher�than�those�for�private�institutions.�The�data�show�variations�in�unit�costs�across�institutions�with�the�College�of�Medicine�having�the�highest�unit�costs�for�each�year.���
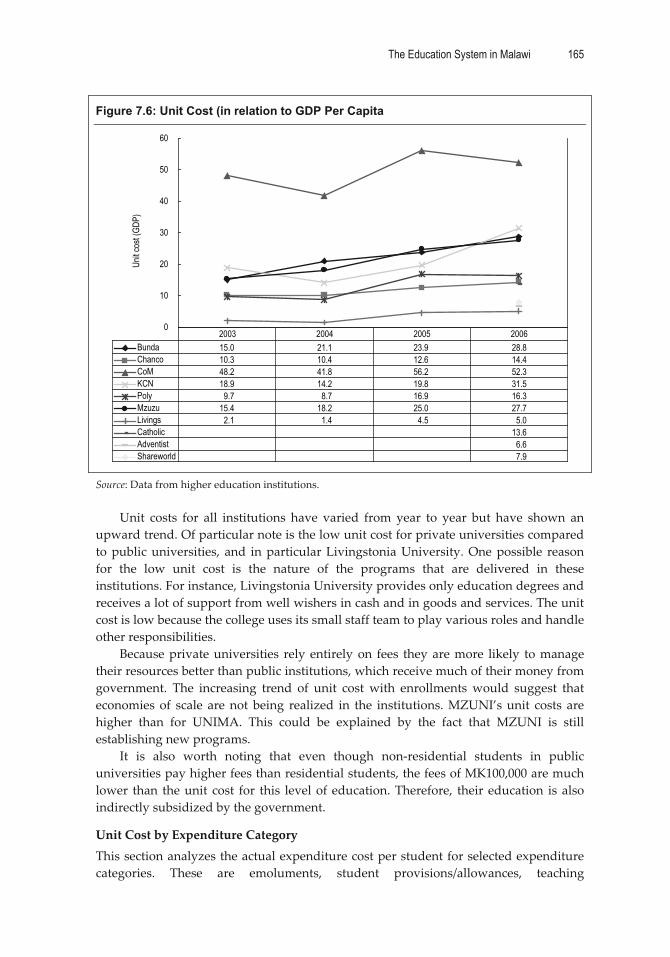
The Education System in Malawi 165
�
Figure 7.6: Unit Cost (in relation to GDP Per Capita
0
10
20
30
40
50
60Un
it cos
t (GD
P)
Bunda 15.0 21.1 23.9 28.8Chanco 10.3 10.4 12.6 14.4CoM 48.2 41.8 56.2 52.3KCN 18.9 14.2 19.8 31.5Poly 9.7 8.7 16.9 16.3Mzuzu 15.4 18.2 25.0 27.7Livings 2.1 1.4 4.5 5.0Catholic 13.6Adventist 6.6Shareworld 7.9
2003 2004 2005 2006
�
Source:�Data�from�higher�education�institutions.��
Unit� costs� for� all� institutions� have� varied� from� year� to� year� but� have� shown� an�upward�trend.�Of�particular�note�is�the�low�unit�cost�for�private�universities�compared�to�public�universities,� and� in�particular�Livingstonia�University.�One�possible� reason�for� the� low� unit� cost� is� the� nature� of� the� programs� that� are� delivered� in� these�institutions.�For�instance,�Livingstonia�University�provides�only�education�degrees�and�receives�a�lot�of�support�from�well�wishers�in�cash�and�in�goods�and�services.�The�unit�cost�is�low�because�the�college�uses�its�small�staff�team�to�play�various�roles�and�handle�other�responsibilities.��
Because�private�universities� rely�entirely�on� fees� they�are�more� likely� to�manage�their�resources�better�than�public�institutions,�which�receive�much�of�their�money�from�government.� The� increasing� trend� of� unit� cost� with� enrollments�would� suggest� that�economies� of� scale� are�not� being� realized� in� the� institutions.�MZUNI’s�unit� costs� are�higher� than� for� UNIMA.� This� could� be� explained� by� the� fact� that� MZUNI� is� still�establishing�new�programs.��
It� is� also� worth� noting� that� even� though� non�residential� students� in� public�universities�pay�higher�fees�than�residential�students,�the�fees�of�MK100,000�are�much�lower� than� the�unit� cost� for� this� level�of�education.�Therefore,� their� education� is� also�indirectly�subsidized�by�the�government.�
Unit�Cost�by�Expenditure�Category�This�section�analyzes�the�actual�expenditure�cost�per�student�for�selected�expenditure�categories.� These� are� emoluments,� student� provisions/allowances,� teaching�

166 World Bank Working Paper
�
materials/equipment,� and� common� services.� A� comparison� of� tables� 7.7a� and� 7.7b�shows� that� the� unit� costs� for� emoluments� and� benefits� in� both� institutions� have�increased�substantially� for� the�period�under�review,�with�MZUNI�having�higher�unit�costs� than� UNIMA� except� in� 2003/04.� This� shows� a� problem� of� staff� usage� in� the�institutions.� With� good� management� and� efficient� utilization� of� staff,� unit� costs� on�emoluments� should� be� expected� to� decrease.� The� increase� in� this� unit� cost� is� also�related� to� increases� in� salaries� and� benefits� during� this� period.� An� analysis� of� the�enrollment� data� for� MZUNI� shows� that� the� institution� offers� courses� to� very� small�classes,� especially� in� the�newly� introduced�programs.�Economies�of� scale� that� can�be�achieved� from�having� large�classes�are�obviously�not�being� realized.�A�policy�on� the�minimum�number�of�students�that�are�required�before�a�class�can�be�offered�is�needed.�For�example,�Catholic�University�requires�a�minimum�of�12�students�before�a�program�can�be�offered.���Table 7.6a: Unit Cost Per Expenditure Category: UNIMA (in MK)
2003/04 2004/05 2005/06 2006/07 Emoluments and benefits 254,822 239,538 329,891 404,965 Student provisions/allowances 26,955 37,788 44,591 47,594 Teaching materials/equipment 2,258 3,212 2,428 6,519 Books and periodicals 209 4,104 1,210 1,374 Common services (represents general administration) 56,639 45,077 85,214 96,899
Source:�Data�from�UNIMA�colleges.��Table 7.6b: Unit Cost per Expenditure Category: MZUNI (in MK)
2003/04 2004/05 2005/06 2006/07 Emoluments and benefits 222,496 306,233 395,920 508,378 Student provisions/allowances 96,990 90,346 93,668 90,948 Teaching materials/equipment 9,460 24,668 77,093 88,148 Books and periodicals 20,226 12,039 12,737 14,307 Common services (represents general administration) 33,774 48,132 14,013 19,636
Source:�Data�from�MZUNI.��
Student� provisions/allowances� for� both� institutions� are� relatively� high� compared�with�other�categories�for�both�institutions�and�again�those�for�MZUNI�are�higher�than�those�for�UNIMA.�It�is�interesting�to�note�that�this�unit�cost�is�higher�than�the�total�fees�paid�by�students,�which�combines�both�tuition�and�provision�of�MK25,000�at�UNIMA�and�MK55,000�at�MZUNI.�These�figures�emphasize�the�levels�of�subsidization�in�higher�education� and� call� into� question�whether� the� concept� of� cost� sharing� is� really� being�achieved�in�these�institutions.��
Unit�costs�for�teaching�and�learning�materials�and�equipment�show�an�increasing�trend�for�both�institutions,�with�MZUNI�providing�a�higher�allocation�per�student�than�UNIMA.�For�instance�MZUNI�provided�3.6�percent�in�2003/04�and�increased�this�to�8.3�percent� in� 2006/07� for� learning�and� teaching�materials.�Their� allocation� to�books�and�periodicals� has� remained� above� 1.4� percent� for� the� period.� This� could� be� because�MZUNI�is�still� introducing�new�programs�and�has�to�allocate�more�to�this� item.�Unit�
The Education System in Malawi 167
�
costs�for�research�and�publications�are�also�very�low.�The�level�of�funding�is�against�a�background�where�most�of� the�equipment� is�old,�obsolete,�and�unserviceable.�This� is�particularly� so� in� the� fields� of� engineering� and� science.� The� capital� budget� to� public�institutions�has�been�non�existent,�although�some�commitment�to�this�has�been�made�in�the�National�Education�Sector�Plan�(NESP).�The�libraries�are�also�old�and�inadequate�for�the�level�of�enrollments�in�the�colleges.��
Donor�funding�to�institutions�for�equipment�has�been�limited,�leaving�institutions�totally� dependent� on� government� subventions� for� these� items.� The�World� Bank� has�provided�some�learning�and�teaching�resources�to�Chancellor�College,�the�Polytechnic,�and�MZUNI�as�part�of�the�rehabilitation�and�staff�development�program.�SIU�has�also�provided� some� resources� to� UNIMA� colleges� through� direct� financing� and� linkages�with�external�universities.�Universities�should�therefore�prioritize�those�categories�that�are�directly�related�to�their�core�functions.��
Recommendations� from� the� MIM� report� suggested� that� UNIMA� should� devise�ways�to�reduce�unit�costs�given�the�high�percentage�allocation�to�higher�education�in�the�education�budget.�This�has�not�apparently�been� the�case�since�unit�costs� for�both�institutions�are� increasing�with�MZUNI�having�a�much�higher�unit� cost� in�2008� than�UNIMA.�Steps�have�been�taken�in�the�public� institutions�to�reduce�unit�costs�by�out�sourcing�some�non�professional�services�in�the�UNIMA�colleges�like�cleaning,�security,�and� ground� maintenance.� This� is� a� step� in� the� right� direction.� The� impact� of� this�initiative� on� unit� costs� has� not� been� felt� because� the� reforms� started� in� 2008� and�outsourcing�of�student�provisions�will�only�start�in�2009.��
Student Financing
The�National�University�Student�Loan�Trust�(NUSLT),�which�should�lend�and�recover�the� loans� from� graduates,� was� established� in� 2005.� Before� then,� students� received�grants�and�loans,�which�were�never�recovered.�The�Malawi�model,�like�many�others�in�the�world,� is� the�mortgage�type� loan�with� a� fixed� rate� of� payment� over� a� period� of�time.� Other� countries� use� the� income� contingency� system,� which� is� based� on� a�percentage�of�the�salary�of�the�borrowers�when�they�are�in�employment�until�the�loan�is�repaid.�
The�main�objective�of�the�NUSLT�is�to�improve�access,�especially�for�the�“needy”23�from�poor�backgrounds,� thereby�ensuring�equity.�This�also�constitutes�a� form�of�cost�sharing,�which�would�in�turn�be�a�source�of�revenue�for�the�universities.�A�silent�and�not� often� mentioned� objective� is� the� increase� in� motivation� and� serious� pursuit� of�learning�among�students�who�are�paying�for�their�education�(albeit�in�the�future).�
Unlike�loan�schemes�in�other�countries,�this�system�does�not�apply�a�“means�test.”�It� is� reported� that�about�one�percent�of� the�applicants�are� turned�down�based�on� the�information�provided�by�the�guarantor.�Non�residential,�mature�entry�students;�those�in� non�degree� programs� in� the� public� universities;� and� those� in� accredited� private�universities� are� not� eligible� for� loans� from� the� Trust.� Like�many� other� student� loan�systems,�the�National�University�Student�Loan�Trust�(NUSLT)�is�solely�financed�by�the�government,� although� the� Trust� is� empowered� to� solicit� additional� resources� for� the�Fund.��
The� loan�provides� for� the� fees� that�comprise� tuition�and�accommodation�and�are�paid�directly�to�the�institution.�A�book�allowance�of�MK10,000�is�part�of�the�loan�and�is�

168 World Bank Working Paper
�
paid�directly�to�the�student.�The�total�loan�disbursement�for�the�four�year�programs�in�Malawi�universities�is�MK140,000�for�a�student�at�UNIMA�and�MK224,000�for�MZUNI.�Since� the� scheme’s� inception,� more� than� MK400,000,000� has� been� disbursed,� but�recovery�has�not�yet�started.��
The� loan� agreement� requires� that� loan� repayment� start� three� months� after�completion� of� studies� and� is� payable� over� a� period� of� six� years� in� equal� monthly�installments.�The�loan�is�interest�free.�This�payment�rate�translates�to�MK1,944�monthly�for� UNIMA� graduates� and� MK3,111� monthly� for� MZUNI� graduates� over� the� 72�months� of� the� payment� period.� Results� from� the� tracer� study� 24� showed� that� the�arithmetic�mean�of�the�monthly�salaries�for�university�graduates�was�MK83,681�and�a�median� of� MK65,000.� The� computed� payment� rates� amount� to� 3� percent� and� 4.7�percent�of� the�median�salaries�for�UNIMA�and�MZUNI�graduates.�This�suggests�that�for� those� in� employment� the� monthly� repayment� amount� is� manageable� and� could�even�be�increased�for�quicker�recovery,�which�would�result�in�a�better�loan�repayment�ratio.�In�addition�to�this,�the�tracer�study�on�higher�education�graduates�showed�that�it�takes�up�to�5.5�months�for�those�seeking�employment�to�get�a�job.�This�of�course�varies�with�the�field�of�study.�On�average�the�study�found�that�75�percent�of�graduates�secure�employment�after�six�months.�The�grace�period�of�3�months�is�therefore�too�short�and�needs�to�be�adjusted.�
Article�6�of�the�agreement�requires�the�participation�of�employers�of�graduates�in�deducting� and� remitting� the� monthly� repayments� to� the� Trust.� In� the� event� of� the�borrower� defaulting� on� payment,� Article� 7� provides� for� the� Trust� to� “use� any� lawful�means�as�it�deems�necessary�to�recover�the�loan.”�The�agreement�also�makes�the�guarantor�responsible�for�the�payment�of�the�loan�in�case�of�death�of�the�borrower�in�Article�8(2)�of� the�Agreement.�However,� there� is�no� legal� framework� to�enforce� these�provisions.�Countries� like�Zimbabwe�and�South�Africa�have� such� legal� frameworks,�which�have�proved�effective�in�improving�loan�repayments.�A�legal�framework�that�spells�out�the�responsibilities�and�obligations�of� all�parties�and� the�applicable� sanctions� is� a� critical�prerequisite�to�the�success�of�this�scheme.�
The�agreement�further�holds�the�guarantor�responsible�for�lack�of�payment�of�the�loan� in� the� event�of� the�borrower� failing� to�pay�even�as� a� result� of�death.�There� is� a�need�to�provide�for�deferment�of� the� loans� in�periods�of�unemployment�and�genuine�economic�hardship�and�cancellation�in�the�case�of�death�of�the�borrower.�
The�recovery�ratio�of�the�total�loans�disbursed�will�be�affected�by�repayment�ratio25�and� administrative� efficiency� in� the� recovery� of� the� loans� including� the� ability� to�reduce� the� level� of� defaulters.� A� number� of� studies� that� have� been� conducted� on�student�loan�schemes�(Shen�and�Ziderman,�2008)�have�shown�that�the�recovery�ratio�is�affected� by� interest� subsidy� and� payment� periods.� The� interest� rate� subsidy� creates�high� hidden� costs� that� result� in� low� repayment,� while� long� payment� periods� also�increase� the�hidden�grant� to� the�borrower.�Both� these�have� the�effect�of� lowering� the�repayment� ratio.26� Countries� that� have� completely� interest�free� loans� in� Africa,� like�Egypt� and� Ethiopia,� have� recovery� rates� of� 11.95� and� 35.24,� respectively.� Namibia,�however,�has�a�small�built�in�subsidy�ratio�of�0.2127�has�a�repayment�ratio�of�close� to�100�percent.�Because�the�student�loans�in�Malawi�are�interest�free�and�payable�over�a�period� of� six� years,� the� government� has� built�in� subsidies� that� will� reduce� the� loan�repayment� ratio.�Other� factors� that�will� affect� the� loan� repayment� ratio� are� payment�
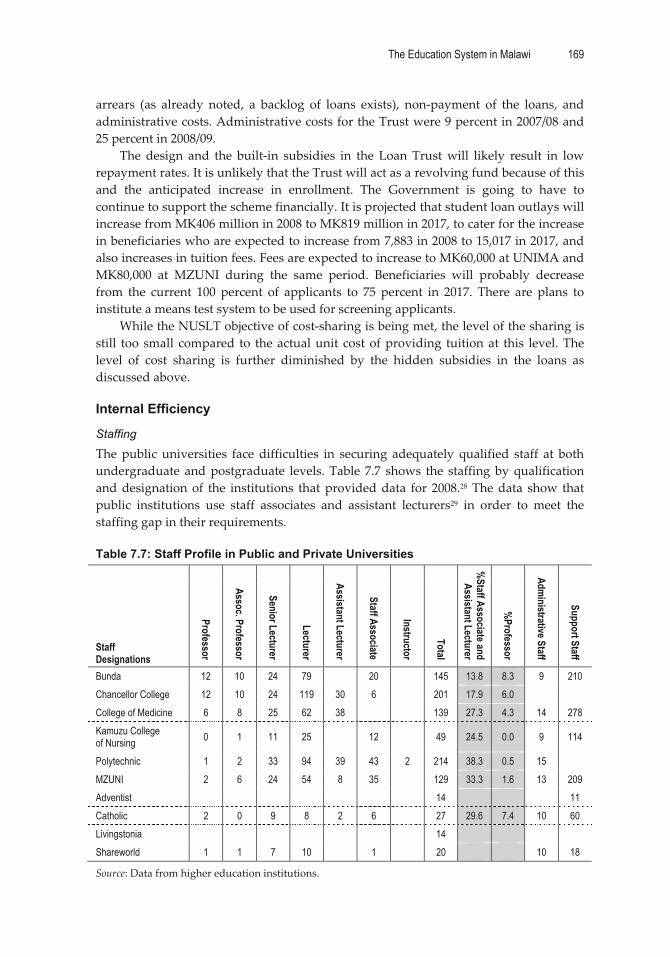
The Education System in Malawi 169
�
arrears� (as� already� noted,� a� backlog� of� loans� exists),� non�payment� of� the� loans,� and�administrative�costs.�Administrative�costs�for�the�Trust�were�9�percent�in�2007/08�and�25�percent�in�2008/09.�
The� design� and� the� built�in� subsidies� in� the� Loan�Trust�will� likely� result� in� low�repayment�rates.�It�is�unlikely�that�the�Trust�will�act�as�a�revolving�fund�because�of�this�and� the� anticipated� increase� in� enrollment.� The� Government� is� going� to� have� to�continue�to�support�the�scheme�financially.�It�is�projected�that�student�loan�outlays�will�increase�from�MK406�million�in�2008�to�MK819�million�in�2017,�to�cater�for�the�increase�in�beneficiaries�who�are�expected�to�increase�from�7,883�in�2008�to�15,017�in�2017,�and�also�increases�in�tuition�fees.�Fees�are�expected�to�increase�to�MK60,000�at�UNIMA�and�MK80,000� at� MZUNI� during� the� same� period.� Beneficiaries� will� probably� decrease�from� the� current� 100� percent� of� applicants� to� 75� percent� in� 2017.� There� are� plans� to�institute�a�means�test�system�to�be�used�for�screening�applicants.�
While�the�NUSLT�objective�of�cost�sharing�is�being�met,�the�level�of�the�sharing�is�still� too� small� compared� to� the�actual�unit� cost�of�providing� tuition�at� this� level.�The�level� of� cost� sharing� is� further� diminished� by� the� hidden� subsidies� in� the� loans� as�discussed�above.�
Internal Efficiency
Staffing
The�public� universities� face�difficulties� in� securing� adequately� qualified� staff� at� both�undergraduate� and�postgraduate� levels.�Table� 7.7� shows� the� staffing�by�qualification�and�designation�of� the� institutions� that�provided�data� for� 2008.28�The�data� show� that�public� institutions� use� staff� associates� and� assistant� lecturers29� in� order� to� meet� the�staffing�gap�in�their�requirements.��Table 7.7: Staff Profile in Public and Private Universities
Staff Designations
Professor
Assoc. Professor
Senior Lecturer
Lecturer
Assistant Lecturer
Staff Associate
Instructor
Total
%Staff Associate and Assistant Lecturer
%Professor
Administrative Staff
Support Staff
Bunda 12 10 24 79 20 145 13.8 8.3 9 210 Chancellor College 12 10 24 119 30 6 201 17.9 6.0 College of Medicine 6 8 25 62 38 139 27.3 4.3 14 278 Kamuzu College of Nursing 0 1 11 25 12 49 24.5 0.0 9 114
Polytechnic 1 2 33 94 39 43 2 214 38.3 0.5 15 MZUNI 2 6 24 54 8 35 129 33.3 1.6 13 209 Adventist 14 11 Catholic 2 0 9 8 2 6 27 29.6 7.4 10 60 Livingstonia 14 Shareworld 1 1 7 10 1 20 10 18
Source:�Data�from�higher�education�institutions.�
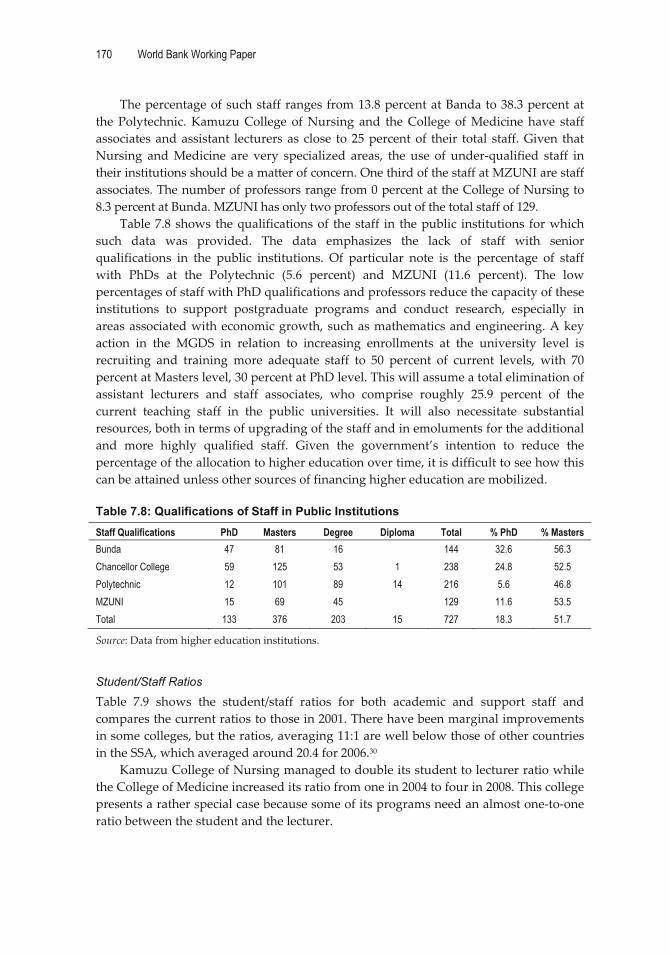
170 World Bank Working Paper
�
The�percentage�of�such�staff�ranges�from�13.8�percent�at�Banda�to�38.3�percent�at�the�Polytechnic.�Kamuzu�College� of�Nursing� and� the�College� of�Medicine� have� staff�associates�and�assistant� lecturers�as� close� to�25�percent�of� their� total� staff.�Given� that�Nursing� and�Medicine� are� very� specialized� areas,� the� use� of� under�qualified� staff� in�their�institutions�should�be�a�matter�of�concern.�One�third�of�the�staff�at�MZUNI�are�staff�associates.�The�number�of�professors�range�from�0�percent�at�the�College�of�Nursing�to�8.3�percent�at�Bunda.�MZUNI�has�only�two�professors�out�of�the�total�staff�of�129.�
Table�7.8�shows� the�qualifications�of� the�staff� in� the�public� institutions� for�which�such� data� was� provided.� The� data� emphasizes� the� lack� of� staff� with� senior�qualifications� in� the� public� institutions.� Of� particular� note� is� the� percentage� of� staff�with� PhDs� at� the� Polytechnic� (5.6� percent)� and� MZUNI� (11.6� percent).� The� low�percentages�of�staff�with�PhD�qualifications�and�professors�reduce�the�capacity�of�these�institutions� to� support� postgraduate� programs� and� conduct� research,� especially� in�areas�associated�with�economic�growth,�such�as�mathematics�and�engineering.�A�key�action� in� the� MGDS� in� relation� to� increasing� enrollments� at� the� university� level� is�recruiting� and� training�more� adequate� staff� to� 50� percent� of� current� levels,� with� 70�percent�at�Masters�level,�30�percent�at�PhD�level.�This�will�assume�a�total�elimination�of�assistant� lecturers� and� staff� associates,� who� comprise� roughly� 25.9� percent� of� the�current� teaching� staff� in� the� public� universities.� It� will� also� necessitate� substantial�resources,�both�in�terms�of�upgrading�of�the�staff�and�in�emoluments�for�the�additional�and� more� highly� qualified� staff.� Given� the� government’s� intention� to� reduce� the�percentage�of�the�allocation�to�higher�education�over�time,�it�is�difficult�to�see�how�this�can�be�attained�unless�other�sources�of�financing�higher�education�are�mobilized.��Table 7.8: Qualifications of Staff in Public Institutions Staff Qualifications PhD Masters Degree Diploma Total % PhD % Masters Bunda 47 81 16 144 32.6 56.3 Chancellor College 59 125 53 1 238 24.8 52.5 Polytechnic 12 101 89 14 216 5.6 46.8 MZUNI 15 69 45 129 11.6 53.5 Total 133 376 203 15 727 18.3 51.7
Source:�Data�from�higher�education�institutions.��
Student/Staff Ratios
Table� 7.9� shows� the� student/staff� ratios� for� both� academic� and� support� staff� and�compares�the�current�ratios�to�those�in�2001.�There�have�been�marginal�improvements�in�some�colleges,�but�the�ratios,�averaging�11:1�are�well�below�those�of�other�countries�in�the�SSA,�which�averaged�around�20.4�for�2006.30��
Kamuzu�College�of�Nursing�managed�to�double�its�student�to�lecturer�ratio�while�the�College�of�Medicine�increased�its�ratio�from�one�in�2004�to�four�in�2008.�This�college�presents�a�rather�special�case�because�some�of�its�programs�need�an�almost�one�to�one�ratio�between�the�student�and�the�lecturer.���

The Education System in Malawi 171
�
Table 7.9: Student/Staff Ratios for 2008
Institution Students Lecturers S/L Ratio
Support Staff S/SS Ratio
2008 2001 2008 2001 Bunda 886 145 6 6 219 4 6 Chancellor 2,446 201 12 8 23 CoM 529 139 4 1 292 2 3 KCN 467 49 10 5 123 4 2 Poly 2,305 214 11 8 18 MZUNI 1448 129 11 8 222 7 3 Adventist 270 14 19 11 25 Catholic 363 27 13 70 5 Livingstonia 147 14 11 0 Shareworld 221 20 11 28 8 Mean 11 6 9
Source:�Data�from�higher�education�institutions.�Note:�The�student/support�staff�ratio�includes�administrative�staff�as�well.��
The� 2004� CSR� noted� that� the� student/support� staff� ratios� were� very� low� and�contributed� to� high� emoluments.� The� current� data� show� improvements� in� the�student/staff� ratios� for� Chancellor� College,� Kamuzu� College� of� Nursing,� the�Polytechnic,� and� MZUNI� but� not� for� Bunda.� Yet� the� improved� ratios� are� still� low,�meaning� that� the� institutions� still� have� the� capacity� to� increase� enrollments�without�necessarily�increasing�their�staff.�This�suggests�inefficiencies�in�how�staff�are�managed�and� utilized.� Better� utilization� of� staff� could� go� a� long� way� towards� reducing� the�current�high�unit�costs.��
Improvements� at� MZUNI� have� been� made� through� a� freeze� in� the� hiring� of�support� staff� and� an� outsourcing� of� new� non�core� areas.� In� 2008,� all� UNIMA�constituent�colleges�retrenched�support�staff� in�of�ground�maintenance,�cleaning,�and�security.�Available�data�show�that�the�Polytechnic�retrenched�117�workers,�College�of�Medicine�39�workers�and�Kamuzu�College�of�Nursing�52�workers.�The�effects�of� this�downsizing�on�ratios�and�emoluments�will�probably�not�be�felt�until�2009/10.�There�are�plans�in�some�colleges�to�outsource�catering,�which�is�one�of�the�biggest�drains�on�the�expenditure�budget.�
The� data� from� the� private� colleges� is� difficult� to� interpret� because� some� have�included� their� adjunct� staff� and� some� have� not.� The� ratio� for� Catholic� University�(which�included�its�adjunct�staff�is�more�in�line�with�the�average�for�the�region).�Those�that�did�not�provide�information�on�adjunct�staff�have�high�ratios�that�would�otherwise�be�reduced�if�adjunct�staff�were�included.�
Graduate Output
University� output� increased� from� 983� in� 2003� to� 1,447� in� 2007� (an� increase� of� 47.2�percent),� in� line�with� increased�enrollments.�The�breakdown�of� the�output�by� field� is�shown�in�table�7.10.�The�data�show�that�by�far�the�largest�number�of�graduates�was�in�education� and� that� ICT� had� the� lowest� number.� Commerce,� which� had� the� second�highest� enrollment� after� education,� also� provided� the� second� highest� output� of�graduates� at� 9.2� percent,� followed� by� environmental� science�with� 8.5� percent.� Social�
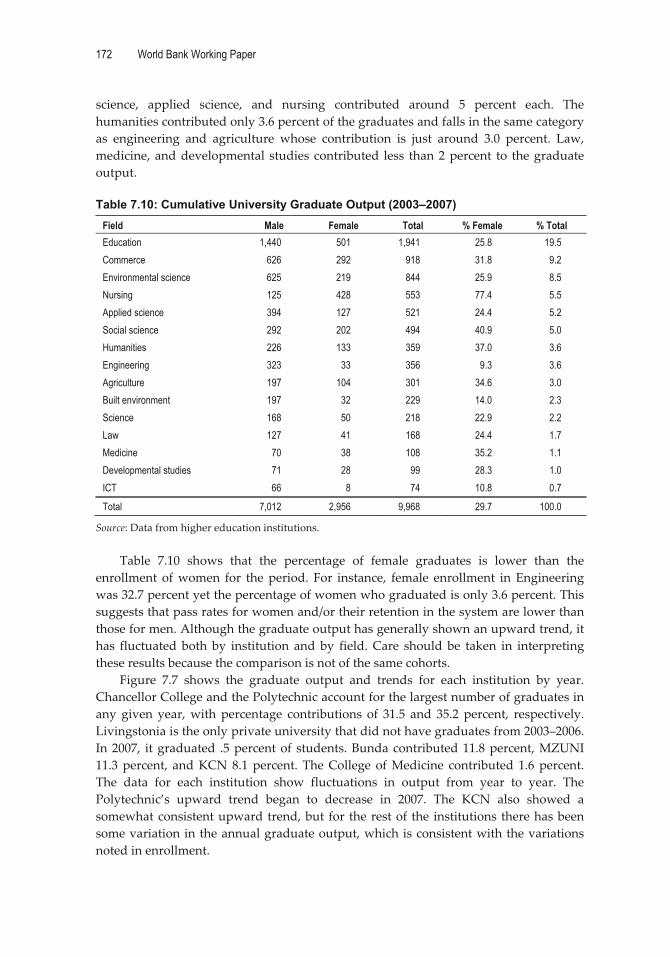
172 World Bank Working Paper
�
science,� applied� science,� and� nursing� contributed� around� 5� percent� each.� The�humanities�contributed�only�3.6�percent�of�the�graduates�and�falls�in�the�same�category�as� engineering� and� agriculture� whose� contribution� is� just� around� 3.0� percent.� Law,�medicine,�and�developmental� studies�contributed� less� than�2�percent� to� the�graduate�output.��Table 7.10: Cumulative University Graduate Output (2003–2007)
Field Male Female Total % Female % Total Education 1,440 501 1,941 25.8 19.5 Commerce 626 292 918 31.8 9.2 Environmental science 625 219 844 25.9 8.5 Nursing 125 428 553 77.4 5.5 Applied science 394 127 521 24.4 5.2 Social science 292 202 494 40.9 5.0 Humanities 226 133 359 37.0 3.6 Engineering 323 33 356 9.3 3.6 Agriculture 197 104 301 34.6 3.0 Built environment 197 32 229 14.0 2.3 Science 168 50 218 22.9 2.2 Law 127 41 168 24.4 1.7 Medicine 70 38 108 35.2 1.1 Developmental studies 71 28 99 28.3 1.0 ICT 66 8 74 10.8 0.7
Total 7,012 2,956 9,968 29.7 100.0
Source:�Data�from�higher�education�institutions.��
Table� 7.10� shows� that� the� percentage� of� female� graduates� is� lower� than� the�enrollment� of�women� for� the�period.� For� instance,� female� enrollment� in�Engineering�was�32.7�percent�yet�the�percentage�of�women�who�graduated�is�only�3.6�percent.�This�suggests�that�pass�rates�for�women�and/or�their�retention�in�the�system�are�lower�than�those�for�men.�Although�the�graduate�output�has�generally�shown�an�upward�trend,�it�has� fluctuated� both� by� institution� and�by� field.�Care� should� be� taken� in� interpreting�these�results�because�the�comparison�is�not�of�the�same�cohorts.�
Figure� 7.7� shows� the� graduate� output� and� trends� for� each� institution� by� year.�Chancellor�College�and�the�Polytechnic�account�for�the�largest�number�of�graduates�in�any� given� year,�with� percentage� contributions� of� 31.5� and� 35.2� percent,� respectively.�Livingstonia�is�the�only�private�university�that�did�not�have�graduates�from�2003–2006.�In�2007,� it�graduated� .5�percent�of� students.�Bunda�contributed�11.8�percent,�MZUNI�11.3�percent,� and�KCN�8.1�percent.� The�College�of�Medicine� contributed� 1.6�percent.�The� data� for� each� institution� show� fluctuations� in� output� from� year� to� year.� The�Polytechnic’s� upward� trend� began� to� decrease� in� 2007.� The� KCN� also� showed� a�somewhat�consistent�upward�trend,�but�for� the�rest�of� the� institutions� there�has�been�some�variation�in�the�annual�graduate�output,�which�is�consistent�with�the�variations�noted�in�enrollment.��

The Education System in Malawi 173
�
Figure 7.7: Trends in Graduate Output by Institution by Year
0
100
200
300
400
500
600
700
Bunda Chancellor CoM KCN Polytechnic MZUNI Livingstonia
Grad
uates
20032004200520062007
�Source:�Data�from�higher�education�institutions.��
Figure�7.8�shows�graduate�output�and�trends�by�field�of�study.�As�can�be�expected,�the�highest�percent�of�graduates�is�in�education�and�the�numbers�have�increased�since�2004.� Given� the� shortage� of� secondary� school� teachers� in�Malawi,� this� is� a�welcome�trend.�However,�it�is�not�known�how�many�of�the�education�graduates�actually�end�up�teaching,�as�the�Tracer�Study�did�not�track�these�graduates.�This�is�an�area�for�further�review�and�analysis.�The�number�of�commerce�graduates�has�fluctuated�annually�and�reached�its�highest�level�in�2005�before�starting�a�downward�trend.�Graduate�output�in�the�environmental�sciences�reached�a�maximum�in�2005�and�declined�in�the�following�two�years.�Graduate�output�in�science�was�at�its�lowest�in�2005�and�is�now�showing�an�upward�trend,�but�the�output�is�still�quite�small�for�such�an�important�field.�The�social�science�graduates�reached�a�peak�in�2005�and�the�numbers�have�since�started�falling.���
Figure 7.8: Trends in Graduate Output by Field of Study
0
50
100
150
200
250
300
350
400
450
500
Educatio
nLaw
Social s
cience
Science
Develop
mental s
tudies
Applied
scien
ce
Commerc
e
Medicin
e ICT
Grad
uates
20032004200520062007
Humani
ties
Agricultu
re
Environ
mental s
cience
Built en
vironm
ent
Enginee
ringNurs
ing
�Source:�Data�from�higher�education�institutions.�
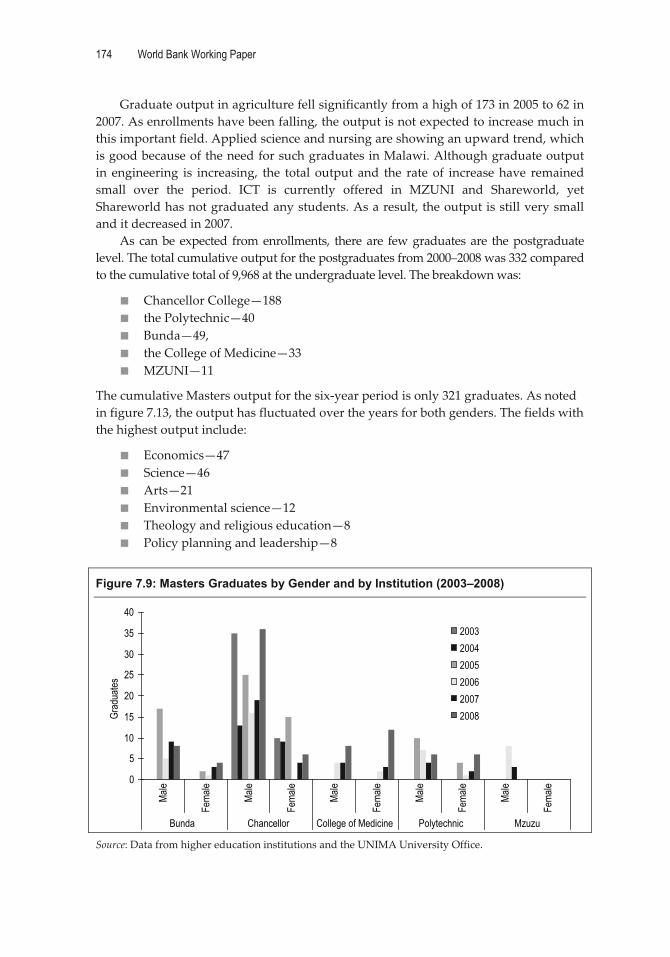
174 World Bank Working Paper
�
Graduate�output�in�agriculture�fell�significantly�from�a�high�of�173�in�2005�to�62�in�2007.�As�enrollments�have�been�falling,�the�output�is�not�expected�to�increase�much�in�this�important�field.�Applied�science�and�nursing�are�showing�an�upward�trend,�which�is�good�because�of�the�need�for�such�graduates�in�Malawi.�Although�graduate�output�in� engineering� is� increasing,� the� total� output� and� the� rate� of� increase�have� remained�small� over� the� period.� ICT� is� currently� offered� in� MZUNI� and� Shareworld,� yet�Shareworld�has�not�graduated�any�students.�As�a�result,�the�output�is�still�very�small�and�it�decreased�in�2007.��
As�can�be� expected� from�enrollments,� there� are� few�graduates� are� the�postgraduate�level.�The�total�cumulative�output�for�the�postgraduates�from�2000–2008�was�332�compared�to�the�cumulative�total�of�9,968�at�the�undergraduate�level.�The�breakdown�was:�
� Chancellor�College—188�� the�Polytechnic—40�� Bunda—49,��� the�College�of�Medicine—33�� MZUNI—11�
The�cumulative�Masters�output�for�the�six�year�period�is�only�321�graduates.�As�noted�in�figure�7.13,�the�output�has�fluctuated�over�the�years�for�both�genders.�The�fields�with�the�highest�output�include:�
� Economics—47�� Science—46�� Arts—21�� Environmental�science—12�� Theology�and�religious�education—8�� Policy�planning�and�leadership—8�
�
Figure 7.9: Masters Graduates by Gender and by Institution (2003–2008)
0
5
10
15
20
25
30
35
40
Male
Bunda
Male
Chancellor
Male
College of Medicine
Male
Polytechnic
Male
Mzuzu
Grad
uates
200320042005200620072008
Fema
le
Fema
le
Fema
le
Fema
le
Fema
le
�Source:�Data�from�higher�education�institutions�and�the�UNIMA�University�Office.�
�

The Education System in Malawi 175
�
The�constraints� that� inhibit� the�Polytechnic� from�offering�postgraduate�programs�in�engineering,�applied�science,�and�built�environment�need�to�be�addressed�as� these�studies�would� help�Malawi� develop� in� science� and� technology� and� improve� its� key�economy�indicators.��
The� cumulative� output� at� the�doctoral� level� for� the�period�under� review�was� 10�males� and� one� female.� Theology� had� six� graduates.� Education,� biology,� chemistry,�rural�development�and�extension,�and�dramatic�literature�had�one�graduate�each.�The�bias� is� towards� the� arts� rather� than� the� sciences.� The� participation� of�women� at� this�level�is�the�lowest�compared�to�the�other�levels.�
According�to�the�findings�of�the�Tracer�Study,�the�fields�offered�by�the�institutions�are�relevant�to�the�needs�of�the�labor�market�and�the�majority�of�the�graduates�are�able�to� secure� employment� within� six� months� of� graduation� (except� for� agriculture�graduates�who� take� a� bit� longer).� Certainly,� there� does� not� seem� to� be� a� backlog� of�graduates� who� are� unemployed.� The� external� efficiency� of� higher� education� is�discussed�in�Chapter�8.�
Equity in Higher Education
Chapters�4�and�5�have�already�provided�information�on�equity�issues�in�accessing�and�financing�higher�education.�This�section�will�provide�a�more�detailed�analysis�of�some�aspects�of�equity�in�higher�education.��
Gender Enrollment
It�has�already�been�noted�that�female�enrollments�in�higher�education�are�much�lower�than�those�for�males.�This�is�so�for�both�public�and�private�universities.�However,�the�percentage� women� enrolled� in� private� universities� surpasses� that� of� the� public�institutions,�as�shown�in�Figure�7A.4�in�Appendix�7.1.��
There� are� a� number� of� reasons� why� female� enrollments� are� low� in� higher�education.�The�first�is�that�dropout�rates�for�females�increase�throughout�the�education�cycle,� as�discussed� in�Chapter� 2.�This� reduces� the�number�of�women�who� sit� for� the�MSCE� examination.� The� second� is� that� the� percentage� pass� for� female�to�female31� is�lower� than� that� for� male�to�male.� As� a� result,� there� is� a� double� screening� in� the�numbers�of�women�who�eventually�qualify�for�university�entry.��
A� positive� trend,� however,� is� that� the� female–to�female� percentage� of� those�enrolled�was�below�the�male–to�male�percentage�in�2004�and�2005�but�is�now�higher.�The� establishment� of� private� universities,� which� have� higher� female� enrollment�percentages,� has�probably� contributed� to� the� increase� in� female�to�female� enrollment�percentages.�
Bed�space�also�limits�the�enrollment�of�more�females�as�the�institutions�have�more�male�bed�space�than�for�females�(except�at�KCN�where�the�reverse�is�true).�In�2008,�the�total�bed�space�for�all�the�UNIMA�colleges�was�2,761�for�males�and�1,383�for�females.�The� introduction� of� non�residential� programs� has� increased� enrollments� for� both�genders� but� the� enrollment� statistics� show� that� the� percentage� of� non�residential�female� students� is� consistently� lower� than� that� of�males,� and�also� lower� than� that�of�residential�female�students.�On�average,�non�residential�females�comprise�23.2�percent�of�the�total�non�residential�enrollment�at�Bunda,�24.3�at�Chancellor�College,�and�26.2�at�the�Polytechnic.�This�may�be�attributed�to�financing�problems,�having�to�live�alone�in�
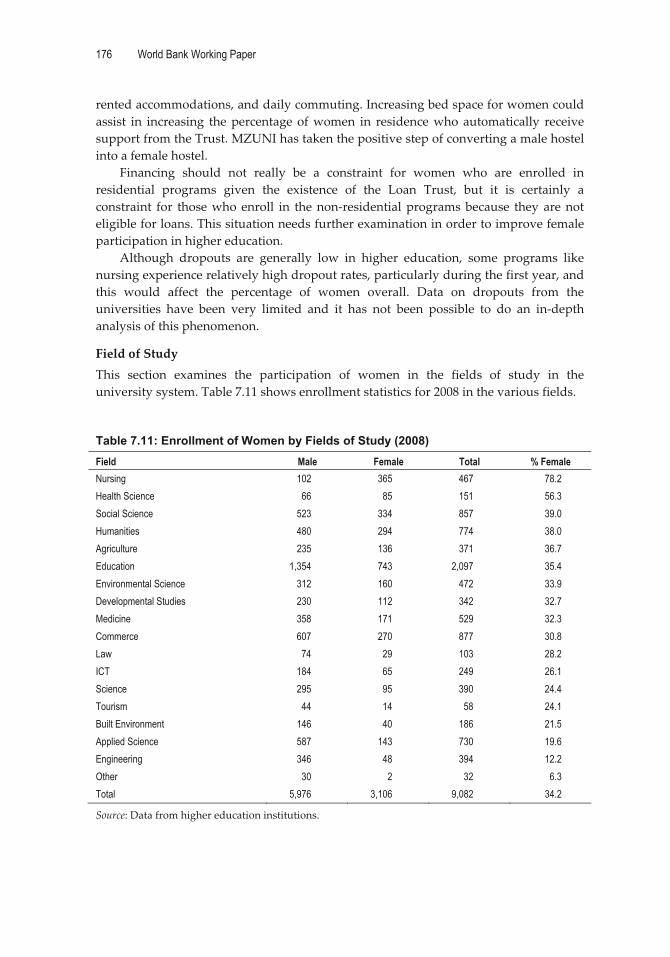
176 World Bank Working Paper
�
rented�accommodations,�and�daily�commuting.�Increasing�bed�space�for�women�could�assist� in� increasing� the�percentage�of�women� in� residence�who�automatically� receive�support�from�the�Trust.�MZUNI�has�taken�the�positive�step�of�converting�a�male�hostel�into�a�female�hostel.�
Financing� should� not� really� be� a� constraint� for� women� who� are� enrolled� in�residential� programs� given� the� existence� of� the� Loan� Trust,� but� it� is� certainly� a�constraint� for� those�who�enroll� in� the�non�residential�programs�because� they�are�not�eligible�for�loans.�This�situation�needs�further�examination�in�order�to�improve�female�participation�in�higher�education.��
Although� dropouts� are� generally� low� in� higher� education,� some� programs� like�nursing�experience�relatively�high�dropout�rates,�particularly�during�the�first�year,�and�this� would� affect� the� percentage� of� women� overall.� Data� on� dropouts� from� the�universities� have� been� very� limited� and� it� has� not� been� possible� to� do� an� in�depth�analysis�of�this�phenomenon.�
Field�of�Study�This� section� examines� the� participation� of� women� in� the� fields� of� study� in� the�university�system.�Table�7.11�shows�enrollment�statistics�for�2008�in�the�various�fields.����Table 7.11: Enrollment of Women by Fields of Study (2008) Field Male Female Total % Female Nursing 102 365 467 78.2 Health Science 66 85 151 56.3 Social Science 523 334 857 39.0 Humanities 480 294 774 38.0 Agriculture 235 136 371 36.7 Education 1,354 743 2,097 35.4 Environmental Science 312 160 472 33.9 Developmental Studies 230 112 342 32.7 Medicine 358 171 529 32.3 Commerce 607 270 877 30.8 Law 74 29 103 28.2 ICT 184 65 249 26.1 Science 295 95 390 24.4 Tourism 44 14 58 24.1 Built Environment 146 40 186 21.5 Applied Science 587 143 730 19.6 Engineering 346 48 394 12.2 Other 30 2 32 6.3 Total 5,976 3,106 9,082 34.2
Source:�Data�from�higher�education�institutions.��

The Education System in Malawi 177
�
The� data� basically� reinforce� the� fact� that� the� percentage� of� females� in� higher�education� is� lower� than� that� of� males� but� it� also� shows� where� their� enrollment� is�concentrated.�Nursing,�with�78.2�percent,�has�the�highest�number�of�females�enrolled,�followed� by� health� sciences� with� 56.3� percent.� The� next� eight� fields� are� around� 30�percent�and�this�includes�education,�which�although�recording�the�highest�number�of�female�students�has�a�percentage�of�only�35.3�women�to�men.�Female�percentages�for�most�of�the�fields�fall�below�40,�except�the�health�related�fields,�social�science,�and�the�humanities—as� shown� in� figure� 7A.10� in� Appendix� 7.� Of� note� are� the� fields� where�female� percentages� are� below� 30.� These� include� ICT,� tourism,� built� environment,�engineering,�and�applied�sciences.32�
Strategies�are�needed�to�enhance� the�participation�of�women�in�higher�education�and�in�male�dominated�fields.�One�possible�avenue�is�already�practiced�at�the�College�of�Medicine,�which�provides�a�pre�med�program�to�prepare�students�for�degree�level�work.� Similarly,� the� universities� could� offer� a� preliminary� year� for� preparing� female�students�to�enter�the�male�dominated�fields.�
As�expected,�the�enrollment�of�women�at�the�postgraduate�level�is�even�lower�than�at� the� undergraduate� level.� The� data� in� table� 7A.13� in� Appendix� 7.5� show� that� the�percentage�of�women�enrolled�in�postgraduate�studies�has�grown�from�19�in�2003�to�29�in� 2008.� Of� the� eight� students� who� are� enrolled� at� the� doctoral� level,� only� two� are�female.��
Socioeconomic Status
A� comparison� of� enrollments� in� the�whole� education� system� as� a� function� of� socio�economic� status� was� discussed� in� Chapter� 5� and� in� this� chapter� under� student�financing.�Table�5.1�in�Chapter�5�showed�that�children�from�the�5th�quintile�comprised�91.3�percent�of�the�enrollment�in�higher�education,�while�children�from�the�1st�quintile�comprised� only� 0.7� percent.� This�means� that� government� is� subsidizing� the�well�off�through�subventions�to�the�universities�and�the�Loan�Trust�at�the�expense�of�those�who�really� need� financial� help.� Just� who� benefits� from� the� Loan� Trust� is� something� the�government� needs� to� address.� Restricting� loan� access� to� only� residential� students� is�glaringly� inequitable� in� that� it� leaves� out� non�residential� Malawians� in� public�institutions� and� those� enrolled� in� accredited� private� institutions.� Issues� of� public�spending�on�education�and�its�inequities�are�discussed�in�greater�detail�in�Chapter�4.�
Data� on� handicapped� students�were� not� available,� but� visits� to� both� public� and�private� higher� education� institutions� revealed� that� higher� education� institutions� did�not�have�the�facilities�to�cater�for�people�with�physical�disabilities.�It�is�noted�that�some�schools� enroll� students� with� physical� disabilities.� This� is� an� area� that� needs� further�investigation� to� provide� a� clearer� picture� of� the� plight� of� physically� challenged�students� in� higher� education.� In� their� strategic� plans,� UNIMA� indicated� that� they�would� like� to� increase�access� for� this�group�but� this�will�depend�to�a� large�extent�on�resources�for�making�facilities�handicapped�accessible.��
Governance and Management
The�governance�and�management�of�higher�education�institutions�refers�to�the�way�in�which�these�institutions�are�formally�organized�and�operated.�Kegan�and�Eckel�(2004:�371�398)� note� that� governance� is� a� ‘multi�level� concept’� which� includes� several�
178 World Bank Working Paper
�
different� bodies� and� processes,� both� internal� and� external.� The� notion� of� ‘good�governance’� is� as� applicable� to� universities� as� it� is� elsewhere� and� has� a� direct�correlation� to� the�quality� of� education�provided�by� these� institutions.�Universities� in�Malawi,� both� public� and� private,� have� a� number� of� governance� and� management�issues� that� need� to� be� addressed� to� improve� performance� (Malawi� Institute� of�Management,�2004).��
Academic� freedom� is�a� feature�of�university�operations� in�Malawi,�meaning� that�scholars� are� permitted� to� pursue� teaching,� learning,� and� research� without� restraints�imposed� by� the� institutions� that� govern� them.� This� is� a� fundamental� tenet� of� good�governance� in� higher� education� systems,� and� Malawi� has� satisfied� this� condition.�There� is,�however,� scope� for�discussions�on� the�extent� to�which� the�government�and�universities� can� collaborate� on� shaping� the� higher� education� curriculum� to� be�responsive�to�the�needs�of�the�Malawian�economy.�
Shared�governance� is� characterized� by� the�delegation� of� responsibilities� to� those�who�are�best�equipped�to�handle�them.�At�a�systemic�level,�it�refers�to�the�participation�of� higher� education� institutions� and� their� advocates� in� the� formulation� of� higher�education�policy.�In�Malawi,�universities�are�in�the�unique�position�of�being�subvented�organizations,�which� although� falling�within� the� ambit� of� the�Ministry� of�Education,�maintain� some� level� of� autonomy�on� internal�management� and�policy� issues.� In� this�way,�shared�governance�at�the�system�level�is�achieved,�although�a�clearer�articulation�of�the�relationships�between�government�and�universities�is�needed.��
At� the� institutional� level,� shared� governance� refers� to� the� participation� of� the�faculty� (and� in�some�cases,� students)� in� the�management�of� the�university,� including�educational� policy� formulation,� academic� appointments,� and� administrative�matters.�The�decentralization� of� several� functions� important� to� the� colleges� has� been� the� first�step� towards�achieving�shared�governance�at� the� institutional� level.�For�example,� the�University� Office� consolidates� the� budgets� for� universities� and� lobbies� for� more�resources�but�the�actual�financial�administration�has�now�been�completely�devolved�to�the� colleges,� placing� them� squarely� in� charge� of� the� implementation� of� their�subventions.� Further,� recruitment� of� staff� and� staff� development� have� also� been�decentralized�to�the�colleges.��
However,�the�quest�for�shared�governance�at�the�higher�education�level�is�stymied�by� a� lack� of� resources� at� the� institutional� level� to� effectively� carry� out� the� devolved�functions.�Universities�also�lack�clear�guidelines�on�the� internal�management�of�these�functions.� This� has� resulted� in� situations� where� staff� have� failed� to� make� crucial�decisions� and� to� adhere� strictly� to� the� enrollment� regulations.�A� clear� assignment� of�rights� and� responsibilities� for� faculty,� administrators,� students,� and� external�supervisors�is�needed�to�achieve�a�system�of�shared�governance�that�works.�Further,�it�is�critical�that�a�monitoring�and�evaluation�framework�for�the�decentralization�process�be�put�in�place.�
One� positive� move� on� the� part� of� the� public� universities� towards� management�reform�has�been�the�outsourcing�of�non�educational�functions�so�that�attention�can�be�concentrated�on�the�core�functions�of�these�institutions.�(See�section�IV.2.)�This�should�go�some�way�in�reducing�the�student�provisions/allowances�bill,�which�was�the�second�highest�expenditure�recorded�at�MZUNI�and�the�third�highest�at�UNIMA�colleges.�It�is�perhaps�too�early�to�assess� the� impact�of� this� initiative�on�efficiency�and�cost�savings�

The Education System in Malawi 179
�
but� anecdotal� evidence� suggests� that� there� are� improvements� in� the� efficiency� of�service� delivery,� reduced� industrial� action,� and� less� administrative� work� for� the�administrators.� However,� negatives� have� been� noted,� such� as� outsourced� service�providers� being� erratic� in� their� performance.� Some� form� of� a� quality� assurance�committee�at�the�level�of�the�university�is�therefore�needed�to�sustain�this�intervention.�
Financial� stability� presents� another� major� issue� of� governance� that� needs� to� be�addressed� in�higher�education.�Uncertainty�over� future� financing�and� fluctuations� in�funding� hinder� the� effective� governance� and� management� of� higher� education�institutions,�since�they�render�medium�term�planning�difficult.�It�has�been�seen�that�the�subventions� to� universities� in�Malawi� from� government� do� not� display� a� consistent�pattern,� and� the� uncertainty� surrounding� fee�setting� has� placed� universities� in� the�precarious� position� of� being� unable� to� determine� their� future� levels� of� funding,� and�therefore�the�nature�and�scope�of�their�operations.�
It� should� also� be� noted� that� the� financing� providers� can� affect� the� autonomy� of�higher�education�institutions.�In�Malawi’s�case,�there�is�the�particular�danger�of�public�universities�being�supported�largely�by�the�government,�and�some�private�universities�being�primarily�funded�by�religious�organizations.�In�such�a�situation,�it�becomes�even�more� critical� to� clarify� the� expectations� of� all� stake�holders� in� the� higher� education�sector.�
In�Malawi,�the�higher�education�sector�is�in�its�infancy�and�is�rapidly�expanding.�It�has� been� difficult� to� regulate� the� emergence� of� new� universities� in� relation� to� the�standardization�of�salaries,�the�coordination�of�quality�and�quality�assurance,�student�admissions,�and�financing�mechanisms.�To�resolve�these�problems,�the�pending�Higher�Education�Act�will� create� the�National�Council� for�Higher�Education� (NCHE),�which�will� be� empowered� to� oversee� higher� education� institutions� and� look� at� quality� and�quality�assurance�mechanisms.�An�important�function�of�the�NCHE�will�be�to�protect�the�Malawian� student� as� a� customer� by� instituting� a� semi�autonomous� accreditation�and�quality�assurance�agency�under�its�supervision.�
Finally,� the� desired� levels� of� autonomy� to� be� attained� by� higher� education�institutions� do� not� preclude� the� need� for� accountability� on� the� part� of� universities.�There� is� currently� a� council� for� oversight� in� existence,� but� again� there� is� a� need� to�clearly� define� the� roles� of� this� body.� Guidelines� need� to� be� developed,� requiring�universities� to� periodically� report� on� their� activities� and� have� their� performance�assessed� in� a� transparent� manner� by� a� suitably� composed� body.� The� forthcoming�NCHE� may� wish� to� undertake� the� fulfillment� of� this� important� principle� of� good�governance.�
Notes �1� Accreditation� of� private� universities� is� done� by� the� Department� of� Human� Resource�Management�and�Development,�which�is�part�of�the�Office�of�the�President�and�Cabinet.��2�Under� the� ISCED�program,� 5A� refers� to� first� degree,� second�degree,� and� further� degree� and�Research.�This�is�primarily�university�education.�3�Details�of�annual�enrollments�by�type�of�institution�and�by�gender�are�shown�in�Appendix�7.3.�4�For�example,�Livingstonia�University�only�offers�a�Bachelor�of�Education�degree�and�the� first�year’s� enrollment� has� remained� below� 160� since� the� program’s� inception� in� 2003.� Catholic��
180 World Bank Working Paper
�
�University� only� offers� two� degree� programs� in� social� sciences� and� education.� The� Adventist�University� of� Malawi� offers� education� and� business� studies,� while� Shareworld� offers� seven�programs� but� has� small� enrollments.� It� has� attempted� to� increase� its� enrollments� by� opening�centers�in�Lilongwe�and�Mzuzu�to�make�its�programs�more�accessible.�5�sometimes�referred�to�as�“parallel”�students�6�Education�enrollment�statistics�have�been�combined�with�statistics�on�enrollment�in�education�and�media�studies�eoffered�at�the�Polytechnic.�The�Polytechnic�had�the�largest�enrollment�in�the�previous�CSR�(2001�data).�7�See�also�figure�7A.7�in�Appendix�7.3�for�enrollments�by�field�of�study.�8�See�Page�97�of�the�MGDS�document.�9�Protocol�which�was�signed�in�Blantyre�by�SADC�Heads�of�states�on�September�8,�1997�provides�for�SADC�member�states�to�use�training�facilities�that�are�available�in�member�states�for�training�personnel� and� also� for� establishing� Centres� of� Excellence� where� specialized� training� can� take�place�for�member�states.�10�See�figure�7A.8�in�Appendix�7.3.�11�The�data�for�these�two�figures�were�extracted�from�the�available�audited�financial�statements�for�the�two�institutions.��12�See�Appendix�7.4�for�detailed�tables�of�the�percentages.�13�The�fee�includes:�tuition,�registration,�caution,�medical,�and�student�union�charges.�14�The�subvention�only�comprises�around�half�of�the�total�public�expenditure�to�higher�education�because�salaries�are�not�counted,�as�well�as�some�other�government�expenditures.�15�Students�are�expected�to�take�at�least�17�credit�hours�per�semester.�16� The�Malawi� Institute� of�Management� was� commissioned� to� carry� out� an� in�depth� study� of�UNIMA� in� 2002� and� produced� a� report� with� recommendations� on� how� to� improve� public�university� education� in� the� country.� Implementation� of� some� of� the� recommendations� is�underway.�17�Table�was�compiled�using�data�from�the�individual�colleges.�18� Expenditures� for� Catholic� University� start� from� 2006/07� and� those� for� 2008/09� are� budget�figures�and�not�actual�expenditures.�19�Adventist�University� has� a� policy� of� not� allowing� emoluments� to� exceed� 50� percent� of� total�expenditure.�20�The�percentages� for�Adventist� and�Shareworld�are�based�on� revenue�calculated� from� tuition�fees�and�student�enrollment,�while�those�for�Livinsgstonia,�Catholic,�and�the�public�universities�are�based�on�actual�total�expenditure.�21� See� Appendix� 7.4� for� a� table� of� unit� cost� calculations.� Unit� costs� for� Livingstonia� were�calculated�using�expenditure�data�for�the�period.�Unit�costs�for�the�other�institutions�were�based�on�the�tuition�fees�for�2008,�seeing�as�the�institutions�rely�almost�entirely�on�the�tuition�fees�paid�by�the�students.��22�See�Figure�3.4�for�a�comparison.�23�This�is�the�term�used�in�the�policy�document�for�the�NUSTF.�24� As� part� of� the� CSR� process� a� tracer� study� for� both� TEVET� and� hgher� education� was�commissioned�to�provide�data�on�the�fate�of�the�graduates�of�the�system.�25�Recovery�ratio�measures�the�ratio�of�total�repayments�to�the�total�loan�disbursements.�26�The�loan�repayment�ratio�is�a�measure�of�how�much�of�a�loan�an�average�borrower�is�required�to�pay�(See�Shen�and�Zinderman,�Student�Loans�Repayment�and�Recovery).�27� Average� for� eight� selected� SAA� countries� is� 58.26� percent� (Egypt,� Ethiopia,� Ghana,� Kenya,�Mauritius,�Namibia,�Nigeria,�and�South�Africa).�The� repayment�period� for�Namibia� is�equal� to�the�period�of�time�of�study,�which�in�this�case�is�three�years.��
The Education System in Malawi 181
�
�28�A�few�institutions�provided�staffing�data�for� the�whole�period�but�most�did�not�so� it�has�not�been�possible�to�do�an�analysis�of�how�student/staff�ratios�have�changed�over�this�time.�29Assistant�lecturers�are�those�with�an�Honors�degree,�while�staff�associates�have�a�first�degree.�30�See�figure�7A.9�in�Appendix�7�for�the�comparison.�31�This�refers�to�the�percentage�of�females�passing�against�the�number�of�females�who�entered�the�examination.��32�These�are�Certificate�and�Diploma�Security�Studies�offered�at�MZUNI.�
182
CHAPTER �8 �
External�Efficiency�
Summary of the Chapter
Education� has� a� direct� influence� on� people’s� social� behavior.� People� with� more�education� have� different� ways� of� responding� to� certain� situations� (for� example,�pregnancy,� malarial� treatment� for� children,� and� HIV/AIDS)� than� those� with� less�education,�independent�of�household�income.��
The� primary� level� accounts� for� almost� half� (48� percent)� of� the� total� impact� of�education�on� social� behavior.�Therefore,� changes�need� to� be� implemented� so� that� all�Malawian�children�achieve�at�least�the�primary�cycle.��
Education�has�a�direct�connection�to�the�labor�market.�With�each�additional�level�of� income� that� a�Malawian� gains,� he� or� she� also� gains� an� increasing� average� annual�income.�And�the�income�gain�for�higher�education�is�particularly�huge.�It�shows�there�is�a�severe�shortage�of�academically�trained�Malawians.�
Tracer� studies� indicate� a� generally� high� satisfaction� with� higher� education�outcomes� among� graduates� and� employers.� The� average� time� span� between�graduation� and� job� entrance� is� relatively� low.�Unemployment� rates� for� academically�trained�people�are�among�the�lowest�in�Africa.��
TEVET�completers�also�have�a�high�acceptance�in�the�labor�market,�with�the�best�employment� rate�of� all�African�countries� for�which�comparative�data�were�available.�The� average� TEVET� graduate’s� monthly� income� of� MK16,700,� however,� remains�relatively� low� compared� to� higher� education� graduates.� The� income� prospects� of�TEVET�graduates�who�venture� into�self�employment�appears�to�be�higher�than�those�of� the� wage�employed.� No� significant� correlation� exists� between� the� duration� of�training� and� income,� which� raises� a� concern� about� the� appropriateness� of� the� long�duration�of�the�regular�public�regular�TEVET�program.��
The� rates� of� return� (ROR)� to� education� in�Malawi� are�very�high,� in�particular� at�higher�education�levels,�which�reflect�Malawi’s�low�overall�access�to�education.�Private�ROR�of�54�percent�for�TEVET�and�171�percent�for�higher�education�also�indicate�severe�shortages� of� skilled� and� highly� educated� human� resources,� demonstrating� the�country’s�urgent�need�to�ensure�greater�access�rates�to�stimulate�growth.��
*�*�*�
Chapter� 8� looks� at� external� efficiency,� meaning� the� impact� of� education� and�training�on�economic�and�social�development�and�on�peoples’�lives.�It�first�analyzes�the�effect�education�has�on�social�behavior�and�human�development�in�Malawi,�and�then�examines� available� information�on� the� relevance� that� education�and� training�have� to�the�labor�market.�
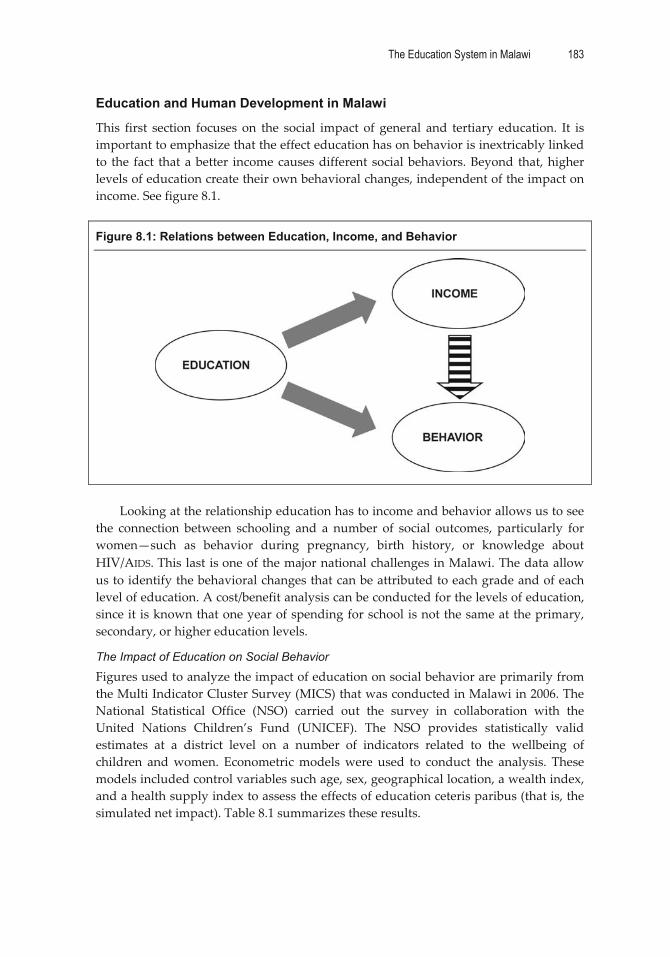
The Education System in Malawi 183
�
Education and Human Development in Malawi
This� first� section� focuses� on� the� social� impact� of� general� and� tertiary� education.� It� is�important�to�emphasize�that�the�effect�education�has�on�behavior�is�inextricably�linked�to� the� fact� that�a�better� income�causes�different� social�behaviors.�Beyond� that,�higher�levels�of�education�create�their�own�behavioral�changes,�independent�of�the�impact�on�income.�See�figure�8.1.��
Figure 8.1: Relations between Education, Income, and Behavior
�
�Looking�at�the�relationship�education�has�to�income�and�behavior�allows�us�to�see�
the� connection� between� schooling� and� a� number� of� social� outcomes,� particularly� for�women—such� as� behavior� during� pregnancy,� birth� history,� or� knowledge� about�HIV/AIDS.�This�last� is�one�of�the�major�national�challenges�in�Malawi.�The�data�allow�us�to�identify�the�behavioral�changes�that�can�be�attributed�to�each�grade�and�of�each�level�of�education.�A�cost/benefit�analysis�can�be�conducted�for�the�levels�of�education,�since�it�is�known�that�one�year�of�spending�for�school�is�not�the�same�at�the�primary,�secondary,�or�higher�education�levels.�
The Impact of Education on Social Behavior
Figures�used�to�analyze�the�impact�of�education�on�social�behavior�are�primarily�from�the�Multi�Indicator�Cluster�Survey�(MICS)�that�was�conducted�in�Malawi�in�2006.�The�National� Statistical� Office� (NSO)� carried� out� the� survey� in� collaboration� with� the�United� Nations� Children’s� Fund� (UNICEF).� The� NSO� provides� statistically� valid�estimates� at� a� district� level� on� a� number� of� indicators� related� to� the� wellbeing� of�children� and�women.� Econometric�models�were� used� to� conduct� the� analysis.� These�models�included�control�variables�such�age,�sex,�geographical�location,�a�wealth�index,�and�a�health�supply�index�to�assess�the�effects�of�education�ceteris�paribus�(that�is,�the�simulated�net�impact).�Table�8.1�summarizes�these�results.���
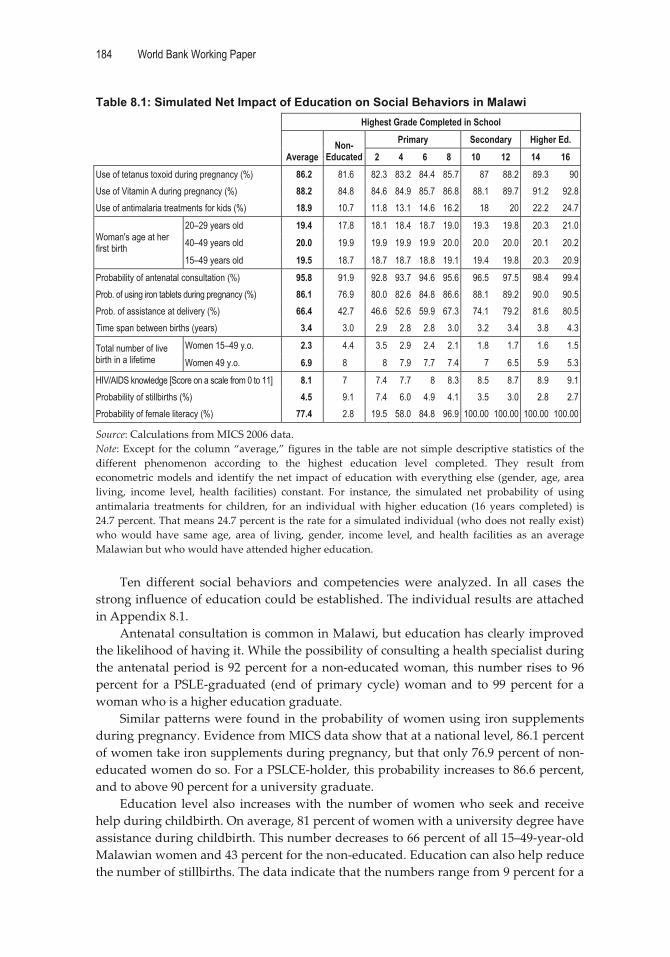
184 World Bank Working Paper
�
Table 8.1: Simulated Net Impact of Education on Social Behaviors in Malawi Highest Grade Completed in School
Average Non-
Educated Primary Secondary Higher Ed.
2 4 6 8 10 12 14 16 Use of tetanus toxoid during pregnancy (%) 86.2 81.6 82.3 83.2 84.4 85.7 87 88.2 89.3 90 Use of Vitamin A during pregnancy (%) 88.2 84.8 84.6 84.9 85.7 86.8 88.1 89.7 91.2 92.8 Use of antimalaria treatments for kids (%) 18.9 10.7 11.8 13.1 14.6 16.2 18 20 22.2 24.7
Woman's age at her first birth
20–29 years old 19.4 17.8 18.1 18.4 18.7 19.0 19.3 19.8 20.3 21.0
40–49 years old 20.0 19.9 19.9 19.9 19.9 20.0 20.0 20.0 20.1 20.2
15–49 years old 19.5 18.7 18.7 18.7 18.8 19.1 19.4 19.8 20.3 20.9
Probability of antenatal consultation (%) 95.8 91.9 92.8 93.7 94.6 95.6 96.5 97.5 98.4 99.4 Prob. of using iron tablets during pregnancy (%) 86.1 76.9 80.0 82.6 84.8 86.6 88.1 89.2 90.0 90.5 Prob. of assistance at delivery (%) 66.4 42.7 46.6 52.6 59.9 67.3 74.1 79.2 81.6 80.5 Time span between births (years) 3.4 3.0 2.9 2.8 2.8 3.0 3.2 3.4 3.8 4.3
Total number of live birth in a lifetime
Women 15–49 y.o. 2.3 4.4 3.5 2.9 2.4 2.1 1.8 1.7 1.6 1.5
Women 49 y.o. 6.9 8 8 7.9 7.7 7.4 7 6.5 5.9 5.3
HIV/AIDS knowledge [Score on a scale from 0 to 11] 8.1 7 7.4 7.7 8 8.3 8.5 8.7 8.9 9.1 Probability of stillbirths (%) 4.5 9.1 7.4 6.0 4.9 4.1 3.5 3.0 2.8 2.7 Probability of female literacy (%) 77.4 2.8 19.5 58.0 84.8 96.9 100.00 100.00 100.00 100.00
Source:�Calculations�from�MICS�2006�data.�Note:�Except� for� the�column�“average,”� figures� in� the� table�are�not�simple�descriptive�statistics�of� the�different� phenomenon� according� to� the� highest� education� level� completed.� They� result� from�econometric�models�and� identify� the�net� impact�of�education�with�everything�else� (gender,�age,�area�living,� income� level,� health� facilities)� constant.� For� instance,� the� simulated� net� probability� of� using�antimalaria� treatments� for� children,� for� an� individual�with� higher� education� (16� years� completed)� is�24.7�percent.�That�means�24.7�percent�is�the�rate�for�a�simulated�individual�(who�does�not�really�exist)�who�would� have� same� age,� area� of� living,� gender,� income� level,� and� health� facilities� as� an� average�Malawian�but�who�would�have�attended�higher�education.��
Ten� different� social� behaviors� and� competencies�were� analyzed.� In� all� cases� the�strong�influence�of�education�could�be�established.�The�individual�results�are�attached�in�Appendix�8.1.�
Antenatal�consultation�is�common�in�Malawi,�but�education�has�clearly�improved�the�likelihood�of�having�it.�While�the�possibility�of�consulting�a�health�specialist�during�the�antenatal�period�is�92�percent�for�a�non�educated�woman,�this�number�rises�to�96�percent� for� a�PSLE�graduated� (end�of�primary� cycle)�woman�and� to� 99�percent� for� a�woman�who�is�a�higher�education�graduate.��
Similar�patterns�were�found�in�the�probability�of�women�using�iron�supplements�during�pregnancy.�Evidence�from�MICS�data�show�that�at�a�national�level,�86.1�percent�of�women�take�iron�supplements�during�pregnancy,�but�that�only�76.9�percent�of�non�educated�women�do�so.�For�a�PSLCE�holder,�this�probability�increases�to�86.6�percent,�and�to�above�90�percent�for�a�university�graduate.��
Education� level� also� increases�with� the�number�of�women�who� seek�and� receive�help�during�childbirth.�On�average,�81�percent�of�women�with�a�university�degree�have�assistance�during�childbirth.�This�number�decreases�to�66�percent�of�all�15–49�year�old�Malawian�women�and�43�percent�for�the�non�educated.�Education�can�also�help�reduce�the�number�of�stillbirths.�The�data�indicate�that�the�numbers�range�from�9�percent�for�a�
The Education System in Malawi 185
�
non�educated�woman�to�3�percent�for�a�woman�who�has�completed�secondary�Form�4�(grade�12).�
The�MICS�asked�mothers�with�children�under�the�age�of�five�who�had�had�a�fever�in� the� two�weeks� prior� to� the� survey�whether� the� child� had� been� taken� to� a� health�facility�during�the� illness,�and� if�so,�what� the�medicine�was�given.�An�analysis�of� the�data� indicate� that� at� the� national� level,� the� average� probability� of� using� antimalarial�treatment�for�children�under�five�is�very�low,�which�is�a�concern�in�itself.�However,�one�important� finding�was� that�mothers�with� a� low� level� of� education� are� less� likely� to�provide� appropriate� antimalarial� treatment� to� their� children.�While� a� child�of� a�non�educated� mother� has� a� 10.7� percent� chance� of� receiving� antimalarial� treatment,� the�chance�rises�to�16�percent�for�the�child�of�a�mother�who�has�completed�Standard�8,�and�to�20�percent�for�a�child�with�a�mother�who�has�completed�Form�4.��
Age�at� first�birth� is� slightly�higher� in�Malawi� for�older�women� than� for�younger�ones.�But�in�contrast�to�the�younger�generation,�the�behavior�of�older�women�was�less�likely�to�be�influenced�by�the�duration�of�schooling.�For�the�older�generation�[40–49]�no�difference� has� been� noted� according� to� the� level� of� education.� In� the� younger�generation,�a�non�educated�woman�is�likely�to�have�a�first�child�at�an�average�of�17.8�years,�whereas�this�age�is�19�years�for�a�woman�with�a�PSLCE�and�19.8�at�the�end�of�the�upper�secondary�cycle.��
Compared�to�other�countries,�age�at�first�birth�is�relatively�low�in�Malawi.�With�an�increasing�level�of�education,� the� interval�between�two�consecutive�births� is�expected�to�be� longer.� In�Malawi,� this�assertion�is�especially�true�for�the�secondary�and�higher�levels�of�education,�which�indicates�that�primary�cycle�schooling�alone�does�not�have�a�strong�positive�effect�on�birth�spacing.�Women�need�more�years�of� schooling� to�start�significantly� increasing� the� time� span� (currently� an� average� of� 3.4� years)� between�births.��
Education�also�helps� to�reduce�the� total�number�of�births�women�may�have.�The�average�number� of� live� births� of� a� 49–year�old�woman� is� rather� high� in�Malawi� (6.9�births).�A�non�educated�woman�gives�birth�approximately�eight�times�in�her�life,�and�this� figure�does�not�vary� substantially� for�women�who�have�had�primary� education.�Everything�else�constant,�eight�years�of�schooling�helps�reduce�this�figure�by�about�0.6�points�only,�while�12�years�of�education�correspond�to�a�reduction�of�1.5�points.�After�16� years� of� education� (secondary� school� plus� four� years� of� higher� education),� the�average�number�of�births�drops�by�2.8,�which�means�an�average�number�of�5.3�children�for� each� highly� educated�woman.�Despite� the� impact� of� education,� these� figures� for�Malawi�remain�high�compared�to�other�countries�with�similar�characteristics.��
The�fight�against�HIV/AIDS�is�a�major�national�challenge�in�Malawi�given�its�high�prevalence�in�the�country.�The�MICS�was�an�opportunity�to�ask�both�men�and�women�about� their� knowledge� of� the� disease.� The� results� indicate� that� people�with� a� lower�level�of�education�score� lower� in� their�knowledge�about�HIV/AIDS�than�do�the�more�educated.�There�is�no�doubt�that�schooling�can�help�strengthen�people’s�understanding�of�the�disease.�
Literacy� is� probably� the� most� important� outcome� expected� from� education,�especially� in� the� primary� cycle.� The� MICS� required� respondents� to� read� a� short�sentence� in�English,�Chichewa,� or� Tumbuka.�Although� literacy� comprises�more� than�

186 World Bank Working Paper
�
just�reading�skills,�this�indicator�was�used�here�to�analyze�the�net�impact�of�education�on�literacy.��
Logistic�regression�was�used�to�estimate�the�probability�of�being� literate�at�given�grade�completed,�all�other�things�(age,�wealth�index,�health�supply�index,�geographical�location)�being�equal.�Results�indicate�the�strong�positive�effect�that�education�has�on�literacy:� 97� and� 98� percent� respectively� for� women� and� men� who� have� completed�Standard�8,�while�less�than�3�percent�for�both�if�non�educated.��
Comparison of Outcomes by Level and Cost-Benefit Analysis
The� social� outcomes� of� education� can� be� analyzed� from�an� economic� viewpoint� that�compares� the� effect� each� level� of� schooling� has� on� the� total� social� outcomes.� Such� a�distinction�is�pertinent�for�at�least�two�reasons:��
1. For�policy�makers�it�would�be�useful�to�know�which�level�of�schooling�is�the�most�effective�to�quickly�support�poverty�reduction�in�the�country,�or�human�development� in� general.� Choices,� especially� regarding� public� investments,�may�be�made�accordingly.�
2. The�duration�of�schooling�is�not�the�same�for�every�level.��
In� Malawi’s� case,� the� primary� cycle� ranges� from� standards� 1–8,� while� secondary�education� takes� only� half� of� this� duration� (two� years� for� each� lower� secondary� and�upper�secondary�level).��
The� tertiary� cycle� spans� at� least� four�years.�Different� levels� of� education� involve�different� costs.� Since� it� is� possible� to� identify� how� far� each� level� affects� human�development,�it�is�useful�to�examine�the�cost�of�each�year�of�schooling�and�its�benefits�(see�table�8.2).�
On�average,�the�primary�cycle�represents�almost�half�(48�percent)�of�the�total�social�impact�of�the�behaviors�in�table�8.2,�while�secondary�as�well�as�higher�education�(four�years�duration)�each�account�for�26�percent.�One�year�of�schooling�equals�6�percent�for�the� primary� cycle,� 6.5� percent� for� the� secondary� cycle,� and� 6.4� percent� for� higher�education.� Therefore,� we� can� say� that� in� Malawi� each� year� of� schooling� means� an�approximately�6�percent�increased�impact�on�social�behavior.��
The� primary� cycle� has� a� high� impact� on� competencies� and� social� indicators� like�literacy,� stillbirth,� HIV/AIDS� knowledge,� and� assistance� at� delivery.� For� these�indicators,� up� to� two�thirds� of� the� total� impact� has� been�made� by� the� completion� of�Standard�8.�Conversely,�the�primary�cycle�has�a�low�effect�on�behaviors�such�as�using�vitamin�A�for�children�under�five,�total�live�births,�a�woman�s�age�at�first�birth,�or�birth�interval.�For�these�indicators,�its�contribution�is�less�than�25�percent.�
Finally,�we�confront�each�cycle’s�contribution�with�its�costs�as�shown�in�table�8.2.�Costs�here�represent�units�of�gross�domestic�product�(GDP)�per�capita�(estimated�to�be�MK36,358�in�2008).�They�were�obtained�by�multiplying�the�unit�cost�of�each�cycle�by�its�duration.� Results� in� the� last� row� of� the� table� indicate� a� very� high� efficiency� in� the�primary� cycle� compared� to� secondary,� and� especially� tertiary,� education.� All� costs�being�equal,�the�efficiency�of�the�primary�cycle�in�enhancing�human�development�is�9�times�higher�than�that�of�the�secondary�cycle�and�243�times�higher�than�that�of�tertiary�education.�

The Education System in Malawi 187
�
Table 8.2: Impact of a Mother’s Education on Various Adult Behaviors (Share for the Different Cycles) (in %)
Primary (vs. Non-
educated)
Second. 1 (vs.
primary cycle)
Second. 2 (vs.
second. 1)
Higher Ed (vs.
second. 2) Total
High contribution of primary cycle
Enhancing literacy 96.9 3.1 0.0 0.0 100 Reducing stillbirth 78.1 9.8 6.7 5.4 100
Encouraging use of iron tablets 71.4 10.6 8.2 9.8 100 Knowledge about HIV/AIDS (on 0–11 scale) 67.5 11.4 9.2 11.9 100
Assistance at delivery 65.3 17.9 13.5 3.4 100
Medium contribution of primary cycle
Antenatal care 49.0 12.6 12.7 25.7 100
Use of tetanus toxins 48.5 15.4 14.5 21.6 100
Antimalarial treatments 39.7 12.8 14.2 33.3 100
Moderated contribution of primary cycle
Use of vitamin A for children under five 24.3 17.1 19.1 39.5 100 Total live births [49 y.o.] 21.6 14.3 17.8 46.3 100
Age at first birth 17.0 14.6 18.7 49.8 100 Birth interval 0.0 16.2 23.2 60.6 100
Average social impact 48.3 13.0 13.1 25.6 100 Unit cost as percentage of GDP per capita) 8.3 83.3 2,146.7 — Total spending (unit of GDP per capita) 0.66 3.33 85.87 — Efficiency (= impact/spending) 0.727 0.078 0.003 —
Source:�Calculation�from�MICS�2006�data�and�data�from�Chapter�3.��
Relevance of Education for the Labor Market
It�is�important�to�look�at�the�relevance�of�education�and�training�for�the�labor�market�(that� is,� the� value� the� employment� sector� ascribes� to� educational� background� and�qualifications).� We� must� also� ascertain� whether� the� skills� and� competences� of�graduates,� particularly� of� TEVET� and� higher� education,� match� the� requirements� of�employers�and�the�development�needs�of�the�economy.�Major�primary�data�sources�for�this� analysis�were� the� 2004� Integrated�Household�Survey� (IHS)� as�well� as� two� tracer�studies� conducted� in� 2008,� which� when� combined� add� substantial� value� to� the�understanding� of� the� external� efficiency� of� TEVET� and� HE,� despite� their� different�emphases�and�sample�frames.�These�studies�are:�
� The�Malawi�Labor�Market�Survey�(LMS)�commissioned�by�TEVETA�(JIMAT,�2008).�The�study�comprises�five�individual�surveys:�a�tracer�survey�of�TEVET�graduates,� a� skills� demand� survey� of� formal� companies,� an� informal� sector�survey,�an�informal�sector�employees�survey,�and�a�tracer�survey�of�TEVETA’s�informal�sector�training�program.�This�study’s�subject�is�TEVET�only�with�the�tracer�study�focusing�on�formal�TEVET�apprentices.�
� A� tracer� study� of� TEVET� and� higher� education� completers� in� Malawi�commissioned� by� the� GTZ� and� the� World� Bank� in� the� context� of� the� CSR�(Pfeiffer� and�Chiunda,�Appendix� 9).�Apart� from�higher� education� graduates�and� TEVET� completers� from� all� TEVET� provider� systems,� the� study� also�targeted�a�smaller�sample�of�higher�education�dropouts.��
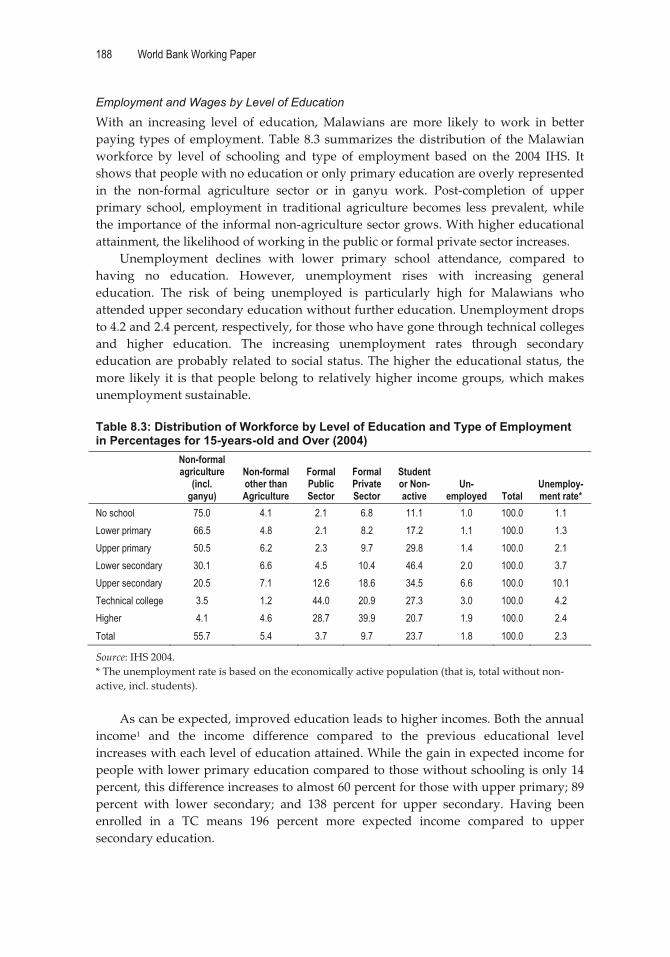
188 World Bank Working Paper
�
Employment and Wages by Level of Education
With� an� increasing� level� of� education,�Malawians� are� more� likely� to� work� in� better�paying� types�of�employment.�Table�8.3� summarizes� the�distribution�of� the�Malawian�workforce� by� level� of� schooling� and� type� of� employment� based� on� the� 2004� IHS.� It�shows�that�people�with�no�education�or�only�primary�education�are�overly�represented�in� the� non�formal� agriculture� sector� or� in� ganyu� work.� Post�completion� of� upper�primary� school,� employment� in� traditional� agriculture� becomes� less� prevalent,�while�the�importance�of�the�informal�non�agriculture�sector�grows.�With�higher�educational�attainment,�the�likelihood�of�working�in�the�public�or�formal�private�sector�increases.��
Unemployment� declines� with� lower� primary� school� attendance,� compared� to�having� no� education.� However,� unemployment� rises� with� increasing� general�education.� The� risk� of� being� unemployed� is� particularly� high� for� Malawians� who�attended�upper�secondary�education�without�further�education.�Unemployment�drops�to�4.2�and�2.4�percent,�respectively,�for�those�who�have�gone�through�technical�colleges�and� higher� education.� The� increasing� unemployment� rates� through� secondary�education�are�probably�related�to�social�status.�The�higher� the�educational�status,� the�more� likely� it� is� that�people�belong� to� relatively�higher� income�groups,�which�makes�unemployment�sustainable.��Table 8.3: Distribution of Workforce by Level of Education and Type of Employment in Percentages for 15-years-old and Over (2004)
Non-formal agriculture
(incl. ganyu)
Non-formal other than Agriculture
Formal Public Sector
Formal Private Sector
Student or Non- active
Un- employed Total
Unemploy-ment rate*
No school 75.0 4.1 2.1 6.8 11.1 1.0 100.0 1.1 Lower primary 66.5 4.8 2.1 8.2 17.2 1.1 100.0 1.3 Upper primary 50.5 6.2 2.3 9.7 29.8 1.4 100.0 2.1 Lower secondary 30.1 6.6 4.5 10.4 46.4 2.0 100.0 3.7 Upper secondary 20.5 7.1 12.6 18.6 34.5 6.6 100.0 10.1 Technical college 3.5 1.2 44.0 20.9 27.3 3.0 100.0 4.2 Higher 4.1 4.6 28.7 39.9 20.7 1.9 100.0 2.4 Total 55.7 5.4 3.7 9.7 23.7 1.8 100.0 2.3
Source:�IHS�2004.�*�The�unemployment�rate�is�based�on�the�economically�active�population�(that�is,�total�without�non�active,�incl.�students).��
As�can�be�expected,�improved�education�leads�to�higher�incomes.�Both�the�annual�income1� and� the� income� difference� compared� to� the� previous� educational� level�increases�with�each�level�of�education�attained.�While�the�gain�in�expected�income�for�people�with�lower�primary�education�compared�to�those�without�schooling�is�only�14�percent,�this�difference�increases�to�almost�60�percent�for�those�with�upper�primary;�89�percent� with� lower� secondary;� and� 138� percent� for� upper� secondary.� Having� been�enrolled� in� a� TC� means� 196� percent� more� expected� income� compared� to� upper�secondary�education.��
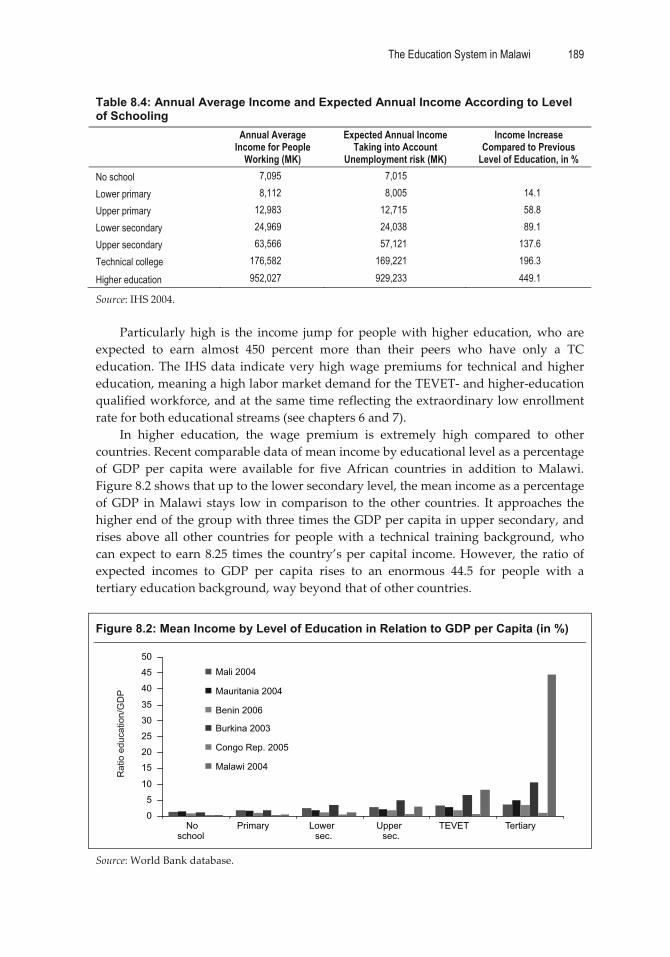
The Education System in Malawi 189
�
Table 8.4: Annual Average Income and Expected Annual Income According to Level of Schooling
Annual Average Income for People
Working (MK)
Expected Annual Income Taking into Account
Unemployment risk (MK)
Income Increase Compared to Previous
Level of Education, in % No school 7,095 7,015 Lower primary 8,112 8,005 14.1 Upper primary 12,983 12,715 58.8 Lower secondary 24,969 24,038 89.1 Upper secondary 63,566 57,121 137.6 Technical college 176,582 169,221 196.3
Higher education 952,027 929,233 449.1
Source:�IHS�2004.���
Particularly� high� is� the� income� jump� for� people�with� higher� education,�who� are�expected� to� earn� almost� 450� percent� more� than� their� peers� who� have� only� a� TC�education.�The� IHS�data� indicate�very�high�wage�premiums� for� technical� and�higher�education,�meaning�a�high�labor�market�demand�for�the�TEVET��and�higher�education�qualified�workforce,�and�at�the�same�time�reflecting�the�extraordinary�low�enrollment�rate�for�both�educational�streams�(see�chapters�6�and�7).��
In� higher� education,� the� wage� premium� is� extremely� high� compared� to� other�countries.�Recent�comparable�data�of�mean�income�by�educational�level�as�a�percentage�of� GDP� per� capita� were� available� for� five� African� countries� in� addition� to� Malawi.�Figure�8.2�shows�that�up�to�the�lower�secondary�level,�the�mean�income�as�a�percentage�of�GDP� in�Malawi� stays� low� in� comparison� to� the� other� countries.� It� approaches� the�higher�end�of�the�group�with�three�times�the�GDP�per�capita�in�upper�secondary,�and�rises� above� all� other� countries� for� people�with� a� technical� training� background,�who�can�expect� to� earn�8.25� times� the�country’s�per�capital� income.�However,� the� ratio�of�expected� incomes� to� GDP� per� capita� rises� to� an� enormous� 44.5� for� people� with� a�tertiary�education�background,�way�beyond�that�of�other�countries.���
Figure 8.2: Mean Income by Level of Education in Relation to GDP per Capita (in %)
0
5
10
15
20
25
30
35
40
45
50
Noschool
Primary Lowersec.
Uppersec.
TEVET Tertiary
Mali 2004
Mauritania 2004
Benin 2006
Burkina 2003
Congo Rep. 2005
Malawi 2004
Rat
io e
duca
tion/
GD
P
�
Source:�World�Bank�database.�

190 World Bank Working Paper
�
Labor Market Relevance of TEVET and Higher Education (Results of the Tracer Studies)
Unlike� general� education,� TEVET� and� higher� education� (HE)� are� directly� aimed� at�preparing� students� for� employment.2� The� expected� income� levels� presented� in� the�previous�section�strongly�suggest�a�high�demand�for�graduates�of�the�two�educational�streams,� but� do� not� necessarily� provide� a� clear� and� disaggregated� answer� to� the�question� of� labor� market� relevance.� Following� is� an� analysis� of� existing� data� and�information,�mainly�of�the�two�2008�tracer�studies,�meant�to�form�a�preliminary�picture�about� the� value� and� relevance� of� the� qualifications� and� competencies� of� higher�education�and�TEVET�completers�in�the�labor�market.��
Higher�Education�The�2008�GTZ/World�Bank�tracer�study�of�a�total�of�492�graduates�from�five�different�higher�educational�institutions3�indicates�that�the�higher�education�sector�in�Malawi�is�to� a� large� extent� successful� in� preparing� highly� qualified� human� resources� for�employment.�
Overall,�graduates�are�well�employed�and�have�success�integrating�into�the�labor�market.�As� figure�8.3�shows,�85.3�percent�of�all� respondents� found�employment�after�graduating� from�higher� education,� the� vast�majority� (72.2� percent)� in� full�time�wage�employment.� Self�employment� is� small� (2.1� percent),� but� a� substantial� share� of�graduates�are�working�part�time�(11�percent).�A�relatively�high�amount—9.9�percent—is� seeking� employment,� of�whom� the�most� recent� graduates� (2007)� have� the� highest�unemployment.� The� higher� unemployment� in� the� tracer� study� compared� with� the�results�of�the�2004�IHS�described�in�section�II.1�can�most�likely�be�attributed�to�the�fact�that�only�graduates�in�the�four�most�recent�graduation�years�(2004–2007)�were�traced,�which� points� to� labor� market� entry� problems� for� a� still� considerable� number� of�graduates.���
Figure 8.3: Occupational Situation of HE graduates by Field of Study
60.063.665.566.769.572.272.578.279.5
100.0
0% 50% 100%
OtherICT
Pure ScienceAgriculture
Social SciencesTotal / Average
HumanitiesEconomics/Bus
EngineeringLaw
FT employed
Own business
PT employed
Seeking employment
Other
�Source:�Pfeiffer/Chiunda�2008�(Appendix�9).��

The Education System in Malawi 191
�
Figure� 8.3� also� shows� relatively� clear�variations� in� the� fields�of� study.�Law� fares�best� by� far,� bringing� all� graduates� into� regular� full�time� employment;� engineering,�business/economics,� and,� interestingly,� humanities,� show� above�average� full�time�employment� rates.� ICT,� social� science,� agriculture,� and� pure� science� have� below�average�results.�ICT�also�shows�the�highest�unemployment�rate,�pointing�to�a�possible�saturation�in�the�relevant�labor�market,�which�calls�for�further�analysis.��
Comparing�data�with�other�African�countries�shows�a�very�high�employment�rate�for� academically� trained�Malawians� and� reflects� the� generally� low� higher� education�enrollment� rates.� Interestingly,� Malawi� is� the� only� country� with� a� markedly� higher�employment� rate� for� younger� rather� than� older� academicians,� suggesting� an� even�higher�recent�labor�market�demand.4��
The� good� labor�market� standing� (of� younger�HE�graduates� in� particular)� is� also�reflected� in� a� relatively� short� job� search� after� graduation.� Seventy�five� percent� of� all�graduates� are� employed�within� the� first� six�months� after� graduation,� and� 94�percent�have�managed� to� find� jobs�within� one� year.� The� search� process� is� on� average�much�longer� for� those� who� have� left� university� without� any� academic� qualification� (see�figure�8A.1�in�Appendix�8.1),�which�confirms�the�value�of�full�academic�qualifications�in�the�market,�as�compared�to�some�academic�knowledge.���
Figure 8.4: Employment Rate (Modern Sector Only) of Higher-Education Leavers in Different Age Groups in Different African Countries
0
10
20
30
40
50
60
70
80
90
100
Malawi
Mozam
bique
Chad
Burkina
Burund
i
Leso
tho
Zambia
Ugand
a
Ethiop
ia
Ghana
Madag
asca
r
Rwanda
Seneg
al
Sierra
Leon
e
Centra
l Afric
an R
epub
lic
AVERAGE
Camero
on
Maurita
niaBen
inMali
Togo
Guinea
-Biss
au
Côte d'
Ivoire
Congo
, Dem
. Rep
. of
Guinea
Age 25–34
Age 35–59
Per
cent
�Source:�World�Bank�database.��
As�previously�described,�the�income�potential�of�HE�graduates,�which�was�also�re�confirmed�by� the� tracer�study,� indicates� the�high�value� the� labor�market�attributes� to�academic� qualifications.� Not� surprisingly,� the� income� distribution� of� graduates� in�employment� is� characterized� by� a� very� large� range� of� between� MK9,000� and�
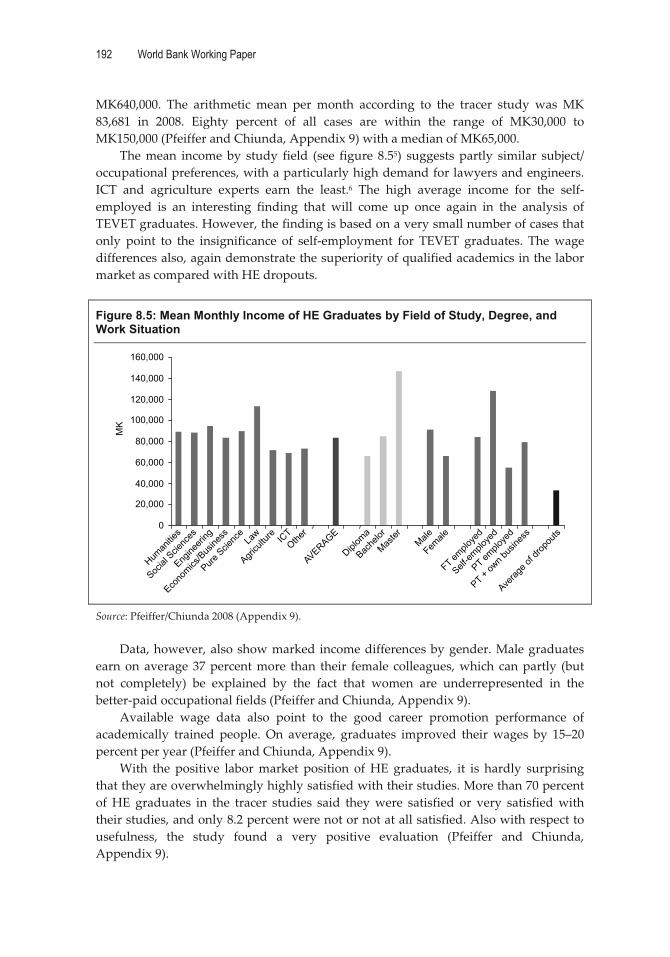
192 World Bank Working Paper
�
MK640,000.� The� arithmetic� mean� per� month� according� to� the� tracer� study� was� MK�83,681� in� 2008.� Eighty� percent� of� all� cases� are� within� the� range� of� MK30,000� to�MK150,000�(Pfeiffer�and�Chiunda,�Appendix�9)�with�a�median�of�MK65,000.��
The�mean� income�by� study� field� (see� figure� 8.55)� suggests�partly� similar� subject/�occupational�preferences,�with�a�particularly�high�demand�for�lawyers�and�engineers.�ICT� and� agriculture� experts� earn� the� least.6� The� high� average� income� for� the� self�employed� is� an� interesting� finding� that� will� come� up� once� again� in� the� analysis� of�TEVET�graduates.�However,�the�finding�is�based�on�a�very�small�number�of�cases�that�only� point� to� the� insignificance� of� self�employment� for� TEVET� graduates.� The�wage�differences�also,�again�demonstrate�the�superiority�of�qualified�academics�in�the�labor�market�as�compared�with�HE�dropouts.���
Figure 8.5: Mean Monthly Income of HE Graduates by Field of Study, Degree, and Work Situation
0
20,000
40,000
60,000
80,000
100,000
120,000
140,000
160,000
Human
ities
Social
Scie
nces
Engine
ering
Econo
mics/B
usine
ss
Pure S
cienc
eLa
w
Agricu
lture IC
TOthe
r
AVERAGE
Diplom
a
Bache
lor
Master
Male
Female
FT emplo
yed
Self-em
ploye
d
PT emplo
yed
PT + ow
n bus
iness
Averag
e of d
ropou
ts
MK
�
Source:�Pfeiffer/Chiunda�2008�(Appendix�9).��
Data,�however,�also�show�marked� income�differences�by�gender.�Male�graduates�earn�on�average�37�percent�more� than� their� female� colleagues,�which� can�partly� (but�not� completely)� be� explained� by� the� fact� that� women� are� underrepresented� in� the�better�paid�occupational�fields�(Pfeiffer�and�Chiunda,�Appendix�9).��
Available� wage� data� also� point� to� the� good� career� promotion� performance� of�academically� trained� people.�On� average,� graduates� improved� their�wages� by� 15–20�percent�per�year�(Pfeiffer�and�Chiunda,�Appendix�9).��
With� the� positive� labor�market� position� of�HE� graduates,� it� is� hardly� surprising�that�they�are�overwhelmingly�highly�satisfied�with�their�studies.�More�than�70�percent�of�HE� graduates� in� the� tracer� studies� said� they�were� satisfied� or� very� satisfied�with�their�studies,�and�only�8.2�percent�were�not�or�not�at�all�satisfied.�Also�with�respect�to�usefulness,� the� study� found� a� very� positive� evaluation� (Pfeiffer� and� Chiunda,�Appendix�9).��

The Education System in Malawi 193
�
Table 8.5: Months Needed by HE Graduates to Properly Carry out Professional Tasks Months %
1 18.2 2–3 29.8 4–6 26.4
More 25.6
Source:�Pfeiffer�and�Chiunda,�Tracer�Study�of�TEVET�and�Higher�Education�Completers�in�Malawi,�See�Appendix�9.��
Still�positive� (although�less�enthusiastic)�are�employers�about� the�performance�of�HE� graduates.� The� best� scores� were� for� basic� professional� abilities� and� knowledge,�least� for� special� professional� knowledge.� Ten� percent� of� employers� were� generally�unsatisfied,�indicating�that�a�share�of�HE�graduates�do�not�exhibit�the�expected�level�of�knowledge� and� competence� (Pfeiffer� and�Chiunda,�Appendix� 9).�A� large� number� of�employers�(74.4�percent)�said�that�a�graduate�would�normally�need�six�months�or�less�for� professional� adaptation� (see� table� 8.5),� which� is� a� good� result� in� international�comparisons.��
TEVET�As�is�the�case�for�higher�education,�TEVET�also�appears�to�be�relevant�to�the�needs�of�the� labor� market.� According� to� the� GTZ/World� Bank� tracer� survey� (Pfeiffer� and�Chiunda,�Appendix�9),�which�followed�completers�from�various�TEVET�programs�and�provider� systems,� 93� percent� of� all� completers� indicated� that� the� training� was�somewhat� or� very� useful,� despite� a� range� of� complaints� about� organizational� issues�during� the� program.� The� TEVETA� Labor�Market� Survey� (JIMAT,� 2008),� which� only�included� participants� in� the� formal� TEVET� apprenticeship� program� in� its� sample,�confirms�this�general�perception.�Both�studies�also�show�that�completers�usually�work�in� the� professional� field,� for� which� they� were� trained.� The� GTZ/World� Bank� study�shows�an�80�percent�matching�rate.�Also,�the�TEVETA�study�verified�for�former�formal�apprentices� a� high� correspondence� between� field� of� training� and� work� (Pearson�coefficient�of�0.927).���Table�8.6:�Direct�Results�of�Training�Indicated�by�TEVET�Graduates�Results of Training % of Respondents I got a job. 3.3 I have been able to make better products. 38.9 I have been hired more frequently to provide my services. 30.8 I managed to open my own business. 24.3 No change 14.5 Total (n=1000)
Source:�Pfeiffer�and�Chiunda,�Tracer�Study�of�TEVET�and�Higher�Education�Completers�in�Malawi,�Appendix�9.��
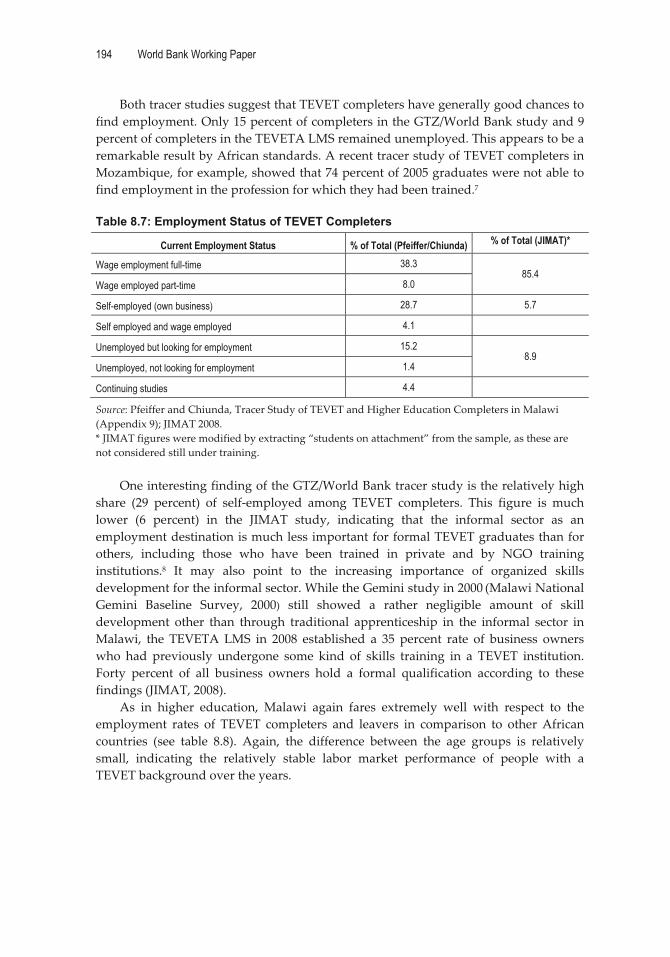
194 World Bank Working Paper
�
Both�tracer�studies�suggest�that�TEVET�completers�have�generally�good�chances�to�find�employment.�Only�15�percent�of�completers�in�the�GTZ/World�Bank�study�and�9�percent�of�completers�in�the�TEVETA�LMS�remained�unemployed.�This�appears�to�be�a�remarkable�result�by�African�standards.�A�recent�tracer�study�of�TEVET�completers�in�Mozambique,�for�example,�showed�that�74�percent�of�2005�graduates�were�not�able�to�find�employment�in�the�profession�for�which�they�had�been�trained.7���Table 8.7: Employment Status of TEVET Completers
Current Employment Status % of Total (Pfeiffer/Chiunda) % of Total (JIMAT)*
Wage employment full-time 38.3 85.4
Wage employed part-time 8.0
Self-employed (own business) 28.7 5.7
Self employed and wage employed 4.1
Unemployed but looking for employment 15.2 8.9
Unemployed, not looking for employment 1.4
Continuing studies 4.4
Source:�Pfeiffer�and�Chiunda,�Tracer�Study�of�TEVET�and�Higher�Education�Completers�in�Malawi�(Appendix�9);�JIMAT�2008.�*�JIMAT�figures�were�modified�by�extracting�“students�on�attachment”�from�the�sample,�as�these�are�not�considered�still�under�training.��
One�interesting�finding�of�the�GTZ/World�Bank�tracer�study�is�the�relatively�high�share� (29� percent)� of� self�employed� among� TEVET� completers.� This� figure� is� much�lower� (6� percent)� in� the� JIMAT� study,� indicating� that� the� informal� sector� as� an�employment�destination�is�much�less�important�for�formal�TEVET�graduates�than�for�others,� including� those� who� have� been� trained� in� private� and� by� NGO� training�institutions.8� It� may� also� point� to� the� increasing� importance� of� organized� skills�development�for�the�informal�sector.�While�the�Gemini�study�in�2000�(Malawi�National�Gemini� Baseline� Survey,� 2000)� still� showed� a� rather� negligible� amount� of� skill�development� other� than� through� traditional� apprenticeship� in� the� informal� sector� in�Malawi,� the� TEVETA�LMS� in� 2008� established� a� 35� percent� rate� of� business� owners�who� had� previously� undergone� some� kind� of� skills� training� in� a� TEVET� institution.�Forty� percent� of� all� business� owners� hold� a� formal� qualification� according� to� these�findings�(JIMAT,�2008).��
As� in� higher� education,� Malawi� again� fares� extremely� well� with� respect� to� the�employment� rates� of� TEVET� completers� and� leavers� in� comparison� to� other�African�countries� (see� table� 8.8).� Again,� the� difference� between� the� age� groups� is� relatively�small,� indicating� the� relatively� stable� labor� market� performance� of� people� with� a�TEVET�background�over�the�years.���

The Education System in Malawi 195
�
Table 8.8: Employment (of All Kinds) Rate of TEVET Graduates or Leavers, Aged 25–34 and 35–59 in Different African Countries (in %)
Country Job Insertion, TEVET, 25–34
Job Insertion, TEVET, 35–59 Year
Difference Between Age
Groups Malawi 93.9 97.8 2004 –3.9 Uganda 92.8 96.6 2002 –3.8 Rwanda 92.7 90.4 2001 2.3 Lesotho 91.2 97.0 2002 –5.8 Mozambique 90.6 96.9 2002 –6.3 Ethiopia 89.7 94.7 2004 –5.0 Ghana 89.5 93.8 2003 –4.3 Benin 83.0 93.0 2006 –10.0 Mauritania 79.3 91.3 2005 –12.0 Burkina Faso 78.0 88.4 2002 –10.4 Mali 72.8 74.2 2004 –1.4 Sierra Leone 72.3 88.6 2003 –16.3 Togo 71.0 80.0 2006 –9.0 Cameroon 70.9 81.6 2001 –10.7 Côte d'Ivoire 69.8 67.8 2002 2.0 Senegal 60.5 77.5 2001 –17.0 Central African Republic 60.3 79.7 2003 –19.4 Congo, Rep. 59.6 79.2 2003 –19.6 Guinea 56.6 83.2 2002 –26.6 Chad 49.4 97.6 2002 –48.2 Average 76.19 87.47 –11.28
Source:�World�Bank�database.��
Another� indicator� for� the� good� value� of� TEVET� qualifications� is� the� duration�between� completion� and� entrance� into� employment.� Both� tracer� studies� show� good�results�in�this�regard.�Yet�the�data�in�figure�8.6�suggest�that�apprenticeship�training�in�fact� eases� labor� market� entry,� because� students� have� built� up� relations� with� future�employers�during�the�training�time.�According�to�the�TEVETA�LMS,�86�percent�of�all�employed� former� apprentices� found� jobs� within� the� first� six� months,� while� only� 64�percent�of�the�mixed�group�of�TEVET�graduates�did�so.��
In�view�of�the�findings�that�TEVET�completers�are�in�demand�in�the�labor�market,�the� low�income� level� noted� by� both� tracer� studies� is� a� cause� of� concern.� While�international� comparative� data� show� that� the� expected� income� of�Malawians�with� a�TEVET�background�in�relation�to�the�country’s�GDP�per�capita.�is�relatively�favorable�(see�figure�8.2),�expected�income�remains�very�low�compared�to�the�expected�incomes�after�completion�of�higher�education.�This�is�of�particular�concern�because�of�the�level�and�duration�of�formal�TEVET�programs,�which�are�post�secondary�and�often�last�four�years.� The� GTZ/World� Bank� study� established� a� mean� monthly� net� income� of� only�MK16,730,� again� with� an� extremely� skewed� distribution.� Fifty�three� percent� of� all�completers�earn�MK10,000�or�less�(see�figure�8.7).�There�is�no�significant�difference�by�gender.��

196 World Bank Working Paper
�
Figure 8.6: Duration of Job Search of TEVET Completers: Findings from Two Tracer Studies (2008) (in %)
44.7
73.5
19.4
12.221.7
4.315.2 9.9
0102030405060708090
100
GTZ/World BankTracer Study
TEVETA LMS
more than one year
7-12 months
4-6 months
up to three months
Per
cent
�
Source:�Pfeiffer/Chiunda�2008�(Appendix�9).��
Interestingly,� with� an� average� MK20,724� monthly� net� income,� self�employment�pays�better� than�wage� employment.� It� is� hardly� surprising� that� self�employment�has�turned� into� an� attractive� option� for� TEVET� completers.� This� is� confirmed� by� the�TEVETA�LMS,�where�57.6�percent�of�the�traced�former�apprentices�indicated�that�they�want�to�be�self�employed�(JIMAT,�2008).��
The� income� of� former� apprentices�merits� special� attention� and� further� research.�Sixty�four� percent,� as� the� TEVETA� study� shows,� are� in� the� wage� range� below�MK10,000.�It�is�worth�noting�that�53�percent�of�all�apprentices�traced�by�JIMAT�receive�an� allowance� of� between� MK6,000� and� MK10,000� during� the� second� year� of� their�apprenticeship�(JIMAT,�2008).�So�apprentices�hardly�earn�more�after�graduation�than�they�receive�in�the�first�half�of�their�studies.���
Figure 8.7: Net Income per Month of TEVET Graduates (MK)
18.4
34.9
22.8
10.4 9.24.3
0
5
10
15
20
25
30
35
40
below5,000
5,000–10,000
10,000–20,000
20,000–30,000
30,000–50,000
above50,000
Perc
ent
Income (MK) �Source:�Pfeiffer/Chiunda�2008�(Appendix�9).��
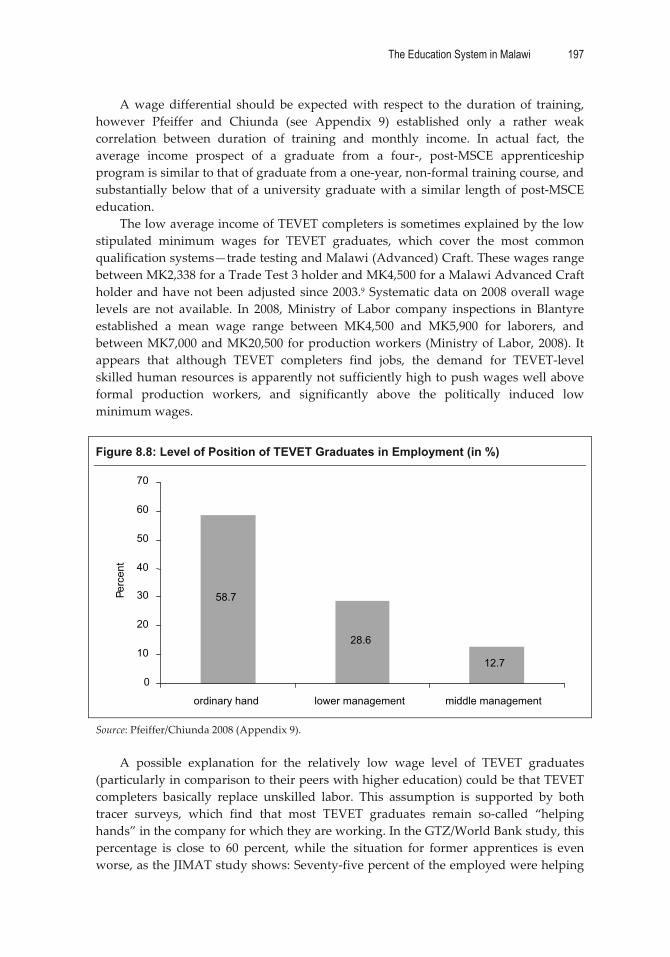
The Education System in Malawi 197
�
A�wage�differential� should� be� expected�with� respect� to� the�duration� of� training,�however� Pfeiffer� and� Chiunda� (see� Appendix� 9)� established� only� a� rather� weak�correlation� between� duration� of� training� and� monthly� income.� In� actual� fact,� the�average� income� prospect� of� a� graduate� from� a� four�,� post�MSCE� apprenticeship�program�is�similar�to�that�of�graduate�from�a�one�year,�non�formal�training�course,�and�substantially�below� that�of�a�university�graduate�with�a� similar� length�of�post�MSCE�education.��
The�low�average�income�of�TEVET�completers�is�sometimes�explained�by�the�low�stipulated� minimum� wages� for� TEVET� graduates,� which� cover� the� most� common�qualification�systems—trade�testing�and�Malawi�(Advanced)�Craft.�These�wages�range�between�MK2,338�for�a�Trade�Test�3�holder�and�MK4,500�for�a�Malawi�Advanced�Craft�holder�and�have�not�been�adjusted�since�2003.9�Systematic�data�on�2008�overall�wage�levels� are� not� available.� In� 2008,�Ministry� of� Labor� company� inspections� in� Blantyre�established� a� mean� wage� range� between� MK4,500� and� MK5,900� for� laborers,� and�between�MK7,000�and�MK20,500�for�production�workers� (Ministry�of�Labor,�2008).� It�appears� that� although� TEVET� completers� find� jobs,� the� demand� for� TEVET�level�skilled�human�resources�is�apparently�not�sufficiently�high�to�push�wages�well�above�formal� production� workers,� and� significantly� above� the� politically� induced� low�minimum�wages.���
Figure 8.8: Level of Position of TEVET Graduates in Employment (in %)
58.7
28.6
12.7
0
10
20
30
40
50
60
70
ordinary hand lower management middle management
Perc
ent
�
Source:�Pfeiffer/Chiunda�2008�(Appendix�9).��
A� possible� explanation� for� the� relatively� low� wage� level� of� TEVET� graduates�(particularly�in�comparison�to�their�peers�with�higher�education)�could�be�that�TEVET�completers� basically� replace� unskilled� labor.� This� assumption� is� supported� by� both�tracer� surveys,� which� find� that� most� TEVET� graduates� remain� so�called� “helping�hands”�in�the�company�for�which�they�are�working.�In�the�GTZ/World�Bank�study,�this�percentage� is� close� to� 60� percent,� while� the� situation� for� former� apprentices� is� even�worse,�as�the�JIMAT�study�shows:�Seventy�five�percent�of�the�employed�were�helping�

198 World Bank Working Paper
�
hands.�A�comparison�with�positions�at�first�employment�and�at�the�time�of�the�study�demonstrates� that�only�a� small� amount� (some�14�percent)�were�able� to�advance�over�time�(table�8.9).���Table 8.9: Position of TEVET Completers at First Employment and Time of Study (in %)
Position At First Employment At Time of Study Ordinary hand 89.4 74.8 Supervisor 5.0 11.0 Foreman/middle management 2.8 11.5 Other 2.8 2.8
Source:�JIMAT�2008.��
As�responses� to�open�questions� in� the� tracer�studies�show,� low�wages�are�one�of�the� main� reasons� for� lack� of� interest� in� TEVET� among� young� Malawians.� Further�research�into�the�wage�determination�of�TEVET�completers�is�recommended.�
Although� the� two� studies� provide� some� insight� into� the� relative� value� of� the�different� TEVET� certificates� in� the� labor� market,� there� are� some� doubts� about� the�validity� of� replies� in� both� surveys.10� The�GTZ/World�Bank� study� shows� a� significant�market� preference� for� certificate� holders� of� any� kind� compared� to� those� without�certificates.� City� and� Guilds� graduates� tend� to� be� better� remunerated,� however,� the�overall� findings�do�not� provide� evidence� that� preferences� for� certain� certificates� also�lead� to� better� pay.� The� TEVETA� LMS� included� questions� about� the� qualification�preferences� in� its� employers’� survey,� and� the� results� suggest� a� rather� undecided�picture:� 58� percent� of� employers� indicated� they� did� not� have� preferences� and� 51�percent� said� they�did�not�differentiate�between� the�qualifications� in�wage� setting.�Of�those�who�do,�the�highest�wages�are�clearly�paid�to�City�and�Guilds�holders,�a�finding�that� corresponds�with� the�GTZ/World� Bank� study.11� The� JIMAT� study� also� provides�some� indications� of� the� preference� of� employers� for� trade� testing� over�Malawi�Craft�and�Advanced�Craft,�and�hence�supports�the�general�assumption�in�this�regard.��
In�figure�8.9,�significant�income�variations�can�be�seen�by�field�of�study.�In�general,�the� food� and� hospitality� sectors� tend� to� pay� less,�while� some� fields,� including�more�modern�trades,�pay�better.�Income�differences,�however,�appear�to�be�an�issue�of�trade�specific� characteristics� (for� example,� company� sizes,� economic� sectors)� rather� than�of�human� resource� shortages.12� The� TEVETA� LMS� interviewed� companies� about� their�unmet� skills� demand� by� occupation.� The� findings� are� presented� in� figure� 8.11� in�Section�II.4.�There�appears�to�be�no�obvious�correlation�with�the�level�of�demand�and�average� salary� of� TEVET� graduates.� For� some� occupations,� where� (according� to� the�TEVETA�LMS),�the�current�unmet�demand�is�particularly�high,13�salaries�are�also�above�the�mean�average,�such�as� for�steel� fixing,�refrigeration,�and�fabrication�and�welding.�Other� occupational� fields,� such� as� plumbing,� electrical� installation,� and�painting� and�decoration�recorded�a�large�demand�but�pay�a�below�average�salary.���

The Education System in Malawi 199
�
Figure 8.9: Mean Monthly Net Income of TEVET Completers
0
5,000
10,000
15,000
20,000
25,000
30,000
35,000
40,000
Steel fi
Other (
spec
ify)
Refrige
ration
& Air C
ondit
ioning
Hawke
r
Compu
ter S
cienc
e
Secret
arial,
Admini
strati
on &
Accou
nting
Wood M
achin
g/Fab
ricati
on &
Woo
d Prod
ucts
Carpen
try an
d Join
ery
Beauty
Therap
y
AVERAGE
Genera
l Fitti
ng
Brick L
aying
Paintin
g and
Dec
oratio
n
Electric
al Ins
tallat
ion
Electro
nics
Car main
tenan
ce
Tailo
ring a
nd D
esign
ing
Plumbin
g
Food P
roduc
tion
Hospit
ality
Service
s
Food P
roces
sing
MK
�
Source:�Pfeiffer/Chiunda�2008�(Appendix�9).��
Rates of Return to Education
A� comparative� view� of� the� rates� of� return� to� different� levels� of� schooling� provides�evidence� of� the� economic� value� added� to� each� additional� educational� level� attained.�Rates�of�return�(ROR)�are�assumed�to�reflect�the�increased�labor�productivity�induced�by�education.�Private�ROR�describe�the�average�extra�income�gained�by�an�individual�through�additional�education�in�relation�to�the�cost�of�this�education�for�the�individual�(including�the�foregone�earnings�due�to�longer�studies).�The�social�ROR�informs�about�the�gain�of�society�at�large.�It�is�calculated�by�relating�the�additional�expected�income�to�the�total�cost�involved�in�the�education,�both�private�and�public.�An�analysis�of�the�rates� of� return� to� each� level� of� schooling� in� Malawi� helps� us� understand� whether�investments� in� education� for� both�private�households� and� society� are�beneficial,� and�may�serve�as�a�tool�to�analyze�the�appropriateness�of�educational�investment.��
The� growing� income� differential� in� relation� to� an� increasing� level� of� schooling�corresponds�with�increasing�private�rates�of�return�to�education.�Table�8.10�shows�very�high�ROR�to�education�in�Malawi,�established�already�in�ROR�to�education�analyses�in�previous�years.14�Returns� to�education�appear� to�be�high�by�African�standards.�Table�8.11� compares� returns� in� Malawi� to� those� recently� calculated� with� the� same�methodology�for�Benin�and�Congo.�The�high�returns�reflect�that�education�is�still�a�rare�privilege� in�Malawi,� for�which� the� labor�market� is� prepared� to�pay� a� high�premium�compared�to�its�costs.15��

200 World Bank Working Paper
�
Table 8.10: Private and Social Rates of Return to Education
Rates of return
Additional Annual Income Compared to Lower Level
(MK)
Public Cost per Student in the
Level (MK)
Private Cost per Student (direct
+ foregone earnings, MK)
Total Social Cost (public + private, MK)
Private ROR
Social ROR
Lower primary 990 8,384 20,176 28,559 5% 3% Upper primary 4,710 7,990 31,643 39,633 15% 12% Lower secondary 11,323 52,900 52,598 105,498 22% 11% Upper secondary 33,083 56,256 75,462 131,718 44% 25% TC (compared to upper secondary) 112,100 111,912 207,492 319,404 54% 35% Higher 872,112 3,233,722 508,857 3,742,579 171% 23%
Source:�Own�calculations�based�on�IHS�2004�data�and�data�from�Chapter�3.�Note:�Public�and�private�direct�cost�are�computed�by�multiplying�the�annual�unit�cost�(as�calculated�in�Chapter�3)�by�the�average�number�of�years�of�schooling�within�the�level�of�education�(see�Appendix�8.3�for�more�details).��Table 8.11: ROR in Malawi Compared to Selected Other African Countries
Malawi (priv.)*
Malawi (soc.)*
Benin (priv.)*
Benin (soc.)*
Congo (priv.)*
Congo (soc.)*
Lower primary 5% 3% 4% 3% 3% 3% Upper primary 15% 12%
Lower secondary 22% 11% 1% 1% 3% 2% Upper secondary 44% 25% 9% 7% 4% 2% TC (compared to upper sec.) 54% 35% 2% 2% 3% 2% Higher education 171% 23% 5% 3% 4% 1%
Source:�Malawi�IHS�2004;�CSR�Benin;�CSR�Republic�of�Congo.�*�In�Benin�and�Congo,�TEVET�is�post�primary.�The�ROR�represents�the�return�from�primary�education�to�TEVET.��Rates� of� return� for� Malawi� were� calculated� based� on� IHS� 2004� data.� A� detailed�description�of�the�methodology�used�is�attached�in�Appendix�8.3.��
Interesting�is�also�the�enormous�gap�between�the�returns�to�higher�education�and�the� educational� levels� below.� It� indicates� a� severe� shortage� of� academically� trained�human�resources.�The�high�income�of�academics�may�also�be�related�to�the�privileged�status� that� academics� enjoy� in� the� public� sector,� where� a� large� portion� of� them� are�employed.�Furthermore,� the�regional� labor�market�for�academics,� in�which�Malawian�HE� graduates� compete,� is� likely� to� induce� an� additional� push� in� wages.� While� the�income�level�for�academically�trained�people�in�Malawi�is�high�relative�to�the�average�income�level�of�the�country,�expected�incomes�in�absolute�terms�may�still�be�relatively�low�compared�to�the�incomes�of�academics�in�neighboring�countries�that�have�a�much�higher�per�capita�income�than�Malawi.��
The� difference� between� private� and� social� ROR� makes� for� another� interesting�finding.� Social� ROR� are� per� definition� lower� than� private� ROR,� once� the� public� cost�involved�in�providing�education�is�factored�in.�Again,�overall�social�ROR�to�education�in� Malawi� are� very� high� at� all� levels.� However,� there� is� an� enormous� difference�between�the�private�and�social�ROR�in�higher�education.�For�an�average�academic,�the�
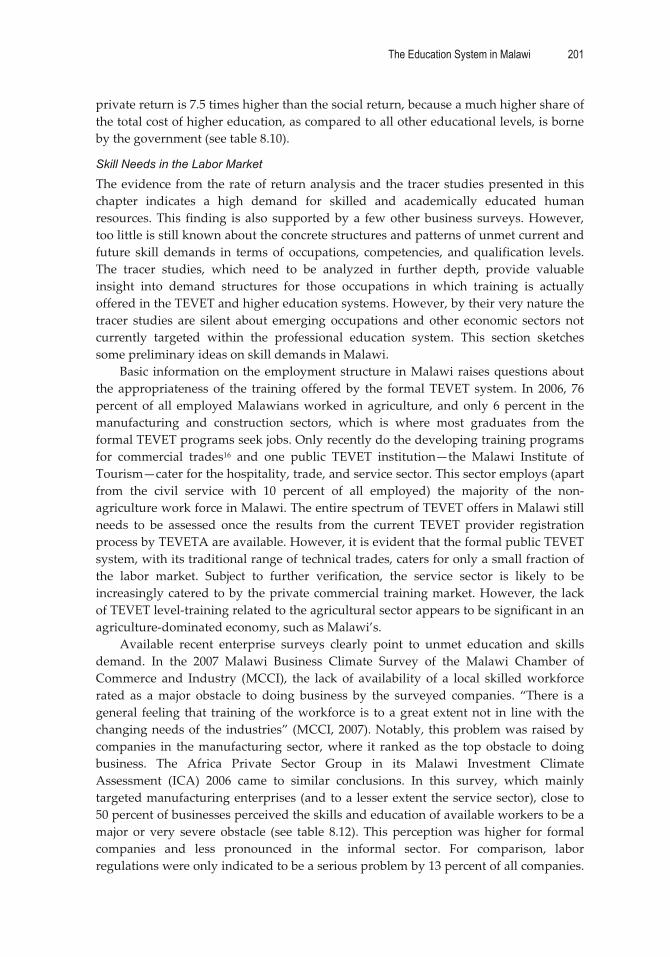
The Education System in Malawi 201
�
private�return�is�7.5�times�higher�than�the�social�return,�because�a�much�higher�share�of�the�total�cost�of�higher�education,�as�compared�to�all�other�educational�levels,�is�borne�by�the�government�(see�table�8.10).��
Skill Needs in the Labor Market
The�evidence�from�the�rate�of�return�analysis�and�the� tracer�studies�presented� in� this�chapter� indicates� a� high� demand� for� skilled� and� academically� educated� human�resources.�This� finding� is� also� supported�by�a� few�other�business� surveys.�However,�too�little�is�still�known�about�the�concrete�structures�and�patterns�of�unmet�current�and�future� skill� demands� in� terms� of� occupations,� competencies,� and�qualification� levels.�The� tracer� studies,� which� need� to� be� analyzed� in� further� depth,� provide� valuable�insight� into� demand� structures� for� those� occupations� in� which� training� is� actually�offered�in�the�TEVET�and�higher�education�systems.�However,�by�their�very�nature�the�tracer� studies� are� silent� about� emerging� occupations� and� other� economic� sectors� not�currently� targeted� within� the� professional� education� system.� This� section� sketches�some�preliminary�ideas�on�skill�demands�in�Malawi.��
Basic� information�on�the�employment�structure� in�Malawi�raises�questions�about�the� appropriateness� of� the� training� offered�by� the� formal�TEVET� system.� In� 2006,� 76�percent�of� all� employed�Malawians�worked� in� agriculture,� and�only�6�percent� in� the�manufacturing� and� construction� sectors,� which� is� where� most� graduates� from� the�formal�TEVET�programs�seek�jobs.�Only�recently�do�the�developing�training�programs�for� commercial� trades16� and� one� public� TEVET� institution—the� Malawi� Institute� of�Tourism—cater�for�the�hospitality,�trade,�and�service�sector.�This�sector�employs�(apart�from� the� civil� service� with� 10� percent� of� all� employed)� the� majority� of� the� non�agriculture�work�force�in�Malawi.�The�entire�spectrum�of�TEVET�offers�in�Malawi�still�needs� to� be� assessed� once� the� results� from� the� current� TEVET� provider� registration�process�by�TEVETA�are�available.�However,�it�is�evident�that�the�formal�public�TEVET�system,�with�its�traditional�range�of�technical�trades,�caters�for�only�a�small�fraction�of�the� labor� market.� Subject� to� further� verification,� the� service� sector� is� likely� to� be�increasingly�catered�to�by�the�private�commercial� training�market.�However,� the� lack�of�TEVET�level�training�related�to�the�agricultural�sector�appears�to�be�significant�in�an�agriculture�dominated�economy,�such�as�Malawi’s.��
Available� recent� enterprise� surveys� clearly� point� to� unmet� education� and� skills�demand.� In� the� 2007� Malawi� Business� Climate� Survey� of� the� Malawi� Chamber� of�Commerce� and� Industry� (MCCI),� the� lack� of� availability� of� a� local� skilled�workforce�rated� as� a�major� obstacle� to� doing� business� by� the� surveyed� companies.� “There� is� a�general� feeling� that� training�of� the�workforce� is� to�a�great�extent�not� in� line�with� the�changing�needs�of� the� industries”�(MCCI,�2007).�Notably,� this�problem�was�raised�by�companies� in� the�manufacturing� sector,�where� it� ranked�as� the� top�obstacle� to�doing�business.� The� Africa� Private� Sector� Group� in� its� Malawi� Investment� Climate�Assessment� (ICA)� 2006� came� to� similar� conclusions.� In� this� survey,� which� mainly�targeted�manufacturing�enterprises�(and�to�a� lesser�extent�the�service�sector),�close�to�50�percent�of�businesses�perceived�the�skills�and�education�of�available�workers�to�be�a�major� or� very� severe� obstacle� (see� table� 8.12).� This� perception�was�higher� for� formal�companies� and� less� pronounced� in� the� informal� sector.� For� comparison,� labor�regulations�were�only�indicated�to�be�a�serious�problem�by�13�percent�of�all�companies.�
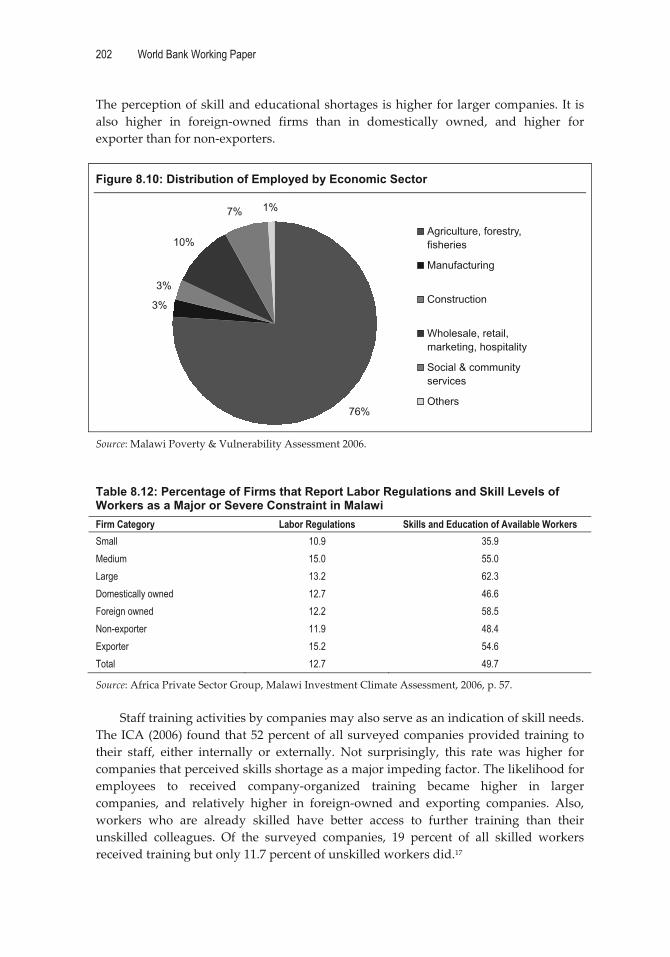
202 World Bank Working Paper
�
The�perception�of�skill�and�educational�shortages� is�higher�for� larger�companies.� It� is�also� higher� in� foreign�owned� firms� than� in� domestically� owned,� and� higher� for�exporter�than�for�non�exporters.���
Figure 8.10: Distribution of Employed by Economic Sector
76%
3%
3%
10%
7% 1%
Agriculture, forestry,fisheries
Manufacturing
Construction
Wholesale, retail,marketing, hospitality
Social & communityservices
Others
�
Source:�Malawi�Poverty�&�Vulnerability�Assessment�2006.���Table 8.12: Percentage of Firms that Report Labor Regulations and Skill Levels of Workers as a Major or Severe Constraint in Malawi Firm Category Labor Regulations Skills and Education of Available Workers Small 10.9 35.9 Medium 15.0 55.0 Large 13.2 62.3 Domestically owned 12.7 46.6 Foreign owned 12.2 58.5 Non-exporter 11.9 48.4 Exporter 15.2 54.6 Total 12.7 49.7
Source:�Africa�Private�Sector�Group,�Malawi�Investment�Climate�Assessment,�2006,�p.�57.��
Staff�training�activities�by�companies�may�also�serve�as�an�indication�of�skill�needs.�The�ICA�(2006)�found�that�52�percent�of�all�surveyed�companies�provided�training�to�their� staff,� either� internally� or� externally.� Not� surprisingly,� this� rate� was� higher� for�companies�that�perceived�skills�shortage�as�a�major�impeding�factor.�The�likelihood�for�employees� to� received� company�organized� training� became� higher� in� larger�companies,� and� relatively� higher� in� foreign�owned� and� exporting� companies.� Also,�workers� who� are� already� skilled� have� better� access� to� further� training� than� their�unskilled� colleagues.� Of� the� surveyed� companies,� 19� percent� of� all� skilled� workers�received�training�but�only�11.7�percent�of�unskilled�workers�did.17�
The Education System in Malawi 203
�
The�training�patterns�are�different�in�the�informal�sector.�Here,�the�preparedness�to�provide� training� is� generally� lower.�Only� 38� percent� (compared� to� 52� percent� in� the�formal� training)� provided� training� to� staff.� Moreover,� training� consisted� mainly� of�internal� training.� According� to� the� ICA,� the� reasons� for� this� are� two�fold:� a� lower�perceived�need�for�training�(indicated�by�61�percent�of�companies),�and�also�high�costs.�Almost�60�percent�indicated�that�training�would�be�too�costly.��
Interestingly,�only�12�percent�said� they� feared� their�employees�would� leave�after�training.�More�recent�studies�(notably�the�tracer�studies�and�the�informal�sector�survey�of� the� TEVETA�LMS)� point� to� the� overall� increasing� importance� of� formalized� skills�development�in�the�informal�sector.�As�described�before,�the�number�of�informal�sector�operators�with�a�TEVET�background�appears� to�have� increased� in�comparison� to� the�1990s.� Self�employment�has� also�become� an� attractive� employment� status� for�TEVET�graduates.� The� increased� attention� TEVETA� is� according� to� TEVET� programs� that�target� informal� sector� operators� and� the� informal� sector� labor� market� has� to� be�welcomed�in�this�context.��
Despite�the�many�indications�for�unmet�skills�demand,�a�more�concrete�knowledge�of� demand� by� occupations� and� competences� is� hardly� available.� This� would� be�necessary,� though,� to� sync� the� TEVET� supply� with� labor� market� demands.� More�recently,�only�the�TEVETA�LMS�(JIMAT,�2008)�tried�to�identify�skill�demands�in�more�concrete� terms.�According� to� JIMAT,�which� focused�on�occupational� areas� for�which�formal� TEVET� programs� exist,� unmet� training� needs� are� significant� in� advanced�mechanics,� welding� and� fabrication,� general� fitting,� electronics,� administration,�building,� calibration� equipment,� computer� knowledge,� machine� maintenance,� plant�operators,�steel�fixing,�advanced�molding,�and�fire�drill�evacuation.�A�lack�of�practical�skills�was�recorded�as�a�key�weakness�by�the�majority�of�companies.�JIMAT�also�found�that�on�average�across�occupational�fields,�the�demand�for�skilled�labor�as�a�percentage�of�all�employed�in�a�specific�occupational�field�was�47.6�percent,�with�occupations�such�as� water� plant� operators,� instrumentation� mechanics,� mechatronics,� plumbers,�refrigeration� technicians,� painters� and� decorators,� roofers,� drivers,� electricians,� plant�operators,�and�welders�showing�an�above�average�shortage�(unmet�demand)�of�skilled�workforce�(see�figure�8.11).�
In� view� of� the� occupational� limitations,� methodological� problems� as� well� as�resources� needed� for� studies� such� as� JIMAT’s,� considerable� doubts� remain� as� to�whether� comprehensive� quantitative� attempts� to� assess� skills� shortages� and� forecast�future� needs� is� the� right� approach� to� training� needs� assessment� in� a� country� like�Malawi,� where� research� capacities� and� resources� are� scarce.� More� qualitative�assessment�methods,�such�as�sector�specific�consultative�meetings�with�employers�and�experts,�complemented�by�targeted�surveys�of�selected�economic�sectors,�may�be�more�promising.18�

204 World Bank Working Paper
�
Figure 8.11: Unmet Labor Demand as a Percentage of Employed in Selected TEVET Occupations (in %)
0 20 40 60 80 100
road construction
joinery
motor vehicle body repair
bricklaying
secretarial & admin
landscaping
electronics
wood machining
automotive
general fitting
carpentry
carpentry/joinery
AVERAGE
fabrication/welding
plant operator
electrical installation
professional drivers
roofing
painting & decoration
refrigeration
plumbing
mechatronics
instrumentation
water plant operators
Percent �Source:�Calculations�based�on�figures�from�JIMAT�2008.��
Notes �1�This�refers�to�both�the�annual�average�income�for�people�working�recorded�in�the�IHS,�as�well�as�the�expected�annual�income�taking�the�unemployment�risk�into�account.��2�Including�self�employment��3�The�sample�was�drawn�from�Chancellor�College,�Polytechnical�College,�Bunda�College,�Mzuzu�College,�and�Sharewood�University.��4� The� rates� indicated� in� figure� 8.4� are� slightly� lower� than� the� ones� in� table� 8.3� because� the�international�comparison�only�takes�modern�sector�employment�into�account.�Table�8.3�showed��
The Education System in Malawi 205
�
�that� 8.7� percent� of� people� with� a� higher� education� background� are� working� in� traditional�agricultural�or�non�agricultural�sectors.��5�Only�those�who�are�employed�are�included�in�the�calculation.��6� The� GTZ/World� Bank� tracer� study� did� not� include� teachers� and� nursing� training� as� it� was�assumed�that�these�programs�train�for�public�employment.��7� Programa� Integrado� de� Reforma� da� Educacao� Profissional� (PIREP),� Analise� Estatistica� do�Estudo�de�Base�Sobre�Educacao�Tecnica�Profissional,�Dezembre�2007.��8�This�JIMAT�finding�cannot�be�verified�by�the�GTZ/World�Bank�study.�Here,�also�a�considerable�share�of�the�TC�completers�(24�percent)�indicated�they�were�self�employed.�However,�the�results�cannot�be�fully�compared,�because�the�GTZ/World�Bank�study�did�not�only�trace�former�formal�TEVET�students,�but�all�completers�of�programs�run�by�the�colleges.��9� It� should� be� emphasized� that� the� overall� minimum� wage� for� unskilled� labor� is� currently�MK3,280�for�urban�workers,�equal�to�the�minimum�wage�for�Trade�Test�2�holders.��10�Both�surveys�have�asked�the�traced�graduates�for�their�qualifications.�However,�the�results�are�not�clear.��11� In� the� JIMAT� study,� the� results� for� wages� and� qualifications� do� not� distinguish� among� the�levels�of�the�qualifications.��12� The� 2006� Malawi� Investment� Climate� Assessment,� which� mainly� analyzed� firms� from� the�manufacturing�sector,�found�strong�evidence�of�the�influence�of�firm�size,�foreign�ownership,�and�export�status�on�wage�levels.�Other�factors�being�equal,� in�2006�a�foreign�owned�firm�payed�33�percent�more� than� a�Malawian�owned� firm,� an� exporter� 9� percent�more� than� a� non�exporting�company,� a�medium�sized� company� 20� percent�more� than� an� small� firm,� and� a� large� firm� 30�percent�more�than�a�small�firm�(Investment�Climate�Assessment,�2006,�p.�70).��13�Measured�as�a�percentage�of�current�employment�in�the�occupational�area�14�The�2006�ICA�established�(on�the�basis�of�its�own�survey�data)�an�increase�in�wages�of�almost�15�percent� for�each�additional�year�of� schooling,�which�was� reduced� to�8–9�percent�when�data�were�controlled�for�occupation�(ICA�2006,�p.�68).��15� Benin� and�Congo�were� cited� because� of� the� availability� of� comparable� data.�However,� both�countries�have�a�significantly�higher�GDP�per�capita,�partially�explaining�the�lower�ROR.��16� This� refers� to� public� TCs.� Supposedly� the� supply� for� so�called� commercial� trades� is� much�higher�in�the�private�training�market,�for�which�no�data�are�available.��17�In�the�TEVETA�LMS�(JIMAT,�2008)�72�percent�of�all�surveyed�companies�engaged�in�in�house�training.�This� is�significantly�higher�than�in�the�ICA,�probably�because�only�the�companies�that�employ�skilled�people�were�included�in�the�sample.��18�Also�compare�the�recommendations�in�Johanson�and�Adams,�Skills�Development�in�Sub�Saharan�Africa,�the�World�Bank,�2004,�pp.�57–61.��
206
�
�
Appendixes�

The Education System in Malawi 207
�
Appendix 1.1: Demographic and Social Development Indicators
�
Map 1A.1: Population Density by District (2008)
�
Source:�National�Statistics�Office.���
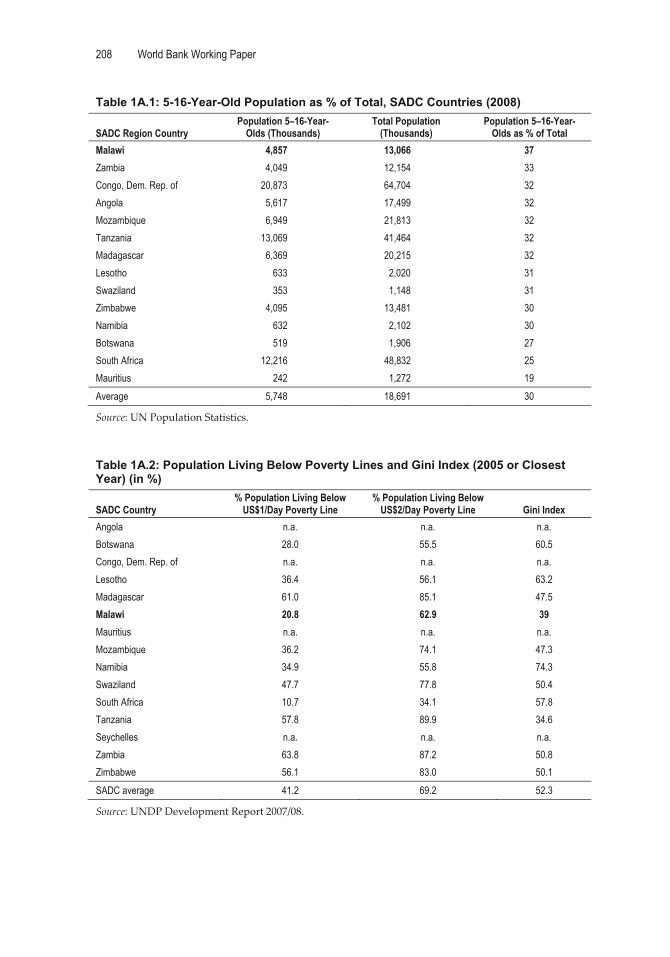
208 World Bank Working Paper
�
Table 1A.1: 5-16-Year-Old Population as % of Total, SADC Countries (2008)
SADC Region Country Population 5–16-Year-
Olds (Thousands) Total Population
(Thousands) Population 5–16-Year-
Olds as % of Total Malawi 4,857 13,066 37 Zambia 4,049 12,154 33 Congo, Dem. Rep. of 20,873 64,704 32 Angola 5,617 17,499 32 Mozambique 6,949 21,813 32 Tanzania 13,069 41,464 32 Madagascar 6,369 20,215 32 Lesotho 633 2,020 31 Swaziland 353 1,148 31 Zimbabwe 4,095 13,481 30 Namibia 632 2,102 30 Botswana 519 1,906 27 South Africa 12,216 48,832 25 Mauritius 242 1,272 19 Average 5,748 18,691 30
Source:�UN�Population�Statistics.���Table 1A.2: Population Living Below Poverty Lines and Gini Index (2005 or Closest Year) (in %)
SADC Country % Population Living Below
US$1/Day Poverty Line % Population Living Below
US$2/Day Poverty Line Gini Index Angola n.a. n.a. n.a. Botswana 28.0 55.5 60.5 Congo, Dem. Rep. of n.a. n.a. n.a. Lesotho 36.4 56.1 63.2 Madagascar 61.0 85.1 47.5 Malawi 20.8 62.9 39 Mauritius n.a. n.a. n.a. Mozambique 36.2 74.1 47.3 Namibia 34.9 55.8 74.3 Swaziland 47.7 77.8 50.4 South Africa 10.7 34.1 57.8 Tanzania 57.8 89.9 34.6 Seychelles n.a. n.a. n.a. Zambia 63.8 87.2 50.8 Zimbabwe 56.1 83.0 50.1 SADC average 41.2 69.2 52.3
Source:�UNDP�Development�Report�2007/08.�
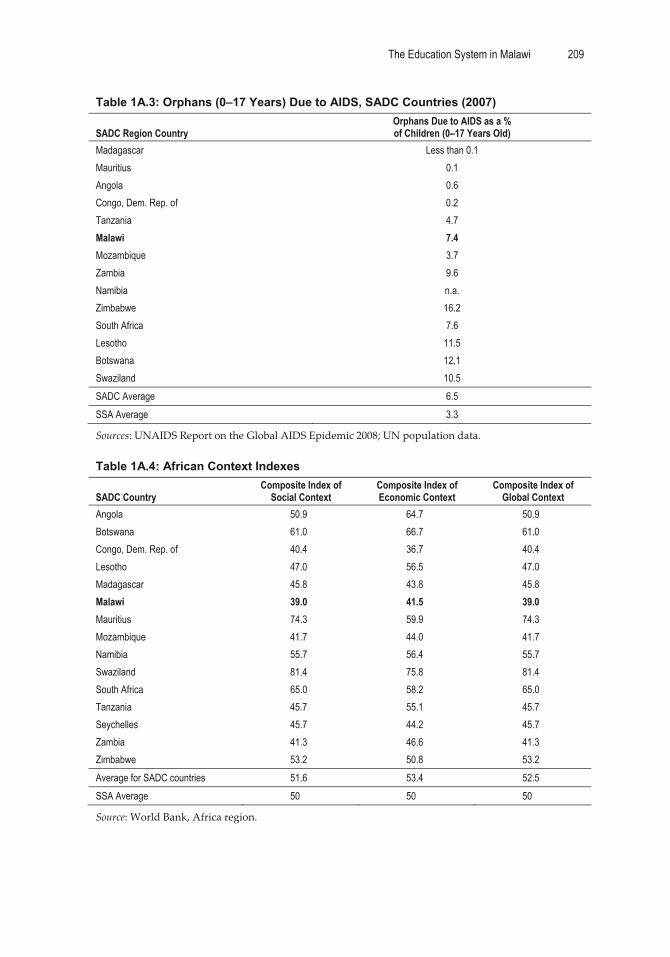
The Education System in Malawi 209
�
Table 1A.3: Orphans (0–17 Years) Due to AIDS, SADC Countries (2007)
SADC Region Country Orphans Due to AIDS as a % of Children (0–17 Years Old)
Madagascar Less than 0.1 Mauritius 0.1 Angola 0.6 Congo, Dem. Rep. of 0.2 Tanzania 4.7 Malawi 7.4 Mozambique 3.7 Zambia 9.6 Namibia n.a. Zimbabwe 16.2 South Africa 7.6 Lesotho 11.5 Botswana 12.1 Swaziland 10.5 SADC Average 6.5 SSA Average 3.3
Sources:�UNAIDS�Report�on�the�Global�AIDS�Epidemic�2008;�UN�population�data.��Table 1A.4: African Context Indexes
SADC Country Composite Index of
Social Context Composite Index of Economic Context
Composite Index of Global Context
Angola 50.9 64.7 50.9 Botswana 61.0 66.7 61.0 Congo, Dem. Rep. of 40.4 36.7 40.4 Lesotho 47.0 56.5 47.0 Madagascar 45.8 43.8 45.8 Malawi 39.0 41.5 39.0 Mauritius 74.3 59.9 74.3 Mozambique 41.7 44.0 41.7 Namibia 55.7 56.4 55.7 Swaziland 81.4 75.8 81.4 South Africa 65.0 58.2 65.0 Tanzania 45.7 55.1 45.7 Seychelles 45.7 44.2 45.7 Zambia 41.3 46.6 41.3 Zimbabwe 53.2 50.8 53.2 Average for SADC countries 51.6 53.4 52.5 SSA Average 50 50 50
Source:�World�Bank,�Africa�region.��
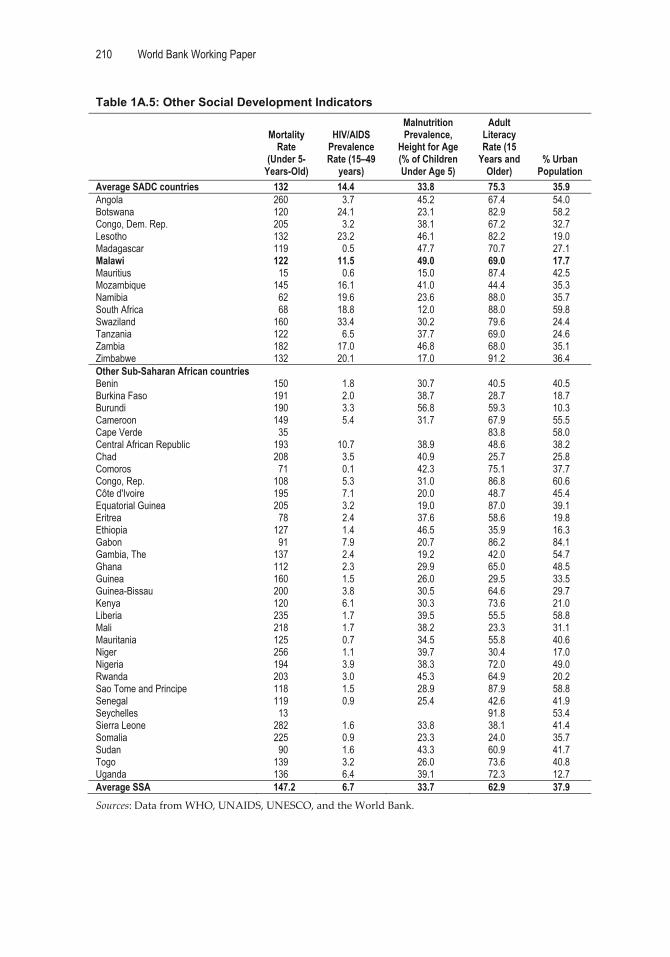
210 World Bank Working Paper
�
Table 1A.5: Other Social Development Indicators
Mortality Rate
(Under 5-Years-Old)
HIV/AIDS Prevalence Rate (15–49
years)
Malnutrition Prevalence,
Height for Age (% of Children Under Age 5)
Adult Literacy Rate (15
Years and Older)
% Urban Population
Average SADC countries 132 14.4 33.8 75.3 35.9 Angola 260 3.7 45.2 67.4 54.0 Botswana 120 24.1 23.1 82.9 58.2 Congo, Dem. Rep. 205 3.2 38.1 67.2 32.7 Lesotho 132 23.2 46.1 82.2 19.0 Madagascar 119 0.5 47.7 70.7 27.1 Malawi 122 11.5 49.0 69.0 17.7 Mauritius 15 0.6 15.0 87.4 42.5 Mozambique 145 16.1 41.0 44.4 35.3 Namibia 62 19.6 23.6 88.0 35.7 South Africa 68 18.8 12.0 88.0 59.8 Swaziland 160 33.4 30.2 79.6 24.4 Tanzania 122 6.5 37.7 69.0 24.6 Zambia 182 17.0 46.8 68.0 35.1 Zimbabwe 132 20.1 17.0 91.2 36.4 Other Sub-Saharan African countries Benin 150 1.8 30.7 40.5 40.5 Burkina Faso 191 2.0 38.7 28.7 18.7 Burundi 190 3.3 56.8 59.3 10.3 Cameroon 149 5.4 31.7 67.9 55.5 Cape Verde 35 83.8 58.0 Central African Republic 193 10.7 38.9 48.6 38.2 Chad 208 3.5 40.9 25.7 25.8 Comoros 71 0.1 42.3 75.1 37.7 Congo, Rep. 108 5.3 31.0 86.8 60.6 Côte d'Ivoire 195 7.1 20.0 48.7 45.4 Equatorial Guinea 205 3.2 19.0 87.0 39.1 Eritrea 78 2.4 37.6 58.6 19.8 Ethiopia 127 1.4 46.5 35.9 16.3 Gabon 91 7.9 20.7 86.2 84.1 Gambia, The 137 2.4 19.2 42.0 54.7 Ghana 112 2.3 29.9 65.0 48.5 Guinea 160 1.5 26.0 29.5 33.5 Guinea-Bissau 200 3.8 30.5 64.6 29.7 Kenya 120 6.1 30.3 73.6 21.0 Liberia 235 1.7 39.5 55.5 58.8 Mali 218 1.7 38.2 23.3 31.1 Mauritania 125 0.7 34.5 55.8 40.6 Niger 256 1.1 39.7 30.4 17.0 Nigeria 194 3.9 38.3 72.0 49.0 Rwanda 203 3.0 45.3 64.9 20.2 Sao Tome and Principe 118 1.5 28.9 87.9 58.8 Senegal 119 0.9 25.4 42.6 41.9 Seychelles 13 91.8 53.4 Sierra Leone 282 1.6 33.8 38.1 41.4 Somalia 225 0.9 23.3 24.0 35.7 Sudan 90 1.6 43.3 60.9 41.7 Togo 139 3.2 26.0 73.6 40.8 Uganda 136 6.4 39.1 72.3 12.7 Average SSA 147.2 6.7 33.7 62.9 37.9 Sources:�Data�from�WHO,�UNAIDS,�UNESCO,�and�the�World�Bank.�
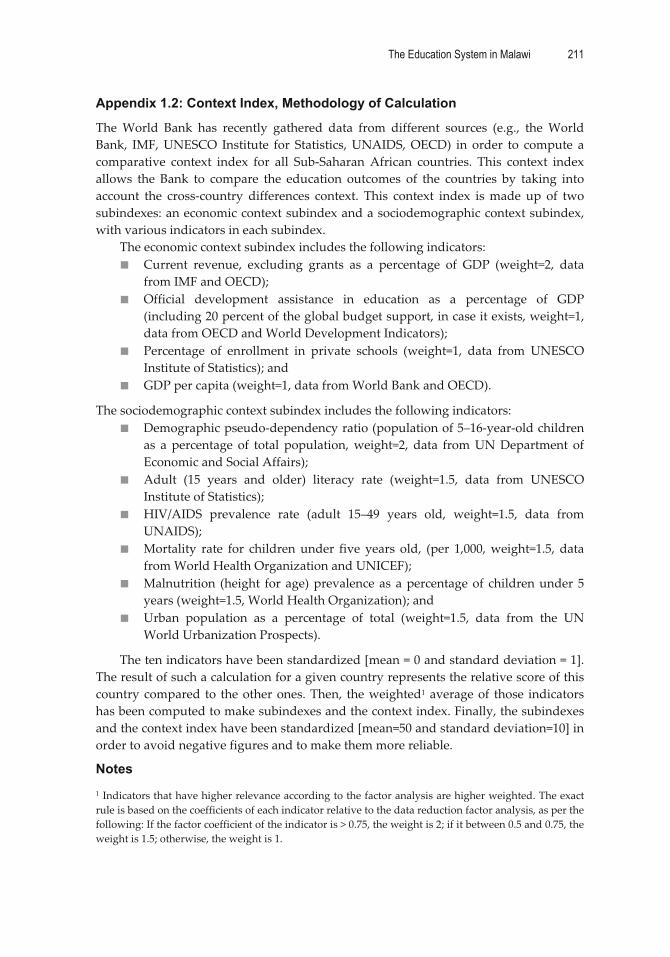
The Education System in Malawi 211
�
Appendix 1.2: Context Index, Methodology of Calculation
The�World� Bank� has� recently� gathered� data� from� different� sources� (e.g.,� the�World�Bank,� IMF,�UNESCO� Institute� for� Statistics,�UNAIDS,�OECD)� in� order� to� compute� a�comparative� context� index� for� all� Sub�Saharan�African� countries.� This� context� index�allows� the� Bank� to� compare� the� education� outcomes� of� the� countries� by� taking� into�account� the� cross�country� differences� context.� This� context� index� is�made� up� of� two�subindexes:�an�economic�context�subindex�and�a�sociodemographic�context�subindex,�with�various�indicators�in�each�subindex.��
The�economic�context�subindex�includes�the�following�indicators:��� Current� revenue,� excluding� grants� as� a� percentage� of� GDP� (weight=2,� data�
from�IMF�and�OECD);�� Official� development� assistance� in� education� as� a� percentage� of� GDP�
(including�20�percent�of�the�global�budget�support,�in�case�it�exists,�weight=1,�data�from�OECD�and�World�Development�Indicators);�
� Percentage� of� enrollment� in� private� schools� (weight=1,� data� from� UNESCO�Institute�of�Statistics);�and�
� GDP�per�capita�(weight=1,�data�from�World�Bank�and�OECD).�
The�sociodemographic�context�subindex�includes�the�following�indicators:��� Demographic�pseudo�dependency�ratio�(population�of�5–16�year�old�children�
as� a� percentage� of� total� population,�weight=2,� data� from�UN�Department� of�Economic�and�Social�Affairs);�
� Adult� (15� years� and� older)� literacy� rate� (weight=1.5,� data� from� UNESCO�Institute�of�Statistics);�
� HIV/AIDS� prevalence� rate� (adult� 15–49� years� old,� weight=1.5,� data� from�UNAIDS);�
� Mortality� rate� for� children� under� five� years� old,� (per� 1,000,�weight=1.5,� data�from�World�Health�Organization�and�UNICEF);�
� Malnutrition� (height� for�age)�prevalence�as�a�percentage�of� children�under�5�years�(weight=1.5,�World�Health�Organization);�and�
� Urban� population� as� a� percentage� of� total� (weight=1.5,� data� from� the� UN�World�Urbanization�Prospects).�
The�ten�indicators�have�been�standardized�[mean�=�0�and�standard�deviation�=�1].�The�result�of�such�a�calculation�for�a�given�country�represents�the�relative�score�of�this�country�compared� to� the�other�ones.�Then,� the�weighted1�average�of� those� indicators�has�been�computed�to�make�subindexes�and�the�context�index.�Finally,�the�subindexes�and�the�context�index�have�been�standardized�[mean=50�and�standard�deviation=10]�in�order�to�avoid�negative�figures�and�to�make�them�more�reliable.�
Notes �1�Indicators�that�have�higher�relevance�according�to�the�factor�analysis�are�higher�weighted.�The�exact�rule�is�based�on�the�coefficients�of�each�indicator�relative�to�the�data�reduction�factor�analysis,�as�per�the�following:�If�the�factor�coefficient�of�the�indicator�is�>�0.75,�the�weight�is�2;�if�it�between�0.5�and�0.75,�the�weight�is�1.5;�otherwise,�the�weight�is�1.�
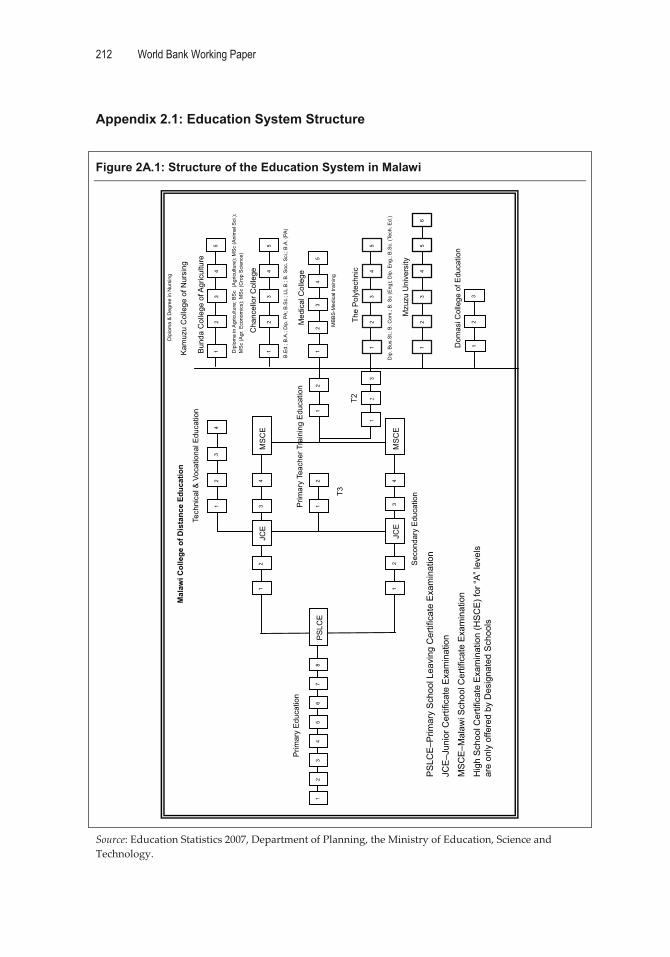
212 World Bank Working Paper
�
Appendix 2.1: Education System Structure
�
Figure 2A.1: Structure of the Education System in Malawi K
amuz
u C
olle
ge o
f Nur
sing
Dip
lom
a &
Deg
ree
in N
ursi
ng
Bun
da C
olle
ge o
f Agr
icul
ture
Cha
ncel
lor C
olle
ge
Med
ical
Col
lege
The
Pol
ytec
hnic
Sec
onda
ry E
duca
tion
T2
T3
Prim
ary
Teac
her T
rain
ing
Edu
catio
n
Tech
nica
l & V
ocat
iona
l Edu
catio
n
Prim
ary
Edu
catio
n
65
42
1
55
43
2
43
24
32
1
21
21
MS
CE
MS
CE
43
JCE
21
43
JCE
21
76
54
32
1
Mal
awi C
olle
ge o
f Dis
tanc
e Ed
ucat
ion
1 Dip
lom
a in
Agr
icul
ture
; BS
c (A
gric
ultu
re);
MS
c (A
nim
al S
ci.);
MS
c (A
gr. E
cono
mic
s); M
Sc
(Cro
p S
cien
ce)
8
B.E
d.; B
.A.;
Dip
. PA
; B.S
c.; L
L.B
.; B
. Soc
. Sci
.; B
.A. (
PA)
54
32
1
MB
BS
-Med
ical
trai
ning
13
2
Dip
. Bus
.St.;
B. C
om.;
B. S
c (E
ng);
Dip
. Eng
.; B
.Sc.
(Tec
h. E
d.)
PS
LCE
–Prim
ary
Sch
ool L
eavi
ng C
ertif
icat
e E
xam
inat
ion
JCE
–Jun
ior C
ertif
icat
e E
xam
inat
ion
MS
CE
–Mal
awi S
choo
l Cer
tific
ate
Exa
min
atio
n
Hig
h S
choo
l Cer
tific
ate
Exa
min
atio
n (H
SC
E) f
or “A
” lev
els
are
only
offe
red
by D
esig
nate
d S
choo
ls
Mzu
zu U
nive
rsity
Dom
asi C
olle
ge o
f Edu
catio
n
32
1
PS
LCE
1
54
32
1
3
�
Source:�Education�Statistics�2007,�Department�of�Planning,�the�Ministry�of�Education,�Science�and�Technology.��
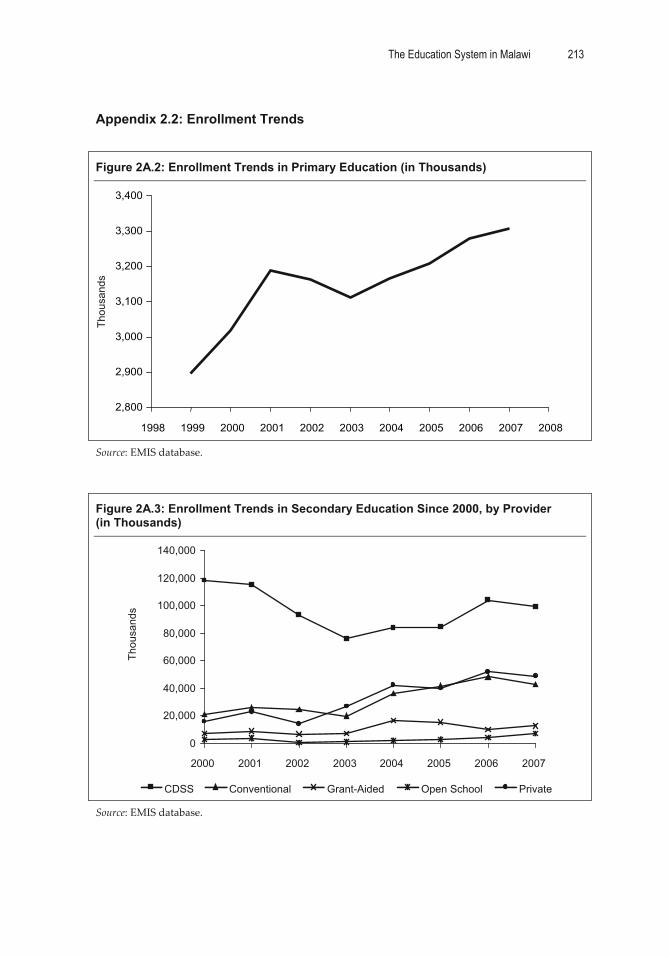
The Education System in Malawi 213
�
Appendix 2.2: Enrollment Trends
�
Figure 2A.2: Enrollment Trends in Primary Education (in Thousands)
2,800
2,900
3,000
3,100
3,200
3,300
3,400
1998 1999 2000 2001 2002 2003 2004 2005 2006 2007 2008
Thou
sand
s
�Source:�EMIS�database.���
Figure 2A.3: Enrollment Trends in Secondary Education Since 2000, by Provider (in Thousands)
0
20,000
40,000
60,000
80,000
100,000
120,000
140,000
2000 2001 2002 2003 2004 2005 2006 2007
CDSS Conventional Grant-Aided Open School Private
Thou
sand
s
�Source:�EMIS�database.�
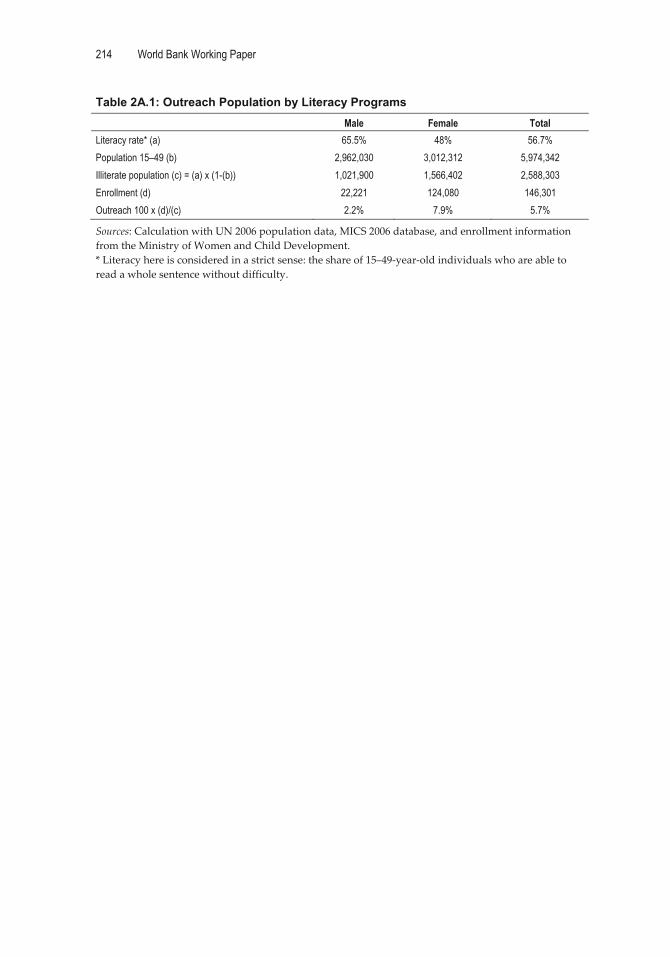
214 World Bank Working Paper
�
Table 2A.1: Outreach Population by Literacy Programs Male Female Total
Literacy rate* (a) 65.5% 48% 56.7% Population 15–49 (b) 2,962,030 3,012,312 5,974,342 Illiterate population (c) = (a) x (1-(b)) 1,021,900 1,566,402 2,588,303 Enrollment (d) 22,221 124,080 146,301 Outreach 100 x (d)/(c) 2.2% 7.9% 5.7%
Sources:�Calculation�with�UN�2006�population�data,�MICS�2006�database,�and�enrollment�information�from�the�Ministry�of�Women�and�Child�Development.�*�Literacy�here�is�considered�in�a�strict�sense:�the�share�of�15–49�year�old�individuals�who�are�able�to�read�a�whole�sentence�without�difficulty.��

The Education System in Malawi 215
�
Appendix 2.3: Population Estimates for the Malawi CSR
Population�estimates�are�a�key�issue�in�education�planning�as�they�are�important�in�the�calculations� of� almost� all� the� education� coverage� indicators.� These� estimates� are� a�major� concern� in� Malawi� as� in� cross�country� analysis� it� has� the� highest� and� most�unbelievable�education�indicators�when�computed�with�national�population�estimates.�For�example,�when�taking�new�entrants�in�Standard�1�from�EMIS�2000�data�and�NSO’s�six�year�populations�estimate,�the�result� is�a�217�percent�gross� intake�rate�(number�of�new� entrants� in� Standard� 1� divided� by� the� population� of� children� age� six).� This� is�clearly�unrealistic:� It�would�mean� that� in�2000� the�number�of�new�enrolled�pupils� in�Standard�1�was� twice�as�much�as� the�population�of� the�official�age� to�attend�the�first�standard� of� primary� education.� The� consequence� at� the� national� level� is� that� some�indicators�are�not�computed�on�a�yearly�basis�anymore�as�they�should�be,�with�some�education� planning� staff� admitting� that� the� population� basis� does� not� allow� such� a�calculation.� In� the� context� of� the�CSR,� this� issue� could� not� be� avoided� and� the� team�asked�the�National�Statistical�Office�to�provide�the�population�data�and�projections�in�order� to� try� to� find,� on� the� demographic� side,� an� explanation� of� the� overestimated�education� indicators.� The� CSR� team� also� worked� on� both� MICS� Data� and� United�Nations�population�estimates.�
1. Population Projections from the National Statistical Office (NSO)
The�NSO�provided�the�national�projections�(issued�from�the�1998�census)�by�single�age,�gender,� and� districts.� These� data� needed� some� strong� preliminary� technical�work� in�order� to� analyze� them� with� a� more� suitable� format.� First,� the� sum� of� the� total�population� of� all� 31� districts� gave� estimates� for� Malawi� at� the� global� level� and� per�single� age.� The� global� population� estimates� were� consistent� with� the� global� official�information�from�NSO—an�estimated�10.2�million�people� in�1999�that�would�grow�to�22� million� inhabitants� in� 2023.� The� estimate� for� 2007� is� 12.8� million.� Staying� at� this�global� level� does� not� allow� for� the� estimation� of� any� difficulties� in� the� population�projection�trends�(figure�2A.4).��
Figure 2A.4: Projections of the Malawian Population, Based on the 1998 National Census (1999–2023)
0
5,000,000
10,000,000
15,000,000
20,000,000
25,000,000
1995 2000 2005 2010 2015 2020 2025
Pop
ulat
ion
�
Source:�NSO�population�projection�from�1998�census.�

216 World Bank Working Paper
�
The� major� problem� appears� when� the� analysis� goes� through� the� evolution� by�single�age.�According� to� the�NSO,� the� trends� that� should�be�observed�on�each�single�age�group�would�be�as�shown�in�figure�2A.5.���
Figure 2A.5: Projections of Single-Age Population
0
100,000
200,000
300,000
400,000
500,000
600,000
700,000
800,000
0 1 2 3 4 5 6 7 8 9 10 11 12 13 14 15 16 17 18 19 20 21 22 23 24 25Age
Num
ber o
f Ind
ivid
uals
1998 1999
2000 2006
2007 2015
NSO Projections
�
Source:�NSO�population�estimates.��
If�the�data�structure�from�the�1998�census�is�correct,�the�projections�have�suffered�an� initial� “shock”� that� is� projected� from� 1999� to� 2023:� Between� 1998� and� 1999,� an�exceptional�36�percent�growth�rate�for�the�population�under�age�one�can�be�seen,�but�this�is�not�the�case�for�the�other�single�age�group,�for�which�the�observed�growth�rate�stays�under�10�percent.�The�phenomenon�repeats�itself�from�one�year�to�another.�The�same�36�percent�rate�is�encountered�between�1999�and�2000�for�population�of�age�one,�and�then�between�2000�and�2001�for�the�population�of�age�two�while�the�others�rates�stay�realistic.�
The�consequence�is�a�distorted�age�structure.�For�example,�in�2007�and�according�to�these�projections,�the�expected�number�of�eight�year�olds�should�have�been�429,573,�and� there�would�be�314,773�nine�year�olds,� etc.� If�only� the� school�age�population� for�primary� and� secondary� education� is� considered� (see� table� 2A.2),� the� share� of� eight�year�olds�for�2007�would�be�around�11�percent,�while�it�would�fall�to�under�8�percent�for�those�who�are�nine�years�old�and�above.�In�2006,�the�share�of�eight�year�olds�would�then�have�been�8.3�percent.��
Such�an�evolution�(the�amount�of�eight�year�olds�growing�from�8.3�to�10.8�percent�from�one�year�to�another)�is�too�fragile�to�be�taken�into�consideration�for�the�calculation�of�education�indicators.���
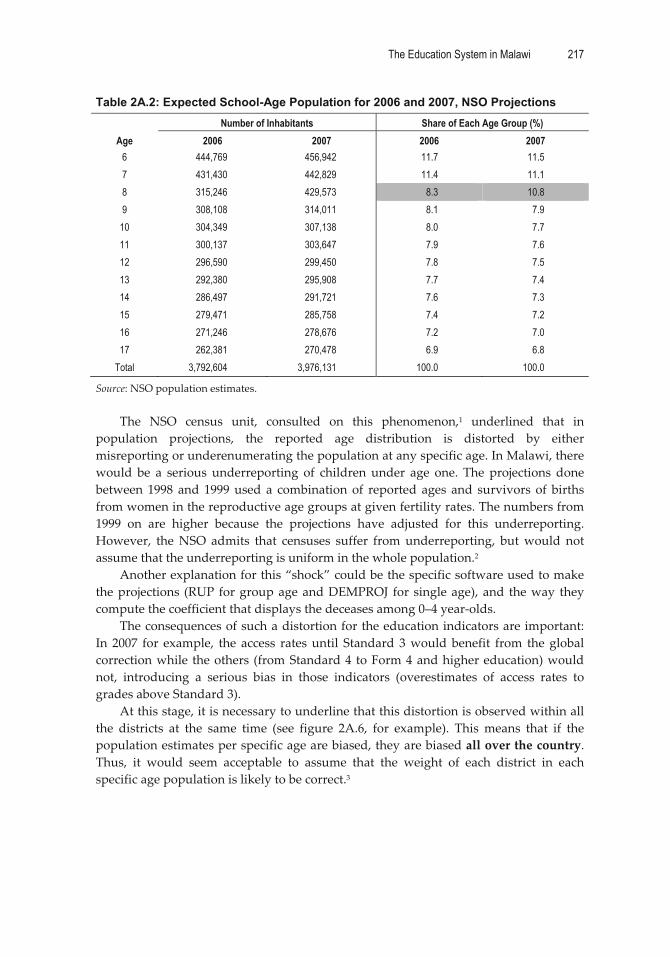
The Education System in Malawi 217
�
Table 2A.2: Expected School-Age Population for 2006 and 2007, NSO Projections
Age Number of Inhabitants Share of Each Age Group (%)
2006 2007 2006 2007 6 444,769 456,942 11.7 11.5 7 431,430 442,829 11.4 11.1 8 315,246 429,573 8.3 10.8 9 308,108 314,011 8.1 7.9
10 304,349 307,138 8.0 7.7 11 300,137 303,647 7.9 7.6 12 296,590 299,450 7.8 7.5 13 292,380 295,908 7.7 7.4 14 286,497 291,721 7.6 7.3 15 279,471 285,758 7.4 7.2 16 271,246 278,676 7.2 7.0 17 262,381 270,478 6.9 6.8
Total 3,792,604 3,976,131 100.0 100.0
Source:�NSO�population�estimates.��
The� NSO� census� unit,� consulted� on� this� phenomenon,1� underlined� that� in�population� projections,� the� reported� age� distribution� is� distorted� by� either�misreporting�or�underenumerating�the�population�at�any�specific�age.�In�Malawi,�there�would� be� a� serious� underreporting� of� children� under� age� one.� The� projections� done�between� 1998� and� 1999�used� a� combination�of� reported� ages� and� survivors�of� births�from�women�in�the�reproductive�age�groups�at�given�fertility�rates.�The�numbers�from�1999� on� are� higher� because� the� projections have� adjusted� for� this� underreporting.�However,� the�NSO� admits� that� censuses� suffer� from�underreporting,� but�would� not�assume�that�the�underreporting�is�uniform�in�the�whole�population.2��
Another�explanation�for�this�“shock”�could�be�the�specific�software�used�to�make�the�projections� (RUP� for�group�age�and�DEMPROJ� for� single�age),�and� the�way� they�compute�the�coefficient�that�displays�the�deceases�among�0–4�year�olds.��
The�consequences�of�such�a�distortion�for�the�education�indicators�are�important:�In� 2007� for� example,� the� access� rates�until� Standard� 3�would�benefit� from� the�global�correction�while� the�others� (from�Standard�4� to�Form�4�and�higher�education)�would�not,� introducing� a� serious� bias� in� those� indicators� (overestimates� of� access� rates� to�grades�above�Standard�3).��
At�this�stage,�it�is�necessary�to�underline�that�this�distortion�is�observed�within�all�the� districts� at� the� same� time� (see� figure� 2A.6,� for� example).� This� means� that� if� the�population�estimates�per�specific�age�are�biased,�they�are�biased�all�over�the�country.�Thus,� it� would� seem� acceptable� to� assume� that� the� weight� of� each� district� in� each�specific�age�population�is�likely�to�be�correct.3���
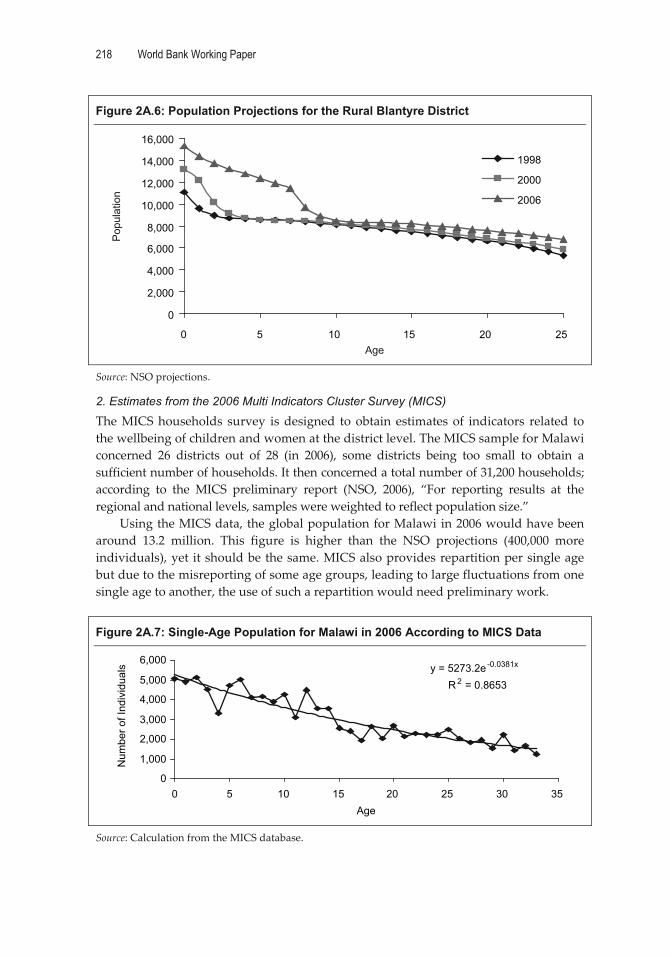
218 World Bank Working Paper
�
Figure 2A.6: Population Projections for the Rural Blantyre District
0
2,000
4,000
6,000
8,000
10,000
12,000
14,000
16,000
0 5 10 15 20 25
1998
2000
2006
Popu
latio
n
Age �
Source:�NSO�projections.��
2. Estimates from the 2006 Multi Indicators Cluster Survey (MICS)
The�MICS�households� survey� is�designed� to�obtain� estimates�of� indicators� related� to�the�wellbeing�of�children�and�women�at�the�district�level.�The�MICS�sample�for�Malawi�concerned� 26� districts� out� of� 28� (in� 2006),� some� districts� being� too� small� to� obtain� a�sufficient�number�of�households.�It�then�concerned�a�total�number�of�31,200�households;�according� to� the� MICS� preliminary� report� (NSO,� 2006),� “For� reporting� results� at� the�regional�and�national�levels,�samples�were�weighted�to�reflect�population�size.”��
Using�the�MICS�data,�the�global�population�for�Malawi�in�2006�would�have�been�around� 13.2� million.� This� figure� is� higher� than� the� NSO� projections� (400,000� more�individuals),�yet� it�should�be�the�same.�MICS�also�provides�repartition�per�single�age�but�due�to�the�misreporting�of�some�age�groups,�leading�to�large�fluctuations�from�one�single�age�to�another,�the�use�of�such�a�repartition�would�need�preliminary�work.���
Figure 2A.7: Single-Age Population for Malawi in 2006 According to MICS Data
y = 5273.2e-0.0381x
R 2 = 0.8653
0
1,000
2,000
3,000
4,000
5,000
6,000
0 5 10 15 20 25 30 35Age
Num
ber o
f Ind
ivid
uals
�
Source:�Calculation�from�the�MICS�database.��
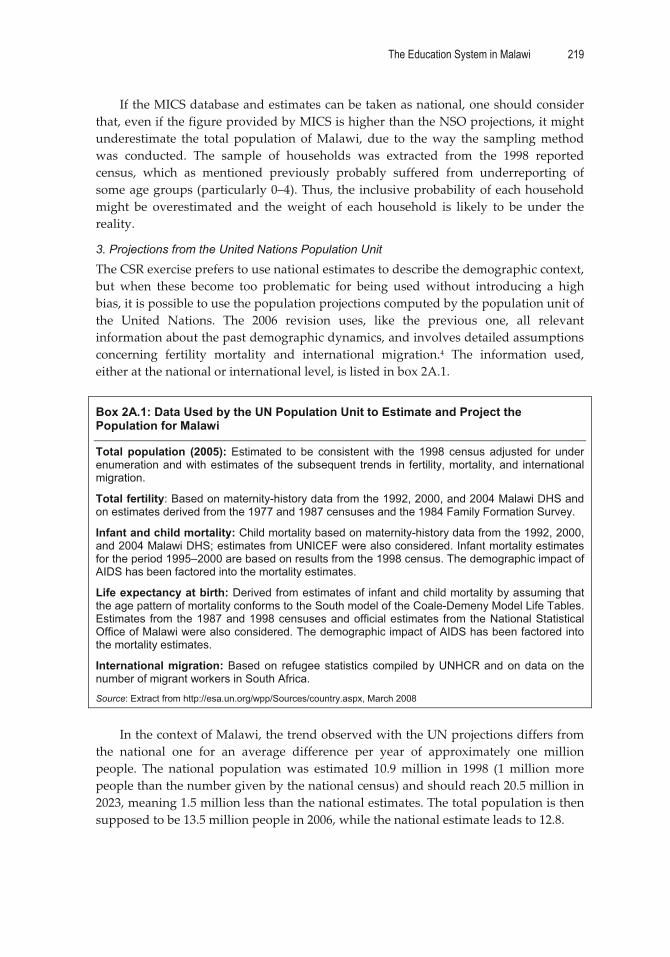
The Education System in Malawi 219
�
If�the�MICS�database�and�estimates�can�be�taken�as�national,�one�should�consider�that,�even�if�the�figure�provided�by�MICS�is�higher�than�the�NSO�projections,�it�might�underestimate� the� total� population� of�Malawi,� due� to� the�way� the� sampling�method�was� conducted.� The� sample� of� households� was� extracted� from� the� 1998� reported�census,� which� as� mentioned� previously� probably� suffered� from� underreporting� of�some�age�groups�(particularly�0–4).�Thus,�the�inclusive�probability�of�each�household�might� be� overestimated� and� the�weight� of� each� household� is� likely� to� be� under� the�reality.�
3. Projections from the United Nations Population Unit
The�CSR�exercise�prefers�to�use�national�estimates�to�describe�the�demographic�context,�but� when� these� become� too� problematic� for� being� used� without� introducing� a� high�bias,�it�is�possible�to�use�the�population�projections�computed�by�the�population�unit�of�the� United� Nations.� The� 2006� revision� uses,� like� the� previous� one,� all� relevant�information�about�the�past�demographic�dynamics,�and�involves�detailed�assumptions�concerning� fertility� mortality� and� international� migration.4� The� information� used,�either�at�the�national�or�international�level,�is�listed�in�box�2A.1.���
Box 2A.1: Data Used by the UN Population Unit to Estimate and Project the Population for Malawi
Total population (2005): Estimated to be consistent with the 1998 census adjusted for under enumeration and with estimates of the subsequent trends in fertility, mortality, and international migration.
Total fertility: Based on maternity-history data from the 1992, 2000, and 2004 Malawi DHS and on estimates derived from the 1977 and 1987 censuses and the 1984 Family Formation Survey.
Infant and child mortality: Child mortality based on maternity-history data from the 1992, 2000, and 2004 Malawi DHS; estimates from UNICEF were also considered. Infant mortality estimates for the period 1995–2000 are based on results from the 1998 census. The demographic impact of AIDS has been factored into the mortality estimates.
Life expectancy at birth: Derived from estimates of infant and child mortality by assuming that the age pattern of mortality conforms to the South model of the Coale-Demeny Model Life Tables. Estimates from the 1987 and 1998 censuses and official estimates from the National Statistical Office of Malawi were also considered. The demographic impact of AIDS has been factored into the mortality estimates.
International migration: Based on refugee statistics compiled by UNHCR and on data on the number of migrant workers in South Africa.
Source: Extract from http://esa.un.org/wpp/Sources/country.aspx, March 2008
�In�the�context�of�Malawi,�the�trend�observed�with�the�UN�projections�differs�from�
the� national� one� for� an� average� difference� per� year� of� approximately� one� million�people.� The� national� population�was� estimated� 10.9�million� in� 1998� (1�million�more�people�than�the�number�given�by�the�national�census)�and�should�reach�20.5�million�in�2023,�meaning�1.5�million�less�than�the�national�estimates.�The�total�population�is�then�supposed�to�be�13.5�million�people�in�2006,�while�the�national�estimate�leads�to�12.8.����
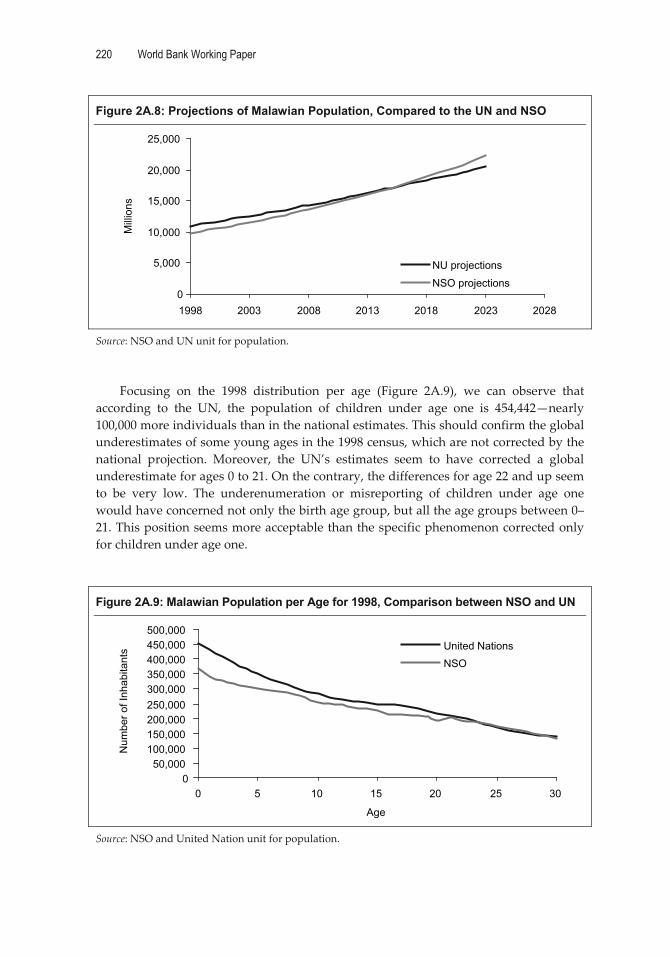
220 World Bank Working Paper
�
Figure 2A.8: Projections of Malawian Population, Compared to the UN and NSO
0
5,000
10,000
15,000
20,000
25,000
1998 2003 2008 2013 2018 2023 2028
Mill
ions
NU projections
NSO projections
�
Source:�NSO�and�UN�unit�for�population.���
Focusing� on� the� 1998� distribution� per� age� (Figure� 2A.9),� we� can� observe� that�according� to� the� UN,� the� population� of� children� under� age� one� is� 454,442—nearly�100,000�more�individuals�than�in�the�national�estimates.�This�should�confirm�the�global�underestimates�of�some�young�ages�in�the�1998�census,�which�are�not�corrected�by�the�national� projection.� Moreover,� the� UN’s� estimates� seem� to� have� corrected� a� global�underestimate�for�ages�0�to�21.�On�the�contrary,�the�differences�for�age�22�and�up�seem�to� be� very� low.� The� underenumeration� or� misreporting� of� children� under� age� one�would�have�concerned�not�only�the�birth�age�group,�but�all�the�age�groups�between�0–21.�This�position�seems�more�acceptable�than�the�specific�phenomenon�corrected�only�for�children�under�age�one.���
Figure 2A.9: Malawian Population per Age for 1998, Comparison between NSO and UN
050,000
100,000 150,000 200,000 250,000 300,000 350,000 400,000 450,000 500,000
0 5 10 15 20 25 30
Age
Num
ber o
f Inh
abita
nts United Nations
NSO
�
Source:�NSO�and�United�Nation�unit�for�population.��
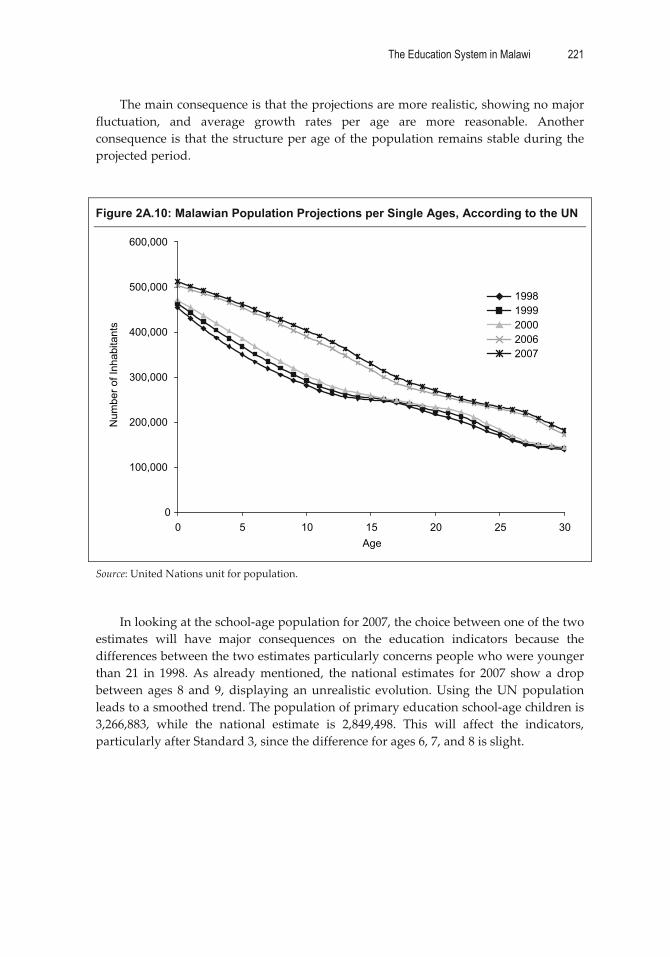
The Education System in Malawi 221
�
The�main�consequence�is�that�the�projections�are�more�realistic,�showing�no�major�fluctuation,� and� average� growth� rates� per� age� are� more� reasonable.� Another�consequence�is� that� the�structure�per�age�of� the�population�remains�stable�during�the�projected�period.���
Figure 2A.10: Malawian Population Projections per Single Ages, According to the UN
0
100,000
200,000
300,000
400,000
500,000
600,000
0 5 10 15 20 25 30Age
Num
ber o
f Inh
abita
nts
19981999200020062007
�
Source:�United�Nations�unit�for�population.���
In�looking�at�the�school�age�population�for�2007,�the�choice�between�one�of�the�two�estimates� will� have� major� consequences� on� the� education� indicators� because� the�differences�between�the�two�estimates�particularly�concerns�people�who�were�younger�than� 21� in� 1998.�As� already�mentioned,� the� national� estimates� for� 2007� show� a� drop�between� ages� 8� and� 9,�displaying� an�unrealistic� evolution.�Using� the�UN�population�leads�to�a�smoothed�trend.�The�population�of�primary�education�school�age�children�is�3,266,883,� while� the� national� estimate� is� 2,849,498.� This� will� affect� the� indicators,�particularly�after�Standard�3,�since�the�difference�for�ages�6,�7,�and�8�is�slight.���
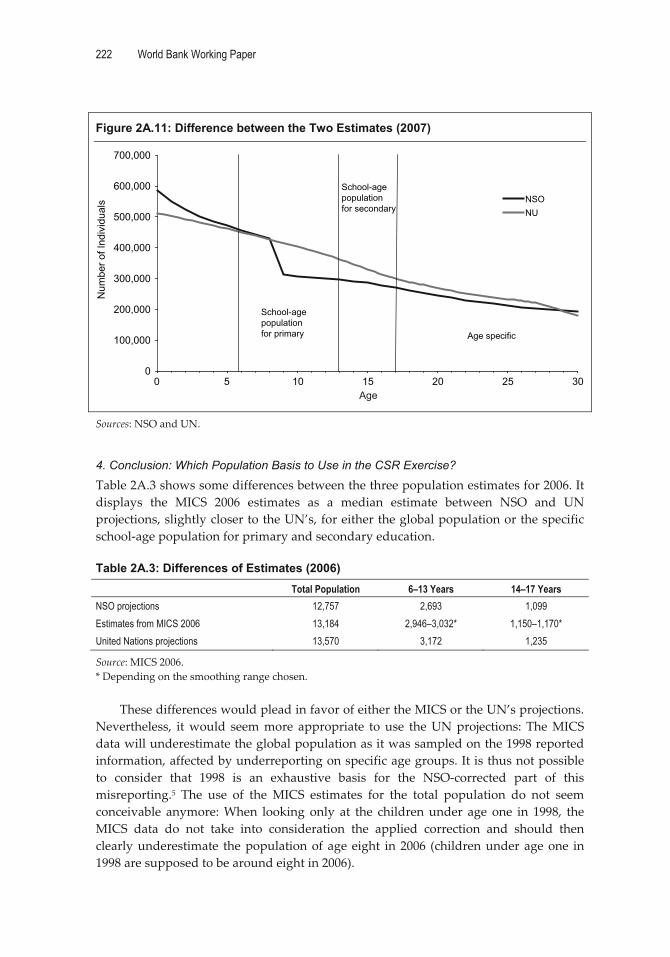
222 World Bank Working Paper
�
�
Figure 2A.11: Difference between the Two Estimates (2007)
0
100,000
200,000
300,000
400,000
500,000
600,000
700,000
0 5 10 15 20 25 30
Age specific
Num
ber o
f Ind
ivid
uals NSO
NU
School-age population for primary
School-age population for secondary
Age �
Sources:�NSO�and�UN.��
4. Conclusion: Which Population Basis to Use in the CSR Exercise?
Table�2A.3�shows�some�differences�between�the�three�population�estimates�for�2006.�It�displays� the� MICS� 2006� estimates� as� a� median� estimate� between� NSO� and� UN�projections,�slightly�closer�to�the�UN’s,�for�either�the�global�population�or�the�specific�school�age�population�for�primary�and�secondary�education.���Table 2A.3: Differences of Estimates (2006)
Total Population 6–13 Years 14–17 Years NSO projections 12,757 2,693 1,099 Estimates from MICS 2006 13,184 2,946–3,032* 1,150–1,170* United Nations projections 13,570 3,172 1,235
Source:�MICS�2006.�*�Depending�on�the�smoothing�range�chosen.��
These�differences�would�plead�in�favor�of�either�the�MICS�or�the�UN’s�projections.�Nevertheless,� it�would� seem�more� appropriate� to� use� the�UN�projections:� The�MICS�data�will�underestimate�the�global�population�as�it�was�sampled�on�the�1998�reported�information,�affected�by�underreporting�on�specific�age�groups.�It�is�thus�not�possible�to� consider� that� 1998� is� an� exhaustive� basis� for� the� NSO�corrected� part� of� this�misreporting.5� The� use� of� the� MICS� estimates� for� the� total� population� do� not� seem�conceivable� anymore:�When� looking� only� at� the� children�under� age� one� in� 1998,� the�MICS� data� do� not� take� into� consideration� the� applied� correction� and� should� then�clearly�underestimate� the�population�of�age�eight� in�2006� (children�under�age�one� in�1998�are�supposed�to�be�around�eight�in�2006).��
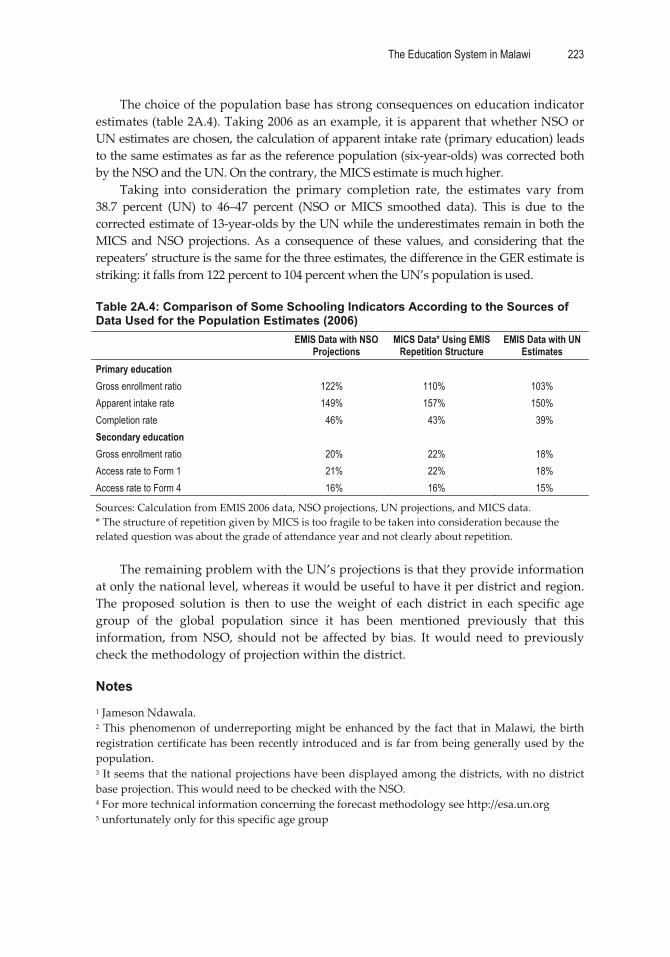
The Education System in Malawi 223
�
The�choice�of�the�population�base�has�strong�consequences�on�education�indicator�estimates�(table�2A.4).�Taking�2006�as�an�example,�it�is�apparent�that�whether�NSO�or�UN�estimates�are�chosen,�the�calculation�of�apparent�intake�rate�(primary�education)�leads�to�the�same�estimates�as�far�as�the�reference�population�(six�year�olds)�was�corrected�both�by�the�NSO�and�the�UN.�On�the�contrary,�the�MICS�estimate�is�much�higher.��
Taking� into� consideration� the� primary� completion� rate,� the� estimates� vary� from�38.7� percent� (UN)� to� 46–47� percent� (NSO� or�MICS� smoothed� data).� This� is� due� to� the�corrected�estimate�of�13�year�olds�by�the�UN�while�the�underestimates�remain�in�both�the�MICS� and�NSO�projections.�As� a� consequence� of� these� values,� and� considering� that� the�repeaters’�structure�is�the�same�for�the�three�estimates,�the�difference�in�the�GER�estimate�is�striking:�it�falls�from�122�percent�to�104�percent�when�the�UN’s�population�is�used.���Table 2A.4: Comparison of Some Schooling Indicators According to the Sources of Data Used for the Population Estimates (2006)
EMIS Data with NSO
Projections MICS Data* Using EMIS
Repetition Structure EMIS Data with UN
Estimates Primary education Gross enrollment ratio 122% 110% 103% Apparent intake rate 149% 157% 150% Completion rate 46% 43% 39% Secondary education Gross enrollment ratio 20% 22% 18% Access rate to Form 1 21% 22% 18% Access rate to Form 4 16% 16% 15%
Sources:�Calculation�from�EMIS�2006�data,�NSO�projections,�UN�projections,�and�MICS�data.�*�The�structure�of�repetition�given�by�MICS�is�too�fragile�to�be�taken�into�consideration�because�the�related�question�was�about�the�grade�of�attendance�year�and�not�clearly�about�repetition.���
The�remaining�problem�with�the�UN’s�projections�is�that�they�provide�information�at�only�the�national�level,�whereas�it�would�be�useful�to�have�it�per�district�and�region.�The� proposed� solution� is� then� to� use� the�weight� of� each�district� in� each� specific� age�group� of� the� global� population� since� it� has� been� mentioned� previously� that� this�information,� from�NSO,� should�not� be� affected� by� bias.� It�would�need� to�previously�check�the�methodology�of�projection�within�the�district.��
Notes �1�Jameson�Ndawala.�2�This�phenomenon�of�underreporting�might�be�enhanced�by� the� fact� that� in�Malawi,� the�birth�registration�certificate�has�been�recently�introduced�and�is�far�from�being�generally�used�by�the�population.��3�It�seems�that�the�national�projections�have�been�displayed�among�the�districts,�with�no�district�base�projection.�This�would�need�to�be�checked�with�the�NSO.�4�For�more�technical�information�concerning�the�forecast�methodology�see�http://esa.un.org��5�unfortunately�only�for�this�specific�age�group�
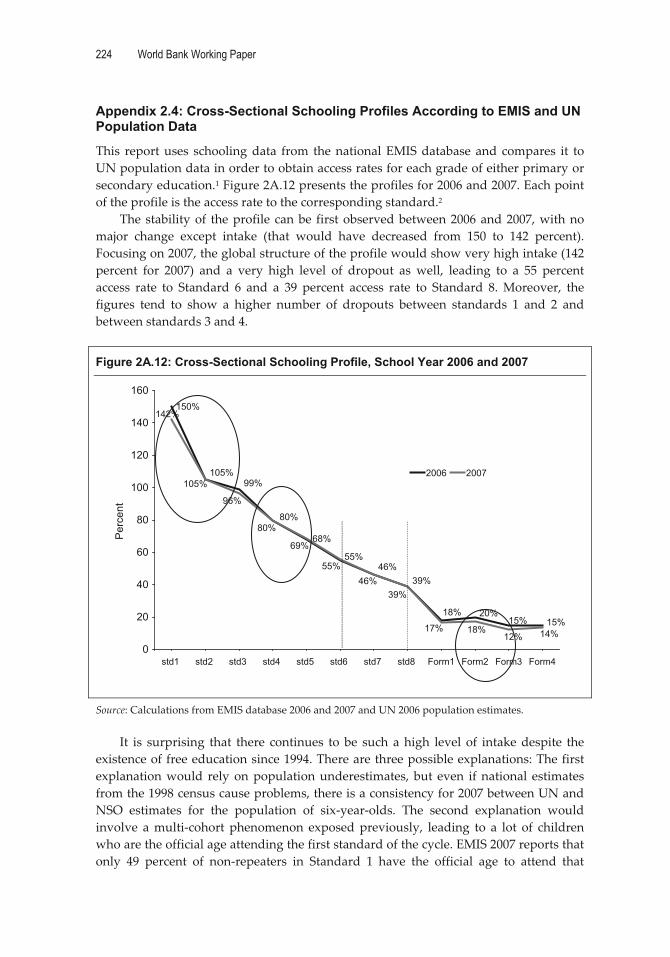
224 World Bank Working Paper
�
Appendix 2.4: Cross-Sectional Schooling Profiles According to EMIS and UN Population Data
This� report�uses� schooling�data� from� the�national�EMIS�database� and� compares� it� to�UN�population�data�in�order�to�obtain�access�rates�for�each�grade�of�either�primary�or�secondary�education.1�Figure�2A.12�presents�the�profiles�for�2006�and�2007.�Each�point�of�the�profile�is�the�access�rate�to�the�corresponding�standard.2�
The�stability�of� the�profile� can�be� first�observed�between�2006�and�2007,�with�no�major� change� except� intake� (that� would� have� decreased� from� 150� to� 142� percent).�Focusing�on�2007,�the�global�structure�of�the�profile�would�show�very�high�intake�(142�percent� for� 2007)� and� a� very� high� level� of� dropout� as� well,� leading� to� a� 55� percent�access� rate� to� Standard� 6� and� a� 39� percent� access� rate� to� Standard� 8.�Moreover,� the�figures� tend� to� show� a� higher� number� of� dropouts� between� standards� 1� and� 2� and�between�standards�3�and�4.���
Figure 2A.12: Cross-Sectional Schooling Profile, School Year 2006 and 2007
150%
39%46%
55%
68%
15%15%18% 20%
80%
99%105%
12%18%17%
39%
55%
80%
96%
105%
142%
14%
69%
46%
0
20
40
60
80
100
120
140
160
std1 std2 std3 std4 std5 std6 std7 std8 Form1 Form2 Form3 Form4
2006 2007
Per
cent
�
Source:�Calculations�from�EMIS�database�2006�and�2007�and�UN�2006�population�estimates.��
It� is� surprising� that� there� continues� to� be� such� a�high� level� of� intake�despite� the�existence�of�free�education�since�1994.�There�are�three�possible�explanations:�The�first�explanation�would� rely�on�population�underestimates,� but� even� if�national� estimates�from�the�1998�census�cause�problems,�there�is�a�consistency�for�2007�between�UN�and�NSO� estimates� for� the� population� of� six�year�olds.� The� second� explanation� would�involve� a�multi�cohort� phenomenon� exposed�previously,� leading� to� a� lot� of� children�who�are�the�official�age�attending�the�first�standard�of�the�cycle.�EMIS�2007�reports�that�only� 49� percent� of� non�repeaters� in� Standard� 1� have� the� official� age� to� attend� that�

The Education System in Malawi 225
�
standard;�2.9�percent�are�under�age�and�47.9�percent�are�over�age�(ranging�from�7�to�12�years�old).�Moreover,�there�are�no�birth�registration�certificates,�so�the�age�of�children�attending� schools� are� mentioned� by� parents,� with� all� the� confusion� this� can� cause�school�heads�when�they�try�to�assess�exact�ages�for�children.��
The�multi�cohort� phenomenon� could� be� thus� explained,� and� is� certainly� part� of�reality—but�is�not�sufficient�in�itself—as�Malawi�primary�education�has�experienced�a�very�high�level�of�intake�(more�than�150�percent)�for�several�years�(table�2A.5).���Table 2A.5: Evolution of Gross Intake Rate (Access Rate to Standard 1) since 2000
2000 2001 2002 2003 2004 2005 2006 2007 180% 181% 170% 158% 158% 150% 150% 142%
Source:�Calculation�from�EMIS�2007�and�UN�population�data.��The�last�explanation�of�this�level�could�rely�on�an�underestimate�of�pupils�that�repeat�the�same�grade�between�two�consecutive�school�years.�The�high�number�of�dropouts�between�Standard�1�and�Standard�2�can�come�from�pupils�attending�part�of�the�school�year�and�dropping�out�before�the�end�of�Standard�1.�There�is�anecdotal�evidence�in�Malawi�that�many�children�who�drop�out�can�come�back�to�school�either�the�same�school�year�or�the�year�after,�and�still�be�considered�as�nonrepeaters.�If�they�cannot�be�considered�as�repeaters�because�there�is�no�official�decision�that�makes�them�repeat,�they�should�not�be�considered�nonrepeaters�as�well.�Being�so�considered�could�artificially�inflate�the�number�of�nonrepeaters�and�consequently�the�level�of�intake.�A�methodology�to�correct�intake,�and�access�rates�to�each�standard,�consists�of�relying�on�an�alternate�repetition�structure�that�would�be�provided�by�other�information�sources�than�EMIS.�This�can�become�possible�with�household�survey�data.��
Notes �1�The�UN�single�age�population�is�used�here�because�the�new�2008�census�did�not�provide�a�single�age�population�for�2007.�2�Each�access�rate�is�computed�by�dividing�the�number�on�non�repeaters�of�the�corresponding�standard�by�the�population�that�is�of�the�official�age�to�attend.��

226 World Bank Working Paper
�
Appendix 2.5: How to Read Educational Pyramids?
The�educational�pyramids�give� a� rough� idea�of� the� school� coverage� for� each� level�of�education�and�the�pupil�flow�from�one�level�to�another.�The�size�of�the�arrows�between�levels� grows� along� with� the� transition� rates.� The� indicators� contained� in� the�educational�pyramids�are�detailed�below:�
Access rate to first grade and access rate to last grade (per level of education)
These�are�calculated�by�relating�the�number�of�non�repeaters�in�the�first�grade�and�in�the�last�grade�of�each�level�of�education�to�the�population�of�children�of�the�official�age�for�each�of�these�grades.�For�example,�for�lower�secondary�education�which�lasts�two�years�with�a�theoretical�entrance�age�of�14�years�old,�we�have:��
Access�rate�in�first�grade�of�lower�secondary�education�= first grade
age 14
Non repeaters
population
Access�rate�in�last�grade�of�lower�secondary�education�= last grade
age15
Non repeaters
population
For�primary�education,�the�access�rate�in�the�first�grade�corresponds�to�what�is�known�as� the�Apparent� Intake� Rate� (AIR).�When� the� rate� is� over� 100� percent� (late� or� early�entrance� for� some� pupils),� it� is� recapped� to� 100� percent� (access� to� first� grade� is�considered�universal)�in�the�pyramid.��
Transition�rate�(transversal):�In�the�pyramid,� this�rate� is�calculated�by�relating�for�a�specific�year�the�access�rate� in�the�first�grade�of�a� level� to�the�access�rate� in�the� last�grade�of� the�preceding�level.�To�measure� the� transition� rate� between� primary� and� lower� secondary� education� for�example,�the�following�is�used:���
Transition�rate�prim/sec1�= first grade lowersec
last gradeprimary
AccessRate
AccessRate
�This� indicator� is� an�approximation�of� the�actual� transition� rate� calculated�by� relating�the� number� of� nonrepeaters� in� the� first� grade� of� lower� secondary� education� to� the�number�of�nonrepeaters�in�last�grade�of�primary�education�the�year�before.��
Gross�enrollment�ratio�(GER)�for�each�level:��Number�of�pupils�enrolled�in�a�given�level,�expressed�as�a�percentage�of�the�population�of�the�official�age�group�for�this�level�of�education.�For�example,�for�primary�education,�it�is�calculated�as�follows:���
Enrollments�in�primaryGER� ��Official�age�groupe�population
�

The Education System in Malawi 227
�
This� indicator�can�exceed�100�percent�because�of� repeating�and�early�or� late�entrance�for�some�children.�It�is�an�indicator�of�the�education�system’s�potential�ability�to�enroll�the�school�age�population.��
Percentage�of�technical�and�vocational�training:��The�number�of�pupils�following�technical�and�vocational�training�is�related�to�the�total�number�of�pupils�in�secondary�education�(general,�technical,�and�vocational).��
Figure 2A.13: Educational Pyramid
6
7
8
9
10
11
Prim
ary
74%
100%
77%
12
13
14
Low
er
seco
ndar
y ed
ucat
ion 43%
57%
88%
15
16
17
18
Upp
er s
econ
dary
ed
ucat
ion
Theoretical ages
24%
Share of pupils in training/vocational courses among all secondary education
pupils
Number of students per 100,000 inhabitants
Transition rate (transversal) between primary and lower secondary. The size of the arrow is
proportional to the indicator value
Transition rate (transversal) between lower and upper secondary. The size of the arrow
is proportional to the indicator value
Access rate to the last grade of upper secondary
Access rate to the first grade of upper secondary
Acces rate to the first grade of primary education (capped to 100% for countries with an higher value)
Access rate to the last grade of primary educationGER = 106%
GER = 59%
Gross enolment rate
GER = 35%
38%
��
�

228 World Bank Working Paper
�
Appendix 2.6: Factors Explaining Why Some Children Never Go to Primary Education
High�access�probability� to� Standard�1� (96�percent)�must�not� obscure� the� issue�of� the�remaining� 4� percent� (100–96� percent)� that� never� go� to� school.� In� order� to� better�understand�why� there� is� a� remaining� access� to� Standard� 1�problem,� the� information�provided� by� both� MICS� and� IHS� data� can� be� used,� with� which� it� is� possible� to�comprehend� the� out�of�school� children.� Table� 2A.10� provides� results� of� a� statistical�model�computed�using�data�from�MICS�2006,�trying�to�relate�the�access�probability�in�Standard�1�with�socio�economic�criteria.��Table 2A.6: Model for Access Rate to Standard 1 Using Household Survey Data
Variable Modality Coef. Marginal Effect a Sign�b Dependant variable: Access Rate to Std 1 Area (ref:urban) Rural – 0.047 – 0.001 ns Gender (ref:male) Female 0.099 0.003 ns
Income index (ref:q1)�c q3 0.239 0.006 ** q4 0.389 0.009 *** q5 0.714 0.015 *** Region (ref:northern) Central – 0.476 – 0.012 * Southern – 0.795 – 0.022 *** Mother's level of education (ref: primary) No education – 1.168 – 0.037 *** Post-primary 0.852 0.016 *** Non-formal education 0.266 0.006 ns Father's level of education (ref: primary) No education – 0.578 – 0.018 *** Post-primary 0.888 0.016 *** Non-formal education – 1.897 – 0.125 ns Father not in household – 0.511 – 0.013 *** Cons. 4.450 *** Number of observation : 11 133 ; Pseudo R2==0.0872; predicted probability = 97.4%
Source:�Calculation�from�MICS�2006�data.�Notes:��a.�The�marginal�effect�is�computed�on�the�probability:�for�instance,�according�to�this�model,�the�probability�to�access�school�in�the�Southern�region�is�2.2�percent�lower�than�the�same�probability�in�the�Northern�region,�all�things�being�equal.�b.�ns=�non�significant,�*=10�percent,�**=5�percent,�***=1�percent�c.�The�quintile�q2�is�not�displayed�in�the�model�because�its�coefficient�was�insignificant�(no�statistical�difference�compared�to�q1).��
According�to�this�model,�there�is�no�statistically�significant�difference�in�the�access�rate� to�Std�1� that�would�rely�either�on�gender�or�area�(urban/rural).�Estimated�access�probabilities� do� not� differ� significantly� between� boys� and� girls,� urban� and� rural.�However,�there�are�some�significant�differences�according�to�other�criteria,�even�if�they�remain�small:�

The Education System in Malawi 229
�
� Regarding�wealth� classification,� children� living� in� the� richest� 20� percent� of�households� should�have�an�access� rate� to�Standard�1�only�1.5�percent�above�the�same�figure�for�children�coming�from�the�poorest�20�percent.��
� Differences�between�regions�are�a�little�bit�more�important:�the�access�rate�to�Standard�1� in� the�Southern�region�significantly�2.2�percent� lower� than� in� the�Northern,�while� the� same� figure� for� the� Central� region� is� 1.2� percent� lower�than�in�the�Northern�region.1�
� The� parents’� education� has� an� increasingly� positive� effect� on� access� to�Standard�1.�For�instance,�children�whose�mothers�have�no�education�have�an�access�rate�that�is�3.7�percent�less�than�for�those�whose�mother�has�a�primary�education�level.�There�is�no�difference�regarding�access�to�Standard�1�between�children�whose� parents� have� no� education� and� those�whose� parents� have� a�non�formal�education�background.��
IHS�data�also�provide�more�qualitative�information�because�the�households�were�asked� why� children� never� attend� school.� Table� 2A.11� presents� the� distribution� of�reason�declared�for�out�of�school�children�aged�from�6�to�13.���Table 2A.7: Main Reason Declared for Having Never Attended School (in %)
6–7 Y.O. 8–9 Y.O. 10–11 Y.O. 12–13 Y.O. Total Still too young to attend school 69.1 23.9 8.1 1.5 47.5
No money for fees/uniform 3.9 12.7 12.9 15.4 7.7 No school nearby 4.3 9.2 9 10.4 6.4
Disabled/illness 10 29.2 50 48.5 21.3 Orphaned 3.9 11.3 10.7 10.8 6.8
Not interested/lazy 0.5 2.2 4.2 6.8 1.8 Parents didn't let me in 8.3 11.2 5.2 6.7 8.5 School conflicted with beliefs 0.3 0.1
Total 100 100 100 100 100
Number of individuals (weighted) 213,664 81,272 32,452 31,207 358,595
Source:�Calculations�from�IHS�2004�database.��
For�children�6–7�years�old�69.1�percent,�did�not�enter�school�because�their�parents�thought�they�were�too�young,�although�6�is�the�official�age�for�Standard�1�attendance.�This�reason�is�less�involved�for�older�children,�but�remains�at�the�global�level�the�main�reason�for�children�of�official�age�not�attending�school�(47.5�percent).��
The� second� major� reason� expressed� was� illness� and� disabilities� (21.3� percent),�which�was�major�for�8–9�year�olds�(29.2�percent)�and�older�(around�50�percent).�Being�orphaned�was�referred�to�in�6.8�percent�of�cases.��
The�lack�of�money�to�pay�fees�and�uniforms�was�also�given�as�one�reason�for�never�attending�school�(around�13�percent�for�children�between�8–11�and�15�percent�for�12–13� year� olds).� This� reason� needs� to� be� related� to� the� global� issue� of� free� primary�education�introduced�in�Malawi�in�1994.�

230 World Bank Working Paper
�
Having� no� school� nearby� was� also� reported� as� the� main� reason� for� around� 9�percent�of�children�between�8–13�years�old.�This�reason�is�contrary�to�the�others,�a�pure�supply�side�issue.�
Notes �1�Regional�disparities�are�discussed�in�Chapter�5.�
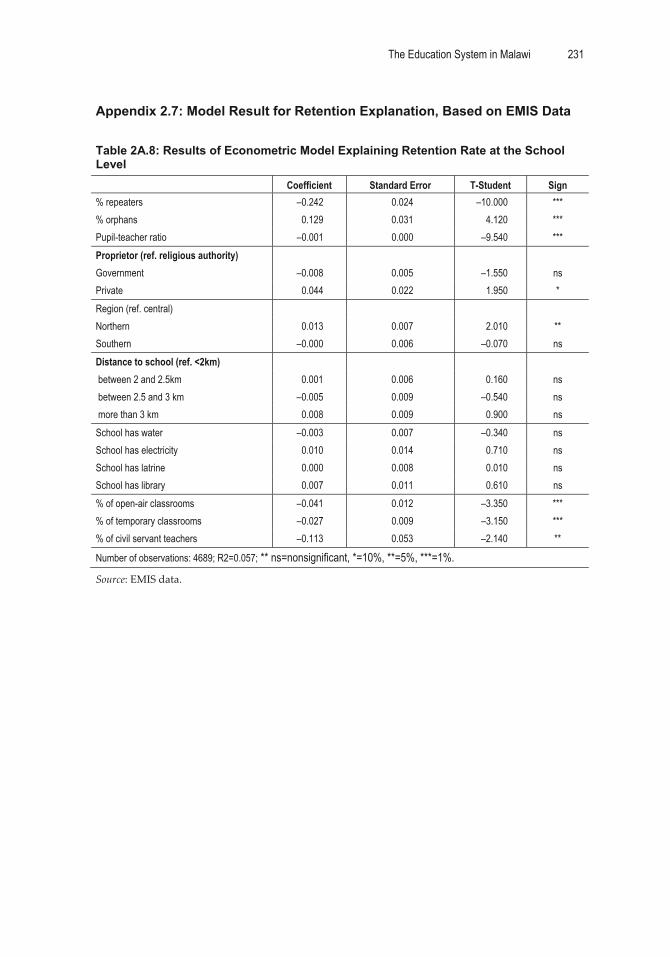
The Education System in Malawi 231
�
Appendix 2.7: Model Result for Retention Explanation, Based on EMIS Data
�Table 2A.8: Results of Econometric Model Explaining Retention Rate at the School Level
Coefficient Standard Error T-Student Sign % repeaters –0.242 0.024 –10.000 *** % orphans 0.129 0.031 4.120 *** Pupil-teacher ratio –0.001 0.000 –9.540 *** Proprietor (ref. religious authority) Government –0.008 0.005 –1.550 ns Private 0.044 0.022 1.950 * Region (ref. central) Northern 0.013 0.007 2.010 ** Southern –0.000 0.006 –0.070 ns Distance to school (ref. <2km) between 2 and 2.5km 0.001 0.006 0.160 ns between 2.5 and 3 km –0.005 0.009 –0.540 ns more than 3 km 0.008 0.009 0.900 ns School has water –0.003 0.007 –0.340 ns School has electricity 0.010 0.014 0.710 ns School has latrine 0.000 0.008 0.010 ns School has library 0.007 0.011 0.610 ns % of open-air classrooms –0.041 0.012 –3.350 *** % of temporary classrooms –0.027 0.009 –3.150 *** % of civil servant teachers –0.113 0.053 –2.140 **
Number of observations: 4689; R2=0.057; ** ns=nonsignificant, *=10%, **=5%, ***=1%.
Source:�EMIS�data.���

232 World Bank Working Paper
�
Appendix 2.8: Quantitative Efficiency of Education Expenditure
It� is� possible� to� estimate� school� life� expectancy� (SLE)� in� Malawi,� combining� the�situation�of�children� that�never�go� to�school�with�students’�histories�according� to� the�distribution� of� final� levels� in� general� education.� A� cross�section� schooling� profile,�providing� access� rates� to� each� grade,� allows� this� calculation,� but� for� international�comparison�purposes,�a�simplified�method�based�on�the�average�schooling�ratio�(ASR),�derived� from� the� GER� per� cycle1� can� also� be� used.� The� result� of� this� calculation,�presented� in� table� 2A.13,2� gives� an� average� duration� of� seven� years� of� schooling� in�Malawi.3���Table 2A.9: ASR and School-Life Expectancy Calculation for Malawi (2007)
Std1–4 Std 5–8 Form 1–2 Form 3–4 Higher Ed. SLE GER (a) 136.6% 61.4% 18.3% 14.1% 1.3% Duration (b) 4 4 2 2 4 Ref.pop. 6-9y 10-13y 14-15y 16-17y 18-21y % repeaters (c) 22.6% 14.4% 4.4% 6.8% 0.0% ASR (d) = (a) x (1-(c) 105.7% 52.5% 17.5% 13.2% 1.3% Weighted duration (e)= (d) x (b) 4.23 2.10 0.35 0.26 0.05 7.0
Source:�Calculation�from�EMIS�2007�and�UN�population�estimates.��
Figure�2A.14�provides�an�international�comparison�on�school�life�expectancy.�This�indicator� varies� between� 3.1� (Niger)� to� 11.4� (Mauritius� and� South� Africa)� with� an�average�value�of�6.59.�Malawi�stands�above� the�Africa�average,�but�below�the�SADC�average�of�7.53.����
Figure 2A.14: International Comparison on School-Life Expectancy (2007 or Closest Year)
0123456789
101112
Niger
Centra
l Afric
an R
epub
licMali
Burkina
Faso
Eritrea
Burund
iCha
d
Rwanda
Madag
asca
r
Côte d'
Ivoire
Guinea
-Biss
auSud
an
Mozam
bique
Congo
, Rep
. of
Ethiop
ia
Maurita
nia
Comoro
s
Guinea
Equato
rial
Seneg
al
Tanz
ania
Sierra
Leon
e
Ugand
a
Sao To
me and
Prin
cipeTo
go
Camero
on
MalawiBen
in
Gabon
Gambia
, The
Zambia
Ghana
Leso
tho
Swazila
nd
NigeriaKen
ya
Zimba
bwe
Cape V
erde
Namibi
a
Botswan
a
Mauriti
us
South
Africa
Africa average = 6.59SADC average = 7.53
Indi
cato
r
�
Source:�World�Bank�database.��

The Education System in Malawi 233
�
The� issue� of� efficiency� can� be� addressed� in� a� relatively� simple� way,� both� a�summary� indicator� of� global� educational� coverage� (school� life� expectancy)� and� an�estimate�of�the�public�resources�dedicated�to�education�(Chapter�1)�can�be�used.�Both�are�displayed�in�table�2A.10,�for�some�low�income�African�countries.��Table 2A.10: School Life Expectancy, Recurrent Expenditure for Education as a Share of GDP and Index, Low-Income African Countries (2007 or closest Year)
Education Recurrent Public Expenditure
as % of GDP (a) School Life
Expectancy (b) Efficiency Index
(b)/(a) Central African Republic 1.5 3.9 2.60 Guinea 2 5.2 2.60 Rwanda 2.4 5.3 2.21 Madagascar 2.6 5.4 2.08 Niger 2.6 2.9 1.12 Guinea-Bissau 2.6 6.2 2.38 Mozambique 3 4.7 1.57 Ethiopia 3 4.6 1.53 Malawi 4.8 7 1.46 Mali 3.4 4.2 1.24 Togo 3.4 8.7 2.56 Tanzania 3.6 5.9 1.64 Uganda 3.7 8.1 2.19 Burundi 3.8 3.9 1.03 Gambia 4.1 6.9 1.68 Burkina Faso 4.3 4.2 0.98 Ghana 5.3 7 1.32
Sources:�Calculation�from�Chapter�3�and�EMIS�data�for�Malawi,�CSRs�for�the�other�countries.��
Efficiency�index�as�it�is�computed�in�table�2A.10�indicates�the�number�of�schooling�years�that�the�country�can�supply�to�its�population�by�spending�1�percent�of�GDP.�In�Malawi,�the�result�is�1.46,�which�is�slightly�below�the�average�of�the�selected�countries�(1.77).�Another�way�to�display�these�results�is�to�display�on�the�same�figure�both�school�life�expectancy�and�the�share�of�public�resources�for�education�(Figure�2A.15)���

234 World Bank Working Paper
�
Figure 2A.15: School Life Expectancy and Current Expenditure for Education as a Share of GDP for Some Low Income African Countries (2007 or Closest Year)
Ghana
Burkina Faso
Gambia
Burundi
Uganda
Tanzania
Togo
Mali
Malawi
EthiopiaMozambique
Guinea-Bissau
Niger
Madagascar
Rwanda
Guinea
CAR
0
1
2
3
4
5
6
7
8
9
10
1 1.5 2 2.5 3 3.5 4 4.5 5 5.5 6
% Current Expenditure for Education as a Share of GDP
Sch
ool L
ife E
xpec
tanc
y
�
Source:�Table�2.16.��
For� a�given� level� of�mobilized�public� resources,� there� are�various� situations� that�offer�different�levels�of�schooling�coverage.�Thus,�Malawi�belongs�to�the�countries�that�spend�more�than�others,�not�being�so�efficient�compared�to�countries�spending�less.�
Notes �1�For�a�given�cycle�or�sub�cycle,�ASR=GER�x�(1��%�repeaters).��2�For�more�detailed�presentation,�see�Pole�de�Dakar�Méthode�note�n°3�:�“Mesurer� la�couverture�scolaire�globale�d’un�pays:�l’espérance�de�vie�scolaire.”�3�Calculation�with�schooling�profile�lead�to�6.2.�

The Education System in Malawi 235
�
Appendix 3.1: Expenditure by Type and Source of Funding
Figure 3A.1: Teachers’ Average Salary (Primary and Secondary) as Units of GDP Per Capita for Countries with GDP Per Capita Lower than US$500 (2007 or last year available)
0
2
4
6
8
10
12
14
Congo
, Dem
. Rep
. of
Guinea
Guinea
-Biss
auTo
go
Madag
asca
r
Ugand
a
Sierra
Leon
e
Rwanda
Eritrea
Averag
e
Zimba
bwe
Mali
Centra
l Afric
an R
epub
lic
The G
ambia
Burkina
Faso
Malawi
Niger
Burund
i
Ethiop
ia
Prim arySecondary (upper)
Sal
ary
as u
nits
of G
DP
per c
apita
�Source:�Malawian�salary�scale�and�World�Bank�data.�Note:�For�comparative�purposes,�the�secondary�teachers’�average�salaries�presented�for�other�countries�are�calculated�on�upper�secondary�(the�upper�secondary�is�similar�in�terms�of�qualifications�and�duration�to�the�full�cycle�of�secondary�in�Malawi).���
Figure 3A.2: Public Recurrent Expenditure Excluding Teachers’ Salaries As a Percentage of Total Recurrent Expenditure (Primary Education) (2007 or last year available)
0
1020
3040
5060
70
Per
cent
Congo
, Dem
. Rep
. of
Guinea
Kenya
Guinea
-Biss
auSud
anTo
go
Ghana CI
Benin
Congo
, Rep
. of
Mozam
bique
Swazila
nd
Madag
asca
r
Ugand
a
Sierra
Leon
e
Rwanda
Seneg
alEritr
ea
Averag
e
Zambia
Camero
on
Zimba
bwe
Mali
Maurita
nia
FTI refer
ence
Tanz
ania
Nigeria
Chad
Leso
tho
Liberi
a
Centra
l Afric
an R
epub
lic
Gambia
, The
Burkina
Faso
Malawi
Niger
Burund
i
Ethiop
ia
�
Source:�World�Bank�data.��
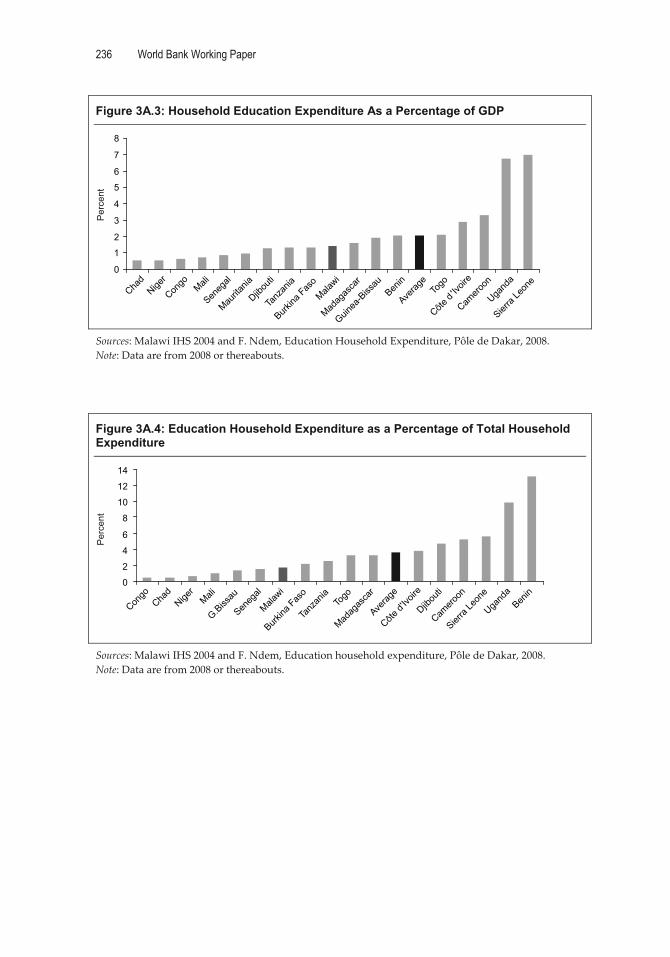
236 World Bank Working Paper
�
Figure 3A.3: Household Education Expenditure As a Percentage of GDP
0
1
2
3
4
5
6
7
8
Chad
Niger
Congo Mali
Seneg
al
Maurita
nia
Djibou
ti
Tanz
ania
Burkina
Faso
Malawi
Madag
asca
r
Guinea
-Biss
auBen
in
Averag
eTo
go
Côte d
'Ivoir
e
Camero
on
Ugand
a
Sierra
Leon
e
Per
cent
�Sources:�Malawi�IHS�2004�and�F.�Ndem,�Education�Household�Expenditure,�Pôle�de�Dakar,�2008.�Note:�Data�are�from�2008�or�thereabouts.����
Figure 3A.4: Education Household Expenditure as a Percentage of Total Household Expenditure
0
2
4
6
8
10
12
14
Congo
Chad
Niger
Mali
G.Biss
au
Seneg
al
Malawi
Burkina
Faso
Tanz
ania
Togo
Madag
asca
r
Averag
e
Côte d'
Ivoire
Djibou
ti
Camero
on
Sierra
Leon
e
Ugand
aBen
in
Per
cent
Sources:�Malawi�IHS�2004�and�F.�Ndem,�Education�household�expenditure,�Pôle�de�Dakar,�2008.�Note:�Data�are�from�2008�or�thereabouts.��
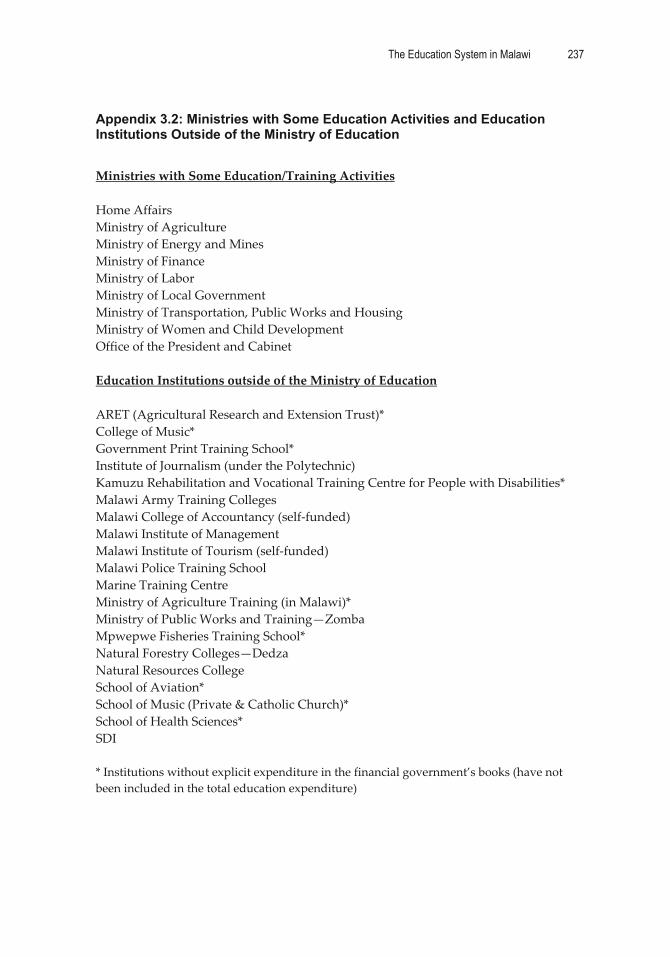
The Education System in Malawi 237
�
Appendix 3.2: Ministries with Some Education Activities and Education Institutions Outside of the Ministry of Education
�Ministries�with�Some�Education/Training�Activities��Home�Affairs�Ministry�of�Agriculture�Ministry�of�Energy�and�Mines�Ministry�of�Finance�Ministry�of�Labor�Ministry�of�Local�Government�Ministry�of�Transportation,�Public�Works�and�Housing�Ministry�of�Women�and�Child�Development�Office�of�the�President�and�Cabinet��Education�Institutions�outside�of�the�Ministry�of�Education��ARET�(Agricultural�Research�and�Extension�Trust)*�College�of�Music*�Government�Print�Training�School*�Institute�of�Journalism�(under�the�Polytechnic)�Kamuzu�Rehabilitation�and�Vocational�Training�Centre�for�People�with�Disabilities*�Malawi�Army�Training�Colleges�Malawi�College�of�Accountancy�(self�funded)�Malawi�Institute�of�Management�Malawi�Institute�of�Tourism�(self�funded)�Malawi�Police�Training�School�Marine�Training�Centre�Ministry�of�Agriculture�Training�(in�Malawi)*�Ministry�of�Public�Works�and�Training—Zomba�Mpwepwe�Fisheries�Training�School*�Natural�Forestry�Colleges—Dedza�Natural�Resources�College�School�of�Aviation*�School�of�Music�(Private�&�Catholic�Church)*�School�of�Health�Sciences*�SDI��*�Institutions�without�explicit�expenditure�in�the�financial�government’s�books�(have�not�been�included�in�the�total�education�expenditure)��

238 World Bank Working Paper
�
Appendix 3.3: Recurrent and Capital Allocations to ECD and Adult Literacy
Budget�allocations� to�early�childhood�development�and� for�adult� literacy�are�given�a�very� low� priority.� Compared� to� the� other� subsectors,� the� allocated� amounts� are�negligible.� As� an� example,� ECD� gets� an�ORT� allocation� that� is� no�more� than�MK10�million� for� all� their� recurrent� activities� in� the� entire� country� and� this� was� over� an�extended�period�(i.e.,�from�2000–2007).��
The�ORT�allocations� to�adult� literacy� improved�somewhat� from�2003/04–2006/07,�after� a� long� period� of� stagnation� while� the� development� allocations� fell� to� MK30�million�between�2000/01�and�2003/04�and�then�rose�to�MK45�million�in�2006/07.��
Both� adult� literacy� and� Early� Childhood� Development� have� very� low� priority�ratings�and�their�total�development�and�recurrent�expenditures�only�rose�from�MK60�million�to�MK�145�million�from�2003/04�to�2006/07.��
As� a� consequence,� the� number� of� children� benefiting� from� ECD� intervention� is�very�low,�although�the�benefits�to�primary�education�of�the�development�of�this�level�are�well�documented�in�education�literature.����
Figure 3A.5: Evolution of Budget Allocation to ECD and Adult Literacy (in MK Millions)
MK
milli
ons
Total Budget
ORT-Literacy
Total DEV Literacy
Total DEV ECD
ORT-ECD
2000/01 2000/02 2000/03 2000/04 2000/05 2000/06 2000/070
20
40
60
80
100
120
140
160
Fiscal year �
Source:�Ministry�of�Women�and�Child�Development.���
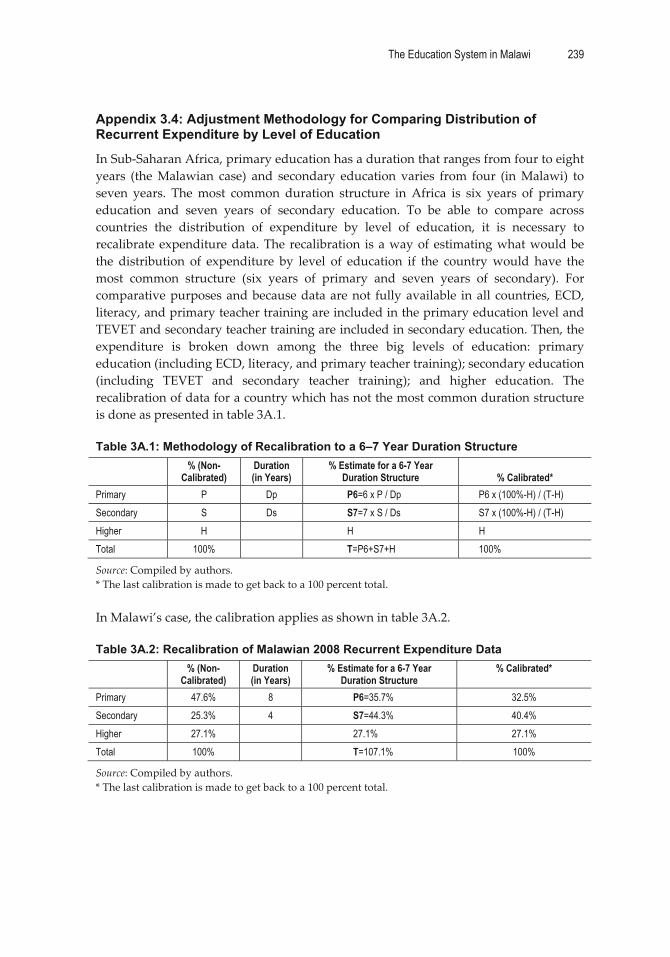
The Education System in Malawi 239
�
Appendix 3.4: Adjustment Methodology for Comparing Distribution of Recurrent Expenditure by Level of Education
In�Sub�Saharan�Africa,�primary�education�has�a�duration�that�ranges�from�four�to�eight�years� (the�Malawian� case)� and� secondary� education� varies� from� four� (in�Malawi)� to�seven� years.� The�most� common� duration� structure� in� Africa� is� six� years� of� primary�education� and� seven� years� of� secondary� education.� To� be� able� to� compare� across�countries� the� distribution� of� expenditure� by� level� of� education,� it� is� necessary� to�recalibrate�expenditure�data.�The�recalibration� is�a�way�of�estimating�what�would�be�the� distribution� of� expenditure� by� level� of� education� if� the� country�would� have� the�most� common� structure� (six� years� of� primary� and� seven� years� of� secondary).� For�comparative�purposes�and�because�data�are�not� fully�available� in�all� countries,�ECD,�literacy,�and�primary�teacher�training�are�included�in�the�primary�education�level�and�TEVET�and�secondary�teacher�training�are�included�in�secondary�education.�Then,�the�expenditure� is� broken� down� among� the� three� big� levels� of� education:� primary�education�(including�ECD,�literacy,�and�primary�teacher�training);�secondary�education�(including� TEVET� and� secondary� teacher� training);� and� higher� education.� The�recalibration�of�data�for�a�country�which�has�not�the�most�common�duration�structure�is�done�as�presented�in�table�3A.1.��Table 3A.1: Methodology of Recalibration to a 6–7 Year Duration Structure
% (Non-
Calibrated) Duration (in Years)
% Estimate for a 6-7 Year Duration Structure % Calibrated*
Primary P Dp P6=6 x P / Dp P6 x (100%-H) / (T-H) Secondary S Ds S7=7 x S / Ds S7 x (100%-H) / (T-H) Higher H H H Total 100% T=P6+S7+H 100%
Source:�Compiled�by�authors.�*�The�last�calibration�is�made�to�get�back�to�a�100�percent�total.��In�Malawi’s�case,�the�calibration�applies�as�shown�in�table�3A.2.���Table 3A.2: Recalibration of Malawian 2008 Recurrent Expenditure Data
% (Non-Calibrated)
Duration (in Years)
% Estimate for a 6-7 Year Duration Structure
% Calibrated*
Primary 47.6% 8 P6=35.7% 32.5% Secondary 25.3% 4 S7=44.3% 40.4% Higher 27.1% 27.1% 27.1% Total 100% T=107.1% 100%
Source:�Compiled�by�authors.�*�The�last�calibration�is�made�to�get�back�to�a�100�percent�total.��
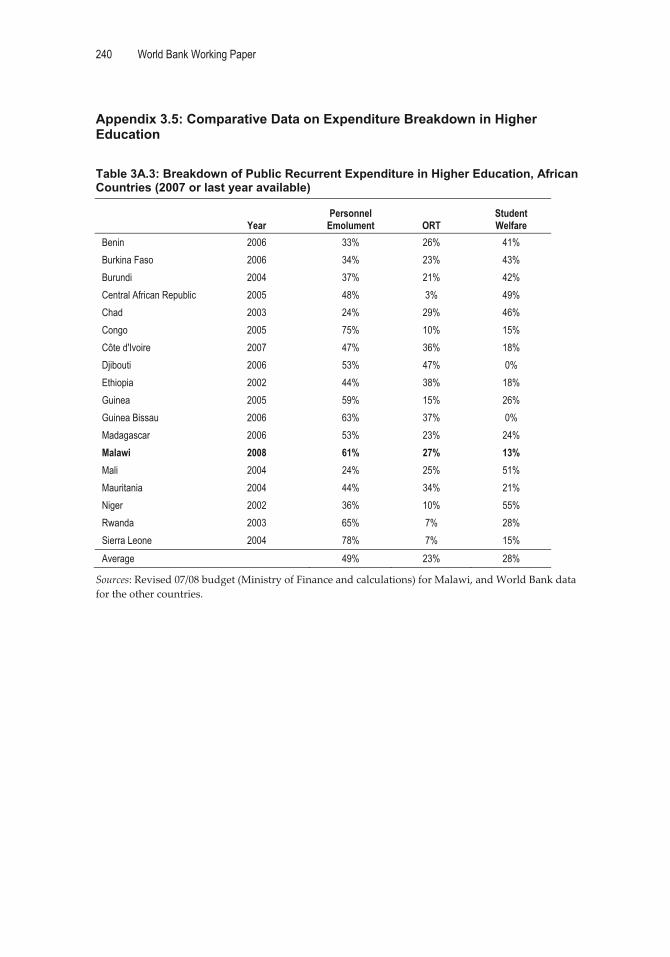
240 World Bank Working Paper
�
Appendix 3.5: Comparative Data on Expenditure Breakdown in Higher Education
�Table 3A.3: Breakdown of Public Recurrent Expenditure in Higher Education, African Countries (2007 or last year available)
Year Personnel
Emolument ORT Student Welfare
Benin 2006 33% 26% 41% Burkina Faso 2006 34% 23% 43% Burundi 2004 37% 21% 42% Central African Republic 2005 48% 3% 49% Chad 2003 24% 29% 46% Congo 2005 75% 10% 15% Côte d'Ivoire 2007 47% 36% 18% Djibouti 2006 53% 47% 0% Ethiopia 2002 44% 38% 18% Guinea 2005 59% 15% 26% Guinea Bissau 2006 63% 37% 0% Madagascar 2006 53% 23% 24% Malawi 2008 61% 27% 13% Mali 2004 24% 25% 51% Mauritania 2004 44% 34% 21% Niger 2002 36% 10% 55% Rwanda 2003 65% 7% 28% Sierra Leone 2004 78% 7% 15% Average 49% 23% 28%
Sources:�Revised�07/08�budget�(Ministry�of�Finance�and�calculations)�for�Malawi,�and�World�Bank�data�for�the�other�countries.��
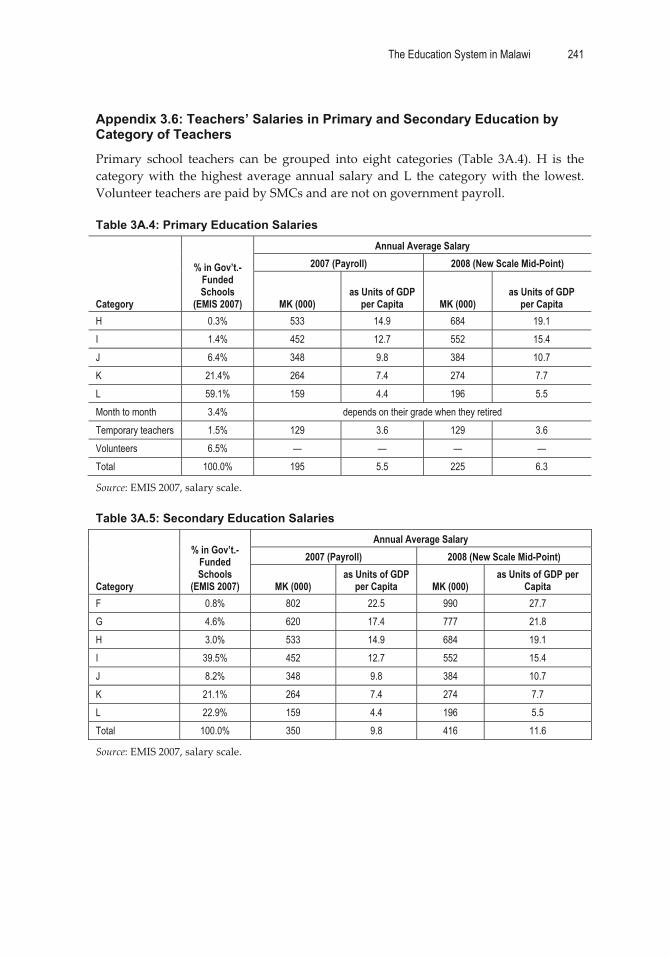
The Education System in Malawi 241
�
Appendix 3.6: Teachers’ Salaries in Primary and Secondary Education by Category of Teachers
Primary� school� teachers� can� be� grouped� into� eight� categories� (Table� 3A.4).� H� is� the�category�with� the�highest� average�annual� salary�and�L� the� category�with� the� lowest.�Volunteer�teachers�are�paid�by�SMCs�and�are�not�on�government�payroll.��Table 3A.4: Primary Education Salaries
Category
% in Gov’t.- Funded Schools
(EMIS 2007)
Annual Average Salary 2007 (Payroll) 2008 (New Scale Mid-Point)
MK (000) as Units of GDP
per Capita MK (000) as Units of GDP
per Capita H 0.3% 533 14.9 684 19.1 I 1.4% 452 12.7 552 15.4 J 6.4% 348 9.8 384 10.7 K 21.4% 264 7.4 274 7.7 L 59.1% 159 4.4 196 5.5 Month to month 3.4% depends on their grade when they retired Temporary teachers 1.5% 129 3.6 129 3.6 Volunteers 6.5% — — — — Total 100.0% 195 5.5 225 6.3
Source:�EMIS�2007,�salary�scale.��Table 3A.5: Secondary Education Salaries
Category
% in Gov’t.- Funded Schools
(EMIS 2007)
Annual Average Salary 2007 (Payroll) 2008 (New Scale Mid-Point)
MK (000) as Units of GDP
per Capita MK (000) as Units of GDP per
Capita F 0.8% 802 22.5 990 27.7 G 4.6% 620 17.4 777 21.8 H 3.0% 533 14.9 684 19.1 I 39.5% 452 12.7 552 15.4 J 8.2% 348 9.8 384 10.7 K 21.1% 264 7.4 274 7.7 L 22.9% 159 4.4 196 5.5 Total 100.0% 350 9.8 416 11.6
Source:�EMIS�2007,�salary�scale.�
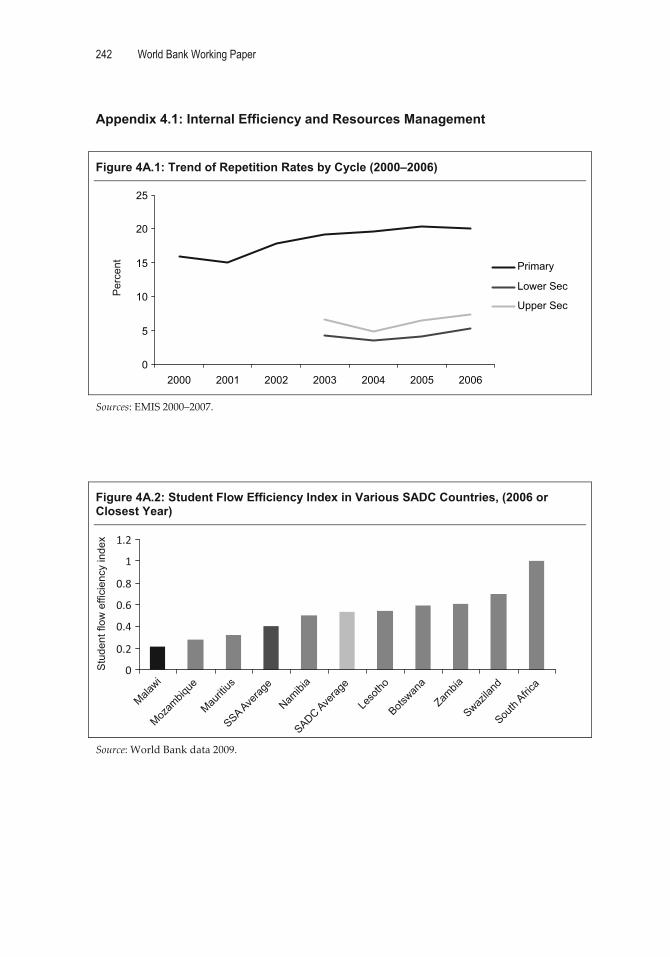
242 World Bank Working Paper
�
Appendix 4.1: Internal Efficiency and Resources Management
�
Figure 4A.1: Trend of Repetition Rates by Cycle (2000–2006)
0
5
10
15
20
25
2000 2001 2002 2003 2004 2005 2006
Primary
Lower Sec
Upper Sec
Per
cent
�
Sources:�EMIS�2000–2007.�����
Figure 4A.2: Student Flow Efficiency Index in Various SADC Countries, (2006 or Closest Year)
Malawi
Mozam
bique
Mauriti
us
SSA Averag
e
Namibi
a
SADC Averag
e
Leso
tho
Botswan
a
Zambia
Swazila
nd
South
Africa
0
0.2
0.4
0.6
0.8
1
1.2
Stu
dent
flow
effi
cien
cy in
dex
�Source:�World�Bank�data�2009.�����

The Education System in Malawi 243
�
Figure 4A.3: Internal Efficiency Coefficient (IEC) in SADC Countries (2006 or Closest Year)
0 0.2 0.4 0.6 0.8 1
MalawiMadagascarMozambique
LesothoSSA average
SADC subSwaziland
NamibiaZambia
South AfricaTanzania
Botswana
IEC �Source:�World�Bank�data�2009.��Note:�Based�on�a�primary�cycle�of�six�years�to�allow�for�comparison.����Table 4A.1: Degree of Randomness (1 – R2) in Public Teacher Allocations in Various African Countries (2002–2007)
Country Gov’t.-Funded
Teachers (in %)
Gov’t.-Funded and Volunteer/
Community Teachers Country
Gov’t.- Funded Teachers (in %)
Gov’t.-Funded and Volunteer/
Community Teachers (in %)
Guinea (2004) 7 n.a. Congo (2005) 38 35 Lesotho (2003) 18 — Malawi (2007) 42 42 Niger (2003) 19 n.a. CAR (2005) 46 24 Guinea-Bissau (2006) 20 Burundi (2004) 50 — Burkina Faso (2007) 22 — Benin (2006) 54 39 Mauritania (2004) 22 — Cameroon (2002) n.a. 45 Ethiopia (2002) 28 — Mali (2004) n.a. 27 Chad (2004) 33 34 Average 31 35
Sources:�various�CSR;�Malawi:�EMIS,�2007.��n.a.�=�not�available.��

244 World Bank Working Paper
�
Figure 4A.4: Consistency of Allocation of ORT at the Primary Level According to Enrollment at the District Level (2007/08)
y = 96.92x + 3E+06R2 = 0.8707
0
5,000,000
10,000,000
15,000,000
20,000,000
25,000,000
30,000,000
35,000,000
40,000,000
45,000,000
0 50,000 100,000 150,000 200,000 250,000 300,000 350,000
Students
Fund
ing
�
Sources:�ORT:�2007�budget�data,�enrollment;�EMIS�2007.����
Figure 4A.5: Teacher Allocation in All Secondary Publicly Funded Schools (2007)
y = 0.0394x + 2.1405R2 = 0.7247
0
10
20
30
40
50
60
70
0 200 400 600 800 1,000 1,200 1,400 1,600
Teac
hers
Students Source:�EMIS�2007.���
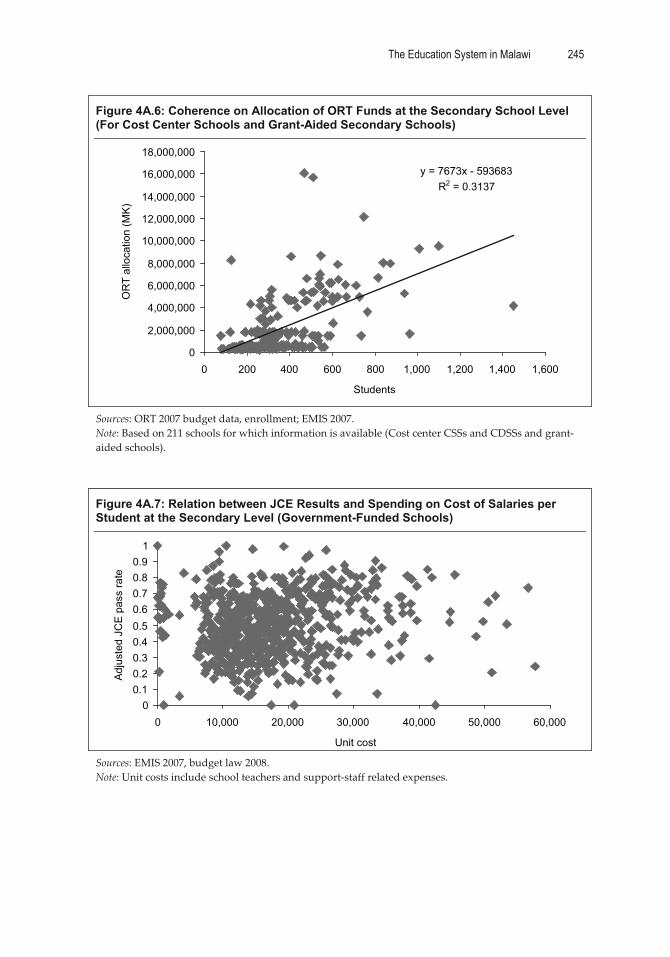
The Education System in Malawi 245
�
Figure 4A.6: Coherence on Allocation of ORT Funds at the Secondary School Level (For Cost Center Schools and Grant-Aided Secondary Schools)
y = 7673x - 593683R2 = 0.3137
0
2,000,000
4,000,000
6,000,000
8,000,000
10,000,000
12,000,000
14,000,000
16,000,000
18,000,000
0 200 400 600 800 1,000 1,200 1,400 1,600
Students
OR
T al
loca
tion
(MK
)
�
Sources:�ORT�2007�budget�data,�enrollment;�EMIS�2007.�Note:�Based�on�211�schools�for�which�information�is�available�(Cost�center�CSSs�and�CDSSs�and�grant�aided�schools).���
Figure 4A.7: Relation between JCE Results and Spending on Cost of Salaries per Student at the Secondary Level (Government-Funded Schools)
00.10.20.30.40.50.60.70.80.9
1
0 10,000 20,000 30,000 40,000 50,000 60,000
Unit cost
Adj
uste
d JC
E p
ass
rate
�Sources:�EMIS�2007,�budget�law�2008.�Note:�Unit�costs�include�school�teachers�and�support�staff�related�expenses.����
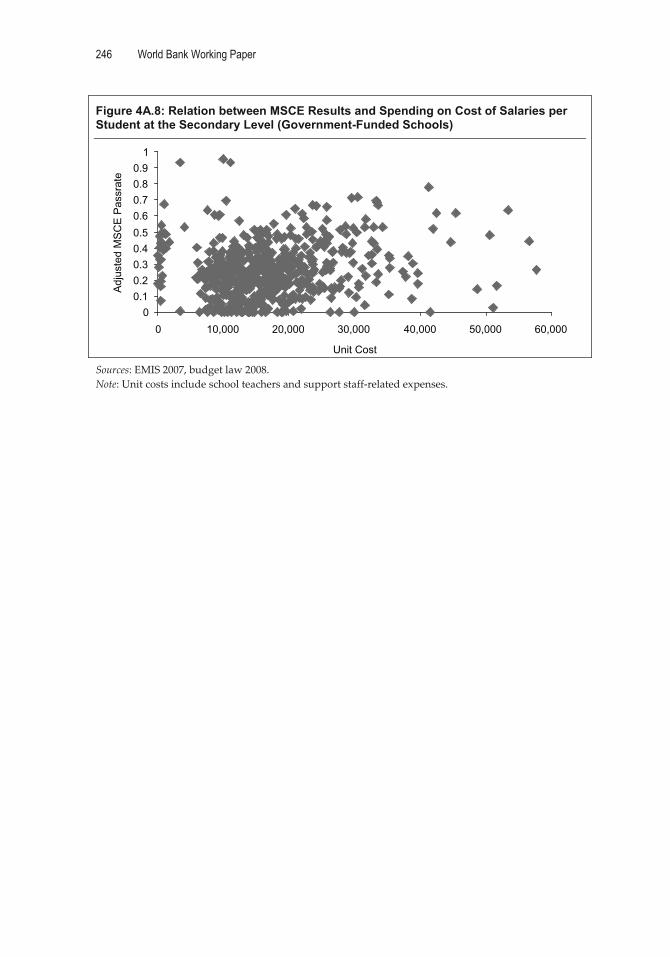
246 World Bank Working Paper
�
Figure 4A.8: Relation between MSCE Results and Spending on Cost of Salaries per Student at the Secondary Level (Government-Funded Schools)
00.10.20.30.40.50.60.70.80.9
1
0 10,000 20,000 30,000 40,000 50,000 60,000
Unit Cost
Adj
uste
d M
SC
E P
assr
ate
�Sources:�EMIS�2007,�budget�law�2008.�Note:�Unit�costs�include�school�teachers�and�support�staff�related�expenses.���
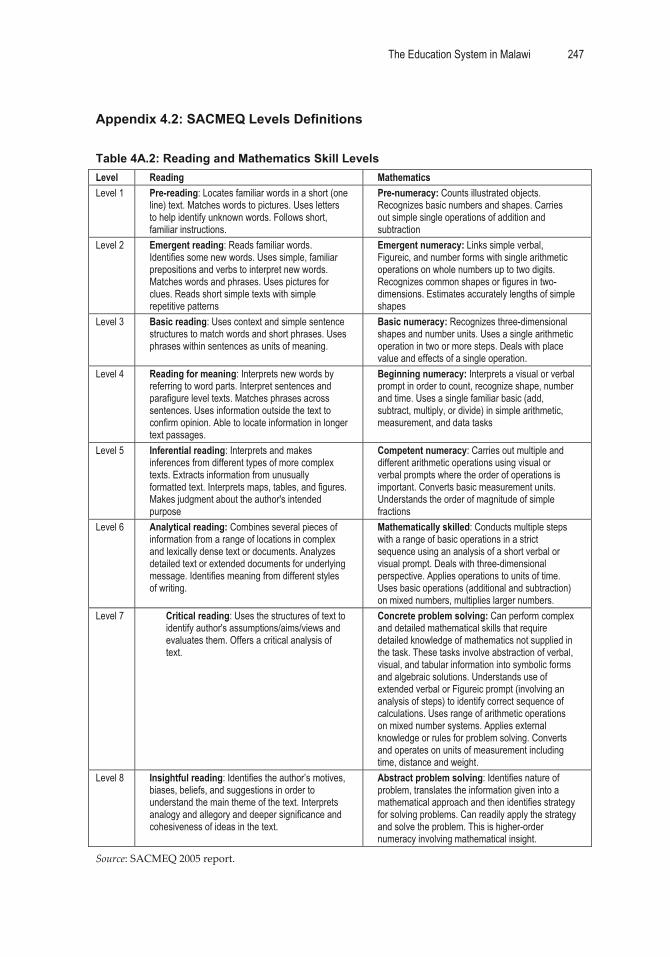
The Education System in Malawi 247
�
Appendix 4.2: SACMEQ Levels Definitions
�Table 4A.2: Reading and Mathematics Skill Levels Level Reading Mathematics Level 1 Pre-reading: Locates familiar words in a short (one
line) text. Matches words to pictures. Uses letters to help identify unknown words. Follows short, familiar instructions.
Pre-numeracy: Counts illustrated objects. Recognizes basic numbers and shapes. Carries out simple single operations of addition and subtraction
Level 2 Emergent reading: Reads familiar words. Identifies some new words. Uses simple, familiar prepositions and verbs to interpret new words. Matches words and phrases. Uses pictures for clues. Reads short simple texts with simple repetitive patterns
Emergent numeracy: Links simple verbal, Figureic, and number forms with single arithmetic operations on whole numbers up to two digits. Recognizes common shapes or figures in two-dimensions. Estimates accurately lengths of simple shapes
Level 3 Basic reading: Uses context and simple sentence structures to match words and short phrases. Uses phrases within sentences as units of meaning.
Basic numeracy: Recognizes three-dimensional shapes and number units. Uses a single arithmetic operation in two or more steps. Deals with place value and effects of a single operation.
Level 4 Reading for meaning: Interprets new words by referring to word parts. Interpret sentences and parafigure level texts. Matches phrases across sentences. Uses information outside the text to confirm opinion. Able to locate information in longer text passages.
Beginning numeracy: Interprets a visual or verbal prompt in order to count, recognize shape, number and time. Uses a single familiar basic (add, subtract, multiply, or divide) in simple arithmetic, measurement, and data tasks
Level 5 Inferential reading: Interprets and makes inferences from different types of more complex texts. Extracts information from unusually formatted text. Interprets maps, tables, and figures. Makes judgment about the author's intended purpose
Competent numeracy: Carries out multiple and different arithmetic operations using visual or verbal prompts where the order of operations is important. Converts basic measurement units. Understands the order of magnitude of simple fractions
Level 6 Analytical reading: Combines several pieces of information from a range of locations in complex and lexically dense text or documents. Analyzes detailed text or extended documents for underlying message. Identifies meaning from different styles of writing.
Mathematically skilled: Conducts multiple steps with a range of basic operations in a strict sequence using an analysis of a short verbal or visual prompt. Deals with three-dimensional perspective. Applies operations to units of time. Uses basic operations (additional and subtraction) on mixed numbers, multiplies larger numbers.
Level 7 Critical reading: Uses the structures of text to identify author's assumptions/aims/views and evaluates them. Offers a critical analysis of text.
Concrete problem solving: Can perform complex and detailed mathematical skills that require detailed knowledge of mathematics not supplied in the task. These tasks involve abstraction of verbal, visual, and tabular information into symbolic forms and algebraic solutions. Understands use of extended verbal or Figureic prompt (involving an analysis of steps) to identify correct sequence of calculations. Uses range of arithmetic operations on mixed number systems. Applies external knowledge or rules for problem solving. Converts and operates on units of measurement including time, distance and weight.
Level 8 Insightful reading: Identifies the author’s motives, biases, beliefs, and suggestions in order to understand the main theme of the text. Interprets analogy and allegory and deeper significance and cohesiveness of ideas in the text.
Abstract problem solving: Identifies nature of problem, translates the information given into a mathematical approach and then identifies strategy for solving problems. Can readily apply the strategy and solve the problem. This is higher-order numeracy involving mathematical insight.
Source:�SACMEQ�2005�report.�
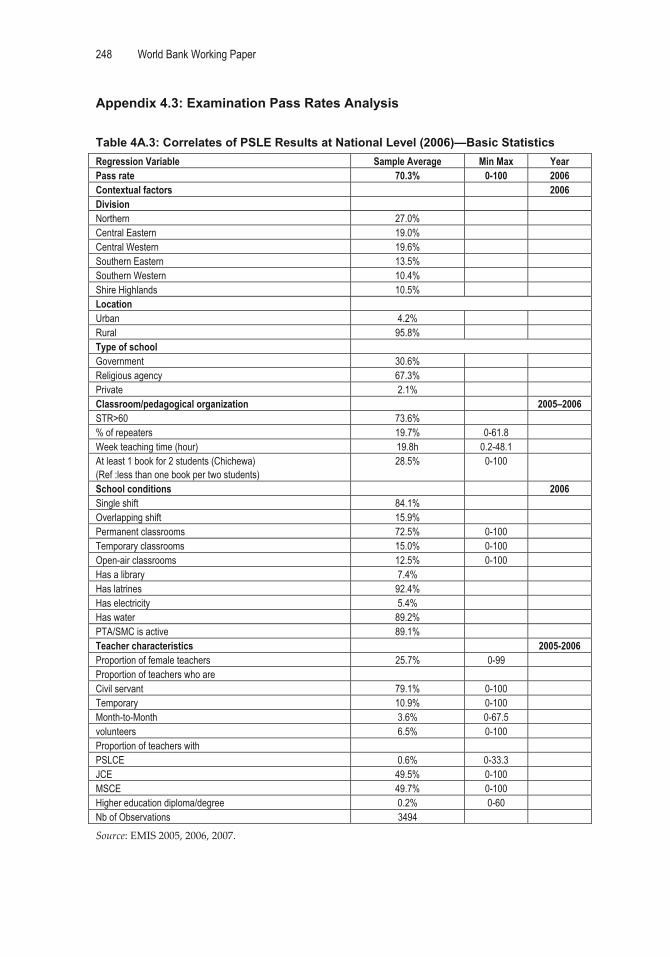
248 World Bank Working Paper
�
Appendix 4.3: Examination Pass Rates Analysis
�Table 4A.3: Correlates of PSLE Results at National Level (2006)—Basic Statistics Regression Variable Sample Average Min Max Year Pass rate 70.3% 0-100 2006 Contextual factors 2006 Division Northern 27.0% Central Eastern 19.0% Central Western 19.6% Southern Eastern 13.5% Southern Western 10.4% Shire Highlands 10.5% Location Urban 4.2% Rural 95.8% Type of school Government 30.6% Religious agency 67.3% Private 2.1% Classroom/pedagogical organization 2005–2006 STR>60 73.6% % of repeaters 19.7% 0-61.8 Week teaching time (hour) 19.8h 0.2-48.1 At least 1 book for 2 students (Chichewa) (Ref :less than one book per two students)
28.5% 0-100
School conditions 2006 Single shift 84.1% Overlapping shift 15.9% Permanent classrooms 72.5% 0-100 Temporary classrooms 15.0% 0-100 Open-air classrooms 12.5% 0-100 Has a library 7.4% Has latrines 92.4% Has electricity 5.4% Has water 89.2% PTA/SMC is active 89.1% Teacher characteristics 2005-2006 Proportion of female teachers 25.7% 0-99 Proportion of teachers who are Civil servant 79.1% 0-100 Temporary 10.9% 0-100 Month-to-Month 3.6% 0-67.5 volunteers 6.5% 0-100 Proportion of teachers with PSLCE 0.6% 0-33.3 JCE 49.5% 0-100 MSCE 49.7% 0-100 Higher education diploma/degree 0.2% 0-60 Nb of Observations 3494 Source:�EMIS�2005,�2006,�2007.�
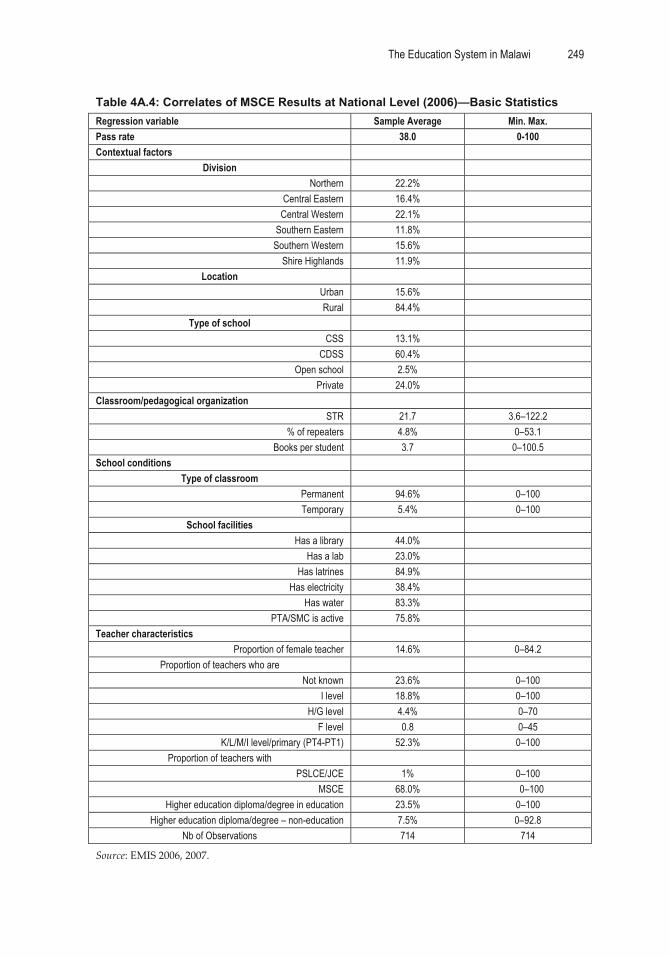
The Education System in Malawi 249
�
Table 4A.4: Correlates of MSCE Results at National Level (2006)—Basic Statistics Regression variable Sample Average Min. Max. Pass rate 38.0 0-100 Contextual factors
Division Northern 22.2%
Central Eastern 16.4% Central Western 22.1%
Southern Eastern 11.8% Southern Western 15.6%
Shire Highlands 11.9% Location
Urban 15.6% Rural 84.4%
Type of school CSS 13.1%
CDSS 60.4% Open school 2.5%
Private 24.0% Classroom/pedagogical organization
STR 21.7 3.6–122.2 % of repeaters 4.8% 0–53.1
Books per student 3.7 0–100.5 School conditions
Type of classroom Permanent 94.6% 0–100 Temporary 5.4% 0–100
School facilities Has a library 44.0%
Has a lab 23.0% Has latrines 84.9%
Has electricity 38.4% Has water 83.3%
PTA/SMC is active 75.8% Teacher characteristics
Proportion of female teacher 14.6% 0–84.2 Proportion of teachers who are
Not known 23.6% 0–100 I level 18.8% 0–100
H/G level 4.4% 0–70 F level 0.8 0–45
K/L/M/I level/primary (PT4-PT1) 52.3% 0–100 Proportion of teachers with
PSLCE/JCE 1% 0–100 MSCE 68.0% 0–100
Higher education diploma/degree in education 23.5% 0–100 Higher education diploma/degree – non-education 7.5% 0–92.8
Nb of Observations 714 714
Source:�EMIS�2006,�2007.�
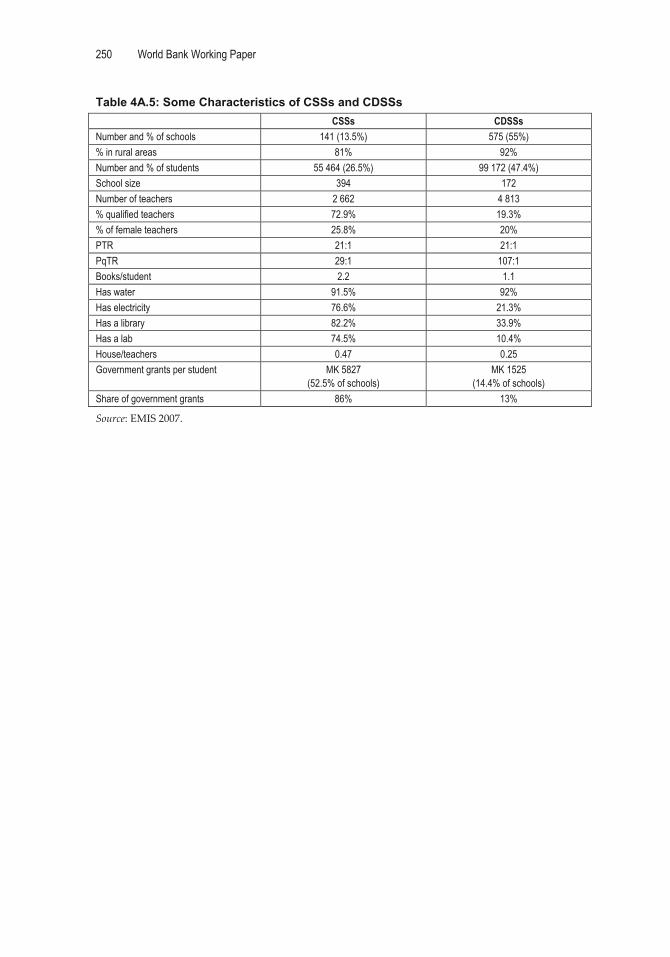
250 World Bank Working Paper
�
Table 4A.5: Some Characteristics of CSSs and CDSSs CSSs CDSSs Number and % of schools 141 (13.5%) 575 (55%) % in rural areas 81% 92% Number and % of students 55 464 (26.5%) 99 172 (47.4%) School size 394 172 Number of teachers 2 662 4 813 % qualified teachers 72.9% 19.3% % of female teachers 25.8% 20% PTR 21:1 21:1 PqTR 29:1 107:1 Books/student 2.2 1.1 Has water 91.5% 92% Has electricity 76.6% 21.3% Has a library 82.2% 33.9% Has a lab 74.5% 10.4% House/teachers 0.47 0.25 Government grants per student MK 5827
(52.5% of schools) MK 1525
(14.4% of schools) Share of government grants 86% 13%
Source:�EMIS�2007.��
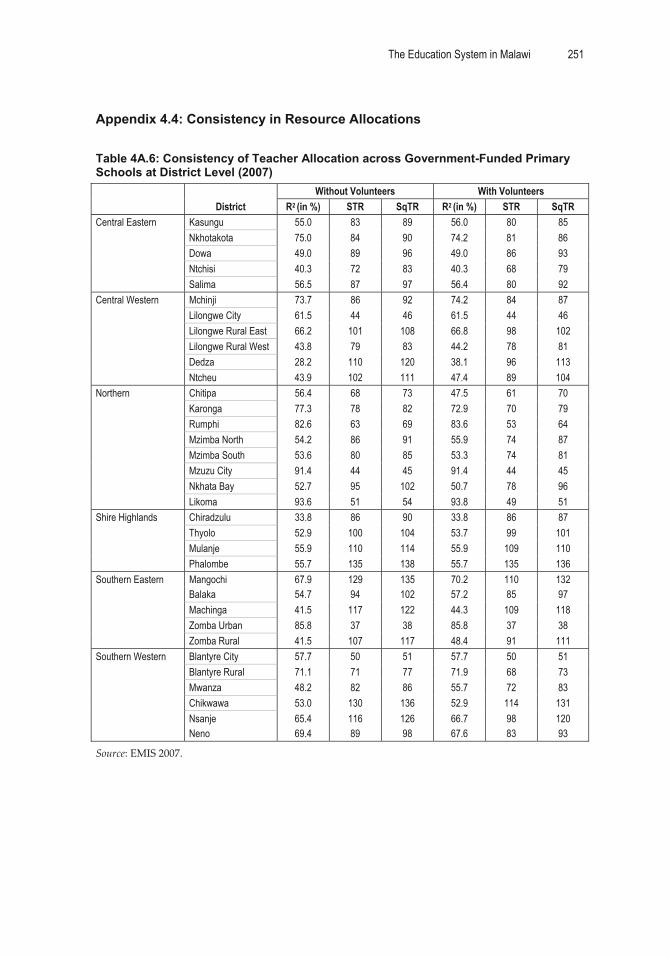
The Education System in Malawi 251
�
Appendix 4.4: Consistency in Resource Allocations
�Table 4A.6: Consistency of Teacher Allocation across Government-Funded Primary Schools at District Level (2007)
District
Without Volunteers With Volunteers R2 (in %) STR SqTR R2 (in %) STR SqTR
Central Eastern Kasungu 55.0 83 89 56.0 80 85 Nkhotakota 75.0 84 90 74.2 81 86 Dowa 49.0 89 96 49.0 86 93 Ntchisi 40.3 72 83 40.3 68 79 Salima 56.5 87 97 56.4 80 92
Central Western Mchinji 73.7 86 92 74.2 84 87 Lilongwe City 61.5 44 46 61.5 44 46 Lilongwe Rural East 66.2 101 108 66.8 98 102 Lilongwe Rural West 43.8 79 83 44.2 78 81 Dedza 28.2 110 120 38.1 96 113 Ntcheu 43.9 102 111 47.4 89 104
Northern Chitipa 56.4 68 73 47.5 61 70 Karonga 77.3 78 82 72.9 70 79 Rumphi 82.6 63 69 83.6 53 64 Mzimba North 54.2 86 91 55.9 74 87 Mzimba South 53.6 80 85 53.3 74 81 Mzuzu City 91.4 44 45 91.4 44 45 Nkhata Bay 52.7 95 102 50.7 78 96 Likoma 93.6 51 54 93.8 49 51
Shire Highlands Chiradzulu 33.8 86 90 33.8 86 87 Thyolo 52.9 100 104 53.7 99 101 Mulanje 55.9 110 114 55.9 109 110 Phalombe 55.7 135 138 55.7 135 136
Southern Eastern Mangochi 67.9 129 135 70.2 110 132 Balaka 54.7 94 102 57.2 85 97 Machinga 41.5 117 122 44.3 109 118 Zomba Urban 85.8 37 38 85.8 37 38 Zomba Rural 41.5 107 117 48.4 91 111
Southern Western Blantyre City 57.7 50 51 57.7 50 51 Blantyre Rural 71.1 71 77 71.9 68 73 Mwanza 48.2 82 86 55.7 72 83 Chikwawa 53.0 130 136 52.9 114 131 Nsanje 65.4 116 126 66.7 98 120 Neno 69.4 89 98 67.6 83 93
Source:�EMIS�2007.�

252 World Bank Working Paper
�
Table 4A.7: Consistency in Book Allocation across Government-Funded Primary Schools, by Divisions: R2 Analysis
Std1 Std2 Std3 Std4 Std5 Std6 Std7 Std8 English Northern 2.6 24.9 27.2 30.9 36.6 25.8 41.7 24.7 Central Eastern 0.9 13.6 12.9 14.4 14.1 15.3 22.9 18.0 Central Western 0.4 22.9 29.7 31.9 35.4 34.0 35.3 21.7 South Eastern 0.4 19.7 19.5 24.1 21.8 20.4 12.8 12.6 South Western 3.4 27.2 37.8 56.1 56.3 36.3 38.2 34.4 Shire Highlands 0.3 16.5 11.8 13.0 14.6 23.2 18.7 23.7 Chichewa Northern 2.4 24.3 16.7 32.4 43.6 44.6 48.1 41.6 Central Eastern 1.7 13.4 13.4 17.6 22.6 14.2 20.6 21.1 Central Western 0.5 19.8 28.9 25.9 34.3 32.3 28.4 22.5 South Eastern 0.6 16.7 22.9 21.2 30.9 34.2 37.0 18.2 South Western 5.2 28.2 41.3 54.7 49.9 42.6 42.4 35.7 Shire Highlands 0.4 13.0 15.3 11.4 14.4 23.0 20.0 15.2 Mathematics Northern 2.5 18.2 22.7 36.5 34.0 35.1 21.1 27.0 Central Eastern 0.8 9.8 12.6 13.7 15.4 20.9 24.3 22.9 Central Western 0.4 14.3 29.9 29.3 26.6 30.5 26.6 21.9 South Eastern 0.5 13.8 17.5 18.6 19.1 28.5 14.9 18.0 South Western 5.0 30.1 36.7 58.9 60.1 50.1 46.1 40.3 Shire Highlands 0.4 13.1 10.5 10.8 16.0 23.1 18.8 21.5
Source:�EMIS�2007.��

The Education System in Malawi 253
�
Appendix 4.5: Teacher Training
At the Primary Level
Malawi�has�experienced�a�few�modes�of�training�teachers�over�the�years.�Historically,�up�to�1994,�teacher�training�for�primary�schools�was�a�two�year�pre�service�program�at�a� Teacher� Training� College� (TTC)� and� all� prospective� teachers� had� to� undergo� this�training� before� being� engaged� to� teach.� However� there� was� the�MASTEP� (Malawi�Special� Teacher� Education� Programme)� which� used� to� train� teachers,� using� the�distance�mode,�at�that�same�time.�The�MASTEP�trained�a�teacher�for�three�years�so�that�by� the� end� of� the� training� period� a�MASTEP�trained� teacher� had� covered� the� same�syllabus� as� the� ones� who� were� training� for� two� years� in� a� residential� mode.� The�MASTEP�teacher�was�being�trained�while�on�the�job.�
The�one�year�teacher�training�program�came�into�being�in�1993�to�replace�both�the�two�year� training�and�the�MASTEP,�and�was�run�up�until�1997.�The�objective�was�to�increase� qualified� teacher� numbers� since� teachers� would� be� produced� annually.�However,� this� did� not� pay� off� because� of� the� sudden� introduction� of� free� primary�education� (FPE)� in� 1994,� which� increased� enrollment� to� about� 3.2� million.� A� new�program�was�designed� to�accelerate� teacher� training� to�meet� the�enrollment�boom�of�the� FPE.� This� was� called� MIITEP,� the� Malawi� Integrated� In�service� Teacher�Education�Program.�
Twenty�two�thousand�temporary�teachers�were�recruited�to�be�trained�on�the�job�before�they�could�be�engaged�as�full�time�teachers.�This�training�was�partly�residential�but� more� time� was� devoted� to� distance� learning� while� on� the� job.� Initially,� three�cohorts� of� students�went� through� the� residential� training� in� a� year,�which�was� later�reduced�to�two�in�the�year�2000�due�to�concerns�with�quality.�
In� 2006,� the� Ministry� of� Education� introduced� an� improved� mode� of� training�teachers.� This� was� called� the� 1+1� model� or� the� Initial� Primary� Teachers� Education�Programme�(IPTE).�This�meant�that�trainees�would�be�one�year�in�a�TTC�followed�by�another�one�year�hands�on�in�a�school�under�supervision�by�all�the�stakeholders�(eg.,�the� head� teachers,� mentor� teachers,� PEAs,� college� lecturers� and� ministry� officials).�Mentorship� is�another�component�of� the�IPTE�program.�Student�teachers�are�assisted�by� trained� mentor� teachers� in� the� second� year� of� their� training.� This� is� the� current�training�mode�of�teachers.�The�new�distance�mode�of�training�primary�school�teachers,�to�start�in�2009,�will�be�a�two�and�a�half�year�program.�
The�recruitment�of� trainee�primary�school� teachers� is�done�by�the�Department�of�Teacher�Education�and�Development�(DTED)�in�liaison�with�the�department�of�Human�Resource� Management� and� Development� in� the� Ministry� of� Education.� The�appointment�and�disciplinary�committee�in�the�ministry�selects�student�teachers�using�an�aptitude� test.�The�requirements� for� selection�are� that�candidates�should�posses�an�MSCE�with�a� credit�pass� in�English� and�a�pass� in�Mathematics� and�any�one�Science�subject;�be�not�more�than�35�years�of�age;�be�ready�to�work�in�the�rural�areas�;�and�pass�an�aptitude�test�in�numerical,�communication,�and�reasoning�skills.�
The�IPTE�is�mostly�carried�out�in�the�five�public�and�four�private�primary�teacher�training�institutions.�During�the�training,�student�teachers�get�an�upkeep�allowance�of�MK1,500.00� per� month� during� the� college�based� phases� and�MK5,000.00� per� month�
254 World Bank Working Paper
�
during�the�school�based�phases.�These�allowances�are�paid�by�colleges�from�their�ORT.�The�student�teachers�are�also�assisted�professionally�by�trained�mentor�teachers�during�the�field�phase.�The�allowance�for�the�field�phase�is�not�adequate�considering�the�rise�in�the�prices�of�commodities.�(There�is�aneed�to�review�it.)�
From�next�year,�October�2009,�the�total�number�of�student�teachers�to�be�recruited�will� be� 4,290.� This�will� be� after� the� completion� of� Liwonde� TTC� first� phase� and� the�expansion� of� St.� Josephs� TTC.� The� conventional� mode� of� IPTE� training� has� a� non�residential� progam� component� where� 500� student� teachers� find� their� own�accommodations�outside�of�the�campus.�However,�they�enjoy�the�same�privileges�the�residential� student� teachers� do� (e.g.,� meals� at� the� college,� teaching� and� learning�materials).� After� qualifying� from� the� TTCs,� these� teachers� sign� a� bond� before� being�deployed�to�teach�in�the�rural�areas�for�a�period�of�not�less�than�five�years.��
In� 2009,� the� ministry� will� introduce� the� effective� training� of� primary� school�teachers� through�distance�mode.�The�decision� to� start� this�mode�of� training� teachers�was�arrived�at�after�realizing�that�the�rate�of�teacher�production�cannot�match�the�loss.�The�current�TTCs�do�not�have�sufficient� capacity� to�produce� the� required�number�of�teachers�to�meet�the�projected�target�of�1:60�by�2017.�The�intake�for�the�program�will�be�4,000�student� teachers.�Each�student� teacher�will�be�attached�to�a�study�center� /�TDC�and�a�college.�Two�hundred�study�center�supervisors�will�be�recruited�for�the�program.�Recruitment�of�open�and�distance�learning�(ODL)�student�teachers�will�be�done�locally,�targeting�those�schools�that�have�acute�shortage�of�teachers.�By�2012,�the�ministry�will�have�recruited�12,000�student� teachers� through�the�program�in�addition�to� the�yearly�output�of�4,000�teachers�through�the�conventional�mode�from�2011.�
All�trained�teachers�are�expected�to�perform�and�are�all�subjected�to�CPD.�How�the�teacher� is� trained�only�depends�on�when� that� teacher�to�be�was� recruited�and�under�what�conditions.��
At the Secondary Level
Secondary�school� teachers�are� trained�at�diploma�and�degree� level.�At�diploma�level,�they�are�trained�at�Domasi�College�of�Education�which�also�started�offering�Bachelor�of�Education� degree� in� primary� education.� The� diploma� program� is� offered� as� a�preservice� through� conventional� and� distance� mode� of� training.� The� distance� mode�targets� under� qualified� teachers� teaching� in� CDSSs.� The� University� of� Malawi� and�Mzuzu�University�are�the�main�providers�of�degree�programs.�
The� ministry� of� Education� on� the� other� hand� piloted� a� program� called�Strengthening� Mathematics� and� Science� in� Secondary� Education� (SMASSE).� This�program�was�introduced�to�remedy�the�low�achievements�of�students�in�mathematics�and�science.�It�was�piloted�from�2004�to�2007�in�the�South�Eastern�Education�division.�On�the�basis�of�the�achievements�of�the�program,�SMASSE�is�now�being�rolled�out�to�the� remaining� divisions.� The� second� phase� will� run� from� 2008� to� 2012� and� each�division�will� have� three� INSET.� Although� the�main� focus� of� this� intervention� is� the�teacher,�the�main�target�is�the�learner�in�the�classroom.�
Other�upgrading�courses�for�teachers�in�Malawi:�
� Domasi�College�of�Education� is�running�three�programs�aimed�at� improving�the�number�of�qualified�teachers�at�secondary�school�level:��
The Education System in Malawi 255
�
� 220� under�qualified� teachers� are� admitted� to� upgrade� to� diploma� level�every� year� in� subjects� of� their� choice� through� distance� mode� and�residential�sessions�at�Domasi�College�of�Education.�
� 220� students� are� admitted� to� the� normal� entry� program� every� year� to�study�for�a�diploma�in�education�in�subjects�of�their�choice.�Out�of�these,�60�percent�are�recruited�from�serving�primary�school�teachers.�
� Up� to� 400� under�qualified� teachers� will� be� trained� to� diploma� level� in�science� subjects� over� the� next� three� years�with� funding� from� the�Africa�Development�Fund.�
� Bachelor� of� Education� degree� in� primary� introduced� at� Domasi� College� of�Education� to� reduce� teacher� shortage� in� TTCs.� This� targets� qualified� T2�teachers�and�secondary�school�graduates.�
� An�upgrading�course�at�Chancellor�College�for�TTC�lecturers�with�diplomas�to�bachelors�degree.�This�is�supported�by�the�Scottish�government.�
� Masters� degree� program� for� 19� TTC� lecturers,� including� two� DTED� staff�through�Open�and�Distance�Learning,�sponsored�by�UNESCO�through�Indira�Ghandi�National�Open�University.��
At�the�secondary�school�level,�CPD�is�organized�at�cluster�level.����
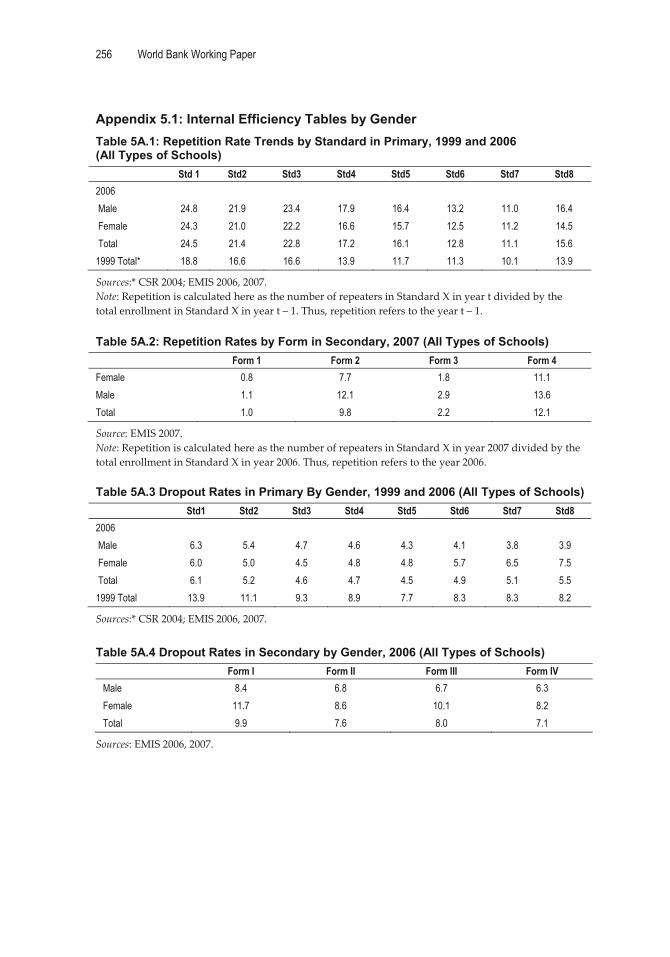
256 World Bank Working Paper
�
Appendix 5.1: Internal Efficiency Tables by Gender Table 5A.1: Repetition Rate Trends by Standard in Primary, 1999 and 2006 (All Types of Schools)
Std 1 Std2 Std3 Std4 Std5 Std6 Std7 Std8 2006 Male 24.8 21.9 23.4 17.9 16.4 13.2 11.0 16.4 Female 24.3 21.0 22.2 16.6 15.7 12.5 11.2 14.5 Total 24.5 21.4 22.8 17.2 16.1 12.8 11.1 15.6 1999 Total* 18.8 16.6 16.6 13.9 11.7 11.3 10.1 13.9
Sources:*�CSR�2004;�EMIS�2006,�2007.�Note:�Repetition�is�calculated�here�as�the�number�of�repeaters�in�Standard�X�in�year�t�divided�by�the�total�enrollment�in�Standard�X�in�year�t�–�1.�Thus,�repetition�refers�to�the�year�t�–�1.���Table 5A.2: Repetition Rates by Form in Secondary, 2007 (All Types of Schools)
Form 1 Form 2 Form 3 Form 4 Female 0.8 7.7 1.8 11.1 Male 1.1 12.1 2.9 13.6 Total 1.0 9.8 2.2 12.1
Source:�EMIS�2007.�Note:�Repetition�is�calculated�here�as�the�number�of�repeaters�in�Standard�X�in�year�2007�divided�by�the�total�enrollment�in�Standard�X�in�year�2006.�Thus,�repetition�refers�to�the�year�2006.���Table 5A.3 Dropout Rates in Primary By Gender, 1999 and 2006 (All Types of Schools)
Std1 Std2 Std3 Std4 Std5 Std6 Std7 Std8 2006 Male 6.3 5.4 4.7 4.6 4.3 4.1 3.8 3.9 Female 6.0 5.0 4.5 4.8 4.8 5.7 6.5 7.5 Total 6.1 5.2 4.6 4.7 4.5 4.9 5.1 5.5 1999 Total 13.9 11.1 9.3 8.9 7.7 8.3 8.3 8.2
Sources:*�CSR�2004;�EMIS�2006,�2007.�
�Table 5A.4 Dropout Rates in Secondary by Gender, 2006 (All Types of Schools)
Form I Form II Form III Form IV Male 8.4 6.8 6.7 6.3 Female 11.7 8.6 10.1 8.2 Total 9.9 7.6 8.0 7.1
Sources:�EMIS�2006,�2007.��

The Education System in Malawi 257
�
Appendix 5.2: Disparities
�
Figure 5A.1: Urban Completion Rate/Rural Completion Rate for Lower Secondary in Some African Countries (ca. 2007)
0
2
4
6
8
10
12
14
16
18
20
Ghana
Nigeria
Côte d'
IvoireKen
ya
Congo
, Dem
. Rep
. of
Leso
thoBen
inTo
go
The G
ambia
Ugand
a
Zambia
Congo
, Rep
.
Sierra
Leon
e
Malawi
Maurita
nia
Guinea
Camero
on Mali
Seneg
al
Rwanda
Burund
i
Burkina
FasoCha
d
Mozam
bique
Ethiop
ia
Centra
l Afric
an R
epub
licNige
r
Guinea
-Biss
au
Average = 5.2
Per
cent
�
Sources:�Calculation�from�MICS�2006�for�Malawi,�World�Bank�data�base�for�other�countries.���

258 World Bank Working Paper
�
Table 5A.5: GER and PCR for the 28 Administrative Districts (2007) Boys Girls Total GER PCR GER PCR GER PCR
North Chitipa 159 88 134 66 146 76 Karonga 134 62 126 47 130 54 Rumphi 157 81 165 80 161 81 Mzimba 136 67 131 55 134 61 Mzuzu 98 53 102 56 100 55 Nkhatabay 136 75 135 63 136 69 Likoma 112 50 120 62 116 57 Central East Ntchisi 100 36 113 38 107 37 Nkhotakota 111 42 106 32 109 37 Salima 85 29 85 23 85 26 Dowa 110 35 117 33 114 34 Kasungu 119 45 129 40 124 42 Central West Mchinji 102 35 103 28 102 31 Lilongwe 88 31 92 26 90 29 Dedza 83 21 86 18 85 20 Ntcheu 111 40 115 36 113 39 South East Mangochi 79 22 81 17 80 20 Balaka 116 41 113 31 115 37 Machinga 90 26 91 19 90 22 Zomba 93 34 94 28 94 31 South West Nsanje 119 51 114 27 116 39 Chikwawa 96 38 93 21 95 30 Blantyre 77 38 78 34 77 39 Mwanza 117 39 121 28 119 33 Shire Highlands Phalombe 102 32 106 25 104 29 Mulanje 94 33 98 27 96 30 Thyolo 101 35 103 26 102 31 Chiradzulu 110 43 112 36 111 39
Sources:�Calculation�from�EMIS�2007�and�UN�population�estimates.���

The Education System in Malawi 259
�
Table 5A.6: Leaving School Examination Results at the Primary Level by School Types, Location, Division and Gender (2006)
Sat (%) Passed (%) Male Female Total Male Female Total
School status Government 94.3 93.4 93.9 78.0 70.8 74.9 Religious 93.5 92.3 93.0 77.0 67.1 72.7 Public 93.8 92.7 93.3 77.3 68.4 73.5 Private 95.1 95.1 95.1 82.9 81.0 82.0 Location Urban 97.8 97.5 97.7 90.0 86.9 88.5 Rural 93.3 92.1 92.8 75.9 65.8 71.6 Division Northern 92.4 91.4 91.9 67.9 59.0 64.1 Central Eastern 93.6 86.9 90.5 71.0 59.7 66.0 Central Western 94.1 93.9 94.0 85.0 78.2 82.0 South Eastern 92.4 94.9 93.5 79.2 70.9 75.6 South Western 96.0 95.3 95.7 82.7 76.3 80.0 Shire Highlands 95.8 97.2 96.4 84.7 72.3 79.4 Total 93.8 92.8 93.4 77.4 68.8 73.7
Source:�EMIS�2007.����Table 5A.7: JCE and MSCE Examination Pass Rates by School Types, Location, Division, and Gender (2006)
JCE pass rates MSCE pass rates Male Female Total Male Female Total
School status CSS 86.4 74.1 79.6 58.8 45.8 53.5 CDSS 63.4 41.1 54.2 39.1 20.7 33.0 Open day school 53.4 40.4 47.4 46.2 40.1 43.2 Public 69.3 50.0 61.2 46.6 33.0 41.5 Private 69.5 59.0 64.8 56.0 43.8 50.4 Location Urban 76.0 70.0 73.2 54.3 44.4 49.8 Rural 68.0 47.0 59.2 47.2 33.1 41.9 Division NED 72.3 52.8 63.7 51.0 35.9 44.9 CEED 60.0 39.0 51.3 45.4 29.4 39.4 CWED 68.4 52.5 61.4 52.2 36.7 45.8 SEED 70.1 58.2 65.0 52.0 43.4 48.5 SWED 70.3 56.0 64.2 45.0 39.7 42.9 SHED 77.6 53.7 67.6 45.6 30.2 40.0 Total 69.4 51.8 61.8 48.7 36.2 43.8
Source:�EMIS�2007.�
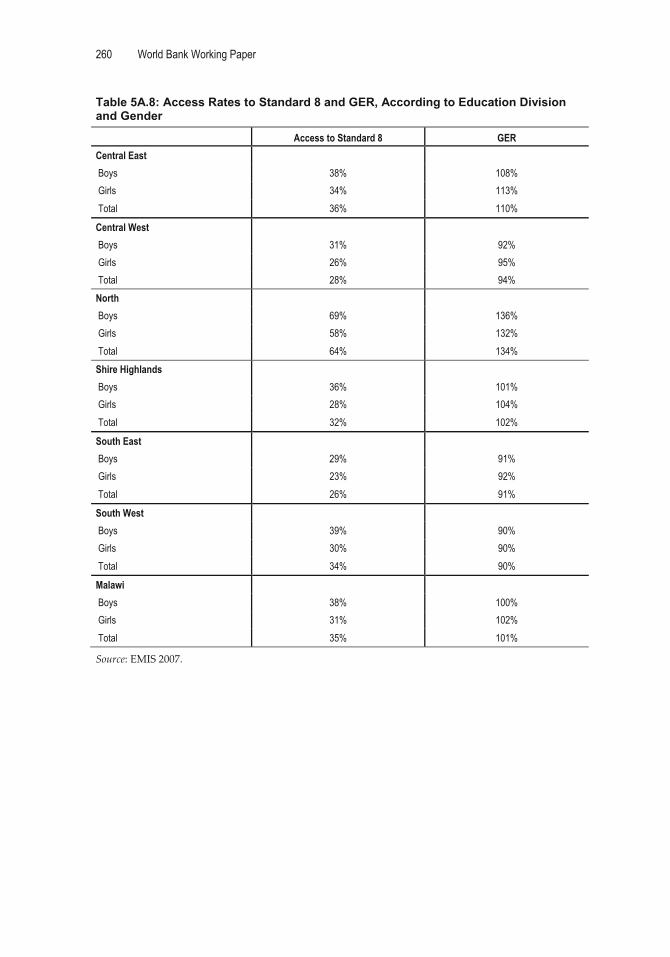
260 World Bank Working Paper
�
Table 5A.8: Access Rates to Standard 8 and GER, According to Education Division and Gender
Access to Standard 8 GER Central East Boys 38% 108% Girls 34% 113% Total 36% 110%
Central West Boys 31% 92% Girls 26% 95% Total 28% 94% North Boys 69% 136% Girls 58% 132% Total 64% 134% Shire Highlands Boys 36% 101% Girls 28% 104% Total 32% 102%
South East Boys 29% 91% Girls 23% 92% Total 26% 91%
South West Boys 39% 90% Girls 30% 90% Total 34% 90%
Malawi Boys 38% 100% Girls 31% 102% Total 35% 101%
Source:�EMIS�2007.��
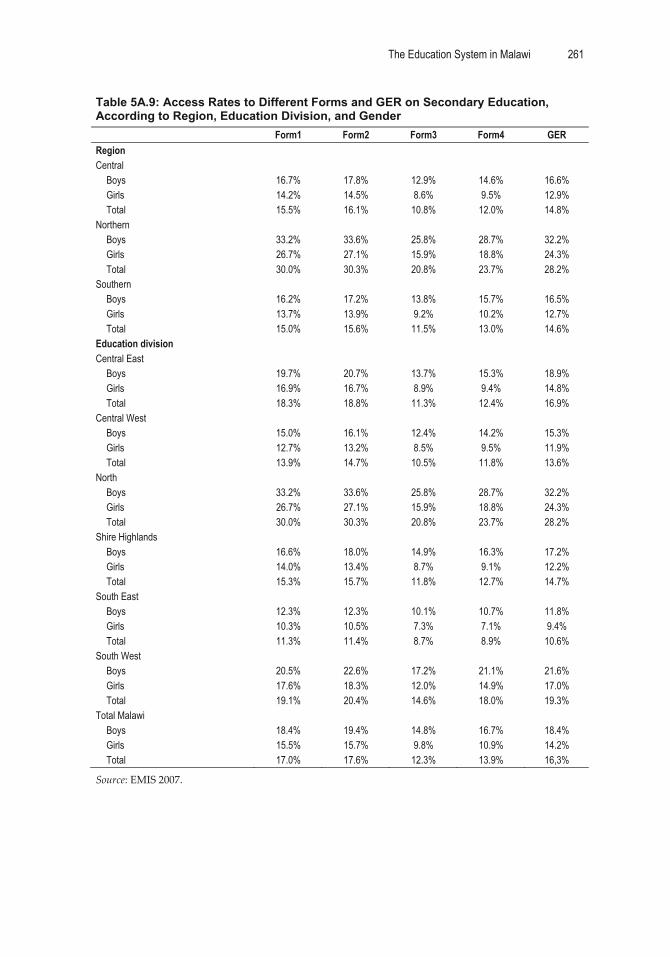
The Education System in Malawi 261
�
Table 5A.9: Access Rates to Different Forms and GER on Secondary Education, According to Region, Education Division, and Gender
Form1 Form2 Form3 Form4 GER Region Central
Boys 16.7% 17.8% 12.9% 14.6% 16.6% Girls 14.2% 14.5% 8.6% 9.5% 12.9% Total 15.5% 16.1% 10.8% 12.0% 14.8%
Northern Boys 33.2% 33.6% 25.8% 28.7% 32.2% Girls 26.7% 27.1% 15.9% 18.8% 24.3% Total 30.0% 30.3% 20.8% 23.7% 28.2%
Southern Boys 16.2% 17.2% 13.8% 15.7% 16.5% Girls 13.7% 13.9% 9.2% 10.2% 12.7% Total 15.0% 15.6% 11.5% 13.0% 14.6%
Education division Central East
Boys 19.7% 20.7% 13.7% 15.3% 18.9% Girls 16.9% 16.7% 8.9% 9.4% 14.8% Total 18.3% 18.8% 11.3% 12.4% 16.9%
Central West Boys 15.0% 16.1% 12.4% 14.2% 15.3% Girls 12.7% 13.2% 8.5% 9.5% 11.9% Total 13.9% 14.7% 10.5% 11.8% 13.6%
North Boys 33.2% 33.6% 25.8% 28.7% 32.2% Girls 26.7% 27.1% 15.9% 18.8% 24.3% Total 30.0% 30.3% 20.8% 23.7% 28.2%
Shire Highlands Boys 16.6% 18.0% 14.9% 16.3% 17.2% Girls 14.0% 13.4% 8.7% 9.1% 12.2% Total 15.3% 15.7% 11.8% 12.7% 14.7%
South East Boys 12.3% 12.3% 10.1% 10.7% 11.8% Girls 10.3% 10.5% 7.3% 7.1% 9.4% Total 11.3% 11.4% 8.7% 8.9% 10.6%
South West Boys 20.5% 22.6% 17.2% 21.1% 21.6% Girls 17.6% 18.3% 12.0% 14.9% 17.0% Total 19.1% 20.4% 14.6% 18.0% 19.3%
Total Malawi Boys 18.4% 19.4% 14.8% 16.7% 18.4% Girls 15.5% 15.7% 9.8% 10.9% 14.2% Total 17.0% 17.6% 12.3% 13.9% 16,3%
Source:�EMIS�2007.��

262 World Bank Working Paper
�
Table 5A.10: Probability of Enrollment in Standards 1–8 of Primary School, by District Standard1 Standard8
North Chitipa 99% 49% Karonga 98% 48% Nkhatabay 98% 52% Rumphi 99% 56% Mzimba 99% 59%
Central Kasungu 98% 38% Nkhotakota 94% 34% Ntchisi 96% 26% Dowa 98% 35% Salima 98% 32% Lilongwe 97% 42% Mchinji 95% 33% Dedza 88% 18% Ntcheu 95% 29%
South Mangochi 92% 25% Machinga 92% 24% Zomba 97% 38% Chiradzulu 98% 42% Blantyre 97% 57% Mwanza 96% 32% Thyolo 95% 27% Mulanje 97% 34% Phalombe 94% 22% Chikwawa 93% 30% Nsanje 91% 33% Balaka 97% 35%
Source:�Calculation�from�MICS�2006�database��

The Education System in Malawi 263
�
Table 5A.11: Probability of Enrollment in Forms 1–4 of Secondary School, by District Form1 Form2 Form3 Form4
North Chitipa 33% 26% 9% 4% Karonga 35% 31% 21% 14% Nkhatabay 34% 23% 11% 6% Rumphi 43% 25% 16% 9% Mzimba 45% 36% 24% 15%
Central Kasungu 23% 22% 15% 10% Nkhotakota 22% 16% 12% 7% Ntchisi 17% 14% 8% 5% Dowa 19% 15% 10% 8% Salima 14% 14% 11% 8% Lilongwe 33% 29% 25% 17% Mchinji 19% 14% 9% 5% Dedza 11% 10% 7% 7% Ntcheu 24% 18% 11% 6%
South Mangochi 15% 17% 13% 12% Machinga 11% 6% 3% 2% Zomba 28% 26% 15% 7% Chiradzulu 34% 24% 13% 6% Blantyre 47% 46% 33% 30% Mwanza 26% 18% 11% 7% Thyolo 19% 18% 13% 10% Mulanje 23% 16% 11% 7% Phalombe 14% 12% 8% 5% Chikwawa 18% 19% 16% 9% Nsanje 26% 19% 12% 8% Balaka 29% 14% 7% 4%
Sources:�Calculation�from�MICS�2006�database.��
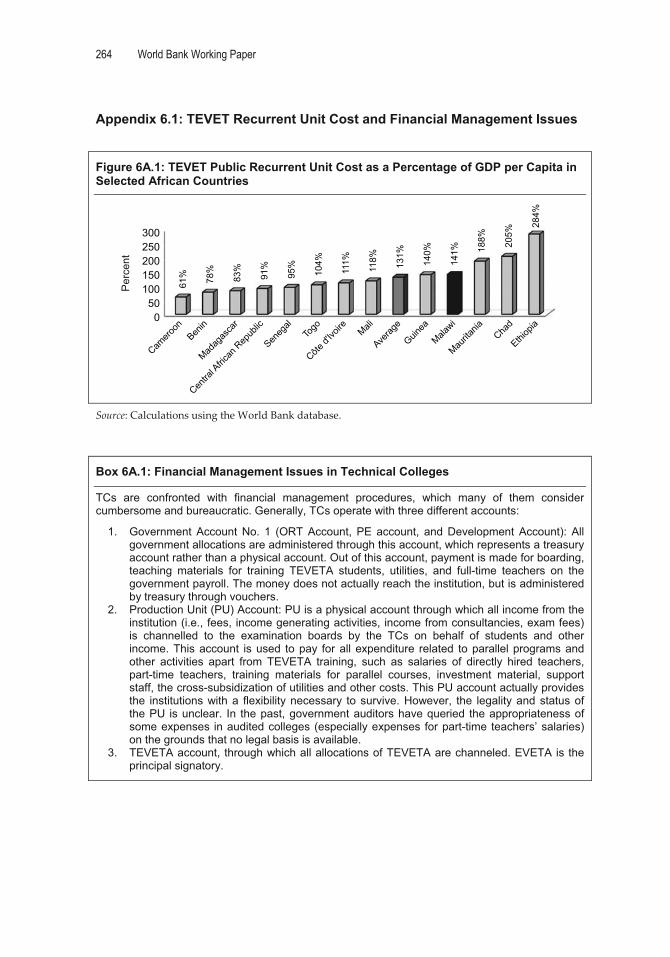
264 World Bank Working Paper
�
Appendix 6.1: TEVET Recurrent Unit Cost and Financial Management Issues
�
Figure 6A.1: TEVET Public Recurrent Unit Cost as a Percentage of GDP per Capita in Selected African Countries
050
100150200250300
61% 78%
83%
91%
95%
104%
111%
118% 131%
140%
141% 18
8% 205%
284%
Per
cent
Côte d'
Ivoire
Benin
Togo
Averag
e
Malawi
Maurita
nia
Guinea
Camero
on Mali
Seneg
alCha
d
Madag
asca
r
Ethiop
ia
Centra
l Afric
an R
epub
lic
�
Source:�Calculations�using�the�World�Bank�database.���
Box 6A.1: Financial Management Issues in Technical Colleges
TCs are confronted with financial management procedures, which many of them consider cumbersome and bureaucratic. Generally, TCs operate with three different accounts:
1. Government Account No. 1 (ORT Account, PE account, and Development Account): All government allocations are administered through this account, which represents a treasury account rather than a physical account. Out of this account, payment is made for boarding, teaching materials for training TEVETA students, utilities, and full-time teachers on the government payroll. The money does not actually reach the institution, but is administered by treasury through vouchers.
2. Production Unit (PU) Account: PU is a physical account through which all income from the institution (i.e., fees, income generating activities, income from consultancies, exam fees) is channelled to the examination boards by the TCs on behalf of students and other income. This account is used to pay for all expenditure related to parallel programs and other activities apart from TEVETA training, such as salaries of directly hired teachers, part-time teachers, training materials for parallel courses, investment material, support staff, the cross-subsidization of utilities and other costs. This PU account actually provides the institutions with a flexibility necessary to survive. However, the legality and status of the PU is unclear. In the past, government auditors have queried the appropriateness of some expenses in audited colleges (especially expenses for part-time teachers’ salaries) on the grounds that no legal basis is available.
3. TEVETA account, through which all allocations of TEVETA are channeled. EVETA is the principal signatory.
�

The Education System in Malawi 265
�
Appendix 6.2: Other TEVET Indicators
�Table 6A.1: Number of Regular and Parallel Students in Technical Colleges (2007)
Regular Students Parallel Students Total College Male Female Total Male Female Total Soche 94 61 155 192 88 280 435 Namitete 35 38 73 50 94 144 217 Lilongwe 425 149 574 1,253 461 1,714 2,288 Livingstonia 113 63 176 160 12 172 348 Mzuzu 168 68 236 195 55 250 486 Nasawa 72 32 104 190 59 249 353 Salima 381 111 492 139 49 188 680 Total 1,288 522 1,810 2,179 818 2,997 4,807 in% 37.65 62.35 100.00
Source:�Malawi�Education�Statistics�2007.���Table 6A.2: Records of the TEVET Provider Directory 1999 Type of Institution Number of Recorded Institutions Total Enrollment Not classified 1 — Church/religious organization 19 900 Community development program 3 152 Government institution 16 3,870 Grant-aided institution 4 31 In-company 2 204 In-company training center 1 72 Independent NGO 6 448 NGO affiliate 4 670 Parastatal 11 8,258 Parastatal/ government trust 1 500 Private commercial institution 101 7,835 Total 169 22,940
Source:�TEVET�Provider�Directory�Database�1999.���Table 6A.3: Enrollment in Regular Apprenticeship Programs (2003–2007)
Year Total Enrollment 2003 1,036 2004 790 2005 817 2006 1,076 2007 1,330
Source:�TEVETA.��Note:�Figures�represent�total�enrollment�in�regular�apprenticeship�system�without�students�enrolled�in�Phwezi�Technical�College�and�in�Press�Trust�Printing�College.���

266 World Bank Working Paper
�
Table 6A.4: Female Participation in TEVETA-Sponsored Courses by Applications, Short Listing, and Enrollment from 2001 to 2008
Year Female
Applicants % of Total Applicants
Females Short- Listed
% of Total Shortlisted
Females Enrolled
% of Total Enrolled
2001 65 28.9 2002 1,472 15.0 472 17.8 50 22.3 2003 1,265 17.0 162 16.5 46 20.9 2004 1,771 18.7 537 15.6 82 31.4 2005 2,178 20.8 688 22.4 88 28.2 2006 3,063 22.8 1,909 31.0 243 31.6 2007 1,593 18.5 955 18.4 209 28.6 2008 1,583 17.6 1,222 24.9 205 29.4
Source:�TEVETA.��Table 6A.5: Girls’ Participation in Malawi Craft and Malawi Advanced Craft Examinations (in %)
Year Malawi Craft Malawi Advanced Craft Combined 2003 10.4 11.0 11 2004 12.9 10.6 12 2005 16.8 10.8 15 2006 22.9 15.6 20 2007 24.9 18.7 23
Source:�Malawi�National�Examinations�Board.��Table 6A.6: Expenditure in Public Technical Colleges 2007/08 (Revised Budgeted) by Subprograms (in %)
Subprograms Llgwe Soche Mzuzu Namitete Livngst Salima Nasawa Average 02: Mgmt & support services (incl. PE) 68.0 50.2 67.9 54.6 27.3 82.6 57.8 56.6 06: Staff development 3.3 8.0 0.1 0.0 3.2 0.0 3.3 2.8 15: HIV/AIDS intervention 0.4 1.3 0.0 0.0 4.5 15.8 0.0 3.3 19: Special needs 1.3 0.2 26: Sports & culture 0.8 1.8 0.3 30: Boarding & feeding 15.6 25.3 24.9 35.4 18.6 0.0 25.1 19.6 31: Teaching services 12.7 13.0 5.3 10.0 46.4 1.6 13.8 17.3 Total 100 100 100 100 100 100 100 100 of which PE 48.8 40.2 39.6 30.6 16.3 34.9 44.6 34.9
Source:�Government�of�Malawi,�National�Budget�(Revised)�2007/08.�Note:�Substantial�differences�can�be�observed�by�college,�mainly�because:�� Colleges�attribute�costs�to�subprograms�in�different�ways.�In�the�Salima�TC�budget,�for�example,�
costs�related�to�boarding�and�feeding�were�included�in�the�subprogram�15�(HIV/AIDS).�� Colleges�use�their�income�from�other�sources�(see�below)�for�different�purposes.�Notably,�the�PE�
budget�depends�on�the�posts�that�are�actually�filled.�If�this�rate�is�low�(typically�in�more�rural�locations),�additional�staff�are�recruited�directly�by�the�college�and�paid�out�of�the�PU�(own�income)�account,�which�is�not�reflected�in�the�government�budget.��
� First�budget�prepared�under�education,�which�follows�other�classification���confusion��

The Education System in Malawi 267
�
Table 6A.7: Budget Execution Rates for Technical Colleges (2005/06) Execution Rate PE Execution Rate ORT Combined Execution Rate
Nasawa 44.5 53.3 50.0 Lilongwe 67.2 56.3 60.1 Livingstonia 127.2 69.9 89.9 Mzuzu 68.1 47.0 55.0 Salima 71.8 73.9 73.1 Average 73.0 59.7 64.5 Source:�Government�of�Malawi,�Budget�(Revised)�2007/08.��Table 6A.8: TEVETA Expenditure 2002/03–2006/7, in ’000 MK
2002/03 2003/04 2004/05 2005/06 2006/07 Private sector training 3,295 10,216 11,391 17,444 42,355 Apprenticeship & other training 24,617 24,642 41,598 54,997 71,151 Informal sector outreach program 4,401 9,945 12,888 17,082 8,456 Quality assurance services 7,510 17,735 18,944 31,178 36,004 IEC activities 3,866 8,676 13,785 5,124 11,735 Planning, monitoring & evaluation 1,259 4,754 11,456 17,198 15,599 TEVETA Secretariat 45,753 68,910 79,049 88,831 96,434 Regional service centers 26,090 27,123 24,906 29,465 30,429 Fund management 4,035 9,284 17,855 18,954 25,069 Total expenditure 120,826 181,285 231,871 280,272 337,232 Source:�TEVETA�Secretariat.�Note:�TEVETA�expenditure�is�divided�into�(1)�funding�and�subsidies�for�training�activities,�(2)�funding�of�TEVETA’s�regulatory�function�of�the�TEVET�system,�and�(3)�funding�of�governance�and�administration.��Expenses�for�training�activities:��� Cost�of�Apprenticeship�training:�Divided�into�(1)�training�material�subsidies�to�Technical�Colleges�
providing�apprenticeship�training,�tuition�for�each�apprentice�payable�to�the�TCs,�bursaries�for�needy�students,�and�occasionally�support�to�the�capital�cost�of�TCs.�Note�that�this�budget�line�only�covers�TEVETA�administered�apprentices�(annual�intake�760�at�the�moment),�and�not�trainees�in�the�parallel�programs.�
� Private�sector�training�program:�The�program�entitles�levy�paying�private�companies�to�a�reimbursement�of�33�percent�of�their�total�training�cost,�while�the�upper�ceiling�is�total�training�cost�up�to�the�total�amount�paid�as�levy.�This�means,�employers�can�recover�up�to�33�percent�of�their�levy�payment�through�this�scheme.�The�short�term�training�costs�of�employers�to�upgrade�their�own�workforce�are�eligible.�In�2006/07,�a�total�of�MK11.5�million�was�reimbursed�to�companies,�representing�around�30�claims.�The�program�is�structured�into�three�windows:�a�company�specific�private�sector�training�program,�common�tailor�made�private�sector�programs,�and�a�private�sector�training�program�through�associations.��
� Informal�sector�training:�In�this�program,�TEVETA�funds�tailor�made�training�to�informal�sector�operators�and�workers.��
Expenses�for�TEVET�system�regulation:�� Quality�Assurance:�costs�related�to�assessment,�certification,�registration�of�training�providers�(in�
future�also�accreditation),�standard�setting,�curriculum�development,�and�verification.�� Planning,�monitoring,�evaluation,�research,�information�and�communication�
Expenses�for�TEVET�governance�and�administration�� Governance:�Including�salaries�of�TEVETA�staff,�both�at�central�(TEVETA�Secretariat)�level�and�in�
the�regional�service�centers,�administrative�costs,�and�cost�related�to�the�TEVETA�Board.�� Finance:�Mainly�the�administration�cost�of�the�levy�and�finance�department�(without�salaries)�of�
TEVETA�finance�division.�This�includes�levy�collection�since�2004/05�directly�done�by�the�TEVETA�Secretariat.��
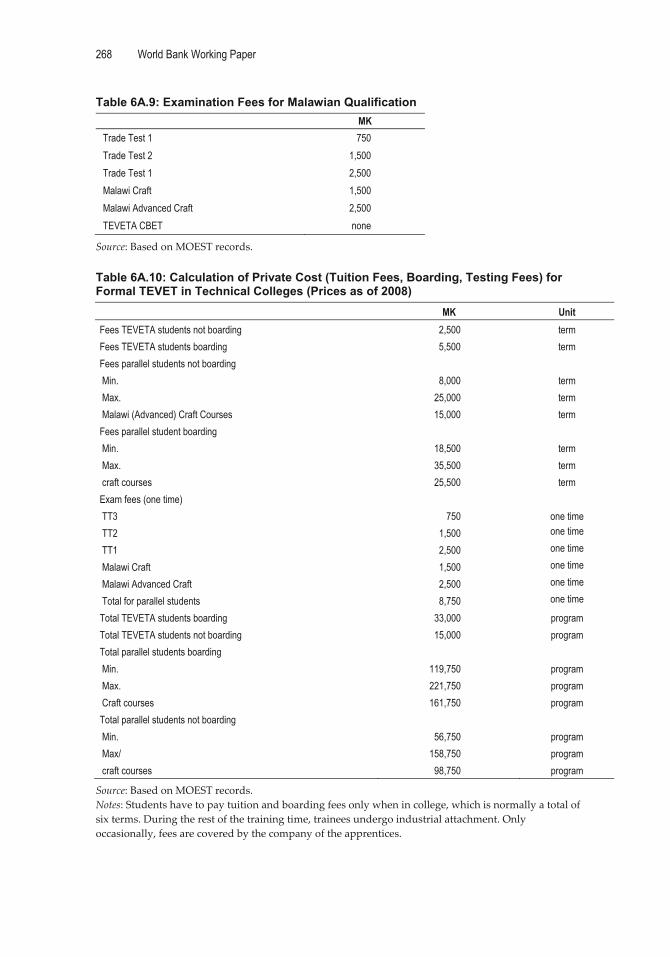
268 World Bank Working Paper
�
Table 6A.9: Examination Fees for Malawian Qualification MK
Trade Test 1 750 Trade Test 2 1,500 Trade Test 1 2,500 Malawi Craft 1,500 Malawi Advanced Craft 2,500 TEVETA CBET none
Source:�Based�on�MOEST�records.��Table 6A.10: Calculation of Private Cost (Tuition Fees, Boarding, Testing Fees) for Formal TEVET in Technical Colleges (Prices as of 2008)
MK Unit Fees TEVETA students not boarding 2,500 term Fees TEVETA students boarding 5,500 term Fees parallel students not boarding Min. 8,000 term Max. 25,000 term Malawi (Advanced) Craft Courses 15,000 term Fees parallel student boarding Min. 18,500 term Max. 35,500 term craft courses 25,500 term Exam fees (one time) TT3 750 one time TT2 1,500 one time
TT1 2,500 one time
Malawi Craft 1,500 one time
Malawi Advanced Craft 2,500 one time
Total for parallel students 8,750 one time
Total TEVETA students boarding 33,000 program Total TEVETA students not boarding 15,000 program Total parallel students boarding Min. 119,750 program Max. 221,750 program Craft courses 161,750 program Total parallel students not boarding Min. 56,750 program Max/ 158,750 program craft courses 98,750 program
Source:�Based�on�MOEST�records.�Notes:�Students�have�to�pay�tuition�and�boarding�fees�only�when�in�college,�which�is�normally�a�total�of�six�terms.�During�the�rest�of�the�training�time,�trainees�undergo�industrial�attachment.�Only�occasionally,�fees�are�covered�by�the�company�of�the�apprentices.��
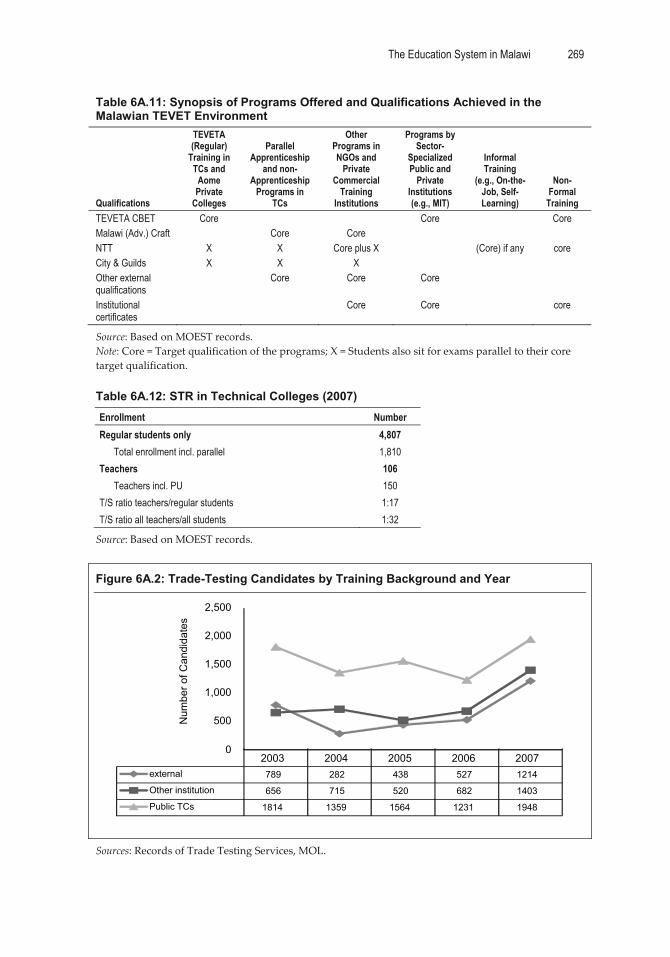
The Education System in Malawi 269
�
Table 6A.11: Synopsis of Programs Offered and Qualifications Achieved in the Malawian TEVET Environment
Qualifications
TEVETA (Regular)
Training in TCs and
Aome Private
Colleges
Parallel Apprenticeship
and non-Apprenticeship
Programs in TCs
Other Programs in NGOs and
Private Commercial
Training Institutions
Programs by Sector-
Specialized Public and
Private Institutions (e.g., MIT)
Informal Training
(e.g., On-the-Job, Self-Learning)
Non-Formal
Training TEVETA CBET Core Core Core Malawi (Adv.) Craft Core Core NTT X X Core plus X (Core) if any core City & Guilds X X X Other external qualifications
Core Core Core
Institutional certificates
Core Core core
Source:�Based�on�MOEST�records.�Note:�Core�=�Target�qualification�of�the�programs;�X�=�Students�also�sit�for�exams�parallel�to�their�core�target�qualification.��Table 6A.12: STR in Technical Colleges (2007) Enrollment Number Regular students only 4,807
Total enrollment incl. parallel 1,810 Teachers 106
Teachers incl. PU 150 T/S ratio teachers/regular students 1:17 T/S ratio all teachers/all students 1:32
Source:�Based�on�MOEST�records.��
Figure 6A.2: Trade-Testing Candidates by Training Background and Year
2003 2004 2005 2006 2007external 789 282 438 527 1214
Other institution 656 715 520 682 1403
Public TCs 1814 1359 1564 1231 1948
0
500
1,000
1,500
2,000
2,500
Num
ber o
f Can
dida
tes
�
Sources:�Records�of�Trade�Testing�Services,�MOL.��
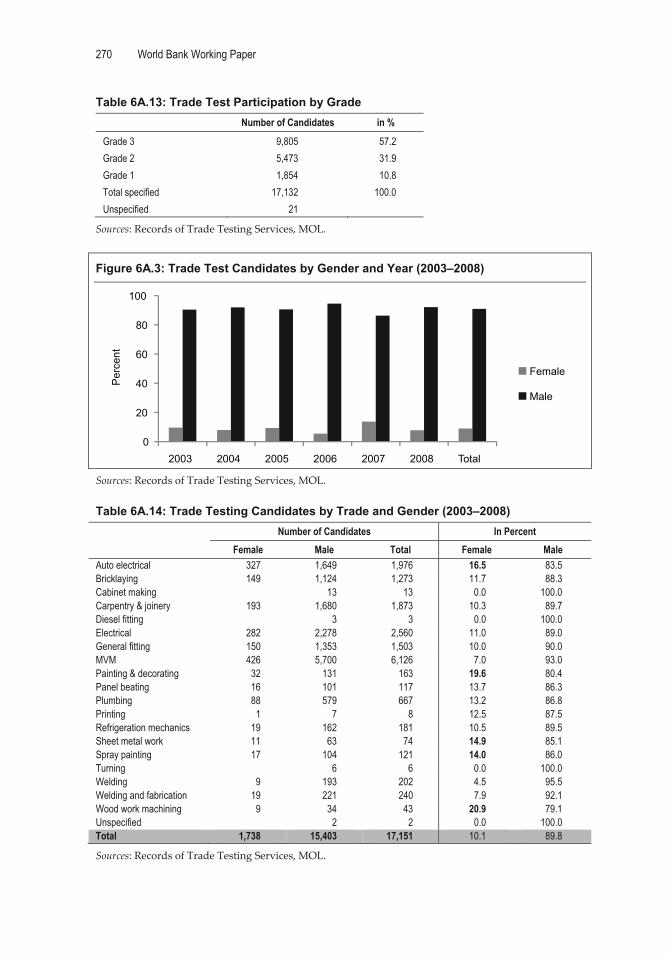
270 World Bank Working Paper
�
Table 6A.13: Trade Test Participation by Grade Number of Candidates in %
Grade 3 9,805 57.2 Grade 2 5,473 31.9 Grade 1 1,854 10.8 Total specified 17,132 100.0 Unspecified 21
Sources:�Records�of�Trade�Testing�Services,�MOL.��
Figure 6A.3: Trade Test Candidates by Gender and Year (2003–2008)
0
20
40
60
80
100
2003 2004 2005 2006 2007 2008 Total
Per
cent
Female
Male
�Sources:�Records�of�Trade�Testing�Services,�MOL.��Table 6A.14: Trade Testing Candidates by Trade and Gender (2003–2008)
Number of Candidates In Percent Female Male Total Female Male
Auto electrical 327 1,649 1,976 16.5 83.5 Bricklaying 149 1,124 1,273 11.7 88.3 Cabinet making 13 13 0.0 100.0 Carpentry & joinery 193 1,680 1,873 10.3 89.7 Diesel fitting 3 3 0.0 100.0 Electrical 282 2,278 2,560 11.0 89.0 General fitting 150 1,353 1,503 10.0 90.0 MVM 426 5,700 6,126 7.0 93.0 Painting & decorating 32 131 163 19.6 80.4 Panel beating 16 101 117 13.7 86.3 Plumbing 88 579 667 13.2 86.8 Printing 1 7 8 12.5 87.5 Refrigeration mechanics 19 162 181 10.5 89.5 Sheet metal work 11 63 74 14.9 85.1 Spray painting 17 104 121 14.0 86.0 Turning 6 6 0.0 100.0 Welding 9 193 202 4.5 95.5 Welding and fabrication 19 221 240 7.9 92.1 Wood work machining 9 34 43 20.9 79.1 Unspecified 2 2 0.0 100.0 Total 1,738 15,403 17,151 10.1 89.8
Sources:�Records�of�Trade�Testing�Services,�MOL.��
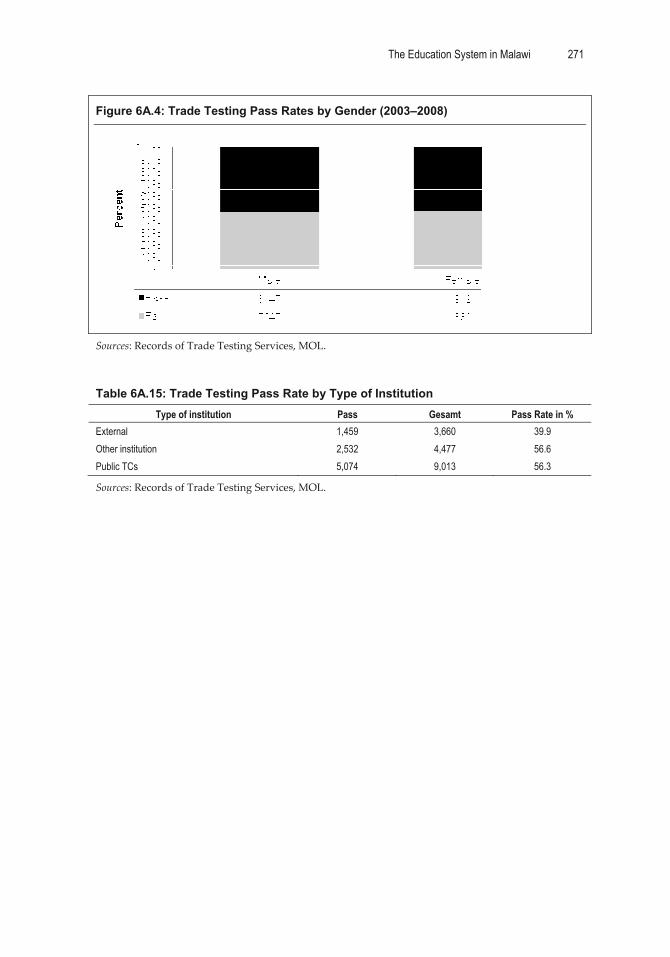
The Education System in Malawi 271
�
Figure 6A.4: Trade Testing Pass Rates by Gender (2003–2008)
�Sources:�Records�of�Trade�Testing�Services,�MOL.���Table 6A.15: Trade Testing Pass Rate by Type of Institution
Type of institution Pass Gesamt Pass Rate in % External 1,459 3,660 39.9 Other institution 2,532 4,477 56.6 Public TCs 5,074 9,013 56.3
Sources:�Records�of�Trade�Testing�Services,�MOL.����
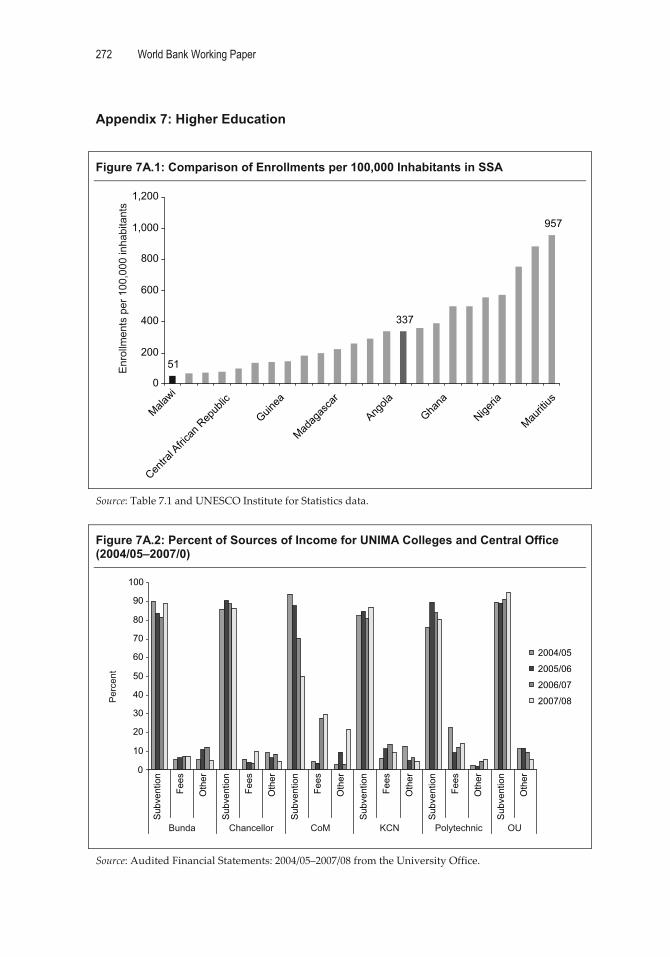
272 World Bank Working Paper
�
Appendix 7: Higher Education
�
Figure 7A.1: Comparison of Enrollments per 100,000 Inhabitants in SSA
51
337
957
0
200
400
600
800
1,000
1,200
Malawi
Centra
l Afric
an R
epub
lic
Guinea
Madag
asca
r
Angola
Ghana
Nigeria
Mauriti
us
Enr
ollm
ents
per
100
,000
inha
bita
nts
�
Source:�Table�7.1�and�UNESCO�Institute�for�Statistics�data.��
Figure 7A.2: Percent of Sources of Income for UNIMA Colleges and Central Office (2004/05–2007/0)
0
10
20
30
40
50
60
70
80
90
100
Sub
vent
ion
Oth
er
Fees
Sub
vent
ion
Oth
er
Fees
Sub
vent
ion
Oth
er
Fees
Sub
vent
ion
Oth
er
Fees
Sub
vent
ion
Oth
er
Fees
Sub
vent
ion
Oth
er
2004/05
2005/06
2006/07
2007/08Per
cent
Bunda Chancellor CoM KCN Polytechnic OU �
Source:�Audited�Financial�Statements:�2004/05–2007/08�from�the�University�Office.��

The Education System in Malawi 273
�
Figure 7A.3: Percent of Sources of Income for UNIMA Colleges and Central Office (2004/05–2007/08)
0
10
20
30
40
50
60
70
80
Subvention Fees Donations Other
Per
cent 2002/03
2003/042004/05
�
Source:�MZUNI�audited�financial�statements:�2002/03–2004/05����
Figure 7A.4: Percentage of Female Enrollment by Type of Institution
25303540455055606570
Per
cent
enr
ollm
ent
% Female Pb 0.297 0.303 0.325 0.319 0.32 0.33
% Female Pv 0.651 0.404 0.39 0.451 0.434 0.449
% Female TL 0.3 0.306 0.328 0.328 0.329 0.343
2003 2004 2005 2006 2007 2008
�
Source:�Data�from�higher�education�institutions.��Note:�Pb�=�Public,�Pv�=�private,�and�TL=�total.���
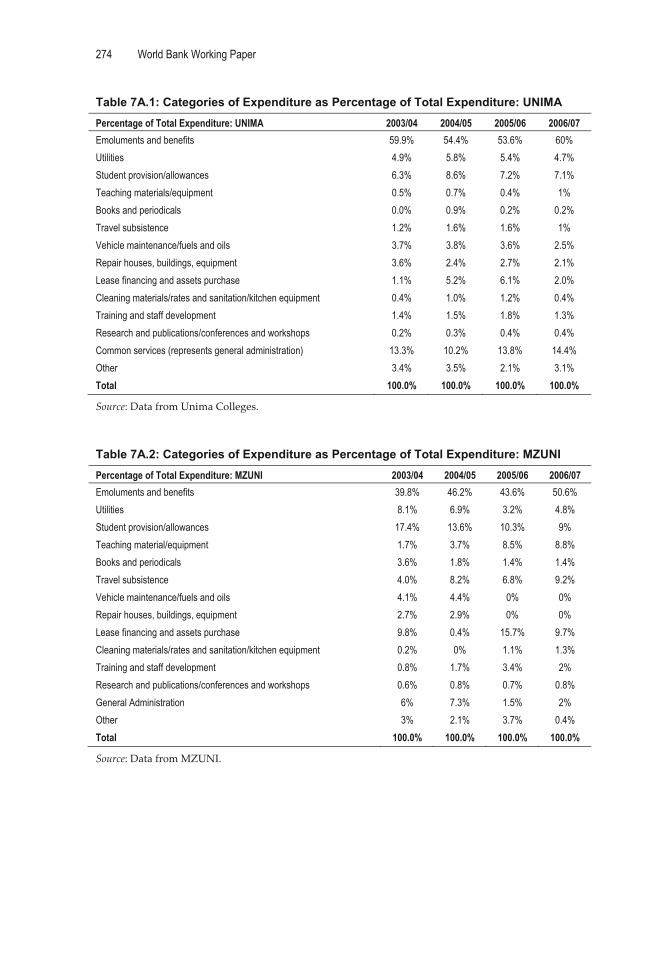
274 World Bank Working Paper
�
Table 7A.1: Categories of Expenditure as Percentage of Total Expenditure: UNIMA Percentage of Total Expenditure: UNIMA 2003/04 2004/05 2005/06 2006/07 Emoluments and benefits 59.9% 54.4% 53.6% 60% Utilities 4.9% 5.8% 5.4% 4.7% Student provision/allowances 6.3% 8.6% 7.2% 7.1% Teaching materials/equipment 0.5% 0.7% 0.4% 1% Books and periodicals 0.0% 0.9% 0.2% 0.2% Travel subsistence 1.2% 1.6% 1.6% 1% Vehicle maintenance/fuels and oils 3.7% 3.8% 3.6% 2.5% Repair houses, buildings, equipment 3.6% 2.4% 2.7% 2.1% Lease financing and assets purchase 1.1% 5.2% 6.1% 2.0% Cleaning materials/rates and sanitation/kitchen equipment 0.4% 1.0% 1.2% 0.4% Training and staff development 1.4% 1.5% 1.8% 1.3% Research and publications/conferences and workshops 0.2% 0.3% 0.4% 0.4% Common services (represents general administration) 13.3% 10.2% 13.8% 14.4% Other 3.4% 3.5% 2.1% 3.1% Total 100.0% 100.0% 100.0% 100.0%
Source:�Data�from�Unima�Colleges.���Table 7A.2: Categories of Expenditure as Percentage of Total Expenditure: MZUNI Percentage of Total Expenditure: MZUNI 2003/04 2004/05 2005/06 2006/07 Emoluments and benefits 39.8% 46.2% 43.6% 50.6% Utilities 8.1% 6.9% 3.2% 4.8% Student provision/allowances 17.4% 13.6% 10.3% 9% Teaching material/equipment 1.7% 3.7% 8.5% 8.8% Books and periodicals 3.6% 1.8% 1.4% 1.4% Travel subsistence 4.0% 8.2% 6.8% 9.2% Vehicle maintenance/fuels and oils 4.1% 4.4% 0% 0% Repair houses, buildings, equipment 2.7% 2.9% 0% 0% Lease financing and assets purchase 9.8% 0.4% 15.7% 9.7% Cleaning materials/rates and sanitation/kitchen equipment 0.2% 0% 1.1% 1.3% Training and staff development 0.8% 1.7% 3.4% 2% Research and publications/conferences and workshops 0.6% 0.8% 0.7% 0.8% General Administration 6% 7.3% 1.5% 2% Other 3% 2.1% 3.7% 0.4% Total 100.0% 100.0% 100.0% 100.0%
Source:�Data�from�MZUNI.��

The Education System in Malawi 275
�
Table 7A.3: Categories of Expenditure as Percentage of Total Expenditure: Livingstonia Percentage of Total Expenditure: Livingstonia 2003/04 2004/05 2005/06 2006/07 Emoluments and benefits 12.9% 36.9% 35.3% 34.7% Utilities 1.4% 3.6% 2.4% 2.6% Student provision/allowances 34.2% 29.4% 24.2% 23.2% Teaching materials/equipment 3.4% 4.3% 3.7% 8.6% Books and periodicals 3.1% 0% 0.1% 0% Travel subsistence 3.2% 0.8% 2.9% 1.6% Vehicle maintenance/fuels and oils 8.5% 10.9% 7.9% 15.1% Repair houses, buildings, equipment 16.6% 0.2% 1.9% 3.6% Lease financing and assets purchase 0% 0% 0% 0.0% Cleaning materials/rates and sanitation/kitchen equipment 7.6% 2.8% 3.2% 2.7% Training and staff development 0% 0% 2.5% 0% Research and publications/conferences and workshops 0% 3.3% 1% 0.7% Common services (represents general administration) 9.3% 7.8% 12.5% 5.5% Other 0% 0% 2.2% 1.9% Total 100.0% 100.0% 100.0% 100.0%
Source:�Data�from�Livingstonia�University.��Table 7A.4: Categories of Expenditure as Percentage of Total Expenditure: Catholic
Percentage of Total Expenditure: Catholic Actual Actual Budget
2006–2007 2007–2008 2008–2009
Staff salaries and benefits 45.7% 58.8% 74.4%
Utilities (water and electricity) 7% 7.7% 5.6%
Student provisions/allowances 17.2% 11.5% 0.9%
Teaching materials/equipment 0.7% 1.1% 1.5%
Books and periodicals 0.7% 0.9% 0.8%
Travel/trips and allowances 0.2% 0% 2.3%
Vehicle maintenance/fuels and oils 2% 1.9% 3.1%
Repairs to houses and buildings 4.4% 0% 2.1%
Lease financing and assets purchase 5% 0% 2.1%
Cleaning materials, sanitation, kitchen equipment 0.4% 0.5% 0.3%
Training and staff development 0% 0.0% 0.2%
Research and publications/conferences and workshops 0.2% 0.1% 0.1%
Common services (general administration costs) 14.9% 11.0% 3.1%
Other stationery and duplicating services 1.5% 6.5% 3.5%
Total 100% 100% 100%
Source:�Data�from�Catholic�University.���
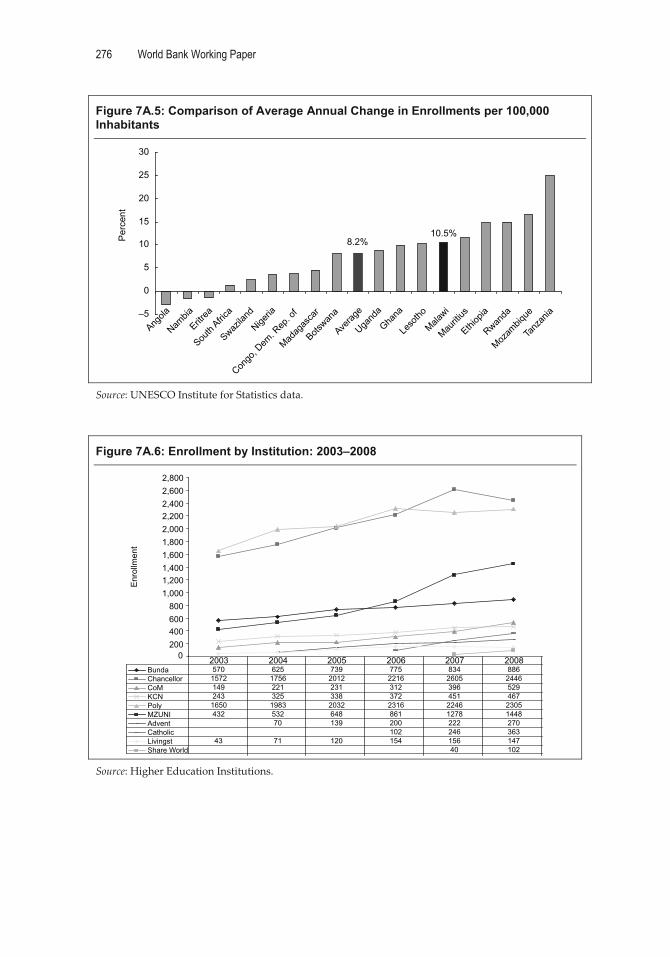
276 World Bank Working Paper
�
Figure 7A.5: Comparison of Average Annual Change in Enrollments per 100,000 Inhabitants
10.5%8.2%
–5
0
5
10
15
20
25
30
Angola
Nambia
Eritrea
South
Africa
Swazila
nd
Nigeria
Congo
, Dem
. Rep
. of
Averag
e
Ugand
a
Ghana
Madag
asca
r
Botswan
a
Leso
tho
Malawi
Mauriti
us
Ethiop
ia
Rwanda
Mozam
bique
Tanz
ania
Per
cent
�
Source:�UNESCO�Institute�for�Statistics�data.���
Figure 7A.6: Enrollment by Institution: 2003–2008
0200400600800
1,0001,2001,4001,6001,8002,0002,2002,4002,6002,800
Enr
ollm
ent
Bunda 570 625 739 775 834 886Chancellor 1572 1756 2012 2216 2605 2446CoM 149 221 231 312 396 529KCN 243 325 338 372 451 467Poly 1650 1983 2032 2316 2246 2305MZUNI 432 532 648 861 1278 1448Advent 70 139 200 222 270Catholic 102 246 363Livingst 43 71 120 154 156 147Share World 40 102
2003 2004 2005 2006 2007 2008
�Source:�Higher�Education�Institutions.�

The Education System in Malawi 277
�
Table 7A.5: Enrollments in Higher Education by Gender
Year
Public Private Total for Both
Male
Female
Total Pb
% Fem
ale Pb
Male
Female
Total Pv
% Fem
ale Pv
Male
Female
Total
% Fem
ale TL
% Fem
ale Pv TL
2003 3,247 1,369 4,616 29.7 15 28 43 65.1 3,262 1,397 4,659 30.0 0.9
2004 3,793 1,649 5,442 30.3 84 57 141 40.4 3,877 1,706 5,583 30.6 2.6
2005 4,050 1,950 6,000 32.5 158 101 259 39.0 4,208 2,051 6,259 32.8 4.3
2006 4,701 2,200 6,901 31.9 246 210 456 46.1 4,947 2,410 7,357 32.8 6.6
2007 5,310 2,500 7,810 32.0 376 288 664 43.4 5,686 2,788 8,474 32.9 8.5
2008 5,412 2,669 8,081 33.0 552 449 1,001 44.9 5,964 3,118 9,082 34.3 12.4
Source:�Data�from�Higher�Education�Institutions.���
Figure 7A.7: Postgraduate Enrollments by Field of Study (2003–2008)
0102030405060708090
100
Educa
tion
Scienc
e
Social
Scie
nce
Human
ities
Agricu
lture
Enviro
nmen
tal S
cienc
e
Develo
pmen
tal S
tudies
Nursing
Commerc
e
Medici
ne
Enr
ollm
ent
200320042005200620072008
�Source:�Data�from�Higher�Education�Institutions.�����
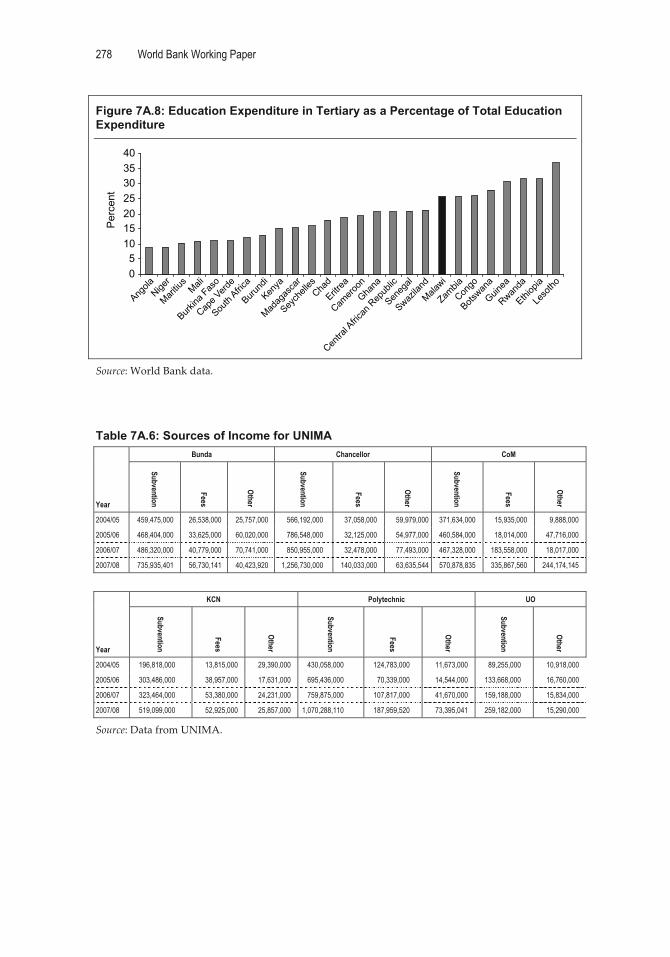
278 World Bank Working Paper
�
Figure 7A.8: Education Expenditure in Tertiary as a Percentage of Total Education Expenditure
05
10152025303540
Angola
Niger
Maritiu
sMali
Burkina
Faso
Cape V
erde
South
Africa
Burund
i
Kenya
Madag
asca
r
Seych
elles
Chad
Eritrea
Camero
on
Ghana
Seneg
al
Swazila
nd
Malawi
Centra
l Afric
an R
epub
lic
Zambia
Congo
Botswan
a
Guinea
Rwanda
Ethiop
ia
Leso
tho
Per
cent
�Source:�World�Bank�data.����Table 7A.6: Sources of Income for UNIMA
Year
Bunda Chancellor CoM
Subvention
Fees
Other
Subvention
Fees
Other
Subvention
Fees
Other
2004/05 459,475,000 26,538,000 25,757,000 566,192,000 37,058,000 59,979,000 371,634,000 15,935,000 9,888,000
2005/06 468,404,000 33,625,000 60,020,000 786,548,000 32,125,000 54,977,000 460,584,000 18,014,000 47,716,000
2006/07 486,320,000 40,779,000 70,741,000 850,955,000 32,478,000 77,493,000 467,328,000 183,558,000 18,017,000
2007/08 735,935,401 56,730,141 40,423,920 1,256,730,000 140,033,000 63,635,544 570,878,835 335,867,560 244,174,145
�
Year
KCN Polytechnic UO
Subvention
Fees
Other
Subvention
Fees
Other
Subvention
Other
2004/05 196,818,000 13,815,000 29,390,000 430,058,000 124,783,000 11,673,000 89,255,000 10,918,000
2005/06 303,486,000 38,957,000 17,631,000 695,436,000 70,339,000 14,544,000 133,668,000 16,760,000
2006/07 323,464,000 53,380,000 24,231,000 759,875,000 107,817,000 41,670,000 159,188,000 15,834,000
2007/08 519,099,000 52,925,000 25,857,000 1,070,288,110 187,959,520 73,395,041 259,182,000 15,290,000
Source:�Data�from�UNIMA.��

The Education System in Malawi 279
�
Table 7A.7: Percentages of Sources of Income for UNIMA
Year
Bunda Chancellor CoM
Subvention
Fees
Other
Subvention
Fees
Other
Subvention
Fees
Other
2004/05 89.8% 5.2% 5.0% 85.4% 5.6% 9.0% 93.5% 4.0% 2.5%
2005/06 83.3% 6.0% 10.7% 90.0% 3.7% 6.3% 87.5% 3.4% 9.1%
2006/07 81.3% 6.8% 11.8% 88.6% 3.4% 8.1% 69.9% 27.4% 2.7%
2007/08 88.3% 6.8% 4.9% 86.1% 9.6% 4.4% 49.6% 29.2% 21.2%
�
Year
KCN Polytechnic OU
Subvention
Fees
Other
Subvention
Fees
Other
Subvention
Other
2004/05 82.0% 5.8% 12.2% 75.9% 22.0% 2.1% 89.1% 10.9%
2005/06 84.3% 10.8% 4.9% 89.1% 9.0% 1.9% 88.9% 11.1%
2006/07 80.6% 13.3% 6.0% 83.6% 11.9% 4.6% 91.0% 9.0%
2007/08 86.8% 8.9% 4.3% 80.4% 14.1% 5.5% 94.4% 5.6%
Source:�Data�from�UNIMA.���Table 7A.8: Sources of Income for MZUNI Year Subvention Fees Donations Other Total 2002/03 117,470,175 34,819,010 1,212,090 6,307,047 159,808,322 2003/04 129,275,846 34,410,398 32,429,330 14,302,655 210,418,229 2004/05 267,114,290 43,018,058 43,332,283 13,564,441 367,029,072
Source:�Data�from�MZUNI.���Table 7A.9: Percentages of Sources of Income for MZUNI Year Subvention Fees Donations Other 2002/03 73.5% 21.8% 0.8% 3.9% 2003/04 61.4% 16.4% 15.4% 6.8% 2004/05 72.8% 11.7% 11.8% 3.7%
Source:�Data�from�MZUNI.����

280 World Bank Working Paper
�
Table 7A.10: UNIMA Actual Expenditure: 2003/04 to 2006/07 Category 2003/04 2004/05 2005/06 2006/07
Emoluments 951,703,800 1,001,497,977 1,578,937,109 2,216,433,631 Benefits 114,472,606 174,634,124 186,637,115 209,712,597 Emoluments + Benefits 1,066,176,406 1,176,132,101 1,765,574,223 2,426,146,227 Utilities 87,234,871 124,375,851 177,846,221 188,649,621 Student provision/allowances 112,778,736 185,537,839 238,649,729 285,137,759 Teaching materials/equipment 9,445,555 15,770,575 12,994,817 39,055,036 Books and periodicals 875,613 20,149,505 6,476,935 8,229,474 Travel subsistence 21,265,548 35,529,454 52,019,297 40,310,104 Vehicle maintenance/fuels & oils 65,810,787 82,923,629 117,916,216 102,549,085 Repair houses, buildings, equipment 63,679,315 51,440,004 89,316,650 84,756,770 Lease financing &assets purchase 19,902,391 112,035,014 201,970,767 80,405,451 Cleaning materials/rates & sanitation/kitchen equipment 7,683,135 22,392,528 38,817,175 15,178,250 Training and staff development 25,570,425 32,162,261 57,798,683 52,849,620 Research & publications/conferences & workshops 2,971,503 6,054,851 11,607,916 16,700,247 Common services (represents general administration) 236,977,031 221,329,556 456,065,693 580,522,976 Other 60,582,570 75,688,000 69,922,000 123,391,966 Total 1,780,953,888 2,161,521,168 3,296,976,322 4,043,882,587
Source:�Data�from�higher�education�institutions.�
�Table 7A.11: MZUNI Actual Expenditure: 2003/04 to 2006/07
2003/04 2004/05 2005/06 2006/07 Emoluments 251,780,619 432,449,290 Benefits 4,775,607 5,263,787 Emoluments + Benefits 96,118,143 162,915,886 256,556,226 437,713,077 Utilities 19,447,567 24,216,217 18,944,322 41,525,064 Student provision/allowances 41,899,538 48,063,963 60,696,864 78,306,448 Teaching materials/equipment 4,086,825 13,123,493 49,956,123 75,895,730 Books and periodicals 8,737,707 6,404,670 8,253,304 12,318,578 Travel subsistence 9,586,289 28,798,405 40,260,325 79,348,412 Vehicle maintenance/fuels & oils 9,971,354 15,415,058 Repair houses, buildings, equipment 6,540,767 10,132,796 Lease financing &assets purchase 23,653,119 1,292,010 92,079,189 83,572,294 Cleaning materials/rates & sanitation/kitchen equipment 500,000 6,253,305 11,318,575 Training and staff development 1,840,681 5,902,264 19,942,013 17,566,730 Research & publications/conferences & workshops 1,467,821 2,978,408 4,253,304 7,318,576 Common services (represents general administration) 14,590,345 25,605,988 9,080,379 16,906,598 Other 2,882,648 7,447,108 21,591,504 3,820,735 Total 241,322,804 352,296,266 587,866,858 865,610,817
Source:�Data�from�MZUNI.��Table 7A.12: Unit Cost by Institution
Institution 2003 2004 2005 2006
MWK GDP MWK GDP MWK GDP MWK GDP Bunda 546,945 15.05 765,489 21.06 868,900 23.90 1,047,979 28.83 Chancellor College 373,033 10.26 376,265 10.35 458,228 12.61 522,187 14.36 College of Medicine 1,753,554 48.24 1,521,271 41.85 2,043,182 56.21 1,900,964 52.29 Kamuzu College 685,948 18.87 515,687 14.19 719,346 19.79 1,145,240 31.50 Polytechnic 353,802 9.73 316,537 8.71 614,236 16.90 591,986 16.28 Mzuzu 558,618 15.37 662,211 18.22 907,202 24.96 1,005,355 27.66 Livingstonia 77,908 2.14 48,917 1.42 164,219 4.52 182,299 5.01 Catholic 494,532 13.60 Adventist 241,000 6.63 Shareworld 182,299 7.90
Source:�Data�from�Higher�Education�Institutions.�
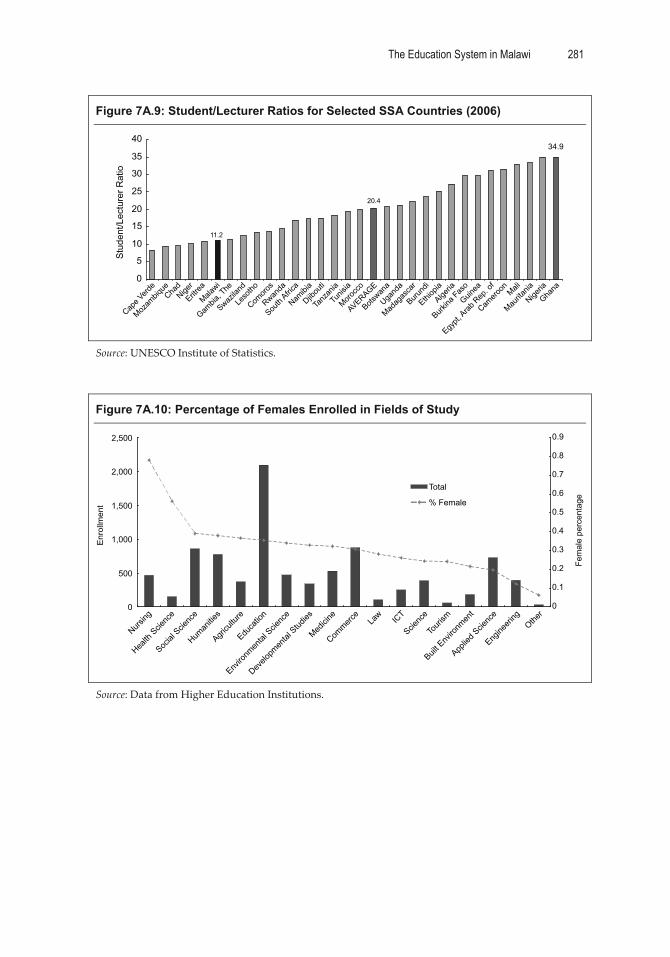
The Education System in Malawi 281
�
Figure 7A.9: Student/Lecturer Ratios for Selected SSA Countries (2006)
11.2
20.4
34.9
0
5
10
15
20
25
30
35
40
Cape V
erde
Mozam
bique
ChadNige
r
Eritrea
Malawi
Gambia
, The
Swazila
nd
Leso
tho
Comoro
s
Rwanda
South
Africa
Namibi
a
Djibou
ti
Tanz
ania
Tunis
ia
Morocc
o
AVERAGE
Botswan
a
Ugand
a
Madag
asca
r
Burund
i
Ethiop
ia
Algeria
Burkina
Faso
Guinea
Egypt,
Arab R
ep. o
f
Camero
on Mali
Maurita
nia
Nigeria
Ghana
Stu
dent
/Lec
ture
r Rat
io
�Source:�UNESCO�Institute�of�Statistics.���
Figure 7A.10: Percentage of Females Enrolled in Fields of Study
0
500
1,000
1,500
2,000
2,500
Nursing
Health
Scie
nce
Social
Scie
nce
Human
ities
Agricu
lture
Educa
tion
Enviro
nmen
tal S
cienc
e
Develo
pmen
tal S
tudies
Medici
ne
Commerc
eLa
w ICT
Scienc
e
Touri
sm
Built E
nviro
nmen
t
Applie
d Scie
nce
Engine
ering
Other
Enr
ollm
ent
0
0.1
0.2
0.3
0.4
0.5
0.6
0.7
0.8
0.9
Fem
ale
perc
enta
ge
Total
% Female
�Source:�Data�from�Higher�Education�Institutions.�
��
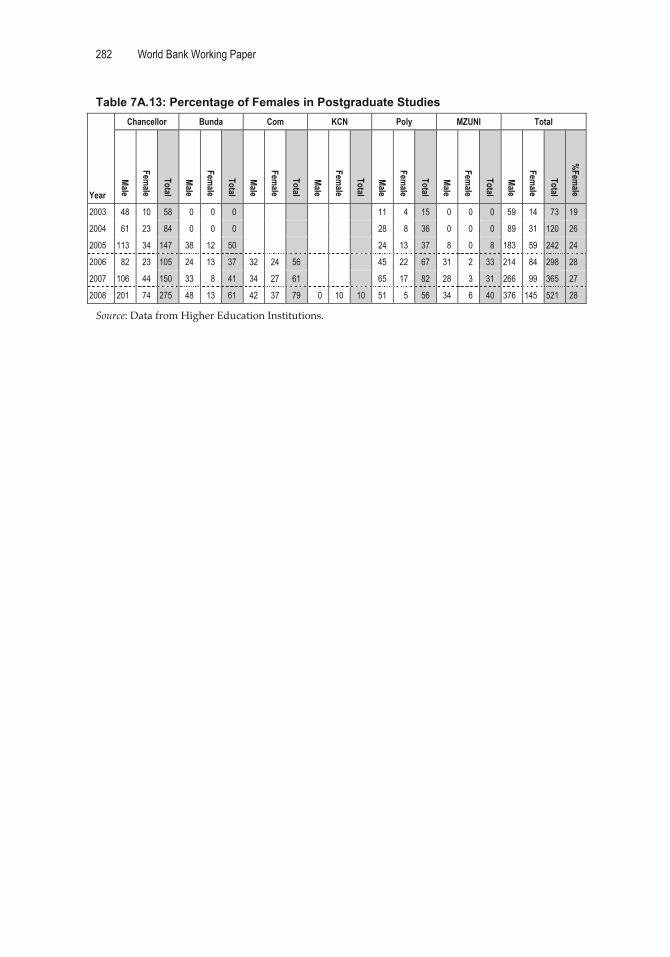
282 World Bank Working Paper
�
Table 7A.13: Percentage of Females in Postgraduate Studies
Year
Chancellor Bunda Com KCN Poly MZUNI Total
Male
Female
Total
Male
Female
Total
Male
Female
Total
Male
Female
Total
Male
Female
Total
Male
Female
Total
Male
Female
Total
%Fem
ale
2003 48 10 58 0 0 0 11 4 15 0 0 0 59 14 73 19
2004 61 23 84 0 0 0 28 8 36 0 0 0 89 31 120 26
2005 113 34 147 38 12 50 24 13 37 8 0 8 183 59 242 24
2006 82 23 105 24 13 37 32 24 56 45 22 67 31 2 33 214 84 298 28
2007 106 44 150 33 8 41 34 27 61 65 17 82 28 3 31 266 99 365 27
2008 201 74 275 48 13 61 42 37 79 0 10 10 51 5 56 34 6 40 376 145 521 28
Source:�Data�from�Higher�Education�Institutions.��
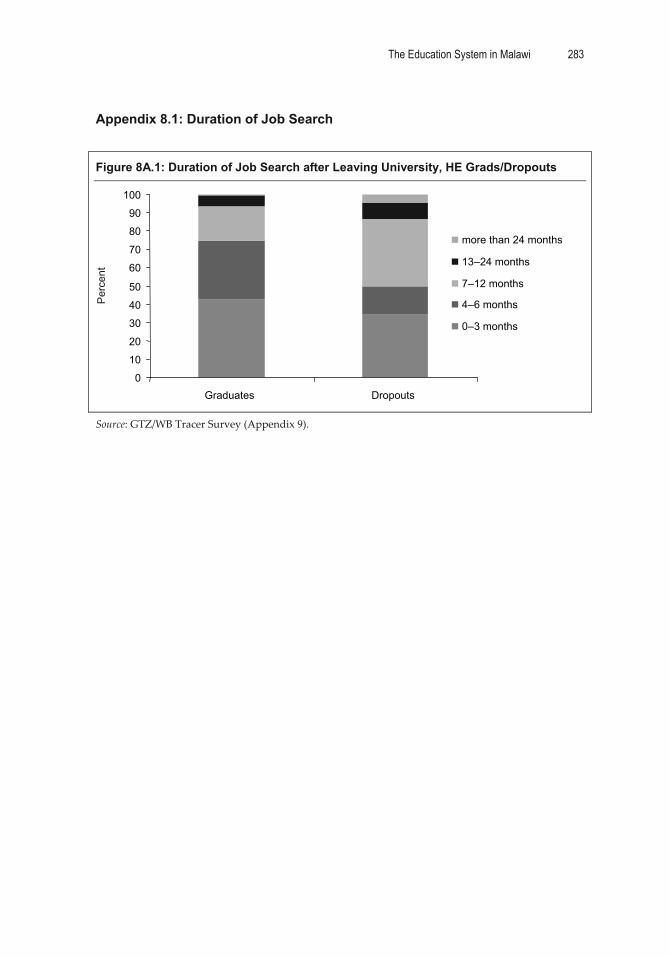
The Education System in Malawi 283
�
Appendix 8.1: Duration of Job Search
�
Figure 8A.1: Duration of Job Search after Leaving University, HE Grads/Dropouts
0
10
20
30
40
50
60
70
80
90
100
Graduates Dropouts
more than 24 months
13–24 months
7–12 months
4–6 months
0–3 months
Per
cent
�
Source:�GTZ/WB�Tracer�Survey�(Appendix�9).�
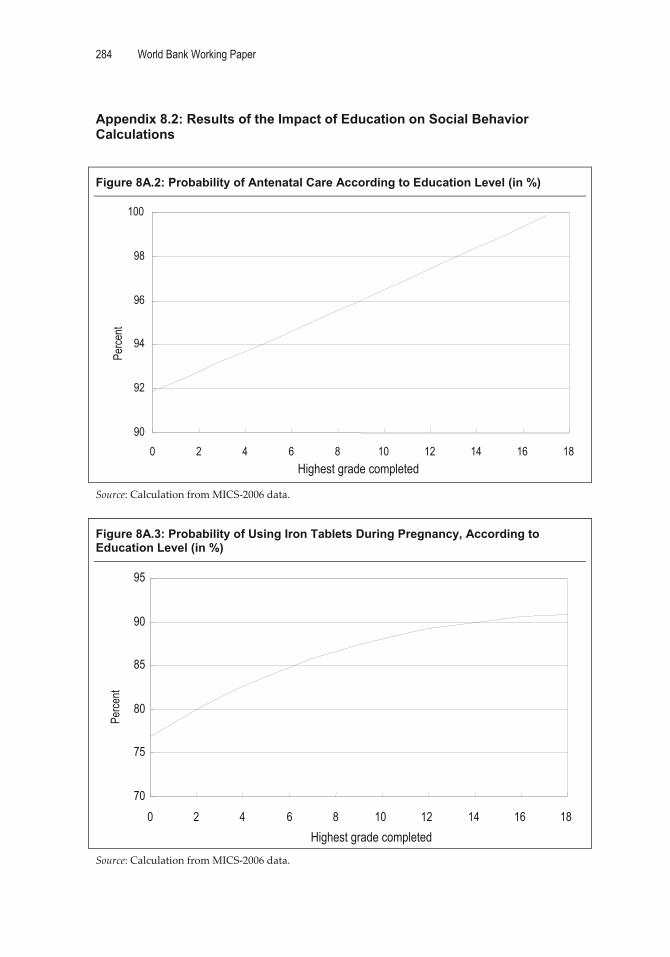
284 World Bank Working Paper
�
Appendix 8.2: Results of the Impact of Education on Social Behavior Calculations
�
Figure 8A.2: Probability of Antenatal Care According to Education Level (in %)
�
Source:�Calculation�from�MICS�2006�data.��
Figure 8A.3: Probability of Using Iron Tablets During Pregnancy, According to Education Level (in %)
�Source:�Calculation�from�MICS�2006�data.��
70
75
80
85
90
95
0 2 4 6 8 10 12 14 16 18 Highest grade completed
90
92
94
96
98
100
0 2 4 6 8 10 12 14 16 18 Highest grade completed
Perce
nt Pe
rcent
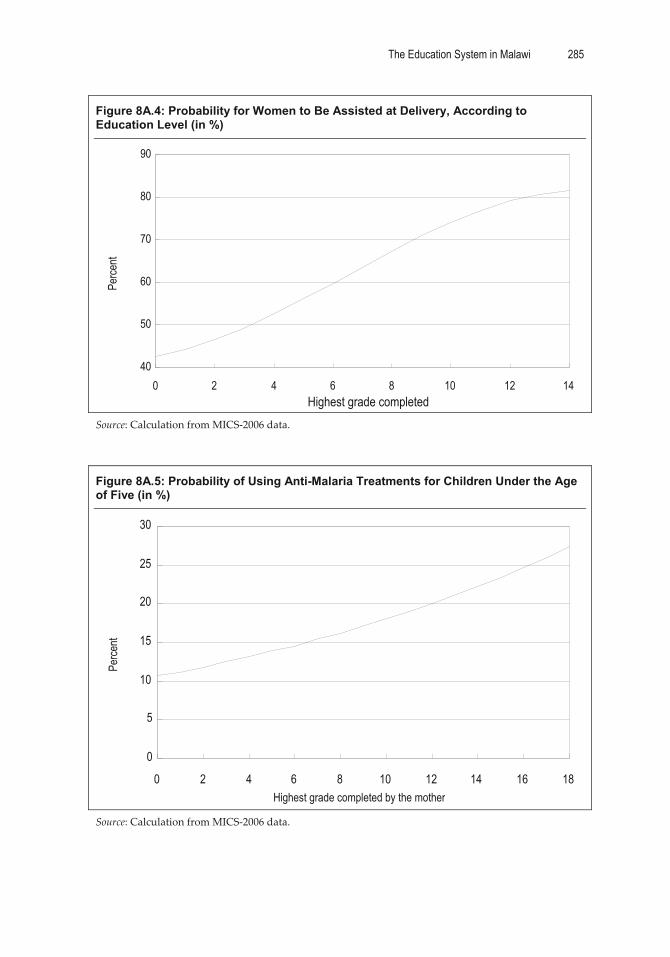
The Education System in Malawi 285
�
Figure 8A.4: Probability for Women to Be Assisted at Delivery, According to Education Level (in %)
�Source:�Calculation�from�MICS�2006�data.���
Figure 8A.5: Probability of Using Anti-Malaria Treatments for Children Under the Age of Five (in %)
�Source:�Calculation�from�MICS�2006�data.�
�
0
5
10
15
20
25
30
0 2 4 6 8 10 12 14 16 18 Highest grade completed by the mother
Perce
nt
40
50
60
70
80
90
0 2 4 6 8 10 12 14Highest grade completed
Perce
nt

286 World Bank Working Paper
�
Figure 8A.6: Average Woman’s Age at Her First Birth
�
Source:�Calculation�from�MICS�2006�data.��
Figure 8A.7: Birth Interval (in Years)
�
Source:�Calculation�from�MICS�2006�data.�
�
2.5
3.0
3.5
4.0
4.5
5.0
0 2 4 6 8 10 12 14 16 18Highest grade completed
18
19
20
21
22
0 2 4 6 8 10 12 14 16 18 Highest grade completed
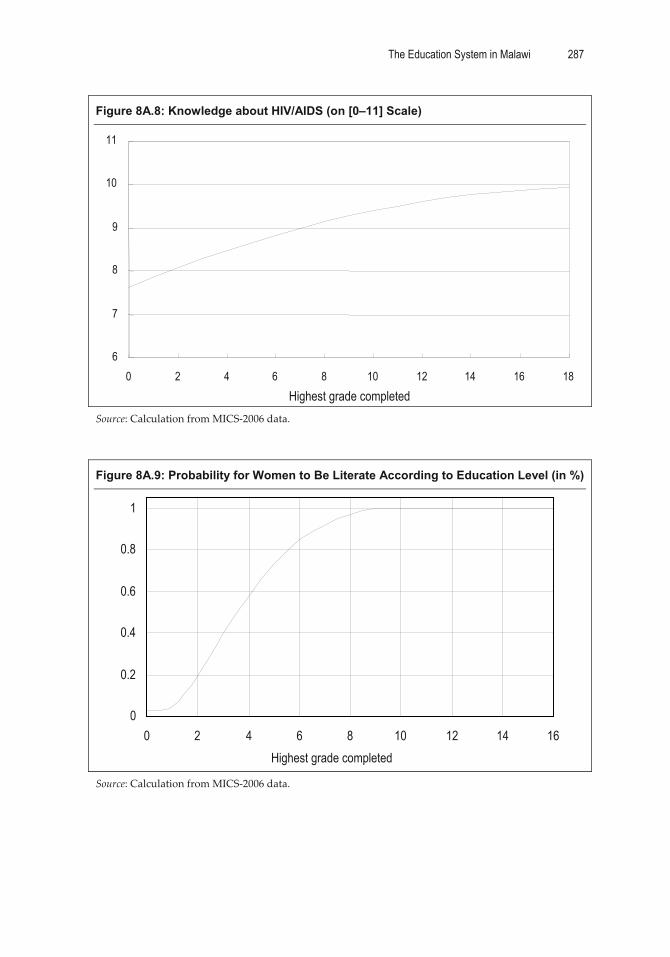
The Education System in Malawi 287
�
Figure 8A.8: Knowledge about HIV/AIDS (on [0–11] Scale)
�Source:�Calculation�from�MICS�2006�data.���
Figure 8A.9: Probability for Women to Be Literate According to Education Level (in %)
�
Source:�Calculation�from�MICS�2006�data.�
0
0.2
0.4
0.6
0.8
1
0 2 4 6 8 10 12 14 16Highest grade completed
6
7
8
9
10
11
0 2 4 6 8 10 12 14 16 18 Highest grade completed
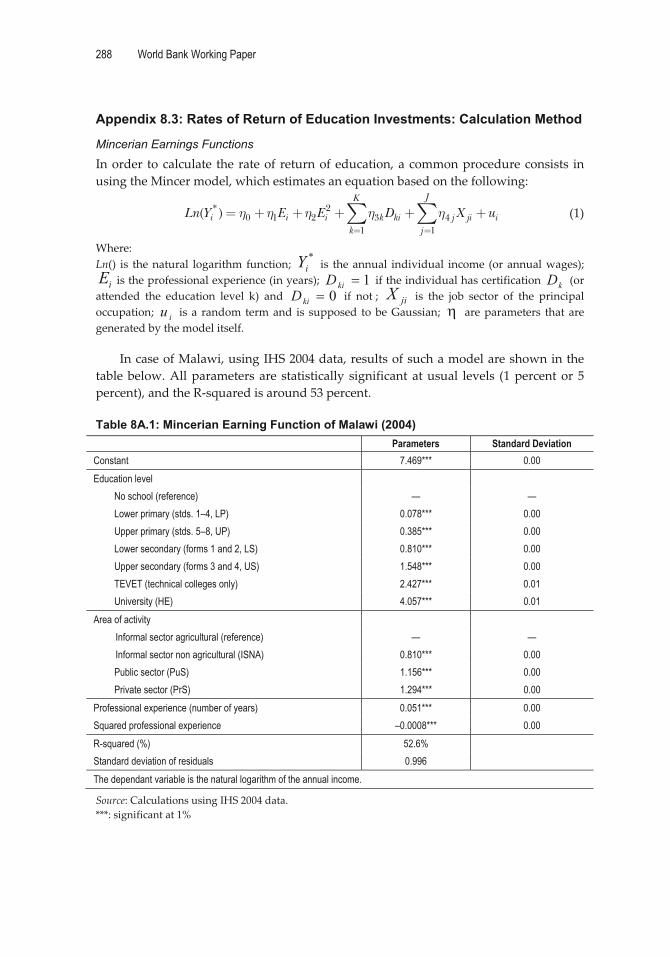
288 World Bank Working Paper
�
Appendix 8.3: Rates of Return of Education Investments: Calculation Method
Mincerian Earnings Functions
In�order� to�calculate� the�rate�of� return�of�education,�a�common�procedure�consists� in�using�the�Mincer�model,�which�estimates�an�equation�based�on�the�following:�
�
* 20 1 2 3 4
1 1
( )JK
i i i k ki j ji ik j
Ln Y E E D X u� � � � �� �
� � � � � �� � � (1)�
Where:�Ln()� is� the�natural� logarithm� function;�
*iY � is� the�annual� individual� income� (or�annual�wages);�
iE is�the�professional�experience�(in�years);� 1�kiD �if�the�individual�has�certification� kD �(or�attended� the� education� level� k)� and� 0�kiD � if� not�;� jiX � is� the� job� sector� of� the� principal�occupation;� iu � is�a� random� term�and� is� supposed� to�be�Gaussian;� � � are�parameters� that�are�generated�by�the�model�itself.��
In�case�of�Malawi,�using�IHS�2004�data,�results�of�such�a�model�are�shown�in�the�table�below.�All�parameters�are� statistically� significant�at�usual� levels� (1�percent�or� 5�percent),�and�the�R�squared�is�around�53�percent.��Table 8A.1: Mincerian Earning Function of Malawi (2004)
Parameters Standard Deviation Constant 7.469*** 0.00 Education level
No school (reference) — — Lower primary (stds. 1–4, LP) 0.078*** 0.00 Upper primary (stds. 5–8, UP) 0.385*** 0.00 Lower secondary (forms 1 and 2, LS) 0.810*** 0.00 Upper secondary (forms 3 and 4, US) 1.548*** 0.00 TEVET (technical colleges only) 2.427*** 0.01 University (HE) 4.057*** 0.01
Area of activity Informal sector agricultural (reference) — — Informal sector non agricultural (ISNA) 0.810*** 0.00 Public sector (PuS) 1.156*** 0.00 Private sector (PrS) 1.294*** 0.00
Professional experience (number of years) 0.051*** 0.00 Squared professional experience –0.0008*** 0.00 R-squared (%) 52.6% Standard deviation of residuals 0.996 The dependant variable is the natural logarithm of the annual income.
Source:�Calculations�using�IHS�2004�data.�***:�significant�at�1%��
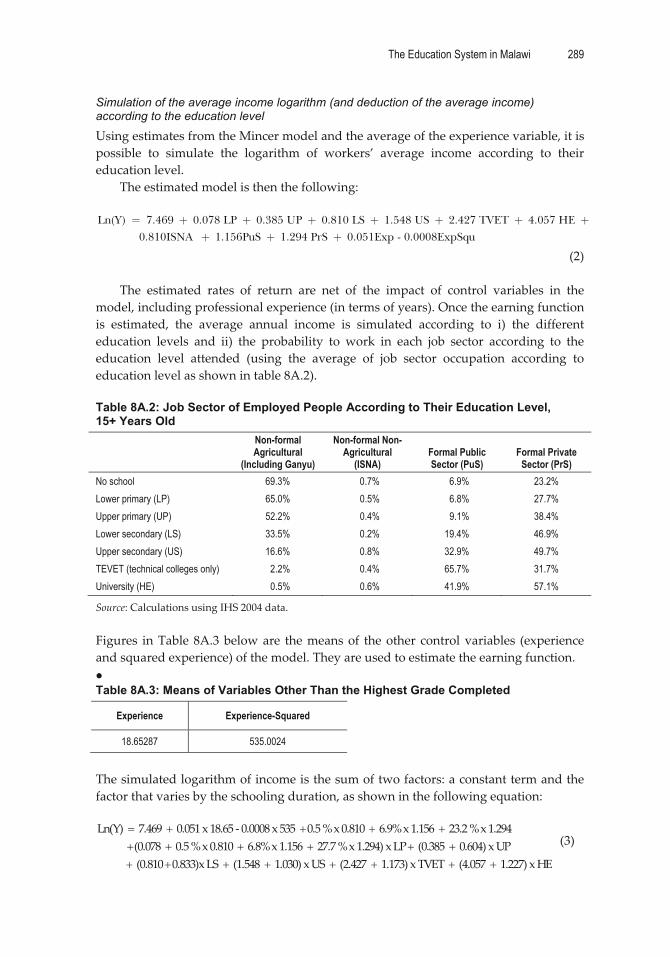
The Education System in Malawi 289
�
Simulation of the average income logarithm (and deduction of the average income) according to the education level
Using�estimates�from�the�Mincer�model�and�the�average�of�the�experience�variable,�it�is�possible� to� simulate� the� logarithm� of� workers’� average� income� according� to� their�education�level.��
The�estimated�model�is�then�the�following:��Ln(Y) 7.469 0.078 LP 0.385 UP 0.810 LS 1.548 US 2.427 TVET 4.057 HE
0.810ISNA 1.156PuS 1.294 PrS 0.051Exp - 0.0008ExpSqu� � � � � � � �
� � �
�(2)��
The� estimated� rates� of� return� are� net� of� the� impact� of� control� variables� in� the�model,�including�professional�experience�(in�terms�of�years).�Once�the�earning�function�is� estimated,� the� average� annual� income� is� simulated� according� to� i)� the� different�education� levels� and� ii)� the� probability� to� work� in� each� job� sector� according� to� the�education� level� attended� (using� the� average� of� job� sector� occupation� according� to�education�level�as�shown�in�table�8A.2).��Table 8A.2: Job Sector of Employed People According to Their Education Level, 15+ Years Old
Non-formal Agricultural
(Including Ganyu)
Non-formal Non-Agricultural
(ISNA) Formal Public Sector (PuS)
Formal Private Sector (PrS)
No school 69.3% 0.7% 6.9% 23.2% Lower primary (LP) 65.0% 0.5% 6.8% 27.7% Upper primary (UP) 52.2% 0.4% 9.1% 38.4% Lower secondary (LS) 33.5% 0.2% 19.4% 46.9% Upper secondary (US) 16.6% 0.8% 32.9% 49.7% TEVET (technical colleges only) 2.2% 0.4% 65.7% 31.7% University (HE) 0.5% 0.6% 41.9% 57.1%
Source:�Calculations�using�IHS�2004�data.��Figures� in�Table�8A.3�below�are� the�means�of� the�other� control�variables� (experience�and�squared�experience)�of�the�model.�They�are�used�to�estimate�the�earning�function.�� Table 8A.3: Means of Variables Other Than the Highest Grade Completed
Experience Experience-Squared
18.65287 535.0024
�The�simulated�logarithm�of�income�is�the�sum�of�two�factors:�a�constant�term�and�the�factor�that�varies�by�the�schooling�duration,�as�shown�in�the�following�equation:��Ln(Y)� �7.469� �0.051�x�18.65���0.0008�x�535� 0.5�%�x�0.810� �6.9%�x�1.156� �23.2�%�x1.294�
(0.078� �0.5�%�x�0.810� �6.8%�x�1.156� �27.7�%�x�1.294)�x�LP �(0.385� �0.604)�x�UP� �(0.810 0.833)x�LS� �(1
� � � � �� � � � � �� � � .548� �1.030)�x�US� �(2.427� �1.173)�x�TVET �(4.057� �1.227)�x�HE�� � � � �
�(3)�

290 World Bank Working Paper
�
Table 8A.4: Logarithm of Annual Income According to Education Level No school (reference) = 8.371 Lower primary (LP) = 8.505 Upper primary (UP) = 8.975 Lower secondary (LS) = 9.629 Upper secondary (US) = 10.564 TEVET = 11.586 University (HE) = 13.271
�The� simulated� income� should� take� into� account� the� variance� of� the� error� factor� in�equation�(1)�above.��
� �� � � �� �2 2
2 2simulated simulated simulated
s sY Exp Ln Y Exp Exp Ln Y� � �� � � � � �� � � �� � � �� � �� � � �� � �
(4)�
�In�that�equation�(4),�s�represents�the�Standard�deviation�of�the�residuals,�and�is�shown�in�the�last�row�of�Table�8A.1�above.��
s²/2�=�0,996*0,996/2�=�0,496.��Table 8A.5: Expected Income According to Education Level, 15+ Years Old
Expected Income Without Taking into Account Risks of Unemployment (a)
Unemployment Rate (b)
Expected Income Taking into
Account Risks of Unemployment
(a)*(1-b/100) No school (reference) = Exp(8.371 + 0.496) = 7,095 1.1% 7,015 Lower primary (LP) = Exp(8.505 + 0.496) = 8,112 1.3% 8,005 Upper primary (UP) = Exp(8.975 + 0.496) = 12,983 2.1% 12,715 Lower secondary (LS) = Exp(9.629 + 0.496) = 24,969 3.7% 24,038 Upper secondary (US) = Exp(10.564 + 0.496) = 63,566 10.1% 57,121 TEVET = Exp(11.586 + 0.496) = 176,582 4.2% 169,221 University (HE) = Exp(13.271 + 0.496) = 952,027 2.4% 929,233
Source:�IHS�2004�data�and�our�own�calculation.��
Rates of Return
On� the� basis� of� the� simulated� incomes� above,� the� rate� of� return� of� the� level� (k)�relatively�to� the� level� (k�1)� is�estimated�by�dividing�the�difference�of�wages�(between�the�expected�income�with�a�level�k�and�the�expected�income�with�a�level�(k�1))�by�the�additional�cost�supported�when�pursuing�schooling�in�level�k.��
On� the� income� side,� it� is� necessary� to� take� into� account� the� unemployment� rate�(which�may�vary�with� the� education� level)�with� the�assumption�unemployed�people�have�no�income�(see�table�8A.5).�

The Education System in Malawi 291
�
The� cost� includes� direct� training� costs� as� well� as� the� foregone� earning� (or�opportunity�cost),�which�is�the�income�one�would�forego�while�pursuing�study�to�the�level� k.�The� foregone� earning� cost� for� the� level� k� is� estimated�by�using� the� expected�income�at�level�(k�1).�
More� precisely,� the� formula� below� is� used� to� estimate� the� rate� of� return� of�education�level�(k)�relatively�to�education�level�(k�1):��
� kkkkkk
kkkkkk CNYN
YYR�
��
��
��
11/1-
111-/ �
��� (5)�
�with� k� � the� employment� rate� (therefore� (1� k� )� is� the� unemployment� rate)� of�individuals�with�education�level�k;� kY �the�simulated�income�of�the�level�k,� kN � is�the�average� duration� (number� of� years� of� schooling)� within� the� level� k,� -1/k kN � is� the�difference�between�level�k�and�(k�1)�in�number�of�years�of�schooling�attended�and�Ck�the�direct�training�cost.��
The�values�of� kN �and� -1/k kN �are�shown�in�table�8A.6,�as�well�as�the�annual�unit�
direct�cost�(public�and�private)�as�calculated�in�Chapter�3.�With�equation� (5)� it� is�possible� to�calculate�both� the�social� rate�of� return�and�the�
private�rate�of�return.�The�two�kinds�of�rate�of�return�differ�only�by�the�components�of�the�direct� training� costs.� In� the� case� of� private� rate,� the� only� component� of�Ck� is� the�training�cost�supported�by�the�individual�himself� (or�his�family);� in�the�case�of�social�rate,�the�public�cost�is�added.��Table 8A.6: Schooling Duration, Unit Cost, and Rates of the Different Education Levels
Average Number of
years of Schooling
Difference in Average
Number of Years of
Schooling
kkN /1-
Average Number of Years of
Schooling within the
Level k
kN
Unit Annual Cost (MK) Rate of Return
Private Public Private Social Lower primary (LP) 2.78 2.78 2.78 252 3,019 5% 3% Upper primary (UP) 6.65 3.87 2.65 252 3,019 15% 12% Lower secondary (LS) 9.75 3.10 1.75 7,547 30,292 22% 11% Upper secondary (US) 11.86 2.11 1.86 13,313 30,292 44% 25% TEVET 14.18 2.32 2.18 34,444 51,408 54% 35% University (HE) 16.14 4.29 4.14 63,725 780,479 171% 23%
Source:�IHS�2004�and�our�own�calculation.��
For� example� the� rate� of� return� of� upper� primary� compared� to� lower� primary� is�calculated�as�follows:�
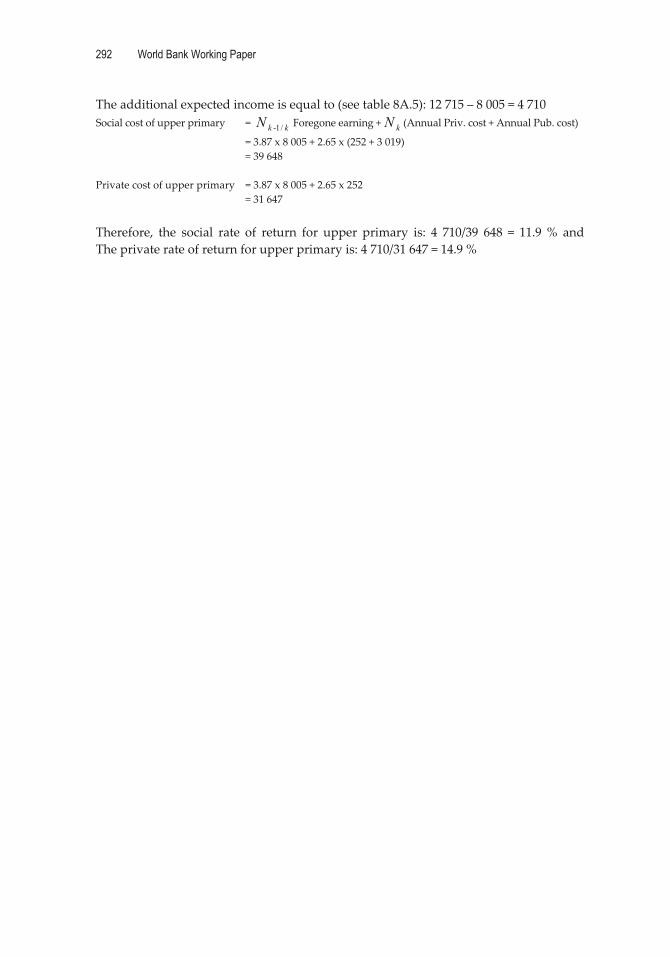
292 World Bank Working Paper
�
The�additional�expected�income�is�equal�to�(see�table�8A.5):�12�715�–�8�005�=�4�710�Social�cost�of�upper�primary� =� kkN /1- Foregone�earning�+ kN (Annual�Priv.�cost�+�Annual�Pub.�cost)
� =�3.87�x�8�005�+�2.65�x�(252�+�3�019)�� =�39�648��Private�cost�of�upper�primary� =�3.87�x�8�005�+�2.65�x�252�� =�31�647��Therefore,� the� social� rate� of� return� for� upper� primary� is:� 4� 710/39� 648� =� 11.9�%� and��The�private�rate�of�return�for�upper�primary�is:�4�710/31�647�=�14.9�%���
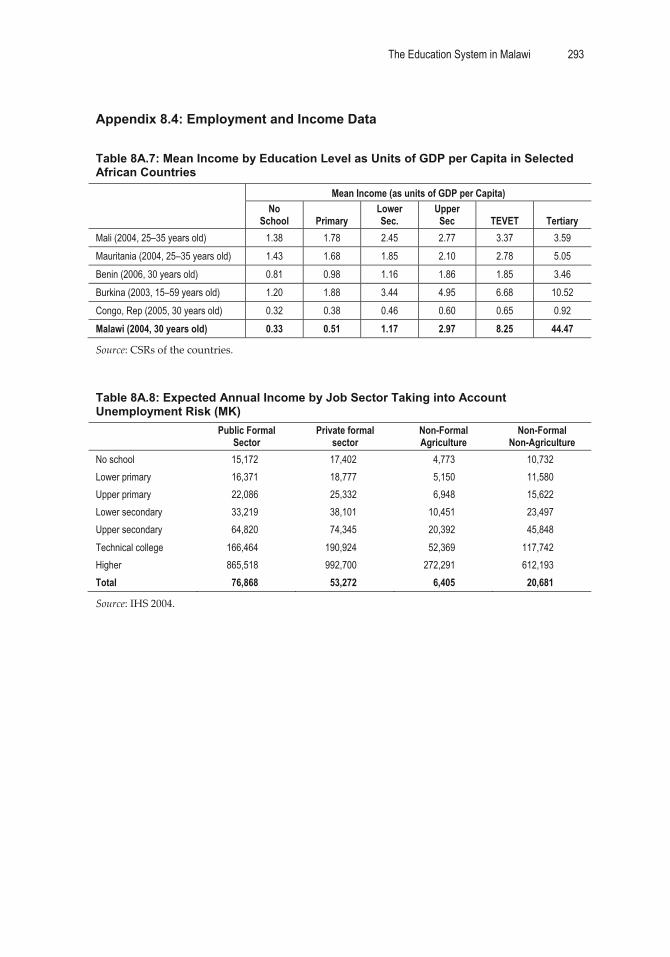
The Education System in Malawi 293
�
Appendix 8.4: Employment and Income Data
�Table 8A.7: Mean Income by Education Level as Units of GDP per Capita in Selected African Countries
Mean Income (as units of GDP per Capita) No
School Primary Lower Sec.
Upper Sec TEVET Tertiary
Mali (2004, 25–35 years old) 1.38 1.78 2.45 2.77 3.37 3.59 Mauritania (2004, 25–35 years old) 1.43 1.68 1.85 2.10 2.78 5.05 Benin (2006, 30 years old) 0.81 0.98 1.16 1.86 1.85 3.46 Burkina (2003, 15–59 years old) 1.20 1.88 3.44 4.95 6.68 10.52 Congo, Rep (2005, 30 years old) 0.32 0.38 0.46 0.60 0.65 0.92 Malawi (2004, 30 years old) 0.33 0.51 1.17 2.97 8.25 44.47
Source:�CSRs�of�the�countries.���Table 8A.8: Expected Annual Income by Job Sector Taking into Account Unemployment Risk (MK)
Public Formal
Sector Private formal
sector Non-Formal Agriculture
Non-Formal Non-Agriculture
No school 15,172 17,402 4,773 10,732 Lower primary 16,371 18,777 5,150 11,580 Upper primary 22,086 25,332 6,948 15,622 Lower secondary 33,219 38,101 10,451 23,497 Upper secondary 64,820 74,345 20,392 45,848 Technical college 166,464 190,924 52,369 117,742 Higher 865,518 992,700 272,291 612,193 Total 76,868 53,272 6,405 20,681
Source:�IHS�2004.���

�
��
295
APPENDIX � 9 �
Tracer�Study�of�TEVET�and�Higher�Education�Completers�
Dietmar�Pfeiffer�University�of�Münster�Germany�
Gerald�Chiunda�Malawi�National�Examinations�Board�
�

�
��

297
Part�I:�General�Background�
1. Introduction
The�main�concern�of�educational�policy�is�the�evaluation�of�the�internal�and�external�efficiency� of�programs,� specifically� in� the�sub�sectors�of� technical�vocational� training�on�one�hand�and�Higher�Education�on�the�other.�Programs�in�these�sub�sectors�of�the�educational�system�usually�generate�higher�unit�costs�than�General�Education�(Primary�and� Secondary),� which� should� result� in� appropriate� returns.� Therefore,� maximum�utilization�of�resources,�demand�orientation,�and�relevance�for�individuals�and�society�are� to� be� expected.� Completer� who� does� not� find� access� to� an� employment� or� are�overqualified� or� inappropriately� qualified� for� the� professional� activities� which� they�perform,�mean�a�waste�of�economic�resources�and�dissatisfaction�and�disappointment�of�qualified�individuals.�
Tracer�Studies�of�beneficiaries�of�those�programs�(apprentices,�trainees,�graduates)�can�be�considered�as�one�powerful�methodological�tool�in�order�to�evaluate�the�impact�of� programs� (outcomes,� results,� relevance)� as�well� as� identify� problems� and� deficits�experienced�by�the�beneficiaries,�which�can�provide� important� information�for� future�policy�options,�quality�monitoring�and�long�term�strategies.�Tracer�Studies�are�surveys�that�endeavor�to�follow�up�graduates�of�a�program�of�study.�The�reason�for�the�follow�up�is�to�evaluate�the�result�of�programs�of�studies�in�pursuant�of�quality�assurance�and�the�need�to�find�out�how�graduates�and�leavers�of�the�various�programs�are�faring�in�the�job�market�and�workplace.�The�feedback�provided�by�Tracer�Studies�can�contribute�to� a� better� coordination� between� supply� and� demand� in� the� labor� market.� Other�possible� objectives� can� be� the� evaluation� of� the� learning� environment,� motivation�processes,�and�general�satisfaction�with�studies.�
Education� related� tracer� studies� have� been� in� the� past� directed� mainly� on�individuals� who� have� undergone� higher� education� courses.� Nonetheless� they� can�track� also� participants� in� all� other� type� of� educational� programs� such� as� literacy�courses,�short�term�vocational�courses�or�formal�technical�education�programs.��
Traditionally,� higher� education� related� tracer� studies� cover� graduates,� who�finished�the�course�but�not�dropouts.�The�reason�for�this�lack�of�interest�for�this�field�is�that� dropping� out� is� considered� mainly� as� a� problem� of� internal� efficiency� of� the�institution�and/or�of�a�result�of�individual�deficits.1�Another�reason�is�that�the�concept�of�drop�out� is�sometime�difficult� to�define.�On�the�other�hand�high�dropout�rates�are�causes� of,� for� every� year,� high� social� and� individual� costs� and� therefore� efforts� to�reduce� the�dropout�rate�are�required.� If� the�group�of�dropouts� is�clearly�delimited�to�individuals�who�left�university�and�did�not�re�enter�neither�in�the�same�course�nor�in�another�one2,�they�can�be�considered�as�a�type�of�control�group�in�a�quasi�experimental�design,� which� can� contribute� to� estimate� the� impact� of� a� university� degree� on�employment�chances�and�income�of�individuals.�This�may�be�important,�because�“one�of� the� criticisms�of� tracer� studies� is� that� it� is�difficult� to� construct� a� control� group�of�
298 World Bank Working Paper
�
individuals�who�have�not�undergone�the�educational�training”.3�In�the�case�of�TEVET,�the�control�group�does�not�comprise�dropouts,�but�a�small�sample�of�worker�who�did�not�participate�in�any�type�of�course�or�training�program.�
In� the� context� of� graduate� surveys,� sometimes� employer� surveys� are� conducted�additionally.�They�can�provide�additional�and�complementary� information�which�are�not�or�only�partially�available� for�graduates� (recruitment�criteria�and�procedures,� the�reputation�of�universities�etc).�They�can�also�give�experiences�and�perceptions�from�a�different�point�of�view,�so�that�a�higher�level�of�validity�of�data�can�be�established.��
2. Objectives of the Study
Existing� data,� generated� by� Tracer� Studies� conducted� in� Malawi� in� the� past,� are�outdated�and/or�limited�in�scope.4�The�present�Tracer�Study�aims�to�generate�updated�and� valid� information� needed� on� relevance� and� external� efficiency� of� Technical,�Entrepreneurial,� and� Vocational� Education� and� training� (TEVET)� and� Higher�Education� (HE).� This� information� is� to� be� used� as� relevant� input� into� the� Malawi�Education� Country� Status� Report� (CSR),� which� is� currently� being� conducted� by� the�government�of�Malawi.��
The� general� objective� of� the� study� is� to� assess� the� external� efficiency� of� TEVET� and�higher�education�programs� in�Malawi,� and� identify�needed� improvement�of� existing�educational�structures�and�processes.�
�The� specific� objectives� are� related� to� generate� information� on� the� following� topics�considering� disparities� and� differences� by� types� of� training� and� study,� certificates,�institutions,�gender,�origin,�and�levels:�
� employment�destinations�of�completers�of�the�TEVET/HE�programs�� professional�success�of�completers�of�the�TEVET/HE�programs�� relevance�of�knowledge�and�skills�acquired�by�TEVET/HE�program��� match�between�field�of�study�and�field�of�occupation�� preparation�for�self�employment�(if�needed)�� job�satisfaction�of�completers�of�the�TEVET/HE�programs�� assessment�of�training/study�conditions,�relevance,�and�effectiveness��� satisfaction�of�employers�with�the�level�of�competencies�of�HE�graduates�� satisfaction�of�employers�with�the�level�of�competencies�of�TEVET�completers�� reasons�for�leaving�and�present�occupational�situation�of�HE�dropouts�� identification� of� practices� that� can� contribute� to� improved� efficiency� of�
programs.�
A� complementary� objective� is� to� generate� methodological� experience� and� develop�capacity�in�conducting�Tracer�Studies�in�Malawi.�

The Education System in Malawi 299
�
3. Methodology
3.1. General Approach
According� to� the� general� rules� of� Survey� Studies� and� taking� into� consideration� the�specific�conditions�in�Malawi,�the�approach�involved�six�steps�with�different�activities�outlined�below.��Phase 1 Project Inception Phase 2 Development of Questionnaires Phase 3 Preparation of Field Phase Phase 4 Data Collection and Data Entry Phase 5 Data Analysis Phase 6 Preparation and submission of Draft/Final Report
�In� the� inception� phase� meetings� with� a� Reference� Group� composed� of�
representatives�of�different�institutions�and�offices�(GTZ,�World�Bank,�MOE,�MOLSD,�and� TEVETA)� took� place.� The� meetings� intended� to� enable� members� to� reach� a�consensual� interpretation� of� the� TOR,� the� target� groups� to� be� covered� and� the�methodology�of�the�study,�including�sampling�frame,�and�questionnaires.�Subsequent�meetings�were�held�with�various�officials�of�TEVETA�and�the�JIMAT�consulting�group.�
3.2. Target population
The�following�four�target�groups�have�been�covered�by�the�study:�
� completers�of�formal,�parallel�and�other�(including�informal)�TEVET�programs�� graduates� of� higher� education� courses� excluding� the� health� and� education�
sector� (medicine,� nursery,� teacher� education)�which� is� predominantly�public�organized�
� employers�that�employ�graduates�and�TEVET�leavers�� higher�education�dropouts.�
The� survey� accessed� HE� graduates/TEVET� completers� and� HE� dropouts,� who�finished� their� course� in� the� four� year� interval� 2004–07,� a� period� that� fit� to� the� usual�standards�in�Tracer�Studies.�
In�addition� to� these� three�groups,� employers�of�different� size�and� sectors,�which�have�actually�employed�TEVET�people�and�HE�graduate,�have�been�targeted.5��
3.3. Data collection
Generally,�data�collection�was�done� in� two�phases.�The� first�phase� involved�personal�visits� to� the� training� institutions� in� order� to� get� the� initial� database/personal� contact�details�for�the�completers�and�graduates.�The�visit�was�complemented�by�phone�calls,�e�mails�and�fax.�However,�due�to�non�completeness�of�database�in�most�of�the�training�institutions,�an�advertisement�for�the�database�was�also�made�through�the�print�media.�This�was�an�appeal�to�the�targeted�completers�to�forward�their�current�contact�details�for�a�possible�inclusion�into�the�study.�
Within� this� phase,� phone� calls�were�made� directly� to� those�who� had� left� phone�numbers� in� the� training� institutions.� Where� the� phone� numbers� were� for�

300 World Bank Working Paper
�
guardians/parents,�attempts�were�made�to�get�the�contact�details�of�their�wards.�This�approach� helped� in� updating� and� consolidating� the� database� for� the� targeted�completers� and� graduates.� In� addition,� the� phone� calls� helped� to� book� for� the�interviews.�
Nonetheless,� not� all� the� targeted� 1,000� TEVET� completers,� 500� graduates,� 200�employers�and�100�university�dropouts�were�contacted�within�the�phase�one.�
In�phase�two,�multiple�methods�were�deployed�in�order�to�reach�out�and�interview�the� targeted� respondents.� A� total� of� 30� enumerators� were� trained� to� interview� the�respondents� using� structured� questionnaires� including� some� open� questions.� These�enumerators�were�deployed�initially�in�all�the�28�districts,� later�on�more�enumerators�went�into�the�cities�to�complement�those�who�were�already�there.�
Another� approach� used�was� the� area� point� sampling� in�which� the� geographical�locations� were� demarcated� then� enumerators� interviewed� representatives� of� those�locations.�This�approach�was�particularly�helpful�in�the�informal�sector,�which�did�not�leave� documentation� of� their� localities� at� the� training� institution� and� indeed� had�changed�locations�several�times�after�training.�Snowball�method�in�which�enumerators�asked�for� information�for�others�from�the�one�who�had� just�been�interviewed�proved�worthwhile� especially� in� getting� contact�details� and�booking� for�university�dropouts�and�graduates.�
As� for� employers,� a� combination�of� approaches�was�used.�Where�graduates� and�completers�indicated�to�be�on�employment,�their�employers�were�interviewed�as�well.�The�Business� Information�Register�was�also�used� to� select� targeted�employers� across�the�country�and�across�sectors�of�the�economy.�However,�where�those�employers�did�not� or�had�never�occupied� either� a�TEVET� completer� or� a� graduate,� such� employers�were�replaced�with�others�within�the�same�locality�and�preferably�the�same�sector.�
3.4. Data entry and analysis
Before� data� entry,� the� returned� questionnaires� were� checked� for� completeness� and�consistency.�The�data�was�analyzed�statistically�using�the�SPSS�PC,�V.16�software.�The�analysis� mainly� included� descriptive� statistics,� cross�tabulations,� correlation,� factor�analysis,�and�cluster�analysis.�The�graphs�have�been�plotted�by�EXCEL.�
Notes �1� Tinto,� V.,� 1975,� “Dropout� from� Higher� Education,”�Review� of� Educational� Research� 45,� pp.89–125;�Heublein,�U.,�H.�Spangenberg,�and�D.�Sommer,�2002,�Ursachen�des�Studienabbruchs,�HIS:�Hannover.��2�Students�who�left�the�university�and�reenter�after�a�certain�time�are�defined�as�“interrupters.”�3� Hughes,� Sarah,� and� Julia� Lane.� “Literature� Review� of� Education�Related� Tracer� Studies� in�Developing�Countries.”�University�of�Chicago.��4�PJ�Development�Consultancy�Company,�2005,�“‘Skills�development�Initiative’�and� ‘On�the� job�training’� beneficiaries,”� Tracer� study� for� TEVETA,� Lilongwe;� S.N.� Zembere,� and� M.P.M.�Chinyama,�1996,�The�University�of�Malawi�Tracer�Study,�University�of�Malawi.�5�The�results�of�the�employer�survey�will�not�be�reported�separately�but�will�be�included�in�the�TEVET� and� the� HE� study� in� order� to� complete� and� cross� validate� the� data� collected� by� the�interviews.�
301
Part�II:�Higher�Education��Tracer�Study�
Introduction: The Context of the University System in Malawi
Soon� after� political� independence,� the� government� of� Malawi� established� a� public�university� called� the� University� of� Malawi.� The� principal� aim� seems� to� link� to� the�provision�of�human�resource�base� trained� to�be�managers� in�both�public�and�private�sectors.�Hence�over�the�years,�University�of�Malawi�grew�into�five�constituent�colleges�with� one� central� control� centre� known� as� the�University�Office.�With� the� coming� of�political�and�economic�liberalization,�a�need�for�and�indeed�another�public�university�of� Mzuzu� was� established.� Simultaneously,� the� church� and� other� private� entities�established�their�own�universities�offering�various�curricula.�At�the�time�of�the�tracer�study,� there� were� four� government�accredited� universities,� namely;� University� of�Malawi,� Mzuzu� University,� Shareworld� Open� University,� and� University� of�Livingstonia.� Entry� into� the� public� universities� is� controlled� by� government� policies,�availability� of� space� and� resource� consideration�whereas� the� private� universities� are�still�in�their�infant�phase�of�development.�All�this�implies�that�student�intake�into�the�university�system�is�largely�limited.�
Therefore� the� total� enrolment� is� only� about� 7,000� students� in� all� programs� and�about� 1,000� students� are� awarded� yearly,� giving� an� `elitist`� character� to� the� system.�“This�capacity�restriction�is�one�of�the�principal�causes�for�the�disproportionately�high�cost�of�higher�education�per�student,�relative�to�regional�levels,�reported�to�be�US$2,884�for�the�2003/04�financial�year.�By�2006�the�cost�per�student�had�grown�to�about�$4,270�at�UNIMA�and�US$5,169”�at�Mzuzu.1�
The� principal� limit� given� in� the� public� universities� is� the� provision� of� free� and�guaranteed�boarding�and�lodging�to�all�students.�The�access�to�university�is�basically�government�financed.�Nonetheless�government�introduced�an�annual�student�financial�contribution�of�US$170�for�UNIMA�and�US$390�for�Mzuzu.�Meanwhile�some�private�institutions�already�started�to�operate�and�probably�others�will�be�created�in�the�future.�This�diversification�of�the�system�can�be�a�contribution�to�enhance�delivery�of�Higher�Education�on�the�premises�that�a�policy�of�regulation�and�quality�assurance�guarantee the necessary academic standards. �
The� systemic,� managerial,� and� academic� challenges� of� the� system� of� higher�education� in� Malawi� are� reflected� in� the� National� Education� Sector� Plan,� which�proposed� goals� and� strategies� with� respect� to� higher� education� in� order� to� expand�access�and�improve�his�quality�and�relevance.�
302 World Bank Working Paper
�
1. Methodology
The�general�methodological�procedures�of�tracing,�sampling,�and�data�collection�have�been�described�above�in�Part�I.�The�following�section�describes�the�construction�of�the�specific� questionnaires� and� the� basic� characteristics� of� the� samples� for� each� target�group�covered�by�the�Higher�Education�study.�
1.1. Questionnaires
The�development�of�the�questionnaires�for�the�graduates�as�well�as�for�the�employees�was� based� on� standard� instruments� developed� by� the� “Centre� of� Higher� Education�Research”�(CHER)�at�the�University�of�Kassel�Germany.2�
Considering�the�focus�of�the�study�on�aspects�of�external�efficiency�and�the�scope�of�the�target�groups�(graduates�of�all�field�of�studies;�employees�of�the�formal�and�the�informal� sector� occupying� graduates� and/or� TEVET� leavers),� the� instruments� were�subjected� to� an� adaptation� and� reduction� of� the� issues� to� be� covered.� The�questionnaires� were� developed� and� revised� in� consultation� with� all� stakeholders�involved�in�the�study.�
The� questionnaire� for� the� dropouts� was� compiled� by� the� consultants� using�elements�of�instruments�of�different�studies�and�self�developed�items.��
1.2. Size of Samples
In�keeping�with�the�TOR,�a�sample�size�of�500�HE�graduates�was�envisaged.�As�some�of� the�completers�were�out�of� the� time�range�2004�2007�or�had�earned�a�qualification�less�than�Diploma�the�sample�comprised�n=492�HE�completers.�
As� the� decision� of� the� CSR� team� to� include� also� dropouts� was� taken� after� the�inception�phase,�only�a�small�sample�of�initially�n=101�could�be�envisaged.�Also�in�this�case� some� units� were� out� of� the� time� range� 2004�2007,� so� that� final� size� was� n=91�dropouts.�
The� limited� employers� survey� suggested� in� the� TOR� included� a� total� of� n=220�employers� (companies� or� organizations).� Out� of� this� number� n=134� employers�occupied�university�graduates�and�post�graduates.�For�purpose�of�the�HE�survey,�only�this�subgroup�is�relevant�and�included�in�the�analysis.�
1.3. Characteristics of the Samples
According� to� the�TOR,� the� sample�of� the�HE�graduates3� included�all� field�of� studies�less� the� health� sector,� teacher� education� and� other� areas� providing� mainly� human�resources� for� the� public� sector.� The� study� targeted� all� government� accredited�University�Institutions,�namely�University�of�Malawi,�Mzuzu�University,�University�of�Livingstonia�and�Shareworld�Open�University.�At�the�time�of�data�collection,�however,�University� of� Livingstonia� had� graduated� teachers� only� according� to� the� initial�database� collection� exercise.� Consequently,� all� those� graduates� were� working� in�government� Institutions.� This� left� the� study� with� three� Universities,� University� of�Malawi,�Mzuzu�University,� and� Shareworld.� Shareworld� did� not� provide� the� initial�database�hence�the�data�collection�depended�much�on�snowball�approach.�Resultantly,�a�few�graduates�from�this�University�were�reached�out.�
University�of�Malawi�had�five�constituent�colleges.�These�are:�Chancellor�College,�Bunda�College�of�Agriculture,�Malawi�Polytechnic,�Kamuzu�College�of�Nursing,�and�

The Education System in Malawi 303
�
College� of� Medicine.� By� their� nature,� Kamuzu� College� of� Nursing,� and� College� of�Medicine�train�in�health,�therefore�graduates�from�these�did�not�qualify�for�the�study�as� the�graduates�work� in� the�public�health�sector.�The�study�therefore� targeted� those�graduates� from� Chancellor� College,� Malawi� Polytechnic� and� Bunda� College� of�Agriculture.�
The� demographic� background� characteristics� of� the� samples� are� given� in� the�sampling�frame�below,�based�on�the�number�of�valid�cases.���Sampling Frame
Graduates Drop outs Employers Year of finishing course or leaving university
2004 N=117 N=15 2005 N=115 N=26 2006 N=132 N=27 2007 N=128 N=23 Age Mean 28 27 SD 4.8 3.5 Gender % male 71 74,7 female 29 25.3 Region % North 13.9 17.6 40 Central 32.7 24.2 73 South 53.4 58.2 107 Location % Urban 77.7 70.3 Rural 22.3 29.7 No of employees in the branch of company %
1-10 36.1 11-50 42.0 51-100 7.1 >100 16.8 No of employees in the whole company %
1-10 22.2 11-50 29.8 51-100 11.7 >100 36.3 �
The�sample�meets�largely�criterions�of�representativeness.�All�relevant�institutions�had� their� completers� covered� in� the� study.� All� administrative� districts� were� fully�covered� and� special� coverage� emphasis� was� done� for� the� four� cities.� This� is� why�questionnaire�retention�rate�was�100�percent.�
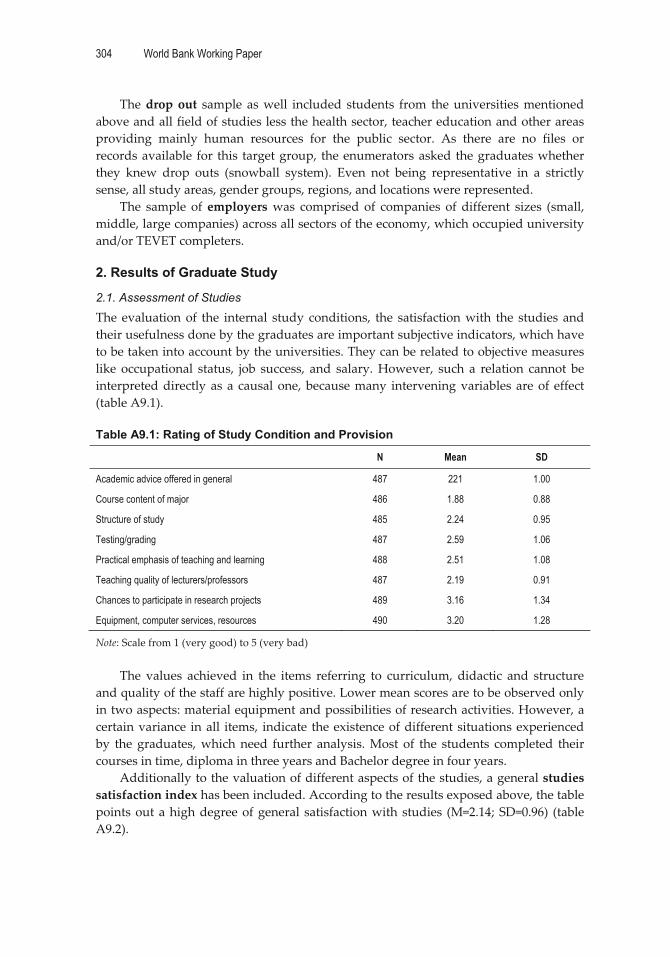
304 World Bank Working Paper
�
The�drop�out� sample� as�well� included� students� from� the�universities�mentioned�above�and�all�field�of�studies�less�the�health�sector,�teacher�education�and�other�areas�providing� mainly� human� resources� for� the� public� sector.� As� there� are� no� files� or�records�available� for� this� target�group,� the�enumerators�asked�the�graduates�whether�they� knew� drop� outs� (snowball� system).� Even� not� being� representative� in� a� strictly�sense,�all�study�areas,�gender�groups,�regions,�and�locations�were�represented.�
The� sample� of�employers�was� comprised� of� companies� of� different� sizes� (small,�middle,�large�companies)�across�all�sectors�of�the�economy,�which�occupied�university�and/or�TEVET�completers.�
2. Results of Graduate Study
2.1. Assessment of Studies
The�evaluation�of� the� internal� study� conditions,� the� satisfaction�with� the� studies�and�their�usefulness�done�by�the�graduates�are�important�subjective�indicators,�which�have�to�be�taken�into�account�by�the�universities.�They�can�be�related�to�objective�measures�like� occupational� status,� job� success,� and� salary.�However,� such� a� relation� cannot� be�interpreted�directly�as�a� causal�one,�because�many� intervening�variables�are�of� effect�(table�A9.1).��Table A9.1: Rating of Study Condition and Provision
N Mean SD
Academic advice offered in general 487 221 1.00
Course content of major 486 1.88 0.88
Structure of study 485 2.24 0.95
Testing/grading 487 2.59 1.06
Practical emphasis of teaching and learning 488 2.51 1.08
Teaching quality of lecturers/professors 487 2.19 0.91
Chances to participate in research projects 489 3.16 1.34
Equipment, computer services, resources 490 3.20 1.28
Note:�Scale�from�1�(very�good)�to�5�(very�bad)��
The� values� achieved� in� the� items� referring� to� curriculum,� didactic� and� structure�and�quality�of�the�staff�are�highly�positive.�Lower�mean�scores�are�to�be�observed�only�in�two�aspects:�material�equipment�and�possibilities�of�research�activities.�However,�a�certain�variance� in�all� items,� indicate� the�existence�of�different�situations�experienced�by� the� graduates,�which�need� further� analysis.�Most� of� the� students� completed� their�courses�in�time,�diploma�in�three�years�and�Bachelor�degree�in�four�years.��
Additionally�to�the�valuation�of�different�aspects�of�the�studies,�a�general�studies�satisfaction�index�has�been�included.�According�to�the�results�exposed�above,�the�table�points�out�a�high�degree�of�general� satisfaction�with�studies� (M=2.14;�SD=0.96)� (table�A9.2).���
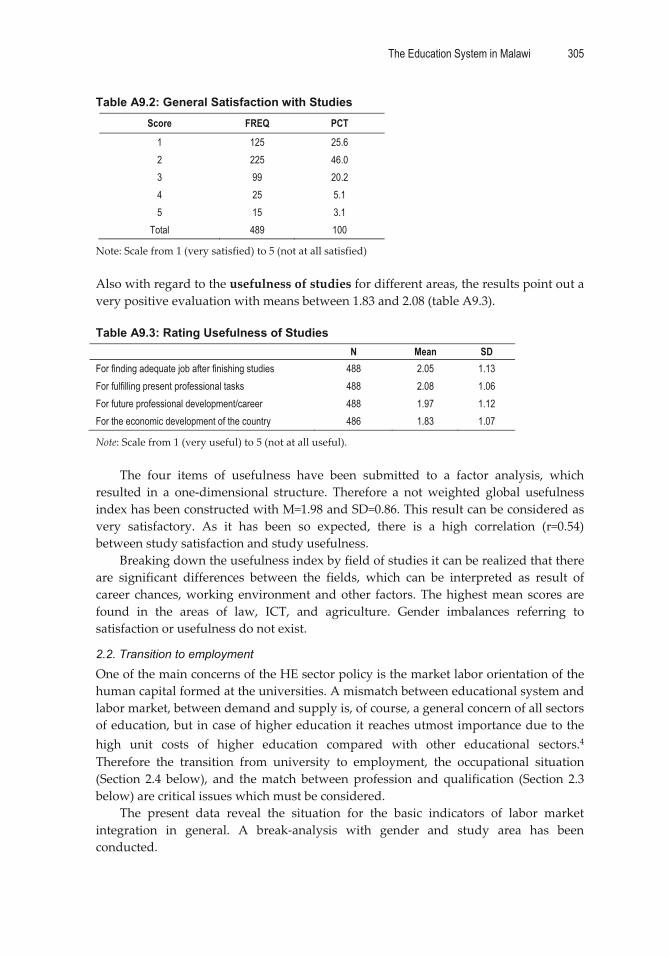
The Education System in Malawi 305
�
Table A9.2: General Satisfaction with Studies Score FREQ PCT
1 125 25.6 2 225 46.0 3 99 20.2 4 25 5.1 5 15 3.1
Total 489 100
Note:�Scale�from�1�(very�satisfied)�to�5�(not�at�all�satisfied)��Also�with�regard�to�the�usefulness�of�studies�for�different�areas,�the�results�point�out�a�very�positive�evaluation�with�means�between�1.83�and�2.08�(table�A9.3).��Table A9.3: Rating Usefulness of Studies
N Mean SD For finding adequate job after finishing studies 488 2.05 1.13 For fulfilling present professional tasks 488 2.08 1.06 For future professional development/career 488 1.97 1.12 For the economic development of the country 486 1.83 1.07
Note:�Scale�from�1�(very�useful)�to�5�(not�at�all�useful).��
The� four� items� of� usefulness� have� been� submitted� to� a� factor� analysis,� which�resulted� in� a� one�dimensional� structure.� Therefore� a� not�weighted� global� usefulness�index�has�been�constructed�with�M=1.98�and�SD=0.86.�This�result�can�be�considered�as�very� satisfactory.� As� it� has� been� so� expected,� there� is� a� high� correlation� (r=0.54)�between�study�satisfaction�and�study�usefulness.�
Breaking�down�the�usefulness�index�by�field�of�studies�it�can�be�realized�that�there�are� significant� differences� between� the� fields,� which� can� be� interpreted� as� result� of�career� chances,�working�environment�and�other� factors.�The�highest�mean�scores� are�found� in� the� areas� of� law,� ICT,� and� agriculture.� Gender� imbalances� referring� to�satisfaction�or�usefulness�do�not�exist.�
2.2. Transition to employment
One�of�the�main�concerns�of�the�HE�sector�policy�is�the�market�labor�orientation�of�the�human�capital�formed�at�the�universities.�A�mismatch�between�educational�system�and�labor�market,�between�demand�and�supply�is,�of�course,�a�general�concern�of�all�sectors�of�education,�but�in�case�of�higher�education�it�reaches�utmost�importance�due�to�the�high� unit� costs� of� higher� education� compared� with� other� educational� sectors.4�Therefore� the� transition� from� university� to� employment,� the� occupational� situation�(Section� 2.4� below),� and� the�match� between�profession� and� qualification� (Section� 2.3�below)�are�critical�issues�which�must�be�considered.�
The� present� data� reveal� the� situation� for� the� basic� indicators� of� labor� market�integration� in� general.� A� break�analysis� with� gender� and� study� area� has� been�conducted.�
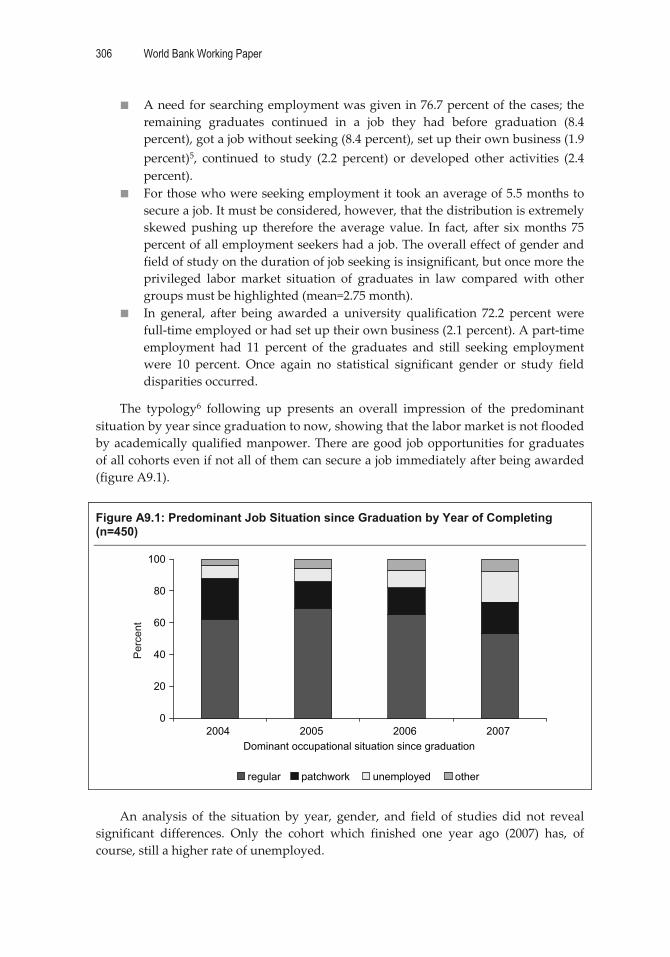
306 World Bank Working Paper
�
� A�need�for�searching�employment�was�given�in�76.7�percent�of�the�cases;�the�remaining� graduates� continued� in� a� job� they� had� before� graduation� (8.4�percent),�got�a�job�without�seeking�(8.4�percent),�set�up�their�own�business�(1.9�percent)5,� continued� to� study� (2.2� percent)� or� developed� other� activities� (2.4�percent).��
� For�those�who�were�seeking�employment�it�took�an�average�of�5.5�months�to�secure�a�job.�It�must�be�considered,�however,�that�the�distribution�is�extremely�skewed�pushing�up� therefore� the� average�value.� In� fact,� after� six�months� 75�percent�of�all�employment�seekers�had�a�job.�The�overall�effect�of�gender�and�field�of�study�on�the�duration�of�job�seeking�is�insignificant,�but�once�more�the�privileged� labor� market� situation� of� graduates� in� law� compared� with� other�groups�must�be�highlighted�(mean=2.75�month).�
� In� general,� after� being� awarded� a� university� qualification� 72.2� percent�were�full�time�employed�or�had�set�up�their�own�business�(2.1�percent).�A�part�time�employment� had� 11� percent� of� the� graduates� and� still� seeking� employment�were� 10� percent.� Once� again� no� statistical� significant� gender� or� study� field�disparities�occurred.��
The� typology6� following� up� presents� an� overall� impression� of� the� predominant�situation�by�year�since�graduation�to�now,�showing�that�the�labor�market�is�not�flooded�by�academically�qualified�manpower.�There�are�good� job�opportunities� for�graduates�of�all�cohorts�even�if�not�all�of�them�can�secure�a�job�immediately�after�being�awarded�(figure�A9.1).��
�
Figure A9.1: Predominant Job Situation since Graduation by Year of Completing (n=450)
0
20
40
60
80
100
2004 2005 2006 2007Dominant occupational situation since graduation
regular patchwork unemployed other
Per
cent
��An� analysis� of� the� situation� by� year,� gender,� and� field� of� studies� did� not� reveal�
significant� differences.� Only� the� cohort� which� finished� one� year� ago� (2007)� has,� of�course,�still�a�higher�rate�of�unemployed.�
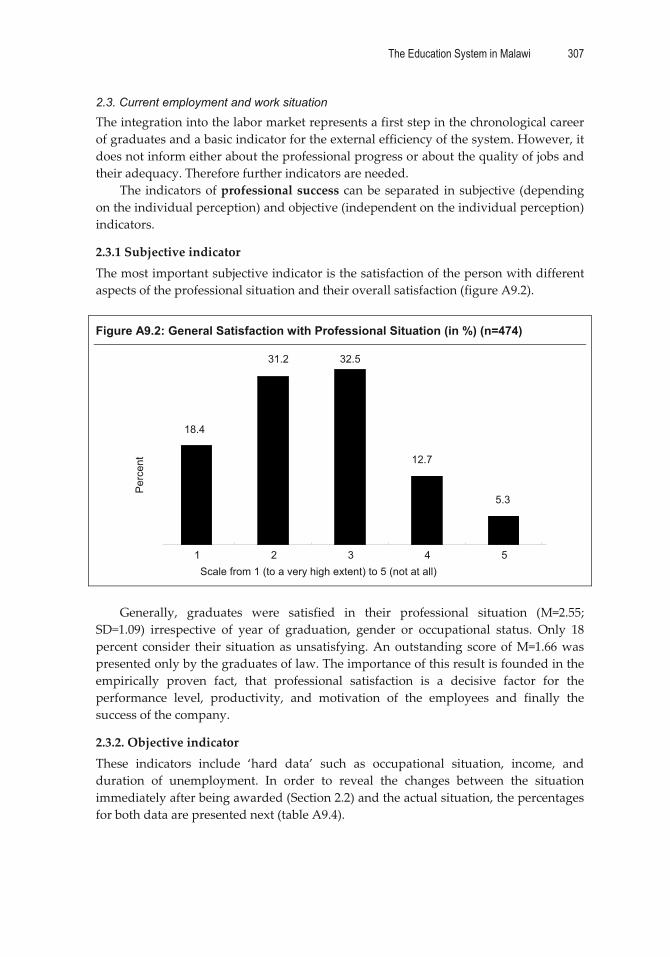
The Education System in Malawi 307
�
2.3. Current employment and work situation
The�integration�into�the�labor�market�represents�a�first�step�in�the�chronological�career�of�graduates�and�a�basic�indicator�for�the�external�efficiency�of�the�system.�However,�it�does�not�inform�either�about�the�professional�progress�or�about�the�quality�of�jobs�and�their�adequacy.�Therefore�further�indicators�are�needed.�
The� indicators�of�professional�success�can�be�separated� in�subjective�(depending�on�the�individual�perception)�and�objective�(independent�on�the�individual�perception)�indicators.�
2.3.1�Subjective�indicator�The�most�important�subjective�indicator�is�the�satisfaction�of�the�person�with�different�aspects�of�the�professional�situation�and�their�overall�satisfaction�(figure�A9.2).��
Figure A9.2: General Satisfaction with Professional Situation (in %) (n=474)
��
Generally,� graduates� were� satisfied� in� their� professional� situation� (M=2.55;�SD=1.09)� irrespective� of� year� of� graduation,� gender� or� occupational� status.� Only� 18�percent� consider� their� situation�as�unsatisfying.�An�outstanding� score�of�M=1.66�was�presented�only�by�the�graduates�of�law.�The�importance�of�this�result�is�founded�in�the�empirically� proven� fact,� that� professional� satisfaction� is� a� decisive� factor� for� the�performance� level,� productivity,� and� motivation� of� the� employees� and� finally� the�success�of�the�company.�
2.3.2.�Objective�indicator�These� indicators� include� ‘hard� data’� such� as� occupational� situation,� income,� and�duration� of� unemployment.� In� order� to� reveal� the� changes� between� the� situation�immediately�after�being�awarded�(Section�2.2)�and�the�actual�situation,�the�percentages�for�both�data�are�presented�next�(table�A9.4).��
18.4
31.2 32.5
12.7
5.3
1 2 3 4 5
Per
cent
Scale from 1 (to a very high extent) to 5 (not at all)
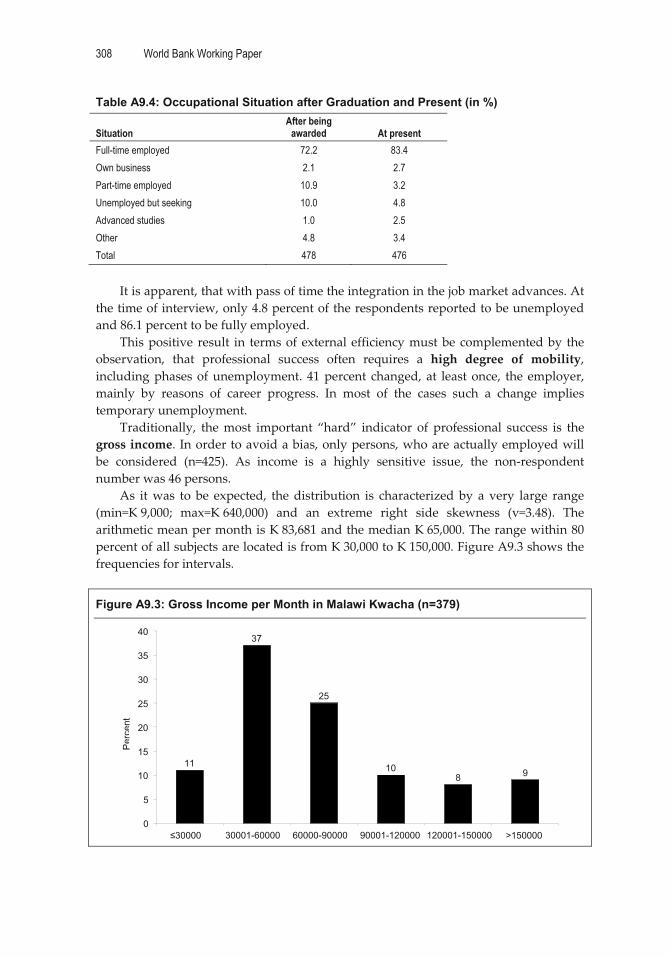
308 World Bank Working Paper
�
Table A9.4: Occupational Situation after Graduation and Present (in %)
Situation After being
awarded At present Full-time employed 72.2 83.4 Own business 2.1 2.7 Part-time employed 10.9 3.2 Unemployed but seeking 10.0 4.8 Advanced studies 1.0 2.5 Other 4.8 3.4 Total 478 476
�It�is�apparent,�that�with�pass�of�time�the�integration�in�the�job�market�advances.�At�
the�time�of�interview,�only�4.8�percent�of�the�respondents�reported�to�be�unemployed�and�86.1�percent�to�be�fully�employed.�
This�positive� result� in� terms�of�external�efficiency�must�be�complemented�by� the�observation,� that� professional� success� often� requires� a� high� degree� of� mobility,�including�phases�of�unemployment.� 41�percent� changed,�at� least�once,� the�employer,�mainly� by� reasons� of� career� progress.� In� most� of� the� cases� such� a� change� implies�temporary�unemployment.�
Traditionally,� the�most� important� “hard”� indicator� of� professional� success� is� the�gross�income.� In�order�to�avoid�a�bias,�only�persons,�who�are�actually�employed�will�be� considered� (n=425).� As� income� is� a� highly� sensitive� issue,� the� non�respondent�number�was�46�persons.�
As� it�was� to� be� expected,� the�distribution� is� characterized�by� a� very� large� range�(min=K�9,000;� max=K�640,000)� and� an� extreme� right� side� skewness� (v=3.48).� The�arithmetic�mean�per�month�is�K�83,681�and�the�median�K�65,000.�The�range�within�80�percent�of�all�subjects�are�located�is�from�K�30,000�to�K�150,000.�Figure�A9.3�shows�the�frequencies�for�intervals.��
Figure A9.3: Gross Income per Month in Malawi Kwacha (n=379)
��
11
37
25
108 9
0
5
10
15
20
25
30
35
40
�30000 30001-60000 60000-90000 90001-120000 120001-150000 >150000
Per
cent
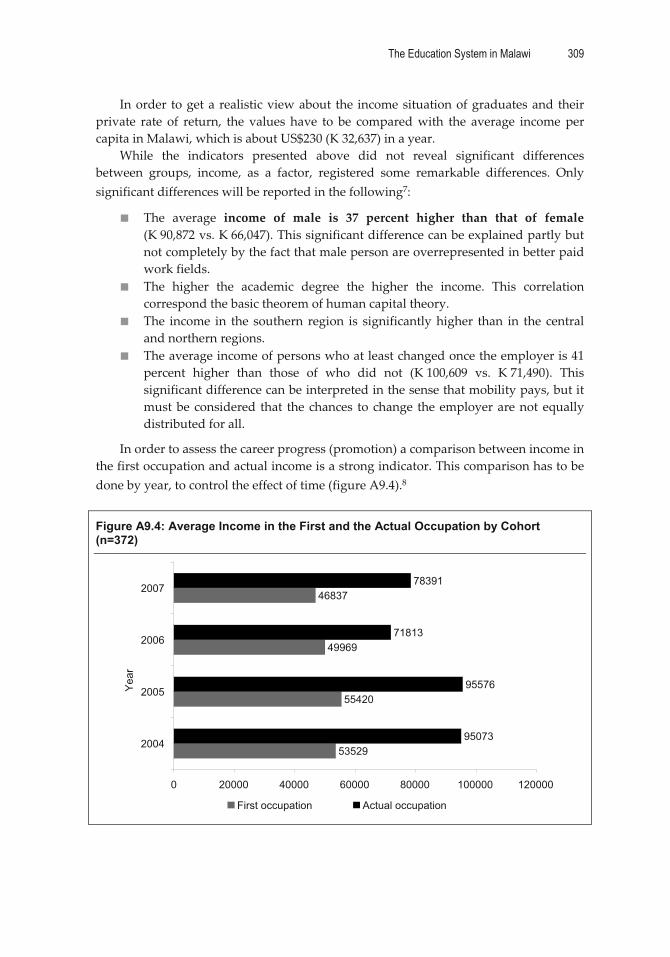
The Education System in Malawi 309
�
In�order� to�get�a�realistic�view�about� the� income�situation�of�graduates�and�their�private� rate� of� return,� the� values� have� to� be� compared�with� the� average� income�per�capita�in�Malawi,�which�is�about�US$230�(K�32,637)�in�a�year.�
While� the� indicators� presented� above� did� not� reveal� significant� differences�between� groups,� income,� as� a� factor,� registered� some� remarkable� differences.� Only�significant�differences�will�be�reported�in�the�following7:�
� The� average� income� of� male� is� 37� percent� higher� than� that� of� female�(K�90,872�vs.�K�66,047).�This�significant�difference�can�be�explained�partly�but�not�completely�by�the�fact�that�male�person�are�overrepresented�in�better�paid�work�fields.�
� The� higher� the� academic� degree� the� higher� the� income.� This� correlation�correspond�the�basic�theorem�of�human�capital�theory.��
� The� income� in� the� southern� region� is� significantly�higher� than� in� the� central�and�northern�regions.�
� The�average�income�of�persons�who�at�least�changed�once�the�employer�is�41�percent� higher� than� those� of� who� did� not� (K�100,609� vs.� K�71,490).� This�significant�difference�can�be�interpreted�in�the�sense�that�mobility�pays,�but�it�must�be�considered� that� the�chances� to�change� the�employer�are�not�equally�distributed�for�all.�
In�order�to�assess�the�career�progress�(promotion)�a�comparison�between�income�in�the�first�occupation�and�actual�income�is�a�strong�indicator.�This�comparison�has�to�be�done�by�year,�to�control�the�effect�of�time�(figure�A9.4).8��
Figure A9.4: Average Income in the First and the Actual Occupation by Cohort (n=372)
�
53529
55420
49969
46837
95073
95576
71813
78391
0 20000 40000 60000 80000 100000 120000
2004
2005
2006
2007
Yea
r
First occupation Actual occupation

310 World Bank Working Paper
�
For�all�cohorts�an�increase�of�income�took�place�with�15�20�percent�in�average�per�year,� except� for� the� 2007� cohort�which� experienced� in� only� one� year� a� growth� of� 67�percent.�In�order�to�decompose�these�growth�rates�in�a�general�component�of�economic�growth� and� a� component� of� individual� promotion� further� econometrical� analysis� is�needed.� But� it� cannot� be� doubted� that� by� and� large� the� promotion� progress� for� all�employed�graduates�is�fast.�
2.4. Relation between studies and profession
Tertiary� education� is� by� nature� a� long�term� project� meanwhile� the� modern� labor�markets�are�short�term�oriented.�Therefore,�a�synchronism�between�both�subsystems�is�not�easy�to�realize.�Lack�or�excess�of�academic�qualified�manpower,�over�,�under�,�or�miss�qualification�are�the�consequence,�and�the�external�efficiency�remains�low.�
As� demonstrated� above,� the� absorption� of� academic� qualified�manpower� by� the�labor� market� in� Malawi� as� well� as� the� indicators� of� professional� success� can� be�considered� as� somewhat� satisfying� but�with� room� for� improvement.� For� a� complete�assessment� of� the� external� efficiency,� however,� the� adequacy� of� the� knowledge�acquired� at� university� is� of� utmost� importance.� This� includes� on� one� hand� the�possibility�for�the�graduates�to�make�use�of�their�qualification�and�for�the�employers�on�the�other�hand�to�have�at�disposal�the�qualifications�needed.��
2.4.1.�The�view�of�the�graduates�As�pointed�out�in�Section�2.1,�the�assessment�of�the�utility�of�studies�for�fulfilling�their�professional� tasks� by� the� graduates�was� rather� positive.�Another� aspect� of� the� same�issue� is� to� what� extent� they� could� make� use� of� qualifications� acquired� during� their�study.�This�measure�can�also�be�taken�as�an�output�indicator�for�the�efficiency�of�study�(table�A9.5).���Table A9.5: Extent of Use of Qualification Score FREQ PCT 1 153 33.9 2 147 32.6 3 107 23.7 4 31 6.9 5 13 2.9 Total 451 100.0 Missing 46
Note:�Scale�from�1�(to�a�very�high�extent)�to�5�(not�at�all).��
It�is�quite�encouraging,�that�the�data�reveal�a�high�or�even�a�very�high�extent�of�use�(66.6�percent)�with�mean=2.12�and�SD=1.05�on� the� five�point�scale.�As� to�be�expected�there�is�a�strong�correlation�(r=0.45)�with�the�rating�of�usefulness�of�studies.�Using�the�results� of� both� indicators� to� carry� out� a� cluster� analysis,� there� is� evidence� that� 78�percent� of� the� respondents� consider� their� studies� as� very� useful� for� fulfilling� their�professional� and� effectively� make� use� of� the� knowledge� acquired.� Only� 17� percent�assess�their�studies�as�not�very�useful�and�in�consequence�only�make�little�use�of�their�qualifications� for� fulfilling� their� professional� tasks.� The� highest� average� score� in� this�
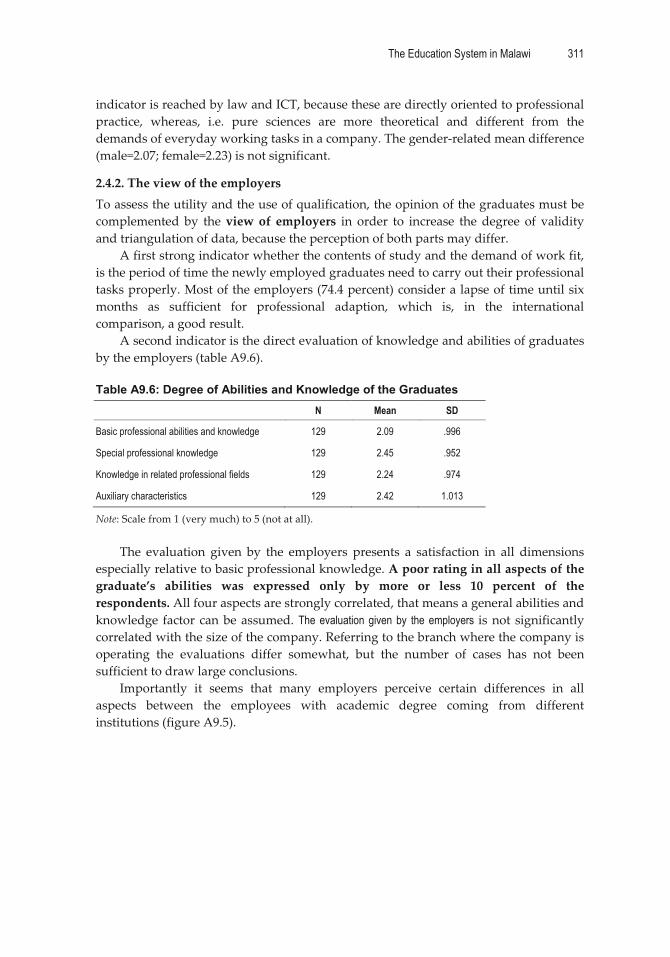
The Education System in Malawi 311
�
indicator�is�reached�by�law�and�ICT,�because�these�are�directly�oriented�to�professional�practice,� whereas,� i.e.� pure� sciences� are� more� theoretical� and� different� from� the�demands�of�everyday�working�tasks�in�a�company.�The�gender�related�mean�difference�(male=2.07;�female=2.23)�is�not�significant.�
2.4.2.�The�view�of�the�employers�To�assess�the�utility�and�the�use�of�qualification,�the�opinion�of�the�graduates�must�be�complemented� by� the�view�of� employers� in� order� to� increase� the� degree� of� validity�and�triangulation�of�data,�because�the�perception�of�both�parts�may�differ.�
A�first�strong�indicator�whether�the�contents�of�study�and�the�demand�of�work�fit,�is�the�period�of�time�the�newly�employed�graduates�need�to�carry�out�their�professional�tasks�properly.�Most�of�the�employers�(74.4�percent)�consider�a�lapse�of�time�until�six�months� as� sufficient� for� professional� adaption,� which� is,� in� the� international�comparison,�a�good�result.�
A�second�indicator�is�the�direct�evaluation�of�knowledge�and�abilities�of�graduates�by�the�employers�(table�A9.6).��Table A9.6: Degree of Abilities and Knowledge of the Graduates
N Mean SD
Basic professional abilities and knowledge 129 2.09 .996
Special professional knowledge 129 2.45 .952
Knowledge in related professional fields 129 2.24 .974
Auxiliary characteristics 129 2.42 1.013
Note:�Scale�from�1�(very�much)�to�5�(not�at�all).��
The� evaluation� given� by� the� employers� presents� a� satisfaction� in� all� dimensions�especially�relative�to�basic�professional�knowledge.�A�poor�rating�in�all�aspects�of�the�graduate’s� abilities� was� expressed� only� by� more� or� less� 10� percent� of� the�respondents.�All�four�aspects�are�strongly�correlated,�that�means�a�general�abilities�and�knowledge� factor�can�be�assumed.�The evaluation given by the employers is�not� significantly�correlated�with�the�size�of�the�company.�Referring�to�the�branch�where�the�company�is�operating� the� evaluations� differ� somewhat,� but� the� number� of� cases� has� not� been�sufficient�to�draw�large�conclusions.�
Importantly� it� seems� that� many� employers� perceive� certain� differences� in� all�aspects� between� the� employees� with� academic� degree� coming� from� different�institutions�(figure�A9.5).��

312 World Bank Working Paper
�
Figure A9.5: Differences between Graduates from Different Institutions (n=121)
Scale from 1=very much to 5=not at all
0
5
10
15
20
25
30
35
Basic professionalknowledge
Special professionalknowledge
Knowledge inrelated fields
Auxiliarycharacteristics
Per
cent
1 2 3 4 5
��Little� is�known�about� the�causes�of� this� inter�institutional�variance,�whose�analysis� is�beyond�the�scope�of�this�study.��
2.5. Appropriateness of professional situation and level of education
The� question� that� how� far� the� actual� professional� situation� (status,� income,� tasks)�corresponds�to�the�educational�level�catches�different�areas.�It�summarizes�the�relation�between�studies�and�profession�(Section�2.4),�the�professional�success�(Section�2.3)�and�finally�the�core�issue�in�how�far�the�educational�and�occupational�system�fit.�The�well�known�phenomenon�of�over�qualification�can�be�covered�by�this�indicator—even�if�the�viewpoint�is�a�subjective�one.9��Table A9.7: Extent of Appropriateness of Professional Situation
Score FREQ PCT
1 91 20.4 2 146 32.7 3 121 27.1 4 61 13.6 5 28 6.3 Total 447 100.0 Missing 45
Note:�Scale�from�1�(very�high�extent)�to�5�(not�at�all)��
The Education System in Malawi 313
�
The� average�M=2.51� indicates� a� rather�positive� tendency� and�more� than� the�half�(52.9�percent)�of�all�graduates,�indeed,�feel�that�their�education�qualifications�are�highly�appropriate�to�their�positions�and�status.�Gender�related�differences�do�not�exist�at�all�in�this�indicator�but�there�is�a�certain�variance�between�groups�in�the�field�of�studies.�
There�remains�19.5�percent,�who�felt�that�their�positions�and�status�did�not�match�their� qualifications.� This� is� true� especially� for� the� group� of� only� part�time� employed�graduates.� Once� more� it� must� be� emphasized� that� a� 100� percent� fit� of� the� Higher�Education�system�and�the�labor�market�system�is�a�utopian�benchmark,�so�that�results�as�the�above�are�not�completely�satisfying�but�quite�reasonable.�
As� to� be� expected,� the� feeling� of� appropriateness� has� a� strong� influence� on� the�satisfaction� with� the� professional� situation� (r=0.55).� Use� of� qualifications� acquired,�work� satisfaction� and� correspondence� between� education� level� and� occupational�situation� form� a� complex� construct� for� measuring� professional� success.� Submitting�these� core� indicators� to� a� non�hierarchical� cluster� analysis� it� becomes� once� more�evident� that� there� exists� a� group� of� somewhat� 19� percent� of� graduates� with�occupational�problems�in�a�larger�sense.�This�Group�(Cluster�3)�comprises�persons�not�fully� integrated� in� the� labor� market� or� in� inadequate� positions� and� therefore�unsatisfied.� Its� composition� is� characterized� by� a� strong� over�� representation� of�humanities� (RR=1.63)�and�women�(R=1.38).10� In�order� to�understand�the�patterns�and�causes�of�this�problem�further�analysis�is�needed.�
3. Results of Dropout Study
As�pointed�out�above,�studies�which�track�university�drop�outs�are�rather�rare.�As�far�as�it�is�known�in�Malawi,�no�reliable�data�about�the�reason�and�the�destiny�of�drop�outs�are� available.�Even� the�quantitative�dimension,� the�overall�dropout� rate,� can�only�be�estimated.� The� results� presented� below� can� give� first� empirical� evidence� about� the�reasons�dropping�out�and�the�situation�of�the�dropouts�compared�with�graduates�and�completers�of�TEVET�courses�and�programs.�
3.1. Duration of studies and reason for leaving
The� longer� the� student� courses� at�university�without� success� the�higher� the�waste�of�resources.�The�average�of�3.68�semesters�in�the�present�study�does�not�seem�very�high�in� international� comparison� and� especially� students� with� financial� problems� leave�university�rather�soon.�Nevertheless�it�continues�to�be�a�matter�of�concern.�
For� possible� policy� options� aiming� at� improving� effectiveness,� there� is� need� for�more�information�about�the�reasons�for�dropping�out�(figure�A9.6).��

314 World Bank Working Paper
�
Figure A9.6: Reasons for Dropping Out (in %) (n=90)
personal problems28%
financial problems17%failing grades
32%
conditions of study5%
professional reorientation
1%
diverse17%
�
�It� is�worth�mentioning,�that� in�case�of�female�students�personal�problems�are�the�
main� reason� for�dropping�out� (39.1�percent),� in� the� case� of�male� student� it� is� failing�grades�(34.4�percent).�Financial�problems�occur�in�both�groups�equally.�
Basically� there�are� two�different�constellations� in� the�context�of�dropping�out:� (1)�lack� of� individual� prerequisites� and� (2)� systemic� failures,� which� impede� that� gifted�students� continue� their� studies.� Leaving� university� due� to� lack� of� academic�performance,�demotivation,�or�equivocal�expectations�makes�part�of�a�normal�selection�process� and� the� earlier� this� reorientation� takes�place� the� better.� But� if� the� individual�prerequisites� are� given� and� students� cannot� continue� due� to� financial� or� personal�problems�institutional�support�is�needed.�
3.2. Actual Situation
A�main�concern�is�the�situation�of�the�persons�after�dropping�out.�Are�there�chances�to�insert�in�the�labor�market�or�is�unemployment�the�consequence?�The�data�reflect�a�split�result:�55�percent�are�employed�or�put�their�own�business;�35�percent�are�unemployed�and� 10� percent� are� coursing� some� kind� of� TEVET� program.� The� gender� differences�referring�to�this�issue�are�highly�significant�(p<0.01)�with�a�female�unemployment�rate�(21.7�percent)�much�lower�than�the�average).�The�chances�to�secure�a�job�vary�also�with�the�field�of�study.��
It�can�be�concluded,�that�dropping�out�does�not�lead�automatically�to�social�decline�and�poverty,�but�certainly�the�situation�of�those�who�did�not�finish�their�studies�are�in�a� less� favorable� position� compared� with� the� graduates:� The� unemployment� rate� is�higher�than�in�the�case�of�the�graduates,�they�need�longer�to�find�a�job�or�put�a�business�and�when� they� finally� are� economically� active� they� count�with� an� average� salary� of�only�K�33,267�approximately�38�percent�of�the�average�that�graduates�receive.�As�is�the�case�with�graduates�some�between�group�variances�appear�even�not�so�expressive�as�in�case� of� those.� Furthermore� only� in� a� third� of� all� cases� the� professional� activities� are�related�to� the�former�studies,�so� that� the�knowledge�acquired�at�university�cannot�be�used�effectively.�

The Education System in Malawi 315
�
3.3. Future Plans
The�plans�of�the�dropouts�for�the�nearer�or�longer�future�are�an�indicator�for�the�degree�of�satisfaction�with�their�actual�situation.�It�is�remarkable�that�about�62�percent�of�the�dropouts�plan�to�return�to�university,�what�this�means�is�that�by�majority�the�dropouts�are� not� definitive� dropouts� but� so� called� potential� interrupters.� Only� 26� percent� are�planning�to�try�to�secure�a�job�or�doing�business�and�only�2.5�percent�want�to�course�a�TEVET�program.�Even�more�than�half�of�those�who�are�integrated�in�the�labor�market�are�planning�to�return�to�the�university.�It�is�a�matter�of�concern�that�also�60�percent�of�former�students,�who�left�the�university�due�to�performance�problems�did�not�give�up�the�idea�to�return�one�day�to�academic�studies.�Obviously�a�vocational�education�does�not�represent�an�attractive�option�for�those�people.�This�is�completely�understandable�in�view�of�the�income�level�of�TEVET�completers�(cf.�Part�III,�Section�2.4).�
In�spite�of�frustrating�experiences�and�actual�problems,�the�dropouts�demonstrate�an�optimistic�view�of�their�future�professional�opportunities�(figure�A9.7).��
Figure A9.7: Rating of Professional Opportunities in the Next Years (in %)
��More�than�half�of�dropouts�are�rating�their�professional�chances�positively,�especially�those� who� had� studied� law� (100� percent),� pure� sciences� (66� percent),� or�business/economics�(66�percent).� In�how�far� these�expectations�will�be�fulfilled� in� the�future�can�be�tested�only�by�a�longitudinal�(panel�design)�study.�
4. Summary and Conclusions
Summary
� The�Higher�Education�Sector� in�Malawi� fulfils�widely� its� function�to�prepare�highly�qualified�human�resources,�who�are�in�general�employable�and�succeed�to�integrate�in�the�labor�market.�
� The� graduates� are� mostly� satisfied� with� their� studies� and� evaluate� them� as�useful�for�their�professional�activities.�
18.2
34.131.8
10.2
5.7
0
5
10
15
20
25
30
35
40
very good good regular bad very bad
Per
cent
316 World Bank Working Paper
�
� The� scale� of� monthly� gross� income� exhibits� a� wide� range� with� a� mean� of�K�87,000.� Significant� gender� imbalance� and� differences� between� fields� of�studies�are�to�be�observed.�
� The�match�between�qualifications�acquired� (supply)� and� labor�market�needs�(demand)� is� mostly� given.� The� majority� of� the� graduates� perform� activities�and� tasks� appropriate� to� their� qualification� making� use� of� their� knowledge�acquired�at�university.�
� However,�there�is�a�segment�of�graduates�(20�percent)�not�fully�integrated�in�the� labor� market� or� situated� in� inadequate� occupational� conditions� with�salaries�not�corresponding�to�their�level.�
� The�employers�are�somewhat�satisfied�with�the�level�of�knowledge�and�skills�of� the� graduates.� But� there� is� also� a� stratum� of� 10�12� percent� of� graduates�which�does�not�exhibit�the�expected�level�of�knowledge�and�abilities.�
� Also�little�is�known�about�the�quantitative�dimension�of�university�dropout�in�Malawi,� there�is�some�empirical�evidence�that�dropping�out� is�not�a�singular�phenomenon.�Even�being�a�small�sample,�first�tendencies�and�trends�appears.�The� main� reasons� for� leaving� university� without� being� awarded� are� failing�grades�(32�percent)�and�personal�problems�(28�percent).�
� The� unemployment� rate� of� the� dropouts� is� rather� high� (35� percent)� and� the�average�salary�of�the�active�is�about�K�33,000.��
� The�majority�of� the�dropouts�plan� to� return� to� the�university�even�when� the�reason�for�their�dropping�out�was�insufficient�academic�performance.�
5. Conclusions and Recommendations
� The�Higher�Education�system�in�Malawi�is�by�and�large�aligned�to�its�present�economical� and� labor�market� environment.� But� knowledge�weaknesses� and�problems� of� labor� market� integration� for� a� certain� segment� of� graduates�should� not� be� ignored.� In� the� course� of� future� development� the� enrolment�rates�must�increase�according�to�the�manpower�needed.�
� The� high� income� level� reached� by� graduates� justifies� covering� an� adequate�part�of� the�real�costs�of�services�and�introducing�fees�which�must�be�used�to�enhance�the�material�and�academic�infrastructure�of�the�universities.�
� The� destination� and� situation� of� university� dropouts�must� turn� into� a�main�concern�of�educational�policy�in�order�to�avoid�the�waste�of�competent�human�resources� by� dropping� out.� Options� of� training� and� certification� must� be�offered�to�those�who�cannot�fulfill�academic�performance�standards.��
Notes �1�Ministry�of�Education,�Malawi.�National�Education�Sector�Plan.�Higher�Education.�November�2006.�2� Schomburg,� H.� (2003),�Handbook� for� Graduate� Tracer� Studies.� Centre� for� Research� on� Higher�Education� and�Work.�University� of� Kassel.� The� authors� acknowledge� gratefully� the� important�support�given�by�Harald�Schomburg�from�the�Center�of�Higher�Education�Research,�University�of�Kassel.���
The Education System in Malawi 317
�
�3�The�sample�includes�also�n=10�(2�percent)�of�post�graduates�(Master’s�degree).� It�was�decided�not�to�exclude�these�cases�because�they�may�serve�for�comparative�objectives.�4�As�known,�in�Malawi�the�costs�are�even�higher�than�in�other�comparable�countries�due�to�some�specific�characteristics�of�the�system.�By�2006�the�per�student�cost�had�grown�to�about�US$4,270�at�UNIMA�and�at�Mzuzu�US$5,169.�Ministry�of�Education,�Malawi.�National�Education�Sector�plan.�Higher�Education.�November�2007�5�It�was�surprising�to�note,�that�very�few�graduates�are�willing�or�able�to�set�their�own�business.�In�case�of�graduates�in�economics,�business�administration�and�related�areas�the�percentage�was�even�lower�(1.5�percent)�than�in�general�(1.9�percent).��6� “Patchwork”�means�a� situation�of� frequent�change�of� jobs,�mainly� temporary� jobs,�more� than�one�job�at�the�same�time,�altogether�an�unstable�situation.��7�Due�to�the�extreme�skewness�of�the�distribution,�parametrical�(t�Test,�ANOVA)�as�well�as�non�parametrical�tests�(U�Test,�K�W�Test)�have�been�performed.�The�results�are�identical;�only�in�case�of�year�of�graduation�the�K�W�Test�results�significant�and�the�ANOVA�doesn’t.�8�In�order�to�avoid�a�bias,�only�persons,�who�indicated�both�their�first�and�present�salaries�made�part�of�the�comparison.�9� Respondents,� who� are� not� seeking� employment,� whatever� the� reason� may� be� or� who� are�dedicated�to�advanced�studies�are�not�considered�(n=448).�10�The�Relative�Risk�(RR)�is�a�statistical�measure�which�relates�the�conditional�probability�with�the�total�probability�for�a�determined�group.�

318
Part�III:�TEVET�Tracer�Study�
Introduction: The Context of the TEVET System in Malawi
The�evolution�of�TEVET�system�aligns�very�much�to�the�political�development�of�the�country.�At� independence,� the� government� of�Malawi� intended� to�develop� a� human�resource� base� that� would� support� the� social�economic� development� of� the� country.�This� human� resource� base� was� soon� to� replace� the� huge� expatriate� level� present� in�public�and�private�sectors.�However,�it�became�clear�that�there�was�need�to�develop�an�equally�important�skilled�craftsmanship�that�would�meet�the�needs�of�the�development�agenda.�So,�an�apprenticeship�program�was�put�in�place.�
The�program�was�aimed�at� training�artisans� through�public� and�private� training�institutions.� Over� the� years,� Technician� Programmes� were� introduced� into� the�apprenticeship�scheme.�External�assessment�for�students�in�this�program�was�initially�done�by�City�and�Guilds�of�London�Institute,�an�international�examining�and�certifying�body� based� in� the� UK.� However,� the� need� to� localize� the� curriculum� and� its�corresponding� assessment� procedures� gave� birth� to� the� Trade� Testing� Examinations�and,� much� later,� the�Malawi� Craft� Examinations.� Recently� (2006)� the� “Competency�Based�Modular�Education�and�Training”�system�(CBET)�was�implemented.�
While�it�is�clear�from�the�foregoing�that�there�were�now�three�independent�sources�of� external� examinations,� the� advent� of� political�multiparty� brought� liberalization� of�Tevet� provision.� The� government,� NGOs,� churches,� private� formal� and� private�informal�operators�established�their�own�training�bases,�providing�short�and�long�term�non�formal�programs.�All�these�Tevet�providers�have�choice�on�which�examining�body�to�subject�their�students�to.�In�some�cases,�a�student�sits�examinations�from�more�than�one�of�the�three�examining�bodies�for�the�same�level�of�tuition.�At�the�same�time,�the�government�established�TEVETA�with�the�mandate�aimed�at�regulating�Tevet�system�and�facilitating�formal�and�informal�programs.�Until�now�the�coordination�between�the�different�public� and�private�providers� and�authorities� is�poor�and� their� roles� are�not�clearly�demarcated.�
There� should� be� a� huge� potential� demand� for� TEVET� among� school�leavers� in�Malawi� and� the� access� to� training� facilities� is� limited.� School� attainments� and�educational�level�are�further�limiting�factors�in�acquiring�higher�levels�of�skills,�which�are�necessary�for�economic�and�social�development.�Those�who�do�not�gain�access�to�formal� institutional� training� undergo� often� some� type� of� informal� learning� under�craftsmen�or�members�of�the�family,�training�on�the�job�in�a�company�or�some�informal�program.�

The Education System in Malawi 319
�
1. Methodology
The�general�methodological�procedures�of�tracing,�sampling�and�data�collection�have�been�described�above�(Part� I).�The�following�section�describes� the�construction�of� the�specific�questionnaires�and�the�basic�characteristics�of�the�sample�for�each�target�group�covered�by�the�TEVET�completers�study.�
1.1. Questionnaires
The�design�of�the�questionnaires�for�the�completers�of�TEVET�Courses�or�programs�has�been�performed�by�the�consultants�using�elements�of�instrument�developed�for�similar�purposes.��
1.2. Size of Samples
In�keeping�with�the�TOR�a�sample�size�of�1000�TEVET�completers�was�envisaged.�As�the� retention� rate� of� the� questionnaires� was� 100� percent,� the� final� sample� size� was�n=1026� TEVET� completers� and� a� small� control� group� n=73� without� formal�qualification.��
The� limited� employers� survey� suggested� in� the� TOR� included� a� total� of� n=220�employers� (companies� or� organizations).� Out� of� this� number� n=206� employers�occupied� skilled� and� unskilled� manpower� of� different� levels.� For� purpose� of� the�TEVET�survey,�only�this�subgroup�is�relevant�and�included�in�the�analysis.�
1.3. Characteristics of the Samples
According� to� the� TOR,� the� sample� of� the� TEVET� completers�was� drawn� from� all�occupational� fields� in� the� formal� and� informal� sector,� wage� employed,� and� self�employed,�with�and�without�certificated�qualification.��
The�sample�meets�largely�criterions�of�representativeness.�All�relevant�institutions�from�the�formal�TEVETA�system�(TC),�parallel�programs,�and�other�programs�in�public�and�private� institutions�had�their�completers�covered�in�the�study.�The�questionnaire�retention�rate�was�100�percent.�
The�demographic�characteristics�of�the�samples�are�given�in�the�sampling�frame�on�the�following�page,�based�on�the�number�of�valid�cases.��
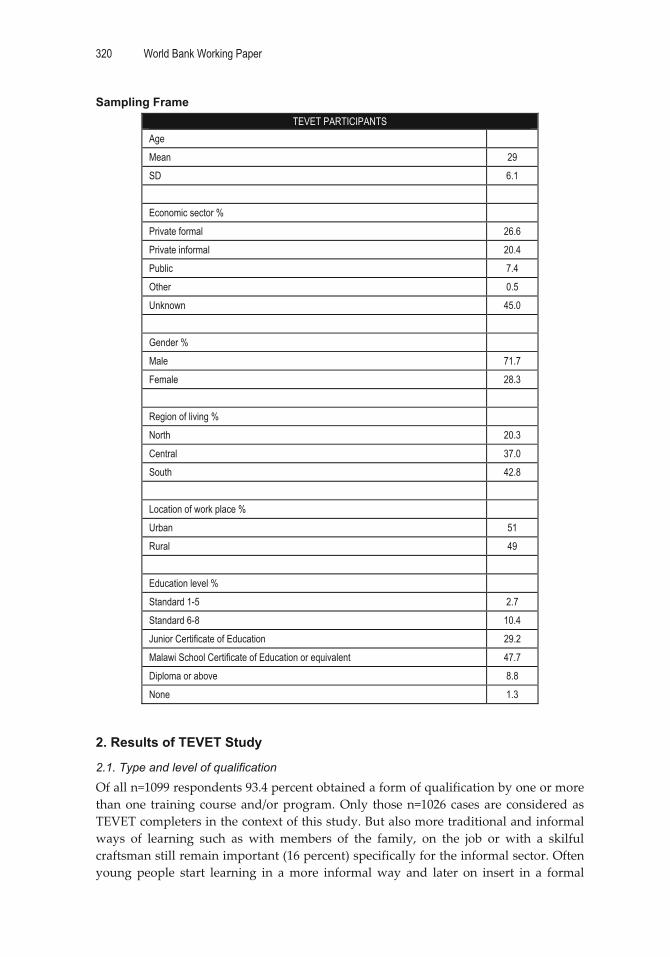
320 World Bank Working Paper
�
Sampling Frame TEVET PARTICIPANTS
Age
Mean 29
SD 6.1
Economic sector %
Private formal 26.6
Private informal 20.4
Public 7.4
Other 0.5
Unknown 45.0
Gender %
Male 71.7
Female 28.3
Region of living %
North 20.3
Central 37.0
South 42.8
Location of work place %
Urban 51
Rural 49
Education level %
Standard 1-5 2.7
Standard 6-8 10.4
Junior Certificate of Education 29.2
Malawi School Certificate of Education or equivalent 47.7
Diploma or above 8.8
None 1.3 �
2. Results of TEVET Study
2.1. Type and level of qualification
Of�all�n=1099�respondents�93.4�percent�obtained�a�form�of�qualification�by�one�or�more�than�one� training�course�and/or�program.�Only� those�n=1026�cases� are� considered�as�TEVET�completers�in�the�context�of�this�study.�But�also�more�traditional�and�informal�ways� of� learning� such� as� with� members� of� the� family,� on� the� job� or� with� a� skilful�craftsman�still�remain�important�(16�percent)�specifically�for�the�informal�sector.�Often�young� people� start� learning� in� a�more� informal�way� and� later� on� insert� in� a� formal�
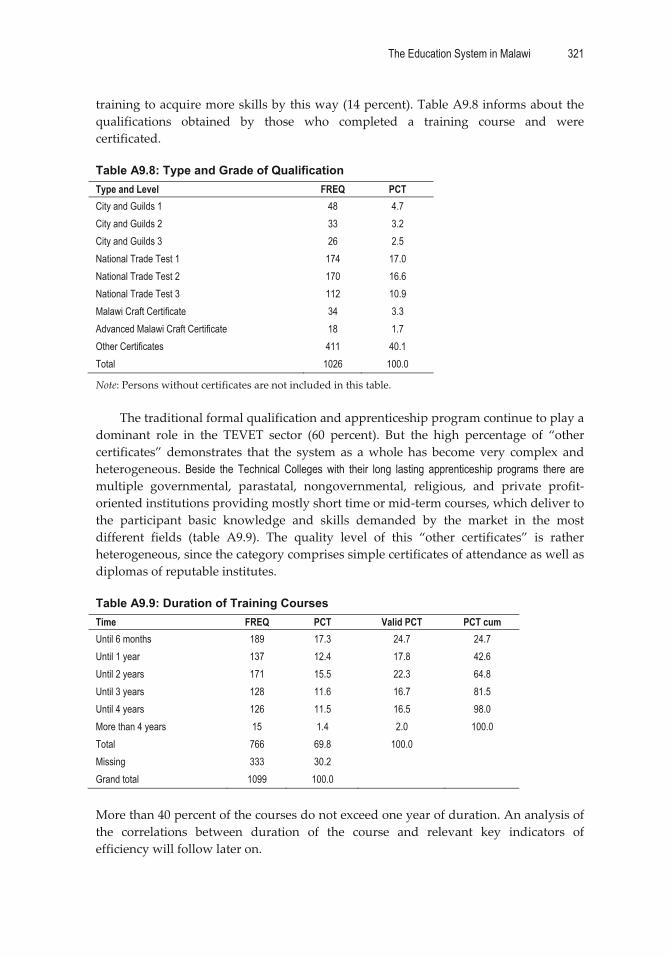
The Education System in Malawi 321
�
training�to�acquire�more�skills�by�this�way�(14�percent).�Table�A9.8�informs�about�the�qualifications� obtained� by� those� who� completed� a� training� course� and� were�certificated.��Table A9.8: Type and Grade of Qualification Type and Level FREQ PCT City and Guilds 1 48 4.7 City and Guilds 2 33 3.2 City and Guilds 3 26 2.5 National Trade Test 1 174 17.0 National Trade Test 2 170 16.6 National Trade Test 3 112 10.9 Malawi Craft Certificate 34 3.3 Advanced Malawi Craft Certificate 18 1.7 Other Certificates 411 40.1 Total 1026 100.0
Note:�Persons�without�certificates�are�not�included�in�this�table.��
The�traditional�formal�qualification�and�apprenticeship�program�continue�to�play�a�dominant� role� in� the� TEVET� sector� (60� percent).� But� the� high� percentage� of� “other�certificates”� demonstrates� that� the� system� as� a�whole� has� become� very� complex� and�heterogeneous. Beside the Technical Colleges with their long lasting apprenticeship programs there are multiple� governmental,� parastatal,� nongovernmental,� religious,� and� private� profit�oriented�institutions�providing�mostly�short�time�or�mid�term�courses,�which�deliver�to�the� participant� basic� knowledge� and� skills� demanded� by� the� market� in� the� most�different� fields� (table� A9.9).� The� quality� level� of� this� “other� certificates”� is� rather�heterogeneous,�since�the�category�comprises�simple�certificates�of�attendance�as�well�as�diplomas�of�reputable�institutes.���Table A9.9: Duration of Training Courses Time FREQ PCT Valid PCT PCT cum Until 6 months 189 17.3 24.7 24.7 Until 1 year 137 12.4 17.8 42.6 Until 2 years 171 15.5 22.3 64.8 Until 3 years 128 11.6 16.7 81.5 Until 4 years 126 11.5 16.5 98.0 More than 4 years 15 1.4 2.0 100.0 Total 766 69.8 100.0 Missing 333 30.2 Grand total 1099 100.0
�More�than�40�percent�of�the�courses�do�not�exceed�one�year�of�duration.�An�analysis�of�the� correlations� between� duration� of� the� course� and� relevant� key� indicators� of�efficiency�will�follow�later�on.�

322 World Bank Working Paper
�
2.2. Assessment of training
Although� TEVET� completers� cannot� be� considered� as� experts� in� matters� of�qualification,� their� opinion� about� the� usefulness� of� their� course� is� a� valid� efficiency�indicator� because� they� experience� finally� the� outcomes� and� effects� in� terms� of� labor�market�chances.�Therefore�it�is�very�encouraging�that�the�assessment�of�the�usefulness�of�the�training�is�very�positive.�The�high�rate�of�non�respondents,�however,�should�be�taken�into�consideration�(figure�A9.8).��
Figure A9.8: Rating of Usefulness of Training (in %) (n=817)
A�detailed�analysis�of�the�factors�which�have�influence�on�the�rating�of�usefulness�
reveals�interesting�insights:�
� Completers�who�rate�the�course�as�very�useful�have�in�average�a�1.27�higher�salary�than�the�other�two�groups.�
� In�the�group�of�unemployed�persons�only�53.1�percent�rate�the�course�as�very�useful.�
� There�is�a�zero�correlation�between�duration�and�rating�of�the�course.�� There�are�no�gender�differences�in�the�rating.�� Self� employed� have� a� higher� “very� useful”� rating� (78.3� percent)� than� other�
groups Variations� referring� to� the� type�of� course,� institution�and�other� intervening�variables�still�need�further�analysis.�
Another�relevant�indicator�for�the�external�efficiency�is�the�matching�of�the�type�of�course�and�actual�employment�field.�A�cross�tabulation�between�both�variables�reveals�that� around� 80�percent� of� the� completers� are�working� in� the�professional� field� for�that�they�have�been�trained.�A�serious�amount�of�misallocation�of�human�resources�is�not�to�be�stated.�
This�positive�assessment�can�be�cross�validated�by�real�improvements�of�the�work�situation�which�the�respondents�attribute�to�the�program/course�they�attended.�In�total�
72.6
20.9
6.5
Very useful Somewhat useful Not very useful
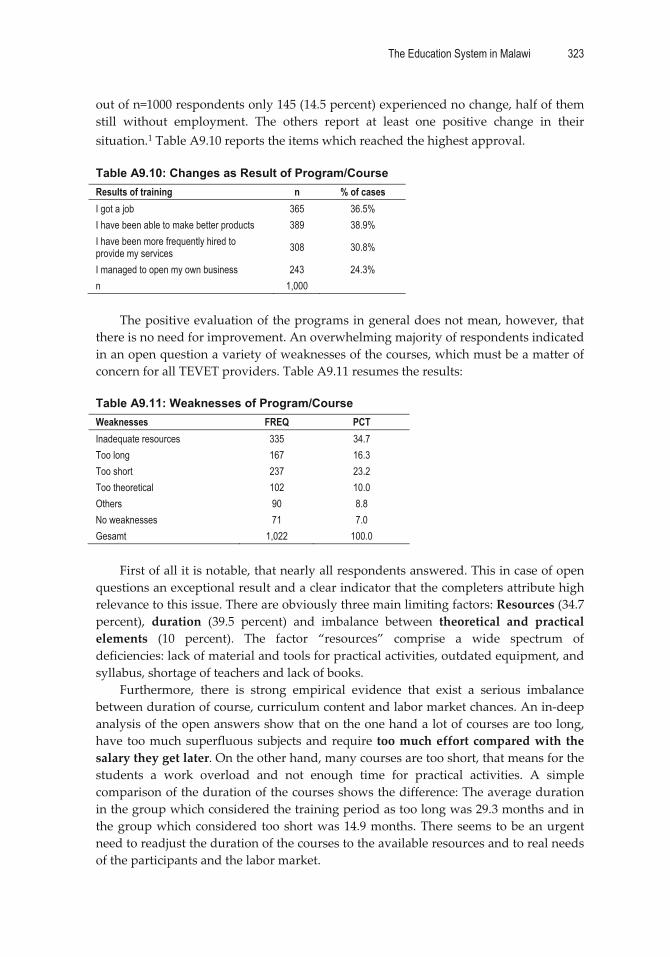
The Education System in Malawi 323
�
out�of�n=1000�respondents�only�145�(14.5�percent)�experienced�no�change,�half�of�them�still� without� employment.� The� others� report� at� least� one� positive� change� in� their�situation.1�Table�A9.10�reports�the�items�which�reached�the�highest�approval.��Table A9.10: Changes as Result of Program/Course Results of training n % of cases I got a job 365 36.5% I have been able to make better products 389 38.9% I have been more frequently hired to provide my services 308 30.8%
I managed to open my own business 243 24.3% n 1,000 �
The�positive�evaluation�of�the�programs�in�general�does�not�mean,�however,�that�there�is�no�need�for�improvement.�An�overwhelming�majority�of�respondents�indicated�in�an�open�question�a�variety�of�weaknesses�of�the�courses,�which�must�be�a�matter�of�concern�for�all�TEVET�providers.�Table�A9.11�resumes�the�results:��Table A9.11: Weaknesses of Program/Course Weaknesses FREQ PCT Inadequate resources 335 34.7 Too long 167 16.3 Too short 237 23.2 Too theoretical 102 10.0 Others 90 8.8 No weaknesses 71 7.0 Gesamt 1,022 100.0 �
First�of�all�it�is�notable,�that�nearly�all�respondents�answered.�This�in�case�of�open�questions�an�exceptional�result�and�a�clear�indicator�that�the�completers�attribute�high�relevance�to�this�issue.�There�are�obviously�three�main�limiting�factors:�Resources�(34.7�percent),� duration� (39.5� percent)� and� imbalance� between� theoretical� and� practical�elements� (10� percent).� The� factor� “resources”� comprise� a� wide� spectrum� of�deficiencies:�lack�of�material�and�tools�for�practical�activities,�outdated�equipment,�and�syllabus,�shortage�of�teachers�and�lack�of�books.�
Furthermore,� there� is� strong� empirical� evidence� that� exist� a� serious� imbalance�between�duration�of�course,�curriculum�content�and�labor�market�chances.�An�in�deep�analysis�of�the�open�answers�show�that�on�the�one�hand�a�lot�of�courses�are�too�long,�have� too�much�superfluous�subjects�and�require� too�much�effort�compared�with� the�salary�they�get�later.�On�the�other�hand,�many�courses�are�too�short,�that�means�for�the�students� a� work� overload� and� not� enough� time� for� practical� activities.� A� simple�comparison�of�the�duration�of�the�courses�shows�the�difference:�The�average�duration�in�the�group�which�considered�the�training�period�as�too�long�was�29.3�months�and�in�the�group�which�considered� too�short�was�14.9�months.�There�seems� to�be�an�urgent�need�to�readjust�the�duration�of�the�courses�to�the�available�resources�and�to�real�needs�of�the�participants�and�the�labor�market.�
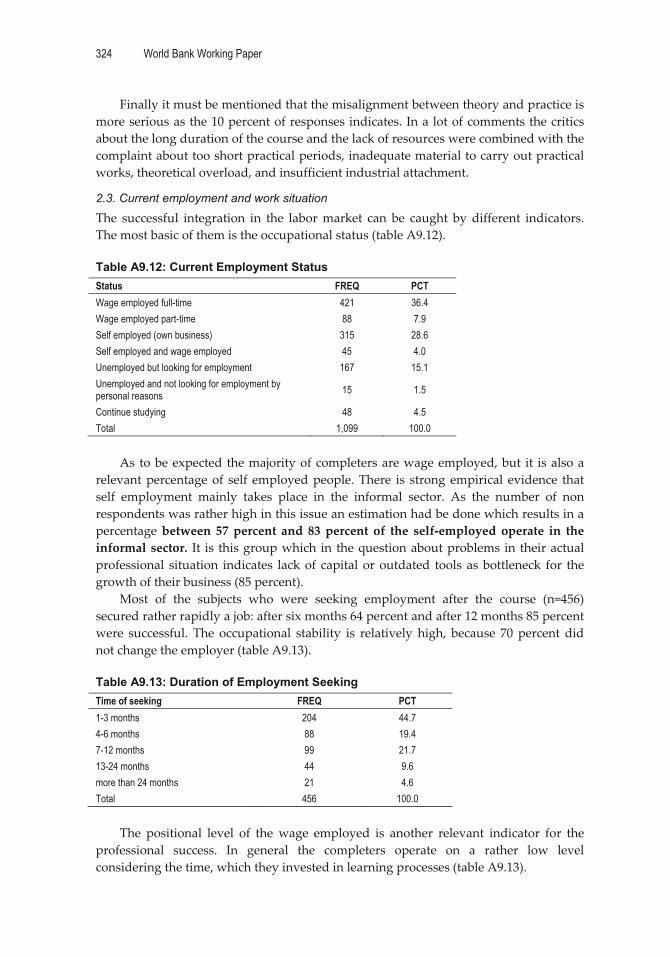
324 World Bank Working Paper
�
Finally�it�must�be�mentioned�that�the�misalignment�between�theory�and�practice�is�more�serious�as�the�10�percent�of�responses�indicates.�In�a�lot�of�comments�the�critics�about�the�long�duration�of�the�course�and�the�lack�of�resources�were�combined�with�the�complaint�about�too�short�practical�periods,�inadequate�material�to�carry�out�practical�works,�theoretical�overload,�and�insufficient�industrial�attachment.�
2.3. Current employment and work situation
The� successful� integration� in� the� labor�market� can� be� caught� by�different� indicators.�The�most�basic�of�them�is�the�occupational�status�(table�A9.12).��Table A9.12: Current Employment Status Status FREQ PCT Wage employed full-time 421 36.4 Wage employed part-time 88 7.9 Self employed (own business) 315 28.6 Self employed and wage employed 45 4.0 Unemployed but looking for employment 167 15.1 Unemployed and not looking for employment by personal reasons 15 1.5
Continue studying 48 4.5 Total 1,099 100.0 �
As�to�be�expected�the�majority�of�completers�are�wage�employed,�but� it� is�also�a�relevant�percentage�of� self� employed�people.�There� is� strong�empirical� evidence� that�self� employment� mainly� takes� place� in� the� informal� sector.� As� the� number� of� non�respondents�was�rather�high�in�this�issue�an�estimation�had�be�done�which�results�in�a�percentage�between� 57�percent� and� 83�percent� of� the� self�employed�operate� in� the�informal�sector.� It� is� this�group�which� in� the�question�about�problems�in�their�actual�professional� situation� indicates� lack�of� capital�or�outdated� tools� as�bottleneck� for� the�growth�of�their�business�(85�percent).�
Most� of� the� subjects� who� were� seeking� employment� after� the� course� (n=456)�secured�rather�rapidly�a�job:�after�six�months�64�percent�and�after�12�months�85�percent�were� successful.� The� occupational� stability� is� relatively� high,� because� 70� percent� did�not�change�the�employer�(table�A9.13).���Table A9.13: Duration of Employment Seeking Time of seeking FREQ PCT 1-3 months 204 44.7 4-6 months 88 19.4 7-12 months 99 21.7 13-24 months 44 9.6 more than 24 months 21 4.6 Total 456 100.0 �
The� positional� level� of� the�wage� employed� is� another� relevant� indicator� for� the�professional� success.� In� general� the� completers� operate� on� a� rather� low� level�considering�the�time,�which�they�invested�in�learning�processes�(table�A9.13).��

The Education System in Malawi 325
�
Table A9.13: Level of Position Level FREQ PCT Ordinary hand (routine tasks) 349 58.7 Lower management (supervisor etc) 170 28.6 Middle management (foreman, group leader etc) 76 12.7 Total 595 100.0
�Referring�to�the�self�employed�and�business�men,�most�of�them�(77.5�percent)�run�their�business�with� employees,� the�majority� (41.6� percent)�with� 1�2� employees,� creating� a�multiplicative�effect�for�the�labor�market�(table�A9.14).��Table A9.14: Number of Employees No of employees FREQ PCT 0 60 22.5 1-2 111 41.6 3-5 73 27.3 > 5 23 8.6 Total 267 100.0
�In�general,�the�data�presented�above�reveal�a�somewhat�positive�panorama�relative�
to� the� labor�market� chances� of� the� completers.2� But� there� exists� also� a� stratum�with�serious�problems�of�employability.�Excluding�those�subjects�who�continue�studying�or�who�do�not�work�by�personal� reasons�results� in�an�unemployment�rate�at�present�of�16.2�percent�(cf.�table�A9.12).3�
There� is� high� empirical� evidence,� that� certain� social� groups� are�more� vulnerable�than� others� in� terms� of� unemployment� and� other� factors� of� social� relevance.� This� is�shown�also�in�this�study�where�in�some�groups�the�percentage�of�employment�seeker�is�significantly� higher� than� the� average.� Table�A9.15� presents� the� relative� risk� (RR)� for�those�groups.��Table A9.15: Relative Risk of Unemployment for High Risk Groups Groups RR Rural area 1.31 Women 1.39 Without education 1.87 Young (18-24 years) 2.46
�Specifically�young�people�and�persons�without�education�encounter�serious�problems�to�secure�a�job�even�having�a�qualification.�
2.4. Income situation and its determinants
The� core� indicator� for� the� quality� and� productivity� of� work—at� least� in� the� private�sector—is� the� income� of� the� persons� (salary� or� net� profit).� Figure� A9.9� shows� the�income�distribution,�which�is�concentrated�in�the�range�between�K�5,000�and�K�20,000�
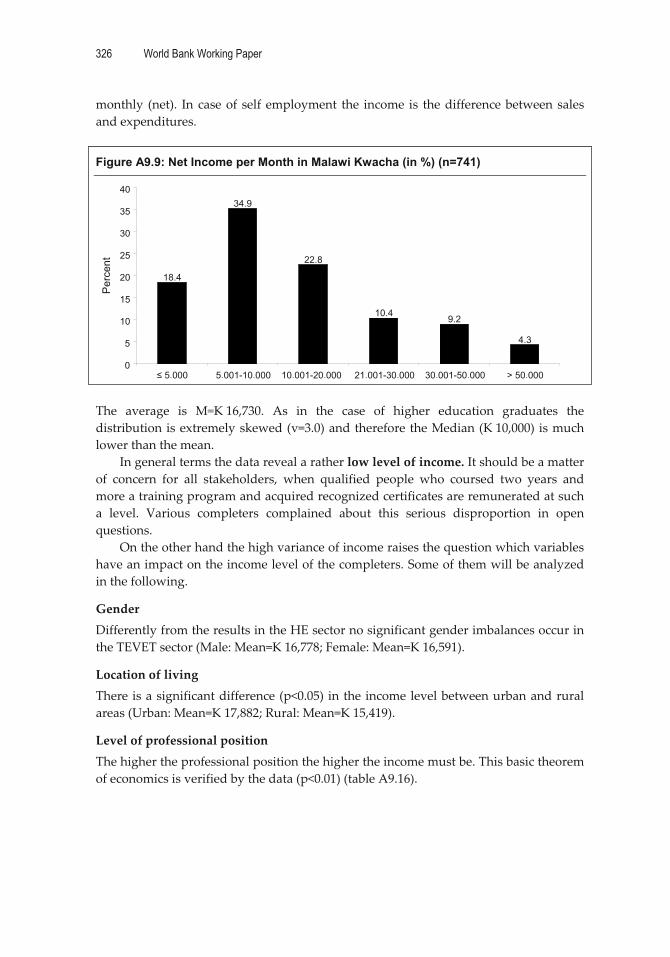
326 World Bank Working Paper
�
monthly� (net).� In� case�of� self�employment� the� income� is� the�difference�between�sales�and�expenditures.��
Figure A9.9: Net Income per Month in Malawi Kwacha (in %) (n=741)
��The� average� is� M=K�16,730.� As� in� the� case� of� higher� education� graduates� the�distribution�is�extremely�skewed�(v=3.0)�and�therefore�the�Median�(K�10,000)� is�much�lower�than�the�mean.�
In�general�terms�the�data�reveal�a�rather�low�level�of�income.�It�should�be�a�matter�of� concern� for� all� stakeholders,� when� qualified� people� who� coursed� two� years� and�more�a�training�program�and�acquired�recognized�certificates�are�remunerated�at�such�a� level.� Various� completers� complained� about� this� serious� disproportion� in� open�questions.�
On�the�other�hand�the�high�variance�of�income�raises�the�question�which�variables�have�an�impact�on�the�income�level�of�the�completers.�Some�of�them�will�be�analyzed�in�the�following.�
Gender�Differently�from�the�results�in�the�HE�sector�no�significant�gender�imbalances�occur�in�the�TEVET�sector�(Male:�Mean=K�16,778;�Female:�Mean=K�16,591).�
Location�of�living�There�is�a�significant�difference�(p<0.05)�in�the�income�level�between�urban�and�rural�areas�(Urban:�Mean=K�17,882;�Rural:�Mean=K�15,419).�
Level�of�professional�position�The�higher�the�professional�position�the�higher�the�income�must�be.�This�basic�theorem�of�economics�is�verified�by�the�data�(p<0.01)�(table�A9.16).��
18.4
34.9
22.8
10.4 9.2
4.3
0
5
10
15
20
25
30
35
40
� 5,000 5,001-10,000 10,001-20,000 21,001-30,000 30,001-50,000 > 50,000
Per
cent

The Education System in Malawi 327
�
Table A9.16: Mean Income by Positional Level Level Mean N SD Ordinary hand 11332 319 10234 Lower management 18740 164 17064 Middle management 25822 72 24817 Total 15354 555 15813 �The�range�between�the�lowest�and�the�highest� level� is�nearly�one�standard�deviation.�But�not�more�than�13�percent�of�all�completers�reach�a�middle�level.�
Occupational�status�The�differences�between�the�groups�are�significant�(p<0.01).�The�highest�mean�income�have�those�running�their�own�business.�This�shows�that� it�pays�for� the�completers� to�start�their�own�business�venture�(table�A9.17).��Table A9.17: Mean Income by Occupational Status Occupational status Mean N SD Wage employed full-time 16019 402 16402 Wage employed part-time 8979 70 7329 Self employed (own business) 20724 226 19411 Self employed and wage employed 15032 43 15878 Total 16731 741 17049
Educational�level�The�impact�of�the�education�level�can�be�described�like�this:�the�upper�and�lower�levels�of� education� differ� significantly� in� their� income� related� to� the� average,� but� in� the�middle� level� (Standard�6�8,� Junior�Certificate�of�Education,�Malawi�School�Certificate�of�Education)�the�differences�are�not�significant.�
Number�of�courses�The�mean�income�of� those�who�attended�more�than�one�training�course� is�somewhat�higher�(M=�K�19,582)�than�for�the�subjects�with�only�one�course�(M=K�16,302).�
Way�of�getting�skills��As�mentioned�above,�informal�ways�of�learning�and�(friend,�members�of�the�family,�on�the�job�or�with�the�help�of�a�skilful�craftsman)�still�remain�important.�For�some�it�is�the�only�way�of�skill�acquirement,�for�others�the�first�step�which�later�on�is�completed�by�a�formal�training�course�(table�A9.18).��Table A9.18: Mean Income by Way of Getting Skills WAYS Mean N SD Informal way 13386 139 19408 Formal way 17235 484 16311 Both way 19192 110 16821 Total 16799 733 17085
�
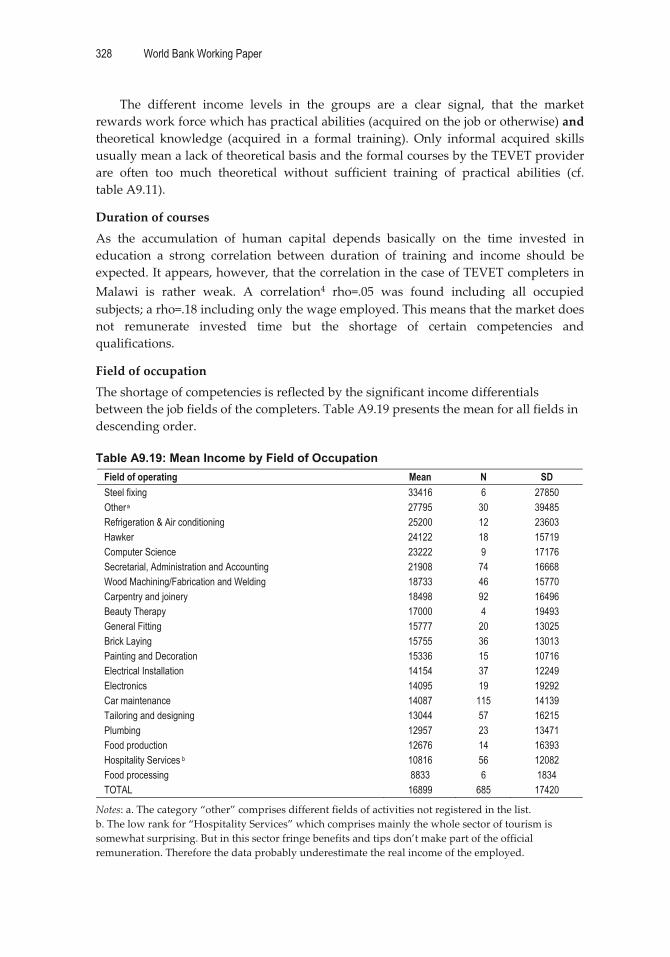
328 World Bank Working Paper
�
The� different� income� levels� in� the� groups� are� a� clear� signal,� that� the� market�rewards�work�force�which�has�practical�abilities�(acquired�on�the�job�or�otherwise)�and�theoretical� knowledge� (acquired� in� a� formal� training).� Only� informal� acquired� skills�usually�mean�a�lack�of�theoretical�basis�and�the�formal�courses�by�the�TEVET�provider�are� often� too� much� theoretical� without� sufficient� training� of� practical� abilities� (cf.�table�A9.11).�
Duration�of�courses�As� the� accumulation� of� human� capital� depends� basically� on� the� time� invested� in�education� a� strong� correlation� between� duration� of� training� and� income� should� be�expected.�It�appears,�however,�that�the�correlation�in�the�case�of�TEVET�completers�in�Malawi� is� rather� weak.� A� correlation4� rho=.05� was� found� including� all� occupied�subjects;�a�rho=.18�including�only�the�wage�employed.�This�means�that�the�market�does�not� remunerate� invested� time� but� the� shortage� of� certain� competencies� and�qualifications.�
Field�of�occupation�The�shortage�of�competencies�is�reflected�by�the�significant�income�differentials�between�the�job�fields�of�the�completers.�Table�A9.19�presents�the�mean�for�all�fields�in�descending�order.��Table A9.19: Mean Income by Field of Occupation
Field of operating Mean N SD Steel fixing 33416 6 27850 Other�a 27795 30 39485 Refrigeration & Air conditioning 25200 12 23603 Hawker 24122 18 15719 Computer Science 23222 9 17176 Secretarial, Administration and Accounting 21908 74 16668 Wood Machining/Fabrication and Welding 18733 46 15770 Carpentry and joinery 18498 92 16496 Beauty Therapy 17000 4 19493 General Fitting 15777 20 13025 Brick Laying 15755 36 13013 Painting and Decoration 15336 15 10716 Electrical Installation 14154 37 12249 Electronics 14095 19 19292 Car maintenance 14087 115 14139 Tailoring and designing 13044 57 16215 Plumbing 12957 23 13471 Food production 12676 14 16393 Hospitality Services b 10816 56 12082 Food processing 8833 6 1834 TOTAL 16899 685 17420
Notes:�a.�The�category�“other”�comprises�different�fields�of�activities�not�registered�in�the�list.�b.�The�low�rank�for�“Hospitality�Services”�which�comprises�mainly�the�whole�sector�of�tourism�is�somewhat�surprising.�But�in�this�sector�fringe�benefits�and�tips�don’t�make�part�of�the�official�remuneration.�Therefore�the�data�probably�underestimate�the�real�income�of�the�employed.��

The Education System in Malawi 329
�
The� between� group� differences� are� highly� significant� and� reflect� the� demand�supply�conditions�of�the�actual�labor�market�in�Malawi.�But�also�the�in�group�variances�remain�very�high,�because�many�other�factors�may�have�an�effect�on�the�income�level.�
Type�of�qualification�An�important�question�is,�in�how�far�the�labor�market�remunerates�different�type�and�level�of�certificates�(table�A9.20).��Table A9.20: Mean Income by Type and Level of Certificates Type and Level Mean n SD City and Guilds 1 24250 28 22302 City and Guilds 2 18182 21 16972 City and Guilds 3 17569 19 18234 National Trade Test 1 15965 118 12986 National Trade Test 2 13585 119 11796 National Trade Test 3 14142 62 14572 Malawi Craft Certificate 22476 21 19300 Advanced Malawi Craft Certificate 14868 15 11745 Other Certificates 18750 283 20534 Without Certificates 11356 55 10301 Total 16731 741 170489
�First� of� all� it� must� be� pointed� out,� that� TEVET� training� does� matter.� Workers�
without� certificated� training� course� have� an� average� income� of� only� K�11,356,�meanwhile�the�owner�of�a�certificate�reach�K�17,162�in�average.�As�the�data�reveal,�the�City�&�Guilds�Certificate�enjoy�a�definitely�higher�valuation�in�the�labor�market�than�the�National�Trade.5�
A�somewhat�unexpected� result�appears� in� case�of� the�Malawi�Craft� certificate.� It�should� be� expected,� of� course,� that� the� owners� of� the� Advanced� Certificate� have� a�higher� income� level� than� those� of� the� Craft� Certificate.� A� possible� explication� is� the�small�sample�size�which�means�a�high�standard�error�and�in�fact�the�difference�is�not�significant�(p>0.1).�But�it�should�also�be�taken�into�consideration�that�a�higher�portion�of�Malawi�Craft�completers�are�self�employed�implying�a�higher�average�income.�
The�owners�of�“other�certificates”�are�characterized�by�an�income�a�little�above�the�general�mean�and�the�highest�standard�deviation� in�relation�to� the�group�mean.�This�demonstrates� once� more� the� very� expressive� heterogeneity� of� type� and� quality� of�courses�and�certificates�offered�by� the�market.�Further�analysis� is�needed� in�order� to�verify�which�type�of�certificates�by�which�providers�are�rewarded�by�the�employers.�
2.4. Evaluation of the employers
Also� in� the� case�of�non�academic� staff,� the�opinion�of� the�employers� is�an� important�indicator�in�how�far�the�system�is�able�to�provide�market�oriented�qualifications.�
First� of� all� it� must� be� pointed� out� that� the� employers� confirm� that� a� TEVET�qualification�makes�a�difference.�For�76.8�percent�there�are�notable�differences�in�work�performance� between� TEVET� completers� and� the� others.� Only� 10.6� percent� don’t�perceive�such�difference�and�the�rest�do�not�know.�Therefore� it� is�not�surprising� that�
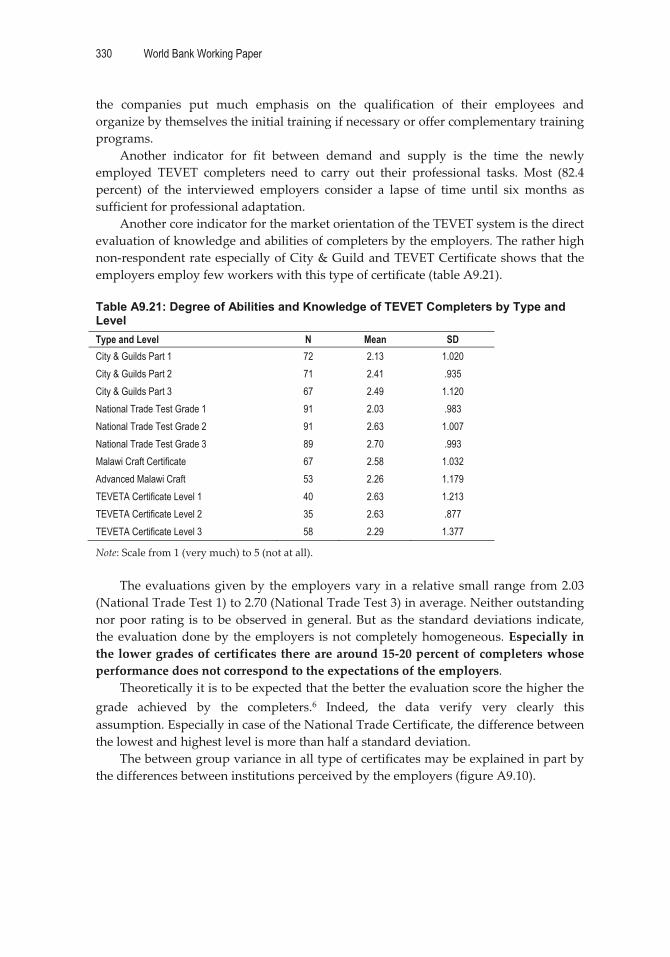
330 World Bank Working Paper
�
the� companies� put� much� emphasis� on� the� qualification� of� their� employees� and�organize�by�themselves�the�initial�training�if�necessary�or�offer�complementary�training�programs.�
Another� indicator� for� fit� between� demand� and� supply� is� the� time� the� newly�employed� TEVET� completers� need� to� carry� out� their� professional� tasks.� Most� (82.4�percent)� of� the� interviewed� employers� consider� a� lapse� of� time� until� six� months� as�sufficient�for�professional�adaptation.��
Another�core�indicator�for�the�market�orientation�of�the�TEVET�system�is�the�direct�evaluation�of�knowledge�and�abilities�of�completers�by�the�employers.�The�rather�high�non�respondent�rate�especially�of�City�&�Guild�and�TEVET�Certificate�shows�that�the�employers�employ�few�workers�with�this�type�of�certificate�(table�A9.21).���Table A9.21: Degree of Abilities and Knowledge of TEVET Completers by Type and Level Type and Level N Mean SD City & Guilds Part 1 72 2.13 1.020 City & Guilds Part 2 71 2.41 .935 City & Guilds Part 3 67 2.49 1.120 National Trade Test Grade 1 91 2.03 .983 National Trade Test Grade 2 91 2.63 1.007 National Trade Test Grade 3 89 2.70 .993 Malawi Craft Certificate 67 2.58 1.032 Advanced Malawi Craft 53 2.26 1.179 TEVETA Certificate Level 1 40 2.63 1.213 TEVETA Certificate Level 2 35 2.63 .877 TEVETA Certificate Level 3 58 2.29 1.377
Note:�Scale�from�1�(very�much)�to�5�(not�at�all).��
The�evaluations�given�by� the�employers�vary� in�a� relative� small� range� from�2.03�(National�Trade�Test�1)�to�2.70�(National�Trade�Test�3)�in�average.�Neither�outstanding�nor�poor� rating� is� to�be�observed� in�general.�But�as� the�standard�deviations� indicate,�the�evaluation�done�by� the�employers� is�not� completely�homogeneous.�Especially� in�the�lower�grades�of�certificates�there�are�around�15�20�percent�of�completers�whose�performance�does�not�correspond�to�the�expectations�of�the�employers.��
Theoretically�it�is�to�be�expected�that�the�better�the�evaluation�score�the�higher�the�grade� achieved� by� the� completers.6� Indeed,� the� data� verify� very� clearly� this�assumption.�Especially�in�case�of�the�National�Trade�Certificate,�the�difference�between�the�lowest�and�highest�level�is�more�than�half�a�standard�deviation.�
The�between�group�variance�in�all�type�of�certificates�may�be�explained�in�part�by�the�differences�between�institutions�perceived�by�the�employers�(figure�A9.10).��
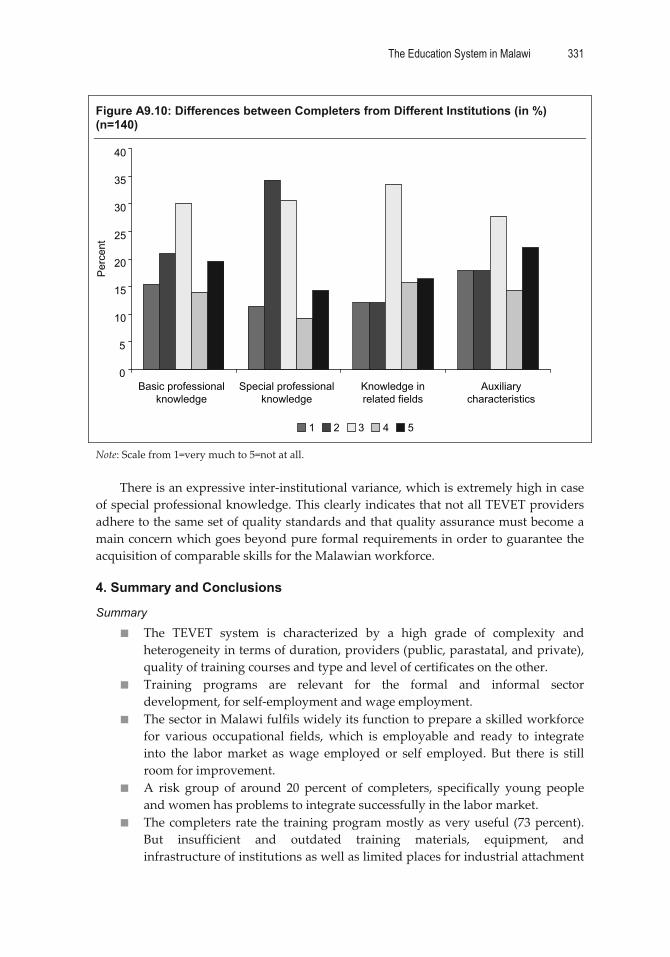
The Education System in Malawi 331
�
Figure A9.10: Differences between Completers from Different Institutions (in %) (n=140)
0
5
10
15
20
25
30
35
40
Basic professionalknowledge
Special professionalknowledge
Knowledge inrelated fields
Auxiliarycharacteristics
Perc
ent
1 2 3 4 5 �
Note:�Scale�from�1=very�much�to�5=not�at�all.��
There�is�an�expressive�inter�institutional�variance,�which�is�extremely�high�in�case�of�special�professional�knowledge.�This�clearly�indicates�that�not�all�TEVET�providers�adhere�to�the�same�set�of�quality�standards�and�that�quality�assurance�must�become�a�main�concern�which�goes�beyond�pure�formal�requirements�in�order�to�guarantee�the�acquisition�of�comparable�skills�for�the�Malawian�workforce.�
4. Summary and Conclusions
Summary
� The� TEVET� system� is� characterized� by� a� high� grade� of� complexity� and�heterogeneity�in�terms�of�duration,�providers�(public,�parastatal,�and�private),�quality�of�training�courses�and�type�and�level�of�certificates�on�the�other.�
� Training� programs� are� relevant� for� the� formal� and� informal� sector�development,�for�self�employment�and�wage�employment.�
� The�sector�in�Malawi�fulfils�widely�its�function�to�prepare�a�skilled�workforce�for� various� occupational� fields,� which� is� employable� and� ready� to� integrate�into� the� labor�market� as�wage� employed� or� self� employed.� But� there� is� still�room�for�improvement.�
� A� risk� group� of� around� 20� percent� of� completers,� specifically� young� people�and�women�has�problems�to�integrate�successfully�in�the�labor�market.��
� The�completers�rate� the� training�program�mostly�as�very�useful� (73�percent).�But� insufficient� and� outdated� training� materials,� equipment,� and�infrastructure�of�institutions�as�well�as�limited�places�for�industrial�attachment�

332 World Bank Working Paper
�
are�serious�constraints�for�a�practical�oriented�training�and�skill�development�taking�in�account�the�prevailing�demands�of�the�labor�market.�
� The�match�between�qualifications�acquired� (supply)� and� labor�market�needs�(demand)� is�mostly�given.� 80�percent�of� the� completers�perform�activities� in�the�fields�which�they�have�been�trained�for.�
� The� scale� of� monthly� gross� income� exhibits� a� wide� range� with� a� mean� of�K�16,730.� There� is� no� correlation� between� duration� of� training� and� income�level,� but� a� significant� correlation� between� occupational� field� and� income�level.� The� remuneration� for� the� owner� of� different� types� and� levels� of�certificates�differs�somewhat�but�not�so�strong�as�to�be�expected.�
� The�employers�are�somewhat�satisfied�with�the�level�of�knowledge�and�skills�of� the� graduates,� but� in� the� lower� certificate� grades� there� are� around� 15�20�percent� of� completers� whose� performance� doesn’t� correspond� to� the�expectations� of� the� employers.� They� point� out� a� rather� large� difference�between� completers� coming� from� different� institutions� and� sometimes� poor�practical�abilities.�
Conclusions and Recommendations
� Taking�into�account�the�high�complexity�of�the�Malawian�TEVET�system�there�is�an�urgent�need�to�identify�and�demarcate�the�functions�and�responsibilities�of� different� public,� nongovernmental,� and� private� providers,� in� order� to�optimize�the�efficiency�of�the�system�as�a�whole.�
� All� TEVET� providers� must� keep� track� of� those� they� trained� and� provide�support� and� follow�up� services� to� the� completers� in� order� to� facilitate� their�integration� in� the� Labor� Market� or� to� incentive� the� development� of� their�business�by�giving�loans.�
� The�mismatch� between�duration� of� training� and� income� indicates� an�urgent�need�to�make�the�curriculum�flexible�and�to�facilitate�different�entry�and�exit�points�to�avoid�waste�of�time�and�resources�and�enhance�the�efficiency�of�the�system.�The�recently�implemented�modularized�system�may�be�a�step�in�this�direction.�
� The� insufficient� and� outdated� training� resources� inclusive� shortage� of�qualified�teachers�and�insufficient�industrial�attachment�is�a�serious�constraint�in� preparing� students� for� the� actual� and� future� needs� of� the� economy.�Strengthening� synergy� effects� between� the� providers� and� the� industry� and�commerce�must�be�used.�
� The� high� variance� in� the� income� distribution� demonstrates� that� TEVET�activities� should� be� directed� in� emerging� occupational� areas� beyond� the�traditional� fields� covered� by� the� apprenticeship� programs.� For� this� purpose�actual�and�future�social�and�labor�market�requirements�must�be�identified�in�close�cooperation�with�stakeholders�of�the�private�and�the�public�sector.��
� As� the� employers� perceive� notable� performance� differences� between� the�completers�of�different�institutions,�setting�and�assurance�of�quality�standards�are� urgently� needed� in� order� to� ensure� that� all� TEVET� providers� adhere� to�certain� standards.� Not� only� registration� but� accreditation� and� permanent�monitoring� and� evaluation� of� providers� by� TEVETA� are� needed.� In� this�
The Education System in Malawi 333
�
context�the�multiple�structures�responsible�for�assessments�and�examinations�should�be�reconsidered.��
Notes�1�As�multiple�responses�have�been�possible�the�percentages�sum�up�to�more�than�100�percent.�2�The�question�what�are�the�conditions�for�getting�a�work�will�be�discussed�later�on.�3�For�data�analysis�concerned�with�issues�of�income,�work�place,�professional�tasks�etc.�both�these�groups� (n=65)� are� excluded.� In� all� questions� related� to�professional�qualification�processes� and�their�impact,�however�they�will�be�included.�4�Although�the�variables�are�metrical�scaled,�the�Spearman�correlation�coefficient�was�calculated�due�to�the�strong�skewness�of�both�variables.�5�This�result�is�confirmed�by�the�“Labor�market�Survey”�conducted�by�JIMAT�in�2008.�6�The� interpretation�of� the�average�scores�must�consider, that in case of City & Guilds�and�National�Trade� Certificates� the� levels� are� counting� from� 3� (lowest)� to� 1� (highest),� but� in� case� of� the�TEVETA�Certificate�it’s�inverse.�
334
Part�IV:�Final�Remarks�
Education�is�a�strategic�sector�for�the�promotion�of�economic�and�social�development.�The�present� study� targeted� two�of� the� sub�sectors� of� the� educational� system:�Higher�Education�and�Technical�and�Vocational�Education.�Both�of�them�are�characterized�by�a�direct� relation�with� the� labor�market�because�their� function�consists� in�an�economic�point� of� view1� in� the� formation� of� specific� human� capital� needed� by� the� private� and�public�sector�of�a�country’s�economy.��
In� general� external� and� internal� efficiency� of� educational� processes� has� to� be�expected.�One�powerful�tool2�to�assess�efficiency�and�internal�quality�assurance�in�HE�and�TEVET�programs�are�Tracer�Studies�which�endeavor�to�follow�up�graduates�of�a�program�of�study.�The�present�study�targeted�graduates�of�Malawian�Universities�and�completers�of�TEVET�programs�of�the�years�2004�2007.�The�results�of�the�study�indicate�by� and� large� a� positive� situation,� and� no� evidence� for� a� general� trend� of� “over�production”� of� graduates� was� observed.� However,� there� is� still� much� room� for�improvement,�in�order�to�enhance�the�efficiency�of�the�system�as�a�whole�according�to�the�recommendations�exposed�above.��
However,� it� must� be� emphasized� that� Tracer� Studies� are� not� a� one�time� data�collection� but� should� make� part� of� institutionalized� an� integrated� labor� market�oriented� Monitoring� and� Evaluation� System� (MES).� Especially� in� dynamic�environments�which� changing� labor�market�demands,� a� regular�monitoring�must� be�realized�at�economically�justifiable�costs.�The�methodological�experiences�generated�in�the� present� study� demonstrate� the� necessity� to� encourage� universities� and� TEVET�providers� to� develop� databases� which� permit� to� track� regularly� their� students�providing�a�link�between�the�supply�side�(universities�and�TEVET�providers)�and�the�quantitative� and� qualitative� needs� of� the� private� and� public� sector� of� economy.� The�formation�of�alumni�associations�on�both�levels�(HE�and�TEVET)�could�be�a�first�and�efficient� instrument� to� put� an� effective� MES� and� to� collect� needed� data� regularly.�Incentives� such�us� job� and� career� information� are� helpful� to� attract�members� to� join�such� alumni� networks.� Further� steps� such� as� regular� reporting� by� part� of� the�companies� and� self�employed� can� follow� in� the� future� in� order� to� identify� at� time�future�occupational�trends�in�the�Malawian�economy.�
Notes �1�Beyond�the�economic�value�of�education�there�are�a�lot�of�non�economic�social�and�individual�effects�to�be�considered.�2�Another�method�to�assess�efficiency�is�the�calculation�of�rates�of�return,�which�request,�however,�detailed�information�about�the�cost�structures�of�programs.��

335
�
References�
Global�World� Bank.� 2004.� Cost,� Financing� and� School� Effectiveness� of� Education� in� Malawi:� A�
Future�of�Limited�Choices�and�Endless�Opportunities.�Washington,�DC:�World�Bank.�August�(first�Education�Malawi�CSR).�
�
Executive�Summary�JIMAT�Development�Consultants.� 2008.�Malawi�Labour�Market�Survey.�Prepared� for�
TEVETA,�Draft�Report.�Lilongwe,�August.��National� Statistical� Office.� 2005.� Malawi� Second� Integrated� Household� Survey� (IHS�2)�
2004–2005.�October.�Zomba,�Malawi.�National�Statistical�Office�and�UNICEF.�2007.�Malawi�Multiple�Indicators�Cluster�Survey�
(MICS)�2006.�February.�Zomba�and�Lilongwe,�Malawi.���
Chapter�1�OECD.�2008.�OECD�Stat�Extracts�(www.�oecd.org).�Paris.�UNAIDS.�2008.�Report�on�the�Global�AIDS�Epidemic,�2008.�UN,�New�York�UNDP.�2008.�Human�Development�Report,�2007/2008.�UN,�New�York�United� Nations.� 2008.�World� Population� Prospects:� The� 2008� Revision.� Department� of�
Economic�and�Social�Affairs.�UN,�New�York.�World�Bank.�2008.�Live�Database�(www.worldbank.org).�Washington,�DC:�World�Bank.�———.�2008.�Malawi�Poverty�Assessment�Report,�2008.�Washington,�DC:�World�Bank.�———.� 2009� (forthcoming)� Education� Performance� Rating:� How� Do� African� countries�
Score?�A�Multi�Dimensional�Tool� for�Benchmarking�Education�Outcomes�and�System�Policies.�Washington,�DC:�World�Bank.�
World� Health� Organization.� 2008.� Global� Database� on� Child� Growth� and� Malnutrition.�Geneva.�
�Chapter�2�Mingat,�A.,�and�S.�Sosale.�2001.�Problèmes�de�politique�éducative�relatifs�au�redoublement�à�
l�école� primaire� dans� les� pays� d�Afrique� Sub�saharienne.� PSAST/AFTHD.�Washington,�DC:�World�Bank.�
Ministry� of� Education,� Science� and� Technology� (MOEST),�Department� of� Education.�2008.�Education�Statistics�2007.�Government�of�Malawi.��
336 References
�
National�Statistical�Office.�2001.�Malawi�Demographic�and�Health�Survey�(DHS).�Zomba,�Malawi�and�ORC�Macro,�Calverton,�MD.�
———.� 2005.�Malawi� Second� Integrated� Household� Survey� (IHS�2)� 2004–2005.� Zomba,�Malawi,�October.�
National�Statistical�Office�and�UNICEF.�2007.�Malawi�Multiple�Indicators�Cluster�Survey�(MICS)�2006.�February.�Zomba�and�Lilongwe,�Malawi.�
Reuge,�N.�2008.�Schooling�Profiles,�Methodological�Note�n°2.�UNESCO�BREDA,�Note�du�Pôle�de�Dakar�(www.poledakar.org).�
UNESCO�BREDA.�2007.�Education�for�All�in�Africa:�Top�Priority�for�Integrated�Sector�Wide�Policies.�Dakar+7.�Dakar.�
World� Bank.� 2005.� “Project� Appraisal� Document� on� a� Proposed� IDA� Grant� to� the�Republic�of�Malawi�for�an�Education�Support�Project.”�AFTH3,�Working�Paper.�Washington,�DC:�World�Bank.�
�Chapter�3�Bellew,� R.� 2008.� “Malawi� NESP� EFA�FTI� Appraisal� Report.”� Working� Document.�
Cambridge�Education,�Mokoro,�and�Oxford�Policy�Management.��Foko,� B.,� and�M.� Brossard.� 2007.�Couverture� scolaire� des� années� 1970� et� impacts� sur� la�
croissance�entre�1970�et�2003,�UNESCO�BREDA:�Document�de�travail�du�Pôle�de�Dakar�(www.poledakar.org).�
Government�of�Malawi.�2008.�Budget�Statements�(revised),�2007/2008.��National� Statistical� Office.� 2005.� Malawi� Second� Integrated� Household� Survey� (IHS�2)�
2004–2005.�October.�Zomba,�Malawi.�Ndem,� F.� 2008.� Education� Household� Expenditure.� Senegal:� Pole� de� Dakar�
(www.poledakar.org).�World�Bank.�2009�(forthcoming).�Education�Performance�Rating:�How�Do�African�countries�
Score?�A�Multi�Dimensional�Tool� for�Benchmarking�Education�Outcomes�and�System�Policies.�Washington,�DC:�World�Bank.�
�Chapter�4�Bellew,� R.� 2008.� “Malawi� NESP� EFA�FTI� Appraisal� Report.”� Working� Document.�
Cambridge�Education,�Mokoro,�and�Oxford�Policy�Management.��Brossard,� M.� 2003.� “Retention,� redoublement� et� qualité� dans� les� écoles� publiques�
primaires�béninoises:�Quel�diagnostic?�Quelles�pistes�de�politiques�éducatives?”�Pôle�de�Dakar�Working�Paper�(www.poledakar.org).�
Bruns,�B.,�A.�Mingat,�and�M.�Rakotomalala.�2003.�Achieving�Universal�Primary�Education�by�2015:�A�Chance�for�Every�Child.�Washington,�DC:�World�Bank.�
Mingat,�A.,�and�S.�Sosale.�,�2001.�Problèmes�de�politique�éducative�relatifs�au�redoublement�à�l�école� primaire� dans� les� pays� d�Afrique� Sub�saharienne.� PSAST/AFTHD.�Washington,�DC:�World�Bank.�
PASEC,�CONFEMEN.�1999.�“Les�facteurs�de�l’efficacité�dans�l’enseignement�primaire:�les� résultats� du� programme� PASEC� sur� neuf� pays� d’Afrique� et� de� l’Océan�indien.”�CONFEMEN�(www.confemen.org).��
———.� 2004.� “Le� redoublement�:� pratiques� et� conséquences� dans� l’enseignement�primaire�au�Sénégal.”�(www.confemen.org).�

References 337
�
Pôle� de� Dakar.� 2002.� “Universal� Primary� Education:� A� Goal� for� All.”� Statistical�Document�for�the�Eighth�Education�Ministers’�Conference�for�African�Countries.�MINEDAF� VIII� (December� 6–12,� Dar� Es� Salam).� BREDA�UNESCO�(www.poledakar.org).�
SACMEQ� II.� 2005.� The� SACMEQ� II� Project� in� Malawi:� A� Study� of� the� Conditions� of�Schooling� and� the� Quality� of� Education.� Working� Report.� Southern� and� Eastern�Africa� Consortium� for� Monitoring� Educational� Quality� (SACMEQ)�(http://www.sacmeq.org/).�
UNESCO�BREDA.�2007.�Education�for�All�in�Africa:�Top�Priority�for�Integrated�Sector�Wide�Policies.�Dakar+7.�Dakar.�
———.�2005.�EFA�in�Africa:�Paving�the�Way�for�Action.�Dakar.�World�Bank,�in�partnership�with�the�Pôle�de�Dakar�(UNESCO�France)�and�a�national�
Cameroonian�team.�2004.�Cameroun�Country�Status�Report.�(www.poledakar.org).�World�Bank,�in�partnership�with�the�Pôle�de�Dakar�(UNESCO�France)�and�a�national�
Chadian�team.�2005.�Chad�Country�Status�Report.�(www.poledakar.org).��Chapter�5�Ministry� of� Education,� Science� and� Technology� (MOEST),� Education� Management�
Information� System� (EMIS).� 2006,� 2007.� Education� Statistics.� Government� of�Malawi.�
SACMEQ� II.� 2005.� The� SACMEQ� II� Project� in� Malawi:� A� Study� of� the� Conditions� of�Schooling� and� the� Quality� of� Education.� Working� Report.� Southern� and� Eastern�Africa� Consortium� for� Monitoring� Educational� Quality� (SACMEQ)�(http://www.sacmeq.org/).�
�Chapter�6�Africa�Private�Sector�Group.� Investment�Climate�Assessment� (ICA).�Malawi:� June�23,�
2006.�Franz,�Jutta,�Marc�Maleta,�and�Maston�Mtambo.�A�New�Mechanism�for�Financing�TEVET�
in�Malawi.�A�study�commissioned�by�the�TEVET�Secretariat.�Malawi:�Ministry�of�Labour�and�Vocational�Training,�August�1998.��
Gondwe,�Clement.�“TEVETA�Informal�Sector�Outreach�Programmes.”�Paper�prepared�as� a� response� to� UNESCO/International� Centre� for� Technical� and� Vocational�Education�and�Training�call�for�papers.�Lilongwe:�March�2003.��
Government�of�Malawi.�Budget�Statements�(revised),�2007/2008.��Government� of� Malawi,� Ministry� of� Labour� and� Vocational� Training,� Technical,�
Entrepreneurial� and� Vocational� Education� and� Training� (TEVET)� Policy.�October,�1998.�
Government� of� Malawi.� Technical,� Entrepreneurial� and� Vocational� Education� and�Training�Act.�No.�6�of�1999.�February,�19,�1999.��
Government� of� Malawi.� Technical,� Entrepreneurial� and� Vocational� Education� and�Training�(Registration�of�Education�and�Training�Institutions).�Regulation,�2006.��
JIMAT� Development� Consultants.� Malawi� Labour� Market� Survey.� Prepared� for�TEVETA,�Draft�Report.�Lilongwe:�August�2008.��
Maganga,� Dick.� Apprenticeship� Training� Costs.� Final� Report.� TEVETA,� September�2008�(circulation�restricted).��
338 References
�
Ministry� of� Education,� Science� and� Technology� (MOEST),� Education� Management�Information� System� (EMIS).� 2006,� 2007.� Education� Statistics.� Government� of�Malawi.�
MOEST.�2007.�National�Education�Sector�Plan.�Operation�Supplement�Containing�Education�Sector�Analysis,�Summary�of�Programme�Profiles,�Financial�Details.�Draft,�August.��
Pfeiffer,�Dietmar�and�Gerald�Chiunda.�Tracer�Study�of�TEVET�and�Higher�Education�Completers� in� Malawi.� Final� Report.� Lilongwe:� GTZ/World� Bank,� 2008.� (See�Annex�9�of�this�report.)�
PJ� Development� Consultancy� Company.� Tracer� Study� on� “Skills� Development�Initiative”�and�“On�the�Job�Training”�Beneficiaries.�Prepared�for�TEVETA.�Final�Report.�Lilongwe:�August�2005.��
Technical,� Entrepreneurial,� and� Vocational� Education� and� Training� Authority�(TEVETA),�Government�of�Malawi.�1999.�TEVET�Provider�Inventory.�Lilongwe.�
———.�2004.�A�Guide�to�Better�Understanding�and�Implementation�of�TEVET�Qualifications.�TEVET�Qualifications�Framework�Handbook.�November.�Lilongwe.��
———.� 2007.� Strategic� Plan� for� Technical� Entrepreneurial� Vocational� Education� and�Training�Authority�(TEVETA)�2007–2012,�March�2007.�Lilongwe.�
UNESCO.� 2006.� Republic� of� Malawi:� Report� on� Present� Status� and� Future� Directions� of�Technical�and�Vocational�Education.�January.�Paris.�
�Chapter�7�Barry,�B.,�and�A.�Sawyerr.�2008.�African�Higher�Education�and� Industry:�What�Linkages.�
Cape�Town,�South�Africa:�Association�of�African�Universities.�Bloom,�D.,�D.�Canning,�and�K.�Chan.�2006.�Higher�Education�and�Economic�Development.�
Cambridge,�MA:�Harvard�University.�Fielden,� J.,� and� K.� Abercromby.� 2001.� UNESCO� Higher� Education� Indicators� Study,�
Accountability�and�International�Co�operation� in� the�Renewal�of�Higher�Education.�A�study� prepared� by� of� the� Commonwealth� Higher� Education� Management�Service�(CHEMS),�as�part�of� the�follow�up�to� the�World�Conference�on�Higher�Education�(UNESCO�Paris�1998).��
Helm,�R.�2008.�University�Admission�Worldwide:�World�Bank�Education�Working�Series:�Number�15.�Washington,�DC:�World�Bank.�
Jackson,�R.� 2002.� “The�National�Student�Financial�Aid�Scheme�of�South�Africa:�How�and�Why�it�Works.”�Welsh�Journal�of�Education�11(1),�July.�
Government� of� Malawi.� 2006.� Public� Expenditure� Review.� Appendix� V,� The� Public�Universities� Students� Loan� Trust� Loan� Agreement� Between� The� Public� Universities�Student�Loan�Trust�in�the�Public�of�Malawi�and�the�Student.�Lilongwe.�
Hahao,�N.� L.� 2003.� “Towards�Curriculum�Relevance:� The� Reform�Experience� on� the�National� University� of� Lesotho.”� Paper� prepared� for� the� Regional� Training�Conference�on�Improving�Tertiary�Education�in�Sub�Sahara�Africa:�Things�that�Work.�Ghana.�
JIMAT�Development�Consultants.�2008.�“Malawi�Labour�Market�Survey.”�Prepared�for�TEVETA,�Draft�Report.�August.�Lilongwe.��
Kurasha,� P.� 2003.� “Access� to� Tertiary� Education� as� a� National� Strategy� for�Development:� The� Zimbabwe�Open�University� Case.”� Paper� prepared� for� the�
References 339
�
Regional� Training�Conference� on� Improving�Tertiary� Education� in� Sub�Sahara�Africa:�Things�that�Work.�Ghana.�
Malawi�Institute�of�Management.�2004.�University�of�Malawi�Reform�Study.�Lilongwe.�MOEST.�2008.�Trust�Deed�for�the�Public�Universities�Students�Loans�Trust,�2008.�Lilongwe.�Odebero�et�al.�2007.�“Equity�in�the�Distribution�of�HELB�Loans�in�Kenya�in�Relation�to�
Student�Characteristics:�An�Empirical�Analysis.”�Educational�Research�and�Reviews�2(8):�209–219.�
Otieno,�W.� 2004.� “Student� Loans� in� Kenya:� Past� Experiences,� Current� Hurdles,� and�Opportunities�for�the�Future.”�Journal�of�Higher�Education�in�Africa�2(2).�
Pfeiffer,� D.,� and� G.� Chiunda.� 2008.� “Tracer� Study� of� TEVET� and� Higher� Education�Completers�in�Malawi.�Final�Report.”�Lilongwe:�GTZ/World�Bank.�(See�Annex�9�of�this�report.)�
Shen,� H.,� and� A.� Ziderman.� 2008.� “Student� Loans� Repayment� and� Recovery:�International�Comparisons.”�Discussion�Paper�No.�3588.�Bonn:� Institute� for� the�Labour�Study.�
UNESCO.�ISCED�International�Standard�Classification�of�Education,�1997.�Paris.�United� Nations.� Recommendations� Concerning� the� Status� of� Higher� Education� Teaching�
Personnel.�United�Nations�Education,�Scientific�and�Cultural�Organization,�1997.�UN,�New�York.�
University�of�Malawi.�2007.�University�of�Malawi�Strategic�Plan�2004/05–2009/10,�Volume�1�Consolidated�Version,�2007.�Zomba.�
———.� 2008.�Programmes� and� Entry� Requirements� for� 2008–2009:� University� of�Malawi.�University�Office,�Zomba.�
Van�Harte,�M.�2002.�“Can�Student�Loan�Schemes�Ensure�Access�to�Higher�Education:�South� Africa’s� Experience.”� International� Comparative� Higher� Education�Finance� and� Accessibility� Project� Discussion� Paper,� Graduate� School� of�Education,�University�of�Buffalo,�Buffalo,�NY.�
Woodhall,�M.�1992.�Student�Loans� in�Developing�Countries,�Experiences� and�Prospects� for�Reform.�The�Netherlands:�Kluwer�Academic�Publishers.�
World�Bank.�1997.�Revitalizing�Universities�in�Africa,�Strategy�and�Guidelines.�Prepared�by�the�Association�of�African�Universities,�1997.�Washington,�DC:�World�Bank.�
———.�2000.�“Higher�Education� in�Developing�Countries:�Peril�and�Promise� (2000).”�Paper� commissioned� by� the� Task� Force� on� Higher� Education� and� Society.�Washington,�DC:�World�Bank.�
———.�2003.�Education�in�Rwanda:�Accelerating�the�Agenda�for�Post�Conflict�Development.�Human�Development�II,�Africa�Region,�2003.�Washington,�DC:�World�Bank.�
Ziderman,�A.�2004.�Policy�Options�for�Student�Loan�Schemes:�Lessons�from�Five�Asian�Case�Studies:�UNESCO�Bangkok.�
�Chapter�8�Africa� Private� Sector� Group.� 2006.� Investment� Climate� Assessment� (ICA).� June� 23.�
Malawi.�JIMAT�Development�Consultants.�2008.�“Malawi�Labour�Market�Survey.”�Prepared�for�
TEVETA,�Draft�Report.�August.�Lilongwe.��Johanson,� R.,� and� A.� Adams.� 2004.� Skills� Development� in� Sub�Saharan� Africa.�
Washington,�DC:�The�World�Bank.�
340 References
�
Malawi�Confederation�of�Chambers�of�Commerce�and�Industry�(MCCCI).�2007.�Report�of�the�Results�of�the�2007�Malawi�Business�Climate�Survey.�November.��
Malawi� National� Gemini� MSE� Baseline� Survey� 2000.� 2001.� Prepared� by� Ebony�Consulting� International� and� the�National� Statistical�Office,�with� assistance� of�Kadale� Consultants� and� Wadonda� Consult,� on� behalf� of� DFID.� February.�Lilongwe.��
Malawi�Confederation�of�Chambers�of�Commerce�and�Industry�(MCCCI).�2007.�Malawi�Business�Climate�Survey,�p.�10.�Blantyre,�Malawi.�
Ministry�of�Labour.�2007.�2006�Labour�Yearbook,�March�2007.�Malawi.�———.� 2008.� “Blantyre� Sweeping� Labour� Inspections� (The� First� Reports).� Tables�
Generated�from�the�Data�and�Some�Highlights.”�February�15.�Malawi.�National�Statistical�Office.�2006.�Welfare�Monitoring�Survey�(WMS).�Malawi.�Pfeiffer,� D.,� and� G.� Chiunda.� 2008.� “Tracer� Study� of� TEVET� and� Higher� Education�
Completers�in�Malawi.�Final�Report.”�Lilongwe:�GTZ/World�Bank.�(See�Annex�9�of�this�report.)�
PJ� Development� Consultancy� Company.� 2005.� Tracer� Study� on� “Skills� Development�Initiative”�and�“On�the�Job�Training”�Beneficiaries.�Prepared�for�TEVETA.�Final�Report.�August.�Lilongwe.��
Programa� Integrado� de� Reforma� da� Educacao� Profissional� (PIREP)/C.� 2007.�“Lauchande,� Analise� Estatistica� do� Estudo� de� Base� Sobre� Educacao� Técnica�Profissional�(Mozambique).”�December.�PIREP.�
Republic� of� Malawi� &� The� World� Bank.� 2006.� Malawi� Poverty� and� Vulnerability�Assessment.�Investing�in�Our�Future.�June.��
�����

�
��

�
�
��

�
�
��
�
�
����
Eco-Audit
Environmental Benefits Statement �The�World�Bank�is�committed�to�preserving�Endangered�Forests�and�natural�resources.�We�print�World�Bank�Working�Papers�and�Country�Studies�on�postconsumer�recycled�paper,� processed� chlorine� free.� The� World� Bank� has� formally� agreed� to� follow� the�recommended� standards� for� paper� usage� set� by� Green� Press� Initiative—a� nonprofit�program� supporting� publishers� in� using� fiber� that� is� not� sourced� from� Endangered�Forests.�For�more�information,�visit�www.greenpressinitiative.org.��In�2008,�the�printing�of�these�books�on�recycled�paper�saved�the�following:��
Trees*� Solid�Waste� Water� Net�Greenhouse�Gases�
Total�Energy�
289� 8,011� 131,944 27,396� 92�mil.�*40�feet�in��height�and��6–8�inches�in�diameter�
Pounds� Gallons�Pounds�CO2�Equivalent� BTUs�
�
�����
�

THE WORLD BANK1818 H Street, NW
Washington, DC 20433 USA
Telephone: 202 473-1000
Internet: www.worldbank.org
E-mail: [email protected]
The Education System in Malawi, an Education Country
Status Report (CSR), is a detailed analysis of the current sta-
tus of the education sector in Malawi, the results of which
have been validated by the government of Malawi. Its main
purpose is to enable decision makers to orient national poli-
cy on the basis of a factual diagnosis of the overall education
sector and to provide relevant analytical information for the
dialogue between the government and development part-
ners. The analysis incorporates data and information from
multiple sources, such as school administrative surveys by
the Ministry of Education, household surveys, and a tracer
survey created especially for this study. This CSR, developed
by a multi-ministerial national team supported by UNESCO-
Pôle de Dakar, the World Bank, and GTZ specialists, updates
the previous one drawn up in 2003 and consists of eight
chapters, including a chapter on higher education. The analy-
sis provides key monitoring and evaluation inputs for the
overall education sector, particularly under the framework of
the implementation of the Nati onal Education Sector Plan.
World Bank Working Papers are available individually or on
standing order. This World Bank Working Paper series is also
available by subscription to the World Bank e-Library
(www.worldbank.org/newelibrary.
ISBN 978-0-8213-8198-4
SKU 18198