Embed Size (px)
Citation preview
– 1 –
The Fiscal Im-
pacts of Oil and
Gas Production in
New Mexico
2014 Fiscal Year End
New Mexico Tax Research Institute © 2015 all
rights reserved www.nmtri.org P.O. Box 91657
Albuquerque, NM 87199 505 842-5833
Impacts of Oil and Natural Gas Production in New Mexico on the State General Fund February 2015
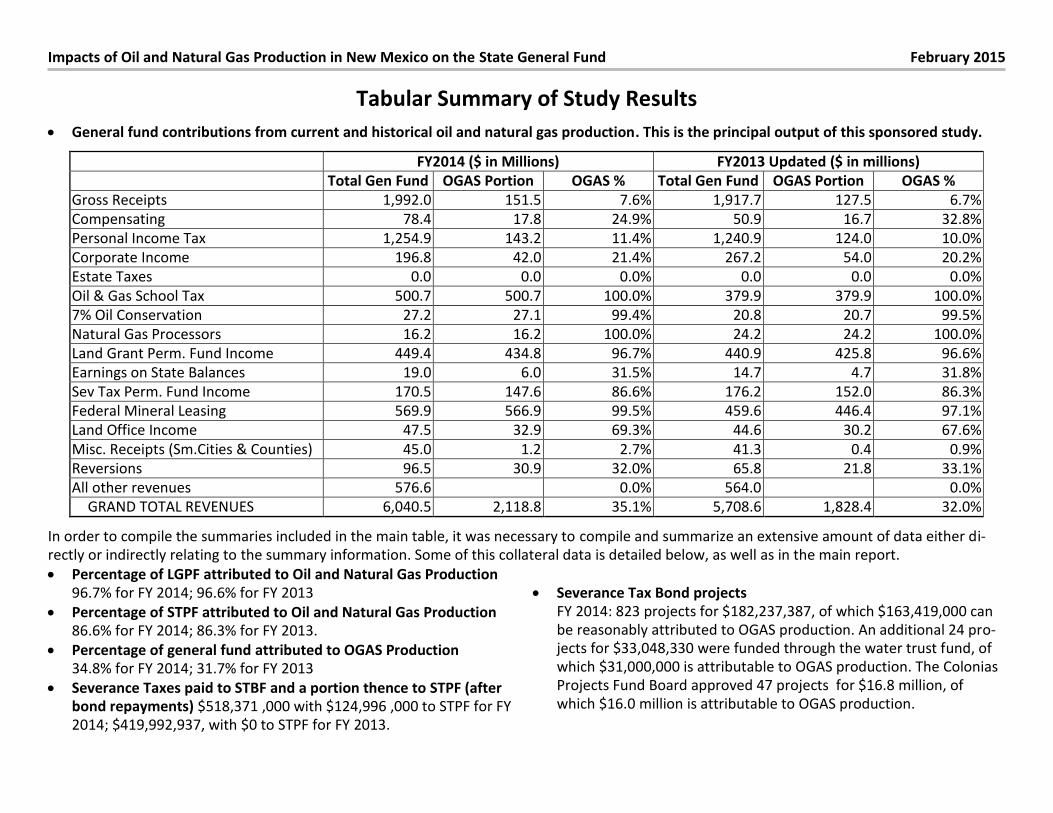
Tabular Summary of Study Results General fund contributions from current and historical oil and natural gas production. This is the principal output of this sponsored study.
FY2014 ($ in Millions) FY2013 Updated ($ in millions)
Total Gen Fund OGAS Portion OGAS % Total Gen Fund OGAS Portion OGAS %
Gross Receipts 1,992.0 151.5 7.6% 1,917.7 127.5 6.7%
Compensating 78.4 17.8 24.9% 50.9 16.7 32.8%
Personal Income Tax 1,254.9 143.2 11.4% 1,240.9 124.0 10.0%
Corporate Income 196.8 42.0 21.4% 267.2 54.0 20.2%
Estate Taxes 0.0 0.0 0.0% 0.0 0.0 0.0%
Oil & Gas School Tax 500.7 500.7 100.0% 379.9 379.9 100.0%
7% Oil Conservation 27.2 27.1 99.4% 20.8 20.7 99.5%
Natural Gas Processors 16.2 16.2 100.0% 24.2 24.2 100.0%
Land Grant Perm. Fund Income 449.4 434.8 96.7% 440.9 425.8 96.6%
Earnings on State Balances 19.0 6.0 31.5% 14.7 4.7 31.8%
Sev Tax Perm. Fund Income 170.5 147.6 86.6% 176.2 152.0 86.3%
Federal Mineral Leasing 569.9 566.9 99.5% 459.6 446.4 97.1%
Land Office Income 47.5 32.9 69.3% 44.6 30.2 67.6%
Misc. Receipts (Sm.Cities & Counties) 45.0 1.2 2.7% 41.3 0.4 0.9%
Reversions 96.5 30.9 32.0% 65.8 21.8 33.1%
All other revenues 576.6
0.0% 564.0
0.0%
GRAND TOTAL REVENUES 6,040.5 2,118.8 35.1% 5,708.6 1,828.4 32.0%
In order to compile the summaries included in the main table, it was necessary to compile and summarize an extensive amount of data either di-
rectly or indirectly relating to the summary information. Some of this collateral data is detailed below, as well as in the main report.
Percentage of LGPF attributed to Oil and Natural Gas Production
96.7% for FY 2014; 96.6% for FY 2013
Percentage of STPF attributed to Oil and Natural Gas Production 86.6% for FY 2014; 86.3% for FY 2013.
Percentage of general fund attributed to OGAS Production 34.8% for FY 2014; 31.7% for FY 2013
Severance Taxes paid to STBF and a portion thence to STPF (after bond repayments) $518,371 ,000 with $124,996 ,000 to STPF for FY
2014; $419,992,937, with $0 to STPF for FY 2013.
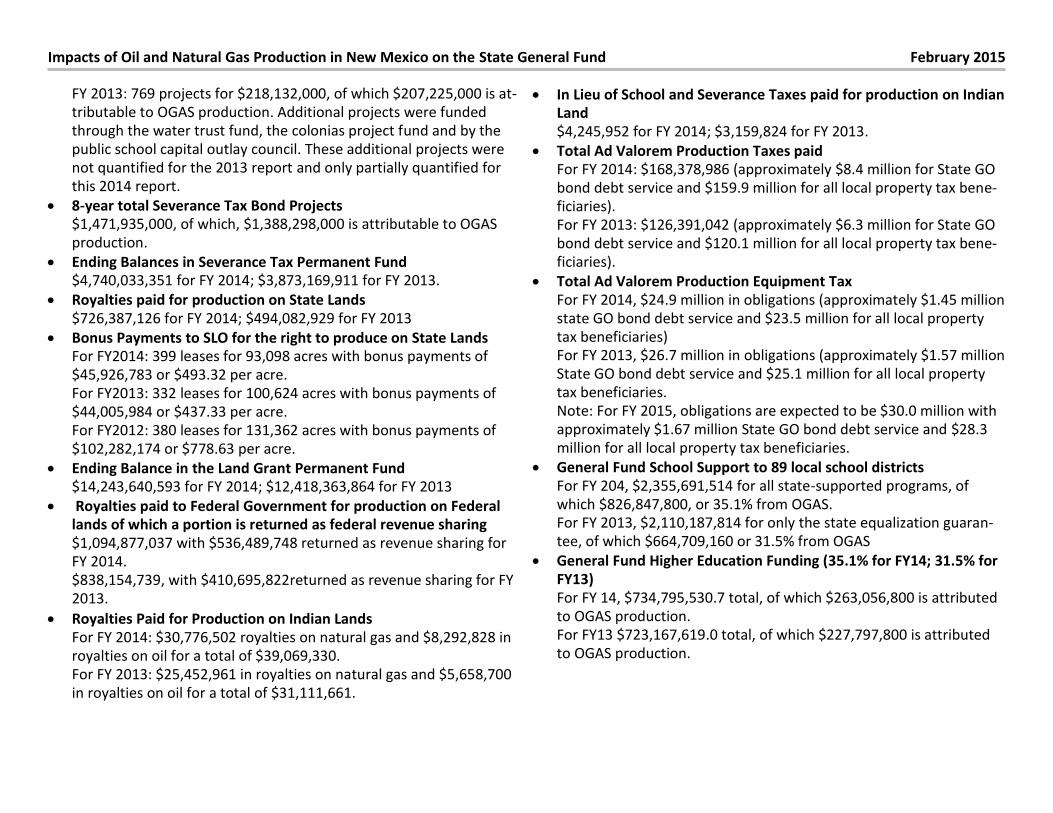
Severance Tax Bond projects
FY 2014: 823 projects for $182,237,387, of which $163,419,000 can
be reasonably attributed to OGAS production. An additional 24 pro-jects for $33,048,330 were funded through the water trust fund, of
which $31,000,000 is attributable to OGAS production. The Colonias
Projects Fund Board approved 47 projects for $16.8 million, of
which $16.0 million is attributable to OGAS production.
Impacts of Oil and Natural Gas Production in New Mexico on the State General Fund February 2015
FY 2013: 769 projects for $218,132,000, of which $207,225,000 is at-
tributable to OGAS production. Additional projects were funded
through the water trust fund, the colonias project fund and by the
public school capital outlay council. These additional projects were
not quantified for the 2013 report and only partially quantified for
this 2014 report.
8-year total Severance Tax Bond Projects $1,471,935,000, of which, $1,388,298,000 is attributable to OGAS
production.
Ending Balances in Severance Tax Permanent Fund $4,740,033,351 for FY 2014; $3,873,169,911 for FY 2013.
Royalties paid for production on State Lands
$726,387,126 for FY 2014; $494,082,929 for FY 2013
Bonus Payments to SLO for the right to produce on State Lands For FY2014: 399 leases for 93,098 acres with bonus payments of
$45,926,783 or $493.32 per acre.
For FY2013: 332 leases for 100,624 acres with bonus payments of
$44,005,984 or $437.33 per acre.
For FY2012: 380 leases for 131,362 acres with bonus payments of
$102,282,174 or $778.63 per acre.
Ending Balance in the Land Grant Permanent Fund $14,243,640,593 for FY 2014; $12,418,363,864 for FY 2013
Royalties paid to Federal Government for production on Federal lands of which a portion is returned as federal revenue sharing
$1,094,877,037 with $536,489,748 returned as revenue sharing for
FY 2014.
$838,154,739, with $410,695,822returned as revenue sharing for FY
2013.
Royalties Paid for Production on Indian Lands
For FY 2014: $30,776,502 royalties on natural gas and $8,292,828 in
royalties on oil for a total of $39,069,330.
For FY 2013: $25,452,961 in royalties on natural gas and $5,658,700
in royalties on oil for a total of $31,111,661.
In Lieu of School and Severance Taxes paid for production on Indian Land
$4,245,952 for FY 2014; $3,159,824 for FY 2013.
Total Ad Valorem Production Taxes paid For FY 2014: $168,378,986 (approximately $8.4 million for State GO
bond debt service and $159.9 million for all local property tax bene-
ficiaries).
For FY 2013: $126,391,042 (approximately $6.3 million for State GO
bond debt service and $120.1 million for all local property tax bene-
ficiaries).
Total Ad Valorem Production Equipment Tax
For FY 2014, $24.9 million in obligations (approximately $1.45 million
state GO bond debt service and $23.5 million for all local property
tax beneficiaries) For FY 2013, $26.7 million in obligations (approximately $1.57 million
State GO bond debt service and $25.1 million for all local property
tax beneficiaries.
Note: For FY 2015, obligations are expected to be $30.0 million with
approximately $1.67 million State GO bond debt service and $28.3
million for all local property tax beneficiaries.
General Fund School Support to 89 local school districts
For FY 204, $2,355,691,514 for all state-supported programs, of
which $826,847,800, or 35.1% from OGAS. For FY 2013, $2,110,187,814 for only the state equalization guaran-
tee, of which $664,709,160 or 31.5% from OGAS
General Fund Higher Education Funding (35.1% for FY14; 31.5% for
FY13)
For FY 14, $734,795,530.7 total, of which $263,056,800 is attributed
to OGAS production.
For FY13 $723,167,619.0 total, of which $227,797,800 is attributed
to OGAS production.
Impacts of Oil and Natural Gas Production in New Mexico on the State General Fund February 2015
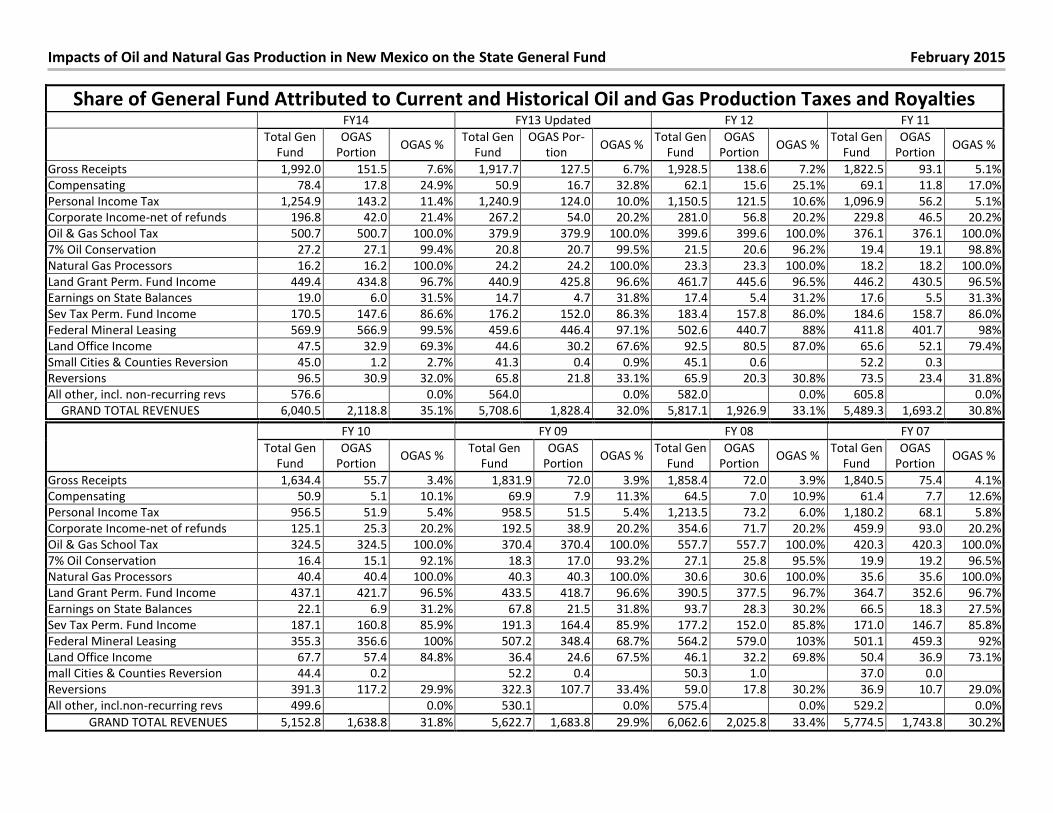
Share of General Fund Attributed to Current and Historical Oil and Gas Production Taxes and Royalties FY14 FY13 Updated FY 12 FY 11
Total Gen
Fund
OGAS
Portion OGAS %
Total Gen
Fund
OGAS Por-
tion OGAS %
Total Gen
Fund
OGAS
Portion OGAS %
Total Gen
Fund
OGAS
Portion OGAS %
Gross Receipts 1,992.0 151.5 7.6% 1,917.7 127.5 6.7% 1,928.5 138.6 7.2% 1,822.5 93.1 5.1%
Compensating 78.4 17.8 24.9% 50.9 16.7 32.8% 62.1 15.6 25.1% 69.1 11.8 17.0%
Personal Income Tax 1,254.9 143.2 11.4% 1,240.9 124.0 10.0% 1,150.5 121.5 10.6% 1,096.9 56.2 5.1%
Corporate Income-net of refunds 196.8 42.0 21.4% 267.2 54.0 20.2% 281.0 56.8 20.2% 229.8 46.5 20.2%
Oil & Gas School Tax 500.7 500.7 100.0% 379.9 379.9 100.0% 399.6 399.6 100.0% 376.1 376.1 100.0%
7% Oil Conservation 27.2 27.1 99.4% 20.8 20.7 99.5% 21.5 20.6 96.2% 19.4 19.1 98.8%
Natural Gas Processors 16.2 16.2 100.0% 24.2 24.2 100.0% 23.3 23.3 100.0% 18.2 18.2 100.0%
Land Grant Perm. Fund Income 449.4 434.8 96.7% 440.9 425.8 96.6% 461.7 445.6 96.5% 446.2 430.5 96.5%
Earnings on State Balances 19.0 6.0 31.5% 14.7 4.7 31.8% 17.4 5.4 31.2% 17.6 5.5 31.3%
Sev Tax Perm. Fund Income 170.5 147.6 86.6% 176.2 152.0 86.3% 183.4 157.8 86.0% 184.6 158.7 86.0%
Federal Mineral Leasing 569.9 566.9 99.5% 459.6 446.4 97.1% 502.6 440.7 88% 411.8 401.7 98%
Land Office Income 47.5 32.9 69.3% 44.6 30.2 67.6% 92.5 80.5 87.0% 65.6 52.1 79.4%
Small Cities & Counties Reversion 45.0 1.2 2.7% 41.3 0.4 0.9% 45.1 0.6 52.2 0.3
Reversions 96.5 30.9 32.0% 65.8 21.8 33.1% 65.9 20.3 30.8% 73.5 23.4 31.8%
All other, incl. non-recurring revs 576.6
0.0% 564.0
0.0% 582.0
0.0% 605.8
0.0%
GRAND TOTAL REVENUES 6,040.5 2,118.8 35.1% 5,708.6 1,828.4 32.0% 5,817.1 1,926.9 33.1% 5,489.3 1,693.2 30.8% FY 10 FY 09 FY 08 FY 07
Total Gen
Fund
OGAS
Portion OGAS %
Total Gen
Fund
OGAS
Portion OGAS %
Total Gen
Fund
OGAS
Portion OGAS %
Total Gen
Fund
OGAS
Portion OGAS %
Gross Receipts 1,634.4 55.7 3.4% 1,831.9 72.0 3.9% 1,858.4 72.0 3.9% 1,840.5 75.4 4.1%
Compensating 50.9 5.1 10.1% 69.9 7.9 11.3% 64.5 7.0 10.9% 61.4 7.7 12.6%
Personal Income Tax 956.5 51.9 5.4% 958.5 51.5 5.4% 1,213.5 73.2 6.0% 1,180.2 68.1 5.8%
Corporate Income-net of refunds 125.1 25.3 20.2% 192.5 38.9 20.2% 354.6 71.7 20.2% 459.9 93.0 20.2%
Oil & Gas School Tax 324.5 324.5 100.0% 370.4 370.4 100.0% 557.7 557.7 100.0% 420.3 420.3 100.0%
7% Oil Conservation 16.4 15.1 92.1% 18.3 17.0 93.2% 27.1 25.8 95.5% 19.9 19.2 96.5%
Natural Gas Processors 40.4 40.4 100.0% 40.3 40.3 100.0% 30.6 30.6 100.0% 35.6 35.6 100.0%
Land Grant Perm. Fund Income 437.1 421.7 96.5% 433.5 418.7 96.6% 390.5 377.5 96.7% 364.7 352.6 96.7%
Earnings on State Balances 22.1 6.9 31.2% 67.8 21.5 31.8% 93.7 28.3 30.2% 66.5 18.3 27.5%
Sev Tax Perm. Fund Income 187.1 160.8 85.9% 191.3 164.4 85.9% 177.2 152.0 85.8% 171.0 146.7 85.8%
Federal Mineral Leasing 355.3 356.6 100% 507.2 348.4 68.7% 564.2 579.0 103% 501.1 459.3 92%
Land Office Income 67.7 57.4 84.8% 36.4 24.6 67.5% 46.1 32.2 69.8% 50.4 36.9 73.1%
mall Cities & Counties Reversion 44.4 0.2 52.2 0.4 50.3 1.0 37.0 0.0
Reversions 391.3 117.2 29.9% 322.3 107.7 33.4% 59.0 17.8 30.2% 36.9 10.7 29.0%
All other, incl.non-recurring revs 499.6
0.0% 530.1
0.0% 575.4
0.0% 529.2
0.0%
GRAND TOTAL REVENUES 5,152.8 1,638.8 31.8% 5,622.7 1,683.8 29.9% 6,062.6 2,025.8 33.4% 5,774.5 1,743.8 30.2%
Impacts of Oil and Natural Gas Production in New Mexico on the State General Fund February 2015
Impacts of Oil and Natural Gas Production in New Mexico on the State General Fund February 2015
– 1 –
Impacts of Oil and Natural Gas Production in New Mexico on the
State General Fund
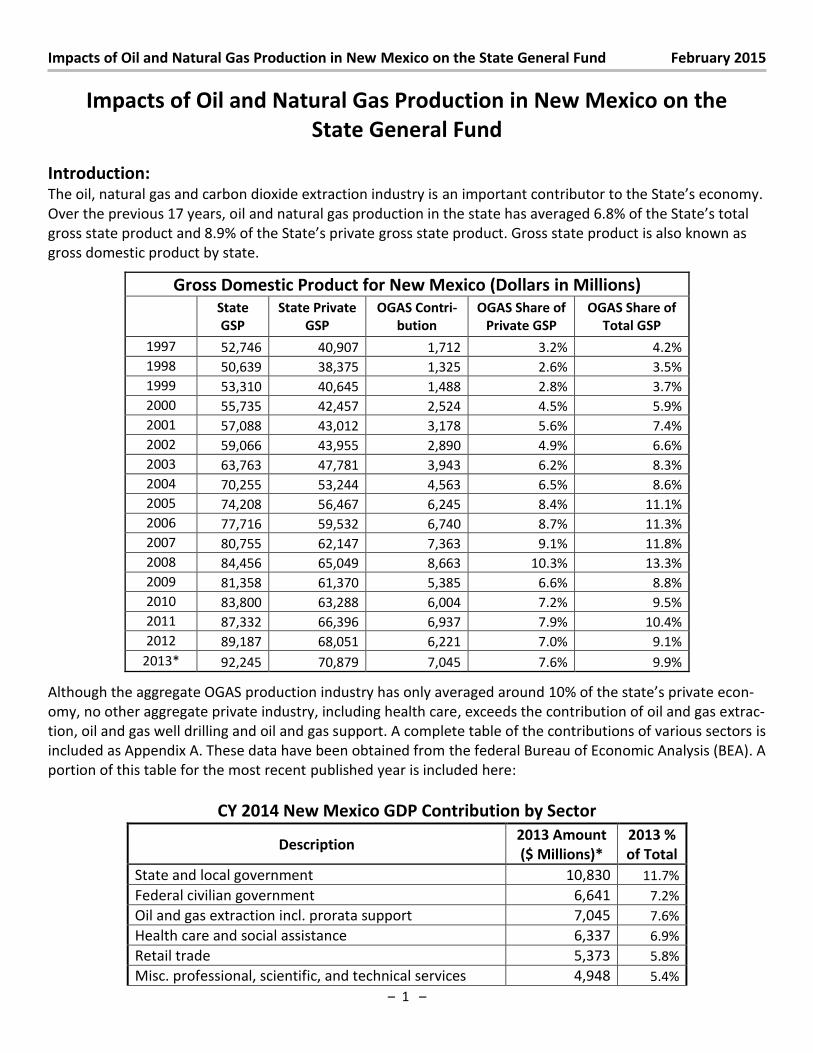
Introduction: The oil, natural gas and carbon dioxide extraction industry is an important contributor to the “tate’s e o o .
Over the previous 17 years, oil and natural gas p odu tio i the state has a e aged . % of the “tate’s total gross state product a d . % of the “tate’s p i ate gross state product. Gross state product is also known as
gross domestic product by state.
Gross Domestic Product for New Mexico (Dollars in Millions)
State
GSP
State Private
GSP
OGAS Contri-
bution
OGAS Share of
Private GSP
OGAS Share of
Total GSP
1997 52,746 40,907 1,712 3.2% 4.2%
1998 50,639 38,375 1,325 2.6% 3.5%
1999 53,310 40,645 1,488 2.8% 3.7%
2000 55,735 42,457 2,524 4.5% 5.9%
2001 57,088 43,012 3,178 5.6% 7.4%
2002 59,066 43,955 2,890 4.9% 6.6%
2003 63,763 47,781 3,943 6.2% 8.3%
2004 70,255 53,244 4,563 6.5% 8.6%
2005 74,208 56,467 6,245 8.4% 11.1%
2006 77,716 59,532 6,740 8.7% 11.3%
2007 80,755 62,147 7,363 9.1% 11.8%
2008 84,456 65,049 8,663 10.3% 13.3%
2009 81,358 61,370 5,385 6.6% 8.8%
2010 83,800 63,288 6,004 7.2% 9.5%
2011 87,332 66,396 6,937 7.9% 10.4%
2012 89,187 68,051 6,221 7.0% 9.1%
2013* 92,245 70,879 7,045 7.6% 9.9% Although the aggregate OGAS production industry has only averaged around % of the state’s p i ate e on-
omy, no other aggregate private industry, including health care, exceeds the contribution of oil and gas extrac-
tion, oil and gas well drilling and oil and gas support. A complete table of the contributions of various sectors is
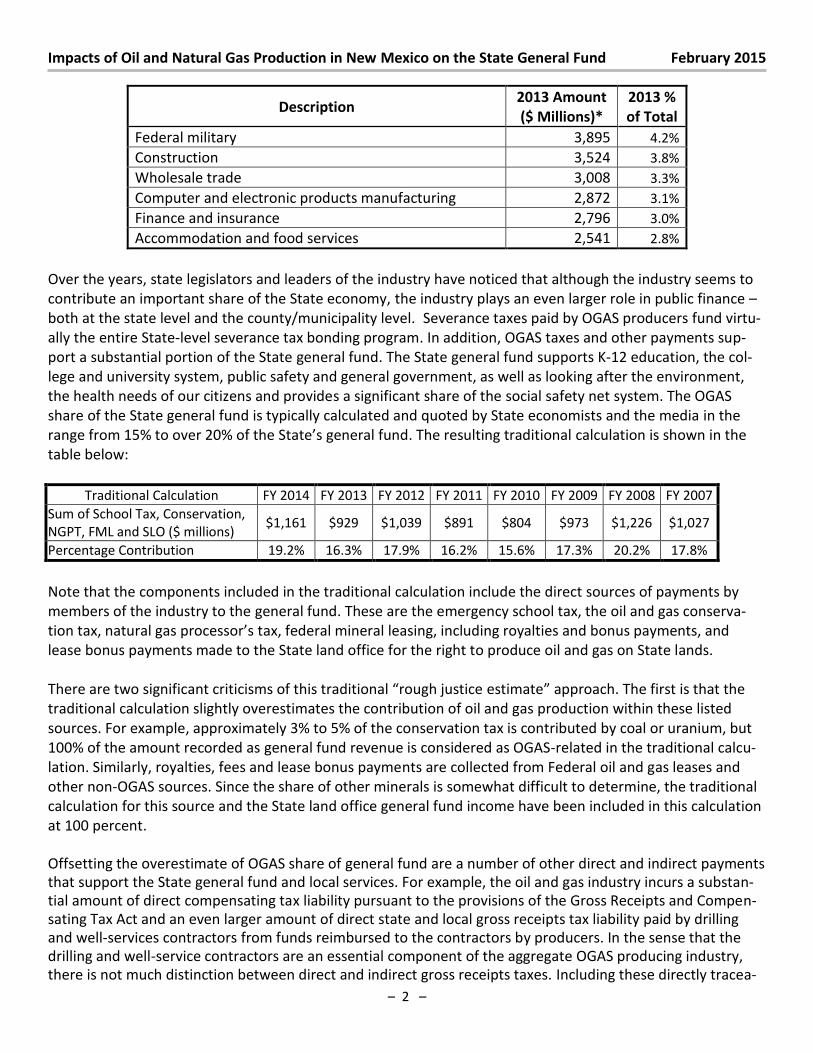
included as Appendix A. These data have been obtained from the federal Bureau of Economic Analysis (BEA). A
portion of this table for the most recent published year is included here:
CY 2014 New Mexico GDP Contribution by Sector
Description 2013 Amount
($ Millions)*
2013 %
of Total
State and local government 10,830 11.7%
Federal civilian government 6,641 7.2%
Oil and gas extraction incl. prorata support 7,045 7.6%
Health care and social assistance 6,337 6.9%
Retail trade 5,373 5.8%
Misc. professional, scientific, and technical services 4,948 5.4%
Impacts of Oil and Natural Gas Production in New Mexico on the State General Fund February 2015
– 2 –
Description 2013 Amount
($ Millions)*
2013 %
of Total
Federal military 3,895 4.2%
Construction 3,524 3.8%
Wholesale trade 3,008 3.3%
Computer and electronic products manufacturing 2,872 3.1%
Finance and insurance 2,796 3.0%
Accommodation and food services 2,541 2.8%
Over the years, state legislators and leaders of the industry have noticed that although the industry seems to
contribute an important share of the State economy, the industry plays an even larger role in public finance –
both at the state level and the county/municipality level. Severance taxes paid by OGAS producers fund virtu-
ally the entire State-level severance tax bonding program. In addition, OGAS taxes and other payments sup-
port a substantial portion of the State general fund. The State general fund supports K-12 education, the col-
lege and university system, public safety and general government, as well as looking after the environment,
the health needs of our citizens and provides a significant share of the social safety net system. The OGAS
share of the State general fund is typically calculated and quoted by State economists and the media in the
range from 15% to over 20% of the State’s general fund. The resulting traditional calculation is shown in the
table below:
Traditional Calculation FY 2014 FY 2013 FY 2012 FY 2011 FY 2010 FY 2009 FY 2008 FY 2007
Sum of School Tax, Conservation,
NGPT, FML and SLO ($ millions) $1,161 $929 $1,039 $891 $804 $973 $1,226 $1,027
Percentage Contribution 19.2% 16.3% 17.9% 16.2% 15.6% 17.3% 20.2% 17.8%
Note that the components included in the traditional calculation include the direct sources of payments by
members of the industry to the general fund. These are the emergency school tax, the oil and gas conserva-
tion tax, natural gas p o esso ’s tax, federal mineral leasing, including royalties and bonus payments, and
lease bonus payments made to the State land office for the right to produce oil and gas on State lands.
There are two significa t iti is s of this t aditio al ough justi e estimate app oa h. The fi st is that the traditional calculation slightly overestimates the contribution of oil and gas production within these listed
sources. For example, approximately 3% to 5% of the conservation tax is contributed by coal or uranium, but
100% of the amount recorded as general fund revenue is considered as OGAS-related in the traditional calcu-
lation. Similarly, royalties, fees and lease bonus payments are collected from Federal oil and gas leases and
other non-OGAS sources. Since the share of other minerals is somewhat difficult to determine, the traditional
calculation for this source and the State land office general fund income have been included in this calculation
at 100 percent.
Offsetting the overestimate of OGAS share of general fund are a number of other direct and indirect payments
that support the State general fund and local services. For example, the oil and gas industry incurs a substan-
tial amount of direct compensating tax liability pursuant to the provisions of the Gross Receipts and Compen-
sating Tax Act and an even larger amount of direct state and local gross receipts tax liability paid by drilling
and well-services contractors from funds reimbursed to the contractors by producers. In the sense that the
drilling and well-service contractors are an essential component of the aggregate OGAS producing industry,
there is not much distinction between direct and indirect gross receipts taxes. Including these directly tracea-
Impacts of Oil and Natural Gas Production in New Mexico on the State General Fund February 2015
– 3 –
ble tax payments made by the industry increases the estimated OGAS share of general fund by almost three
percentage points.
The largest underestimate within the traditional calculation of the OGAS share of the general fund is from in-
terest accruing to the general fund from the earnings from the corpus of the land grant permanent fund
(LGPF) and the severance tax permanent fund (STPF). In FY 2014, for example, over 10 percent of general fund
revenues come from the two permanent funds ($449.4 million from the LGPF and $170.5 million from the
STPF.) In the investigation and analysis accomplished in the course of this project, we can reasonably attribute
96.7 percent of the corpus of the LGPF at the end of FY 2014 to royalties paid for OGAS production on State
lands. Similarly, we have been able to establish that 86.6 percent of the FY 2014 ending corpus of the STPF can
be attributed to severance taxes paid on OGAS production from when the fund was established at the end of
the 1972 Fiscal Year to date. Including these two interest payments increases the estimated share of the gen-
eral fund by almost ten percentage points.
Fo this ea ’s effo t, e have included several other non-controversial items in the share calculation: TRD produces a RP-90 report that details, by industrial sector, payments of compensating taxes and payments of
withheld personal income taxes from industry employees. Both of these components – one direct and the
other indirect – are appropriate for inclusion in the share calculation. TRD also collects oil and gas withholding
payments from persons who receive either royalty payments from private leases or from investments in pro-
ducing partnerships or corporations. Twenty percent of the compensating taxes paid fund the small cities and
small counties assistance funds. An additional cut of approximately 7.3 percent provides the funding for the
municipal equivalency distribution. While the entire small cities assistance fund is distributed to the cities,
there is usually a reversion of funds to the general fund from the Small Counties Assistance fund. This rever-
sion has been credited to the OGAS share. Similarly, the State Treasurer holds all of the savings accounts of
the state and invests these funds in various financial instruments. Approximately 32 percent of the amount of
interest earned by the t easu e ’s i ested funds can be reasonably assumed to be derived from OGAS
sources.
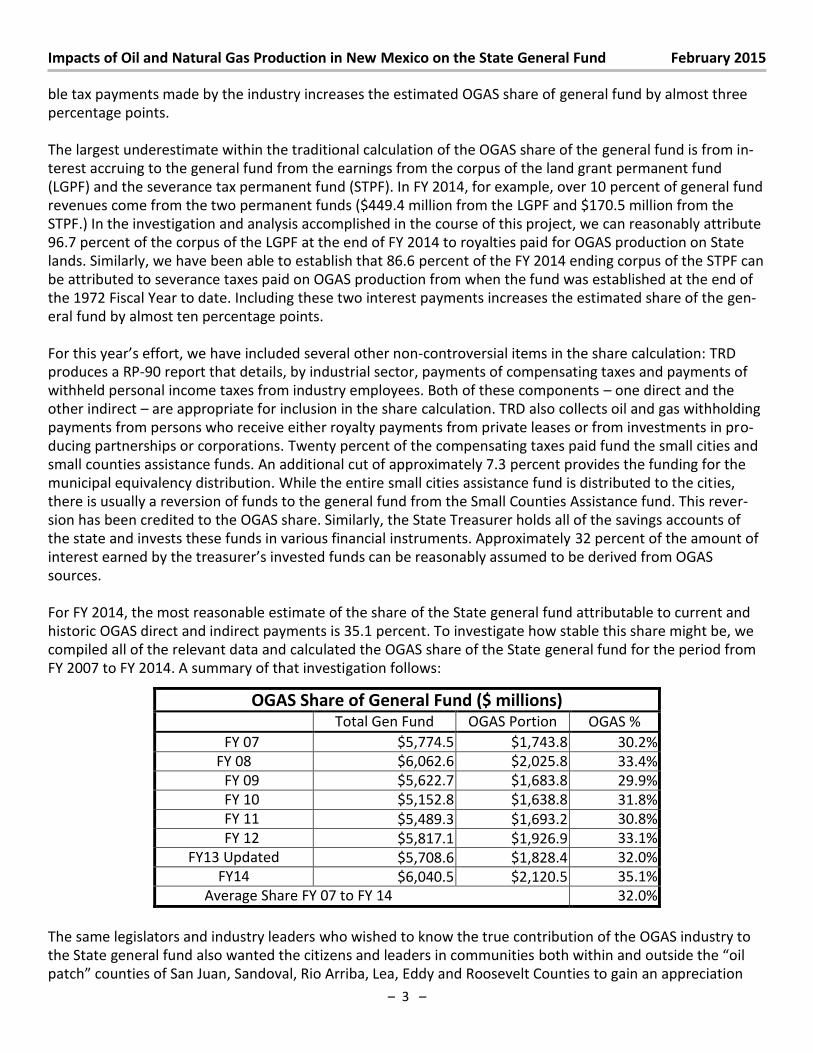
For FY 2014, the most reasonable estimate of the share of the State general fund attributable to current and
historic OGAS direct and indirect payments is 35.1 percent. To investigate how stable this share might be, we
compiled all of the relevant data and calculated the OGAS share of the State general fund for the period from
FY 2007 to FY 2014. A summary of that investigation follows:
OGAS Share of General Fund ($ millions)
Total Gen Fund OGAS Portion OGAS %
FY 07 $5,774.5 $1,743.8 30.2%
FY 08 $6,062.6 $2,025.8 33.4%
FY 09 $5,622.7 $1,683.8 29.9%
FY 10 $5,152.8 $1,638.8 31.8%
FY 11 $5,489.3 $1,693.2 30.8%
FY 12 $5,817.1 $1,926.9 33.1%
FY13 Updated $5,708.6 $1,828.4 32.0%
FY14 $6,040.5 $2,120.5 35.1%
Average Share FY 07 to FY 14 32.0%
The same legislators and industry leaders who wished to know the true contribution of the OGAS industry to
the State general fund also wanted the citizens and leaders in communities both within and outside the oil pat h ou ties of “a Jua , “a do al, Rio A i a, Lea, Edd a d Roose elt Cou ties to gai a app e iatio
Impacts of Oil and Natural Gas Production in New Mexico on the State General Fund February 2015
– 4 –
that thei o u it as i the oil id ess. If a a e age of 32 percent of the State general fund can be
reasonably attributed to current and historical OGAS production in the State, it must follow logically that an
average of 32 percent of all state governmental services, 32 percent of K-12 public education and 32 percent
of the higher education funding fo ula suppo t of the “tate’s olleges a d u i e sities ust e fu ded current and historical oil and gas production in the state.
This is a somewhat controversial statement. According to one view, once general taxes, such as personal in-
come tax, corporate income tax or the gross receipts and compensating taxes leave the pockets of the taxpay-
ers, these taxpayers lose all control or ownership of the tax payments. However, the des iptio of ge e al ta es e tai l does ot fit as a des iptio of p odu tio ta es su h as the atu al gas p o esso ’s ta , the severance tax or the emergency school tax. In addition, the atio et ee the i dust ’s pa ti ipatio i the “tate’s e o o oughl percent of the “tate’s p i ate e o o as easu ed G“P a d the oughl
percent share of the State general fund puts the industry in a special and unique position.
Another criticism leveled at the statement concerning contribution to the general fund is that it is alleged that OGAS production still bears a relatively low burden of taxes, compared to the value of product produced and
sold. Let us look at that contention for just the general fund and not consider the severance taxes that support
the “tate’s apital outlay program. The CY 2013 GSP for New Mexico is about $92 billion. The general fund for
FY 2014 was about $6 billion. Thus, each $100 of GSP should contribute about $6.50 in general taxes and other
payments to the general fund.
For CY 2013, BEA has determined that the oil and gas industry produces about $7 billion in value-added on
about $15 billion in total production value. Applying these same ratios to FY 2014 production, the $7.8 billion
in OGAS industry contributions for FY 2014 should account for about $500 million in general fund taxes and
other revenues. Instead, this project indicates that the industry contributes on the order of $2.1 billion to the
general fund or about four times the i dust ’s fai sha e.
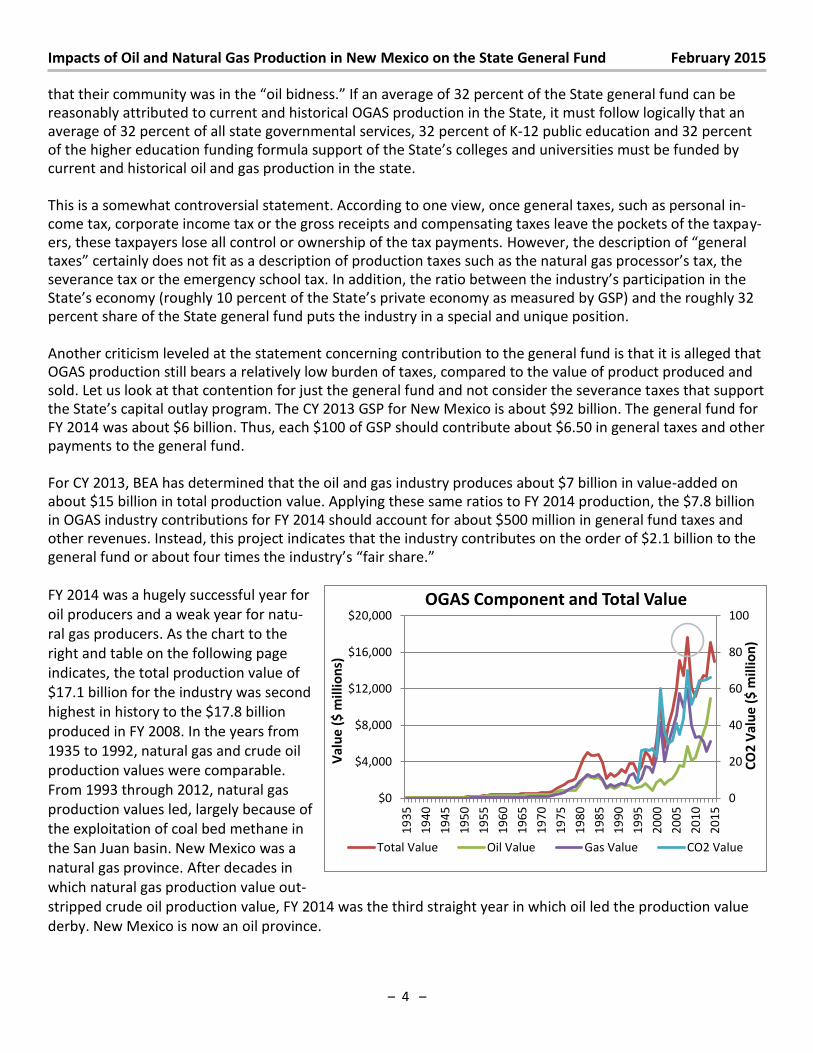
FY 2014 was a hugely successful year for
oil producers and a weak year for natu-
ral gas producers. As the chart to the
right and table on the following page
indicates, the total production value of
$17.1 billion for the industry was second
highest in history to the $17.8 billion
produced in FY 2008. In the years from
1935 to 1992, natural gas and crude oil
production values were comparable.
From 1993 through 2012, natural gas
production values led, largely because of
the exploitation of coal bed methane in
the San Juan basin. New Mexico was a
natural gas province. After decades in
which natural gas production value out-
stripped crude oil production value, FY 2014 was the third straight year in which oil led the production value
derby. New Mexico is now an oil province.
0
20
40
60
80
100
$0
$4,000
$8,000
$12,000
$16,000
$20,000
19
35
19
40
19
45
19
50
19
55
19
60
19
65
19
70
19
75
19
80
19
85
19
90
19
95
20
00
20
05
20
10
20
15
CO
2 V
alu
e (
$ m
illi
on
)
Va
lue
($
mil
lio
ns)
OGAS Component and Total Value
Total Value Oil Value Gas Value CO2 Value
Impacts of Oil and Natural Gas Production in New Mexico on the State General Fund February 2015
– 5 –
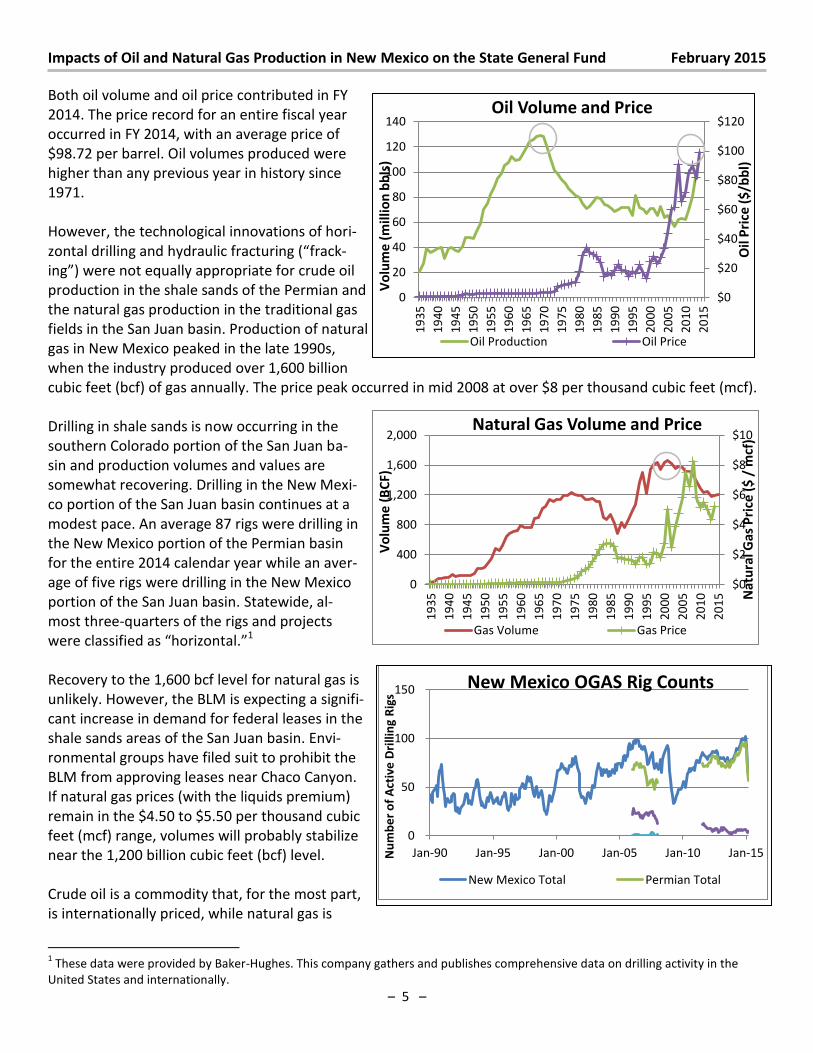
Both oil volume and oil price contributed in FY
2014. The price record for an entire fiscal year
occurred in FY 2014, with an average price of
$98.72 per barrel. Oil volumes produced were
higher than any previous year in history since
1971.
However, the technological innovations of hori-
zontal drilling and h d auli f a tu i g frack-
ing were not equally appropriate for crude oil
production in the shale sands of the Permian and
the natural gas production in the traditional gas
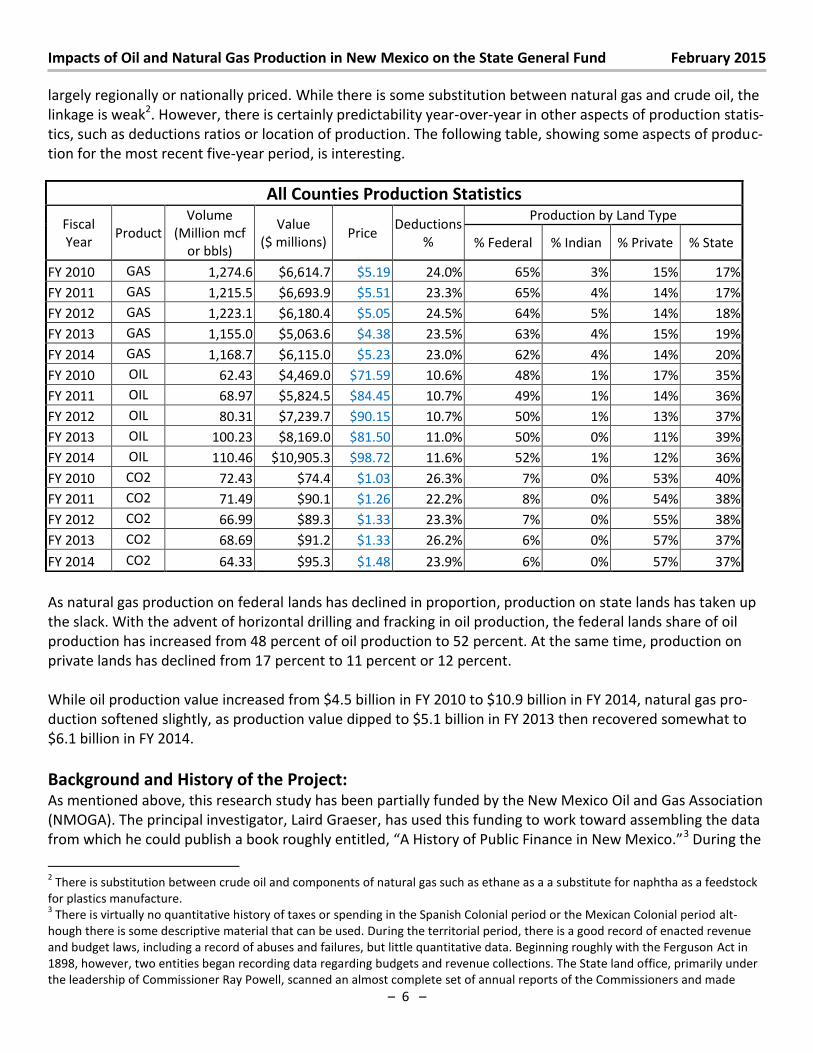
fields in the San Juan basin. Production of natural
gas in New Mexico peaked in the late 1990s,
when the industry produced over 1,600 billion
cubic feet (bcf) of gas annually. The price peak occurred in mid 2008 at over $8 per thousand cubic feet (mcf).
Drilling in shale sands is now occurring in the
southern Colorado portion of the San Juan ba-
sin and production volumes and values are
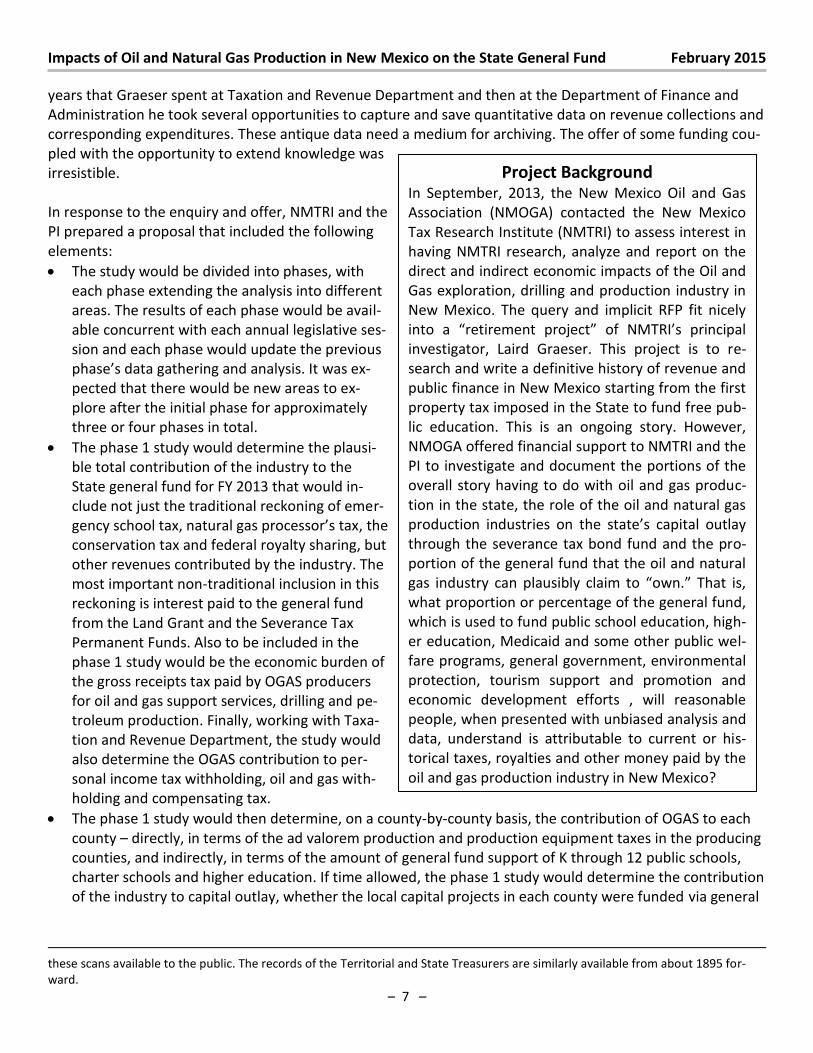
somewhat recovering. Drilling in the New Mexi-
co portion of the San Juan basin continues at a
modest pace. An average 87 rigs were drilling in
the New Mexico portion of the Permian basin
for the entire 2014 calendar year while an aver-
age of five rigs were drilling in the New Mexico
portion of the San Juan basin. Statewide, al-
most three-quarters of the rigs and projects
e e lassified as ho izo tal. 1
Recovery to the 1,600 bcf level for natural gas is
unlikely. However, the BLM is expecting a signifi-
cant increase in demand for federal leases in the
shale sands areas of the San Juan basin. Envi-
ronmental groups have filed suit to prohibit the
BLM from approving leases near Chaco Canyon.
If natural gas prices (with the liquids premium)
remain in the $4.50 to $5.50 per thousand cubic
feet (mcf) range, volumes will probably stabilize
near the 1,200 billion cubic feet (bcf) level.
Crude oil is a commodity that, for the most part,
is internationally priced, while natural gas is
1 These data were provided by Baker-Hughes. This company gathers and publishes comprehensive data on drilling activity in the
United States and internationally.
$0
$2
$4
$6
$8
$10
0
400
800
1,200
1,600
2,0001
93
5
19
40
19
45
19
50
19
55
19
60
19
65
19
70
19
75
19
80
19
85
19
90
19
95
20
00
20
05
20
10
20
15 N
atu
ral
Ga
s P
rice
($
/ m
cf)
Vo
lum
e (
BC
F)
Natural Gas Volume and Price
Gas Volume Gas Price
$0
$20
$40
$60
$80
$100
$120
0
20
40
60
80
100
120
140
19
35
19
40
19
45
19
50
19
55
19
60
19
65
19
70
19
75
19
80
19
85
19
90
19
95
20
00
20
05
20
10
20
15
Oil
Pri
ce (
$/b
bl)
Vo
lum
e (
mil
lio
n b
bls
)
Oil Volume and Price
Oil Production Oil Price
0
50
100
150
Jan-90 Jan-95 Jan-00 Jan-05 Jan-10 Jan-15Nu
mb
er
of
Act
ive
Dri
llin
g R
igs
New Mexico OGAS Rig Counts
New Mexico Total Permian Total
Impacts of Oil and Natural Gas Production in New Mexico on the State General Fund February 2015
– 6 –
largely regionally or nationally priced. While there is some substitution between natural gas and crude oil, the
linkage is weak2. However, there is certainly predictability year-over-year in other aspects of production statis-
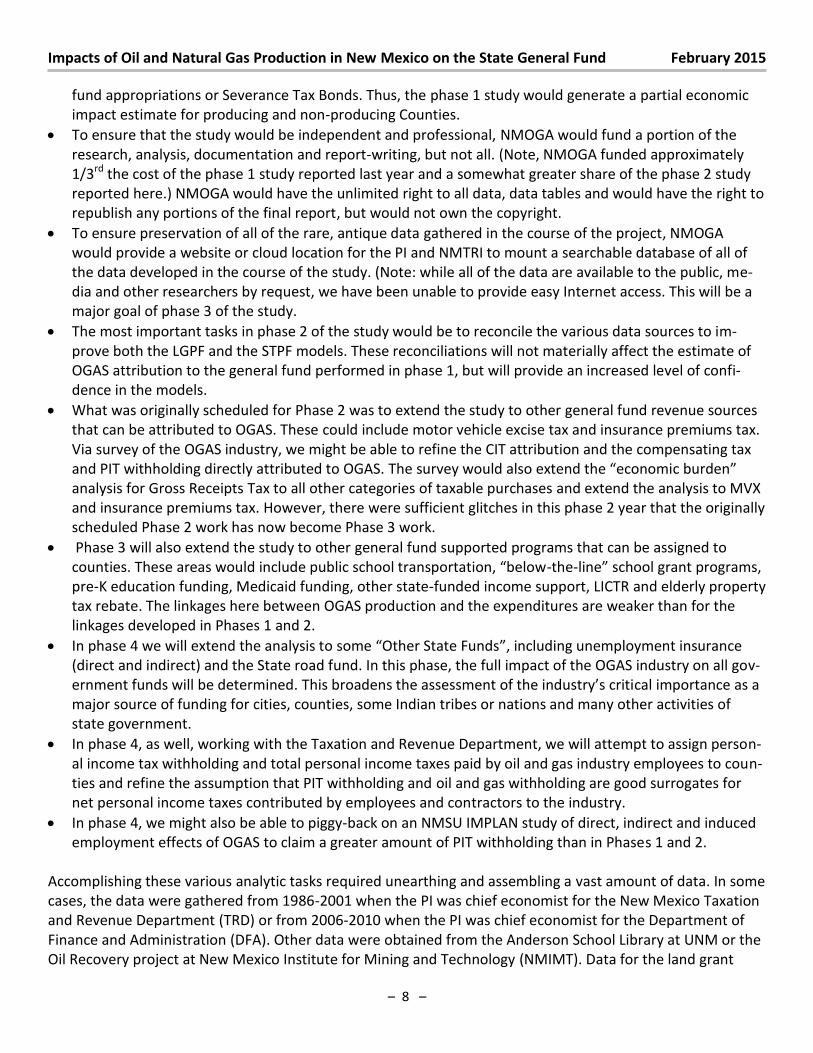
tics, such as deductions ratios or location of production. The following table, showing some aspects of produc-
tion for the most recent five-year period, is interesting.
As natural gas production on federal lands has declined in proportion, production on state lands has taken up
the slack. With the advent of horizontal drilling and fracking in oil production, the federal lands share of oil
production has increased from 48 percent of oil production to 52 percent. At the same time, production on
private lands has declined from 17 percent to 11 percent or 12 percent.
While oil production value increased from $4.5 billion in FY 2010 to $10.9 billion in FY 2014, natural gas pro-
duction softened slightly, as production value dipped to $5.1 billion in FY 2013 then recovered somewhat to
$6.1 billion in FY 2014.
Background and History of the Project: As mentioned above, this research study has been partially funded by the New Mexico Oil and Gas Association
(NMOGA). The principal investigator, Laird Graeser, has used this funding to work toward assembling the data
f o hi h he ould pu lish a ook oughl e titled, A Histo of Pu li Fi a e i Ne Me i o. 3 During the
2 There is substitution between crude oil and components of natural gas such as ethane as a a substitute for naphtha as a feedstock
for plastics manufacture. 3 There is virtually no quantitative history of taxes or spending in the Spanish Colonial period or the Mexican Colonial period alt-
hough there is some descriptive material that can be used. During the territorial period, there is a good record of enacted revenue
and budget laws, including a record of abuses and failures, but little quantitative data. Beginning roughly with the Ferguson Act in
1898, however, two entities began recording data regarding budgets and revenue collections. The State land office, primarily under
the leadership of Commissioner Ray Powell, scanned an almost complete set of annual reports of the Commissioners and made
All Counties Production Statistics
Fiscal
Year Product
Volume
(Million mcf
or bbls)
Value
($ millions) Price
Deductions
%
Production by Land Type
% Federal % Indian % Private % State
FY 2010 GAS 1,274.6 $6,614.7 $5.19 24.0% 65% 3% 15% 17%
FY 2011 GAS 1,215.5 $6,693.9 $5.51 23.3% 65% 4% 14% 17%
FY 2012 GAS 1,223.1 $6,180.4 $5.05 24.5% 64% 5% 14% 18%
FY 2013 GAS 1,155.0 $5,063.6 $4.38 23.5% 63% 4% 15% 19%
FY 2014 GAS 1,168.7 $6,115.0 $5.23 23.0% 62% 4% 14% 20%
FY 2010 OIL 62.43 $4,469.0 $71.59 10.6% 48% 1% 17% 35%
FY 2011 OIL 68.97 $5,824.5 $84.45 10.7% 49% 1% 14% 36%
FY 2012 OIL 80.31 $7,239.7 $90.15 10.7% 50% 1% 13% 37%
FY 2013 OIL 100.23 $8,169.0 $81.50 11.0% 50% 0% 11% 39%
FY 2014 OIL 110.46 $10,905.3 $98.72 11.6% 52% 1% 12% 36%
FY 2010 CO2 72.43 $74.4 $1.03 26.3% 7% 0% 53% 40%
FY 2011 CO2 71.49 $90.1 $1.26 22.2% 8% 0% 54% 38%
FY 2012 CO2 66.99 $89.3 $1.33 23.3% 7% 0% 55% 38%
FY 2013 CO2 68.69 $91.2 $1.33 26.2% 6% 0% 57% 37%
FY 2014 CO2 64.33 $95.3 $1.48 23.9% 6% 0% 57% 37%
Impacts of Oil and Natural Gas Production in New Mexico on the State General Fund February 2015
– 7 –
years that Graeser spent at Taxation and Revenue Department and then at the Department of Finance and
Administration he took several opportunities to capture and save quantitative data on revenue collections and
corresponding expenditures. These antique data need a medium for archiving. The offer of some funding cou-
pled with the opportunity to extend knowledge was
irresistible.
In response to the enquiry and offer, NMTRI and the
PI prepared a proposal that included the following
elements:
The study would be divided into phases, with
each phase extending the analysis into different
areas. The results of each phase would be avail-
able concurrent with each annual legislative ses-
sion and each phase would update the previous
phase’s data gathe i g a d a al sis. It was ex-
pected that there would be new areas to ex-
plore after the initial phase for approximately
three or four phases in total.
The phase 1 study would determine the plausi-
ble total contribution of the industry to the
State general fund for FY 2013 that would in-
clude not just the traditional reckoning of emer-
ge s hool ta , atu al gas p o esso ’s ta , the
conservation tax and federal royalty sharing, but
other revenues contributed by the industry. The
most important non-traditional inclusion in this
reckoning is interest paid to the general fund
from the Land Grant and the Severance Tax
Permanent Funds. Also to be included in the
phase 1 study would be the economic burden of
the gross receipts tax paid by OGAS producers
for oil and gas support services, drilling and pe-
troleum production. Finally, working with Taxa-
tion and Revenue Department, the study would
also determine the OGAS contribution to per-
sonal income tax withholding, oil and gas with-
holding and compensating tax.
The phase 1 study would then determine, on a county-by-county basis, the contribution of OGAS to each
county – directly, in terms of the ad valorem production and production equipment taxes in the producing
counties, and indirectly, in terms of the amount of general fund support of K through 12 public schools,
charter schools and higher education. If time allowed, the phase 1 study would determine the contribution
of the industry to capital outlay, whether the local capital projects in each county were funded via general
these scans available to the public. The records of the Territorial and State Treasurers are similarly available from about 1895 for-
ward.
Project Background In September, 2013, the New Mexico Oil and Gas
Association (NMOGA) contacted the New Mexico
Tax Research Institute (NMTRI) to assess interest in
having NMTRI research, analyze and report on the
direct and indirect economic impacts of the Oil and
Gas exploration, drilling and production industry in
New Mexico. The query and implicit RFP fit nicely
i to a eti e e t p oje t of NMTRI’s p i ipal investigator, Laird Graeser. This project is to re-
search and write a definitive history of revenue and
public finance in New Mexico starting from the first
property tax imposed in the State to fund free pub-
lic education. This is an ongoing story. However,
NMOGA offered financial support to NMTRI and the
PI to investigate and document the portions of the
overall story having to do with oil and gas produc-
tion in the state, the role of the oil and natural gas
production industries o the state’s apital outla through the severance tax bond fund and the pro-
portion of the general fund that the oil and natural
gas i dust a plausi l lai to o . That is, what proportion or percentage of the general fund,
which is used to fund public school education, high-
er education, Medicaid and some other public wel-
fare programs, general government, environmental
protection, tourism support and promotion and
economic development efforts , will reasonable
people, when presented with unbiased analysis and
data, understand is attributable to current or his-
torical taxes, royalties and other money paid by the
oil and gas production industry in New Mexico?
Impacts of Oil and Natural Gas Production in New Mexico on the State General Fund February 2015
– 8 –
fund appropriations or Severance Tax Bonds. Thus, the phase 1 study would generate a partial economic
impact estimate for producing and non-producing Counties.
To ensure that the study would be independent and professional, NMOGA would fund a portion of the
research, analysis, documentation and report-writing, but not all. (Note, NMOGA funded approximately
1/3rd the cost of the phase 1 study reported last year and a somewhat greater share of the phase 2 study
reported here.) NMOGA would have the unlimited right to all data, data tables and would have the right to
republish any portions of the final report, but would not own the copyright.
To ensure preservation of all of the rare, antique data gathered in the course of the project, NMOGA
would provide a website or cloud location for the PI and NMTRI to mount a searchable database of all of
the data developed in the course of the study. (Note: while all of the data are available to the public, me-
dia and other researchers by request, we have been unable to provide easy Internet access. This will be a
major goal of phase 3 of the study.
The most important tasks in phase 2 of the study would be to reconcile the various data sources to im-
prove both the LGPF and the STPF models. These reconciliations will not materially affect the estimate of
OGAS attribution to the general fund performed in phase 1, but will provide an increased level of confi-
dence in the models.
What was originally scheduled for Phase 2 was to extend the study to other general fund revenue sources
that can be attributed to OGAS. These could include motor vehicle excise tax and insurance premiums tax.
Via survey of the OGAS industry, we might be able to refine the CIT attribution and the compensating tax
and PIT withholding directly attributed to OGAS. The survey would also e te d the e o o i u de analysis for Gross Receipts Tax to all other categories of taxable purchases and extend the analysis to MVX
and insurance premiums tax. However, there were sufficient glitches in this phase 2 year that the originally
scheduled Phase 2 work has now become Phase 3 work.
Phase 3 will also extend the study to other general fund supported programs that can be assigned to
ou ties. These a eas ould i lude pu li s hool t a spo tatio , elo -the-li e s hool g a t p og a s, pre-K education funding, Medicaid funding, other state-funded income support, LICTR and elderly property
tax rebate. The linkages here between OGAS production and the expenditures are weaker than for the
linkages developed in Phases 1 and 2.
In phase 4 we will extend the analysis to some Other State Funds , including unemployment insurance
(direct and indirect) and the State road fund. In this phase, the full impact of the OGAS industry on all gov-
ernment funds will be determined. This oade s the assess e t of the i dust ’s itical importance as a
major source of funding for cities, counties, some Indian tribes or nations and many other activities of
state government.
In phase 4, as well, working with the Taxation and Revenue Department, we will attempt to assign person-
al income tax withholding and total personal income taxes paid by oil and gas industry employees to coun-
ties and refine the assumption that PIT withholding and oil and gas withholding are good surrogates for
net personal income taxes contributed by employees and contractors to the industry.
In phase 4, we might also be able to piggy-back on an NMSU IMPLAN study of direct, indirect and induced
employment effects of OGAS to claim a greater amount of PIT withholding than in Phases 1 and 2.
Accomplishing these various analytic tasks required unearthing and assembling a vast amount of data. In some
cases, the data were gathered from 1986-2001 when the PI was chief economist for the New Mexico Taxation
and Revenue Department (TRD) or from 2006-2010 when the PI was chief economist for the Department of
Finance and Administration (DFA). Other data were obtained from the Anderson School Library at UNM or the
Oil Recovery project at New Mexico Institute for Mining and Technology (NMIMT). Data for the land grant
Impacts of Oil and Natural Gas Production in New Mexico on the State General Fund February 2015
– 9 –
permanent fund (LGPF) model were obtained directly from the State land office (SLO), where staff graciously
provided access to the entire series of annual reports of the State land commissioner. These data will be dis-
cussed later in the report as supporting the individual taxes and revenue sources contributing to the State
general fund, the severance tax bonding fund (STBF) and county-level capital outlay, operating and school
funding from the same revenue sources as the State general fund. These data will be made available to other
researchers through a mechanism to be developed.
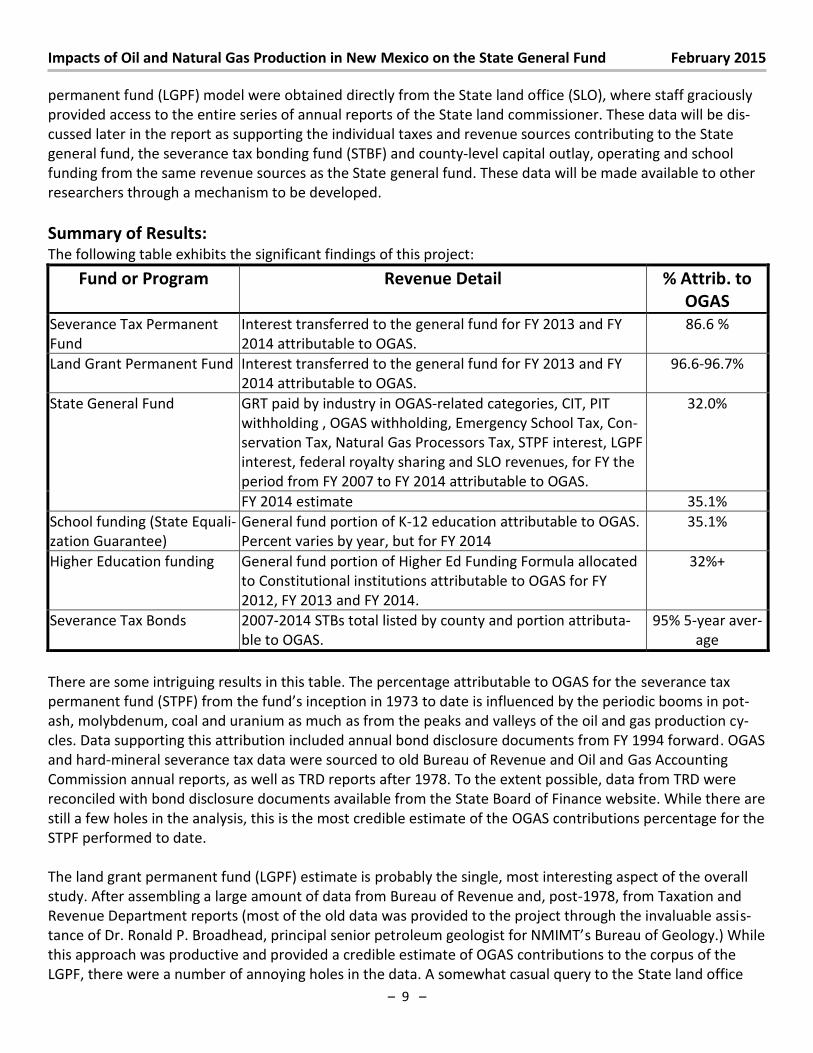
Summary of Results: The following table exhibits the significant findings of this project:
Fund or Program Revenue Detail % Attrib. to
OGAS
Severance Tax Permanent
Fund
Interest transferred to the general fund for FY 2013 and FY
2014 attributable to OGAS.
86.6 %
Land Grant Permanent Fund Interest transferred to the general fund for FY 2013 and FY
2014 attributable to OGAS.
96.6-96.7%
State General Fund GRT paid by industry in OGAS-related categories, CIT, PIT
withholding , OGAS withholding, Emergency School Tax, Con-
servation Tax, Natural Gas Processors Tax, STPF interest, LGPF
interest, federal royalty sharing and SLO revenues, for FY the
period from FY 2007 to FY 2014 attributable to OGAS.
32.0%
FY 2014 estimate 35.1%
School funding (State Equali-
zation Guarantee)
General fund portion of K-12 education attributable to OGAS.
Percent varies by year, but for FY 2014
35.1%
Higher Education funding General fund portion of Higher Ed Funding Formula allocated
to Constitutional institutions attributable to OGAS for FY
2012, FY 2013 and FY 2014.
32%+
Severance Tax Bonds 2007-2014 STBs total listed by county and portion attributa-
ble to OGAS.
95% 5-year aver-
age
There are some intriguing results in this table. The percentage attributable to OGAS for the severance tax
permanent fund (STPF) f o the fu d’s i eptio i 3 to date is influenced by the periodic booms in pot-
ash, molybdenum, coal and uranium as much as from the peaks and valleys of the oil and gas production cy-
cles. Data supporting this attribution included annual bond disclosure documents from FY 1994 forward. OGAS
and hard-mineral severance tax data were sourced to old Bureau of Revenue and Oil and Gas Accounting
Commission annual reports, as well as TRD reports after 1978. To the extent possible, data from TRD were
reconciled with bond disclosure documents available from the State Board of Finance website. While there are
still a few holes in the analysis, this is the most credible estimate of the OGAS contributions percentage for the
STPF performed to date.
The land grant permanent fund (LGPF) estimate is probably the single, most interesting aspect of the overall
study. After assembling a large amount of data from Bureau of Revenue and, post-1978, from Taxation and
Revenue Department reports (most of the old data was provided to the project through the invaluable assis-
ta e of D . Ro ald P. B oadhead, p i ipal se io pet oleu geologist fo NMIMT’s Bureau of Geology.) While
this approach was productive and provided a credible estimate of OGAS contributions to the corpus of the
LGPF, there were a number of annoying holes in the data. A somewhat casual query to the State land office
Impacts of Oil and Natural Gas Production in New Mexico on the State General Fund February 2015
– 10 –
resulted in being granted access to scans of a virtually complete set of annual reports of the State land com-
missioner, going back to the first report dated 1900. Data from these reports were hand entered into a com-
prehensive database, from which a highly credible and robust model was built. With an uncertainty of less
than .5 percent, we assert that the current proportion of the amount of annual interest transferred to the
general fund from investments of the LGPF is 96.7 percent. This year, we were able to plug some of the an-
noying gaps left at the conclusion of the FY 2013 report with another tranche of data from the old SLO annual
reports.
Before delving into some of the other general fund revenue sources, we will discuss the two general fund In-
terest models – the LGPF interest model and the STPF interest model.
The General Fund Interest Models: The most interesting and useful portion of this study was to quantify the proportion of interest transferred to the
general fund from oil and gas taxes and royalties paid. In 2014, $449.4 million in earnings from the land grant per-
manent fund (LGPF) was transferred, of which $434.8 million, or 96.7 percent of the transfer can be plausibly and
reasonably attributed to royalty payments for production on State lands made by OGAS companies. Similarly,
$170.5 million of earnings from the severance tax permanent fund (STPF) was transferred, of which $147.6 million,
or 86.7 percent was attributed to the oil and gas severance taxes paid by the OGAS industry. To arrive at 96.7 per-
cent for LGPF attributable to the OGAS industry in the state we had to develop data for the LGPF model extending
back in time to 1900 – 12 years prior to statehood, when first the Ferguson Act and subsequently the Organic Act
transferred over 12 million acres of federal land to the New Mexico Territory and then the new State of New Mexi-
co for the purpose of providing funds for public schools, higher education and other public purposes. To arrive at
86.6 percent for STPF attributable to severance taxes paid by OGAS interests, we had to develop data for the STPF
model extending back in time to 1973 when Hard Mineral and Oil and Gas Severance Taxes were restructured and
the portion of severance tax collections not needed to amortize capital outlay bonds used to fund a Land Grant
Permanent Fund.
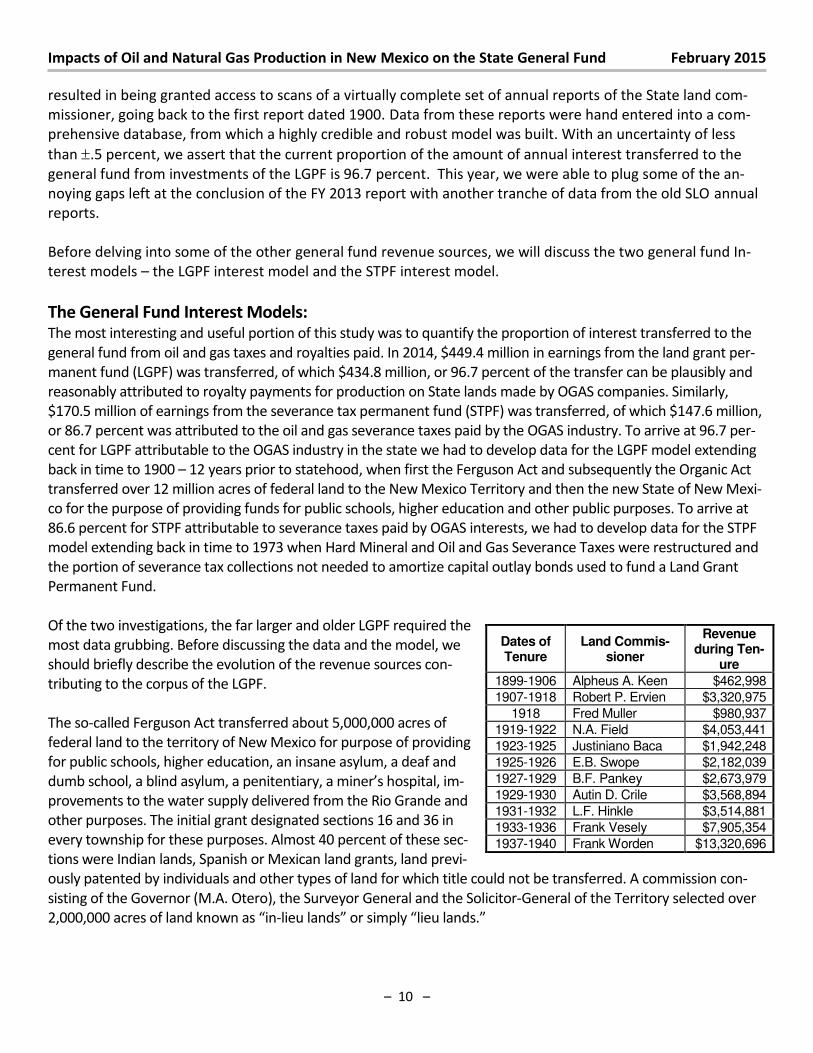
Of the two investigations, the far larger and older LGPF required the
most data grubbing. Before discussing the data and the model, we
should briefly describe the evolution of the revenue sources con-
tributing to the corpus of the LGPF.
The so-called Ferguson Act transferred about 5,000,000 acres of
federal land to the territory of New Mexico for purpose of providing
for public schools, higher education, an insane asylum, a deaf and
du s hool, a li d as lu , a pe ite tia , a i e ’s hospital, im-
provements to the water supply delivered from the Rio Grande and
other purposes. The initial grant designated sections 16 and 36 in
every township for these purposes. Almost 40 percent of these sec-
tions were Indian lands, Spanish or Mexican land grants, land previ-
ously patented by individuals and other types of land for which title could not be transferred. A commission con-
sisting of the Governor (M.A. Otero), the Surveyor General and the Solicitor-General of the Territory selected over
2,000,000 acres of land k o as i -lieu la ds o si pl lieu la ds.
Dates of Tenure
Land Commis-sioner
Revenue during Ten-
ure
1899-1906 Alpheus A. Keen $462,998 1907-1918 Robert P. Ervien $3,320,975
1918 Fred Muller $980,937 1919-1922 N.A. Field $4,053,441 1923-1925 Justiniano Baca $1,942,248 1925-1926 E.B. Swope $2,182,039 1927-1929 B.F. Pankey $2,673,979 1929-1930 Autin D. Crile $3,568,894 1931-1932 L.F. Hinkle $3,514,881 1933-1936 Frank Vesely $7,905,354 1937-1940 Frank Worden $13,320,696
Impacts of Oil and Natural Gas Production in New Mexico on the State General Fund February 2015
– 11 –
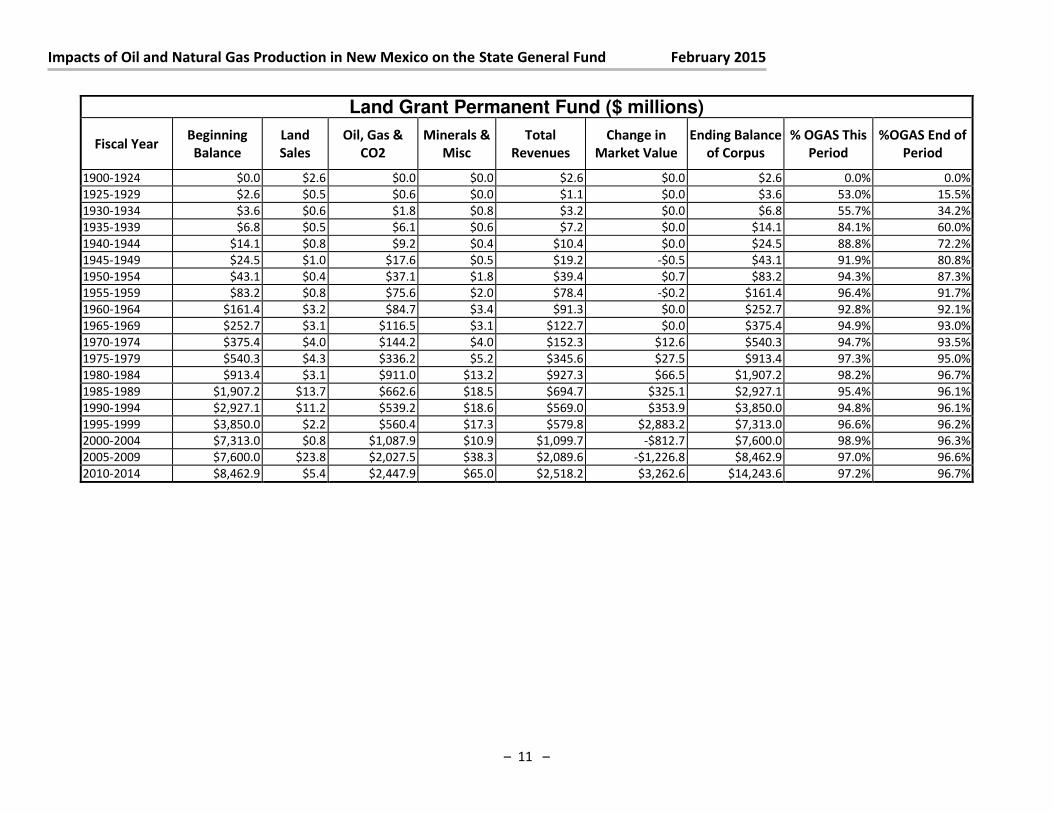
Land Grant Permanent Fund ($ millions)
Fiscal Year Beginning
Balance
Land
Sales
Oil, Gas &
CO2
Minerals &
Misc
Total
Revenues
Change in
Market Value
Ending Balance
of Corpus
% OGAS This
Period
%OGAS End of
Period
1900-1924 $0.0 $2.6 $0.0 $0.0 $2.6 $0.0 $2.6 0.0% 0.0%
1925-1929 $2.6 $0.5 $0.6 $0.0 $1.1 $0.0 $3.6 53.0% 15.5%
1930-1934 $3.6 $0.6 $1.8 $0.8 $3.2 $0.0 $6.8 55.7% 34.2%
1935-1939 $6.8 $0.5 $6.1 $0.6 $7.2 $0.0 $14.1 84.1% 60.0%
1940-1944 $14.1 $0.8 $9.2 $0.4 $10.4 $0.0 $24.5 88.8% 72.2%
1945-1949 $24.5 $1.0 $17.6 $0.5 $19.2 -$0.5 $43.1 91.9% 80.8%
1950-1954 $43.1 $0.4 $37.1 $1.8 $39.4 $0.7 $83.2 94.3% 87.3%
1955-1959 $83.2 $0.8 $75.6 $2.0 $78.4 -$0.2 $161.4 96.4% 91.7%
1960-1964 $161.4 $3.2 $84.7 $3.4 $91.3 $0.0 $252.7 92.8% 92.1%
1965-1969 $252.7 $3.1 $116.5 $3.1 $122.7 $0.0 $375.4 94.9% 93.0%
1970-1974 $375.4 $4.0 $144.2 $4.0 $152.3 $12.6 $540.3 94.7% 93.5%
1975-1979 $540.3 $4.3 $336.2 $5.2 $345.6 $27.5 $913.4 97.3% 95.0%
1980-1984 $913.4 $3.1 $911.0 $13.2 $927.3 $66.5 $1,907.2 98.2% 96.7%
1985-1989 $1,907.2 $13.7 $662.6 $18.5 $694.7 $325.1 $2,927.1 95.4% 96.1%
1990-1994 $2,927.1 $11.2 $539.2 $18.6 $569.0 $353.9 $3,850.0 94.8% 96.1%
1995-1999 $3,850.0 $2.2 $560.4 $17.3 $579.8 $2,883.2 $7,313.0 96.6% 96.2%
2000-2004 $7,313.0 $0.8 $1,087.9 $10.9 $1,099.7 -$812.7 $7,600.0 98.9% 96.3%
2005-2009 $7,600.0 $23.8 $2,027.5 $38.3 $2,089.6 -$1,226.8 $8,462.9 97.0% 96.6%
2010-2014 $8,462.9 $5.4 $2,447.9 $65.0 $2,518.2 $3,262.6 $14,243.6 97.2% 96.7%
Impacts of Oil and Natural Gas Production in New Mexico on the State General Fund February 2015
– 12 –
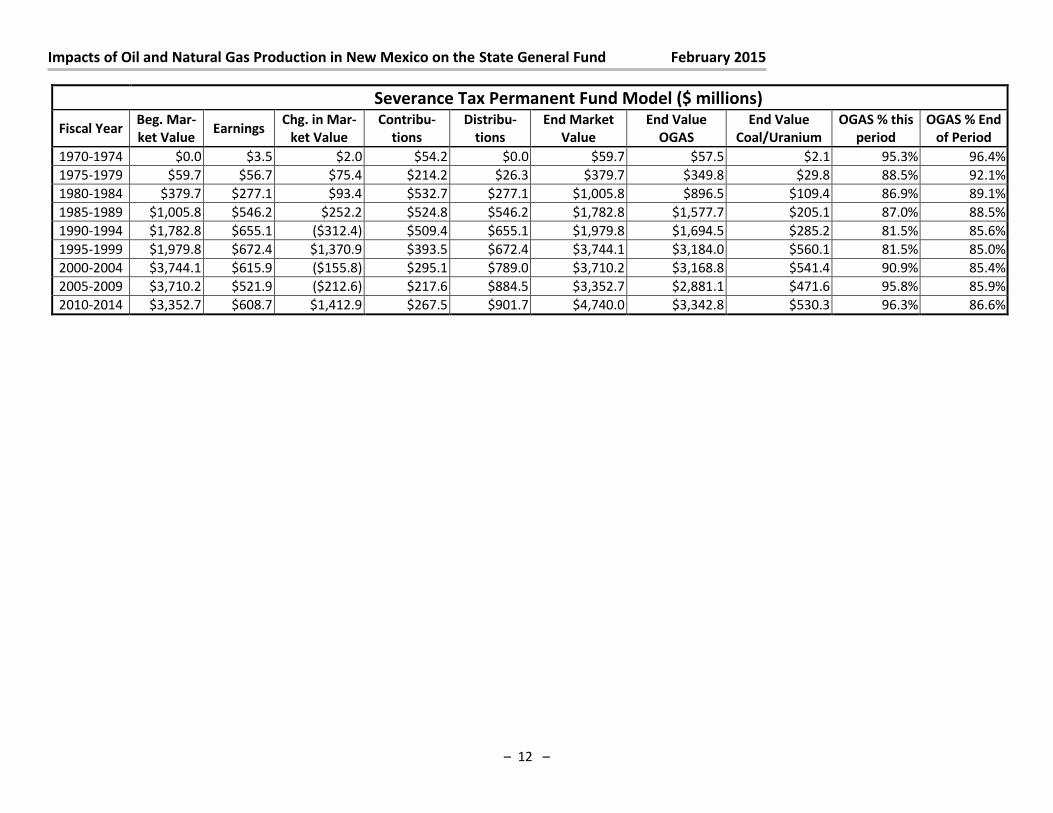
Severance Tax Permanent Fund Model ($ millions)
Fiscal Year Beg. Mar-
ket Value Earnings
Chg. in Mar-
ket Value
Contribu-
tions
Distribu-
tions
End Market
Value
End Value
OGAS
End Value
Coal/Uranium
OGAS % this
period
OGAS % End
of Period
1970-1974 $0.0 $3.5 $2.0 $54.2 $0.0 $59.7 $57.5 $2.1 95.3% 96.4%
1975-1979 $59.7 $56.7 $75.4 $214.2 $26.3 $379.7 $349.8 $29.8 88.5% 92.1%
1980-1984 $379.7 $277.1 $93.4 $532.7 $277.1 $1,005.8 $896.5 $109.4 86.9% 89.1%
1985-1989 $1,005.8 $546.2 $252.2 $524.8 $546.2 $1,782.8 $1,577.7 $205.1 87.0% 88.5%
1990-1994 $1,782.8 $655.1 ($312.4) $509.4 $655.1 $1,979.8 $1,694.5 $285.2 81.5% 85.6%
1995-1999 $1,979.8 $672.4 $1,370.9 $393.5 $672.4 $3,744.1 $3,184.0 $560.1 81.5% 85.0%
2000-2004 $3,744.1 $615.9 ($155.8) $295.1 $789.0 $3,710.2 $3,168.8 $541.4 90.9% 85.4%
2005-2009 $3,710.2 $521.9 ($212.6) $217.6 $884.5 $3,352.7 $2,881.1 $471.6 95.8% 85.9%
2010-2014 $3,352.7 $608.7 $1,412.9 $267.5 $901.7 $4,740.0 $3,342.8 $530.3 96.3% 86.6%
Impacts of Oil and Natural Gas Production in New Mexico on the State General Fund February 2015
– 13 –
The Ferguson Act provided some guidelines as to suitable lieu lands, but there was some contentious squabbling
between Territorial and Federal interests. Laws of 1901, Chapter 74, established the office of State land commis-
sioner. The initial act set the salary of the State land commissioner at $2,500 per annum, which was six to seven
times the wages of a working cowboy4. The State land commissioner was allowed to hire clerks to assist in the op-
erations of the office with an initial appropriation of $1,500, which was probably enough for two or three clerks. Of
course, the cowboy was provided with horses to ride, a bed in a bunkhouse and grub. The Land Commissioner had
to furnish his own food, housing and transportation. This law replaced the Surveyor General on the Commission
charged with designating the lieu lands with the State Land Commissioner. The first State Land Commissioner was
Alpheus A. Keen, who served from 1899 to 1906, which was two years longer than the statutory authority for the
position. For the e ti e pe iod of M . Kee ’s te u e, he olle ted e e ue e ual to about 10 times the costs of the
“tate La d Co issio e ’s ope atio s. Total e pe ses of the “tate La d Offi e du i g the ou se of e e $5,707. One other interesting note, the Ferguson Act assumed that the state would sell the land outright to farm-
ers and ranchers, thus contributing to the settlement of the American West. However, the 1901 laws required that
5 percent of the money received from outright sales of land or from land contracts would be transferred to a per-
manent fund. At the end of calendar year 1901, the total corpus of the permanent funds stood at $70,069.After
1913, proceeds from land which was sold on contract that extended the purchase over 30 years at a 5 percent
annual interest rate were transferred to the permanent fund. The contract principal could be paid on a self-
amortizing basis or a lump sum basis. The federal establishment designated some lands as $5 lands (per acre)
and some as $3 lands. Grazing leases were priced roughly based on these designations, with the annual charge
for grazing leases on land without water of $12.80 per section per year and $30 per section for land with wa-
ter. A section is 640 acres.
At statehood in 1912, virtually all of the 5,584809.03 acres granted to the Territory in the Ferguson Act had
been selected. 2,072,000 acres were leased – primarily for ranching. About 75,000 acres had been sold out-
right or via contracts. The remainder of the original allotment was vacant. The Organic Act, also known locally
as the Enabling Act transferred an additional 6,569,520 acres of federal land to the new State of New Mexico
for the purpose of providing funds for public schools and higher education. The total of over 12 million acres is
but little smaller than the entire states of Maryland, New Jersey and Delaware 5. By the end of 1914, all but 2
million of the 12 million acres total had been selected and title vested in the State. The Federal Government
contested about 1 million acres of the 2 million unconfirmed. The 1910 grant gave sections 2 and 32 to the
state, with about half of the new grants being already entailed or otherwise withdrawn, either as Indian reser-
vations, federal forest reservations, residual Spanish or Mexican land grants, military reservations, patented
mining claims, mineral and oil reservations, homesteads and patented lands, small holding claims, reserva-
tions for irrigation purposes and Indian allotments. Between the 1898 and 1910 grants, over 4,000,000 acres
were lieu lands.
In the early going, the corpus of the LGPF consisted of five percent of the amount realized from sales of State
land. In 1924, oil royalties began flowing to the LGPF. Somewhat later, mineral royalties (primarily from coal
production on state lands) and timber sales were added to 100 percent of land sales and contracts and OGAS
4 F o the s th ough , o ki g o o ’s ages e e ge e all $ pe da plus oo i a u khouse, eals a d o ki g
horses. Cowboys provided a saddle and other tools of the trade. Young apprentices were frequently paid $15 a month or less.
(http://www.lemen.com/qa261.html … A working cowhand in the late 1800s was paid $25 to $30 a month "and found." The
phrase "and found" meant he also got his meals (and a bunk when he was at the ranch headquarters.) A top hand might even get
$40 a month and a foreman $50 or more. On a drive, a trail boss was sometimes paid as much as $100. For comparison, back then a
typical school teacher's wage was $30 a month, and dinner in a restaurant would usually cost about 25 cents. 5 “tate La d Co issio e ’s 1914 Annual Report of the State Land Commissioner
Impacts of Oil and Natural Gas Production in New Mexico on the State General Fund February 2015
– 14 –
royalties. By State Law, all royalties and proceeds from the sale of State land are transferred to the LGPF. The
FY2014 ending balance in the fund was $14,243,600,000. In building the general fund interest model, we de-
termined that the first flow of OGAS royalties to the permanent fund occurred in CY 19246, when the State
land commissioner required all royalties paid on oil and gas production on state lands, as well as hard mineral
production on state lands to be transferred to the permanent funds maintained on behalf of each of the insti-
tutions. By June 30, 1932, the book value of transfers to the permanent funds stood at $4,767,590 with the
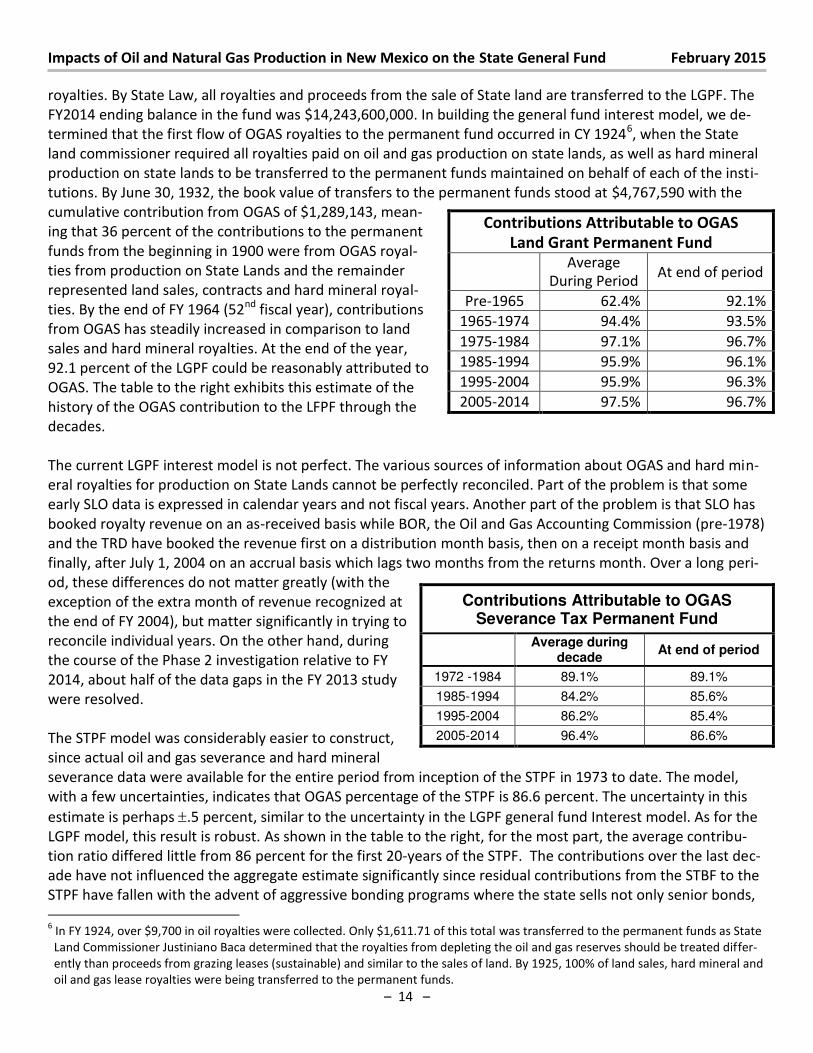
cumulative contribution from OGAS of $1,289,143, mean-
ing that 36 percent of the contributions to the permanent
funds from the beginning in 1900 were from OGAS royal-
ties from production on State Lands and the remainder
represented land sales, contracts and hard mineral royal-
ties. By the end of FY 1964 (52nd fiscal year), contributions
from OGAS has steadily increased in comparison to land
sales and hard mineral royalties. At the end of the year,
92.1 percent of the LGPF could be reasonably attributed to
OGAS. The table to the right exhibits this estimate of the
history of the OGAS contribution to the LFPF through the
decades.
The current LGPF interest model is not perfect. The various sources of information about OGAS and hard min-
eral royalties for production on State Lands cannot be perfectly reconciled. Part of the problem is that some
early SLO data is expressed in calendar years and not fiscal years. Another part of the problem is that SLO has
booked royalty revenue on an as-received basis while BOR, the Oil and Gas Accounting Commission (pre-1978)
and the TRD have booked the revenue first on a distribution month basis, then on a receipt month basis and
finally, after July 1, 2004 on an accrual basis which lags two months from the returns month. Over a long peri-
od, these differences do not matter greatly (with the
exception of the extra month of revenue recognized at
the end of FY 2004), but matter significantly in trying to
reconcile individual years. On the other hand, during
the course of the Phase 2 investigation relative to FY
2014, about half of the data gaps in the FY 2013 study
were resolved.
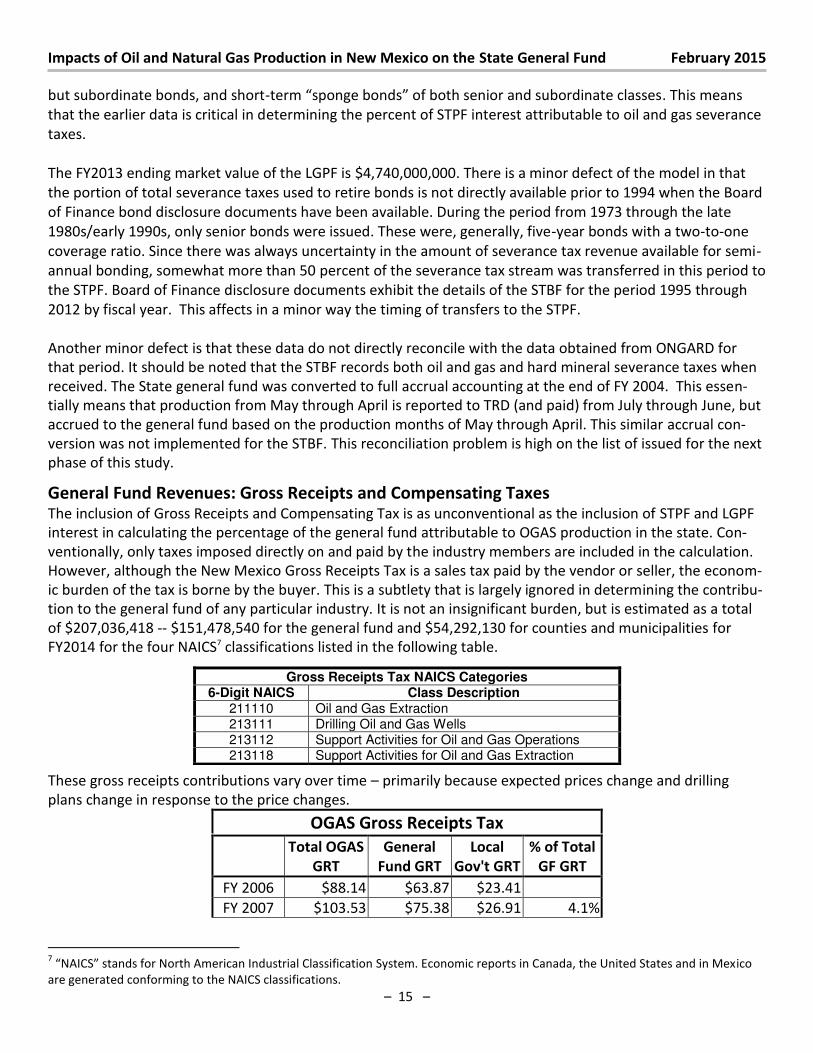
The STPF model was considerably easier to construct,
since actual oil and gas severance and hard mineral
severance data were available for the entire period from inception of the STPF in 1973 to date. The model,
with a few uncertainties, indicates that OGAS percentage of the STPF is 86.6 percent. The uncertainty in this
estimate is perhaps .5 percent, similar to the uncertainty in the LGPF general fund Interest model. As for the
LGPF model, this result is robust. As shown in the table to the right, for the most part, the average contribu-
tion ratio differed little from 86 percent for the first 20-years of the STPF. The contributions over the last dec-
ade have not influenced the aggregate estimate significantly since residual contributions from the STBF to the
STPF have fallen with the advent of aggressive bonding programs where the state sells not only senior bonds,
6 In FY 1924, over $9,700 in oil royalties were collected. Only $1,611.71 of this total was transferred to the permanent funds as State
Land Commissioner Justiniano Baca determined that the royalties from depleting the oil and gas reserves should be treated differ-
ently than proceeds from grazing leases (sustainable) and similar to the sales of land. By 1925, 100% of land sales, hard mineral and
oil and gas lease royalties were being transferred to the permanent funds.
Contributions Attributable to OGAS
Land Grant Permanent Fund
Average
During Period At end of period
Pre-1965 62.4% 92.1%
1965-1974 94.4% 93.5%
1975-1984 97.1% 96.7%
1985-1994 95.9% 96.1%
1995-2004 95.9% 96.3%
2005-2014 97.5% 96.7%
Contributions Attributable to OGAS Severance Tax Permanent Fund
Average during
decade At end of period
1972 -1984 89.1% 89.1%
1985-1994 84.2% 85.6%
1995-2004 86.2% 85.4%
2005-2014 96.4% 86.6%
Impacts of Oil and Natural Gas Production in New Mexico on the State General Fund February 2015
– 15 –
but subordinate bonds, and short-te spo ge o ds of oth se io a d su o di ate lasses. This means
that the earlier data is critical in determining the percent of STPF interest attributable to oil and gas severance
taxes.
The FY2013 ending market value of the LGPF is $4,740,000,000. There is a minor defect of the model in that
the portion of total severance taxes used to retire bonds is not directly available prior to 1994 when the Board
of Finance bond disclosure documents have been available. During the period from 1973 through the late
1980s/early 1990s, only senior bonds were issued. These were, generally, five-year bonds with a two-to-one
coverage ratio. Since there was always uncertainty in the amount of severance tax revenue available for semi-
annual bonding, somewhat more than 50 percent of the severance tax stream was transferred in this period to
the STPF. Board of Finance disclosure documents exhibit the details of the STBF for the period 1995 through
2012 by fiscal year. This affects in a minor way the timing of transfers to the STPF.
Another minor defect is that these data do not directly reconcile with the data obtained from ONGARD for
that period. It should be noted that the STBF records both oil and gas and hard mineral severance taxes when
received. The State general fund was converted to full accrual accounting at the end of FY 2004. This essen-
tially means that production from May through April is reported to TRD (and paid) from July through June, but
accrued to the general fund based on the production months of May through April. This similar accrual con-
version was not implemented for the STBF. This reconciliation problem is high on the list of issued for the next
phase of this study.
General Fund Revenues: Gross Receipts and Compensating Taxes The inclusion of Gross Receipts and Compensating Tax is as unconventional as the inclusion of STPF and LGPF
interest in calculating the percentage of the general fund attributable to OGAS production in the state. Con-
ventionally, only taxes imposed directly on and paid by the industry members are included in the calculation.
However, although the New Mexico Gross Receipts Tax is a sales tax paid by the vendor or seller, the econom-
ic burden of the tax is borne by the buyer. This is a subtlety that is largely ignored in determining the contribu-
tion to the general fund of any particular industry. It is not an insignificant burden, but is estimated as a total
of $207,036,418 -- $151,478,540 for the general fund and $54,292,130 for counties and municipalities for
FY2014 for the four NAICS7 classifications listed in the following table.
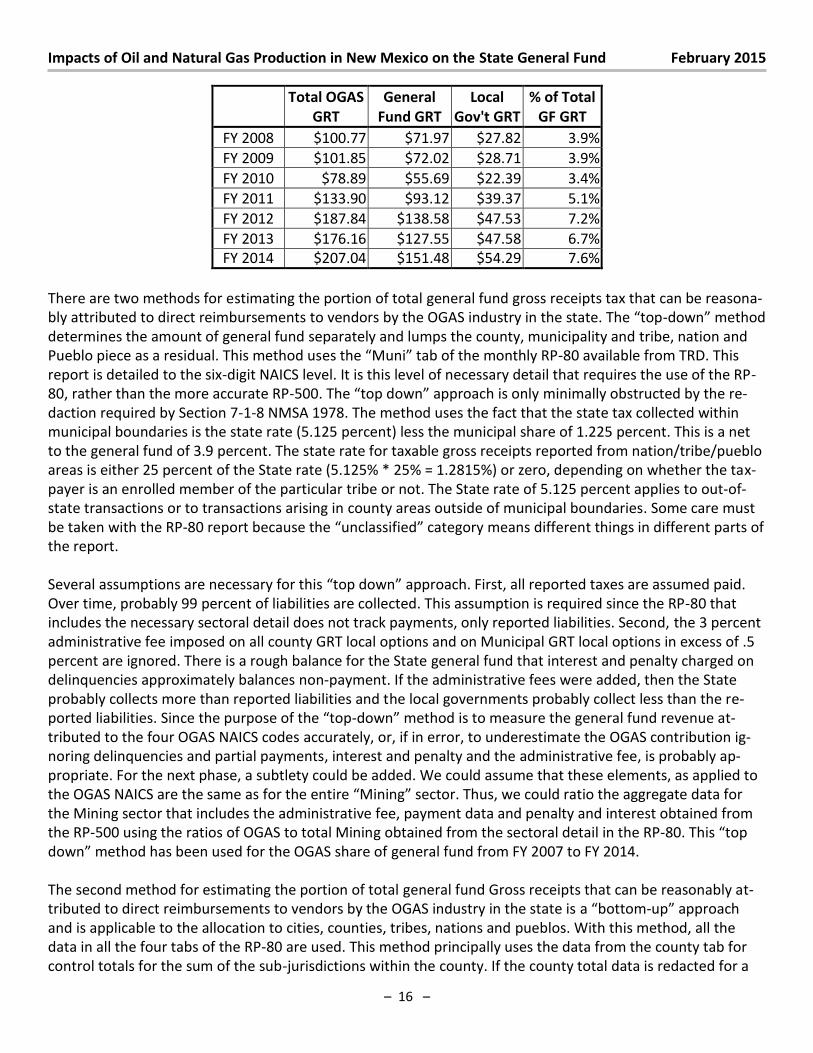
These gross receipts contributions vary over time – primarily because expected prices change and drilling
plans change in response to the price changes.
OGAS Gross Receipts Tax
Total OGAS
GRT
General
Fund GRT
Local
Gov't GRT
% of Total
GF GRT
FY 2006 $88.14 $63.87 $23.41
FY 2007 $103.53 $75.38 $26.91 4.1%
7 NAIC“ sta ds fo No th A e i a I dust ial Classifi atio “ ste . E o o i epo ts i Ca ada, the U ited “tates a d i Me ico
are generated conforming to the NAICS classifications.
Gross Receipts Tax NAICS Categories 6-Digit NAICS Class Description
211110 Oil and Gas Extraction 213111 Drilling Oil and Gas Wells 213112 Support Activities for Oil and Gas Operations 213118 Support Activities for Oil and Gas Extraction
Impacts of Oil and Natural Gas Production in New Mexico on the State General Fund February 2015
– 16 –
Total OGAS
GRT
General
Fund GRT
Local
Gov't GRT
% of Total
GF GRT
FY 2008 $100.77 $71.97 $27.82 3.9%
FY 2009 $101.85 $72.02 $28.71 3.9%
FY 2010 $78.89 $55.69 $22.39 3.4%
FY 2011 $133.90 $93.12 $39.37 5.1%
FY 2012 $187.84 $138.58 $47.53 7.2%
FY 2013 $176.16 $127.55 $47.58 6.7%
FY 2014 $207.04 $151.48 $54.29 7.6%
There are two methods for estimating the portion of total general fund gross receipts tax that can be reasona-
bly attributed to direct reimbursements to vendors the OGA“ i dust i the state. The top-do ethod determines the amount of general fund separately and lumps the county, municipality and tribe, nation and
Pueblo piece as a residual. This method uses the Mu i ta of the o thl RP-80 available from TRD. This
report is detailed to the six-digit NAICS level. It is this level of necessary detail that requires the use of the RP-
80, rather than the more accurate RP-500. The top do app oa h is o l minimally obstructed by the re-
daction required by Section 7-1-8 NMSA 1978. The method uses the fact that the state tax collected within
municipal boundaries is the state rate (5.125 percent) less the municipal share of 1.225 percent. This is a net
to the general fund of 3.9 percent. The state rate for taxable gross receipts reported from nation/tribe/pueblo
areas is either 25 percent of the State rate (5.125% * 25% = 1.2815%) or zero, depending on whether the tax-
payer is an enrolled member of the particular tribe or not. The State rate of 5.125 percent applies to out-of-
state transactions or to transactions arising in county areas outside of municipal boundaries. Some care must
be taken with the RP-80 report because the u lassified atego means different things in different parts of
the report.
Several assumptions are necessary for this top do approach. First, all reported taxes are assumed paid.
Over time, probably 99 percent of liabilities are collected. This assumption is required since the RP-80 that
includes the necessary sectoral detail does not track payments, only reported liabilities. Second, the 3 percent
administrative fee imposed on all county GRT local options and on Municipal GRT local options in excess of .5
percent are ignored. There is a rough balance for the State general fund that interest and penalty charged on
delinquencies approximately balances non-payment. If the administrative fees were added, then the State
probably collects more than reported liabilities and the local governments probably collect less than the re-
ported liabilities. “i e the pu pose of the top-do ethod is to easu e the general fund revenue at-
tributed to the four OGAS NAICS codes accurately, or, if in error, to underestimate the OGAS contribution ig-
noring delinquencies and partial payments, interest and penalty and the administrative fee, is probably ap-
propriate. For the next phase, a subtlety could be added. We could assume that these elements, as applied to
the OGAS NAICS are the same as fo the e ti e Mi i g se to . Thus, e ould atio the agg egate data fo the Mining sector that includes the administrative fee, payment data and penalty and interest obtained from
the RP-500 using the ratios of OGAS to total Mining obtained from the sectoral detail in the RP-80. This top do ethod has ee used fo the OGA“ sha e of general fund from FY 2007 to FY 2014.
The second method for estimating the portion of total general fund Gross receipts that can be reasonably at-
tributed to direct reimbursements to vendors by the OGAS industry in the state is a otto -up app oa h and is applicable to the allocation to cities, counties, tribes, nations and pueblos. With this method, all the
data in all the four tabs of the RP-80 are used. This method principally uses the data from the county tab for
control totals for the sum of the sub-jurisdictions within the county. If the county total data is redacted for a
Impacts of Oil and Natural Gas Production in New Mexico on the State General Fund February 2015
– 17 –
particular NAICS code, then the redaction is allowed to stand. If the county total data are not redacted, but
the sub-jurisdiction data are, then a judicious allocation of the county amounts to the municipalities, Indian
areas and remainder county are made. Tax rates are adopted effective only July 1 and January 1. The bottom
up method adds the first six months of the fiscal year together for each jurisdiction in the county and the sec-
ond six months separately together. The enactment table published by TRD for each six-month period pro-
vides the data to allocate reported tax by sub-jurisdiction to the county, to the city or to a tribe, nation or
pue lo. These a e the data epo ted o the o pa io Cou t I pa ts of Oil and Gas Production in New
Me i o. The otto -up ethod has the sa e i a u a ies as the Top-do ethod, a d additio al un-
derestimates from redactions. The t o ethods ield si ila esults. The Top-Do esti ate fo OGA“ on-
tribution to the State general fund for FY 2014 is $151. illio . The otto -up ethod esti ates the gen-
eral fund contribution to be $148.4 million.
In future versions of this report, we may include the economic burden of other purchases by oil and natural
gas-related companies. We will use the IMPLAN model and tool to determine the plausible amount of taxable
purchases of goods and services that are made by oil and gas industry members. The amount will be at least
equal to the amount above and could be several times that amount. In FY 2014, oil, natural gas and CO2 total
production value was $17.1 billion. This production is not directly taxed under the Gross Receipts and Com-
pensating Tax Act. However, if all this value were taxed, the total tax burden would be almost $1 billion. Con-
sider the $207 million ($151 million general fund) estimate above as a lower bound on the Gross Receipts Tax
economic burden. Alternatively, as discussed previously, we may use an industry survey approach to refine
and extend the phases 1 and 2 results. From BEA data for CY 2013 (see introduction), the industry produced
$15.0 billion of product while contributing $7 billion in value added. The implies that the industry in the state
purchased about $8 billion of goods and services from both in-state and out-of-state vendors. Assuming a 6.5
percent gross receipts tax rate, this implies an additional $325 million in total GRT and nearly $200 million in
non-OGAS-related general fund contributions.
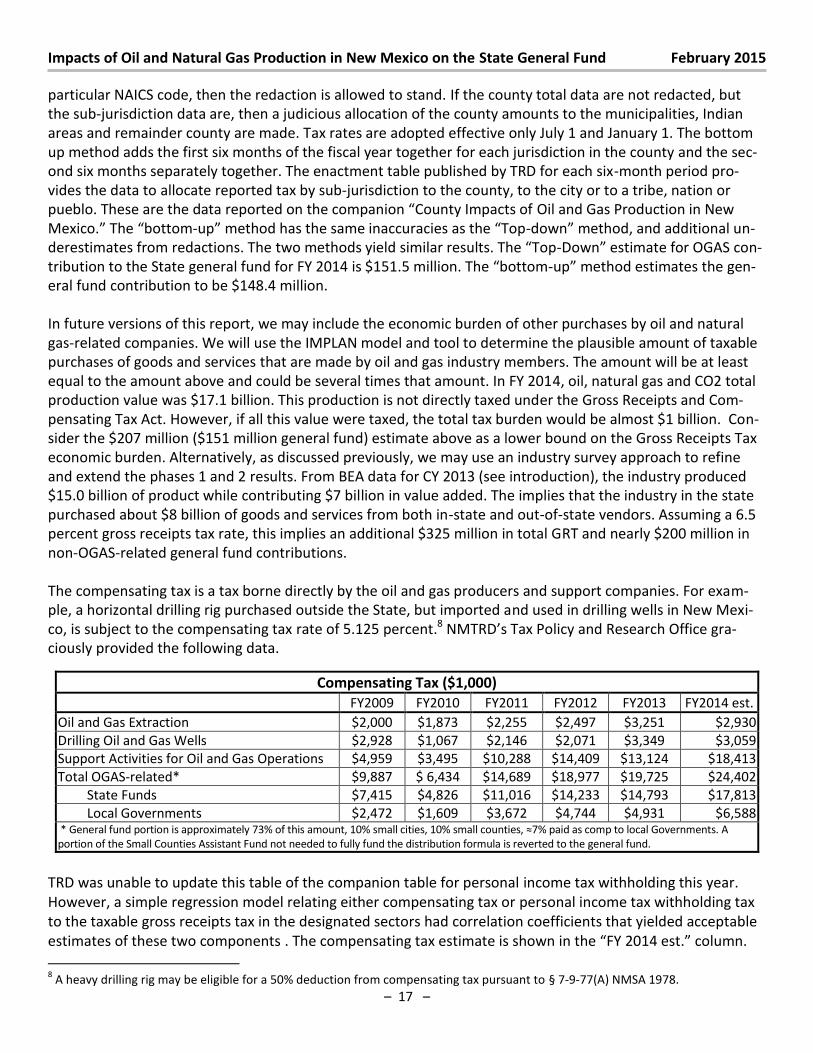
The compensating tax is a tax borne directly by the oil and gas producers and support companies. For exam-
ple, a horizontal drilling rig purchased outside the State, but imported and used in drilling wells in New Mexi-
co, is subject to the compensating tax rate of 5.125 percent.8 NMTRD’s Tax Policy and Research Office gra-
ciously provided the following data.
TRD was unable to update this table of the companion table for personal income tax withholding this year.
However, a simple regression model relating either compensating tax or personal income tax withholding tax
to the taxable gross receipts tax in the designated sectors had correlation coefficients that yielded acceptable
estimates of these two components . The co pe sati g ta esti ate is sho i the FY est. olu . 8 A heavy drilling rig may be eligible for a 50% deduction from compensating tax pursuant to § 7-9-77(A) NMSA 1978.
Compensating Tax ($1,000)
FY2009 FY2010 FY2011 FY2012 FY2013 FY2014 est.
Oil and Gas Extraction $2,000 $1,873 $2,255 $2,497 $3,251 $2,930
Drilling Oil and Gas Wells $2,928 $1,067 $2,146 $2,071 $3,349 $3,059
Support Activities for Oil and Gas Operations $4,959 $3,495 $10,288 $14,409 $13,124 $18,413
Total OGAS-related* $9,887 $ 6,434 $14,689 $18,977 $19,725 $24,402
State Funds $7,415 $4,826 $11,016 $14,233 $14,793 $17,813
Local Governments $2,472 $1,609 $3,672 $4,744 $4,931 $6,588 * General fund portion is approximately 73% of this amount, 10% small cities, 10% small ou ties, ≈7% paid as comp to local Governments. A
portion of the Small Counties Assistant Fund not needed to fully fund the distribution formula is reverted to the general fund.
Impacts of Oil and Natural Gas Production in New Mexico on the State General Fund February 2015
– 18 –
General Fund Revenues: Personal Income Tax Conventionally, when determining the portion of the general fund attributable to taxes and royalties paid by
the oil and natural gas industry, personal income taxes paid by employees or investors in production of the
industry are not included. This is a similar argument to the traditional exclusion of the economic burden im-
posed on the industry of the gross receipts tax. In that case, the argument advanced was that the tax is not
imposed directly on the producers. That argument, however, fails in the case of oil and gas withholding. This is
a tax collected by the producers from investors and persons with royalty interests in oil and gas production.
These taxes, when deducted from royalty payments or profit distributions made to out-of-state investors, are
then remitted to TRD. At personal income tax filing time, these withheld payments are applied to personal
income tax liabilities incurred by the payment of royalties by the producers. In the first few years following
enactment in 2004, this was not a significant revenue source. However, in FY2013, producers remitted
$90,195,333 to TRD on behalf of their royalty holders and investors and in FY 2014, the amount had increased
to $109,600,000. This is not a direct tax. The producers have a fiduciary responsibility to collect and remit this
withholding. Nor is the amount of oil and gas withholding a perfect estimate of the amount of New Mexico tax
liability incurred by the investors and royalty holders. On the other hand, it is likely that refunds will be mod-
est, since the vast majority of investors are subject to the maximum 4.9 percent current income tax rate,
which is the 2014 withholding rate. Thus, the allocated income from oil and gas interests will end up being
taxed at approximately the 4.9 percent tax rate. This may be a specious argument, however. Total production
on private lands in the state in FY 2014 was approximately $2.2 billion. If royalties are a usual 1/8th, or 12.5
percent and the withholding tax rate is 4.9 percent, the total withheld and remitted to TRD should be around
$13.6 million or less. However, royalties are not the only payments subject to OGAS withholding. Producers,
particularly independent producers, have company owners and other investors. Total production value for
FY14, including production on State, Federal and private lands was $17.1 billion. If, in addition to the $13.6
million in royalties on private lands, producers pay investors some portion of the profits from oil and gas pro-
duction and then deduct the oil and gas withholding amounts from dividends, $96 million in oil and gas with-
holding represents about $2.0 billion in profits subject to withholding. Thus, this is consistent with about 18
percent of production in New Mexico is financed by investors.
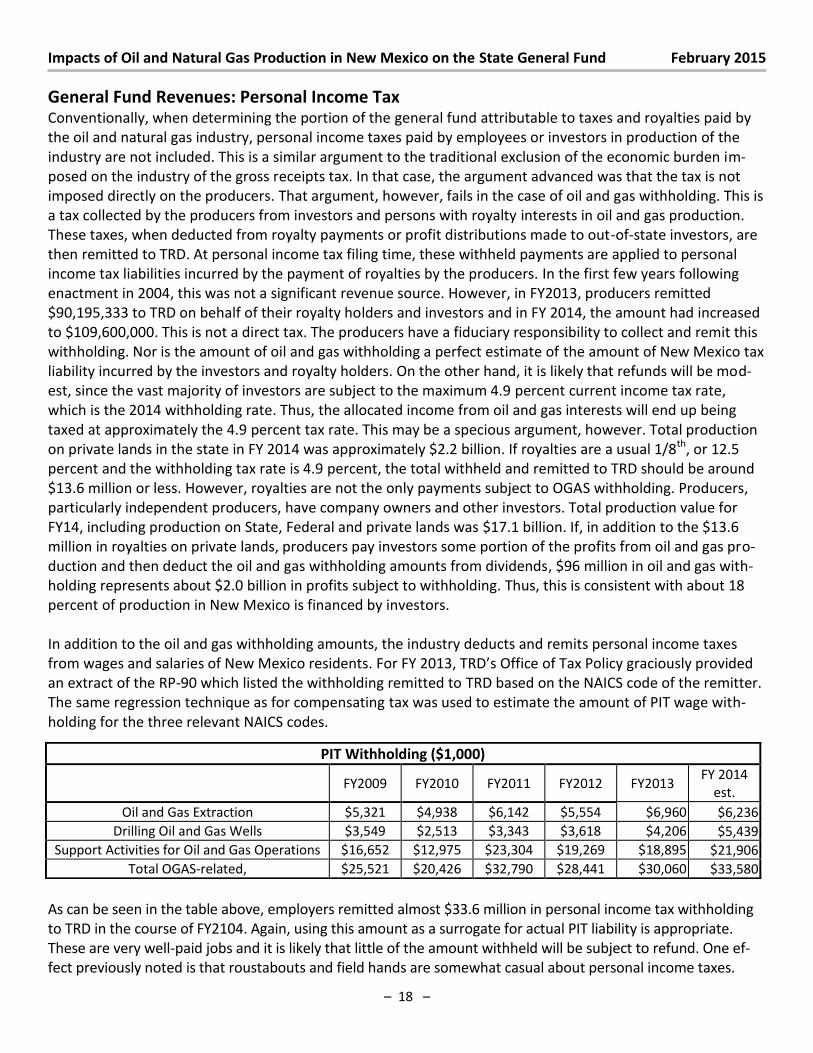
In addition to the oil and gas withholding amounts, the industry deducts and remits personal income taxes
from wages and salaries of New Mexico residents. For FY 2013, TRD’s Offi e of Ta Poli g a iousl p o ided an extract of the RP-90 which listed the withholding remitted to TRD based on the NAICS code of the remitter.
The same regression technique as for compensating tax was used to estimate the amount of PIT wage with-
holding for the three relevant NAICS codes.
As can be seen in the table above, employers remitted almost $33.6 million in personal income tax withholding
to TRD in the course of FY2104. Again, using this amount as a surrogate for actual PIT liability is appropriate.
These are very well-paid jobs and it is likely that little of the amount withheld will be subject to refund. One ef-
fect previously noted is that roustabouts and field hands are somewhat casual about personal income taxes.
PIT Withholding ($1,000)
FY2009 FY2010 FY2011 FY2012 FY2013
FY 2014
est.
Oil and Gas Extraction $5,321 $4,938 $6,142 $5,554 $6,960 $6,236
Drilling Oil and Gas Wells $3,549 $2,513 $3,343 $3,618 $4,206 $5,439
Support Activities for Oil and Gas Operations $16,652 $12,975 $23,304 $19,269 $18,895 $21,906
Total OGAS-related, $25,521 $20,426 $32,790 $28,441 $30,060 $33,580
Impacts of Oil and Natural Gas Production in New Mexico on the State General Fund February 2015
– 19 –
They tend to move casually into and out of the state and let the amount of taxes withheld by their employers
suffice instead of filing a New Mexico income tax return in the event that they are no longer resident in the state
at the time of filing. These migrant workers cheerfully abandon any refund they might be due.
For many reasons, then, it is appropriate that we give to the industry $109.6+$33.6 in attribution to the gen-
eral fund for oil and gas withholding and for withholding from wages and salaries.
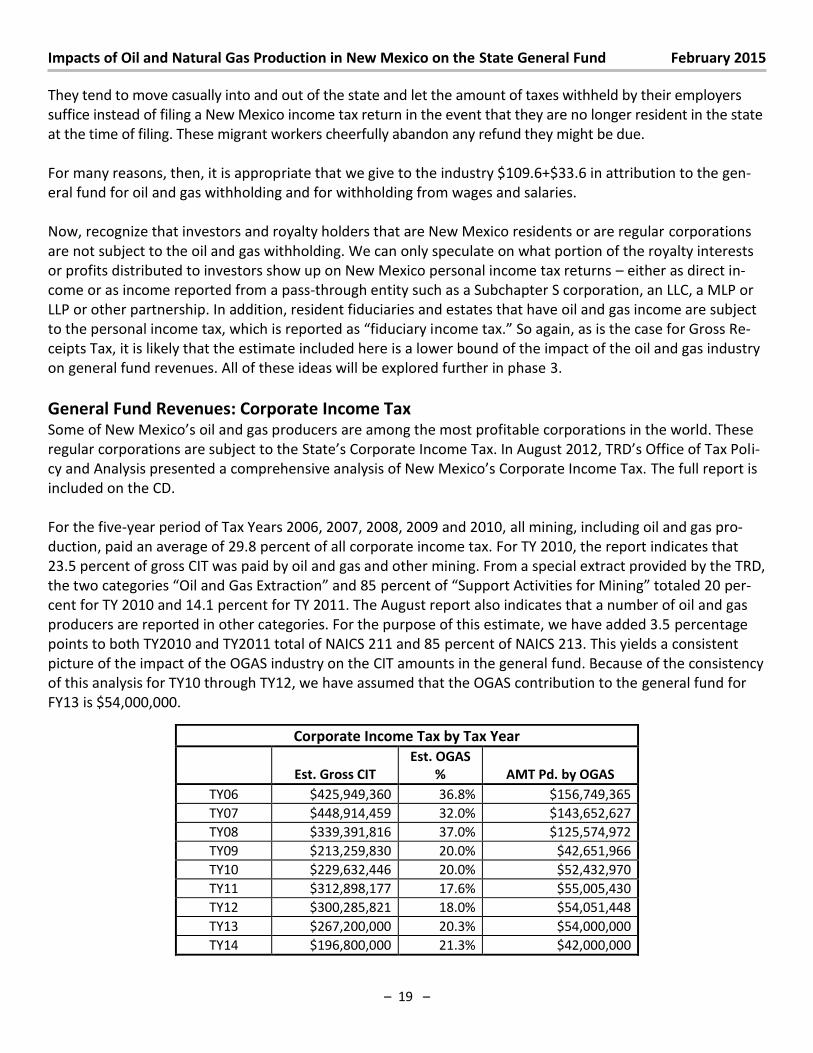
Now, recognize that investors and royalty holders that are New Mexico residents or are regular corporations
are not subject to the oil and gas withholding. We can only speculate on what portion of the royalty interests
or profits distributed to investors show up on New Mexico personal income tax returns – either as direct in-
come or as income reported from a pass-through entity such as a Subchapter S corporation, an LLC, a MLP or
LLP or other partnership. In addition, resident fiduciaries and estates that have oil and gas income are subject
to the pe so al i o e ta , hi h is epo ted as fidu ia i o e ta . So again, as is the case for Gross Re-
ceipts Tax, it is likely that the estimate included here is a lower bound of the impact of the oil and gas industry
on general fund revenues. All of these ideas will be explored further in phase 3.
General Fund Revenues: Corporate Income Tax “o e of Ne Me i o’s oil and gas producers are among the most profitable corporations in the world. These
regular corporations are subject to the State’s Co po ate I o e Ta . I August , TRD’s Offi e of Ta Poli-cy a d A al sis p ese ted a o p ehe si e a al sis of Ne Me i o’s Co po ate I o e Ta . The full report is
included on the CD.
For the five-year period of Tax Years 2006, 2007, 2008, 2009 and 2010, all mining, including oil and gas pro-
duction, paid an average of 29.8 percent of all corporate income tax. For TY 2010, the report indicates that
23.5 percent of gross CIT was paid by oil and gas and other mining. From a special extract provided by the TRD,
the t o atego ies Oil a d Gas E t a tio a d percent of “uppo t A ti ities fo Mi i g totaled per-
cent for TY 2010 and 14.1 percent for TY 2011. The August report also indicates that a number of oil and gas
producers are reported in other categories. For the purpose of this estimate, we have added 3.5 percentage
points to both TY2010 and TY2011 total of NAICS 211 and 85 percent of NAICS 213. This yields a consistent
picture of the impact of the OGAS industry on the CIT amounts in the general fund. Because of the consistency
of this analysis for TY10 through TY12, we have assumed that the OGAS contribution to the general fund for
FY13 is $54,000,000.
Corporate Income Tax by Tax Year
Est. Gross CIT
Est. OGAS
% AMT Pd. by OGAS
TY06 $425,949,360 36.8% $156,749,365
TY07 $448,914,459 32.0% $143,652,627
TY08 $339,391,816 37.0% $125,574,972
TY09 $213,259,830 20.0% $42,651,966
TY10 $229,632,446 20.0% $52,432,970
TY11 $312,898,177 17.6% $55,005,430
TY12 $300,285,821 18.0% $54,051,448
TY13 $267,200,000 20.3% $54,000,000
TY14 $196,800,000 21.3% $42,000,000
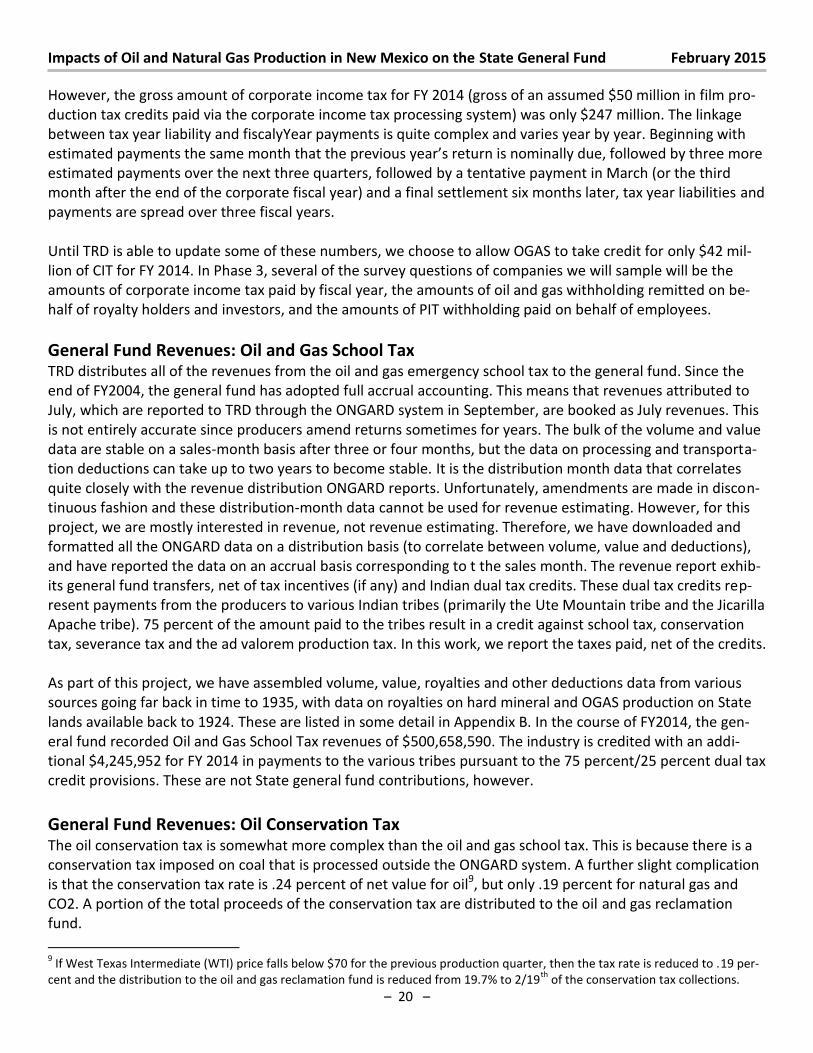
Impacts of Oil and Natural Gas Production in New Mexico on the State General Fund February 2015
– 20 –
However, the gross amount of corporate income tax for FY 2014 (gross of an assumed $50 million in film pro-
duction tax credits paid via the corporate income tax processing system) was only $247 million. The linkage
between tax year liability and fiscalyYear payments is quite complex and varies year by year. Beginning with
esti ated pa e ts the sa e o th that the p e ious ea ’s etu is o i all due, follo ed th ee o e estimated payments over the next three quarters, followed by a tentative payment in March (or the third
month after the end of the corporate fiscal year) and a final settlement six months later, tax year liabilities and
payments are spread over three fiscal years.
Until TRD is able to update some of these numbers, we choose to allow OGAS to take credit for only $42 mil-
lion of CIT for FY 2014. In Phase 3, several of the survey questions of companies we will sample will be the
amounts of corporate income tax paid by fiscal year, the amounts of oil and gas withholding remitted on be-
half of royalty holders and investors, and the amounts of PIT withholding paid on behalf of employees.
General Fund Revenues: Oil and Gas School Tax TRD distributes all of the revenues from the oil and gas emergency school tax to the general fund. Since the
end of FY2004, the general fund has adopted full accrual accounting. This means that revenues attributed to
July, which are reported to TRD through the ONGARD system in September, are booked as July revenues. This
is not entirely accurate since producers amend returns sometimes for years. The bulk of the volume and value
data are stable on a sales-month basis after three or four months, but the data on processing and transporta-
tion deductions can take up to two years to become stable. It is the distribution month data that correlates
quite closely with the revenue distribution ONGARD reports. Unfortunately, amendments are made in discon-
tinuous fashion and these distribution-month data cannot be used for revenue estimating. However, for this
project, we are mostly interested in revenue, not revenue estimating. Therefore, we have downloaded and
formatted all the ONGARD data on a distribution basis (to correlate between volume, value and deductions),
and have reported the data on an accrual basis corresponding to t the sales month. The revenue report exhib-
its general fund transfers, net of tax incentives (if any) and Indian dual tax credits. These dual tax credits rep-
resent payments from the producers to various Indian tribes (primarily the Ute Mountain tribe and the Jicarilla
Apache tribe). 75 percent of the amount paid to the tribes result in a credit against school tax, conservation
tax, severance tax and the ad valorem production tax. In this work, we report the taxes paid, net of the credits.
As part of this project, we have assembled volume, value, royalties and other deductions data from various
sources going far back in time to 1935, with data on royalties on hard mineral and OGAS production on State
lands available back to 1924. These are listed in some detail in Appendix B. In the course of FY2014, the gen-
eral fund recorded Oil and Gas School Tax revenues of $500,658,590. The industry is credited with an addi-
tional $4,245,952 for FY 2014 in payments to the various tribes pursuant to the 75 percent/25 percent dual tax
credit provisions. These are not State general fund contributions, however.
General Fund Revenues: Oil Conservation Tax The oil conservation tax is somewhat more complex than the oil and gas school tax. This is because there is a
conservation tax imposed on coal that is processed outside the ONGARD system. A further slight complication
is that the conservation tax rate is .24 percent of net value for oil9, but only .19 percent for natural gas and
CO2. A portion of the total proceeds of the conservation tax are distributed to the oil and gas reclamation
fund.
9 If West Texas Intermediate (WTI) price falls below $70 for the previous production quarter, then the tax rate is reduced to .19 per-
cent and the distribution to the oil and gas reclamation fund is reduced from 19.7% to 2/19th
of the conservation tax collections.
Impacts of Oil and Natural Gas Production in New Mexico on the State General Fund February 2015
– 21 –
The data available from the financial control division of DFA includes both oil and gas conservation tax, as well
as the coal conservation tax. However, these data do not reconcile. The ONGARD system implies that total
OGAS conservation tax collections for FY 2014 were $32,678,485, of which $27,808,652 would have trans-
ferred to the general fund and $4,869,833 would have been transferred to the oil reclamation fund. However,
the financial control division has published an unaudited final amount of $27,244,668 including the coal and
uranium transfers. This amount will be adjusted at audit by $152,000 to back out advanced payments. Resolv-
ing this enigma will be left to Phase 3.
In doing the research for this report, we read that the .24 percent conservation tax rate imposed on oil is con-
tingent upon west Texas intermediate price for the previous quarter averaging over $70 per barrel. The distri-
bution of the oil conservation tax also changes depending on the triggered rate. When the rate is .19 percent,
the distribution to the oil reclamation fund is 2/19ths and to the general fund, 17/19ths. When the rate is .24
percent, the distribution to the oil reclamation fund is 19.7 percent of collections and to the general fund,
81.3%.
General Fund Revenues: Natural Gas Processors Tax TRD transfers all of the natural gas processors tax collections to the general fund. While the calculation of the
tax rate for this tax is somewhat complex, it is relatively simple to determine the total amount attributed to
the OGAS industry. For FY2014, this was $$16,197,464. For FY 2013, the amount was $24,196,501. The tax rate
adjusts annually depending on the average ONGARD gas price the previous year.
General Fund Revenues: Federal Mineral Leasing Another somewhat complex revenue source is federal mineral leasing. Crude oil and natural gas producers pay
for the privilege of developing a particular OGAS site that is located on federal lands. These leases are adminis-
tered by the bureau of land management (BLM). After a well is in production, the producers pay royalties to
the Office of Natural Resource Revenues (ONRR),10 based on a contractual percentage of production value. In
most cases, the royalty percentage is 12.5 percent, or 1/8th of the value of production. There is some contro-
versy over whether the royalty calculation is based on market price less transportation and processing costs or
whether the royalty rate is imposed on the gross wellhead price before deductions. This is a complex issue,
but does not affect the calculation we are presenting in this report. The complexity is that oil and gas royalties
and bonus payments are less than 100 percent of the base for calculation of revenue sharing.11 BLM also leas-
es mineral lands and some grazing land. Based on ONGARD deductions and a download of the results of New
Mexico bonus payments, the OGAS industry paid $1,094,877,037 with $536,489,748 returned as revenue shar-
ing for FY 2014. Since the amount of FML recorded by the State Treasure was $569 million, too much revenue
sharing was remitted. This is unlikely. The ONRR data indicate that for FFY 2014, 95 percent of the total reve-
nues were attributable to Oil and Gas production. The rate of revenue sharing compared to the royalty pay-
ments was about 46 percent. Thus, of the $579 million reported by ONRR paid to New Mexico in the course of
Federal Fiscal Year 2014, $550 million can be attributed to Oil and Gas production. In the attribution table, the
amount reported as paid by the ONRR to New Mexico is shown as $569 million and the amount contributed by
OGAS production shown as $565 million. If we had used the 95 percent ratio as reported by ONRR, then the
10
Prior to 2011, payments were remitted to the Minerals Management Service (MMS), which processed the payments and dis-
bursed the revenue shares to the states. 11
On October 1, 2011, the Bureau of Ocean Energy Management, Regulation and Enforcement (BOEMRE), formerly the Minerals Management
Service (MMS), was replaced by the Bureau of Ocean Energy Management (BOEM) and the Bureau of Safety and Environmental Enforcement
(BSEE) as part of a major reorganization. At the same time, the Office of Resource Revenues took over the task of processing royalty and other
mineral payments and disbursing the revenue shares to the states.
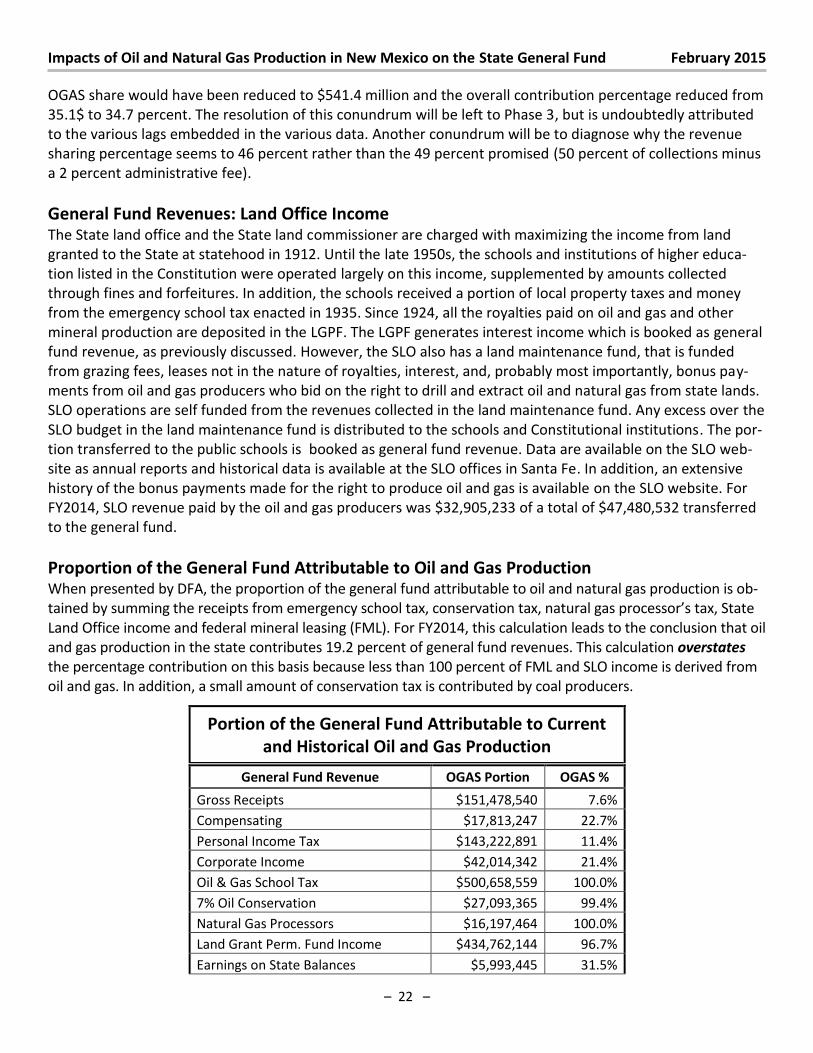
Impacts of Oil and Natural Gas Production in New Mexico on the State General Fund February 2015
– 22 –
OGAS share would have been reduced to $541.4 million and the overall contribution percentage reduced from
35.1$ to 34.7 percent. The resolution of this conundrum will be left to Phase 3, but is undoubtedly attributed
to the various lags embedded in the various data. Another conundrum will be to diagnose why the revenue
sharing percentage seems to 46 percent rather than the 49 percent promised (50 percent of collections minus
a 2 percent administrative fee).
General Fund Revenues: Land Office Income The State land office and the State land commissioner are charged with maximizing the income from land
granted to the State at statehood in 1912. Until the late 1950s, the schools and institutions of higher educa-
tion listed in the Constitution were operated largely on this income, supplemented by amounts collected
through fines and forfeitures. In addition, the schools received a portion of local property taxes and money
from the emergency school tax enacted in 1935. Since 1924, all the royalties paid on oil and gas and other
mineral production are deposited in the LGPF. The LGPF generates interest income which is booked as general
fund revenue, as previously discussed. However, the SLO also has a land maintenance fund, that is funded
from grazing fees, leases not in the nature of royalties, interest, and, probably most importantly, bonus pay-
ments from oil and gas producers who bid on the right to drill and extract oil and natural gas from state lands.
SLO operations are self funded from the revenues collected in the land maintenance fund. Any excess over the
SLO budget in the land maintenance fund is distributed to the schools and Constitutional institutions. The por-
tion transferred to the public schools is booked as general fund revenue. Data are available on the SLO web-
site as annual reports and historical data is available at the SLO offices in Santa Fe. In addition, an extensive
history of the bonus payments made for the right to produce oil and gas is available on the SLO website. For
FY2014, SLO revenue paid by the oil and gas producers was $32,905,233 of a total of $47,480,532 transferred
to the general fund.
Proportion of the General Fund Attributable to Oil and Gas Production When presented by DFA, the proportion of the general fund attributable to oil and natural gas production is ob-
tai ed su i g the e eipts f o e e ge s hool ta , o se atio ta , atu al gas p o esso ’s ta , “tate Land Office income and federal mineral leasing (FML). For FY2014, this calculation leads to the conclusion that oil
and gas production in the state contributes 19.2 percent of general fund revenues. This calculation overstates
the percentage contribution on this basis because less than 100 percent of FML and SLO income is derived from
oil and gas. In addition, a small amount of conservation tax is contributed by coal producers.
Portion of the General Fund Attributable to Current
and Historical Oil and Gas Production
General Fund Revenue OGAS Portion OGAS %
Gross Receipts $151,478,540 7.6%
Compensating $17,813,247 22.7%
Personal Income Tax $143,222,891 11.4%
Corporate Income $42,014,342 21.4%
Oil & Gas School Tax $500,658,559 100.0%
7% Oil Conservation $27,093,365 99.4%
Natural Gas Processors $16,197,464 100.0%
Land Grant Perm. Fund Income $434,762,144 96.7%
Earnings on State Balances $5,993,445 31.5%
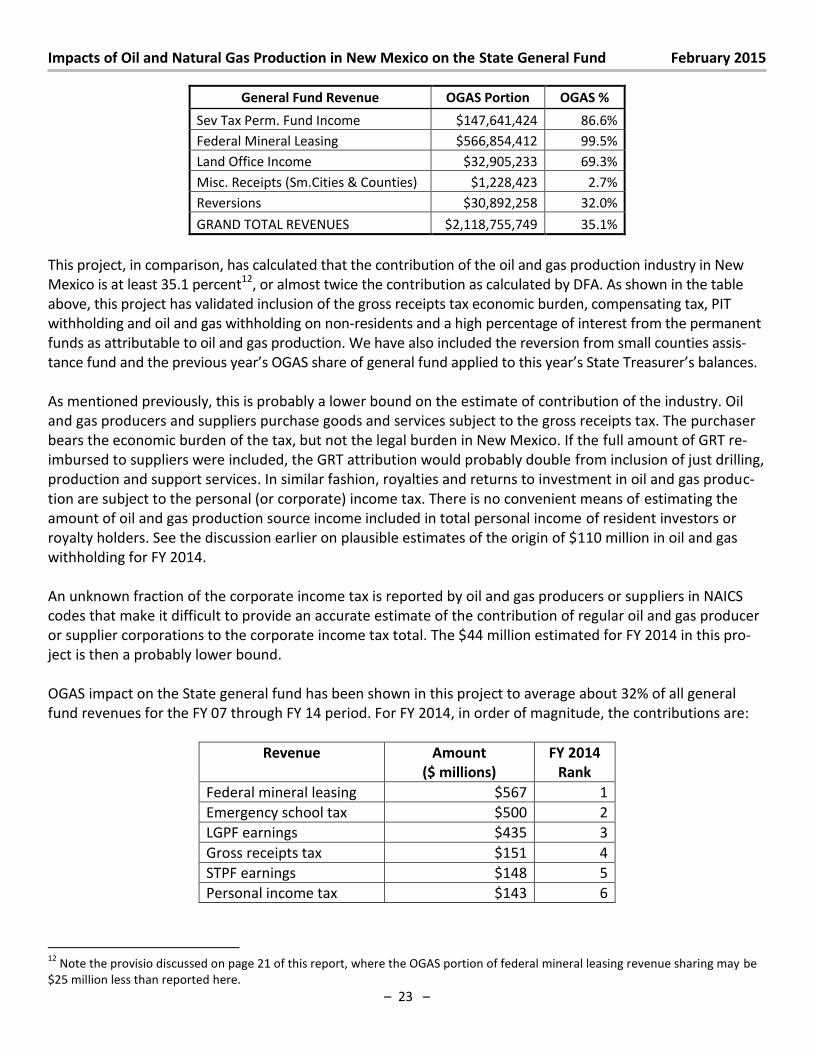
Impacts of Oil and Natural Gas Production in New Mexico on the State General Fund February 2015
– 23 –
General Fund Revenue OGAS Portion OGAS %
Sev Tax Perm. Fund Income $147,641,424 86.6%
Federal Mineral Leasing $566,854,412 99.5%
Land Office Income $32,905,233 69.3%
Misc. Receipts (Sm.Cities & Counties) $1,228,423 2.7%
Reversions $30,892,258 32.0%
GRAND TOTAL REVENUES $2,118,755,749 35.1%
This project, in comparison, has calculated that the contribution of the oil and gas production industry in New
Mexico is at least 35.1 percent12, or almost twice the contribution as calculated by DFA. As shown in the table
above, this project has validated inclusion of the gross receipts tax economic burden, compensating tax, PIT
withholding and oil and gas withholding on non-residents and a high percentage of interest from the permanent
funds as attributable to oil and gas production. We have also included the reversion from small counties assis-
tance fu d a d the p e ious ea ’s OGA“ sha e of general fund applied to this yea ’s “tate T easu e ’s ala es.
As mentioned previously, this is probably a lower bound on the estimate of contribution of the industry. Oil
and gas producers and suppliers purchase goods and services subject to the gross receipts tax. The purchaser
bears the economic burden of the tax, but not the legal burden in New Mexico. If the full amount of GRT re-
imbursed to suppliers were included, the GRT attribution would probably double from inclusion of just drilling,
production and support services. In similar fashion, royalties and returns to investment in oil and gas produc-
tion are subject to the personal (or corporate) income tax. There is no convenient means of estimating the
amount of oil and gas production source income included in total personal income of resident investors or
royalty holders. See the discussion earlier on plausible estimates of the origin of $110 million in oil and gas
withholding for FY 2014.
An unknown fraction of the corporate income tax is reported by oil and gas producers or suppliers in NAICS
codes that make it difficult to provide an accurate estimate of the contribution of regular oil and gas producer
or supplier corporations to the corporate income tax total. The $44 million estimated for FY 2014 in this pro-
ject is then a probably lower bound.
OGAS impact on the State general fund has been shown in this project to average about 32% of all general
fund revenues for the FY 07 through FY 14 period. For FY 2014, in order of magnitude, the contributions are:
Revenue Amount
($ millions)
FY 2014
Rank
Federal mineral leasing $567 1
Emergency school tax $500 2
LGPF earnings $435 3
Gross receipts tax $151 4
STPF earnings $148 5
Personal income tax $143 6
12
Note the provisio discussed on page 21 of this report, where the OGAS portion of federal mineral leasing revenue sharing may be
$25 million less than reported here.
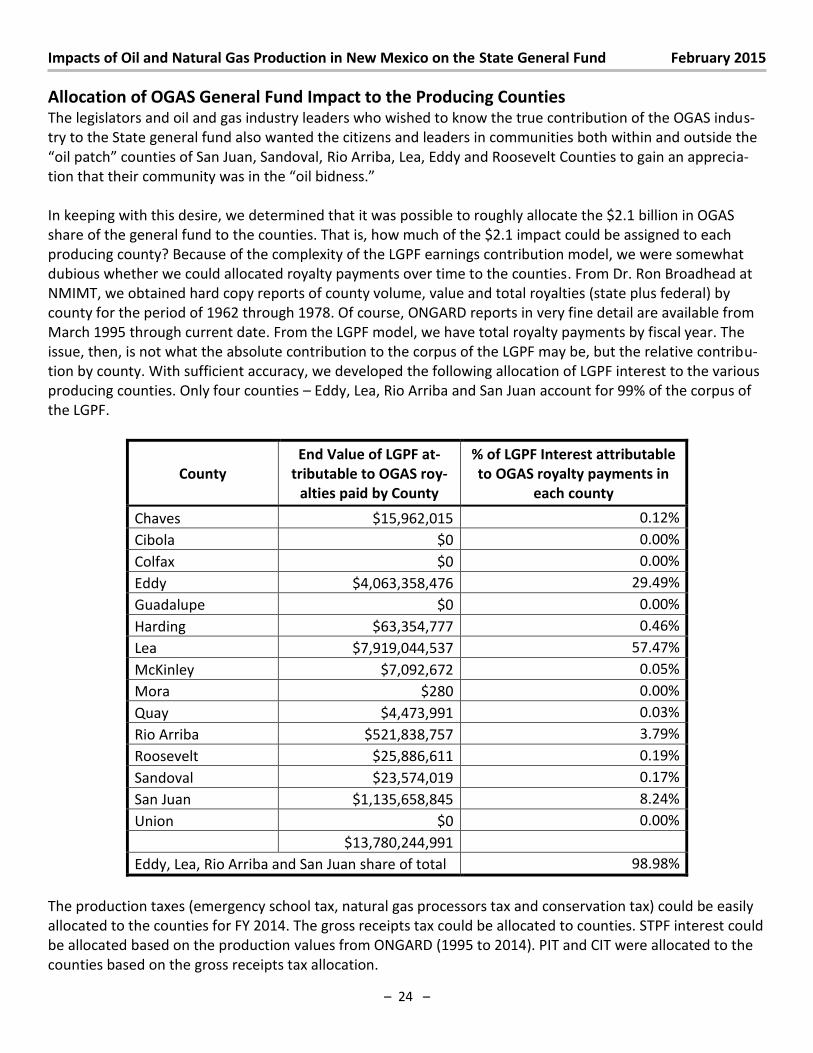
Impacts of Oil and Natural Gas Production in New Mexico on the State General Fund February 2015
– 24 –
Allocation of OGAS General Fund Impact to the Producing Counties The legislators and oil and gas industry leaders who wished to know the true contribution of the OGAS indus-
try to the State general fund also wanted the citizens and leaders in communities both within and outside the
oil pat h ou ties of “a Jua , “a do al, Rio Arriba, Lea, Eddy and Roosevelt Counties to gain an apprecia-
tio that thei o u it as i the oil id ess.
In keeping with this desire, we determined that it was possible to roughly allocate the $2.1 billion in OGAS
share of the general fund to the counties. That is, how much of the $2.1 impact could be assigned to each
producing county? Because of the complexity of the LGPF earnings contribution model, we were somewhat
dubious whether we could allocated royalty payments over time to the counties. From Dr. Ron Broadhead at
NMIMT, we obtained hard copy reports of county volume, value and total royalties (state plus federal) by
county for the period of 1962 through 1978. Of course, ONGARD reports in very fine detail are available from
March 1995 through current date. From the LGPF model, we have total royalty payments by fiscal year. The
issue, then, is not what the absolute contribution to the corpus of the LGPF may be, but the relative contribu-
tion by county. With sufficient accuracy, we developed the following allocation of LGPF interest to the various
producing counties. Only four counties – Eddy, Lea, Rio Arriba and San Juan account for 99% of the corpus of
the LGPF.
County
End Value of LGPF at-
tributable to OGAS roy-
alties paid by County
% of LGPF Interest attributable
to OGAS royalty payments in
each county
Chaves $15,962,015 0.12%
Cibola $0 0.00%
Colfax $0 0.00%
Eddy $4,063,358,476 29.49%
Guadalupe $0 0.00%
Harding $63,354,777 0.46%
Lea $7,919,044,537 57.47%
McKinley $7,092,672 0.05%
Mora $280 0.00%
Quay $4,473,991 0.03%
Rio Arriba $521,838,757 3.79%
Roosevelt $25,886,611 0.19%
Sandoval $23,574,019 0.17%
San Juan $1,135,658,845 8.24%
Union $0 0.00%
$13,780,244,991
Eddy, Lea, Rio Arriba and San Juan share of total 98.98%
The production taxes (emergency school tax, natural gas processors tax and conservation tax) could be easily
allocated to the counties for FY 2014. The gross receipts tax could be allocated to counties. STPF interest could
be allocated based on the production values from ONGARD (1995 to 2014). PIT and CIT were allocated to the
counties based on the gross receipts tax allocation.
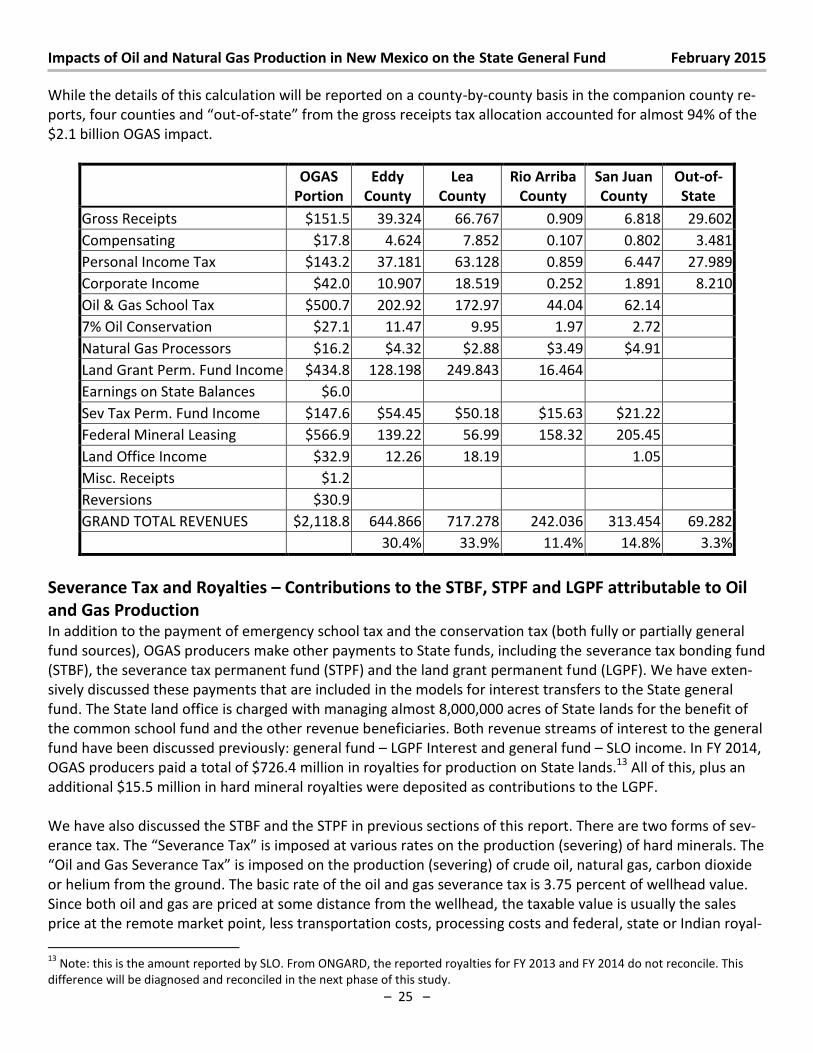
Impacts of Oil and Natural Gas Production in New Mexico on the State General Fund February 2015
– 25 –
While the details of this calculation will be reported on a county-by-county basis in the companion county re-
ports, four counties and out-of-state f o the g oss e eipts ta allo atio a ou ted fo al ost % of the $2.1 billion OGAS impact.
OGAS
Portion
Eddy
County
Lea
County
Rio Arriba
County
San Juan
County
Out-of-
State
Gross Receipts $151.5 39.324 66.767 0.909 6.818 29.602
Compensating $17.8 4.624 7.852 0.107 0.802 3.481
Personal Income Tax $143.2 37.181 63.128 0.859 6.447 27.989
Corporate Income $42.0 10.907 18.519 0.252 1.891 8.210
Oil & Gas School Tax $500.7 202.92 172.97 44.04 62.14
7% Oil Conservation $27.1 11.47 9.95 1.97 2.72
Natural Gas Processors $16.2 $4.32 $2.88 $3.49 $4.91
Land Grant Perm. Fund Income $434.8 128.198 249.843 16.464
Earnings on State Balances $6.0
Sev Tax Perm. Fund Income $147.6 $54.45 $50.18 $15.63 $21.22
Federal Mineral Leasing $566.9 139.22 56.99 158.32 205.45
Land Office Income $32.9 12.26 18.19
1.05
Misc. Receipts $1.2
Reversions $30.9
GRAND TOTAL REVENUES $2,118.8 644.866 717.278 242.036 313.454 69.282
30.4% 33.9% 11.4% 14.8% 3.3%
Severance Tax and Royalties – Contributions to the STBF, STPF and LGPF attributable to Oil
and Gas Production In addition to the payment of emergency school tax and the conservation tax (both fully or partially general
fund sources), OGAS producers make other payments to State funds, including the severance tax bonding fund
(STBF), the severance tax permanent fund (STPF) and the land grant permanent fund (LGPF). We have exten-
sively discussed these payments that are included in the models for interest transfers to the State general
fund. The State land office is charged with managing almost 8,000,000 acres of State lands for the benefit of
the common school fund and the other revenue beneficiaries. Both revenue streams of interest to the general
fund have been discussed previously: general fund – LGPF Interest and general fund – SLO income. In FY 2014,
OGAS producers paid a total of $726.4 million in royalties for production on State lands.13 All of this, plus an
additional $15.5 million in hard mineral royalties were deposited as contributions to the LGPF.
We have also discussed the STBF and the STPF in previous sections of this report. There are two forms of sev-
erance ta . The “e e a e Ta is i posed at a ious ates o the production (severing) of hard minerals. The
Oil a d Gas “e e a e Ta is i posed o the p odu tio se e i g of ude oil, atu al gas, a o dio ide or helium from the ground. The basic rate of the oil and gas severance tax is 3.75 percent of wellhead value.
Since both oil and gas are priced at some distance from the wellhead, the taxable value is usually the sales
price at the remote market point, less transportation costs, processing costs and federal, state or Indian royal-
13
Note: this is the amount reported by SLO. From ONGARD, the reported royalties for FY 2013 and FY 2014 do not reconcile. This
difference will be diagnosed and reconciled in the next phase of this study.
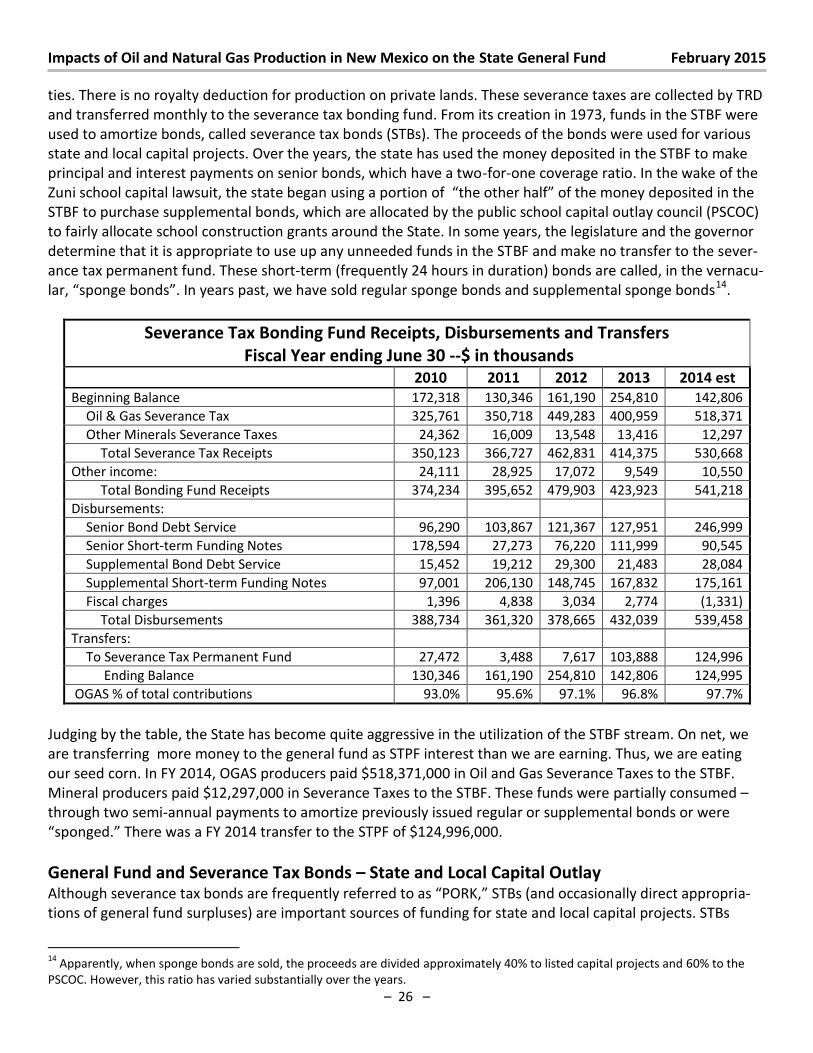
Impacts of Oil and Natural Gas Production in New Mexico on the State General Fund February 2015
– 26 –
ties. There is no royalty deduction for production on private lands. These severance taxes are collected by TRD
and transferred monthly to the severance tax bonding fund. From its creation in 1973, funds in the STBF were
used to amortize bonds, called severance tax bonds (STBs). The proceeds of the bonds were used for various
state and local capital projects. Over the years, the state has used the money deposited in the STBF to make
principal and interest payments on senior bonds, which have a two-for-one coverage ratio. In the wake of the
Zuni school capital lawsuit, the state began using a portion of the othe half of the o e deposited in the
STBF to purchase supplemental bonds, which are allocated by the public school capital outlay council (PSCOC)
to fairly allocate school construction grants around the State. In some years, the legislature and the governor
determine that it is appropriate to use up any unneeded funds in the STBF and make no transfer to the sever-
ance tax permanent fund. These short-term (frequently 24 hours in duration) bonds are called, in the vernacu-
la , spo ge o ds . I ea s past, e ha e sold egula spo ge o ds a d supple e tal spo ge o ds14.
Severance Tax Bonding Fund Receipts, Disbursements and Transfers
Fiscal Year ending June 30 --$ in thousands
2010 2011 2012 2013 2014 est
Beginning Balance 172,318 130,346 161,190 254,810 142,806
Oil & Gas Severance Tax 325,761 350,718 449,283 400,959 518,371
Other Minerals Severance Taxes 24,362 16,009 13,548 13,416 12,297
Total Severance Tax Receipts 350,123 366,727 462,831 414,375 530,668
Other income: 24,111 28,925 17,072 9,549 10,550
Total Bonding Fund Receipts 374,234 395,652 479,903 423,923 541,218
Disbursements:
Senior Bond Debt Service 96,290 103,867 121,367 127,951 246,999
Senior Short-term Funding Notes 178,594 27,273 76,220 111,999 90,545
Supplemental Bond Debt Service 15,452 19,212 29,300 21,483 28,084
Supplemental Short-term Funding Notes 97,001 206,130 148,745 167,832 175,161
Fiscal charges 1,396 4,838 3,034 2,774 (1,331)
Total Disbursements 388,734 361,320 378,665 432,039 539,458
Transfers:
To Severance Tax Permanent Fund 27,472 3,488 7,617 103,888 124,996
Ending Balance 130,346 161,190 254,810 142,806 124,995
OGAS % of total contributions 93.0% 95.6% 97.1% 96.8% 97.7%
Judging by the table, the State has become quite aggressive in the utilization of the STBF stream. On net, we
are transferring more money to the general fund as STPF interest than we are earning. Thus, we are eating
our seed corn. In FY 2014, OGAS producers paid $518,371,000 in Oil and Gas Severance Taxes to the STBF.
Mineral producers paid $12,297,000 in Severance Taxes to the STBF. These funds were partially consumed –
through two semi-annual payments to amortize previously issued regular or supplemental bonds or were
spo ged. The e as a FY 2014 transfer to the STPF of $124,996,000.
General Fund and Severance Tax Bonds – State and Local Capital Outlay Although severance ta o ds a e f e ue tl efe ed to as PORK, “TBs a d o asio all di e t app op ia-
tions of general fund surpluses) are important sources of funding for state and local capital projects. STBs
14
Apparently, when sponge bonds are sold, the proceeds are divided approximately 40% to listed capital projects and 60% to the
PSCOC. However, this ratio has varied substantially over the years.
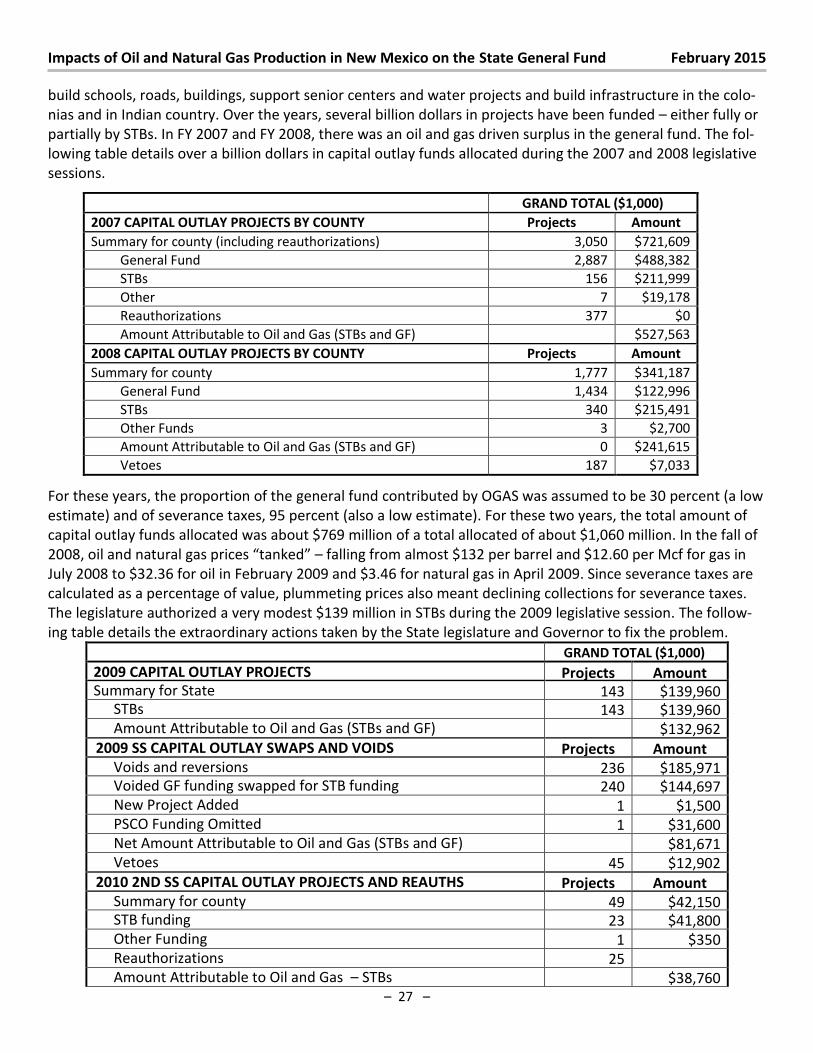
Impacts of Oil and Natural Gas Production in New Mexico on the State General Fund February 2015
– 27 –
build schools, roads, buildings, support senior centers and water projects and build infrastructure in the colo-
nias and in Indian country. Over the years, several billion dollars in projects have been funded – either fully or
partially by STBs. In FY 2007 and FY 2008, there was an oil and gas driven surplus in the general fund. The fol-
lowing table details over a billion dollars in capital outlay funds allocated during the 2007 and 2008 legislative
sessions.
GRAND TOTAL ($1,000)
2007 CAPITAL OUTLAY PROJECTS BY COUNTY Projects Amount
Summary for county (including reauthorizations) 3,050 $721,609
General Fund 2,887 $488,382
STBs 156 $211,999
Other 7 $19,178
Reauthorizations 377 $0
Amount Attributable to Oil and Gas (STBs and GF) $527,563
2008 CAPITAL OUTLAY PROJECTS BY COUNTY Projects Amount
Summary for county 1,777 $341,187
General Fund 1,434 $122,996
STBs 340 $215,491
Other Funds 3 $2,700
Amount Attributable to Oil and Gas (STBs and GF) 0 $241,615
Vetoes 187 $7,033 For these years, the proportion of the general fund contributed by OGAS was assumed to be 30 percent (a low
estimate) and of severance taxes, 95 percent (also a low estimate). For these two years, the total amount of
capital outlay funds allocated was about $769 million of a total allocated of about $1,060 million. In the fall of
, oil a d atu al gas p i es ta ked – falling from almost $132 per barrel and $12.60 per Mcf for gas in
July 2008 to $32.36 for oil in February 2009 and $3.46 for natural gas in April 2009. Since severance taxes are
calculated as a percentage of value, plummeting prices also meant declining collections for severance taxes.
The legislature authorized a very modest $139 million in STBs during the 2009 legislative session. The follow-
ing table details the extraordinary actions taken by the State legislature and Governor to fix the problem.
GRAND TOTAL ($1,000)
2009 CAPITAL OUTLAY PROJECTS Projects Amount Summary for State 143 $139,960
STBs 143 $139,960 Amount Attributable to Oil and Gas (STBs and GF)
$132,962
2009 SS CAPITAL OUTLAY SWAPS AND VOIDS Projects Amount Voids and reversions 236 $185,971 Voided GF funding swapped for STB funding 240 $144,697 New Project Added 1 $1,500 PSCO Funding Omitted 1 $31,600 Net Amount Attributable to Oil and Gas (STBs and GF) $81,671 Vetoes 45 $12,902
2010 2ND SS CAPITAL OUTLAY PROJECTS AND REAUTHS Projects Amount Summary for county 49 $42,150 STB funding 23 $41,800 Other Funding 1 $350 Reauthorizations 25 Amount Attributable to Oil and Gas – STBs $38,760
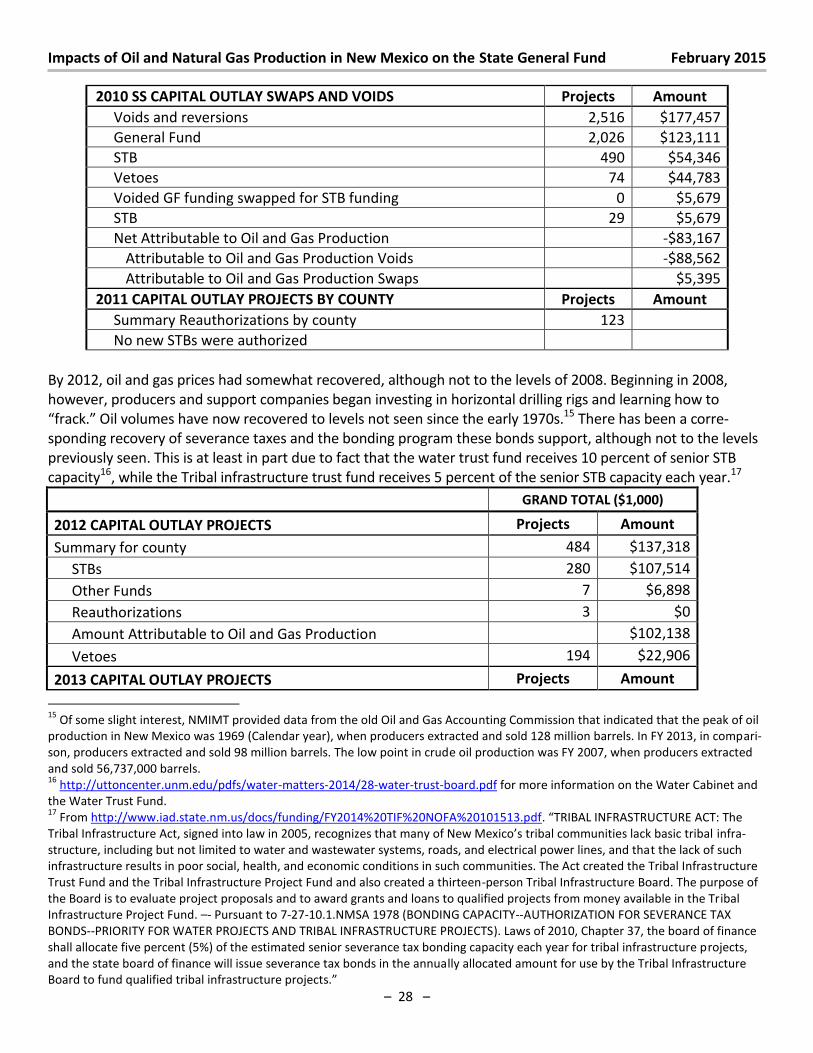
Impacts of Oil and Natural Gas Production in New Mexico on the State General Fund February 2015
– 28 –
2010 SS CAPITAL OUTLAY SWAPS AND VOIDS Projects Amount
Voids and reversions 2,516 $177,457
General Fund 2,026 $123,111
STB 490 $54,346
Vetoes 74 $44,783
Voided GF funding swapped for STB funding 0 $5,679
STB 29 $5,679
Net Attributable to Oil and Gas Production -$83,167
Attributable to Oil and Gas Production Voids -$88,562
Attributable to Oil and Gas Production Swaps $5,395
2011 CAPITAL OUTLAY PROJECTS BY COUNTY Projects Amount
Summary Reauthorizations by county 123
No new STBs were authorized
By 2012, oil and gas prices had somewhat recovered, although not to the levels of 2008. Beginning in 2008,
however, producers and support companies began investing in horizontal drilling rigs and learning how to
f a k. Oil olu es have now recovered to levels not seen since the early 1970s.15 There has been a corre-
sponding recovery of severance taxes and the bonding program these bonds support, although not to the levels
previously seen. This is at least in part due to fact that the water trust fund receives 10 percent of senior STB
capacity16, while the Tribal infrastructure trust fund receives 5 percent of the senior STB capacity each year.17
GRAND TOTAL ($1,000)
2012 CAPITAL OUTLAY PROJECTS Projects Amount
Summary for county 484 $137,318
STBs 280 $107,514
Other Funds 7 $6,898
Reauthorizations 3 $0
Amount Attributable to Oil and Gas Production
$102,138
Vetoes 194 $22,906
2013 CAPITAL OUTLAY PROJECTS Projects Amount
15
Of some slight interest, NMIMT provided data from the old Oil and Gas Accounting Commission that indicated that the peak of oil
production in New Mexico was 1969 (Calendar year), when producers extracted and sold 128 million barrels. In FY 2013, in compari-
son, producers extracted and sold 98 million barrels. The low point in crude oil production was FY 2007, when producers extracted
and sold 56,737,000 barrels. 16
http://uttoncenter.unm.edu/pdfs/water-matters-2014/28-water-trust-board.pdf for more information on the Water Cabinet and
the Water Trust Fund. 17
From http://www.iad.state.nm.us/docs/funding/FY2014%20TIF%20NOFA%20101513.pdf. TRIBAL INFRA“TRUCTURE ACT: The
T i al I f ast u tu e A t, sig ed i to la i , e og izes that a of Ne Me i o’s t i al o u ities la k asi t i al infra-
structure, including but not limited to water and wastewater systems, roads, and electrical power lines, and that the lack of such
infrastructure results in poor social, health, and economic conditions in such communities. The Act created the Tribal Infrastructure
Trust Fund and the Tribal Infrastructure Project Fund and also created a thirteen-person Tribal Infrastructure Board. The purpose of
the Board is to evaluate project proposals and to award grants and loans to qualified projects from money available in the Tribal
Infrastructure Project Fund. –- Pursuant to 7-27-10.1.NMSA 1978 (BONDING CAPACITY--AUTHORIZATION FOR SEVERANCE TAX
BONDS--PRIORITY FOR WATER PROJECTS AND TRIBAL INFRASTRUCTURE PROJECTS). Laws of 2010, Chapter 37, the board of finance
shall allocate five percent (5%) of the estimated senior severance tax bonding capacity each year for tribal infrastructure projects,
and the state board of finance will issue severance tax bonds in the annually allocated amount for use by the Tribal Infrastructure
Boa d to fu d ualified t i al i f ast u tu e p oje ts.
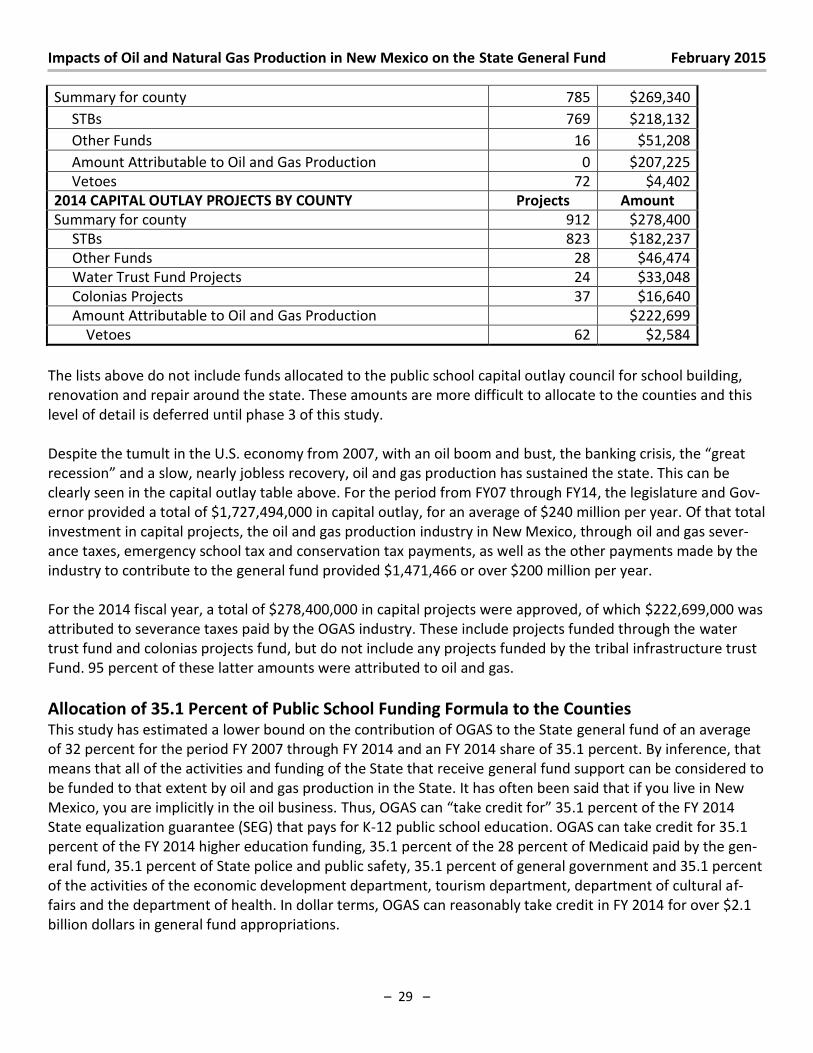
Impacts of Oil and Natural Gas Production in New Mexico on the State General Fund February 2015
– 29 –
Summary for county 785 $269,340
STBs 769 $218,132
Other Funds 16 $51,208
Amount Attributable to Oil and Gas Production 0 $207,225
Vetoes 72 $4,402
2014 CAPITAL OUTLAY PROJECTS BY COUNTY Projects Amount
Summary for county 912 $278,400
STBs 823 $182,237
Other Funds 28 $46,474
Water Trust Fund Projects 24 $33,048
Colonias Projects 37 $16,640
Amount Attributable to Oil and Gas Production
$222,699
Vetoes 62 $2,584
The lists above do not include funds allocated to the public school capital outlay council for school building,
renovation and repair around the state. These amounts are more difficult to allocate to the counties and this
level of detail is deferred until phase 3 of this study.
Despite the tumult in the U.S. economy from 2007, with an oil boom and ust, the a ki g isis, the g eat recession and a slow, nearly jobless recovery, oil and gas production has sustained the state. This can be
clearly seen in the capital outlay table above. For the period from FY07 through FY14, the legislature and Gov-
ernor provided a total of $1,727,494,000 in capital outlay, for an average of $240 million per year. Of that total
investment in capital projects, the oil and gas production industry in New Mexico, through oil and gas sever-
ance taxes, emergency school tax and conservation tax payments, as well as the other payments made by the
industry to contribute to the general fund provided $1,471,466 or over $200 million per year.
For the 2014 fiscal year, a total of $278,400,000 in capital projects were approved, of which $222,699,000 was
attributed to severance taxes paid by the OGAS industry. These include projects funded through the water
trust fund and colonias projects fund, but do not include any projects funded by the tribal infrastructure trust
Fund. 95 percent of these latter amounts were attributed to oil and gas.
Allocation of 35.1 Percent of Public School Funding Formula to the Counties This study has estimated a lower bound on the contribution of OGAS to the State general fund of an average
of 32 percent for the period FY 2007 through FY 2014 and an FY 2014 share of 35.1 percent. By inference, that
means that all of the activities and funding of the State that receive general fund support can be considered to
be funded to that extent by oil and gas production in the State. It has often been said that if you live in New
Mexico, you are implicitly in the oil business. Thus, OGA“ a take edit fo .1 percent of the FY 2014
State equalization guarantee (SEG) that pays for K-12 public school education. OGAS can take credit for 35.1
percent of the FY 2014 higher education funding, 35.1 percent of the 28 percent of Medicaid paid by the gen-
eral fund, 35.1 percent of State police and public safety, 35.1 percent of general government and 35.1 percent
of the activities of the economic development department, tourism department, department of cultural af-
fairs and the department of health. In dollar terms, OGAS can reasonably take credit in FY 2014 for over $2.1
billion dollars in general fund appropriations.
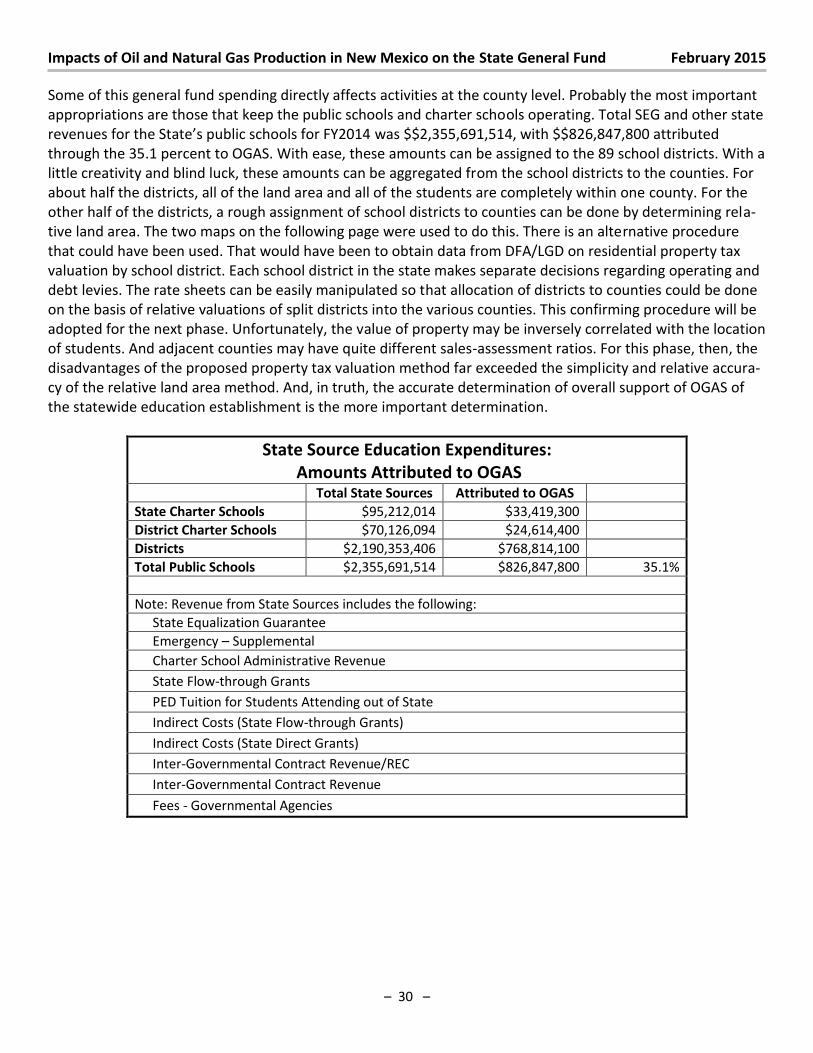
Impacts of Oil and Natural Gas Production in New Mexico on the State General Fund February 2015
– 30 –
Some of this general fund spending directly affects activities at the county level. Probably the most important
appropriations are those that keep the public schools and charter schools operating. Total SEG and other state
e e ues fo the “tate’s pu li s hools fo FY was $$2,355,691,514, with $$826,847,800 attributed
through the 35.1 percent to OGAS. With ease, these amounts can be assigned to the 89 school districts. With a
little creativity and blind luck, these amounts can be aggregated from the school districts to the counties. For
about half the districts, all of the land area and all of the students are completely within one county. For the
other half of the districts, a rough assignment of school districts to counties can be done by determining rela-
tive land area. The two maps on the following page were used to do this. There is an alternative procedure
that could have been used. That would have been to obtain data from DFA/LGD on residential property tax
valuation by school district. Each school district in the state makes separate decisions regarding operating and
debt levies. The rate sheets can be easily manipulated so that allocation of districts to counties could be done
on the basis of relative valuations of split districts into the various counties. This confirming procedure will be
adopted for the next phase. Unfortunately, the value of property may be inversely correlated with the location
of students. And adjacent counties may have quite different sales-assessment ratios. For this phase, then, the
disadvantages of the proposed property tax valuation method far exceeded the simplicity and relative accura-
cy of the relative land area method. And, in truth, the accurate determination of overall support of OGAS of
the statewide education establishment is the more important determination.
State Source Education Expenditures:
Amounts Attributed to OGAS
Total State Sources Attributed to OGAS
State Charter Schools $95,212,014 $33,419,300
District Charter Schools $70,126,094 $24,614,400
Districts $2,190,353,406 $768,814,100
Total Public Schools $2,355,691,514 $826,847,800 35.1%
Note: Revenue from State Sources includes the following:
State Equalization Guarantee
Emergency – Supplemental
Charter School Administrative Revenue
State Flow-through Grants
PED Tuition for Students Attending out of State
Indirect Costs (State Flow-through Grants)
Indirect Costs (State Direct Grants)
Inter-Governmental Contract Revenue/REC
Inter-Governmental Contract Revenue
Fees - Governmental Agencies
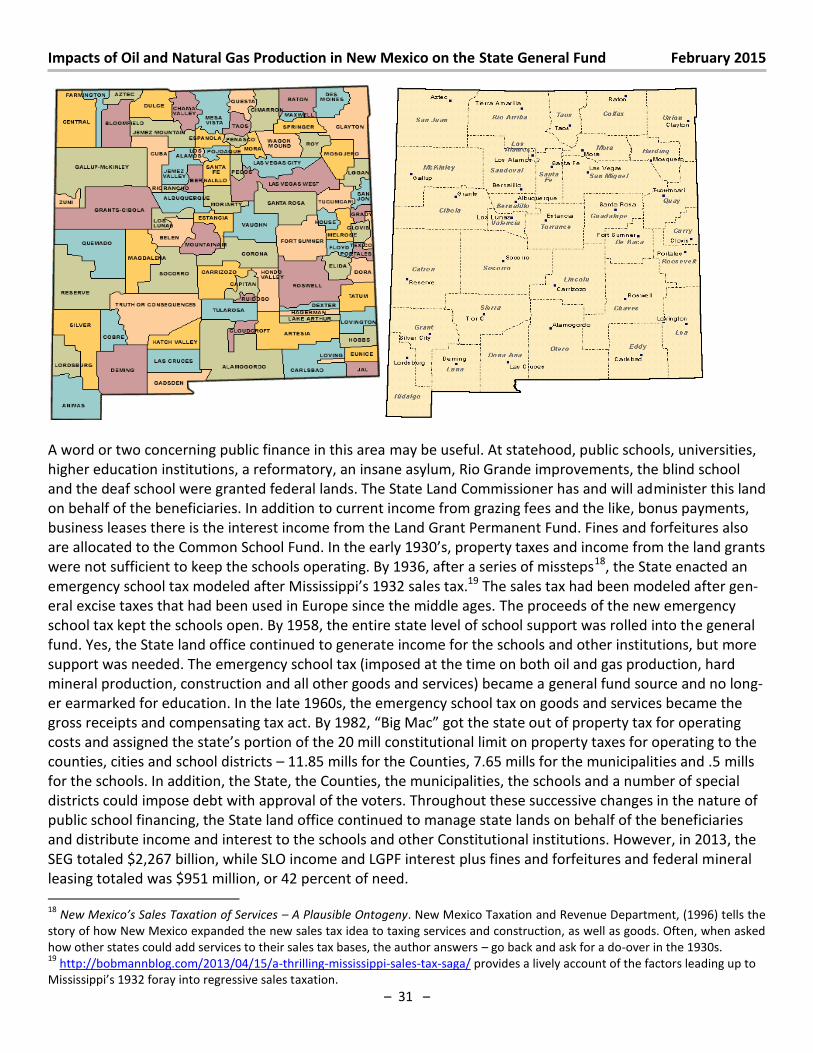
Impacts of Oil and Natural Gas Production in New Mexico on the State General Fund February 2015
– 31 –
A word or two concerning public finance in this area may be useful. At statehood, public schools, universities,
higher education institutions, a reformatory, an insane asylum, Rio Grande improvements, the blind school
and the deaf school were granted federal lands. The State Land Commissioner has and will administer this land
on behalf of the beneficiaries. In addition to current income from grazing fees and the like, bonus payments,
business leases there is the interest income from the Land Grant Permanent Fund. Fines and forfeitures also
are allocated to the Co o “ hool Fu d. I the ea l ’s, p ope t ta es a d i o e f o the la d g a ts were not sufficient to keep the schools operating. By 1936, after a series of missteps18, the State enacted an
emergency school tax odeled afte Mississippi’s sales tax.19 The sales tax had been modeled after gen-
eral excise taxes that had been used in Europe since the middle ages. The proceeds of the new emergency
school tax kept the schools open. By 1958, the entire state level of school support was rolled into the general
fund. Yes, the State land office continued to generate income for the schools and other institutions, but more
support was needed. The emergency school tax (imposed at the time on both oil and gas production, hard
mineral production, construction and all other goods and services) became a general fund source and no long-
er earmarked for education. In the late 1960s, the emergency school tax on goods and services became the
g oss e eipts a d o pe sati g ta a t. B , Big Ma got the state out of property tax for operating
osts a d assig ed the state’s po tio of the ill o stitutio al li it o p ope t ta es fo ope ati g to the counties, cities and school districts – 11.85 mills for the Counties, 7.65 mills for the municipalities and .5 mills
for the schools. In addition, the State, the Counties, the municipalities, the schools and a number of special
districts could impose debt with approval of the voters. Throughout these successive changes in the nature of
public school financing, the State land office continued to manage state lands on behalf of the beneficiaries
and distribute income and interest to the schools and other Constitutional institutions. However, in 2013, the
SEG totaled $2,267 billion, while SLO income and LGPF interest plus fines and forfeitures and federal mineral
leasing totaled was $951 million, or 42 percent of need.
18
Ne Mexico’s Sales Taxation of Ser ices – A Plausible Ontogeny. New Mexico Taxation and Revenue Department, (1996) tells the
story of how New Mexico expanded the new sales tax idea to taxing services and construction, as well as goods. Often, when asked
how other states could add services to their sales tax bases, the author answers – go back and ask for a do-over in the 1930s. 19
http://bobmannblog.com/2013/04/15/a-thrilling-mississippi-sales-tax-saga/ provides a lively account of the factors leading up to
Mississippi’s fo a i to eg essi e sales taxation.
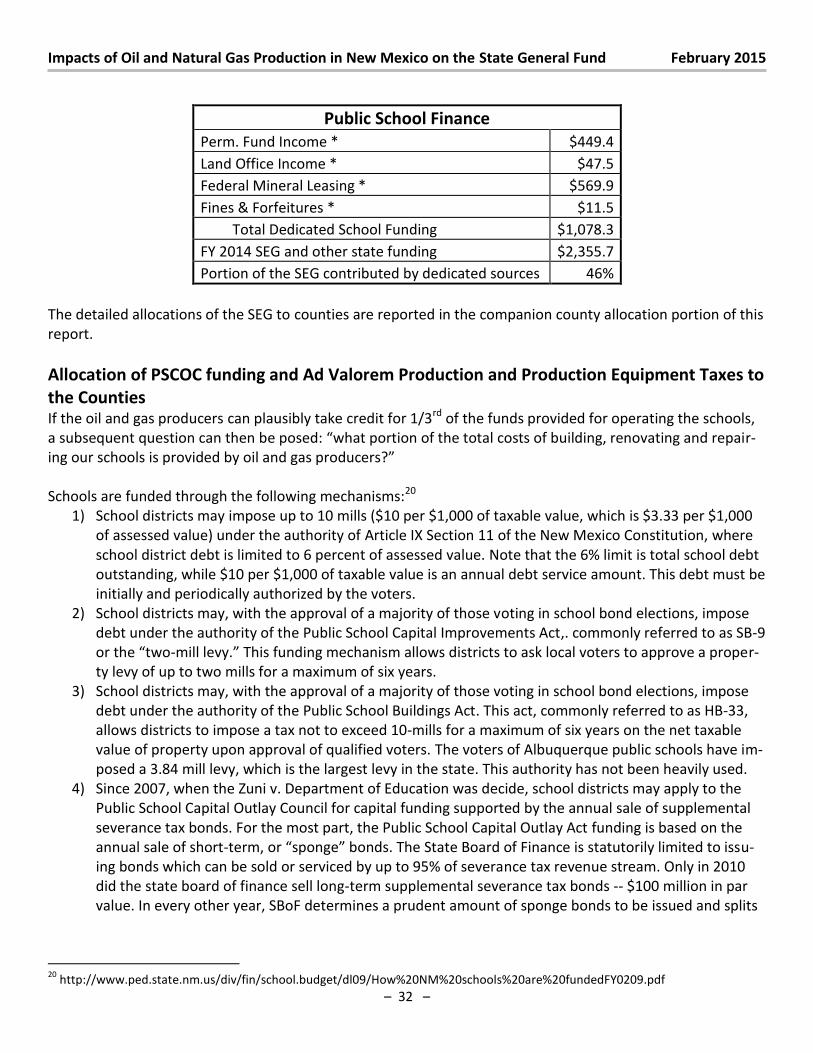
Impacts of Oil and Natural Gas Production in New Mexico on the State General Fund February 2015
– 32 –
Public School Finance
Perm. Fund Income * $449.4
Land Office Income * $47.5
Federal Mineral Leasing * $569.9
Fines & Forfeitures * $11.5
Total Dedicated School Funding $1,078.3
FY 2014 SEG and other state funding $2,355.7
Portion of the SEG contributed by dedicated sources 46%
The detailed allocations of the SEG to counties are reported in the companion county allocation portion of this
report.
Allocation of PSCOC funding and Ad Valorem Production and Production Equipment Taxes to
the Counties If the oil and gas producers can plausibly take credit for 1/3rd of the funds provided for operating the schools,
a subsequent question can then be posed: hat po tio of the total osts of uildi g, e o ati g a d epair-
i g ou s hools is p o ided oil a d gas p odu e s?
Schools are funded through the following mechanisms:20
1) School districts may impose up to 10 mills ($10 per $1,000 of taxable value, which is $3.33 per $1,000
of assessed value) under the authority of Article IX Section 11 of the New Mexico Constitution, where
school district debt is limited to 6 percent of assessed value. Note that the 6% limit is total school debt
outstanding, while $10 per $1,000 of taxable value is an annual debt service amount. This debt must be
initially and periodically authorized by the voters.
2) School districts may, with the approval of a majority of those voting in school bond elections, impose
debt under the authority of the Public School Capital Improvements Act,. commonly referred to as SB-9
o the t o-mill levy. This funding mechanism allows districts to ask local voters to approve a proper-
ty levy of up to two mills for a maximum of six years.
3) School districts may, with the approval of a majority of those voting in school bond elections, impose
debt under the authority of the Public School Buildings Act. This act, commonly referred to as HB-33,
allows districts to impose a tax not to exceed 10-mills for a maximum of six years on the net taxable
value of property upon approval of qualified voters. The voters of Albuquerque public schools have im-
posed a 3.84 mill levy, which is the largest levy in the state. This authority has not been heavily used.
4) Since 2007, when the Zuni v. Department of Education was decide, school districts may apply to the
Public School Capital Outlay Council for capital funding supported by the annual sale of supplemental
severance tax bonds. For the most part, the Public School Capital Outlay Act funding is based on the
annual sale of short-te , o spo ge o ds. The “tate Boa d of Fi a e is statuto il li ited to issu-
ing bonds which can be sold or serviced by up to 95% of severance tax revenue stream. Only in 2010
did the state board of finance sell long-term supplemental severance tax bonds -- $100 million in par
value. In every other year, SBoF determines a prudent amount of sponge bonds to be issued and splits
20
http://www.ped.state.nm.us/div/fin/school.budget/dl09/How%20NM%20schools%20are%20fundedFY0209.pdf
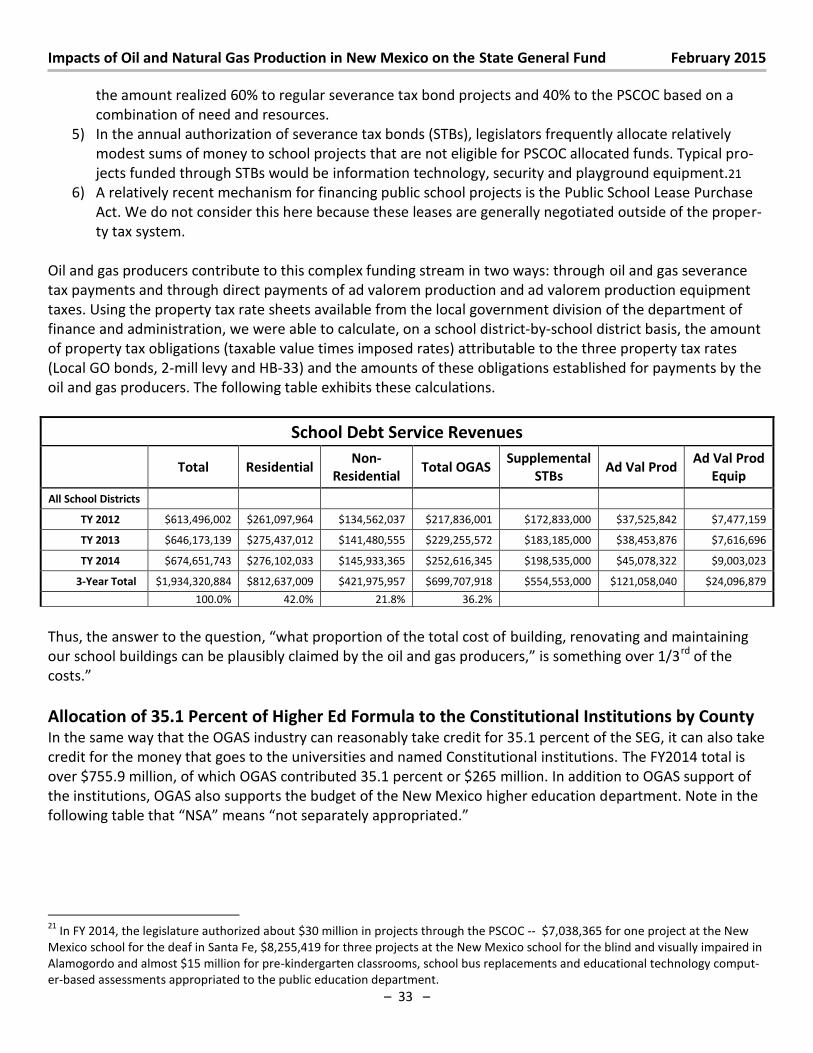
Impacts of Oil and Natural Gas Production in New Mexico on the State General Fund February 2015
– 33 –
the amount realized 60% to regular severance tax bond projects and 40% to the PSCOC based on a
combination of need and resources.
5) In the annual authorization of severance tax bonds (STBs), legislators frequently allocate relatively
modest sums of money to school projects that are not eligible for PSCOC allocated funds. Typical pro-
jects funded through STBs would be information technology, security and playground equipment.21
6) A relatively recent mechanism for financing public school projects is the Public School Lease Purchase
Act. We do not consider this here because these leases are generally negotiated outside of the proper-
ty tax system.
Oil and gas producers contribute to this complex funding stream in two ways: through oil and gas severance
tax payments and through direct payments of ad valorem production and ad valorem production equipment
taxes. Using the property tax rate sheets available from the local government division of the department of
finance and administration, we were able to calculate, on a school district-by-school district basis, the amount
of property tax obligations (taxable value times imposed rates) attributable to the three property tax rates
(Local GO bonds, 2-mill levy and HB-33) and the amounts of these obligations established for payments by the
oil and gas producers. The following table exhibits these calculations.
School Debt Service Revenues
Total Residential
Non-
Residential Total OGAS
Supplemental
STBs Ad Val Prod
Ad Val Prod
Equip
All School Districts
TY 2012 $613,496,002 $261,097,964 $134,562,037 $217,836,001 $172,833,000 $37,525,842 $7,477,159
TY 2013 $646,173,139 $275,437,012 $141,480,555 $229,255,572 $183,185,000 $38,453,876 $7,616,696
TY 2014 $674,651,743 $276,102,033 $145,933,365 $252,616,345 $198,535,000 $45,078,322 $9,003,023
3-Year Total $1,934,320,884 $812,637,009 $421,975,957 $699,707,918 $554,553,000 $121,058,040 $24,096,879
100.0% 42.0% 21.8% 36.2%
Thus, the a s e to the uestio , hat p opo tio of the total ost of building, renovating and maintaining
ou s hool uildi gs a e plausi l lai ed the oil a d gas p odu e s, is so ethi g o e / rd of the
osts.
Allocation of 35.1 Percent of Higher Ed Formula to the Constitutional Institutions by County In the same way that the OGAS industry can reasonably take credit for 35.1 percent of the SEG, it can also take
credit for the money that goes to the universities and named Constitutional institutions. The FY2014 total is
over $755.9 million, of which OGAS contributed 35.1 percent or $265 million. In addition to OGAS support of
the institutions, OGAS also supports the budget of the New Mexico higher education department. Note in the
follo i g ta le that N“A ea s ot sepa atel app op iated.
21
In FY 2014, the legislature authorized about $30 million in projects through the PSCOC -- $7,038,365 for one project at the New
Mexico school for the deaf in Santa Fe, $8,255,419 for three projects at the New Mexico school for the blind and visually impaired in
Alamogordo and almost $15 million for pre-kindergarten classrooms, school bus replacements and educational technology comput-
er-based assessments appropriated to the public education department.
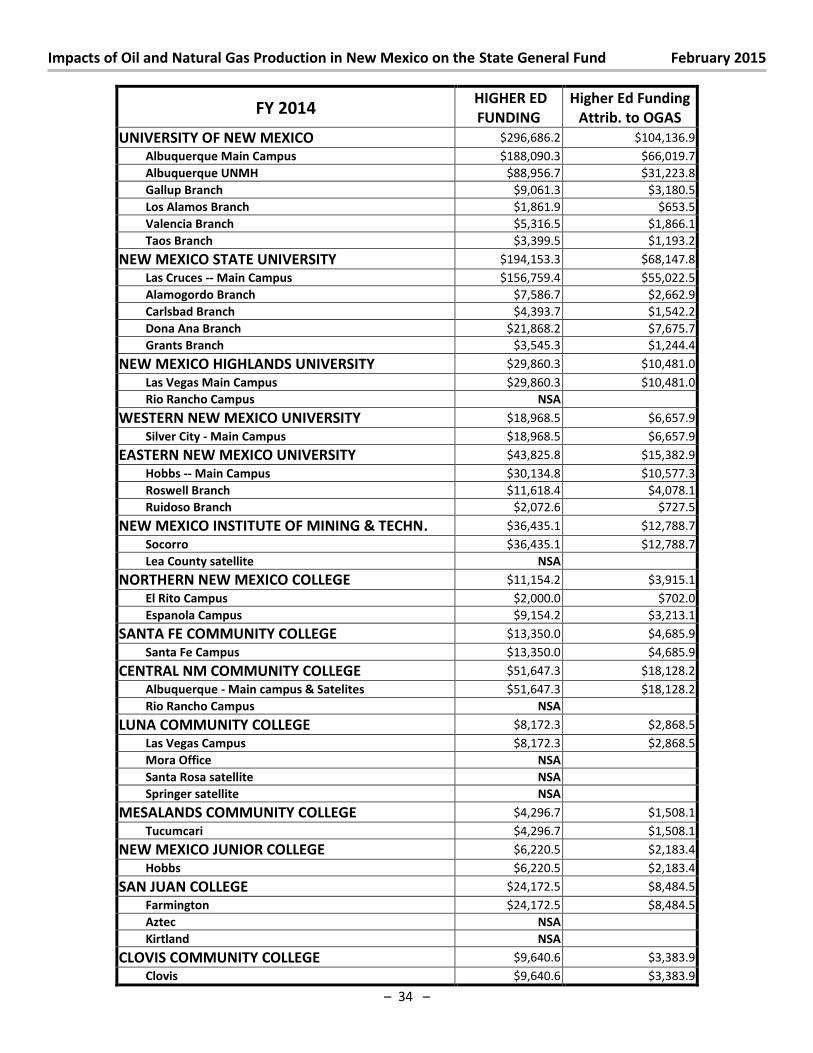
Impacts of Oil and Natural Gas Production in New Mexico on the State General Fund February 2015
– 34 –
FY 2014 HIGHER ED
FUNDING
Higher Ed Funding
Attrib. to OGAS
UNIVERSITY OF NEW MEXICO $296,686.2 $104,136.9
Albuquerque Main Campus $188,090.3 $66,019.7
Albuquerque UNMH $88,956.7 $31,223.8
Gallup Branch $9,061.3 $3,180.5
Los Alamos Branch $1,861.9 $653.5
Valencia Branch $5,316.5 $1,866.1
Taos Branch $3,399.5 $1,193.2
NEW MEXICO STATE UNIVERSITY $194,153.3 $68,147.8
Las Cruces -- Main Campus $156,759.4 $55,022.5
Alamogordo Branch $7,586.7 $2,662.9
Carlsbad Branch $4,393.7 $1,542.2
Dona Ana Branch $21,868.2 $7,675.7
Grants Branch $3,545.3 $1,244.4
NEW MEXICO HIGHLANDS UNIVERSITY $29,860.3 $10,481.0
Las Vegas Main Campus $29,860.3 $10,481.0
Rio Rancho Campus NSA
WESTERN NEW MEXICO UNIVERSITY $18,968.5 $6,657.9
Silver City - Main Campus $18,968.5 $6,657.9
EASTERN NEW MEXICO UNIVERSITY $43,825.8 $15,382.9
Hobbs -- Main Campus $30,134.8 $10,577.3
Roswell Branch $11,618.4 $4,078.1
Ruidoso Branch $2,072.6 $727.5
NEW MEXICO INSTITUTE OF MINING & TECHN. $36,435.1 $12,788.7
Socorro $36,435.1 $12,788.7
Lea County satellite NSA
NORTHERN NEW MEXICO COLLEGE $11,154.2 $3,915.1
El Rito Campus $2,000.0 $702.0
Espanola Campus $9,154.2 $3,213.1
SANTA FE COMMUNITY COLLEGE $13,350.0 $4,685.9
Santa Fe Campus $13,350.0 $4,685.9
CENTRAL NM COMMUNITY COLLEGE $51,647.3 $18,128.2
Albuquerque - Main campus & Satelites $51,647.3 $18,128.2
Rio Rancho Campus NSA
LUNA COMMUNITY COLLEGE $8,172.3 $2,868.5
Las Vegas Campus $8,172.3 $2,868.5
Mora Office NSA
Santa Rosa satellite NSA
Springer satellite NSA
MESALANDS COMMUNITY COLLEGE $4,296.7 $1,508.1
Tucumcari $4,296.7 $1,508.1
NEW MEXICO JUNIOR COLLEGE $6,220.5 $2,183.4
Hobbs $6,220.5 $2,183.4
SAN JUAN COLLEGE $24,172.5 $8,484.5
Farmington $24,172.5 $8,484.5
Aztec NSA
Kirtland NSA
CLOVIS COMMUNITY COLLEGE $9,640.6 $3,383.9
Clovis $9,640.6 $3,383.9
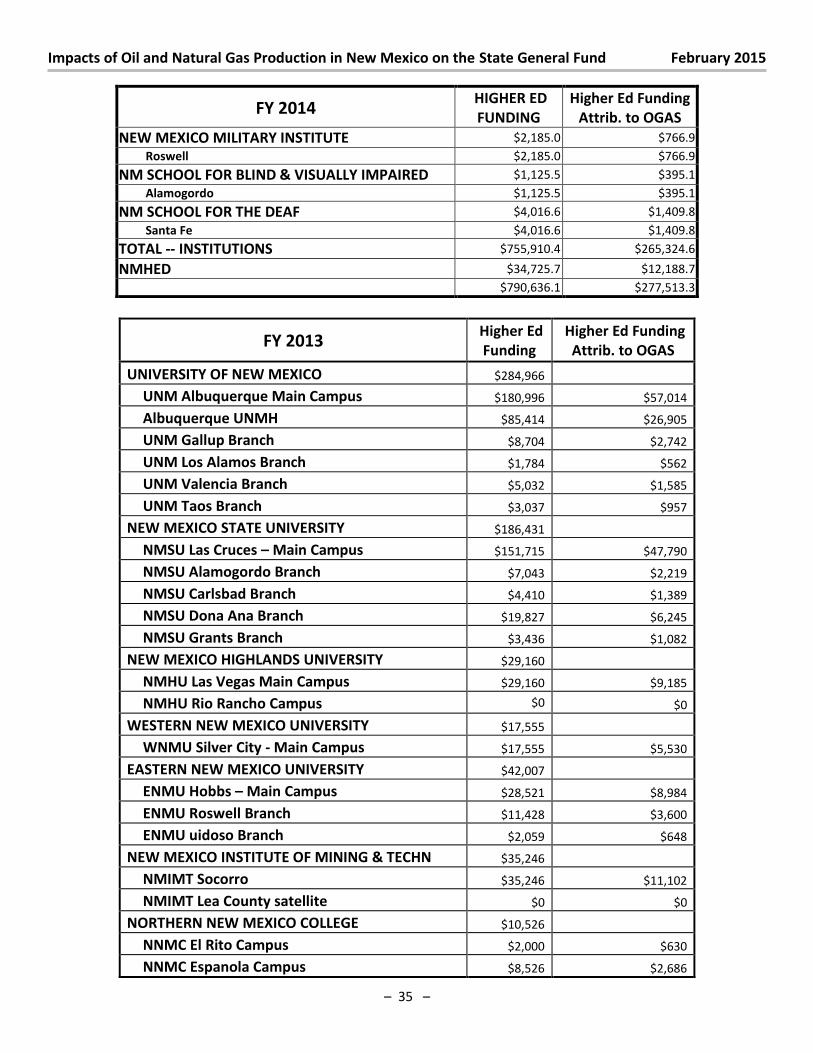
Impacts of Oil and Natural Gas Production in New Mexico on the State General Fund February 2015
– 35 –
FY 2014 HIGHER ED
FUNDING
Higher Ed Funding
Attrib. to OGAS
NEW MEXICO MILITARY INSTITUTE $2,185.0 $766.9
Roswell $2,185.0 $766.9
NM SCHOOL FOR BLIND & VISUALLY IMPAIRED $1,125.5 $395.1
Alamogordo $1,125.5 $395.1
NM SCHOOL FOR THE DEAF $4,016.6 $1,409.8
Santa Fe $4,016.6 $1,409.8
TOTAL -- INSTITUTIONS $755,910.4 $265,324.6
NMHED $34,725.7 $12,188.7
$790,636.1 $277,513.3
FY 2013 Higher Ed
Funding
Higher Ed Funding
Attrib. to OGAS
UNIVERSITY OF NEW MEXICO $284,966
UNM Albuquerque Main Campus $180,996 $57,014
Albuquerque UNMH $85,414 $26,905
UNM Gallup Branch $8,704 $2,742
UNM Los Alamos Branch $1,784 $562
UNM Valencia Branch $5,032 $1,585
UNM Taos Branch $3,037 $957
NEW MEXICO STATE UNIVERSITY $186,431
NMSU Las Cruces – Main Campus $151,715 $47,790
NMSU Alamogordo Branch $7,043 $2,219
NMSU Carlsbad Branch $4,410 $1,389
NMSU Dona Ana Branch $19,827 $6,245
NMSU Grants Branch $3,436 $1,082
NEW MEXICO HIGHLANDS UNIVERSITY $29,160
NMHU Las Vegas Main Campus $29,160 $9,185
NMHU Rio Rancho Campus $0 $0
WESTERN NEW MEXICO UNIVERSITY $17,555
WNMU Silver City - Main Campus $17,555 $5,530
EASTERN NEW MEXICO UNIVERSITY $42,007
ENMU Hobbs – Main Campus $28,521 $8,984
ENMU Roswell Branch $11,428 $3,600
ENMU uidoso Branch $2,059 $648
NEW MEXICO INSTITUTE OF MINING & TECHN $35,246
NMIMT Socorro $35,246 $11,102
NMIMT Lea County satellite $0 $0
NORTHERN NEW MEXICO COLLEGE $10,526
NNMC El Rito Campus $2,000 $630
NNMC Espanola Campus $8,526 $2,686
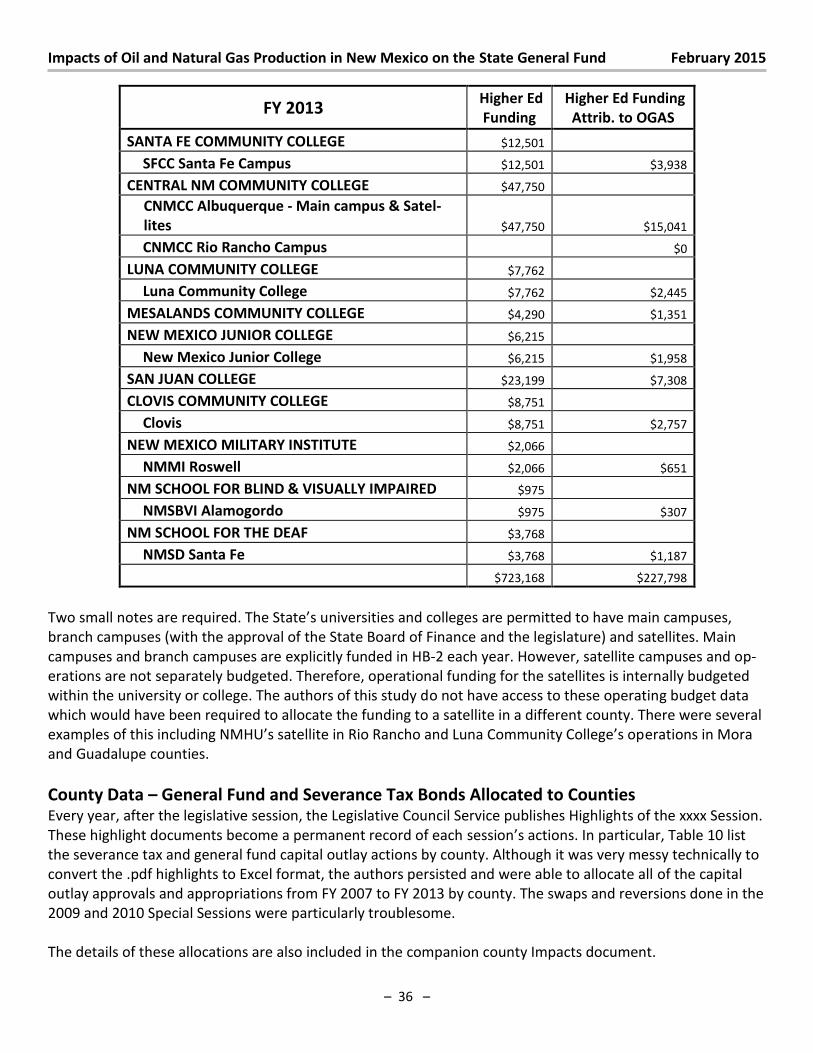
Impacts of Oil and Natural Gas Production in New Mexico on the State General Fund February 2015
– 36 –
FY 2013 Higher Ed
Funding
Higher Ed Funding
Attrib. to OGAS
SANTA FE COMMUNITY COLLEGE $12,501
SFCC Santa Fe Campus $12,501 $3,938
CENTRAL NM COMMUNITY COLLEGE $47,750
CNMCC Albuquerque - Main campus & Satel-
lites $47,750 $15,041
CNMCC Rio Rancho Campus
$0
LUNA COMMUNITY COLLEGE $7,762
Luna Community College $7,762 $2,445
MESALANDS COMMUNITY COLLEGE $4,290 $1,351
NEW MEXICO JUNIOR COLLEGE $6,215
New Mexico Junior College $6,215 $1,958
SAN JUAN COLLEGE $23,199 $7,308
CLOVIS COMMUNITY COLLEGE $8,751
Clovis $8,751 $2,757
NEW MEXICO MILITARY INSTITUTE $2,066
NMMI Roswell $2,066 $651
NM SCHOOL FOR BLIND & VISUALLY IMPAIRED $975
NMSBVI Alamogordo $975 $307
NM SCHOOL FOR THE DEAF $3,768
NMSD Santa Fe $3,768 $1,187
$723,168 $227,798
Two small notes a e e ui ed. The “tate’s universities and colleges are permitted to have main campuses,
branch campuses (with the approval of the State Board of Finance and the legislature) and satellites. Main
campuses and branch campuses are explicitly funded in HB-2 each year. However, satellite campuses and op-
erations are not separately budgeted. Therefore, operational funding for the satellites is internally budgeted
within the university or college. The authors of this study do not have access to these operating budget data
which would have been required to allocate the funding to a satellite in a different county. There were several
e a ples of this i ludi g NMHU’s satellite i Rio Ra ho a d Lu a Co u it College’s operations in Mora
and Guadalupe counties.
County Data – General Fund and Severance Tax Bonds Allocated to Counties Every year, after the legislative session, the Legislative Council Service publishes Highlights of the xxxx Session.
These highlight documents become a permanent record of each sessio ’s a tio s. I particular, Table 10 list
the severance tax and general fund capital outlay actions by county. Although it was very messy technically to
convert the .pdf highlights to Excel format, the authors persisted and were able to allocate all of the capital
outlay approvals and appropriations from FY 2007 to FY 2013 by county. The swaps and reversions done in the
2009 and 2010 Special Sessions were particularly troublesome.
The details of these allocations are also included in the companion county Impacts document.
Impacts of Oil and Natural Gas Production in New Mexico on the State General Fund February 2015
– 37 –
What this Study Accomplished? 1) Applied a consistent methodology and calculated the share of general fund attributable to OGAS taxes,
royalties, fees and indirect economic burdens for the period from FY 2007 to FY 2014.
2) Built a model quantifying the proportion of the LGPF interest attributable to OGAS with accuracy of .5
percent.
3) Built a model quantifying the proportion of the STPF interest attributable to OGAS with accuracy of 1
percent.
4) Included some of the economic burden of the gross receipts tax in the calculation of the share of the
general fund attributable to OGAS.
5) Included oil and gas withholding and direct PIT withholding on certain categories of wages and salaries
for inclusion in determining the proper portion of the general fund to attribute to OGAS.
6) Properly calculated the share of SLO revenues in the general fund attributable to OGAS bonus pay-
ments.
7) Extended the calculation of proportion of the general fund attributable to oil and natural gas produc-
tion (35.1 percent in this study) to allocate public school support to school districts and aggregating the
89 school districts impacts to counties.
8) Extended the calculation of proportion of the general fund attributable to oil and natural gas produc-
tion (35.1 percent in this study) to allocate higher education funding formula to the Constitutional uni-
versities institutions, as well as the community colleges.
9) Allocated capital outlay to the counties at an aggregate level, assuming 95 percent of the contributions
to the STBF are attributable to oil and gas production.
10) Provided a current data point on the importance of oil and gas production to non-OGAS producing
counties through the public school funding formula and the annual capital outlay (severance tax bond
fund) appropriations.
11) Assembled and organized a great deal of old, even antique data, and rendered this data into organized
databases.
What investigations remain for Phases Three and Four? 1) Reconcile the LGPF disclosure documents with ONGARD data.
2) Reconcile the SLO annual reports with other data sources.
3) Improve the STPF interest model by determining the percentage of contributions to the STBF that were
used for bond payments and the percentage transferred to the STPF in the period before disclosure
statements were filed.
4) Work with TRD and DFA to extract net PIT liability when returns show credits from oil and gas with-
holding. In addition, determine if there are any data that would allow calculation of net PIT from em-
ployees of companies within the industry. Finally, is it possible to allocate oil and gas withholding and
PIT withholding to counties?
5) Work with TRD to refine the true total of compensating tax, corporate Income tax, gross receipts tax
and personal income tax withholding to account for the fact that some members of the industry – par-
ticularly in support services do not report using the proper, attributable NAICS code.
6) Work with TRD to allocate PIT withholding and final liability of OGAS employees to Counties.
7) Unravel the mystery of too much money for oil and gas withholding, or at least confirm the speculation
that the bulk of oil and gas withholding is attributed to payments to investors and not to royalties. De-
termine if the entire amount of withholding show up as liabilities.
Impacts of Oil and Natural Gas Production in New Mexico on the State General Fund February 2015
– 38 –
8) Properly calculate the FML royalty share, including bonus payments, to attribute these federal revenue
shares to OGAS. Determine the non-OGAS royalty payments to close the loop.
9) Consider investigating the gross receipts taxable procurement of the industry through survey under
NMOGA’s auspices. This would provide direct evidence, supplemented by IMPLAN and RIMS II coeffi-
cients, of the amount of economic burden borne by the industry in addition to the burden of gross re-
ceipts tax on oil and gas extraction, oil and gas drilling and oil and gas support services.
10) If such a survey were to be implemented (on a statistically valid sampling basis), we would also like to
survey motor vehicle excise tax amounts, corporate income tax payments and liabilities and details of
the amounts of oil and gas withholding payments remitted.
11) Include Tribal infrastructure grants and projects in the capital outlay by county tables. Consider sepa-
rate tables for Jicarilla and Navajo nations.
12) Add to the county allocations amounts awarded by the public school capital outlay council.
13) Reconcile sales month detail and distribution month summaries with the ONGARD revenue report and
determine why the data are not exactly congruent. Is this because some of the gas plant products are
reported in different counties than the county in which the gas was extracted?
14) Build multi-year tables, similar to Appendix C, detailing all payments and economic burdens incurred
by the industry to all local, tribal, state and federal governments.
15) Complete updating the History of Mineral Taxes document enclosed her as Appendix F.
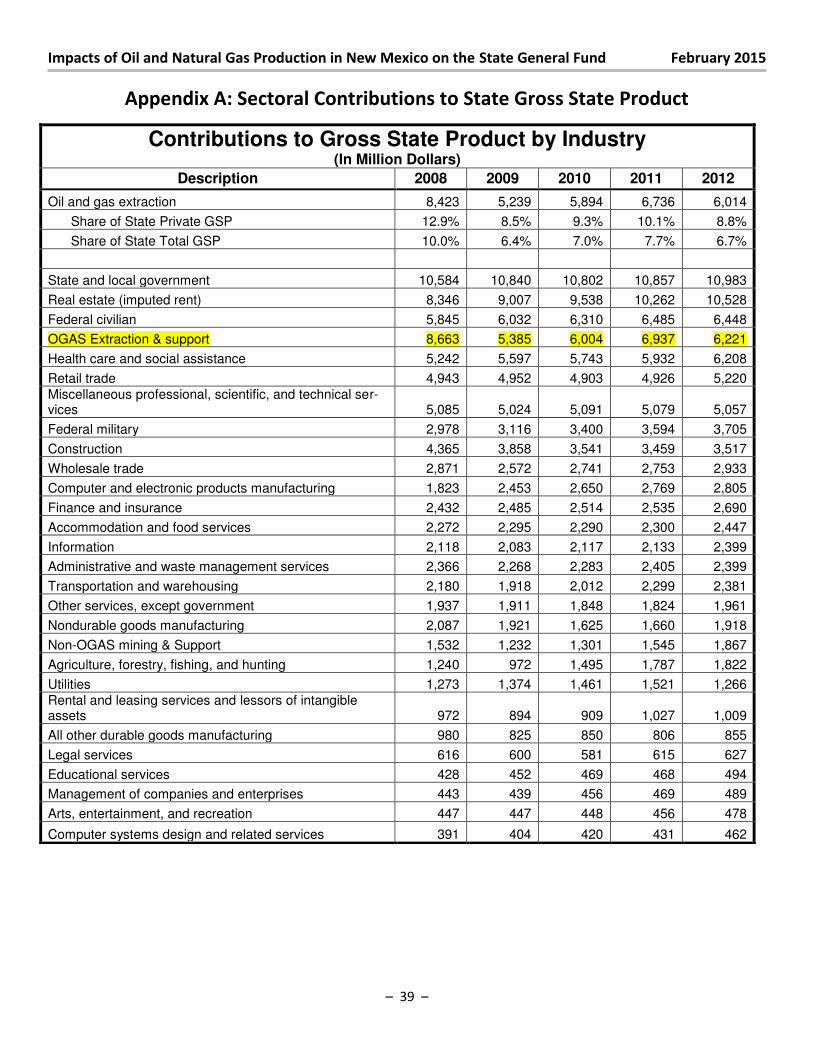
Impacts of Oil and Natural Gas Production in New Mexico on the State General Fund February 2015
– 39 –
Appendix A: Sectoral Contributions to State Gross State Product
Contributions to Gross State Product by Industry (In Million Dollars)
Description 2008 2009 2010 2011 2012
Oil and gas extraction 8,423 5,239 5,894 6,736 6,014
Share of State Private GSP 12.9% 8.5% 9.3% 10.1% 8.8%
Share of State Total GSP 10.0% 6.4% 7.0% 7.7% 6.7%
State and local government 10,584 10,840 10,802 10,857 10,983
Real estate (imputed rent) 8,346 9,007 9,538 10,262 10,528
Federal civilian 5,845 6,032 6,310 6,485 6,448
OGAS Extraction & support 8,663 5,385 6,004 6,937 6,221
Health care and social assistance 5,242 5,597 5,743 5,932 6,208
Retail trade 4,943 4,952 4,903 4,926 5,220 Miscellaneous professional, scientific, and technical ser-vices 5,085 5,024 5,091 5,079 5,057
Federal military 2,978 3,116 3,400 3,594 3,705
Construction 4,365 3,858 3,541 3,459 3,517
Wholesale trade 2,871 2,572 2,741 2,753 2,933
Computer and electronic products manufacturing 1,823 2,453 2,650 2,769 2,805
Finance and insurance 2,432 2,485 2,514 2,535 2,690
Accommodation and food services 2,272 2,295 2,290 2,300 2,447
Information 2,118 2,083 2,117 2,133 2,399
Administrative and waste management services 2,366 2,268 2,283 2,405 2,399
Transportation and warehousing 2,180 1,918 2,012 2,299 2,381
Other services, except government 1,937 1,911 1,848 1,824 1,961
Nondurable goods manufacturing 2,087 1,921 1,625 1,660 1,918
Non-OGAS mining & Support 1,532 1,232 1,301 1,545 1,867
Agriculture, forestry, fishing, and hunting 1,240 972 1,495 1,787 1,822
Utilities 1,273 1,374 1,461 1,521 1,266 Rental and leasing services and lessors of intangible assets 972 894 909 1,027 1,009
All other durable goods manufacturing 980 825 850 806 855
Legal services 616 600 581 615 627
Educational services 428 452 469 468 494
Management of companies and enterprises 443 439 456 469 489
Arts, entertainment, and recreation 447 447 448 456 478
Computer systems design and related services 391 404 420 431 462
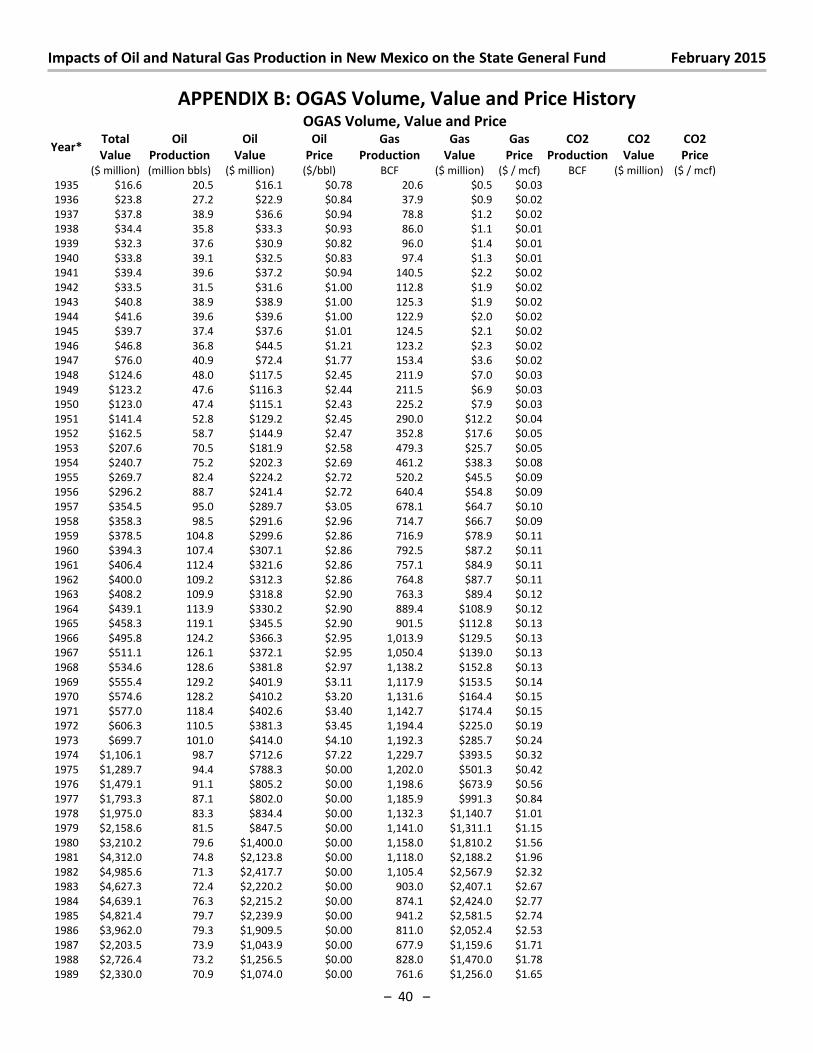
Impacts of Oil and Natural Gas Production in New Mexico on the State General Fund February 2015
– 40 –
APPENDIX B: OGAS Volume, Value and Price History
OGAS Volume, Value and Price
Year* Total
Value
Oil
Production
Oil
Value
Oil
Price
Gas
Production
Gas
Value
Gas
Price
CO2
Production
CO2
Value
CO2
Price
($ million) (million bbls) ($ million) ($/bbl) BCF ($ million) ($ / mcf) BCF ($ million) ($ / mcf)
1935 $16.6 20.5 $16.1 $0.78 20.6 $0.5 $0.03
1936 $23.8 27.2 $22.9 $0.84 37.9 $0.9 $0.02
1937 $37.8 38.9 $36.6 $0.94 78.8 $1.2 $0.02
1938 $34.4 35.8 $33.3 $0.93 86.0 $1.1 $0.01
1939 $32.3 37.6 $30.9 $0.82 96.0 $1.4 $0.01
1940 $33.8 39.1 $32.5 $0.83 97.4 $1.3 $0.01
1941 $39.4 39.6 $37.2 $0.94 140.5 $2.2 $0.02
1942 $33.5 31.5 $31.6 $1.00 112.8 $1.9 $0.02
1943 $40.8 38.9 $38.9 $1.00 125.3 $1.9 $0.02
1944 $41.6 39.6 $39.6 $1.00 122.9 $2.0 $0.02
1945 $39.7 37.4 $37.6 $1.01 124.5 $2.1 $0.02
1946 $46.8 36.8 $44.5 $1.21 123.2 $2.3 $0.02
1947 $76.0 40.9 $72.4 $1.77 153.4 $3.6 $0.02
1948 $124.6 48.0 $117.5 $2.45 211.9 $7.0 $0.03
1949 $123.2 47.6 $116.3 $2.44 211.5 $6.9 $0.03
1950 $123.0 47.4 $115.1 $2.43 225.2 $7.9 $0.03
1951 $141.4 52.8 $129.2 $2.45 290.0 $12.2 $0.04
1952 $162.5 58.7 $144.9 $2.47 352.8 $17.6 $0.05
1953 $207.6 70.5 $181.9 $2.58 479.3 $25.7 $0.05
1954 $240.7 75.2 $202.3 $2.69 461.2 $38.3 $0.08
1955 $269.7 82.4 $224.2 $2.72 520.2 $45.5 $0.09
1956 $296.2 88.7 $241.4 $2.72 640.4 $54.8 $0.09
1957 $354.5 95.0 $289.7 $3.05 678.1 $64.7 $0.10
1958 $358.3 98.5 $291.6 $2.96 714.7 $66.7 $0.09
1959 $378.5 104.8 $299.6 $2.86 716.9 $78.9 $0.11
1960 $394.3 107.4 $307.1 $2.86 792.5 $87.2 $0.11
1961 $406.4 112.4 $321.6 $2.86 757.1 $84.9 $0.11
1962 $400.0 109.2 $312.3 $2.86 764.8 $87.7 $0.11
1963 $408.2 109.9 $318.8 $2.90 763.3 $89.4 $0.12
1964 $439.1 113.9 $330.2 $2.90 889.4 $108.9 $0.12
1965 $458.3 119.1 $345.5 $2.90 901.5 $112.8 $0.13
1966 $495.8 124.2 $366.3 $2.95 1,013.9 $129.5 $0.13
1967 $511.1 126.1 $372.1 $2.95 1,050.4 $139.0 $0.13
1968 $534.6 128.6 $381.8 $2.97 1,138.2 $152.8 $0.13
1969 $555.4 129.2 $401.9 $3.11 1,117.9 $153.5 $0.14
1970 $574.6 128.2 $410.2 $3.20 1,131.6 $164.4 $0.15
1971 $577.0 118.4 $402.6 $3.40 1,142.7 $174.4 $0.15
1972 $606.3 110.5 $381.3 $3.45 1,194.4 $225.0 $0.19
1973 $699.7 101.0 $414.0 $4.10 1,192.3 $285.7 $0.24
1974 $1,106.1 98.7 $712.6 $7.22 1,229.7 $393.5 $0.32
1975 $1,289.7 94.4 $788.3 $0.00 1,202.0 $501.3 $0.42
1976 $1,479.1 91.1 $805.2 $0.00 1,198.6 $673.9 $0.56
1977 $1,793.3 87.1 $802.0 $0.00 1,185.9 $991.3 $0.84
1978 $1,975.0 83.3 $834.4 $0.00 1,132.3 $1,140.7 $1.01
1979 $2,158.6 81.5 $847.5 $0.00 1,141.0 $1,311.1 $1.15
1980 $3,210.2 79.6 $1,400.0 $0.00 1,158.0 $1,810.2 $1.56
1981 $4,312.0 74.8 $2,123.8 $0.00 1,118.0 $2,188.2 $1.96
1982 $4,985.6 71.3 $2,417.7 $0.00 1,105.4 $2,567.9 $2.32
1983 $4,627.3 72.4 $2,220.2 $0.00 903.0 $2,407.1 $2.67
1984 $4,639.1 76.3 $2,215.2 $0.00 874.1 $2,424.0 $2.77
1985 $4,821.4 79.7 $2,239.9 $0.00 941.2 $2,581.5 $2.74
1986 $3,962.0 79.3 $1,909.5 $0.00 811.0 $2,052.4 $2.53
1987 $2,203.5 73.9 $1,043.9 $0.00 677.9 $1,159.6 $1.71
1988 $2,726.4 73.2 $1,256.5 $0.00 828.0 $1,470.0 $1.78
1989 $2,330.0 70.9 $1,074.0 $0.00 761.6 $1,256.0 $1.65
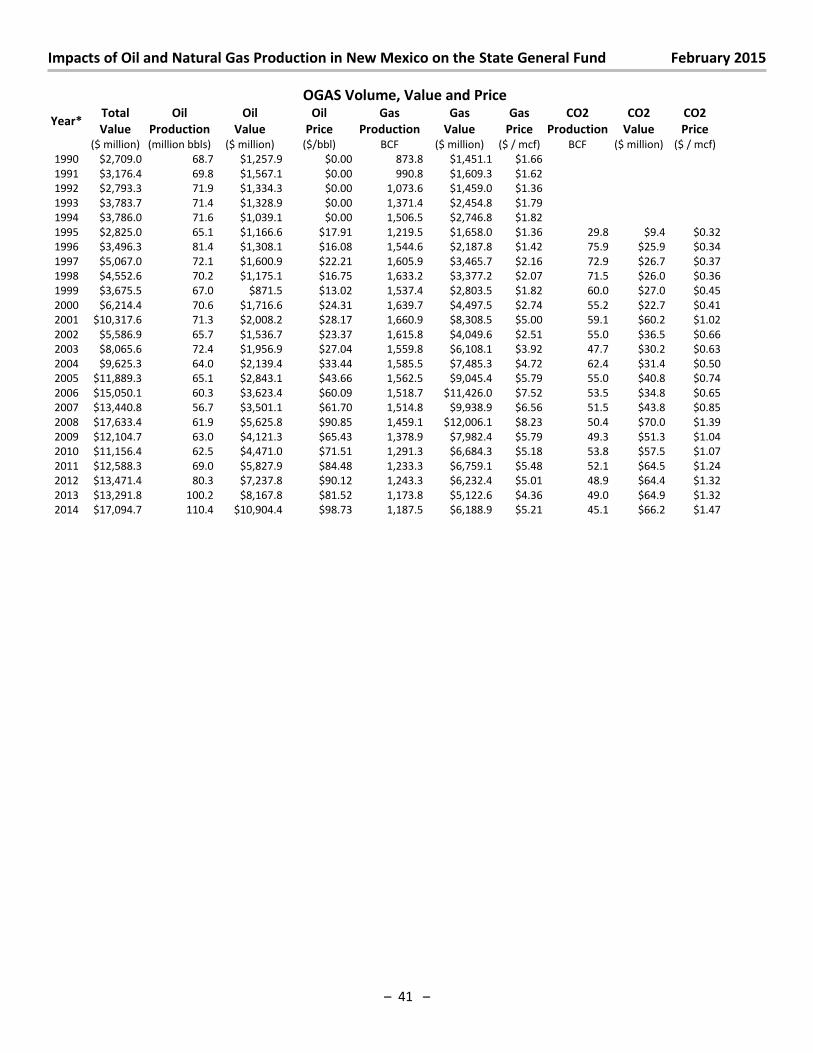
Impacts of Oil and Natural Gas Production in New Mexico on the State General Fund February 2015
– 41 –
OGAS Volume, Value and Price
Year* Total
Value
Oil
Production
Oil
Value
Oil
Price
Gas
Production
Gas
Value
Gas
Price
CO2
Production
CO2
Value
CO2
Price
($ million) (million bbls) ($ million) ($/bbl) BCF ($ million) ($ / mcf) BCF ($ million) ($ / mcf)
1990 $2,709.0 68.7 $1,257.9 $0.00 873.8 $1,451.1 $1.66
1991 $3,176.4 69.8 $1,567.1 $0.00 990.8 $1,609.3 $1.62
1992 $2,793.3 71.9 $1,334.3 $0.00 1,073.6 $1,459.0 $1.36
1993 $3,783.7 71.4 $1,328.9 $0.00 1,371.4 $2,454.8 $1.79
1994 $3,786.0 71.6 $1,039.1 $0.00 1,506.5 $2,746.8 $1.82
1995 $2,825.0 65.1 $1,166.6 $17.91 1,219.5 $1,658.0 $1.36 29.8 $9.4 $0.32
1996 $3,496.3 81.4 $1,308.1 $16.08 1,544.6 $2,187.8 $1.42 75.9 $25.9 $0.34
1997 $5,067.0 72.1 $1,600.9 $22.21 1,605.9 $3,465.7 $2.16 72.9 $26.7 $0.37
1998 $4,552.6 70.2 $1,175.1 $16.75 1,633.2 $3,377.2 $2.07 71.5 $26.0 $0.36
1999 $3,675.5 67.0 $871.5 $13.02 1,537.4 $2,803.5 $1.82 60.0 $27.0 $0.45
2000 $6,214.4 70.6 $1,716.6 $24.31 1,639.7 $4,497.5 $2.74 55.2 $22.7 $0.41
2001 $10,317.6 71.3 $2,008.2 $28.17 1,660.9 $8,308.5 $5.00 59.1 $60.2 $1.02
2002 $5,586.9 65.7 $1,536.7 $23.37 1,615.8 $4,049.6 $2.51 55.0 $36.5 $0.66
2003 $8,065.6 72.4 $1,956.9 $27.04 1,559.8 $6,108.1 $3.92 47.7 $30.2 $0.63
2004 $9,625.3 64.0 $2,139.4 $33.44 1,585.5 $7,485.3 $4.72 62.4 $31.4 $0.50
2005 $11,889.3 65.1 $2,843.1 $43.66 1,562.5 $9,045.4 $5.79 55.0 $40.8 $0.74
2006 $15,050.1 60.3 $3,623.4 $60.09 1,518.7 $11,426.0 $7.52 53.5 $34.8 $0.65
2007 $13,440.8 56.7 $3,501.1 $61.70 1,514.8 $9,938.9 $6.56 51.5 $43.8 $0.85
2008 $17,633.4 61.9 $5,625.8 $90.85 1,459.1 $12,006.1 $8.23 50.4 $70.0 $1.39
2009 $12,104.7 63.0 $4,121.3 $65.43 1,378.9 $7,982.4 $5.79 49.3 $51.3 $1.04
2010 $11,156.4 62.5 $4,471.0 $71.51 1,291.3 $6,684.3 $5.18 53.8 $57.5 $1.07
2011 $12,588.3 69.0 $5,827.9 $84.48 1,233.3 $6,759.1 $5.48 52.1 $64.5 $1.24
2012 $13,471.4 80.3 $7,237.8 $90.12 1,243.3 $6,232.4 $5.01 48.9 $64.4 $1.32
2013 $13,291.8 100.2 $8,167.8 $81.52 1,173.8 $5,122.6 $4.36 49.0 $64.9 $1.32
2014 $17,094.7 110.4 $10,904.4 $98.73 1,187.5 $6,188.9 $5.21 45.1 $66.2 $1.47
Impacts of Oil and Natural Gas Production in New Mexico on the State General Fund February 2015
– 42 –
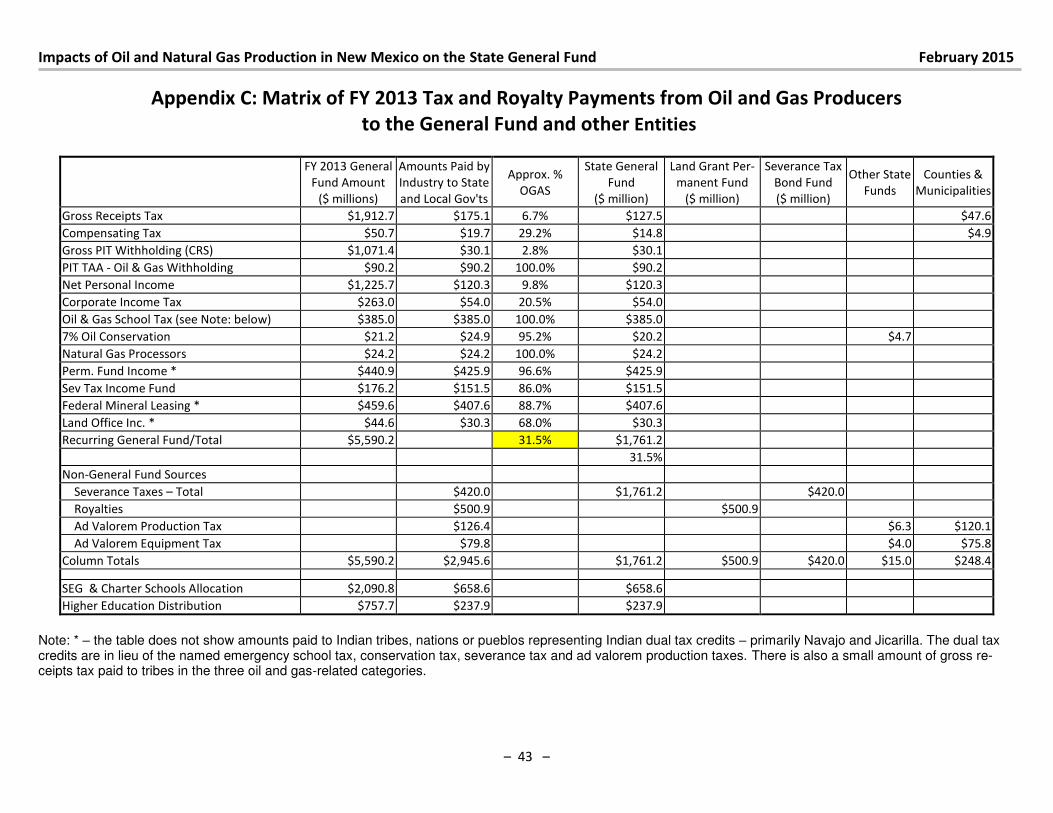
Impacts of Oil and Natural Gas Production in New Mexico on the State General Fund February 2015
– 43 –
Appendix C: Matrix of FY 2013 Tax and Royalty Payments from Oil and Gas Producers
to the General Fund and other Entities
FY 2013 General
Fund Amount
($ millions)
Amounts Paid by
Industry to State
and Local Gov'ts
Approx. %
OGAS
State General
Fund
($ million)
Land Grant Per-
manent Fund
($ million)
Severance Tax
Bond Fund
($ million)
Other State
Funds
Counties &
Municipalities
Gross Receipts Tax $1,912.7 $175.1 6.7% $127.5
$47.6
Compensating Tax $50.7 $19.7 29.2% $14.8
$4.9
Gross PIT Withholding (CRS) $1,071.4 $30.1 2.8% $30.1
PIT TAA - Oil & Gas Withholding $90.2 $90.2 100.0% $90.2
Net Personal Income $1,225.7 $120.3 9.8% $120.3
Corporate Income Tax $263.0 $54.0 20.5% $54.0
Oil & Gas School Tax (see Note: below) $385.0 $385.0 100.0% $385.0
7% Oil Conservation $21.2 $24.9 95.2% $20.2
$4.7
Natural Gas Processors $24.2 $24.2 100.0% $24.2
Perm. Fund Income * $440.9 $425.9 96.6% $425.9
Sev Tax Income Fund $176.2 $151.5 86.0% $151.5
Federal Mineral Leasing * $459.6 $407.6 88.7% $407.6
Land Office Inc. * $44.6 $30.3 68.0% $30.3
Recurring General Fund/Total $5,590.2
31.5% $1,761.2
31.5%
Non-General Fund Sources
Severance Taxes – Total
$420.0
$1,761.2
$420.0
Royalties
$500.9
$500.9
Ad Valorem Production Tax
$126.4
$6.3 $120.1
Ad Valorem Equipment Tax
$79.8
$4.0 $75.8
Column Totals $5,590.2 $2,945.6
$1,761.2 $500.9 $420.0 $15.0 $248.4
SEG & Charter Schools Allocation $2,090.8 $658.6
$658.6
Higher Education Distribution $757.7 $237.9
$237.9
Note: * – the table does not show amounts paid to Indian tribes, nations or pueblos representing Indian dual tax credits – primarily Navajo and Jicarilla. The dual tax credits are in lieu of the named emergency school tax, conservation tax, severance tax and ad valorem production taxes. There is also a small amount of gross re-ceipts tax paid to tribes in the three oil and gas-related categories.
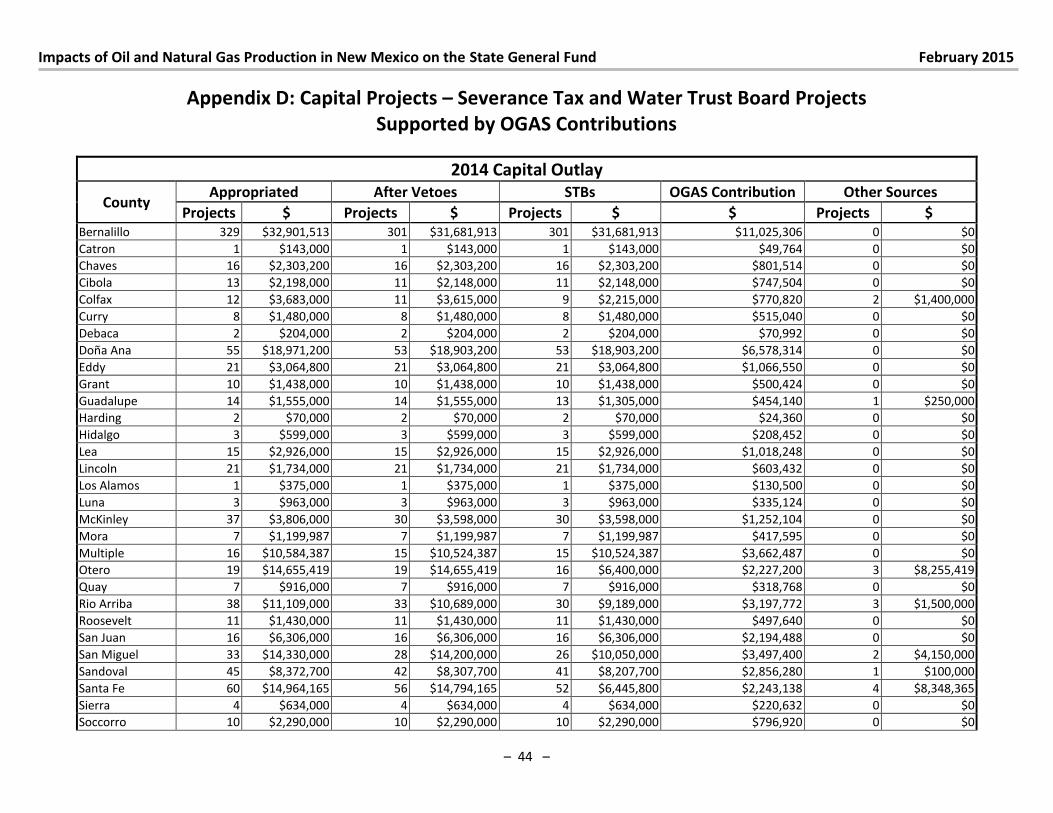
Impacts of Oil and Natural Gas Production in New Mexico on the State General Fund February 2015
– 44 –
Appendix D: Capital Projects – Severance Tax and Water Trust Board Projects
Supported by OGAS Contributions
2014 Capital Outlay
County Appropriated After Vetoes STBs OGAS Contribution Other Sources
Projects $ Projects $ Projects $ $ Projects $ Bernalillo 329 $32,901,513 301 $31,681,913 301 $31,681,913 $11,025,306 0 $0
Catron 1 $143,000 1 $143,000 1 $143,000 $49,764 0 $0
Chaves 16 $2,303,200 16 $2,303,200 16 $2,303,200 $801,514 0 $0
Cibola 13 $2,198,000 11 $2,148,000 11 $2,148,000 $747,504 0 $0
Colfax 12 $3,683,000 11 $3,615,000 9 $2,215,000 $770,820 2 $1,400,000
Curry 8 $1,480,000 8 $1,480,000 8 $1,480,000 $515,040 0 $0
Debaca 2 $204,000 2 $204,000 2 $204,000 $70,992 0 $0
Doña Ana 55 $18,971,200 53 $18,903,200 53 $18,903,200 $6,578,314 0 $0
Eddy 21 $3,064,800 21 $3,064,800 21 $3,064,800 $1,066,550 0 $0
Grant 10 $1,438,000 10 $1,438,000 10 $1,438,000 $500,424 0 $0
Guadalupe 14 $1,555,000 14 $1,555,000 13 $1,305,000 $454,140 1 $250,000
Harding 2 $70,000 2 $70,000 2 $70,000 $24,360 0 $0
Hidalgo 3 $599,000 3 $599,000 3 $599,000 $208,452 0 $0
Lea 15 $2,926,000 15 $2,926,000 15 $2,926,000 $1,018,248 0 $0
Lincoln 21 $1,734,000 21 $1,734,000 21 $1,734,000 $603,432 0 $0
Los Alamos 1 $375,000 1 $375,000 1 $375,000 $130,500 0 $0
Luna 3 $963,000 3 $963,000 3 $963,000 $335,124 0 $0
McKinley 37 $3,806,000 30 $3,598,000 30 $3,598,000 $1,252,104 0 $0
Mora 7 $1,199,987 7 $1,199,987 7 $1,199,987 $417,595 0 $0
Multiple 16 $10,584,387 15 $10,524,387 15 $10,524,387 $3,662,487 0 $0
Otero 19 $14,655,419 19 $14,655,419 16 $6,400,000 $2,227,200 3 $8,255,419
Quay 7 $916,000 7 $916,000 7 $916,000 $318,768 0 $0
Rio Arriba 38 $11,109,000 33 $10,689,000 30 $9,189,000 $3,197,772 3 $1,500,000
Roosevelt 11 $1,430,000 11 $1,430,000 11 $1,430,000 $497,640 0 $0
San Juan 16 $6,306,000 16 $6,306,000 16 $6,306,000 $2,194,488 0 $0
San Miguel 33 $14,330,000 28 $14,200,000 26 $10,050,000 $3,497,400 2 $4,150,000
Sandoval 45 $8,372,700 42 $8,307,700 41 $8,207,700 $2,856,280 1 $100,000
Santa Fe 60 $14,964,165 56 $14,794,165 52 $6,445,800 $2,243,138 4 $8,348,365
Sierra 4 $634,000 4 $634,000 4 $634,000 $220,632 0 $0
Soccorro 10 $2,290,000 10 $2,290,000 10 $2,290,000 $796,920 0 $0
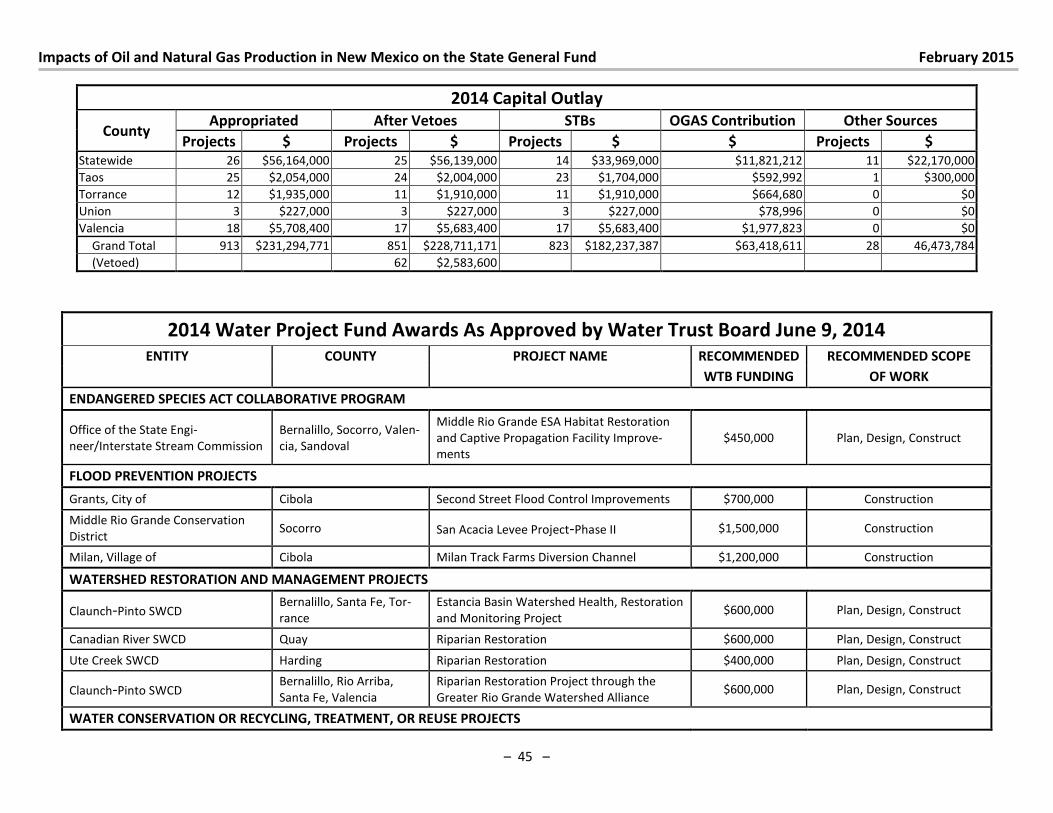
Impacts of Oil and Natural Gas Production in New Mexico on the State General Fund February 2015
– 45 –
2014 Capital Outlay
County Appropriated After Vetoes STBs OGAS Contribution Other Sources
Projects $ Projects $ Projects $ $ Projects $ Statewide 26 $56,164,000 25 $56,139,000 14 $33,969,000 $11,821,212 11 $22,170,000
Taos 25 $2,054,000 24 $2,004,000 23 $1,704,000 $592,992 1 $300,000
Torrance 12 $1,935,000 11 $1,910,000 11 $1,910,000 $664,680 0 $0
Union 3 $227,000 3 $227,000 3 $227,000 $78,996 0 $0
Valencia 18 $5,708,400 17 $5,683,400 17 $5,683,400 $1,977,823 0 $0
Grand Total 913 $231,294,771 851 $228,711,171 823 $182,237,387 $63,418,611 28 46,473,784
(Vetoed) 62 $2,583,600
2014 Water Project Fund Awards As Approved by Water Trust Board June 9, 2014 ENTITY COUNTY PROJECT NAME RECOMMENDED RECOMMENDED SCOPE
WTB FUNDING OF WORK
ENDANGERED SPECIES ACT COLLABORATIVE PROGRAM
Office of the State Engi-
neer/Interstate Stream Commission
Bernalillo, Socorro, Valen-
cia, Sandoval
Middle Rio Grande ESA Habitat Restoration
and Captive Propagation Facility Improve-
ments
$450,000 Plan, Design, Construct
FLOOD PREVENTION PROJECTS
Grants, City of Cibola Second Street Flood Control Improvements $700,000 Construction
Middle Rio Grande Conservation
District Socorro San Acacia Levee Project-Phase II $1,500,000 Construction
Milan, Village of Cibola Milan Track Farms Diversion Channel $1,200,000 Construction
WATERSHED RESTORATION AND MANAGEMENT PROJECTS
Claunch-Pinto SWCD Bernalillo, Santa Fe, Tor-
rance
Estancia Basin Watershed Health, Restoration
and Monitoring Project $600,000 Plan, Design, Construct
Canadian River SWCD Quay Riparian Restoration $600,000 Plan, Design, Construct
Ute Creek SWCD Harding Riparian Restoration $400,000 Plan, Design, Construct
Claunch-Pinto SWCD Bernalillo, Rio Arriba,
Santa Fe, Valencia
Riparian Restoration Project through the
Greater Rio Grande Watershed Alliance $600,000 Plan, Design, Construct
WATER CONSERVATION OR RECYCLING, TREATMENT, OR REUSE PROJECTS
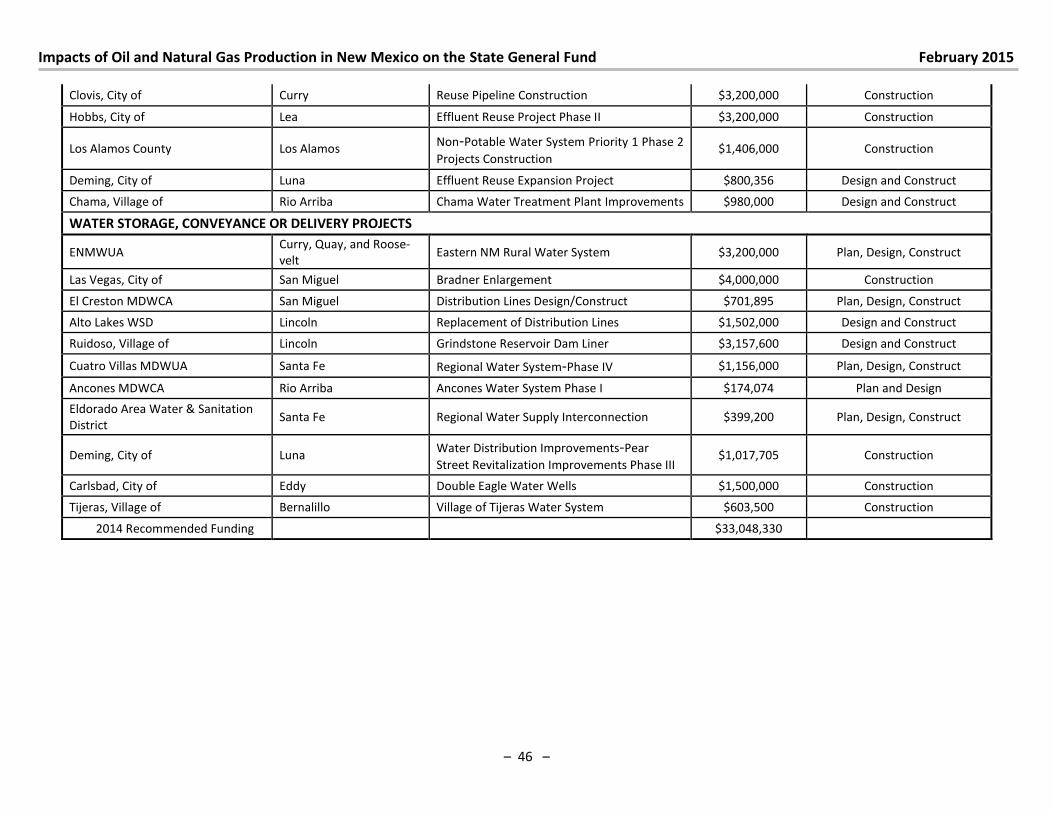
Impacts of Oil and Natural Gas Production in New Mexico on the State General Fund February 2015
– 46 –
Clovis, City of Curry Reuse Pipeline Construction $3,200,000 Construction
Hobbs, City of Lea Effluent Reuse Project Phase II $3,200,000 Construction
Los Alamos County Los Alamos Non-Potable Water System Priority 1 Phase 2
Projects Construction $1,406,000 Construction
Deming, City of Luna Effluent Reuse Expansion Project $800,356 Design and Construct
Chama, Village of Rio Arriba Chama Water Treatment Plant Improvements $980,000 Design and Construct
WATER STORAGE, CONVEYANCE OR DELIVERY PROJECTS
ENMWUA Curry, Quay, and Roose-
velt Eastern NM Rural Water System $3,200,000 Plan, Design, Construct
Las Vegas, City of San Miguel Bradner Enlargement $4,000,000 Construction
El Creston MDWCA San Miguel Distribution Lines Design/Construct $701,895 Plan, Design, Construct
Alto Lakes WSD Lincoln Replacement of Distribution Lines $1,502,000 Design and Construct
Ruidoso, Village of Lincoln Grindstone Reservoir Dam Liner $3,157,600 Design and Construct
Cuatro Villas MDWUA Santa Fe Regional Water System-Phase IV $1,156,000 Plan, Design, Construct
Ancones MDWCA Rio Arriba Ancones Water System Phase I $174,074 Plan and Design
Eldorado Area Water & Sanitation
District Santa Fe Regional Water Supply Interconnection $399,200 Plan, Design, Construct
Deming, City of Luna Water Distribution Improvements-Pear
Street Revitalization Improvements Phase III $1,017,705 Construction
Carlsbad, City of Eddy Double Eagle Water Wells $1,500,000 Construction
Tijeras, Village of Bernalillo Village of Tijeras Water System $603,500 Construction
2014 Recommended Funding $33,048,330
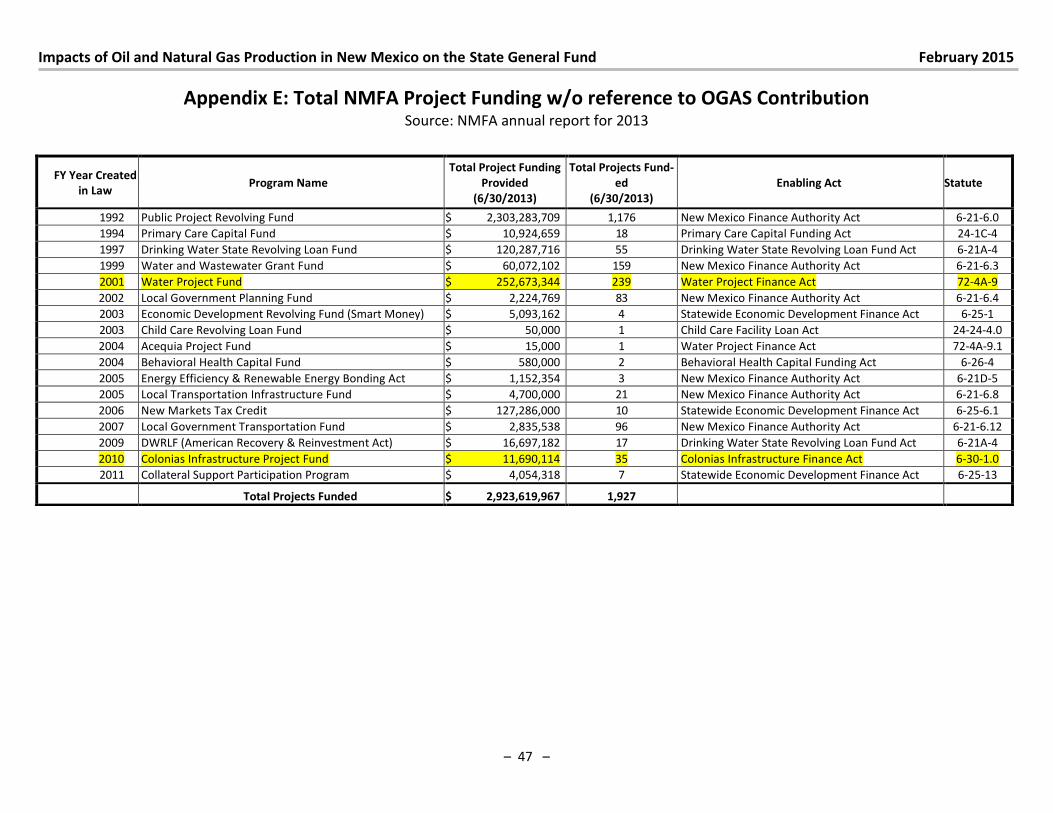
Impacts of Oil and Natural Gas Production in New Mexico on the State General Fund February 2015
– 47 –
Appendix E: Total NMFA Project Funding w/o reference to OGAS Contribution Source: NMFA annual report for 2013
FY Year Created
in Law Program Name
Total Project Funding
Provided
(6/30/2013)
Total Projects Fund-
ed
(6/30/2013)
Enabling Act Statute
1992 Public Project Revolving Fund $ 2,303,283,709 1,176 New Mexico Finance Authority Act 6-21-6.0
1994 Primary Care Capital Fund $ 10,924,659 18 Primary Care Capital Funding Act 24-1C-4
1997 Drinking Water State Revolving Loan Fund $ 120,287,716 55 Drinking Water State Revolving Loan Fund Act 6-21A-4
1999 Water and Wastewater Grant Fund $ 60,072,102 159 New Mexico Finance Authority Act 6-21-6.3
2001 Water Project Fund $ 252,673,344 239 Water Project Finance Act 72-4A-9
2002 Local Government Planning Fund $ 2,224,769 83 New Mexico Finance Authority Act 6-21-6.4
2003 Economic Development Revolving Fund (Smart Money) $ 5,093,162 4 Statewide Economic Development Finance Act 6-25-1
2003 Child Care Revolving Loan Fund $ 50,000 1 Child Care Facility Loan Act 24-24-4.0
2004 Acequia Project Fund $ 15,000 1 Water Project Finance Act 72-4A-9.1
2004 Behavioral Health Capital Fund $ 580,000 2 Behavioral Health Capital Funding Act 6-26-4
2005 Energy Efficiency & Renewable Energy Bonding Act $ 1,152,354 3 New Mexico Finance Authority Act 6-21D-5
2005 Local Transportation Infrastructure Fund $ 4,700,000 21 New Mexico Finance Authority Act 6-21-6.8
2006 New Markets Tax Credit $ 127,286,000 10 Statewide Economic Development Finance Act 6-25-6.1
2007 Local Government Transportation Fund $ 2,835,538 96 New Mexico Finance Authority Act 6-21-6.12
2009 DWRLF (American Recovery & Reinvestment Act) $ 16,697,182 17 Drinking Water State Revolving Loan Fund Act 6-21A-4
2010 Colonias Infrastructure Project Fund $ 11,690,114 35 Colonias Infrastructure Finance Act 6-30-1.0
2011 Collateral Support Participation Program $ 4,054,318 7 Statewide Economic Development Finance Act 6-25-13
Total Projects Funded $ 2,923,619,967 1,927
Impacts of Oil and Natural Gas Production in New Mexico on the State General Fund February 2015
– 48 –
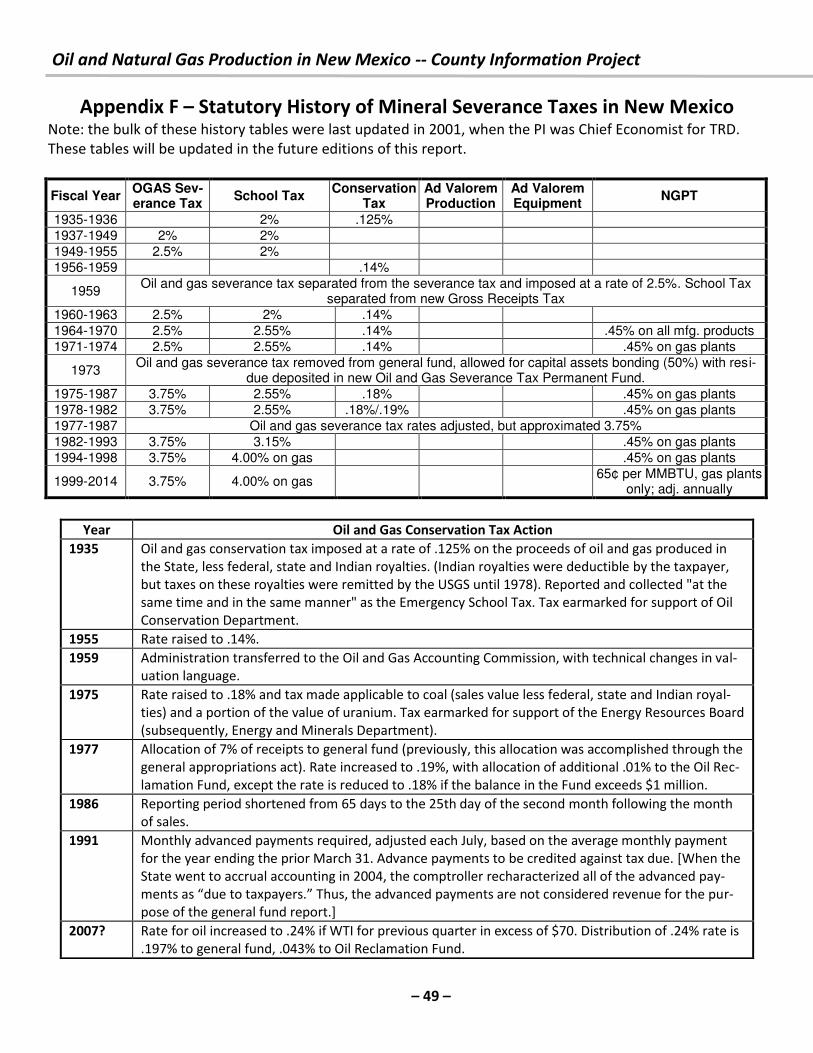
Oil and Natural Gas Production in New Mexico -- County Information Project
– 49 –
Appendix F – Statutory History of Mineral Severance Taxes in New Mexico Note: the bulk of these history tables were last updated in 2001, when the PI was Chief Economist for TRD.
These tables will be updated in the future editions of this report.
Fiscal Year OGAS Sev-erance Tax
School Tax Conservation
Tax Ad Valorem Production
Ad Valorem Equipment
NGPT
1935-1936 2% .125% 1937-1949 2% 2% 1949-1955 2.5% 2% 1956-1959 .14%
1959 Oil and gas severance tax separated from the severance tax and imposed at a rate of 2.5%. School Tax
separated from new Gross Receipts Tax 1960-1963 2.5% 2% .14% 1964-1970 2.5% 2.55% .14% .45% on all mfg. products 1971-1974 2.5% 2.55% .14% .45% on gas plants
1973 Oil and gas severance tax removed from general fund, allowed for capital assets bonding (50%) with resi-
due deposited in new Oil and Gas Severance Tax Permanent Fund. 1975-1987 3.75% 2.55% .18% .45% on gas plants 1978-1982 3.75% 2.55% .18%/.19% .45% on gas plants 1977-1987 Oil and gas severance tax rates adjusted, but approximated 3.75% 1982-1993 3.75% 3.15% .45% on gas plants 1994-1998 3.75% 4.00% on gas .45% on gas plants
1999-2014 3.75% 4.00% on gas 65¢ per MMBTU, gas plants
only; adj. annually
Year Oil and Gas Conservation Tax Action
1935 Oil and gas conservation tax imposed at a rate of .125% on the proceeds of oil and gas produced in
the State, less federal, state and Indian royalties. (Indian royalties were deductible by the taxpayer,
but taxes on these royalties were remitted by the USGS until 1978). Reported and collected "at the
same time and in the same manner" as the Emergency School Tax. Tax earmarked for support of Oil
Conservation Department.
1955 Rate raised to .14%.
1959 Administration transferred to the Oil and Gas Accounting Commission, with technical changes in val-
uation language.
1975 Rate raised to .18% and tax made applicable to coal (sales value less federal, state and Indian royal-
ties) and a portion of the value of uranium. Tax earmarked for support of the Energy Resources Board
(subsequently, Energy and Minerals Department).
1977 Allocation of 7% of receipts to general fund (previously, this allocation was accomplished through the
general appropriations act). Rate increased to .19%, with allocation of additional .01% to the Oil Rec-
lamation Fund, except the rate is reduced to .18% if the balance in the Fund exceeds $1 million.
1986 Reporting period shortened from 65 days to the 25th day of the second month following the month
of sales.
1991 Monthly advanced payments required, adjusted each July, based on the average monthly payment
for the year ending the prior March 31. Advance payments to be credited against tax due. [When the
State went to accrual accounting in 2004, the comptroller recharacterized all of the advanced pay-
e ts as due to ta pa e s. Thus, the ad a ed pa e ts a e ot o side ed e e ue fo the pur-
pose of the general fund report.]
2007? Rate for oil increased to .24% if WTI for previous quarter in excess of $70. Distribution of .24% rate is
.197% to general fund, .043% to Oil Reclamation Fund.
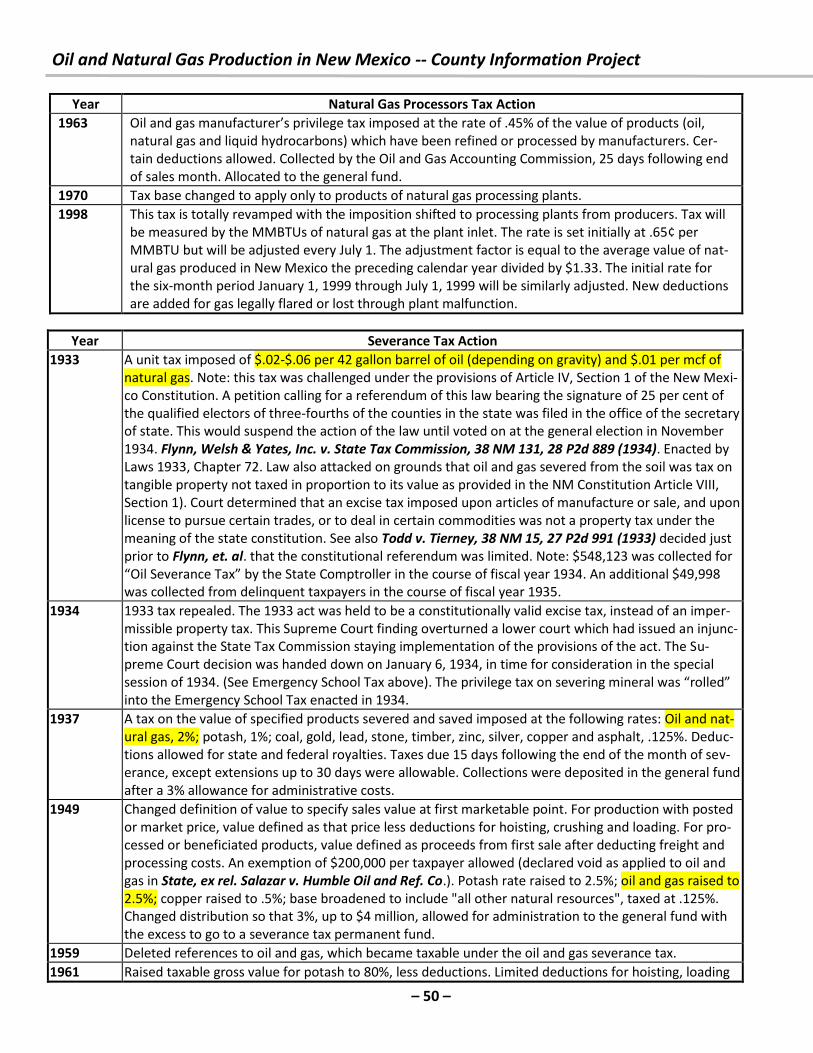
Oil and Natural Gas Production in New Mexico -- County Information Project
– 50 –
Year Natural Gas Processors Tax Action
1963 Oil and gas manufacturer’s privilege tax imposed at the rate of .45% of the value of products (oil,
natural gas and liquid hydrocarbons) which have been refined or processed by manufacturers. Cer-
tain deductions allowed. Collected by the Oil and Gas Accounting Commission, 25 days following end
of sales month. Allocated to the general fund.
1970 Tax base changed to apply only to products of natural gas processing plants.
1998 This tax is totally revamped with the imposition shifted to processing plants from producers. Tax will
be measured by the MMBTUs of natural gas at the plant inlet. The rate is set initially at .65¢ per
MMBTU but will be adjusted every July 1. The adjustment factor is equal to the average value of nat-
ural gas produced in New Mexico the preceding calendar year divided by $1.33. The initial rate for
the six-month period January 1, 1999 through July 1, 1999 will be similarly adjusted. New deductions
are added for gas legally flared or lost through plant malfunction.
Year Severance Tax Action
1933 A unit tax imposed of $.02-$.06 per 42 gallon barrel of oil (depending on gravity) and $.01 per mcf of
natural gas. Note: this tax was challenged under the provisions of Article IV, Section 1 of the New Mexi-
co Constitution. A petition calling for a referendum of this law bearing the signature of 25 per cent of
the qualified electors of three-fourths of the counties in the state was filed in the office of the secretary
of state. This would suspend the action of the law until voted on at the general election in November
1934. Flynn, Welsh & Yates, Inc. v. State Tax Commission, 38 NM 131, 28 P2d 889 (1934). Enacted by
Laws 1933, Chapter 72. Law also attacked on grounds that oil and gas severed from the soil was tax on
tangible property not taxed in proportion to its value as provided in the NM Constitution Article VIII,
Section 1). Court determined that an excise tax imposed upon articles of manufacture or sale, and upon
license to pursue certain trades, or to deal in certain commodities was not a property tax under the
meaning of the state constitution. See also Todd v. Tierney, 38 NM 15, 27 P2d 991 (1933) decided just
prior to Flynn, et. al. that the constitutional referendum was limited. Note: $548,123 was collected for
Oil “e e a e Ta the “tate Co pt olle i the ou se of fis al ea . A additio al $ , was collected from delinquent taxpayers in the course of fiscal year 1935.
1934 1933 tax repealed. The 1933 act was held to be a constitutionally valid excise tax, instead of an imper-
missible property tax. This Supreme Court finding overturned a lower court which had issued an injunc-
tion against the State Tax Commission staying implementation of the provisions of the act. The Su-
preme Court decision was handed down on January 6, 1934, in time for consideration in the special
session of 1934. (See Emergency School Tax above). The p i ilege ta o se e i g i e al as olled into the Emergency School Tax enacted in 1934.
1937 A tax on the value of specified products severed and saved imposed at the following rates: Oil and nat-
ural gas, 2%; potash, 1%; coal, gold, lead, stone, timber, zinc, silver, copper and asphalt, .125%. Deduc-
tions allowed for state and federal royalties. Taxes due 15 days following the end of the month of sev-
erance, except extensions up to 30 days were allowable. Collections were deposited in the general fund
after a 3% allowance for administrative costs.
1949 Changed definition of value to specify sales value at first marketable point. For production with posted
or market price, value defined as that price less deductions for hoisting, crushing and loading. For pro-
cessed or beneficiated products, value defined as proceeds from first sale after deducting freight and
processing costs. An exemption of $200,000 per taxpayer allowed (declared void as applied to oil and
gas in State, ex rel. Salazar v. Humble Oil and Ref. Co.). Potash rate raised to 2.5%; oil and gas raised to
2.5%; copper raised to .5%; base broadened to include "all other natural resources", taxed at .125%.
Changed distribution so that 3%, up to $4 million, allowed for administration to the general fund with
the excess to go to a severance tax permanent fund.
1959 Deleted references to oil and gas, which became taxable under the oil and gas severance tax.
1961 Raised taxable gross value for potash to 80%, less deductions. Limited deductions for hoisting, loading
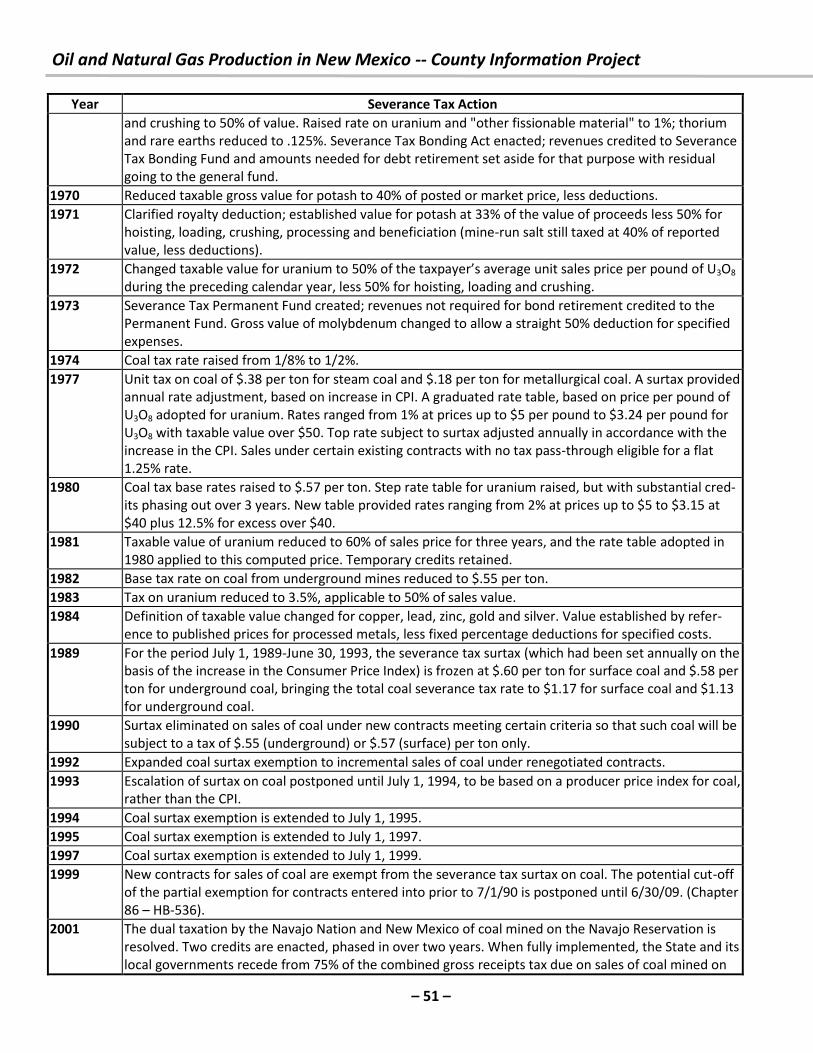
Oil and Natural Gas Production in New Mexico -- County Information Project
– 51 –
Year Severance Tax Action
and crushing to 50% of value. Raised rate on uranium and "other fissionable material" to 1%; thorium
and rare earths reduced to .125%. Severance Tax Bonding Act enacted; revenues credited to Severance
Tax Bonding Fund and amounts needed for debt retirement set aside for that purpose with residual
going to the general fund.
1970 Reduced taxable gross value for potash to 40% of posted or market price, less deductions.
1971 Clarified royalty deduction; established value for potash at 33% of the value of proceeds less 50% for
hoisting, loading, crushing, processing and beneficiation (mine-run salt still taxed at 40% of reported
value, less deductions).
1972 Changed taxable value for uranium to % of the ta pa e ’s a e age u it sales p i e pe pou d of U3O8
during the preceding calendar year, less 50% for hoisting, loading and crushing.
1973 Severance Tax Permanent Fund created; revenues not required for bond retirement credited to the
Permanent Fund. Gross value of molybdenum changed to allow a straight 50% deduction for specified
expenses.
1974 Coal tax rate raised from 1/8% to 1/2%.
1977 Unit tax on coal of $.38 per ton for steam coal and $.18 per ton for metallurgical coal. A surtax provided
annual rate adjustment, based on increase in CPI. A graduated rate table, based on price per pound of
U3O8 adopted for uranium. Rates ranged from 1% at prices up to $5 per pound to $3.24 per pound for
U3O8 with taxable value over $50. Top rate subject to surtax adjusted annually in accordance with the
increase in the CPI. Sales under certain existing contracts with no tax pass-through eligible for a flat
1.25% rate.
1980 Coal tax base rates raised to $.57 per ton. Step rate table for uranium raised, but with substantial cred-
its phasing out over 3 years. New table provided rates ranging from 2% at prices up to $5 to $3.15 at
$40 plus 12.5% for excess over $40.
1981 Taxable value of uranium reduced to 60% of sales price for three years, and the rate table adopted in
1980 applied to this computed price. Temporary credits retained.
1982 Base tax rate on coal from underground mines reduced to $.55 per ton.
1983 Tax on uranium reduced to 3.5%, applicable to 50% of sales value.
1984 Definition of taxable value changed for copper, lead, zinc, gold and silver. Value established by refer-
ence to published prices for processed metals, less fixed percentage deductions for specified costs.
1989 For the period July 1, 1989-June 30, 1993, the severance tax surtax (which had been set annually on the
basis of the increase in the Consumer Price Index) is frozen at $.60 per ton for surface coal and $.58 per
ton for underground coal, bringing the total coal severance tax rate to $1.17 for surface coal and $1.13
for underground coal.
1990 Surtax eliminated on sales of coal under new contracts meeting certain criteria so that such coal will be
subject to a tax of $.55 (underground) or $.57 (surface) per ton only.
1992 Expanded coal surtax exemption to incremental sales of coal under renegotiated contracts.
1993 Escalation of surtax on coal postponed until July 1, 1994, to be based on a producer price index for coal,
rather than the CPI.
1994 Coal surtax exemption is extended to July 1, 1995.
1995 Coal surtax exemption is extended to July 1, 1997.
1997 Coal surtax exemption is extended to July 1, 1999.
1999 New contracts for sales of coal are exempt from the severance tax surtax on coal. The potential cut-off
of the partial exemption for contracts entered into prior to 7/1/90 is postponed until 6/30/09. (Chapter
86 – HB-536).
2001 The dual taxation by the Navajo Nation and New Mexico of coal mined on the Navajo Reservation is
resolved. Two credits are enacted, phased in over two years. When fully implemented, the State and its
local governments recede from 75% of the combined gross receipts tax due on sales of coal mined on
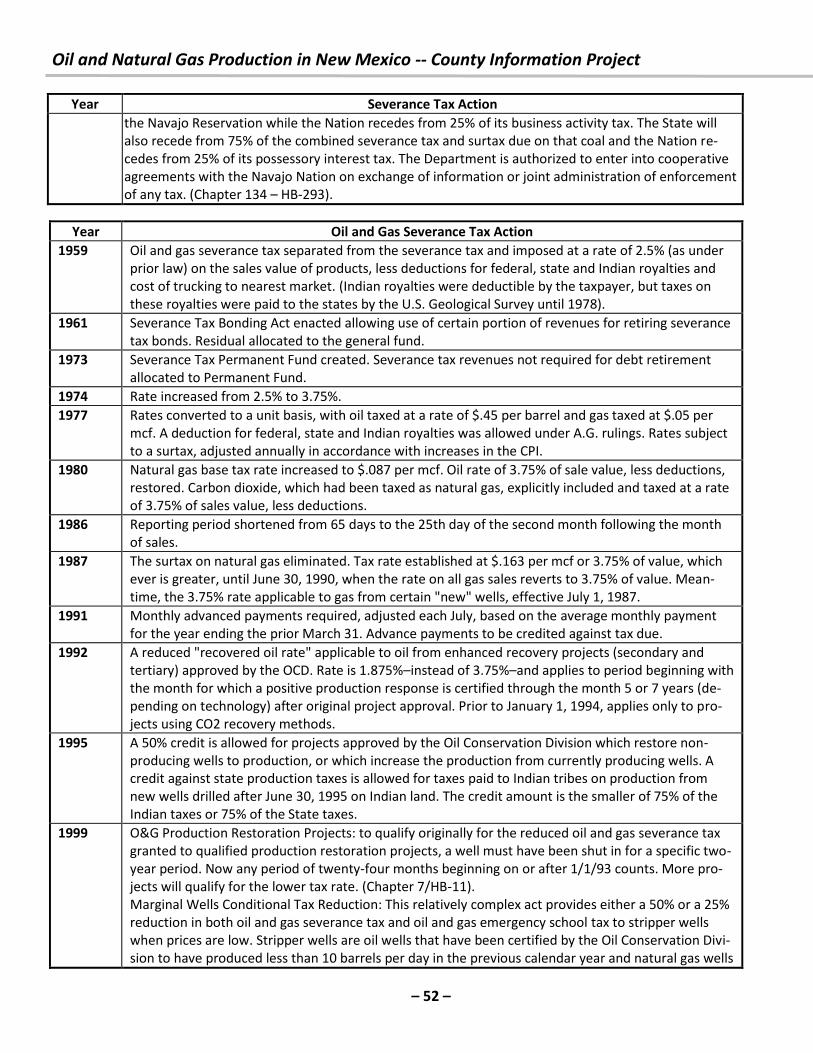
Oil and Natural Gas Production in New Mexico -- County Information Project
– 52 –
Year Severance Tax Action
the Navajo Reservation while the Nation recedes from 25% of its business activity tax. The State will
also recede from 75% of the combined severance tax and surtax due on that coal and the Nation re-
cedes from 25% of its possessory interest tax. The Department is authorized to enter into cooperative
agreements with the Navajo Nation on exchange of information or joint administration of enforcement
of any tax. (Chapter 134 – HB-293).
Year Oil and Gas Severance Tax Action
1959 Oil and gas severance tax separated from the severance tax and imposed at a rate of 2.5% (as under
prior law) on the sales value of products, less deductions for federal, state and Indian royalties and
cost of trucking to nearest market. (Indian royalties were deductible by the taxpayer, but taxes on
these royalties were paid to the states by the U.S. Geological Survey until 1978).
1961 Severance Tax Bonding Act enacted allowing use of certain portion of revenues for retiring severance
tax bonds. Residual allocated to the general fund.
1973 Severance Tax Permanent Fund created. Severance tax revenues not required for debt retirement
allocated to Permanent Fund.
1974 Rate increased from 2.5% to 3.75%.
1977 Rates converted to a unit basis, with oil taxed at a rate of $.45 per barrel and gas taxed at $.05 per
mcf. A deduction for federal, state and Indian royalties was allowed under A.G. rulings. Rates subject
to a surtax, adjusted annually in accordance with increases in the CPI.
1980 Natural gas base tax rate increased to $.087 per mcf. Oil rate of 3.75% of sale value, less deductions,
restored. Carbon dioxide, which had been taxed as natural gas, explicitly included and taxed at a rate
of 3.75% of sales value, less deductions.
1986 Reporting period shortened from 65 days to the 25th day of the second month following the month
of sales.
1987 The surtax on natural gas eliminated. Tax rate established at $.163 per mcf or 3.75% of value, which
ever is greater, until June 30, 1990, when the rate on all gas sales reverts to 3.75% of value. Mean-
time, the 3.75% rate applicable to gas from certain "new" wells, effective July 1, 1987.
1991 Monthly advanced payments required, adjusted each July, based on the average monthly payment
for the year ending the prior March 31. Advance payments to be credited against tax due.
1992 A reduced "recovered oil rate" applicable to oil from enhanced recovery projects (secondary and
tertiary) approved by the OCD. Rate is 1.875%–instead of 3.75%–and applies to period beginning with
the month for which a positive production response is certified through the month 5 or 7 years (de-
pending on technology) after original project approval. Prior to January 1, 1994, applies only to pro-
jects using CO2 recovery methods.
1995 A 50% credit is allowed for projects approved by the Oil Conservation Division which restore non-
producing wells to production, or which increase the production from currently producing wells. A
credit against state production taxes is allowed for taxes paid to Indian tribes on production from
new wells drilled after June 30, 1995 on Indian land. The credit amount is the smaller of 75% of the
Indian taxes or 75% of the State taxes.
1999 O&G Production Restoration Projects: to qualify originally for the reduced oil and gas severance tax
granted to qualified production restoration projects, a well must have been shut in for a specific two-
year period. Now any period of twenty-four months beginning on or after 1/1/93 counts. More pro-
jects will qualify for the lower tax rate. (Chapter 7/HB-11).
Marginal Wells Conditional Tax Reduction: This relatively complex act provides either a 50% or a 25%
reduction in both oil and gas severance tax and oil and gas emergency school tax to stripper wells
when prices are low. Stripper wells are oil wells that have been certified by the Oil Conservation Divi-
sion to have produced less than 10 barrels per day in the previous calendar year and natural gas wells
Oil and Natural Gas Production in New Mexico -- County Information Project
– 53 –
Year Oil and Gas Severance Tax Action
certified to have produced less than 60 mcf per day in the previous calendar year. Because produc-
tion and taxes are not reported on a well-by-well basis, production units instead qualify for the re-
du ed ta es if the u it’s a e age p odu tio pe eligi le ell fits the st ippe ell definition. (Injec-
tion wells may be eligible.) The average taxable value reported to this Department for the preceding
calendar year determines whether a lower rate applies. O & G severance tax rate for Level 1 oil or gas
is 1.875%; for level 2 oil or gas, 2.8125%. The tax rate for O & G emergency school tax for level 1 oil is
1.58% and for natural gas 2.0%; the level 2 emergency school tax rates are 2.36% for oil and 3.0% for
natural gas. A level 1 price is either $15 or less per barrel for oil or $1.15 or less per mcf of natural
gas. A level 2 price is more than $15 but not more than $18 per barrel for oil or more than $1.15 but
not more than $1.35 per mcf for natural gas. (Chapter 256 – CS/HB-281 & 436).
Year Oil and Gas School Tax Action
1959 Oil and gas removed from under the "Emergency School Tax" and placed under separate law. Tax
imposed at the rate of 2% (same as prior law) of sales, less deductions for federal, state and Indian
royalties and cost of trucking to the nearest market. (Indian royalties were deductible by the taxpay-
er, but taxes on these royalties were remitted by the USGS until 1978). Also deductible were oil and
gas sold for processing in the state which were subsequently taxed under the manufacturers privilege
tax.
1963 Rate increased to 2.55%. Eliminated deduction for products subsequently taxable under the manu-
facturers privilege tax.
1983 Rate increased to 3.15%.
1986 Reporting period shortened from 65 days to 25th day of the second month following the month of
sales.
1991 Monthly advanced payments required, adjusted each July, based on the average monthly payment
for the year ending the prior March 31. Advance payments to be credited against tax due.
1993 Tax rate increased from 3.15% to 4% on natural gas.
1999 A one-time drilling credit of $15,000 is available for the first 600 new crude oil or natural gas wells
drilled between January 1, 1999, and June 30, 2000. The Oil Conservation Division of the Energy,
Minerals and Natural Resources Department must certify that drilling commenced after January 1,
1999, and the well was completed before July 1, 2000. The credit is to be claimed by the operator
and may be applied only against oil and gas emergency school tax liability; no cash refunds will be
made. (Chapter 218 – CS/HB-280).
Marginal Wells Conditional Tax Reduction: This relatively complex act provides either a 50% or a 25%
reduction in both oil and gas severance tax and oil and gas emergency school tax to stripper wells
when prices are low. Stripper wells are oil wells that have been certified by the Oil Conservation Divi-
sion to have produced less than 10 barrels per day in the previous calendar year and natural gas wells
certified to have produced less than 60 mcf per day in the previous calendar year. Because produc-
tion and taxes are not reported on a well-by-well basis, production units instead qualify for the re-
du ed ta es if the u it’s a e age p odu tio pe eligi le ell fits the st ippe ell defi itio . I jec-
tion wells may be eligible.) The average taxable value reported to this Department for the preceding
calendar year determines whether a lower rate applies. O & G severance tax rate for Level 1 oil or gas
is 1.875%; for level 2 oil or gas, 2.8125%. The tax rate for O & G emergency school tax for level 1 oil is
1.58% and for natural gas 2.0%; the level 2 emergency school tax rates are 2.36% for oil and 3.0% for
natural gas. A level 1 price is either $15 or less per barrel for oil or $1.15 or less per mcf of natural
gas. A level 2 price is more than $15 but not more than $18 per barrel for oil or more than $1.15 but
not more than $1.35 per mcf for natural gas. (Chapter 256 – CS/HB-281 & 436).
Year Oil and Gas Ad Valorem Production Tax Action
Oil and Natural Gas Production in New Mexico -- County Information Project
– 54 –
Year Oil and Gas School Tax Action
1959 Oil and gas ad valorem production tax imposed in lieu of property tax. Tax rates set in the same man-
ner as are property tax rates. Taxable value is half the amount of the sales value less state, federal
and Indian royalties. Taxes due 65 days following the end of the sales month.
1986 Reporting period shortened from 65 days to the 25th day of the second month following the month
of sales.
1991 Monthly advanced payments required, adjusted each July, based on the average monthly payment
for the year ending the prior March 31. Advance payments to be credited against tax due.
Year Oil and Gas Production Equipment Ad Valorem TaxError! Bookmark not defined. Action
1969 Production equipment ad valorem tax enacted in lieu of property taxes on lease equipment. Tax rate
set in the same manner as property tax rates. Tax base established as 9% of the prior calendar year
sales value. Taxes collected by the Oil and Gas Accounting Division (later absorbed in the Taxation
and Revenue Department). Tax due in November.
Year Resources Excise Tax Action
1966 Resources excise tax imposed at a rate of .75% of the amount of money or the reasonable value of severed or processed resources, except for unprocessed potash and processed timber for which the rates were 3% and .375%, respectively. Deductions allowed for state and federal royalties and sales to federal agencies. Tax not applied to oil and gas, coal or carbon dioxide (effective July 1, 1967). Gen-erally replaced taxes imposed under the Emergency School Tax. Taxes due the 20th day of the month following the month in which the taxable event occurs.
1968 Tax base expanded to include unprocessed timber. 1969 Tax base expanded to include coal. 1970 Potash rates reduced to .5% for the unprocessed mineral and .125% for the processed product. Re-
port date changed from 20th to 25th day of the month. 1971 Clarified which tax exempt organizations qualify for tax exempt sales. 1972 Deleted provision for valuation by a court-ordered formula for uranium. 1973 Molybdenum rate reduced to .125%. 1985 Rate on copper reduced from .75% to .25% for a 3-year period, beginning July 1, 1985. 1986 Deduction allowed for royalties paid to Indian tribes. 1999 The resources and processors taxes on copper are cut by two-thirds. The rate reduction applies for
three-years only, to July 1, 2002. [This mirrors a temporary cut in 1985-88, the last time copper prices were low.] (Chapter 177 – SB-337).
Note: following history only extends to 1959 when oil and gas were not rolled into the Gross Receipts and Compensating Tax Act, but rather, were included in the Oil and Gas School Tax Act.
Year Emergency School/Gross Receipts Tax Action
1850 Under the Kearney Code, licenses were required for certain occupations and occupation fees were permitted. The territorial permit fee to keep a billiard table was set at $60 per table per year. Fees for distillers were $50 per still per year. Grocer’s and dramshop keepers were assessed $20 to $100 a year. Merchants paid on a sliding scale ranging from $20 per year for merchandise received for sale of value less than $2,000 for six month to $80. A portion of the semi-annual fee was apparently calculated as a ¼% ad valorem tax on the value of merchandise received each six months.
1933 A graduated “license and occupation” tax imposed on retail sales of merchandise, with a maximum tax rate of 2.5%, applicable for sales by merchants whose annual gross sales exceed $400,000. Oil, natural gas, gasoline and other motor fuels, liquor, itinerant vendors, and dealers in new or used automobiles were exempt. Tax administered and collected by State Comptroller (although may have been adminis-tered in practice by the State Tax Commission). Funds distributed 1/3 to municipality or county where business activity reported, 1/3 to common school fund (state) and 1/3 to state general fund. Tax due on 15th of month following business activity. Penalty for non payment of 5% imposed, and interest at 1% per month until paid. Criminal penalties provided for failure to register or pay tax. State Comptroller au-
Oil and Natural Gas Production in New Mexico -- County Information Project
– 55 –
Year Emergency School/Gross Receipts Tax Action
thorized to deduct up to 10% of proceeds for administrative costs. Tax enactment was subjected to suc-cessful petition drive under Article IV, Section 1 of the NM Constitution. This petition did not stay the action of the act until it could be reviewed by state supreme court, or until election on the act’s provi-sions could be scheduled. The State Treasurer’s biennial report for the period lists a total of $65,526 collected and transferred for “Retail Dealer’s Licenses” in FY 1934. Tax repealed by judicial action about 1936.
1934 Emergency School Tax enacted for one year. Provisions same as permanent tax enacted in 1935 and summarized below. Reenacted the 1933 graduated “license and occupation tax, which was also stayed by action of the NM Supreme Court. The State Comptroller was charged with the administra-tion of the new tax. In the course of FY 1934, the Comptroller collected and transferred $109,176 to the general fund. Apparently, the new emergency school tax law was effective for less than a month of collections in FY 1934. In FY 1935, the State Comptroller collected and transferred $1,211,222.08 from July through the end of January. The newly-created Bureau of Revenue collected and transferred an additional $790,176.23 for the February through June 30 period of FY 1935.
1935 Emergency School Tax enacted. For the privilege of doing business, taxes enacted on gross receipts at rates varying from .125% to 2% in accordance with the type of business: oil, gas and potash mining, 2% and all other mining, .25% (except natural resource subject to processing instate subject only to manufacturing tax); mineral processing treated as part of manufacturing, and subject to .5% for pro-cessing oil and gas and .25% for other minerals; general manufacturing and generation of electricity, .25%; wholesalers, including electricity and gas sales to manufacturers, .125%; retailers, 2% except sales of automobiles and farm implements (.5%) and trucks and tractors (.25%) and except plants, fertilizers and livestock feeds, not taxable; sales to consumers of electricity and gas, intrastate tele-phone service and transportation services, 2%; construction, 1%; entertainment, professional, tech-nical and scientific services, 2%; a wide variety of other specified services, 2%; real estate commis-sions, 2%; broker fees, 2%. Taxes not applicable to sales made to U.S. Government, state or political subdivisions. The act specifically taxed receipts from sales of unprocessed mining products, specified types of services and brokers services regardless of whether or not delivery made outside the state, although interstate commerce sales exempt if taxation prohibited by the U.S. Other exemptions were: sales by nonprofit organizations, sales of farm products by producers; insurance premiums taxed un-der separate law; wages and salaries; hospital receipts; interest, dividends, real estate rentals; news-papers and magazines; motor fuel subject to separate taxes; banks; sale of water; dormitories and dining halls of state educational institutions. Freight charges deductible for natural resource extraction and processing, for wholesalers and contractors. Tax explicitly applied a second time if property taxed under natural resource, manufacturing and wholesalers tax subsequently sold at retail. Taxes did not apply to sales of items taken in on trade but trade-in deduction not allowed. Taxes due 15th day of month. Credited to the "Emergency School Fund" with 5% administrative allowance for the Bureau of Revenue.
1937 Deleted exclusion for sale of products taken in on trade. Income from hotels, campgrounds and room-ing houses not real estate rentals and therefore taxable. Tax due on gasoline for which refunds claimed.
1941 Raised mining taxes other than oil, gas, carbon dioxide and potash to .5% while carbon dioxide taxed at 2% along with oil and gas. Coal excluded from natural resource extraction tax (presuming taxed as processed minerals). Processed minerals raised to .5%. Raised construction tax to 2% but allowed a deduction for materials used in project. Raised taxes on automobiles, trucks and tractors to 1% but eliminated tax on other agricultural implements. Trade-in deduction allowed. Deleted specific refer-ences to interstate commerce. Exclusion for sales to governments does not apply to gold and silver shipped to mints.
1945 Added exemption for wholesalers services to retailers subject to tax. 1947 Added exclusion for sales to societies, hospitals, fraternal or religious organizations not organized for
profit. 1949 Changed definition of gross (taxable) receipts to exclude separately stated tax amounts. 1955 Sales of new and used automobiles removed from school tax base and taxed under separate law at a
rate of 1%. 1957 Municipal sales tax authorization extended to all cities but made subject to approval by electorate in
cities under 70,000. 1959 Emergency School Tax Code extensively revised, with a moniker given to each component of the tax
Oil and Natural Gas Production in New Mexico -- County Information Project
– 56 –
Year Emergency School/Gross Receipts Tax Action
(e.g., natural resources, manufacturing–which only applied to certain resource processing, wholesale, etc.). Oil and gas made subject to separate law (Oil and Gas School Tax); coal and carbon dioxide eliminated from unprocessed mineral section, unprocessed potash rate of 2% retained and all other minerals, processed or unprocessed, taxed at .5% as before except timber (under manufacturing), .25%; wholesalers rate of .125% retained; rates for retailers, furnishing electricity to consumers, transport services, entertainment remained at 2%; contractors reduced to 1% and deduction for their materials eliminated. Tax applied to natural resource sales, service sales and commissions of agents and brokers regardless of whether or not deliveries made out-of-state, as before. Restored exclusion for sale of tangible personal property (but not services) to federal government. Terminology for exclu-sion of sales to state and local government and to non-profits changes to specify sales of tangible personal property and services. Additional 2% applicable where resource processors and wholesalers sell at retail, except if sale is for resale or incorporation into a manufactured product. Other exemptions similar to original law.
Oil and Natural Gas Production in New Mexico -- County Information Project
– 57 –
The Impacts of Oil and Natural Gas Production in New Mexico on Berna-
lillo County A Summary of Important Economic and Revenue Issues
Bernalillo County Summary
Bernalillo County is not an oil and natural gas producing area. However, oil and natural gas production is im-
portant to the county indirectly. This summary details some of these important issues.
In FY 2010, all New Mexico producers shipped 62.4 million barrels of oil worth $4,469 million, 1,275 million
mcf of natural gas worth $6,615 million and 72.4 million mcf of CO2 worth $74.4 million. In FY 2014, all New
Mexico producers shipped 110.5 million barrels of oil worth $10,905 million and 1,169 million mcf of natural
gas worth $6,115 million and 64.3 million mcf of CO2 worth $95.3.million. Note: f is , u i feet of gas at standard temperature and pressure.)
1. What products and land types generate the OGAS production in Bernalillo County? Bernalillo County is not
an oil and natural gas producing area.
2. Is there more detail on specific product, such as natural gas liquids or condensate? Yes, the ONGRD sys-
tem has for several years published details by product category. However, Bernalillo County is not an oil
and natural gas producing area.
3. What does this production mean for state and local direct revenues from production in Bernalillo County?
Bernalillo County is not an oil and natural gas producing area.
4. The industry also makes bonus payments for the rights to lease federal and state lands for production.
These leases are primarily in the producing counties, but exploratory leases are also executed. Bonus
payments for leases on federal land are shared with the State general fund. Bonus payments for leases on
state lands become part of the land maintenance fund at the State Land Office, distributed to beneficiar-
ies after deducting the expenses of the SLO. For the Period 2010 through 2014, no leases were sold for
State or Federal lands in the county.
5. How about Gross Receipts Tax revenue to county and municipal governments for the NAICS codes 211110 -
Oil & Gas Extraction; 213111 Drilling oil and gas wells; 213112 - Support activities for oil and gas operations;
and 213118 - Services to oil and gas extraction? Refer to the main document for an explanation of the eco-
nomic burden concept for Gross Receipts Tax. This year, the methodology for calculating the State tax
amount was improved somewhat, but those improvements are not reflected in the following table. Note
that in the course of 2013, 30 counties had reported activity in at least one of the three NAICS codes. Only
DeBaca, Los Alamos and Mora Counties reported no gross receipts activity. For FY 2014, only Los Alamos
County reported no GRT activity. Although the methodology has been improved this year, most of the dif-
ferences between 2013 and 2014 for this county are real. Extraction activity was significantly less in FY 2014
than in FY 2013. Drilling activity was approximately flat. However, well services, completion, fracking and
other recurring and non-recurring services significantly expanded.
Bernalillo County Gross Receipts Tax Activity
Fiscal NAICS Descrip- Count Gross Re- Txbl Gross Gross GRT Rate Approx Approx
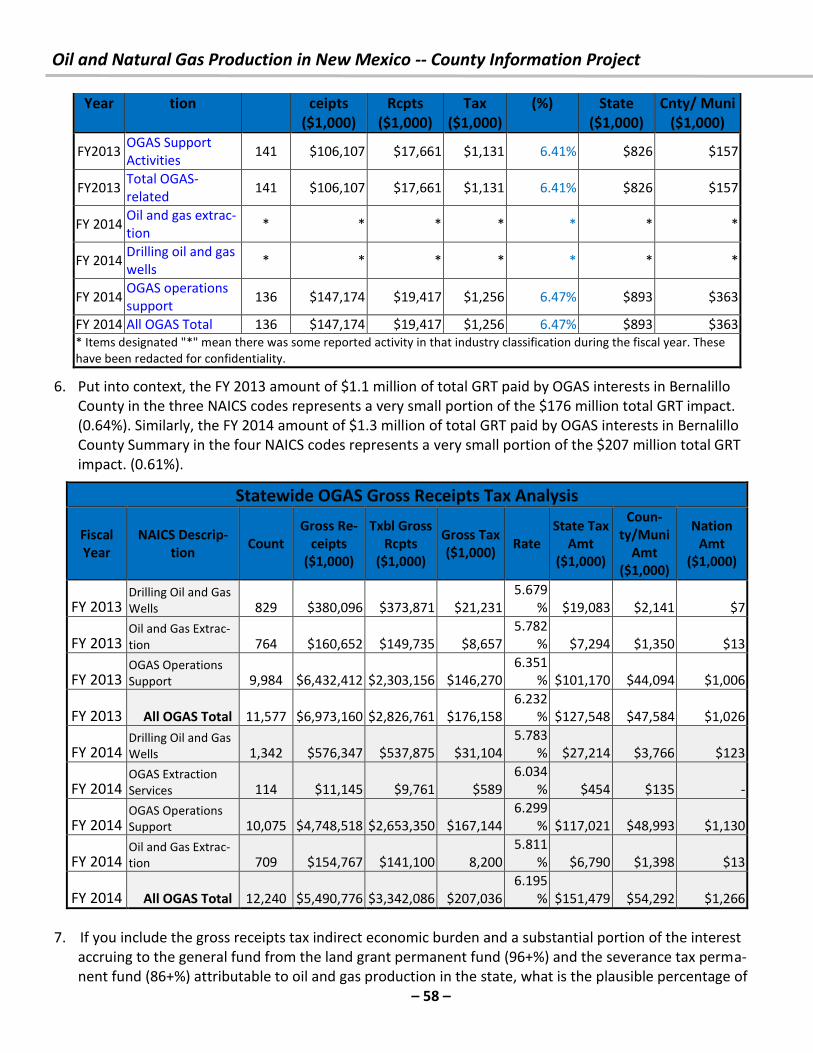
Oil and Natural Gas Production in New Mexico -- County Information Project
– 58 –
Year tion ceipts
($1,000)
Rcpts
($1,000)
Tax
($1,000)
(%) State
($1,000)
Cnty/ Muni
($1,000)
FY2013 OGAS Support
Activities 141 $106,107 $17,661 $1,131 6.41% $826 $157
FY2013 Total OGAS-
related 141 $106,107 $17,661 $1,131 6.41% $826 $157
FY 2014 Oil and gas extrac-
tion * * * * * * *
FY 2014 Drilling oil and gas
wells * * * * * * *
FY 2014 OGAS operations
support 136 $147,174 $19,417 $1,256 6.47% $893 $363
FY 2014 All OGAS Total 136 $147,174 $19,417 $1,256 6.47% $893 $363
* Items designated "*" mean there was some reported activity in that industry classification during the fiscal year. These
have been redacted for confidentiality.
6. Put into context, the FY 2013 amount of $1.1 million of total GRT paid by OGAS interests in Bernalillo
County in the three NAICS codes represents a very small portion of the $176 million total GRT impact.
(0.64%). Similarly, the FY 2014 amount of $1.3 million of total GRT paid by OGAS interests in Bernalillo
County Summary in the four NAICS codes represents a very small portion of the $207 million total GRT
impact. (0.61%).
Statewide OGAS Gross Receipts Tax Analysis
Fiscal
Year
NAICS Descrip-
tion Count
Gross Re-
ceipts
($1,000)
Txbl Gross
Rcpts
($1,000)
Gross Tax
($1,000) Rate
State Tax
Amt
($1,000)
Coun-
ty/Muni
Amt
($1,000)
Nation
Amt
($1,000)
FY 2013 Drilling Oil and Gas
Wells 829 $380,096 $373,871 $21,231
5.679
% $19,083 $2,141 $7
FY 2013 Oil and Gas Extrac-
tion 764 $160,652 $149,735 $8,657
5.782
% $7,294 $1,350 $13
FY 2013 OGAS Operations
Support 9,984 $6,432,412 $2,303,156 $146,270
6.351
% $101,170 $44,094 $1,006
FY 2013 All OGAS Total 11,577 $6,973,160 $2,826,761 $176,158
6.232
% $127,548 $47,584 $1,026
FY 2014 Drilling Oil and Gas
Wells 1,342 $576,347 $537,875 $31,104
5.783
% $27,214 $3,766 $123
FY 2014 OGAS Extraction
Services 114 $11,145 $9,761 $589
6.034
% $454 $135 -
FY 2014 OGAS Operations
Support 10,075 $4,748,518 $2,653,350 $167,144
6.299
% $117,021 $48,993 $1,130
FY 2014 Oil and Gas Extrac-
tion 709 $154,767 $141,100 8,200
5.811
% $6,790 $1,398 $13
FY 2014 All OGAS Total 12,240 $5,490,776 $3,342,086 $207,036
6.195
% $151,479 $54,292 $1,266
7. If you include the gross receipts tax indirect economic burden and a substantial portion of the interest
accruing to the general fund from the land grant permanent fund (96+%) and the severance tax perma-
nent fund (86+%) attributable to oil and gas production in the state, what is the plausible percentage of
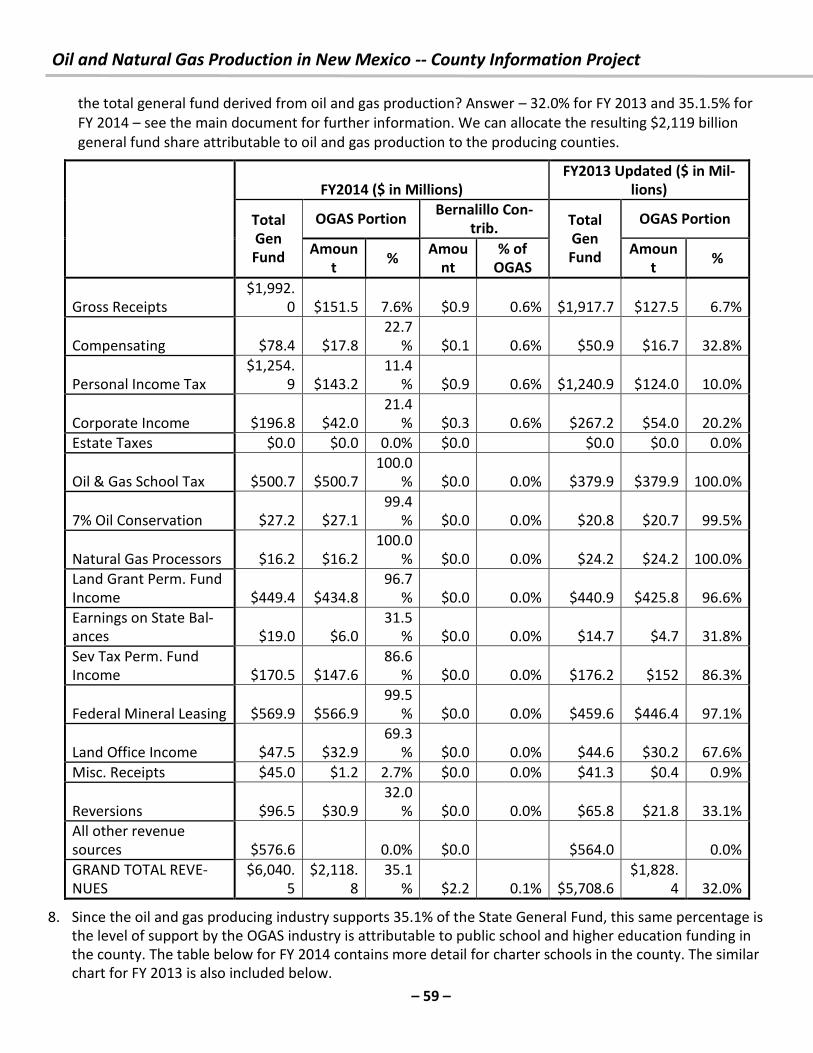
Oil and Natural Gas Production in New Mexico -- County Information Project
– 59 –
the total general fund derived from oil and gas production? Answer – 32.0% for FY 2013 and 35.1.5% for
FY 2014 – see the main document for further information. We can allocate the resulting $2,119 billion
general fund share attributable to oil and gas production to the producing counties.
FY2014 ($ in Millions)
FY2013 Updated ($ in Mil-
lions)
Total
Gen
Fund
OGAS Portion Bernalillo Con-
trib. Total
Gen
Fund
OGAS Portion
Amoun
t %
Amou
nt
% of
OGAS
Amoun
t %
Gross Receipts
$1,992.
0 $151.5 7.6% $0.9 0.6% $1,917.7 $127.5 6.7%
Compensating $78.4 $17.8
22.7
% $0.1 0.6% $50.9 $16.7 32.8%
Personal Income Tax
$1,254.
9 $143.2
11.4
% $0.9 0.6% $1,240.9 $124.0 10.0%
Corporate Income $196.8 $42.0
21.4
% $0.3 0.6% $267.2 $54.0 20.2%
Estate Taxes $0.0 $0.0 0.0% $0.0 $0.0 $0.0 0.0%
Oil & Gas School Tax $500.7 $500.7
100.0
% $0.0 0.0% $379.9 $379.9 100.0%
7% Oil Conservation $27.2 $27.1
99.4
% $0.0 0.0% $20.8 $20.7 99.5%
Natural Gas Processors $16.2 $16.2
100.0
% $0.0 0.0% $24.2 $24.2 100.0%
Land Grant Perm. Fund
Income $449.4 $434.8
96.7
% $0.0 0.0% $440.9 $425.8 96.6%
Earnings on State Bal-
ances $19.0 $6.0
31.5
% $0.0 0.0% $14.7 $4.7 31.8%
Sev Tax Perm. Fund
Income $170.5 $147.6
86.6
% $0.0 0.0% $176.2 $152 86.3%
Federal Mineral Leasing $569.9 $566.9
99.5
% $0.0 0.0% $459.6 $446.4 97.1%
Land Office Income $47.5 $32.9
69.3
% $0.0 0.0% $44.6 $30.2 67.6%
Misc. Receipts $45.0 $1.2 2.7% $0.0 0.0% $41.3 $0.4 0.9%
Reversions $96.5 $30.9
32.0
% $0.0 0.0% $65.8 $21.8 33.1%
All other revenue
sources $576.6 0.0% $0.0 $564.0
0.0%
GRAND TOTAL REVE-
NUES
$6,040.
5
$2,118.
8
35.1
% $2.2 0.1% $5,708.6
$1,828.
4 32.0%
8. Since the oil and gas producing industry supports 35.1% of the State General Fund, this same percentage is
the level of support by the OGAS industry is attributable to public school and higher education funding in
the county. The table below for FY 2014 contains more detail for charter schools in the county. The similar
chart for FY 2013 is also included below.
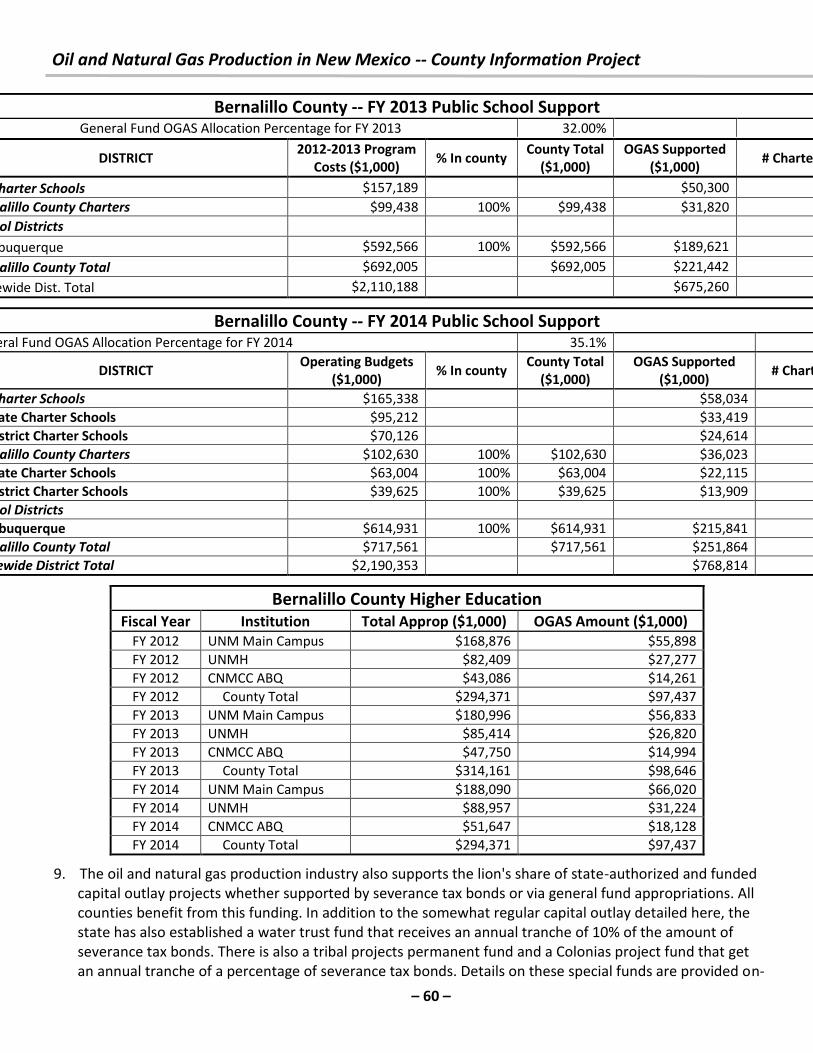
Oil and Natural Gas Production in New Mexico -- County Information Project
– 60 –
Bernalillo County -- FY 2013 Public School Support General Fund OGAS Allocation Percentage for FY 2013 32.00%
DISTRICT 2012-2013 Program
Costs ($1,000) % In county
County Total
($1,000)
OGAS Supported
($1,000) # Charters
l Charter Schools $157,189 $50,300
ernalillo County Charters $99,438 100% $99,438 $31,820
hool Districts
Albuquerque $592,566 100% $592,566 $189,621
ernalillo County Total $692,005 $692,005 $221,442
Statewide Dist. Total $2,110,188 $675,260
Bernalillo County -- FY 2014 Public School Support General Fund OGAS Allocation Percentage for FY 2014 35.1%
DISTRICT Operating Budgets
($1,000) % In county
County Total
($1,000)
OGAS Supported
($1,000) # Charte
l Charter Schools $165,338 $58,034
State Charter Schools $95,212 $33,419
District Charter Schools $70,126 $24,614
ernalillo County Charters $102,630 100% $102,630 $36,023
State Charter Schools $63,004 100% $63,004 $22,115
District Charter Schools $39,625 100% $39,625 $13,909
hool Districts
Albuquerque $614,931 100% $614,931 $215,841
ernalillo County Total $717,561 $717,561 $251,864
atewide District Total $2,190,353 $768,814
Bernalillo County Higher Education
Fiscal Year Institution Total Approp ($1,000) OGAS Amount ($1,000)
FY 2012 UNM Main Campus $168,876 $55,898
FY 2012 UNMH $82,409 $27,277
FY 2012 CNMCC ABQ $43,086 $14,261
FY 2012 County Total $294,371 $97,437
FY 2013 UNM Main Campus $180,996 $56,833
FY 2013 UNMH $85,414 $26,820
FY 2013 CNMCC ABQ $47,750 $14,994
FY 2013 County Total $314,161 $98,646
FY 2014 UNM Main Campus $188,090 $66,020
FY 2014 UNMH $88,957 $31,224
FY 2014 CNMCC ABQ $51,647 $18,128
FY 2014 County Total $294,371 $97,437
9. The oil and natural gas production industry also supports the lion's share of state-authorized and funded
capital outlay projects whether supported by severance tax bonds or via general fund appropriations. All
counties benefit from this funding. In addition to the somewhat regular capital outlay detailed here, the
state has also established a water trust fund that receives an annual tranche of 10% of the amount of
severance tax bonds. There is also a tribal projects permanent fund and a Colonias project fund that get
an annual tranche of a percentage of severance tax bonds. Details on these special funds are provided on-
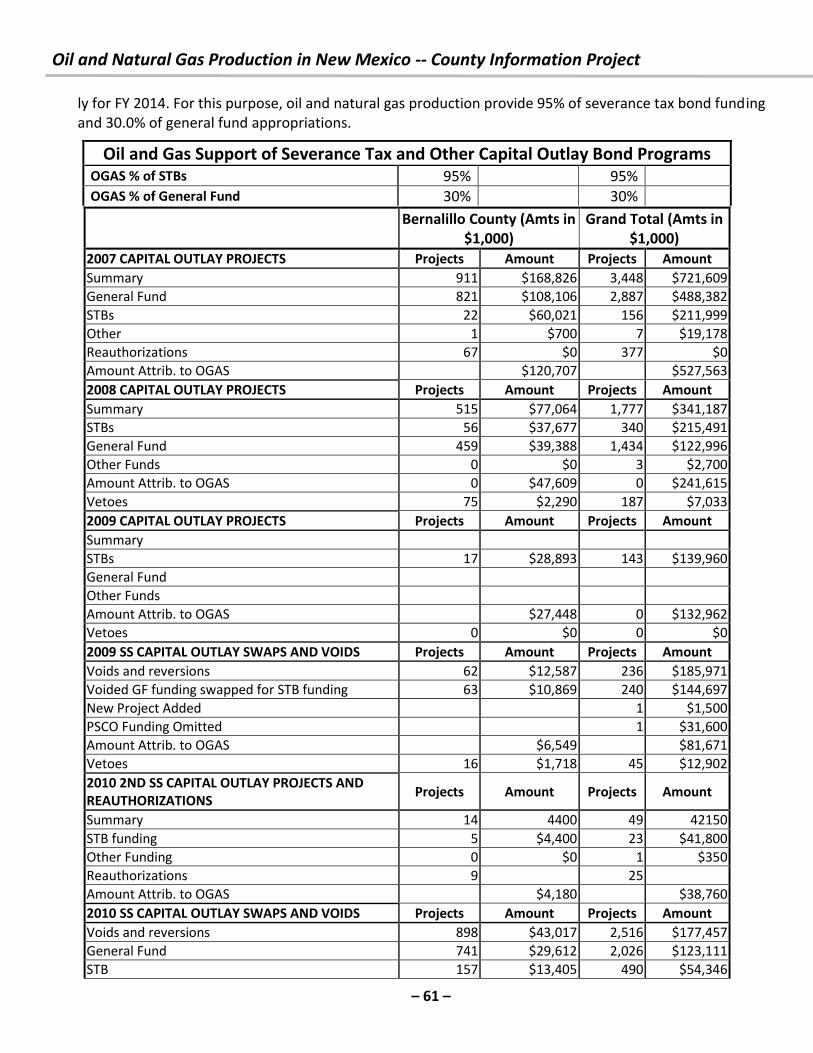
Oil and Natural Gas Production in New Mexico -- County Information Project
– 61 –
ly for FY 2014. For this purpose, oil and natural gas production provide 95% of severance tax bond funding
and 30.0% of general fund appropriations.
Oil and Gas Support of Severance Tax and Other Capital Outlay Bond Programs OGAS % of STBs 95% 95%
OGAS % of General Fund 30% 30%
Bernalillo County (Amts in
$1,000)
Grand Total (Amts in
$1,000)
2007 CAPITAL OUTLAY PROJECTS Projects Amount Projects Amount
Summary 911 $168,826 3,448 $721,609
General Fund 821 $108,106 2,887 $488,382
STBs 22 $60,021 156 $211,999
Other 1 $700 7 $19,178
Reauthorizations 67 $0 377 $0
Amount Attrib. to OGAS $120,707 $527,563
2008 CAPITAL OUTLAY PROJECTS Projects Amount Projects Amount
Summary 515 $77,064 1,777 $341,187
STBs 56 $37,677 340 $215,491
General Fund 459 $39,388 1,434 $122,996
Other Funds 0 $0 3 $2,700
Amount Attrib. to OGAS 0 $47,609 0 $241,615
Vetoes 75 $2,290 187 $7,033
2009 CAPITAL OUTLAY PROJECTS Projects Amount Projects Amount
Summary
STBs 17 $28,893 143 $139,960
General Fund
Other Funds
Amount Attrib. to OGAS $27,448 0 $132,962
Vetoes 0 $0 0 $0
2009 SS CAPITAL OUTLAY SWAPS AND VOIDS Projects Amount Projects Amount
Voids and reversions 62 $12,587 236 $185,971
Voided GF funding swapped for STB funding 63 $10,869 240 $144,697
New Project Added 1 $1,500
PSCO Funding Omitted 1 $31,600
Amount Attrib. to OGAS $6,549 $81,671
Vetoes 16 $1,718 45 $12,902
2010 2ND SS CAPITAL OUTLAY PROJECTS AND
REAUTHORIZATIONS Projects Amount Projects Amount
Summary 14 4400 49 42150
STB funding 5 $4,400 23 $41,800
Other Funding 0 $0 1 $350
Reauthorizations 9 25
Amount Attrib. to OGAS $4,180 $38,760
2010 SS CAPITAL OUTLAY SWAPS AND VOIDS Projects Amount Projects Amount
Voids and reversions 898 $43,017 2,516 $177,457
General Fund 741 $29,612 2,026 $123,111
STB 157 $13,405 490 $54,346
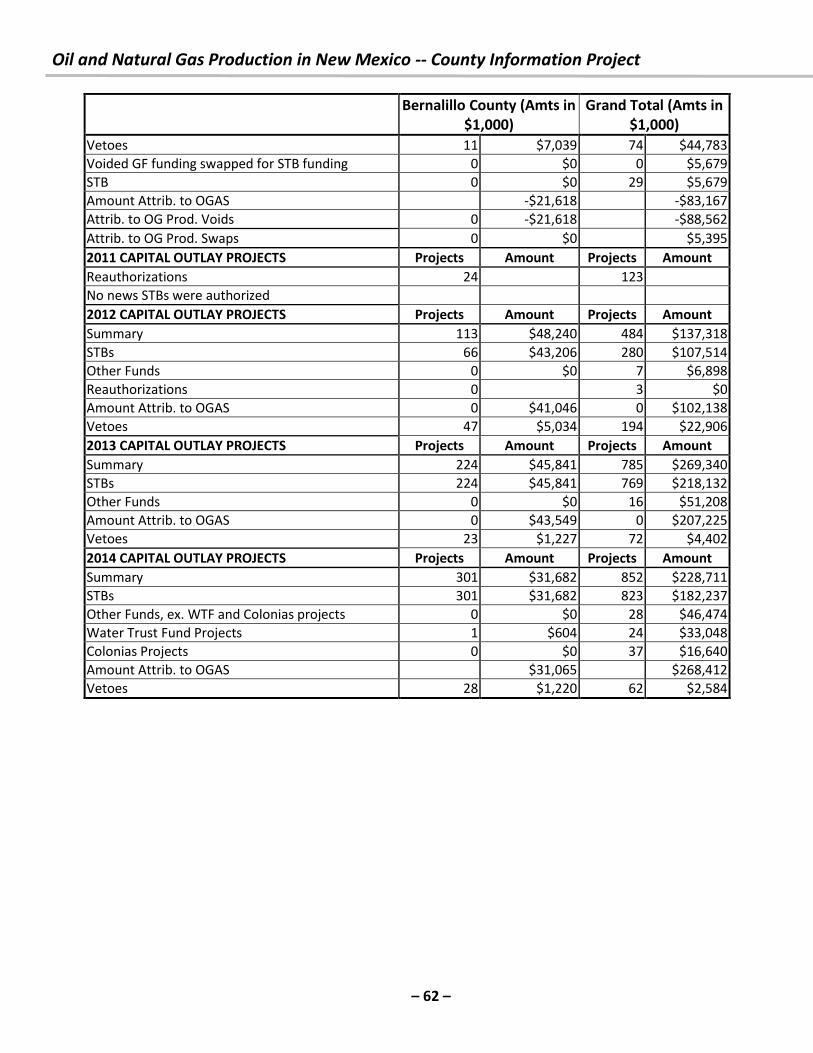
Oil and Natural Gas Production in New Mexico -- County Information Project
– 62 –
Bernalillo County (Amts in
$1,000)
Grand Total (Amts in
$1,000)
Vetoes 11 $7,039 74 $44,783
Voided GF funding swapped for STB funding 0 $0 0 $5,679
STB 0 $0 29 $5,679
Amount Attrib. to OGAS -$21,618 -$83,167
Attrib. to OG Prod. Voids 0 -$21,618 -$88,562
Attrib. to OG Prod. Swaps 0 $0 $5,395
2011 CAPITAL OUTLAY PROJECTS Projects Amount Projects Amount
Reauthorizations 24 123
No news STBs were authorized
2012 CAPITAL OUTLAY PROJECTS Projects Amount Projects Amount
Summary 113 $48,240 484 $137,318
STBs 66 $43,206 280 $107,514
Other Funds 0 $0 7 $6,898
Reauthorizations 0 3 $0
Amount Attrib. to OGAS 0 $41,046 0 $102,138
Vetoes 47 $5,034 194 $22,906
2013 CAPITAL OUTLAY PROJECTS Projects Amount Projects Amount
Summary 224 $45,841 785 $269,340
STBs 224 $45,841 769 $218,132
Other Funds 0 $0 16 $51,208
Amount Attrib. to OGAS 0 $43,549 0 $207,225
Vetoes 23 $1,227 72 $4,402
2014 CAPITAL OUTLAY PROJECTS Projects Amount Projects Amount
Summary 301 $31,682 852 $228,711
STBs 301 $31,682 823 $182,237
Other Funds, ex. WTF and Colonias projects 0 $0 28 $46,474
Water Trust Fund Projects 1 $604 24 $33,048
Colonias Projects 0 $0 37 $16,640
Amount Attrib. to OGAS $31,065 $268,412
Vetoes 28 $1,220 62 $2,584
Oil and Natural Gas Production in New Mexico -- County Information Project
– 63 –
10. For questions, comments or criticisms of this work, contact:
Laird Graeser
505 424-9023
or
Richard L. Anklam, President & Executive Director, New Mexico Tax Research Institute
505-269-6791
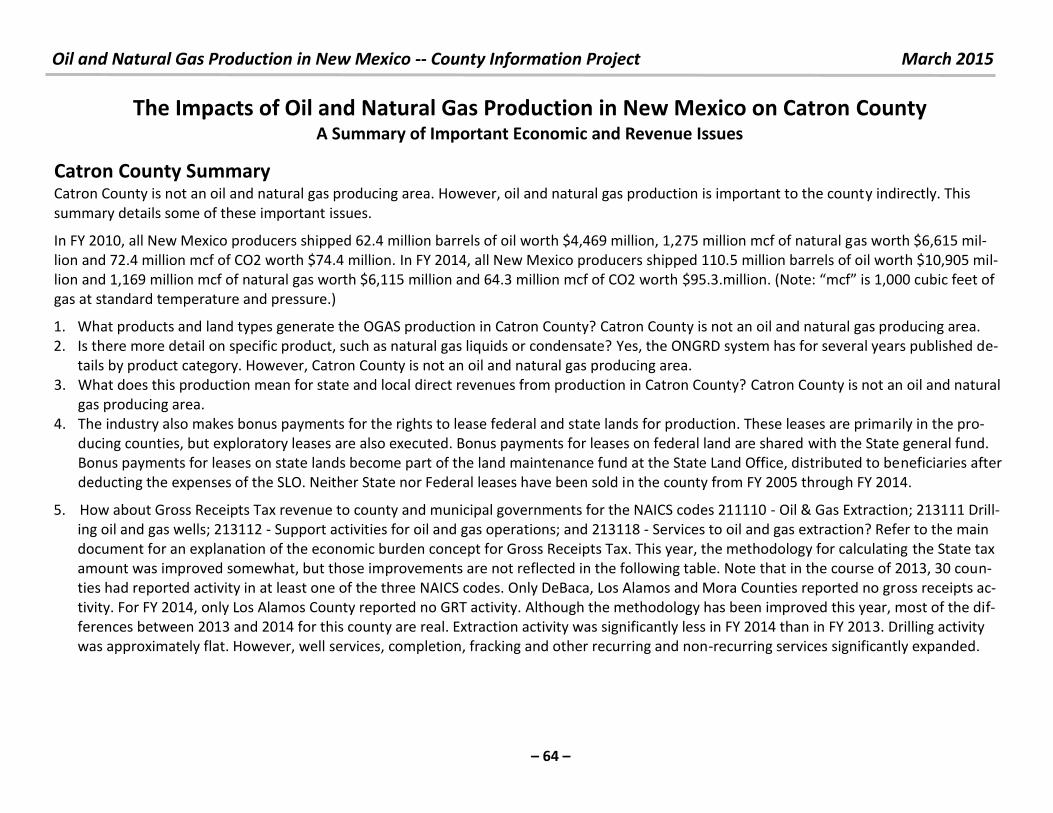
Oil and Natural Gas Production in New Mexico -- County Information Project March 2015
– 64 –
The Impacts of Oil and Natural Gas Production in New Mexico on Catron County A Summary of Important Economic and Revenue Issues
Catron County Summary Catron County is not an oil and natural gas producing area. However, oil and natural gas production is important to the county indirectly. This
summary details some of these important issues.
In FY 2010, all New Mexico producers shipped 62.4 million barrels of oil worth $4,469 million, 1,275 million mcf of natural gas worth $6,615 mil-
lion and 72.4 million mcf of CO2 worth $74.4 million. In FY 2014, all New Mexico producers shipped 110.5 million barrels of oil worth $10,905 mil-
lion and 1,169 million mcf of natural gas worth $6,115 million and 64.3 million mcf of CO2 worth $ . . illio . Note: f is , u i feet of gas at standard temperature and pressure.)
1. What products and land types generate the OGAS production in Catron County? Catron County is not an oil and natural gas producing area.
2. Is there more detail on specific product, such as natural gas liquids or condensate? Yes, the ONGRD system has for several years published de-
tails by product category. However, Catron County is not an oil and natural gas producing area.
3. What does this production mean for state and local direct revenues from production in Catron County? Catron County is not an oil and natural
gas producing area.
4. The industry also makes bonus payments for the rights to lease federal and state lands for production. These leases are primarily in the pro-
ducing counties, but exploratory leases are also executed. Bonus payments for leases on federal land are shared with the State general fund.
Bonus payments for leases on state lands become part of the land maintenance fund at the State Land Office, distributed to beneficiaries after
deducting the expenses of the SLO. Neither State nor Federal leases have been sold in the county from FY 2005 through FY 2014.
5. How about Gross Receipts Tax revenue to county and municipal governments for the NAICS codes 211110 - Oil & Gas Extraction; 213111 Drill-
ing oil and gas wells; 213112 - Support activities for oil and gas operations; and 213118 - Services to oil and gas extraction? Refer to the main
document for an explanation of the economic burden concept for Gross Receipts Tax. This year, the methodology for calculating the State tax
amount was improved somewhat, but those improvements are not reflected in the following table. Note that in the course of 2013, 30 coun-
ties had reported activity in at least one of the three NAICS codes. Only DeBaca, Los Alamos and Mora Counties reported no gross receipts ac-
tivity. For FY 2014, only Los Alamos County reported no GRT activity. Although the methodology has been improved this year, most of the dif-
ferences between 2013 and 2014 for this county are real. Extraction activity was significantly less in FY 2014 than in FY 2013. Drilling activity
was approximately flat. However, well services, completion, fracking and other recurring and non-recurring services significantly expanded.
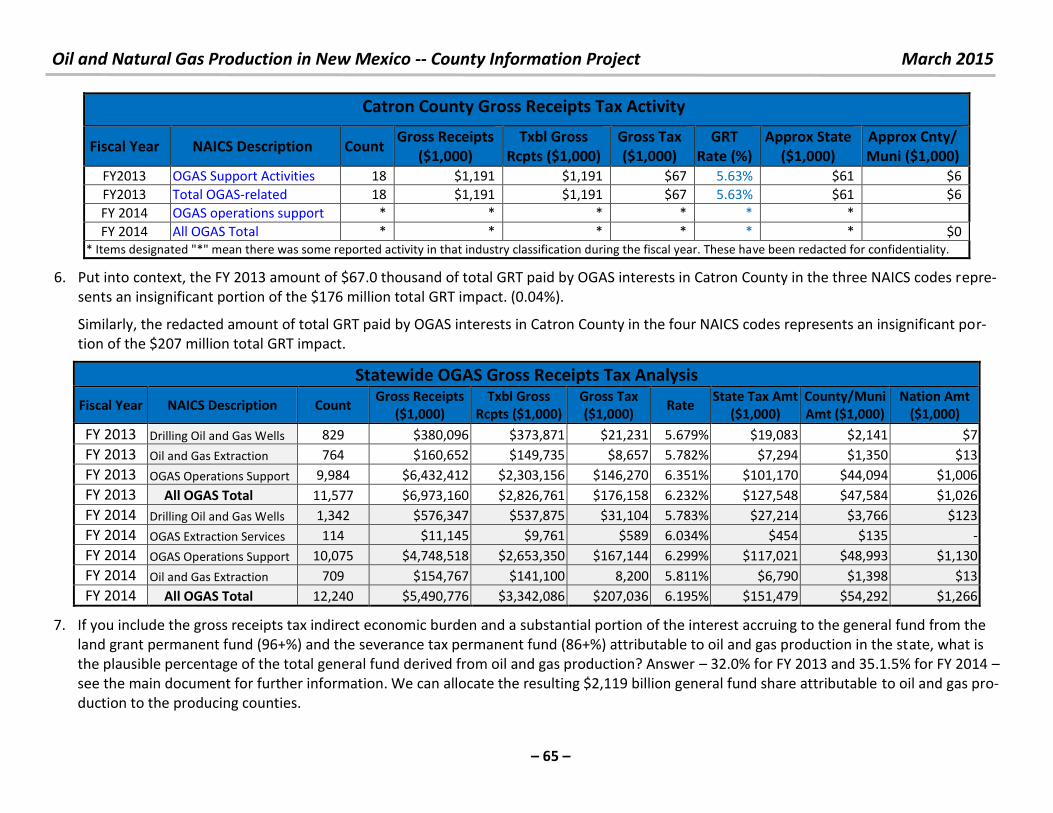
Oil and Natural Gas Production in New Mexico -- County Information Project March 2015
– 65 –
Catron County Gross Receipts Tax Activity
Fiscal Year NAICS Description Count Gross Receipts
($1,000)
Txbl Gross
Rcpts ($1,000)
Gross Tax
($1,000)
GRT
Rate (%)
Approx State
($1,000)
Approx Cnty/
Muni ($1,000)
FY2013 OGAS Support Activities 18 $1,191 $1,191 $67 5.63% $61 $6
FY2013 Total OGAS-related 18 $1,191 $1,191 $67 5.63% $61 $6
FY 2014 OGAS operations support * * * * * *
FY 2014 All OGAS Total * * * * * * $0
* Items designated "*" mean there was some reported activity in that industry classification during the fiscal year. These have been redacted for confidentiality.
6. Put into context, the FY 2013 amount of $67.0 thousand of total GRT paid by OGAS interests in Catron County in the three NAICS codes repre-
sents an insignificant portion of the $176 million total GRT impact. (0.04%).
Similarly, the redacted amount of total GRT paid by OGAS interests in Catron County in the four NAICS codes represents an insignificant por-
tion of the $207 million total GRT impact.
Statewide OGAS Gross Receipts Tax Analysis
Fiscal Year NAICS Description Count Gross Receipts
($1,000)
Txbl Gross
Rcpts ($1,000)
Gross Tax
($1,000) Rate
State Tax Amt
($1,000)
County/Muni
Amt ($1,000)
Nation Amt
($1,000)
FY 2013 Drilling Oil and Gas Wells 829 $380,096 $373,871 $21,231 5.679% $19,083 $2,141 $7
FY 2013 Oil and Gas Extraction 764 $160,652 $149,735 $8,657 5.782% $7,294 $1,350 $13
FY 2013 OGAS Operations Support 9,984 $6,432,412 $2,303,156 $146,270 6.351% $101,170 $44,094 $1,006
FY 2013 All OGAS Total 11,577 $6,973,160 $2,826,761 $176,158 6.232% $127,548 $47,584 $1,026
FY 2014 Drilling Oil and Gas Wells 1,342 $576,347 $537,875 $31,104 5.783% $27,214 $3,766 $123
FY 2014 OGAS Extraction Services 114 $11,145 $9,761 $589 6.034% $454 $135 -
FY 2014 OGAS Operations Support 10,075 $4,748,518 $2,653,350 $167,144 6.299% $117,021 $48,993 $1,130
FY 2014 Oil and Gas Extraction 709 $154,767 $141,100 8,200 5.811% $6,790 $1,398 $13
FY 2014 All OGAS Total 12,240 $5,490,776 $3,342,086 $207,036 6.195% $151,479 $54,292 $1,266
7. If you include the gross receipts tax indirect economic burden and a substantial portion of the interest accruing to the general fund from the
land grant permanent fund (96+%) and the severance tax permanent fund (86+%) attributable to oil and gas production in the state, what is
the plausible percentage of the total general fund derived from oil and gas production? Answer – 32.0% for FY 2013 and 35.1.5% for FY 2014 –
see the main document for further information. We can allocate the resulting $2,119 billion general fund share attributable to oil and gas pro-
duction to the producing counties.
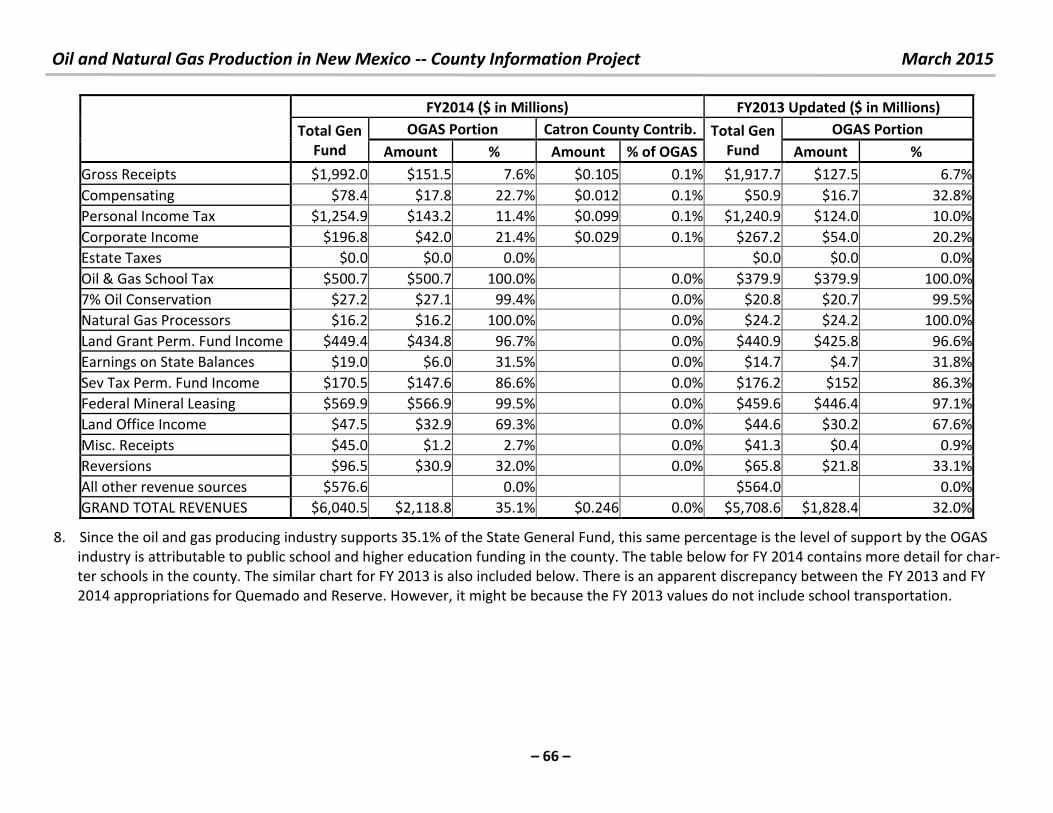
Oil and Natural Gas Production in New Mexico -- County Information Project March 2015
– 66 –
8. Since the oil and gas producing industry supports 35.1% of the State General Fund, this same percentage is the level of support by the OGAS
industry is attributable to public school and higher education funding in the county. The table below for FY 2014 contains more detail for char-
ter schools in the county. The similar chart for FY 2013 is also included below. There is an apparent discrepancy between the FY 2013 and FY
2014 appropriations for Quemado and Reserve. However, it might be because the FY 2013 values do not include school transportation.
FY2014 ($ in Millions) FY2013 Updated ($ in Millions)
Total Gen
Fund
OGAS Portion Catron County Contrib. Total Gen
Fund
OGAS Portion
Amount % Amount % of OGAS Amount %
Gross Receipts $1,992.0 $151.5 7.6% $0.105 0.1% $1,917.7 $127.5 6.7%
Compensating $78.4 $17.8 22.7% $0.012 0.1% $50.9 $16.7 32.8%
Personal Income Tax $1,254.9 $143.2 11.4% $0.099 0.1% $1,240.9 $124.0 10.0%
Corporate Income $196.8 $42.0 21.4% $0.029 0.1% $267.2 $54.0 20.2%
Estate Taxes $0.0 $0.0 0.0% $0.0 $0.0 0.0%
Oil & Gas School Tax $500.7 $500.7 100.0% 0.0% $379.9 $379.9 100.0%
7% Oil Conservation $27.2 $27.1 99.4% 0.0% $20.8 $20.7 99.5%
Natural Gas Processors $16.2 $16.2 100.0% 0.0% $24.2 $24.2 100.0%
Land Grant Perm. Fund Income $449.4 $434.8 96.7% 0.0% $440.9 $425.8 96.6%
Earnings on State Balances $19.0 $6.0 31.5% 0.0% $14.7 $4.7 31.8%
Sev Tax Perm. Fund Income $170.5 $147.6 86.6% 0.0% $176.2 $152 86.3%
Federal Mineral Leasing $569.9 $566.9 99.5% 0.0% $459.6 $446.4 97.1%
Land Office Income $47.5 $32.9 69.3% 0.0% $44.6 $30.2 67.6%
Misc. Receipts $45.0 $1.2 2.7% 0.0% $41.3 $0.4 0.9%
Reversions $96.5 $30.9 32.0% 0.0% $65.8 $21.8 33.1%
All other revenue sources $576.6 0.0% $564.0
0.0%
GRAND TOTAL REVENUES $6,040.5 $2,118.8 35.1% $0.246 0.0% $5,708.6 $1,828.4 32.0%
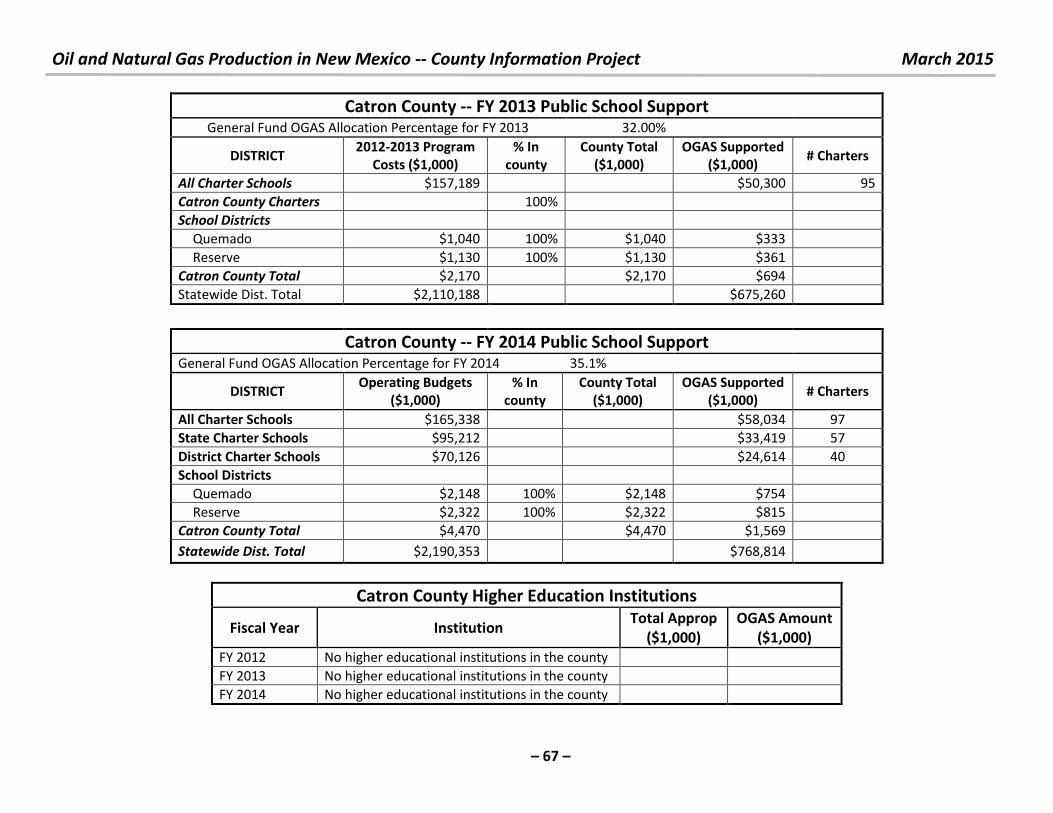
Oil and Natural Gas Production in New Mexico -- County Information Project March 2015
– 67 –
Catron County -- FY 2013 Public School Support General Fund OGAS Allocation Percentage for FY 2013 32.00%
DISTRICT 2012-2013 Program
Costs ($1,000)
% In
county
County Total
($1,000)
OGAS Supported
($1,000) # Charters
All Charter Schools $157,189
$50,300 95
Catron County Charters
100%
School Districts
Quemado $1,040 100% $1,040 $333
Reserve $1,130 100% $1,130 $361
Catron County Total $2,170
$2,170 $694
Statewide Dist. Total $2,110,188
$675,260
Catron County -- FY 2014 Public School Support
General Fund OGAS Allocation Percentage for FY 2014 35.1%
DISTRICT Operating Budgets
($1,000)
% In
county
County Total
($1,000)
OGAS Supported
($1,000) # Charters
All Charter Schools $165,338 $58,034 97
State Charter Schools $95,212 $33,419 57
District Charter Schools $70,126 $24,614 40
School Districts
Quemado $2,148 100% $2,148 $754
Reserve $2,322 100% $2,322 $815
Catron County Total $4,470 $4,470 $1,569
Statewide Dist. Total $2,190,353 $768,814
Catron County Higher Education Institutions
Fiscal Year Institution Total Approp
($1,000)
OGAS Amount
($1,000)
FY 2012 No higher educational institutions in the county
FY 2013 No higher educational institutions in the county
FY 2014 No higher educational institutions in the county
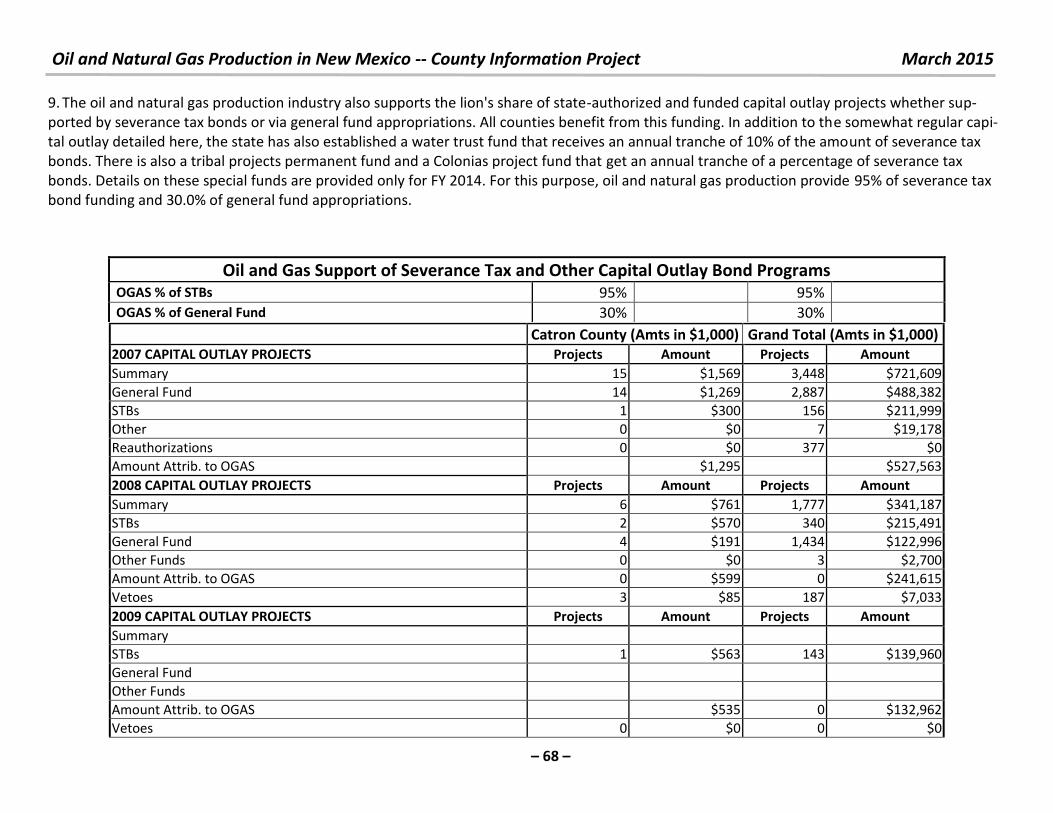
Oil and Natural Gas Production in New Mexico -- County Information Project March 2015
– 68 –
9. The oil and natural gas production industry also supports the lion's share of state-authorized and funded capital outlay projects whether sup-
ported by severance tax bonds or via general fund appropriations. All counties benefit from this funding. In addition to the somewhat regular capi-
tal outlay detailed here, the state has also established a water trust fund that receives an annual tranche of 10% of the amount of severance tax
bonds. There is also a tribal projects permanent fund and a Colonias project fund that get an annual tranche of a percentage of severance tax
bonds. Details on these special funds are provided only for FY 2014. For this purpose, oil and natural gas production provide 95% of severance tax
bond funding and 30.0% of general fund appropriations.
Oil and Gas Support of Severance Tax and Other Capital Outlay Bond Programs OGAS % of STBs 95% 95%
OGAS % of General Fund 30% 30%
Catron County (Amts in $1,000) Grand Total (Amts in $1,000)
2007 CAPITAL OUTLAY PROJECTS Projects Amount Projects Amount
Summary 15 $1,569 3,448 $721,609
General Fund 14 $1,269 2,887 $488,382
STBs 1 $300 156 $211,999
Other 0 $0 7 $19,178
Reauthorizations 0 $0 377 $0
Amount Attrib. to OGAS $1,295 $527,563
2008 CAPITAL OUTLAY PROJECTS Projects Amount Projects Amount
Summary 6 $761 1,777 $341,187
STBs 2 $570 340 $215,491
General Fund 4 $191 1,434 $122,996
Other Funds 0 $0 3 $2,700
Amount Attrib. to OGAS 0 $599 0 $241,615
Vetoes 3 $85 187 $7,033
2009 CAPITAL OUTLAY PROJECTS Projects Amount Projects Amount
Summary
STBs 1 $563 143 $139,960
General Fund
Other Funds
Amount Attrib. to OGAS $535 0 $132,962
Vetoes 0 $0 0 $0
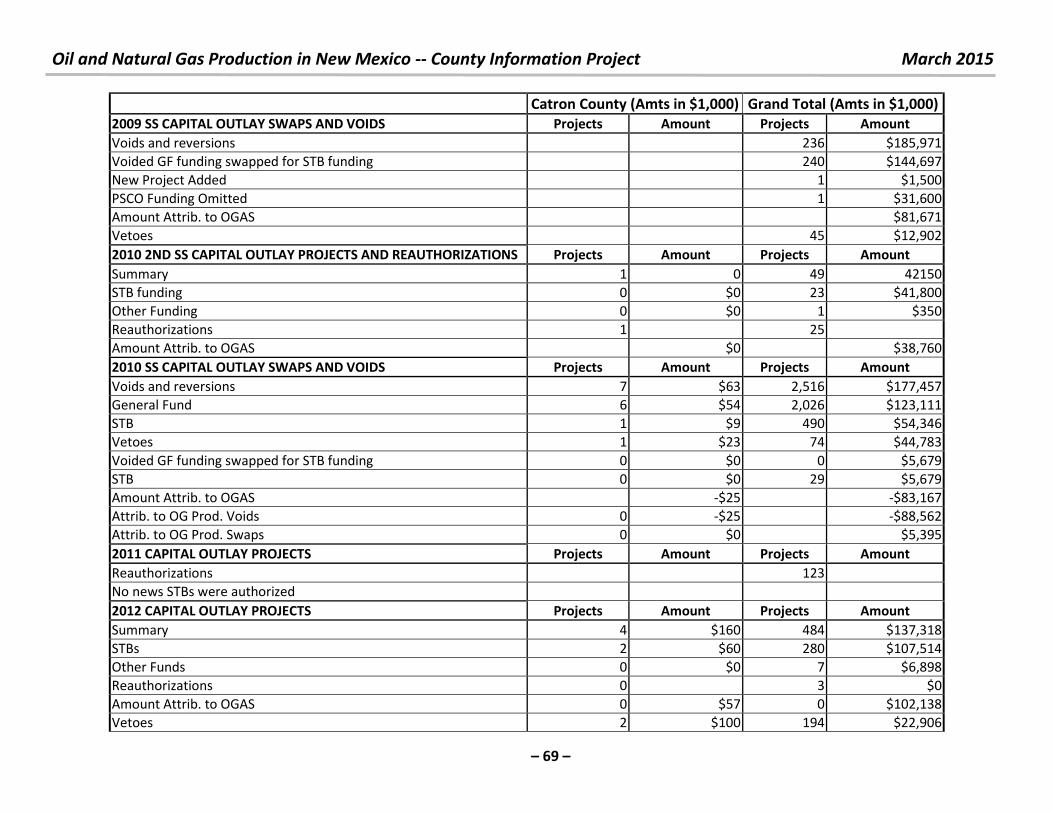
Oil and Natural Gas Production in New Mexico -- County Information Project March 2015
– 69 –
Catron County (Amts in $1,000) Grand Total (Amts in $1,000)
2009 SS CAPITAL OUTLAY SWAPS AND VOIDS Projects Amount Projects Amount
Voids and reversions 236 $185,971
Voided GF funding swapped for STB funding 240 $144,697
New Project Added 1 $1,500
PSCO Funding Omitted 1 $31,600
Amount Attrib. to OGAS $81,671
Vetoes 45 $12,902
2010 2ND SS CAPITAL OUTLAY PROJECTS AND REAUTHORIZATIONS Projects Amount Projects Amount
Summary 1 0 49 42150
STB funding 0 $0 23 $41,800
Other Funding 0 $0 1 $350
Reauthorizations 1 25
Amount Attrib. to OGAS $0 $38,760
2010 SS CAPITAL OUTLAY SWAPS AND VOIDS Projects Amount Projects Amount
Voids and reversions 7 $63 2,516 $177,457
General Fund 6 $54 2,026 $123,111
STB 1 $9 490 $54,346
Vetoes 1 $23 74 $44,783
Voided GF funding swapped for STB funding 0 $0 0 $5,679
STB 0 $0 29 $5,679
Amount Attrib. to OGAS -$25 -$83,167
Attrib. to OG Prod. Voids 0 -$25 -$88,562
Attrib. to OG Prod. Swaps 0 $0 $5,395
2011 CAPITAL OUTLAY PROJECTS Projects Amount Projects Amount
Reauthorizations 123
No news STBs were authorized
2012 CAPITAL OUTLAY PROJECTS Projects Amount Projects Amount
Summary 4 $160 484 $137,318
STBs 2 $60 280 $107,514
Other Funds 0 $0 7 $6,898
Reauthorizations 0 3 $0
Amount Attrib. to OGAS 0 $57 0 $102,138
Vetoes 2 $100 194 $22,906

Oil and Natural Gas Production in New Mexico -- County Information Project March 2015
– 70 –
Catron County (Amts in $1,000) Grand Total (Amts in $1,000)
2013 CAPITAL OUTLAY PROJECTS Projects Amount Projects Amount
Summary 2 $250 785 $269,340
STBs 2 $250 769 $218,132
Other Funds 0 $0 16 $51,208
Amount Attrib. to OGAS 0 $238 0 $207,225
Vetoes 0 $0 72 $4,402
2014 CAPITAL OUTLAY PROJECTS Projects Amount Projects Amount
Summary 2 $204 852 $228,711
STBs 2 $204 823 $182,237
Other Funds, ex. WTF and Colonias projects 0 $0 28 $46,474
Water Trust Fund Projects 0 $0 24 $33,048
Colonias Projects 0 $0 37 $16,640
Amount Attrib. to OGAS $196 $268,412
Vetoes 0 $0 62 $2,584

Oil and Natural Gas Production in New Mexico -- County Information Project March 2015
– 71 –
10. For questions, comments or criticisms of this work, contact:
Laird Graeser
505 424-9023
or
Richard L. Anklam, President & Executive Director, New Mexico Tax Research Institute
505-269-6791
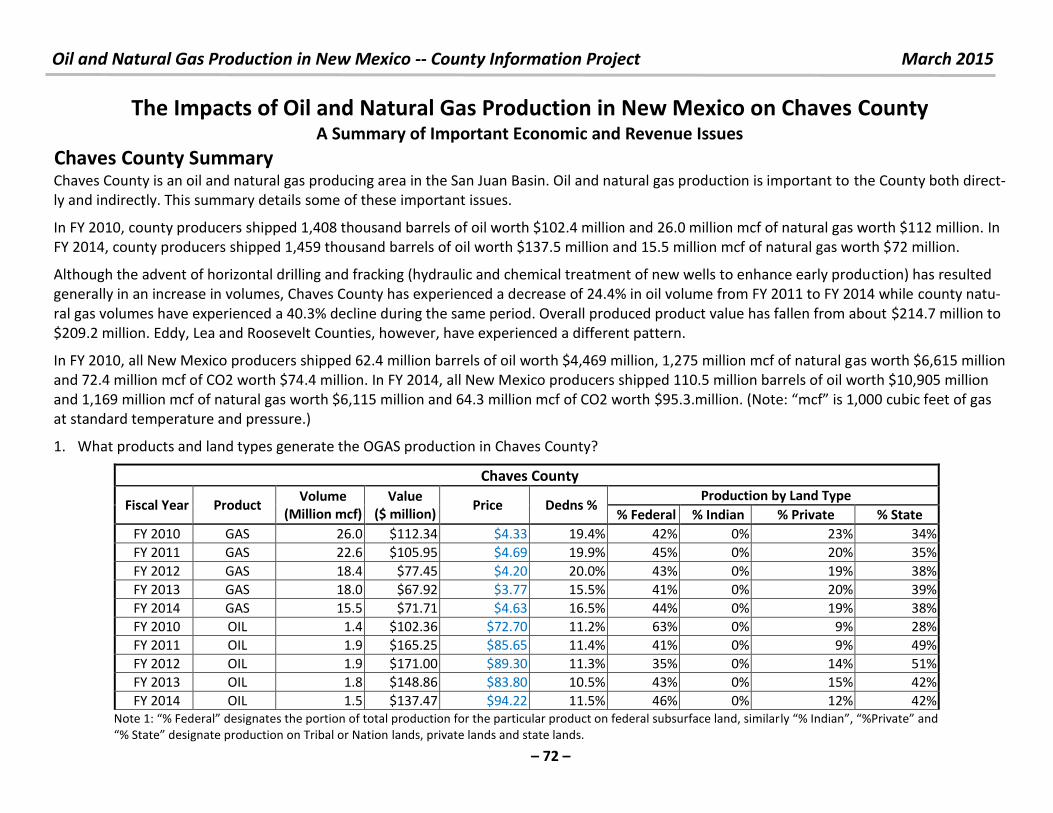
Oil and Natural Gas Production in New Mexico -- County Information Project March 2015
– 72 –
The Impacts of Oil and Natural Gas Production in New Mexico on Chaves County A Summary of Important Economic and Revenue Issues
Chaves County Summary Chaves County is an oil and natural gas producing area in the San Juan Basin. Oil and natural gas production is important to the County both direct-
ly and indirectly. This summary details some of these important issues.
In FY 2010, county producers shipped 1,408 thousand barrels of oil worth $102.4 million and 26.0 million mcf of natural gas worth $112 million. In
FY 2014, county producers shipped 1,459 thousand barrels of oil worth $137.5 million and 15.5 million mcf of natural gas worth $72 million.
Although the advent of horizontal drilling and fracking (hydraulic and chemical treatment of new wells to enhance early production) has resulted
generally in an increase in volumes, Chaves County has experienced a decrease of 24.4% in oil volume from FY 2011 to FY 2014 while county natu-
ral gas volumes have experienced a 40.3% decline during the same period. Overall produced product value has fallen from about $214.7 million to
$209.2 million. Eddy, Lea and Roosevelt Counties, however, have experienced a different pattern.
In FY 2010, all New Mexico producers shipped 62.4 million barrels of oil worth $4,469 million, 1,275 million mcf of natural gas worth $6,615 million
and 72.4 million mcf of CO2 worth $74.4 million. In FY 2014, all New Mexico producers shipped 110.5 million barrels of oil worth $10,905 million
and 1,169 million mcf of natural gas worth $6,115 million and 64.3 million mcf of CO2 worth $ . . illio . Note: f is , u i feet of gas at standard temperature and pressure.)
1. What products and land types generate the OGAS production in Chaves County?
Chaves County
Fiscal Year Product Volume
(Million mcf)
Value
($ million) Price Dedns %
Production by Land Type
% Federal % Indian % Private % State
FY 2010 GAS 26.0 $112.34 $4.33 19.4% 42% 0% 23% 34%
FY 2011 GAS 22.6 $105.95 $4.69 19.9% 45% 0% 20% 35%
FY 2012 GAS 18.4 $77.45 $4.20 20.0% 43% 0% 19% 38%
FY 2013 GAS 18.0 $67.92 $3.77 15.5% 41% 0% 20% 39%
FY 2014 GAS 15.5 $71.71 $4.63 16.5% 44% 0% 19% 38%
FY 2010 OIL 1.4 $102.36 $72.70 11.2% 63% 0% 9% 28%
FY 2011 OIL 1.9 $165.25 $85.65 11.4% 41% 0% 9% 49%
FY 2012 OIL 1.9 $171.00 $89.30 11.3% 35% 0% 14% 51%
FY 2013 OIL 1.8 $148.86 $83.80 10.5% 43% 0% 15% 42%
FY 2014 OIL 1.5 $137.47 $94.22 11.5% 46% 0% 12% 42%
Note : % Fede al desig ates the po tio of total p odu tio fo the pa ti ula p odu t o fede al su su fa e la d, si ila l % I dia , %P i ate a d % “tate desig ate p odu tio o T i al o Natio lands, private lands and state lands.
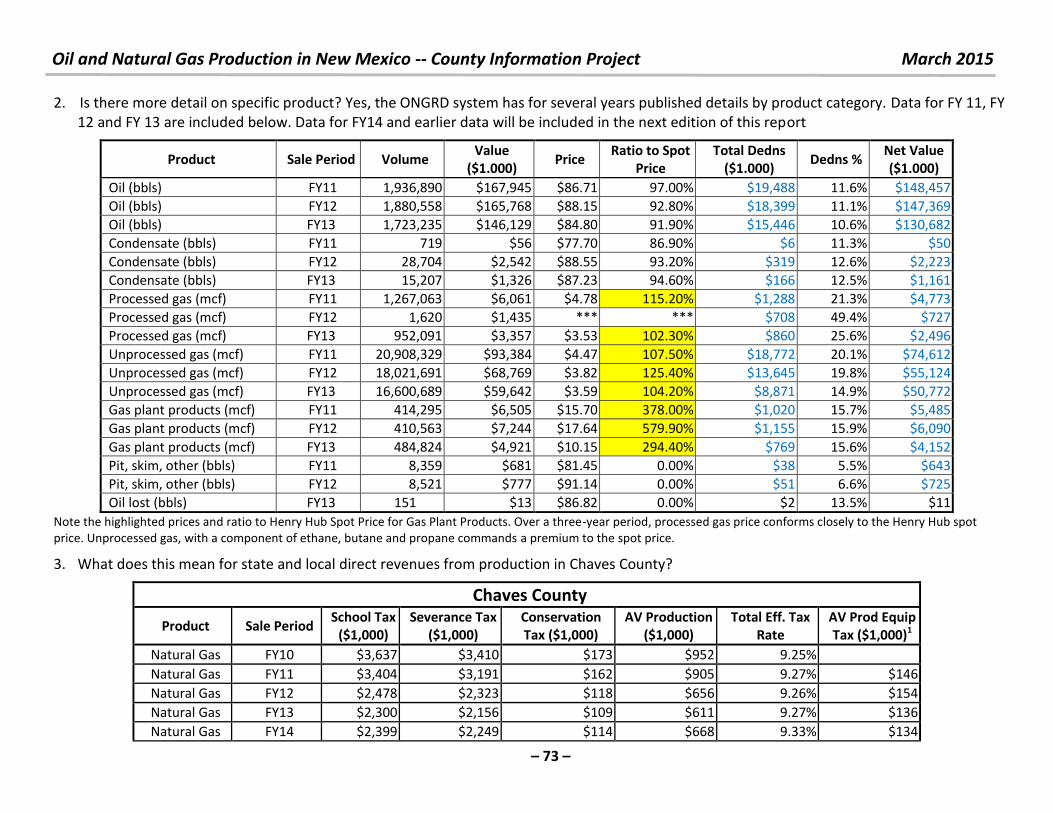
Oil and Natural Gas Production in New Mexico -- County Information Project March 2015
– 73 –
2. Is there more detail on specific product? Yes, the ONGRD system has for several years published details by product category. Data for FY 11, FY
12 and FY 13 are included below. Data for FY14 and earlier data will be included in the next edition of this report
Product Sale Period Volume Value
($1.000) Price
Ratio to Spot
Price
Total Dedns
($1.000) Dedns %
Net Value
($1.000)
Oil (bbls) FY11 1,936,890 $167,945 $86.71 97.00% $19,488 11.6% $148,457
Oil (bbls) FY12 1,880,558 $165,768 $88.15 92.80% $18,399 11.1% $147,369
Oil (bbls) FY13 1,723,235 $146,129 $84.80 91.90% $15,446 10.6% $130,682
Condensate (bbls) FY11 719 $56 $77.70 86.90% $6 11.3% $50
Condensate (bbls) FY12 28,704 $2,542 $88.55 93.20% $319 12.6% $2,223
Condensate (bbls) FY13 15,207 $1,326 $87.23 94.60% $166 12.5% $1,161
Processed gas (mcf) FY11 1,267,063 $6,061 $4.78 115.20% $1,288 21.3% $4,773
Processed gas (mcf) FY12 1,620 $1,435 *** *** $708 49.4% $727
Processed gas (mcf) FY13 952,091 $3,357 $3.53 102.30% $860 25.6% $2,496
Unprocessed gas (mcf) FY11 20,908,329 $93,384 $4.47 107.50% $18,772 20.1% $74,612
Unprocessed gas (mcf) FY12 18,021,691 $68,769 $3.82 125.40% $13,645 19.8% $55,124
Unprocessed gas (mcf) FY13 16,600,689 $59,642 $3.59 104.20% $8,871 14.9% $50,772
Gas plant products (mcf) FY11 414,295 $6,505 $15.70 378.00% $1,020 15.7% $5,485
Gas plant products (mcf) FY12 410,563 $7,244 $17.64 579.90% $1,155 15.9% $6,090
Gas plant products (mcf) FY13 484,824 $4,921 $10.15 294.40% $769 15.6% $4,152
Pit, skim, other (bbls) FY11 8,359 $681 $81.45 0.00% $38 5.5% $643
Pit, skim, other (bbls) FY12 8,521 $777 $91.14 0.00% $51 6.6% $725
Oil lost (bbls) FY13 151 $13 $86.82 0.00% $2 13.5% $11
Note the highlighted prices and ratio to Henry Hub Spot Price for Gas Plant Products. Over a three-year period, processed gas price conforms closely to the Henry Hub spot
price. Unprocessed gas, with a component of ethane, butane and propane commands a premium to the spot price.
3. What does this mean for state and local direct revenues from production in Chaves County?
Chaves County
Product Sale Period School Tax
($1,000)
Severance Tax
($1,000)
Conservation
Tax ($1,000)
AV Production
($1,000)
Total Eff. Tax
Rate
AV Prod Equip
Tax ($1,000)1
Natural Gas FY10 $3,637 $3,410 $173 $952 9.25%
Natural Gas FY11 $3,404 $3,191 $162 $905 9.27% $146
Natural Gas FY12 $2,478 $2,323 $118 $656 9.26% $154
Natural Gas FY13 $2,300 $2,156 $109 $611 9.27% $136
Natural Gas FY14 $2,399 $2,249 $114 $668 9.33% $134
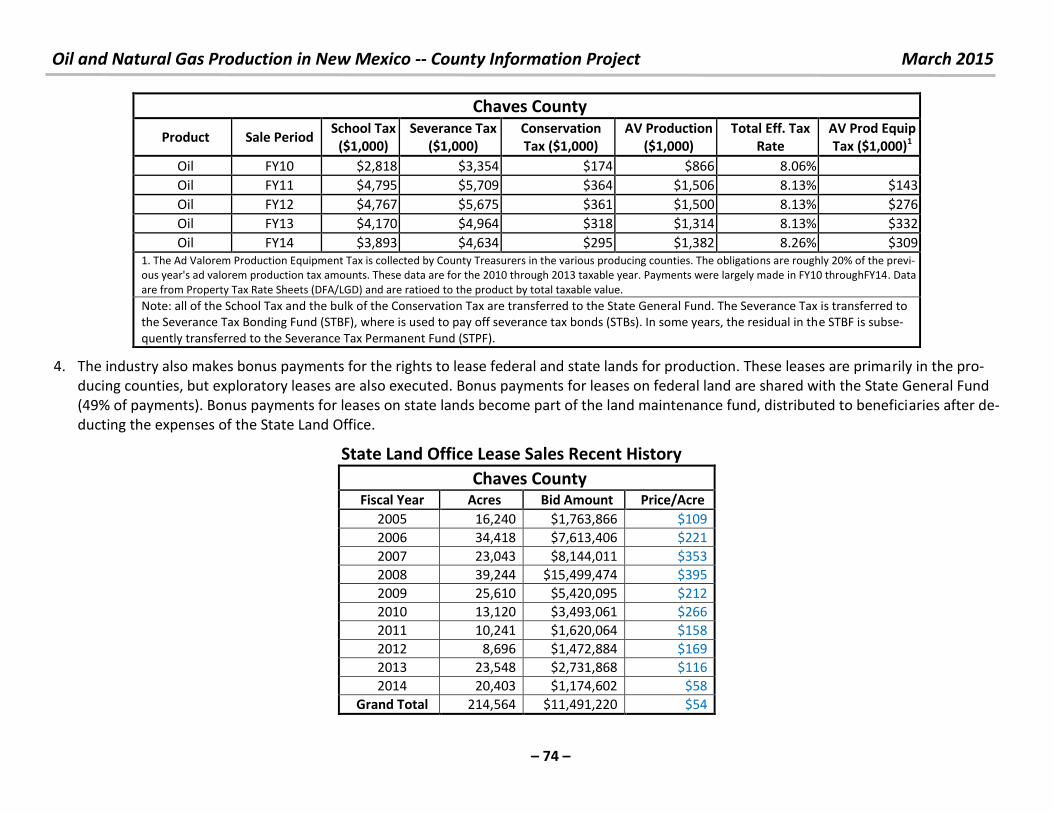
Oil and Natural Gas Production in New Mexico -- County Information Project March 2015
– 74 –
Chaves County
Product Sale Period School Tax
($1,000)
Severance Tax
($1,000)
Conservation
Tax ($1,000)
AV Production
($1,000)
Total Eff. Tax
Rate
AV Prod Equip
Tax ($1,000)1
Oil FY10 $2,818 $3,354 $174 $866 8.06%
Oil FY11 $4,795 $5,709 $364 $1,506 8.13% $143
Oil FY12 $4,767 $5,675 $361 $1,500 8.13% $276
Oil FY13 $4,170 $4,964 $318 $1,314 8.13% $332
Oil FY14 $3,893 $4,634 $295 $1,382 8.26% $309
1. The Ad Valorem Production Equipment Tax is collected by County Treasurers in the various producing counties. The obligations are roughly 20% of the previ-
ous year's ad valorem production tax amounts. These data are for the 2010 through 2013 taxable year. Payments were largely made in FY10 throughFY14. Data
are from Property Tax Rate Sheets (DFA/LGD) and are ratioed to the product by total taxable value.
Note: all of the School Tax and the bulk of the Conservation Tax are transferred to the State General Fund. The Severance Tax is transferred to
the Severance Tax Bonding Fund (STBF), where is used to pay off severance tax bonds (STBs). In some years, the residual in the STBF is subse-
quently transferred to the Severance Tax Permanent Fund (STPF).
4. The industry also makes bonus payments for the rights to lease federal and state lands for production. These leases are primarily in the pro-
ducing counties, but exploratory leases are also executed. Bonus payments for leases on federal land are shared with the State General Fund
(49% of payments). Bonus payments for leases on state lands become part of the land maintenance fund, distributed to beneficiaries after de-
ducting the expenses of the State Land Office.
State Land Office Lease Sales Recent History
Chaves County Fiscal Year Acres Bid Amount Price/Acre
2005 16,240 $1,763,866 $109
2006 34,418 $7,613,406 $221
2007 23,043 $8,144,011 $353
2008 39,244 $15,499,474 $395
2009 25,610 $5,420,095 $212
2010 13,120 $3,493,061 $266
2011 10,241 $1,620,064 $158
2012 8,696 $1,472,884 $169
2013 23,548 $2,731,868 $116
2014 20,403 $1,174,602 $58
Grand Total 214,564 $11,491,220 $54
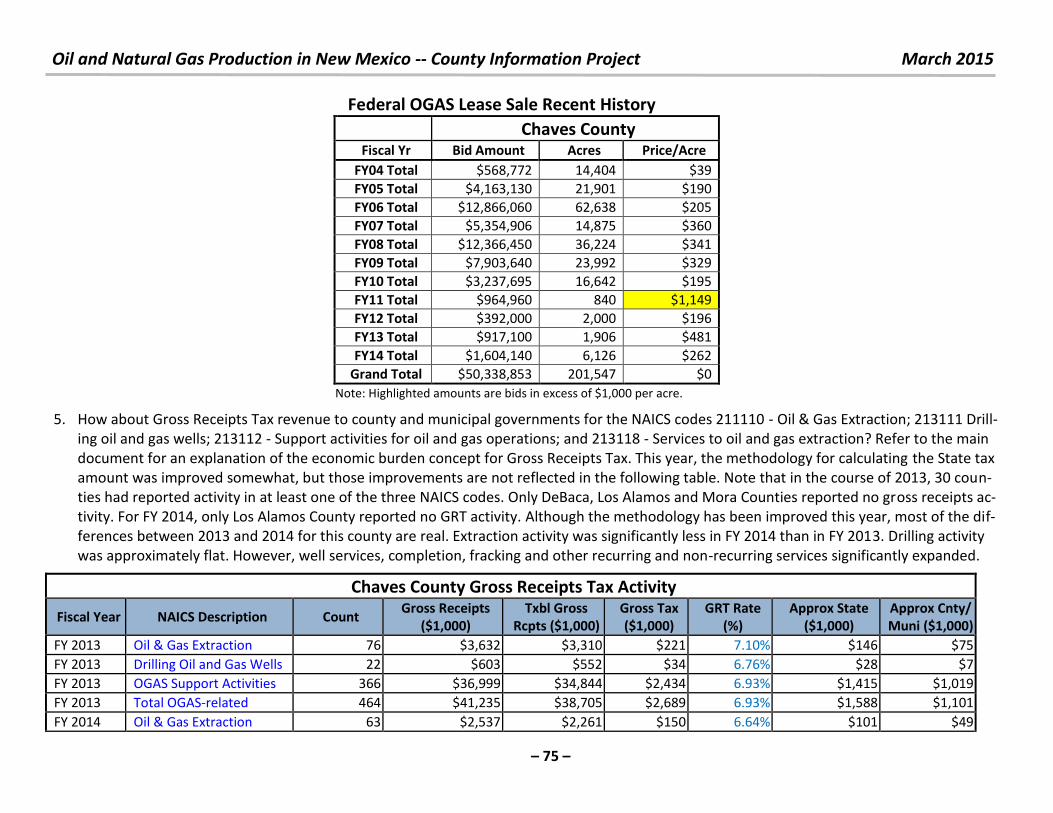
Oil and Natural Gas Production in New Mexico -- County Information Project March 2015
– 75 –
Federal OGAS Lease Sale Recent History
Chaves County
Fiscal Yr Bid Amount Acres Price/Acre
FY04 Total $568,772 14,404 $39
FY05 Total $4,163,130 21,901 $190
FY06 Total $12,866,060 62,638 $205
FY07 Total $5,354,906 14,875 $360
FY08 Total $12,366,450 36,224 $341
FY09 Total $7,903,640 23,992 $329
FY10 Total $3,237,695 16,642 $195
FY11 Total $964,960 840 $1,149
FY12 Total $392,000 2,000 $196
FY13 Total $917,100 1,906 $481
FY14 Total $1,604,140 6,126 $262
Grand Total $50,338,853 201,547 $0
Note: Highlighted amounts are bids in excess of $1,000 per acre.
5. How about Gross Receipts Tax revenue to county and municipal governments for the NAICS codes 211110 - Oil & Gas Extraction; 213111 Drill-
ing oil and gas wells; 213112 - Support activities for oil and gas operations; and 213118 - Services to oil and gas extraction? Refer to the main
document for an explanation of the economic burden concept for Gross Receipts Tax. This year, the methodology for calculating the State tax
amount was improved somewhat, but those improvements are not reflected in the following table. Note that in the course of 2013, 30 coun-
ties had reported activity in at least one of the three NAICS codes. Only DeBaca, Los Alamos and Mora Counties reported no gross receipts ac-
tivity. For FY 2014, only Los Alamos County reported no GRT activity. Although the methodology has been improved this year, most of the dif-
ferences between 2013 and 2014 for this county are real. Extraction activity was significantly less in FY 2014 than in FY 2013. Drilling activity
was approximately flat. However, well services, completion, fracking and other recurring and non-recurring services significantly expanded.
Chaves County Gross Receipts Tax Activity
Fiscal Year NAICS Description Count Gross Receipts
($1,000)
Txbl Gross
Rcpts ($1,000)
Gross Tax
($1,000)
GRT Rate
(%)
Approx State
($1,000)
Approx Cnty/
Muni ($1,000)
FY 2013 Oil & Gas Extraction 76 $3,632 $3,310 $221 7.10% $146 $75
FY 2013 Drilling Oil and Gas Wells 22 $603 $552 $34 6.76% $28 $7
FY 2013 OGAS Support Activities 366 $36,999 $34,844 $2,434 6.93% $1,415 $1,019
FY 2013 Total OGAS-related 464 $41,235 $38,705 $2,689 6.93% $1,588 $1,101
FY 2014 Oil & Gas Extraction 63 $2,537 $2,261 $150 6.64% $101 $49
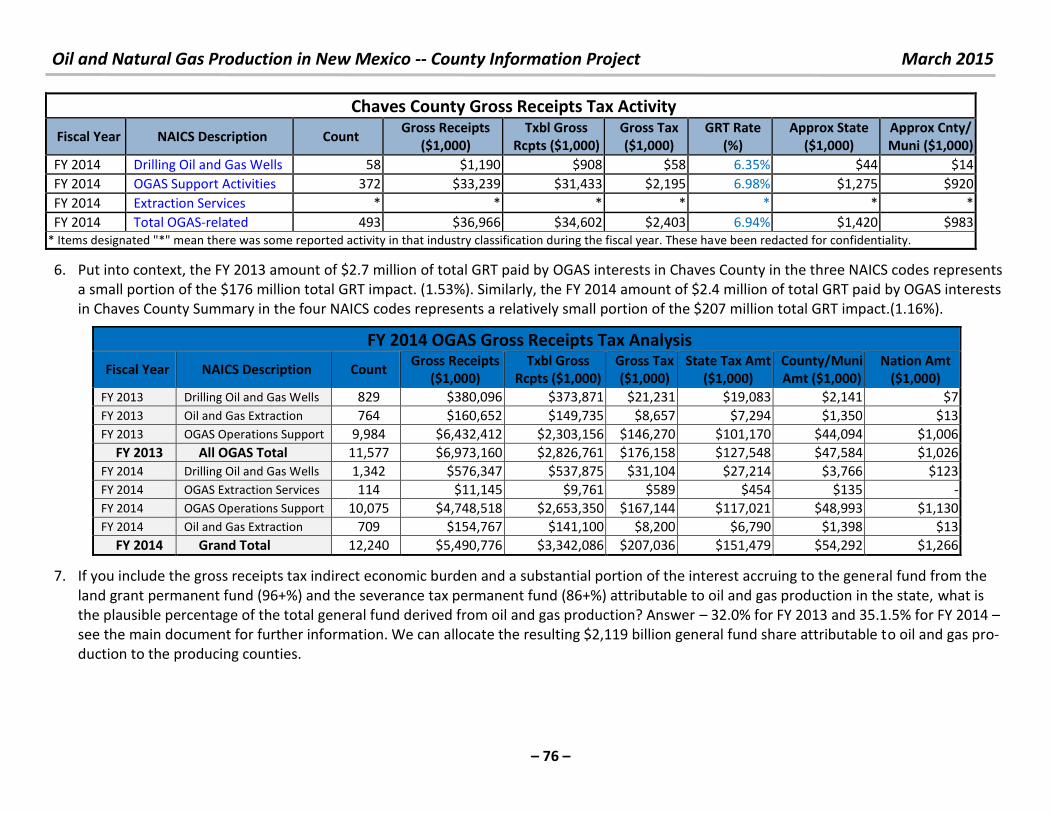
Oil and Natural Gas Production in New Mexico -- County Information Project March 2015
– 76 –
Chaves County Gross Receipts Tax Activity
Fiscal Year NAICS Description Count Gross Receipts
($1,000)
Txbl Gross
Rcpts ($1,000)
Gross Tax
($1,000)
GRT Rate
(%)
Approx State
($1,000)
Approx Cnty/
Muni ($1,000)
FY 2014 Drilling Oil and Gas Wells 58 $1,190 $908 $58 6.35% $44 $14
FY 2014 OGAS Support Activities 372 $33,239 $31,433 $2,195 6.98% $1,275 $920
FY 2014 Extraction Services * * * * * * *
FY 2014 Total OGAS-related 493 $36,966 $34,602 $2,403 6.94% $1,420 $983
* Items designated "*" mean there was some reported activity in that industry classification during the fiscal year. These have been redacted for confidentiality. 6. Put into context, the FY 2013 amount of $2.7 million of total GRT paid by OGAS interests in Chaves County in the three NAICS codes represents
a small portion of the $176 million total GRT impact. (1.53%). Similarly, the FY 2014 amount of $2.4 million of total GRT paid by OGAS interests
in Chaves County Summary in the four NAICS codes represents a relatively small portion of the $207 million total GRT impact.(1.16%).
FY 2014 OGAS Gross Receipts Tax Analysis
Fiscal Year NAICS Description Count Gross Receipts
($1,000)
Txbl Gross
Rcpts ($1,000)
Gross Tax
($1,000)
State Tax Amt
($1,000)
County/Muni
Amt ($1,000)
Nation Amt
($1,000)
FY 2013 Drilling Oil and Gas Wells 829 $380,096 $373,871 $21,231 $19,083 $2,141 $7
FY 2013 Oil and Gas Extraction 764 $160,652 $149,735 $8,657 $7,294 $1,350 $13
FY 2013 OGAS Operations Support 9,984 $6,432,412 $2,303,156 $146,270 $101,170 $44,094 $1,006
FY 2013 All OGAS Total 11,577 $6,973,160 $2,826,761 $176,158 $127,548 $47,584 $1,026
FY 2014 Drilling Oil and Gas Wells 1,342 $576,347 $537,875 $31,104 $27,214 $3,766 $123
FY 2014 OGAS Extraction Services 114 $11,145 $9,761 $589 $454 $135 -
FY 2014 OGAS Operations Support 10,075 $4,748,518 $2,653,350 $167,144 $117,021 $48,993 $1,130
FY 2014 Oil and Gas Extraction 709 $154,767 $141,100 $8,200 $6,790 $1,398 $13
FY 2014 Grand Total 12,240 $5,490,776 $3,342,086 $207,036 $151,479 $54,292 $1,266 7. If you include the gross receipts tax indirect economic burden and a substantial portion of the interest accruing to the general fund from the
land grant permanent fund (96+%) and the severance tax permanent fund (86+%) attributable to oil and gas production in the state, what is
the plausible percentage of the total general fund derived from oil and gas production? Answer – 32.0% for FY 2013 and 35.1.5% for FY 2014 –
see the main document for further information. We can allocate the resulting $2,119 billion general fund share attributable to oil and gas pro-
duction to the producing counties.
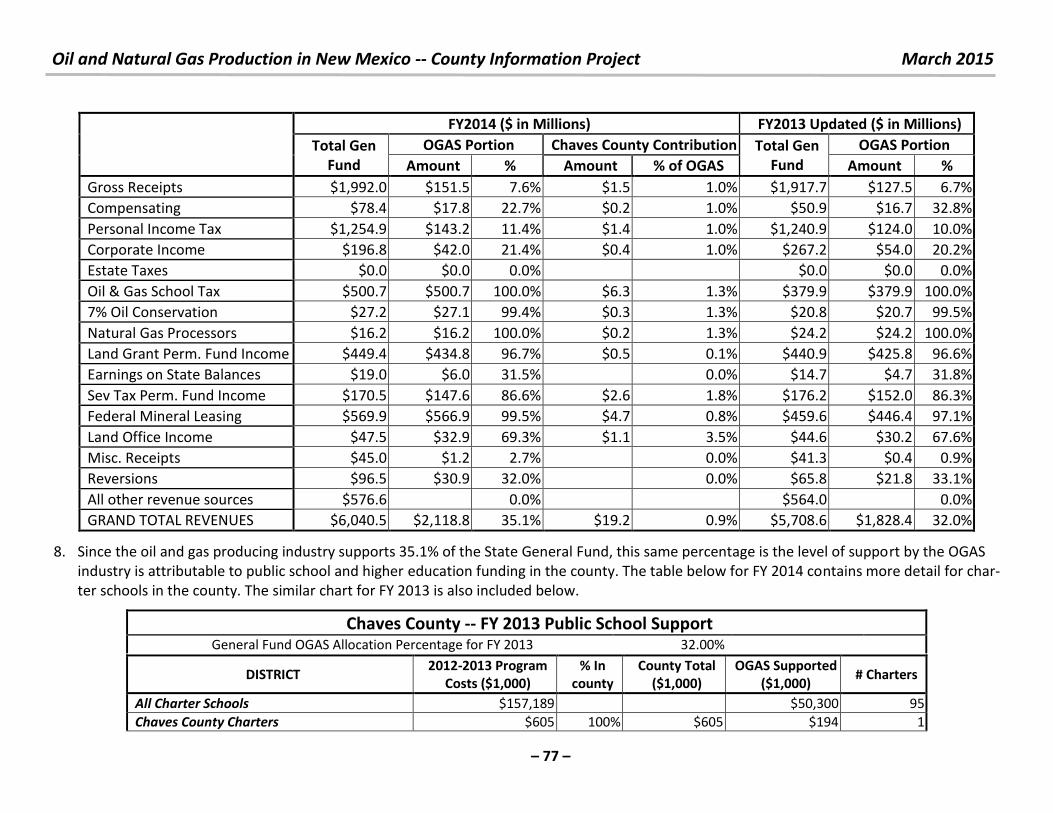
Oil and Natural Gas Production in New Mexico -- County Information Project March 2015
– 77 –
FY2014 ($ in Millions) FY2013 Updated ($ in Millions)
Total Gen
Fund
OGAS Portion Chaves County Contribution Total Gen
Fund
OGAS Portion
Amount % Amount % of OGAS Amount %
Gross Receipts $1,992.0 $151.5 7.6% $1.5 1.0% $1,917.7 $127.5 6.7%
Compensating $78.4 $17.8 22.7% $0.2 1.0% $50.9 $16.7 32.8%
Personal Income Tax $1,254.9 $143.2 11.4% $1.4 1.0% $1,240.9 $124.0 10.0%
Corporate Income $196.8 $42.0 21.4% $0.4 1.0% $267.2 $54.0 20.2%
Estate Taxes $0.0 $0.0 0.0%
$0.0 $0.0 0.0%
Oil & Gas School Tax $500.7 $500.7 100.0% $6.3 1.3% $379.9 $379.9 100.0%
7% Oil Conservation $27.2 $27.1 99.4% $0.3 1.3% $20.8 $20.7 99.5%
Natural Gas Processors $16.2 $16.2 100.0% $0.2 1.3% $24.2 $24.2 100.0%
Land Grant Perm. Fund Income $449.4 $434.8 96.7% $0.5 0.1% $440.9 $425.8 96.6%
Earnings on State Balances $19.0 $6.0 31.5% 0.0% $14.7 $4.7 31.8%
Sev Tax Perm. Fund Income $170.5 $147.6 86.6% $2.6 1.8% $176.2 $152.0 86.3%
Federal Mineral Leasing $569.9 $566.9 99.5% $4.7 0.8% $459.6 $446.4 97.1%
Land Office Income $47.5 $32.9 69.3% $1.1 3.5% $44.6 $30.2 67.6%
Misc. Receipts $45.0 $1.2 2.7%
0.0% $41.3 $0.4 0.9%
Reversions $96.5 $30.9 32.0%
0.0% $65.8 $21.8 33.1%
All other revenue sources $576.6
0.0%
$564.0
0.0%
GRAND TOTAL REVENUES $6,040.5 $2,118.8 35.1% $19.2 0.9% $5,708.6 $1,828.4 32.0% 8. Since the oil and gas producing industry supports 35.1% of the State General Fund, this same percentage is the level of support by the OGAS
industry is attributable to public school and higher education funding in the county. The table below for FY 2014 contains more detail for char-
ter schools in the county. The similar chart for FY 2013 is also included below.
Chaves County -- FY 2013 Public School Support General Fund OGAS Allocation Percentage for FY 2013 32.00%
DISTRICT 2012-2013 Program
Costs ($1,000)
% In
county
County Total
($1,000)
OGAS Supported
($1,000) # Charters
All Charter Schools $157,189 $50,300 95
Chaves County Charters $605 100% $605 $194 1
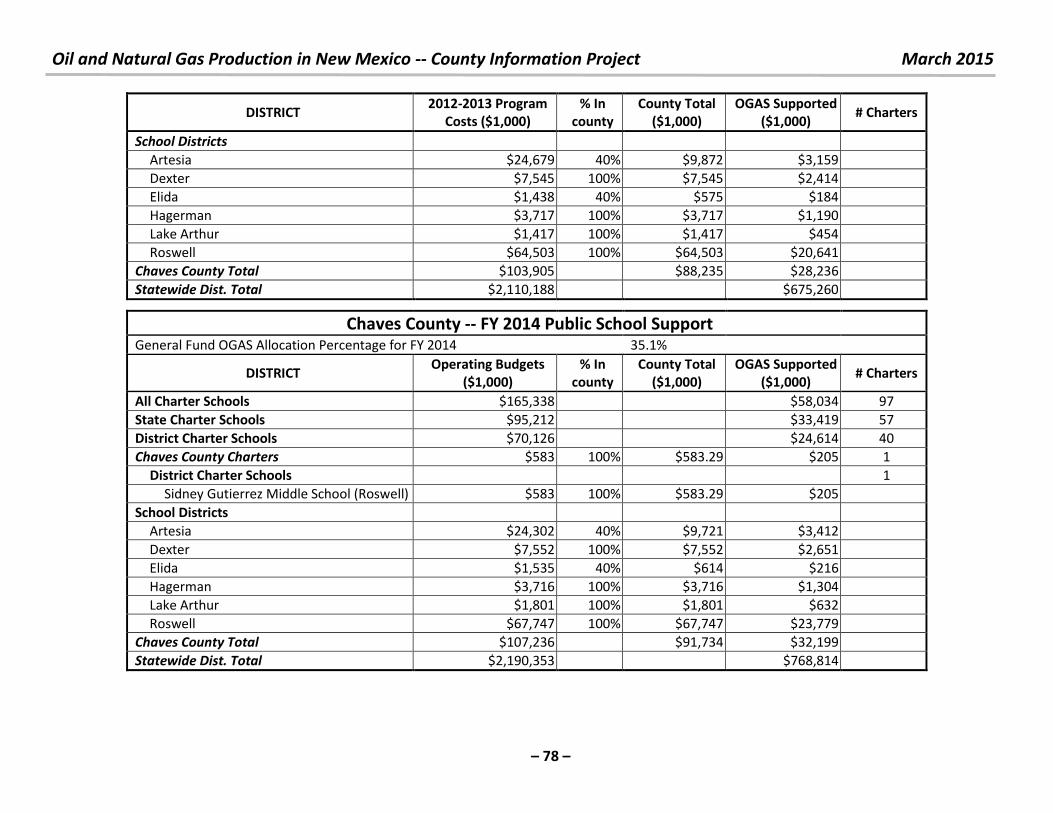
Oil and Natural Gas Production in New Mexico -- County Information Project March 2015
– 78 –
DISTRICT 2012-2013 Program
Costs ($1,000)
% In
county
County Total
($1,000)
OGAS Supported
($1,000) # Charters
School Districts
Artesia $24,679 40% $9,872 $3,159
Dexter $7,545 100% $7,545 $2,414
Elida $1,438 40% $575 $184
Hagerman $3,717 100% $3,717 $1,190
Lake Arthur $1,417 100% $1,417 $454
Roswell $64,503 100% $64,503 $20,641
Chaves County Total $103,905
$88,235 $28,236
Statewide Dist. Total $2,110,188
$675,260
Chaves County -- FY 2014 Public School Support
General Fund OGAS Allocation Percentage for FY 2014 35.1%
DISTRICT Operating Budgets
($1,000)
% In
county
County Total
($1,000)
OGAS Supported
($1,000) # Charters
All Charter Schools $165,338 $58,034 97
State Charter Schools $95,212 $33,419 57
District Charter Schools $70,126 $24,614 40
Chaves County Charters $583 100% $583.29 $205 1
District Charter Schools
1
Sidney Gutierrez Middle School (Roswell) $583 100% $583.29 $205
School Districts
Artesia $24,302 40% $9,721 $3,412
Dexter $7,552 100% $7,552 $2,651
Elida $1,535 40% $614 $216
Hagerman $3,716 100% $3,716 $1,304
Lake Arthur $1,801 100% $1,801 $632
Roswell $67,747 100% $67,747 $23,779
Chaves County Total $107,236 $91,734 $32,199
Statewide Dist. Total $2,190,353 $768,814
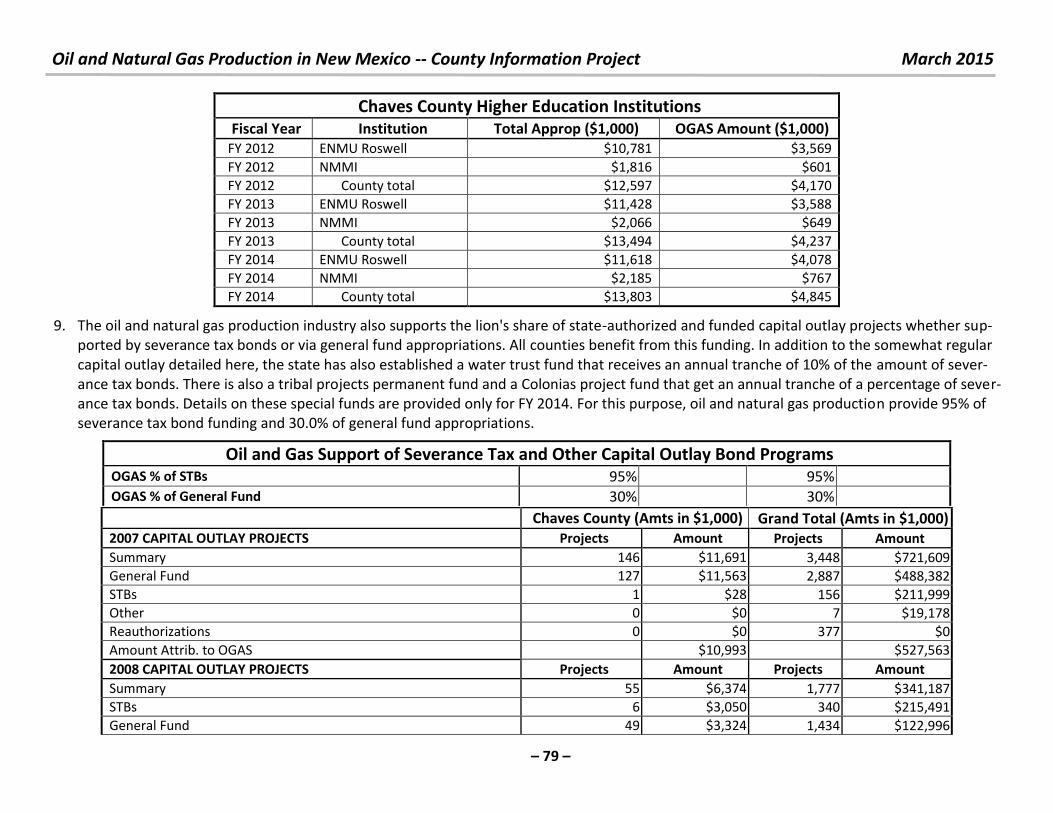
Oil and Natural Gas Production in New Mexico -- County Information Project March 2015
– 79 –
Chaves County Higher Education Institutions
Fiscal Year Institution Total Approp ($1,000) OGAS Amount ($1,000)
FY 2012 ENMU Roswell $10,781 $3,569
FY 2012 NMMI $1,816 $601
FY 2012 County total $12,597 $4,170
FY 2013 ENMU Roswell $11,428 $3,588
FY 2013 NMMI $2,066 $649
FY 2013 County total $13,494 $4,237
FY 2014 ENMU Roswell $11,618 $4,078
FY 2014 NMMI $2,185 $767
FY 2014 County total $13,803 $4,845
9. The oil and natural gas production industry also supports the lion's share of state-authorized and funded capital outlay projects whether sup-
ported by severance tax bonds or via general fund appropriations. All counties benefit from this funding. In addition to the somewhat regular
capital outlay detailed here, the state has also established a water trust fund that receives an annual tranche of 10% of the amount of sever-
ance tax bonds. There is also a tribal projects permanent fund and a Colonias project fund that get an annual tranche of a percentage of sever-
ance tax bonds. Details on these special funds are provided only for FY 2014. For this purpose, oil and natural gas production provide 95% of
severance tax bond funding and 30.0% of general fund appropriations.
Oil and Gas Support of Severance Tax and Other Capital Outlay Bond Programs OGAS % of STBs 95% 95%
OGAS % of General Fund 30% 30% Chaves County (Amts in $1,000) Grand Total (Amts in $1,000)
2007 CAPITAL OUTLAY PROJECTS Projects Amount Projects Amount
Summary 146 $11,691 3,448 $721,609
General Fund 127 $11,563 2,887 $488,382
STBs 1 $28 156 $211,999
Other 0 $0 7 $19,178
Reauthorizations 0 $0 377 $0
Amount Attrib. to OGAS $10,993 $527,563
2008 CAPITAL OUTLAY PROJECTS Projects Amount Projects Amount
Summary 55 $6,374 1,777 $341,187
STBs 6 $3,050 340 $215,491
General Fund 49 $3,324 1,434 $122,996
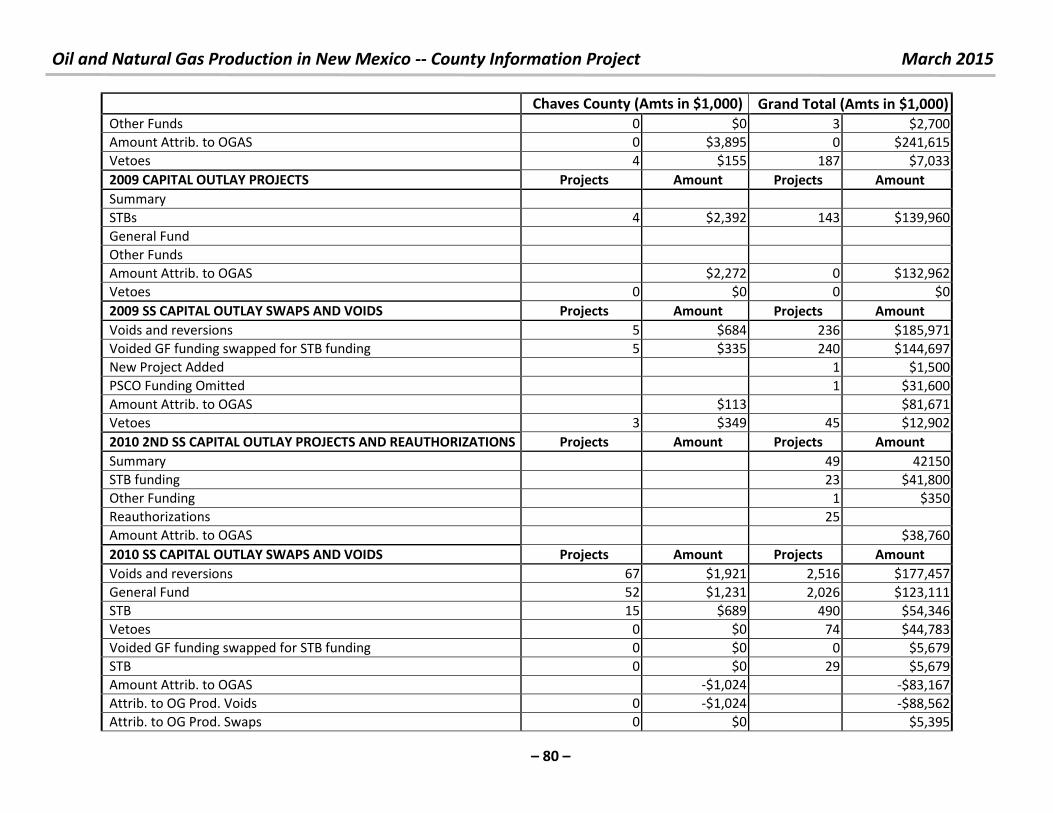
Oil and Natural Gas Production in New Mexico -- County Information Project March 2015
– 80 –
Chaves County (Amts in $1,000) Grand Total (Amts in $1,000)
Other Funds 0 $0 3 $2,700
Amount Attrib. to OGAS 0 $3,895 0 $241,615
Vetoes 4 $155 187 $7,033
2009 CAPITAL OUTLAY PROJECTS Projects Amount Projects Amount
Summary
STBs 4 $2,392 143 $139,960
General Fund
Other Funds
Amount Attrib. to OGAS $2,272 0 $132,962
Vetoes 0 $0 0 $0
2009 SS CAPITAL OUTLAY SWAPS AND VOIDS Projects Amount Projects Amount
Voids and reversions 5 $684 236 $185,971
Voided GF funding swapped for STB funding 5 $335 240 $144,697
New Project Added 1 $1,500
PSCO Funding Omitted 1 $31,600
Amount Attrib. to OGAS $113 $81,671
Vetoes 3 $349 45 $12,902
2010 2ND SS CAPITAL OUTLAY PROJECTS AND REAUTHORIZATIONS Projects Amount Projects Amount
Summary 49 42150
STB funding 23 $41,800
Other Funding 1 $350
Reauthorizations 25
Amount Attrib. to OGAS $38,760
2010 SS CAPITAL OUTLAY SWAPS AND VOIDS Projects Amount Projects Amount
Voids and reversions 67 $1,921 2,516 $177,457
General Fund 52 $1,231 2,026 $123,111
STB 15 $689 490 $54,346
Vetoes 0 $0 74 $44,783
Voided GF funding swapped for STB funding 0 $0 0 $5,679
STB 0 $0 29 $5,679
Amount Attrib. to OGAS -$1,024 -$83,167
Attrib. to OG Prod. Voids 0 -$1,024 -$88,562
Attrib. to OG Prod. Swaps 0 $0 $5,395
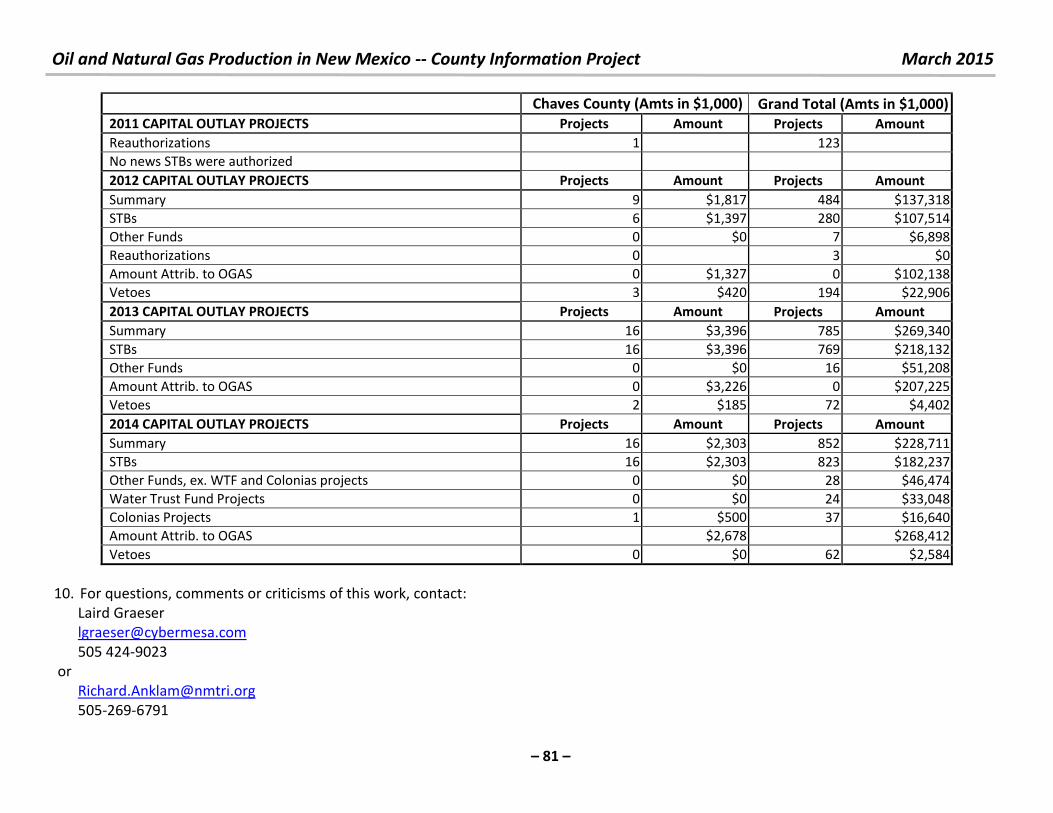
Oil and Natural Gas Production in New Mexico -- County Information Project March 2015
– 81 –
Chaves County (Amts in $1,000) Grand Total (Amts in $1,000)
2011 CAPITAL OUTLAY PROJECTS Projects Amount Projects Amount
Reauthorizations 1 123
No news STBs were authorized
2012 CAPITAL OUTLAY PROJECTS Projects Amount Projects Amount
Summary 9 $1,817 484 $137,318
STBs 6 $1,397 280 $107,514
Other Funds 0 $0 7 $6,898
Reauthorizations 0 3 $0
Amount Attrib. to OGAS 0 $1,327 0 $102,138
Vetoes 3 $420 194 $22,906
2013 CAPITAL OUTLAY PROJECTS Projects Amount Projects Amount
Summary 16 $3,396 785 $269,340
STBs 16 $3,396 769 $218,132
Other Funds 0 $0 16 $51,208
Amount Attrib. to OGAS 0 $3,226 0 $207,225
Vetoes 2 $185 72 $4,402
2014 CAPITAL OUTLAY PROJECTS Projects Amount Projects Amount
Summary 16 $2,303 852 $228,711
STBs 16 $2,303 823 $182,237
Other Funds, ex. WTF and Colonias projects 0 $0 28 $46,474
Water Trust Fund Projects 0 $0 24 $33,048
Colonias Projects 1 $500 37 $16,640
Amount Attrib. to OGAS $2,678 $268,412
Vetoes 0 $0 62 $2,584
10. For questions, comments or criticisms of this work, contact:
Laird Graeser
505 424-9023
or
505-269-6791
Oil and Natural Gas Production in New Mexico -- County Information Project March 2015
– 82 –
The Impacts of Oil and Natural Gas Production in New Mexico on Cibola County A Summary of Important Economic and Revenue Issues
Cibola County Summary Cibola County is not an oil and natural gas producing area. However, oil and natural gas production is important to the county indirectly. This
summary details some of these important issues.
In FY 2010, all New Mexico producers shipped 62.4 million barrels of oil worth $4,469 million, 1,275 million mcf of natural gas worth $6,615 million
and 72.4 million mcf of CO2 worth $74.4 million. In FY 2014, all New Mexico producers shipped 110.5 million barrels of oil worth $10,905 million
and 1,169 million mcf of natural gas worth $6,115 million and 64.3 million mcf of CO2 worth $ . . illio . Note: f is , u i feet of gas at standard temperature and pressure.).
1. What products and land types generate the OGAS production in Cibola County? Cibola County is not an oil and natural gas producing area.
2. Is there more detail on specific product, such as natural gas liquids or condensate? Yes, the ONGRD system has for several years published de-
tails by product category. However, Cibola County is not an oil and natural gas producing area.
3. What does this production mean for state and local direct revenues from production in Cibola County? Cibola County is not an oil and natural
gas producing area.
4. The industry also makes bonus payments for the rights to lease federal and state lands for production. These leases are primarily in the pro-
ducing counties, but exploratory leases are also executed. Bonus payments for leases on federal land are shared with the State general fund.
Bonus payments for leases on state lands become part of the land maintenance fund at the State Land Office, distributed to beneficiaries after
deducting the expenses of the SLO. No state or federal leases have been sold in Cibola County in the FY 2005 through FY 2014 period.
5. How about Gross Receipts Tax revenue to county and municipal governments for the NAICS codes 211110 - Oil & Gas Extraction; 213111 Drill-
ing oil and gas wells; 213112 - Support activities for oil and gas operations; and 213118 - Services to oil and gas extraction? Refer to the main
document for an explanation of the economic burden concept for Gross Receipts Tax. This year, the methodology for calculating the State tax
amount was improved somewhat, but those improvements are not reflected in the following table. Note that in the course of 2013, 30 coun-
ties had reported activity in at least one of the three NAICS codes. Only DeBaca, Los Alamos and Mora Counties reported no gross receipts ac-
tivity. For FY 2014, only Los Alamos County reported no GRT activity. Although the methodology has been improved this year, most of the dif-
ferences between 2013 and 2014 for this county are real. Extraction activity was significantly less in FY 2014 than in FY 2013. Drilling activity
was approximately flat. However, well services, completion, fracking and other recurring and non-recurring services significantly expanded.
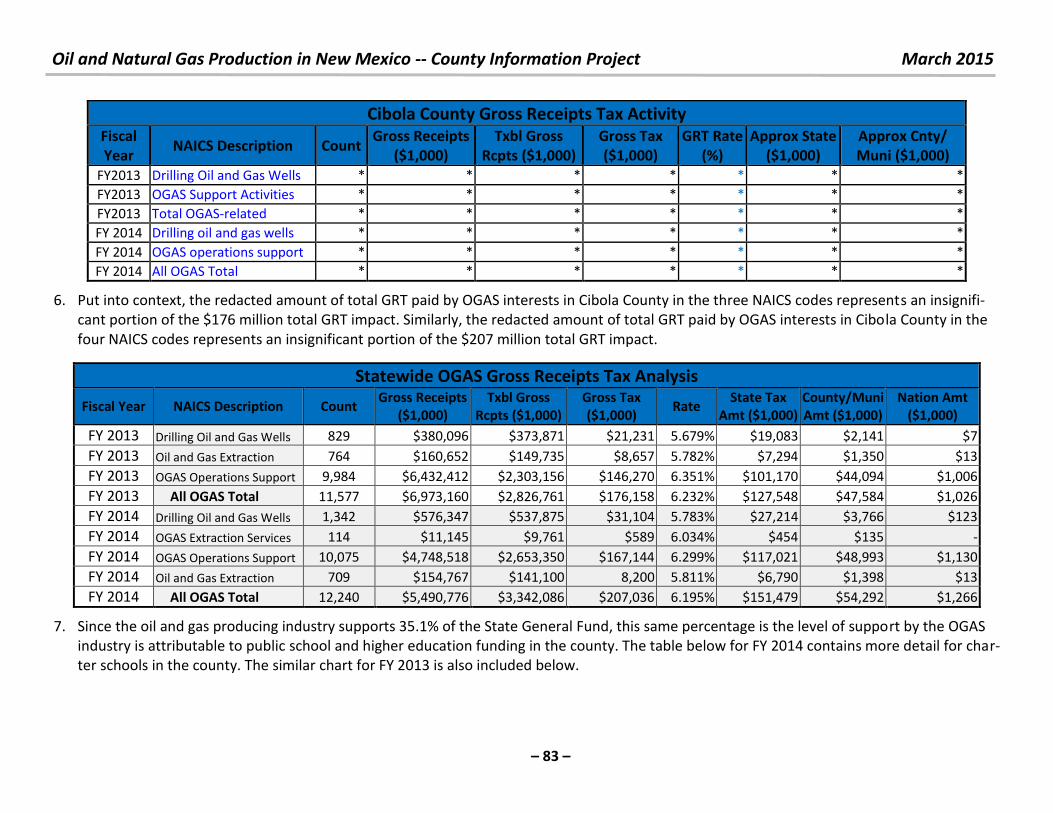
Oil and Natural Gas Production in New Mexico -- County Information Project March 2015
– 83 –
6. Put into context, the redacted amount of total GRT paid by OGAS interests in Cibola County in the three NAICS codes represents an insignifi-
cant portion of the $176 million total GRT impact. Similarly, the redacted amount of total GRT paid by OGAS interests in Cibola County in the
four NAICS codes represents an insignificant portion of the $207 million total GRT impact.
7. Since the oil and gas producing industry supports 35.1% of the State General Fund, this same percentage is the level of support by the OGAS
industry is attributable to public school and higher education funding in the county. The table below for FY 2014 contains more detail for char-
ter schools in the county. The similar chart for FY 2013 is also included below.
Cibola County Gross Receipts Tax Activity Fiscal
Year NAICS Description Count
Gross Receipts
($1,000)
Txbl Gross
Rcpts ($1,000)
Gross Tax
($1,000)
GRT Rate
(%)
Approx State
($1,000)
Approx Cnty/
Muni ($1,000)
FY2013 Drilling Oil and Gas Wells * * * * * * *
FY2013 OGAS Support Activities * * * * * * *
FY2013 Total OGAS-related * * * * * * *
FY 2014 Drilling oil and gas wells * * * * * * *
FY 2014 OGAS operations support * * * * * * *
FY 2014 All OGAS Total * * * * * * *
Statewide OGAS Gross Receipts Tax Analysis
Fiscal Year NAICS Description Count Gross Receipts
($1,000)
Txbl Gross
Rcpts ($1,000)
Gross Tax
($1,000) Rate
State Tax
Amt ($1,000)
County/Muni
Amt ($1,000)
Nation Amt
($1,000)
FY 2013 Drilling Oil and Gas Wells 829 $380,096 $373,871 $21,231 5.679% $19,083 $2,141 $7
FY 2013 Oil and Gas Extraction 764 $160,652 $149,735 $8,657 5.782% $7,294 $1,350 $13
FY 2013 OGAS Operations Support 9,984 $6,432,412 $2,303,156 $146,270 6.351% $101,170 $44,094 $1,006
FY 2013 All OGAS Total 11,577 $6,973,160 $2,826,761 $176,158 6.232% $127,548 $47,584 $1,026
FY 2014 Drilling Oil and Gas Wells 1,342 $576,347 $537,875 $31,104 5.783% $27,214 $3,766 $123
FY 2014 OGAS Extraction Services 114 $11,145 $9,761 $589 6.034% $454 $135 -
FY 2014 OGAS Operations Support 10,075 $4,748,518 $2,653,350 $167,144 6.299% $117,021 $48,993 $1,130
FY 2014 Oil and Gas Extraction 709 $154,767 $141,100 8,200 5.811% $6,790 $1,398 $13
FY 2014 All OGAS Total 12,240 $5,490,776 $3,342,086 $207,036 6.195% $151,479 $54,292 $1,266
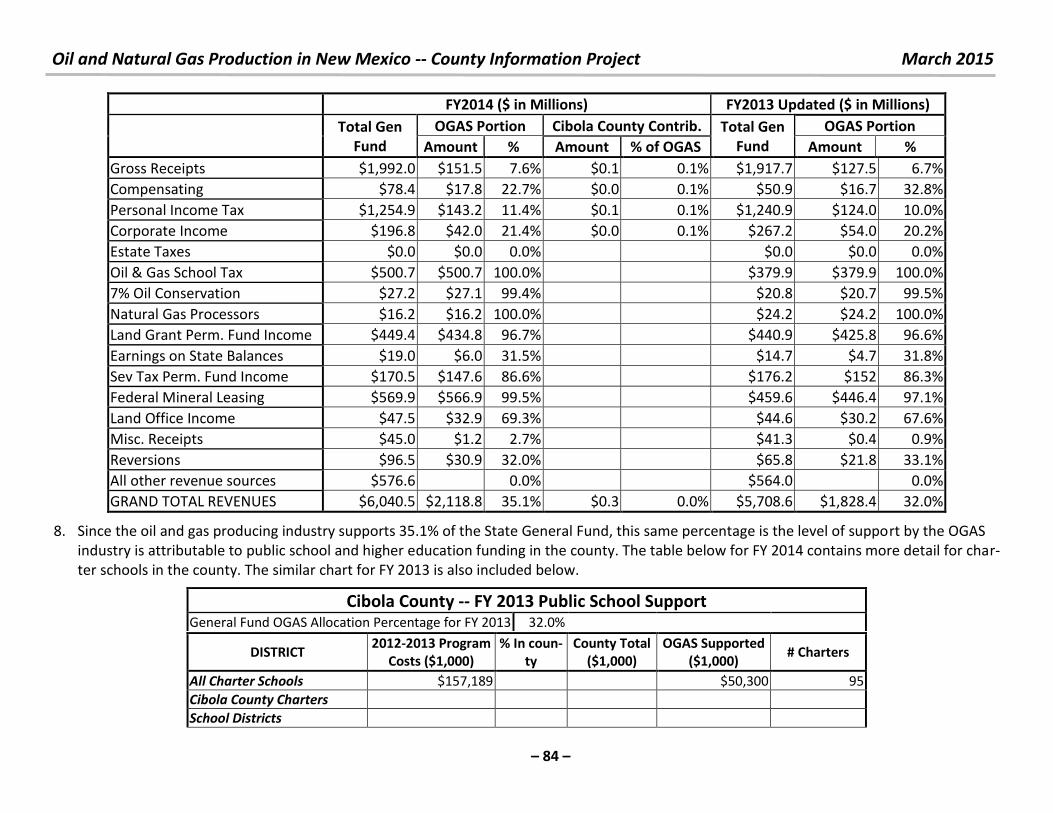
Oil and Natural Gas Production in New Mexico -- County Information Project March 2015
– 84 –
FY2014 ($ in Millions) FY2013 Updated ($ in Millions)
Total Gen
Fund
OGAS Portion Cibola County Contrib. Total Gen
Fund
OGAS Portion
Amount % Amount % of OGAS Amount %
Gross Receipts $1,992.0 $151.5 7.6% $0.1 0.1% $1,917.7 $127.5 6.7%
Compensating $78.4 $17.8 22.7% $0.0 0.1% $50.9 $16.7 32.8%
Personal Income Tax $1,254.9 $143.2 11.4% $0.1 0.1% $1,240.9 $124.0 10.0%
Corporate Income $196.8 $42.0 21.4% $0.0 0.1% $267.2 $54.0 20.2%
Estate Taxes $0.0 $0.0 0.0% $0.0 $0.0 0.0%
Oil & Gas School Tax $500.7 $500.7 100.0% $379.9 $379.9 100.0%
7% Oil Conservation $27.2 $27.1 99.4% $20.8 $20.7 99.5%
Natural Gas Processors $16.2 $16.2 100.0% $24.2 $24.2 100.0%
Land Grant Perm. Fund Income $449.4 $434.8 96.7% $440.9 $425.8 96.6%
Earnings on State Balances $19.0 $6.0 31.5% $14.7 $4.7 31.8%
Sev Tax Perm. Fund Income $170.5 $147.6 86.6% $176.2 $152 86.3%
Federal Mineral Leasing $569.9 $566.9 99.5% $459.6 $446.4 97.1%
Land Office Income $47.5 $32.9 69.3% $44.6 $30.2 67.6%
Misc. Receipts $45.0 $1.2 2.7% $41.3 $0.4 0.9%
Reversions $96.5 $30.9 32.0% $65.8 $21.8 33.1%
All other revenue sources $576.6
0.0% $564.0
0.0%
GRAND TOTAL REVENUES $6,040.5 $2,118.8 35.1% $0.3 0.0% $5,708.6 $1,828.4 32.0%
8. Since the oil and gas producing industry supports 35.1% of the State General Fund, this same percentage is the level of support by the OGAS
industry is attributable to public school and higher education funding in the county. The table below for FY 2014 contains more detail for char-
ter schools in the county. The similar chart for FY 2013 is also included below.
Cibola County -- FY 2013 Public School Support General Fund OGAS Allocation Percentage for FY 2013 32.0%
DISTRICT 2012-2013 Program
Costs ($1,000)
% In coun-
ty
County Total
($1,000)
OGAS Supported
($1,000) # Charters
All Charter Schools $157,189
$50,300 95
Cibola County Charters
School Districts
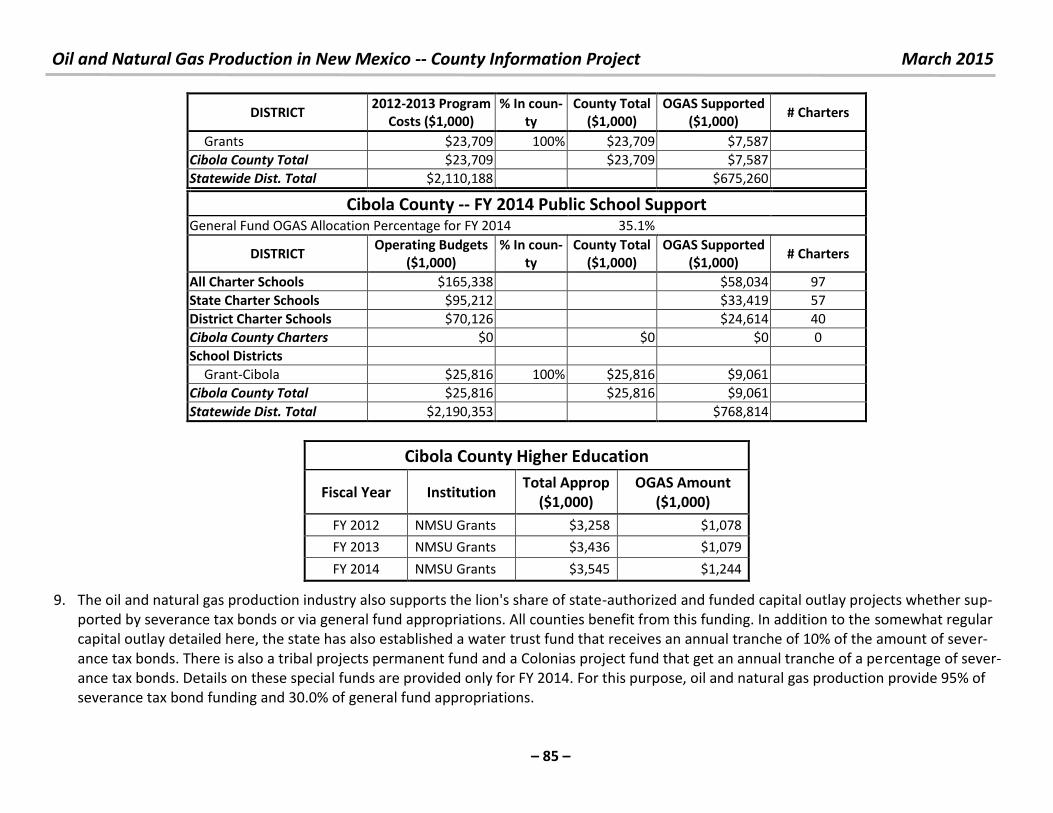
Oil and Natural Gas Production in New Mexico -- County Information Project March 2015
– 85 –
DISTRICT 2012-2013 Program
Costs ($1,000)
% In coun-
ty
County Total
($1,000)
OGAS Supported
($1,000) # Charters
Grants $23,709 100% $23,709 $7,587
Cibola County Total $23,709 $23,709 $7,587
Statewide Dist. Total $2,110,188 $675,260
Cibola County -- FY 2014 Public School Support General Fund OGAS Allocation Percentage for FY 2014 35.1%
DISTRICT Operating Budgets
($1,000)
% In coun-
ty
County Total
($1,000)
OGAS Supported
($1,000) # Charters
All Charter Schools $165,338 $58,034 97
State Charter Schools $95,212 $33,419 57
District Charter Schools $70,126 $24,614 40
Cibola County Charters $0 $0 $0 0
School Districts
Grant-Cibola $25,816 100% $25,816 $9,061
Cibola County Total $25,816 $25,816 $9,061
Statewide Dist. Total $2,190,353 $768,814
Cibola County Higher Education
Fiscal Year Institution Total Approp
($1,000)
OGAS Amount
($1,000)
FY 2012 NMSU Grants $3,258 $1,078
FY 2013 NMSU Grants $3,436 $1,079
FY 2014 NMSU Grants $3,545 $1,244
9. The oil and natural gas production industry also supports the lion's share of state-authorized and funded capital outlay projects whether sup-
ported by severance tax bonds or via general fund appropriations. All counties benefit from this funding. In addition to the somewhat regular
capital outlay detailed here, the state has also established a water trust fund that receives an annual tranche of 10% of the amount of sever-
ance tax bonds. There is also a tribal projects permanent fund and a Colonias project fund that get an annual tranche of a percentage of sever-
ance tax bonds. Details on these special funds are provided only for FY 2014. For this purpose, oil and natural gas production provide 95% of
severance tax bond funding and 30.0% of general fund appropriations.
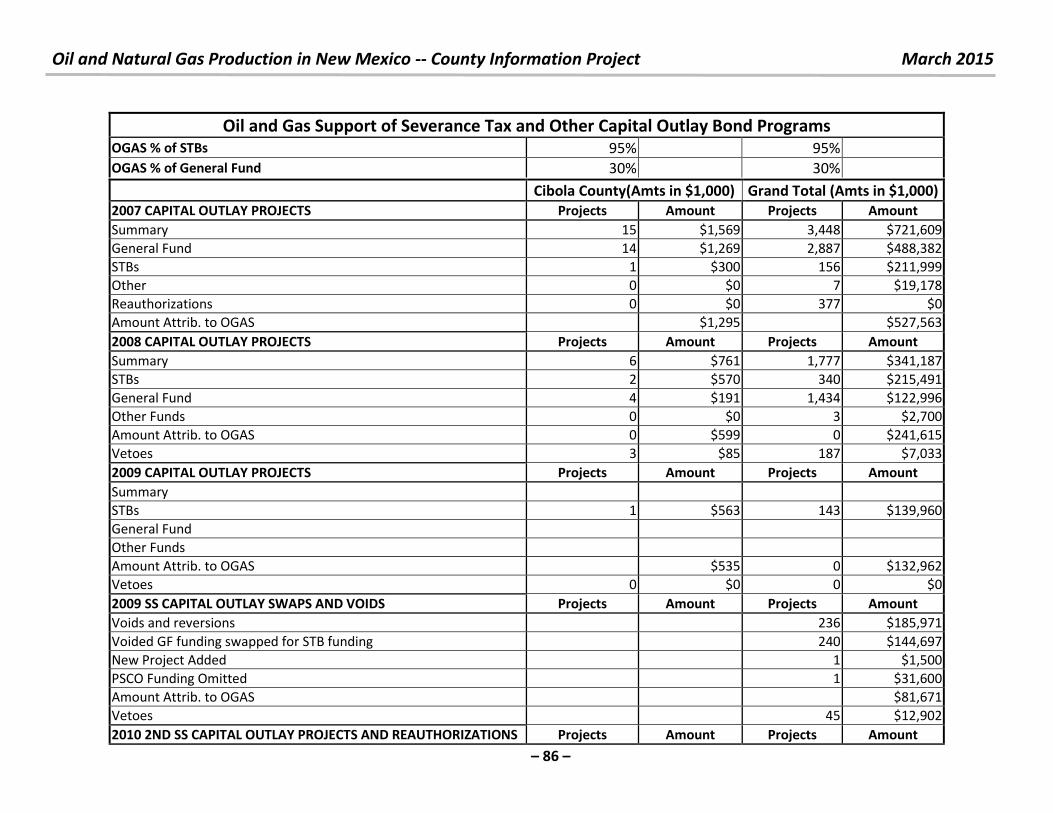
Oil and Natural Gas Production in New Mexico -- County Information Project March 2015
– 86 –
Oil and Gas Support of Severance Tax and Other Capital Outlay Bond Programs OGAS % of STBs 95% 95%
OGAS % of General Fund 30% 30%
Cibola County(Amts in $1,000) Grand Total (Amts in $1,000)
2007 CAPITAL OUTLAY PROJECTS Projects Amount Projects Amount
Summary 15 $1,569 3,448 $721,609
General Fund 14 $1,269 2,887 $488,382
STBs 1 $300 156 $211,999
Other 0 $0 7 $19,178
Reauthorizations 0 $0 377 $0
Amount Attrib. to OGAS $1,295 $527,563
2008 CAPITAL OUTLAY PROJECTS Projects Amount Projects Amount
Summary 6 $761 1,777 $341,187
STBs 2 $570 340 $215,491
General Fund 4 $191 1,434 $122,996
Other Funds 0 $0 3 $2,700
Amount Attrib. to OGAS 0 $599 0 $241,615
Vetoes 3 $85 187 $7,033
2009 CAPITAL OUTLAY PROJECTS Projects Amount Projects Amount
Summary
STBs 1 $563 143 $139,960
General Fund
Other Funds
Amount Attrib. to OGAS $535 0 $132,962
Vetoes 0 $0 0 $0
2009 SS CAPITAL OUTLAY SWAPS AND VOIDS Projects Amount Projects Amount
Voids and reversions 236 $185,971
Voided GF funding swapped for STB funding 240 $144,697
New Project Added 1 $1,500
PSCO Funding Omitted 1 $31,600
Amount Attrib. to OGAS $81,671
Vetoes 45 $12,902
2010 2ND SS CAPITAL OUTLAY PROJECTS AND REAUTHORIZATIONS Projects Amount Projects Amount
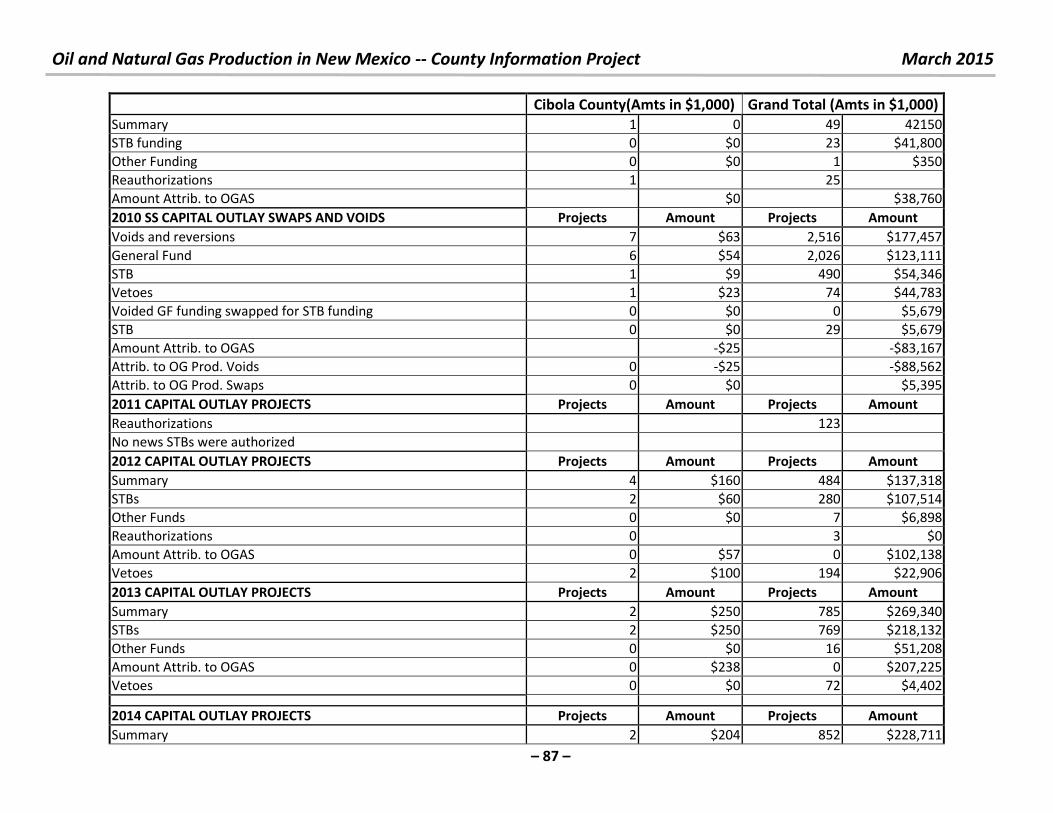
Oil and Natural Gas Production in New Mexico -- County Information Project March 2015
– 87 –
Cibola County(Amts in $1,000) Grand Total (Amts in $1,000)
Summary 1 0 49 42150
STB funding 0 $0 23 $41,800
Other Funding 0 $0 1 $350
Reauthorizations 1 25
Amount Attrib. to OGAS $0 $38,760
2010 SS CAPITAL OUTLAY SWAPS AND VOIDS Projects Amount Projects Amount
Voids and reversions 7 $63 2,516 $177,457
General Fund 6 $54 2,026 $123,111
STB 1 $9 490 $54,346
Vetoes 1 $23 74 $44,783
Voided GF funding swapped for STB funding 0 $0 0 $5,679
STB 0 $0 29 $5,679
Amount Attrib. to OGAS -$25 -$83,167
Attrib. to OG Prod. Voids 0 -$25 -$88,562
Attrib. to OG Prod. Swaps 0 $0 $5,395
2011 CAPITAL OUTLAY PROJECTS Projects Amount Projects Amount
Reauthorizations 123
No news STBs were authorized
2012 CAPITAL OUTLAY PROJECTS Projects Amount Projects Amount
Summary 4 $160 484 $137,318
STBs 2 $60 280 $107,514
Other Funds 0 $0 7 $6,898
Reauthorizations 0 3 $0
Amount Attrib. to OGAS 0 $57 0 $102,138
Vetoes 2 $100 194 $22,906
2013 CAPITAL OUTLAY PROJECTS Projects Amount Projects Amount
Summary 2 $250 785 $269,340
STBs 2 $250 769 $218,132
Other Funds 0 $0 16 $51,208
Amount Attrib. to OGAS 0 $238 0 $207,225
Vetoes 0 $0 72 $4,402
2014 CAPITAL OUTLAY PROJECTS Projects Amount Projects Amount
Summary 2 $204 852 $228,711
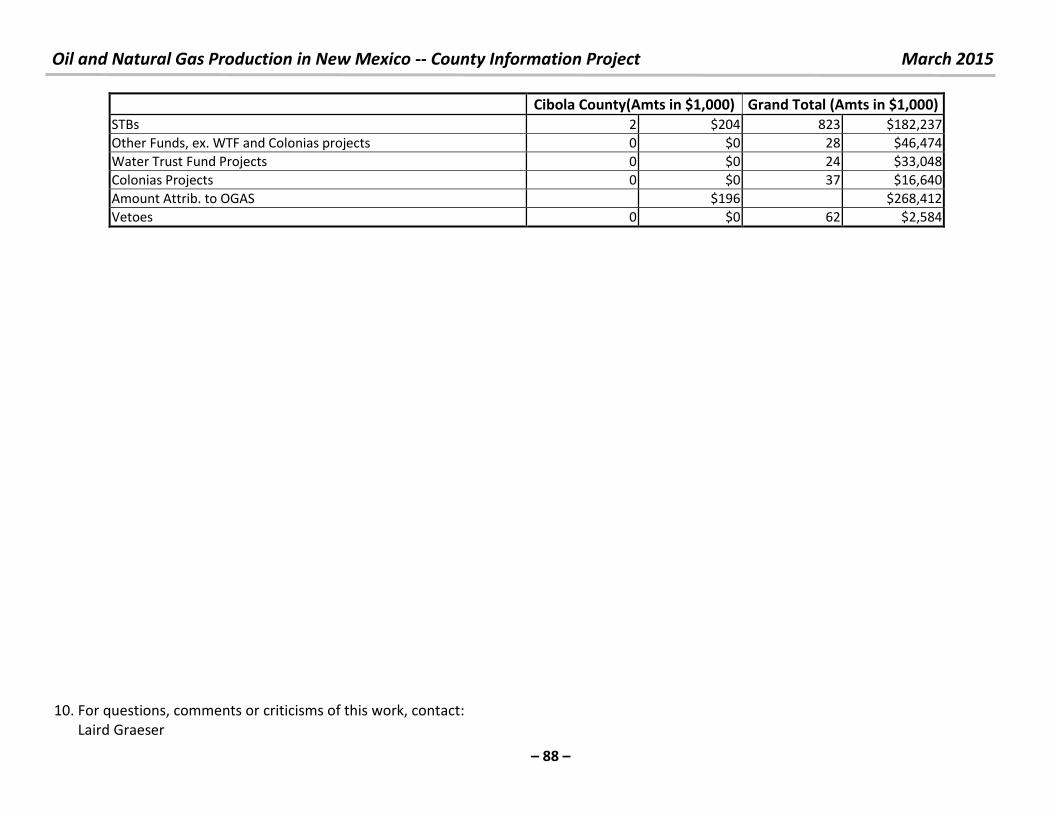
Oil and Natural Gas Production in New Mexico -- County Information Project March 2015
– 88 –
Cibola County(Amts in $1,000) Grand Total (Amts in $1,000)
STBs 2 $204 823 $182,237
Other Funds, ex. WTF and Colonias projects 0 $0 28 $46,474
Water Trust Fund Projects 0 $0 24 $33,048
Colonias Projects 0 $0 37 $16,640
Amount Attrib. to OGAS $196 $268,412
Vetoes 0 $0 62 $2,584
10. For questions, comments or criticisms of this work, contact:
Laird Graeser
Oil and Natural Gas Production in New Mexico -- County Information Project March 2015
– 89 –
505 424-9023
or
Richard L. Anklam, President & Executive Director, New Mexico Tax Research Institute
505-269-6791
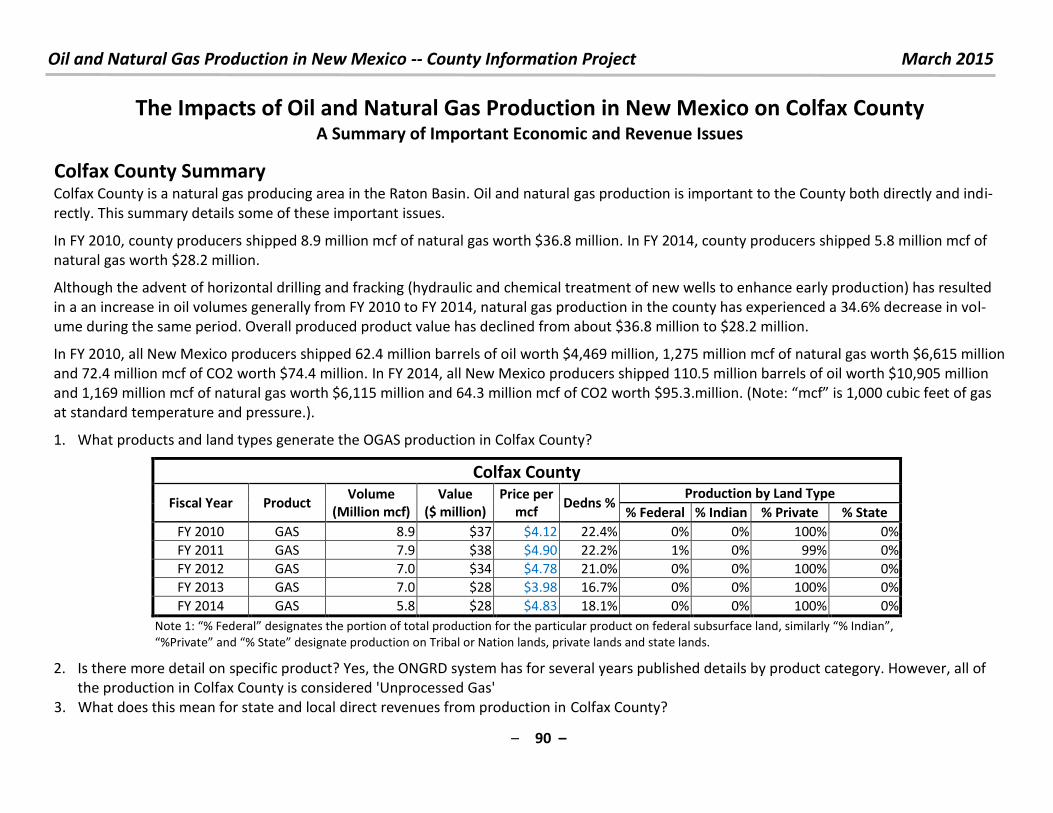
Oil and Natural Gas Production in New Mexico -- County Information Project March 2015
– 90 –
The Impacts of Oil and Natural Gas Production in New Mexico on Colfax County A Summary of Important Economic and Revenue Issues
Colfax County Summary Colfax County is a natural gas producing area in the Raton Basin. Oil and natural gas production is important to the County both directly and indi-
rectly. This summary details some of these important issues.
In FY 2010, county producers shipped 8.9 million mcf of natural gas worth $36.8 million. In FY 2014, county producers shipped 5.8 million mcf of
natural gas worth $28.2 million.
Although the advent of horizontal drilling and fracking (hydraulic and chemical treatment of new wells to enhance early production) has resulted
in a an increase in oil volumes generally from FY 2010 to FY 2014, natural gas production in the county has experienced a 34.6% decrease in vol-
ume during the same period. Overall produced product value has declined from about $36.8 million to $28.2 million.
In FY 2010, all New Mexico producers shipped 62.4 million barrels of oil worth $4,469 million, 1,275 million mcf of natural gas worth $6,615 million
and 72.4 million mcf of CO2 worth $74.4 million. In FY 2014, all New Mexico producers shipped 110.5 million barrels of oil worth $10,905 million
and 1,169 million mcf of natural gas worth $6,115 million and 64.3 million mcf of CO2 worth $ . . illio . Note: f is , u i feet of gas at standard temperature and pressure.).
1. What products and land types generate the OGAS production in Colfax County?
Colfax County
Fiscal Year Product Volume
(Million mcf)
Value
($ million)
Price per
mcf Dedns %
Production by Land Type
% Federal % Indian % Private % State
FY 2010 GAS 8.9 $37 $4.12 22.4% 0% 0% 100% 0%
FY 2011 GAS 7.9 $38 $4.90 22.2% 1% 0% 99% 0%
FY 2012 GAS 7.0 $34 $4.78 21.0% 0% 0% 100% 0%
FY 2013 GAS 7.0 $28 $3.98 16.7% 0% 0% 100% 0%
FY 2014 GAS 5.8 $28 $4.83 18.1% 0% 0% 100% 0%
Note : % Fede al desig ates the po tio of total p odu tio fo the pa ti ula p odu t o fede al su su fa e la d, si ila l % I dia , %P i ate a d % “tate desig ate p odu tio o T i al o Natio la ds, p i ate la ds a d state la ds.
2. Is there more detail on specific product? Yes, the ONGRD system has for several years published details by product category. However, all of
the production in Colfax County is considered 'Unprocessed Gas'
3. What does this mean for state and local direct revenues from production in Colfax County?
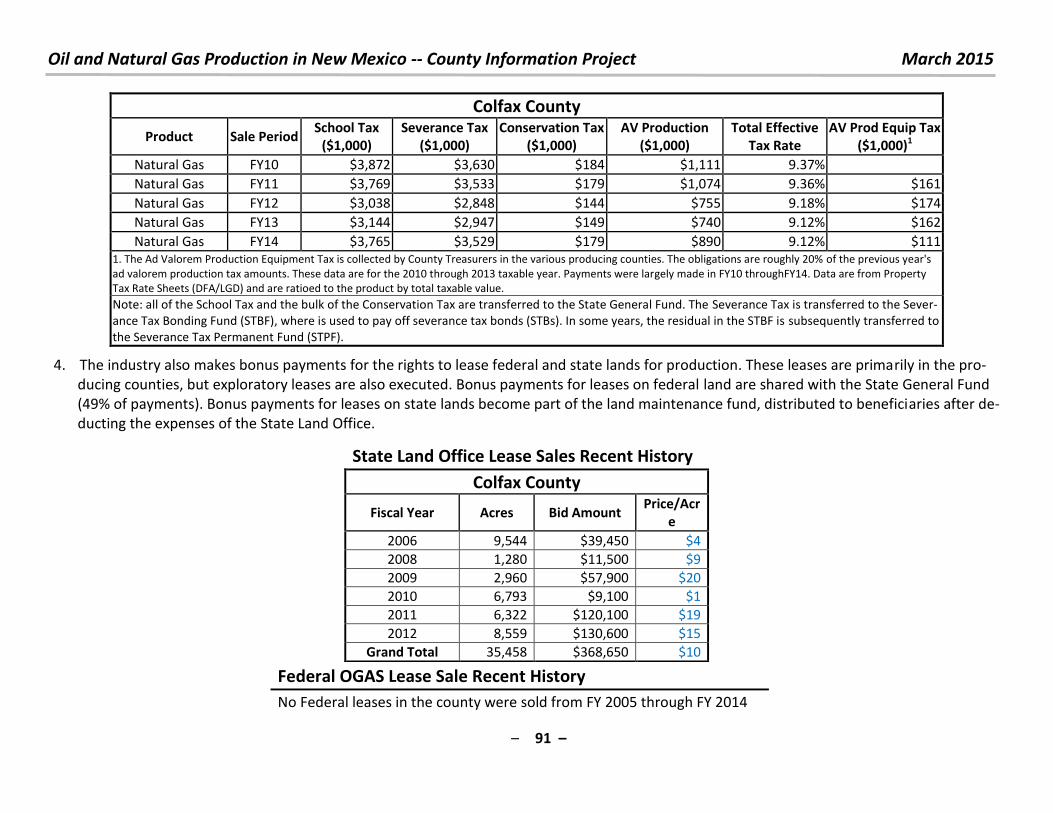
Oil and Natural Gas Production in New Mexico -- County Information Project March 2015
– 91 –
Colfax County
Product Sale Period School Tax
($1,000)
Severance Tax
($1,000)
Conservation Tax
($1,000)
AV Production
($1,000)
Total Effective
Tax Rate
AV Prod Equip Tax
($1,000)1
Natural Gas FY10 $3,872 $3,630 $184 $1,111 9.37%
Natural Gas FY11 $3,769 $3,533 $179 $1,074 9.36% $161
Natural Gas FY12 $3,038 $2,848 $144 $755 9.18% $174
Natural Gas FY13 $3,144 $2,947 $149 $740 9.12% $162
Natural Gas FY14 $3,765 $3,529 $179 $890 9.12% $111 1. The Ad Valorem Production Equipment Tax is collected by County Treasurers in the various producing counties. The obligations are roughly 20% of the previous year's
ad valorem production tax amounts. These data are for the 2010 through 2013 taxable year. Payments were largely made in FY10 throughFY14. Data are from Property
Tax Rate Sheets (DFA/LGD) and are ratioed to the product by total taxable value.
Note: all of the School Tax and the bulk of the Conservation Tax are transferred to the State General Fund. The Severance Tax is transferred to the Sever-
ance Tax Bonding Fund (STBF), where is used to pay off severance tax bonds (STBs). In some years, the residual in the STBF is subsequently transferred to
the Severance Tax Permanent Fund (STPF).
4. The industry also makes bonus payments for the rights to lease federal and state lands for production. These leases are primarily in the pro-
ducing counties, but exploratory leases are also executed. Bonus payments for leases on federal land are shared with the State General Fund
(49% of payments). Bonus payments for leases on state lands become part of the land maintenance fund, distributed to beneficiaries after de-
ducting the expenses of the State Land Office.
Federal OGAS Lease Sale Recent History
No Federal leases in the county were sold from FY 2005 through FY 2014
State Land Office Lease Sales Recent History
Colfax County
Fiscal Year Acres Bid Amount Price/Acr
e
2006 9,544 $39,450 $4
2008 1,280 $11,500 $9
2009 2,960 $57,900 $20
2010 6,793 $9,100 $1
2011 6,322 $120,100 $19
2012 8,559 $130,600 $15
Grand Total 35,458 $368,650 $10
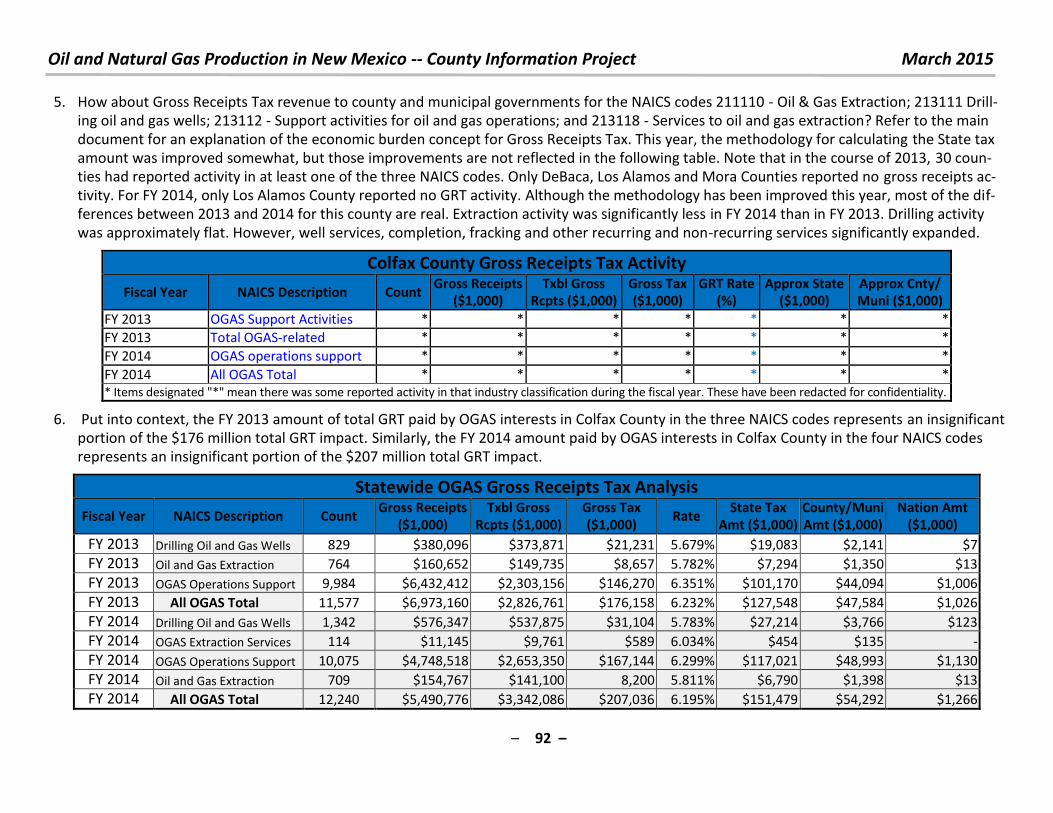
Oil and Natural Gas Production in New Mexico -- County Information Project March 2015
– 92 –
5. How about Gross Receipts Tax revenue to county and municipal governments for the NAICS codes 211110 - Oil & Gas Extraction; 213111 Drill-
ing oil and gas wells; 213112 - Support activities for oil and gas operations; and 213118 - Services to oil and gas extraction? Refer to the main
document for an explanation of the economic burden concept for Gross Receipts Tax. This year, the methodology for calculating the State tax
amount was improved somewhat, but those improvements are not reflected in the following table. Note that in the course of 2013, 30 coun-
ties had reported activity in at least one of the three NAICS codes. Only DeBaca, Los Alamos and Mora Counties reported no gross receipts ac-
tivity. For FY 2014, only Los Alamos County reported no GRT activity. Although the methodology has been improved this year, most of the dif-
ferences between 2013 and 2014 for this county are real. Extraction activity was significantly less in FY 2014 than in FY 2013. Drilling activity
was approximately flat. However, well services, completion, fracking and other recurring and non-recurring services significantly expanded.
Colfax County Gross Receipts Tax Activity
Fiscal Year NAICS Description Count Gross Receipts
($1,000)
Txbl Gross
Rcpts ($1,000)
Gross Tax
($1,000)
GRT Rate
(%)
Approx State
($1,000)
Approx Cnty/
Muni ($1,000)
FY 2013 OGAS Support Activities * * * * * * *
FY 2013 Total OGAS-related * * * * * * *
FY 2014 OGAS operations support * * * * * * *
FY 2014 All OGAS Total * * * * * * *
* Items designated "*" mean there was some reported activity in that industry classification during the fiscal year. These have been redacted for confidentiality.
6. Put into context, the FY 2013 amount of total GRT paid by OGAS interests in Colfax County in the three NAICS codes represents an insignificant
portion of the $176 million total GRT impact. Similarly, the FY 2014 amount paid by OGAS interests in Colfax County in the four NAICS codes
represents an insignificant portion of the $207 million total GRT impact.
Statewide OGAS Gross Receipts Tax Analysis
Fiscal Year NAICS Description Count Gross Receipts
($1,000)
Txbl Gross
Rcpts ($1,000)
Gross Tax
($1,000) Rate
State Tax
Amt ($1,000)
County/Muni
Amt ($1,000)
Nation Amt
($1,000)
FY 2013 Drilling Oil and Gas Wells 829 $380,096 $373,871 $21,231 5.679% $19,083 $2,141 $7
FY 2013 Oil and Gas Extraction 764 $160,652 $149,735 $8,657 5.782% $7,294 $1,350 $13
FY 2013 OGAS Operations Support 9,984 $6,432,412 $2,303,156 $146,270 6.351% $101,170 $44,094 $1,006
FY 2013 All OGAS Total 11,577 $6,973,160 $2,826,761 $176,158 6.232% $127,548 $47,584 $1,026
FY 2014 Drilling Oil and Gas Wells 1,342 $576,347 $537,875 $31,104 5.783% $27,214 $3,766 $123
FY 2014 OGAS Extraction Services 114 $11,145 $9,761 $589 6.034% $454 $135 -
FY 2014 OGAS Operations Support 10,075 $4,748,518 $2,653,350 $167,144 6.299% $117,021 $48,993 $1,130
FY 2014 Oil and Gas Extraction 709 $154,767 $141,100 8,200 5.811% $6,790 $1,398 $13
FY 2014 All OGAS Total 12,240 $5,490,776 $3,342,086 $207,036 6.195% $151,479 $54,292 $1,266
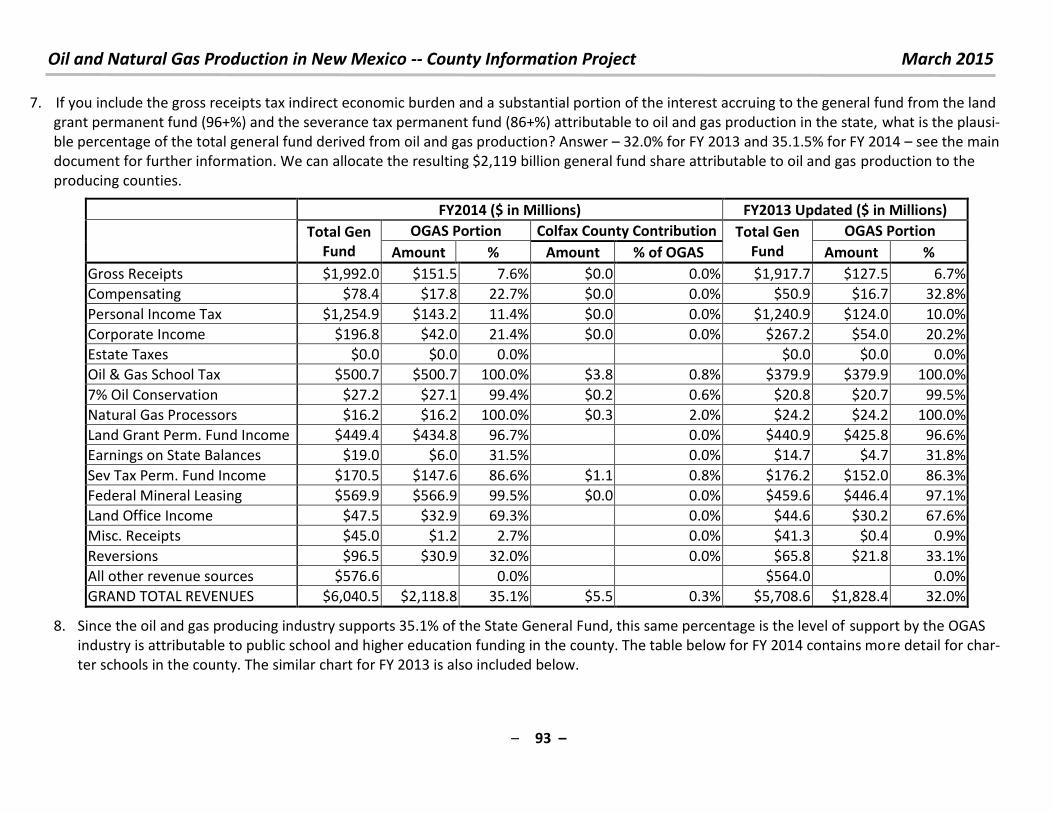
Oil and Natural Gas Production in New Mexico -- County Information Project March 2015
– 93 –
7. If you include the gross receipts tax indirect economic burden and a substantial portion of the interest accruing to the general fund from the land
grant permanent fund (96+%) and the severance tax permanent fund (86+%) attributable to oil and gas production in the state, what is the plausi-
ble percentage of the total general fund derived from oil and gas production? Answer – 32.0% for FY 2013 and 35.1.5% for FY 2014 – see the main
document for further information. We can allocate the resulting $2,119 billion general fund share attributable to oil and gas production to the
producing counties.
FY2014 ($ in Millions) FY2013 Updated ($ in Millions)
Total Gen
Fund
OGAS Portion Colfax County Contribution Total Gen
Fund
OGAS Portion
Amount % Amount % of OGAS Amount %
Gross Receipts $1,992.0 $151.5 7.6% $0.0 0.0% $1,917.7 $127.5 6.7%
Compensating $78.4 $17.8 22.7% $0.0 0.0% $50.9 $16.7 32.8%
Personal Income Tax $1,254.9 $143.2 11.4% $0.0 0.0% $1,240.9 $124.0 10.0%
Corporate Income $196.8 $42.0 21.4% $0.0 0.0% $267.2 $54.0 20.2%
Estate Taxes $0.0 $0.0 0.0%
$0.0 $0.0 0.0%
Oil & Gas School Tax $500.7 $500.7 100.0% $3.8 0.8% $379.9 $379.9 100.0%
7% Oil Conservation $27.2 $27.1 99.4% $0.2 0.6% $20.8 $20.7 99.5%
Natural Gas Processors $16.2 $16.2 100.0% $0.3 2.0% $24.2 $24.2 100.0%
Land Grant Perm. Fund Income $449.4 $434.8 96.7% 0.0% $440.9 $425.8 96.6%
Earnings on State Balances $19.0 $6.0 31.5% 0.0% $14.7 $4.7 31.8%
Sev Tax Perm. Fund Income $170.5 $147.6 86.6% $1.1 0.8% $176.2 $152.0 86.3%
Federal Mineral Leasing $569.9 $566.9 99.5% $0.0 0.0% $459.6 $446.4 97.1%
Land Office Income $47.5 $32.9 69.3% 0.0% $44.6 $30.2 67.6%
Misc. Receipts $45.0 $1.2 2.7% 0.0% $41.3 $0.4 0.9%
Reversions $96.5 $30.9 32.0% 0.0% $65.8 $21.8 33.1%
All other revenue sources $576.6 0.0% $564.0 0.0%
GRAND TOTAL REVENUES $6,040.5 $2,118.8 35.1% $5.5 0.3% $5,708.6 $1,828.4 32.0%
8. Since the oil and gas producing industry supports 35.1% of the State General Fund, this same percentage is the level of support by the OGAS
industry is attributable to public school and higher education funding in the county. The table below for FY 2014 contains more detail for char-
ter schools in the county. The similar chart for FY 2013 is also included below.
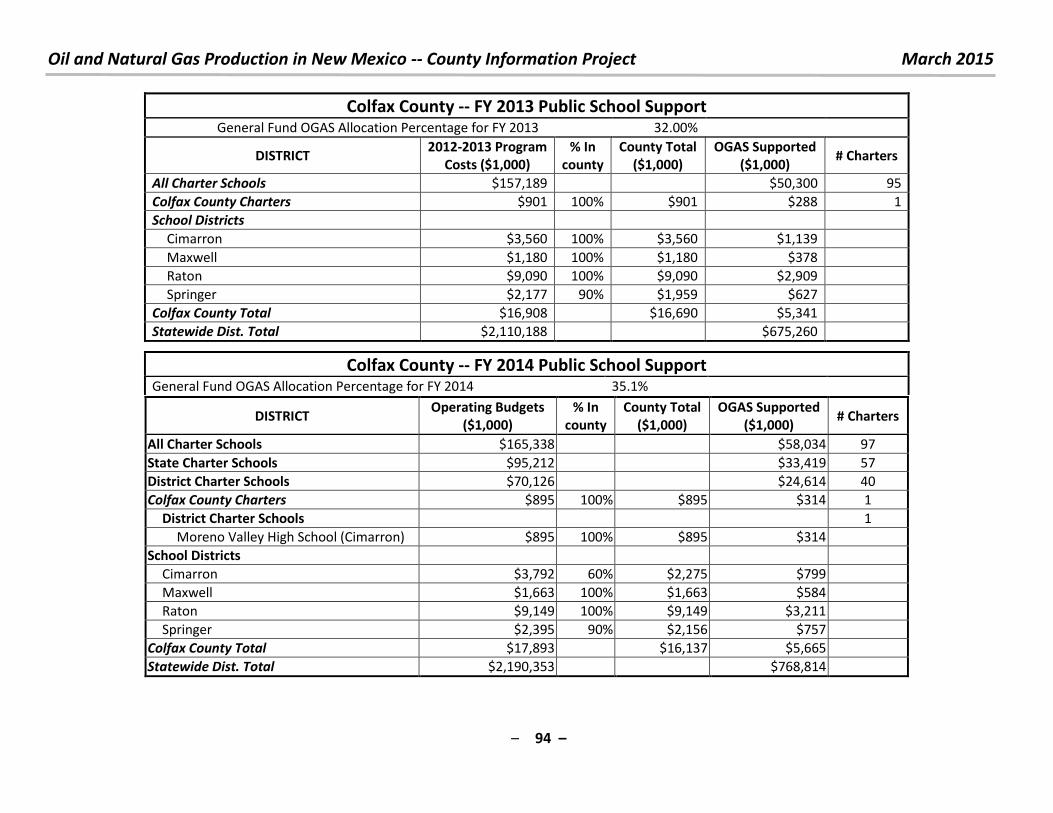
Oil and Natural Gas Production in New Mexico -- County Information Project March 2015
– 94 –
Colfax County -- FY 2013 Public School Support General Fund OGAS Allocation Percentage for FY 2013 32.00%
DISTRICT 2012-2013 Program
Costs ($1,000)
% In
county
County Total
($1,000)
OGAS Supported
($1,000) # Charters
All Charter Schools $157,189 $50,300 95
Colfax County Charters $901 100% $901 $288 1
School Districts
Cimarron $3,560 100% $3,560 $1,139
Maxwell $1,180 100% $1,180 $378
Raton $9,090 100% $9,090 $2,909
Springer $2,177 90% $1,959 $627
Colfax County Total $16,908 $16,690 $5,341
Statewide Dist. Total $2,110,188 $675,260
Colfax County -- FY 2014 Public School Support General Fund OGAS Allocation Percentage for FY 2014 35.1%
DISTRICT Operating Budgets
($1,000)
% In
county
County Total
($1,000)
OGAS Supported
($1,000) # Charters
All Charter Schools $165,338 $58,034 97
State Charter Schools $95,212 $33,419 57
District Charter Schools $70,126 $24,614 40
Colfax County Charters $895 100% $895 $314 1
District Charter Schools 1
Moreno Valley High School (Cimarron) $895 100% $895 $314
School Districts
Cimarron $3,792 60% $2,275 $799
Maxwell $1,663 100% $1,663 $584
Raton $9,149 100% $9,149 $3,211
Springer $2,395 90% $2,156 $757
Colfax County Total $17,893 $16,137 $5,665
Statewide Dist. Total $2,190,353 $768,814
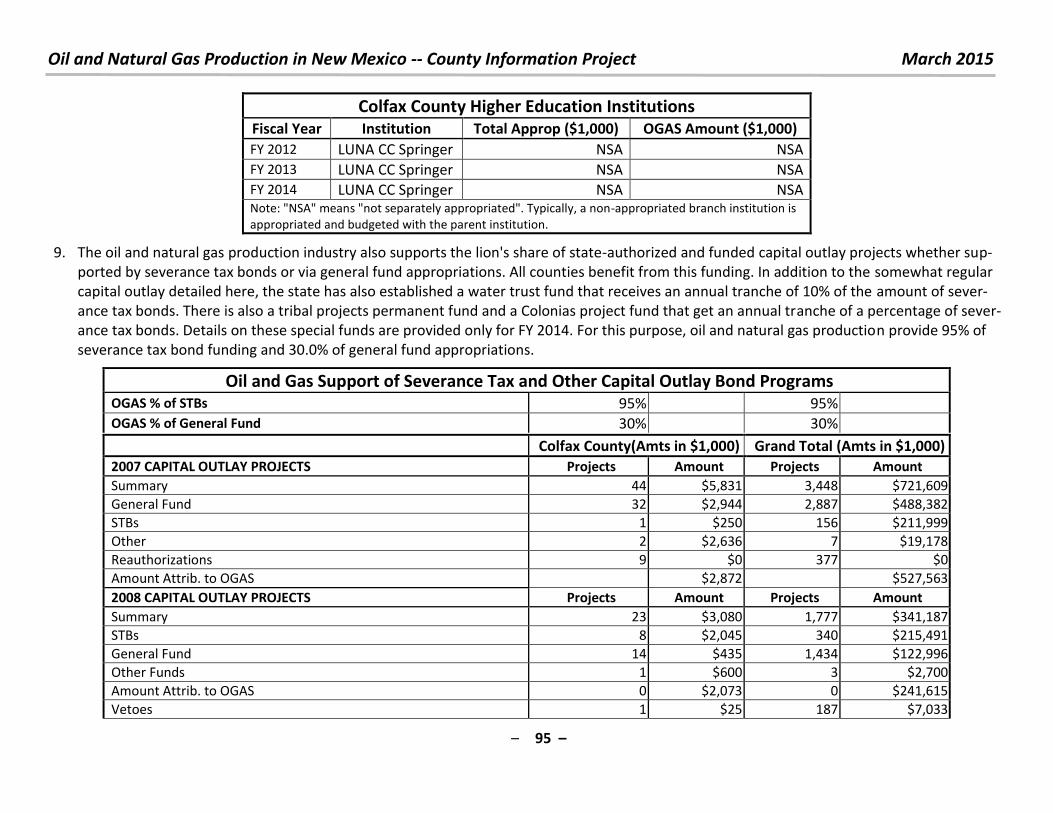
Oil and Natural Gas Production in New Mexico -- County Information Project March 2015
– 95 –
Colfax County Higher Education Institutions
Fiscal Year Institution Total Approp ($1,000) OGAS Amount ($1,000)
FY 2012 LUNA CC Springer NSA NSA
FY 2013 LUNA CC Springer NSA NSA
FY 2014 LUNA CC Springer NSA NSA Note: "NSA" means "not separately appropriated". Typically, a non-appropriated branch institution is
appropriated and budgeted with the parent institution.
9. The oil and natural gas production industry also supports the lion's share of state-authorized and funded capital outlay projects whether sup-
ported by severance tax bonds or via general fund appropriations. All counties benefit from this funding. In addition to the somewhat regular
capital outlay detailed here, the state has also established a water trust fund that receives an annual tranche of 10% of the amount of sever-
ance tax bonds. There is also a tribal projects permanent fund and a Colonias project fund that get an annual tranche of a percentage of sever-
ance tax bonds. Details on these special funds are provided only for FY 2014. For this purpose, oil and natural gas production provide 95% of
severance tax bond funding and 30.0% of general fund appropriations.
Oil and Gas Support of Severance Tax and Other Capital Outlay Bond Programs OGAS % of STBs 95% 95%
OGAS % of General Fund 30% 30% Colfax County(Amts in $1,000) Grand Total (Amts in $1,000)
2007 CAPITAL OUTLAY PROJECTS Projects Amount Projects Amount
Summary 44 $5,831 3,448 $721,609
General Fund 32 $2,944 2,887 $488,382
STBs 1 $250 156 $211,999
Other 2 $2,636 7 $19,178
Reauthorizations 9 $0 377 $0
Amount Attrib. to OGAS $2,872 $527,563
2008 CAPITAL OUTLAY PROJECTS Projects Amount Projects Amount
Summary 23 $3,080 1,777 $341,187
STBs 8 $2,045 340 $215,491
General Fund 14 $435 1,434 $122,996
Other Funds 1 $600 3 $2,700
Amount Attrib. to OGAS 0 $2,073 0 $241,615
Vetoes 1 $25 187 $7,033
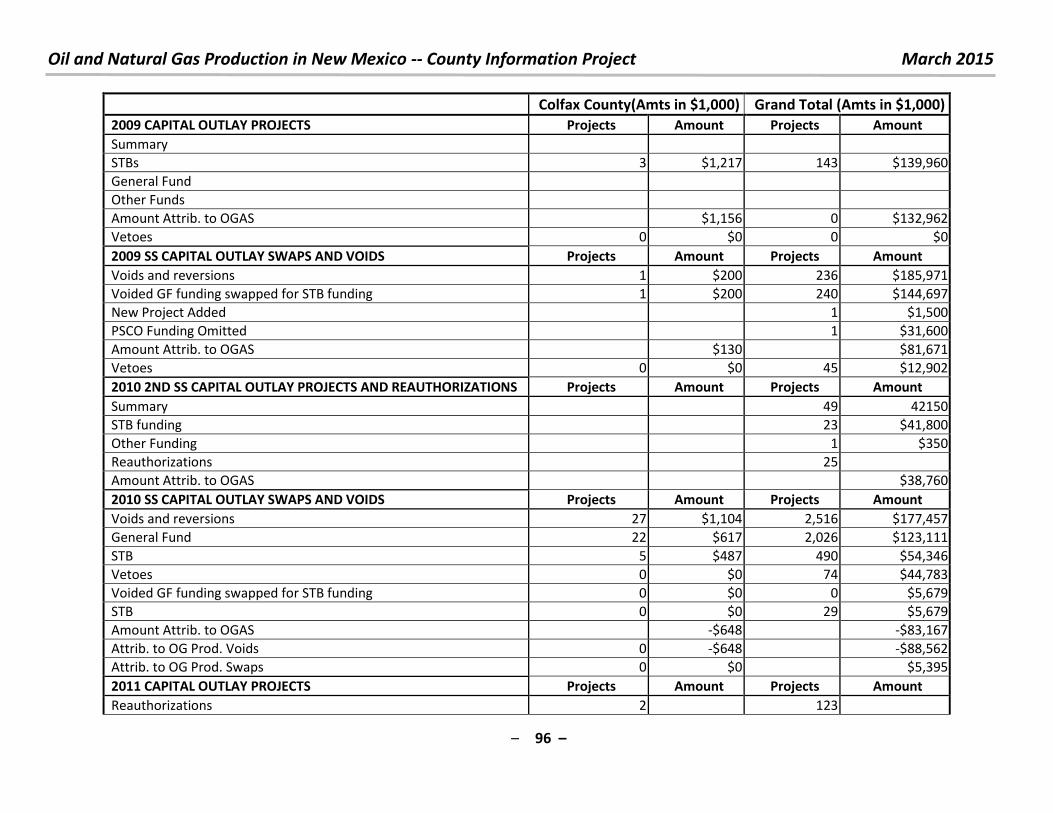
Oil and Natural Gas Production in New Mexico -- County Information Project March 2015
– 96 –
Colfax County(Amts in $1,000) Grand Total (Amts in $1,000)
2009 CAPITAL OUTLAY PROJECTS Projects Amount Projects Amount
Summary
STBs 3 $1,217 143 $139,960
General Fund
Other Funds
Amount Attrib. to OGAS $1,156 0 $132,962
Vetoes 0 $0 0 $0
2009 SS CAPITAL OUTLAY SWAPS AND VOIDS Projects Amount Projects Amount
Voids and reversions 1 $200 236 $185,971
Voided GF funding swapped for STB funding 1 $200 240 $144,697
New Project Added 1 $1,500
PSCO Funding Omitted 1 $31,600
Amount Attrib. to OGAS $130 $81,671
Vetoes 0 $0 45 $12,902
2010 2ND SS CAPITAL OUTLAY PROJECTS AND REAUTHORIZATIONS Projects Amount Projects Amount
Summary 49 42150
STB funding 23 $41,800
Other Funding 1 $350
Reauthorizations 25
Amount Attrib. to OGAS $38,760
2010 SS CAPITAL OUTLAY SWAPS AND VOIDS Projects Amount Projects Amount
Voids and reversions 27 $1,104 2,516 $177,457
General Fund 22 $617 2,026 $123,111
STB 5 $487 490 $54,346
Vetoes 0 $0 74 $44,783
Voided GF funding swapped for STB funding 0 $0 0 $5,679
STB 0 $0 29 $5,679
Amount Attrib. to OGAS -$648 -$83,167
Attrib. to OG Prod. Voids 0 -$648 -$88,562
Attrib. to OG Prod. Swaps 0 $0 $5,395
2011 CAPITAL OUTLAY PROJECTS Projects Amount Projects Amount
Reauthorizations 2 123
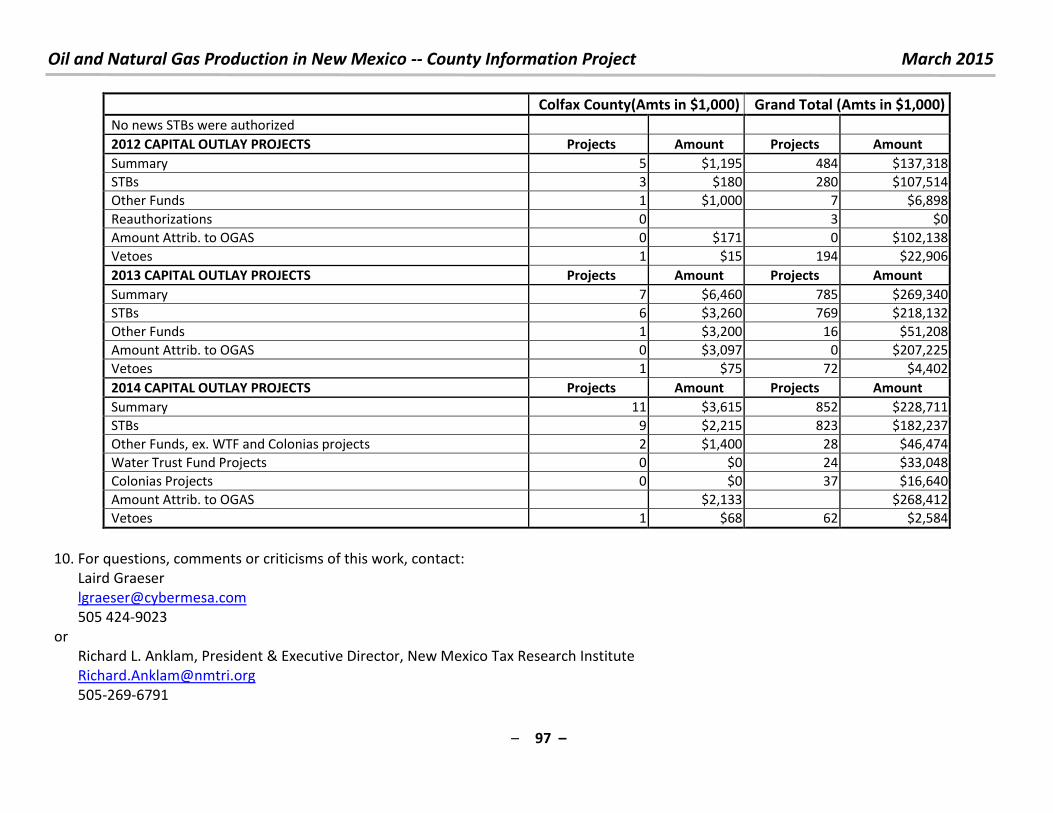
Oil and Natural Gas Production in New Mexico -- County Information Project March 2015
– 97 –
Colfax County(Amts in $1,000) Grand Total (Amts in $1,000)
No news STBs were authorized
2012 CAPITAL OUTLAY PROJECTS Projects Amount Projects Amount
Summary 5 $1,195 484 $137,318
STBs 3 $180 280 $107,514
Other Funds 1 $1,000 7 $6,898
Reauthorizations 0 3 $0
Amount Attrib. to OGAS 0 $171 0 $102,138
Vetoes 1 $15 194 $22,906
2013 CAPITAL OUTLAY PROJECTS Projects Amount Projects Amount
Summary 7 $6,460 785 $269,340
STBs 6 $3,260 769 $218,132
Other Funds 1 $3,200 16 $51,208
Amount Attrib. to OGAS 0 $3,097 0 $207,225
Vetoes 1 $75 72 $4,402
2014 CAPITAL OUTLAY PROJECTS Projects Amount Projects Amount
Summary 11 $3,615 852 $228,711
STBs 9 $2,215 823 $182,237
Other Funds, ex. WTF and Colonias projects 2 $1,400 28 $46,474
Water Trust Fund Projects 0 $0 24 $33,048
Colonias Projects 0 $0 37 $16,640
Amount Attrib. to OGAS $2,133 $268,412
Vetoes 1 $68 62 $2,584
10. For questions, comments or criticisms of this work, contact:
Laird Graeser
505 424-9023
or
Richard L. Anklam, President & Executive Director, New Mexico Tax Research Institute
505-269-6791
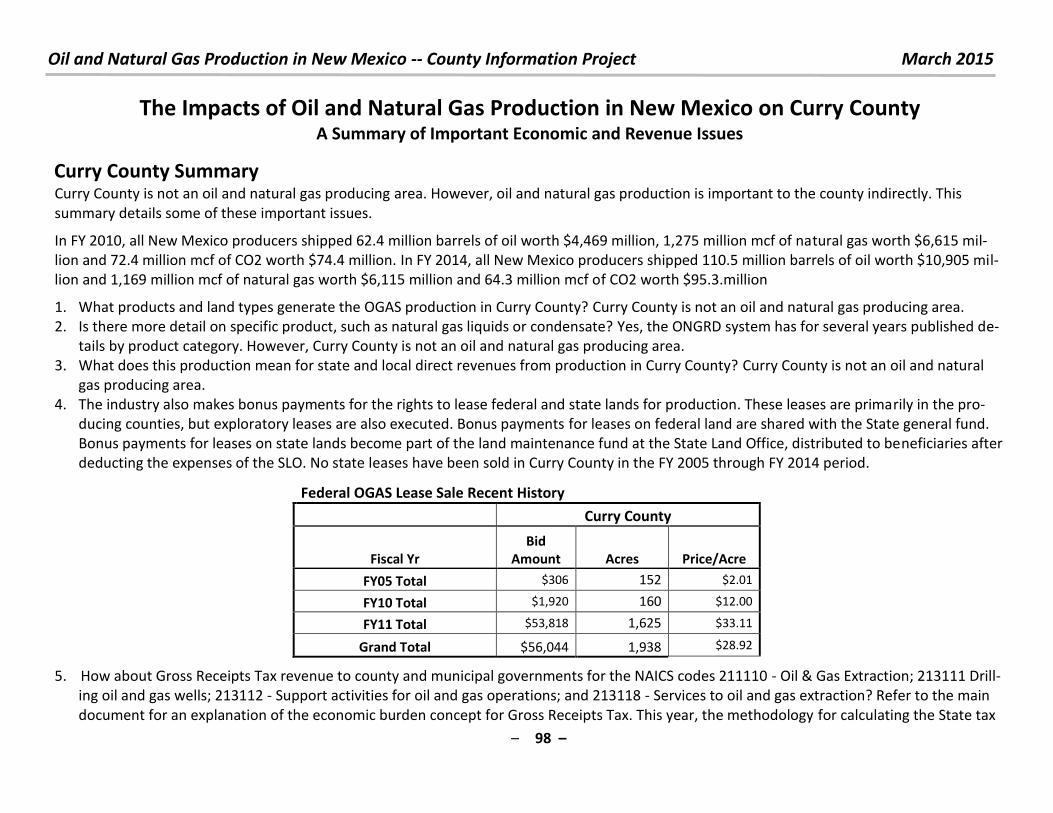
Oil and Natural Gas Production in New Mexico -- County Information Project March 2015
– 98 –
The Impacts of Oil and Natural Gas Production in New Mexico on Curry County A Summary of Important Economic and Revenue Issues
Curry County Summary
Curry County is not an oil and natural gas producing area. However, oil and natural gas production is important to the county indirectly. This
summary details some of these important issues.
In FY 2010, all New Mexico producers shipped 62.4 million barrels of oil worth $4,469 million, 1,275 million mcf of natural gas worth $6,615 mil-
lion and 72.4 million mcf of CO2 worth $74.4 million. In FY 2014, all New Mexico producers shipped 110.5 million barrels of oil worth $10,905 mil-
lion and 1,169 million mcf of natural gas worth $6,115 million and 64.3 million mcf of CO2 worth $95.3.million
1. What products and land types generate the OGAS production in Curry County? Curry County is not an oil and natural gas producing area.
2. Is there more detail on specific product, such as natural gas liquids or condensate? Yes, the ONGRD system has for several years published de-
tails by product category. However, Curry County is not an oil and natural gas producing area.
3. What does this production mean for state and local direct revenues from production in Curry County? Curry County is not an oil and natural
gas producing area.
4. The industry also makes bonus payments for the rights to lease federal and state lands for production. These leases are primarily in the pro-
ducing counties, but exploratory leases are also executed. Bonus payments for leases on federal land are shared with the State general fund.
Bonus payments for leases on state lands become part of the land maintenance fund at the State Land Office, distributed to beneficiaries after
deducting the expenses of the SLO. No state leases have been sold in Curry County in the FY 2005 through FY 2014 period.
Federal OGAS Lease Sale Recent History
Curry County
Fiscal Yr
Bid
Amount Acres Price/Acre
FY05 Total $306 152 $2.01
FY10 Total $1,920 160 $12.00
FY11 Total $53,818 1,625 $33.11
Grand Total $56,044 1,938 $28.92
5. How about Gross Receipts Tax revenue to county and municipal governments for the NAICS codes 211110 - Oil & Gas Extraction; 213111 Drill-
ing oil and gas wells; 213112 - Support activities for oil and gas operations; and 213118 - Services to oil and gas extraction? Refer to the main
document for an explanation of the economic burden concept for Gross Receipts Tax. This year, the methodology for calculating the State tax
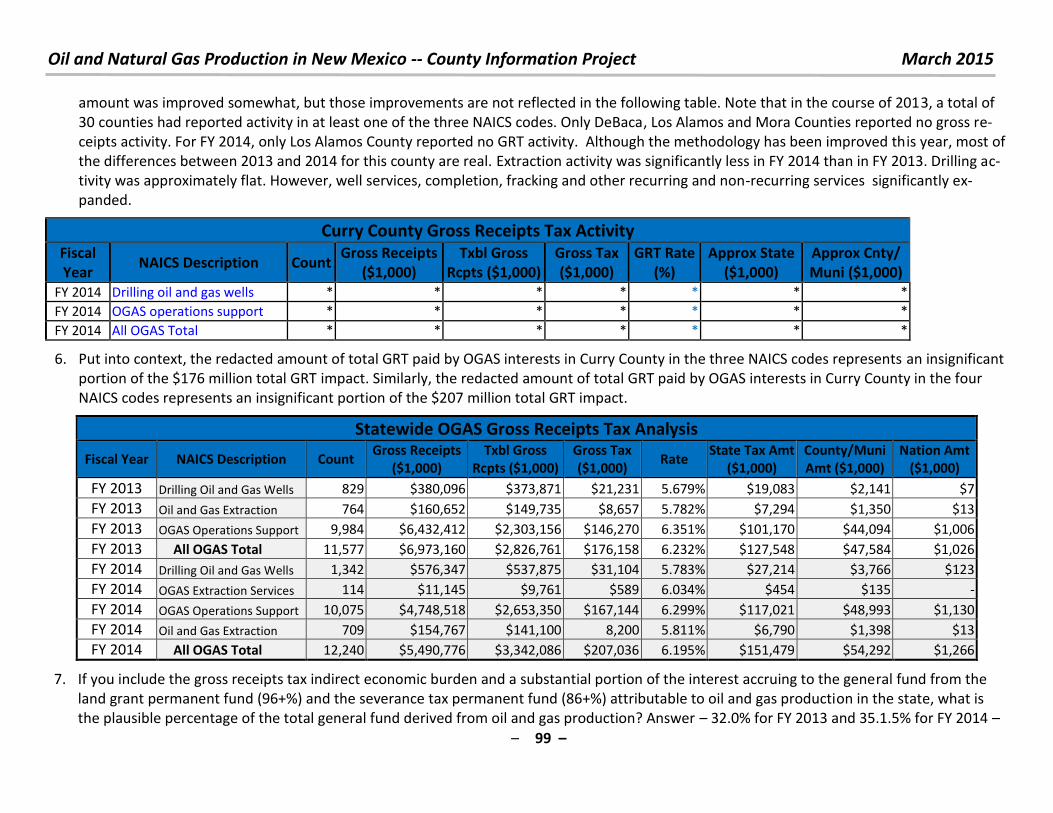
Oil and Natural Gas Production in New Mexico -- County Information Project March 2015
– 99 –
amount was improved somewhat, but those improvements are not reflected in the following table. Note that in the course of 2013, a total of
30 counties had reported activity in at least one of the three NAICS codes. Only DeBaca, Los Alamos and Mora Counties reported no gross re-
ceipts activity. For FY 2014, only Los Alamos County reported no GRT activity. Although the methodology has been improved this year, most of
the differences between 2013 and 2014 for this county are real. Extraction activity was significantly less in FY 2014 than in FY 2013. Drilling ac-
tivity was approximately flat. However, well services, completion, fracking and other recurring and non-recurring services significantly ex-
panded.
Curry County Gross Receipts Tax Activity Fiscal
Year NAICS Description Count
Gross Receipts
($1,000)
Txbl Gross
Rcpts ($1,000)
Gross Tax
($1,000)
GRT Rate
(%)
Approx State
($1,000)
Approx Cnty/
Muni ($1,000)
FY 2014 Drilling oil and gas wells * * * * * * *
FY 2014 OGAS operations support * * * * * * *
FY 2014 All OGAS Total * * * * * * *
6. Put into context, the redacted amount of total GRT paid by OGAS interests in Curry County in the three NAICS codes represents an insignificant
portion of the $176 million total GRT impact. Similarly, the redacted amount of total GRT paid by OGAS interests in Curry County in the four
NAICS codes represents an insignificant portion of the $207 million total GRT impact.
Statewide OGAS Gross Receipts Tax Analysis
Fiscal Year NAICS Description Count Gross Receipts
($1,000)
Txbl Gross
Rcpts ($1,000)
Gross Tax
($1,000) Rate
State Tax Amt
($1,000)
County/Muni
Amt ($1,000)
Nation Amt
($1,000)
FY 2013 Drilling Oil and Gas Wells 829 $380,096 $373,871 $21,231 5.679% $19,083 $2,141 $7
FY 2013 Oil and Gas Extraction 764 $160,652 $149,735 $8,657 5.782% $7,294 $1,350 $13
FY 2013 OGAS Operations Support 9,984 $6,432,412 $2,303,156 $146,270 6.351% $101,170 $44,094 $1,006
FY 2013 All OGAS Total 11,577 $6,973,160 $2,826,761 $176,158 6.232% $127,548 $47,584 $1,026
FY 2014 Drilling Oil and Gas Wells 1,342 $576,347 $537,875 $31,104 5.783% $27,214 $3,766 $123
FY 2014 OGAS Extraction Services 114 $11,145 $9,761 $589 6.034% $454 $135 -
FY 2014 OGAS Operations Support 10,075 $4,748,518 $2,653,350 $167,144 6.299% $117,021 $48,993 $1,130
FY 2014 Oil and Gas Extraction 709 $154,767 $141,100 8,200 5.811% $6,790 $1,398 $13
FY 2014 All OGAS Total 12,240 $5,490,776 $3,342,086 $207,036 6.195% $151,479 $54,292 $1,266
7. If you include the gross receipts tax indirect economic burden and a substantial portion of the interest accruing to the general fund from the
land grant permanent fund (96+%) and the severance tax permanent fund (86+%) attributable to oil and gas production in the state, what is
the plausible percentage of the total general fund derived from oil and gas production? Answer – 32.0% for FY 2013 and 35.1.5% for FY 2014 –
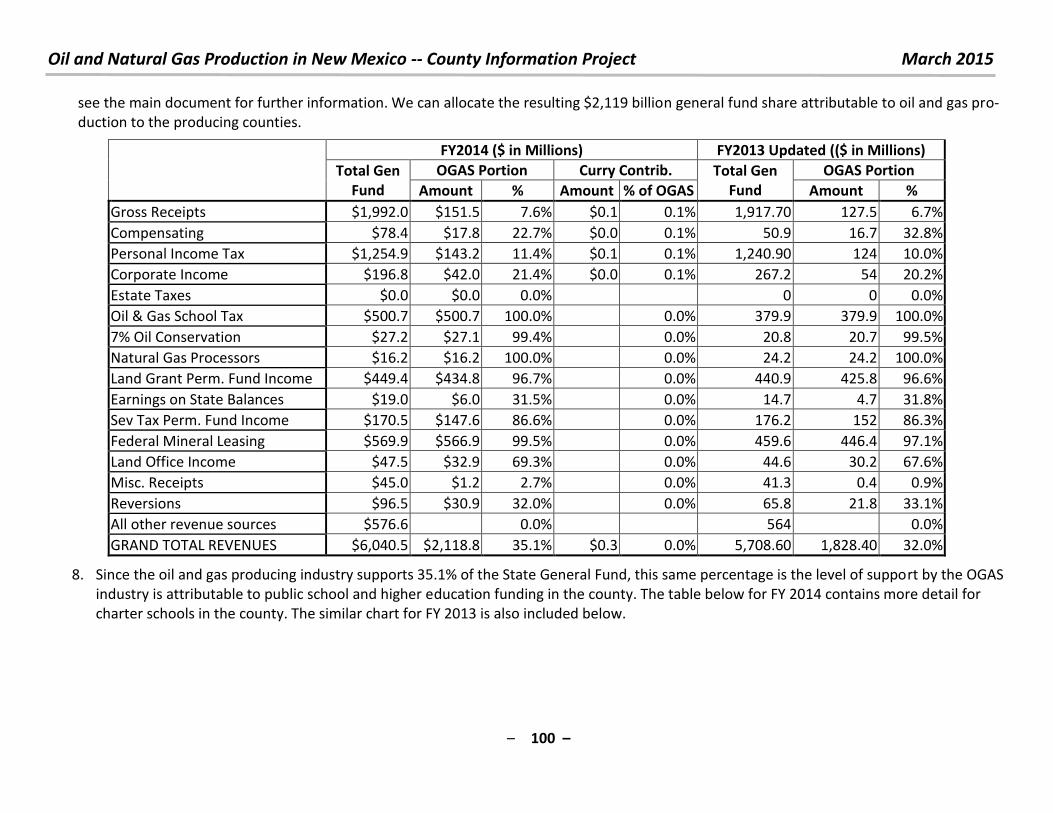
Oil and Natural Gas Production in New Mexico -- County Information Project March 2015
– 100 –
see the main document for further information. We can allocate the resulting $2,119 billion general fund share attributable to oil and gas pro-
duction to the producing counties.
FY2014 ($ in Millions) FY2013 Updated (($ in Millions)
Total Gen
Fund
OGAS Portion Curry Contrib. Total Gen
Fund
OGAS Portion
Amount % Amount % of OGAS Amount %
Gross Receipts $1,992.0 $151.5 7.6% $0.1 0.1% 1,917.70 127.5 6.7%
Compensating $78.4 $17.8 22.7% $0.0 0.1% 50.9 16.7 32.8%
Personal Income Tax $1,254.9 $143.2 11.4% $0.1 0.1% 1,240.90 124 10.0%
Corporate Income $196.8 $42.0 21.4% $0.0 0.1% 267.2 54 20.2%
Estate Taxes $0.0 $0.0 0.0%
0 0 0.0%
Oil & Gas School Tax $500.7 $500.7 100.0%
0.0% 379.9 379.9 100.0%
7% Oil Conservation $27.2 $27.1 99.4%
0.0% 20.8 20.7 99.5%
Natural Gas Processors $16.2 $16.2 100.0%
0.0% 24.2 24.2 100.0%
Land Grant Perm. Fund Income $449.4 $434.8 96.7%
0.0% 440.9 425.8 96.6%
Earnings on State Balances $19.0 $6.0 31.5%
0.0% 14.7 4.7 31.8%
Sev Tax Perm. Fund Income $170.5 $147.6 86.6%
0.0% 176.2 152 86.3%
Federal Mineral Leasing $569.9 $566.9 99.5%
0.0% 459.6 446.4 97.1%
Land Office Income $47.5 $32.9 69.3%
0.0% 44.6 30.2 67.6%
Misc. Receipts $45.0 $1.2 2.7%
0.0% 41.3 0.4 0.9%
Reversions $96.5 $30.9 32.0%
0.0% 65.8 21.8 33.1%
All other revenue sources $576.6 0.0%
564
0.0%
GRAND TOTAL REVENUES $6,040.5 $2,118.8 35.1% $0.3 0.0% 5,708.60 1,828.40 32.0%
8. Since the oil and gas producing industry supports 35.1% of the State General Fund, this same percentage is the level of support by the OGAS
industry is attributable to public school and higher education funding in the county. The table below for FY 2014 contains more detail for
charter schools in the county. The similar chart for FY 2013 is also included below.
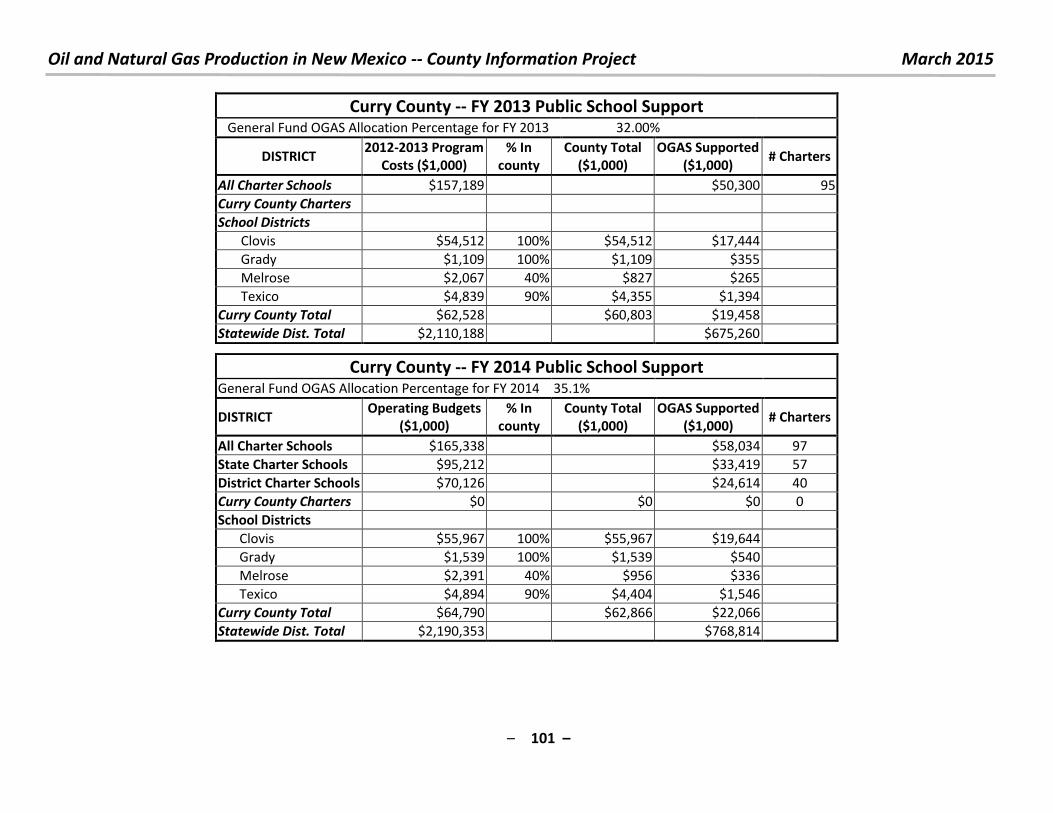
Oil and Natural Gas Production in New Mexico -- County Information Project March 2015
– 101 –
Curry County -- FY 2013 Public School Support General Fund OGAS Allocation Percentage for FY 2013 32.00%
DISTRICT 2012-2013 Program
Costs ($1,000)
% In
county
County Total
($1,000)
OGAS Supported
($1,000) # Charters
All Charter Schools $157,189 $50,300 95
Curry County Charters
School Districts
Clovis $54,512 100% $54,512 $17,444
Grady $1,109 100% $1,109 $355
Melrose $2,067 40% $827 $265
Texico $4,839 90% $4,355 $1,394
Curry County Total $62,528 $60,803 $19,458
Statewide Dist. Total $2,110,188 $675,260
Curry County -- FY 2014 Public School Support General Fund OGAS Allocation Percentage for FY 2014 35.1%
DISTRICT Operating Budgets
($1,000)
% In
county
County Total
($1,000)
OGAS Supported
($1,000) # Charters
All Charter Schools $165,338 $58,034 97
State Charter Schools $95,212 $33,419 57
District Charter Schools $70,126 $24,614 40
Curry County Charters $0 $0 $0 0
School Districts
Clovis $55,967 100% $55,967 $19,644
Grady $1,539 100% $1,539 $540
Melrose $2,391 40% $956 $336
Texico $4,894 90% $4,404 $1,546
Curry County Total $64,790 $62,866 $22,066
Statewide Dist. Total $2,190,353 $768,814
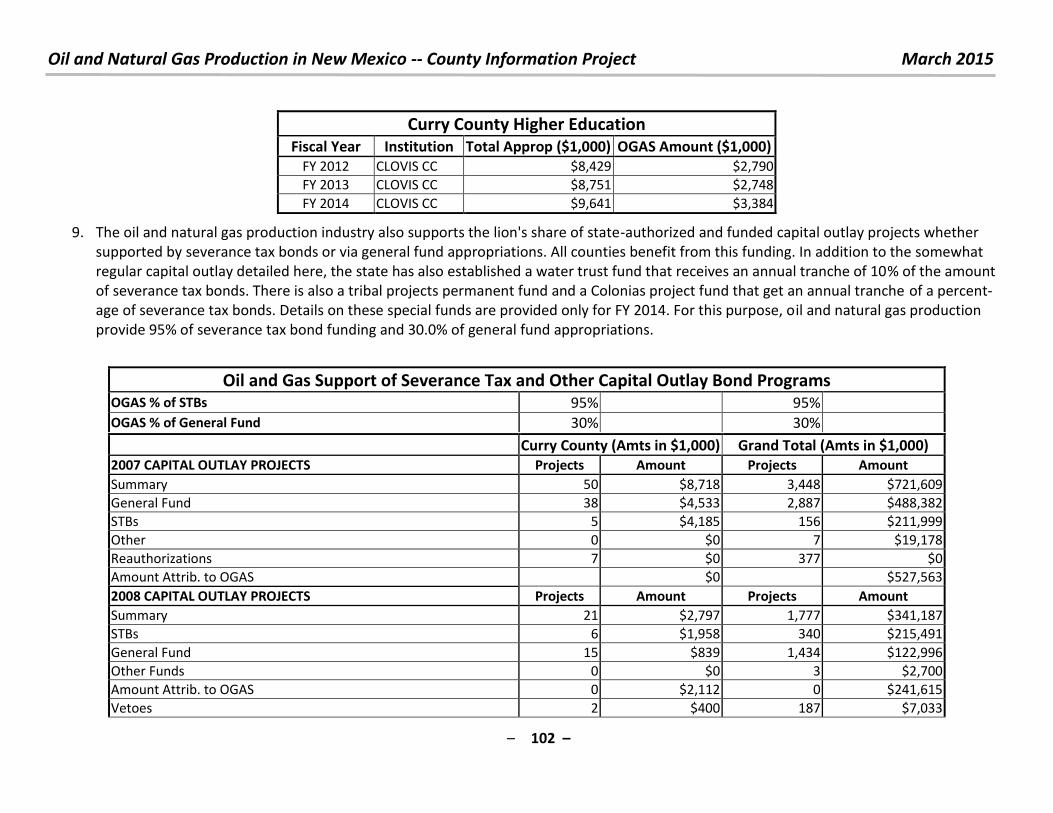
Oil and Natural Gas Production in New Mexico -- County Information Project March 2015
– 102 –
Curry County Higher Education
Fiscal Year Institution Total Approp ($1,000) OGAS Amount ($1,000)
FY 2012 CLOVIS CC $8,429 $2,790
FY 2013 CLOVIS CC $8,751 $2,748
FY 2014 CLOVIS CC $9,641 $3,384
9. The oil and natural gas production industry also supports the lion's share of state-authorized and funded capital outlay projects whether
supported by severance tax bonds or via general fund appropriations. All counties benefit from this funding. In addition to the somewhat
regular capital outlay detailed here, the state has also established a water trust fund that receives an annual tranche of 10% of the amount
of severance tax bonds. There is also a tribal projects permanent fund and a Colonias project fund that get an annual tranche of a percent-
age of severance tax bonds. Details on these special funds are provided only for FY 2014. For this purpose, oil and natural gas production
provide 95% of severance tax bond funding and 30.0% of general fund appropriations.
Oil and Gas Support of Severance Tax and Other Capital Outlay Bond Programs OGAS % of STBs 95% 95%
OGAS % of General Fund 30% 30%
Curry County (Amts in $1,000) Grand Total (Amts in $1,000)
2007 CAPITAL OUTLAY PROJECTS Projects Amount Projects Amount
Summary 50 $8,718 3,448 $721,609
General Fund 38 $4,533 2,887 $488,382
STBs 5 $4,185 156 $211,999
Other 0 $0 7 $19,178
Reauthorizations 7 $0 377 $0
Amount Attrib. to OGAS $0 $527,563
2008 CAPITAL OUTLAY PROJECTS Projects Amount Projects Amount
Summary 21 $2,797 1,777 $341,187
STBs 6 $1,958 340 $215,491
General Fund 15 $839 1,434 $122,996
Other Funds 0 $0 3 $2,700
Amount Attrib. to OGAS 0 $2,112 0 $241,615
Vetoes 2 $400 187 $7,033
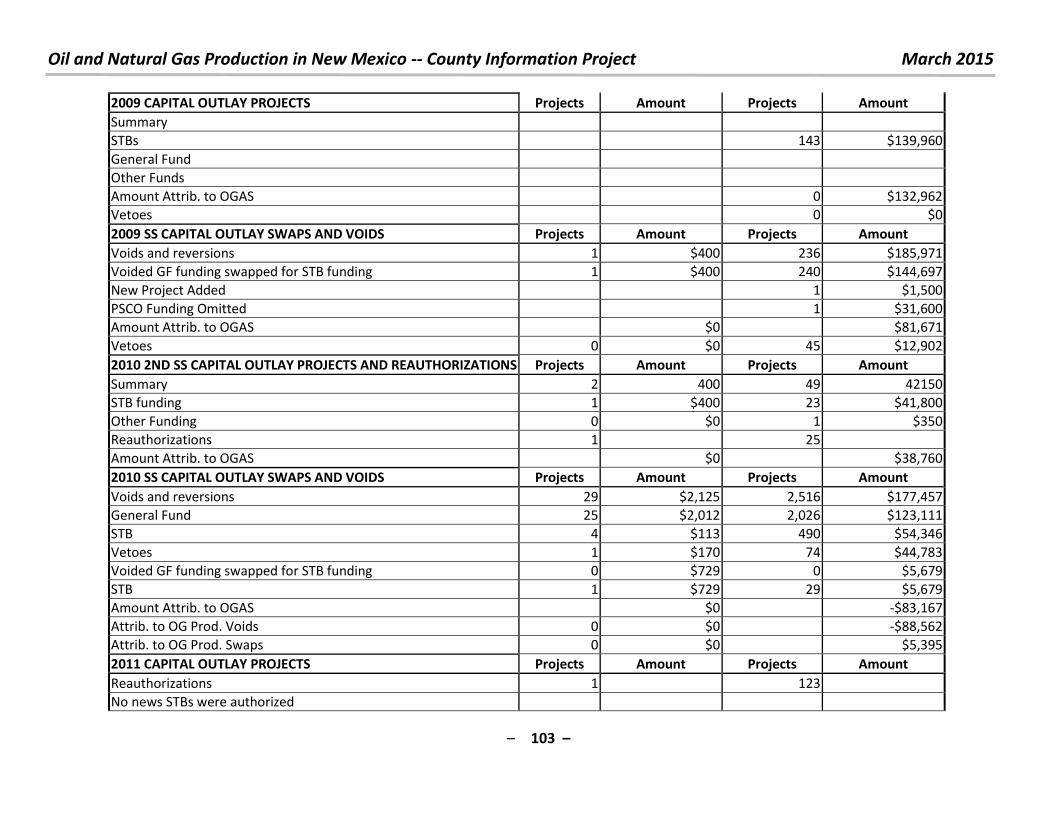
Oil and Natural Gas Production in New Mexico -- County Information Project March 2015
– 103 –
2009 CAPITAL OUTLAY PROJECTS Projects Amount Projects Amount
Summary
STBs 143 $139,960
General Fund
Other Funds
Amount Attrib. to OGAS 0 $132,962
Vetoes 0 $0
2009 SS CAPITAL OUTLAY SWAPS AND VOIDS Projects Amount Projects Amount
Voids and reversions 1 $400 236 $185,971
Voided GF funding swapped for STB funding 1 $400 240 $144,697
New Project Added 1 $1,500
PSCO Funding Omitted 1 $31,600
Amount Attrib. to OGAS $0 $81,671
Vetoes 0 $0 45 $12,902
2010 2ND SS CAPITAL OUTLAY PROJECTS AND REAUTHORIZATIONS Projects Amount Projects Amount
Summary 2 400 49 42150
STB funding 1 $400 23 $41,800
Other Funding 0 $0 1 $350
Reauthorizations 1 25
Amount Attrib. to OGAS $0 $38,760
2010 SS CAPITAL OUTLAY SWAPS AND VOIDS Projects Amount Projects Amount
Voids and reversions 29 $2,125 2,516 $177,457
General Fund 25 $2,012 2,026 $123,111
STB 4 $113 490 $54,346
Vetoes 1 $170 74 $44,783
Voided GF funding swapped for STB funding 0 $729 0 $5,679
STB 1 $729 29 $5,679
Amount Attrib. to OGAS $0 -$83,167
Attrib. to OG Prod. Voids 0 $0 -$88,562
Attrib. to OG Prod. Swaps 0 $0 $5,395
2011 CAPITAL OUTLAY PROJECTS Projects Amount Projects Amount
Reauthorizations 1 123
No news STBs were authorized
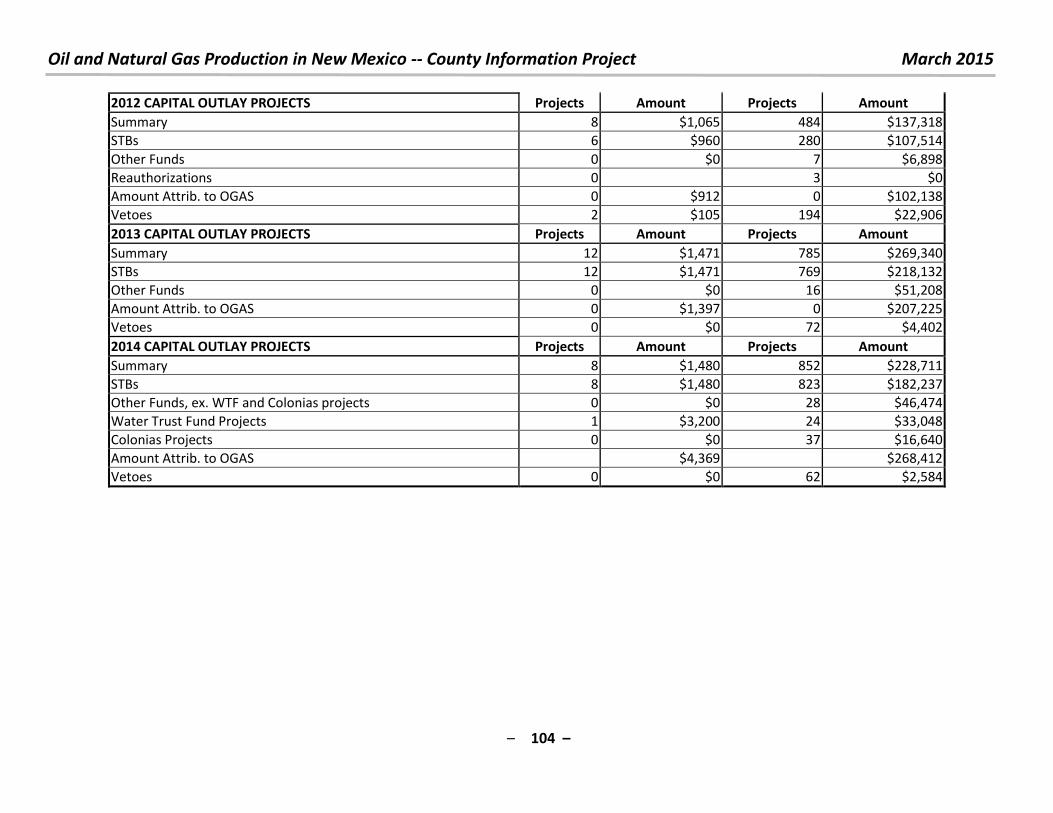
Oil and Natural Gas Production in New Mexico -- County Information Project March 2015
– 104 –
2012 CAPITAL OUTLAY PROJECTS Projects Amount Projects Amount
Summary 8 $1,065 484 $137,318
STBs 6 $960 280 $107,514
Other Funds 0 $0 7 $6,898
Reauthorizations 0 3 $0
Amount Attrib. to OGAS 0 $912 0 $102,138
Vetoes 2 $105 194 $22,906
2013 CAPITAL OUTLAY PROJECTS Projects Amount Projects Amount
Summary 12 $1,471 785 $269,340
STBs 12 $1,471 769 $218,132
Other Funds 0 $0 16 $51,208
Amount Attrib. to OGAS 0 $1,397 0 $207,225
Vetoes 0 $0 72 $4,402
2014 CAPITAL OUTLAY PROJECTS Projects Amount Projects Amount
Summary 8 $1,480 852 $228,711
STBs 8 $1,480 823 $182,237
Other Funds, ex. WTF and Colonias projects 0 $0 28 $46,474
Water Trust Fund Projects 1 $3,200 24 $33,048
Colonias Projects 0 $0 37 $16,640
Amount Attrib. to OGAS $4,369 $268,412
Vetoes 0 $0 62 $2,584

Oil and Natural Gas Production in New Mexico -- County Information Project March 2015
– 105 –
10. For questions, comments or criticisms of this work, contact:
Laird Graeser
505 424-9023
or
Richard L. Anklam, President & Executive Director, New Mexico Tax Research Institute
505-269-6791
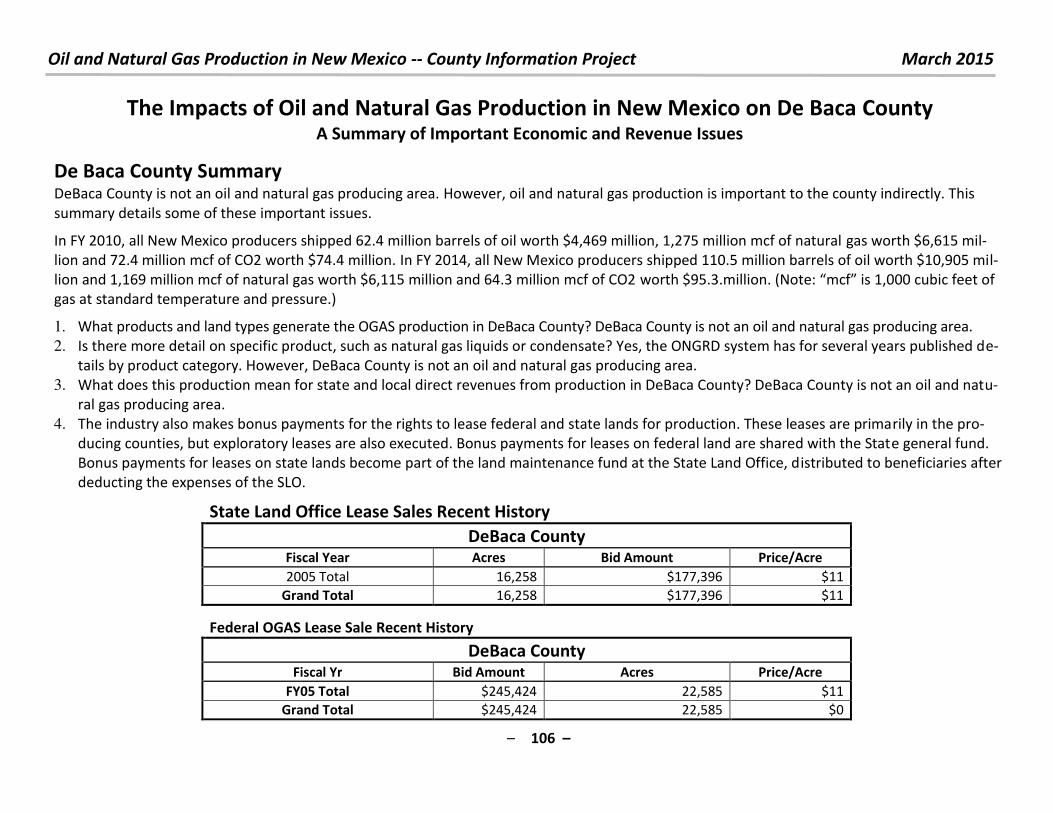
Oil and Natural Gas Production in New Mexico -- County Information Project March 2015
– 106 –
The Impacts of Oil and Natural Gas Production in New Mexico on De Baca County A Summary of Important Economic and Revenue Issues
De Baca County Summary
DeBaca County is not an oil and natural gas producing area. However, oil and natural gas production is important to the county indirectly. This
summary details some of these important issues.
In FY 2010, all New Mexico producers shipped 62.4 million barrels of oil worth $4,469 million, 1,275 million mcf of natural gas worth $6,615 mil-
lion and 72.4 million mcf of CO2 worth $74.4 million. In FY 2014, all New Mexico producers shipped 110.5 million barrels of oil worth $10,905 mil-
lion and 1,169 million mcf of natural gas worth $6,115 million and 64.3 million mcf of CO2 worth $ . . illio . Note: f is , u i feet of gas at standard temperature and pressure.)
1. What products and land types generate the OGAS production in DeBaca County? DeBaca County is not an oil and natural gas producing area.
2. Is there more detail on specific product, such as natural gas liquids or condensate? Yes, the ONGRD system has for several years published de-
tails by product category. However, DeBaca County is not an oil and natural gas producing area.
3. What does this production mean for state and local direct revenues from production in DeBaca County? DeBaca County is not an oil and natu-
ral gas producing area.
4. The industry also makes bonus payments for the rights to lease federal and state lands for production. These leases are primarily in the pro-
ducing counties, but exploratory leases are also executed. Bonus payments for leases on federal land are shared with the State general fund.
Bonus payments for leases on state lands become part of the land maintenance fund at the State Land Office, distributed to beneficiaries after
deducting the expenses of the SLO.
State Land Office Lease Sales Recent History
DeBaca County Fiscal Year Acres Bid Amount Price/Acre
2005 Total 16,258 $177,396 $11
Grand Total 16,258 $177,396 $11
Federal OGAS Lease Sale Recent History
DeBaca County Fiscal Yr Bid Amount Acres Price/Acre
FY05 Total $245,424 22,585 $11
Grand Total $245,424 22,585 $0
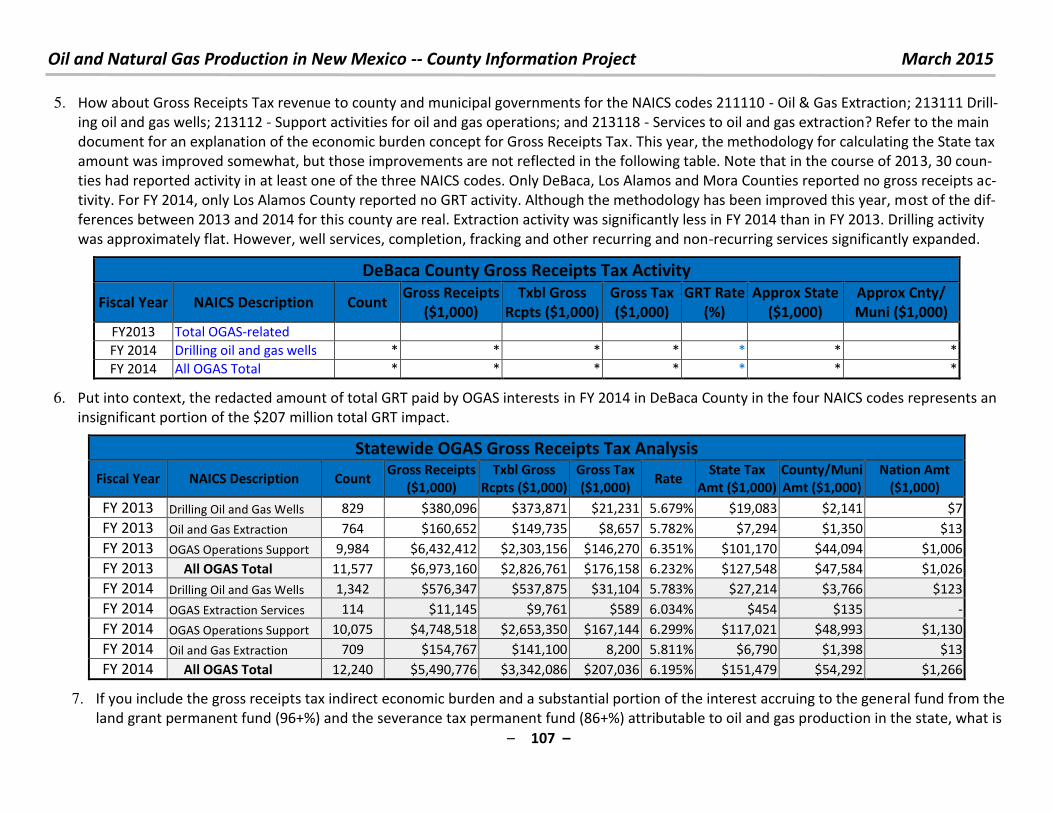
Oil and Natural Gas Production in New Mexico -- County Information Project March 2015
– 107 –
5. How about Gross Receipts Tax revenue to county and municipal governments for the NAICS codes 211110 - Oil & Gas Extraction; 213111 Drill-
ing oil and gas wells; 213112 - Support activities for oil and gas operations; and 213118 - Services to oil and gas extraction? Refer to the main
document for an explanation of the economic burden concept for Gross Receipts Tax. This year, the methodology for calculating the State tax
amount was improved somewhat, but those improvements are not reflected in the following table. Note that in the course of 2013, 30 coun-
ties had reported activity in at least one of the three NAICS codes. Only DeBaca, Los Alamos and Mora Counties reported no gross receipts ac-
tivity. For FY 2014, only Los Alamos County reported no GRT activity. Although the methodology has been improved this year, most of the dif-
ferences between 2013 and 2014 for this county are real. Extraction activity was significantly less in FY 2014 than in FY 2013. Drilling activity
was approximately flat. However, well services, completion, fracking and other recurring and non-recurring services significantly expanded.
DeBaca County Gross Receipts Tax Activity
Fiscal Year NAICS Description Count Gross Receipts
($1,000)
Txbl Gross
Rcpts ($1,000)
Gross Tax
($1,000)
GRT Rate
(%)
Approx State
($1,000)
Approx Cnty/
Muni ($1,000)
FY2013 Total OGAS-related
FY 2014 Drilling oil and gas wells * * * * * * *
FY 2014 All OGAS Total * * * * * * *
6. Put into context, the redacted amount of total GRT paid by OGAS interests in FY 2014 in DeBaca County in the four NAICS codes represents an
insignificant portion of the $207 million total GRT impact.
Statewide OGAS Gross Receipts Tax Analysis
Fiscal Year NAICS Description Count Gross Receipts
($1,000)
Txbl Gross
Rcpts ($1,000)
Gross Tax
($1,000) Rate
State Tax
Amt ($1,000)
County/Muni
Amt ($1,000)
Nation Amt
($1,000)
FY 2013 Drilling Oil and Gas Wells 829 $380,096 $373,871 $21,231 5.679% $19,083 $2,141 $7
FY 2013 Oil and Gas Extraction 764 $160,652 $149,735 $8,657 5.782% $7,294 $1,350 $13
FY 2013 OGAS Operations Support 9,984 $6,432,412 $2,303,156 $146,270 6.351% $101,170 $44,094 $1,006
FY 2013 All OGAS Total 11,577 $6,973,160 $2,826,761 $176,158 6.232% $127,548 $47,584 $1,026
FY 2014 Drilling Oil and Gas Wells 1,342 $576,347 $537,875 $31,104 5.783% $27,214 $3,766 $123
FY 2014 OGAS Extraction Services 114 $11,145 $9,761 $589 6.034% $454 $135 -
FY 2014 OGAS Operations Support 10,075 $4,748,518 $2,653,350 $167,144 6.299% $117,021 $48,993 $1,130
FY 2014 Oil and Gas Extraction 709 $154,767 $141,100 8,200 5.811% $6,790 $1,398 $13
FY 2014 All OGAS Total 12,240 $5,490,776 $3,342,086 $207,036 6.195% $151,479 $54,292 $1,266
7. If you include the gross receipts tax indirect economic burden and a substantial portion of the interest accruing to the general fund from the
land grant permanent fund (96+%) and the severance tax permanent fund (86+%) attributable to oil and gas production in the state, what is
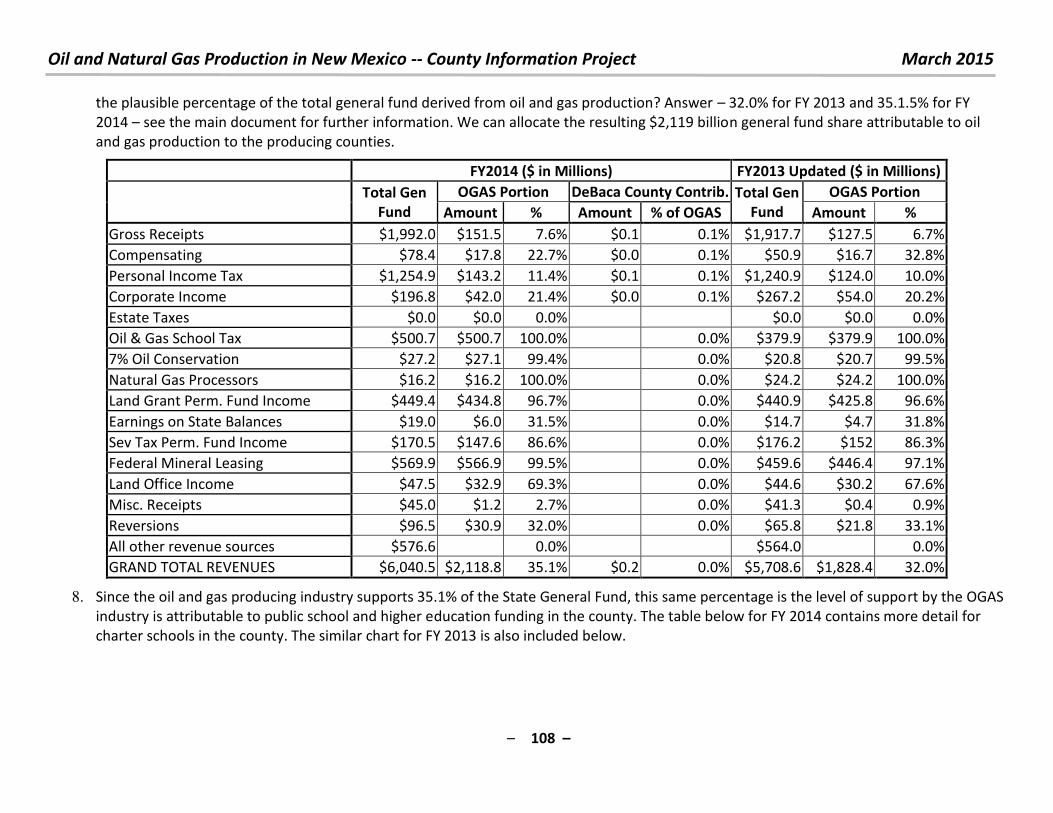
Oil and Natural Gas Production in New Mexico -- County Information Project March 2015
– 108 –
the plausible percentage of the total general fund derived from oil and gas production? Answer – 32.0% for FY 2013 and 35.1.5% for FY
2014 – see the main document for further information. We can allocate the resulting $2,119 billion general fund share attributable to oil
and gas production to the producing counties.
FY2014 ($ in Millions) FY2013 Updated ($ in Millions)
Total Gen
Fund
OGAS Portion DeBaca County Contrib. Total Gen
Fund
OGAS Portion
Amount % Amount % of OGAS Amount %
Gross Receipts $1,992.0 $151.5 7.6% $0.1 0.1% $1,917.7 $127.5 6.7%
Compensating $78.4 $17.8 22.7% $0.0 0.1% $50.9 $16.7 32.8%
Personal Income Tax $1,254.9 $143.2 11.4% $0.1 0.1% $1,240.9 $124.0 10.0%
Corporate Income $196.8 $42.0 21.4% $0.0 0.1% $267.2 $54.0 20.2%
Estate Taxes $0.0 $0.0 0.0% $0.0 $0.0 0.0%
Oil & Gas School Tax $500.7 $500.7 100.0% 0.0% $379.9 $379.9 100.0%
7% Oil Conservation $27.2 $27.1 99.4% 0.0% $20.8 $20.7 99.5%
Natural Gas Processors $16.2 $16.2 100.0% 0.0% $24.2 $24.2 100.0%
Land Grant Perm. Fund Income $449.4 $434.8 96.7% 0.0% $440.9 $425.8 96.6%
Earnings on State Balances $19.0 $6.0 31.5% 0.0% $14.7 $4.7 31.8%
Sev Tax Perm. Fund Income $170.5 $147.6 86.6% 0.0% $176.2 $152 86.3%
Federal Mineral Leasing $569.9 $566.9 99.5% 0.0% $459.6 $446.4 97.1%
Land Office Income $47.5 $32.9 69.3% 0.0% $44.6 $30.2 67.6%
Misc. Receipts $45.0 $1.2 2.7% 0.0% $41.3 $0.4 0.9%
Reversions $96.5 $30.9 32.0% 0.0% $65.8 $21.8 33.1%
All other revenue sources $576.6 0.0% $564.0
0.0%
GRAND TOTAL REVENUES $6,040.5 $2,118.8 35.1% $0.2 0.0% $5,708.6 $1,828.4 32.0%
8. Since the oil and gas producing industry supports 35.1% of the State General Fund, this same percentage is the level of support by the OGAS
industry is attributable to public school and higher education funding in the county. The table below for FY 2014 contains more detail for
charter schools in the county. The similar chart for FY 2013 is also included below.
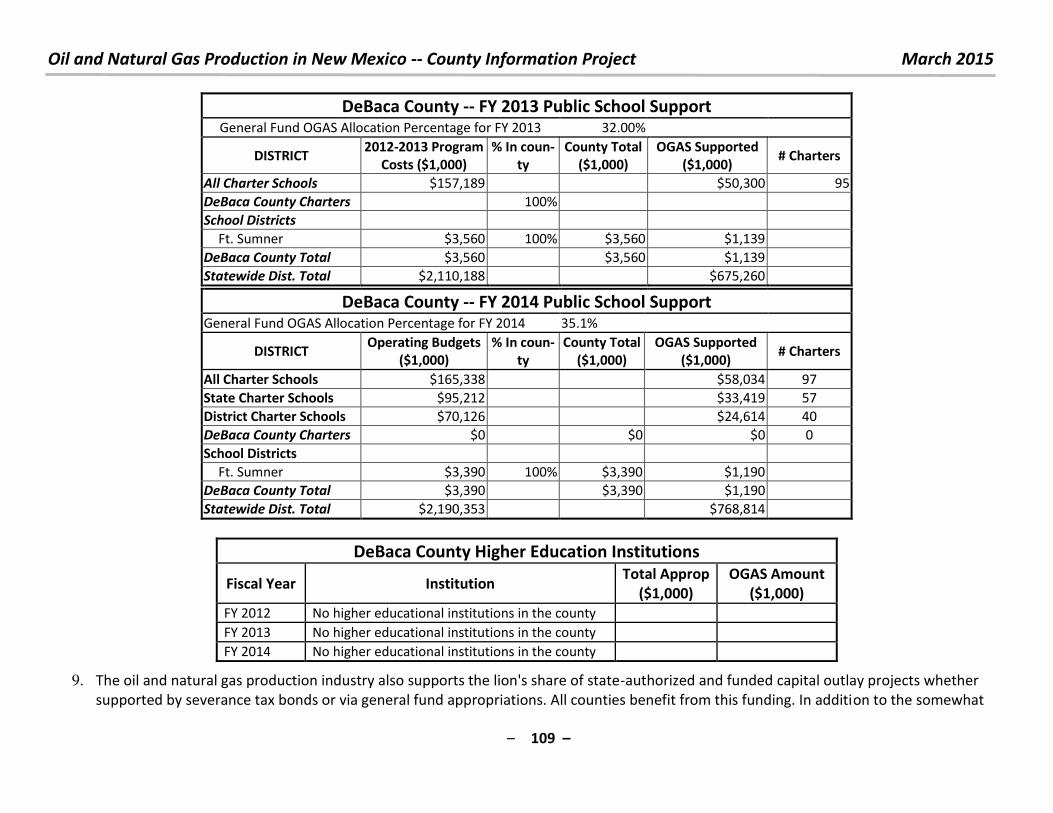
Oil and Natural Gas Production in New Mexico -- County Information Project March 2015
– 109 –
DeBaca County -- FY 2013 Public School Support General Fund OGAS Allocation Percentage for FY 2013 32.00%
DISTRICT 2012-2013 Program
Costs ($1,000)
% In coun-
ty
County Total
($1,000)
OGAS Supported
($1,000) # Charters
All Charter Schools $157,189 $50,300 95
DeBaca County Charters 100%
School Districts
Ft. Sumner $3,560 100% $3,560 $1,139
DeBaca County Total $3,560 $3,560 $1,139
Statewide Dist. Total $2,110,188 $675,260
DeBaca County -- FY 2014 Public School Support General Fund OGAS Allocation Percentage for FY 2014 35.1%
DISTRICT Operating Budgets
($1,000)
% In coun-
ty
County Total
($1,000)
OGAS Supported
($1,000) # Charters
All Charter Schools $165,338 $58,034 97
State Charter Schools $95,212 $33,419 57
District Charter Schools $70,126 $24,614 40
DeBaca County Charters $0 $0 $0 0
School Districts
Ft. Sumner $3,390 100% $3,390 $1,190
DeBaca County Total $3,390 $3,390 $1,190
Statewide Dist. Total $2,190,353 $768,814
DeBaca County Higher Education Institutions
Fiscal Year Institution Total Approp
($1,000)
OGAS Amount
($1,000)
FY 2012 No higher educational institutions in the county
FY 2013 No higher educational institutions in the county
FY 2014 No higher educational institutions in the county
9. The oil and natural gas production industry also supports the lion's share of state-authorized and funded capital outlay projects whether
supported by severance tax bonds or via general fund appropriations. All counties benefit from this funding. In addition to the somewhat
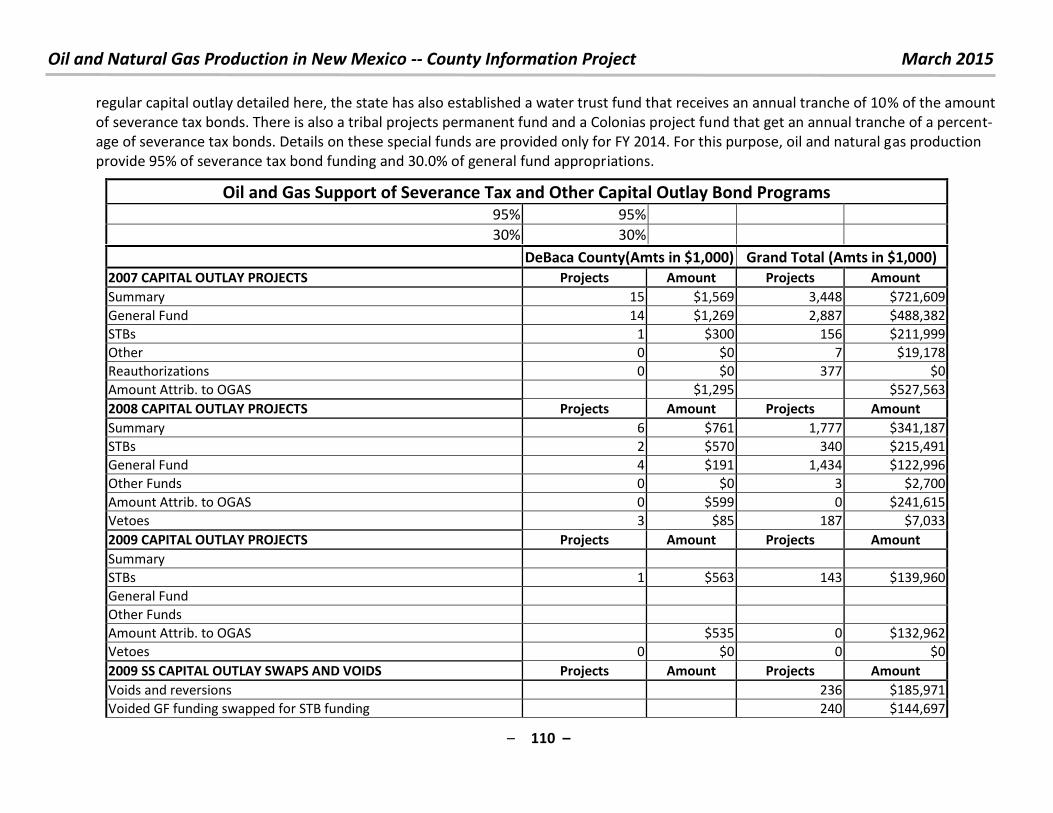
Oil and Natural Gas Production in New Mexico -- County Information Project March 2015
– 110 –
regular capital outlay detailed here, the state has also established a water trust fund that receives an annual tranche of 10% of the amount
of severance tax bonds. There is also a tribal projects permanent fund and a Colonias project fund that get an annual tranche of a percent-
age of severance tax bonds. Details on these special funds are provided only for FY 2014. For this purpose, oil and natural gas production
provide 95% of severance tax bond funding and 30.0% of general fund appropriations.
Oil and Gas Support of Severance Tax and Other Capital Outlay Bond Programs 95% 95%
30% 30%
DeBaca County(Amts in $1,000) Grand Total (Amts in $1,000)
2007 CAPITAL OUTLAY PROJECTS Projects Amount Projects Amount
Summary 15 $1,569 3,448 $721,609
General Fund 14 $1,269 2,887 $488,382
STBs 1 $300 156 $211,999
Other 0 $0 7 $19,178
Reauthorizations 0 $0 377 $0
Amount Attrib. to OGAS $1,295 $527,563
2008 CAPITAL OUTLAY PROJECTS Projects Amount Projects Amount
Summary 6 $761 1,777 $341,187
STBs 2 $570 340 $215,491
General Fund 4 $191 1,434 $122,996
Other Funds 0 $0 3 $2,700
Amount Attrib. to OGAS 0 $599 0 $241,615
Vetoes 3 $85 187 $7,033
2009 CAPITAL OUTLAY PROJECTS Projects Amount Projects Amount
Summary
STBs 1 $563 143 $139,960
General Fund
Other Funds
Amount Attrib. to OGAS $535 0 $132,962
Vetoes 0 $0 0 $0
2009 SS CAPITAL OUTLAY SWAPS AND VOIDS Projects Amount Projects Amount
Voids and reversions 236 $185,971
Voided GF funding swapped for STB funding 240 $144,697
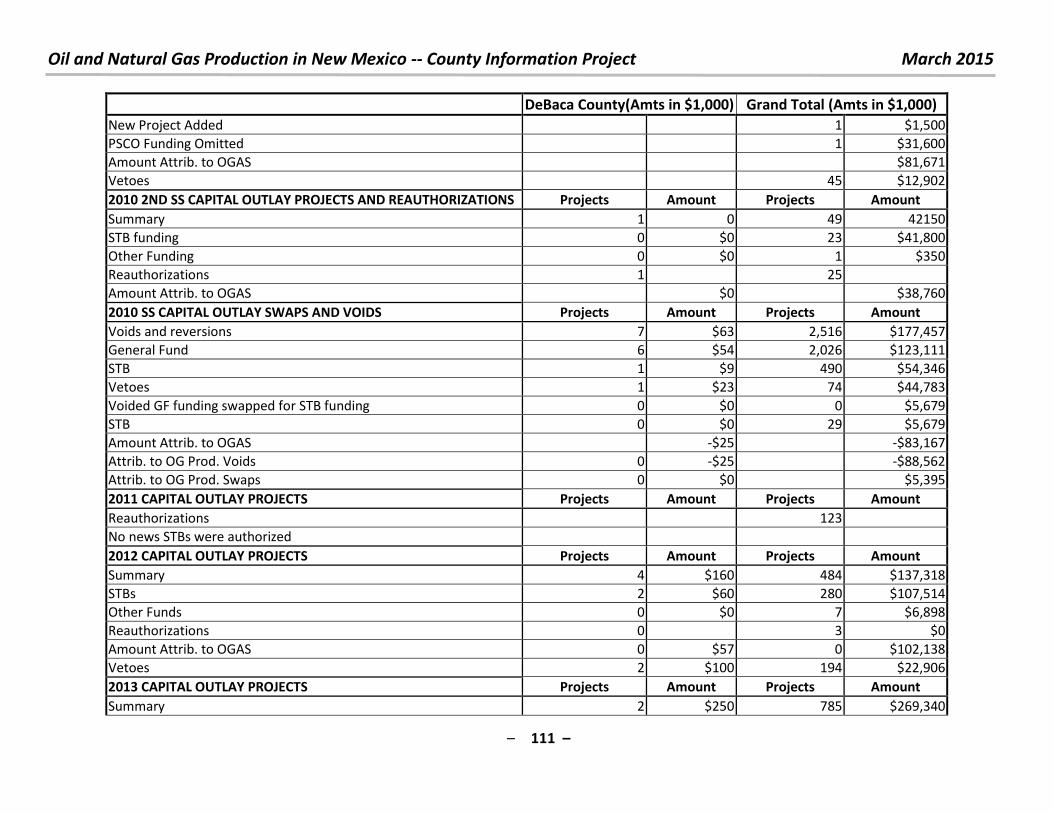
Oil and Natural Gas Production in New Mexico -- County Information Project March 2015
– 111 –
DeBaca County(Amts in $1,000) Grand Total (Amts in $1,000)
New Project Added 1 $1,500
PSCO Funding Omitted 1 $31,600
Amount Attrib. to OGAS $81,671
Vetoes 45 $12,902
2010 2ND SS CAPITAL OUTLAY PROJECTS AND REAUTHORIZATIONS Projects Amount Projects Amount
Summary 1 0 49 42150
STB funding 0 $0 23 $41,800
Other Funding 0 $0 1 $350
Reauthorizations 1 25
Amount Attrib. to OGAS $0 $38,760
2010 SS CAPITAL OUTLAY SWAPS AND VOIDS Projects Amount Projects Amount
Voids and reversions 7 $63 2,516 $177,457
General Fund 6 $54 2,026 $123,111
STB 1 $9 490 $54,346
Vetoes 1 $23 74 $44,783
Voided GF funding swapped for STB funding 0 $0 0 $5,679
STB 0 $0 29 $5,679
Amount Attrib. to OGAS -$25 -$83,167
Attrib. to OG Prod. Voids 0 -$25 -$88,562
Attrib. to OG Prod. Swaps 0 $0 $5,395
2011 CAPITAL OUTLAY PROJECTS Projects Amount Projects Amount
Reauthorizations 123
No news STBs were authorized
2012 CAPITAL OUTLAY PROJECTS Projects Amount Projects Amount
Summary 4 $160 484 $137,318
STBs 2 $60 280 $107,514
Other Funds 0 $0 7 $6,898
Reauthorizations 0 3 $0
Amount Attrib. to OGAS 0 $57 0 $102,138
Vetoes 2 $100 194 $22,906
2013 CAPITAL OUTLAY PROJECTS Projects Amount Projects Amount
Summary 2 $250 785 $269,340
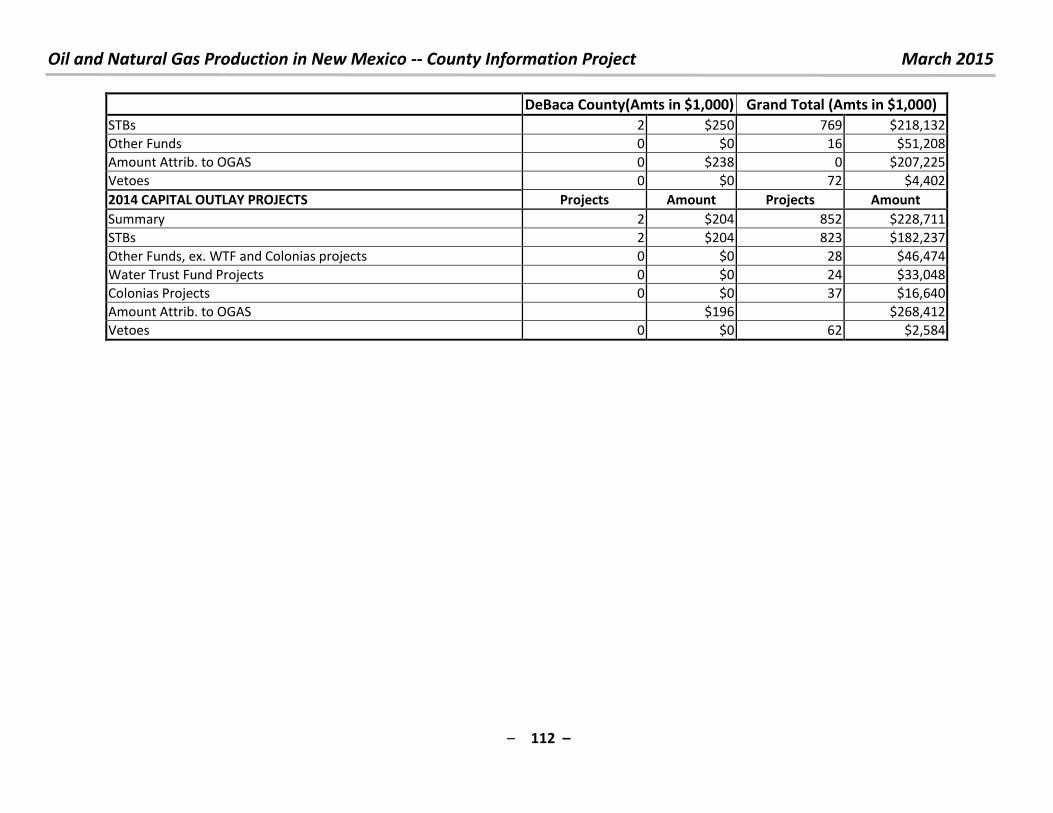
Oil and Natural Gas Production in New Mexico -- County Information Project March 2015
– 112 –
DeBaca County(Amts in $1,000) Grand Total (Amts in $1,000)
STBs 2 $250 769 $218,132
Other Funds 0 $0 16 $51,208
Amount Attrib. to OGAS 0 $238 0 $207,225
Vetoes 0 $0 72 $4,402
2014 CAPITAL OUTLAY PROJECTS Projects Amount Projects Amount
Summary 2 $204 852 $228,711
STBs 2 $204 823 $182,237
Other Funds, ex. WTF and Colonias projects 0 $0 28 $46,474
Water Trust Fund Projects 0 $0 24 $33,048
Colonias Projects 0 $0 37 $16,640
Amount Attrib. to OGAS $196 $268,412
Vetoes 0 $0 62 $2,584

Oil and Natural Gas Production in New Mexico -- County Information Project March 2015
– 113 –
10. For questions, comments or criticisms of this work, contact:
Laird Graeser
505 424-9023
or
Richard L. Anklam, President & Executive Director, New Mexico Tax Research Institute
505-269-6791
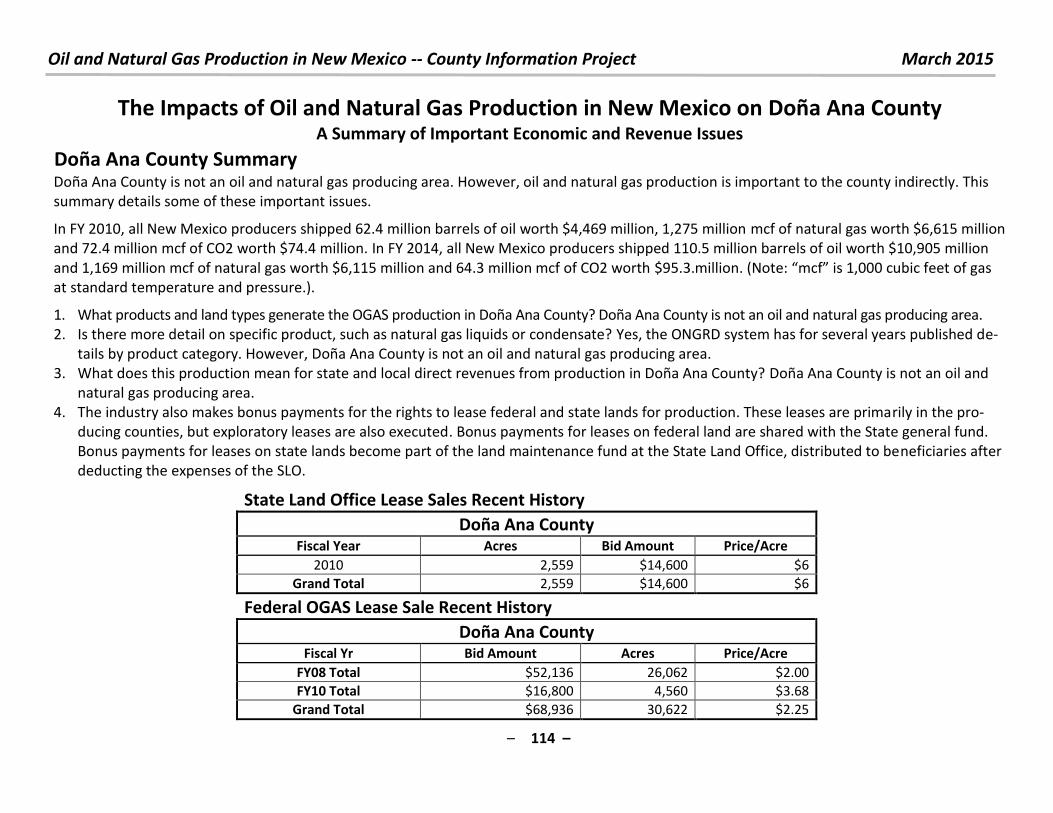
Oil and Natural Gas Production in New Mexico -- County Information Project March 2015
– 114 –
The Impacts of Oil and Natural Gas Production in New Mexico on Doña Ana County A Summary of Important Economic and Revenue Issues
Doña Ana County Summary
Doña Ana County is not an oil and natural gas producing area. However, oil and natural gas production is important to the county indirectly. This
summary details some of these important issues.
In FY 2010, all New Mexico producers shipped 62.4 million barrels of oil worth $4,469 million, 1,275 million mcf of natural gas worth $6,615 million
and 72.4 million mcf of CO2 worth $74.4 million. In FY 2014, all New Mexico producers shipped 110.5 million barrels of oil worth $10,905 million
and 1,169 million mcf of natural gas worth $6,115 million and 64.3 million mcf of CO2 worth $ . . illio . Note: f is , u i feet of gas at standard temperature and pressure.).
1. What products and land types generate the OGAS production in Doña Ana County? Doña Ana County is not an oil and natural gas producing area.
2. Is there more detail on specific product, such as natural gas liquids or condensate? Yes, the ONGRD system has for several years published de-
tails by product category. However, Doña Ana County is not an oil and natural gas producing area.
3. What does this production mean for state and local direct revenues from production in Doña Ana County? Doña Ana County is not an oil and
natural gas producing area.
4. The industry also makes bonus payments for the rights to lease federal and state lands for production. These leases are primarily in the pro-
ducing counties, but exploratory leases are also executed. Bonus payments for leases on federal land are shared with the State general fund.
Bonus payments for leases on state lands become part of the land maintenance fund at the State Land Office, distributed to beneficiaries after
deducting the expenses of the SLO.
State Land Office Lease Sales Recent History
Doña Ana County Fiscal Year Acres Bid Amount Price/Acre
2010 2,559 $14,600 $6
Grand Total 2,559 $14,600 $6
Federal OGAS Lease Sale Recent History
Doña Ana County Fiscal Yr Bid Amount Acres Price/Acre
FY08 Total $52,136 26,062 $2.00
FY10 Total $16,800 4,560 $3.68
Grand Total $68,936 30,622 $2.25
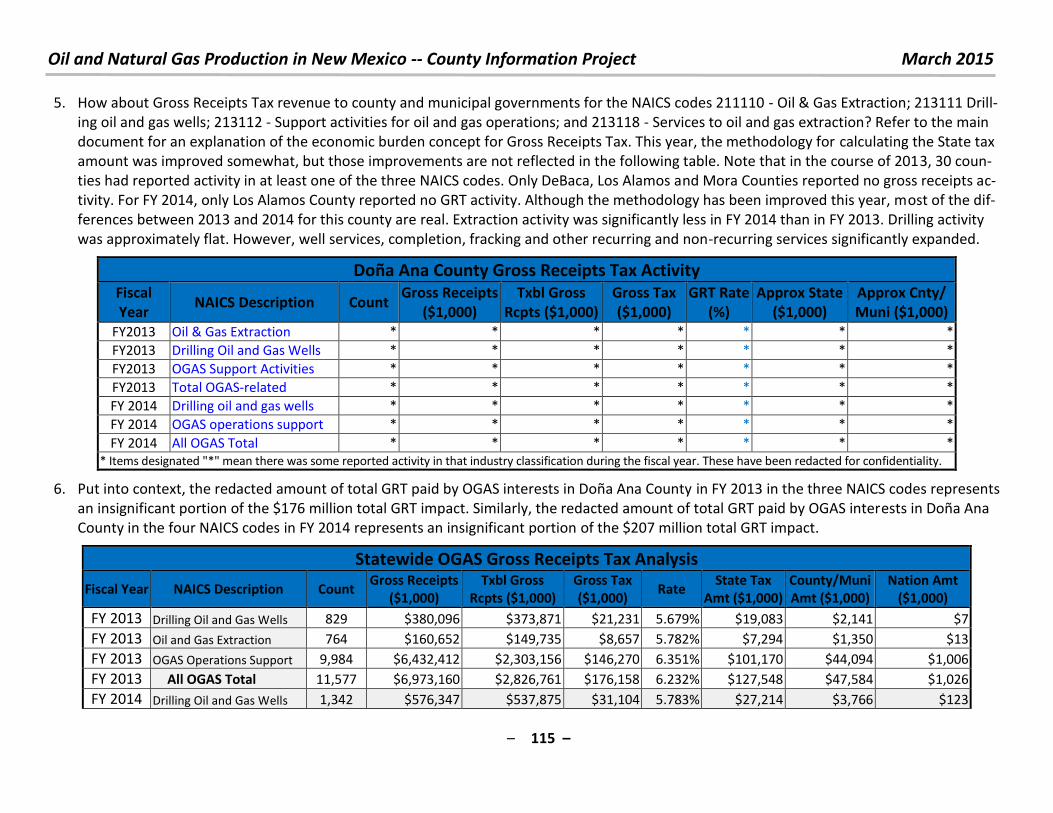
Oil and Natural Gas Production in New Mexico -- County Information Project March 2015
– 115 –
5. How about Gross Receipts Tax revenue to county and municipal governments for the NAICS codes 211110 - Oil & Gas Extraction; 213111 Drill-
ing oil and gas wells; 213112 - Support activities for oil and gas operations; and 213118 - Services to oil and gas extraction? Refer to the main
document for an explanation of the economic burden concept for Gross Receipts Tax. This year, the methodology for calculating the State tax
amount was improved somewhat, but those improvements are not reflected in the following table. Note that in the course of 2013, 30 coun-
ties had reported activity in at least one of the three NAICS codes. Only DeBaca, Los Alamos and Mora Counties reported no gross receipts ac-
tivity. For FY 2014, only Los Alamos County reported no GRT activity. Although the methodology has been improved this year, most of the dif-
ferences between 2013 and 2014 for this county are real. Extraction activity was significantly less in FY 2014 than in FY 2013. Drilling activity
was approximately flat. However, well services, completion, fracking and other recurring and non-recurring services significantly expanded.
Doña Ana County Gross Receipts Tax Activity
Fiscal
Year NAICS Description Count
Gross Receipts
($1,000)
Txbl Gross
Rcpts ($1,000)
Gross Tax
($1,000)
GRT Rate
(%)
Approx State
($1,000)
Approx Cnty/
Muni ($1,000)
FY2013 Oil & Gas Extraction * * * * * * *
FY2013 Drilling Oil and Gas Wells * * * * * * *
FY2013 OGAS Support Activities * * * * * * *
FY2013 Total OGAS-related * * * * * * *
FY 2014 Drilling oil and gas wells * * * * * * *
FY 2014 OGAS operations support * * * * * * *
FY 2014 All OGAS Total * * * * * * *
* Items designated "*" mean there was some reported activity in that industry classification during the fiscal year. These have been redacted for confidentiality.
6. Put into context, the redacted amount of total GRT paid by OGAS interests in Doña Ana County in FY 2013 in the three NAICS codes represents
an insignificant portion of the $176 million total GRT impact. Similarly, the redacted amount of total GRT paid by OGAS interests in Doña Ana
County in the four NAICS codes in FY 2014 represents an insignificant portion of the $207 million total GRT impact.
Statewide OGAS Gross Receipts Tax Analysis
Fiscal Year NAICS Description Count Gross Receipts
($1,000)
Txbl Gross
Rcpts ($1,000)
Gross Tax
($1,000) Rate
State Tax
Amt ($1,000)
County/Muni
Amt ($1,000)
Nation Amt
($1,000)
FY 2013 Drilling Oil and Gas Wells 829 $380,096 $373,871 $21,231 5.679% $19,083 $2,141 $7
FY 2013 Oil and Gas Extraction 764 $160,652 $149,735 $8,657 5.782% $7,294 $1,350 $13
FY 2013 OGAS Operations Support 9,984 $6,432,412 $2,303,156 $146,270 6.351% $101,170 $44,094 $1,006
FY 2013 All OGAS Total 11,577 $6,973,160 $2,826,761 $176,158 6.232% $127,548 $47,584 $1,026
FY 2014 Drilling Oil and Gas Wells 1,342 $576,347 $537,875 $31,104 5.783% $27,214 $3,766 $123
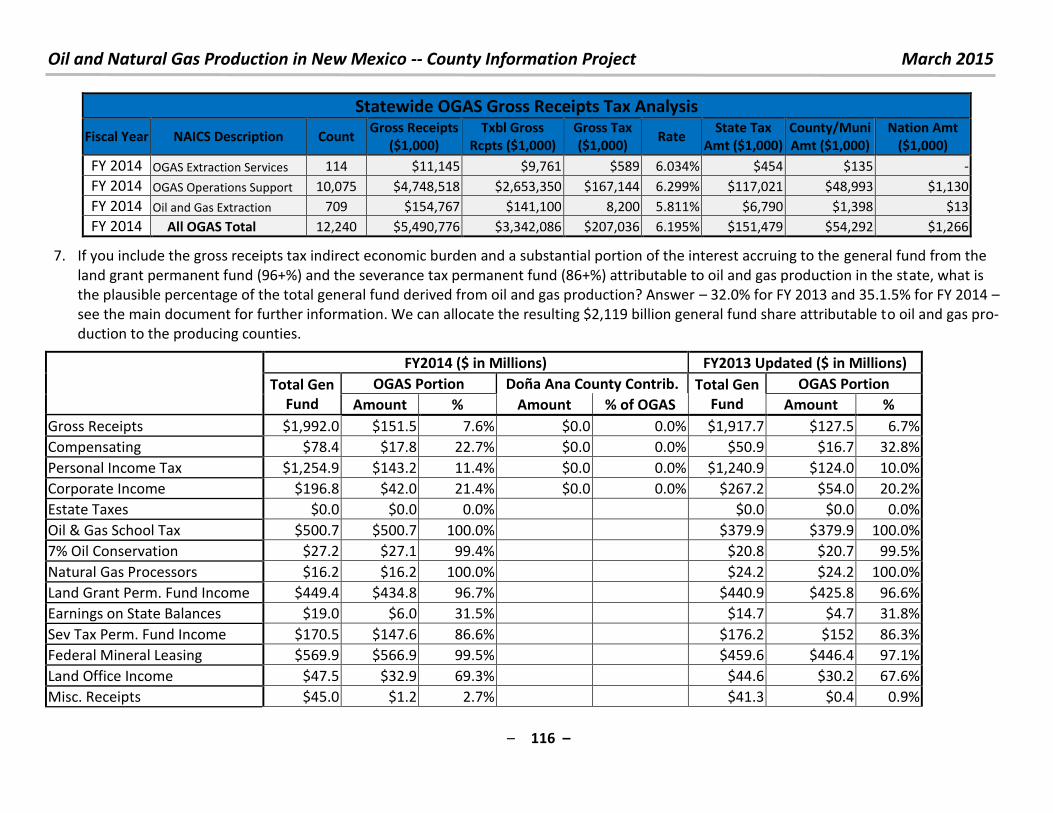
Oil and Natural Gas Production in New Mexico -- County Information Project March 2015
– 116 –
Statewide OGAS Gross Receipts Tax Analysis
Fiscal Year NAICS Description Count Gross Receipts
($1,000)
Txbl Gross
Rcpts ($1,000)
Gross Tax
($1,000) Rate
State Tax
Amt ($1,000)
County/Muni
Amt ($1,000)
Nation Amt
($1,000)
FY 2014 OGAS Extraction Services 114 $11,145 $9,761 $589 6.034% $454 $135 -
FY 2014 OGAS Operations Support 10,075 $4,748,518 $2,653,350 $167,144 6.299% $117,021 $48,993 $1,130
FY 2014 Oil and Gas Extraction 709 $154,767 $141,100 8,200 5.811% $6,790 $1,398 $13
FY 2014 All OGAS Total 12,240 $5,490,776 $3,342,086 $207,036 6.195% $151,479 $54,292 $1,266
7. If you include the gross receipts tax indirect economic burden and a substantial portion of the interest accruing to the general fund from the
land grant permanent fund (96+%) and the severance tax permanent fund (86+%) attributable to oil and gas production in the state, what is
the plausible percentage of the total general fund derived from oil and gas production? Answer – 32.0% for FY 2013 and 35.1.5% for FY 2014 –
see the main document for further information. We can allocate the resulting $2,119 billion general fund share attributable to oil and gas pro-
duction to the producing counties.
FY2014 ($ in Millions) FY2013 Updated ($ in Millions)
Total Gen
Fund
OGAS Portion Doña Ana County Contrib. Total Gen
Fund
OGAS Portion
Amount % Amount % of OGAS Amount %
Gross Receipts $1,992.0 $151.5 7.6% $0.0 0.0% $1,917.7 $127.5 6.7%
Compensating $78.4 $17.8 22.7% $0.0 0.0% $50.9 $16.7 32.8%
Personal Income Tax $1,254.9 $143.2 11.4% $0.0 0.0% $1,240.9 $124.0 10.0%
Corporate Income $196.8 $42.0 21.4% $0.0 0.0% $267.2 $54.0 20.2%
Estate Taxes $0.0 $0.0 0.0% $0.0 $0.0 0.0%
Oil & Gas School Tax $500.7 $500.7 100.0% $379.9 $379.9 100.0%
7% Oil Conservation $27.2 $27.1 99.4% $20.8 $20.7 99.5%
Natural Gas Processors $16.2 $16.2 100.0% $24.2 $24.2 100.0%
Land Grant Perm. Fund Income $449.4 $434.8 96.7% $440.9 $425.8 96.6%
Earnings on State Balances $19.0 $6.0 31.5% $14.7 $4.7 31.8%
Sev Tax Perm. Fund Income $170.5 $147.6 86.6% $176.2 $152 86.3%
Federal Mineral Leasing $569.9 $566.9 99.5% $459.6 $446.4 97.1%
Land Office Income $47.5 $32.9 69.3% $44.6 $30.2 67.6%
Misc. Receipts $45.0 $1.2 2.7% $41.3 $0.4 0.9%
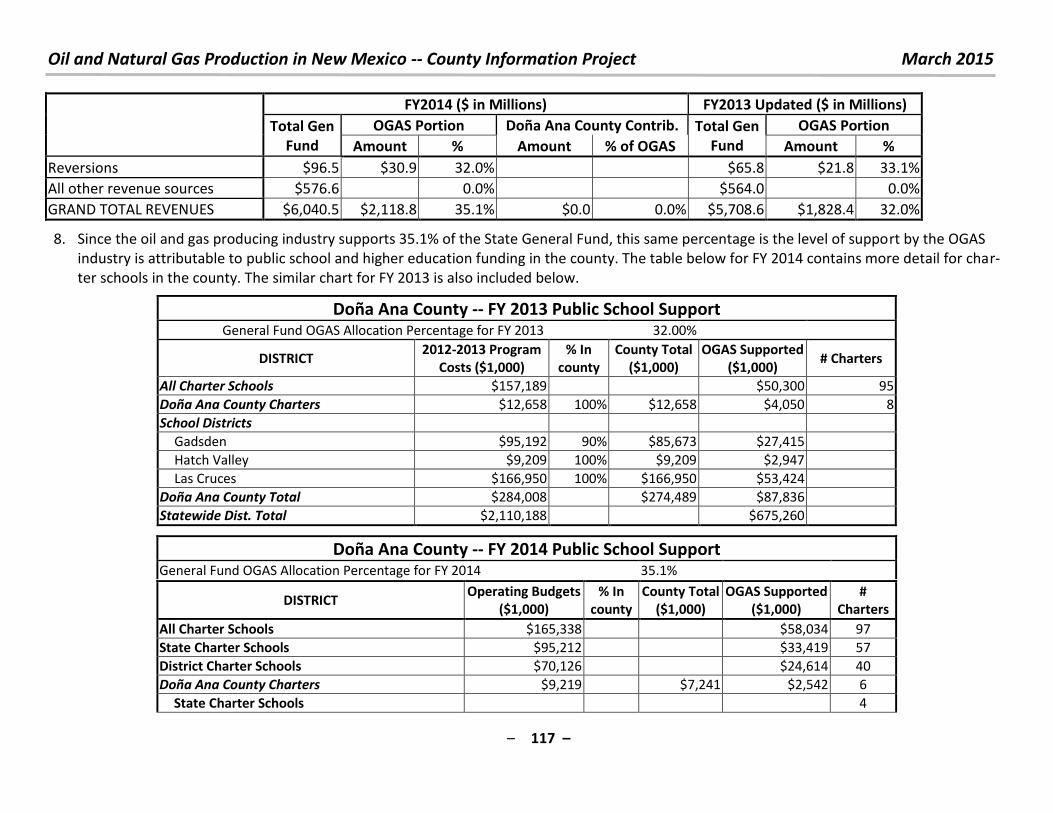
Oil and Natural Gas Production in New Mexico -- County Information Project March 2015
– 117 –
FY2014 ($ in Millions) FY2013 Updated ($ in Millions)
Total Gen
Fund
OGAS Portion Doña Ana County Contrib. Total Gen
Fund
OGAS Portion
Amount % Amount % of OGAS Amount %
Reversions $96.5 $30.9 32.0% $65.8 $21.8 33.1%
All other revenue sources $576.6
0.0% $564.0
0.0%
GRAND TOTAL REVENUES $6,040.5 $2,118.8 35.1% $0.0 0.0% $5,708.6 $1,828.4 32.0%
8. Since the oil and gas producing industry supports 35.1% of the State General Fund, this same percentage is the level of support by the OGAS
industry is attributable to public school and higher education funding in the county. The table below for FY 2014 contains more detail for char-
ter schools in the county. The similar chart for FY 2013 is also included below.
Doña Ana County -- FY 2013 Public School Support General Fund OGAS Allocation Percentage for FY 2013 32.00%
DISTRICT 2012-2013 Program
Costs ($1,000)
% In
county
County Total
($1,000)
OGAS Supported
($1,000) # Charters
All Charter Schools $157,189 $50,300 95
Doña Ana County Charters $12,658 100% $12,658 $4,050 8
School Districts
Gadsden $95,192 90% $85,673 $27,415
Hatch Valley $9,209 100% $9,209 $2,947
Las Cruces $166,950 100% $166,950 $53,424
Doña Ana County Total $284,008 $274,489 $87,836
Statewide Dist. Total $2,110,188 $675,260
Doña Ana County -- FY 2014 Public School Support General Fund OGAS Allocation Percentage for FY 2014 35.1%
DISTRICT Operating Budgets
($1,000)
% In
county
County Total
($1,000)
OGAS Supported
($1,000)
#
Charters
All Charter Schools $165,338 $58,034 97
State Charter Schools $95,212 $33,419 57
District Charter Schools $70,126 $24,614 40
Doña Ana County Charters $9,219 $7,241 $2,542 6
State Charter Schools 4
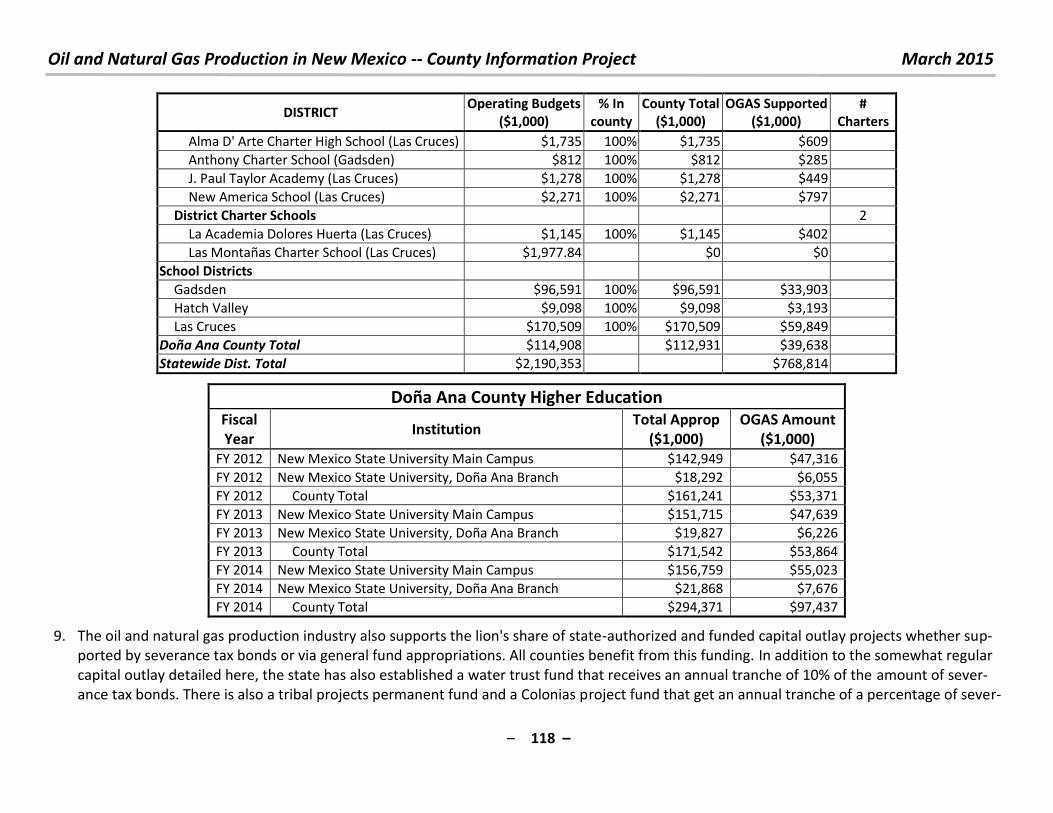
Oil and Natural Gas Production in New Mexico -- County Information Project March 2015
– 118 –
DISTRICT Operating Budgets
($1,000)
% In
county
County Total
($1,000)
OGAS Supported
($1,000)
#
Charters
Alma D' Arte Charter High School (Las Cruces) $1,735 100% $1,735 $609
Anthony Charter School (Gadsden) $812 100% $812 $285
J. Paul Taylor Academy (Las Cruces) $1,278 100% $1,278 $449
New America School (Las Cruces) $2,271 100% $2,271 $797
District Charter Schools 2
La Academia Dolores Huerta (Las Cruces) $1,145 100% $1,145 $402
Las Montañas Charter School (Las Cruces) $1,977.84 $0 $0
School Districts
Gadsden $96,591 100% $96,591 $33,903
Hatch Valley $9,098 100% $9,098 $3,193
Las Cruces $170,509 100% $170,509 $59,849
Doña Ana County Total $114,908 $112,931 $39,638
Statewide Dist. Total $2,190,353 $768,814
Doña Ana County Higher Education
Fiscal
Year Institution
Total Approp
($1,000)
OGAS Amount
($1,000)
FY 2012 New Mexico State University Main Campus $142,949 $47,316
FY 2012 New Mexico State University, Doña Ana Branch $18,292 $6,055
FY 2012 County Total $161,241 $53,371
FY 2013 New Mexico State University Main Campus $151,715 $47,639
FY 2013 New Mexico State University, Doña Ana Branch $19,827 $6,226
FY 2013 County Total $171,542 $53,864
FY 2014 New Mexico State University Main Campus $156,759 $55,023
FY 2014 New Mexico State University, Doña Ana Branch $21,868 $7,676
FY 2014 County Total $294,371 $97,437
9. The oil and natural gas production industry also supports the lion's share of state-authorized and funded capital outlay projects whether sup-
ported by severance tax bonds or via general fund appropriations. All counties benefit from this funding. In addition to the somewhat regular
capital outlay detailed here, the state has also established a water trust fund that receives an annual tranche of 10% of the amount of sever-
ance tax bonds. There is also a tribal projects permanent fund and a Colonias project fund that get an annual tranche of a percentage of sever-
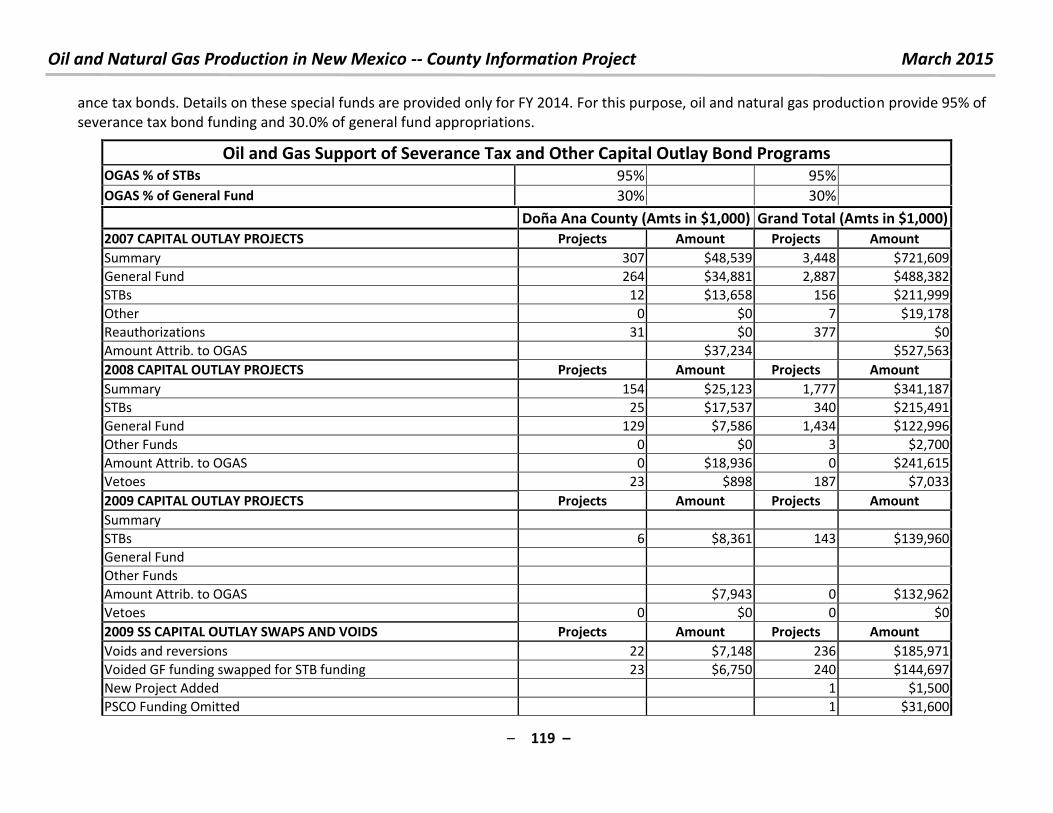
Oil and Natural Gas Production in New Mexico -- County Information Project March 2015
– 119 –
ance tax bonds. Details on these special funds are provided only for FY 2014. For this purpose, oil and natural gas production provide 95% of
severance tax bond funding and 30.0% of general fund appropriations.
Oil and Gas Support of Severance Tax and Other Capital Outlay Bond Programs OGAS % of STBs 95% 95%
OGAS % of General Fund 30% 30%
Doña Ana County (Amts in $1,000) Grand Total (Amts in $1,000)
2007 CAPITAL OUTLAY PROJECTS Projects Amount Projects Amount
Summary 307 $48,539 3,448 $721,609
General Fund 264 $34,881 2,887 $488,382
STBs 12 $13,658 156 $211,999
Other 0 $0 7 $19,178
Reauthorizations 31 $0 377 $0
Amount Attrib. to OGAS $37,234 $527,563
2008 CAPITAL OUTLAY PROJECTS Projects Amount Projects Amount
Summary 154 $25,123 1,777 $341,187
STBs 25 $17,537 340 $215,491
General Fund 129 $7,586 1,434 $122,996
Other Funds 0 $0 3 $2,700
Amount Attrib. to OGAS 0 $18,936 0 $241,615
Vetoes 23 $898 187 $7,033
2009 CAPITAL OUTLAY PROJECTS Projects Amount Projects Amount
Summary
STBs 6 $8,361 143 $139,960
General Fund
Other Funds
Amount Attrib. to OGAS $7,943 0 $132,962
Vetoes 0 $0 0 $0
2009 SS CAPITAL OUTLAY SWAPS AND VOIDS Projects Amount Projects Amount
Voids and reversions 22 $7,148 236 $185,971
Voided GF funding swapped for STB funding 23 $6,750 240 $144,697
New Project Added 1 $1,500
PSCO Funding Omitted 1 $31,600
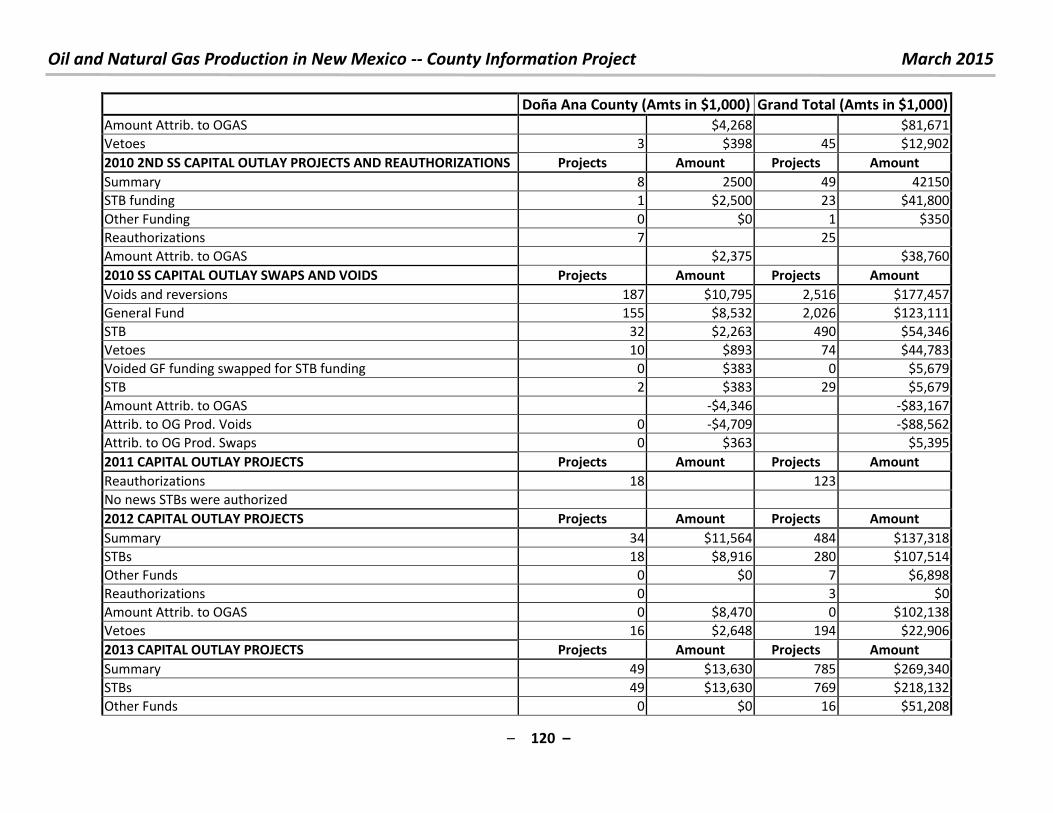
Oil and Natural Gas Production in New Mexico -- County Information Project March 2015
– 120 –
Doña Ana County (Amts in $1,000) Grand Total (Amts in $1,000)
Amount Attrib. to OGAS $4,268 $81,671
Vetoes 3 $398 45 $12,902
2010 2ND SS CAPITAL OUTLAY PROJECTS AND REAUTHORIZATIONS Projects Amount Projects Amount
Summary 8 2500 49 42150
STB funding 1 $2,500 23 $41,800
Other Funding 0 $0 1 $350
Reauthorizations 7 25
Amount Attrib. to OGAS $2,375 $38,760
2010 SS CAPITAL OUTLAY SWAPS AND VOIDS Projects Amount Projects Amount
Voids and reversions 187 $10,795 2,516 $177,457
General Fund 155 $8,532 2,026 $123,111
STB 32 $2,263 490 $54,346
Vetoes 10 $893 74 $44,783
Voided GF funding swapped for STB funding 0 $383 0 $5,679
STB 2 $383 29 $5,679
Amount Attrib. to OGAS -$4,346 -$83,167
Attrib. to OG Prod. Voids 0 -$4,709 -$88,562
Attrib. to OG Prod. Swaps 0 $363 $5,395
2011 CAPITAL OUTLAY PROJECTS Projects Amount Projects Amount
Reauthorizations 18 123
No news STBs were authorized
2012 CAPITAL OUTLAY PROJECTS Projects Amount Projects Amount
Summary 34 $11,564 484 $137,318
STBs 18 $8,916 280 $107,514
Other Funds 0 $0 7 $6,898
Reauthorizations 0 3 $0
Amount Attrib. to OGAS 0 $8,470 0 $102,138
Vetoes 16 $2,648 194 $22,906
2013 CAPITAL OUTLAY PROJECTS Projects Amount Projects Amount
Summary 49 $13,630 785 $269,340
STBs 49 $13,630 769 $218,132
Other Funds 0 $0 16 $51,208
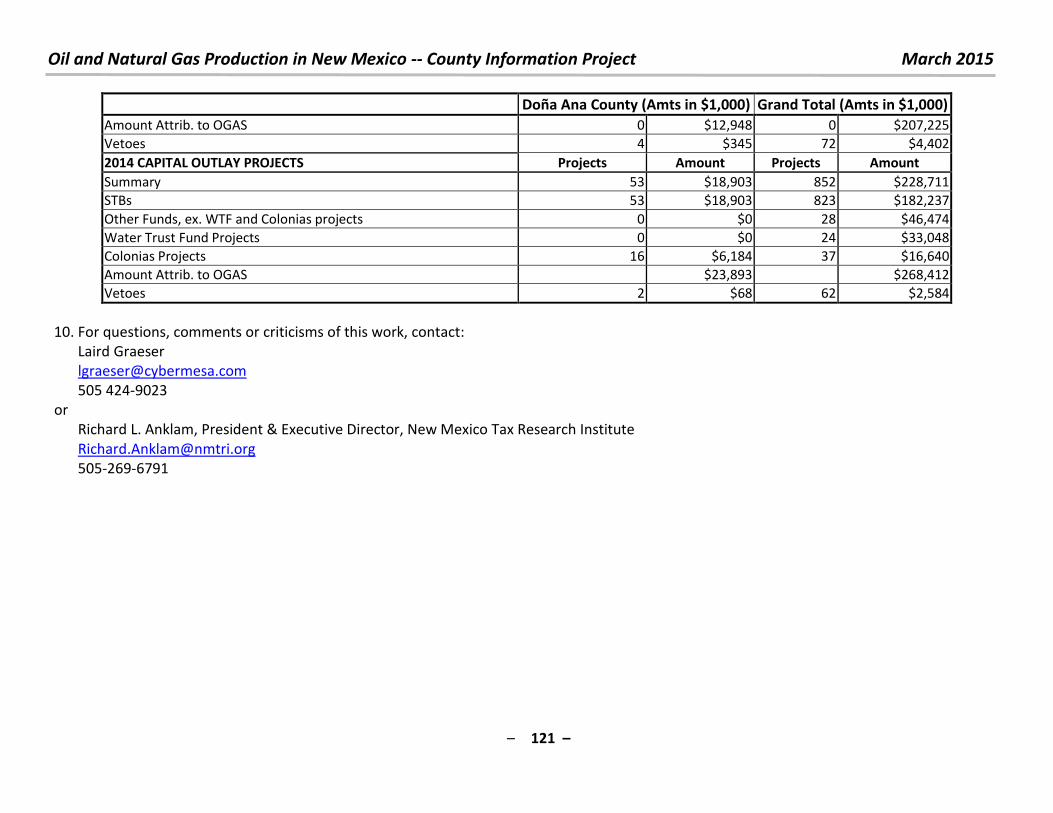
Oil and Natural Gas Production in New Mexico -- County Information Project March 2015
– 121 –
Doña Ana County (Amts in $1,000) Grand Total (Amts in $1,000)
Amount Attrib. to OGAS 0 $12,948 0 $207,225
Vetoes 4 $345 72 $4,402
2014 CAPITAL OUTLAY PROJECTS Projects Amount Projects Amount
Summary 53 $18,903 852 $228,711
STBs 53 $18,903 823 $182,237
Other Funds, ex. WTF and Colonias projects 0 $0 28 $46,474
Water Trust Fund Projects 0 $0 24 $33,048
Colonias Projects 16 $6,184 37 $16,640
Amount Attrib. to OGAS $23,893 $268,412
Vetoes 2 $68 62 $2,584
10. For questions, comments or criticisms of this work, contact:
Laird Graeser
505 424-9023
or
Richard L. Anklam, President & Executive Director, New Mexico Tax Research Institute
505-269-6791
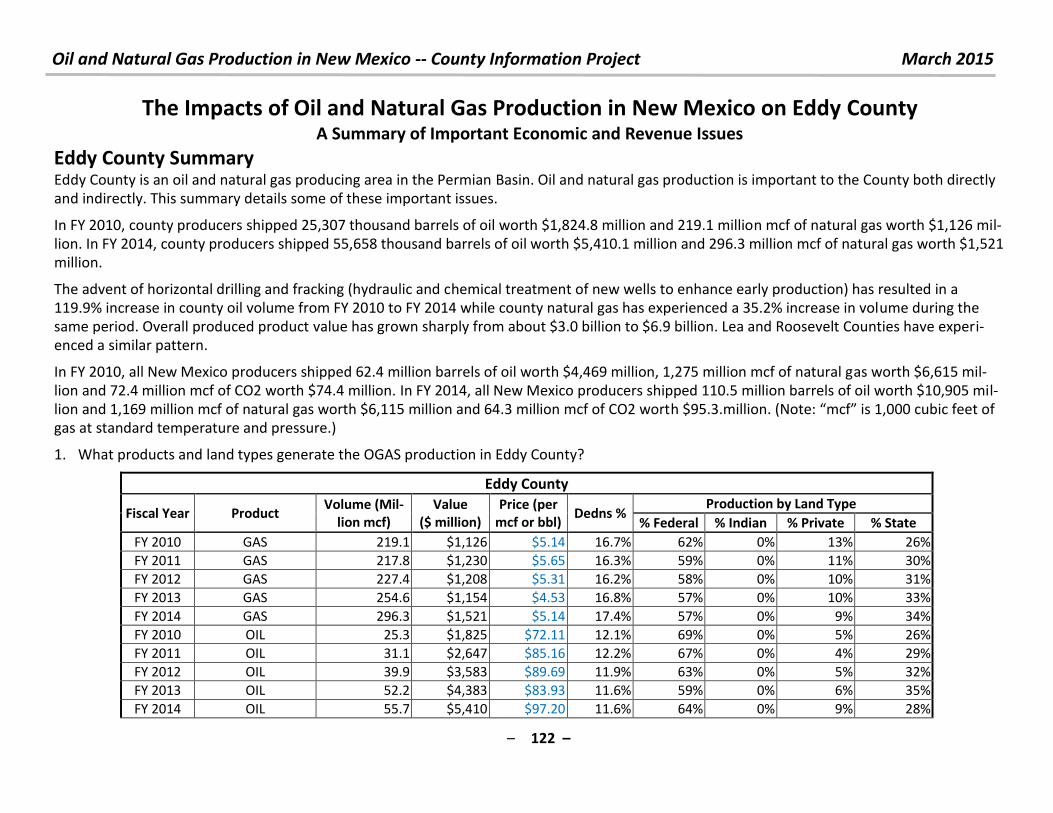
Oil and Natural Gas Production in New Mexico -- County Information Project March 2015
– 122 –
The Impacts of Oil and Natural Gas Production in New Mexico on Eddy County A Summary of Important Economic and Revenue Issues
Eddy County Summary Eddy County is an oil and natural gas producing area in the Permian Basin. Oil and natural gas production is important to the County both directly
and indirectly. This summary details some of these important issues.
In FY 2010, county producers shipped 25,307 thousand barrels of oil worth $1,824.8 million and 219.1 million mcf of natural gas worth $1,126 mil-
lion. In FY 2014, county producers shipped 55,658 thousand barrels of oil worth $5,410.1 million and 296.3 million mcf of natural gas worth $1,521
million.
The advent of horizontal drilling and fracking (hydraulic and chemical treatment of new wells to enhance early production) has resulted in a
119.9% increase in county oil volume from FY 2010 to FY 2014 while county natural gas has experienced a 35.2% increase in volume during the
same period. Overall produced product value has grown sharply from about $3.0 billion to $6.9 billion. Lea and Roosevelt Counties have experi-
enced a similar pattern.
In FY 2010, all New Mexico producers shipped 62.4 million barrels of oil worth $4,469 million, 1,275 million mcf of natural gas worth $6,615 mil-
lion and 72.4 million mcf of CO2 worth $74.4 million. In FY 2014, all New Mexico producers shipped 110.5 million barrels of oil worth $10,905 mil-
lion and 1,169 million mcf of natural gas worth $6,115 million and 64.3 million mcf of CO2 worth $ . . illio . Note: f is , u i feet of gas at standard temperature and pressure.)
1. What products and land types generate the OGAS production in Eddy County?
Eddy County
Fiscal Year Product Volume (Mil-
lion mcf)
Value
($ million)
Price (per
mcf or bbl) Dedns %
Production by Land Type
% Federal % Indian % Private % State
FY 2010 GAS 219.1 $1,126 $5.14 16.7% 62% 0% 13% 26%
FY 2011 GAS 217.8 $1,230 $5.65 16.3% 59% 0% 11% 30%
FY 2012 GAS 227.4 $1,208 $5.31 16.2% 58% 0% 10% 31%
FY 2013 GAS 254.6 $1,154 $4.53 16.8% 57% 0% 10% 33%
FY 2014 GAS 296.3 $1,521 $5.14 17.4% 57% 0% 9% 34%
FY 2010 OIL 25.3 $1,825 $72.11 12.1% 69% 0% 5% 26%
FY 2011 OIL 31.1 $2,647 $85.16 12.2% 67% 0% 4% 29%
FY 2012 OIL 39.9 $3,583 $89.69 11.9% 63% 0% 5% 32%
FY 2013 OIL 52.2 $4,383 $83.93 11.6% 59% 0% 6% 35%
FY 2014 OIL 55.7 $5,410 $97.20 11.6% 64% 0% 9% 28%
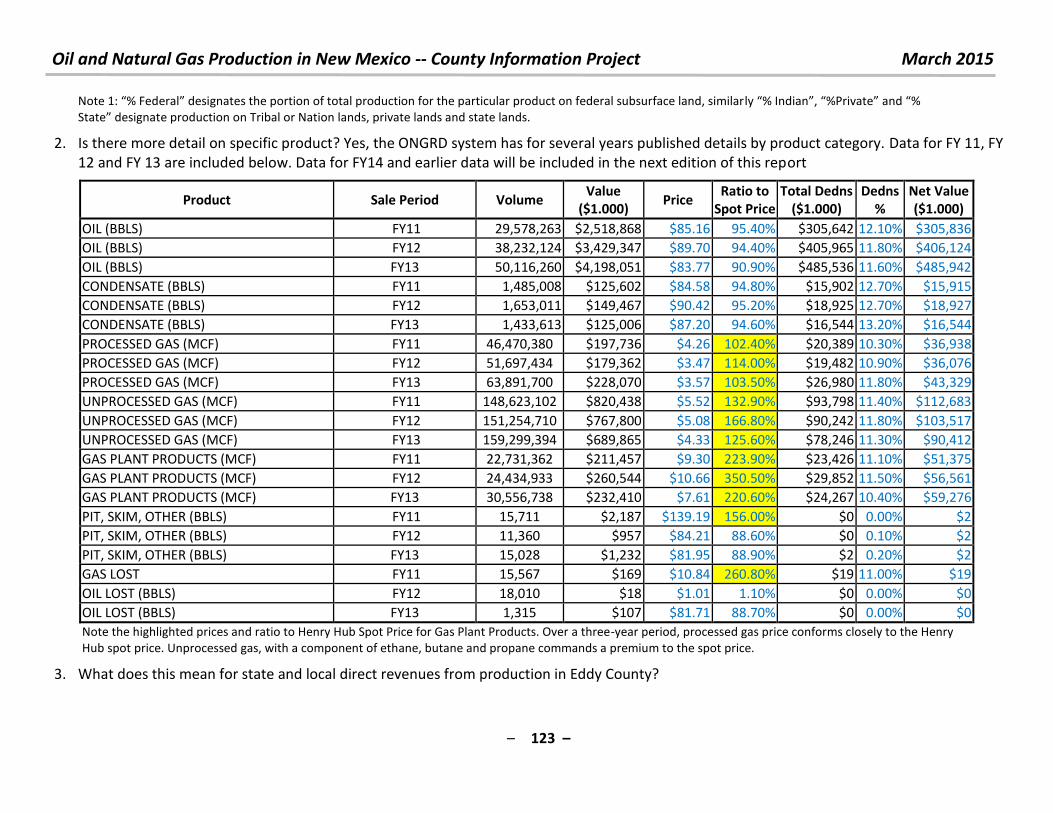
Oil and Natural Gas Production in New Mexico -- County Information Project March 2015
– 123 –
Note : % Fede al desig ates the po tio of total p odu tio fo the pa ti ula p odu t o fede al su su fa e la d, si ila ly % I dia , %P i ate a d % “tate desig ate p odu tio o T i al o Natio la ds, p i ate la ds a d state la ds.
2. Is there more detail on specific product? Yes, the ONGRD system has for several years published details by product category. Data for FY 11, FY
12 and FY 13 are included below. Data for FY14 and earlier data will be included in the next edition of this report
Product Sale Period Volume Value
($1.000) Price
Ratio to
Spot Price
Total Dedns
($1.000)
Dedns
%
Net Value
($1.000)
OIL (BBLS) FY11 29,578,263 $2,518,868 $85.16 95.40% $305,642 12.10% $305,836
OIL (BBLS) FY12 38,232,124 $3,429,347 $89.70 94.40% $405,965 11.80% $406,124
OIL (BBLS) FY13 50,116,260 $4,198,051 $83.77 90.90% $485,536 11.60% $485,942
CONDENSATE (BBLS) FY11 1,485,008 $125,602 $84.58 94.80% $15,902 12.70% $15,915
CONDENSATE (BBLS) FY12 1,653,011 $149,467 $90.42 95.20% $18,925 12.70% $18,927
CONDENSATE (BBLS) FY13 1,433,613 $125,006 $87.20 94.60% $16,544 13.20% $16,544
PROCESSED GAS (MCF) FY11 46,470,380 $197,736 $4.26 102.40% $20,389 10.30% $36,938
PROCESSED GAS (MCF) FY12 51,697,434 $179,362 $3.47 114.00% $19,482 10.90% $36,076
PROCESSED GAS (MCF) FY13 63,891,700 $228,070 $3.57 103.50% $26,980 11.80% $43,329
UNPROCESSED GAS (MCF) FY11 148,623,102 $820,438 $5.52 132.90% $93,798 11.40% $112,683
UNPROCESSED GAS (MCF) FY12 151,254,710 $767,800 $5.08 166.80% $90,242 11.80% $103,517
UNPROCESSED GAS (MCF) FY13 159,299,394 $689,865 $4.33 125.60% $78,246 11.30% $90,412
GAS PLANT PRODUCTS (MCF) FY11 22,731,362 $211,457 $9.30 223.90% $23,426 11.10% $51,375
GAS PLANT PRODUCTS (MCF) FY12 24,434,933 $260,544 $10.66 350.50% $29,852 11.50% $56,561
GAS PLANT PRODUCTS (MCF) FY13 30,556,738 $232,410 $7.61 220.60% $24,267 10.40% $59,276
PIT, SKIM, OTHER (BBLS) FY11 15,711 $2,187 $139.19 156.00% $0 0.00% $2
PIT, SKIM, OTHER (BBLS) FY12 11,360 $957 $84.21 88.60% $0 0.10% $2
PIT, SKIM, OTHER (BBLS) FY13 15,028 $1,232 $81.95 88.90% $2 0.20% $2
GAS LOST FY11 15,567 $169 $10.84 260.80% $19 11.00% $19
OIL LOST (BBLS) FY12 18,010 $18 $1.01 1.10% $0 0.00% $0
OIL LOST (BBLS) FY13 1,315 $107 $81.71 88.70% $0 0.00% $0
Note the highlighted prices and ratio to Henry Hub Spot Price for Gas Plant Products. Over a three-year period, processed gas price conforms closely to the Henry
Hub spot price. Unprocessed gas, with a component of ethane, butane and propane commands a premium to the spot price.
3. What does this mean for state and local direct revenues from production in Eddy County?
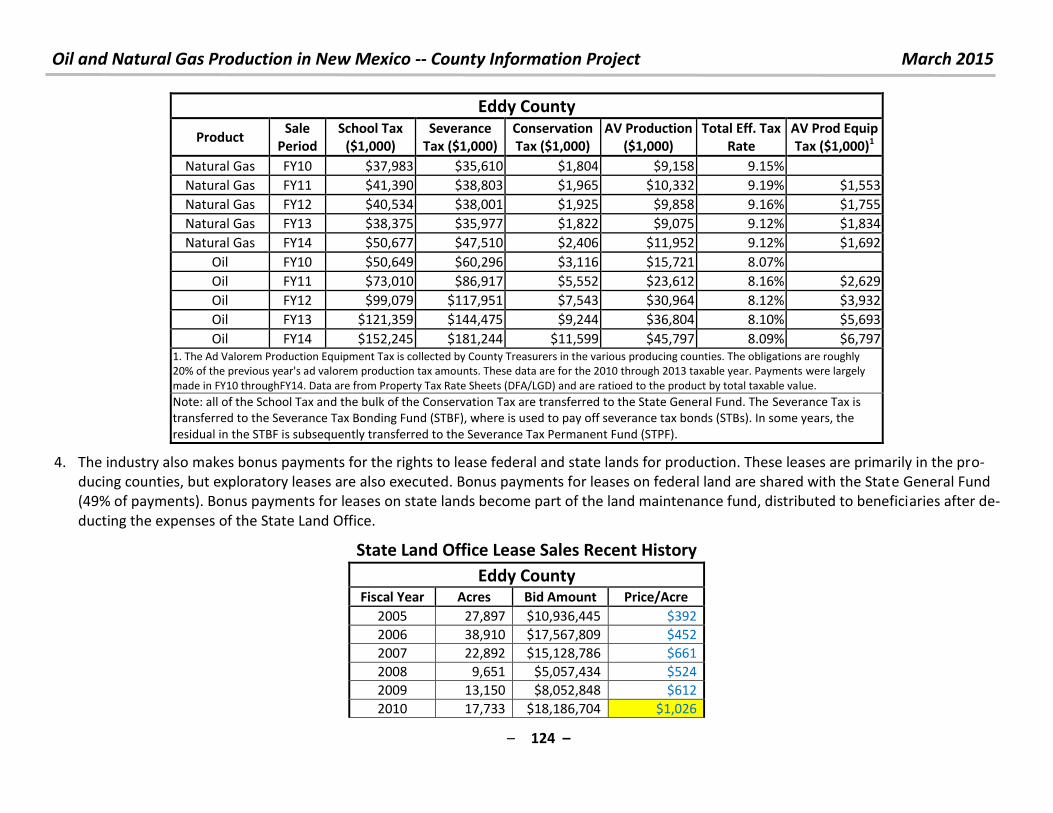
Oil and Natural Gas Production in New Mexico -- County Information Project March 2015
– 124 –
Eddy County
Product Sale
Period
School Tax
($1,000)
Severance
Tax ($1,000)
Conservation
Tax ($1,000)
AV Production
($1,000)
Total Eff. Tax
Rate
AV Prod Equip
Tax ($1,000)1
Natural Gas FY10 $37,983 $35,610 $1,804 $9,158 9.15%
Natural Gas FY11 $41,390 $38,803 $1,965 $10,332 9.19% $1,553
Natural Gas FY12 $40,534 $38,001 $1,925 $9,858 9.16% $1,755
Natural Gas FY13 $38,375 $35,977 $1,822 $9,075 9.12% $1,834
Natural Gas FY14 $50,677 $47,510 $2,406 $11,952 9.12% $1,692
Oil FY10 $50,649 $60,296 $3,116 $15,721 8.07%
Oil FY11 $73,010 $86,917 $5,552 $23,612 8.16% $2,629
Oil FY12 $99,079 $117,951 $7,543 $30,964 8.12% $3,932
Oil FY13 $121,359 $144,475 $9,244 $36,804 8.10% $5,693
Oil FY14 $152,245 $181,244 $11,599 $45,797 8.09% $6,797 1. The Ad Valorem Production Equipment Tax is collected by County Treasurers in the various producing counties. The obligations are roughly
20% of the previous year's ad valorem production tax amounts. These data are for the 2010 through 2013 taxable year. Payments were largely
made in FY10 throughFY14. Data are from Property Tax Rate Sheets (DFA/LGD) and are ratioed to the product by total taxable value.
Note: all of the School Tax and the bulk of the Conservation Tax are transferred to the State General Fund. The Severance Tax is
transferred to the Severance Tax Bonding Fund (STBF), where is used to pay off severance tax bonds (STBs). In some years, the
residual in the STBF is subsequently transferred to the Severance Tax Permanent Fund (STPF).
4. The industry also makes bonus payments for the rights to lease federal and state lands for production. These leases are primarily in the pro-
ducing counties, but exploratory leases are also executed. Bonus payments for leases on federal land are shared with the State General Fund
(49% of payments). Bonus payments for leases on state lands become part of the land maintenance fund, distributed to beneficiaries after de-
ducting the expenses of the State Land Office.
State Land Office Lease Sales Recent History
Eddy County Fiscal Year Acres Bid Amount Price/Acre
2005 27,897 $10,936,445 $392
2006 38,910 $17,567,809 $452
2007 22,892 $15,128,786 $661
2008 9,651 $5,057,434 $524
2009 13,150 $8,052,848 $612
2010 17,733 $18,186,704 $1,026
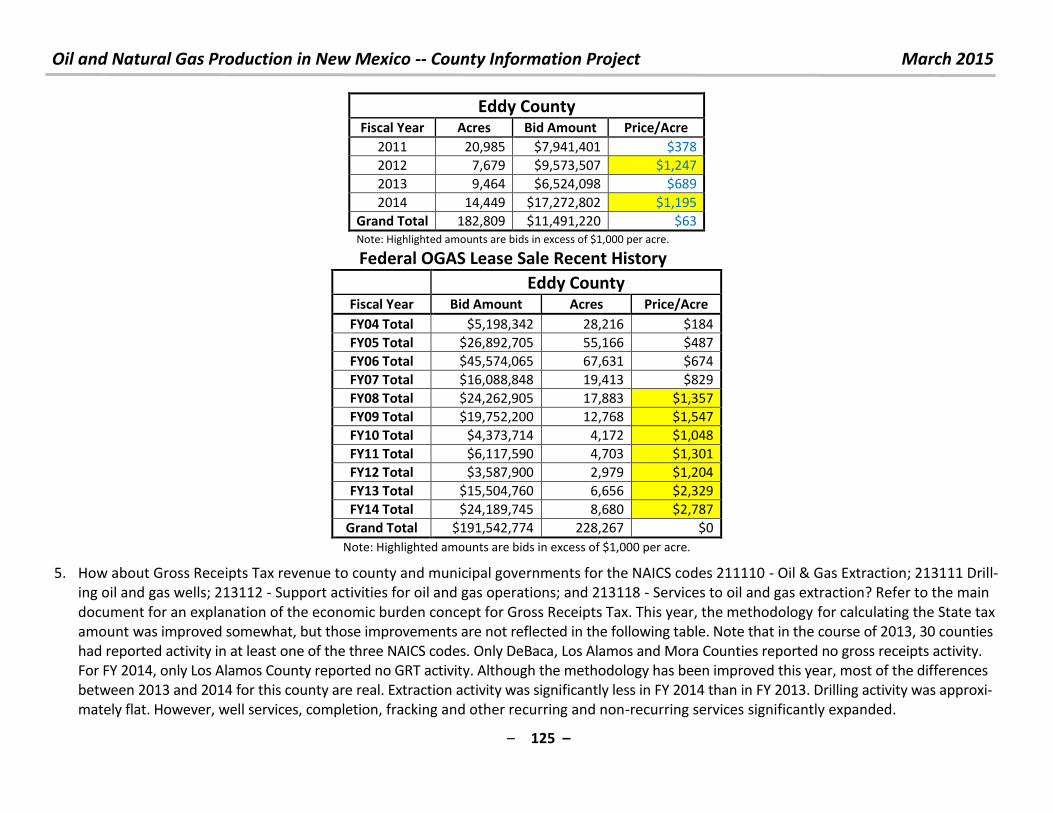
Oil and Natural Gas Production in New Mexico -- County Information Project March 2015
– 125 –
Eddy County Fiscal Year Acres Bid Amount Price/Acre
2011 20,985 $7,941,401 $378
2012 7,679 $9,573,507 $1,247
2013 9,464 $6,524,098 $689
2014 14,449 $17,272,802 $1,195
Grand Total 182,809 $11,491,220 $63
Note: Highlighted amounts are bids in excess of $1,000 per acre.
Federal OGAS Lease Sale Recent History
Eddy County
Fiscal Year Bid Amount Acres Price/Acre
FY04 Total $5,198,342 28,216 $184
FY05 Total $26,892,705 55,166 $487
FY06 Total $45,574,065 67,631 $674
FY07 Total $16,088,848 19,413 $829
FY08 Total $24,262,905 17,883 $1,357
FY09 Total $19,752,200 12,768 $1,547
FY10 Total $4,373,714 4,172 $1,048
FY11 Total $6,117,590 4,703 $1,301
FY12 Total $3,587,900 2,979 $1,204
FY13 Total $15,504,760 6,656 $2,329
FY14 Total $24,189,745 8,680 $2,787
Grand Total $191,542,774 228,267 $0
Note: Highlighted amounts are bids in excess of $1,000 per acre.
5. How about Gross Receipts Tax revenue to county and municipal governments for the NAICS codes 211110 - Oil & Gas Extraction; 213111 Drill-
ing oil and gas wells; 213112 - Support activities for oil and gas operations; and 213118 - Services to oil and gas extraction? Refer to the main
document for an explanation of the economic burden concept for Gross Receipts Tax. This year, the methodology for calculating the State tax
amount was improved somewhat, but those improvements are not reflected in the following table. Note that in the course of 2013, 30 counties
had reported activity in at least one of the three NAICS codes. Only DeBaca, Los Alamos and Mora Counties reported no gross receipts activity.
For FY 2014, only Los Alamos County reported no GRT activity. Although the methodology has been improved this year, most of the differences
between 2013 and 2014 for this county are real. Extraction activity was significantly less in FY 2014 than in FY 2013. Drilling activity was approxi-
mately flat. However, well services, completion, fracking and other recurring and non-recurring services significantly expanded.
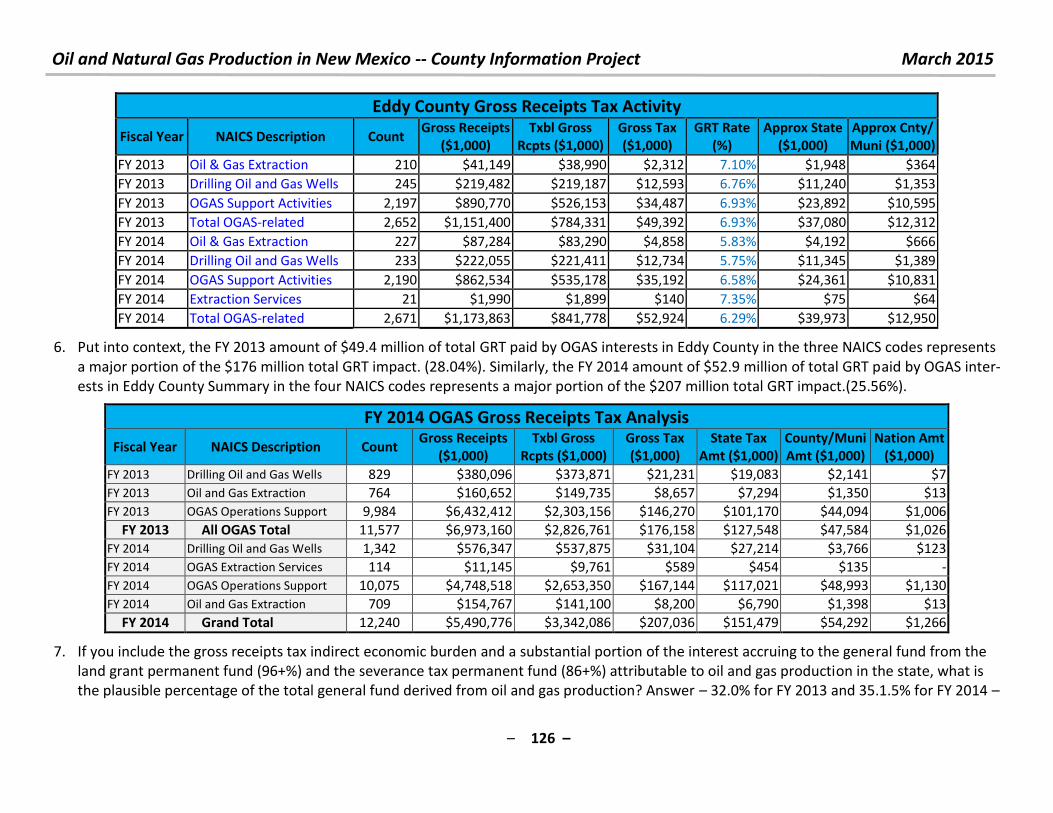
Oil and Natural Gas Production in New Mexico -- County Information Project March 2015
– 126 –
Eddy County Gross Receipts Tax Activity
Fiscal Year NAICS Description Count Gross Receipts
($1,000)
Txbl Gross
Rcpts ($1,000)
Gross Tax
($1,000)
GRT Rate
(%)
Approx State
($1,000)
Approx Cnty/
Muni ($1,000)
FY 2013 Oil & Gas Extraction 210 $41,149 $38,990 $2,312 7.10% $1,948 $364
FY 2013 Drilling Oil and Gas Wells 245 $219,482 $219,187 $12,593 6.76% $11,240 $1,353
FY 2013 OGAS Support Activities 2,197 $890,770 $526,153 $34,487 6.93% $23,892 $10,595
FY 2013 Total OGAS-related 2,652 $1,151,400 $784,331 $49,392 6.93% $37,080 $12,312
FY 2014 Oil & Gas Extraction 227 $87,284 $83,290 $4,858 5.83% $4,192 $666
FY 2014 Drilling Oil and Gas Wells 233 $222,055 $221,411 $12,734 5.75% $11,345 $1,389
FY 2014 OGAS Support Activities 2,190 $862,534 $535,178 $35,192 6.58% $24,361 $10,831
FY 2014 Extraction Services 21 $1,990 $1,899 $140 7.35% $75 $64
FY 2014 Total OGAS-related 2,671 $1,173,863 $841,778 $52,924 6.29% $39,973 $12,950
6. Put into context, the FY 2013 amount of $49.4 million of total GRT paid by OGAS interests in Eddy County in the three NAICS codes represents
a major portion of the $176 million total GRT impact. (28.04%). Similarly, the FY 2014 amount of $52.9 million of total GRT paid by OGAS inter-
ests in Eddy County Summary in the four NAICS codes represents a major portion of the $207 million total GRT impact.(25.56%).
FY 2014 OGAS Gross Receipts Tax Analysis
Fiscal Year NAICS Description Count Gross Receipts
($1,000)
Txbl Gross
Rcpts ($1,000)
Gross Tax
($1,000)
State Tax
Amt ($1,000)
County/Muni
Amt ($1,000)
Nation Amt
($1,000)
FY 2013 Drilling Oil and Gas Wells 829 $380,096 $373,871 $21,231 $19,083 $2,141 $7
FY 2013 Oil and Gas Extraction 764 $160,652 $149,735 $8,657 $7,294 $1,350 $13
FY 2013 OGAS Operations Support 9,984 $6,432,412 $2,303,156 $146,270 $101,170 $44,094 $1,006
FY 2013 All OGAS Total 11,577 $6,973,160 $2,826,761 $176,158 $127,548 $47,584 $1,026
FY 2014 Drilling Oil and Gas Wells 1,342 $576,347 $537,875 $31,104 $27,214 $3,766 $123
FY 2014 OGAS Extraction Services 114 $11,145 $9,761 $589 $454 $135 -
FY 2014 OGAS Operations Support 10,075 $4,748,518 $2,653,350 $167,144 $117,021 $48,993 $1,130
FY 2014 Oil and Gas Extraction 709 $154,767 $141,100 $8,200 $6,790 $1,398 $13
FY 2014 Grand Total 12,240 $5,490,776 $3,342,086 $207,036 $151,479 $54,292 $1,266
7. If you include the gross receipts tax indirect economic burden and a substantial portion of the interest accruing to the general fund from the
land grant permanent fund (96+%) and the severance tax permanent fund (86+%) attributable to oil and gas production in the state, what is
the plausible percentage of the total general fund derived from oil and gas production? Answer – 32.0% for FY 2013 and 35.1.5% for FY 2014 –
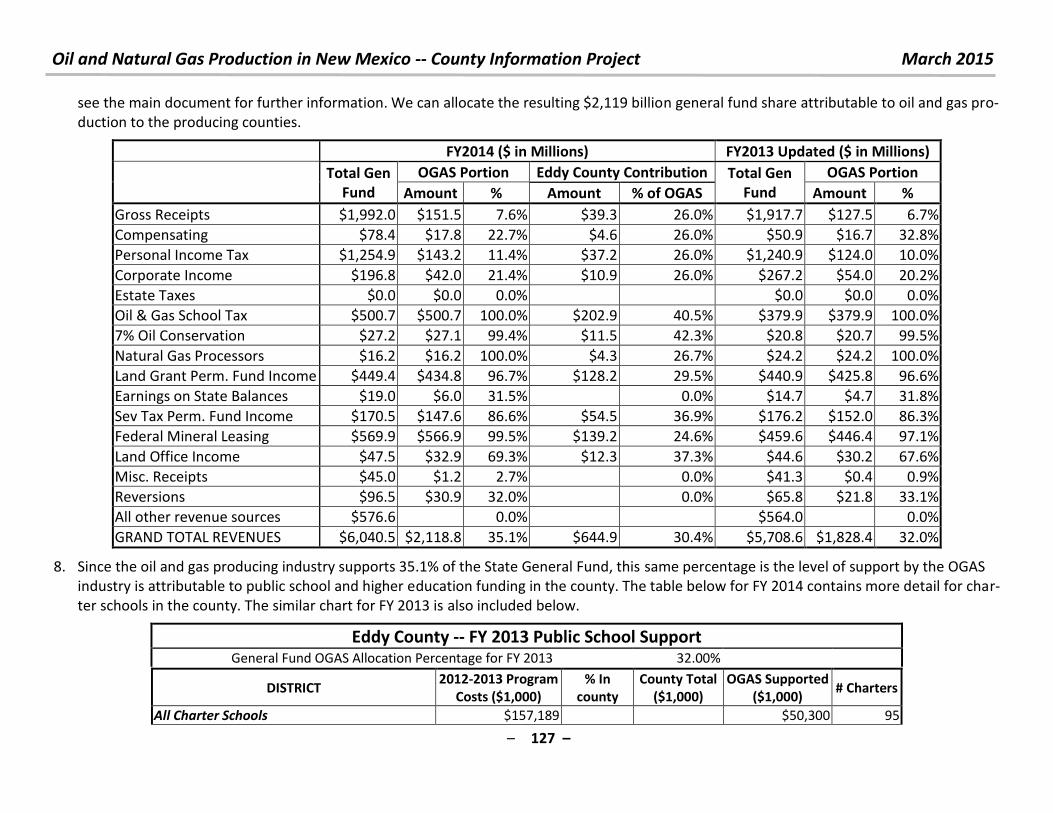
Oil and Natural Gas Production in New Mexico -- County Information Project March 2015
– 127 –
see the main document for further information. We can allocate the resulting $2,119 billion general fund share attributable to oil and gas pro-
duction to the producing counties.
FY2014 ($ in Millions) FY2013 Updated ($ in Millions)
Total Gen
Fund
OGAS Portion Eddy County Contribution Total Gen
Fund
OGAS Portion
Amount % Amount % of OGAS Amount %
Gross Receipts $1,992.0 $151.5 7.6% $39.3 26.0% $1,917.7 $127.5 6.7%
Compensating $78.4 $17.8 22.7% $4.6 26.0% $50.9 $16.7 32.8%
Personal Income Tax $1,254.9 $143.2 11.4% $37.2 26.0% $1,240.9 $124.0 10.0%
Corporate Income $196.8 $42.0 21.4% $10.9 26.0% $267.2 $54.0 20.2%
Estate Taxes $0.0 $0.0 0.0%
$0.0 $0.0 0.0%
Oil & Gas School Tax $500.7 $500.7 100.0% $202.9 40.5% $379.9 $379.9 100.0%
7% Oil Conservation $27.2 $27.1 99.4% $11.5 42.3% $20.8 $20.7 99.5%
Natural Gas Processors $16.2 $16.2 100.0% $4.3 26.7% $24.2 $24.2 100.0%
Land Grant Perm. Fund Income $449.4 $434.8 96.7% $128.2 29.5% $440.9 $425.8 96.6%
Earnings on State Balances $19.0 $6.0 31.5% 0.0% $14.7 $4.7 31.8%
Sev Tax Perm. Fund Income $170.5 $147.6 86.6% $54.5 36.9% $176.2 $152.0 86.3%
Federal Mineral Leasing $569.9 $566.9 99.5% $139.2 24.6% $459.6 $446.4 97.1%
Land Office Income $47.5 $32.9 69.3% $12.3 37.3% $44.6 $30.2 67.6%
Misc. Receipts $45.0 $1.2 2.7% 0.0% $41.3 $0.4 0.9%
Reversions $96.5 $30.9 32.0% 0.0% $65.8 $21.8 33.1%
All other revenue sources $576.6 0.0% $564.0 0.0%
GRAND TOTAL REVENUES $6,040.5 $2,118.8 35.1% $644.9 30.4% $5,708.6 $1,828.4 32.0%
8. Since the oil and gas producing industry supports 35.1% of the State General Fund, this same percentage is the level of support by the OGAS
industry is attributable to public school and higher education funding in the county. The table below for FY 2014 contains more detail for char-
ter schools in the county. The similar chart for FY 2013 is also included below.
Eddy County -- FY 2013 Public School Support General Fund OGAS Allocation Percentage for FY 2013 32.00%
DISTRICT 2012-2013 Program
Costs ($1,000)
% In
county
County Total
($1,000)
OGAS Supported
($1,000) # Charters
All Charter Schools $157,189
$50,300 95
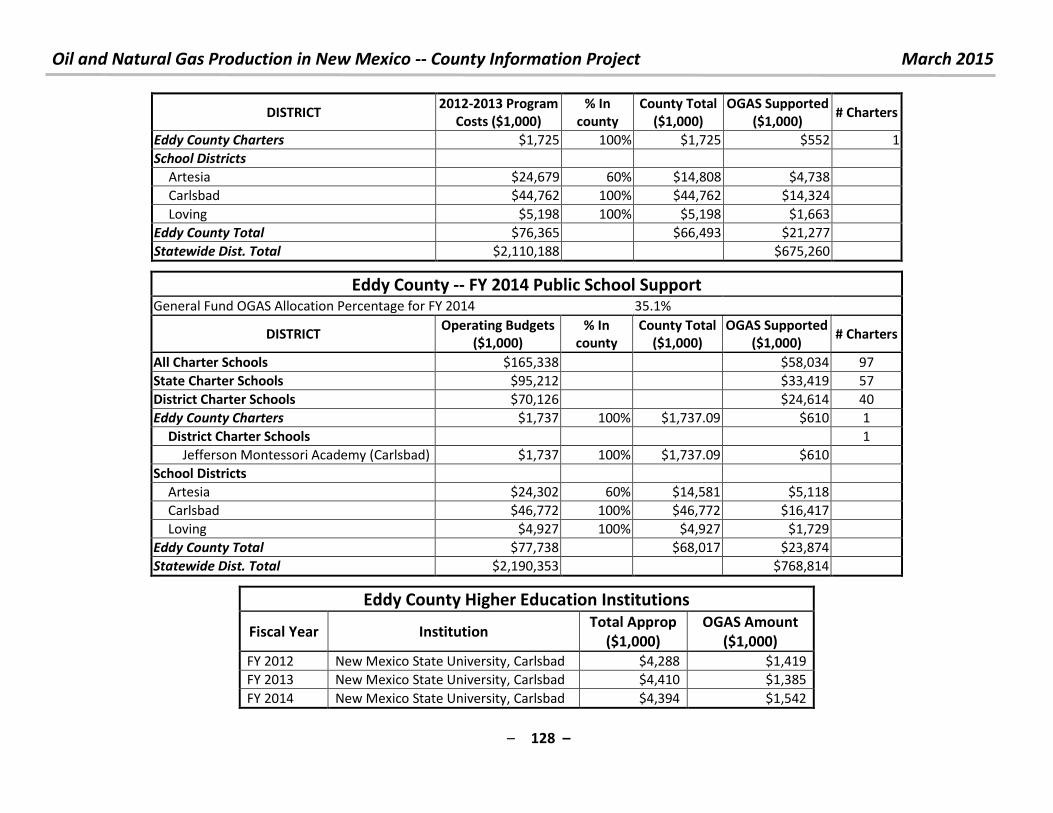
Oil and Natural Gas Production in New Mexico -- County Information Project March 2015
– 128 –
DISTRICT 2012-2013 Program
Costs ($1,000)
% In
county
County Total
($1,000)
OGAS Supported
($1,000) # Charters
Eddy County Charters $1,725 100% $1,725 $552 1
School Districts
Artesia $24,679 60% $14,808 $4,738
Carlsbad $44,762 100% $44,762 $14,324
Loving $5,198 100% $5,198 $1,663
Eddy County Total $76,365
$66,493 $21,277
Statewide Dist. Total $2,110,188
$675,260
Eddy County -- FY 2014 Public School Support General Fund OGAS Allocation Percentage for FY 2014 35.1%
DISTRICT Operating Budgets
($1,000)
% In
county
County Total
($1,000)
OGAS Supported
($1,000) # Charters
All Charter Schools $165,338
$58,034 97
State Charter Schools $95,212
$33,419 57
District Charter Schools $70,126
$24,614 40
Eddy County Charters $1,737 100% $1,737.09 $610 1
District Charter Schools
1
Jefferson Montessori Academy (Carlsbad) $1,737 100% $1,737.09 $610
School Districts
Artesia $24,302 60% $14,581 $5,118
Carlsbad $46,772 100% $46,772 $16,417
Loving $4,927 100% $4,927 $1,729
Eddy County Total $77,738
$68,017 $23,874
Statewide Dist. Total $2,190,353
$768,814
Eddy County Higher Education Institutions
Fiscal Year Institution Total Approp
($1,000)
OGAS Amount
($1,000)
FY 2012 New Mexico State University, Carlsbad $4,288 $1,419
FY 2013 New Mexico State University, Carlsbad $4,410 $1,385
FY 2014 New Mexico State University, Carlsbad $4,394 $1,542
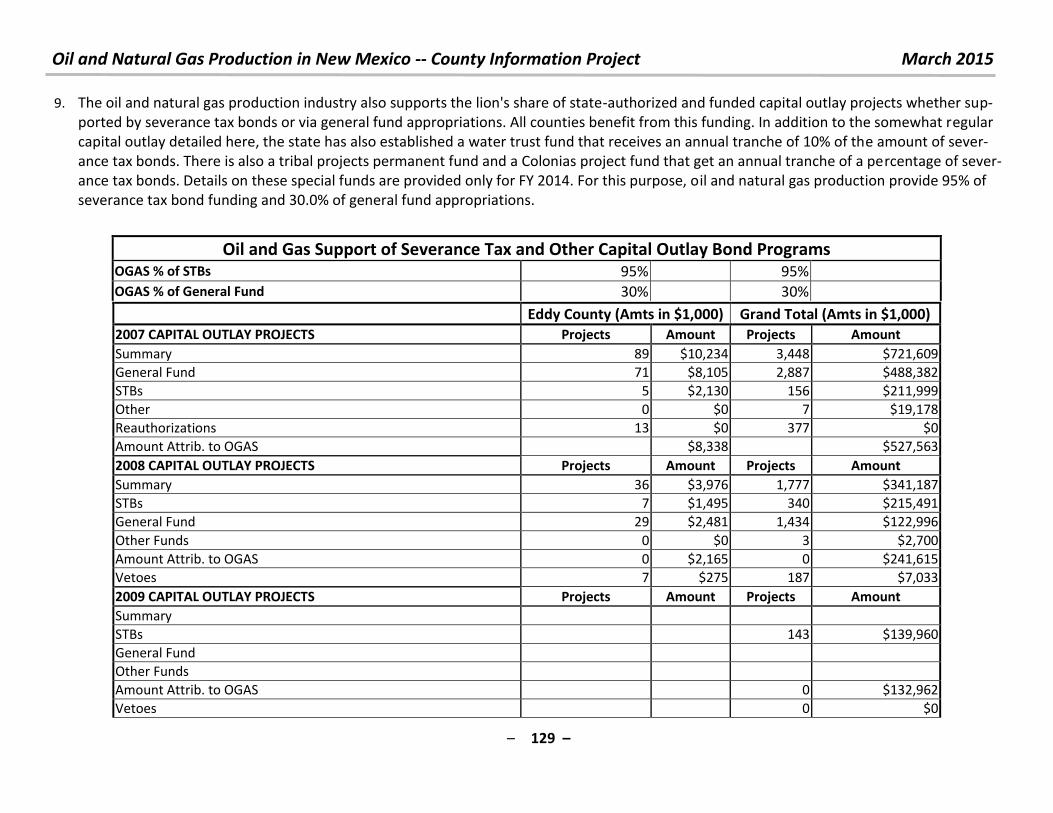
Oil and Natural Gas Production in New Mexico -- County Information Project March 2015
– 129 –
9. The oil and natural gas production industry also supports the lion's share of state-authorized and funded capital outlay projects whether sup-
ported by severance tax bonds or via general fund appropriations. All counties benefit from this funding. In addition to the somewhat regular
capital outlay detailed here, the state has also established a water trust fund that receives an annual tranche of 10% of the amount of sever-
ance tax bonds. There is also a tribal projects permanent fund and a Colonias project fund that get an annual tranche of a percentage of sever-
ance tax bonds. Details on these special funds are provided only for FY 2014. For this purpose, oil and natural gas production provide 95% of
severance tax bond funding and 30.0% of general fund appropriations.
Oil and Gas Support of Severance Tax and Other Capital Outlay Bond Programs OGAS % of STBs 95% 95%
OGAS % of General Fund 30% 30%
Eddy County (Amts in $1,000) Grand Total (Amts in $1,000)
2007 CAPITAL OUTLAY PROJECTS Projects Amount Projects Amount
Summary 89 $10,234 3,448 $721,609
General Fund 71 $8,105 2,887 $488,382
STBs 5 $2,130 156 $211,999
Other 0 $0 7 $19,178
Reauthorizations 13 $0 377 $0
Amount Attrib. to OGAS $8,338 $527,563
2008 CAPITAL OUTLAY PROJECTS Projects Amount Projects Amount
Summary 36 $3,976 1,777 $341,187
STBs 7 $1,495 340 $215,491
General Fund 29 $2,481 1,434 $122,996
Other Funds 0 $0 3 $2,700
Amount Attrib. to OGAS 0 $2,165 0 $241,615
Vetoes 7 $275 187 $7,033
2009 CAPITAL OUTLAY PROJECTS Projects Amount Projects Amount
Summary
STBs 143 $139,960
General Fund
Other Funds
Amount Attrib. to OGAS 0 $132,962
Vetoes 0 $0
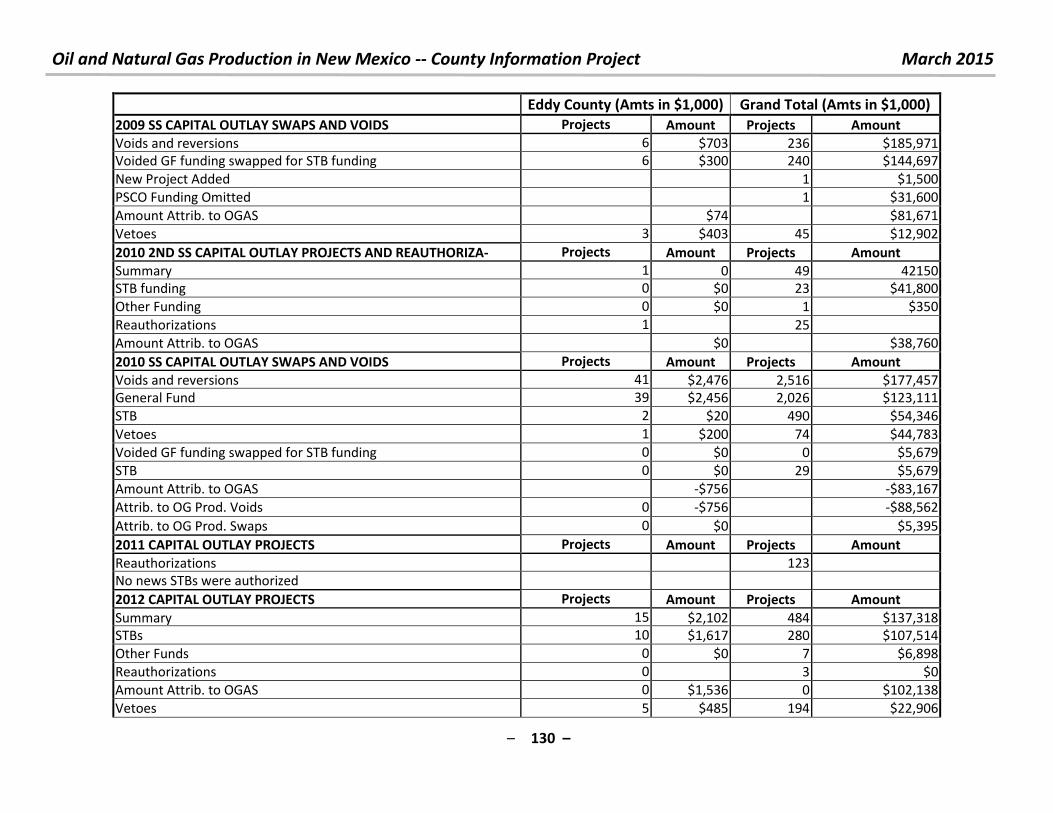
Oil and Natural Gas Production in New Mexico -- County Information Project March 2015
– 130 –
Eddy County (Amts in $1,000) Grand Total (Amts in $1,000)
2009 SS CAPITAL OUTLAY SWAPS AND VOIDS Projects Amount Projects Amount
Voids and reversions 6 $703 236 $185,971
Voided GF funding swapped for STB funding 6 $300 240 $144,697
New Project Added 1 $1,500
PSCO Funding Omitted 1 $31,600
Amount Attrib. to OGAS $74 $81,671
Vetoes 3 $403 45 $12,902
2010 2ND SS CAPITAL OUTLAY PROJECTS AND REAUTHORIZA- Projects Amount Projects Amount
Summary 1 0 49 42150
STB funding 0 $0 23 $41,800
Other Funding 0 $0 1 $350
Reauthorizations 1 25
Amount Attrib. to OGAS $0 $38,760
2010 SS CAPITAL OUTLAY SWAPS AND VOIDS Projects Amount Projects Amount
Voids and reversions 41 $2,476 2,516 $177,457
General Fund 39 $2,456 2,026 $123,111
STB 2 $20 490 $54,346
Vetoes 1 $200 74 $44,783
Voided GF funding swapped for STB funding 0 $0 0 $5,679
STB 0 $0 29 $5,679
Amount Attrib. to OGAS -$756 -$83,167
Attrib. to OG Prod. Voids 0 -$756 -$88,562
Attrib. to OG Prod. Swaps 0 $0 $5,395
2011 CAPITAL OUTLAY PROJECTS Projects Amount Projects Amount
Reauthorizations 123
No news STBs were authorized
2012 CAPITAL OUTLAY PROJECTS Projects Amount Projects Amount
Summary 15 $2,102 484 $137,318
STBs 10 $1,617 280 $107,514
Other Funds 0 $0 7 $6,898
Reauthorizations 0 3 $0
Amount Attrib. to OGAS 0 $1,536 0 $102,138
Vetoes 5 $485 194 $22,906
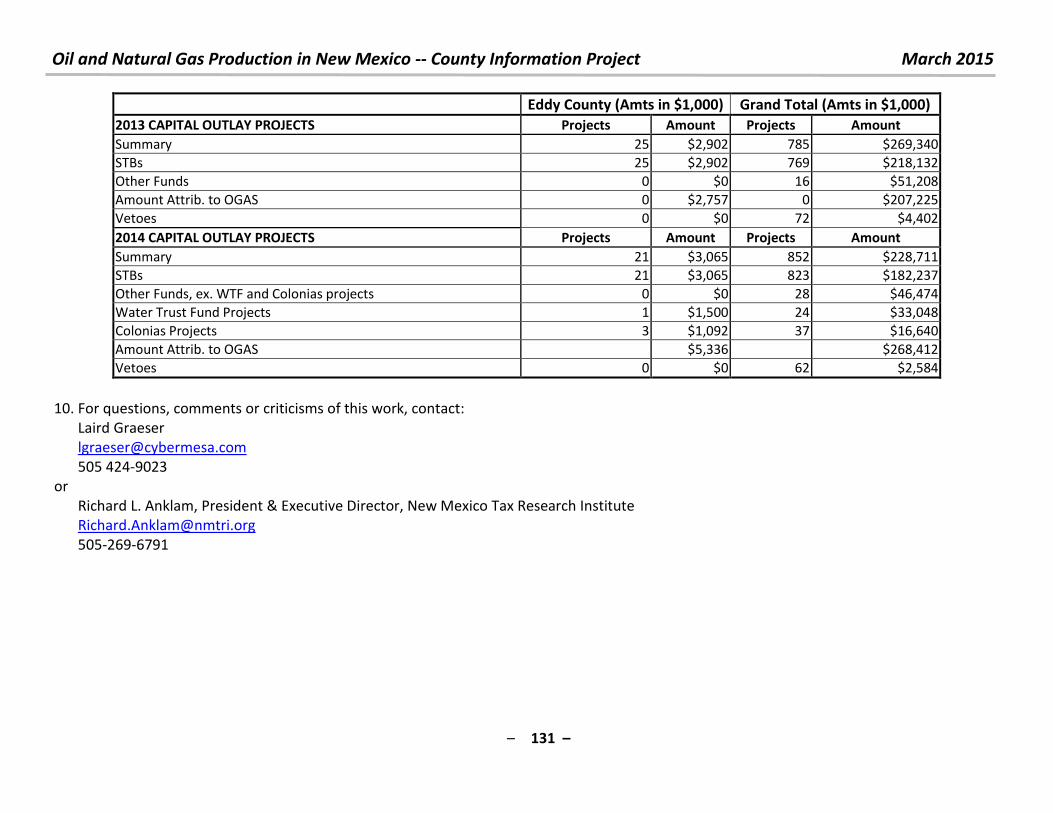
Oil and Natural Gas Production in New Mexico -- County Information Project March 2015
– 131 –
Eddy County (Amts in $1,000) Grand Total (Amts in $1,000)
2013 CAPITAL OUTLAY PROJECTS Projects Amount Projects Amount
Summary 25 $2,902 785 $269,340
STBs 25 $2,902 769 $218,132
Other Funds 0 $0 16 $51,208
Amount Attrib. to OGAS 0 $2,757 0 $207,225
Vetoes 0 $0 72 $4,402
2014 CAPITAL OUTLAY PROJECTS Projects Amount Projects Amount
Summary 21 $3,065 852 $228,711
STBs 21 $3,065 823 $182,237
Other Funds, ex. WTF and Colonias projects 0 $0 28 $46,474
Water Trust Fund Projects 1 $1,500 24 $33,048
Colonias Projects 3 $1,092 37 $16,640
Amount Attrib. to OGAS $5,336 $268,412
Vetoes 0 $0 62 $2,584
10. For questions, comments or criticisms of this work, contact:
Laird Graeser
505 424-9023
or
Richard L. Anklam, President & Executive Director, New Mexico Tax Research Institute
505-269-6791
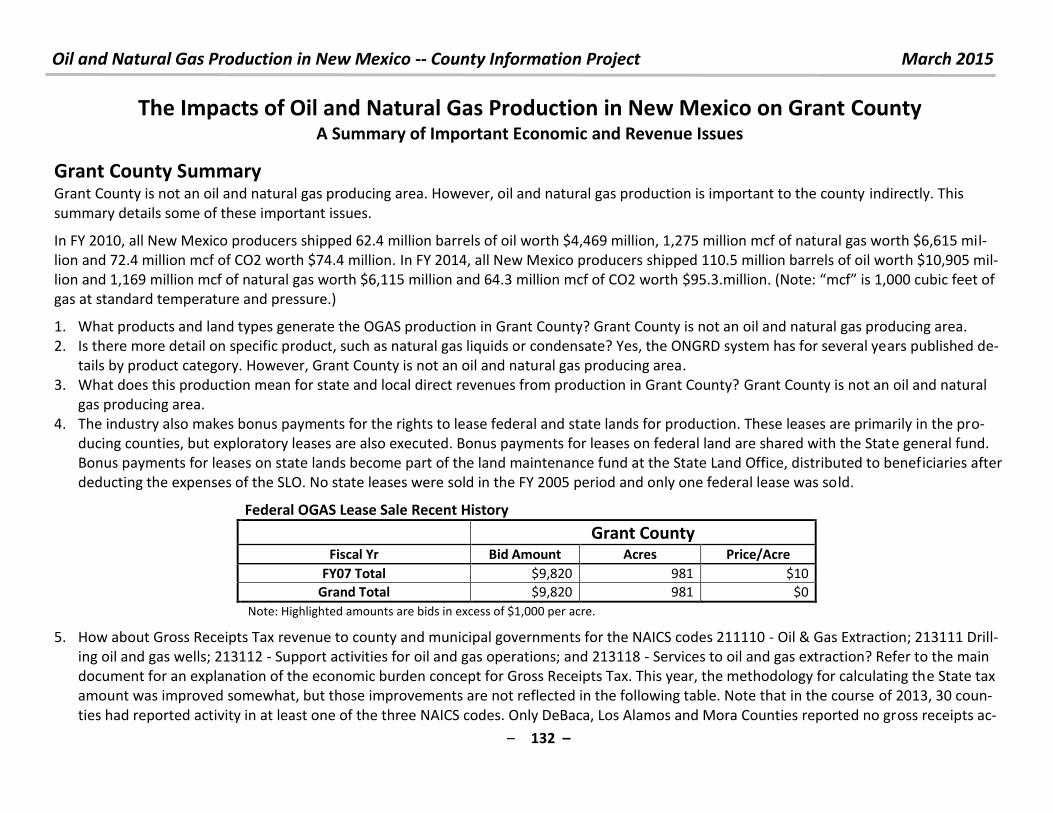
Oil and Natural Gas Production in New Mexico -- County Information Project March 2015
– 132 –
The Impacts of Oil and Natural Gas Production in New Mexico on Grant County A Summary of Important Economic and Revenue Issues
Grant County Summary
Grant County is not an oil and natural gas producing area. However, oil and natural gas production is important to the county indirectly. This
summary details some of these important issues.
In FY 2010, all New Mexico producers shipped 62.4 million barrels of oil worth $4,469 million, 1,275 million mcf of natural gas worth $6,615 mil-
lion and 72.4 million mcf of CO2 worth $74.4 million. In FY 2014, all New Mexico producers shipped 110.5 million barrels of oil worth $10,905 mil-
lion and 1,169 million mcf of natural gas worth $6,115 million and 64.3 million mcf of CO2 worth $ . . illio . Note: f is , u i feet of gas at standard temperature and pressure.)
1. What products and land types generate the OGAS production in Grant County? Grant County is not an oil and natural gas producing area.
2. Is there more detail on specific product, such as natural gas liquids or condensate? Yes, the ONGRD system has for several years published de-
tails by product category. However, Grant County is not an oil and natural gas producing area.
3. What does this production mean for state and local direct revenues from production in Grant County? Grant County is not an oil and natural
gas producing area.
4. The industry also makes bonus payments for the rights to lease federal and state lands for production. These leases are primarily in the pro-
ducing counties, but exploratory leases are also executed. Bonus payments for leases on federal land are shared with the State general fund.
Bonus payments for leases on state lands become part of the land maintenance fund at the State Land Office, distributed to beneficiaries after
deducting the expenses of the SLO. No state leases were sold in the FY 2005 period and only one federal lease was sold.
Federal OGAS Lease Sale Recent History
Grant County Fiscal Yr Bid Amount Acres Price/Acre
FY07 Total $9,820 981 $10
Grand Total $9,820 981 $0
Note: Highlighted amounts are bids in excess of $1,000 per acre.
5. How about Gross Receipts Tax revenue to county and municipal governments for the NAICS codes 211110 - Oil & Gas Extraction; 213111 Drill-
ing oil and gas wells; 213112 - Support activities for oil and gas operations; and 213118 - Services to oil and gas extraction? Refer to the main
document for an explanation of the economic burden concept for Gross Receipts Tax. This year, the methodology for calculating the State tax
amount was improved somewhat, but those improvements are not reflected in the following table. Note that in the course of 2013, 30 coun-
ties had reported activity in at least one of the three NAICS codes. Only DeBaca, Los Alamos and Mora Counties reported no gross receipts ac-
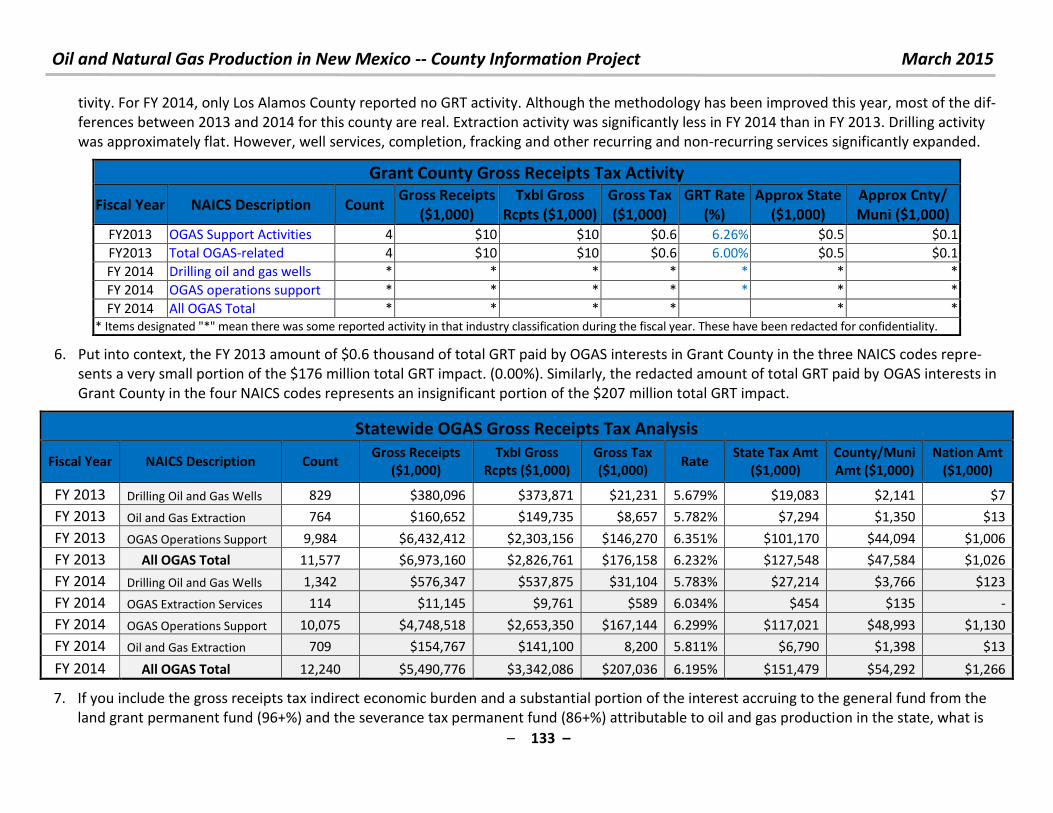
Oil and Natural Gas Production in New Mexico -- County Information Project March 2015
– 133 –
tivity. For FY 2014, only Los Alamos County reported no GRT activity. Although the methodology has been improved this year, most of the dif-
ferences between 2013 and 2014 for this county are real. Extraction activity was significantly less in FY 2014 than in FY 2013. Drilling activity
was approximately flat. However, well services, completion, fracking and other recurring and non-recurring services significantly expanded.
Grant County Gross Receipts Tax Activity
Fiscal Year NAICS Description Count Gross Receipts
($1,000)
Txbl Gross
Rcpts ($1,000)
Gross Tax
($1,000)
GRT Rate
(%)
Approx State
($1,000)
Approx Cnty/
Muni ($1,000)
FY2013 OGAS Support Activities 4 $10 $10 $0.6 6.26% $0.5 $0.1
FY2013 Total OGAS-related 4 $10 $10 $0.6 6.00% $0.5 $0.1
FY 2014 Drilling oil and gas wells * * * * * * *
FY 2014 OGAS operations support * * * * * * *
FY 2014 All OGAS Total * * * * * *
* Items designated "*" mean there was some reported activity in that industry classification during the fiscal year. These have been redacted for confidentiality.
6. Put into context, the FY 2013 amount of $0.6 thousand of total GRT paid by OGAS interests in Grant County in the three NAICS codes repre-
sents a very small portion of the $176 million total GRT impact. (0.00%). Similarly, the redacted amount of total GRT paid by OGAS interests in
Grant County in the four NAICS codes represents an insignificant portion of the $207 million total GRT impact.
Statewide OGAS Gross Receipts Tax Analysis
Fiscal Year NAICS Description Count Gross Receipts
($1,000)
Txbl Gross
Rcpts ($1,000)
Gross Tax
($1,000) Rate
State Tax Amt
($1,000)
County/Muni
Amt ($1,000)
Nation Amt
($1,000)
FY 2013 Drilling Oil and Gas Wells 829 $380,096 $373,871 $21,231 5.679% $19,083 $2,141 $7
FY 2013 Oil and Gas Extraction 764 $160,652 $149,735 $8,657 5.782% $7,294 $1,350 $13
FY 2013 OGAS Operations Support 9,984 $6,432,412 $2,303,156 $146,270 6.351% $101,170 $44,094 $1,006
FY 2013 All OGAS Total 11,577 $6,973,160 $2,826,761 $176,158 6.232% $127,548 $47,584 $1,026
FY 2014 Drilling Oil and Gas Wells 1,342 $576,347 $537,875 $31,104 5.783% $27,214 $3,766 $123
FY 2014 OGAS Extraction Services 114 $11,145 $9,761 $589 6.034% $454 $135 -
FY 2014 OGAS Operations Support 10,075 $4,748,518 $2,653,350 $167,144 6.299% $117,021 $48,993 $1,130
FY 2014 Oil and Gas Extraction 709 $154,767 $141,100 8,200 5.811% $6,790 $1,398 $13
FY 2014 All OGAS Total 12,240 $5,490,776 $3,342,086 $207,036 6.195% $151,479 $54,292 $1,266
7. If you include the gross receipts tax indirect economic burden and a substantial portion of the interest accruing to the general fund from the
land grant permanent fund (96+%) and the severance tax permanent fund (86+%) attributable to oil and gas production in the state, what is
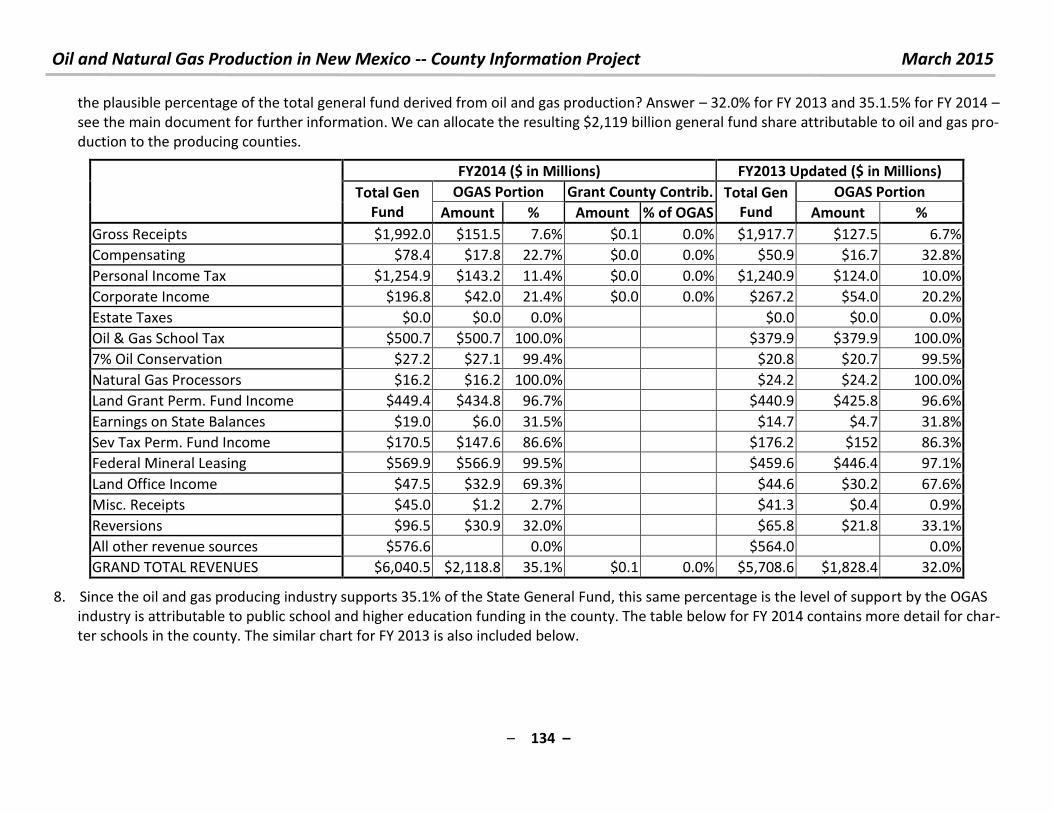
Oil and Natural Gas Production in New Mexico -- County Information Project March 2015
– 134 –
the plausible percentage of the total general fund derived from oil and gas production? Answer – 32.0% for FY 2013 and 35.1.5% for FY 2014 –
see the main document for further information. We can allocate the resulting $2,119 billion general fund share attributable to oil and gas pro-
duction to the producing counties.
FY2014 ($ in Millions) FY2013 Updated ($ in Millions)
Total Gen
Fund
OGAS Portion Grant County Contrib. Total Gen
Fund
OGAS Portion
Amount % Amount % of OGAS Amount %
Gross Receipts $1,992.0 $151.5 7.6% $0.1 0.0% $1,917.7 $127.5 6.7%
Compensating $78.4 $17.8 22.7% $0.0 0.0% $50.9 $16.7 32.8%
Personal Income Tax $1,254.9 $143.2 11.4% $0.0 0.0% $1,240.9 $124.0 10.0%
Corporate Income $196.8 $42.0 21.4% $0.0 0.0% $267.2 $54.0 20.2%
Estate Taxes $0.0 $0.0 0.0% $0.0 $0.0 0.0%
Oil & Gas School Tax $500.7 $500.7 100.0% $379.9 $379.9 100.0%
7% Oil Conservation $27.2 $27.1 99.4% $20.8 $20.7 99.5%
Natural Gas Processors $16.2 $16.2 100.0% $24.2 $24.2 100.0%
Land Grant Perm. Fund Income $449.4 $434.8 96.7% $440.9 $425.8 96.6%
Earnings on State Balances $19.0 $6.0 31.5% $14.7 $4.7 31.8%
Sev Tax Perm. Fund Income $170.5 $147.6 86.6% $176.2 $152 86.3%
Federal Mineral Leasing $569.9 $566.9 99.5% $459.6 $446.4 97.1%
Land Office Income $47.5 $32.9 69.3% $44.6 $30.2 67.6%
Misc. Receipts $45.0 $1.2 2.7% $41.3 $0.4 0.9%
Reversions $96.5 $30.9 32.0% $65.8 $21.8 33.1%
All other revenue sources $576.6 0.0% $564.0
0.0%
GRAND TOTAL REVENUES $6,040.5 $2,118.8 35.1% $0.1 0.0% $5,708.6 $1,828.4 32.0%
8. Since the oil and gas producing industry supports 35.1% of the State General Fund, this same percentage is the level of support by the OGAS
industry is attributable to public school and higher education funding in the county. The table below for FY 2014 contains more detail for char-
ter schools in the county. The similar chart for FY 2013 is also included below.
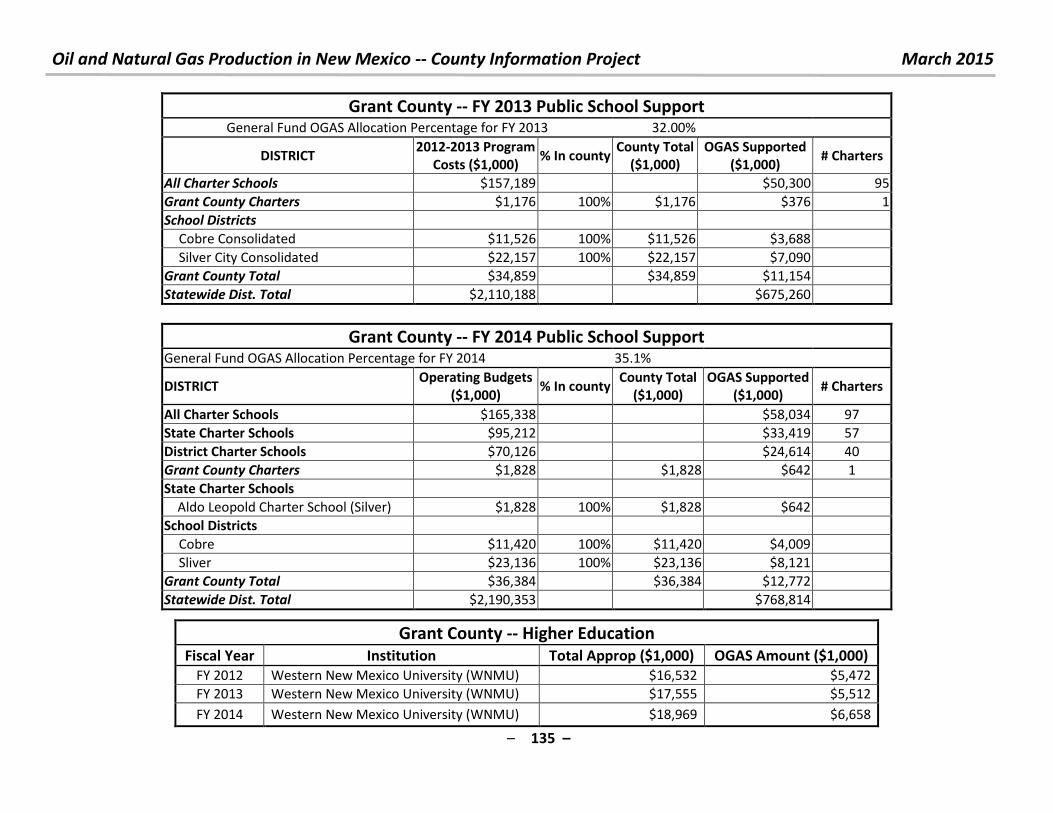
Oil and Natural Gas Production in New Mexico -- County Information Project March 2015
– 135 –
Grant County -- FY 2013 Public School Support General Fund OGAS Allocation Percentage for FY 2013 32.00%
DISTRICT 2012-2013 Program
Costs ($1,000) % In county
County Total
($1,000)
OGAS Supported
($1,000) # Charters
All Charter Schools $157,189 $50,300 95
Grant County Charters $1,176 100% $1,176 $376 1
School Districts
Cobre Consolidated $11,526 100% $11,526 $3,688
Silver City Consolidated $22,157 100% $22,157 $7,090
Grant County Total $34,859 $34,859 $11,154
Statewide Dist. Total $2,110,188 $675,260
Grant County -- FY 2014 Public School Support General Fund OGAS Allocation Percentage for FY 2014 35.1%
DISTRICT Operating Budgets
($1,000) % In county
County Total
($1,000)
OGAS Supported
($1,000) # Charters
All Charter Schools $165,338 $58,034 97
State Charter Schools $95,212 $33,419 57
District Charter Schools $70,126 $24,614 40
Grant County Charters $1,828 $1,828 $642 1
State Charter Schools
Aldo Leopold Charter School (Silver) $1,828 100% $1,828 $642
School Districts
Cobre $11,420 100% $11,420 $4,009
Sliver $23,136 100% $23,136 $8,121
Grant County Total $36,384 $36,384 $12,772
Statewide Dist. Total $2,190,353 $768,814
Grant County -- Higher Education
Fiscal Year Institution Total Approp ($1,000) OGAS Amount ($1,000)
FY 2012 Western New Mexico University (WNMU) $16,532 $5,472
FY 2013 Western New Mexico University (WNMU) $17,555 $5,512
FY 2014 Western New Mexico University (WNMU) $18,969 $6,658
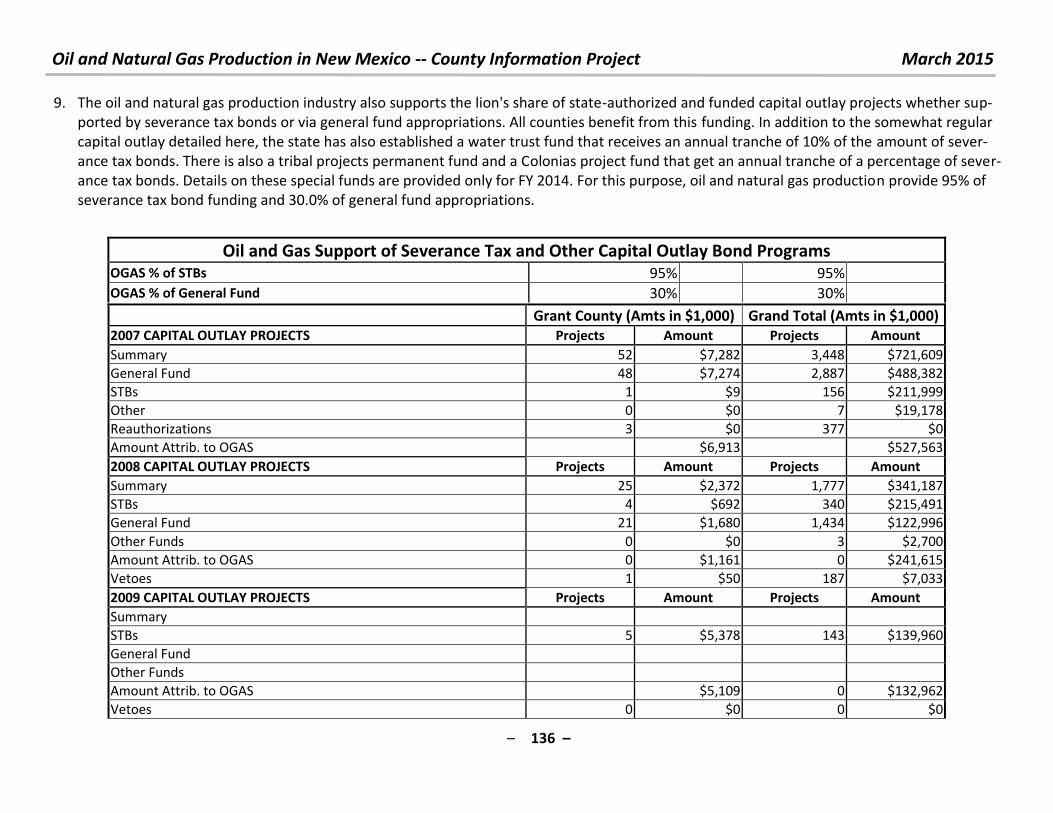
Oil and Natural Gas Production in New Mexico -- County Information Project March 2015
– 136 –
9. The oil and natural gas production industry also supports the lion's share of state-authorized and funded capital outlay projects whether sup-
ported by severance tax bonds or via general fund appropriations. All counties benefit from this funding. In addition to the somewhat regular
capital outlay detailed here, the state has also established a water trust fund that receives an annual tranche of 10% of the amount of sever-
ance tax bonds. There is also a tribal projects permanent fund and a Colonias project fund that get an annual tranche of a percentage of sever-
ance tax bonds. Details on these special funds are provided only for FY 2014. For this purpose, oil and natural gas production provide 95% of
severance tax bond funding and 30.0% of general fund appropriations.
Oil and Gas Support of Severance Tax and Other Capital Outlay Bond Programs OGAS % of STBs 95% 95%
OGAS % of General Fund 30% 30%
Grant County (Amts in $1,000) Grand Total (Amts in $1,000)
2007 CAPITAL OUTLAY PROJECTS Projects Amount Projects Amount
Summary 52 $7,282 3,448 $721,609
General Fund 48 $7,274 2,887 $488,382
STBs 1 $9 156 $211,999
Other 0 $0 7 $19,178
Reauthorizations 3 $0 377 $0
Amount Attrib. to OGAS $6,913 $527,563
2008 CAPITAL OUTLAY PROJECTS Projects Amount Projects Amount
Summary 25 $2,372 1,777 $341,187
STBs 4 $692 340 $215,491
General Fund 21 $1,680 1,434 $122,996
Other Funds 0 $0 3 $2,700
Amount Attrib. to OGAS 0 $1,161 0 $241,615
Vetoes 1 $50 187 $7,033
2009 CAPITAL OUTLAY PROJECTS Projects Amount Projects Amount
Summary
STBs 5 $5,378 143 $139,960
General Fund
Other Funds
Amount Attrib. to OGAS $5,109 0 $132,962
Vetoes 0 $0 0 $0
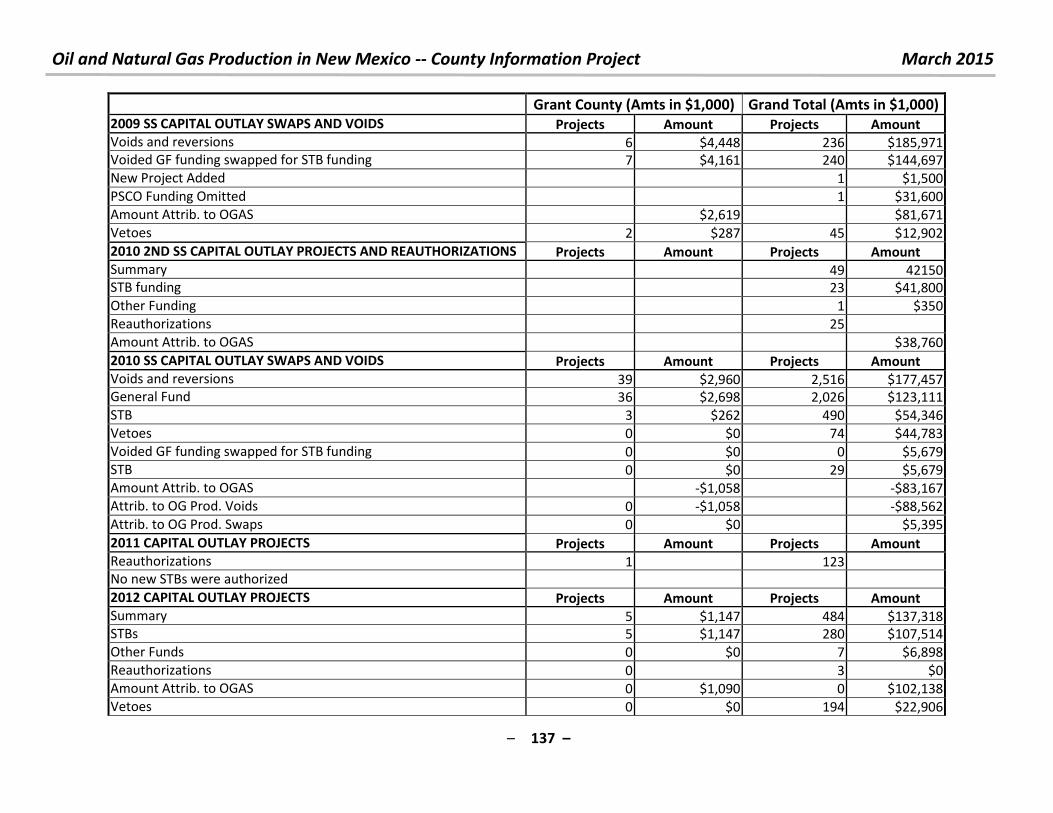
Oil and Natural Gas Production in New Mexico -- County Information Project March 2015
– 137 –
Grant County (Amts in $1,000) Grand Total (Amts in $1,000)
2009 SS CAPITAL OUTLAY SWAPS AND VOIDS Projects Amount Projects Amount
Voids and reversions 6 $4,448 236 $185,971
Voided GF funding swapped for STB funding 7 $4,161 240 $144,697
New Project Added 1 $1,500
PSCO Funding Omitted 1 $31,600
Amount Attrib. to OGAS $2,619 $81,671
Vetoes 2 $287 45 $12,902
2010 2ND SS CAPITAL OUTLAY PROJECTS AND REAUTHORIZATIONS Projects Amount Projects Amount
Summary 49 42150
STB funding 23 $41,800
Other Funding 1 $350
Reauthorizations 25
Amount Attrib. to OGAS $38,760
2010 SS CAPITAL OUTLAY SWAPS AND VOIDS Projects Amount Projects Amount
Voids and reversions 39 $2,960 2,516 $177,457
General Fund 36 $2,698 2,026 $123,111
STB 3 $262 490 $54,346
Vetoes 0 $0 74 $44,783
Voided GF funding swapped for STB funding 0 $0 0 $5,679
STB 0 $0 29 $5,679
Amount Attrib. to OGAS -$1,058 -$83,167
Attrib. to OG Prod. Voids 0 -$1,058 -$88,562
Attrib. to OG Prod. Swaps 0 $0 $5,395
2011 CAPITAL OUTLAY PROJECTS Projects Amount Projects Amount
Reauthorizations 1 123
No new STBs were authorized
2012 CAPITAL OUTLAY PROJECTS Projects Amount Projects Amount
Summary 5 $1,147 484 $137,318
STBs 5 $1,147 280 $107,514
Other Funds 0 $0 7 $6,898
Reauthorizations 0 3 $0
Amount Attrib. to OGAS 0 $1,090 0 $102,138
Vetoes 0 $0 194 $22,906
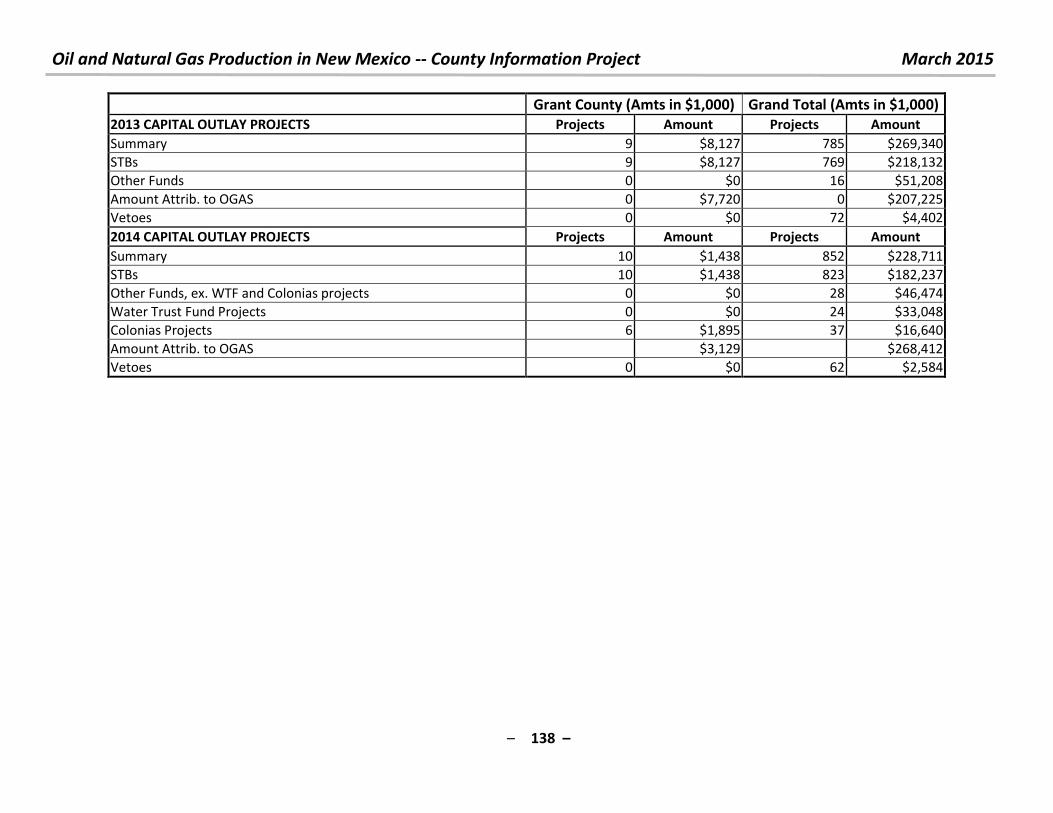
Oil and Natural Gas Production in New Mexico -- County Information Project March 2015
– 138 –
Grant County (Amts in $1,000) Grand Total (Amts in $1,000)
2013 CAPITAL OUTLAY PROJECTS Projects Amount Projects Amount
Summary 9 $8,127 785 $269,340
STBs 9 $8,127 769 $218,132
Other Funds 0 $0 16 $51,208
Amount Attrib. to OGAS 0 $7,720 0 $207,225
Vetoes 0 $0 72 $4,402
2014 CAPITAL OUTLAY PROJECTS Projects Amount Projects Amount
Summary 10 $1,438 852 $228,711
STBs 10 $1,438 823 $182,237
Other Funds, ex. WTF and Colonias projects 0 $0 28 $46,474
Water Trust Fund Projects 0 $0 24 $33,048
Colonias Projects 6 $1,895 37 $16,640
Amount Attrib. to OGAS $3,129 $268,412
Vetoes 0 $0 62 $2,584

Oil and Natural Gas Production in New Mexico -- County Information Project March 2015
– 139 –
10. For questions, comments or criticisms of this work, contact:
Laird Graeser
505 424-9023
or
Richard L. Anklam, President & Executive Director, New Mexico Tax Research Institute
505-269-6791
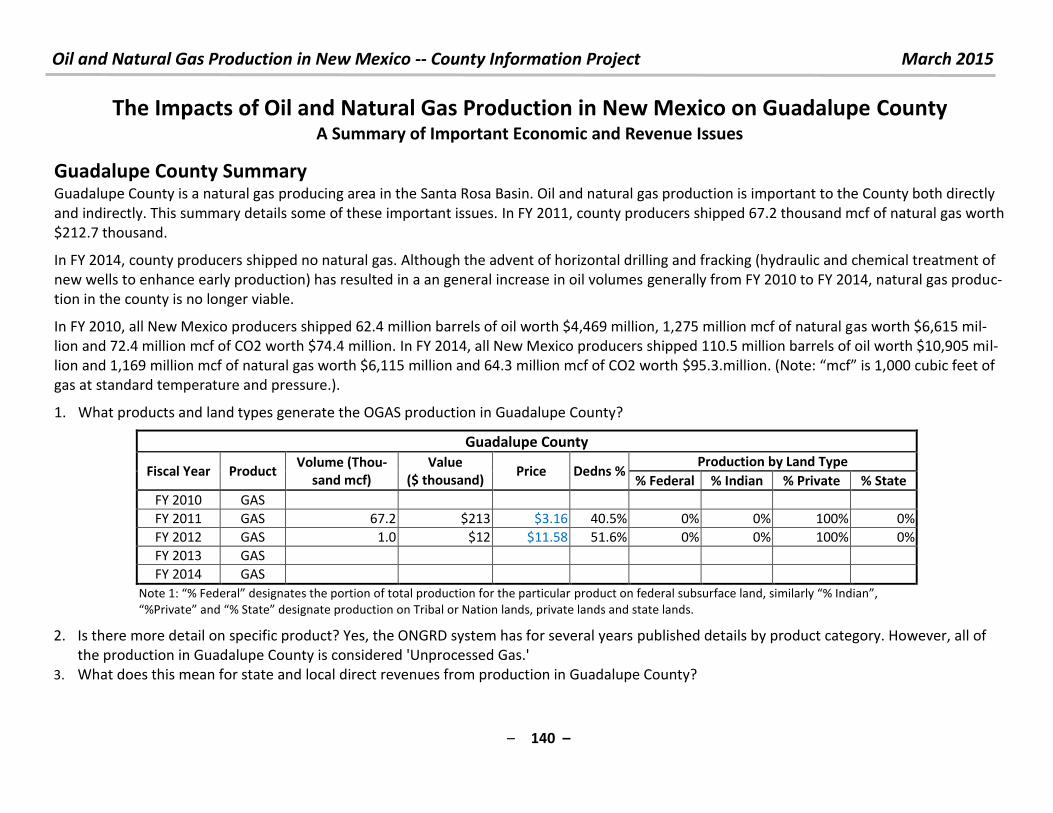
Oil and Natural Gas Production in New Mexico -- County Information Project March 2015
– 140 –
The Impacts of Oil and Natural Gas Production in New Mexico on Guadalupe County A Summary of Important Economic and Revenue Issues
Guadalupe County Summary
Guadalupe County is a natural gas producing area in the Santa Rosa Basin. Oil and natural gas production is important to the County both directly
and indirectly. This summary details some of these important issues. In FY 2011, county producers shipped 67.2 thousand mcf of natural gas worth
$212.7 thousand.
In FY 2014, county producers shipped no natural gas. Although the advent of horizontal drilling and fracking (hydraulic and chemical treatment of
new wells to enhance early production) has resulted in a an general increase in oil volumes generally from FY 2010 to FY 2014, natural gas produc-
tion in the county is no longer viable.
In FY 2010, all New Mexico producers shipped 62.4 million barrels of oil worth $4,469 million, 1,275 million mcf of natural gas worth $6,615 mil-
lion and 72.4 million mcf of CO2 worth $74.4 million. In FY 2014, all New Mexico producers shipped 110.5 million barrels of oil worth $10,905 mil-
lion and 1,169 million mcf of natural gas worth $6,115 million and 64.3 million mcf of CO2 worth $ . . illio . Note: f is ,000 cubic feet of
gas at standard temperature and pressure.).
1. What products and land types generate the OGAS production in Guadalupe County?
Guadalupe County
Fiscal Year Product Volume (Thou-
sand mcf)
Value
($ thousand) Price Dedns %
Production by Land Type
% Federal % Indian % Private % State
FY 2010 GAS
FY 2011 GAS 67.2 $213 $3.16 40.5% 0% 0% 100% 0%
FY 2012 GAS 1.0 $12 $11.58 51.6% 0% 0% 100% 0%
FY 2013 GAS
FY 2014 GAS
Note : % Fede al desig ates the po tio of total p odu tio fo the pa ti ula p odu t o fede al su su fa e la d, si ila l % I dia , %P i ate a d % “tate desig ate p odu tio o T i al o Natio la ds, p i ate la ds a d state la ds.
2. Is there more detail on specific product? Yes, the ONGRD system has for several years published details by product category. However, all of
the production in Guadalupe County is considered 'Unprocessed Gas.'
3. What does this mean for state and local direct revenues from production in Guadalupe County?
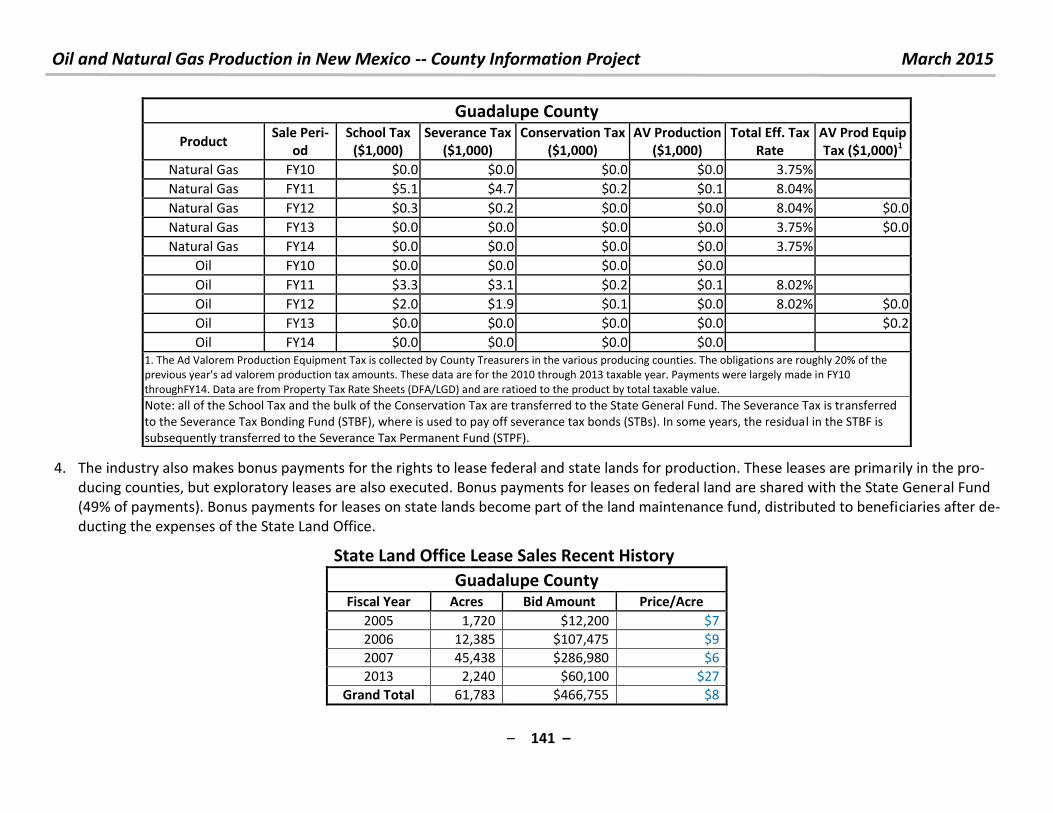
Oil and Natural Gas Production in New Mexico -- County Information Project March 2015
– 141 –
4. The industry also makes bonus payments for the rights to lease federal and state lands for production. These leases are primarily in the pro-
ducing counties, but exploratory leases are also executed. Bonus payments for leases on federal land are shared with the State General Fund
(49% of payments). Bonus payments for leases on state lands become part of the land maintenance fund, distributed to beneficiaries after de-
ducting the expenses of the State Land Office.
State Land Office Lease Sales Recent History
Guadalupe County Fiscal Year Acres Bid Amount Price/Acre
2005 1,720 $12,200 $7
2006 12,385 $107,475 $9
2007 45,438 $286,980 $6
2013 2,240 $60,100 $27
Grand Total 61,783 $466,755 $8
Guadalupe County
Product Sale Peri-
od
School Tax
($1,000)
Severance Tax
($1,000)
Conservation Tax
($1,000)
AV Production
($1,000)
Total Eff. Tax
Rate
AV Prod Equip
Tax ($1,000)1
Natural Gas FY10 $0.0 $0.0 $0.0 $0.0 3.75%
Natural Gas FY11 $5.1 $4.7 $0.2 $0.1 8.04%
Natural Gas FY12 $0.3 $0.2 $0.0 $0.0 8.04% $0.0
Natural Gas FY13 $0.0 $0.0 $0.0 $0.0 3.75% $0.0
Natural Gas FY14 $0.0 $0.0 $0.0 $0.0 3.75%
Oil FY10 $0.0 $0.0 $0.0 $0.0
Oil FY11 $3.3 $3.1 $0.2 $0.1 8.02%
Oil FY12 $2.0 $1.9 $0.1 $0.0 8.02% $0.0
Oil FY13 $0.0 $0.0 $0.0 $0.0 $0.2
Oil FY14 $0.0 $0.0 $0.0 $0.0
1. The Ad Valorem Production Equipment Tax is collected by County Treasurers in the various producing counties. The obligations are roughly 20% of the
previous year's ad valorem production tax amounts. These data are for the 2010 through 2013 taxable year. Payments were largely made in FY10
throughFY14. Data are from Property Tax Rate Sheets (DFA/LGD) and are ratioed to the product by total taxable value.
Note: all of the School Tax and the bulk of the Conservation Tax are transferred to the State General Fund. The Severance Tax is transferred
to the Severance Tax Bonding Fund (STBF), where is used to pay off severance tax bonds (STBs). In some years, the residual in the STBF is
subsequently transferred to the Severance Tax Permanent Fund (STPF).
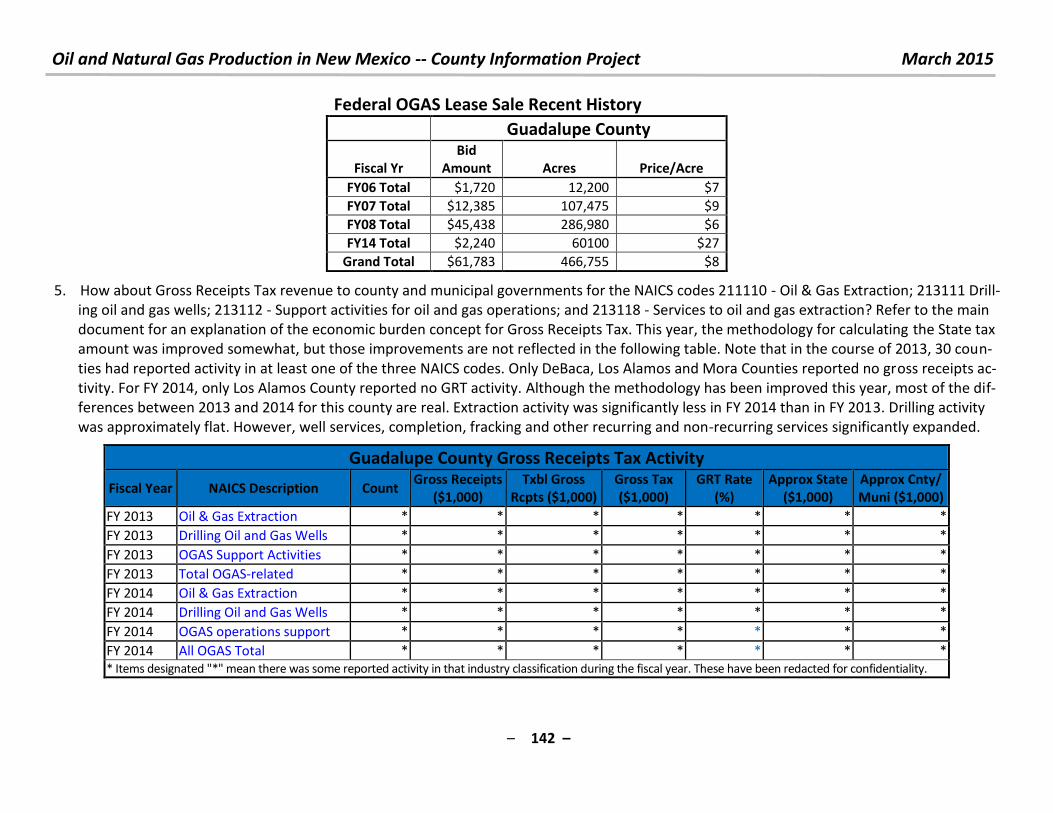
Oil and Natural Gas Production in New Mexico -- County Information Project March 2015
– 142 –
Federal OGAS Lease Sale Recent History
Guadalupe County
Fiscal Yr
Bid
Amount Acres Price/Acre
FY06 Total $1,720 12,200 $7
FY07 Total $12,385 107,475 $9
FY08 Total $45,438 286,980 $6
FY14 Total $2,240 60100 $27
Grand Total $61,783 466,755 $8
5. How about Gross Receipts Tax revenue to county and municipal governments for the NAICS codes 211110 - Oil & Gas Extraction; 213111 Drill-
ing oil and gas wells; 213112 - Support activities for oil and gas operations; and 213118 - Services to oil and gas extraction? Refer to the main
document for an explanation of the economic burden concept for Gross Receipts Tax. This year, the methodology for calculating the State tax
amount was improved somewhat, but those improvements are not reflected in the following table. Note that in the course of 2013, 30 coun-
ties had reported activity in at least one of the three NAICS codes. Only DeBaca, Los Alamos and Mora Counties reported no gross receipts ac-
tivity. For FY 2014, only Los Alamos County reported no GRT activity. Although the methodology has been improved this year, most of the dif-
ferences between 2013 and 2014 for this county are real. Extraction activity was significantly less in FY 2014 than in FY 2013. Drilling activity
was approximately flat. However, well services, completion, fracking and other recurring and non-recurring services significantly expanded.
Guadalupe County Gross Receipts Tax Activity
Fiscal Year NAICS Description Count Gross Receipts
($1,000)
Txbl Gross
Rcpts ($1,000)
Gross Tax
($1,000)
GRT Rate
(%)
Approx State
($1,000)
Approx Cnty/
Muni ($1,000)
FY 2013 Oil & Gas Extraction * * * * * * *
FY 2013 Drilling Oil and Gas Wells * * * * * * *
FY 2013 OGAS Support Activities * * * * * * *
FY 2013 Total OGAS-related * * * * * * *
FY 2014 Oil & Gas Extraction * * * * * * *
FY 2014 Drilling Oil and Gas Wells * * * * * * *
FY 2014 OGAS operations support * * * * * * *
FY 2014 All OGAS Total * * * * * * *
* Items designated "*" mean there was some reported activity in that industry classification during the fiscal year. These have been redacted for confidentiality.
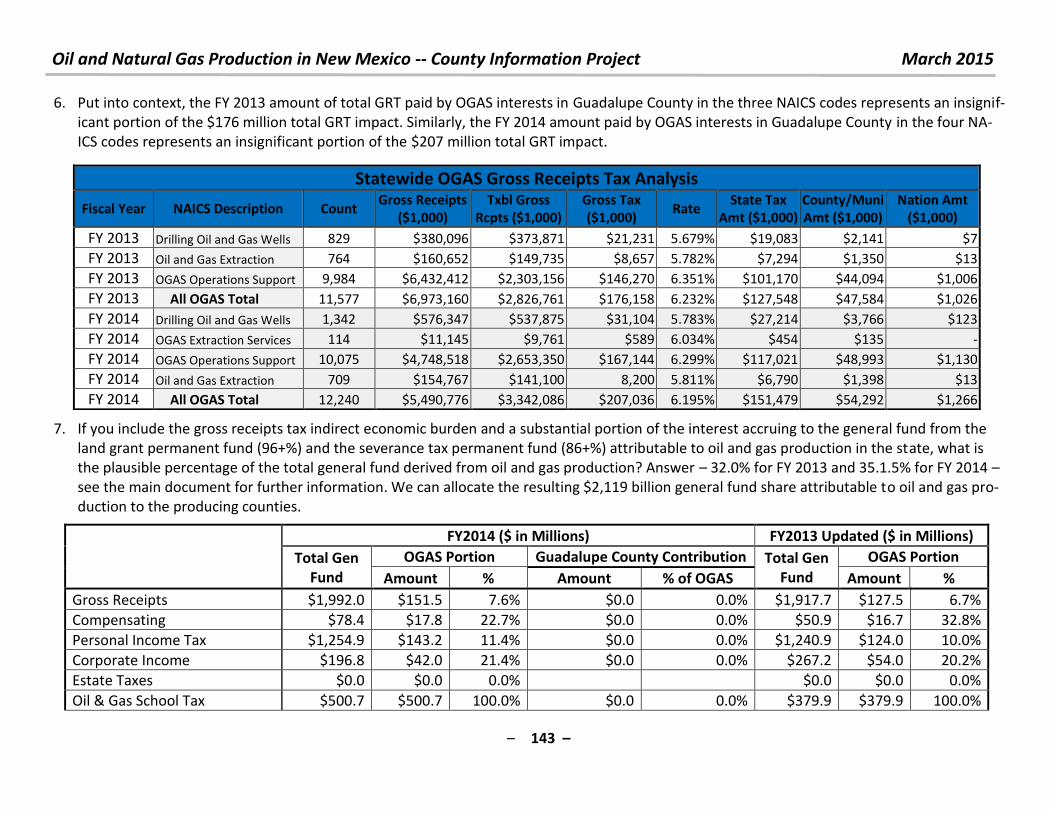
Oil and Natural Gas Production in New Mexico -- County Information Project March 2015
– 143 –
6. Put into context, the FY 2013 amount of total GRT paid by OGAS interests in Guadalupe County in the three NAICS codes represents an insignif-
icant portion of the $176 million total GRT impact. Similarly, the FY 2014 amount paid by OGAS interests in Guadalupe County in the four NA-
ICS codes represents an insignificant portion of the $207 million total GRT impact.
7. If you include the gross receipts tax indirect economic burden and a substantial portion of the interest accruing to the general fund from the
land grant permanent fund (96+%) and the severance tax permanent fund (86+%) attributable to oil and gas production in the state, what is
the plausible percentage of the total general fund derived from oil and gas production? Answer – 32.0% for FY 2013 and 35.1.5% for FY 2014 –
see the main document for further information. We can allocate the resulting $2,119 billion general fund share attributable to oil and gas pro-
duction to the producing counties.
FY2014 ($ in Millions) FY2013 Updated ($ in Millions)
Total Gen
Fund
OGAS Portion Guadalupe County Contribution Total Gen
Fund
OGAS Portion
Amount % Amount % of OGAS Amount %
Gross Receipts $1,992.0 $151.5 7.6% $0.0 0.0% $1,917.7 $127.5 6.7%
Compensating $78.4 $17.8 22.7% $0.0 0.0% $50.9 $16.7 32.8%
Personal Income Tax $1,254.9 $143.2 11.4% $0.0 0.0% $1,240.9 $124.0 10.0%
Corporate Income $196.8 $42.0 21.4% $0.0 0.0% $267.2 $54.0 20.2%
Estate Taxes $0.0 $0.0 0.0% $0.0 $0.0 0.0%
Oil & Gas School Tax $500.7 $500.7 100.0% $0.0 0.0% $379.9 $379.9 100.0%
Statewide OGAS Gross Receipts Tax Analysis
Fiscal Year NAICS Description Count Gross Receipts
($1,000)
Txbl Gross
Rcpts ($1,000)
Gross Tax
($1,000) Rate
State Tax
Amt ($1,000)
County/Muni
Amt ($1,000)
Nation Amt
($1,000)
FY 2013 Drilling Oil and Gas Wells 829 $380,096 $373,871 $21,231 5.679% $19,083 $2,141 $7
FY 2013 Oil and Gas Extraction 764 $160,652 $149,735 $8,657 5.782% $7,294 $1,350 $13
FY 2013 OGAS Operations Support 9,984 $6,432,412 $2,303,156 $146,270 6.351% $101,170 $44,094 $1,006
FY 2013 All OGAS Total 11,577 $6,973,160 $2,826,761 $176,158 6.232% $127,548 $47,584 $1,026
FY 2014 Drilling Oil and Gas Wells 1,342 $576,347 $537,875 $31,104 5.783% $27,214 $3,766 $123
FY 2014 OGAS Extraction Services 114 $11,145 $9,761 $589 6.034% $454 $135 -
FY 2014 OGAS Operations Support 10,075 $4,748,518 $2,653,350 $167,144 6.299% $117,021 $48,993 $1,130
FY 2014 Oil and Gas Extraction 709 $154,767 $141,100 8,200 5.811% $6,790 $1,398 $13
FY 2014 All OGAS Total 12,240 $5,490,776 $3,342,086 $207,036 6.195% $151,479 $54,292 $1,266
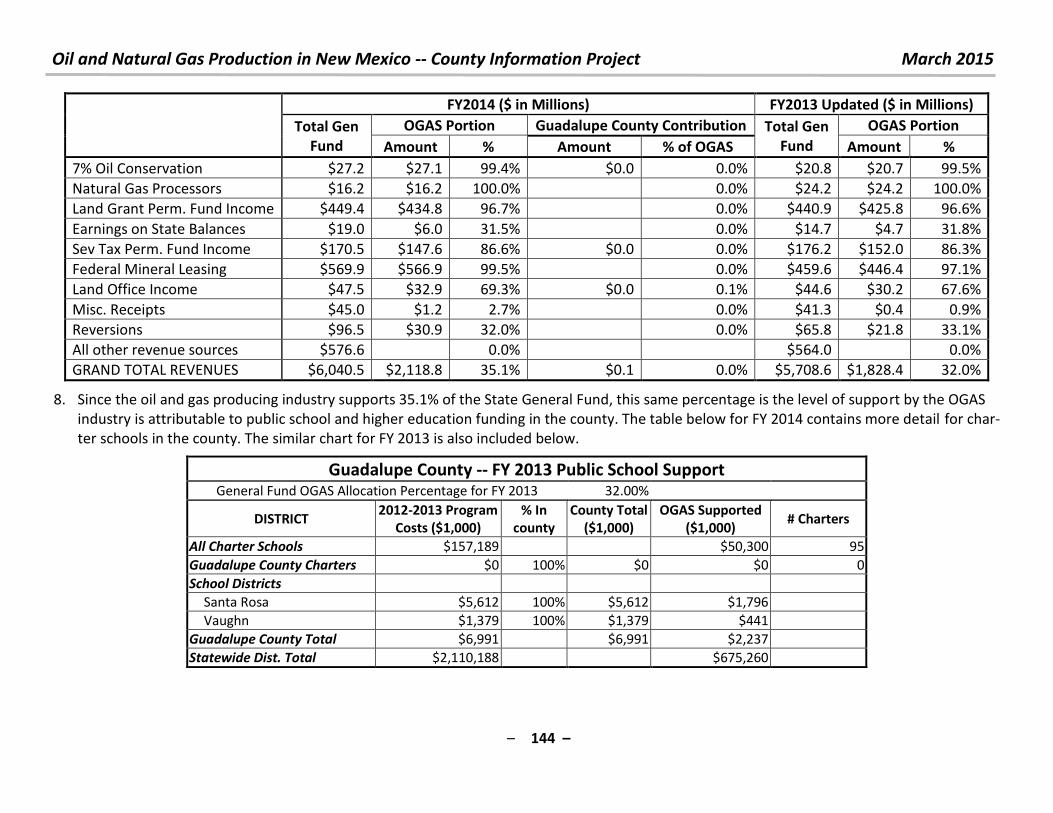
Oil and Natural Gas Production in New Mexico -- County Information Project March 2015
– 144 –
FY2014 ($ in Millions) FY2013 Updated ($ in Millions)
Total Gen
Fund
OGAS Portion Guadalupe County Contribution Total Gen
Fund
OGAS Portion
Amount % Amount % of OGAS Amount %
7% Oil Conservation $27.2 $27.1 99.4% $0.0 0.0% $20.8 $20.7 99.5%
Natural Gas Processors $16.2 $16.2 100.0% 0.0% $24.2 $24.2 100.0%
Land Grant Perm. Fund Income $449.4 $434.8 96.7% 0.0% $440.9 $425.8 96.6%
Earnings on State Balances $19.0 $6.0 31.5% 0.0% $14.7 $4.7 31.8%
Sev Tax Perm. Fund Income $170.5 $147.6 86.6% $0.0 0.0% $176.2 $152.0 86.3%
Federal Mineral Leasing $569.9 $566.9 99.5% 0.0% $459.6 $446.4 97.1%
Land Office Income $47.5 $32.9 69.3% $0.0 0.1% $44.6 $30.2 67.6%
Misc. Receipts $45.0 $1.2 2.7% 0.0% $41.3 $0.4 0.9%
Reversions $96.5 $30.9 32.0% 0.0% $65.8 $21.8 33.1%
All other revenue sources $576.6 0.0% $564.0 0.0%
GRAND TOTAL REVENUES $6,040.5 $2,118.8 35.1% $0.1 0.0% $5,708.6 $1,828.4 32.0%
8. Since the oil and gas producing industry supports 35.1% of the State General Fund, this same percentage is the level of support by the OGAS
industry is attributable to public school and higher education funding in the county. The table below for FY 2014 contains more detail for char-
ter schools in the county. The similar chart for FY 2013 is also included below.
Guadalupe County -- FY 2013 Public School Support General Fund OGAS Allocation Percentage for FY 2013 32.00%
DISTRICT 2012-2013 Program
Costs ($1,000)
% In
county
County Total
($1,000)
OGAS Supported
($1,000) # Charters
All Charter Schools $157,189 $50,300 95
Guadalupe County Charters $0 100% $0 $0 0
School Districts
Santa Rosa $5,612 100% $5,612 $1,796
Vaughn $1,379 100% $1,379 $441
Guadalupe County Total $6,991 $6,991 $2,237
Statewide Dist. Total $2,110,188 $675,260

Oil and Natural Gas Production in New Mexico -- County Information Project March 2015
– 145 –
Guadalupe County -- FY 2014 Public School Support General Fund OGAS Allocation Percentage for FY 2014 35.1%
DISTRICT Operating Budgets
($1,000)
% In
county
County Total
($1,000)
OGAS Supported
($1,000) # Charters
All Charter Schools $165,338 $58,034 97
State Charter Schools $95,212 $33,419 57
District Charter Schools $70,126 $24,614 40
Guadalupe County Charters
School Districts
Santa Rosa $5,890 95% $5,596 $1,964
Vaughn $1,593 50% $797 $280
Guadalupe County Total $7,484 $6,392 $2,244
Statewide Dist. Total $2,190,353 $768,814
Guadalupe County Higher Education Institutions
Fiscal Year Institution Total Approp
($1,000)
OGAS Amount
($1,000)
FY 2012 LUNA CC Springer NSA NSA
FY 2013 LUNA CC Springer NSA NSA
FY 2014 LUNA CC Springer NSA NSA Note: "NSA" means "not separately appropriated". Typically, a non-appropriated
branch institution is appropriated and budgeted with the parent institution.
9. The oil and natural gas production industry also supports the lion's share of state-authorized and funded capital outlay projects whether sup-
ported by severance tax bonds or via general fund appropriations. All counties benefit from this funding. In addition to the somewhat regular
capital outlay detailed here, the state has also established a water trust fund that receives an annual tranche of 10% of the amount of sever-
ance tax bonds. There is also a tribal projects permanent fund and a Colonias project fund that get an annual tranche of a percentage of sever-
ance tax bonds. Details on these special funds are provided only for FY 2014. For this purpose, oil and natural gas production provide 95% of
severance tax bond funding and 30.0% of general fund appropriations.
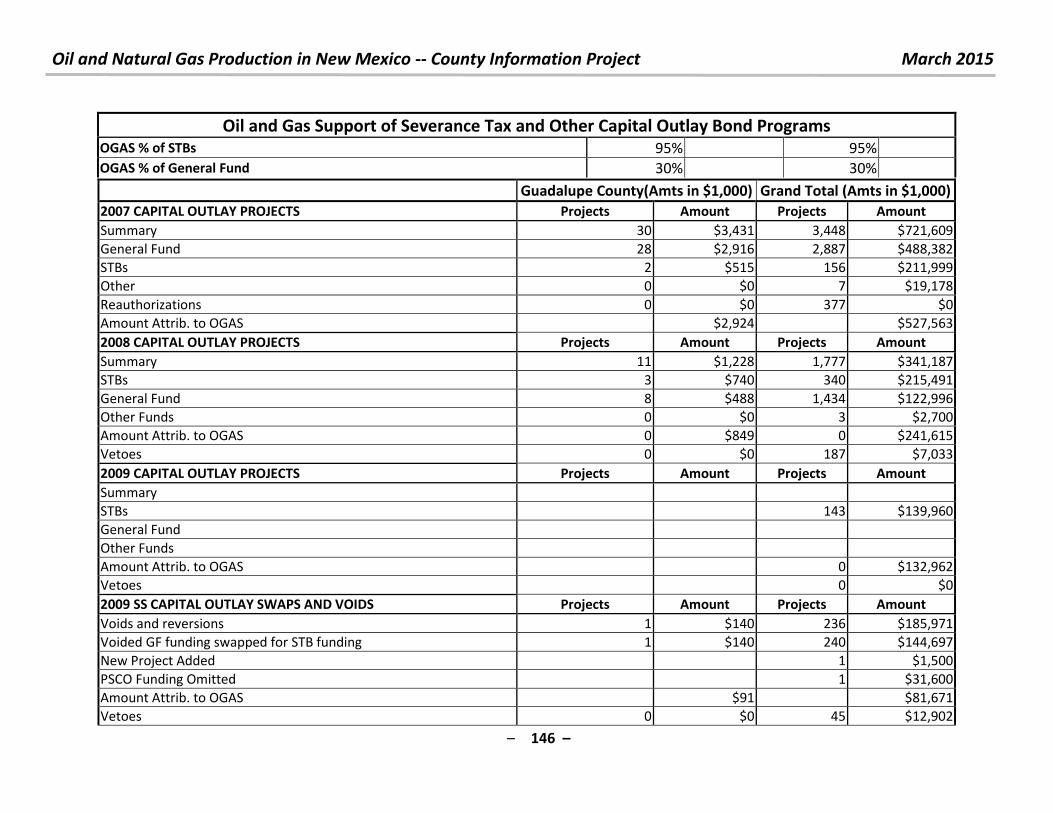
Oil and Natural Gas Production in New Mexico -- County Information Project March 2015
– 146 –
Oil and Gas Support of Severance Tax and Other Capital Outlay Bond Programs OGAS % of STBs 95% 95%
OGAS % of General Fund 30% 30%
Guadalupe County(Amts in $1,000) Grand Total (Amts in $1,000)
2007 CAPITAL OUTLAY PROJECTS Projects Amount Projects Amount
Summary 30 $3,431 3,448 $721,609
General Fund 28 $2,916 2,887 $488,382
STBs 2 $515 156 $211,999
Other 0 $0 7 $19,178
Reauthorizations 0 $0 377 $0
Amount Attrib. to OGAS $2,924 $527,563
2008 CAPITAL OUTLAY PROJECTS Projects Amount Projects Amount
Summary 11 $1,228 1,777 $341,187
STBs 3 $740 340 $215,491
General Fund 8 $488 1,434 $122,996
Other Funds 0 $0 3 $2,700
Amount Attrib. to OGAS 0 $849 0 $241,615
Vetoes 0 $0 187 $7,033
2009 CAPITAL OUTLAY PROJECTS Projects Amount Projects Amount
Summary
STBs 143 $139,960
General Fund
Other Funds
Amount Attrib. to OGAS 0 $132,962
Vetoes 0 $0
2009 SS CAPITAL OUTLAY SWAPS AND VOIDS Projects Amount Projects Amount
Voids and reversions 1 $140 236 $185,971
Voided GF funding swapped for STB funding 1 $140 240 $144,697
New Project Added 1 $1,500
PSCO Funding Omitted 1 $31,600
Amount Attrib. to OGAS $91 $81,671
Vetoes 0 $0 45 $12,902
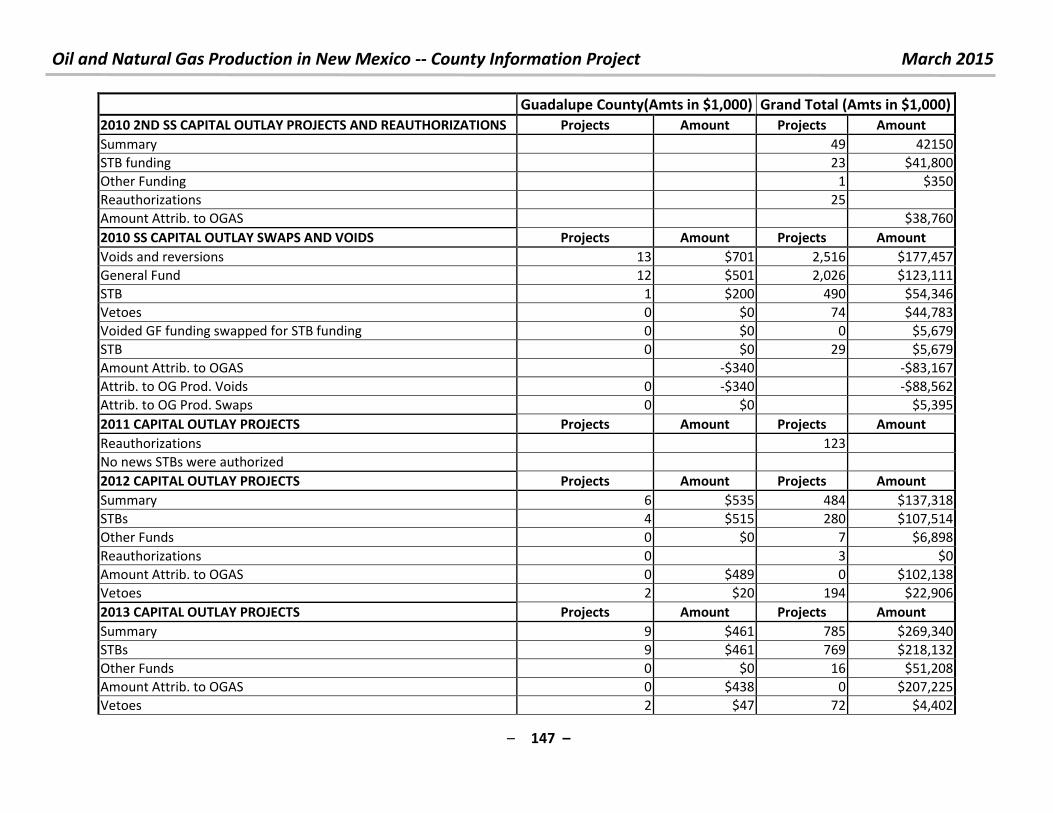
Oil and Natural Gas Production in New Mexico -- County Information Project March 2015
– 147 –
Guadalupe County(Amts in $1,000) Grand Total (Amts in $1,000)
2010 2ND SS CAPITAL OUTLAY PROJECTS AND REAUTHORIZATIONS Projects Amount Projects Amount
Summary 49 42150
STB funding 23 $41,800
Other Funding 1 $350
Reauthorizations 25
Amount Attrib. to OGAS $38,760
2010 SS CAPITAL OUTLAY SWAPS AND VOIDS Projects Amount Projects Amount
Voids and reversions 13 $701 2,516 $177,457
General Fund 12 $501 2,026 $123,111
STB 1 $200 490 $54,346
Vetoes 0 $0 74 $44,783
Voided GF funding swapped for STB funding 0 $0 0 $5,679
STB 0 $0 29 $5,679
Amount Attrib. to OGAS -$340 -$83,167
Attrib. to OG Prod. Voids 0 -$340 -$88,562
Attrib. to OG Prod. Swaps 0 $0 $5,395
2011 CAPITAL OUTLAY PROJECTS Projects Amount Projects Amount
Reauthorizations 123
No news STBs were authorized
2012 CAPITAL OUTLAY PROJECTS Projects Amount Projects Amount
Summary 6 $535 484 $137,318
STBs 4 $515 280 $107,514
Other Funds 0 $0 7 $6,898
Reauthorizations 0 3 $0
Amount Attrib. to OGAS 0 $489 0 $102,138
Vetoes 2 $20 194 $22,906
2013 CAPITAL OUTLAY PROJECTS Projects Amount Projects Amount
Summary 9 $461 785 $269,340
STBs 9 $461 769 $218,132
Other Funds 0 $0 16 $51,208
Amount Attrib. to OGAS 0 $438 0 $207,225
Vetoes 2 $47 72 $4,402
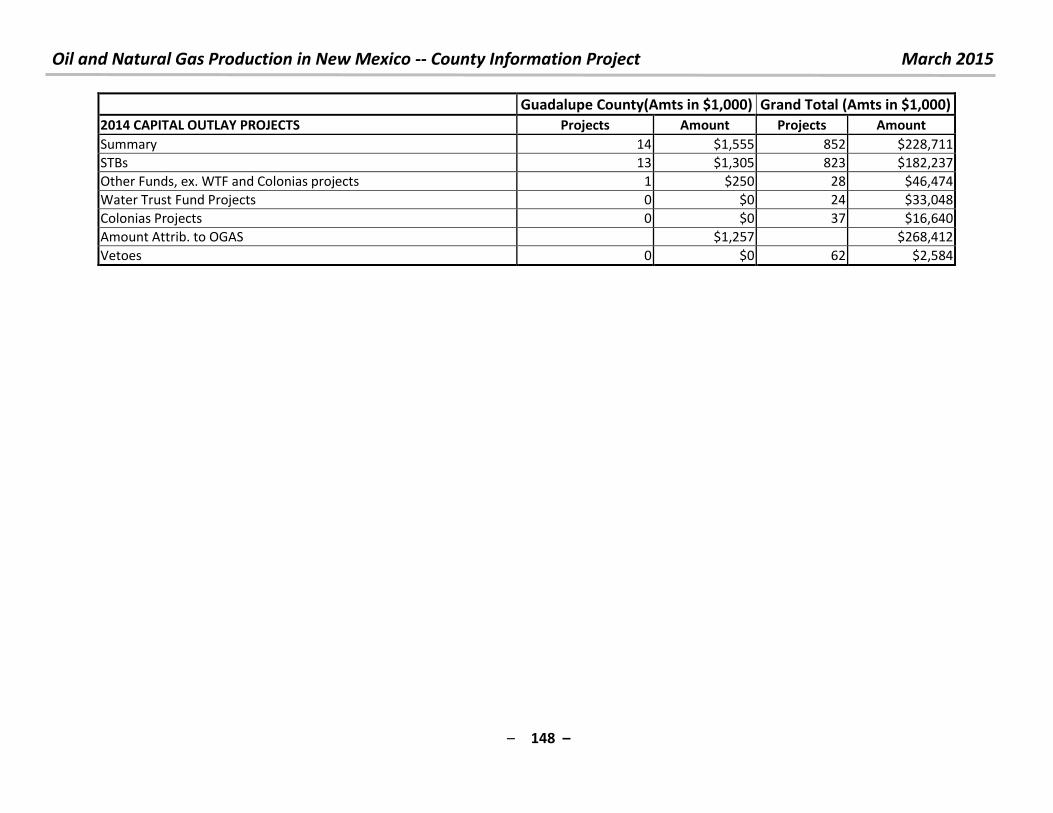
Oil and Natural Gas Production in New Mexico -- County Information Project March 2015
– 148 –
Guadalupe County(Amts in $1,000) Grand Total (Amts in $1,000)
2014 CAPITAL OUTLAY PROJECTS Projects Amount Projects Amount
Summary 14 $1,555 852 $228,711
STBs 13 $1,305 823 $182,237
Other Funds, ex. WTF and Colonias projects 1 $250 28 $46,474
Water Trust Fund Projects 0 $0 24 $33,048
Colonias Projects 0 $0 37 $16,640
Amount Attrib. to OGAS $1,257 $268,412
Vetoes 0 $0 62 $2,584
Oil and Natural Gas Production in New Mexico -- County Information Project March 2015
– 149 –
10. For questions, comments or criticisms of this work, contact:
Laird Graeser
505 424-9023
or
Richard L. Anklam, President & Executive Director, New Mexico Tax Research Institute
505-269-6791
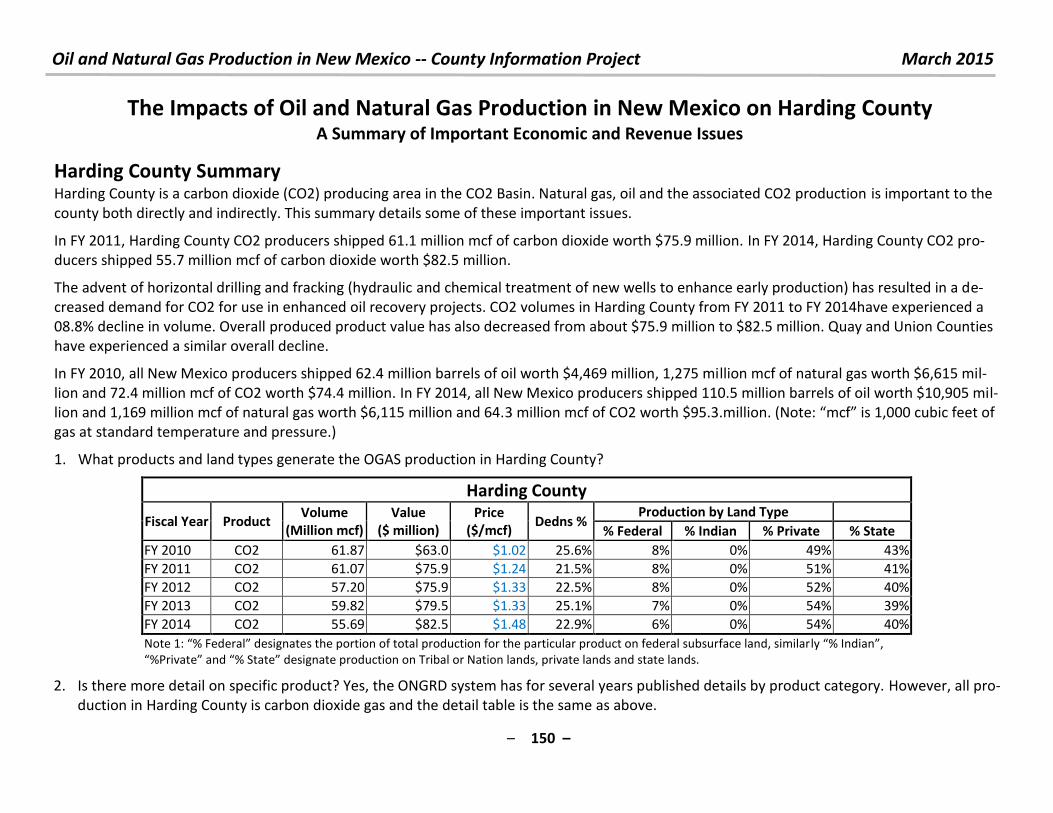
Oil and Natural Gas Production in New Mexico -- County Information Project March 2015
– 150 –
The Impacts of Oil and Natural Gas Production in New Mexico on Harding County A Summary of Important Economic and Revenue Issues
Harding County Summary Harding County is a carbon dioxide (CO2) producing area in the CO2 Basin. Natural gas, oil and the associated CO2 production is important to the
county both directly and indirectly. This summary details some of these important issues.
In FY 2011, Harding County CO2 producers shipped 61.1 million mcf of carbon dioxide worth $75.9 million. In FY 2014, Harding County CO2 pro-
ducers shipped 55.7 million mcf of carbon dioxide worth $82.5 million.
The advent of horizontal drilling and fracking (hydraulic and chemical treatment of new wells to enhance early production) has resulted in a de-
creased demand for CO2 for use in enhanced oil recovery projects. CO2 volumes in Harding County from FY 2011 to FY 2014have experienced a
08.8% decline in volume. Overall produced product value has also decreased from about $75.9 million to $82.5 million. Quay and Union Counties
have experienced a similar overall decline.
In FY 2010, all New Mexico producers shipped 62.4 million barrels of oil worth $4,469 million, 1,275 million mcf of natural gas worth $6,615 mil-
lion and 72.4 million mcf of CO2 worth $74.4 million. In FY 2014, all New Mexico producers shipped 110.5 million barrels of oil worth $10,905 mil-
lion and 1,169 million mcf of natural gas worth $6,115 million and 64.3 million mcf of CO2 worth $ . . illio . Note: f is , u i feet of gas at standard temperature and pressure.)
1. What products and land types generate the OGAS production in Harding County?
Harding County
Fiscal Year Product Volume
(Million mcf)
Value
($ million)
Price
($/mcf) Dedns %
Production by Land Type
% Federal % Indian % Private % State
FY 2010 CO2 61.87 $63.0 $1.02 25.6% 8% 0% 49% 43%
FY 2011 CO2 61.07 $75.9 $1.24 21.5% 8% 0% 51% 41%
FY 2012 CO2 57.20 $75.9 $1.33 22.5% 8% 0% 52% 40%
FY 2013 CO2 59.82 $79.5 $1.33 25.1% 7% 0% 54% 39%
FY 2014 CO2 55.69 $82.5 $1.48 22.9% 6% 0% 54% 40%
Note : % Fede al desig ates the po tio of total p odu tio fo the pa ti ula p odu t o fede al su su fa e la d, si ila l % I dia , %P i ate a d % “tate desig ate p odu tio o T i al o Natio la ds, p i ate la ds a d state la ds.
2. Is there more detail on specific product? Yes, the ONGRD system has for several years published details by product category. However, all pro-
duction in Harding County is carbon dioxide gas and the detail table is the same as above.
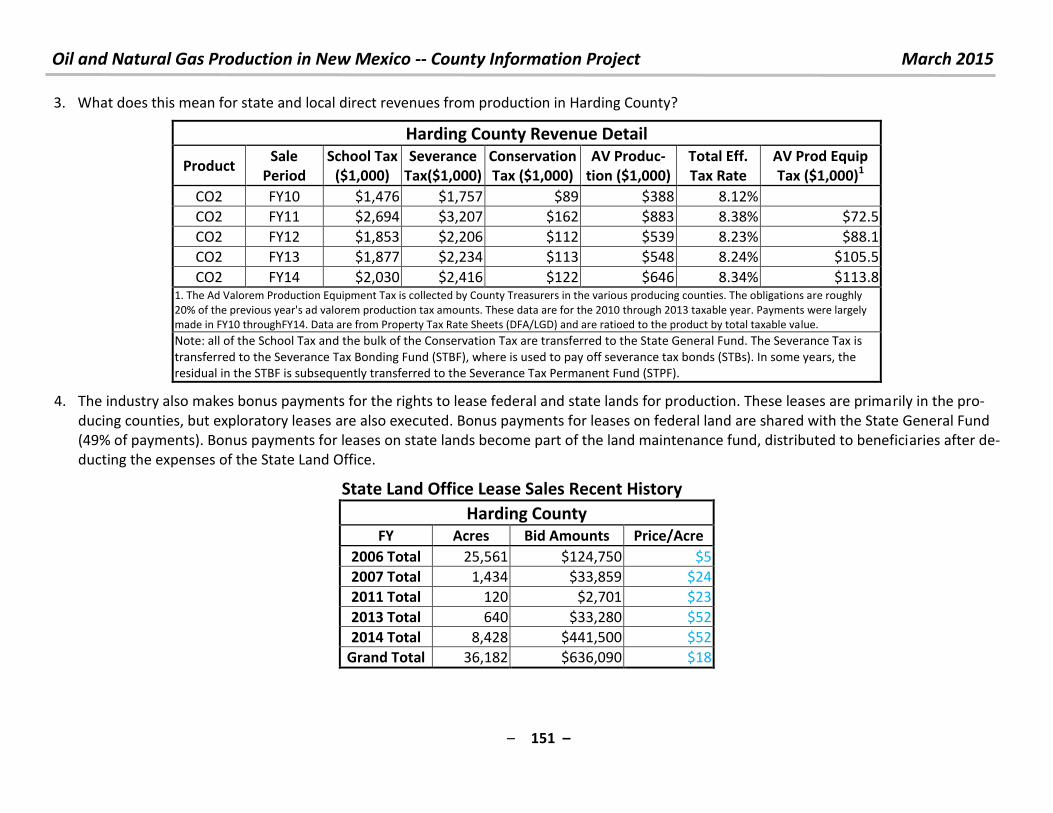
Oil and Natural Gas Production in New Mexico -- County Information Project March 2015
– 151 –
3. What does this mean for state and local direct revenues from production in Harding County?
Harding County Revenue Detail
Product Sale
Period
School Tax
($1,000)
Severance
Tax($1,000)
Conservation
Tax ($1,000)
AV Produc-
tion ($1,000)
Total Eff.
Tax Rate
AV Prod Equip
Tax ($1,000)1
CO2 FY10 $1,476 $1,757 $89 $388 8.12%
CO2 FY11 $2,694 $3,207 $162 $883 8.38% $72.5
CO2 FY12 $1,853 $2,206 $112 $539 8.23% $88.1
CO2 FY13 $1,877 $2,234 $113 $548 8.24% $105.5
CO2 FY14 $2,030 $2,416 $122 $646 8.34% $113.8 1. The Ad Valorem Production Equipment Tax is collected by County Treasurers in the various producing counties. The obligations are roughly
20% of the previous year's ad valorem production tax amounts. These data are for the 2010 through 2013 taxable year. Payments were largely
made in FY10 throughFY14. Data are from Property Tax Rate Sheets (DFA/LGD) and are ratioed to the product by total taxable value.
Note: all of the School Tax and the bulk of the Conservation Tax are transferred to the State General Fund. The Severance Tax is
transferred to the Severance Tax Bonding Fund (STBF), where is used to pay off severance tax bonds (STBs). In some years, the
residual in the STBF is subsequently transferred to the Severance Tax Permanent Fund (STPF).
4. The industry also makes bonus payments for the rights to lease federal and state lands for production. These leases are primarily in the pro-
ducing counties, but exploratory leases are also executed. Bonus payments for leases on federal land are shared with the State General Fund
(49% of payments). Bonus payments for leases on state lands become part of the land maintenance fund, distributed to beneficiaries after de-
ducting the expenses of the State Land Office.
State Land Office Lease Sales Recent History
Harding County FY Acres Bid Amounts Price/Acre
2006 Total 25,561 $124,750 $5
2007 Total 1,434 $33,859 $24
2011 Total 120 $2,701 $23
2013 Total 640 $33,280 $52
2014 Total 8,428 $441,500 $52
Grand Total 36,182 $636,090 $18
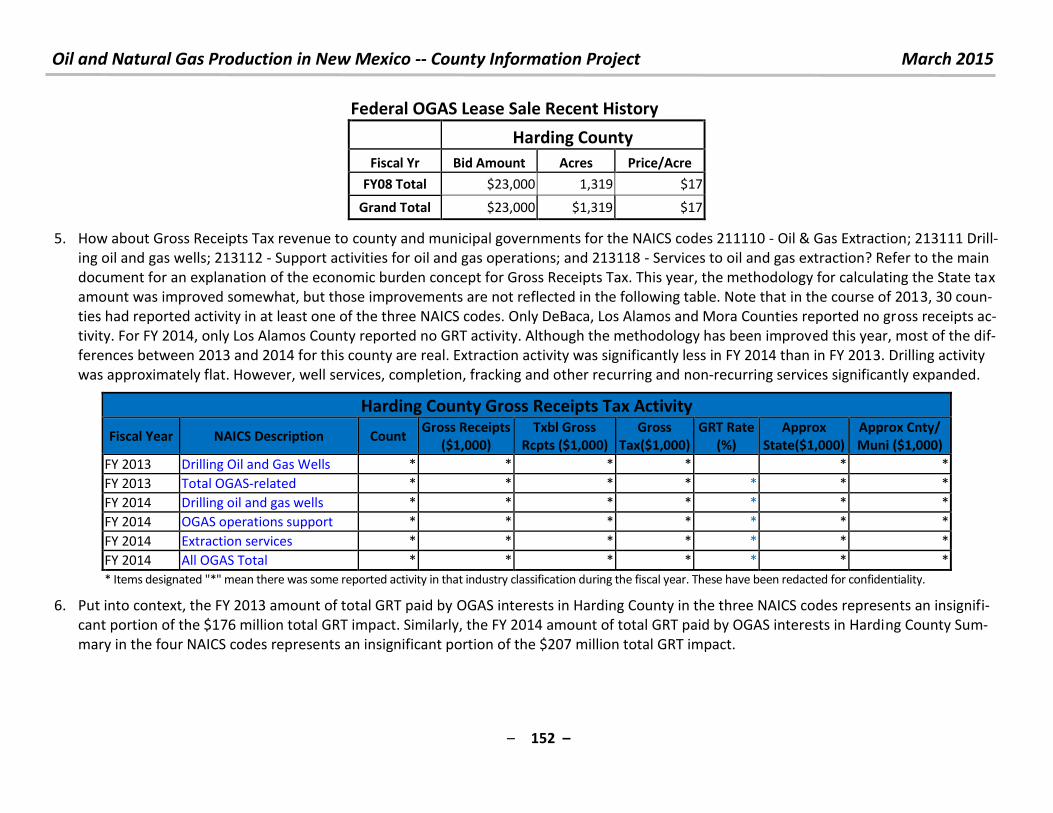
Oil and Natural Gas Production in New Mexico -- County Information Project March 2015
– 152 –
Federal OGAS Lease Sale Recent History
Harding County
Fiscal Yr Bid Amount Acres Price/Acre
FY08 Total $23,000 1,319 $17
Grand Total $23,000 $1,319 $17
5. How about Gross Receipts Tax revenue to county and municipal governments for the NAICS codes 211110 - Oil & Gas Extraction; 213111 Drill-
ing oil and gas wells; 213112 - Support activities for oil and gas operations; and 213118 - Services to oil and gas extraction? Refer to the main
document for an explanation of the economic burden concept for Gross Receipts Tax. This year, the methodology for calculating the State tax
amount was improved somewhat, but those improvements are not reflected in the following table. Note that in the course of 2013, 30 coun-
ties had reported activity in at least one of the three NAICS codes. Only DeBaca, Los Alamos and Mora Counties reported no gross receipts ac-
tivity. For FY 2014, only Los Alamos County reported no GRT activity. Although the methodology has been improved this year, most of the dif-
ferences between 2013 and 2014 for this county are real. Extraction activity was significantly less in FY 2014 than in FY 2013. Drilling activity
was approximately flat. However, well services, completion, fracking and other recurring and non-recurring services significantly expanded.
Harding County Gross Receipts Tax Activity
Fiscal Year NAICS Description Count Gross Receipts
($1,000)
Txbl Gross
Rcpts ($1,000)
Gross
Tax($1,000)
GRT Rate
(%)
Approx
State($1,000)
Approx Cnty/
Muni ($1,000)
FY 2013 Drilling Oil and Gas Wells * * * * * *
FY 2013 Total OGAS-related * * * * * * *
FY 2014 Drilling oil and gas wells * * * * * * *
FY 2014 OGAS operations support * * * * * * *
FY 2014 Extraction services * * * * * * *
FY 2014 All OGAS Total * * * * * * *
* Items designated "*" mean there was some reported activity in that industry classification during the fiscal year. These have been redacted for confidentiality.
6. Put into context, the FY 2013 amount of total GRT paid by OGAS interests in Harding County in the three NAICS codes represents an insignifi-
cant portion of the $176 million total GRT impact. Similarly, the FY 2014 amount of total GRT paid by OGAS interests in Harding County Sum-
mary in the four NAICS codes represents an insignificant portion of the $207 million total GRT impact.
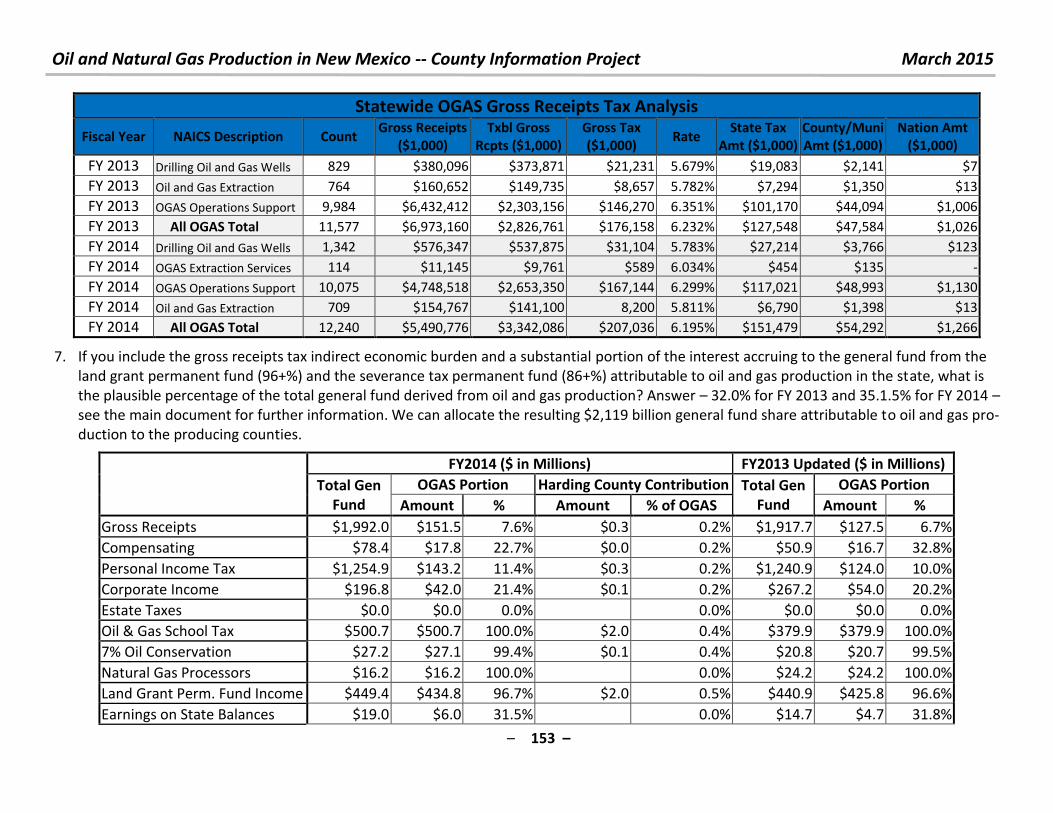
Oil and Natural Gas Production in New Mexico -- County Information Project March 2015
– 153 –
Statewide OGAS Gross Receipts Tax Analysis
Fiscal Year NAICS Description Count Gross Receipts
($1,000)
Txbl Gross
Rcpts ($1,000)
Gross Tax
($1,000) Rate
State Tax
Amt ($1,000)
County/Muni
Amt ($1,000)
Nation Amt
($1,000)
FY 2013 Drilling Oil and Gas Wells 829 $380,096 $373,871 $21,231 5.679% $19,083 $2,141 $7
FY 2013 Oil and Gas Extraction 764 $160,652 $149,735 $8,657 5.782% $7,294 $1,350 $13
FY 2013 OGAS Operations Support 9,984 $6,432,412 $2,303,156 $146,270 6.351% $101,170 $44,094 $1,006
FY 2013 All OGAS Total 11,577 $6,973,160 $2,826,761 $176,158 6.232% $127,548 $47,584 $1,026
FY 2014 Drilling Oil and Gas Wells 1,342 $576,347 $537,875 $31,104 5.783% $27,214 $3,766 $123
FY 2014 OGAS Extraction Services 114 $11,145 $9,761 $589 6.034% $454 $135 -
FY 2014 OGAS Operations Support 10,075 $4,748,518 $2,653,350 $167,144 6.299% $117,021 $48,993 $1,130
FY 2014 Oil and Gas Extraction 709 $154,767 $141,100 8,200 5.811% $6,790 $1,398 $13
FY 2014 All OGAS Total 12,240 $5,490,776 $3,342,086 $207,036 6.195% $151,479 $54,292 $1,266
7. If you include the gross receipts tax indirect economic burden and a substantial portion of the interest accruing to the general fund from the
land grant permanent fund (96+%) and the severance tax permanent fund (86+%) attributable to oil and gas production in the state, what is
the plausible percentage of the total general fund derived from oil and gas production? Answer – 32.0% for FY 2013 and 35.1.5% for FY 2014 –
see the main document for further information. We can allocate the resulting $2,119 billion general fund share attributable to oil and gas pro-
duction to the producing counties.
FY2014 ($ in Millions) FY2013 Updated ($ in Millions)
Total Gen
Fund
OGAS Portion Harding County Contribution Total Gen
Fund
OGAS Portion
Amount % Amount % of OGAS Amount %
Gross Receipts $1,992.0 $151.5 7.6% $0.3 0.2% $1,917.7 $127.5 6.7%
Compensating $78.4 $17.8 22.7% $0.0 0.2% $50.9 $16.7 32.8%
Personal Income Tax $1,254.9 $143.2 11.4% $0.3 0.2% $1,240.9 $124.0 10.0%
Corporate Income $196.8 $42.0 21.4% $0.1 0.2% $267.2 $54.0 20.2%
Estate Taxes $0.0 $0.0 0.0% 0.0% $0.0 $0.0 0.0%
Oil & Gas School Tax $500.7 $500.7 100.0% $2.0 0.4% $379.9 $379.9 100.0%
7% Oil Conservation $27.2 $27.1 99.4% $0.1 0.4% $20.8 $20.7 99.5%
Natural Gas Processors $16.2 $16.2 100.0% 0.0% $24.2 $24.2 100.0%
Land Grant Perm. Fund Income $449.4 $434.8 96.7% $2.0 0.5% $440.9 $425.8 96.6%
Earnings on State Balances $19.0 $6.0 31.5% 0.0% $14.7 $4.7 31.8%
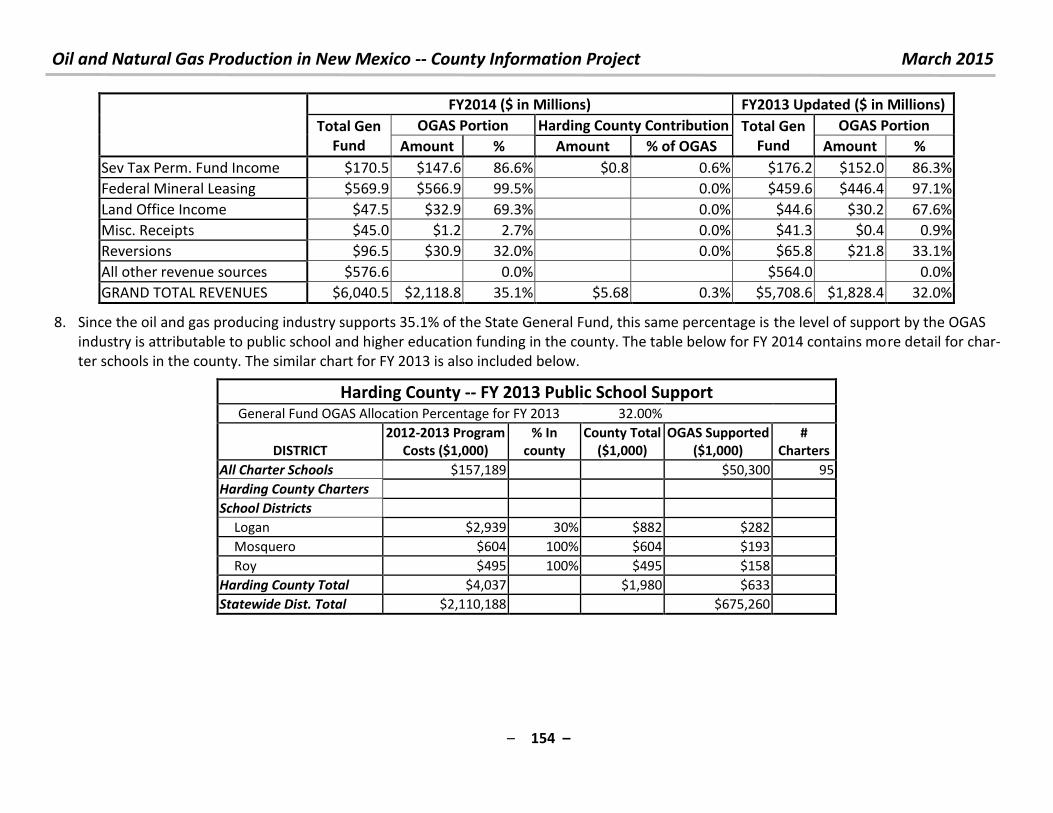
Oil and Natural Gas Production in New Mexico -- County Information Project March 2015
– 154 –
FY2014 ($ in Millions) FY2013 Updated ($ in Millions)
Total Gen
Fund
OGAS Portion Harding County Contribution Total Gen
Fund
OGAS Portion
Amount % Amount % of OGAS Amount %
Sev Tax Perm. Fund Income $170.5 $147.6 86.6% $0.8 0.6% $176.2 $152.0 86.3%
Federal Mineral Leasing $569.9 $566.9 99.5% 0.0% $459.6 $446.4 97.1%
Land Office Income $47.5 $32.9 69.3% 0.0% $44.6 $30.2 67.6%
Misc. Receipts $45.0 $1.2 2.7% 0.0% $41.3 $0.4 0.9%
Reversions $96.5 $30.9 32.0% 0.0% $65.8 $21.8 33.1%
All other revenue sources $576.6 0.0% $564.0 0.0%
GRAND TOTAL REVENUES $6,040.5 $2,118.8 35.1% $5.68 0.3% $5,708.6 $1,828.4 32.0%
8. Since the oil and gas producing industry supports 35.1% of the State General Fund, this same percentage is the level of support by the OGAS
industry is attributable to public school and higher education funding in the county. The table below for FY 2014 contains more detail for char-
ter schools in the county. The similar chart for FY 2013 is also included below.
Harding County -- FY 2013 Public School Support General Fund OGAS Allocation Percentage for FY 2013 32.00%
DISTRICT
2012-2013 Program
Costs ($1,000)
% In
county
County Total
($1,000)
OGAS Supported
($1,000)
#
Charters
All Charter Schools $157,189
$50,300 95
Harding County Charters
School Districts
Logan $2,939 30% $882 $282
Mosquero $604 100% $604 $193
Roy $495 100% $495 $158
Harding County Total $4,037
$1,980 $633
Statewide Dist. Total $2,110,188
$675,260
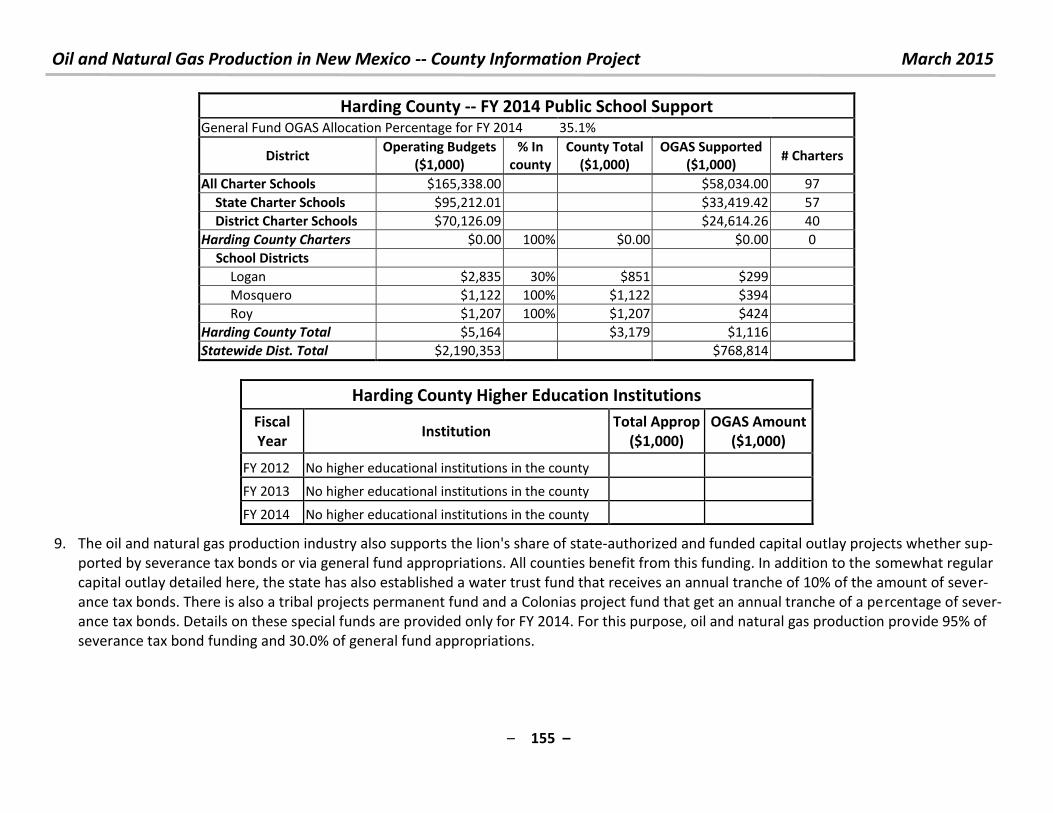
Oil and Natural Gas Production in New Mexico -- County Information Project March 2015
– 155 –
Harding County -- FY 2014 Public School Support General Fund OGAS Allocation Percentage for FY 2014 35.1%
District Operating Budgets
($1,000)
% In
county
County Total
($1,000)
OGAS Supported
($1,000) # Charters
All Charter Schools $165,338.00 $58,034.00 97
State Charter Schools $95,212.01 $33,419.42 57
District Charter Schools $70,126.09 $24,614.26 40
Harding County Charters $0.00 100% $0.00 $0.00 0
School Districts
Logan $2,835 30% $851 $299
Mosquero $1,122 100% $1,122 $394
Roy $1,207 100% $1,207 $424
Harding County Total $5,164 $3,179 $1,116
Statewide Dist. Total $2,190,353 $768,814
Harding County Higher Education Institutions
Fiscal
Year Institution
Total Approp
($1,000)
OGAS Amount
($1,000)
FY 2012 No higher educational institutions in the county
FY 2013 No higher educational institutions in the county
FY 2014 No higher educational institutions in the county
9. The oil and natural gas production industry also supports the lion's share of state-authorized and funded capital outlay projects whether sup-
ported by severance tax bonds or via general fund appropriations. All counties benefit from this funding. In addition to the somewhat regular
capital outlay detailed here, the state has also established a water trust fund that receives an annual tranche of 10% of the amount of sever-
ance tax bonds. There is also a tribal projects permanent fund and a Colonias project fund that get an annual tranche of a percentage of sever-
ance tax bonds. Details on these special funds are provided only for FY 2014. For this purpose, oil and natural gas production provide 95% of
severance tax bond funding and 30.0% of general fund appropriations.
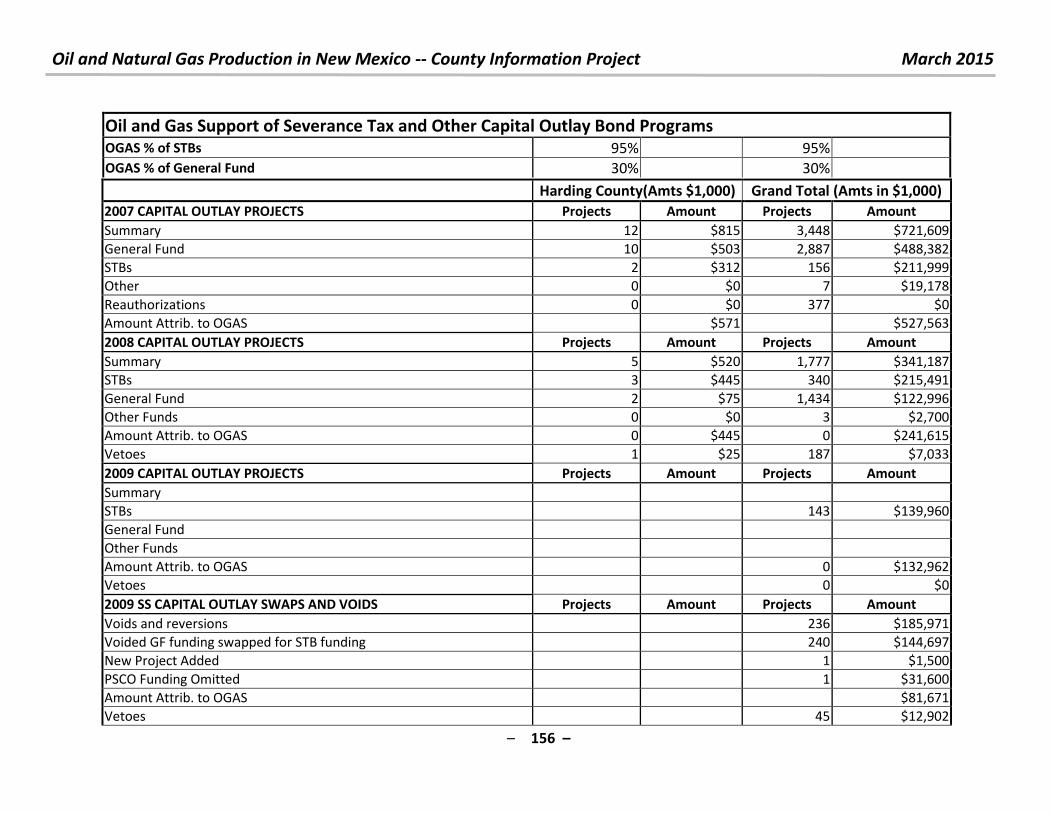
Oil and Natural Gas Production in New Mexico -- County Information Project March 2015
– 156 –
Oil and Gas Support of Severance Tax and Other Capital Outlay Bond Programs OGAS % of STBs 95% 95%
OGAS % of General Fund 30% 30%
Harding County(Amts $1,000) Grand Total (Amts in $1,000)
2007 CAPITAL OUTLAY PROJECTS Projects Amount Projects Amount
Summary 12 $815 3,448 $721,609
General Fund 10 $503 2,887 $488,382
STBs 2 $312 156 $211,999
Other 0 $0 7 $19,178
Reauthorizations 0 $0 377 $0
Amount Attrib. to OGAS $571 $527,563
2008 CAPITAL OUTLAY PROJECTS Projects Amount Projects Amount
Summary 5 $520 1,777 $341,187
STBs 3 $445 340 $215,491
General Fund 2 $75 1,434 $122,996
Other Funds 0 $0 3 $2,700
Amount Attrib. to OGAS 0 $445 0 $241,615
Vetoes 1 $25 187 $7,033
2009 CAPITAL OUTLAY PROJECTS Projects Amount Projects Amount
Summary
STBs 143 $139,960
General Fund
Other Funds
Amount Attrib. to OGAS 0 $132,962
Vetoes 0 $0
2009 SS CAPITAL OUTLAY SWAPS AND VOIDS Projects Amount Projects Amount
Voids and reversions 236 $185,971
Voided GF funding swapped for STB funding 240 $144,697
New Project Added 1 $1,500
PSCO Funding Omitted 1 $31,600
Amount Attrib. to OGAS $81,671
Vetoes 45 $12,902

Oil and Natural Gas Production in New Mexico -- County Information Project March 2015
– 157 –
Harding County(Amts $1,000) Grand Total (Amts in $1,000)
2010 2ND SS CAPITAL OUTLAY PROJECTS AND REAUTHORIZATIONS Projects Amount Projects Amount
Summary 49 42150
STB funding 23 $41,800
Other Funding 1 $350
Reauthorizations 25
Amount Attrib. to OGAS $38,760
2010 SS CAPITAL OUTLAY SWAPS AND VOIDS Projects Amount Projects Amount
Voids and reversions 2 $13 2,516 $177,457
General Fund 1 $3 2,026 $123,111
STB 1 $10 490 $54,346
Vetoes 0 $0 74 $44,783
Voided GF funding swapped for STB funding 0 $0 0 $5,679
STB 0 $0 29 $5,679
Amount Attrib. to OGAS -$10 -$83,167
Attrib. to OG Prod. Voids 0 -$10 -$88,562
Attrib. to OG Prod. Swaps 0 $0 $5,395
2011 CAPITAL OUTLAY PROJECTS Projects Amount Projects Amount
Reauthorizations 123
No news STBs were authorized
2012 CAPITAL OUTLAY PROJECTS Projects Amount Projects Amount
Summary 2 $110 484 $137,318
STBs 2 $110 280 $107,514
Other Funds 0 $0 7 $6,898
Reauthorizations 0 3 $0
Amount Attrib. to OGAS 0 $105 0 $102,138
Vetoes 0 $0 194 $22,906
2013 CAPITAL OUTLAY PROJECTS Projects Amount Projects Amount
Summary 1 $256 785 $269,340
STBs 1 $256 769 $218,132
Other Funds 0 $0 16 $51,208
Amount Attrib. to OGAS 0 $243 0 $207,225
Vetoes 0 $0 72 $4,402
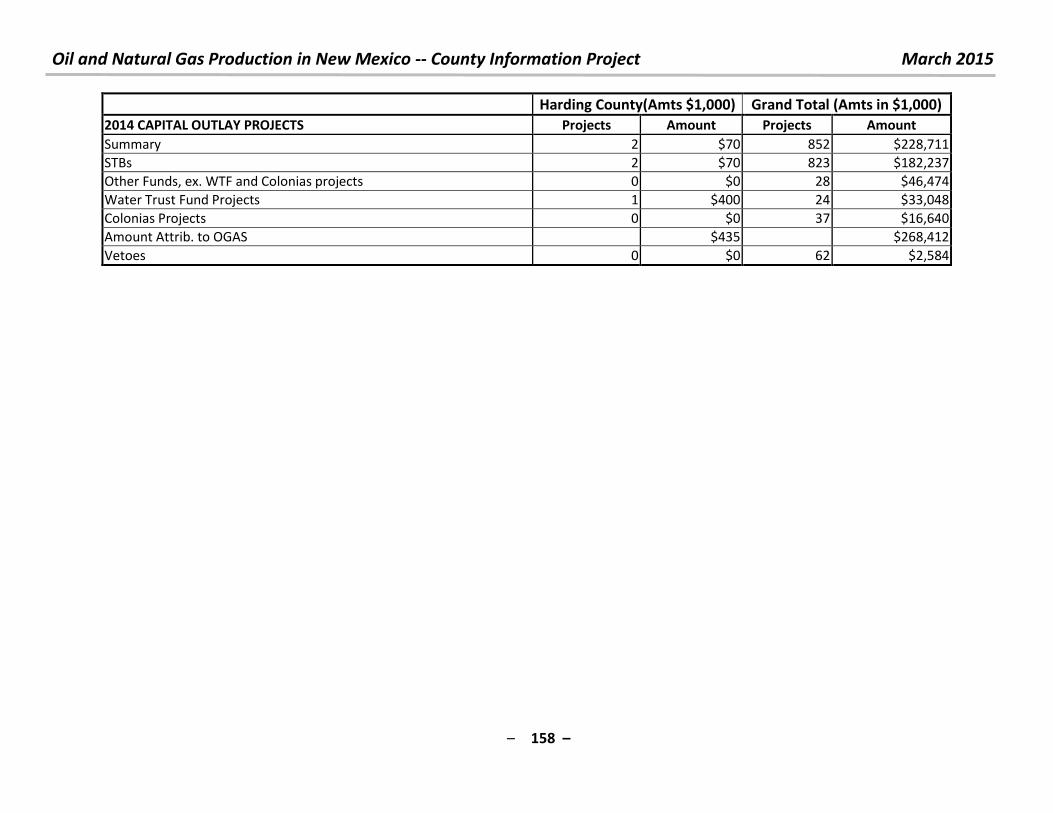
Oil and Natural Gas Production in New Mexico -- County Information Project March 2015
– 158 –
Harding County(Amts $1,000) Grand Total (Amts in $1,000)
2014 CAPITAL OUTLAY PROJECTS Projects Amount Projects Amount
Summary 2 $70 852 $228,711
STBs 2 $70 823 $182,237
Other Funds, ex. WTF and Colonias projects 0 $0 28 $46,474
Water Trust Fund Projects 1 $400 24 $33,048
Colonias Projects 0 $0 37 $16,640
Amount Attrib. to OGAS $435 $268,412
Vetoes 0 $0 62 $2,584

Oil and Natural Gas Production in New Mexico -- County Information Project March 2015
– 159 –
10. For questions, comments or criticisms of this work, contact:
Laird Graeser
505 424-9023
or
Richard L. Anklam, President & Executive Director, New Mexico Tax Research Institute
505-269-6791
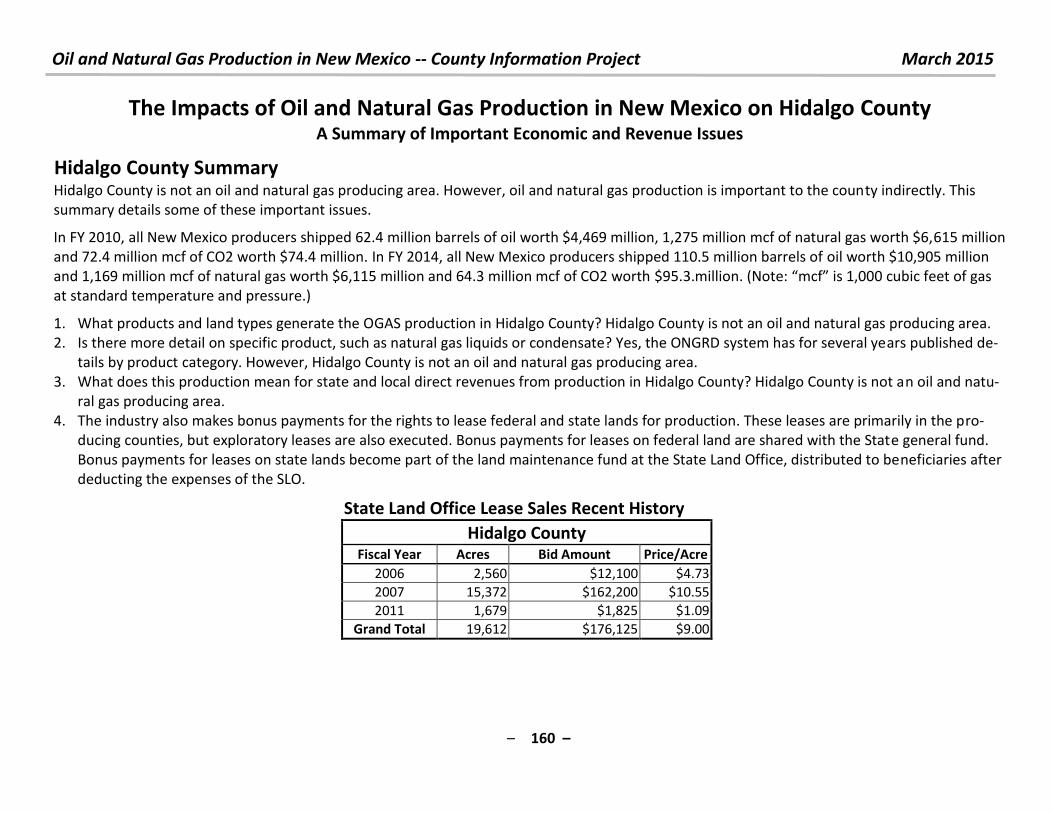
Oil and Natural Gas Production in New Mexico -- County Information Project March 2015
– 160 –
The Impacts of Oil and Natural Gas Production in New Mexico on Hidalgo County A Summary of Important Economic and Revenue Issues
Hidalgo County Summary
Hidalgo County is not an oil and natural gas producing area. However, oil and natural gas production is important to the county indirectly. This
summary details some of these important issues.
In FY 2010, all New Mexico producers shipped 62.4 million barrels of oil worth $4,469 million, 1,275 million mcf of natural gas worth $6,615 million
and 72.4 million mcf of CO2 worth $74.4 million. In FY 2014, all New Mexico producers shipped 110.5 million barrels of oil worth $10,905 million
and 1,169 million mcf of natural gas worth $6,115 million and 64.3 million mcf of CO2 worth $ . . illio . Note: f is , u i feet of gas at standard temperature and pressure.)
1. What products and land types generate the OGAS production in Hidalgo County? Hidalgo County is not an oil and natural gas producing area.
2. Is there more detail on specific product, such as natural gas liquids or condensate? Yes, the ONGRD system has for several years published de-
tails by product category. However, Hidalgo County is not an oil and natural gas producing area.
3. What does this production mean for state and local direct revenues from production in Hidalgo County? Hidalgo County is not an oil and natu-
ral gas producing area.
4. The industry also makes bonus payments for the rights to lease federal and state lands for production. These leases are primarily in the pro-
ducing counties, but exploratory leases are also executed. Bonus payments for leases on federal land are shared with the State general fund.
Bonus payments for leases on state lands become part of the land maintenance fund at the State Land Office, distributed to beneficiaries after
deducting the expenses of the SLO.
State Land Office Lease Sales Recent History
Hidalgo County Fiscal Year Acres Bid Amount Price/Acre
2006 2,560 $12,100 $4.73
2007 15,372 $162,200 $10.55
2011 1,679 $1,825 $1.09
Grand Total 19,612 $176,125 $9.00
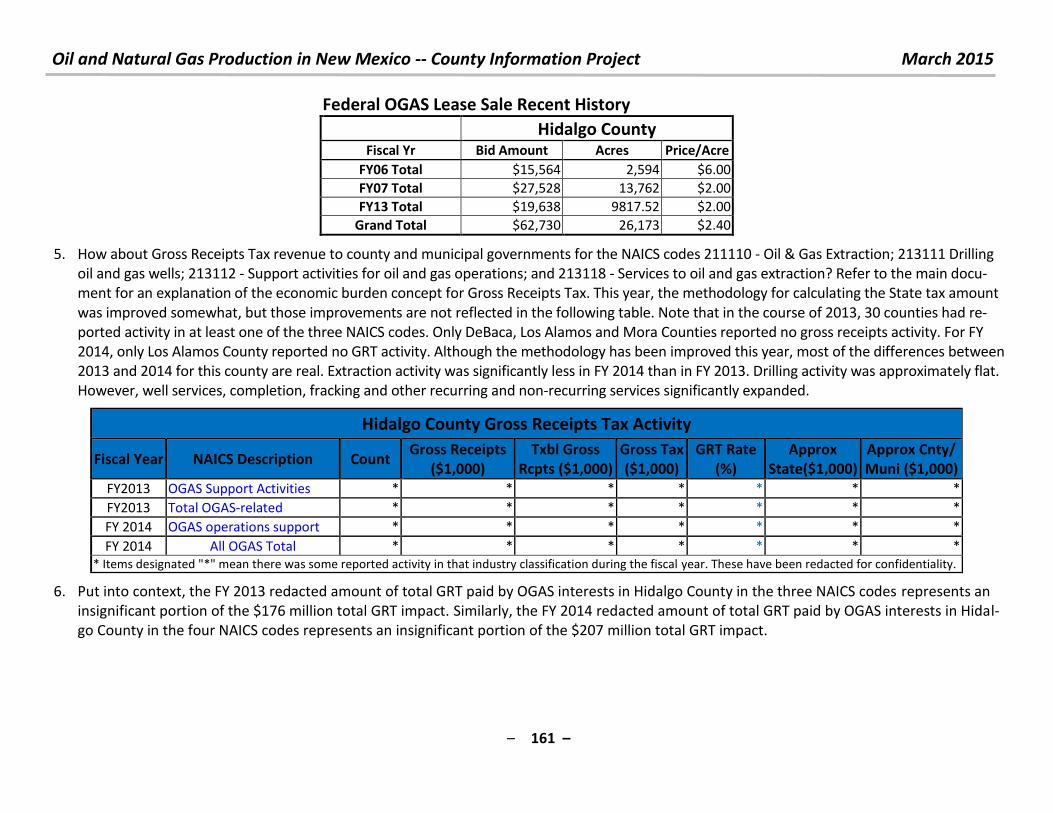
Oil and Natural Gas Production in New Mexico -- County Information Project March 2015
– 161 –
Federal OGAS Lease Sale Recent History
Hidalgo County Fiscal Yr Bid Amount Acres Price/Acre
FY06 Total $15,564 2,594 $6.00
FY07 Total $27,528 13,762 $2.00
FY13 Total $19,638 9817.52 $2.00
Grand Total $62,730 26,173 $2.40
5. How about Gross Receipts Tax revenue to county and municipal governments for the NAICS codes 211110 - Oil & Gas Extraction; 213111 Drilling
oil and gas wells; 213112 - Support activities for oil and gas operations; and 213118 - Services to oil and gas extraction? Refer to the main docu-
ment for an explanation of the economic burden concept for Gross Receipts Tax. This year, the methodology for calculating the State tax amount
was improved somewhat, but those improvements are not reflected in the following table. Note that in the course of 2013, 30 counties had re-
ported activity in at least one of the three NAICS codes. Only DeBaca, Los Alamos and Mora Counties reported no gross receipts activity. For FY
2014, only Los Alamos County reported no GRT activity. Although the methodology has been improved this year, most of the differences between
2013 and 2014 for this county are real. Extraction activity was significantly less in FY 2014 than in FY 2013. Drilling activity was approximately flat.
However, well services, completion, fracking and other recurring and non-recurring services significantly expanded.
Hidalgo County Gross Receipts Tax Activity
Fiscal Year NAICS Description Count Gross Receipts
($1,000)
Txbl Gross
Rcpts ($1,000)
Gross Tax
($1,000)
GRT Rate
(%)
Approx
State($1,000)
Approx Cnty/
Muni ($1,000)
FY2013 OGAS Support Activities * * * * * * *
FY2013 Total OGAS-related * * * * * * *
FY 2014 OGAS operations support * * * * * * *
FY 2014 All OGAS Total * * * * * * *
* Items designated "*" mean there was some reported activity in that industry classification during the fiscal year. These have been redacted for confidentiality.
6. Put into context, the FY 2013 redacted amount of total GRT paid by OGAS interests in Hidalgo County in the three NAICS codes represents an
insignificant portion of the $176 million total GRT impact. Similarly, the FY 2014 redacted amount of total GRT paid by OGAS interests in Hidal-
go County in the four NAICS codes represents an insignificant portion of the $207 million total GRT impact.
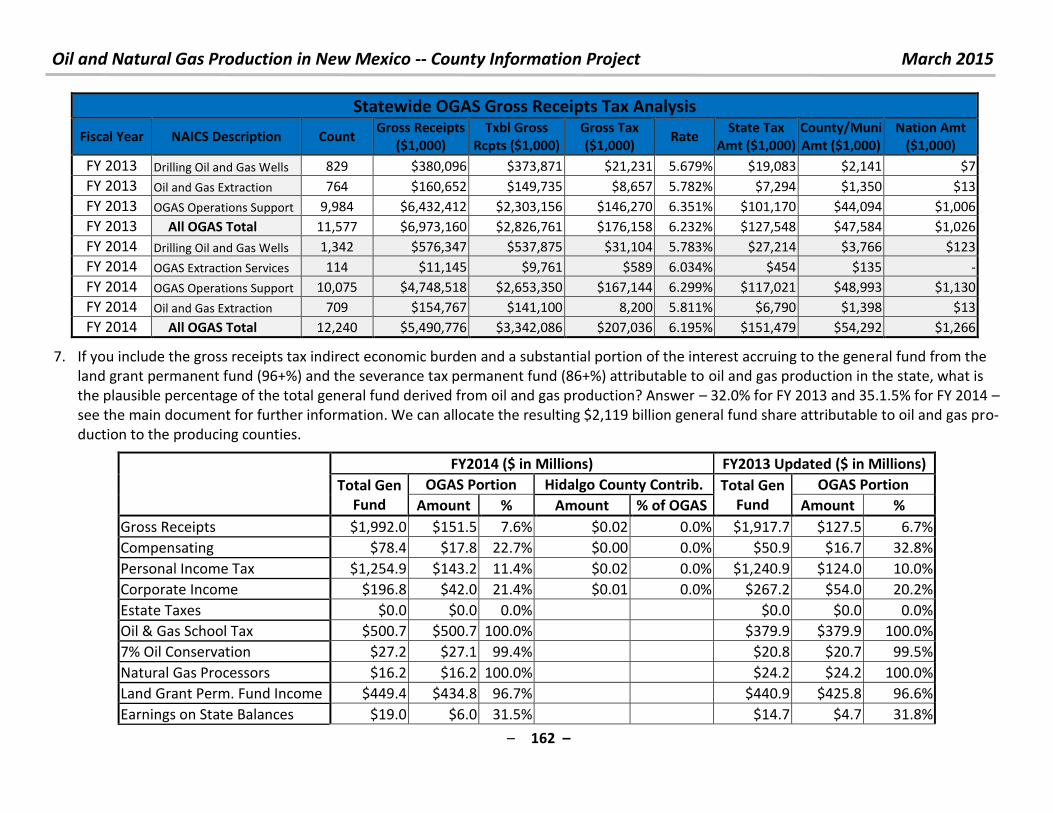
Oil and Natural Gas Production in New Mexico -- County Information Project March 2015
– 162 –
Statewide OGAS Gross Receipts Tax Analysis
Fiscal Year NAICS Description Count Gross Receipts
($1,000)
Txbl Gross
Rcpts ($1,000)
Gross Tax
($1,000) Rate
State Tax
Amt ($1,000)
County/Muni
Amt ($1,000)
Nation Amt
($1,000)
FY 2013 Drilling Oil and Gas Wells 829 $380,096 $373,871 $21,231 5.679% $19,083 $2,141 $7
FY 2013 Oil and Gas Extraction 764 $160,652 $149,735 $8,657 5.782% $7,294 $1,350 $13
FY 2013 OGAS Operations Support 9,984 $6,432,412 $2,303,156 $146,270 6.351% $101,170 $44,094 $1,006
FY 2013 All OGAS Total 11,577 $6,973,160 $2,826,761 $176,158 6.232% $127,548 $47,584 $1,026
FY 2014 Drilling Oil and Gas Wells 1,342 $576,347 $537,875 $31,104 5.783% $27,214 $3,766 $123
FY 2014 OGAS Extraction Services 114 $11,145 $9,761 $589 6.034% $454 $135 -
FY 2014 OGAS Operations Support 10,075 $4,748,518 $2,653,350 $167,144 6.299% $117,021 $48,993 $1,130
FY 2014 Oil and Gas Extraction 709 $154,767 $141,100 8,200 5.811% $6,790 $1,398 $13
FY 2014 All OGAS Total 12,240 $5,490,776 $3,342,086 $207,036 6.195% $151,479 $54,292 $1,266
7. If you include the gross receipts tax indirect economic burden and a substantial portion of the interest accruing to the general fund from the
land grant permanent fund (96+%) and the severance tax permanent fund (86+%) attributable to oil and gas production in the state, what is
the plausible percentage of the total general fund derived from oil and gas production? Answer – 32.0% for FY 2013 and 35.1.5% for FY 2014 –
see the main document for further information. We can allocate the resulting $2,119 billion general fund share attributable to oil and gas pro-
duction to the producing counties.
FY2014 ($ in Millions) FY2013 Updated ($ in Millions)
Total Gen
Fund
OGAS Portion Hidalgo County Contrib. Total Gen
Fund
OGAS Portion
Amount % Amount % of OGAS Amount %
Gross Receipts $1,992.0 $151.5 7.6% $0.02 0.0% $1,917.7 $127.5 6.7%
Compensating $78.4 $17.8 22.7% $0.00 0.0% $50.9 $16.7 32.8%
Personal Income Tax $1,254.9 $143.2 11.4% $0.02 0.0% $1,240.9 $124.0 10.0%
Corporate Income $196.8 $42.0 21.4% $0.01 0.0% $267.2 $54.0 20.2%
Estate Taxes $0.0 $0.0 0.0% $0.0 $0.0 0.0%
Oil & Gas School Tax $500.7 $500.7 100.0% $379.9 $379.9 100.0%
7% Oil Conservation $27.2 $27.1 99.4% $20.8 $20.7 99.5%
Natural Gas Processors $16.2 $16.2 100.0% $24.2 $24.2 100.0%
Land Grant Perm. Fund Income $449.4 $434.8 96.7% $440.9 $425.8 96.6%
Earnings on State Balances $19.0 $6.0 31.5% $14.7 $4.7 31.8%
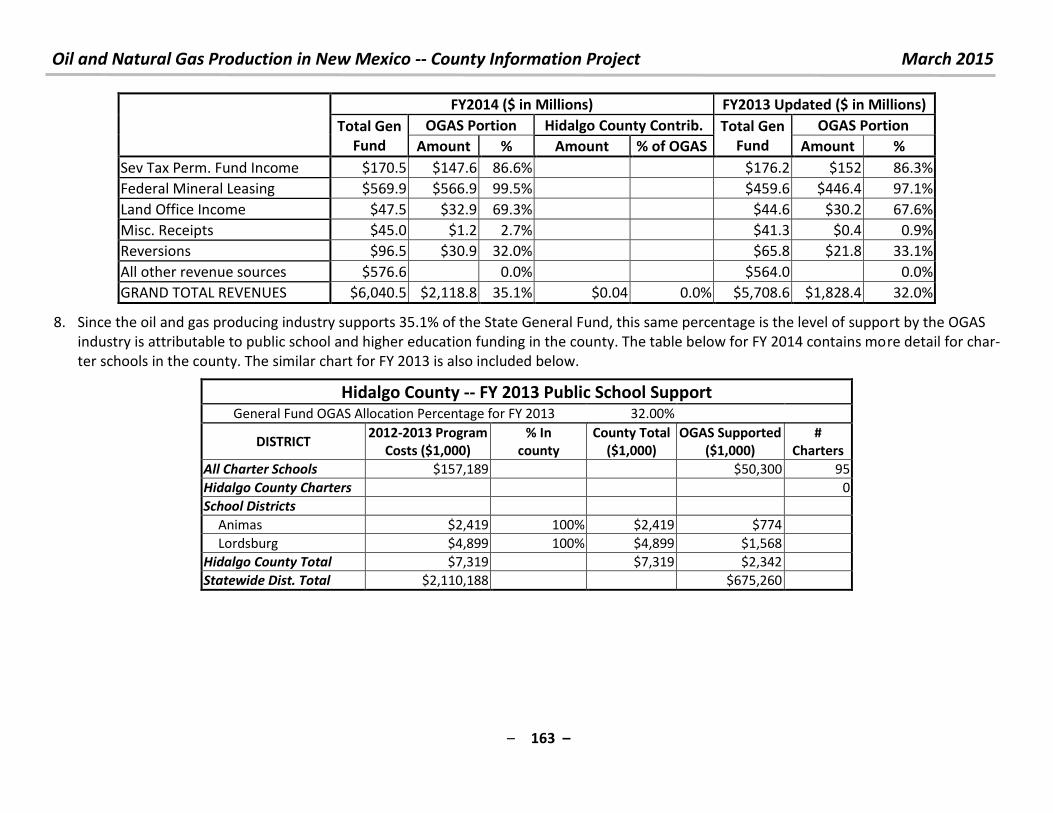
Oil and Natural Gas Production in New Mexico -- County Information Project March 2015
– 163 –
FY2014 ($ in Millions) FY2013 Updated ($ in Millions)
Total Gen
Fund
OGAS Portion Hidalgo County Contrib. Total Gen
Fund
OGAS Portion
Amount % Amount % of OGAS Amount %
Sev Tax Perm. Fund Income $170.5 $147.6 86.6% $176.2 $152 86.3%
Federal Mineral Leasing $569.9 $566.9 99.5% $459.6 $446.4 97.1%
Land Office Income $47.5 $32.9 69.3% $44.6 $30.2 67.6%
Misc. Receipts $45.0 $1.2 2.7% $41.3 $0.4 0.9%
Reversions $96.5 $30.9 32.0% $65.8 $21.8 33.1%
All other revenue sources $576.6 0.0% $564.0
0.0%
GRAND TOTAL REVENUES $6,040.5 $2,118.8 35.1% $0.04 0.0% $5,708.6 $1,828.4 32.0%
8. Since the oil and gas producing industry supports 35.1% of the State General Fund, this same percentage is the level of support by the OGAS
industry is attributable to public school and higher education funding in the county. The table below for FY 2014 contains more detail for char-
ter schools in the county. The similar chart for FY 2013 is also included below.
Hidalgo County -- FY 2013 Public School Support General Fund OGAS Allocation Percentage for FY 2013 32.00%
DISTRICT 2012-2013 Program
Costs ($1,000)
% In
county
County Total
($1,000)
OGAS Supported
($1,000)
#
Charters
All Charter Schools $157,189 $50,300 95
Hidalgo County Charters 0
School Districts
Animas $2,419 100% $2,419 $774
Lordsburg $4,899 100% $4,899 $1,568
Hidalgo County Total $7,319 $7,319 $2,342
Statewide Dist. Total $2,110,188 $675,260
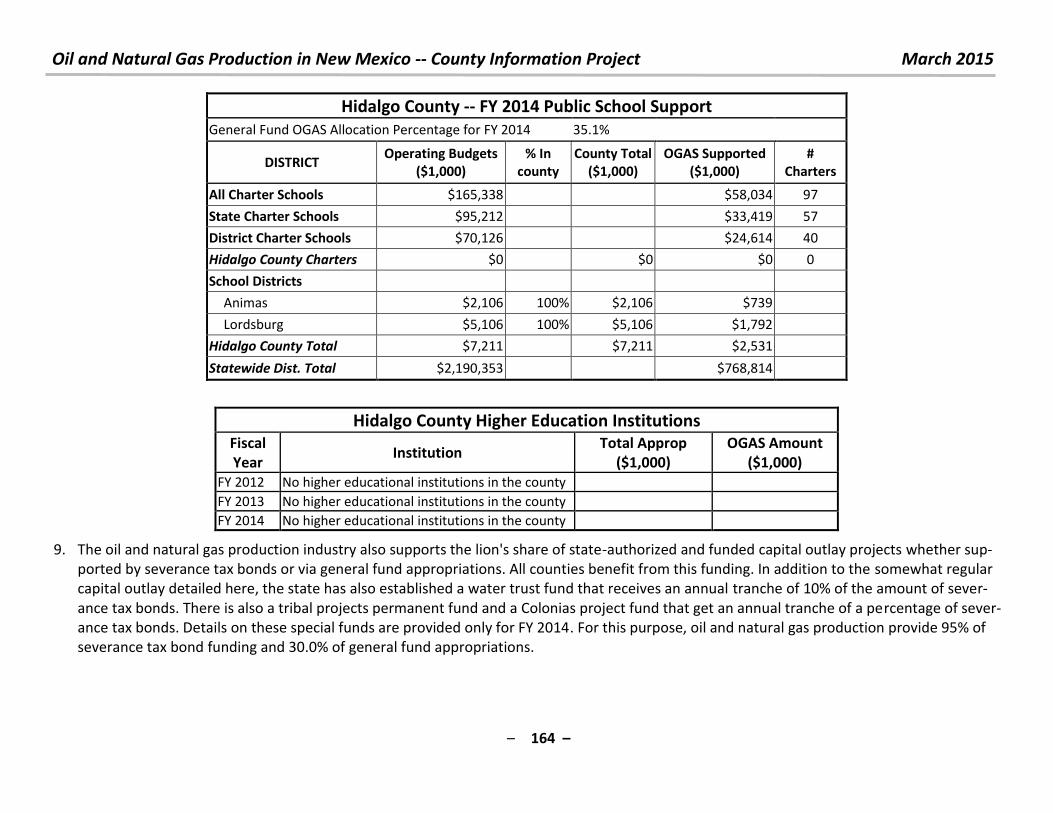
Oil and Natural Gas Production in New Mexico -- County Information Project March 2015
– 164 –
Hidalgo County -- FY 2014 Public School Support
General Fund OGAS Allocation Percentage for FY 2014 35.1%
DISTRICT Operating Budgets
($1,000)
% In
county
County Total
($1,000)
OGAS Supported
($1,000)
#
Charters
All Charter Schools $165,338 $58,034 97
State Charter Schools $95,212 $33,419 57
District Charter Schools $70,126 $24,614 40
Hidalgo County Charters $0 $0 $0 0
School Districts
Animas $2,106 100% $2,106 $739
Lordsburg $5,106 100% $5,106 $1,792
Hidalgo County Total $7,211 $7,211 $2,531
Statewide Dist. Total $2,190,353 $768,814
Hidalgo County Higher Education Institutions
Fiscal
Year Institution
Total Approp
($1,000)
OGAS Amount
($1,000)
FY 2012 No higher educational institutions in the county
FY 2013 No higher educational institutions in the county
FY 2014 No higher educational institutions in the county
9. The oil and natural gas production industry also supports the lion's share of state-authorized and funded capital outlay projects whether sup-
ported by severance tax bonds or via general fund appropriations. All counties benefit from this funding. In addition to the somewhat regular
capital outlay detailed here, the state has also established a water trust fund that receives an annual tranche of 10% of the amount of sever-
ance tax bonds. There is also a tribal projects permanent fund and a Colonias project fund that get an annual tranche of a percentage of sever-
ance tax bonds. Details on these special funds are provided only for FY 2014. For this purpose, oil and natural gas production provide 95% of
severance tax bond funding and 30.0% of general fund appropriations.
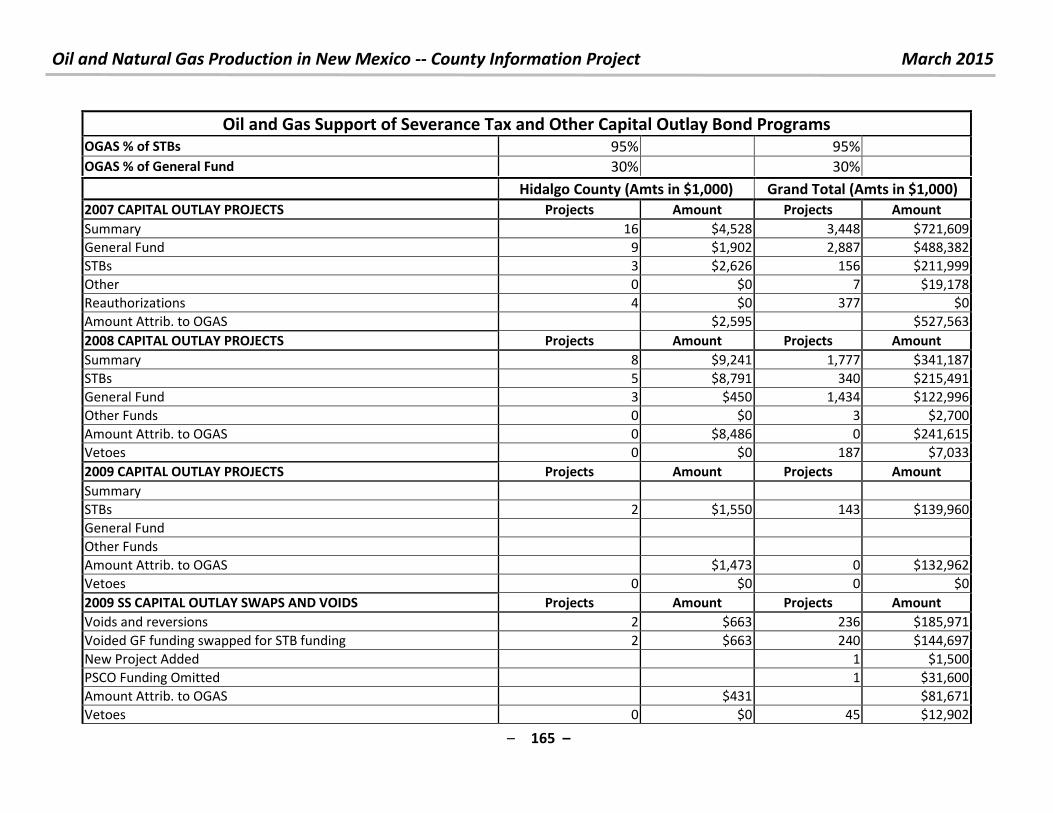
Oil and Natural Gas Production in New Mexico -- County Information Project March 2015
– 165 –
Oil and Gas Support of Severance Tax and Other Capital Outlay Bond Programs OGAS % of STBs 95% 95%
OGAS % of General Fund 30% 30%
Hidalgo County (Amts in $1,000) Grand Total (Amts in $1,000)
2007 CAPITAL OUTLAY PROJECTS Projects Amount Projects Amount
Summary 16 $4,528 3,448 $721,609
General Fund 9 $1,902 2,887 $488,382
STBs 3 $2,626 156 $211,999
Other 0 $0 7 $19,178
Reauthorizations 4 $0 377 $0
Amount Attrib. to OGAS $2,595 $527,563
2008 CAPITAL OUTLAY PROJECTS Projects Amount Projects Amount
Summary 8 $9,241 1,777 $341,187
STBs 5 $8,791 340 $215,491
General Fund 3 $450 1,434 $122,996
Other Funds 0 $0 3 $2,700
Amount Attrib. to OGAS 0 $8,486 0 $241,615
Vetoes 0 $0 187 $7,033
2009 CAPITAL OUTLAY PROJECTS Projects Amount Projects Amount
Summary
STBs 2 $1,550 143 $139,960
General Fund
Other Funds
Amount Attrib. to OGAS $1,473 0 $132,962
Vetoes 0 $0 0 $0
2009 SS CAPITAL OUTLAY SWAPS AND VOIDS Projects Amount Projects Amount
Voids and reversions 2 $663 236 $185,971
Voided GF funding swapped for STB funding 2 $663 240 $144,697
New Project Added 1 $1,500
PSCO Funding Omitted 1 $31,600
Amount Attrib. to OGAS $431 $81,671
Vetoes 0 $0 45 $12,902
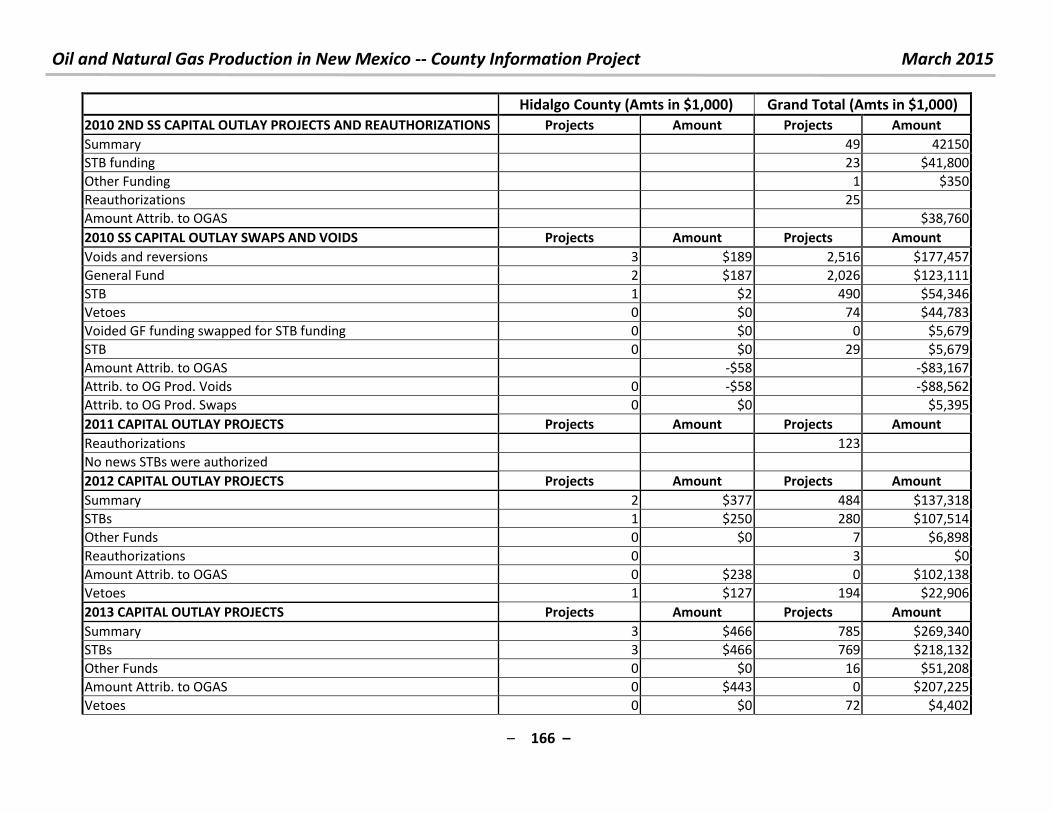
Oil and Natural Gas Production in New Mexico -- County Information Project March 2015
– 166 –
Hidalgo County (Amts in $1,000) Grand Total (Amts in $1,000)
2010 2ND SS CAPITAL OUTLAY PROJECTS AND REAUTHORIZATIONS Projects Amount Projects Amount
Summary 49 42150
STB funding 23 $41,800
Other Funding 1 $350
Reauthorizations 25
Amount Attrib. to OGAS $38,760
2010 SS CAPITAL OUTLAY SWAPS AND VOIDS Projects Amount Projects Amount
Voids and reversions 3 $189 2,516 $177,457
General Fund 2 $187 2,026 $123,111
STB 1 $2 490 $54,346
Vetoes 0 $0 74 $44,783
Voided GF funding swapped for STB funding 0 $0 0 $5,679
STB 0 $0 29 $5,679
Amount Attrib. to OGAS -$58 -$83,167
Attrib. to OG Prod. Voids 0 -$58 -$88,562
Attrib. to OG Prod. Swaps 0 $0 $5,395
2011 CAPITAL OUTLAY PROJECTS Projects Amount Projects Amount
Reauthorizations 123
No news STBs were authorized
2012 CAPITAL OUTLAY PROJECTS Projects Amount Projects Amount
Summary 2 $377 484 $137,318
STBs 1 $250 280 $107,514
Other Funds 0 $0 7 $6,898
Reauthorizations 0 3 $0
Amount Attrib. to OGAS 0 $238 0 $102,138
Vetoes 1 $127 194 $22,906
2013 CAPITAL OUTLAY PROJECTS Projects Amount Projects Amount
Summary 3 $466 785 $269,340
STBs 3 $466 769 $218,132
Other Funds 0 $0 16 $51,208
Amount Attrib. to OGAS 0 $443 0 $207,225
Vetoes 0 $0 72 $4,402
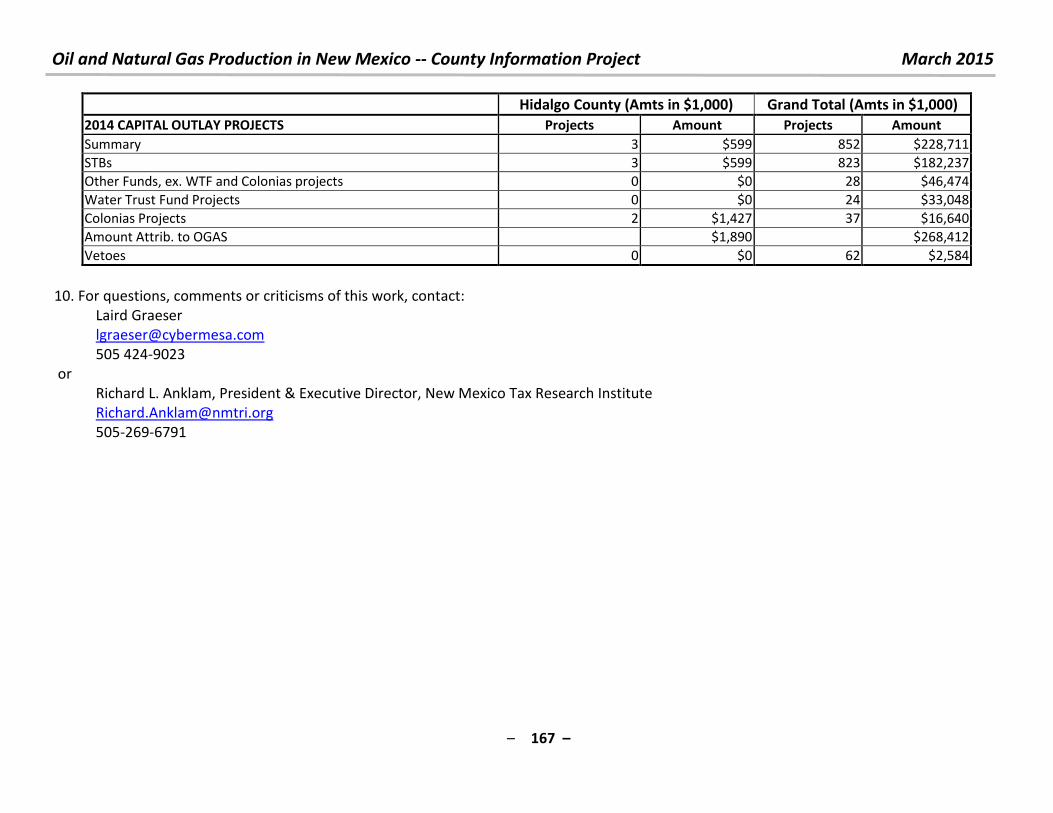
Oil and Natural Gas Production in New Mexico -- County Information Project March 2015
– 167 –
Hidalgo County (Amts in $1,000) Grand Total (Amts in $1,000)
2014 CAPITAL OUTLAY PROJECTS Projects Amount Projects Amount
Summary 3 $599 852 $228,711
STBs 3 $599 823 $182,237
Other Funds, ex. WTF and Colonias projects 0 $0 28 $46,474
Water Trust Fund Projects 0 $0 24 $33,048
Colonias Projects 2 $1,427 37 $16,640
Amount Attrib. to OGAS $1,890 $268,412
Vetoes 0 $0 62 $2,584
10. For questions, comments or criticisms of this work, contact:
Laird Graeser
505 424-9023
or
Richard L. Anklam, President & Executive Director, New Mexico Tax Research Institute
505-269-6791
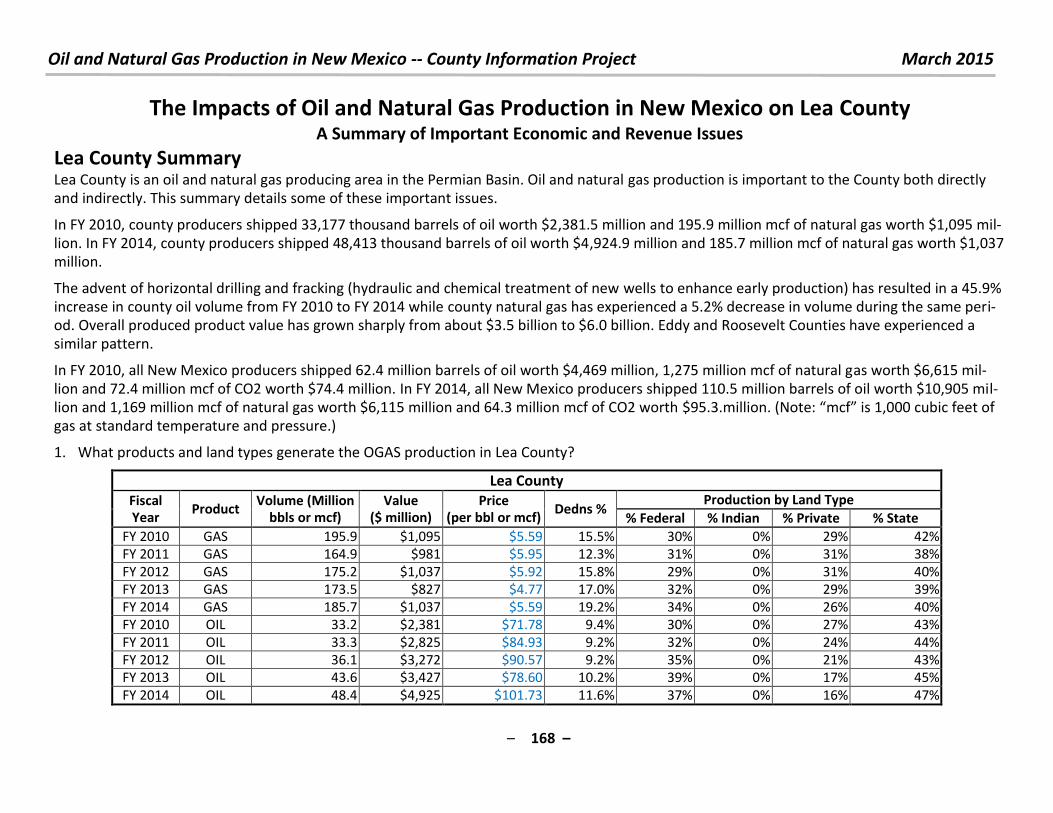
Oil and Natural Gas Production in New Mexico -- County Information Project March 2015
– 168 –
The Impacts of Oil and Natural Gas Production in New Mexico on Lea County A Summary of Important Economic and Revenue Issues
Lea County Summary Lea County is an oil and natural gas producing area in the Permian Basin. Oil and natural gas production is important to the County both directly
and indirectly. This summary details some of these important issues.
In FY 2010, county producers shipped 33,177 thousand barrels of oil worth $2,381.5 million and 195.9 million mcf of natural gas worth $1,095 mil-
lion. In FY 2014, county producers shipped 48,413 thousand barrels of oil worth $4,924.9 million and 185.7 million mcf of natural gas worth $1,037
million.
The advent of horizontal drilling and fracking (hydraulic and chemical treatment of new wells to enhance early production) has resulted in a 45.9%
increase in county oil volume from FY 2010 to FY 2014 while county natural gas has experienced a 5.2% decrease in volume during the same peri-
od. Overall produced product value has grown sharply from about $3.5 billion to $6.0 billion. Eddy and Roosevelt Counties have experienced a
similar pattern.
In FY 2010, all New Mexico producers shipped 62.4 million barrels of oil worth $4,469 million, 1,275 million mcf of natural gas worth $6,615 mil-
lion and 72.4 million mcf of CO2 worth $74.4 million. In FY 2014, all New Mexico producers shipped 110.5 million barrels of oil worth $10,905 mil-
lion and 1,169 million mcf of natural gas worth $6,115 million and 64.3 million mcf of CO2 worth $ . . illio . Note: f is , u i feet of gas at standard temperature and pressure.)
1. What products and land types generate the OGAS production in Lea County?
Lea County
Fiscal Year
Product Volume (Million
bbls or mcf) Value
($ million) Price
(per bbl or mcf) Dedns %
Production by Land Type
% Federal % Indian % Private % State
FY 2010 GAS 195.9 $1,095 $5.59 15.5% 30% 0% 29% 42%
FY 2011 GAS 164.9 $981 $5.95 12.3% 31% 0% 31% 38%
FY 2012 GAS 175.2 $1,037 $5.92 15.8% 29% 0% 31% 40%
FY 2013 GAS 173.5 $827 $4.77 17.0% 32% 0% 29% 39%
FY 2014 GAS 185.7 $1,037 $5.59 19.2% 34% 0% 26% 40%
FY 2010 OIL 33.2 $2,381 $71.78 9.4% 30% 0% 27% 43%
FY 2011 OIL 33.3 $2,825 $84.93 9.2% 32% 0% 24% 44%
FY 2012 OIL 36.1 $3,272 $90.57 9.2% 35% 0% 21% 43%
FY 2013 OIL 43.6 $3,427 $78.60 10.2% 39% 0% 17% 45%
FY 2014 OIL 48.4 $4,925 $101.73 11.6% 37% 0% 16% 47%
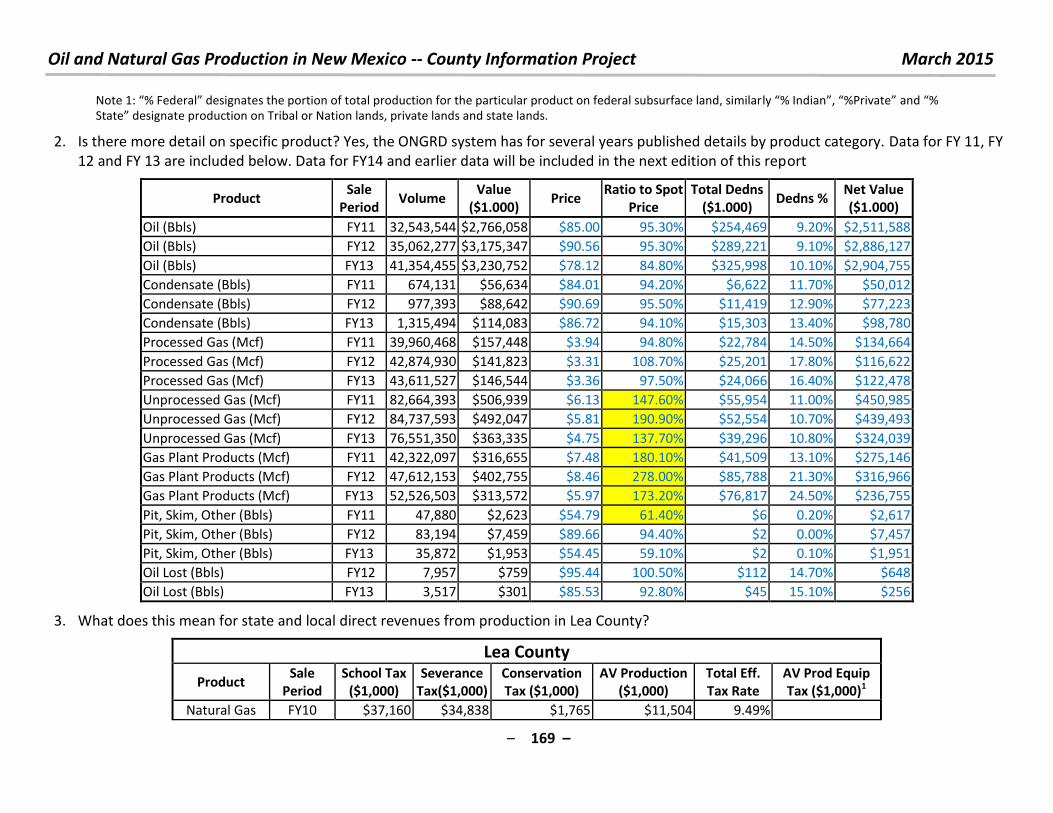
Oil and Natural Gas Production in New Mexico -- County Information Project March 2015
– 169 –
Note : % Fede al desig ates the po tio of total p odu tio fo the pa ti ula p odu t o fede al su su fa e la d, si ila l % I dia , %P i ate a d % “tate desig ate p odu tio o T i al o Natio la ds, p i ate la ds a d state la ds.
2. Is there more detail on specific product? Yes, the ONGRD system has for several years published details by product category. Data for FY 11, FY
12 and FY 13 are included below. Data for FY14 and earlier data will be included in the next edition of this report
Product Sale
Period Volume
Value
($1.000) Price
Ratio to Spot
Price
Total Dedns
($1.000) Dedns %
Net Value
($1.000)
Oil (Bbls) FY11 32,543,544 $2,766,058 $85.00 95.30% $254,469 9.20% $2,511,588
Oil (Bbls) FY12 35,062,277 $3,175,347 $90.56 95.30% $289,221 9.10% $2,886,127
Oil (Bbls) FY13 41,354,455 $3,230,752 $78.12 84.80% $325,998 10.10% $2,904,755
Condensate (Bbls) FY11 674,131 $56,634 $84.01 94.20% $6,622 11.70% $50,012
Condensate (Bbls) FY12 977,393 $88,642 $90.69 95.50% $11,419 12.90% $77,223
Condensate (Bbls) FY13 1,315,494 $114,083 $86.72 94.10% $15,303 13.40% $98,780
Processed Gas (Mcf) FY11 39,960,468 $157,448 $3.94 94.80% $22,784 14.50% $134,664
Processed Gas (Mcf) FY12 42,874,930 $141,823 $3.31 108.70% $25,201 17.80% $116,622
Processed Gas (Mcf) FY13 43,611,527 $146,544 $3.36 97.50% $24,066 16.40% $122,478
Unprocessed Gas (Mcf) FY11 82,664,393 $506,939 $6.13 147.60% $55,954 11.00% $450,985
Unprocessed Gas (Mcf) FY12 84,737,593 $492,047 $5.81 190.90% $52,554 10.70% $439,493
Unprocessed Gas (Mcf) FY13 76,551,350 $363,335 $4.75 137.70% $39,296 10.80% $324,039
Gas Plant Products (Mcf) FY11 42,322,097 $316,655 $7.48 180.10% $41,509 13.10% $275,146
Gas Plant Products (Mcf) FY12 47,612,153 $402,755 $8.46 278.00% $85,788 21.30% $316,966
Gas Plant Products (Mcf) FY13 52,526,503 $313,572 $5.97 173.20% $76,817 24.50% $236,755
Pit, Skim, Other (Bbls) FY11 47,880 $2,623 $54.79 61.40% $6 0.20% $2,617
Pit, Skim, Other (Bbls) FY12 83,194 $7,459 $89.66 94.40% $2 0.00% $7,457
Pit, Skim, Other (Bbls) FY13 35,872 $1,953 $54.45 59.10% $2 0.10% $1,951
Oil Lost (Bbls) FY12 7,957 $759 $95.44 100.50% $112 14.70% $648
Oil Lost (Bbls) FY13 3,517 $301 $85.53 92.80% $45 15.10% $256
3. What does this mean for state and local direct revenues from production in Lea County?
Lea County
Product Sale
Period
School Tax
($1,000)
Severance
Tax($1,000)
Conservation
Tax ($1,000)
AV Production
($1,000)
Total Eff.
Tax Rate
AV Prod Equip
Tax ($1,000)1
Natural Gas FY10 $37,160 $34,838 $1,765 $11,504 9.49%
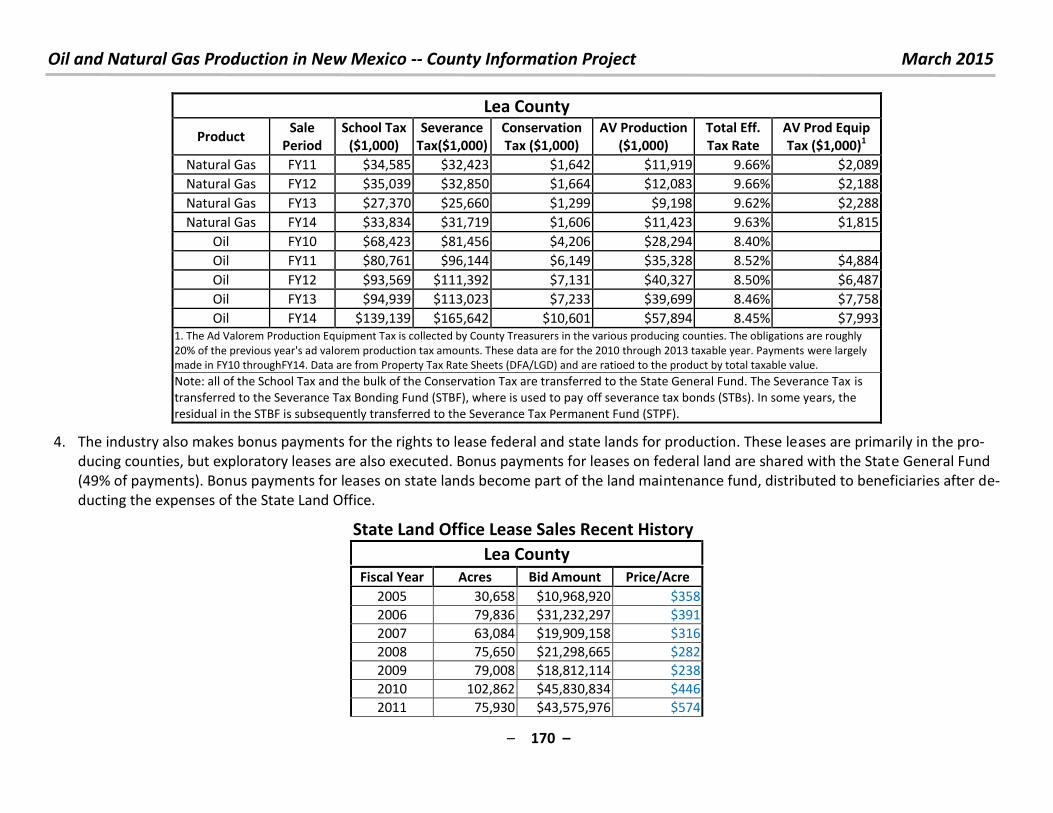
Oil and Natural Gas Production in New Mexico -- County Information Project March 2015
– 170 –
Lea County
Product Sale
Period
School Tax
($1,000)
Severance
Tax($1,000)
Conservation
Tax ($1,000)
AV Production
($1,000)
Total Eff.
Tax Rate
AV Prod Equip
Tax ($1,000)1
Natural Gas FY11 $34,585 $32,423 $1,642 $11,919 9.66% $2,089
Natural Gas FY12 $35,039 $32,850 $1,664 $12,083 9.66% $2,188
Natural Gas FY13 $27,370 $25,660 $1,299 $9,198 9.62% $2,288
Natural Gas FY14 $33,834 $31,719 $1,606 $11,423 9.63% $1,815
Oil FY10 $68,423 $81,456 $4,206 $28,294 8.40%
Oil FY11 $80,761 $96,144 $6,149 $35,328 8.52% $4,884
Oil FY12 $93,569 $111,392 $7,131 $40,327 8.50% $6,487
Oil FY13 $94,939 $113,023 $7,233 $39,699 8.46% $7,758
Oil FY14 $139,139 $165,642 $10,601 $57,894 8.45% $7,993 1. The Ad Valorem Production Equipment Tax is collected by County Treasurers in the various producing counties. The obligations are roughly
20% of the previous year's ad valorem production tax amounts. These data are for the 2010 through 2013 taxable year. Payments were largely
made in FY10 throughFY14. Data are from Property Tax Rate Sheets (DFA/LGD) and are ratioed to the product by total taxable value.
Note: all of the School Tax and the bulk of the Conservation Tax are transferred to the State General Fund. The Severance Tax is
transferred to the Severance Tax Bonding Fund (STBF), where is used to pay off severance tax bonds (STBs). In some years, the
residual in the STBF is subsequently transferred to the Severance Tax Permanent Fund (STPF).
4. The industry also makes bonus payments for the rights to lease federal and state lands for production. These leases are primarily in the pro-
ducing counties, but exploratory leases are also executed. Bonus payments for leases on federal land are shared with the State General Fund
(49% of payments). Bonus payments for leases on state lands become part of the land maintenance fund, distributed to beneficiaries after de-
ducting the expenses of the State Land Office.
State Land Office Lease Sales Recent History
Lea County Fiscal Year Acres Bid Amount Price/Acre
2005 30,658 $10,968,920 $358
2006 79,836 $31,232,297 $391
2007 63,084 $19,909,158 $316
2008 75,650 $21,298,665 $282
2009 79,008 $18,812,114 $238
2010 102,862 $45,830,834 $446
2011 75,930 $43,575,976 $574
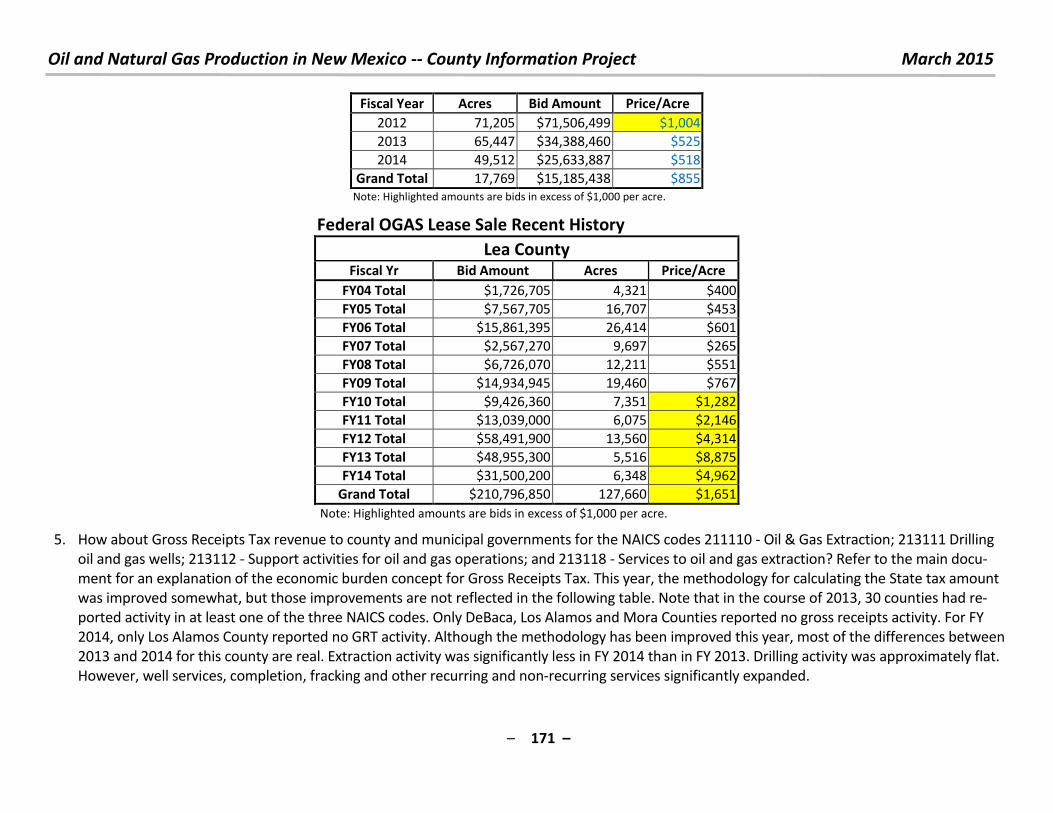
Oil and Natural Gas Production in New Mexico -- County Information Project March 2015
– 171 –
Fiscal Year Acres Bid Amount Price/Acre
2012 71,205 $71,506,499 $1,004
2013 65,447 $34,388,460 $525
2014 49,512 $25,633,887 $518
Grand Total 17,769 $15,185,438 $855
Note: Highlighted amounts are bids in excess of $1,000 per acre.
Federal OGAS Lease Sale Recent History
Lea County Fiscal Yr Bid Amount Acres Price/Acre
FY04 Total $1,726,705 4,321 $400
FY05 Total $7,567,705 16,707 $453
FY06 Total $15,861,395 26,414 $601
FY07 Total $2,567,270 9,697 $265
FY08 Total $6,726,070 12,211 $551
FY09 Total $14,934,945 19,460 $767
FY10 Total $9,426,360 7,351 $1,282
FY11 Total $13,039,000 6,075 $2,146
FY12 Total $58,491,900 13,560 $4,314
FY13 Total $48,955,300 5,516 $8,875
FY14 Total $31,500,200 6,348 $4,962
Grand Total $210,796,850 127,660 $1,651
Note: Highlighted amounts are bids in excess of $1,000 per acre.
5. How about Gross Receipts Tax revenue to county and municipal governments for the NAICS codes 211110 - Oil & Gas Extraction; 213111 Drilling
oil and gas wells; 213112 - Support activities for oil and gas operations; and 213118 - Services to oil and gas extraction? Refer to the main docu-
ment for an explanation of the economic burden concept for Gross Receipts Tax. This year, the methodology for calculating the State tax amount
was improved somewhat, but those improvements are not reflected in the following table. Note that in the course of 2013, 30 counties had re-
ported activity in at least one of the three NAICS codes. Only DeBaca, Los Alamos and Mora Counties reported no gross receipts activity. For FY
2014, only Los Alamos County reported no GRT activity. Although the methodology has been improved this year, most of the differences between
2013 and 2014 for this county are real. Extraction activity was significantly less in FY 2014 than in FY 2013. Drilling activity was approximately flat.
However, well services, completion, fracking and other recurring and non-recurring services significantly expanded.
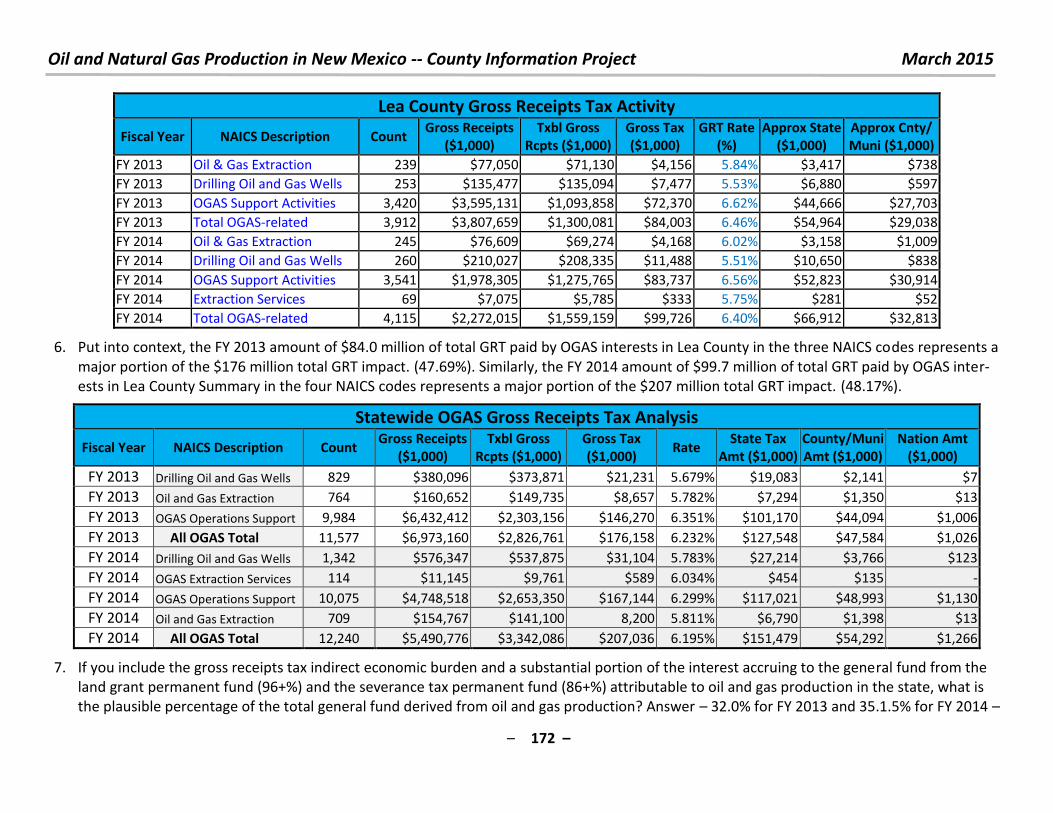
Oil and Natural Gas Production in New Mexico -- County Information Project March 2015
– 172 –
Lea County Gross Receipts Tax Activity
Fiscal Year NAICS Description Count Gross Receipts
($1,000)
Txbl Gross
Rcpts ($1,000)
Gross Tax
($1,000)
GRT Rate
(%)
Approx State
($1,000)
Approx Cnty/
Muni ($1,000)
FY 2013 Oil & Gas Extraction 239 $77,050 $71,130 $4,156 5.84% $3,417 $738
FY 2013 Drilling Oil and Gas Wells 253 $135,477 $135,094 $7,477 5.53% $6,880 $597
FY 2013 OGAS Support Activities 3,420 $3,595,131 $1,093,858 $72,370 6.62% $44,666 $27,703
FY 2013 Total OGAS-related 3,912 $3,807,659 $1,300,081 $84,003 6.46% $54,964 $29,038
FY 2014 Oil & Gas Extraction 245 $76,609 $69,274 $4,168 6.02% $3,158 $1,009
FY 2014 Drilling Oil and Gas Wells 260 $210,027 $208,335 $11,488 5.51% $10,650 $838
FY 2014 OGAS Support Activities 3,541 $1,978,305 $1,275,765 $83,737 6.56% $52,823 $30,914
FY 2014 Extraction Services 69 $7,075 $5,785 $333 5.75% $281 $52
FY 2014 Total OGAS-related 4,115 $2,272,015 $1,559,159 $99,726 6.40% $66,912 $32,813
6. Put into context, the FY 2013 amount of $84.0 million of total GRT paid by OGAS interests in Lea County in the three NAICS codes represents a
major portion of the $176 million total GRT impact. (47.69%). Similarly, the FY 2014 amount of $99.7 million of total GRT paid by OGAS inter-
ests in Lea County Summary in the four NAICS codes represents a major portion of the $207 million total GRT impact. (48.17%).
Statewide OGAS Gross Receipts Tax Analysis
Fiscal Year NAICS Description Count Gross Receipts
($1,000)
Txbl Gross
Rcpts ($1,000)
Gross Tax
($1,000) Rate
State Tax
Amt ($1,000)
County/Muni
Amt ($1,000)
Nation Amt
($1,000)
FY 2013 Drilling Oil and Gas Wells 829 $380,096 $373,871 $21,231 5.679% $19,083 $2,141 $7
FY 2013 Oil and Gas Extraction 764 $160,652 $149,735 $8,657 5.782% $7,294 $1,350 $13
FY 2013 OGAS Operations Support 9,984 $6,432,412 $2,303,156 $146,270 6.351% $101,170 $44,094 $1,006
FY 2013 All OGAS Total 11,577 $6,973,160 $2,826,761 $176,158 6.232% $127,548 $47,584 $1,026
FY 2014 Drilling Oil and Gas Wells 1,342 $576,347 $537,875 $31,104 5.783% $27,214 $3,766 $123
FY 2014 OGAS Extraction Services 114 $11,145 $9,761 $589 6.034% $454 $135 -
FY 2014 OGAS Operations Support 10,075 $4,748,518 $2,653,350 $167,144 6.299% $117,021 $48,993 $1,130
FY 2014 Oil and Gas Extraction 709 $154,767 $141,100 8,200 5.811% $6,790 $1,398 $13
FY 2014 All OGAS Total 12,240 $5,490,776 $3,342,086 $207,036 6.195% $151,479 $54,292 $1,266
7. If you include the gross receipts tax indirect economic burden and a substantial portion of the interest accruing to the general fund from the
land grant permanent fund (96+%) and the severance tax permanent fund (86+%) attributable to oil and gas production in the state, what is
the plausible percentage of the total general fund derived from oil and gas production? Answer – 32.0% for FY 2013 and 35.1.5% for FY 2014 –
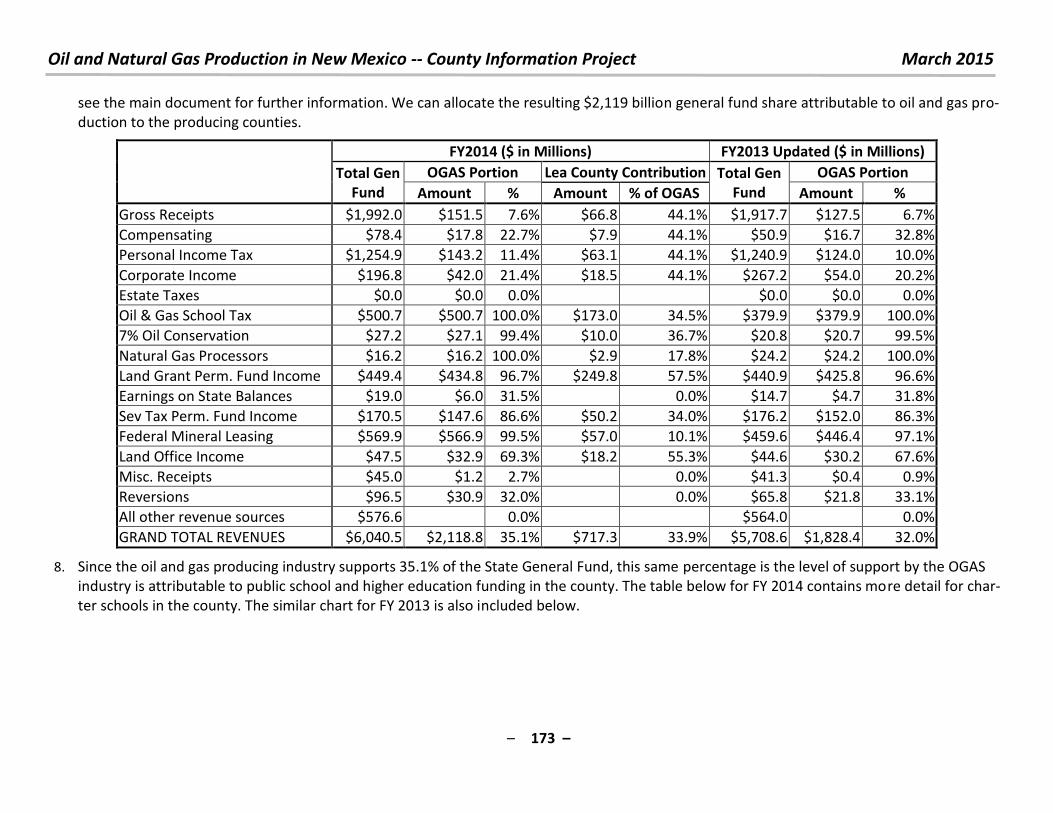
Oil and Natural Gas Production in New Mexico -- County Information Project March 2015
– 173 –
see the main document for further information. We can allocate the resulting $2,119 billion general fund share attributable to oil and gas pro-
duction to the producing counties.
FY2014 ($ in Millions) FY2013 Updated ($ in Millions)
Total Gen
Fund
OGAS Portion Lea County Contribution Total Gen
Fund
OGAS Portion
Amount % Amount % of OGAS Amount %
Gross Receipts $1,992.0 $151.5 7.6% $66.8 44.1% $1,917.7 $127.5 6.7%
Compensating $78.4 $17.8 22.7% $7.9 44.1% $50.9 $16.7 32.8%
Personal Income Tax $1,254.9 $143.2 11.4% $63.1 44.1% $1,240.9 $124.0 10.0%
Corporate Income $196.8 $42.0 21.4% $18.5 44.1% $267.2 $54.0 20.2%
Estate Taxes $0.0 $0.0 0.0% $0.0 $0.0 0.0%
Oil & Gas School Tax $500.7 $500.7 100.0% $173.0 34.5% $379.9 $379.9 100.0%
7% Oil Conservation $27.2 $27.1 99.4% $10.0 36.7% $20.8 $20.7 99.5%
Natural Gas Processors $16.2 $16.2 100.0% $2.9 17.8% $24.2 $24.2 100.0%
Land Grant Perm. Fund Income $449.4 $434.8 96.7% $249.8 57.5% $440.9 $425.8 96.6%
Earnings on State Balances $19.0 $6.0 31.5% 0.0% $14.7 $4.7 31.8%
Sev Tax Perm. Fund Income $170.5 $147.6 86.6% $50.2 34.0% $176.2 $152.0 86.3%
Federal Mineral Leasing $569.9 $566.9 99.5% $57.0 10.1% $459.6 $446.4 97.1%
Land Office Income $47.5 $32.9 69.3% $18.2 55.3% $44.6 $30.2 67.6%
Misc. Receipts $45.0 $1.2 2.7% 0.0% $41.3 $0.4 0.9%
Reversions $96.5 $30.9 32.0% 0.0% $65.8 $21.8 33.1%
All other revenue sources $576.6 0.0% $564.0 0.0%
GRAND TOTAL REVENUES $6,040.5 $2,118.8 35.1% $717.3 33.9% $5,708.6 $1,828.4 32.0%
8. Since the oil and gas producing industry supports 35.1% of the State General Fund, this same percentage is the level of support by the OGAS
industry is attributable to public school and higher education funding in the county. The table below for FY 2014 contains more detail for char-
ter schools in the county. The similar chart for FY 2013 is also included below.
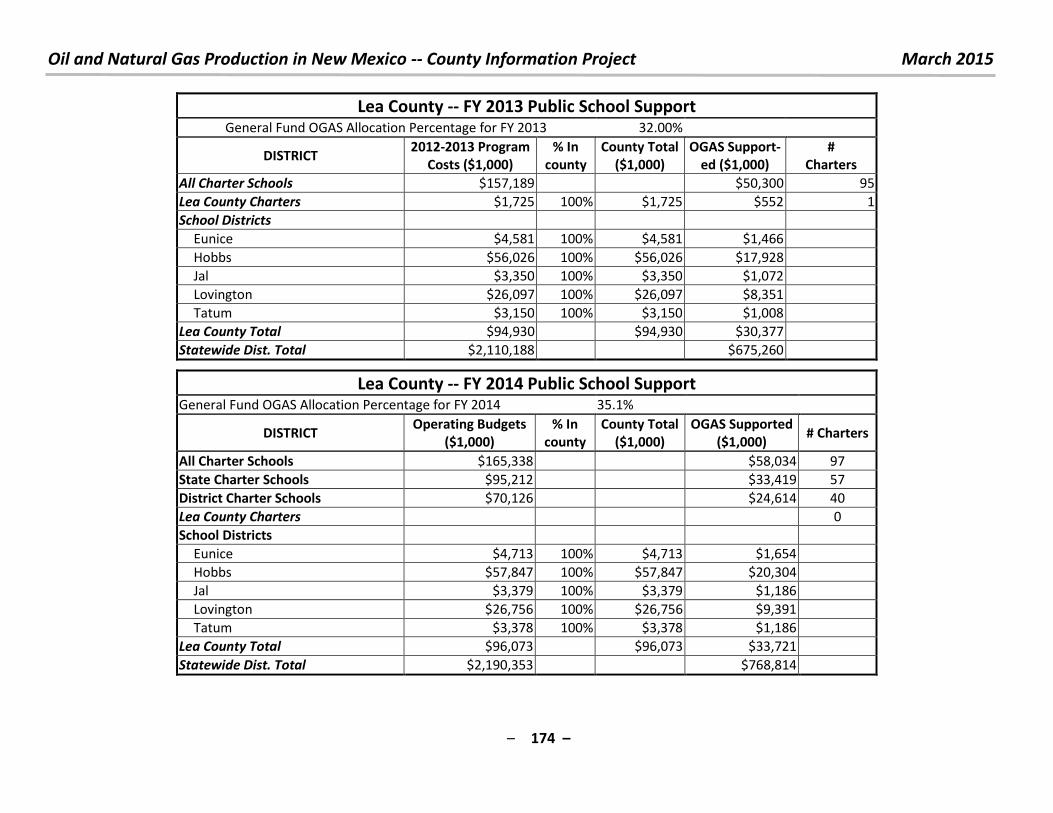
Oil and Natural Gas Production in New Mexico -- County Information Project March 2015
– 174 –
Lea County -- FY 2013 Public School Support General Fund OGAS Allocation Percentage for FY 2013 32.00%
DISTRICT 2012-2013 Program
Costs ($1,000)
% In
county
County Total
($1,000)
OGAS Support-
ed ($1,000)
#
Charters
All Charter Schools $157,189 $50,300 95
Lea County Charters $1,725 100% $1,725 $552 1
School Districts
Eunice $4,581 100% $4,581 $1,466
Hobbs $56,026 100% $56,026 $17,928
Jal $3,350 100% $3,350 $1,072
Lovington $26,097 100% $26,097 $8,351
Tatum $3,150 100% $3,150 $1,008
Lea County Total $94,930 $94,930 $30,377
Statewide Dist. Total $2,110,188 $675,260
Lea County -- FY 2014 Public School Support General Fund OGAS Allocation Percentage for FY 2014 35.1%
DISTRICT Operating Budgets
($1,000)
% In
county
County Total
($1,000)
OGAS Supported
($1,000) # Charters
All Charter Schools $165,338 $58,034 97
State Charter Schools $95,212 $33,419 57
District Charter Schools $70,126 $24,614 40
Lea County Charters 0
School Districts
Eunice $4,713 100% $4,713 $1,654
Hobbs $57,847 100% $57,847 $20,304
Jal $3,379 100% $3,379 $1,186
Lovington $26,756 100% $26,756 $9,391
Tatum $3,378 100% $3,378 $1,186
Lea County Total $96,073 $96,073 $33,721
Statewide Dist. Total $2,190,353 $768,814
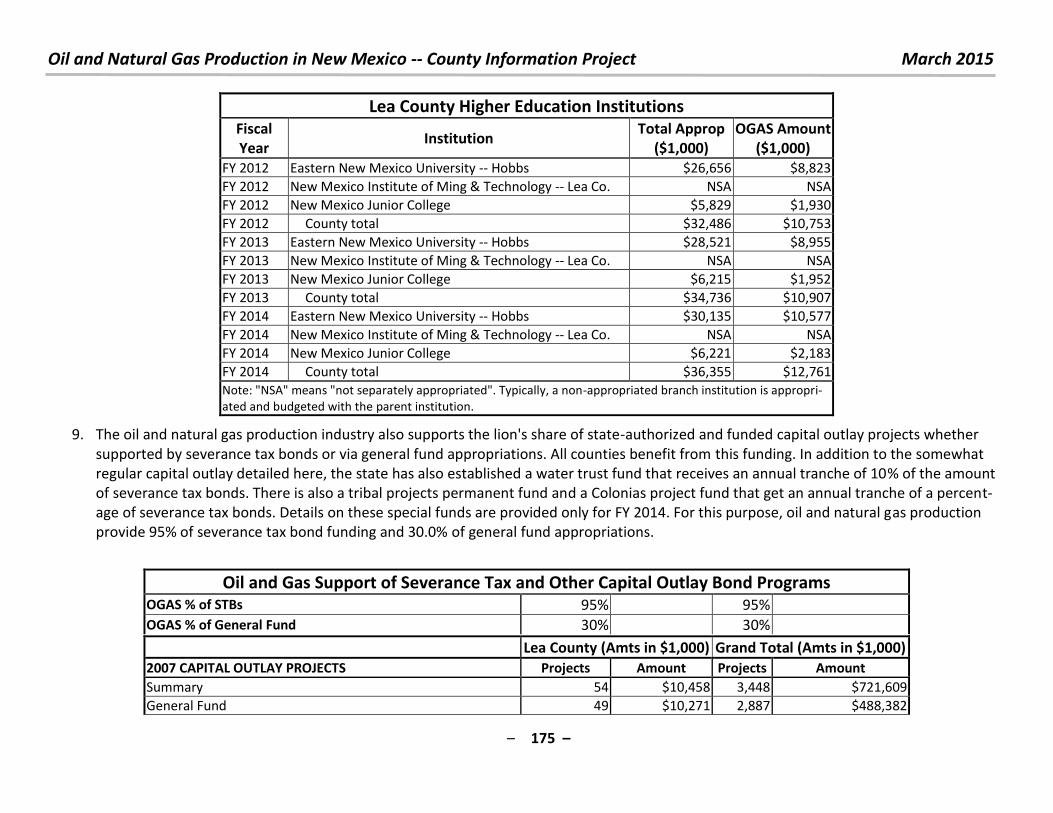
Oil and Natural Gas Production in New Mexico -- County Information Project March 2015
– 175 –
Lea County Higher Education Institutions
Fiscal
Year Institution
Total Approp
($1,000)
OGAS Amount
($1,000)
FY 2012 Eastern New Mexico University -- Hobbs $26,656 $8,823
FY 2012 New Mexico Institute of Ming & Technology -- Lea Co. NSA NSA
FY 2012 New Mexico Junior College $5,829 $1,930
FY 2012 County total $32,486 $10,753
FY 2013 Eastern New Mexico University -- Hobbs $28,521 $8,955
FY 2013 New Mexico Institute of Ming & Technology -- Lea Co. NSA NSA
FY 2013 New Mexico Junior College $6,215 $1,952
FY 2013 County total $34,736 $10,907
FY 2014 Eastern New Mexico University -- Hobbs $30,135 $10,577
FY 2014 New Mexico Institute of Ming & Technology -- Lea Co. NSA NSA
FY 2014 New Mexico Junior College $6,221 $2,183
FY 2014 County total $36,355 $12,761
Note: "NSA" means "not separately appropriated". Typically, a non-appropriated branch institution is appropri-
ated and budgeted with the parent institution.
9. The oil and natural gas production industry also supports the lion's share of state-authorized and funded capital outlay projects whether
supported by severance tax bonds or via general fund appropriations. All counties benefit from this funding. In addition to the somewhat
regular capital outlay detailed here, the state has also established a water trust fund that receives an annual tranche of 10% of the amount
of severance tax bonds. There is also a tribal projects permanent fund and a Colonias project fund that get an annual tranche of a percent-
age of severance tax bonds. Details on these special funds are provided only for FY 2014. For this purpose, oil and natural gas production
provide 95% of severance tax bond funding and 30.0% of general fund appropriations.
Oil and Gas Support of Severance Tax and Other Capital Outlay Bond Programs OGAS % of STBs 95% 95%
OGAS % of General Fund 30% 30%
Lea County (Amts in $1,000) Grand Total (Amts in $1,000)
2007 CAPITAL OUTLAY PROJECTS Projects Amount Projects Amount
Summary 54 $10,458 3,448 $721,609
General Fund 49 $10,271 2,887 $488,382
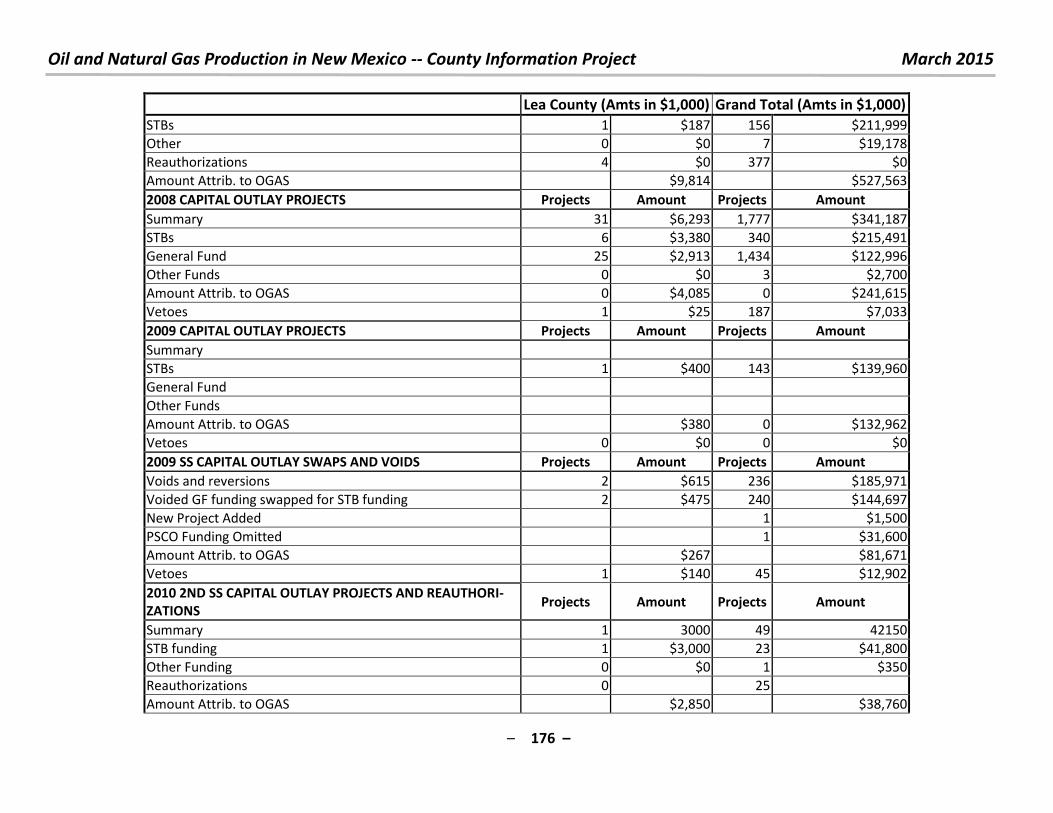
Oil and Natural Gas Production in New Mexico -- County Information Project March 2015
– 176 –
Lea County (Amts in $1,000) Grand Total (Amts in $1,000)
STBs 1 $187 156 $211,999
Other 0 $0 7 $19,178
Reauthorizations 4 $0 377 $0
Amount Attrib. to OGAS $9,814 $527,563
2008 CAPITAL OUTLAY PROJECTS Projects Amount Projects Amount
Summary 31 $6,293 1,777 $341,187
STBs 6 $3,380 340 $215,491
General Fund 25 $2,913 1,434 $122,996
Other Funds 0 $0 3 $2,700
Amount Attrib. to OGAS 0 $4,085 0 $241,615
Vetoes 1 $25 187 $7,033
2009 CAPITAL OUTLAY PROJECTS Projects Amount Projects Amount
Summary
STBs 1 $400 143 $139,960
General Fund
Other Funds
Amount Attrib. to OGAS $380 0 $132,962
Vetoes 0 $0 0 $0
2009 SS CAPITAL OUTLAY SWAPS AND VOIDS Projects Amount Projects Amount
Voids and reversions 2 $615 236 $185,971
Voided GF funding swapped for STB funding 2 $475 240 $144,697
New Project Added 1 $1,500
PSCO Funding Omitted 1 $31,600
Amount Attrib. to OGAS $267 $81,671
Vetoes 1 $140 45 $12,902
2010 2ND SS CAPITAL OUTLAY PROJECTS AND REAUTHORI-
ZATIONS Projects Amount Projects Amount
Summary 1 3000 49 42150
STB funding 1 $3,000 23 $41,800
Other Funding 0 $0 1 $350
Reauthorizations 0 25
Amount Attrib. to OGAS $2,850 $38,760
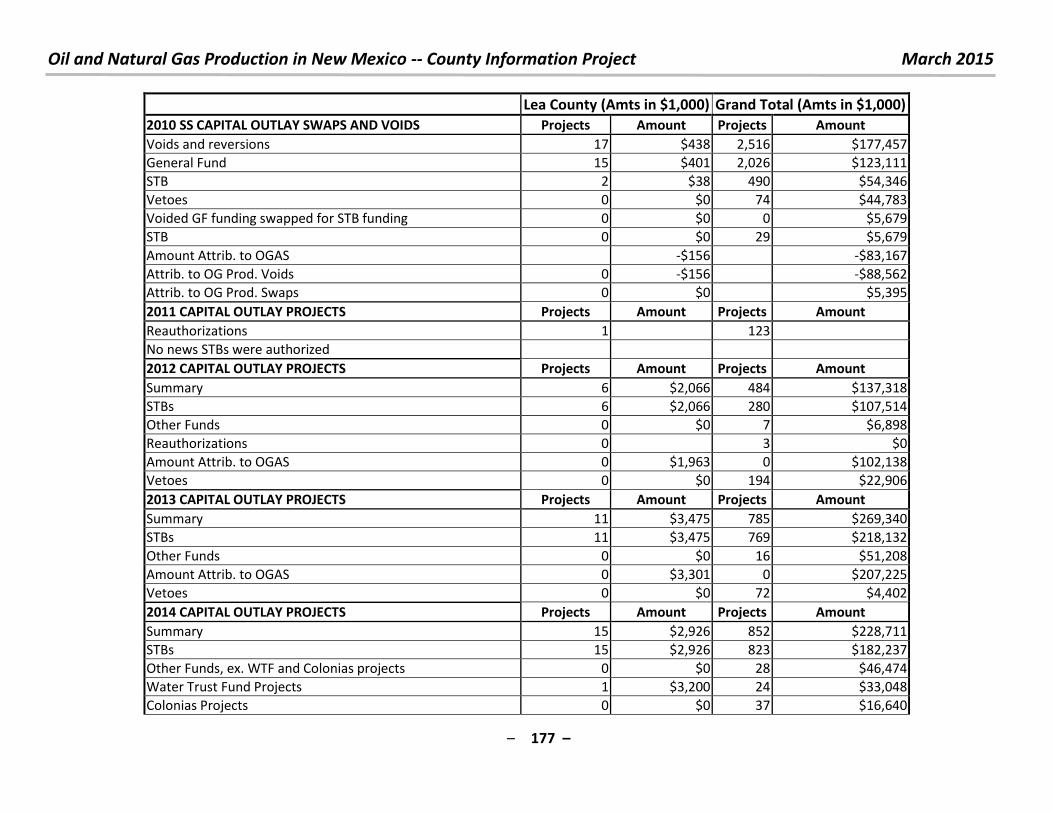
Oil and Natural Gas Production in New Mexico -- County Information Project March 2015
– 177 –
Lea County (Amts in $1,000) Grand Total (Amts in $1,000)
2010 SS CAPITAL OUTLAY SWAPS AND VOIDS Projects Amount Projects Amount
Voids and reversions 17 $438 2,516 $177,457
General Fund 15 $401 2,026 $123,111
STB 2 $38 490 $54,346
Vetoes 0 $0 74 $44,783
Voided GF funding swapped for STB funding 0 $0 0 $5,679
STB 0 $0 29 $5,679
Amount Attrib. to OGAS -$156 -$83,167
Attrib. to OG Prod. Voids 0 -$156 -$88,562
Attrib. to OG Prod. Swaps 0 $0 $5,395
2011 CAPITAL OUTLAY PROJECTS Projects Amount Projects Amount
Reauthorizations 1 123
No news STBs were authorized
2012 CAPITAL OUTLAY PROJECTS Projects Amount Projects Amount
Summary 6 $2,066 484 $137,318
STBs 6 $2,066 280 $107,514
Other Funds 0 $0 7 $6,898
Reauthorizations 0 3 $0
Amount Attrib. to OGAS 0 $1,963 0 $102,138
Vetoes 0 $0 194 $22,906
2013 CAPITAL OUTLAY PROJECTS Projects Amount Projects Amount
Summary 11 $3,475 785 $269,340
STBs 11 $3,475 769 $218,132
Other Funds 0 $0 16 $51,208
Amount Attrib. to OGAS 0 $3,301 0 $207,225
Vetoes 0 $0 72 $4,402
2014 CAPITAL OUTLAY PROJECTS Projects Amount Projects Amount
Summary 15 $2,926 852 $228,711
STBs 15 $2,926 823 $182,237
Other Funds, ex. WTF and Colonias projects 0 $0 28 $46,474
Water Trust Fund Projects 1 $3,200 24 $33,048
Colonias Projects 0 $0 37 $16,640
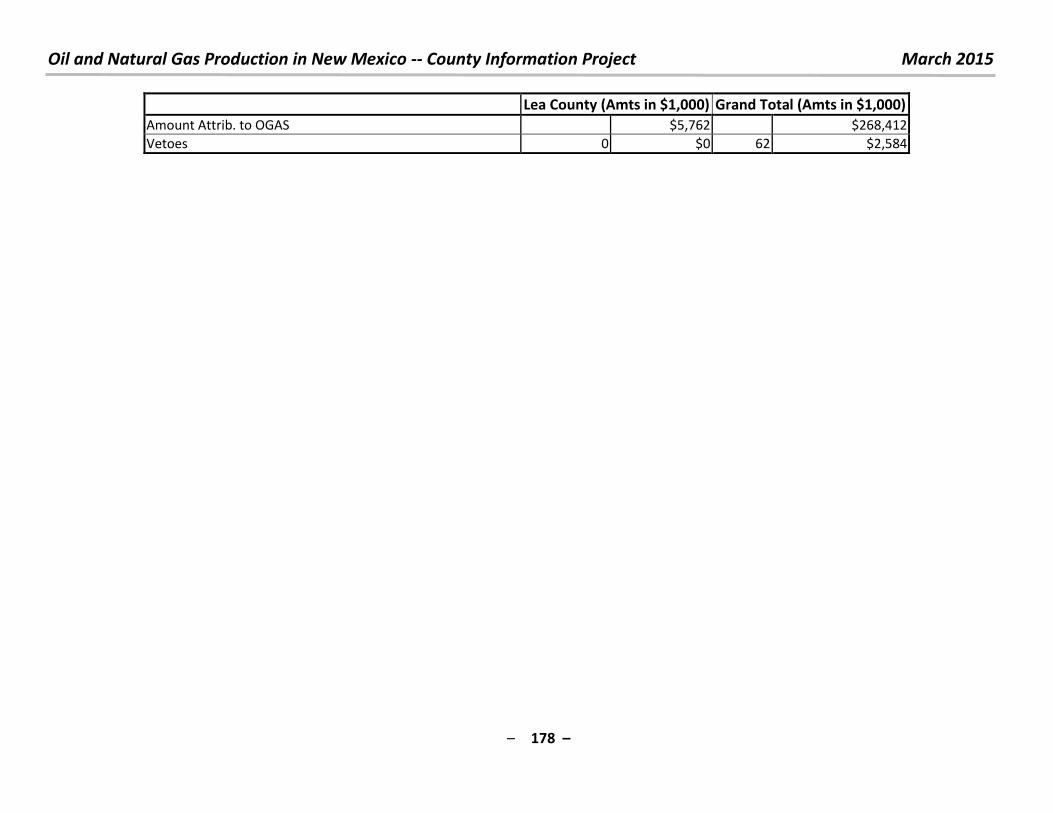
Oil and Natural Gas Production in New Mexico -- County Information Project March 2015
– 178 –
Lea County (Amts in $1,000) Grand Total (Amts in $1,000)
Amount Attrib. to OGAS $5,762 $268,412
Vetoes 0 $0 62 $2,584

Oil and Natural Gas Production in New Mexico -- County Information Project March 2015
– 179 –
10. For questions, comments or criticisms of this work, contact:
Laird Graeser
505 424-9023
or
Richard L. Anklam, President & Executive Director, New Mexico Tax Research Institute
505-269-6791

Oil and Natural Gas Production in New Mexico -- County Information Project March 2015
– 180 –
The Impacts of Oil and Natural Gas Production in New Mexico on Lincoln County A Summary of Important Economic and Revenue Issues
Lincoln County Summary
Lincoln County is not an oil and natural gas producing area. However, oil and natural gas production is important to the county indirectly. This
summary details some of these important issues.
In FY 2010, all New Mexico producers shipped 62.4 million barrels of oil worth $4,469 million, 1,275 million mcf of natural gas worth $6,615 million
and 72.4 million mcf of CO2 worth $74.4 million. In FY 2014, all New Mexico producers shipped 110.5 million barrels of oil worth $10,905 million
and 1,169 million mcf of natural gas worth $6,115 million and 64.3 million mcf of CO2 worth $ . . illio . Note: f is , u i feet of gas at standard temperature and pressure.)
1. What products and land types generate the OGAS production in Lincoln County? Lincoln County is not an oil and natural gas producing area.
2. Is there more detail on specific product, such as natural gas liquids or condensate? Yes, the ONGRD system has for several years published de-
tails by product category. However, Lincoln County is not an oil and natural gas producing area.
3. What does this production mean for state and local direct revenues from production in Lincoln County? Lincoln County is not an oil and natural
gas producing area.
4. The industry also makes bonus payments for the rights to lease federal and state lands for production. These leases are primarily in the pro-
ducing counties, but exploratory leases are also executed. Bonus payments for leases on federal land are shared with the State general fund.
Bonus payments for leases on state lands become part of the land maintenance fund at the State Land Office, distributed to beneficiaries after
deducting the expenses of the SLO. No leases have been sold in Lincoln County for the FY 2004 through FY 2015 period.
5. How about Gross Receipts Tax revenue to county and municipal governments for the NAICS codes 211110 - Oil & Gas Extraction; 213111 Drilling
oil and gas wells; 213112 - Support activities for oil and gas operations; and 213118 - Services to oil and gas extraction? Refer to the main docu-
ment for an explanation of the economic burden concept for Gross Receipts Tax. This year, the methodology for calculating the State tax amount
was improved somewhat, but those improvements are not reflected in the following table. Note that in the course of 2013, 30 counties had re-
ported activity in at least one of the three NAICS codes. Only DeBaca, Los Alamos and Mora Counties reported no gross receipts activity. For FY
2014, only Los Alamos County reported no GRT activity. Although the methodology has been improved this year, most of the differences between
2013 and 2014 for this county are real. Extraction activity was significantly less in FY 2014 than in FY 2013. Drilling activity was approximately flat.
However, well services, completion, fracking and other recurring and non-recurring services significantly expanded.
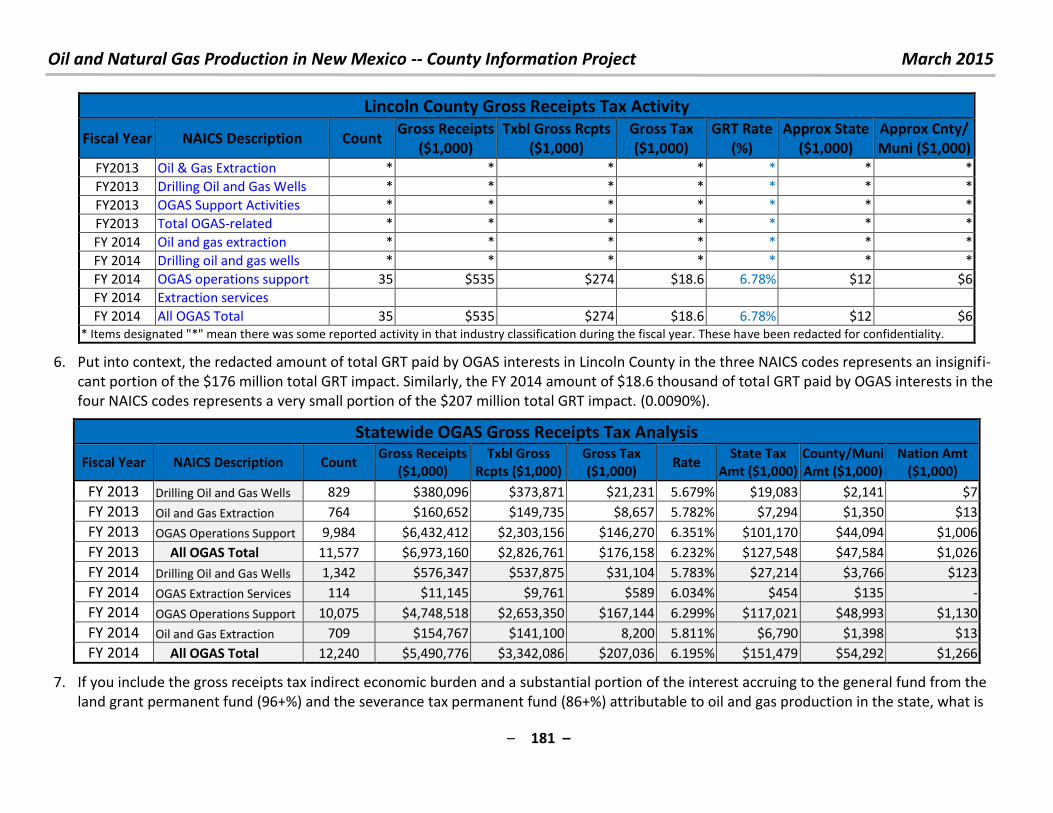
Oil and Natural Gas Production in New Mexico -- County Information Project March 2015
– 181 –
Lincoln County Gross Receipts Tax Activity
Fiscal Year NAICS Description Count Gross Receipts
($1,000)
Txbl Gross Rcpts
($1,000)
Gross Tax
($1,000)
GRT Rate
(%)
Approx State
($1,000)
Approx Cnty/
Muni ($1,000)
FY2013 Oil & Gas Extraction * * * * * * *
FY2013 Drilling Oil and Gas Wells * * * * * * *
FY2013 OGAS Support Activities * * * * * * *
FY2013 Total OGAS-related * * * * * * *
FY 2014 Oil and gas extraction * * * * * * *
FY 2014 Drilling oil and gas wells * * * * * * *
FY 2014 OGAS operations support 35 $535 $274 $18.6 6.78% $12 $6
FY 2014 Extraction services
FY 2014 All OGAS Total 35 $535 $274 $18.6 6.78% $12 $6
* Items designated "*" mean there was some reported activity in that industry classification during the fiscal year. These have been redacted for confidentiality.
6. Put into context, the redacted amount of total GRT paid by OGAS interests in Lincoln County in the three NAICS codes represents an insignifi-
cant portion of the $176 million total GRT impact. Similarly, the FY 2014 amount of $18.6 thousand of total GRT paid by OGAS interests in the
four NAICS codes represents a very small portion of the $207 million total GRT impact. (0.0090%).
Statewide OGAS Gross Receipts Tax Analysis
Fiscal Year NAICS Description Count Gross Receipts
($1,000)
Txbl Gross
Rcpts ($1,000)
Gross Tax
($1,000) Rate
State Tax
Amt ($1,000)
County/Muni
Amt ($1,000)
Nation Amt
($1,000)
FY 2013 Drilling Oil and Gas Wells 829 $380,096 $373,871 $21,231 5.679% $19,083 $2,141 $7
FY 2013 Oil and Gas Extraction 764 $160,652 $149,735 $8,657 5.782% $7,294 $1,350 $13
FY 2013 OGAS Operations Support 9,984 $6,432,412 $2,303,156 $146,270 6.351% $101,170 $44,094 $1,006
FY 2013 All OGAS Total 11,577 $6,973,160 $2,826,761 $176,158 6.232% $127,548 $47,584 $1,026
FY 2014 Drilling Oil and Gas Wells 1,342 $576,347 $537,875 $31,104 5.783% $27,214 $3,766 $123
FY 2014 OGAS Extraction Services 114 $11,145 $9,761 $589 6.034% $454 $135 -
FY 2014 OGAS Operations Support 10,075 $4,748,518 $2,653,350 $167,144 6.299% $117,021 $48,993 $1,130
FY 2014 Oil and Gas Extraction 709 $154,767 $141,100 8,200 5.811% $6,790 $1,398 $13
FY 2014 All OGAS Total 12,240 $5,490,776 $3,342,086 $207,036 6.195% $151,479 $54,292 $1,266
7. If you include the gross receipts tax indirect economic burden and a substantial portion of the interest accruing to the general fund from the
land grant permanent fund (96+%) and the severance tax permanent fund (86+%) attributable to oil and gas production in the state, what is
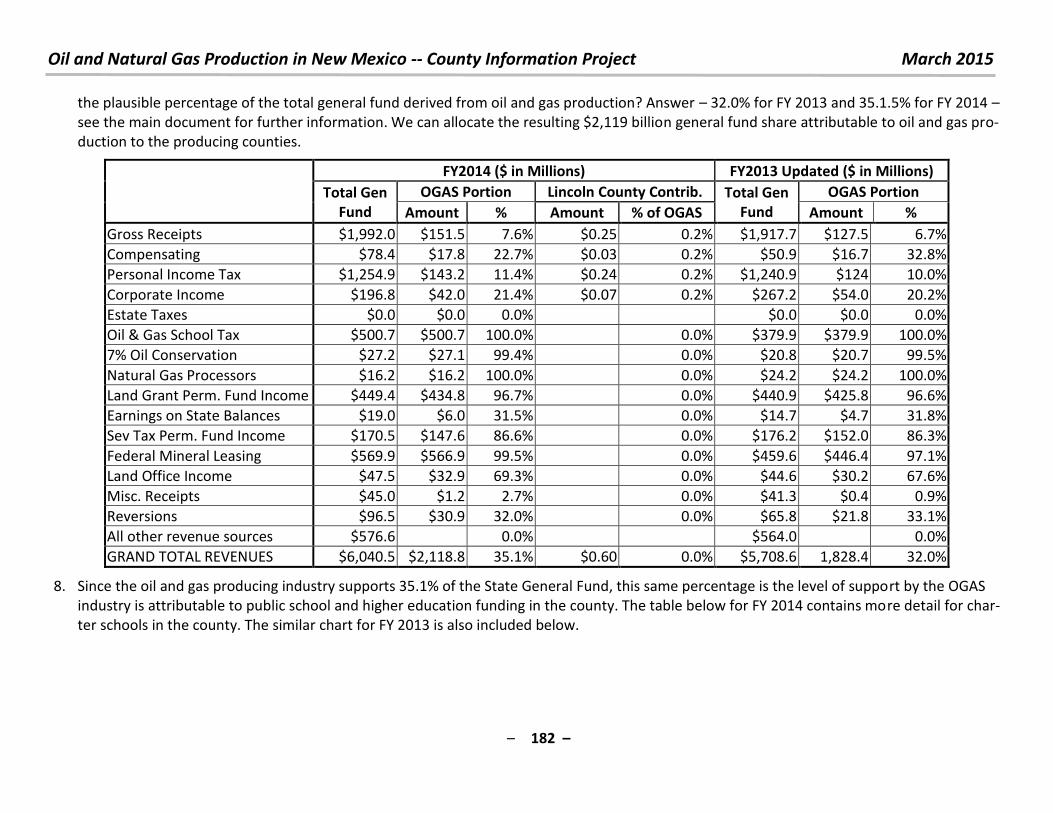
Oil and Natural Gas Production in New Mexico -- County Information Project March 2015
– 182 –
the plausible percentage of the total general fund derived from oil and gas production? Answer – 32.0% for FY 2013 and 35.1.5% for FY 2014 –
see the main document for further information. We can allocate the resulting $2,119 billion general fund share attributable to oil and gas pro-
duction to the producing counties.
FY2014 ($ in Millions) FY2013 Updated ($ in Millions)
Total Gen
Fund
OGAS Portion Lincoln County Contrib. Total Gen
Fund
OGAS Portion
Amount % Amount % of OGAS Amount %
Gross Receipts $1,992.0 $151.5 7.6% $0.25 0.2% $1,917.7 $127.5 6.7%
Compensating $78.4 $17.8 22.7% $0.03 0.2% $50.9 $16.7 32.8%
Personal Income Tax $1,254.9 $143.2 11.4% $0.24 0.2% $1,240.9 $124 10.0%
Corporate Income $196.8 $42.0 21.4% $0.07 0.2% $267.2 $54.0 20.2%
Estate Taxes $0.0 $0.0 0.0%
$0.0 $0.0 0.0%
Oil & Gas School Tax $500.7 $500.7 100.0% 0.0% $379.9 $379.9 100.0%
7% Oil Conservation $27.2 $27.1 99.4% 0.0% $20.8 $20.7 99.5%
Natural Gas Processors $16.2 $16.2 100.0% 0.0% $24.2 $24.2 100.0%
Land Grant Perm. Fund Income $449.4 $434.8 96.7% 0.0% $440.9 $425.8 96.6%
Earnings on State Balances $19.0 $6.0 31.5% 0.0% $14.7 $4.7 31.8%
Sev Tax Perm. Fund Income $170.5 $147.6 86.6% 0.0% $176.2 $152.0 86.3%
Federal Mineral Leasing $569.9 $566.9 99.5% 0.0% $459.6 $446.4 97.1%
Land Office Income $47.5 $32.9 69.3% 0.0% $44.6 $30.2 67.6%
Misc. Receipts $45.0 $1.2 2.7% 0.0% $41.3 $0.4 0.9%
Reversions $96.5 $30.9 32.0% 0.0% $65.8 $21.8 33.1%
All other revenue sources $576.6
0.0%
$564.0
0.0%
GRAND TOTAL REVENUES $6,040.5 $2,118.8 35.1% $0.60 0.0% $5,708.6 1,828.4 32.0%
8. Since the oil and gas producing industry supports 35.1% of the State General Fund, this same percentage is the level of support by the OGAS
industry is attributable to public school and higher education funding in the county. The table below for FY 2014 contains more detail for char-
ter schools in the county. The similar chart for FY 2013 is also included below.
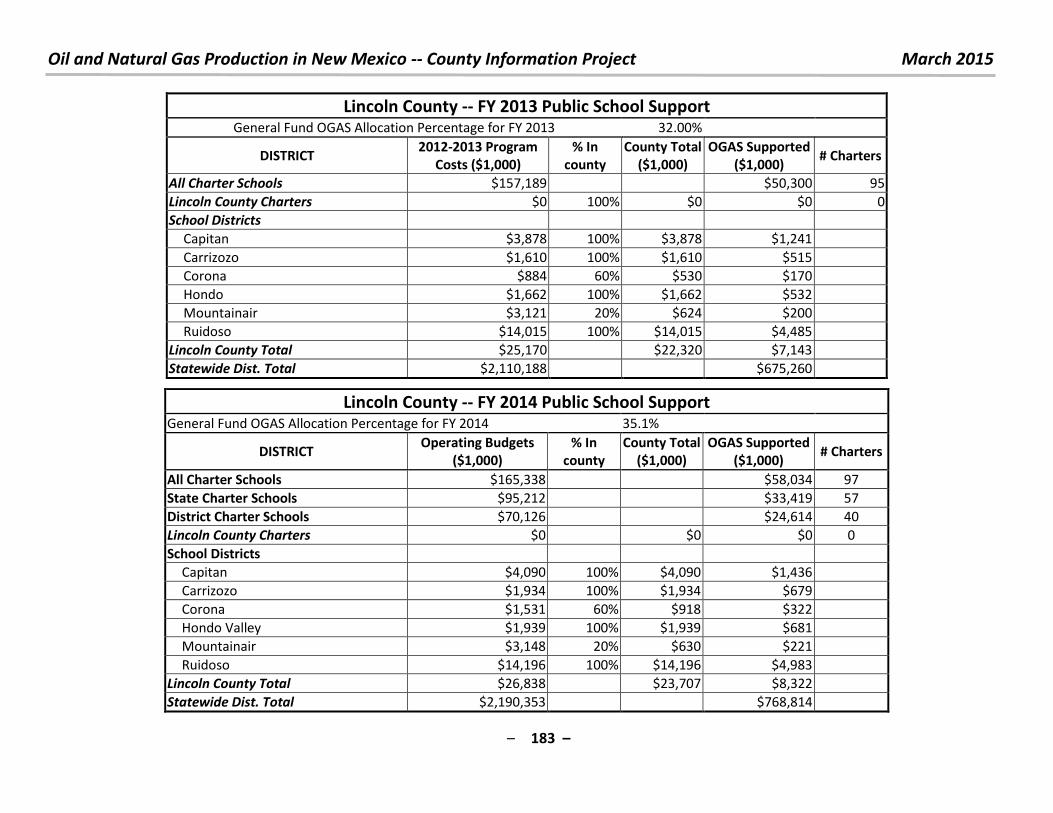
Oil and Natural Gas Production in New Mexico -- County Information Project March 2015
– 183 –
Lincoln County -- FY 2013 Public School Support General Fund OGAS Allocation Percentage for FY 2013 32.00%
DISTRICT 2012-2013 Program
Costs ($1,000)
% In
county
County Total
($1,000)
OGAS Supported
($1,000) # Charters
All Charter Schools $157,189
$50,300 95
Lincoln County Charters $0 100% $0 $0 0
School Districts
Capitan $3,878 100% $3,878 $1,241
Carrizozo $1,610 100% $1,610 $515
Corona $884 60% $530 $170
Hondo $1,662 100% $1,662 $532
Mountainair $3,121 20% $624 $200
Ruidoso $14,015 100% $14,015 $4,485
Lincoln County Total $25,170
$22,320 $7,143
Statewide Dist. Total $2,110,188
$675,260
Lincoln County -- FY 2014 Public School Support General Fund OGAS Allocation Percentage for FY 2014 35.1%
DISTRICT Operating Budgets
($1,000)
% In
county
County Total
($1,000)
OGAS Supported
($1,000) # Charters
All Charter Schools $165,338
$58,034 97
State Charter Schools $95,212
$33,419 57
District Charter Schools $70,126
$24,614 40
Lincoln County Charters $0
$0 $0 0
School Districts
Capitan $4,090 100% $4,090 $1,436
Carrizozo $1,934 100% $1,934 $679
Corona $1,531 60% $918 $322
Hondo Valley $1,939 100% $1,939 $681
Mountainair $3,148 20% $630 $221
Ruidoso $14,196 100% $14,196 $4,983
Lincoln County Total $26,838
$23,707 $8,322
Statewide Dist. Total $2,190,353
$768,814
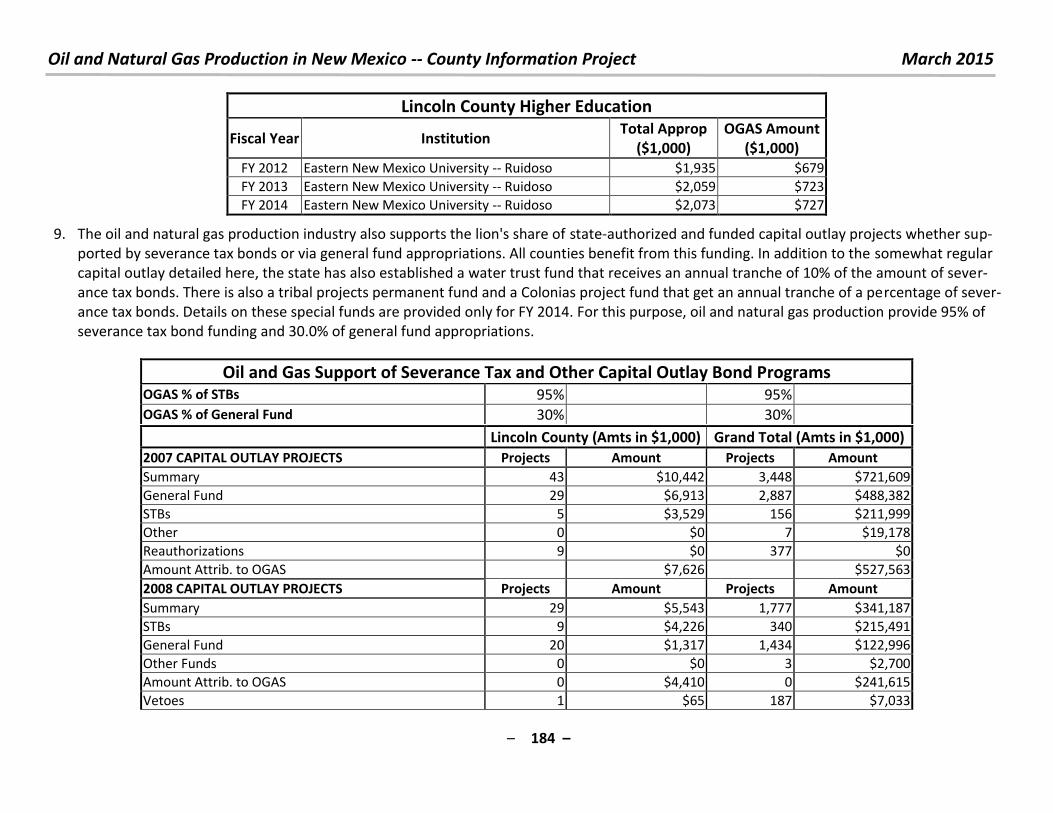
Oil and Natural Gas Production in New Mexico -- County Information Project March 2015
– 184 –
Lincoln County Higher Education
Fiscal Year Institution Total Approp
($1,000)
OGAS Amount
($1,000)
FY 2012 Eastern New Mexico University -- Ruidoso $1,935 $679
FY 2013 Eastern New Mexico University -- Ruidoso $2,059 $723
FY 2014 Eastern New Mexico University -- Ruidoso $2,073 $727
9. The oil and natural gas production industry also supports the lion's share of state-authorized and funded capital outlay projects whether sup-
ported by severance tax bonds or via general fund appropriations. All counties benefit from this funding. In addition to the somewhat regular
capital outlay detailed here, the state has also established a water trust fund that receives an annual tranche of 10% of the amount of sever-
ance tax bonds. There is also a tribal projects permanent fund and a Colonias project fund that get an annual tranche of a percentage of sever-
ance tax bonds. Details on these special funds are provided only for FY 2014. For this purpose, oil and natural gas production provide 95% of
severance tax bond funding and 30.0% of general fund appropriations.
Oil and Gas Support of Severance Tax and Other Capital Outlay Bond Programs OGAS % of STBs 95% 95%
OGAS % of General Fund 30% 30%
Lincoln County (Amts in $1,000) Grand Total (Amts in $1,000)
2007 CAPITAL OUTLAY PROJECTS Projects Amount Projects Amount
Summary 43 $10,442 3,448 $721,609
General Fund 29 $6,913 2,887 $488,382
STBs 5 $3,529 156 $211,999
Other 0 $0 7 $19,178
Reauthorizations 9 $0 377 $0
Amount Attrib. to OGAS $7,626 $527,563
2008 CAPITAL OUTLAY PROJECTS Projects Amount Projects Amount
Summary 29 $5,543 1,777 $341,187
STBs 9 $4,226 340 $215,491
General Fund 20 $1,317 1,434 $122,996
Other Funds 0 $0 3 $2,700
Amount Attrib. to OGAS 0 $4,410 0 $241,615
Vetoes 1 $65 187 $7,033
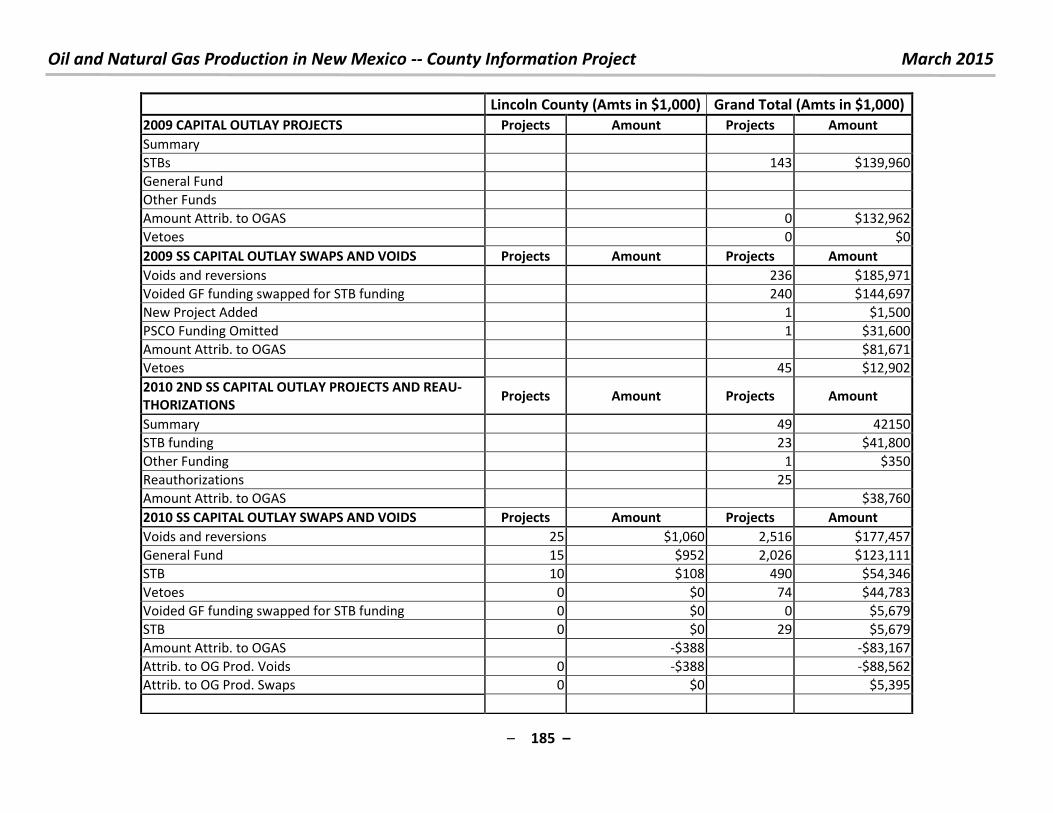
Oil and Natural Gas Production in New Mexico -- County Information Project March 2015
– 185 –
Lincoln County (Amts in $1,000) Grand Total (Amts in $1,000)
2009 CAPITAL OUTLAY PROJECTS Projects Amount Projects Amount
Summary
STBs 143 $139,960
General Fund
Other Funds
Amount Attrib. to OGAS 0 $132,962
Vetoes 0 $0
2009 SS CAPITAL OUTLAY SWAPS AND VOIDS Projects Amount Projects Amount
Voids and reversions 236 $185,971
Voided GF funding swapped for STB funding 240 $144,697
New Project Added 1 $1,500
PSCO Funding Omitted 1 $31,600
Amount Attrib. to OGAS $81,671
Vetoes 45 $12,902
2010 2ND SS CAPITAL OUTLAY PROJECTS AND REAU-
THORIZATIONS Projects Amount Projects Amount
Summary 49 42150
STB funding 23 $41,800
Other Funding 1 $350
Reauthorizations 25
Amount Attrib. to OGAS $38,760
2010 SS CAPITAL OUTLAY SWAPS AND VOIDS Projects Amount Projects Amount
Voids and reversions 25 $1,060 2,516 $177,457
General Fund 15 $952 2,026 $123,111
STB 10 $108 490 $54,346
Vetoes 0 $0 74 $44,783
Voided GF funding swapped for STB funding 0 $0 0 $5,679
STB 0 $0 29 $5,679
Amount Attrib. to OGAS -$388 -$83,167
Attrib. to OG Prod. Voids 0 -$388 -$88,562
Attrib. to OG Prod. Swaps 0 $0 $5,395
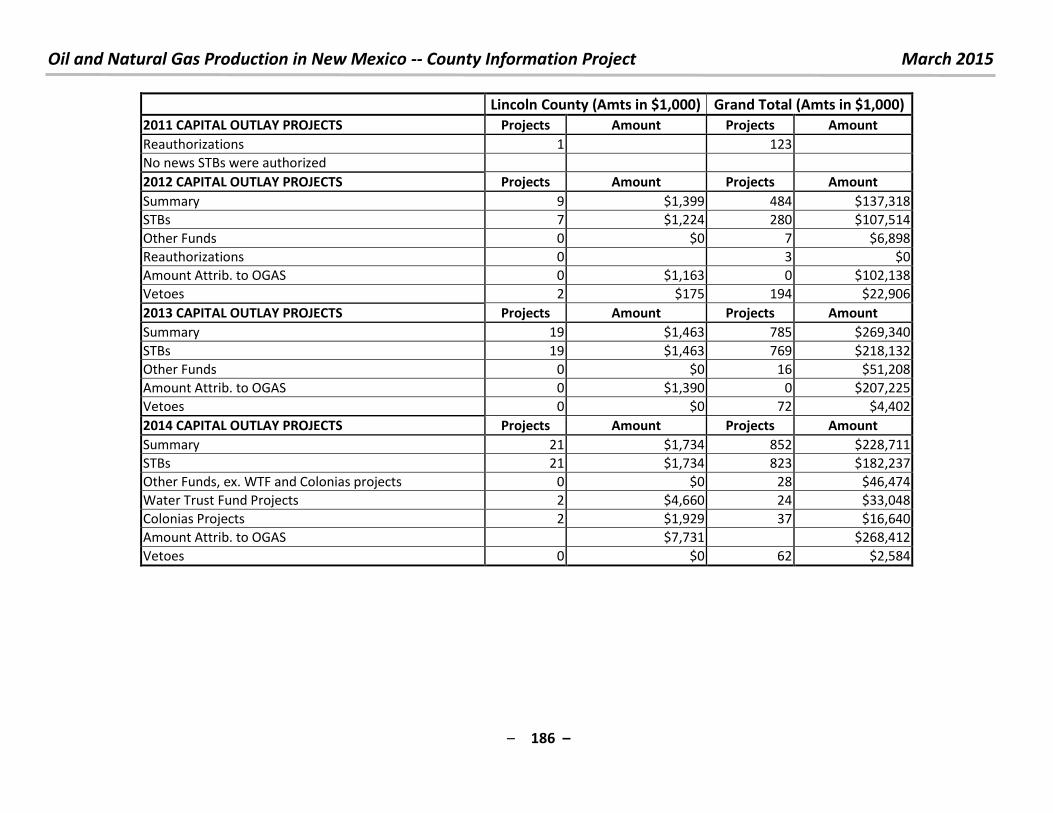
Oil and Natural Gas Production in New Mexico -- County Information Project March 2015
– 186 –
Lincoln County (Amts in $1,000) Grand Total (Amts in $1,000)
2011 CAPITAL OUTLAY PROJECTS Projects Amount Projects Amount
Reauthorizations 1 123
No news STBs were authorized
2012 CAPITAL OUTLAY PROJECTS Projects Amount Projects Amount
Summary 9 $1,399 484 $137,318
STBs 7 $1,224 280 $107,514
Other Funds 0 $0 7 $6,898
Reauthorizations 0 3 $0
Amount Attrib. to OGAS 0 $1,163 0 $102,138
Vetoes 2 $175 194 $22,906
2013 CAPITAL OUTLAY PROJECTS Projects Amount Projects Amount
Summary 19 $1,463 785 $269,340
STBs 19 $1,463 769 $218,132
Other Funds 0 $0 16 $51,208
Amount Attrib. to OGAS 0 $1,390 0 $207,225
Vetoes 0 $0 72 $4,402
2014 CAPITAL OUTLAY PROJECTS Projects Amount Projects Amount
Summary 21 $1,734 852 $228,711
STBs 21 $1,734 823 $182,237
Other Funds, ex. WTF and Colonias projects 0 $0 28 $46,474
Water Trust Fund Projects 2 $4,660 24 $33,048
Colonias Projects 2 $1,929 37 $16,640
Amount Attrib. to OGAS $7,731 $268,412
Vetoes 0 $0 62 $2,584

Oil and Natural Gas Production in New Mexico -- County Information Project March 2015
– 187 –
10. For questions, comments or criticisms of this work, contact:
Laird Graeser
505 424-9023
or
Richard L. Anklam, President & Executive Director, New Mexico Tax Research Institute
505-269-6791
Oil and Natural Gas Production in New Mexico -- County Information Project March 2015
– 188 –
The Impacts of Oil and Natural Gas Production in New Mexico on Los Alamos County A Summary of Important Economic and Revenue Issues
Los Alamos County Summary Los Alamos County is not an oil and natural gas producing area. However, oil and natural gas production is important to the county indirectly. This
summary details some of these important issues.
In FY 2010, all New Mexico producers shipped 62.4 million barrels of oil worth $4,469 million, 1,275 million mcf of natural gas worth $6,615 mil-
lion and 72.4 million mcf of CO2 worth $74.4 million. In FY 2014, all New Mexico producers shipped 110.5 million barrels of oil worth $10,905 mil-
lion and 1,169 million mcf of natural gas worth $6,115 million and 64.3 million mcf of CO2 worth $ . . illio . Note: f is , u i feet of gas at standard temperature and pressure.)
1. What products and land types generate the OGAS production in Los Alamos County? Los Alamos County is not an oil and natural gas producing
area.
2. Is there more detail on specific product, such as natural gas liquids or condensate? Yes, the ONGRD system has for several years published de-
tails by product category. However, Los Alamos County is not an oil and natural gas producing area.
3. What does this production mean for state and local direct revenues from production in Los Alamos County? Los Alamos County is not an oil
and natural gas producing area.
4. The industry also makes bonus payments for the rights to lease federal and state lands for production. These leases are primarily in the pro-
ducing counties, but exploratory leases are also executed. Bonus payments for leases on federal land are shared with the State general fund.
Bonus payments for leases on state lands become part of the land maintenance fund at the State Land Office, distributed to beneficiaries after
deducting the expenses of the SLO. No leases have been sold in Los Alamos County for the FY 2004 through FY 2015 period.
5. How about Gross Receipts Tax revenue to county and municipal governments for the NAICS codes 211110 - Oil & Gas Extraction; 213111 Drill-
ing oil and gas wells; 213112 - Support activities for oil and gas operations; and 213118 - Services to oil and gas extraction? Refer to the main
document for an explanation of the economic burden concept for Gross Receipts Tax. This year, the methodology for calculating the State tax
amount was improved somewhat, but those improvements are not reflected in the following table. Note that in the course of 2013, 30 coun-
ties had reported activity in at least one of the three NAICS codes. Only DeBaca, Los Alamos and Mora Counties reported no gross receipts ac-
tivity. For FY 2014, only Los Alamos County reported no GRT activity. Although the methodology has been improved this year, most of the dif-
ferences between 2013 and 2014 for this county are real. Extraction activity was significantly less in FY 2014 than in FY 2013. Drilling activity
was approximately flat. However, well services, completion, fracking and other recurring and non-recurring services significantly expanded.
6. GRT paid by OGAS interests in the three NAICS in FY 2013 totaled $176 million." Similarly, GRT paid by OGAS interests in FY 2014 in the four
NAICS codes totaled $207 million.
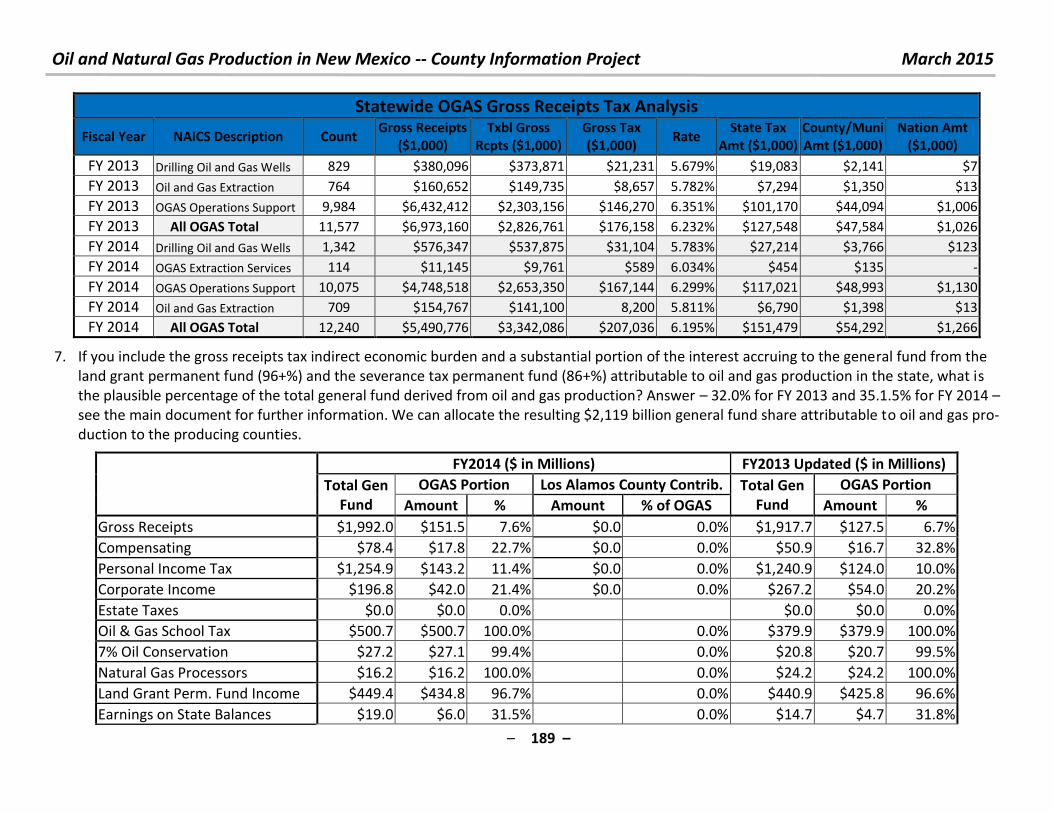
Oil and Natural Gas Production in New Mexico -- County Information Project March 2015
– 189 –
Statewide OGAS Gross Receipts Tax Analysis
Fiscal Year NAICS Description Count Gross Receipts
($1,000)
Txbl Gross
Rcpts ($1,000)
Gross Tax
($1,000) Rate
State Tax
Amt ($1,000)
County/Muni
Amt ($1,000)
Nation Amt
($1,000)
FY 2013 Drilling Oil and Gas Wells 829 $380,096 $373,871 $21,231 5.679% $19,083 $2,141 $7
FY 2013 Oil and Gas Extraction 764 $160,652 $149,735 $8,657 5.782% $7,294 $1,350 $13
FY 2013 OGAS Operations Support 9,984 $6,432,412 $2,303,156 $146,270 6.351% $101,170 $44,094 $1,006
FY 2013 All OGAS Total 11,577 $6,973,160 $2,826,761 $176,158 6.232% $127,548 $47,584 $1,026
FY 2014 Drilling Oil and Gas Wells 1,342 $576,347 $537,875 $31,104 5.783% $27,214 $3,766 $123
FY 2014 OGAS Extraction Services 114 $11,145 $9,761 $589 6.034% $454 $135 -
FY 2014 OGAS Operations Support 10,075 $4,748,518 $2,653,350 $167,144 6.299% $117,021 $48,993 $1,130
FY 2014 Oil and Gas Extraction 709 $154,767 $141,100 8,200 5.811% $6,790 $1,398 $13
FY 2014 All OGAS Total 12,240 $5,490,776 $3,342,086 $207,036 6.195% $151,479 $54,292 $1,266
7. If you include the gross receipts tax indirect economic burden and a substantial portion of the interest accruing to the general fund from the
land grant permanent fund (96+%) and the severance tax permanent fund (86+%) attributable to oil and gas production in the state, what is
the plausible percentage of the total general fund derived from oil and gas production? Answer – 32.0% for FY 2013 and 35.1.5% for FY 2014 –
see the main document for further information. We can allocate the resulting $2,119 billion general fund share attributable to oil and gas pro-
duction to the producing counties.
FY2014 ($ in Millions) FY2013 Updated ($ in Millions)
Total Gen
Fund
OGAS Portion Los Alamos County Contrib. Total Gen
Fund
OGAS Portion
Amount % Amount % of OGAS Amount %
Gross Receipts $1,992.0 $151.5 7.6% $0.0 0.0% $1,917.7 $127.5 6.7%
Compensating $78.4 $17.8 22.7% $0.0 0.0% $50.9 $16.7 32.8%
Personal Income Tax $1,254.9 $143.2 11.4% $0.0 0.0% $1,240.9 $124.0 10.0%
Corporate Income $196.8 $42.0 21.4% $0.0 0.0% $267.2 $54.0 20.2%
Estate Taxes $0.0 $0.0 0.0%
$0.0 $0.0 0.0%
Oil & Gas School Tax $500.7 $500.7 100.0%
0.0% $379.9 $379.9 100.0%
7% Oil Conservation $27.2 $27.1 99.4%
0.0% $20.8 $20.7 99.5%
Natural Gas Processors $16.2 $16.2 100.0%
0.0% $24.2 $24.2 100.0%
Land Grant Perm. Fund Income $449.4 $434.8 96.7%
0.0% $440.9 $425.8 96.6%
Earnings on State Balances $19.0 $6.0 31.5%
0.0% $14.7 $4.7 31.8%
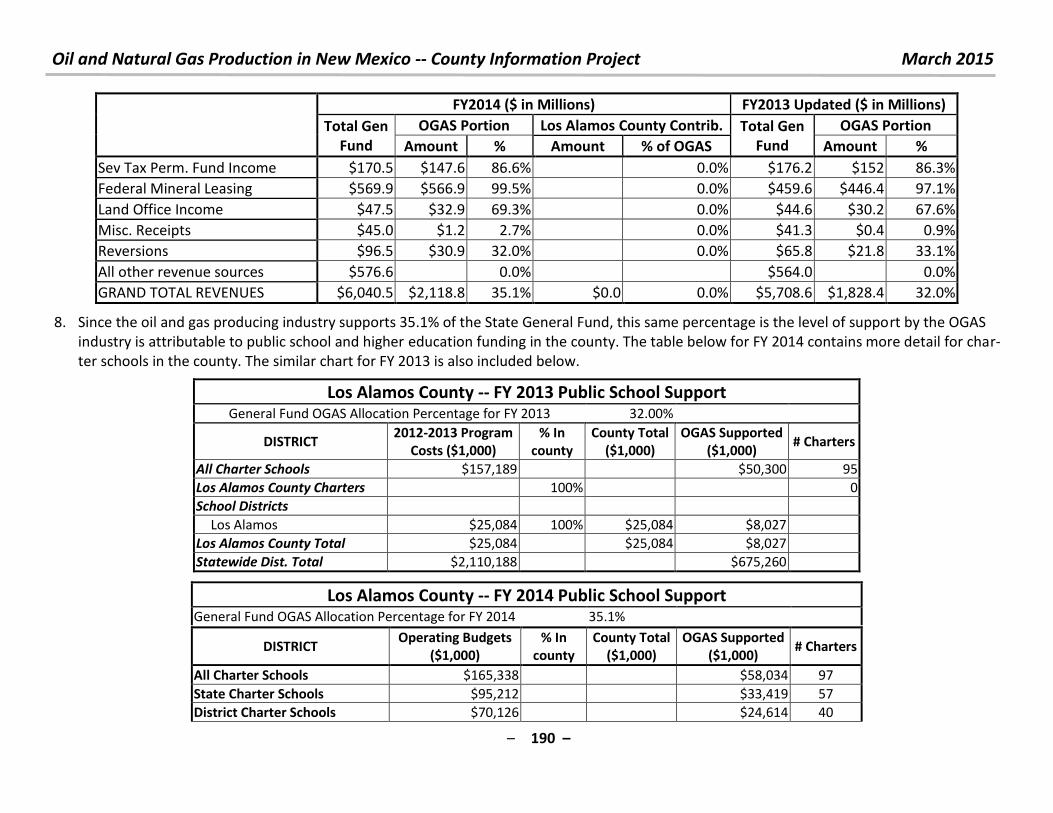
Oil and Natural Gas Production in New Mexico -- County Information Project March 2015
– 190 –
FY2014 ($ in Millions) FY2013 Updated ($ in Millions)
Total Gen
Fund
OGAS Portion Los Alamos County Contrib. Total Gen
Fund
OGAS Portion
Amount % Amount % of OGAS Amount %
Sev Tax Perm. Fund Income $170.5 $147.6 86.6%
0.0% $176.2 $152 86.3%
Federal Mineral Leasing $569.9 $566.9 99.5%
0.0% $459.6 $446.4 97.1%
Land Office Income $47.5 $32.9 69.3%
0.0% $44.6 $30.2 67.6%
Misc. Receipts $45.0 $1.2 2.7%
0.0% $41.3 $0.4 0.9%
Reversions $96.5 $30.9 32.0%
0.0% $65.8 $21.8 33.1%
All other revenue sources $576.6
0.0%
$564.0
0.0%
GRAND TOTAL REVENUES $6,040.5 $2,118.8 35.1% $0.0 0.0% $5,708.6 $1,828.4 32.0%
8. Since the oil and gas producing industry supports 35.1% of the State General Fund, this same percentage is the level of support by the OGAS
industry is attributable to public school and higher education funding in the county. The table below for FY 2014 contains more detail for char-
ter schools in the county. The similar chart for FY 2013 is also included below.
Los Alamos County -- FY 2013 Public School Support General Fund OGAS Allocation Percentage for FY 2013 32.00%
DISTRICT 2012-2013 Program
Costs ($1,000)
% In
county
County Total
($1,000)
OGAS Supported
($1,000) # Charters
All Charter Schools $157,189 $50,300 95
Los Alamos County Charters 100% 0
School Districts
Los Alamos $25,084 100% $25,084 $8,027
Los Alamos County Total $25,084 $25,084 $8,027
Statewide Dist. Total $2,110,188 $675,260
Los Alamos County -- FY 2014 Public School Support General Fund OGAS Allocation Percentage for FY 2014 35.1%
DISTRICT Operating Budgets
($1,000)
% In
county
County Total
($1,000)
OGAS Supported
($1,000) # Charters
All Charter Schools $165,338 $58,034 97
State Charter Schools $95,212 $33,419 57
District Charter Schools $70,126 $24,614 40
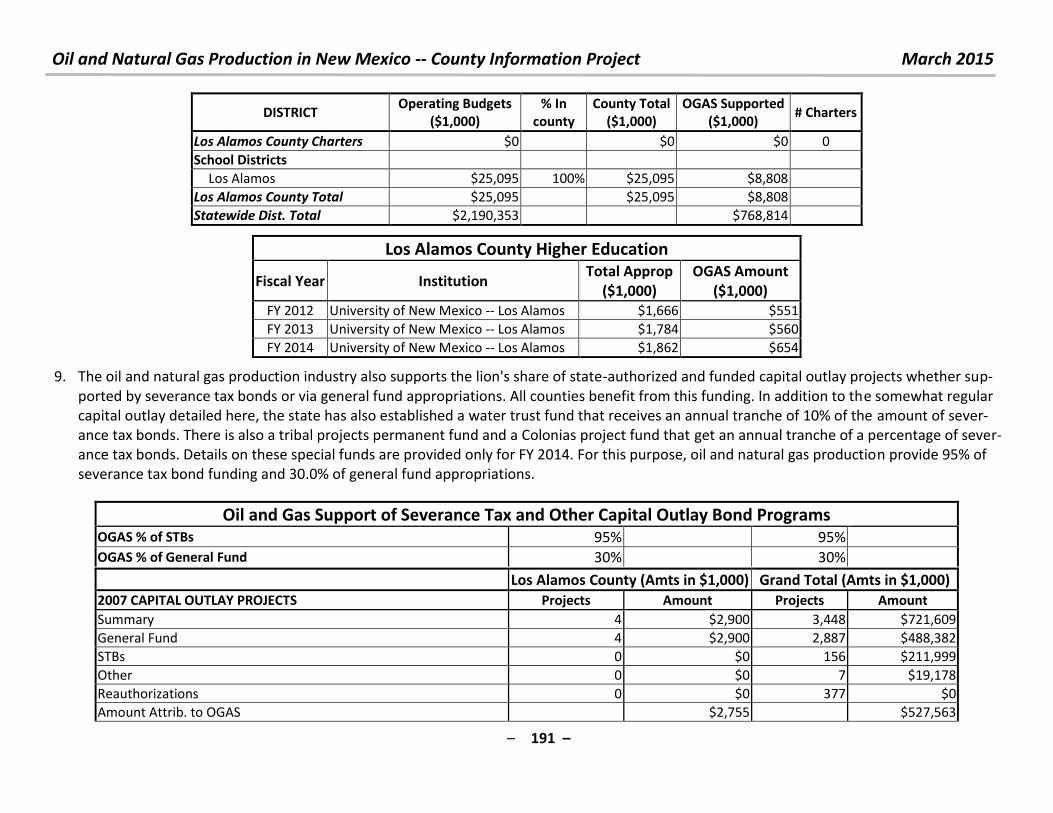
Oil and Natural Gas Production in New Mexico -- County Information Project March 2015
– 191 –
DISTRICT Operating Budgets
($1,000)
% In
county
County Total
($1,000)
OGAS Supported
($1,000) # Charters
Los Alamos County Charters $0 $0 $0 0
School Districts
Los Alamos $25,095 100% $25,095 $8,808
Los Alamos County Total $25,095
$25,095 $8,808
Statewide Dist. Total $2,190,353
$768,814
Los Alamos County Higher Education
Fiscal Year Institution Total Approp
($1,000)
OGAS Amount
($1,000)
FY 2012 University of New Mexico -- Los Alamos $1,666 $551
FY 2013 University of New Mexico -- Los Alamos $1,784 $560
FY 2014 University of New Mexico -- Los Alamos $1,862 $654
9. The oil and natural gas production industry also supports the lion's share of state-authorized and funded capital outlay projects whether sup-
ported by severance tax bonds or via general fund appropriations. All counties benefit from this funding. In addition to the somewhat regular
capital outlay detailed here, the state has also established a water trust fund that receives an annual tranche of 10% of the amount of sever-
ance tax bonds. There is also a tribal projects permanent fund and a Colonias project fund that get an annual tranche of a percentage of sever-
ance tax bonds. Details on these special funds are provided only for FY 2014. For this purpose, oil and natural gas production provide 95% of
severance tax bond funding and 30.0% of general fund appropriations.
Oil and Gas Support of Severance Tax and Other Capital Outlay Bond Programs OGAS % of STBs 95% 95%
OGAS % of General Fund 30% 30%
Los Alamos County (Amts in $1,000) Grand Total (Amts in $1,000)
2007 CAPITAL OUTLAY PROJECTS Projects Amount Projects Amount
Summary 4 $2,900 3,448 $721,609
General Fund 4 $2,900 2,887 $488,382
STBs 0 $0 156 $211,999
Other 0 $0 7 $19,178
Reauthorizations 0 $0 377 $0
Amount Attrib. to OGAS $2,755 $527,563
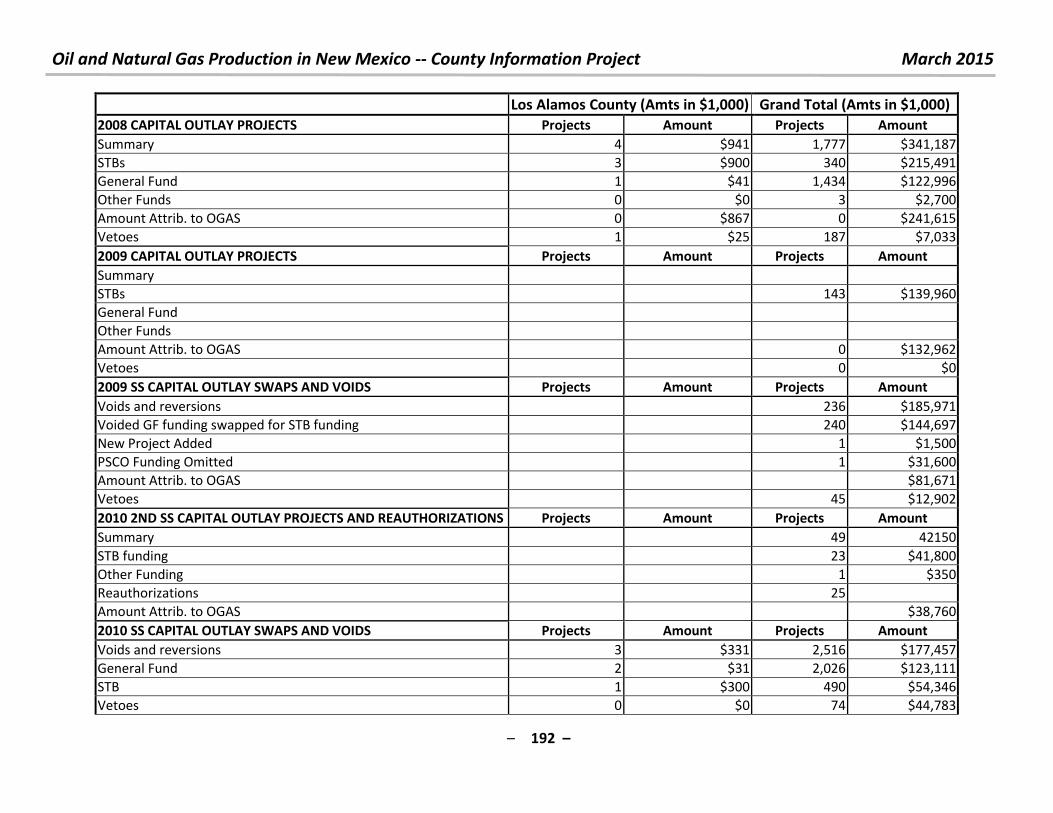
Oil and Natural Gas Production in New Mexico -- County Information Project March 2015
– 192 –
Los Alamos County (Amts in $1,000) Grand Total (Amts in $1,000)
2008 CAPITAL OUTLAY PROJECTS Projects Amount Projects Amount
Summary 4 $941 1,777 $341,187
STBs 3 $900 340 $215,491
General Fund 1 $41 1,434 $122,996
Other Funds 0 $0 3 $2,700
Amount Attrib. to OGAS 0 $867 0 $241,615
Vetoes 1 $25 187 $7,033
2009 CAPITAL OUTLAY PROJECTS Projects Amount Projects Amount
Summary
STBs 143 $139,960
General Fund
Other Funds
Amount Attrib. to OGAS 0 $132,962
Vetoes 0 $0
2009 SS CAPITAL OUTLAY SWAPS AND VOIDS Projects Amount Projects Amount
Voids and reversions 236 $185,971
Voided GF funding swapped for STB funding 240 $144,697
New Project Added 1 $1,500
PSCO Funding Omitted 1 $31,600
Amount Attrib. to OGAS $81,671
Vetoes 45 $12,902
2010 2ND SS CAPITAL OUTLAY PROJECTS AND REAUTHORIZATIONS Projects Amount Projects Amount
Summary 49 42150
STB funding 23 $41,800
Other Funding 1 $350
Reauthorizations 25
Amount Attrib. to OGAS $38,760
2010 SS CAPITAL OUTLAY SWAPS AND VOIDS Projects Amount Projects Amount
Voids and reversions 3 $331 2,516 $177,457
General Fund 2 $31 2,026 $123,111
STB 1 $300 490 $54,346
Vetoes 0 $0 74 $44,783
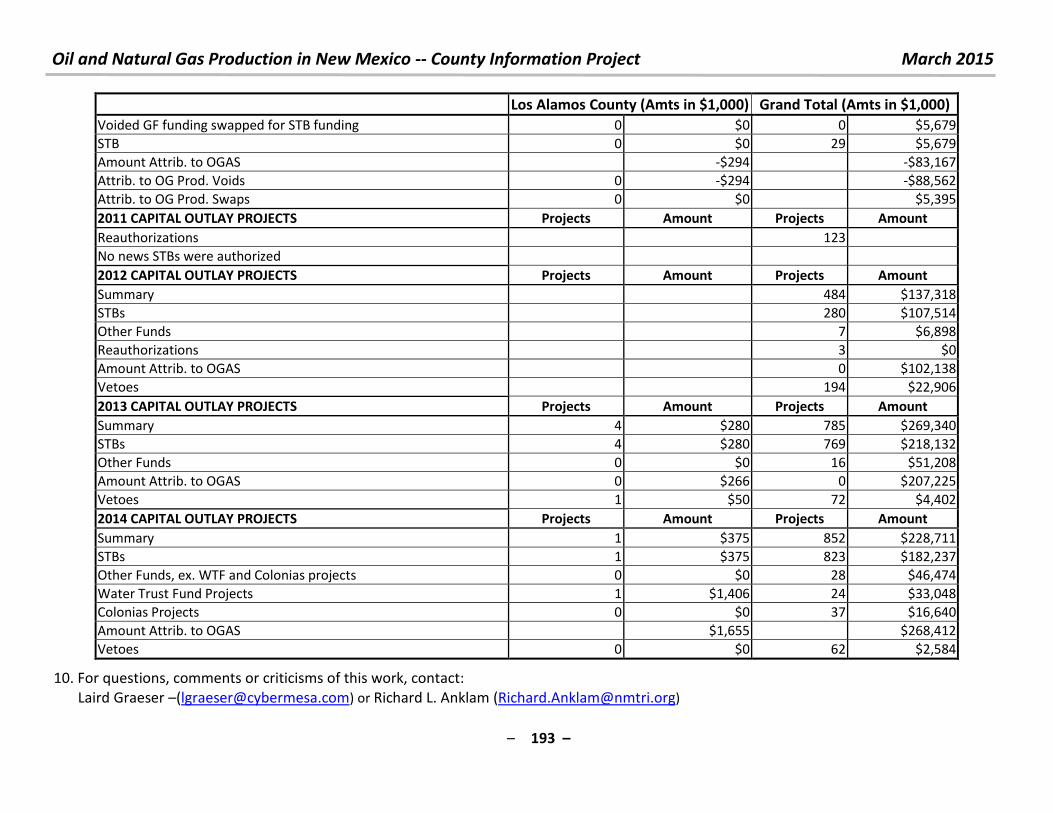
Oil and Natural Gas Production in New Mexico -- County Information Project March 2015
– 193 –
Los Alamos County (Amts in $1,000) Grand Total (Amts in $1,000)
Voided GF funding swapped for STB funding 0 $0 0 $5,679
STB 0 $0 29 $5,679
Amount Attrib. to OGAS -$294 -$83,167
Attrib. to OG Prod. Voids 0 -$294 -$88,562
Attrib. to OG Prod. Swaps 0 $0 $5,395
2011 CAPITAL OUTLAY PROJECTS Projects Amount Projects Amount
Reauthorizations 123
No news STBs were authorized
2012 CAPITAL OUTLAY PROJECTS Projects Amount Projects Amount
Summary 484 $137,318
STBs 280 $107,514
Other Funds 7 $6,898
Reauthorizations 3 $0
Amount Attrib. to OGAS 0 $102,138
Vetoes 194 $22,906
2013 CAPITAL OUTLAY PROJECTS Projects Amount Projects Amount
Summary 4 $280 785 $269,340
STBs 4 $280 769 $218,132
Other Funds 0 $0 16 $51,208
Amount Attrib. to OGAS 0 $266 0 $207,225
Vetoes 1 $50 72 $4,402
2014 CAPITAL OUTLAY PROJECTS Projects Amount Projects Amount
Summary 1 $375 852 $228,711
STBs 1 $375 823 $182,237
Other Funds, ex. WTF and Colonias projects 0 $0 28 $46,474
Water Trust Fund Projects 1 $1,406 24 $33,048
Colonias Projects 0 $0 37 $16,640
Amount Attrib. to OGAS $1,655 $268,412
Vetoes 0 $0 62 $2,584
10. For questions, comments or criticisms of this work, contact:
Laird Graeser –([email protected]) or Richard L. Anklam ([email protected])
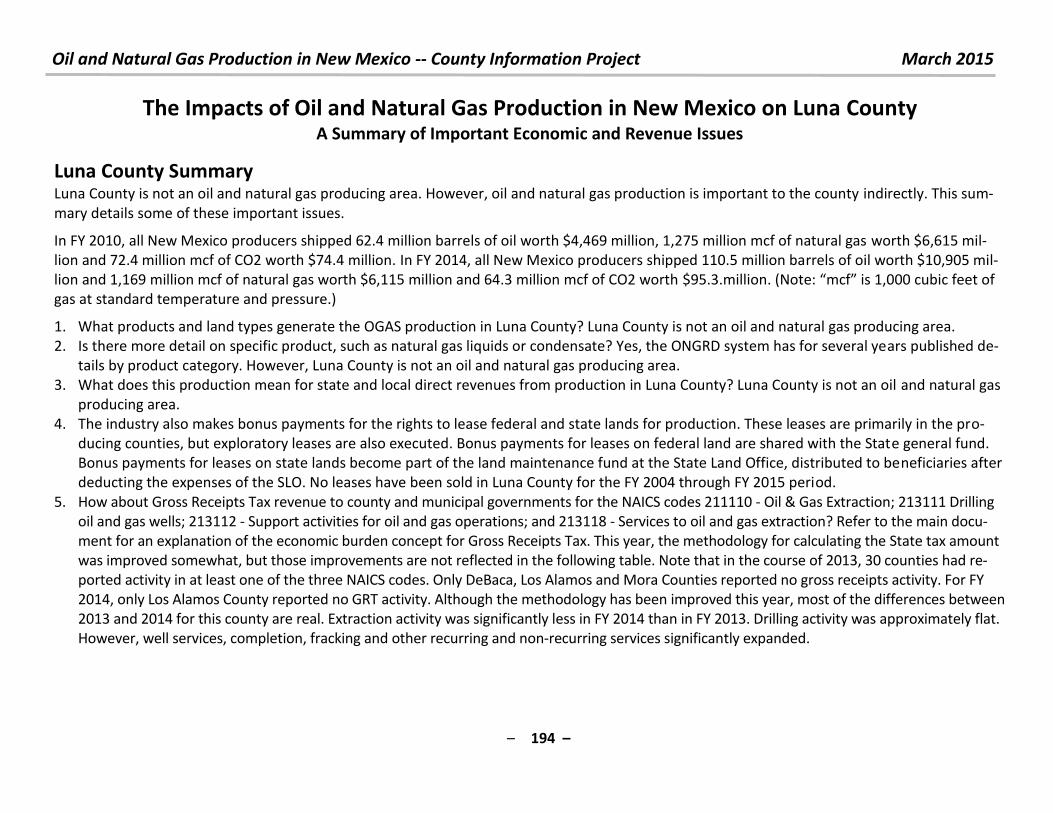
Oil and Natural Gas Production in New Mexico -- County Information Project March 2015
– 194 –
The Impacts of Oil and Natural Gas Production in New Mexico on Luna County A Summary of Important Economic and Revenue Issues
Luna County Summary
Luna County is not an oil and natural gas producing area. However, oil and natural gas production is important to the county indirectly. This sum-
mary details some of these important issues.
In FY 2010, all New Mexico producers shipped 62.4 million barrels of oil worth $4,469 million, 1,275 million mcf of natural gas worth $6,615 mil-
lion and 72.4 million mcf of CO2 worth $74.4 million. In FY 2014, all New Mexico producers shipped 110.5 million barrels of oil worth $10,905 mil-
lion and 1,169 million mcf of natural gas worth $6,115 million and 64.3 million mcf of CO2 worth $ . . illio . Note: f is , u i feet of gas at standard temperature and pressure.)
1. What products and land types generate the OGAS production in Luna County? Luna County is not an oil and natural gas producing area.
2. Is there more detail on specific product, such as natural gas liquids or condensate? Yes, the ONGRD system has for several years published de-
tails by product category. However, Luna County is not an oil and natural gas producing area.
3. What does this production mean for state and local direct revenues from production in Luna County? Luna County is not an oil and natural gas
producing area.
4. The industry also makes bonus payments for the rights to lease federal and state lands for production. These leases are primarily in the pro-
ducing counties, but exploratory leases are also executed. Bonus payments for leases on federal land are shared with the State general fund.
Bonus payments for leases on state lands become part of the land maintenance fund at the State Land Office, distributed to beneficiaries after
deducting the expenses of the SLO. No leases have been sold in Luna County for the FY 2004 through FY 2015 period.
5. How about Gross Receipts Tax revenue to county and municipal governments for the NAICS codes 211110 - Oil & Gas Extraction; 213111 Drilling
oil and gas wells; 213112 - Support activities for oil and gas operations; and 213118 - Services to oil and gas extraction? Refer to the main docu-
ment for an explanation of the economic burden concept for Gross Receipts Tax. This year, the methodology for calculating the State tax amount
was improved somewhat, but those improvements are not reflected in the following table. Note that in the course of 2013, 30 counties had re-
ported activity in at least one of the three NAICS codes. Only DeBaca, Los Alamos and Mora Counties reported no gross receipts activity. For FY
2014, only Los Alamos County reported no GRT activity. Although the methodology has been improved this year, most of the differences between
2013 and 2014 for this county are real. Extraction activity was significantly less in FY 2014 than in FY 2013. Drilling activity was approximately flat.
However, well services, completion, fracking and other recurring and non-recurring services significantly expanded.
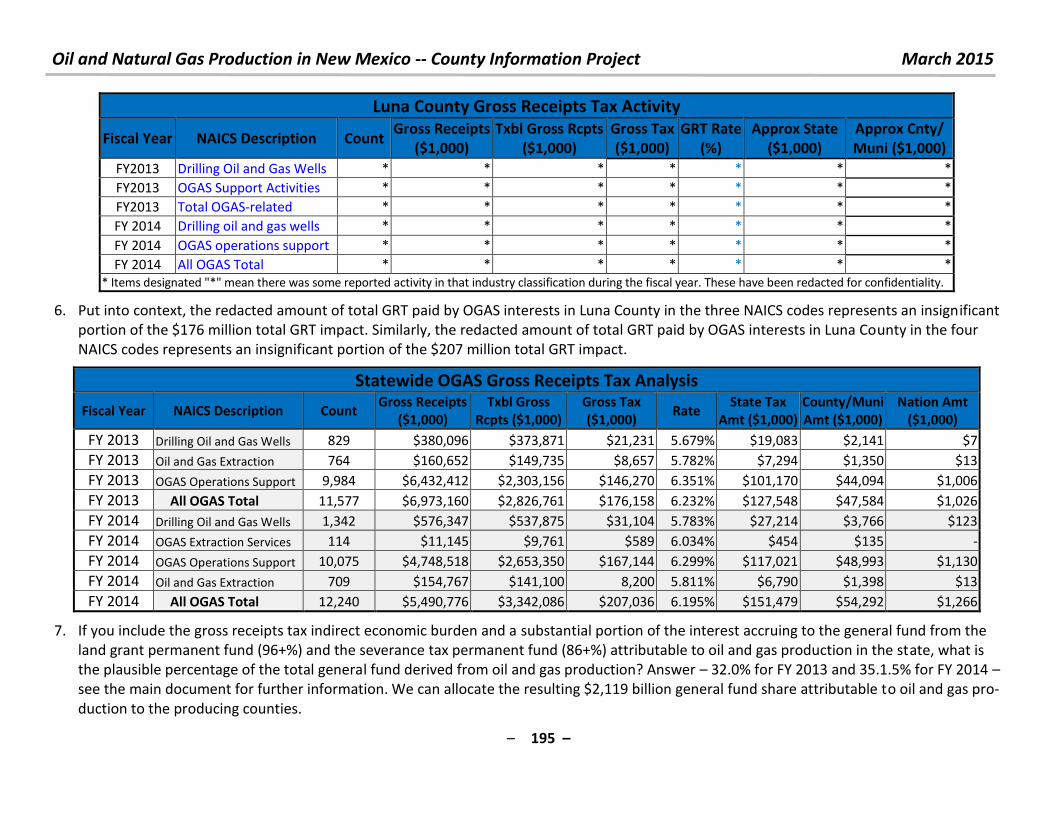
Oil and Natural Gas Production in New Mexico -- County Information Project March 2015
– 195 –
Luna County Gross Receipts Tax Activity
Fiscal Year NAICS Description Count Gross Receipts
($1,000)
Txbl Gross Rcpts
($1,000)
Gross Tax
($1,000)
GRT Rate
(%)
Approx State
($1,000)
Approx Cnty/
Muni ($1,000)
FY2013 Drilling Oil and Gas Wells * * * * * * *
FY2013 OGAS Support Activities * * * * * * *
FY2013 Total OGAS-related * * * * * * *
FY 2014 Drilling oil and gas wells * * * * * * *
FY 2014 OGAS operations support * * * * * * *
FY 2014 All OGAS Total * * * * * * *
* Items designated "*" mean there was some reported activity in that industry classification during the fiscal year. These have been redacted for confidentiality.
6. Put into context, the redacted amount of total GRT paid by OGAS interests in Luna County in the three NAICS codes represents an insignificant
portion of the $176 million total GRT impact. Similarly, the redacted amount of total GRT paid by OGAS interests in Luna County in the four
NAICS codes represents an insignificant portion of the $207 million total GRT impact.
Statewide OGAS Gross Receipts Tax Analysis
Fiscal Year NAICS Description Count Gross Receipts
($1,000)
Txbl Gross
Rcpts ($1,000)
Gross Tax
($1,000) Rate
State Tax
Amt ($1,000)
County/Muni
Amt ($1,000)
Nation Amt
($1,000)
FY 2013 Drilling Oil and Gas Wells 829 $380,096 $373,871 $21,231 5.679% $19,083 $2,141 $7
FY 2013 Oil and Gas Extraction 764 $160,652 $149,735 $8,657 5.782% $7,294 $1,350 $13
FY 2013 OGAS Operations Support 9,984 $6,432,412 $2,303,156 $146,270 6.351% $101,170 $44,094 $1,006
FY 2013 All OGAS Total 11,577 $6,973,160 $2,826,761 $176,158 6.232% $127,548 $47,584 $1,026
FY 2014 Drilling Oil and Gas Wells 1,342 $576,347 $537,875 $31,104 5.783% $27,214 $3,766 $123
FY 2014 OGAS Extraction Services 114 $11,145 $9,761 $589 6.034% $454 $135 -
FY 2014 OGAS Operations Support 10,075 $4,748,518 $2,653,350 $167,144 6.299% $117,021 $48,993 $1,130
FY 2014 Oil and Gas Extraction 709 $154,767 $141,100 8,200 5.811% $6,790 $1,398 $13
FY 2014 All OGAS Total 12,240 $5,490,776 $3,342,086 $207,036 6.195% $151,479 $54,292 $1,266
7. If you include the gross receipts tax indirect economic burden and a substantial portion of the interest accruing to the general fund from the
land grant permanent fund (96+%) and the severance tax permanent fund (86+%) attributable to oil and gas production in the state, what is
the plausible percentage of the total general fund derived from oil and gas production? Answer – 32.0% for FY 2013 and 35.1.5% for FY 2014 –
see the main document for further information. We can allocate the resulting $2,119 billion general fund share attributable to oil and gas pro-
duction to the producing counties.
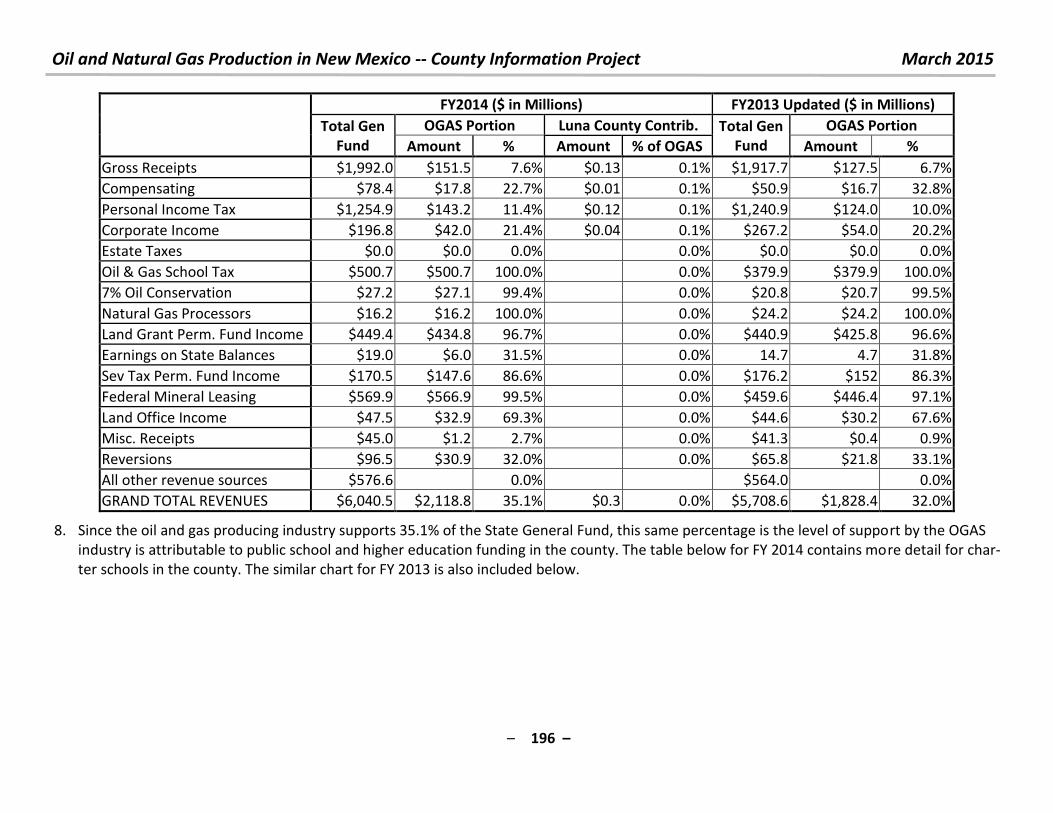
Oil and Natural Gas Production in New Mexico -- County Information Project March 2015
– 196 –
FY2014 ($ in Millions) FY2013 Updated ($ in Millions)
Total Gen
Fund
OGAS Portion Luna County Contrib. Total Gen
Fund
OGAS Portion
Amount % Amount % of OGAS Amount %
Gross Receipts $1,992.0 $151.5 7.6% $0.13 0.1% $1,917.7 $127.5 6.7%
Compensating $78.4 $17.8 22.7% $0.01 0.1% $50.9 $16.7 32.8%
Personal Income Tax $1,254.9 $143.2 11.4% $0.12 0.1% $1,240.9 $124.0 10.0%
Corporate Income $196.8 $42.0 21.4% $0.04 0.1% $267.2 $54.0 20.2%
Estate Taxes $0.0 $0.0 0.0%
0.0% $0.0 $0.0 0.0%
Oil & Gas School Tax $500.7 $500.7 100.0%
0.0% $379.9 $379.9 100.0%
7% Oil Conservation $27.2 $27.1 99.4%
0.0% $20.8 $20.7 99.5%
Natural Gas Processors $16.2 $16.2 100.0%
0.0% $24.2 $24.2 100.0%
Land Grant Perm. Fund Income $449.4 $434.8 96.7%
0.0% $440.9 $425.8 96.6%
Earnings on State Balances $19.0 $6.0 31.5%
0.0% 14.7 4.7 31.8%
Sev Tax Perm. Fund Income $170.5 $147.6 86.6%
0.0% $176.2 $152 86.3%
Federal Mineral Leasing $569.9 $566.9 99.5%
0.0% $459.6 $446.4 97.1%
Land Office Income $47.5 $32.9 69.3%
0.0% $44.6 $30.2 67.6%
Misc. Receipts $45.0 $1.2 2.7%
0.0% $41.3 $0.4 0.9%
Reversions $96.5 $30.9 32.0%
0.0% $65.8 $21.8 33.1%
All other revenue sources $576.6
0.0%
$564.0
0.0%
GRAND TOTAL REVENUES $6,040.5 $2,118.8 35.1% $0.3 0.0% $5,708.6 $1,828.4 32.0%
8. Since the oil and gas producing industry supports 35.1% of the State General Fund, this same percentage is the level of support by the OGAS
industry is attributable to public school and higher education funding in the county. The table below for FY 2014 contains more detail for char-
ter schools in the county. The similar chart for FY 2013 is also included below.
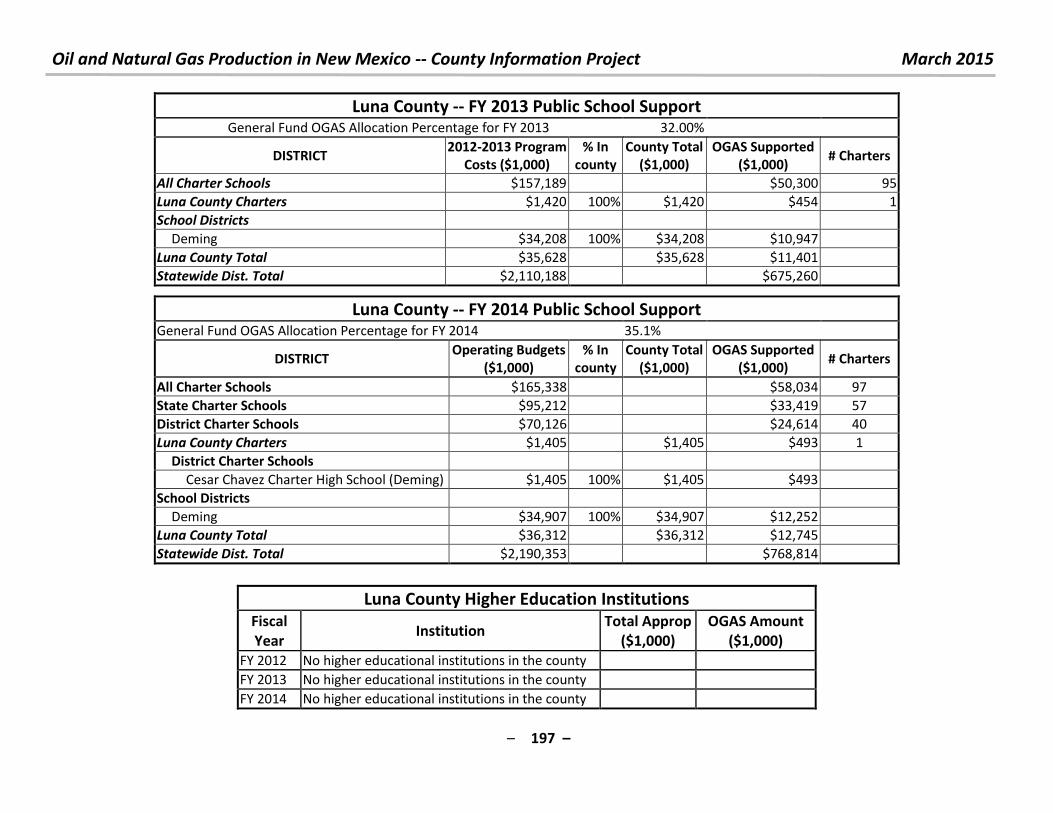
Oil and Natural Gas Production in New Mexico -- County Information Project March 2015
– 197 –
Luna County -- FY 2013 Public School Support General Fund OGAS Allocation Percentage for FY 2013 32.00%
DISTRICT 2012-2013 Program
Costs ($1,000)
% In
county
County Total
($1,000)
OGAS Supported
($1,000) # Charters
All Charter Schools $157,189
$50,300 95
Luna County Charters $1,420 100% $1,420 $454 1
School Districts
Deming $34,208 100% $34,208 $10,947
Luna County Total $35,628
$35,628 $11,401
Statewide Dist. Total $2,110,188
$675,260
Luna County -- FY 2014 Public School Support General Fund OGAS Allocation Percentage for FY 2014 35.1%
DISTRICT Operating Budgets
($1,000)
% In
county
County Total
($1,000)
OGAS Supported
($1,000) # Charters
All Charter Schools $165,338
$58,034 97
State Charter Schools $95,212
$33,419 57
District Charter Schools $70,126
$24,614 40
Luna County Charters $1,405
$1,405 $493 1
District Charter Schools
Cesar Chavez Charter High School (Deming) $1,405 100% $1,405 $493
School Districts
Deming $34,907 100% $34,907 $12,252
Luna County Total $36,312
$36,312 $12,745
Statewide Dist. Total $2,190,353
$768,814
Luna County Higher Education Institutions Fiscal
Year Institution
Total Approp
($1,000)
OGAS Amount
($1,000)
FY 2012 No higher educational institutions in the county
FY 2013 No higher educational institutions in the county
FY 2014 No higher educational institutions in the county

Oil and Natural Gas Production in New Mexico -- County Information Project March 2015
– 198 –
9. The oil and natural gas production industry also supports the lion's share of state-authorized and funded capital outlay projects whether sup-
ported by severance tax bonds or via general fund appropriations. All counties benefit from this funding. In addition to the somewhat regular
capital outlay detailed here, the state has also established a water trust fund that receives an annual tranche of 10% of the amount of sever-
ance tax bonds. There is also a tribal projects permanent fund and a Colonias project fund that get an annual tranche of a percentage of sever-
ance tax bonds. Details on these special funds are provided only for FY 2014. For this purpose, oil and natural gas production provide 95% of
severance tax bond funding and 30.0% of general fund appropriations.
Oil and Gas Support of Severance Tax and Other Capital Outlay Bond Programs OGAS % of STBs 95% 95%
OGAS % of General Fund 30% 30%
Luna County (Amts in $1,000) Grand Total (Amts in $1,000)
2007 CAPITAL OUTLAY PROJECTS Projects Amount Projects Amount
Summary 15 $4,781 3,448 $721,609
General Fund 12 $3,181 2,887 $488,382
STBs 2 $1,600 156 $211,999
Other 0 $0 7 $19,178
Reauthorizations 1 $0 377 $0
Amount Attrib. to OGAS $3,502 $527,563
2008 CAPITAL OUTLAY PROJECTS Projects Amount Projects Amount
Summary 9 $2,137 1,777 $341,187
STBs 5 $1,673 340 $215,491
General Fund 4 $464 1,434 $122,996
Other Funds 0 $0 3 $2,700
Amount Attrib. to OGAS 0 $1,729 0 $241,615
Vetoes 1 $500 187 $7,033
2009 CAPITAL OUTLAY PROJECTS Projects Amount Projects Amount
Summary
STBs 143 $139,960
General Fund
Other Funds
Amount Attrib. to OGAS 0 $132,962
Vetoes 0 $0
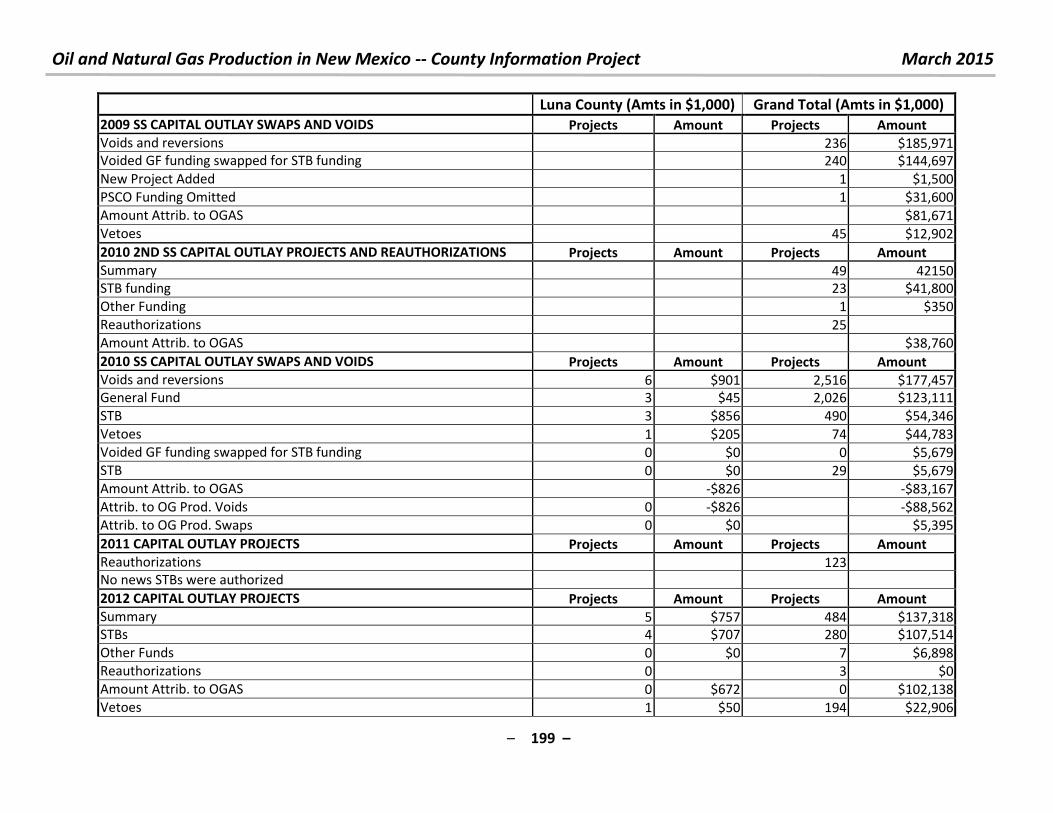
Oil and Natural Gas Production in New Mexico -- County Information Project March 2015
– 199 –
Luna County (Amts in $1,000) Grand Total (Amts in $1,000)
2009 SS CAPITAL OUTLAY SWAPS AND VOIDS Projects Amount Projects Amount
Voids and reversions 236 $185,971
Voided GF funding swapped for STB funding 240 $144,697
New Project Added 1 $1,500
PSCO Funding Omitted 1 $31,600
Amount Attrib. to OGAS $81,671
Vetoes 45 $12,902
2010 2ND SS CAPITAL OUTLAY PROJECTS AND REAUTHORIZATIONS Projects Amount Projects Amount
Summary 49 42150
STB funding 23 $41,800
Other Funding 1 $350
Reauthorizations 25
Amount Attrib. to OGAS $38,760
2010 SS CAPITAL OUTLAY SWAPS AND VOIDS Projects Amount Projects Amount
Voids and reversions 6 $901 2,516 $177,457
General Fund 3 $45 2,026 $123,111
STB 3 $856 490 $54,346
Vetoes 1 $205 74 $44,783
Voided GF funding swapped for STB funding 0 $0 0 $5,679
STB 0 $0 29 $5,679
Amount Attrib. to OGAS -$826 -$83,167
Attrib. to OG Prod. Voids 0 -$826 -$88,562
Attrib. to OG Prod. Swaps 0 $0 $5,395
2011 CAPITAL OUTLAY PROJECTS Projects Amount Projects Amount
Reauthorizations 123
No news STBs were authorized
2012 CAPITAL OUTLAY PROJECTS Projects Amount Projects Amount
Summary 5 $757 484 $137,318
STBs 4 $707 280 $107,514
Other Funds 0 $0 7 $6,898
Reauthorizations 0 3 $0
Amount Attrib. to OGAS 0 $672 0 $102,138
Vetoes 1 $50 194 $22,906
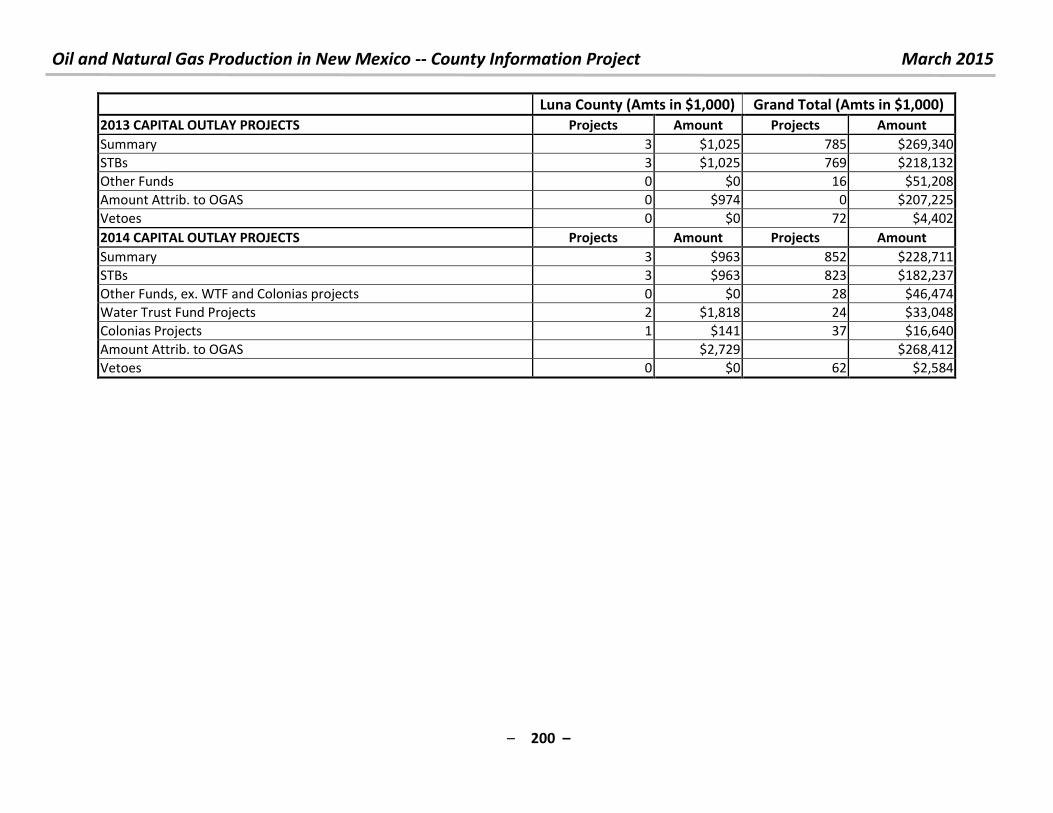
Oil and Natural Gas Production in New Mexico -- County Information Project March 2015
– 200 –
Luna County (Amts in $1,000) Grand Total (Amts in $1,000)
2013 CAPITAL OUTLAY PROJECTS Projects Amount Projects Amount
Summary 3 $1,025 785 $269,340
STBs 3 $1,025 769 $218,132
Other Funds 0 $0 16 $51,208
Amount Attrib. to OGAS 0 $974 0 $207,225
Vetoes 0 $0 72 $4,402
2014 CAPITAL OUTLAY PROJECTS Projects Amount Projects Amount
Summary 3 $963 852 $228,711
STBs 3 $963 823 $182,237
Other Funds, ex. WTF and Colonias projects 0 $0 28 $46,474
Water Trust Fund Projects 2 $1,818 24 $33,048
Colonias Projects 1 $141 37 $16,640
Amount Attrib. to OGAS $2,729 $268,412
Vetoes 0 $0 62 $2,584

Oil and Natural Gas Production in New Mexico -- County Information Project March 2015
– 201 –
10. For questions, comments or criticisms of this work, contact:
Laird Graeser
505 424-9023
or
Richard L. Anklam, President & Executive Director, New Mexico Tax Research Institute
505-269-6791
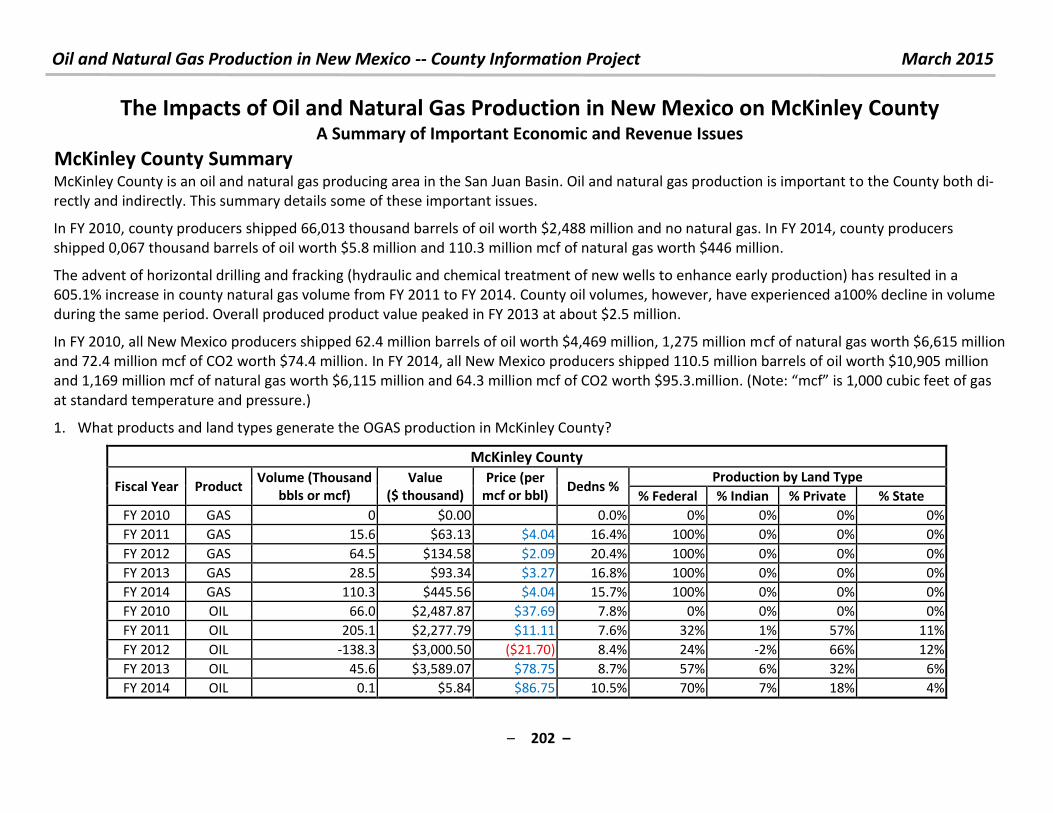
Oil and Natural Gas Production in New Mexico -- County Information Project March 2015
– 202 –
The Impacts of Oil and Natural Gas Production in New Mexico on McKinley County A Summary of Important Economic and Revenue Issues
McKinley County Summary
McKinley County is an oil and natural gas producing area in the San Juan Basin. Oil and natural gas production is important to the County both di-
rectly and indirectly. This summary details some of these important issues.
In FY 2010, county producers shipped 66,013 thousand barrels of oil worth $2,488 million and no natural gas. In FY 2014, county producers
shipped 0,067 thousand barrels of oil worth $5.8 million and 110.3 million mcf of natural gas worth $446 million.
The advent of horizontal drilling and fracking (hydraulic and chemical treatment of new wells to enhance early production) has resulted in a
605.1% increase in county natural gas volume from FY 2011 to FY 2014. County oil volumes, however, have experienced a100% decline in volume
during the same period. Overall produced product value peaked in FY 2013 at about $2.5 million.
In FY 2010, all New Mexico producers shipped 62.4 million barrels of oil worth $4,469 million, 1,275 million mcf of natural gas worth $6,615 million
and 72.4 million mcf of CO2 worth $74.4 million. In FY 2014, all New Mexico producers shipped 110.5 million barrels of oil worth $10,905 million
and 1,169 million mcf of natural gas worth $6,115 million and 64.3 million mcf of CO2 worth $ . . illio . Note: f is , u i feet of gas at standard temperature and pressure.)
1. What products and land types generate the OGAS production in McKinley County?
McKinley County
Fiscal Year Product Volume (Thousand
bbls or mcf)
Value
($ thousand)
Price (per
mcf or bbl) Dedns %
Production by Land Type
% Federal % Indian % Private % State
FY 2010 GAS 0 $0.00 0.0% 0% 0% 0% 0%
FY 2011 GAS 15.6 $63.13 $4.04 16.4% 100% 0% 0% 0%
FY 2012 GAS 64.5 $134.58 $2.09 20.4% 100% 0% 0% 0%
FY 2013 GAS 28.5 $93.34 $3.27 16.8% 100% 0% 0% 0%
FY 2014 GAS 110.3 $445.56 $4.04 15.7% 100% 0% 0% 0%
FY 2010 OIL 66.0 $2,487.87 $37.69 7.8% 0% 0% 0% 0%
FY 2011 OIL 205.1 $2,277.79 $11.11 7.6% 32% 1% 57% 11%
FY 2012 OIL -138.3 $3,000.50 ($21.70) 8.4% 24% -2% 66% 12%
FY 2013 OIL 45.6 $3,589.07 $78.75 8.7% 57% 6% 32% 6%
FY 2014 OIL 0.1 $5.84 $86.75 10.5% 70% 7% 18% 4%
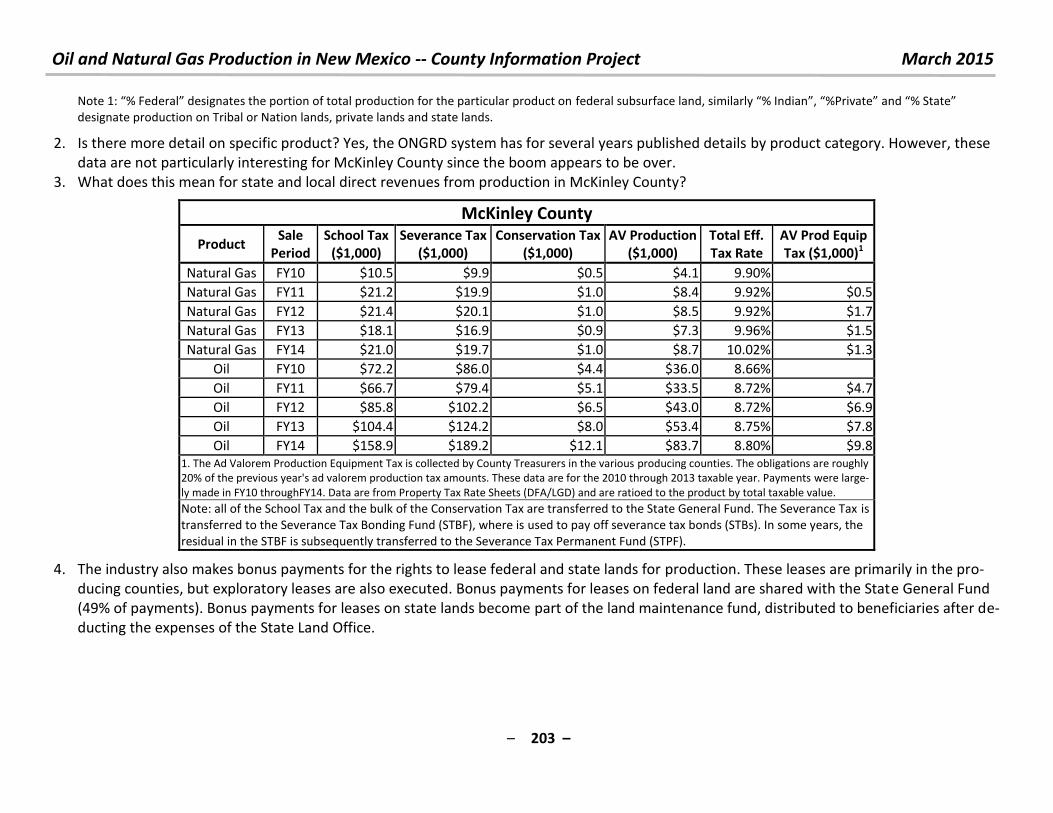
Oil and Natural Gas Production in New Mexico -- County Information Project March 2015
– 203 –
Note : % Fede al desig ates the po tio of total p odu tio fo the pa ti ula p odu t o fede al su su fa e la d, si ila l % I dia , %P i ate a d % “tate designate production on Tribal or Nation lands, private lands and state lands.
2. Is there more detail on specific product? Yes, the ONGRD system has for several years published details by product category. However, these
data are not particularly interesting for McKinley County since the boom appears to be over.
3. What does this mean for state and local direct revenues from production in McKinley County?
McKinley County
Product Sale
Period
School Tax
($1,000)
Severance Tax
($1,000)
Conservation Tax
($1,000)
AV Production
($1,000)
Total Eff.
Tax Rate
AV Prod Equip
Tax ($1,000)1
Natural Gas FY10 $10.5 $9.9 $0.5 $4.1 9.90%
Natural Gas FY11 $21.2 $19.9 $1.0 $8.4 9.92% $0.5
Natural Gas FY12 $21.4 $20.1 $1.0 $8.5 9.92% $1.7
Natural Gas FY13 $18.1 $16.9 $0.9 $7.3 9.96% $1.5
Natural Gas FY14 $21.0 $19.7 $1.0 $8.7 10.02% $1.3
Oil FY10 $72.2 $86.0 $4.4 $36.0 8.66%
Oil FY11 $66.7 $79.4 $5.1 $33.5 8.72% $4.7
Oil FY12 $85.8 $102.2 $6.5 $43.0 8.72% $6.9
Oil FY13 $104.4 $124.2 $8.0 $53.4 8.75% $7.8
Oil FY14 $158.9 $189.2 $12.1 $83.7 8.80% $9.8
1. The Ad Valorem Production Equipment Tax is collected by County Treasurers in the various producing counties. The obligations are roughly
20% of the previous year's ad valorem production tax amounts. These data are for the 2010 through 2013 taxable year. Payments were large-
ly made in FY10 throughFY14. Data are from Property Tax Rate Sheets (DFA/LGD) and are ratioed to the product by total taxable value.
Note: all of the School Tax and the bulk of the Conservation Tax are transferred to the State General Fund. The Severance Tax is
transferred to the Severance Tax Bonding Fund (STBF), where is used to pay off severance tax bonds (STBs). In some years, the
residual in the STBF is subsequently transferred to the Severance Tax Permanent Fund (STPF).
4. The industry also makes bonus payments for the rights to lease federal and state lands for production. These leases are primarily in the pro-
ducing counties, but exploratory leases are also executed. Bonus payments for leases on federal land are shared with the State General Fund
(49% of payments). Bonus payments for leases on state lands become part of the land maintenance fund, distributed to beneficiaries after de-
ducting the expenses of the State Land Office.
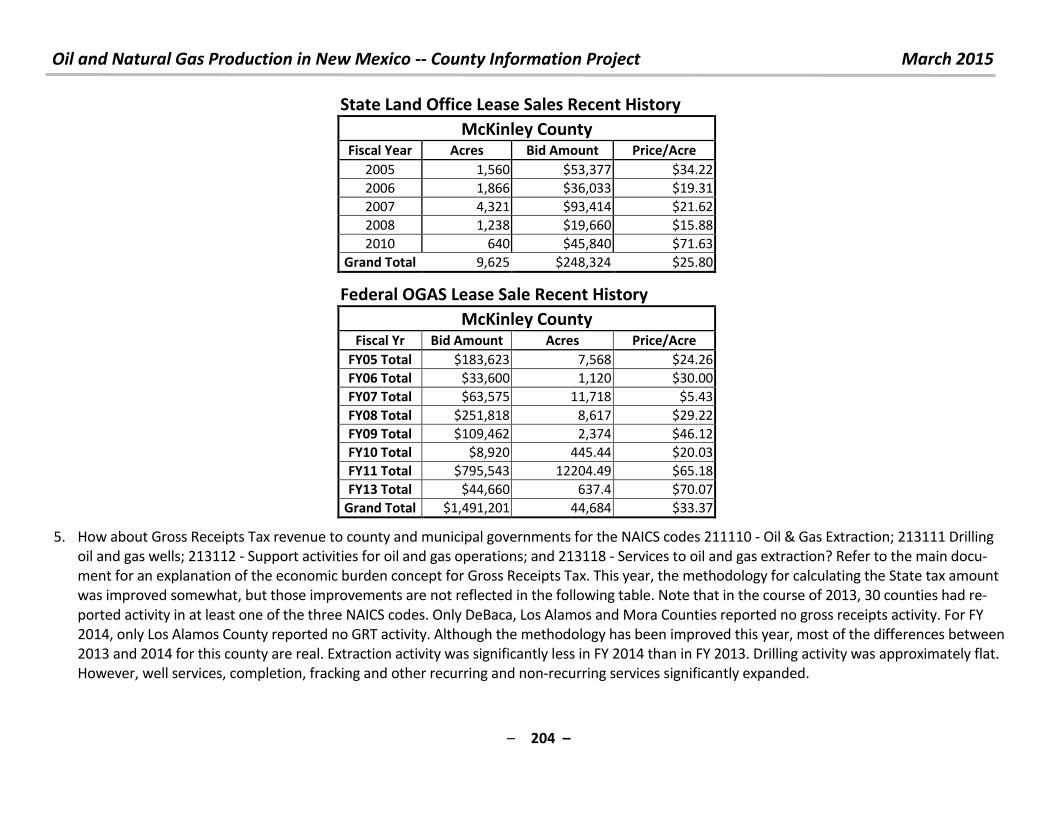
Oil and Natural Gas Production in New Mexico -- County Information Project March 2015
– 204 –
State Land Office Lease Sales Recent History
McKinley County Fiscal Year Acres Bid Amount Price/Acre
2005 1,560 $53,377 $34.22
2006 1,866 $36,033 $19.31
2007 4,321 $93,414 $21.62
2008 1,238 $19,660 $15.88
2010 640 $45,840 $71.63
Grand Total 9,625 $248,324 $25.80
Federal OGAS Lease Sale Recent History
McKinley County Fiscal Yr Bid Amount Acres Price/Acre
FY05 Total $183,623 7,568 $24.26
FY06 Total $33,600 1,120 $30.00
FY07 Total $63,575 11,718 $5.43
FY08 Total $251,818 8,617 $29.22
FY09 Total $109,462 2,374 $46.12
FY10 Total $8,920 445.44 $20.03
FY11 Total $795,543 12204.49 $65.18
FY13 Total $44,660 637.4 $70.07
Grand Total $1,491,201 44,684 $33.37
5. How about Gross Receipts Tax revenue to county and municipal governments for the NAICS codes 211110 - Oil & Gas Extraction; 213111 Drilling
oil and gas wells; 213112 - Support activities for oil and gas operations; and 213118 - Services to oil and gas extraction? Refer to the main docu-
ment for an explanation of the economic burden concept for Gross Receipts Tax. This year, the methodology for calculating the State tax amount
was improved somewhat, but those improvements are not reflected in the following table. Note that in the course of 2013, 30 counties had re-
ported activity in at least one of the three NAICS codes. Only DeBaca, Los Alamos and Mora Counties reported no gross receipts activity. For FY
2014, only Los Alamos County reported no GRT activity. Although the methodology has been improved this year, most of the differences between
2013 and 2014 for this county are real. Extraction activity was significantly less in FY 2014 than in FY 2013. Drilling activity was approximately flat.
However, well services, completion, fracking and other recurring and non-recurring services significantly expanded.
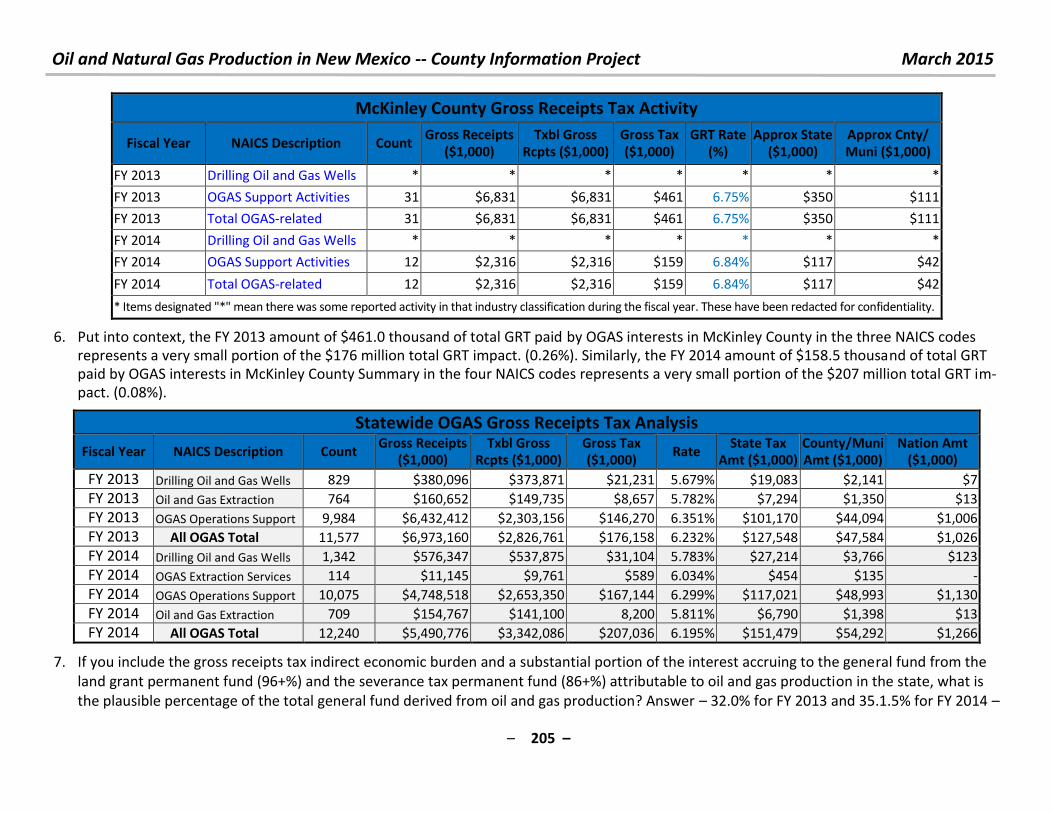
Oil and Natural Gas Production in New Mexico -- County Information Project March 2015
– 205 –
McKinley County Gross Receipts Tax Activity
Fiscal Year NAICS Description Count Gross Receipts
($1,000)
Txbl Gross
Rcpts ($1,000)
Gross Tax
($1,000)
GRT Rate
(%)
Approx State
($1,000)
Approx Cnty/
Muni ($1,000)
FY 2013 Drilling Oil and Gas Wells * * * * * * *
FY 2013 OGAS Support Activities 31 $6,831 $6,831 $461 6.75% $350 $111
FY 2013 Total OGAS-related 31 $6,831 $6,831 $461 6.75% $350 $111
FY 2014 Drilling Oil and Gas Wells * * * * * * *
FY 2014 OGAS Support Activities 12 $2,316 $2,316 $159 6.84% $117 $42
FY 2014 Total OGAS-related 12 $2,316 $2,316 $159 6.84% $117 $42
* Items designated "*" mean there was some reported activity in that industry classification during the fiscal year. These have been redacted for confidentiality.
6. Put into context, the FY 2013 amount of $461.0 thousand of total GRT paid by OGAS interests in McKinley County in the three NAICS codes
represents a very small portion of the $176 million total GRT impact. (0.26%). Similarly, the FY 2014 amount of $158.5 thousand of total GRT
paid by OGAS interests in McKinley County Summary in the four NAICS codes represents a very small portion of the $207 million total GRT im-
pact. (0.08%).
Statewide OGAS Gross Receipts Tax Analysis
Fiscal Year NAICS Description Count Gross Receipts
($1,000) Txbl Gross
Rcpts ($1,000) Gross Tax ($1,000)
Rate State Tax
Amt ($1,000) County/Muni Amt ($1,000)
Nation Amt ($1,000)
FY 2013 Drilling Oil and Gas Wells 829 $380,096 $373,871 $21,231 5.679% $19,083 $2,141 $7
FY 2013 Oil and Gas Extraction 764 $160,652 $149,735 $8,657 5.782% $7,294 $1,350 $13
FY 2013 OGAS Operations Support 9,984 $6,432,412 $2,303,156 $146,270 6.351% $101,170 $44,094 $1,006
FY 2013 All OGAS Total 11,577 $6,973,160 $2,826,761 $176,158 6.232% $127,548 $47,584 $1,026
FY 2014 Drilling Oil and Gas Wells 1,342 $576,347 $537,875 $31,104 5.783% $27,214 $3,766 $123
FY 2014 OGAS Extraction Services 114 $11,145 $9,761 $589 6.034% $454 $135 -
FY 2014 OGAS Operations Support 10,075 $4,748,518 $2,653,350 $167,144 6.299% $117,021 $48,993 $1,130
FY 2014 Oil and Gas Extraction 709 $154,767 $141,100 8,200 5.811% $6,790 $1,398 $13
FY 2014 All OGAS Total 12,240 $5,490,776 $3,342,086 $207,036 6.195% $151,479 $54,292 $1,266
7. If you include the gross receipts tax indirect economic burden and a substantial portion of the interest accruing to the general fund from the
land grant permanent fund (96+%) and the severance tax permanent fund (86+%) attributable to oil and gas production in the state, what is
the plausible percentage of the total general fund derived from oil and gas production? Answer – 32.0% for FY 2013 and 35.1.5% for FY 2014 –
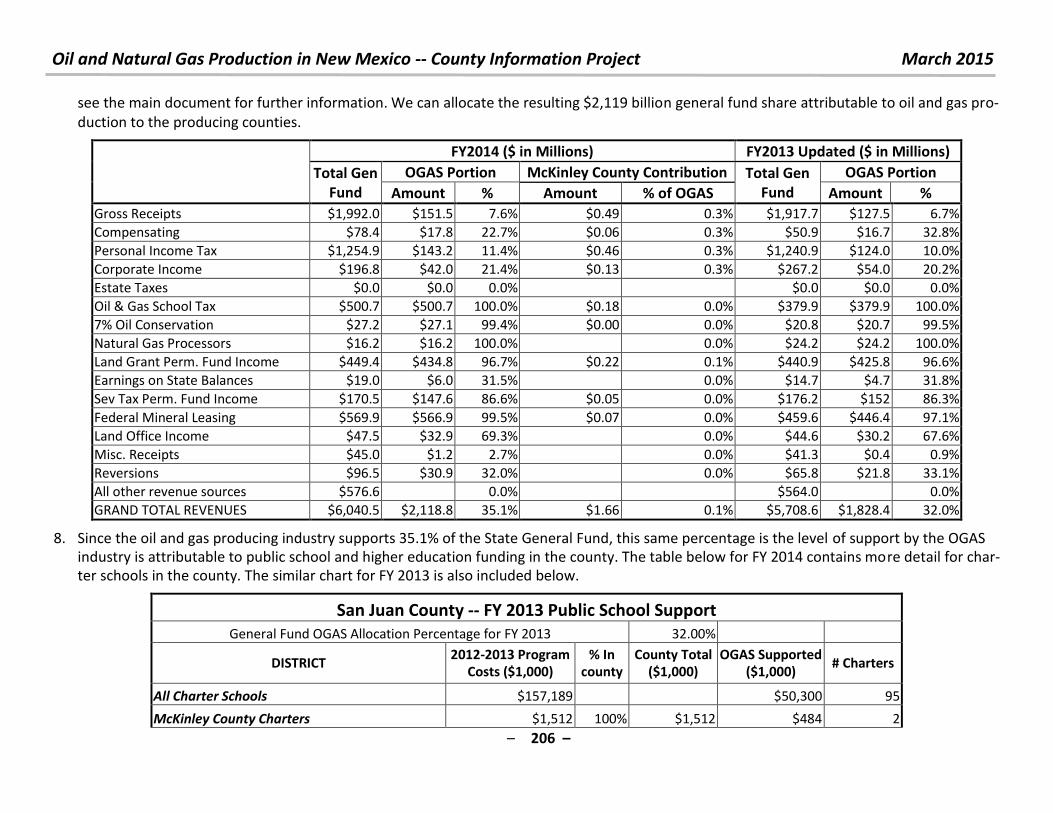
Oil and Natural Gas Production in New Mexico -- County Information Project March 2015
– 206 –
see the main document for further information. We can allocate the resulting $2,119 billion general fund share attributable to oil and gas pro-
duction to the producing counties.
FY2014 ($ in Millions) FY2013 Updated ($ in Millions)
Total Gen
Fund
OGAS Portion McKinley County Contribution Total Gen
Fund
OGAS Portion
Amount % Amount % of OGAS Amount %
Gross Receipts $1,992.0 $151.5 7.6% $0.49 0.3% $1,917.7 $127.5 6.7%
Compensating $78.4 $17.8 22.7% $0.06 0.3% $50.9 $16.7 32.8%
Personal Income Tax $1,254.9 $143.2 11.4% $0.46 0.3% $1,240.9 $124.0 10.0%
Corporate Income $196.8 $42.0 21.4% $0.13 0.3% $267.2 $54.0 20.2%
Estate Taxes $0.0 $0.0 0.0% $0.0 $0.0 0.0%
Oil & Gas School Tax $500.7 $500.7 100.0% $0.18 0.0% $379.9 $379.9 100.0%
7% Oil Conservation $27.2 $27.1 99.4% $0.00 0.0% $20.8 $20.7 99.5%
Natural Gas Processors $16.2 $16.2 100.0% 0.0% $24.2 $24.2 100.0%
Land Grant Perm. Fund Income $449.4 $434.8 96.7% $0.22 0.1% $440.9 $425.8 96.6%
Earnings on State Balances $19.0 $6.0 31.5% 0.0% $14.7 $4.7 31.8%
Sev Tax Perm. Fund Income $170.5 $147.6 86.6% $0.05 0.0% $176.2 $152 86.3%
Federal Mineral Leasing $569.9 $566.9 99.5% $0.07 0.0% $459.6 $446.4 97.1%
Land Office Income $47.5 $32.9 69.3% 0.0% $44.6 $30.2 67.6%
Misc. Receipts $45.0 $1.2 2.7% 0.0% $41.3 $0.4 0.9%
Reversions $96.5 $30.9 32.0% 0.0% $65.8 $21.8 33.1%
All other revenue sources $576.6 0.0% $564.0
0.0%
GRAND TOTAL REVENUES $6,040.5 $2,118.8 35.1% $1.66 0.1% $5,708.6 $1,828.4 32.0%
8. Since the oil and gas producing industry supports 35.1% of the State General Fund, this same percentage is the level of support by the OGAS
industry is attributable to public school and higher education funding in the county. The table below for FY 2014 contains more detail for char-
ter schools in the county. The similar chart for FY 2013 is also included below.
San Juan County -- FY 2013 Public School Support
General Fund OGAS Allocation Percentage for FY 2013 32.00%
DISTRICT 2012-2013 Program
Costs ($1,000)
% In
county
County Total
($1,000)
OGAS Supported
($1,000) # Charters
All Charter Schools $157,189
$50,300 95
McKinley County Charters $1,512 100% $1,512 $484 2
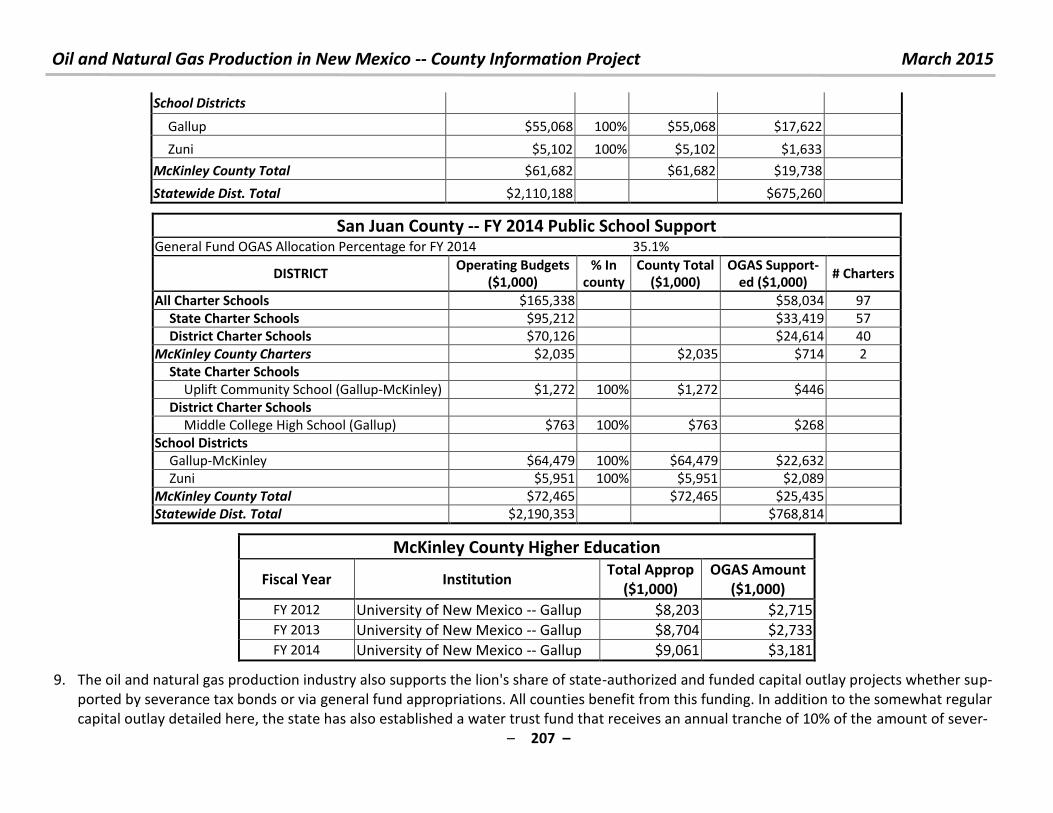
Oil and Natural Gas Production in New Mexico -- County Information Project March 2015
– 207 –
School Districts
Gallup $55,068 100% $55,068 $17,622
Zuni $5,102 100% $5,102 $1,633
McKinley County Total $61,682
$61,682 $19,738
Statewide Dist. Total $2,110,188
$675,260
San Juan County -- FY 2014 Public School Support General Fund OGAS Allocation Percentage for FY 2014 35.1%
DISTRICT Operating Budgets
($1,000)
% In
county
County Total
($1,000)
OGAS Support-
ed ($1,000) # Charters
All Charter Schools $165,338
$58,034 97
State Charter Schools $95,212
$33,419 57
District Charter Schools $70,126
$24,614 40
McKinley County Charters $2,035
$2,035 $714 2
State Charter Schools
Uplift Community School (Gallup-McKinley) $1,272 100% $1,272 $446
District Charter Schools
Middle College High School (Gallup) $763 100% $763 $268
School Districts
Gallup-McKinley $64,479 100% $64,479 $22,632
Zuni $5,951 100% $5,951 $2,089
McKinley County Total $72,465
$72,465 $25,435
Statewide Dist. Total $2,190,353
$768,814
McKinley County Higher Education
Fiscal Year Institution Total Approp
($1,000)
OGAS Amount
($1,000)
FY 2012 University of New Mexico -- Gallup $8,203 $2,715
FY 2013 University of New Mexico -- Gallup $8,704 $2,733
FY 2014 University of New Mexico -- Gallup $9,061 $3,181
9. The oil and natural gas production industry also supports the lion's share of state-authorized and funded capital outlay projects whether sup-
ported by severance tax bonds or via general fund appropriations. All counties benefit from this funding. In addition to the somewhat regular
capital outlay detailed here, the state has also established a water trust fund that receives an annual tranche of 10% of the amount of sever-
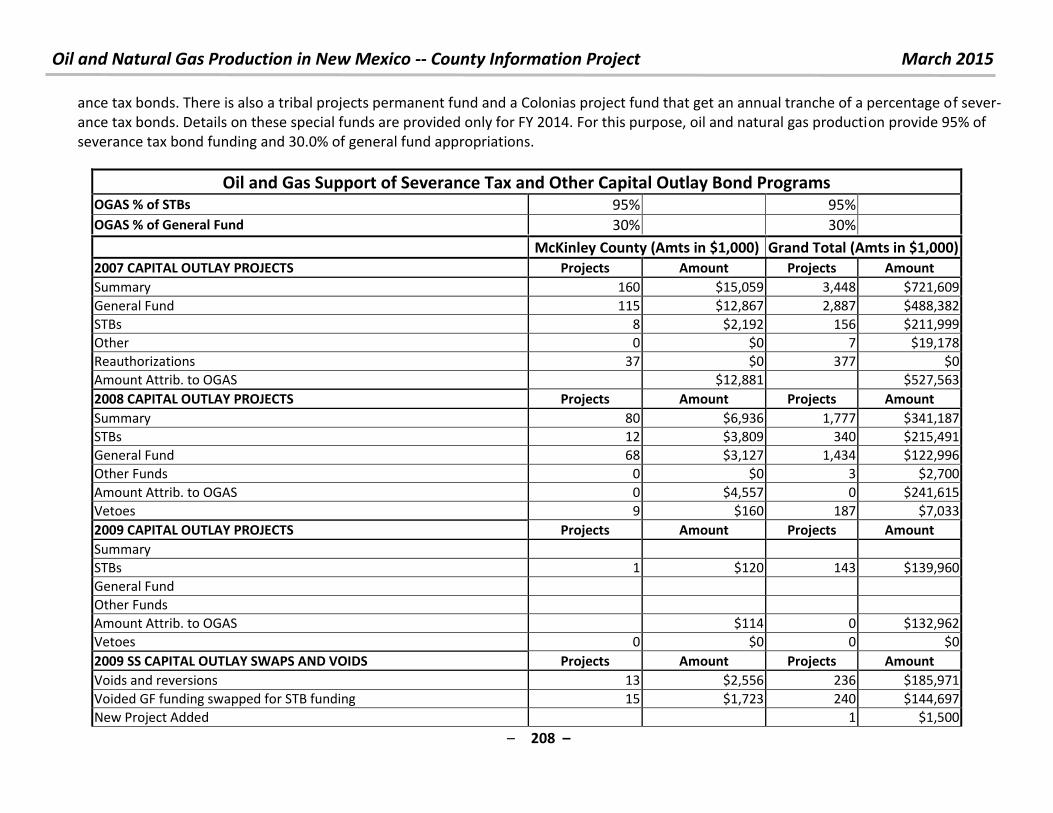
Oil and Natural Gas Production in New Mexico -- County Information Project March 2015
– 208 –
ance tax bonds. There is also a tribal projects permanent fund and a Colonias project fund that get an annual tranche of a percentage of sever-
ance tax bonds. Details on these special funds are provided only for FY 2014. For this purpose, oil and natural gas production provide 95% of
severance tax bond funding and 30.0% of general fund appropriations.
Oil and Gas Support of Severance Tax and Other Capital Outlay Bond Programs OGAS % of STBs 95% 95%
OGAS % of General Fund 30% 30%
McKinley County (Amts in $1,000) Grand Total (Amts in $1,000)
2007 CAPITAL OUTLAY PROJECTS Projects Amount Projects Amount
Summary 160 $15,059 3,448 $721,609
General Fund 115 $12,867 2,887 $488,382
STBs 8 $2,192 156 $211,999
Other 0 $0 7 $19,178
Reauthorizations 37 $0 377 $0
Amount Attrib. to OGAS $12,881 $527,563
2008 CAPITAL OUTLAY PROJECTS Projects Amount Projects Amount
Summary 80 $6,936 1,777 $341,187
STBs 12 $3,809 340 $215,491
General Fund 68 $3,127 1,434 $122,996
Other Funds 0 $0 3 $2,700
Amount Attrib. to OGAS 0 $4,557 0 $241,615
Vetoes 9 $160 187 $7,033
2009 CAPITAL OUTLAY PROJECTS Projects Amount Projects Amount
Summary
STBs 1 $120 143 $139,960
General Fund
Other Funds
Amount Attrib. to OGAS $114 0 $132,962
Vetoes 0 $0 0 $0
2009 SS CAPITAL OUTLAY SWAPS AND VOIDS Projects Amount Projects Amount
Voids and reversions 13 $2,556 236 $185,971
Voided GF funding swapped for STB funding 15 $1,723 240 $144,697
New Project Added 1 $1,500
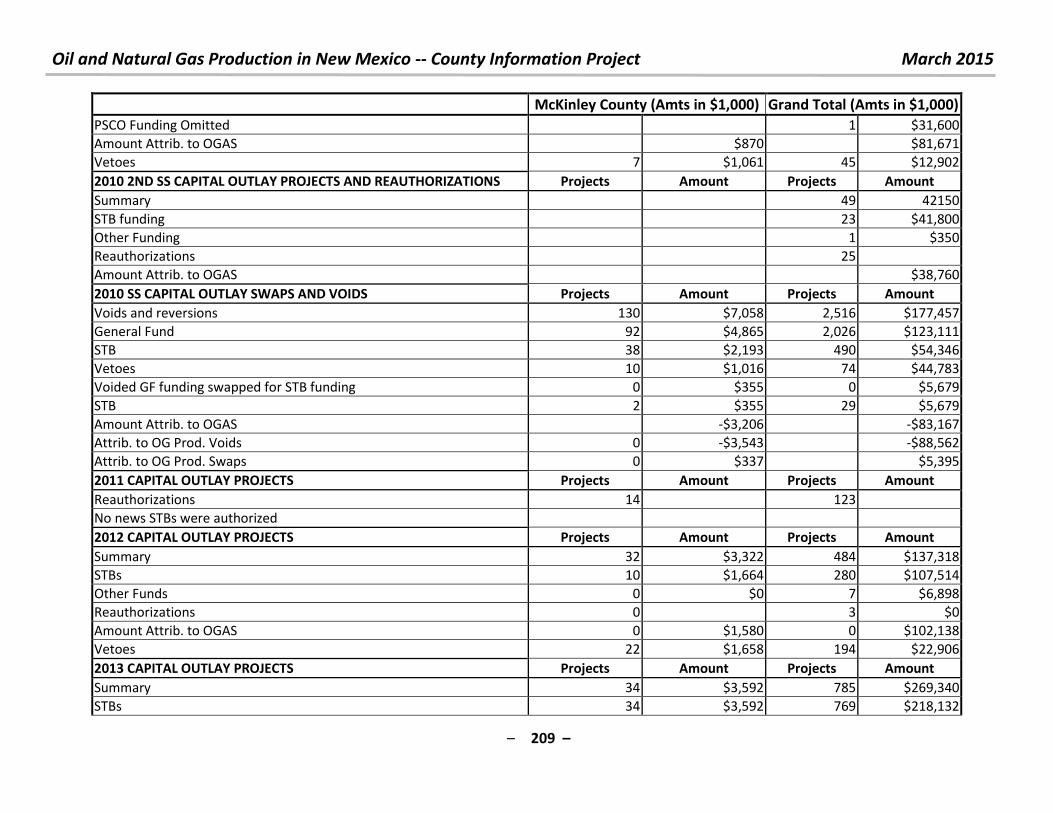
Oil and Natural Gas Production in New Mexico -- County Information Project March 2015
– 209 –
McKinley County (Amts in $1,000) Grand Total (Amts in $1,000)
PSCO Funding Omitted 1 $31,600
Amount Attrib. to OGAS $870 $81,671
Vetoes 7 $1,061 45 $12,902
2010 2ND SS CAPITAL OUTLAY PROJECTS AND REAUTHORIZATIONS Projects Amount Projects Amount
Summary 49 42150
STB funding 23 $41,800
Other Funding 1 $350
Reauthorizations 25
Amount Attrib. to OGAS $38,760
2010 SS CAPITAL OUTLAY SWAPS AND VOIDS Projects Amount Projects Amount
Voids and reversions 130 $7,058 2,516 $177,457
General Fund 92 $4,865 2,026 $123,111
STB 38 $2,193 490 $54,346
Vetoes 10 $1,016 74 $44,783
Voided GF funding swapped for STB funding 0 $355 0 $5,679
STB 2 $355 29 $5,679
Amount Attrib. to OGAS -$3,206 -$83,167
Attrib. to OG Prod. Voids 0 -$3,543 -$88,562
Attrib. to OG Prod. Swaps 0 $337 $5,395
2011 CAPITAL OUTLAY PROJECTS Projects Amount Projects Amount
Reauthorizations 14 123
No news STBs were authorized
2012 CAPITAL OUTLAY PROJECTS Projects Amount Projects Amount
Summary 32 $3,322 484 $137,318
STBs 10 $1,664 280 $107,514
Other Funds 0 $0 7 $6,898
Reauthorizations 0 3 $0
Amount Attrib. to OGAS 0 $1,580 0 $102,138
Vetoes 22 $1,658 194 $22,906
2013 CAPITAL OUTLAY PROJECTS Projects Amount Projects Amount
Summary 34 $3,592 785 $269,340
STBs 34 $3,592 769 $218,132
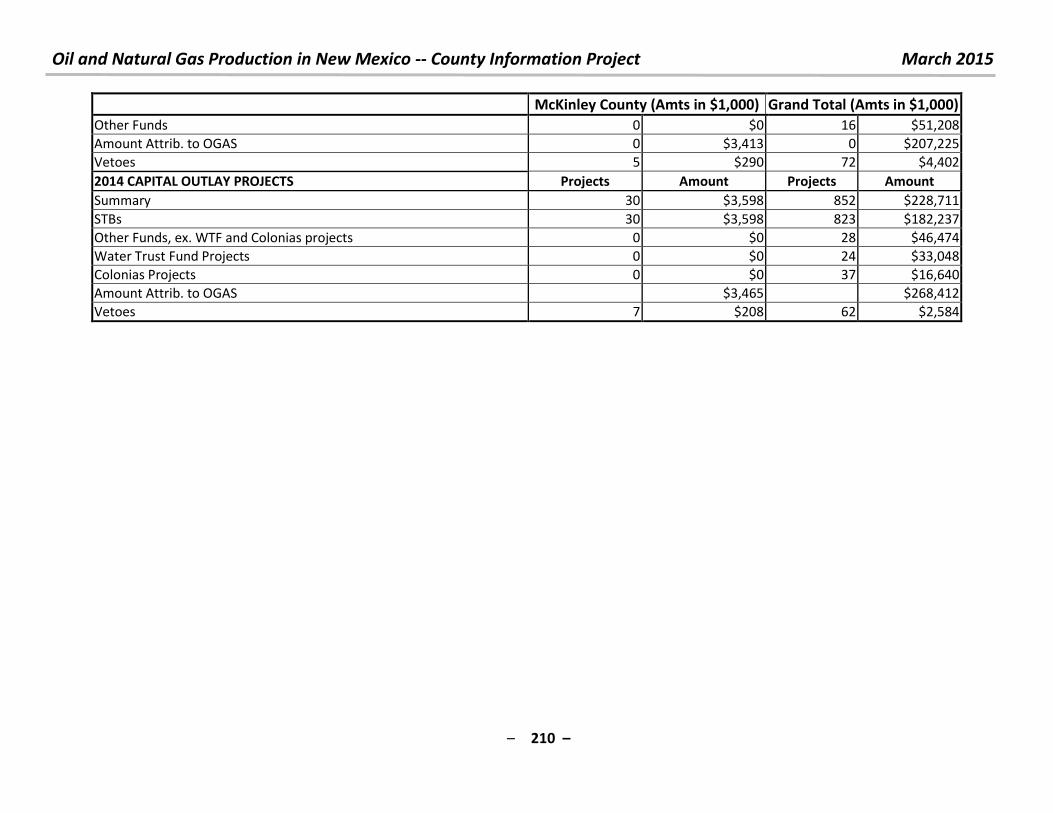
Oil and Natural Gas Production in New Mexico -- County Information Project March 2015
– 210 –
McKinley County (Amts in $1,000) Grand Total (Amts in $1,000)
Other Funds 0 $0 16 $51,208
Amount Attrib. to OGAS 0 $3,413 0 $207,225
Vetoes 5 $290 72 $4,402
2014 CAPITAL OUTLAY PROJECTS Projects Amount Projects Amount
Summary 30 $3,598 852 $228,711
STBs 30 $3,598 823 $182,237
Other Funds, ex. WTF and Colonias projects 0 $0 28 $46,474
Water Trust Fund Projects 0 $0 24 $33,048
Colonias Projects 0 $0 37 $16,640
Amount Attrib. to OGAS $3,465 $268,412
Vetoes 7 $208 62 $2,584

Oil and Natural Gas Production in New Mexico -- County Information Project March 2015
– 211 –
10. For questions, comments or criticisms of this work, contact:
Laird Graeser
505 424-9023
or
Richard L. Anklam, President & Executive Director, New Mexico Tax Research Institute
505-269-6791
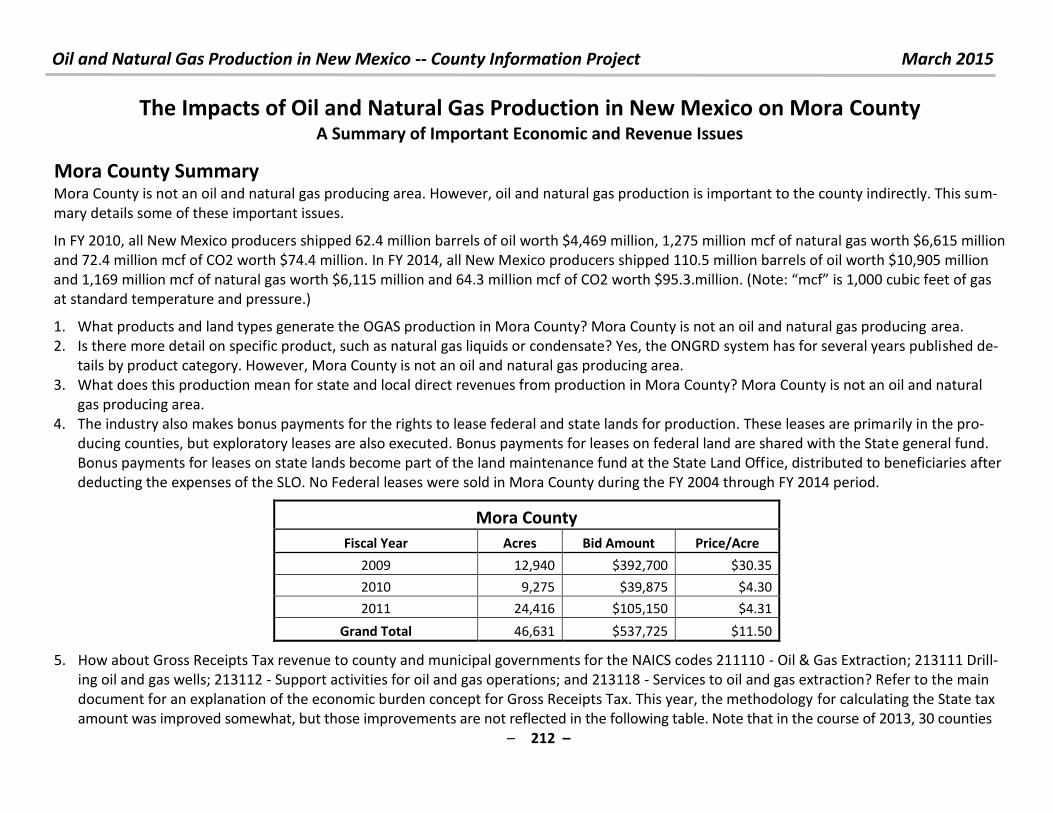
Oil and Natural Gas Production in New Mexico -- County Information Project March 2015
– 212 –
The Impacts of Oil and Natural Gas Production in New Mexico on Mora County A Summary of Important Economic and Revenue Issues
Mora County Summary
Mora County is not an oil and natural gas producing area. However, oil and natural gas production is important to the county indirectly. This sum-
mary details some of these important issues.
In FY 2010, all New Mexico producers shipped 62.4 million barrels of oil worth $4,469 million, 1,275 million mcf of natural gas worth $6,615 million
and 72.4 million mcf of CO2 worth $74.4 million. In FY 2014, all New Mexico producers shipped 110.5 million barrels of oil worth $10,905 million
and 1,169 million mcf of natural gas worth $6,115 million and 64.3 million mcf of CO2 worth $ . . illio . Note: f is , u i feet of gas at standard temperature and pressure.)
1. What products and land types generate the OGAS production in Mora County? Mora County is not an oil and natural gas producing area.
2. Is there more detail on specific product, such as natural gas liquids or condensate? Yes, the ONGRD system has for several years published de-
tails by product category. However, Mora County is not an oil and natural gas producing area.
3. What does this production mean for state and local direct revenues from production in Mora County? Mora County is not an oil and natural
gas producing area.
4. The industry also makes bonus payments for the rights to lease federal and state lands for production. These leases are primarily in the pro-
ducing counties, but exploratory leases are also executed. Bonus payments for leases on federal land are shared with the State general fund.
Bonus payments for leases on state lands become part of the land maintenance fund at the State Land Office, distributed to beneficiaries after
deducting the expenses of the SLO. No Federal leases were sold in Mora County during the FY 2004 through FY 2014 period.
Mora County
Fiscal Year Acres Bid Amount Price/Acre
2009 12,940 $392,700 $30.35
2010 9,275 $39,875 $4.30
2011 24,416 $105,150 $4.31
Grand Total 46,631 $537,725 $11.50
5. How about Gross Receipts Tax revenue to county and municipal governments for the NAICS codes 211110 - Oil & Gas Extraction; 213111 Drill-
ing oil and gas wells; 213112 - Support activities for oil and gas operations; and 213118 - Services to oil and gas extraction? Refer to the main
document for an explanation of the economic burden concept for Gross Receipts Tax. This year, the methodology for calculating the State tax
amount was improved somewhat, but those improvements are not reflected in the following table. Note that in the course of 2013, 30 counties
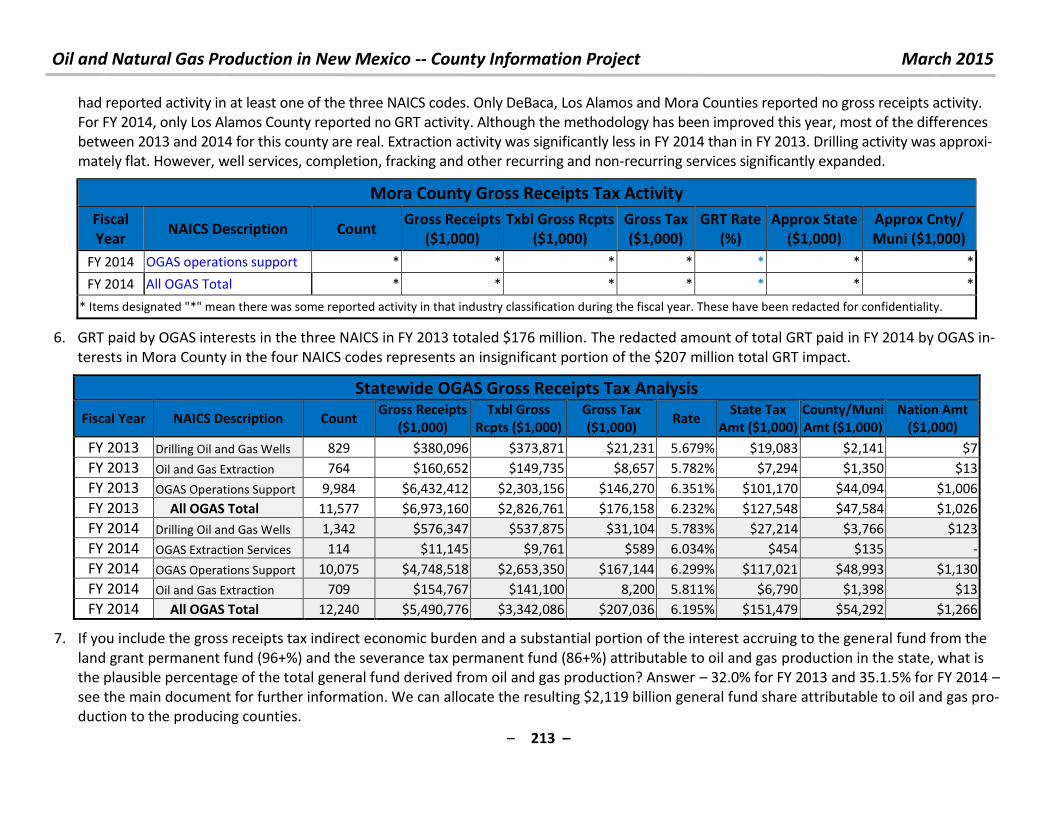
Oil and Natural Gas Production in New Mexico -- County Information Project March 2015
– 213 –
had reported activity in at least one of the three NAICS codes. Only DeBaca, Los Alamos and Mora Counties reported no gross receipts activity.
For FY 2014, only Los Alamos County reported no GRT activity. Although the methodology has been improved this year, most of the differences
between 2013 and 2014 for this county are real. Extraction activity was significantly less in FY 2014 than in FY 2013. Drilling activity was approxi-
mately flat. However, well services, completion, fracking and other recurring and non-recurring services significantly expanded.
Mora County Gross Receipts Tax Activity
Fiscal
Year NAICS Description Count
Gross Receipts
($1,000)
Txbl Gross Rcpts
($1,000)
Gross Tax
($1,000)
GRT Rate
(%)
Approx State
($1,000)
Approx Cnty/
Muni ($1,000)
FY 2014 OGAS operations support * * * * * * *
FY 2014 All OGAS Total * * * * * * *
* Items designated "*" mean there was some reported activity in that industry classification during the fiscal year. These have been redacted for confidentiality.
6. GRT paid by OGAS interests in the three NAICS in FY 2013 totaled $176 million. The redacted amount of total GRT paid in FY 2014 by OGAS in-
terests in Mora County in the four NAICS codes represents an insignificant portion of the $207 million total GRT impact.
Statewide OGAS Gross Receipts Tax Analysis
Fiscal Year NAICS Description Count Gross Receipts
($1,000)
Txbl Gross
Rcpts ($1,000)
Gross Tax
($1,000) Rate
State Tax
Amt ($1,000)
County/Muni
Amt ($1,000)
Nation Amt
($1,000)
FY 2013 Drilling Oil and Gas Wells 829 $380,096 $373,871 $21,231 5.679% $19,083 $2,141 $7
FY 2013 Oil and Gas Extraction 764 $160,652 $149,735 $8,657 5.782% $7,294 $1,350 $13
FY 2013 OGAS Operations Support 9,984 $6,432,412 $2,303,156 $146,270 6.351% $101,170 $44,094 $1,006
FY 2013 All OGAS Total 11,577 $6,973,160 $2,826,761 $176,158 6.232% $127,548 $47,584 $1,026
FY 2014 Drilling Oil and Gas Wells 1,342 $576,347 $537,875 $31,104 5.783% $27,214 $3,766 $123
FY 2014 OGAS Extraction Services 114 $11,145 $9,761 $589 6.034% $454 $135 -
FY 2014 OGAS Operations Support 10,075 $4,748,518 $2,653,350 $167,144 6.299% $117,021 $48,993 $1,130
FY 2014 Oil and Gas Extraction 709 $154,767 $141,100 8,200 5.811% $6,790 $1,398 $13
FY 2014 All OGAS Total 12,240 $5,490,776 $3,342,086 $207,036 6.195% $151,479 $54,292 $1,266
7. If you include the gross receipts tax indirect economic burden and a substantial portion of the interest accruing to the general fund from the
land grant permanent fund (96+%) and the severance tax permanent fund (86+%) attributable to oil and gas production in the state, what is
the plausible percentage of the total general fund derived from oil and gas production? Answer – 32.0% for FY 2013 and 35.1.5% for FY 2014 –
see the main document for further information. We can allocate the resulting $2,119 billion general fund share attributable to oil and gas pro-
duction to the producing counties.
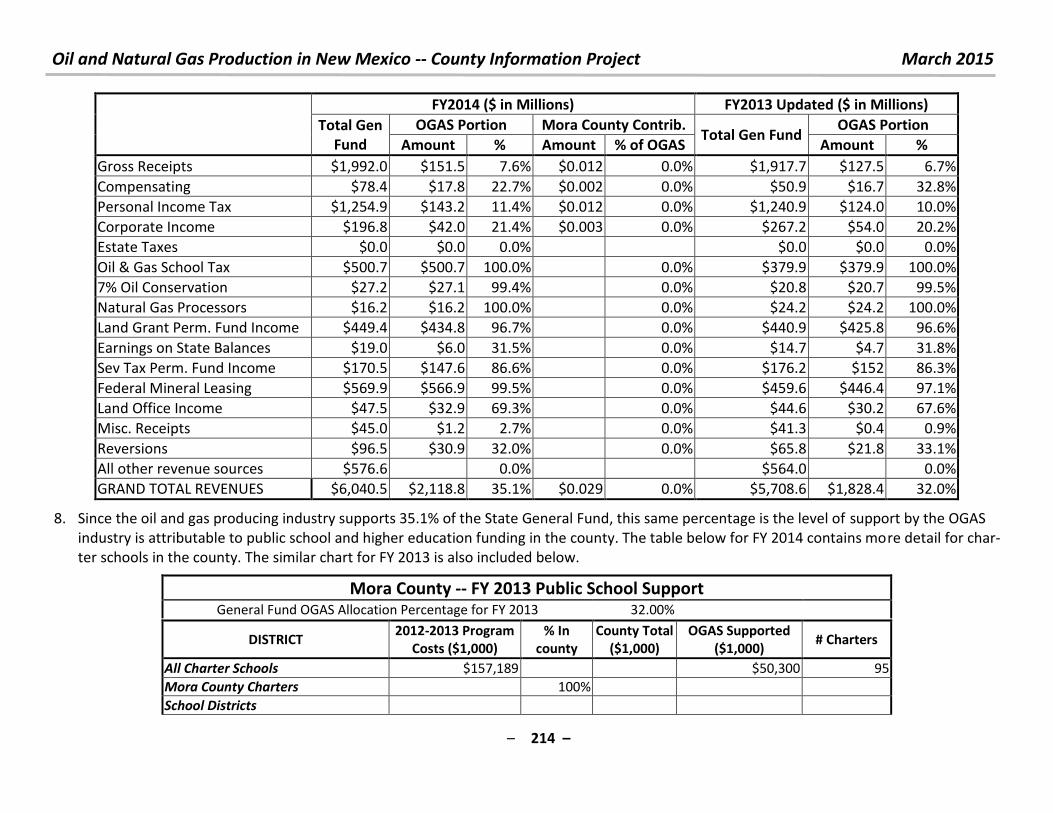
Oil and Natural Gas Production in New Mexico -- County Information Project March 2015
– 214 –
FY2014 ($ in Millions) FY2013 Updated ($ in Millions)
Total Gen
Fund
OGAS Portion Mora County Contrib. Total Gen Fund
OGAS Portion
Amount % Amount % of OGAS Amount %
Gross Receipts $1,992.0 $151.5 7.6% $0.012 0.0% $1,917.7 $127.5 6.7%
Compensating $78.4 $17.8 22.7% $0.002 0.0% $50.9 $16.7 32.8%
Personal Income Tax $1,254.9 $143.2 11.4% $0.012 0.0% $1,240.9 $124.0 10.0%
Corporate Income $196.8 $42.0 21.4% $0.003 0.0% $267.2 $54.0 20.2%
Estate Taxes $0.0 $0.0 0.0% $0.0 $0.0 0.0%
Oil & Gas School Tax $500.7 $500.7 100.0% 0.0% $379.9 $379.9 100.0%
7% Oil Conservation $27.2 $27.1 99.4% 0.0% $20.8 $20.7 99.5%
Natural Gas Processors $16.2 $16.2 100.0% 0.0% $24.2 $24.2 100.0%
Land Grant Perm. Fund Income $449.4 $434.8 96.7% 0.0% $440.9 $425.8 96.6%
Earnings on State Balances $19.0 $6.0 31.5% 0.0% $14.7 $4.7 31.8%
Sev Tax Perm. Fund Income $170.5 $147.6 86.6% 0.0% $176.2 $152 86.3%
Federal Mineral Leasing $569.9 $566.9 99.5% 0.0% $459.6 $446.4 97.1%
Land Office Income $47.5 $32.9 69.3% 0.0% $44.6 $30.2 67.6%
Misc. Receipts $45.0 $1.2 2.7% 0.0% $41.3 $0.4 0.9%
Reversions $96.5 $30.9 32.0% 0.0% $65.8 $21.8 33.1%
All other revenue sources $576.6 0.0% $564.0
0.0%
GRAND TOTAL REVENUES $6,040.5 $2,118.8 35.1% $0.029 0.0% $5,708.6 $1,828.4 32.0%
8. Since the oil and gas producing industry supports 35.1% of the State General Fund, this same percentage is the level of support by the OGAS
industry is attributable to public school and higher education funding in the county. The table below for FY 2014 contains more detail for char-
ter schools in the county. The similar chart for FY 2013 is also included below.
Mora County -- FY 2013 Public School Support General Fund OGAS Allocation Percentage for FY 2013 32.00%
DISTRICT 2012-2013 Program
Costs ($1,000)
% In
county
County Total
($1,000)
OGAS Supported
($1,000) # Charters
All Charter Schools $157,189 $50,300 95
Mora County Charters 100%
School Districts
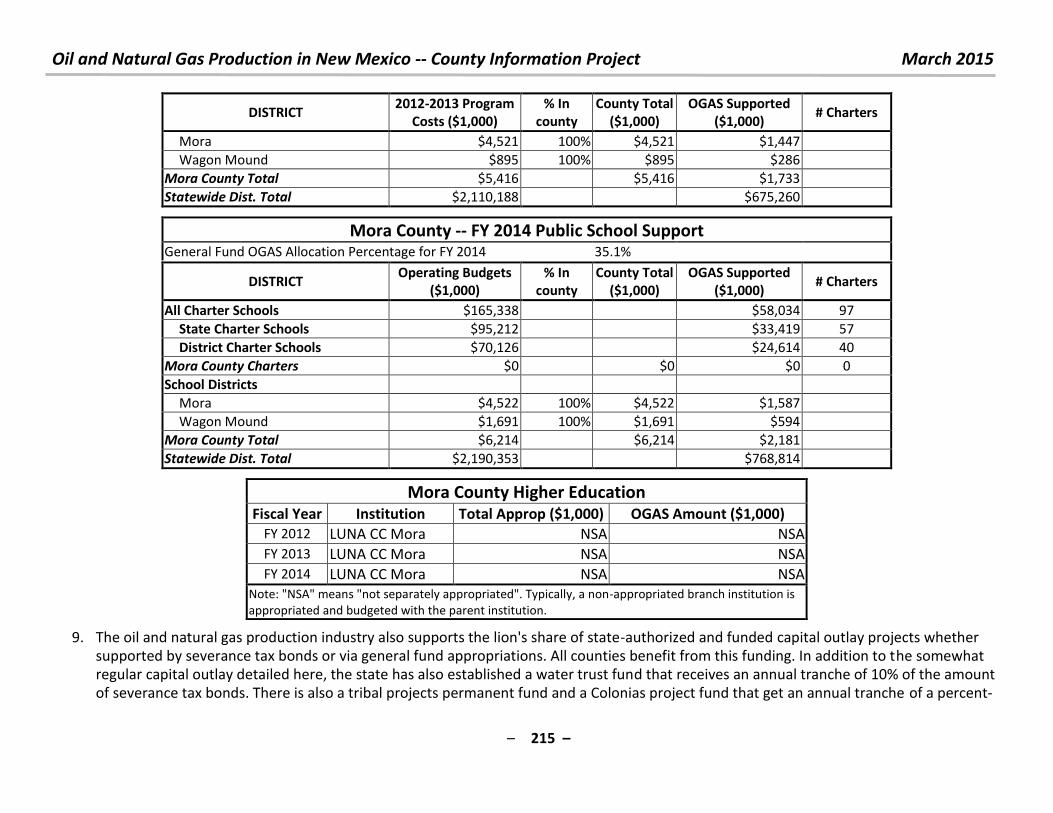
Oil and Natural Gas Production in New Mexico -- County Information Project March 2015
– 215 –
DISTRICT 2012-2013 Program
Costs ($1,000)
% In
county
County Total
($1,000)
OGAS Supported
($1,000) # Charters
Mora $4,521 100% $4,521 $1,447
Wagon Mound $895 100% $895 $286
Mora County Total $5,416 $5,416 $1,733
Statewide Dist. Total $2,110,188 $675,260
Mora County -- FY 2014 Public School Support General Fund OGAS Allocation Percentage for FY 2014 35.1%
DISTRICT Operating Budgets
($1,000)
% In
county
County Total
($1,000)
OGAS Supported
($1,000) # Charters
All Charter Schools $165,338 $58,034 97
State Charter Schools $95,212 $33,419 57
District Charter Schools $70,126 $24,614 40
Mora County Charters $0 $0 $0 0
School Districts
Mora $4,522 100% $4,522 $1,587
Wagon Mound $1,691 100% $1,691 $594
Mora County Total $6,214 $6,214 $2,181
Statewide Dist. Total $2,190,353 $768,814
Mora County Higher Education Fiscal Year Institution Total Approp ($1,000) OGAS Amount ($1,000)
FY 2012 LUNA CC Mora NSA NSA
FY 2013 LUNA CC Mora NSA NSA
FY 2014 LUNA CC Mora NSA NSA
Note: "NSA" means "not separately appropriated". Typically, a non-appropriated branch institution is
appropriated and budgeted with the parent institution.
9. The oil and natural gas production industry also supports the lion's share of state-authorized and funded capital outlay projects whether
supported by severance tax bonds or via general fund appropriations. All counties benefit from this funding. In addition to the somewhat
regular capital outlay detailed here, the state has also established a water trust fund that receives an annual tranche of 10% of the amount
of severance tax bonds. There is also a tribal projects permanent fund and a Colonias project fund that get an annual tranche of a percent-
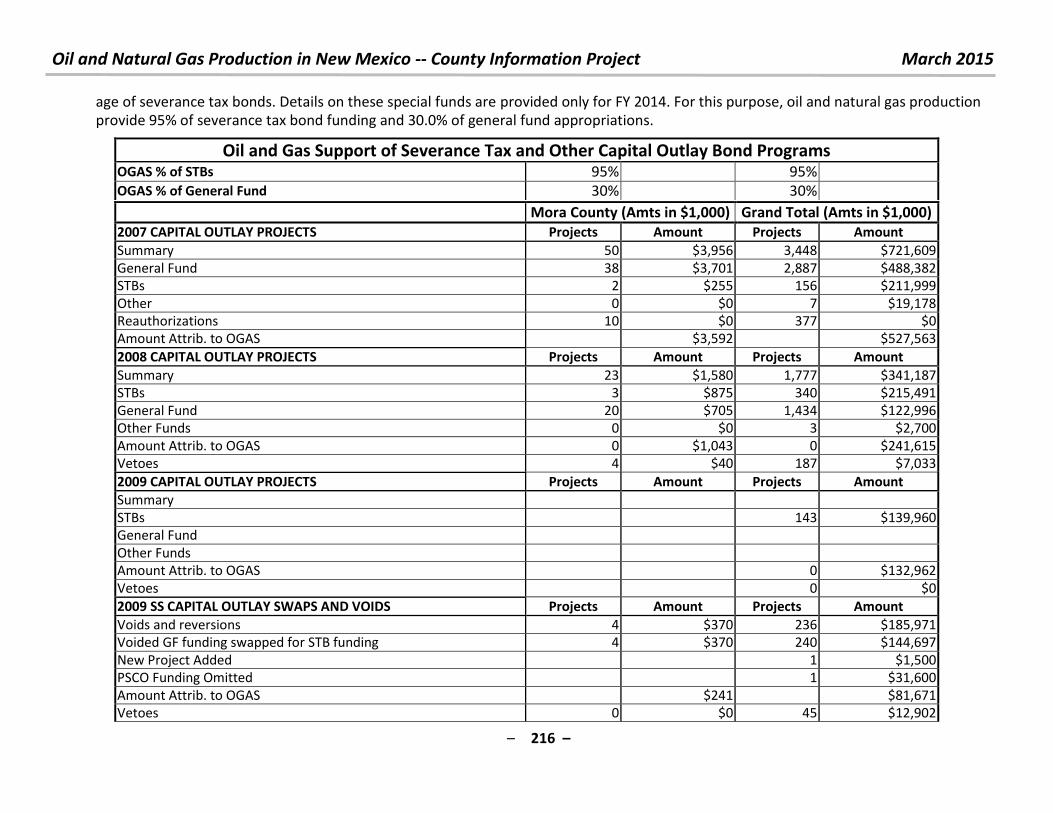
Oil and Natural Gas Production in New Mexico -- County Information Project March 2015
– 216 –
age of severance tax bonds. Details on these special funds are provided only for FY 2014. For this purpose, oil and natural gas production
provide 95% of severance tax bond funding and 30.0% of general fund appropriations.
Oil and Gas Support of Severance Tax and Other Capital Outlay Bond Programs OGAS % of STBs 95% 95%
OGAS % of General Fund 30% 30%
Mora County (Amts in $1,000) Grand Total (Amts in $1,000)
2007 CAPITAL OUTLAY PROJECTS Projects Amount Projects Amount
Summary 50 $3,956 3,448 $721,609
General Fund 38 $3,701 2,887 $488,382
STBs 2 $255 156 $211,999
Other 0 $0 7 $19,178
Reauthorizations 10 $0 377 $0
Amount Attrib. to OGAS $3,592 $527,563
2008 CAPITAL OUTLAY PROJECTS Projects Amount Projects Amount
Summary 23 $1,580 1,777 $341,187
STBs 3 $875 340 $215,491
General Fund 20 $705 1,434 $122,996
Other Funds 0 $0 3 $2,700
Amount Attrib. to OGAS 0 $1,043 0 $241,615
Vetoes 4 $40 187 $7,033
2009 CAPITAL OUTLAY PROJECTS Projects Amount Projects Amount
Summary
STBs 143 $139,960
General Fund
Other Funds
Amount Attrib. to OGAS 0 $132,962
Vetoes 0 $0
2009 SS CAPITAL OUTLAY SWAPS AND VOIDS Projects Amount Projects Amount
Voids and reversions 4 $370 236 $185,971
Voided GF funding swapped for STB funding 4 $370 240 $144,697
New Project Added 1 $1,500
PSCO Funding Omitted 1 $31,600
Amount Attrib. to OGAS $241 $81,671
Vetoes 0 $0 45 $12,902
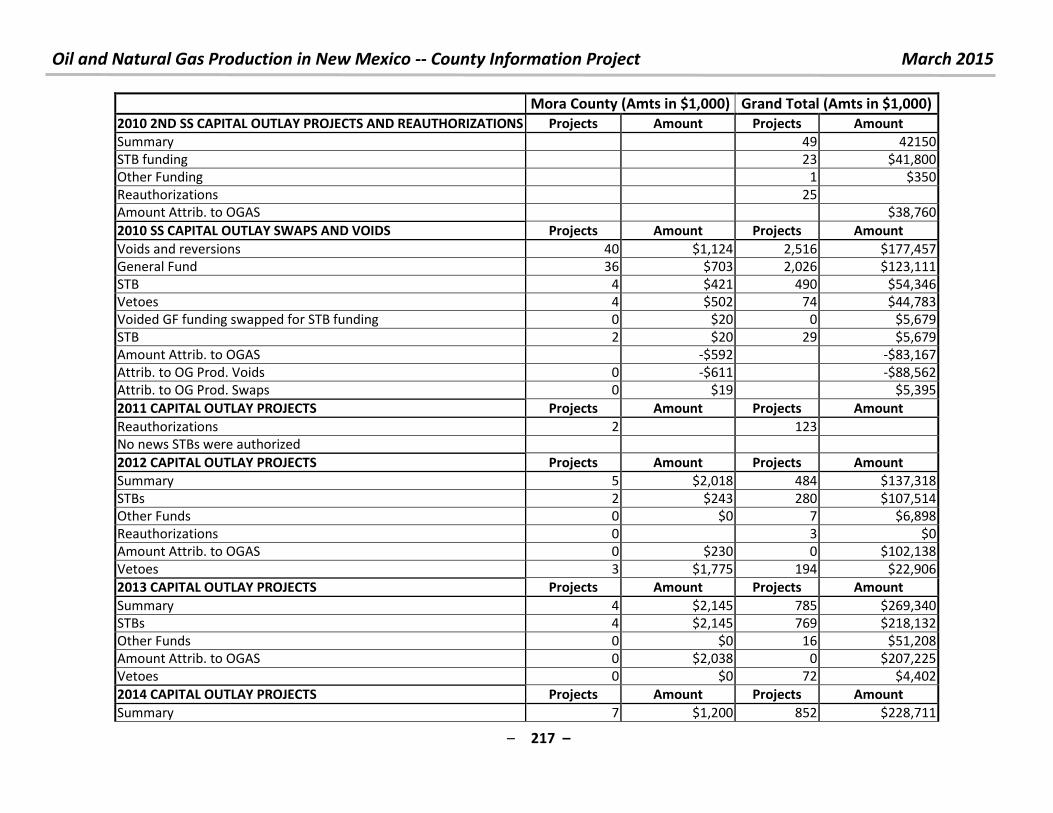
Oil and Natural Gas Production in New Mexico -- County Information Project March 2015
– 217 –
Mora County (Amts in $1,000) Grand Total (Amts in $1,000)
2010 2ND SS CAPITAL OUTLAY PROJECTS AND REAUTHORIZATIONS Projects Amount Projects Amount
Summary 49 42150
STB funding 23 $41,800
Other Funding 1 $350
Reauthorizations 25
Amount Attrib. to OGAS $38,760
2010 SS CAPITAL OUTLAY SWAPS AND VOIDS Projects Amount Projects Amount
Voids and reversions 40 $1,124 2,516 $177,457
General Fund 36 $703 2,026 $123,111
STB 4 $421 490 $54,346
Vetoes 4 $502 74 $44,783
Voided GF funding swapped for STB funding 0 $20 0 $5,679
STB 2 $20 29 $5,679
Amount Attrib. to OGAS -$592 -$83,167
Attrib. to OG Prod. Voids 0 -$611 -$88,562
Attrib. to OG Prod. Swaps 0 $19 $5,395
2011 CAPITAL OUTLAY PROJECTS Projects Amount Projects Amount
Reauthorizations 2 123
No news STBs were authorized
2012 CAPITAL OUTLAY PROJECTS Projects Amount Projects Amount
Summary 5 $2,018 484 $137,318
STBs 2 $243 280 $107,514
Other Funds 0 $0 7 $6,898
Reauthorizations 0 3 $0
Amount Attrib. to OGAS 0 $230 0 $102,138
Vetoes 3 $1,775 194 $22,906
2013 CAPITAL OUTLAY PROJECTS Projects Amount Projects Amount
Summary 4 $2,145 785 $269,340
STBs 4 $2,145 769 $218,132
Other Funds 0 $0 16 $51,208
Amount Attrib. to OGAS 0 $2,038 0 $207,225
Vetoes 0 $0 72 $4,402
2014 CAPITAL OUTLAY PROJECTS Projects Amount Projects Amount
Summary 7 $1,200 852 $228,711
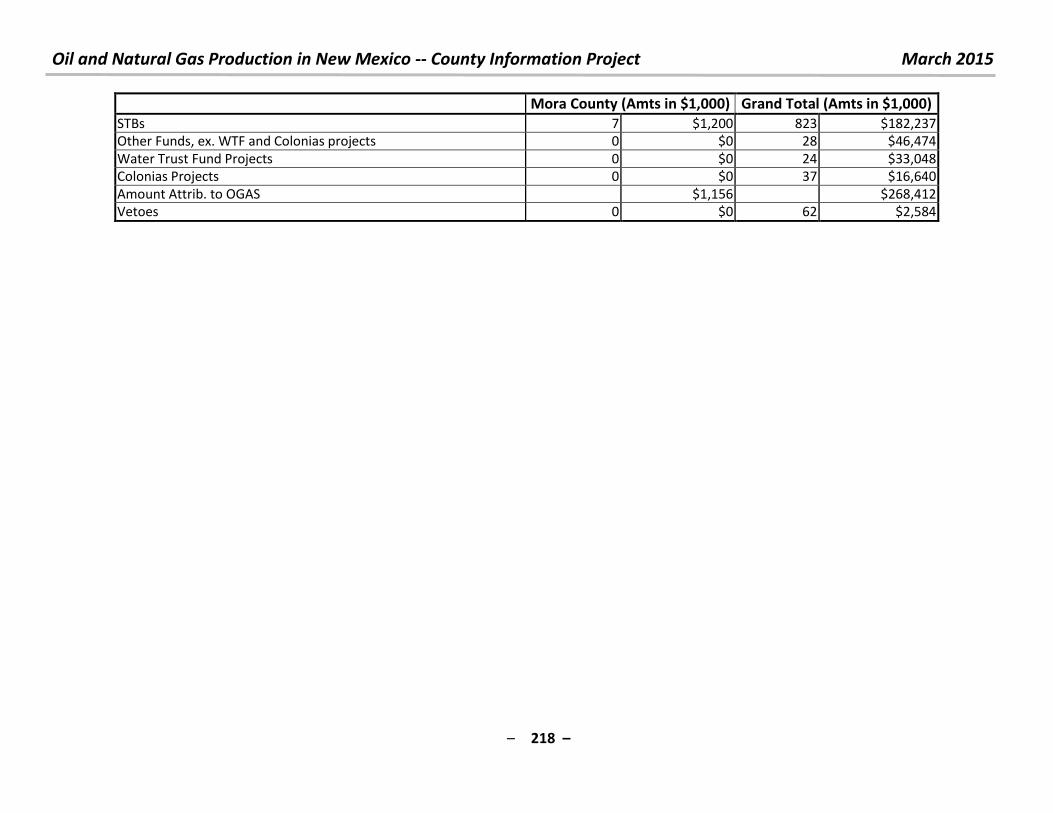
Oil and Natural Gas Production in New Mexico -- County Information Project March 2015
– 218 –
Mora County (Amts in $1,000) Grand Total (Amts in $1,000)
STBs 7 $1,200 823 $182,237
Other Funds, ex. WTF and Colonias projects 0 $0 28 $46,474
Water Trust Fund Projects 0 $0 24 $33,048
Colonias Projects 0 $0 37 $16,640
Amount Attrib. to OGAS $1,156 $268,412
Vetoes 0 $0 62 $2,584

Oil and Natural Gas Production in New Mexico -- County Information Project March 2015
– 219 –
10. For questions, comments or criticisms of this work, contact:
Laird Graeser
505 424-9023
or
Richard L. Anklam, President & Executive Director, New Mexico Tax Research Institute
505-269-6791
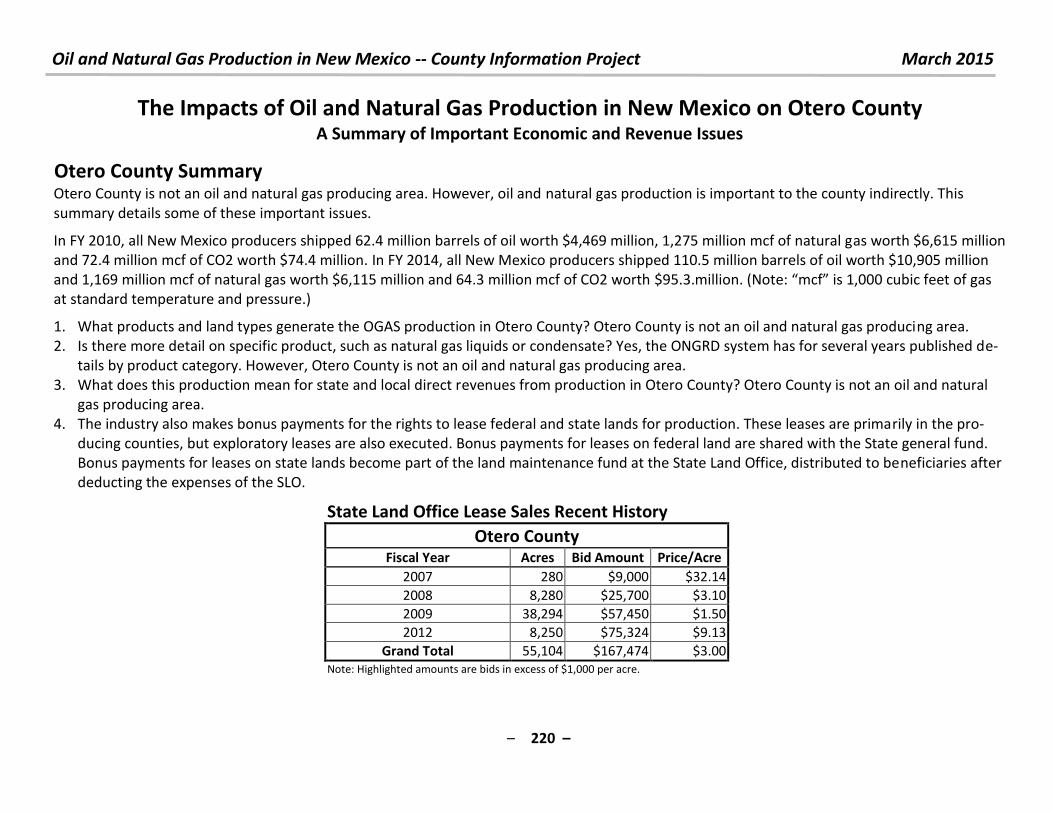
Oil and Natural Gas Production in New Mexico -- County Information Project March 2015
– 220 –
The Impacts of Oil and Natural Gas Production in New Mexico on Otero County A Summary of Important Economic and Revenue Issues
Otero County Summary
Otero County is not an oil and natural gas producing area. However, oil and natural gas production is important to the county indirectly. This
summary details some of these important issues.
In FY 2010, all New Mexico producers shipped 62.4 million barrels of oil worth $4,469 million, 1,275 million mcf of natural gas worth $6,615 million
and 72.4 million mcf of CO2 worth $74.4 million. In FY 2014, all New Mexico producers shipped 110.5 million barrels of oil worth $10,905 million
and 1,169 million mcf of natural gas worth $6,115 million and 64.3 million mcf of CO2 worth $95.3.millio . Note: f is , u i feet of gas at standard temperature and pressure.)
1. What products and land types generate the OGAS production in Otero County? Otero County is not an oil and natural gas producing area.
2. Is there more detail on specific product, such as natural gas liquids or condensate? Yes, the ONGRD system has for several years published de-
tails by product category. However, Otero County is not an oil and natural gas producing area.
3. What does this production mean for state and local direct revenues from production in Otero County? Otero County is not an oil and natural
gas producing area.
4. The industry also makes bonus payments for the rights to lease federal and state lands for production. These leases are primarily in the pro-
ducing counties, but exploratory leases are also executed. Bonus payments for leases on federal land are shared with the State general fund.
Bonus payments for leases on state lands become part of the land maintenance fund at the State Land Office, distributed to beneficiaries after
deducting the expenses of the SLO.
State Land Office Lease Sales Recent History
Otero County Fiscal Year Acres Bid Amount Price/Acre
2007 280 $9,000 $32.14
2008 8,280 $25,700 $3.10
2009 38,294 $57,450 $1.50
2012 8,250 $75,324 $9.13
Grand Total 55,104 $167,474 $3.00
Note: Highlighted amounts are bids in excess of $1,000 per acre.
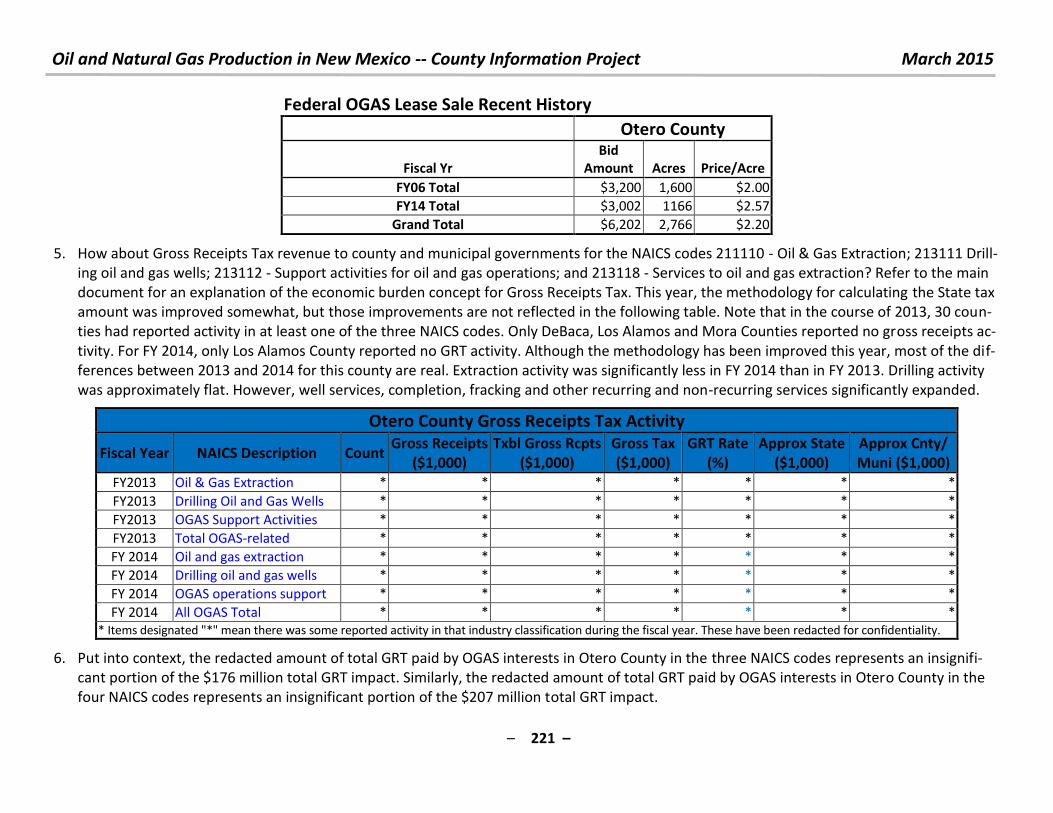
Oil and Natural Gas Production in New Mexico -- County Information Project March 2015
– 221 –
Federal OGAS Lease Sale Recent History
Otero County
Fiscal Yr
Bid
Amount Acres Price/Acre
FY06 Total $3,200 1,600 $2.00
FY14 Total $3,002 1166 $2.57
Grand Total $6,202 2,766 $2.20
5. How about Gross Receipts Tax revenue to county and municipal governments for the NAICS codes 211110 - Oil & Gas Extraction; 213111 Drill-
ing oil and gas wells; 213112 - Support activities for oil and gas operations; and 213118 - Services to oil and gas extraction? Refer to the main
document for an explanation of the economic burden concept for Gross Receipts Tax. This year, the methodology for calculating the State tax
amount was improved somewhat, but those improvements are not reflected in the following table. Note that in the course of 2013, 30 coun-
ties had reported activity in at least one of the three NAICS codes. Only DeBaca, Los Alamos and Mora Counties reported no gross receipts ac-
tivity. For FY 2014, only Los Alamos County reported no GRT activity. Although the methodology has been improved this year, most of the dif-
ferences between 2013 and 2014 for this county are real. Extraction activity was significantly less in FY 2014 than in FY 2013. Drilling activity
was approximately flat. However, well services, completion, fracking and other recurring and non-recurring services significantly expanded.
Otero County Gross Receipts Tax Activity
Fiscal Year NAICS Description Count Gross Receipts
($1,000)
Txbl Gross Rcpts
($1,000)
Gross Tax
($1,000)
GRT Rate
(%)
Approx State
($1,000)
Approx Cnty/
Muni ($1,000)
FY2013 Oil & Gas Extraction * * * * * * *
FY2013 Drilling Oil and Gas Wells * * * * * * *
FY2013 OGAS Support Activities * * * * * * *
FY2013 Total OGAS-related * * * * * * *
FY 2014 Oil and gas extraction * * * * * * *
FY 2014 Drilling oil and gas wells * * * * * * *
FY 2014 OGAS operations support * * * * * * *
FY 2014 All OGAS Total * * * * * * *
* Items designated "*" mean there was some reported activity in that industry classification during the fiscal year. These have been redacted for confidentiality.
6. Put into context, the redacted amount of total GRT paid by OGAS interests in Otero County in the three NAICS codes represents an insignifi-
cant portion of the $176 million total GRT impact. Similarly, the redacted amount of total GRT paid by OGAS interests in Otero County in the
four NAICS codes represents an insignificant portion of the $207 million total GRT impact.
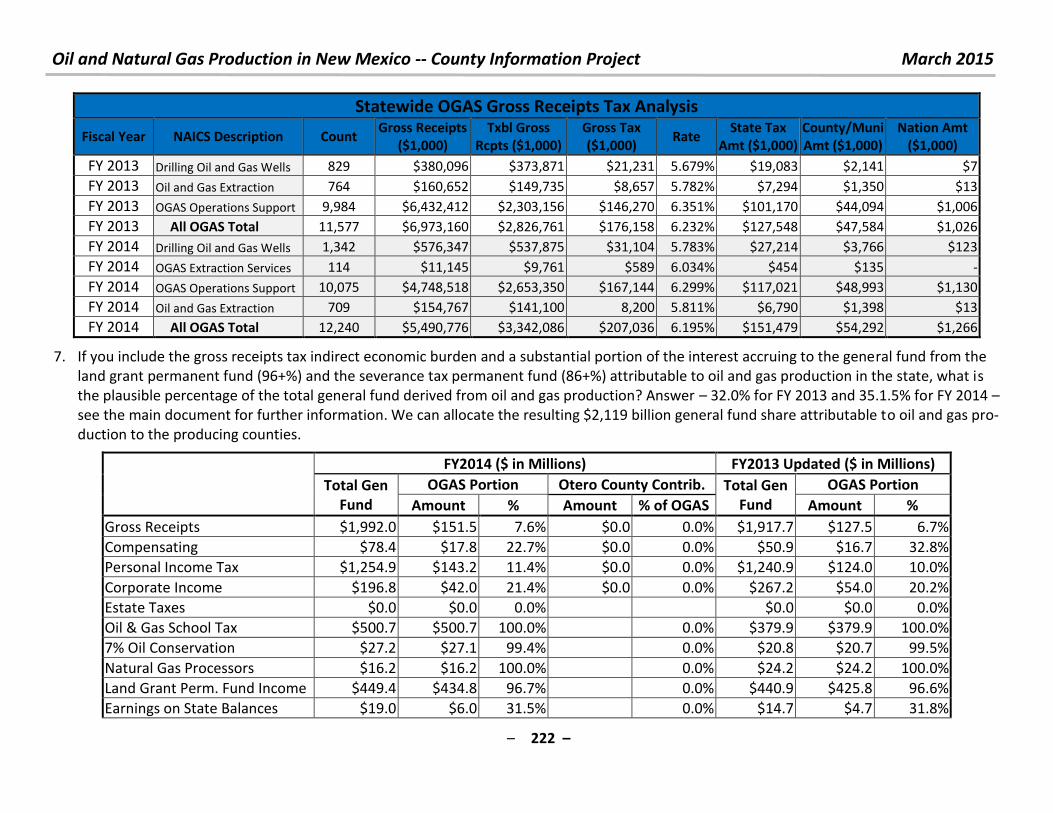
Oil and Natural Gas Production in New Mexico -- County Information Project March 2015
– 222 –
Statewide OGAS Gross Receipts Tax Analysis
Fiscal Year NAICS Description Count Gross Receipts
($1,000)
Txbl Gross
Rcpts ($1,000)
Gross Tax
($1,000) Rate
State Tax
Amt ($1,000)
County/Muni
Amt ($1,000)
Nation Amt
($1,000)
FY 2013 Drilling Oil and Gas Wells 829 $380,096 $373,871 $21,231 5.679% $19,083 $2,141 $7
FY 2013 Oil and Gas Extraction 764 $160,652 $149,735 $8,657 5.782% $7,294 $1,350 $13
FY 2013 OGAS Operations Support 9,984 $6,432,412 $2,303,156 $146,270 6.351% $101,170 $44,094 $1,006
FY 2013 All OGAS Total 11,577 $6,973,160 $2,826,761 $176,158 6.232% $127,548 $47,584 $1,026
FY 2014 Drilling Oil and Gas Wells 1,342 $576,347 $537,875 $31,104 5.783% $27,214 $3,766 $123
FY 2014 OGAS Extraction Services 114 $11,145 $9,761 $589 6.034% $454 $135 -
FY 2014 OGAS Operations Support 10,075 $4,748,518 $2,653,350 $167,144 6.299% $117,021 $48,993 $1,130
FY 2014 Oil and Gas Extraction 709 $154,767 $141,100 8,200 5.811% $6,790 $1,398 $13
FY 2014 All OGAS Total 12,240 $5,490,776 $3,342,086 $207,036 6.195% $151,479 $54,292 $1,266
7. If you include the gross receipts tax indirect economic burden and a substantial portion of the interest accruing to the general fund from the
land grant permanent fund (96+%) and the severance tax permanent fund (86+%) attributable to oil and gas production in the state, what is
the plausible percentage of the total general fund derived from oil and gas production? Answer – 32.0% for FY 2013 and 35.1.5% for FY 2014 –
see the main document for further information. We can allocate the resulting $2,119 billion general fund share attributable to oil and gas pro-
duction to the producing counties.
FY2014 ($ in Millions) FY2013 Updated ($ in Millions)
Total Gen
Fund
OGAS Portion Otero County Contrib. Total Gen
Fund
OGAS Portion
Amount % Amount % of OGAS Amount %
Gross Receipts $1,992.0 $151.5 7.6% $0.0 0.0% $1,917.7 $127.5 6.7%
Compensating $78.4 $17.8 22.7% $0.0 0.0% $50.9 $16.7 32.8%
Personal Income Tax $1,254.9 $143.2 11.4% $0.0 0.0% $1,240.9 $124.0 10.0%
Corporate Income $196.8 $42.0 21.4% $0.0 0.0% $267.2 $54.0 20.2%
Estate Taxes $0.0 $0.0 0.0% $0.0 $0.0 0.0%
Oil & Gas School Tax $500.7 $500.7 100.0% 0.0% $379.9 $379.9 100.0%
7% Oil Conservation $27.2 $27.1 99.4% 0.0% $20.8 $20.7 99.5%
Natural Gas Processors $16.2 $16.2 100.0% 0.0% $24.2 $24.2 100.0%
Land Grant Perm. Fund Income $449.4 $434.8 96.7% 0.0% $440.9 $425.8 96.6%
Earnings on State Balances $19.0 $6.0 31.5% 0.0% $14.7 $4.7 31.8%
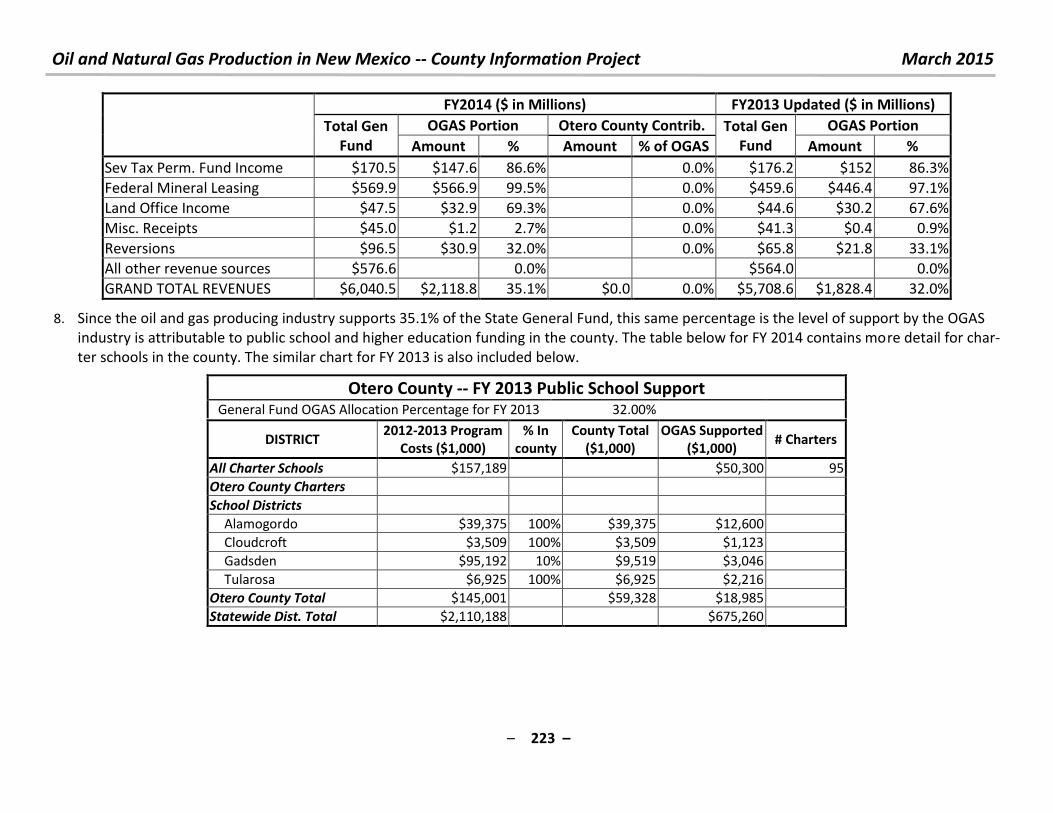
Oil and Natural Gas Production in New Mexico -- County Information Project March 2015
– 223 –
FY2014 ($ in Millions) FY2013 Updated ($ in Millions)
Total Gen
Fund
OGAS Portion Otero County Contrib. Total Gen
Fund
OGAS Portion
Amount % Amount % of OGAS Amount %
Sev Tax Perm. Fund Income $170.5 $147.6 86.6% 0.0% $176.2 $152 86.3%
Federal Mineral Leasing $569.9 $566.9 99.5% 0.0% $459.6 $446.4 97.1%
Land Office Income $47.5 $32.9 69.3% 0.0% $44.6 $30.2 67.6%
Misc. Receipts $45.0 $1.2 2.7% 0.0% $41.3 $0.4 0.9%
Reversions $96.5 $30.9 32.0% 0.0% $65.8 $21.8 33.1%
All other revenue sources $576.6 0.0% $564.0
0.0%
GRAND TOTAL REVENUES $6,040.5 $2,118.8 35.1% $0.0 0.0% $5,708.6 $1,828.4 32.0%
8. Since the oil and gas producing industry supports 35.1% of the State General Fund, this same percentage is the level of support by the OGAS
industry is attributable to public school and higher education funding in the county. The table below for FY 2014 contains more detail for char-
ter schools in the county. The similar chart for FY 2013 is also included below.
Otero County -- FY 2013 Public School Support General Fund OGAS Allocation Percentage for FY 2013 32.00%
DISTRICT 2012-2013 Program
Costs ($1,000)
% In
county
County Total
($1,000)
OGAS Supported
($1,000) # Charters
All Charter Schools $157,189
$50,300 95
Otero County Charters
School Districts
Alamogordo $39,375 100% $39,375 $12,600
Cloudcroft $3,509 100% $3,509 $1,123
Gadsden $95,192 10% $9,519 $3,046
Tularosa $6,925 100% $6,925 $2,216
Otero County Total $145,001 $59,328 $18,985
Statewide Dist. Total $2,110,188 $675,260
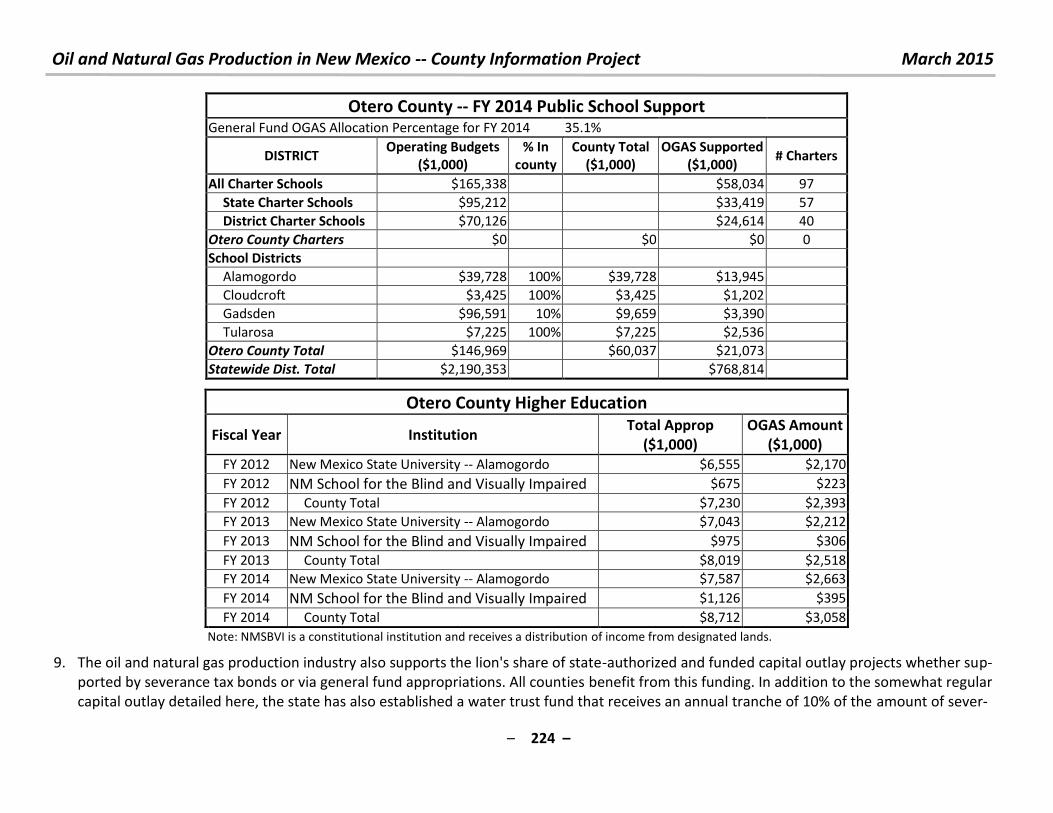
Oil and Natural Gas Production in New Mexico -- County Information Project March 2015
– 224 –
Otero County -- FY 2014 Public School Support General Fund OGAS Allocation Percentage for FY 2014 35.1%
DISTRICT Operating Budgets
($1,000)
% In
county
County Total
($1,000)
OGAS Supported
($1,000) # Charters
All Charter Schools $165,338 $58,034 97
State Charter Schools $95,212 $33,419 57
District Charter Schools $70,126 $24,614 40
Otero County Charters $0 $0 $0 0
School Districts
Alamogordo $39,728 100% $39,728 $13,945
Cloudcroft $3,425 100% $3,425 $1,202
Gadsden $96,591 10% $9,659 $3,390
Tularosa $7,225 100% $7,225 $2,536
Otero County Total $146,969 $60,037 $21,073
Statewide Dist. Total $2,190,353 $768,814
Otero County Higher Education
Fiscal Year Institution Total Approp
($1,000)
OGAS Amount
($1,000)
FY 2012 New Mexico State University -- Alamogordo $6,555 $2,170
FY 2012 NM School for the Blind and Visually Impaired $675 $223
FY 2012 County Total $7,230 $2,393
FY 2013 New Mexico State University -- Alamogordo $7,043 $2,212
FY 2013 NM School for the Blind and Visually Impaired $975 $306
FY 2013 County Total $8,019 $2,518
FY 2014 New Mexico State University -- Alamogordo $7,587 $2,663
FY 2014 NM School for the Blind and Visually Impaired $1,126 $395
FY 2014 County Total $8,712 $3,058
Note: NMSBVI is a constitutional institution and receives a distribution of income from designated lands.
9. The oil and natural gas production industry also supports the lion's share of state-authorized and funded capital outlay projects whether sup-
ported by severance tax bonds or via general fund appropriations. All counties benefit from this funding. In addition to the somewhat regular
capital outlay detailed here, the state has also established a water trust fund that receives an annual tranche of 10% of the amount of sever-
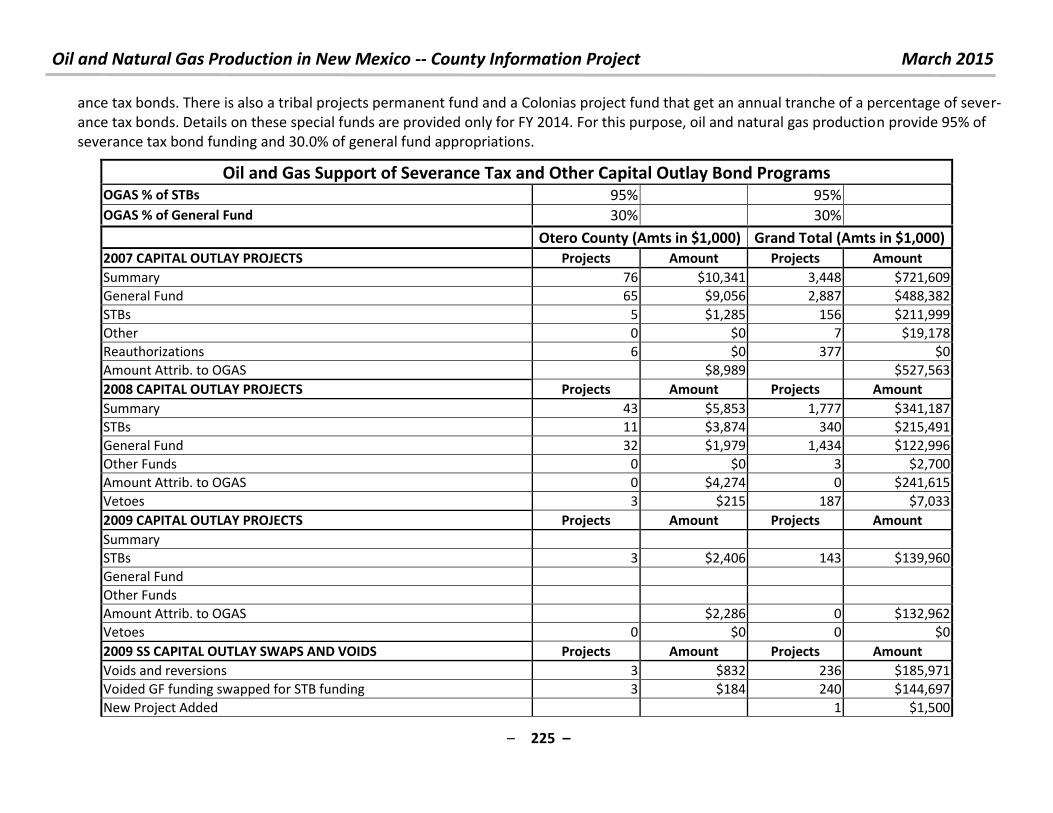
Oil and Natural Gas Production in New Mexico -- County Information Project March 2015
– 225 –
ance tax bonds. There is also a tribal projects permanent fund and a Colonias project fund that get an annual tranche of a percentage of sever-
ance tax bonds. Details on these special funds are provided only for FY 2014. For this purpose, oil and natural gas production provide 95% of
severance tax bond funding and 30.0% of general fund appropriations.
Oil and Gas Support of Severance Tax and Other Capital Outlay Bond Programs OGAS % of STBs 95% 95%
OGAS % of General Fund 30% 30% Otero County (Amts in $1,000) Grand Total (Amts in $1,000)
2007 CAPITAL OUTLAY PROJECTS Projects Amount Projects Amount
Summary 76 $10,341 3,448 $721,609
General Fund 65 $9,056 2,887 $488,382
STBs 5 $1,285 156 $211,999
Other 0 $0 7 $19,178
Reauthorizations 6 $0 377 $0
Amount Attrib. to OGAS $8,989 $527,563
2008 CAPITAL OUTLAY PROJECTS Projects Amount Projects Amount
Summary 43 $5,853 1,777 $341,187
STBs 11 $3,874 340 $215,491
General Fund 32 $1,979 1,434 $122,996
Other Funds 0 $0 3 $2,700
Amount Attrib. to OGAS 0 $4,274 0 $241,615
Vetoes 3 $215 187 $7,033
2009 CAPITAL OUTLAY PROJECTS Projects Amount Projects Amount
Summary
STBs 3 $2,406 143 $139,960
General Fund
Other Funds
Amount Attrib. to OGAS $2,286 0 $132,962
Vetoes 0 $0 0 $0
2009 SS CAPITAL OUTLAY SWAPS AND VOIDS Projects Amount Projects Amount
Voids and reversions 3 $832 236 $185,971
Voided GF funding swapped for STB funding 3 $184 240 $144,697
New Project Added 1 $1,500
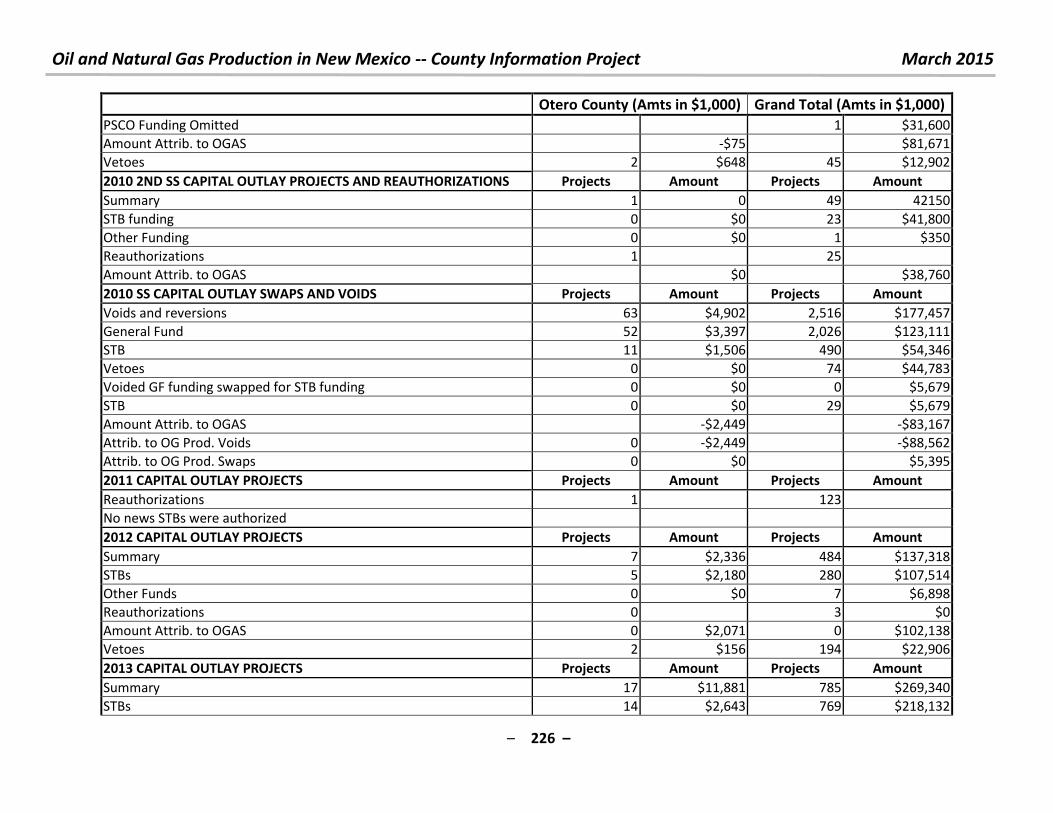
Oil and Natural Gas Production in New Mexico -- County Information Project March 2015
– 226 –
Otero County (Amts in $1,000) Grand Total (Amts in $1,000)
PSCO Funding Omitted 1 $31,600
Amount Attrib. to OGAS -$75 $81,671
Vetoes 2 $648 45 $12,902
2010 2ND SS CAPITAL OUTLAY PROJECTS AND REAUTHORIZATIONS Projects Amount Projects Amount
Summary 1 0 49 42150
STB funding 0 $0 23 $41,800
Other Funding 0 $0 1 $350
Reauthorizations 1 25
Amount Attrib. to OGAS $0 $38,760
2010 SS CAPITAL OUTLAY SWAPS AND VOIDS Projects Amount Projects Amount
Voids and reversions 63 $4,902 2,516 $177,457
General Fund 52 $3,397 2,026 $123,111
STB 11 $1,506 490 $54,346
Vetoes 0 $0 74 $44,783
Voided GF funding swapped for STB funding 0 $0 0 $5,679
STB 0 $0 29 $5,679
Amount Attrib. to OGAS -$2,449 -$83,167
Attrib. to OG Prod. Voids 0 -$2,449 -$88,562
Attrib. to OG Prod. Swaps 0 $0 $5,395
2011 CAPITAL OUTLAY PROJECTS Projects Amount Projects Amount
Reauthorizations 1 123
No news STBs were authorized
2012 CAPITAL OUTLAY PROJECTS Projects Amount Projects Amount
Summary 7 $2,336 484 $137,318
STBs 5 $2,180 280 $107,514
Other Funds 0 $0 7 $6,898
Reauthorizations 0 3 $0
Amount Attrib. to OGAS 0 $2,071 0 $102,138
Vetoes 2 $156 194 $22,906
2013 CAPITAL OUTLAY PROJECTS Projects Amount Projects Amount
Summary 17 $11,881 785 $269,340
STBs 14 $2,643 769 $218,132
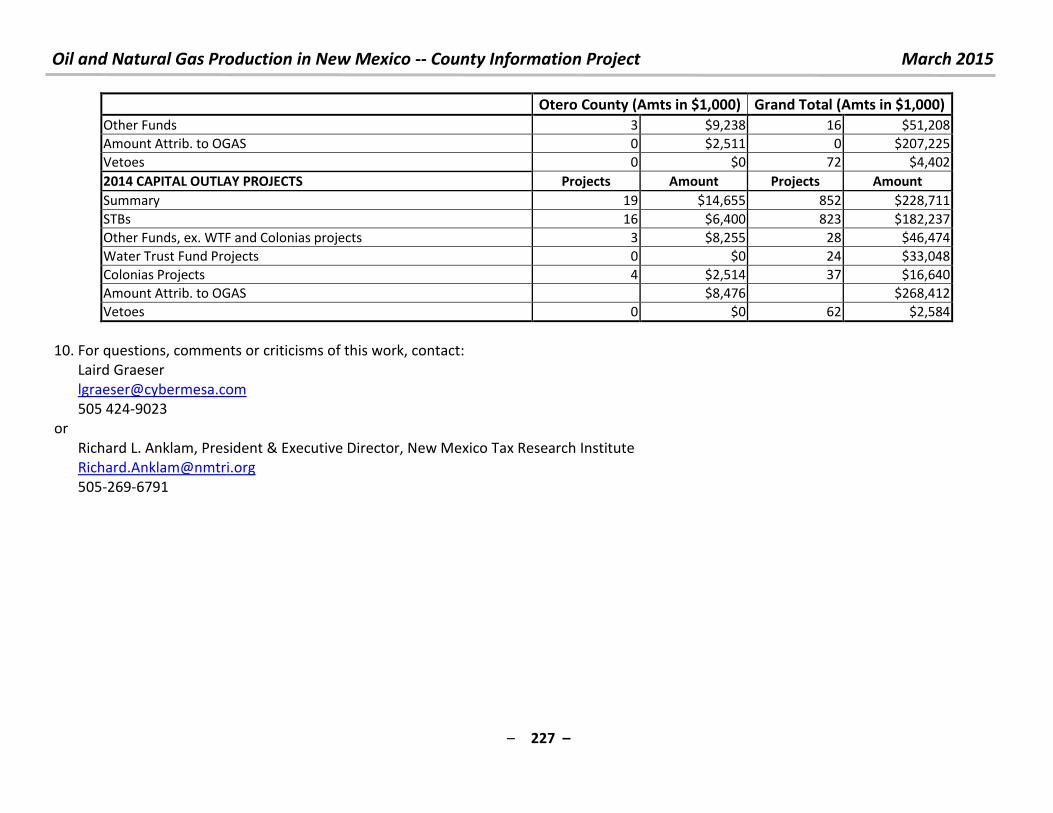
Oil and Natural Gas Production in New Mexico -- County Information Project March 2015
– 227 –
Otero County (Amts in $1,000) Grand Total (Amts in $1,000)
Other Funds 3 $9,238 16 $51,208
Amount Attrib. to OGAS 0 $2,511 0 $207,225
Vetoes 0 $0 72 $4,402
2014 CAPITAL OUTLAY PROJECTS Projects Amount Projects Amount
Summary 19 $14,655 852 $228,711
STBs 16 $6,400 823 $182,237
Other Funds, ex. WTF and Colonias projects 3 $8,255 28 $46,474
Water Trust Fund Projects 0 $0 24 $33,048
Colonias Projects 4 $2,514 37 $16,640
Amount Attrib. to OGAS $8,476 $268,412
Vetoes 0 $0 62 $2,584
10. For questions, comments or criticisms of this work, contact:
Laird Graeser
505 424-9023
or
Richard L. Anklam, President & Executive Director, New Mexico Tax Research Institute
505-269-6791
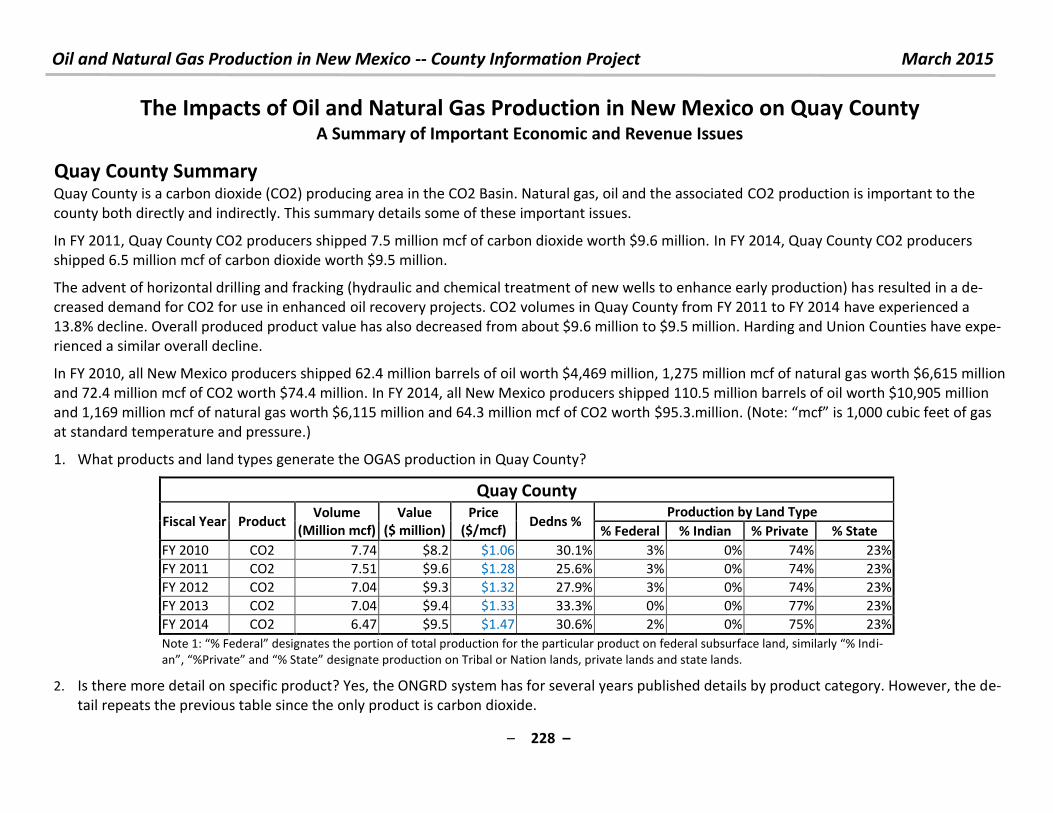
Oil and Natural Gas Production in New Mexico -- County Information Project March 2015
– 228 –
The Impacts of Oil and Natural Gas Production in New Mexico on Quay County A Summary of Important Economic and Revenue Issues
Quay County Summary
Quay County is a carbon dioxide (CO2) producing area in the CO2 Basin. Natural gas, oil and the associated CO2 production is important to the
county both directly and indirectly. This summary details some of these important issues.
In FY 2011, Quay County CO2 producers shipped 7.5 million mcf of carbon dioxide worth $9.6 million. In FY 2014, Quay County CO2 producers
shipped 6.5 million mcf of carbon dioxide worth $9.5 million.
The advent of horizontal drilling and fracking (hydraulic and chemical treatment of new wells to enhance early production) has resulted in a de-
creased demand for CO2 for use in enhanced oil recovery projects. CO2 volumes in Quay County from FY 2011 to FY 2014 have experienced a
13.8% decline. Overall produced product value has also decreased from about $9.6 million to $9.5 million. Harding and Union Counties have expe-
rienced a similar overall decline.
In FY 2010, all New Mexico producers shipped 62.4 million barrels of oil worth $4,469 million, 1,275 million mcf of natural gas worth $6,615 million
and 72.4 million mcf of CO2 worth $74.4 million. In FY 2014, all New Mexico producers shipped 110.5 million barrels of oil worth $10,905 million
and 1,169 million mcf of natural gas worth $6,115 million and 64.3 million mcf of CO2 worth $ . . illio . Note: f is , u i feet of gas at standard temperature and pressure.)
1. What products and land types generate the OGAS production in Quay County?
Quay County
Fiscal Year Product Volume
(Million mcf)
Value
($ million)
Price
($/mcf) Dedns %
Production by Land Type
% Federal % Indian % Private % State
FY 2010 CO2 7.74 $8.2 $1.06 30.1% 3% 0% 74% 23%
FY 2011 CO2 7.51 $9.6 $1.28 25.6% 3% 0% 74% 23%
FY 2012 CO2 7.04 $9.3 $1.32 27.9% 3% 0% 74% 23%
FY 2013 CO2 7.04 $9.4 $1.33 33.3% 0% 0% 77% 23%
FY 2014 CO2 6.47 $9.5 $1.47 30.6% 2% 0% 75% 23%
Note : % Fede al desig ates the po tio of total p odu tio fo the pa ti ula p odu t o fede al su su fa e la d, si ila l % I di-
a , %P i ate a d % “tate desig ate p odu tio o T i al o Natio la ds, p i ate la ds a d state la ds.
2. Is there more detail on specific product? Yes, the ONGRD system has for several years published details by product category. However, the de-
tail repeats the previous table since the only product is carbon dioxide.
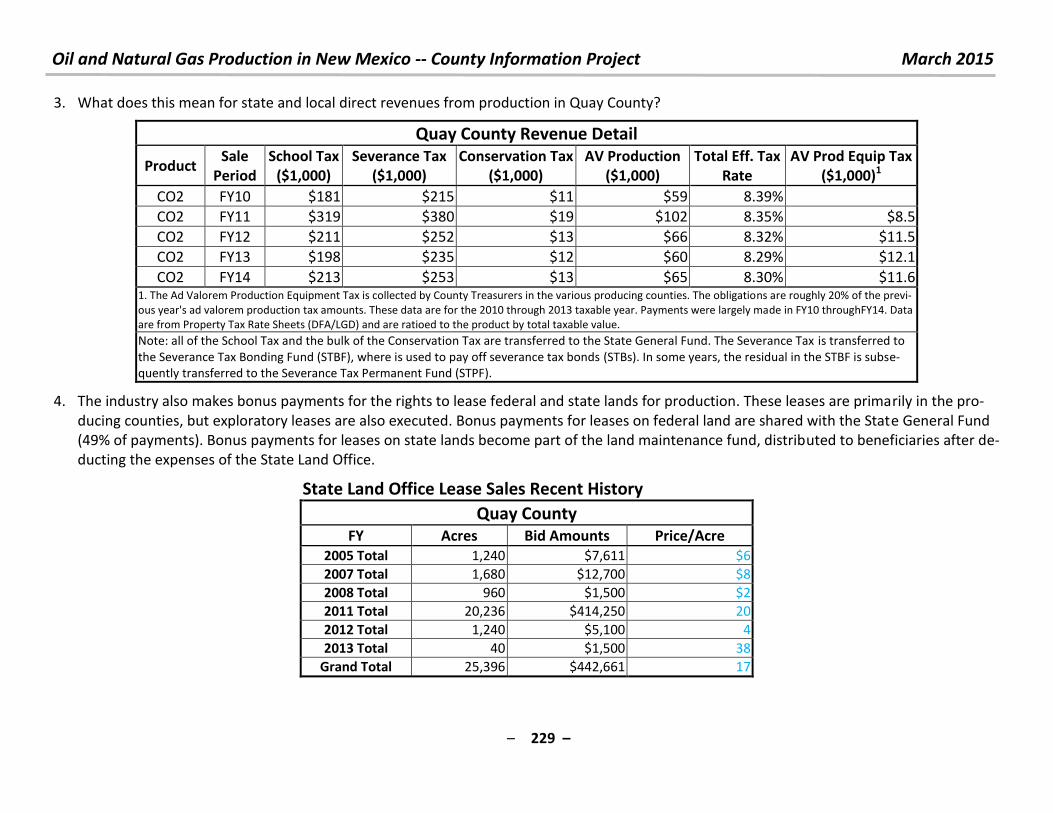
Oil and Natural Gas Production in New Mexico -- County Information Project March 2015
– 229 –
3. What does this mean for state and local direct revenues from production in Quay County?
Quay County Revenue Detail
Product Sale
Period
School Tax
($1,000)
Severance Tax
($1,000)
Conservation Tax
($1,000)
AV Production
($1,000)
Total Eff. Tax
Rate
AV Prod Equip Tax
($1,000)1
CO2 FY10 $181 $215 $11 $59 8.39%
CO2 FY11 $319 $380 $19 $102 8.35% $8.5
CO2 FY12 $211 $252 $13 $66 8.32% $11.5
CO2 FY13 $198 $235 $12 $60 8.29% $12.1
CO2 FY14 $213 $253 $13 $65 8.30% $11.6 1. The Ad Valorem Production Equipment Tax is collected by County Treasurers in the various producing counties. The obligations are roughly 20% of the previ-
ous year's ad valorem production tax amounts. These data are for the 2010 through 2013 taxable year. Payments were largely made in FY10 throughFY14. Data
are from Property Tax Rate Sheets (DFA/LGD) and are ratioed to the product by total taxable value.
Note: all of the School Tax and the bulk of the Conservation Tax are transferred to the State General Fund. The Severance Tax is transferred to
the Severance Tax Bonding Fund (STBF), where is used to pay off severance tax bonds (STBs). In some years, the residual in the STBF is subse-
quently transferred to the Severance Tax Permanent Fund (STPF).
4. The industry also makes bonus payments for the rights to lease federal and state lands for production. These leases are primarily in the pro-
ducing counties, but exploratory leases are also executed. Bonus payments for leases on federal land are shared with the State General Fund
(49% of payments). Bonus payments for leases on state lands become part of the land maintenance fund, distributed to beneficiaries after de-
ducting the expenses of the State Land Office.
State Land Office Lease Sales Recent History
Quay County FY Acres Bid Amounts Price/Acre
2005 Total 1,240 $7,611 $6
2007 Total 1,680 $12,700 $8
2008 Total 960 $1,500 $2
2011 Total 20,236 $414,250 20
2012 Total 1,240 $5,100 4
2013 Total 40 $1,500 38
Grand Total 25,396 $442,661 17
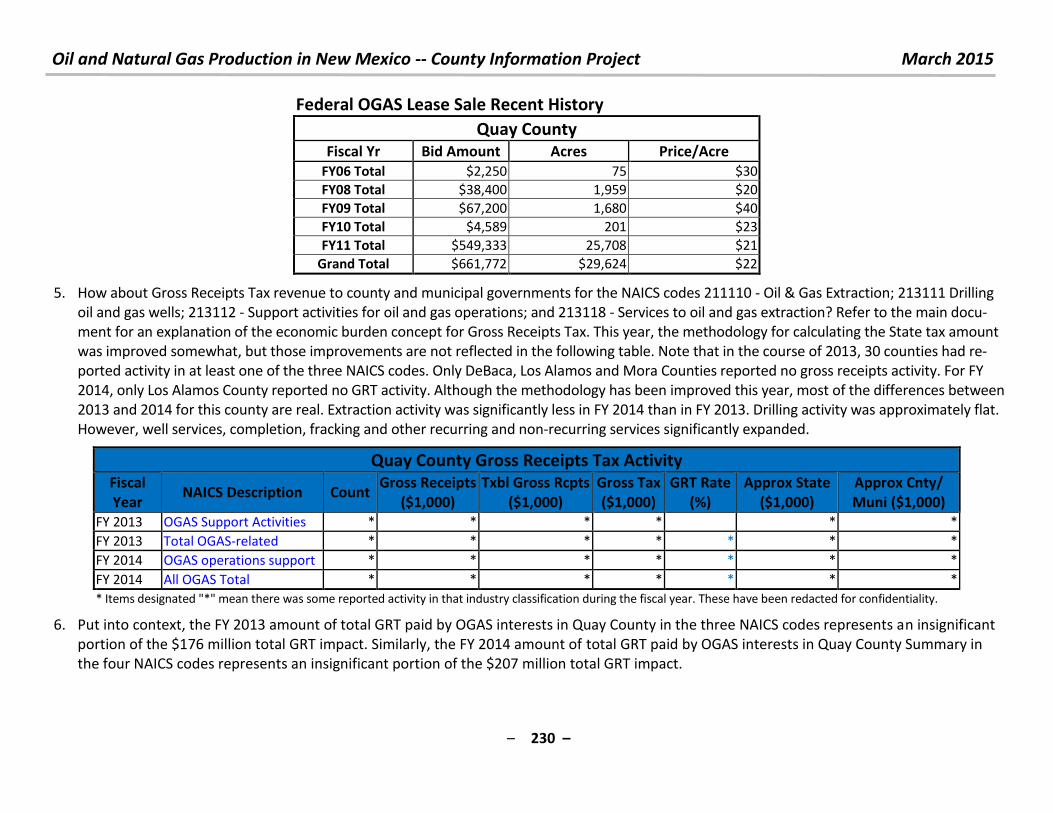
Oil and Natural Gas Production in New Mexico -- County Information Project March 2015
– 230 –
Federal OGAS Lease Sale Recent History
Quay County Fiscal Yr Bid Amount Acres Price/Acre
FY06 Total $2,250 75 $30
FY08 Total $38,400 1,959 $20
FY09 Total $67,200 1,680 $40
FY10 Total $4,589 201 $23
FY11 Total $549,333 25,708 $21
Grand Total $661,772 $29,624 $22
5. How about Gross Receipts Tax revenue to county and municipal governments for the NAICS codes 211110 - Oil & Gas Extraction; 213111 Drilling
oil and gas wells; 213112 - Support activities for oil and gas operations; and 213118 - Services to oil and gas extraction? Refer to the main docu-
ment for an explanation of the economic burden concept for Gross Receipts Tax. This year, the methodology for calculating the State tax amount
was improved somewhat, but those improvements are not reflected in the following table. Note that in the course of 2013, 30 counties had re-
ported activity in at least one of the three NAICS codes. Only DeBaca, Los Alamos and Mora Counties reported no gross receipts activity. For FY
2014, only Los Alamos County reported no GRT activity. Although the methodology has been improved this year, most of the differences between
2013 and 2014 for this county are real. Extraction activity was significantly less in FY 2014 than in FY 2013. Drilling activity was approximately flat.
However, well services, completion, fracking and other recurring and non-recurring services significantly expanded.
Quay County Gross Receipts Tax Activity Fiscal
Year NAICS Description Count
Gross Receipts
($1,000)
Txbl Gross Rcpts
($1,000)
Gross Tax
($1,000)
GRT Rate
(%)
Approx State
($1,000)
Approx Cnty/
Muni ($1,000)
FY 2013 OGAS Support Activities * * * * * *
FY 2013 Total OGAS-related * * * * * * *
FY 2014 OGAS operations support * * * * * * *
FY 2014 All OGAS Total * * * * * * *
* Items designated "*" mean there was some reported activity in that industry classification during the fiscal year. These have been redacted for confidentiality.
6. Put into context, the FY 2013 amount of total GRT paid by OGAS interests in Quay County in the three NAICS codes represents an insignificant
portion of the $176 million total GRT impact. Similarly, the FY 2014 amount of total GRT paid by OGAS interests in Quay County Summary in
the four NAICS codes represents an insignificant portion of the $207 million total GRT impact.
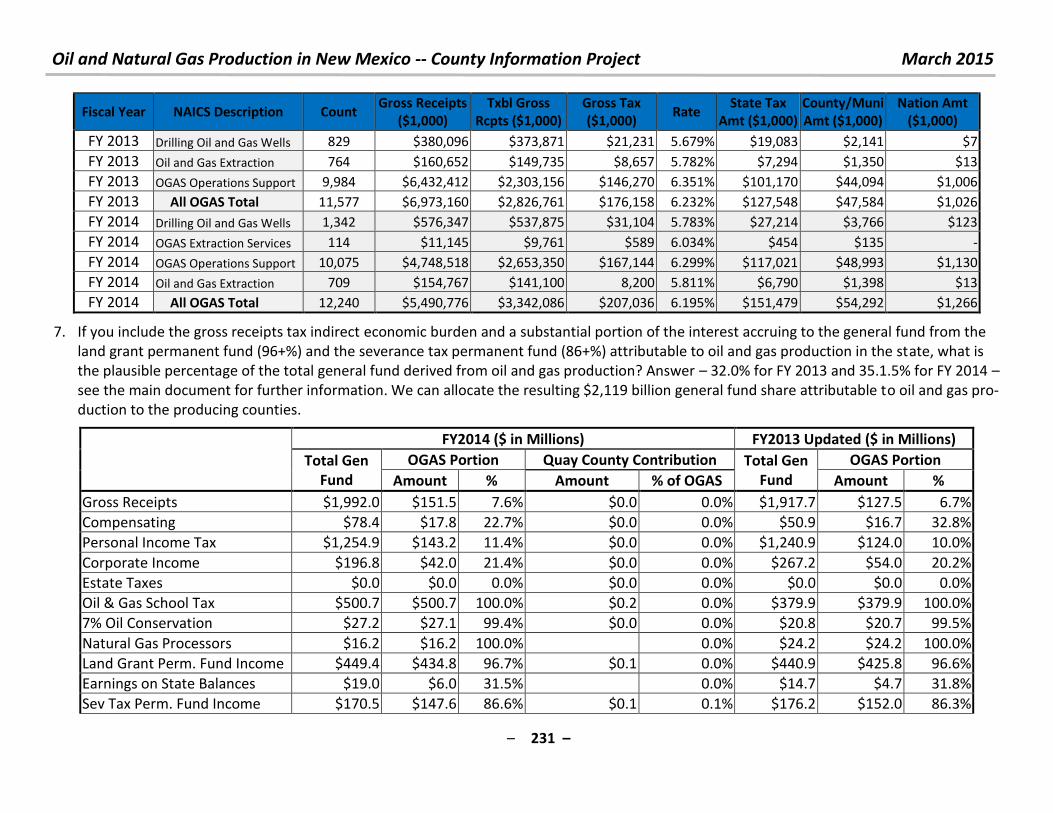
Oil and Natural Gas Production in New Mexico -- County Information Project March 2015
– 231 –
Fiscal Year NAICS Description Count Gross Receipts
($1,000)
Txbl Gross
Rcpts ($1,000)
Gross Tax
($1,000) Rate
State Tax
Amt ($1,000)
County/Muni
Amt ($1,000)
Nation Amt
($1,000)
FY 2013 Drilling Oil and Gas Wells 829 $380,096 $373,871 $21,231 5.679% $19,083 $2,141 $7
FY 2013 Oil and Gas Extraction 764 $160,652 $149,735 $8,657 5.782% $7,294 $1,350 $13
FY 2013 OGAS Operations Support 9,984 $6,432,412 $2,303,156 $146,270 6.351% $101,170 $44,094 $1,006
FY 2013 All OGAS Total 11,577 $6,973,160 $2,826,761 $176,158 6.232% $127,548 $47,584 $1,026
FY 2014 Drilling Oil and Gas Wells 1,342 $576,347 $537,875 $31,104 5.783% $27,214 $3,766 $123
FY 2014 OGAS Extraction Services 114 $11,145 $9,761 $589 6.034% $454 $135 -
FY 2014 OGAS Operations Support 10,075 $4,748,518 $2,653,350 $167,144 6.299% $117,021 $48,993 $1,130
FY 2014 Oil and Gas Extraction 709 $154,767 $141,100 8,200 5.811% $6,790 $1,398 $13
FY 2014 All OGAS Total 12,240 $5,490,776 $3,342,086 $207,036 6.195% $151,479 $54,292 $1,266
7. If you include the gross receipts tax indirect economic burden and a substantial portion of the interest accruing to the general fund from the
land grant permanent fund (96+%) and the severance tax permanent fund (86+%) attributable to oil and gas production in the state, what is
the plausible percentage of the total general fund derived from oil and gas production? Answer – 32.0% for FY 2013 and 35.1.5% for FY 2014 –
see the main document for further information. We can allocate the resulting $2,119 billion general fund share attributable to oil and gas pro-
duction to the producing counties.
FY2014 ($ in Millions) FY2013 Updated ($ in Millions)
Total Gen
Fund
OGAS Portion Quay County Contribution Total Gen
Fund
OGAS Portion
Amount % Amount % of OGAS Amount %
Gross Receipts $1,992.0 $151.5 7.6% $0.0 0.0% $1,917.7 $127.5 6.7%
Compensating $78.4 $17.8 22.7% $0.0 0.0% $50.9 $16.7 32.8%
Personal Income Tax $1,254.9 $143.2 11.4% $0.0 0.0% $1,240.9 $124.0 10.0%
Corporate Income $196.8 $42.0 21.4% $0.0 0.0% $267.2 $54.0 20.2%
Estate Taxes $0.0 $0.0 0.0% $0.0 0.0% $0.0 $0.0 0.0%
Oil & Gas School Tax $500.7 $500.7 100.0% $0.2 0.0% $379.9 $379.9 100.0%
7% Oil Conservation $27.2 $27.1 99.4% $0.0 0.0% $20.8 $20.7 99.5%
Natural Gas Processors $16.2 $16.2 100.0% 0.0% $24.2 $24.2 100.0%
Land Grant Perm. Fund Income $449.4 $434.8 96.7% $0.1 0.0% $440.9 $425.8 96.6%
Earnings on State Balances $19.0 $6.0 31.5% 0.0% $14.7 $4.7 31.8%
Sev Tax Perm. Fund Income $170.5 $147.6 86.6% $0.1 0.1% $176.2 $152.0 86.3%
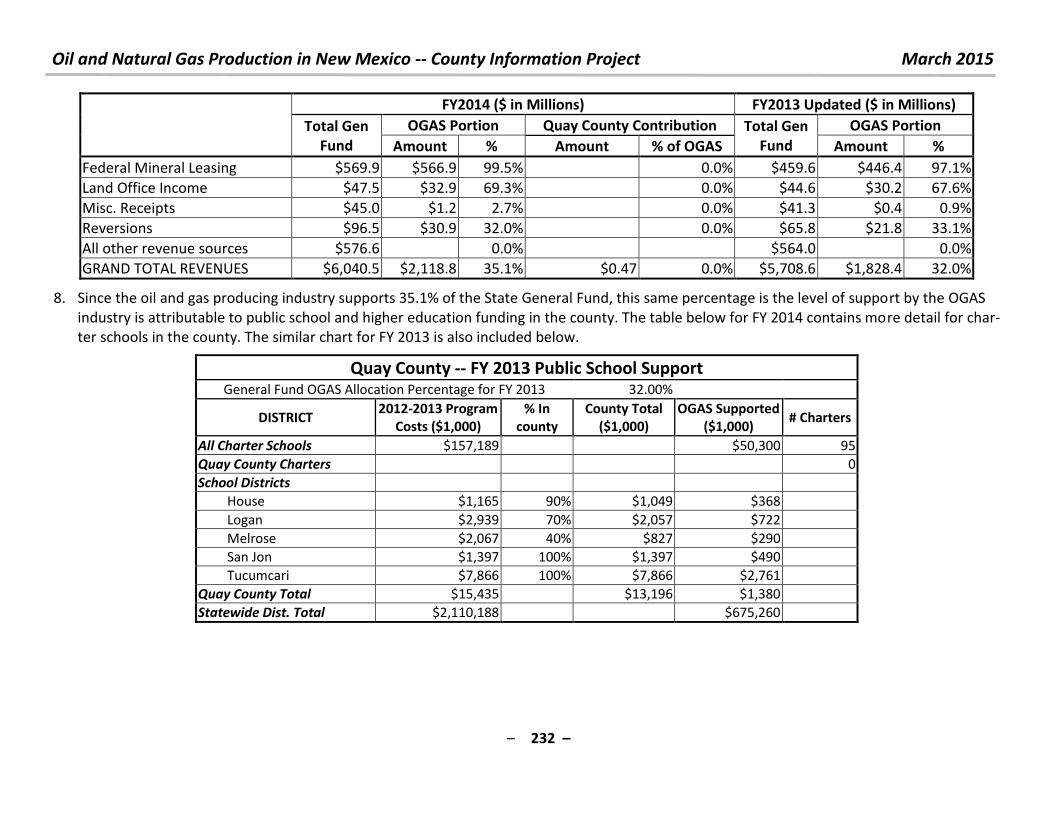
Oil and Natural Gas Production in New Mexico -- County Information Project March 2015
– 232 –
FY2014 ($ in Millions) FY2013 Updated ($ in Millions)
Total Gen
Fund
OGAS Portion Quay County Contribution Total Gen
Fund
OGAS Portion
Amount % Amount % of OGAS Amount %
Federal Mineral Leasing $569.9 $566.9 99.5% 0.0% $459.6 $446.4 97.1%
Land Office Income $47.5 $32.9 69.3% 0.0% $44.6 $30.2 67.6%
Misc. Receipts $45.0 $1.2 2.7% 0.0% $41.3 $0.4 0.9%
Reversions $96.5 $30.9 32.0% 0.0% $65.8 $21.8 33.1%
All other revenue sources $576.6 0.0% $564.0 0.0%
GRAND TOTAL REVENUES $6,040.5 $2,118.8 35.1% $0.47 0.0% $5,708.6 $1,828.4 32.0%
8. Since the oil and gas producing industry supports 35.1% of the State General Fund, this same percentage is the level of support by the OGAS
industry is attributable to public school and higher education funding in the county. The table below for FY 2014 contains more detail for char-
ter schools in the county. The similar chart for FY 2013 is also included below.
Quay County -- FY 2013 Public School Support General Fund OGAS Allocation Percentage for FY 2013 32.00%
DISTRICT 2012-2013 Program
Costs ($1,000)
% In
county
County Total
($1,000)
OGAS Supported
($1,000) # Charters
All Charter Schools $157,189 $50,300 95
Quay County Charters 0
School Districts
House $1,165 90% $1,049 $368
Logan $2,939 70% $2,057 $722
Melrose $2,067 40% $827 $290
San Jon $1,397 100% $1,397 $490
Tucumcari $7,866 100% $7,866 $2,761
Quay County Total $15,435 $13,196 $1,380
Statewide Dist. Total $2,110,188 $675,260
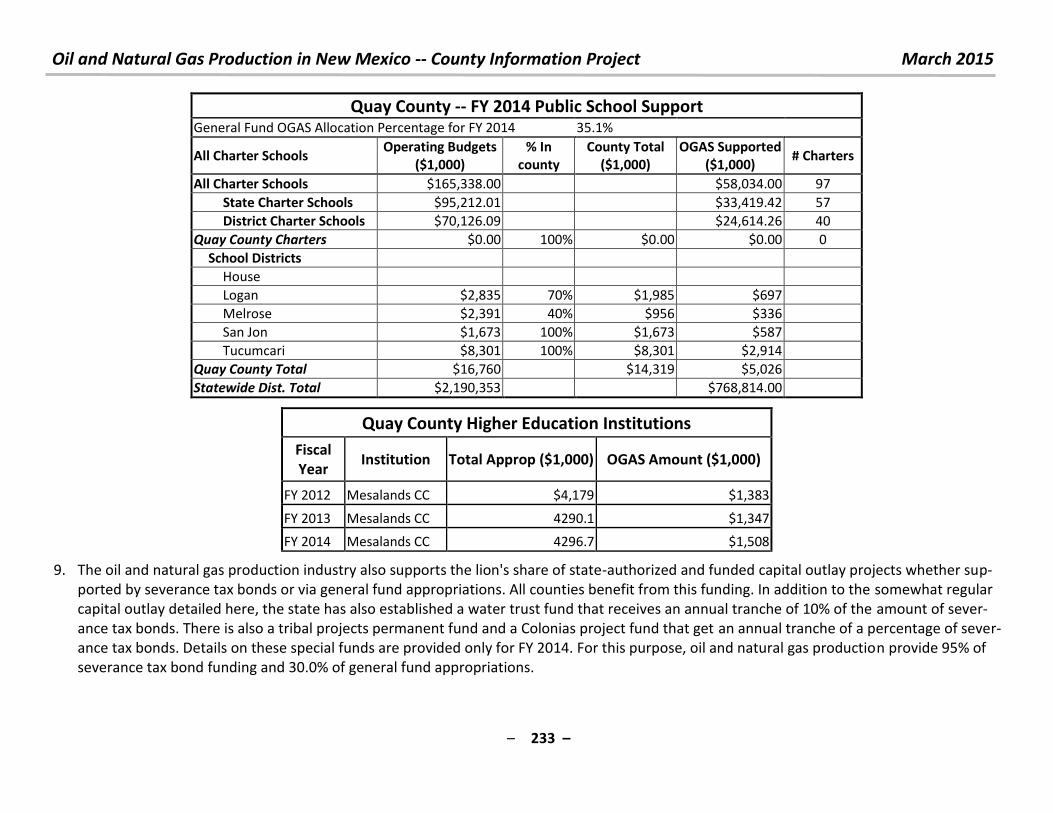
Oil and Natural Gas Production in New Mexico -- County Information Project March 2015
– 233 –
Quay County -- FY 2014 Public School Support General Fund OGAS Allocation Percentage for FY 2014 35.1%
All Charter Schools Operating Budgets
($1,000)
% In
county
County Total
($1,000)
OGAS Supported
($1,000) # Charters
All Charter Schools $165,338.00
$58,034.00 97
State Charter Schools $95,212.01
$33,419.42 57
District Charter Schools $70,126.09
$24,614.26 40
Quay County Charters $0.00 100% $0.00 $0.00 0
School Districts
House
Logan $2,835 70% $1,985 $697
Melrose $2,391 40% $956 $336
San Jon $1,673 100% $1,673 $587
Tucumcari $8,301 100% $8,301 $2,914
Quay County Total $16,760
$14,319 $5,026
Statewide Dist. Total $2,190,353
$768,814.00
Quay County Higher Education Institutions
Fiscal
Year Institution Total Approp ($1,000) OGAS Amount ($1,000)
FY 2012 Mesalands CC $4,179 $1,383
FY 2013 Mesalands CC 4290.1 $1,347
FY 2014 Mesalands CC 4296.7 $1,508
9. The oil and natural gas production industry also supports the lion's share of state-authorized and funded capital outlay projects whether sup-
ported by severance tax bonds or via general fund appropriations. All counties benefit from this funding. In addition to the somewhat regular
capital outlay detailed here, the state has also established a water trust fund that receives an annual tranche of 10% of the amount of sever-
ance tax bonds. There is also a tribal projects permanent fund and a Colonias project fund that get an annual tranche of a percentage of sever-
ance tax bonds. Details on these special funds are provided only for FY 2014. For this purpose, oil and natural gas production provide 95% of
severance tax bond funding and 30.0% of general fund appropriations.
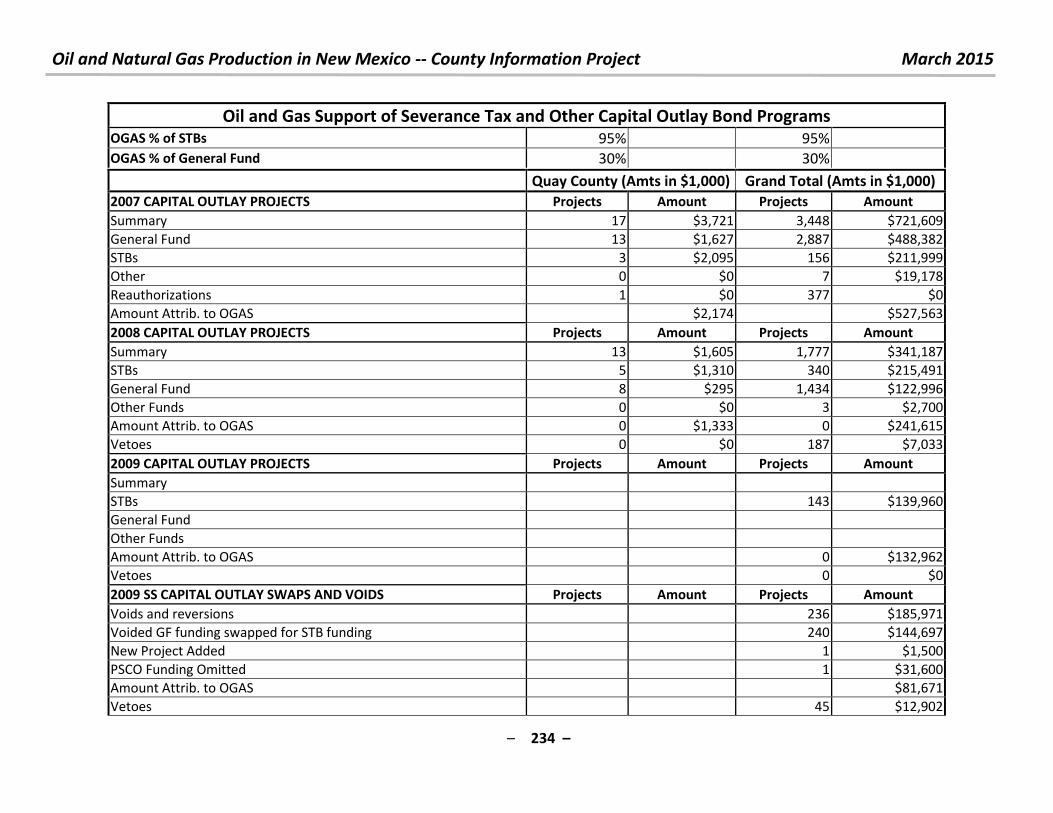
Oil and Natural Gas Production in New Mexico -- County Information Project March 2015
– 234 –
Oil and Gas Support of Severance Tax and Other Capital Outlay Bond Programs OGAS % of STBs 95% 95%
OGAS % of General Fund 30% 30%
Quay County (Amts in $1,000) Grand Total (Amts in $1,000)
2007 CAPITAL OUTLAY PROJECTS Projects Amount Projects Amount
Summary 17 $3,721 3,448 $721,609
General Fund 13 $1,627 2,887 $488,382
STBs 3 $2,095 156 $211,999
Other 0 $0 7 $19,178
Reauthorizations 1 $0 377 $0
Amount Attrib. to OGAS $2,174 $527,563
2008 CAPITAL OUTLAY PROJECTS Projects Amount Projects Amount
Summary 13 $1,605 1,777 $341,187
STBs 5 $1,310 340 $215,491
General Fund 8 $295 1,434 $122,996
Other Funds 0 $0 3 $2,700
Amount Attrib. to OGAS 0 $1,333 0 $241,615
Vetoes 0 $0 187 $7,033
2009 CAPITAL OUTLAY PROJECTS Projects Amount Projects Amount
Summary
STBs 143 $139,960
General Fund
Other Funds
Amount Attrib. to OGAS 0 $132,962
Vetoes 0 $0
2009 SS CAPITAL OUTLAY SWAPS AND VOIDS Projects Amount Projects Amount
Voids and reversions 236 $185,971
Voided GF funding swapped for STB funding 240 $144,697
New Project Added 1 $1,500
PSCO Funding Omitted 1 $31,600
Amount Attrib. to OGAS $81,671
Vetoes 45 $12,902
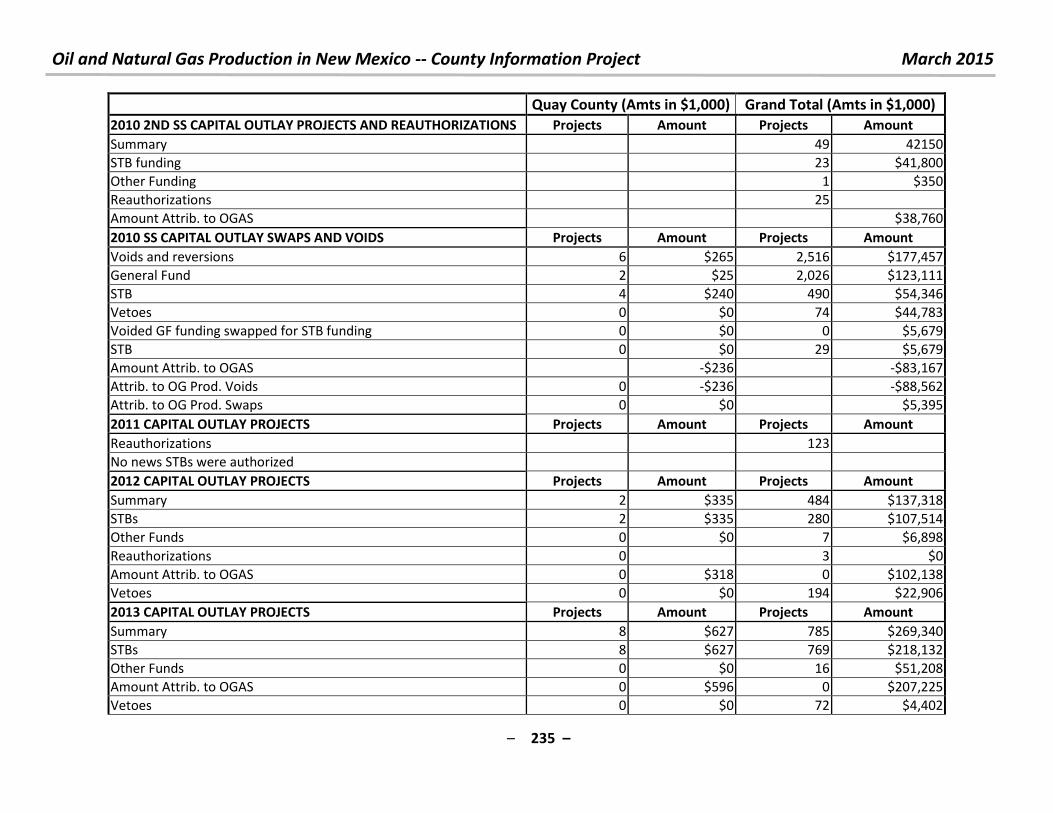
Oil and Natural Gas Production in New Mexico -- County Information Project March 2015
– 235 –
Quay County (Amts in $1,000) Grand Total (Amts in $1,000)
2010 2ND SS CAPITAL OUTLAY PROJECTS AND REAUTHORIZATIONS Projects Amount Projects Amount
Summary 49 42150
STB funding 23 $41,800
Other Funding 1 $350
Reauthorizations 25
Amount Attrib. to OGAS $38,760
2010 SS CAPITAL OUTLAY SWAPS AND VOIDS Projects Amount Projects Amount
Voids and reversions 6 $265 2,516 $177,457
General Fund 2 $25 2,026 $123,111
STB 4 $240 490 $54,346
Vetoes 0 $0 74 $44,783
Voided GF funding swapped for STB funding 0 $0 0 $5,679
STB 0 $0 29 $5,679
Amount Attrib. to OGAS -$236 -$83,167
Attrib. to OG Prod. Voids 0 -$236 -$88,562
Attrib. to OG Prod. Swaps 0 $0 $5,395
2011 CAPITAL OUTLAY PROJECTS Projects Amount Projects Amount
Reauthorizations 123
No news STBs were authorized
2012 CAPITAL OUTLAY PROJECTS Projects Amount Projects Amount
Summary 2 $335 484 $137,318
STBs 2 $335 280 $107,514
Other Funds 0 $0 7 $6,898
Reauthorizations 0 3 $0
Amount Attrib. to OGAS 0 $318 0 $102,138
Vetoes 0 $0 194 $22,906
2013 CAPITAL OUTLAY PROJECTS Projects Amount Projects Amount
Summary 8 $627 785 $269,340
STBs 8 $627 769 $218,132
Other Funds 0 $0 16 $51,208
Amount Attrib. to OGAS 0 $596 0 $207,225
Vetoes 0 $0 72 $4,402
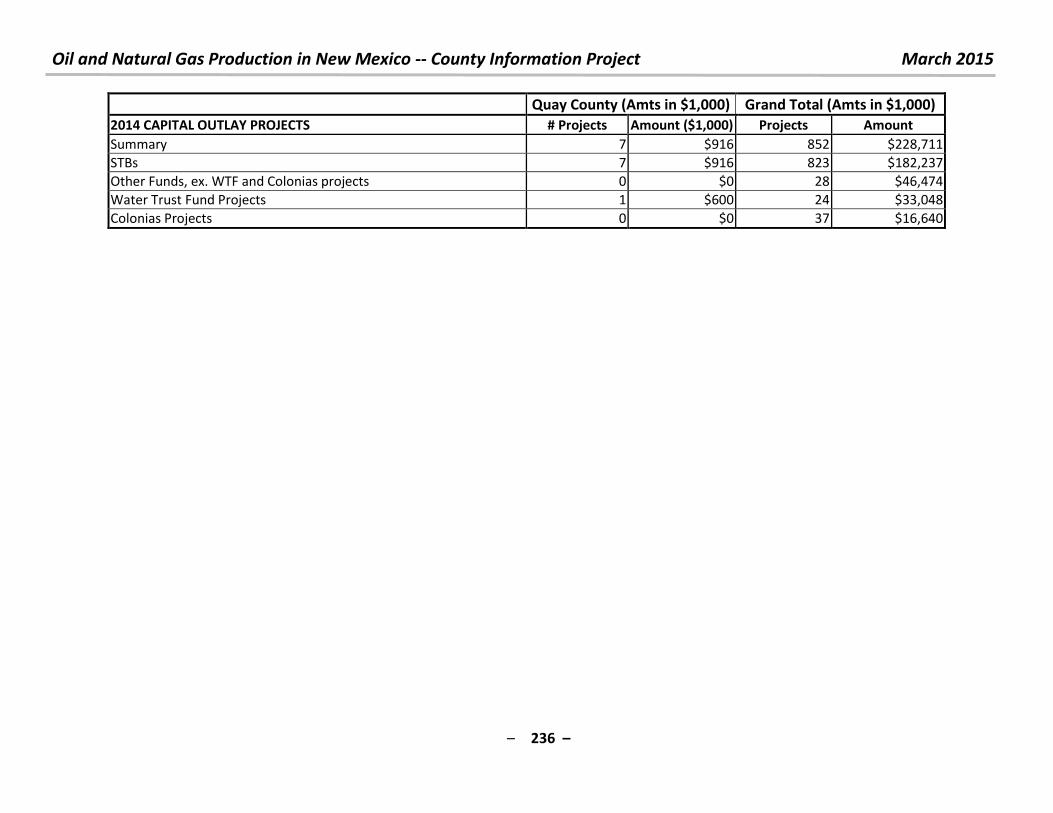
Oil and Natural Gas Production in New Mexico -- County Information Project March 2015
– 236 –
Quay County (Amts in $1,000) Grand Total (Amts in $1,000)
2014 CAPITAL OUTLAY PROJECTS # Projects Amount ($1,000) Projects Amount
Summary 7 $916 852 $228,711
STBs 7 $916 823 $182,237
Other Funds, ex. WTF and Colonias projects 0 $0 28 $46,474
Water Trust Fund Projects 1 $600 24 $33,048
Colonias Projects 0 $0 37 $16,640

Oil and Natural Gas Production in New Mexico -- County Information Project March 2015
– 237 –
10. For questions, comments or criticisms of this work, contact:
Laird Graeser
505 424-9023
or
Richard L. Anklam, President & Executive Director, New Mexico Tax Research Institute
505-269-6791
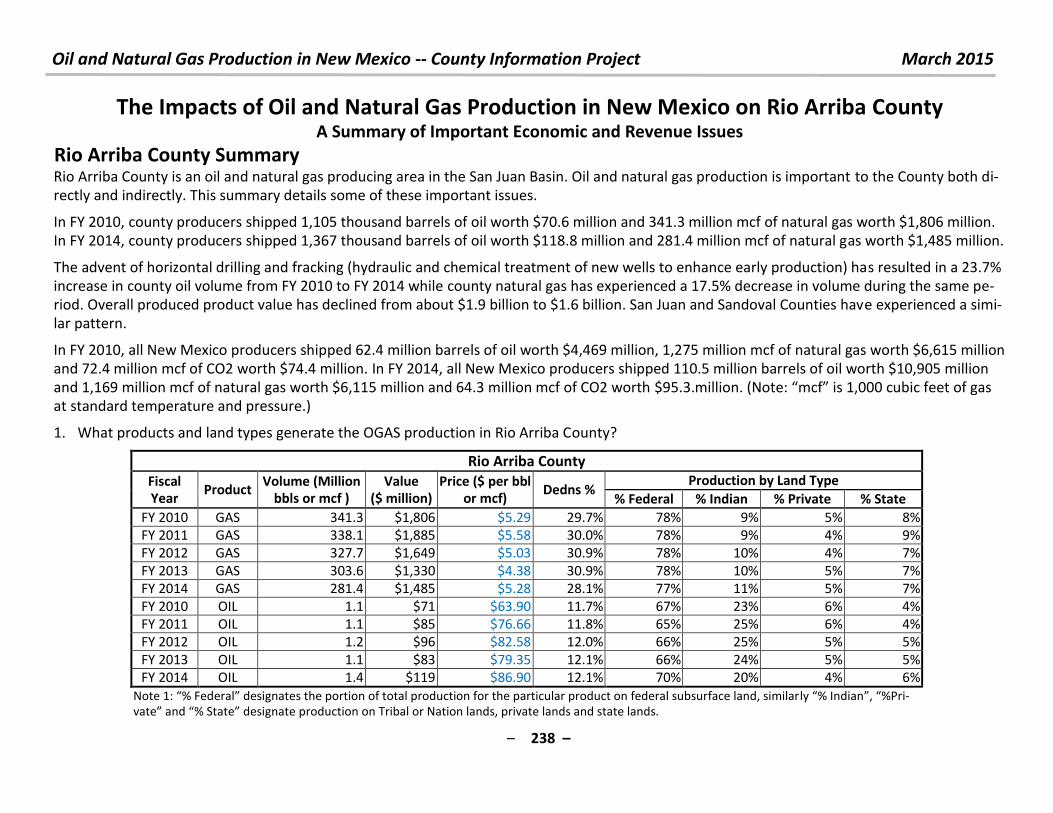
Oil and Natural Gas Production in New Mexico -- County Information Project March 2015
– 238 –
The Impacts of Oil and Natural Gas Production in New Mexico on Rio Arriba County A Summary of Important Economic and Revenue Issues
Rio Arriba County Summary
Rio Arriba County is an oil and natural gas producing area in the San Juan Basin. Oil and natural gas production is important to the County both di-
rectly and indirectly. This summary details some of these important issues.
In FY 2010, county producers shipped 1,105 thousand barrels of oil worth $70.6 million and 341.3 million mcf of natural gas worth $1,806 million.
In FY 2014, county producers shipped 1,367 thousand barrels of oil worth $118.8 million and 281.4 million mcf of natural gas worth $1,485 million.
The advent of horizontal drilling and fracking (hydraulic and chemical treatment of new wells to enhance early production) has resulted in a 23.7%
increase in county oil volume from FY 2010 to FY 2014 while county natural gas has experienced a 17.5% decrease in volume during the same pe-
riod. Overall produced product value has declined from about $1.9 billion to $1.6 billion. San Juan and Sandoval Counties have experienced a simi-
lar pattern.
In FY 2010, all New Mexico producers shipped 62.4 million barrels of oil worth $4,469 million, 1,275 million mcf of natural gas worth $6,615 million
and 72.4 million mcf of CO2 worth $74.4 million. In FY 2014, all New Mexico producers shipped 110.5 million barrels of oil worth $10,905 million
and 1,169 million mcf of natural gas worth $6,115 million and 64.3 million mcf of CO2 worth $ . . illio . Note: f is , u i feet of gas at standard temperature and pressure.)
1. What products and land types generate the OGAS production in Rio Arriba County?
Rio Arriba County
Fiscal
Year Product
Volume (Million
bbls or mcf )
Value
($ million)
Price ($ per bbl
or mcf) Dedns %
Production by Land Type
% Federal % Indian % Private % State
FY 2010 GAS 341.3 $1,806 $5.29 29.7% 78% 9% 5% 8%
FY 2011 GAS 338.1 $1,885 $5.58 30.0% 78% 9% 4% 9%
FY 2012 GAS 327.7 $1,649 $5.03 30.9% 78% 10% 4% 7%
FY 2013 GAS 303.6 $1,330 $4.38 30.9% 78% 10% 5% 7%
FY 2014 GAS 281.4 $1,485 $5.28 28.1% 77% 11% 5% 7%
FY 2010 OIL 1.1 $71 $63.90 11.7% 67% 23% 6% 4%
FY 2011 OIL 1.1 $85 $76.66 11.8% 65% 25% 6% 4%
FY 2012 OIL 1.2 $96 $82.58 12.0% 66% 25% 5% 5%
FY 2013 OIL 1.1 $83 $79.35 12.1% 66% 24% 5% 5%
FY 2014 OIL 1.4 $119 $86.90 12.1% 70% 20% 4% 6%
Note : % Fede al desig ates the po tio of total p odu tio fo the pa ti ula p odu t o fede al su su fa e la d, si ila l % I dia , %P i-
ate a d % “tate desig ate p odu tio o T i al o Natio la ds, p i ate la ds a d state la ds.
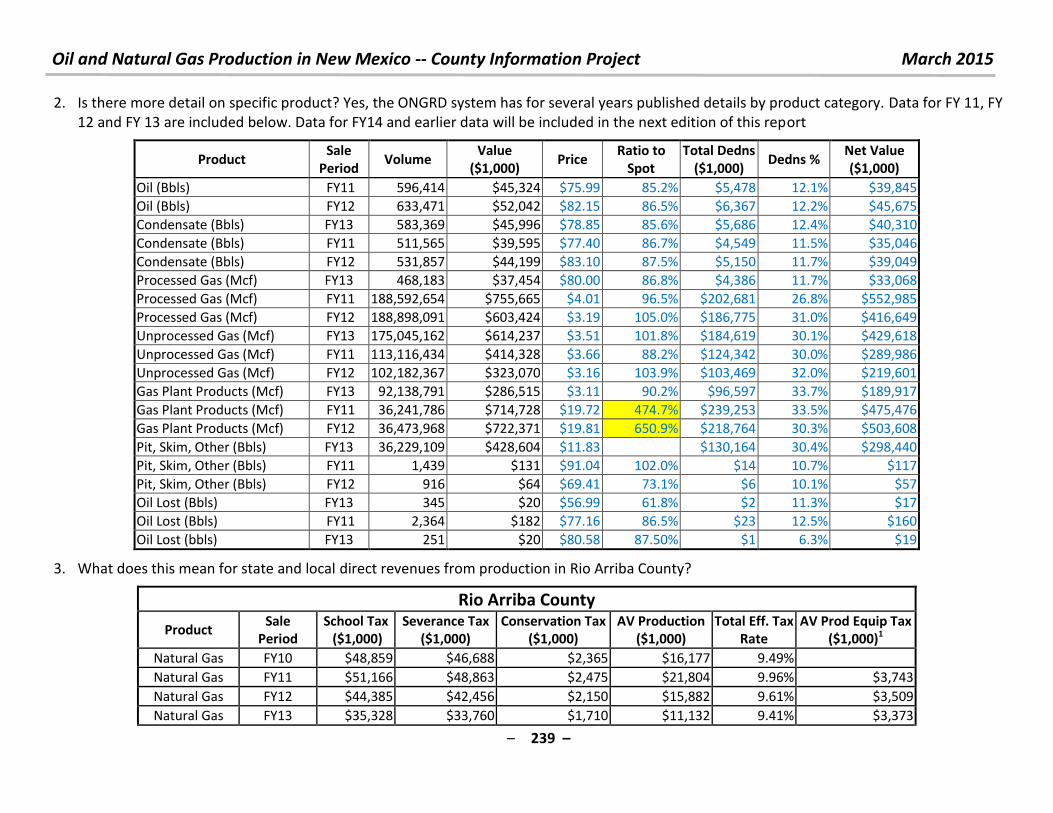
Oil and Natural Gas Production in New Mexico -- County Information Project March 2015
– 239 –
2. Is there more detail on specific product? Yes, the ONGRD system has for several years published details by product category. Data for FY 11, FY
12 and FY 13 are included below. Data for FY14 and earlier data will be included in the next edition of this report
Product Sale
Period Volume
Value
($1,000) Price
Ratio to
Spot
Total Dedns
($1,000) Dedns %
Net Value
($1,000)
Oil (Bbls) FY11 596,414 $45,324 $75.99 85.2% $5,478 12.1% $39,845
Oil (Bbls) FY12 633,471 $52,042 $82.15 86.5% $6,367 12.2% $45,675
Condensate (Bbls) FY13 583,369 $45,996 $78.85 85.6% $5,686 12.4% $40,310
Condensate (Bbls) FY11 511,565 $39,595 $77.40 86.7% $4,549 11.5% $35,046
Condensate (Bbls) FY12 531,857 $44,199 $83.10 87.5% $5,150 11.7% $39,049
Processed Gas (Mcf) FY13 468,183 $37,454 $80.00 86.8% $4,386 11.7% $33,068
Processed Gas (Mcf) FY11 188,592,654 $755,665 $4.01 96.5% $202,681 26.8% $552,985
Processed Gas (Mcf) FY12 188,898,091 $603,424 $3.19 105.0% $186,775 31.0% $416,649
Unprocessed Gas (Mcf) FY13 175,045,162 $614,237 $3.51 101.8% $184,619 30.1% $429,618
Unprocessed Gas (Mcf) FY11 113,116,434 $414,328 $3.66 88.2% $124,342 30.0% $289,986
Unprocessed Gas (Mcf) FY12 102,182,367 $323,070 $3.16 103.9% $103,469 32.0% $219,601
Gas Plant Products (Mcf) FY13 92,138,791 $286,515 $3.11 90.2% $96,597 33.7% $189,917
Gas Plant Products (Mcf) FY11 36,241,786 $714,728 $19.72 474.7% $239,253 33.5% $475,476
Gas Plant Products (Mcf) FY12 36,473,968 $722,371 $19.81 650.9% $218,764 30.3% $503,608
Pit, Skim, Other (Bbls) FY13 36,229,109 $428,604 $11.83 $130,164 30.4% $298,440
Pit, Skim, Other (Bbls) FY11 1,439 $131 $91.04 102.0% $14 10.7% $117
Pit, Skim, Other (Bbls) FY12 916 $64 $69.41 73.1% $6 10.1% $57
Oil Lost (Bbls) FY13 345 $20 $56.99 61.8% $2 11.3% $17
Oil Lost (Bbls) FY11 2,364 $182 $77.16 86.5% $23 12.5% $160
Oil Lost (bbls) FY13 251 $20 $80.58 87.50% $1 6.3% $19
3. What does this mean for state and local direct revenues from production in Rio Arriba County?
Rio Arriba County
Product Sale
Period
School Tax
($1,000)
Severance Tax
($1,000)
Conservation Tax
($1,000)
AV Production
($1,000)
Total Eff. Tax
Rate
AV Prod Equip Tax
($1,000)1
Natural Gas FY10 $48,859 $46,688 $2,365 $16,177 9.49%
Natural Gas FY11 $51,166 $48,863 $2,475 $21,804 9.96% $3,743
Natural Gas FY12 $44,385 $42,456 $2,150 $15,882 9.61% $3,509
Natural Gas FY13 $35,328 $33,760 $1,710 $11,132 9.41% $3,373
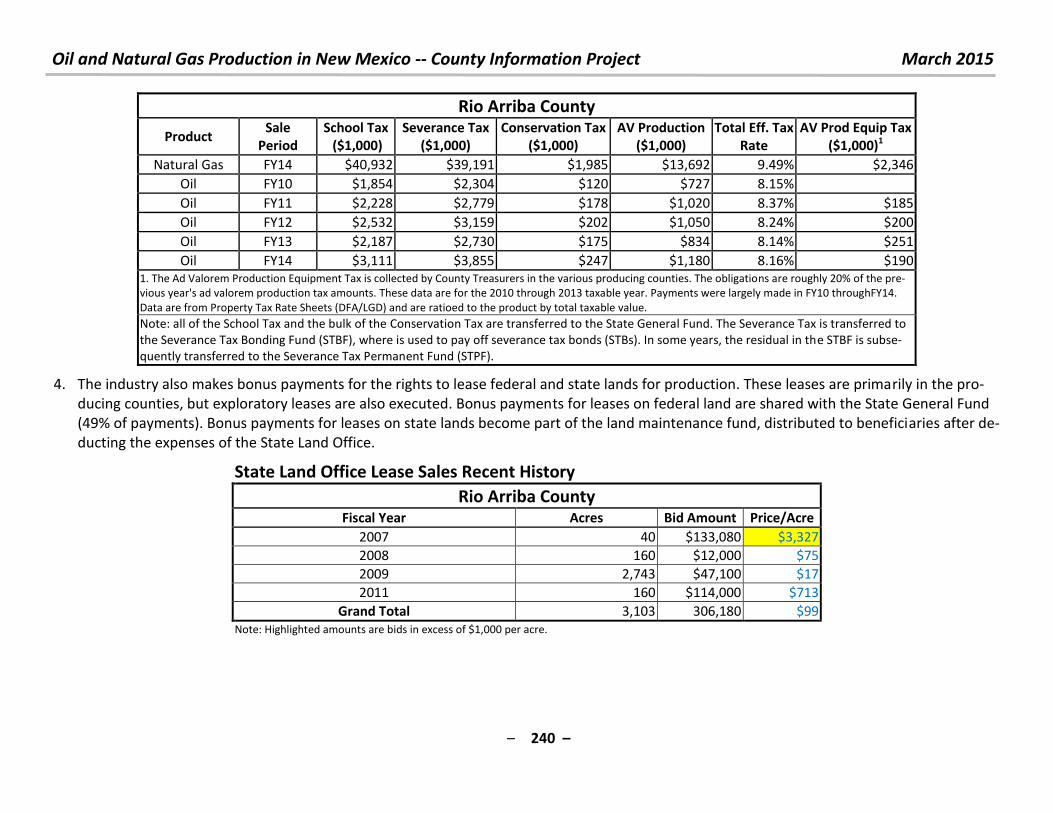
Oil and Natural Gas Production in New Mexico -- County Information Project March 2015
– 240 –
Rio Arriba County
Product Sale
Period
School Tax
($1,000)
Severance Tax
($1,000)
Conservation Tax
($1,000)
AV Production
($1,000)
Total Eff. Tax
Rate
AV Prod Equip Tax
($1,000)1
Natural Gas FY14 $40,932 $39,191 $1,985 $13,692 9.49% $2,346
Oil FY10 $1,854 $2,304 $120 $727 8.15%
Oil FY11 $2,228 $2,779 $178 $1,020 8.37% $185
Oil FY12 $2,532 $3,159 $202 $1,050 8.24% $200
Oil FY13 $2,187 $2,730 $175 $834 8.14% $251
Oil FY14 $3,111 $3,855 $247 $1,180 8.16% $190
1. The Ad Valorem Production Equipment Tax is collected by County Treasurers in the various producing counties. The obligations are roughly 20% of the pre-
vious year's ad valorem production tax amounts. These data are for the 2010 through 2013 taxable year. Payments were largely made in FY10 throughFY14.
Data are from Property Tax Rate Sheets (DFA/LGD) and are ratioed to the product by total taxable value.
Note: all of the School Tax and the bulk of the Conservation Tax are transferred to the State General Fund. The Severance Tax is transferred to
the Severance Tax Bonding Fund (STBF), where is used to pay off severance tax bonds (STBs). In some years, the residual in the STBF is subse-
quently transferred to the Severance Tax Permanent Fund (STPF).
4. The industry also makes bonus payments for the rights to lease federal and state lands for production. These leases are primarily in the pro-
ducing counties, but exploratory leases are also executed. Bonus payments for leases on federal land are shared with the State General Fund
(49% of payments). Bonus payments for leases on state lands become part of the land maintenance fund, distributed to beneficiaries after de-
ducting the expenses of the State Land Office.
State Land Office Lease Sales Recent History
Rio Arriba County Fiscal Year Acres Bid Amount Price/Acre
2007 40 $133,080 $3,327
2008 160 $12,000 $75
2009 2,743 $47,100 $17
2011 160 $114,000 $713
Grand Total 3,103 306,180 $99
Note: Highlighted amounts are bids in excess of $1,000 per acre.
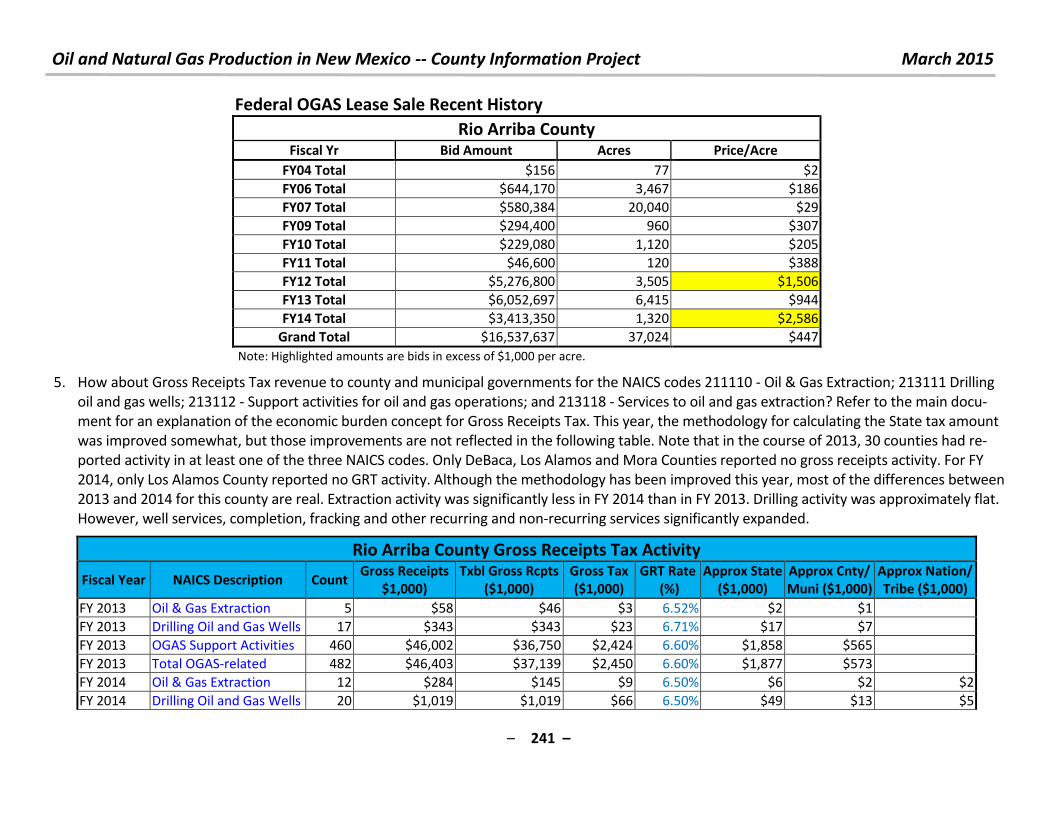
Oil and Natural Gas Production in New Mexico -- County Information Project March 2015
– 241 –
Federal OGAS Lease Sale Recent History
Rio Arriba County Fiscal Yr Bid Amount Acres Price/Acre
FY04 Total $156 77 $2
FY06 Total $644,170 3,467 $186
FY07 Total $580,384 20,040 $29
FY09 Total $294,400 960 $307
FY10 Total $229,080 1,120 $205
FY11 Total $46,600 120 $388
FY12 Total $5,276,800 3,505 $1,506
FY13 Total $6,052,697 6,415 $944
FY14 Total $3,413,350 1,320 $2,586
Grand Total $16,537,637 37,024 $447
Note: Highlighted amounts are bids in excess of $1,000 per acre.
5. How about Gross Receipts Tax revenue to county and municipal governments for the NAICS codes 211110 - Oil & Gas Extraction; 213111 Drilling
oil and gas wells; 213112 - Support activities for oil and gas operations; and 213118 - Services to oil and gas extraction? Refer to the main docu-
ment for an explanation of the economic burden concept for Gross Receipts Tax. This year, the methodology for calculating the State tax amount
was improved somewhat, but those improvements are not reflected in the following table. Note that in the course of 2013, 30 counties had re-
ported activity in at least one of the three NAICS codes. Only DeBaca, Los Alamos and Mora Counties reported no gross receipts activity. For FY
2014, only Los Alamos County reported no GRT activity. Although the methodology has been improved this year, most of the differences between
2013 and 2014 for this county are real. Extraction activity was significantly less in FY 2014 than in FY 2013. Drilling activity was approximately flat.
However, well services, completion, fracking and other recurring and non-recurring services significantly expanded.
Rio Arriba County Gross Receipts Tax Activity
Fiscal Year NAICS Description Count Gross Receipts
$1,000)
Txbl Gross Rcpts
($1,000)
Gross Tax
($1,000)
GRT Rate
(%)
Approx State
($1,000)
Approx Cnty/
Muni ($1,000)
Approx Nation/
Tribe ($1,000)
FY 2013 Oil & Gas Extraction 5 $58 $46 $3 6.52% $2 $1
FY 2013 Drilling Oil and Gas Wells 17 $343 $343 $23 6.71% $17 $7
FY 2013 OGAS Support Activities 460 $46,002 $36,750 $2,424 6.60% $1,858 $565
FY 2013 Total OGAS-related 482 $46,403 $37,139 $2,450 6.60% $1,877 $573
FY 2014 Oil & Gas Extraction 12 $284 $145 $9 6.50% $6 $2 $2
FY 2014 Drilling Oil and Gas Wells 20 $1,019 $1,019 $66 6.50% $49 $13 $5
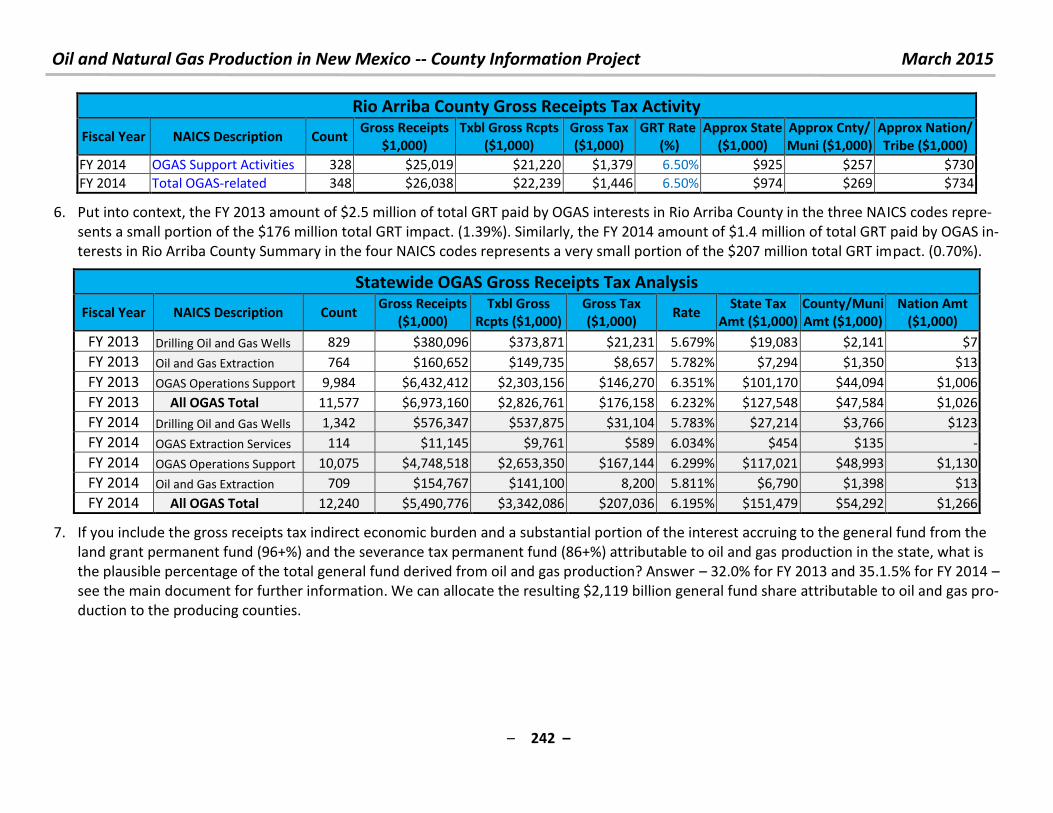
Oil and Natural Gas Production in New Mexico -- County Information Project March 2015
– 242 –
Rio Arriba County Gross Receipts Tax Activity
Fiscal Year NAICS Description Count Gross Receipts
$1,000)
Txbl Gross Rcpts
($1,000)
Gross Tax
($1,000)
GRT Rate
(%)
Approx State
($1,000)
Approx Cnty/
Muni ($1,000)
Approx Nation/
Tribe ($1,000)
FY 2014 OGAS Support Activities 328 $25,019 $21,220 $1,379 6.50% $925 $257 $730
FY 2014 Total OGAS-related 348 $26,038 $22,239 $1,446 6.50% $974 $269 $734
6. Put into context, the FY 2013 amount of $2.5 million of total GRT paid by OGAS interests in Rio Arriba County in the three NAICS codes repre-
sents a small portion of the $176 million total GRT impact. (1.39%). Similarly, the FY 2014 amount of $1.4 million of total GRT paid by OGAS in-
terests in Rio Arriba County Summary in the four NAICS codes represents a very small portion of the $207 million total GRT impact. (0.70%).
Statewide OGAS Gross Receipts Tax Analysis
Fiscal Year NAICS Description Count Gross Receipts
($1,000)
Txbl Gross
Rcpts ($1,000)
Gross Tax
($1,000) Rate
State Tax
Amt ($1,000)
County/Muni
Amt ($1,000)
Nation Amt
($1,000)
FY 2013 Drilling Oil and Gas Wells 829 $380,096 $373,871 $21,231 5.679% $19,083 $2,141 $7
FY 2013 Oil and Gas Extraction 764 $160,652 $149,735 $8,657 5.782% $7,294 $1,350 $13
FY 2013 OGAS Operations Support 9,984 $6,432,412 $2,303,156 $146,270 6.351% $101,170 $44,094 $1,006
FY 2013 All OGAS Total 11,577 $6,973,160 $2,826,761 $176,158 6.232% $127,548 $47,584 $1,026
FY 2014 Drilling Oil and Gas Wells 1,342 $576,347 $537,875 $31,104 5.783% $27,214 $3,766 $123
FY 2014 OGAS Extraction Services 114 $11,145 $9,761 $589 6.034% $454 $135 -
FY 2014 OGAS Operations Support 10,075 $4,748,518 $2,653,350 $167,144 6.299% $117,021 $48,993 $1,130
FY 2014 Oil and Gas Extraction 709 $154,767 $141,100 8,200 5.811% $6,790 $1,398 $13
FY 2014 All OGAS Total 12,240 $5,490,776 $3,342,086 $207,036 6.195% $151,479 $54,292 $1,266
7. If you include the gross receipts tax indirect economic burden and a substantial portion of the interest accruing to the general fund from the
land grant permanent fund (96+%) and the severance tax permanent fund (86+%) attributable to oil and gas production in the state, what is
the plausible percentage of the total general fund derived from oil and gas production? Answer – 32.0% for FY 2013 and 35.1.5% for FY 2014 –
see the main document for further information. We can allocate the resulting $2,119 billion general fund share attributable to oil and gas pro-
duction to the producing counties.
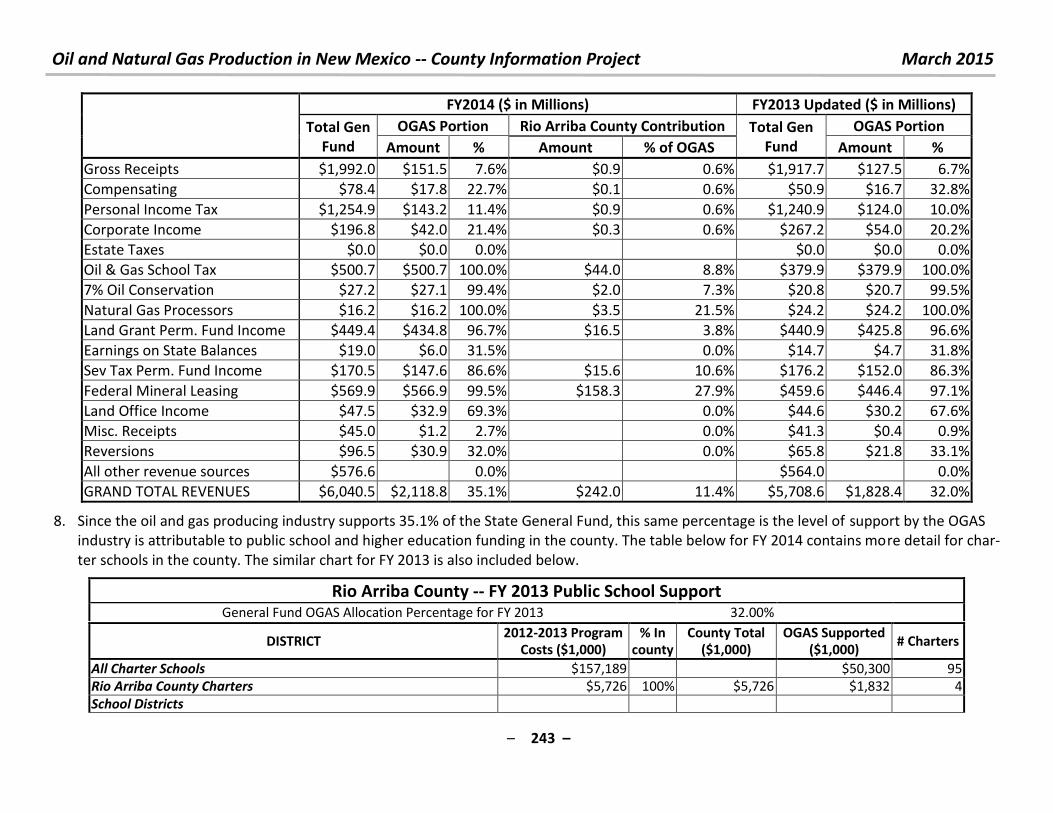
Oil and Natural Gas Production in New Mexico -- County Information Project March 2015
– 243 –
FY2014 ($ in Millions) FY2013 Updated ($ in Millions)
Total Gen
Fund
OGAS Portion Rio Arriba County Contribution Total Gen
Fund
OGAS Portion
Amount % Amount % of OGAS Amount %
Gross Receipts $1,992.0 $151.5 7.6% $0.9 0.6% $1,917.7 $127.5 6.7%
Compensating $78.4 $17.8 22.7% $0.1 0.6% $50.9 $16.7 32.8%
Personal Income Tax $1,254.9 $143.2 11.4% $0.9 0.6% $1,240.9 $124.0 10.0%
Corporate Income $196.8 $42.0 21.4% $0.3 0.6% $267.2 $54.0 20.2%
Estate Taxes $0.0 $0.0 0.0%
$0.0 $0.0 0.0%
Oil & Gas School Tax $500.7 $500.7 100.0% $44.0 8.8% $379.9 $379.9 100.0%
7% Oil Conservation $27.2 $27.1 99.4% $2.0 7.3% $20.8 $20.7 99.5%
Natural Gas Processors $16.2 $16.2 100.0% $3.5 21.5% $24.2 $24.2 100.0%
Land Grant Perm. Fund Income $449.4 $434.8 96.7% $16.5 3.8% $440.9 $425.8 96.6%
Earnings on State Balances $19.0 $6.0 31.5% 0.0% $14.7 $4.7 31.8%
Sev Tax Perm. Fund Income $170.5 $147.6 86.6% $15.6 10.6% $176.2 $152.0 86.3%
Federal Mineral Leasing $569.9 $566.9 99.5% $158.3 27.9% $459.6 $446.4 97.1%
Land Office Income $47.5 $32.9 69.3% 0.0% $44.6 $30.2 67.6%
Misc. Receipts $45.0 $1.2 2.7% 0.0% $41.3 $0.4 0.9%
Reversions $96.5 $30.9 32.0% 0.0% $65.8 $21.8 33.1%
All other revenue sources $576.6 0.0% $564.0 0.0%
GRAND TOTAL REVENUES $6,040.5 $2,118.8 35.1% $242.0 11.4% $5,708.6 $1,828.4 32.0%
8. Since the oil and gas producing industry supports 35.1% of the State General Fund, this same percentage is the level of support by the OGAS
industry is attributable to public school and higher education funding in the county. The table below for FY 2014 contains more detail for char-
ter schools in the county. The similar chart for FY 2013 is also included below.
Rio Arriba County -- FY 2013 Public School Support General Fund OGAS Allocation Percentage for FY 2013 32.00%
DISTRICT 2012-2013 Program
Costs ($1,000) % In
county County Total
($1,000) OGAS Supported
($1,000) # Charters
All Charter Schools $157,189 $50,300 95
Rio Arriba County Charters $5,726 100% $5,726 $1,832 4
School Districts
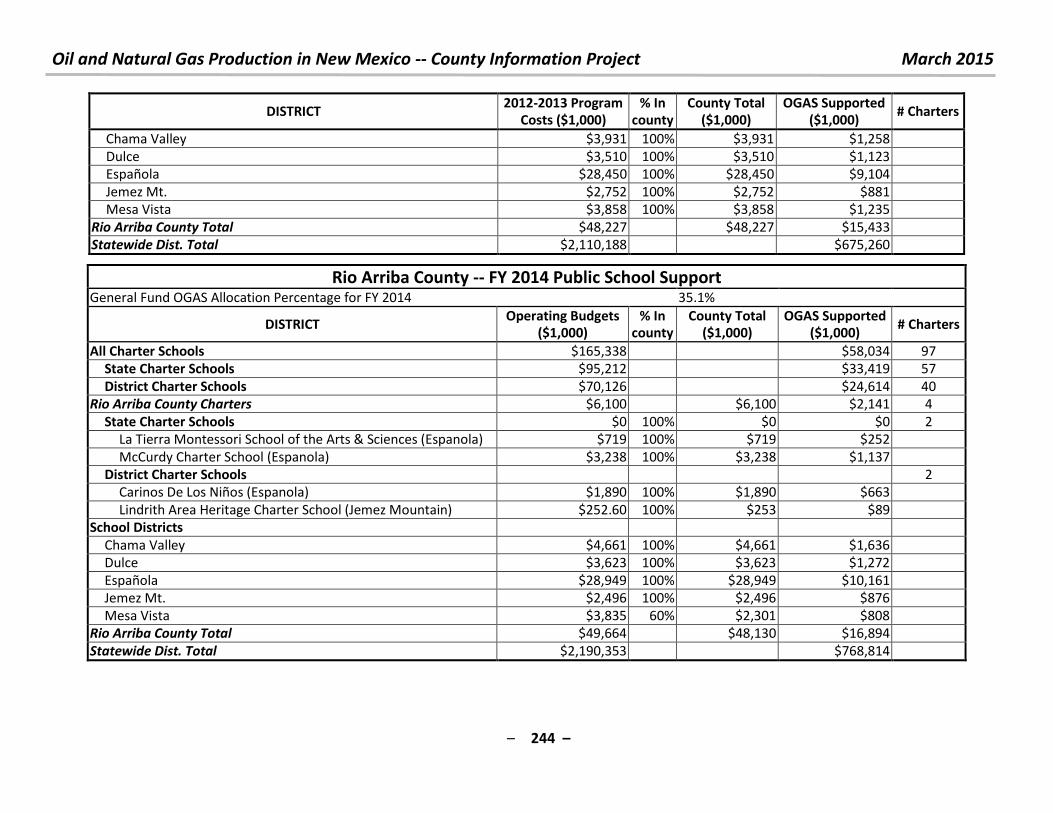
Oil and Natural Gas Production in New Mexico -- County Information Project March 2015
– 244 –
DISTRICT 2012-2013 Program
Costs ($1,000)
% In
county
County Total
($1,000)
OGAS Supported
($1,000) # Charters
Chama Valley $3,931 100% $3,931 $1,258
Dulce $3,510 100% $3,510 $1,123
Española $28,450 100% $28,450 $9,104
Jemez Mt. $2,752 100% $2,752 $881
Mesa Vista $3,858 100% $3,858 $1,235
Rio Arriba County Total $48,227
$48,227 $15,433
Statewide Dist. Total $2,110,188
$675,260
Rio Arriba County -- FY 2014 Public School Support General Fund OGAS Allocation Percentage for FY 2014 35.1%
DISTRICT Operating Budgets
($1,000) % In
county County Total
($1,000) OGAS Supported
($1,000) # Charters
All Charter Schools $165,338
$58,034 97
State Charter Schools $95,212
$33,419 57
District Charter Schools $70,126
$24,614 40
Rio Arriba County Charters $6,100
$6,100 $2,141 4
State Charter Schools $0 100% $0 $0 2
La Tierra Montessori School of the Arts & Sciences (Espanola) $719 100% $719 $252
McCurdy Charter School (Espanola) $3,238 100% $3,238 $1,137
District Charter Schools
2
Carinos De Los Niños (Espanola) $1,890 100% $1,890 $663
Lindrith Area Heritage Charter School (Jemez Mountain) $252.60 100% $253 $89
School Districts
Chama Valley $4,661 100% $4,661 $1,636
Dulce $3,623 100% $3,623 $1,272
Española $28,949 100% $28,949 $10,161
Jemez Mt. $2,496 100% $2,496 $876
Mesa Vista $3,835 60% $2,301 $808
Rio Arriba County Total $49,664 $48,130 $16,894
Statewide Dist. Total $2,190,353 $768,814
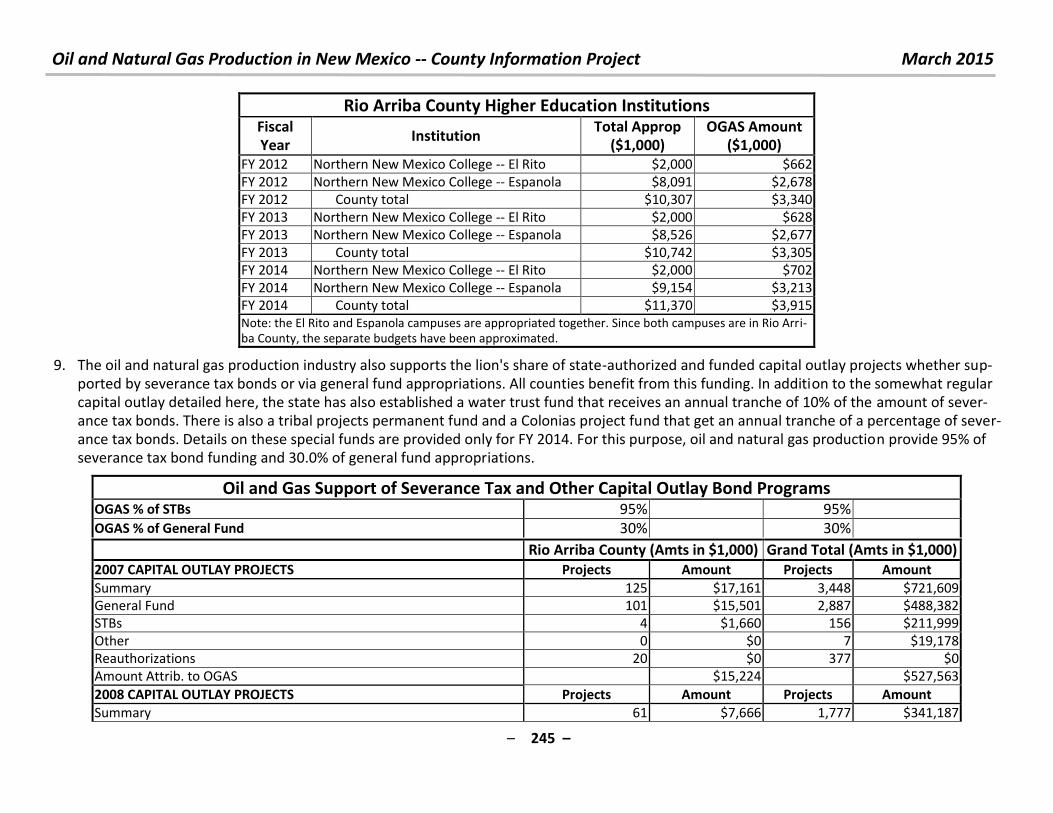
Oil and Natural Gas Production in New Mexico -- County Information Project March 2015
– 245 –
Rio Arriba County Higher Education Institutions Fiscal
Year Institution
Total Approp
($1,000)
OGAS Amount
($1,000)
FY 2012 Northern New Mexico College -- El Rito $2,000 $662
FY 2012 Northern New Mexico College -- Espanola $8,091 $2,678
FY 2012 County total $10,307 $3,340
FY 2013 Northern New Mexico College -- El Rito $2,000 $628
FY 2013 Northern New Mexico College -- Espanola $8,526 $2,677
FY 2013 County total $10,742 $3,305
FY 2014 Northern New Mexico College -- El Rito $2,000 $702
FY 2014 Northern New Mexico College -- Espanola $9,154 $3,213
FY 2014 County total $11,370 $3,915
Note: the El Rito and Espanola campuses are appropriated together. Since both campuses are in Rio Arri-
ba County, the separate budgets have been approximated.
9. The oil and natural gas production industry also supports the lion's share of state-authorized and funded capital outlay projects whether sup-
ported by severance tax bonds or via general fund appropriations. All counties benefit from this funding. In addition to the somewhat regular
capital outlay detailed here, the state has also established a water trust fund that receives an annual tranche of 10% of the amount of sever-
ance tax bonds. There is also a tribal projects permanent fund and a Colonias project fund that get an annual tranche of a percentage of sever-
ance tax bonds. Details on these special funds are provided only for FY 2014. For this purpose, oil and natural gas production provide 95% of
severance tax bond funding and 30.0% of general fund appropriations.
Oil and Gas Support of Severance Tax and Other Capital Outlay Bond Programs OGAS % of STBs 95% 95%
OGAS % of General Fund 30% 30% Rio Arriba County (Amts in $1,000) Grand Total (Amts in $1,000)
2007 CAPITAL OUTLAY PROJECTS Projects Amount Projects Amount
Summary 125 $17,161 3,448 $721,609
General Fund 101 $15,501 2,887 $488,382
STBs 4 $1,660 156 $211,999
Other 0 $0 7 $19,178
Reauthorizations 20 $0 377 $0
Amount Attrib. to OGAS $15,224 $527,563
2008 CAPITAL OUTLAY PROJECTS Projects Amount Projects Amount
Summary 61 $7,666 1,777 $341,187
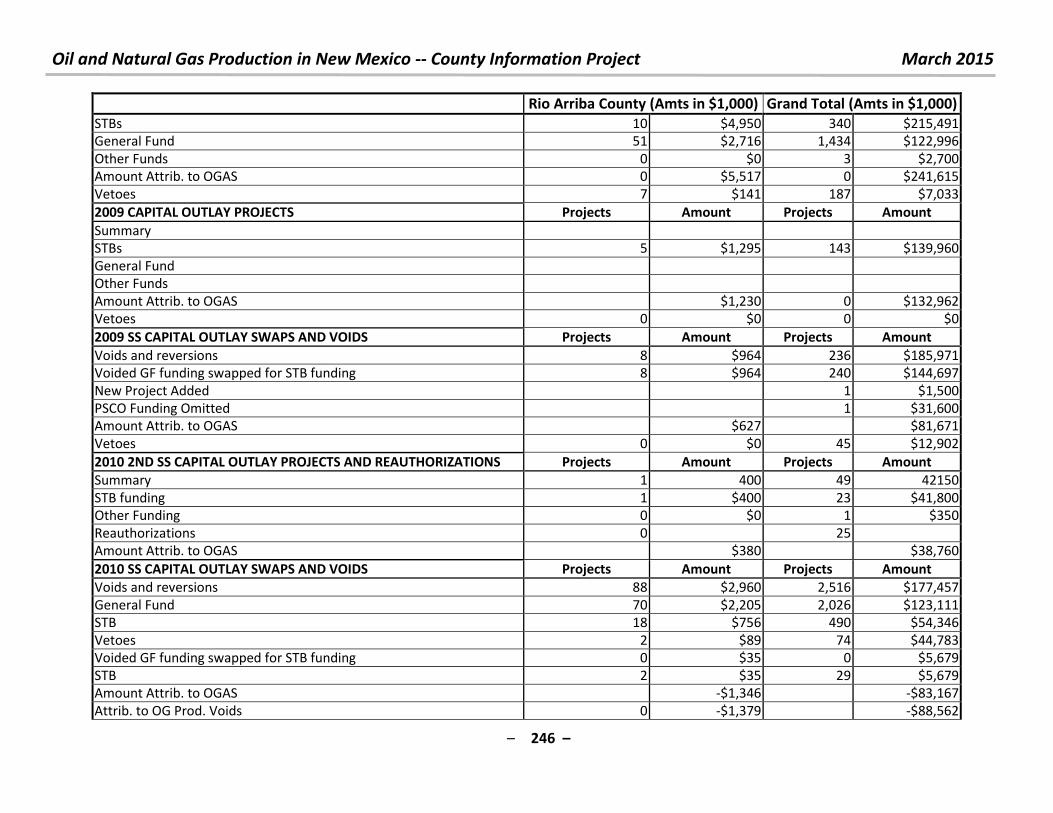
Oil and Natural Gas Production in New Mexico -- County Information Project March 2015
– 246 –
Rio Arriba County (Amts in $1,000) Grand Total (Amts in $1,000)
STBs 10 $4,950 340 $215,491
General Fund 51 $2,716 1,434 $122,996
Other Funds 0 $0 3 $2,700
Amount Attrib. to OGAS 0 $5,517 0 $241,615
Vetoes 7 $141 187 $7,033
2009 CAPITAL OUTLAY PROJECTS Projects Amount Projects Amount
Summary
STBs 5 $1,295 143 $139,960
General Fund
Other Funds
Amount Attrib. to OGAS $1,230 0 $132,962
Vetoes 0 $0 0 $0
2009 SS CAPITAL OUTLAY SWAPS AND VOIDS Projects Amount Projects Amount
Voids and reversions 8 $964 236 $185,971
Voided GF funding swapped for STB funding 8 $964 240 $144,697
New Project Added 1 $1,500
PSCO Funding Omitted 1 $31,600
Amount Attrib. to OGAS $627 $81,671
Vetoes 0 $0 45 $12,902
2010 2ND SS CAPITAL OUTLAY PROJECTS AND REAUTHORIZATIONS Projects Amount Projects Amount
Summary 1 400 49 42150
STB funding 1 $400 23 $41,800
Other Funding 0 $0 1 $350
Reauthorizations 0 25
Amount Attrib. to OGAS $380 $38,760
2010 SS CAPITAL OUTLAY SWAPS AND VOIDS Projects Amount Projects Amount
Voids and reversions 88 $2,960 2,516 $177,457
General Fund 70 $2,205 2,026 $123,111
STB 18 $756 490 $54,346
Vetoes 2 $89 74 $44,783
Voided GF funding swapped for STB funding 0 $35 0 $5,679
STB 2 $35 29 $5,679
Amount Attrib. to OGAS -$1,346 -$83,167
Attrib. to OG Prod. Voids 0 -$1,379 -$88,562
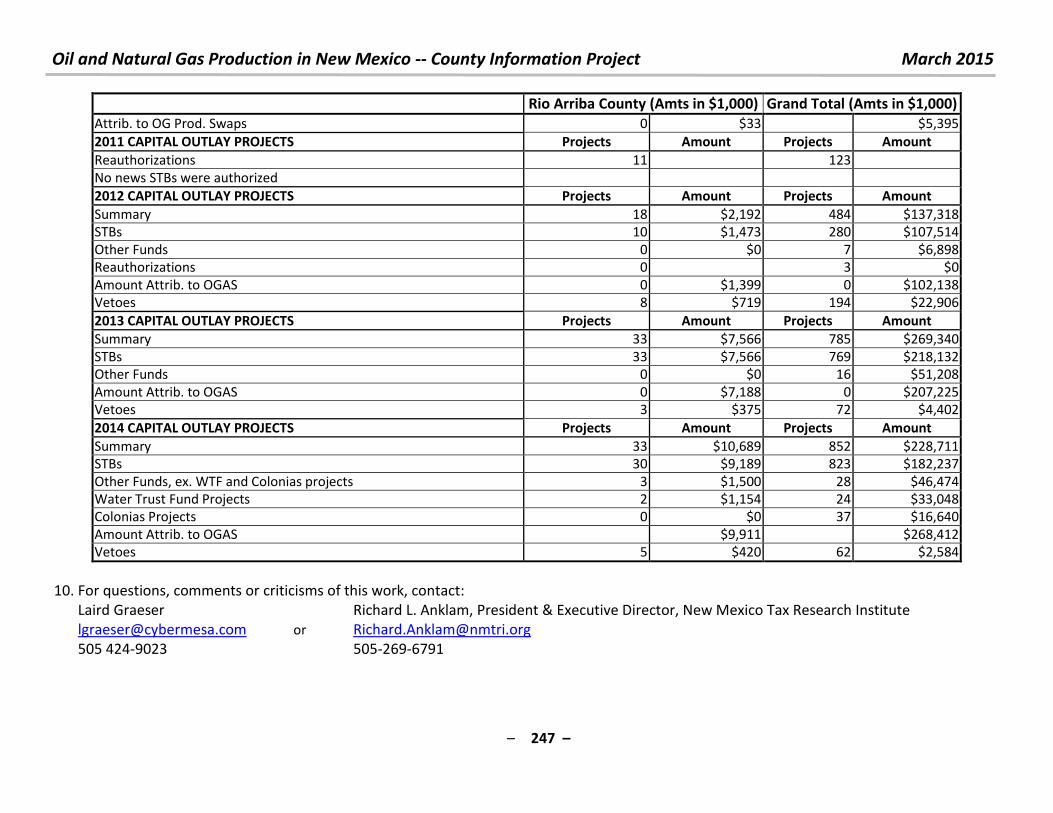
Oil and Natural Gas Production in New Mexico -- County Information Project March 2015
– 247 –
Rio Arriba County (Amts in $1,000) Grand Total (Amts in $1,000)
Attrib. to OG Prod. Swaps 0 $33 $5,395
2011 CAPITAL OUTLAY PROJECTS Projects Amount Projects Amount
Reauthorizations 11 123
No news STBs were authorized
2012 CAPITAL OUTLAY PROJECTS Projects Amount Projects Amount
Summary 18 $2,192 484 $137,318
STBs 10 $1,473 280 $107,514
Other Funds 0 $0 7 $6,898
Reauthorizations 0 3 $0
Amount Attrib. to OGAS 0 $1,399 0 $102,138
Vetoes 8 $719 194 $22,906
2013 CAPITAL OUTLAY PROJECTS Projects Amount Projects Amount
Summary 33 $7,566 785 $269,340
STBs 33 $7,566 769 $218,132
Other Funds 0 $0 16 $51,208
Amount Attrib. to OGAS 0 $7,188 0 $207,225
Vetoes 3 $375 72 $4,402
2014 CAPITAL OUTLAY PROJECTS Projects Amount Projects Amount
Summary 33 $10,689 852 $228,711
STBs 30 $9,189 823 $182,237
Other Funds, ex. WTF and Colonias projects 3 $1,500 28 $46,474
Water Trust Fund Projects 2 $1,154 24 $33,048
Colonias Projects 0 $0 37 $16,640
Amount Attrib. to OGAS $9,911 $268,412
Vetoes 5 $420 62 $2,584
10. For questions, comments or criticisms of this work, contact:
Laird Graeser Richard L. Anklam, President & Executive Director, New Mexico Tax Research Institute
[email protected] or [email protected]
505 424-9023 505-269-6791
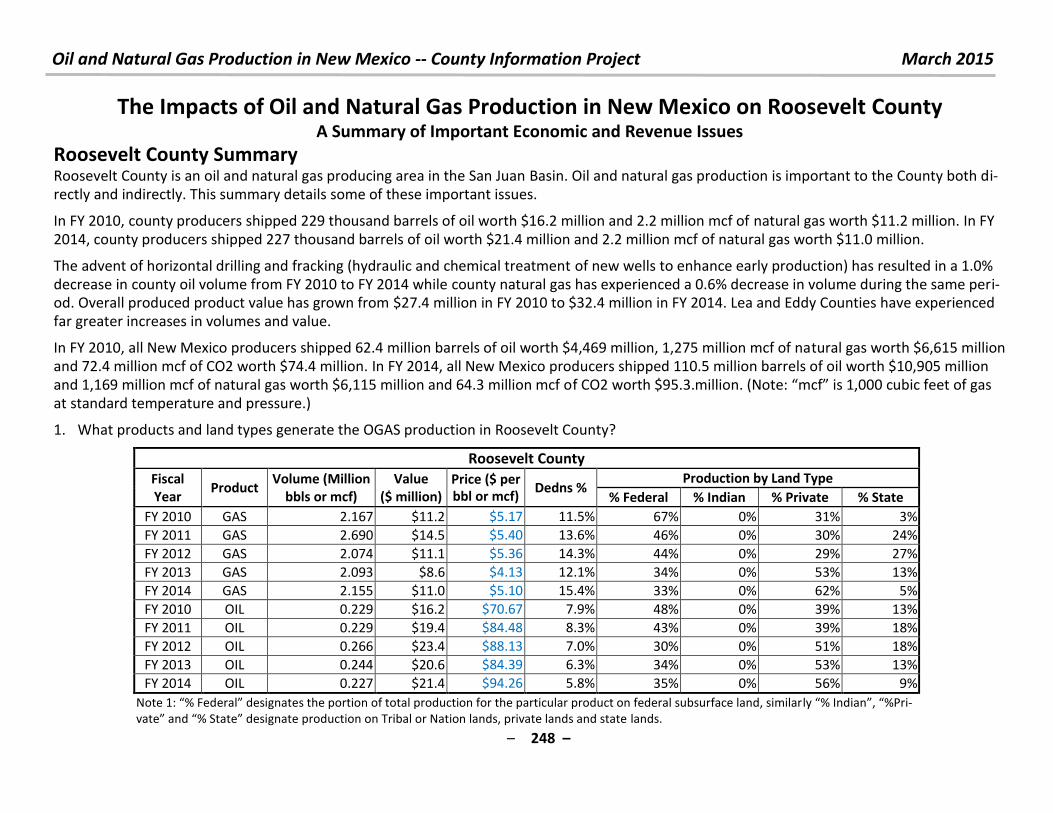
Oil and Natural Gas Production in New Mexico -- County Information Project March 2015
– 248 –
The Impacts of Oil and Natural Gas Production in New Mexico on Roosevelt County A Summary of Important Economic and Revenue Issues
Roosevelt County Summary Roosevelt County is an oil and natural gas producing area in the San Juan Basin. Oil and natural gas production is important to the County both di-
rectly and indirectly. This summary details some of these important issues.
In FY 2010, county producers shipped 229 thousand barrels of oil worth $16.2 million and 2.2 million mcf of natural gas worth $11.2 million. In FY
2014, county producers shipped 227 thousand barrels of oil worth $21.4 million and 2.2 million mcf of natural gas worth $11.0 million.
The advent of horizontal drilling and fracking (hydraulic and chemical treatment of new wells to enhance early production) has resulted in a 1.0%
decrease in county oil volume from FY 2010 to FY 2014 while county natural gas has experienced a 0.6% decrease in volume during the same peri-od. Overall produced product value has grown from $27.4 million in FY 2010 to $32.4 million in FY 2014. Lea and Eddy Counties have experienced
far greater increases in volumes and value.
In FY 2010, all New Mexico producers shipped 62.4 million barrels of oil worth $4,469 million, 1,275 million mcf of natural gas worth $6,615 million
and 72.4 million mcf of CO2 worth $74.4 million. In FY 2014, all New Mexico producers shipped 110.5 million barrels of oil worth $10,905 million
and 1,169 million mcf of natural gas worth $6,115 million and 64.3 million mcf of CO2 worth $ . . illio . Note: f is , u i feet of gas at standard temperature and pressure.)
1. What products and land types generate the OGAS production in Roosevelt County?
Roosevelt County
Fiscal
Year Product
Volume (Million
bbls or mcf)
Value
($ million)
Price ($ per
bbl or mcf) Dedns %
Production by Land Type
% Federal % Indian % Private % State
FY 2010 GAS 2.167 $11.2 $5.17 11.5% 67% 0% 31% 3%
FY 2011 GAS 2.690 $14.5 $5.40 13.6% 46% 0% 30% 24%
FY 2012 GAS 2.074 $11.1 $5.36 14.3% 44% 0% 29% 27%
FY 2013 GAS 2.093 $8.6 $4.13 12.1% 34% 0% 53% 13%
FY 2014 GAS 2.155 $11.0 $5.10 15.4% 33% 0% 62% 5%
FY 2010 OIL 0.229 $16.2 $70.67 7.9% 48% 0% 39% 13%
FY 2011 OIL 0.229 $19.4 $84.48 8.3% 43% 0% 39% 18%
FY 2012 OIL 0.266 $23.4 $88.13 7.0% 30% 0% 51% 18%
FY 2013 OIL 0.244 $20.6 $84.39 6.3% 34% 0% 53% 13%
FY 2014 OIL 0.227 $21.4 $94.26 5.8% 35% 0% 56% 9%
Note : % Fede al desig ates the po tio of total p odu tio fo the pa ti ula p odu t o fede al su su fa e la d, si ila l % I dia , %P i-
ate a d % “tate desig ate p odu tio o T i al o Natio la ds, p i ate la ds a d state lands.
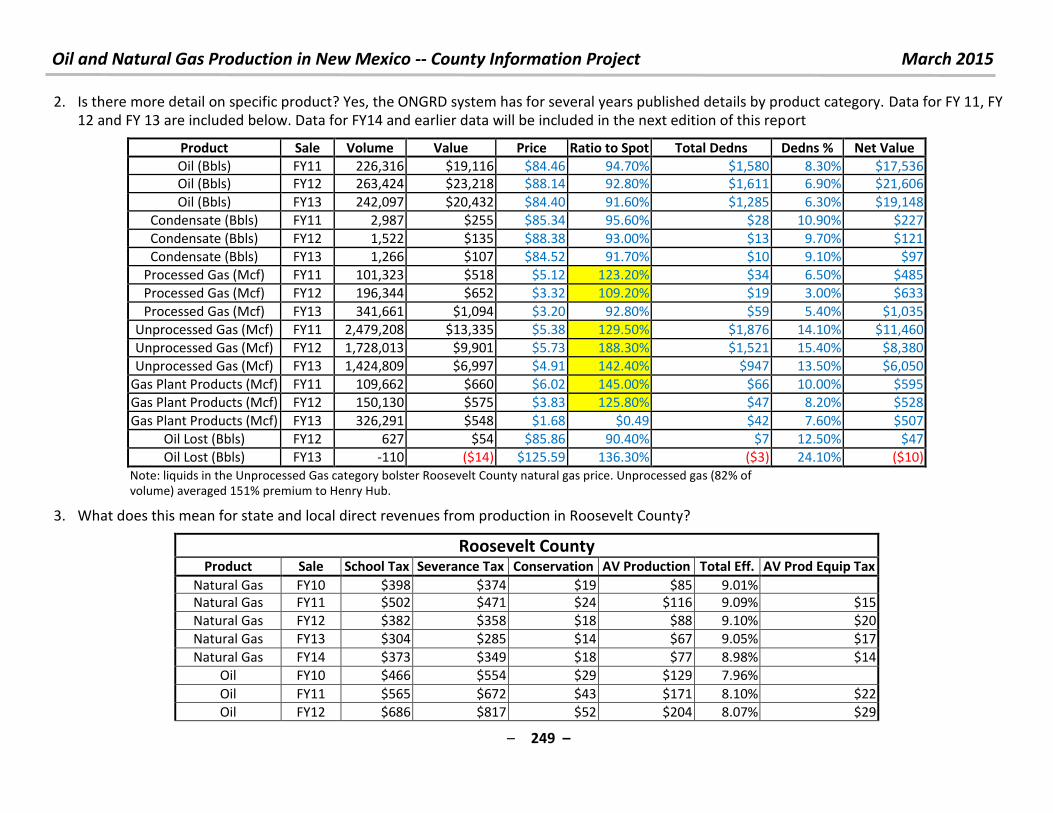
Oil and Natural Gas Production in New Mexico -- County Information Project March 2015
– 249 –
2. Is there more detail on specific product? Yes, the ONGRD system has for several years published details by product category. Data for FY 11, FY
12 and FY 13 are included below. Data for FY14 and earlier data will be included in the next edition of this report
Product Sale
Period
Volume Value
($1.000)
Price Ratio to Spot
Price
Total Dedns
($1.000)
Dedns % Net Value
($1.000) Oil (Bbls) FY11 226,316 $19,116 $84.46 94.70% $1,580 8.30% $17,536
Oil (Bbls) FY12 263,424 $23,218 $88.14 92.80% $1,611 6.90% $21,606
Oil (Bbls) FY13 242,097 $20,432 $84.40 91.60% $1,285 6.30% $19,148
Condensate (Bbls) FY11 2,987 $255 $85.34 95.60% $28 10.90% $227
Condensate (Bbls) FY12 1,522 $135 $88.38 93.00% $13 9.70% $121
Condensate (Bbls) FY13 1,266 $107 $84.52 91.70% $10 9.10% $97
Processed Gas (Mcf) FY11 101,323 $518 $5.12 123.20% $34 6.50% $485
Processed Gas (Mcf) FY12 196,344 $652 $3.32 109.20% $19 3.00% $633
Processed Gas (Mcf) FY13 341,661 $1,094 $3.20 92.80% $59 5.40% $1,035
Unprocessed Gas (Mcf) FY11 2,479,208 $13,335 $5.38 129.50% $1,876 14.10% $11,460
Unprocessed Gas (Mcf) FY12 1,728,013 $9,901 $5.73 188.30% $1,521 15.40% $8,380
Unprocessed Gas (Mcf) FY13 1,424,809 $6,997 $4.91 142.40% $947 13.50% $6,050
Gas Plant Products (Mcf) FY11 109,662 $660 $6.02 145.00% $66 10.00% $595
Gas Plant Products (Mcf) FY12 150,130 $575 $3.83 125.80% $47 8.20% $528
Gas Plant Products (Mcf) FY13 326,291 $548 $1.68 $0.49 $42 7.60% $507
Oil Lost (Bbls) FY12 627 $54 $85.86 90.40% $7 12.50% $47
Oil Lost (Bbls) FY13 -110 ($14) $125.59 136.30% ($3) 24.10% ($10)
Note: liquids in the Unprocessed Gas category bolster Roosevelt County natural gas price. Unprocessed gas (82% of
volume) averaged 151% premium to Henry Hub.
3. What does this mean for state and local direct revenues from production in Roosevelt County?
Roosevelt County Product Sale
Period School Tax
($1,000) Severance Tax
($1,000) Conservation Tax($1,000)
AV Production ($1,000)
Total Eff. Tax Rate
AV Prod Equip Tax ($1,000)1 Natural Gas FY10 $398 $374 $19 $85 9.01%
Natural Gas FY11 $502 $471 $24 $116 9.09% $15
Natural Gas FY12 $382 $358 $18 $88 9.10% $20
Natural Gas FY13 $304 $285 $14 $67 9.05% $17
Natural Gas FY14 $373 $349 $18 $77 8.98% $14
Oil FY10 $466 $554 $29 $129 7.96%
Oil FY11 $565 $672 $43 $171 8.10% $22
Oil FY12 $686 $817 $52 $204 8.07% $29
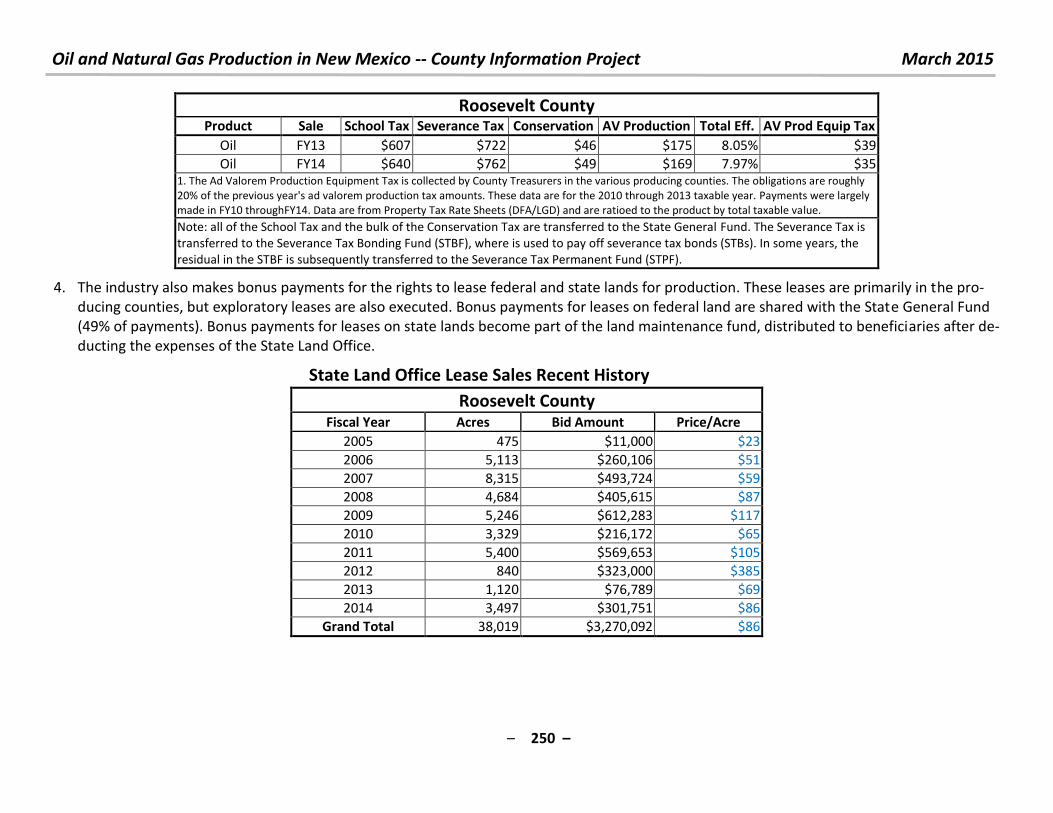
Oil and Natural Gas Production in New Mexico -- County Information Project March 2015
– 250 –
Roosevelt County Product Sale
Period School Tax
($1,000) Severance Tax
($1,000) Conservation Tax($1,000)
AV Production ($1,000)
Total Eff. Tax Rate
AV Prod Equip Tax ($1,000)1 Oil FY13 $607 $722 $46 $175 8.05% $39
Oil FY14 $640 $762 $49 $169 7.97% $35 1. The Ad Valorem Production Equipment Tax is collected by County Treasurers in the various producing counties. The obligations are roughly
20% of the previous year's ad valorem production tax amounts. These data are for the 2010 through 2013 taxable year. Payments were largely
made in FY10 throughFY14. Data are from Property Tax Rate Sheets (DFA/LGD) and are ratioed to the product by total taxable value.
Note: all of the School Tax and the bulk of the Conservation Tax are transferred to the State General Fund. The Severance Tax is
transferred to the Severance Tax Bonding Fund (STBF), where is used to pay off severance tax bonds (STBs). In some years, the
residual in the STBF is subsequently transferred to the Severance Tax Permanent Fund (STPF).
4. The industry also makes bonus payments for the rights to lease federal and state lands for production. These leases are primarily in the pro-
ducing counties, but exploratory leases are also executed. Bonus payments for leases on federal land are shared with the State General Fund
(49% of payments). Bonus payments for leases on state lands become part of the land maintenance fund, distributed to beneficiaries after de-
ducting the expenses of the State Land Office.
State Land Office Lease Sales Recent History
Roosevelt County Fiscal Year Acres Bid Amount Price/Acre
2005 475 $11,000 $23
2006 5,113 $260,106 $51
2007 8,315 $493,724 $59
2008 4,684 $405,615 $87
2009 5,246 $612,283 $117
2010 3,329 $216,172 $65
2011 5,400 $569,653 $105
2012 840 $323,000 $385
2013 1,120 $76,789 $69
2014 3,497 $301,751 $86
Grand Total 38,019 $3,270,092 $86
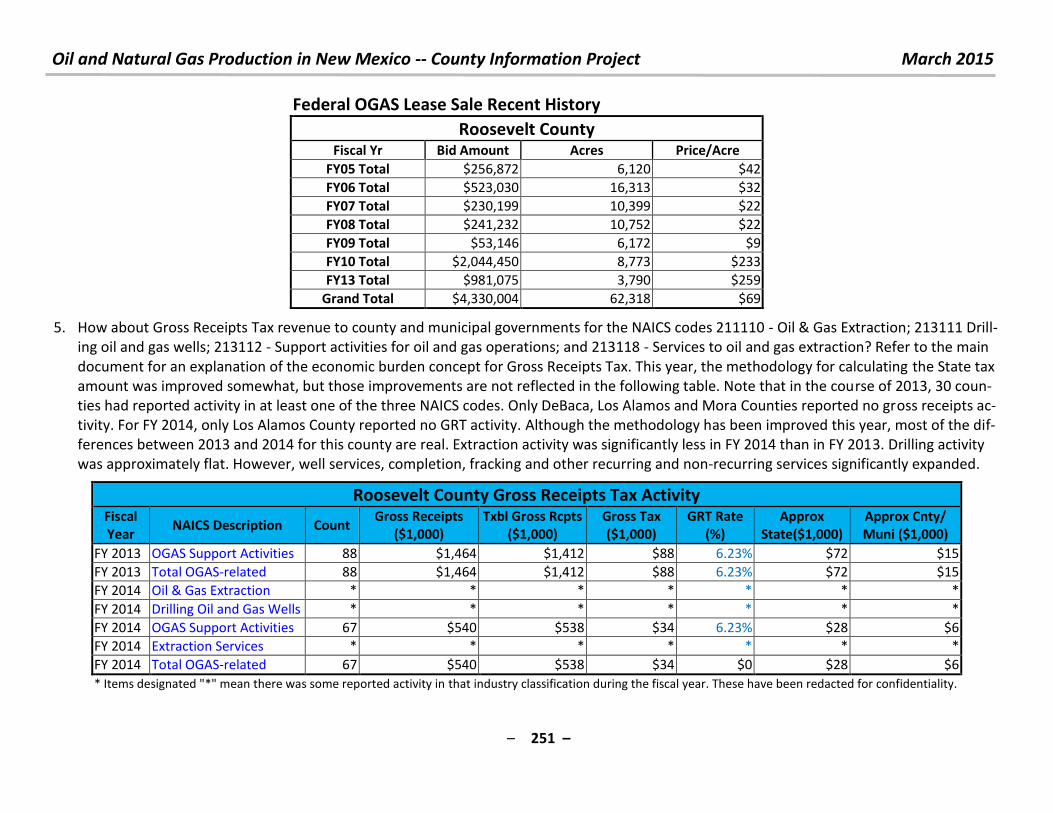
Oil and Natural Gas Production in New Mexico -- County Information Project March 2015
– 251 –
Federal OGAS Lease Sale Recent History
Roosevelt County Fiscal Yr Bid Amount Acres Price/Acre
FY05 Total $256,872 6,120 $42
FY06 Total $523,030 16,313 $32
FY07 Total $230,199 10,399 $22
FY08 Total $241,232 10,752 $22
FY09 Total $53,146 6,172 $9
FY10 Total $2,044,450 8,773 $233
FY13 Total $981,075 3,790 $259
Grand Total $4,330,004 62,318 $69
5. How about Gross Receipts Tax revenue to county and municipal governments for the NAICS codes 211110 - Oil & Gas Extraction; 213111 Drill-
ing oil and gas wells; 213112 - Support activities for oil and gas operations; and 213118 - Services to oil and gas extraction? Refer to the main
document for an explanation of the economic burden concept for Gross Receipts Tax. This year, the methodology for calculating the State tax
amount was improved somewhat, but those improvements are not reflected in the following table. Note that in the course of 2013, 30 coun-
ties had reported activity in at least one of the three NAICS codes. Only DeBaca, Los Alamos and Mora Counties reported no gross receipts ac-
tivity. For FY 2014, only Los Alamos County reported no GRT activity. Although the methodology has been improved this year, most of the dif-
ferences between 2013 and 2014 for this county are real. Extraction activity was significantly less in FY 2014 than in FY 2013. Drilling activity
was approximately flat. However, well services, completion, fracking and other recurring and non-recurring services significantly expanded.
Roosevelt County Gross Receipts Tax Activity Fiscal
Year NAICS Description Count
Gross Receipts
($1,000)
Txbl Gross Rcpts
($1,000)
Gross Tax
($1,000)
GRT Rate
(%)
Approx
State($1,000)
Approx Cnty/
Muni ($1,000)
FY 2013 OGAS Support Activities 88 $1,464 $1,412 $88 6.23% $72 $15
FY 2013 Total OGAS-related 88 $1,464 $1,412 $88 6.23% $72 $15
FY 2014 Oil & Gas Extraction * * * * * * *
FY 2014 Drilling Oil and Gas Wells * * * * * * *
FY 2014 OGAS Support Activities 67 $540 $538 $34 6.23% $28 $6
FY 2014 Extraction Services * * * * * * *
FY 2014 Total OGAS-related 67 $540 $538 $34 $0 $28 $6
* Items designated "*" mean there was some reported activity in that industry classification during the fiscal year. These have been redacted for confidentiality.
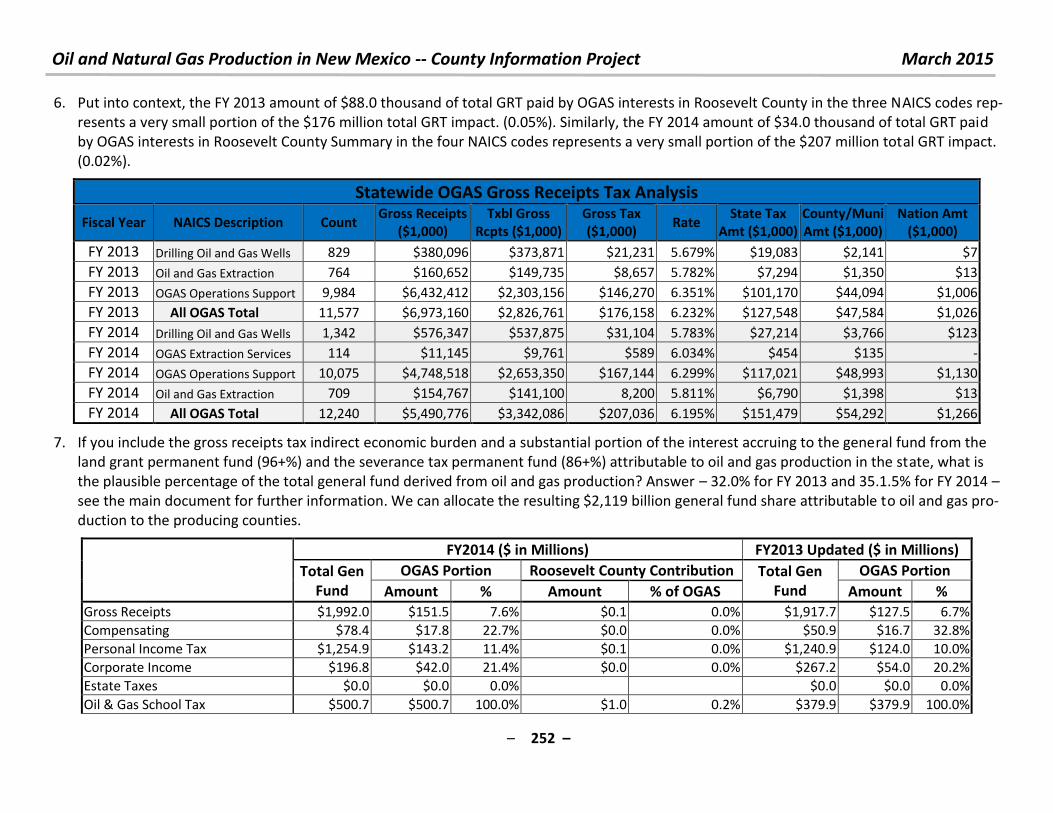
Oil and Natural Gas Production in New Mexico -- County Information Project March 2015
– 252 –
6. Put into context, the FY 2013 amount of $88.0 thousand of total GRT paid by OGAS interests in Roosevelt County in the three NAICS codes rep-
resents a very small portion of the $176 million total GRT impact. (0.05%). Similarly, the FY 2014 amount of $34.0 thousand of total GRT paid
by OGAS interests in Roosevelt County Summary in the four NAICS codes represents a very small portion of the $207 million total GRT impact.
(0.02%).
Statewide OGAS Gross Receipts Tax Analysis
Fiscal Year NAICS Description Count Gross Receipts
($1,000)
Txbl Gross
Rcpts ($1,000)
Gross Tax
($1,000) Rate
State Tax
Amt ($1,000)
County/Muni
Amt ($1,000)
Nation Amt
($1,000)
FY 2013 Drilling Oil and Gas Wells 829 $380,096 $373,871 $21,231 5.679% $19,083 $2,141 $7
FY 2013 Oil and Gas Extraction 764 $160,652 $149,735 $8,657 5.782% $7,294 $1,350 $13
FY 2013 OGAS Operations Support 9,984 $6,432,412 $2,303,156 $146,270 6.351% $101,170 $44,094 $1,006
FY 2013 All OGAS Total 11,577 $6,973,160 $2,826,761 $176,158 6.232% $127,548 $47,584 $1,026
FY 2014 Drilling Oil and Gas Wells 1,342 $576,347 $537,875 $31,104 5.783% $27,214 $3,766 $123
FY 2014 OGAS Extraction Services 114 $11,145 $9,761 $589 6.034% $454 $135 -
FY 2014 OGAS Operations Support 10,075 $4,748,518 $2,653,350 $167,144 6.299% $117,021 $48,993 $1,130
FY 2014 Oil and Gas Extraction 709 $154,767 $141,100 8,200 5.811% $6,790 $1,398 $13
FY 2014 All OGAS Total 12,240 $5,490,776 $3,342,086 $207,036 6.195% $151,479 $54,292 $1,266
7. If you include the gross receipts tax indirect economic burden and a substantial portion of the interest accruing to the general fund from the
land grant permanent fund (96+%) and the severance tax permanent fund (86+%) attributable to oil and gas production in the state, what is
the plausible percentage of the total general fund derived from oil and gas production? Answer – 32.0% for FY 2013 and 35.1.5% for FY 2014 –
see the main document for further information. We can allocate the resulting $2,119 billion general fund share attributable to oil and gas pro-
duction to the producing counties.
FY2014 ($ in Millions) FY2013 Updated ($ in Millions)
Total Gen
Fund
OGAS Portion Roosevelt County Contribution Total Gen
Fund
OGAS Portion
Amount % Amount % of OGAS Amount %
Gross Receipts $1,992.0 $151.5 7.6% $0.1 0.0% $1,917.7 $127.5 6.7%
Compensating $78.4 $17.8 22.7% $0.0 0.0% $50.9 $16.7 32.8%
Personal Income Tax $1,254.9 $143.2 11.4% $0.1 0.0% $1,240.9 $124.0 10.0%
Corporate Income $196.8 $42.0 21.4% $0.0 0.0% $267.2 $54.0 20.2%
Estate Taxes $0.0 $0.0 0.0% $0.0 $0.0 0.0%
Oil & Gas School Tax $500.7 $500.7 100.0% $1.0 0.2% $379.9 $379.9 100.0%
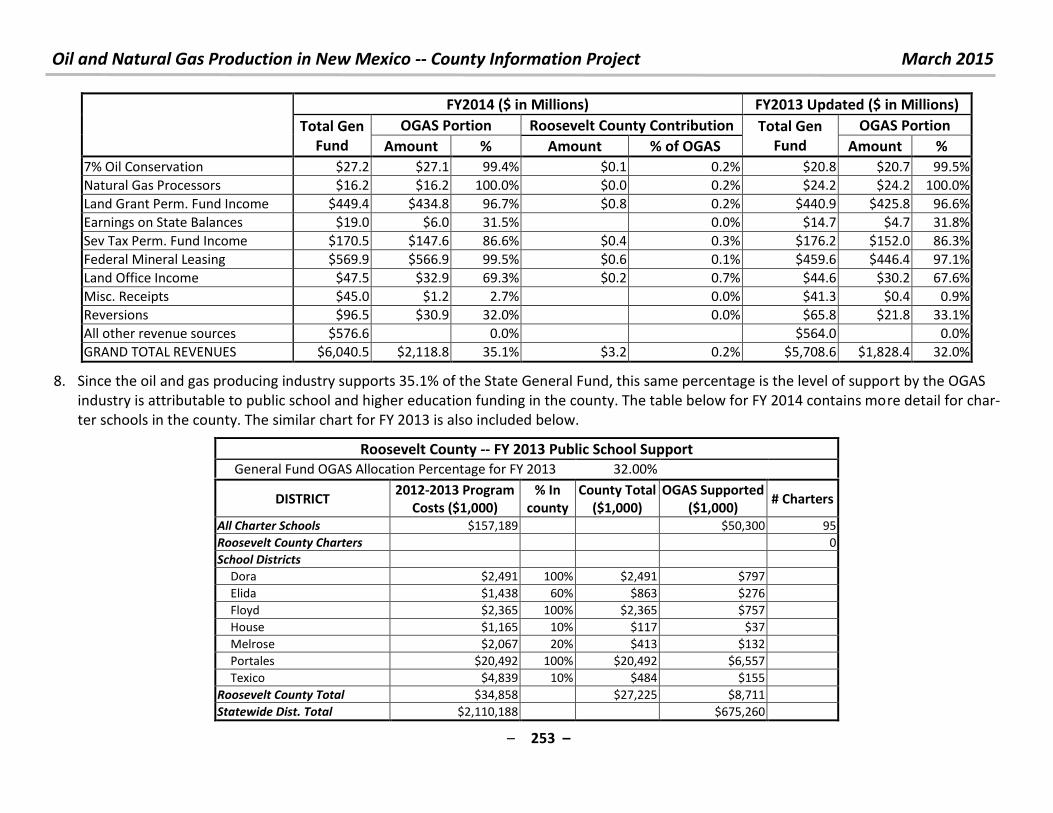
Oil and Natural Gas Production in New Mexico -- County Information Project March 2015
– 253 –
FY2014 ($ in Millions) FY2013 Updated ($ in Millions)
Total Gen
Fund
OGAS Portion Roosevelt County Contribution Total Gen
Fund
OGAS Portion
Amount % Amount % of OGAS Amount %
7% Oil Conservation $27.2 $27.1 99.4% $0.1 0.2% $20.8 $20.7 99.5%
Natural Gas Processors $16.2 $16.2 100.0% $0.0 0.2% $24.2 $24.2 100.0%
Land Grant Perm. Fund Income $449.4 $434.8 96.7% $0.8 0.2% $440.9 $425.8 96.6%
Earnings on State Balances $19.0 $6.0 31.5% 0.0% $14.7 $4.7 31.8%
Sev Tax Perm. Fund Income $170.5 $147.6 86.6% $0.4 0.3% $176.2 $152.0 86.3%
Federal Mineral Leasing $569.9 $566.9 99.5% $0.6 0.1% $459.6 $446.4 97.1%
Land Office Income $47.5 $32.9 69.3% $0.2 0.7% $44.6 $30.2 67.6%
Misc. Receipts $45.0 $1.2 2.7% 0.0% $41.3 $0.4 0.9%
Reversions $96.5 $30.9 32.0% 0.0% $65.8 $21.8 33.1%
All other revenue sources $576.6 0.0% $564.0 0.0%
GRAND TOTAL REVENUES $6,040.5 $2,118.8 35.1% $3.2 0.2% $5,708.6 $1,828.4 32.0%
8. Since the oil and gas producing industry supports 35.1% of the State General Fund, this same percentage is the level of support by the OGAS
industry is attributable to public school and higher education funding in the county. The table below for FY 2014 contains more detail for char-
ter schools in the county. The similar chart for FY 2013 is also included below.
Roosevelt County -- FY 2013 Public School Support
General Fund OGAS Allocation Percentage for FY 2013 32.00%
DISTRICT 2012-2013 Program
Costs ($1,000)
% In
county
County Total
($1,000)
OGAS Supported
($1,000) # Charters
All Charter Schools $157,189 $50,300 95
Roosevelt County Charters
0
School Districts
Dora $2,491 100% $2,491 $797
Elida $1,438 60% $863 $276
Floyd $2,365 100% $2,365 $757
House $1,165 10% $117 $37
Melrose $2,067 20% $413 $132
Portales $20,492 100% $20,492 $6,557
Texico $4,839 10% $484 $155
Roosevelt County Total $34,858 $27,225 $8,711
Statewide Dist. Total $2,110,188 $675,260
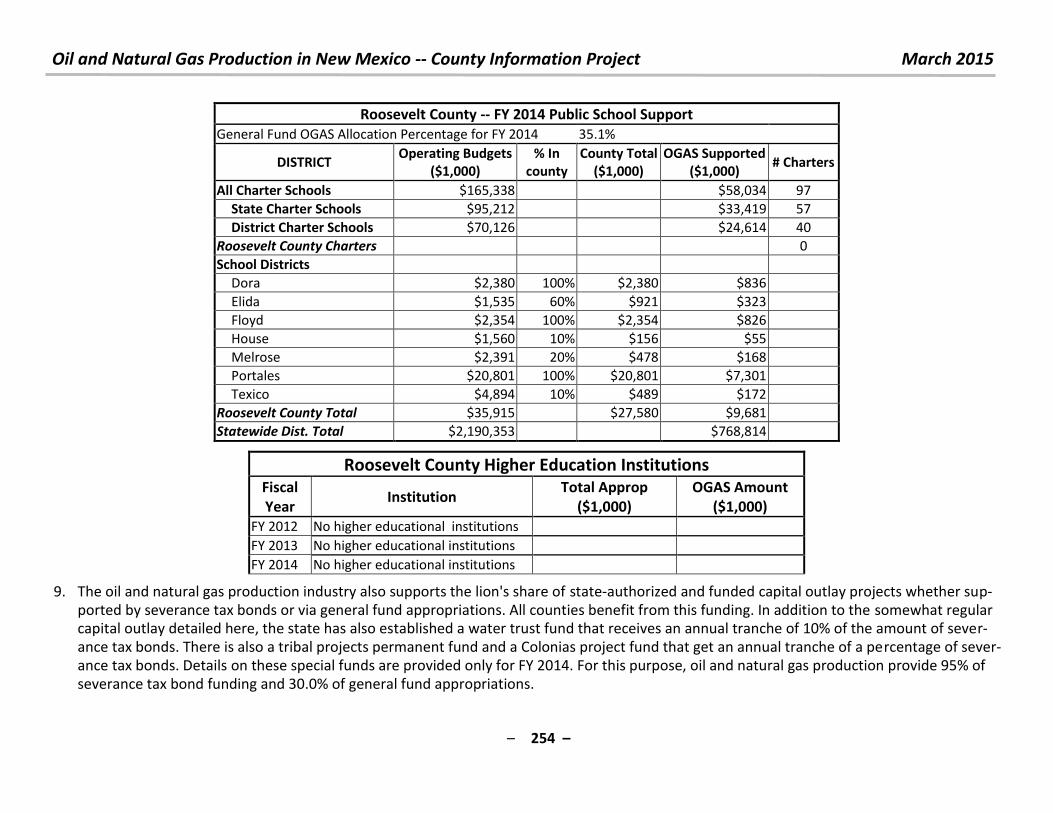
Oil and Natural Gas Production in New Mexico -- County Information Project March 2015
– 254 –
Roosevelt County -- FY 2014 Public School Support
General Fund OGAS Allocation Percentage for FY 2014 35.1%
DISTRICT Operating Budgets
($1,000)
% In
county
County Total
($1,000)
OGAS Supported
($1,000) # Charters
All Charter Schools $165,338 $58,034 97
State Charter Schools $95,212 $33,419 57
District Charter Schools $70,126 $24,614 40
Roosevelt County Charters
0
School Districts
Dora $2,380 100% $2,380 $836
Elida $1,535 60% $921 $323
Floyd $2,354 100% $2,354 $826
House $1,560 10% $156 $55
Melrose $2,391 20% $478 $168
Portales $20,801 100% $20,801 $7,301
Texico $4,894 10% $489 $172
Roosevelt County Total $35,915 $27,580 $9,681
Statewide Dist. Total $2,190,353 $768,814
Roosevelt County Higher Education Institutions
Fiscal
Year Institution
Total Approp
($1,000)
OGAS Amount
($1,000)
FY 2012 No higher educational institutions
FY 2013 No higher educational institutions
FY 2014 No higher educational institutions
9. The oil and natural gas production industry also supports the lion's share of state-authorized and funded capital outlay projects whether sup-
ported by severance tax bonds or via general fund appropriations. All counties benefit from this funding. In addition to the somewhat regular capital outlay detailed here, the state has also established a water trust fund that receives an annual tranche of 10% of the amount of sever-
ance tax bonds. There is also a tribal projects permanent fund and a Colonias project fund that get an annual tranche of a percentage of sever-
ance tax bonds. Details on these special funds are provided only for FY 2014. For this purpose, oil and natural gas production provide 95% of
severance tax bond funding and 30.0% of general fund appropriations.
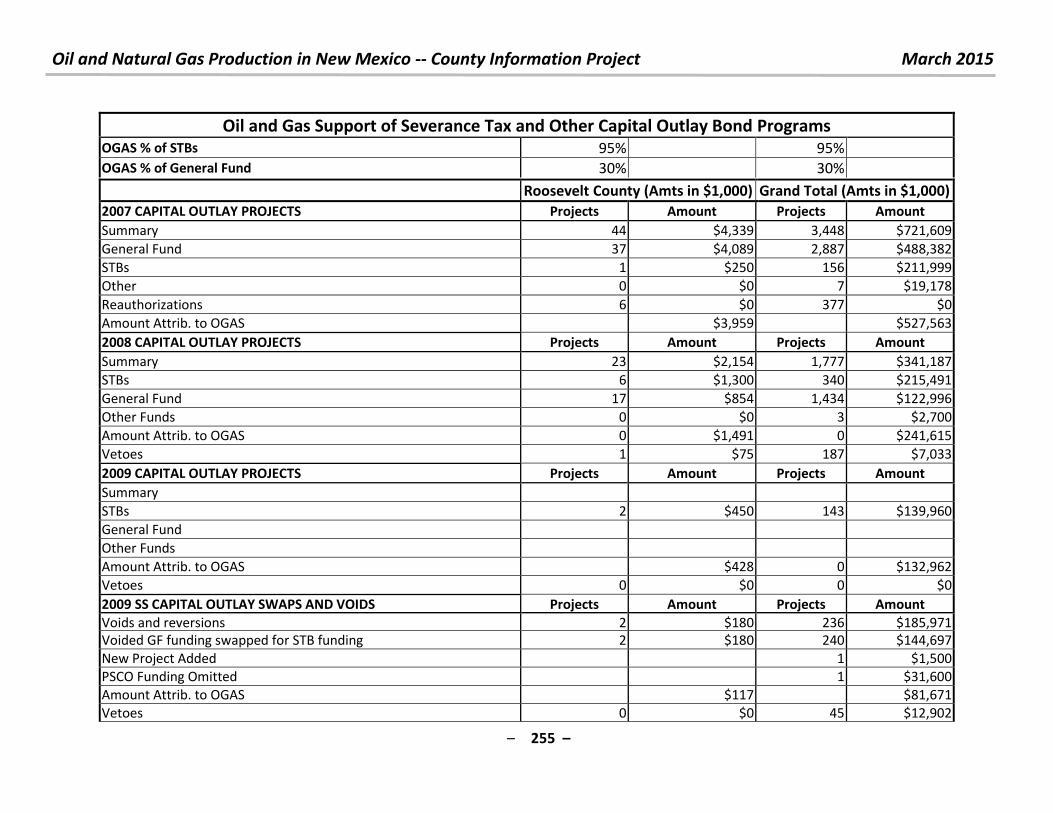
Oil and Natural Gas Production in New Mexico -- County Information Project March 2015
– 255 –
Oil and Gas Support of Severance Tax and Other Capital Outlay Bond Programs OGAS % of STBs 95% 95%
OGAS % of General Fund 30% 30%
Roosevelt County (Amts in $1,000) Grand Total (Amts in $1,000)
2007 CAPITAL OUTLAY PROJECTS Projects Amount Projects Amount
Summary 44 $4,339 3,448 $721,609
General Fund 37 $4,089 2,887 $488,382
STBs 1 $250 156 $211,999
Other 0 $0 7 $19,178
Reauthorizations 6 $0 377 $0
Amount Attrib. to OGAS $3,959 $527,563
2008 CAPITAL OUTLAY PROJECTS Projects Amount Projects Amount
Summary 23 $2,154 1,777 $341,187
STBs 6 $1,300 340 $215,491
General Fund 17 $854 1,434 $122,996
Other Funds 0 $0 3 $2,700
Amount Attrib. to OGAS 0 $1,491 0 $241,615
Vetoes 1 $75 187 $7,033
2009 CAPITAL OUTLAY PROJECTS Projects Amount Projects Amount
Summary
STBs 2 $450 143 $139,960
General Fund
Other Funds
Amount Attrib. to OGAS $428 0 $132,962
Vetoes 0 $0 0 $0
2009 SS CAPITAL OUTLAY SWAPS AND VOIDS Projects Amount Projects Amount
Voids and reversions 2 $180 236 $185,971
Voided GF funding swapped for STB funding 2 $180 240 $144,697
New Project Added 1 $1,500
PSCO Funding Omitted 1 $31,600
Amount Attrib. to OGAS $117 $81,671
Vetoes 0 $0 45 $12,902
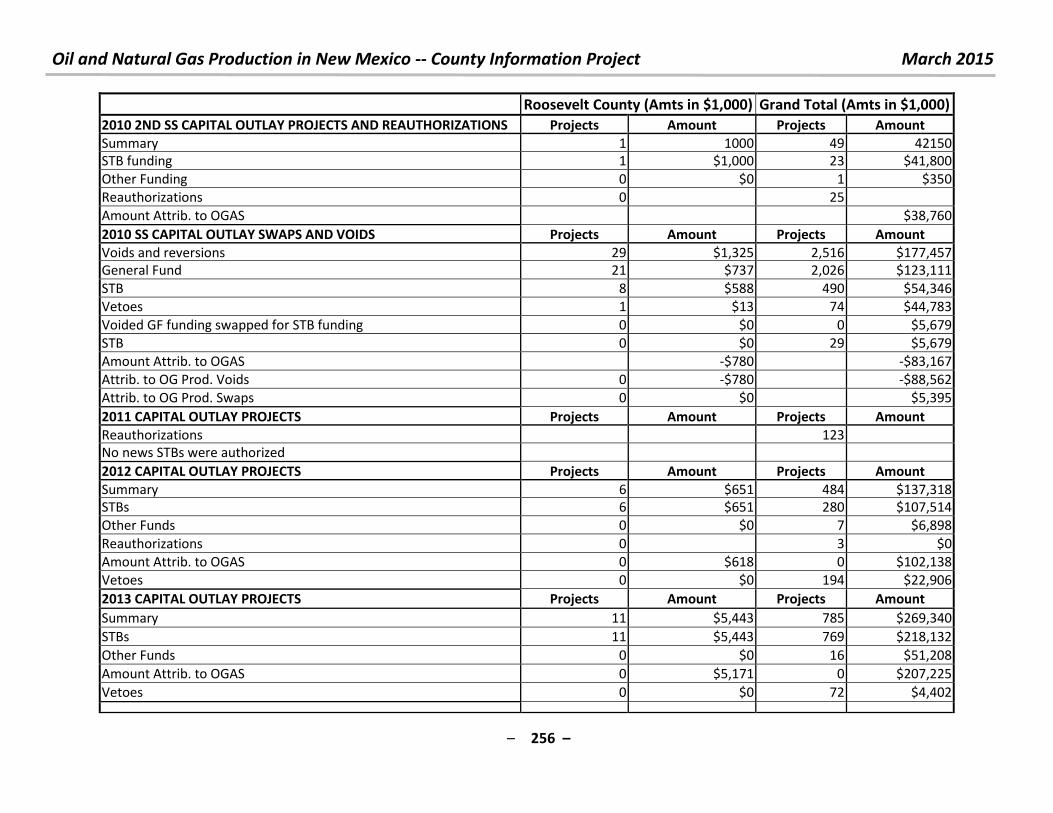
Oil and Natural Gas Production in New Mexico -- County Information Project March 2015
– 256 –
Roosevelt County (Amts in $1,000) Grand Total (Amts in $1,000)
2010 2ND SS CAPITAL OUTLAY PROJECTS AND REAUTHORIZATIONS Projects Amount Projects Amount
Summary 1 1000 49 42150
STB funding 1 $1,000 23 $41,800
Other Funding 0 $0 1 $350
Reauthorizations 0 25
Amount Attrib. to OGAS $38,760
2010 SS CAPITAL OUTLAY SWAPS AND VOIDS Projects Amount Projects Amount
Voids and reversions 29 $1,325 2,516 $177,457
General Fund 21 $737 2,026 $123,111
STB 8 $588 490 $54,346
Vetoes 1 $13 74 $44,783
Voided GF funding swapped for STB funding 0 $0 0 $5,679
STB 0 $0 29 $5,679
Amount Attrib. to OGAS -$780 -$83,167
Attrib. to OG Prod. Voids 0 -$780 -$88,562
Attrib. to OG Prod. Swaps 0 $0 $5,395
2011 CAPITAL OUTLAY PROJECTS Projects Amount Projects Amount
Reauthorizations 123
No news STBs were authorized
2012 CAPITAL OUTLAY PROJECTS Projects Amount Projects Amount
Summary 6 $651 484 $137,318
STBs 6 $651 280 $107,514
Other Funds 0 $0 7 $6,898
Reauthorizations 0 3 $0
Amount Attrib. to OGAS 0 $618 0 $102,138
Vetoes 0 $0 194 $22,906
2013 CAPITAL OUTLAY PROJECTS Projects Amount Projects Amount
Summary 11 $5,443 785 $269,340
STBs 11 $5,443 769 $218,132
Other Funds 0 $0 16 $51,208
Amount Attrib. to OGAS 0 $5,171 0 $207,225
Vetoes 0 $0 72 $4,402

Oil and Natural Gas Production in New Mexico -- County Information Project March 2015
– 257 –
Roosevelt County (Amts in $1,000) Grand Total (Amts in $1,000)
2014 CAPITAL OUTLAY PROJECTS Projects Amount Projects Amount
Summary 11 $1,430 852 $228,711
STBs 11 $1,430 823 $182,237
Other Funds, ex. WTF and Colonias projects 0 $0 28 $46,474
Water Trust Fund Projects 0 $0 24 $33,048
Colonias Projects 0 $0 37 $16,640
Amount Attrib. to OGAS $1,377 $268,412
Vetoes 0 $0 62 $2,584
10. For questions, comments or criticisms of this work, contact:
Laird Graeser
505 424-9023
or
Richard L. Anklam, President & Executive Director, New Mexico Tax Research Institute
505-269-6791
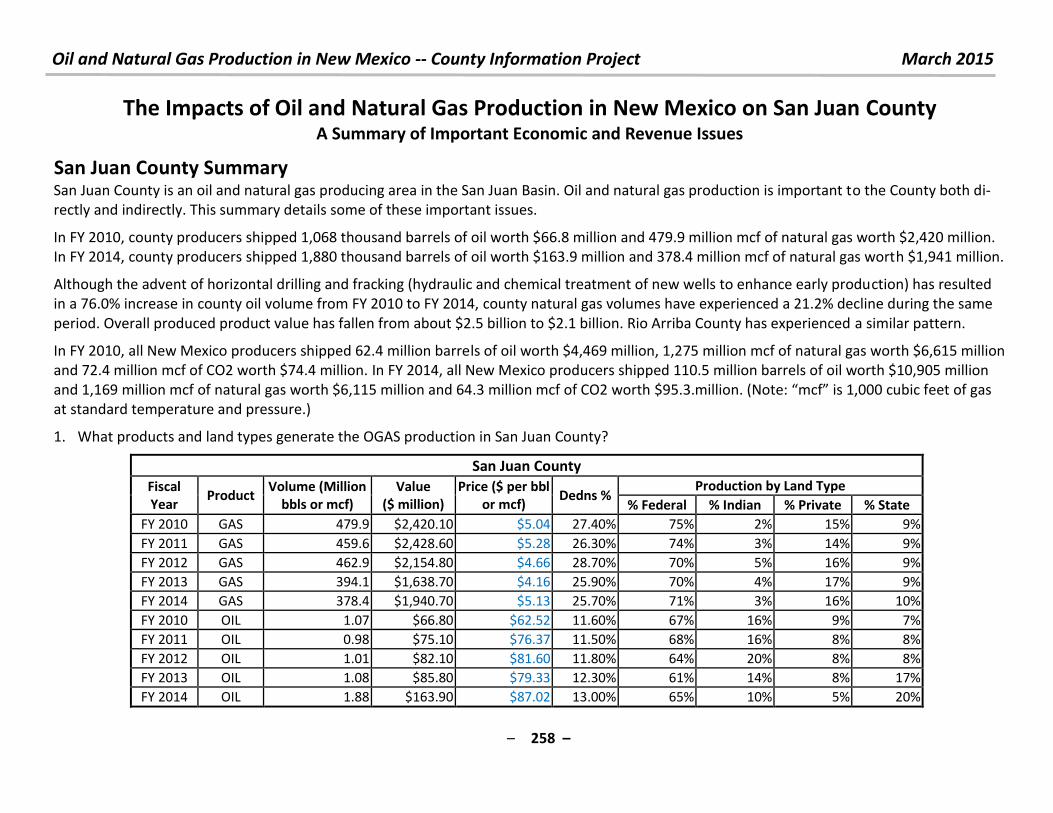
Oil and Natural Gas Production in New Mexico -- County Information Project March 2015
– 258 –
The Impacts of Oil and Natural Gas Production in New Mexico on San Juan County A Summary of Important Economic and Revenue Issues
San Juan County Summary
San Juan County is an oil and natural gas producing area in the San Juan Basin. Oil and natural gas production is important to the County both di-
rectly and indirectly. This summary details some of these important issues.
In FY 2010, county producers shipped 1,068 thousand barrels of oil worth $66.8 million and 479.9 million mcf of natural gas worth $2,420 million.
In FY 2014, county producers shipped 1,880 thousand barrels of oil worth $163.9 million and 378.4 million mcf of natural gas worth $1,941 million.
Although the advent of horizontal drilling and fracking (hydraulic and chemical treatment of new wells to enhance early production) has resulted
in a 76.0% increase in county oil volume from FY 2010 to FY 2014, county natural gas volumes have experienced a 21.2% decline during the same
period. Overall produced product value has fallen from about $2.5 billion to $2.1 billion. Rio Arriba County has experienced a similar pattern.
In FY 2010, all New Mexico producers shipped 62.4 million barrels of oil worth $4,469 million, 1,275 million mcf of natural gas worth $6,615 million
and 72.4 million mcf of CO2 worth $74.4 million. In FY 2014, all New Mexico producers shipped 110.5 million barrels of oil worth $10,905 million
and 1,169 million mcf of natural gas worth $6,115 million and 64.3 million mcf of CO2 worth $ . . illio . Note: f is , u i feet of gas at standard temperature and pressure.)
1. What products and land types generate the OGAS production in San Juan County?
San Juan County
Fiscal
Year Product
Volume (Million
bbls or mcf)
Value
($ million)
Price ($ per bbl
or mcf) Dedns %
Production by Land Type
% Federal % Indian % Private % State
FY 2010 GAS 479.9 $2,420.10 $5.04 27.40% 75% 2% 15% 9%
FY 2011 GAS 459.6 $2,428.60 $5.28 26.30% 74% 3% 14% 9%
FY 2012 GAS 462.9 $2,154.80 $4.66 28.70% 70% 5% 16% 9%
FY 2013 GAS 394.1 $1,638.70 $4.16 25.90% 70% 4% 17% 9%
FY 2014 GAS 378.4 $1,940.70 $5.13 25.70% 71% 3% 16% 10%
FY 2010 OIL 1.07 $66.80 $62.52 11.60% 67% 16% 9% 7%
FY 2011 OIL 0.98 $75.10 $76.37 11.50% 68% 16% 8% 8%
FY 2012 OIL 1.01 $82.10 $81.60 11.80% 64% 20% 8% 8%
FY 2013 OIL 1.08 $85.80 $79.33 12.30% 61% 14% 8% 17%
FY 2014 OIL 1.88 $163.90 $87.02 13.00% 65% 10% 5% 20%
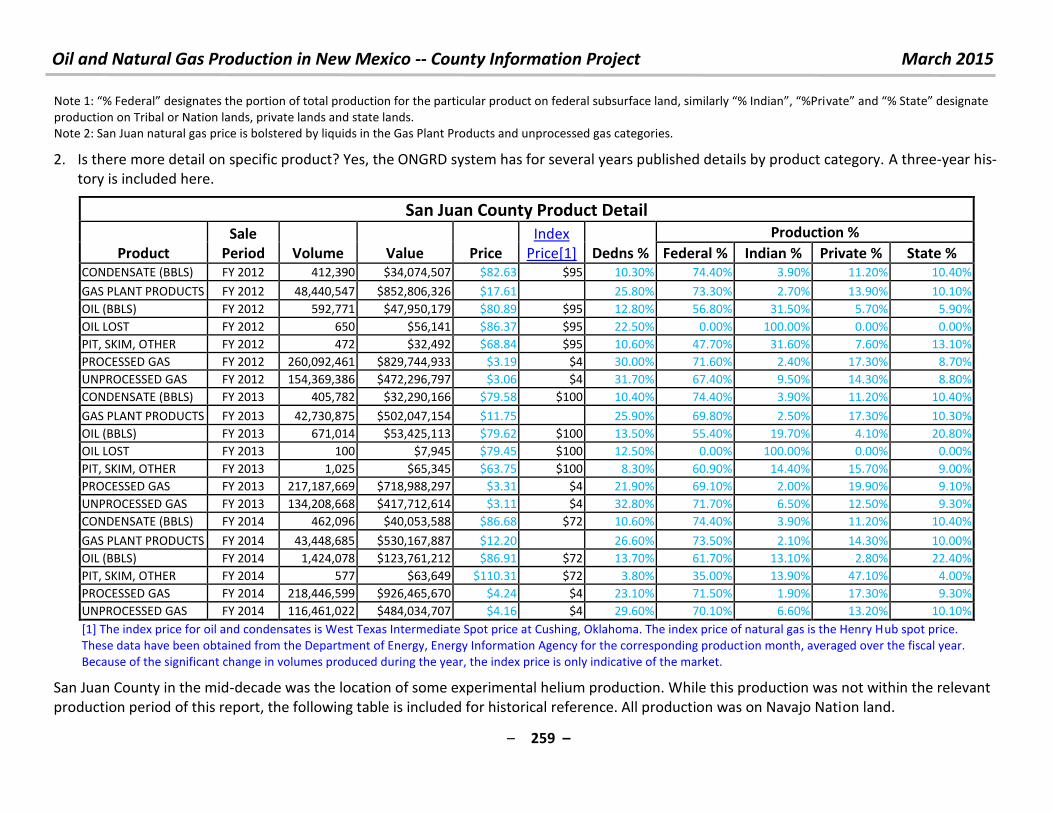
Oil and Natural Gas Production in New Mexico -- County Information Project March 2015
– 259 –
Note : % Fede al desig ates the po tio of total p odu tio fo the pa ti ula p odu t o fede al su su fa e la d, si ila l % I dia , %P i ate a d % “tate desig ate production on Tribal or Nation lands, private lands and state lands.
Note 2: San Juan natural gas price is bolstered by liquids in the Gas Plant Products and unprocessed gas categories.
2. Is there more detail on specific product? Yes, the ONGRD system has for several years published details by product category. A three-year his-
tory is included here.
San Juan County Product Detail
Product
Sale
Period Volume Value Price
Index
Price[1] Dedns %
Production %
Federal % Indian % Private % State % CONDENSATE (BBLS) FY 2012 412,390 $34,074,507 $82.63 $95 10.30% 74.40% 3.90% 11.20% 10.40%
GAS PLANT PRODUCTS FY 2012 48,440,547 $852,806,326 $17.61 25.80% 73.30% 2.70% 13.90% 10.10%
OIL (BBLS) FY 2012 592,771 $47,950,179 $80.89 $95 12.80% 56.80% 31.50% 5.70% 5.90%
OIL LOST FY 2012 650 $56,141 $86.37 $95 22.50% 0.00% 100.00% 0.00% 0.00%
PIT, SKIM, OTHER FY 2012 472 $32,492 $68.84 $95 10.60% 47.70% 31.60% 7.60% 13.10%
PROCESSED GAS FY 2012 260,092,461 $829,744,933 $3.19 $4 30.00% 71.60% 2.40% 17.30% 8.70%
UNPROCESSED GAS FY 2012 154,369,386 $472,296,797 $3.06 $4 31.70% 67.40% 9.50% 14.30% 8.80%
CONDENSATE (BBLS) FY 2013 405,782 $32,290,166 $79.58 $100 10.40% 74.40% 3.90% 11.20% 10.40%
GAS PLANT PRODUCTS FY 2013 42,730,875 $502,047,154 $11.75 25.90% 69.80% 2.50% 17.30% 10.30%
OIL (BBLS) FY 2013 671,014 $53,425,113 $79.62 $100 13.50% 55.40% 19.70% 4.10% 20.80%
OIL LOST FY 2013 100 $7,945 $79.45 $100 12.50% 0.00% 100.00% 0.00% 0.00%
PIT, SKIM, OTHER FY 2013 1,025 $65,345 $63.75 $100 8.30% 60.90% 14.40% 15.70% 9.00%
PROCESSED GAS FY 2013 217,187,669 $718,988,297 $3.31 $4 21.90% 69.10% 2.00% 19.90% 9.10%
UNPROCESSED GAS FY 2013 134,208,668 $417,712,614 $3.11 $4 32.80% 71.70% 6.50% 12.50% 9.30%
CONDENSATE (BBLS) FY 2014 462,096 $40,053,588 $86.68 $72 10.60% 74.40% 3.90% 11.20% 10.40%
GAS PLANT PRODUCTS FY 2014 43,448,685 $530,167,887 $12.20 26.60% 73.50% 2.10% 14.30% 10.00%
OIL (BBLS) FY 2014 1,424,078 $123,761,212 $86.91 $72 13.70% 61.70% 13.10% 2.80% 22.40%
PIT, SKIM, OTHER FY 2014 577 $63,649 $110.31 $72 3.80% 35.00% 13.90% 47.10% 4.00%
PROCESSED GAS FY 2014 218,446,599 $926,465,670 $4.24 $4 23.10% 71.50% 1.90% 17.30% 9.30%
UNPROCESSED GAS FY 2014 116,461,022 $484,034,707 $4.16 $4 29.60% 70.10% 6.60% 13.20% 10.10%
[1] The index price for oil and condensates is West Texas Intermediate Spot price at Cushing, Oklahoma. The index price of natural gas is the Henry Hub spot price.
These data have been obtained from the Department of Energy, Energy Information Agency for the corresponding production month, averaged over the fiscal year.
Because of the significant change in volumes produced during the year, the index price is only indicative of the market.
San Juan County in the mid-decade was the location of some experimental helium production. While this production was not within the relevant
production period of this report, the following table is included for historical reference. All production was on Navajo Nation land.
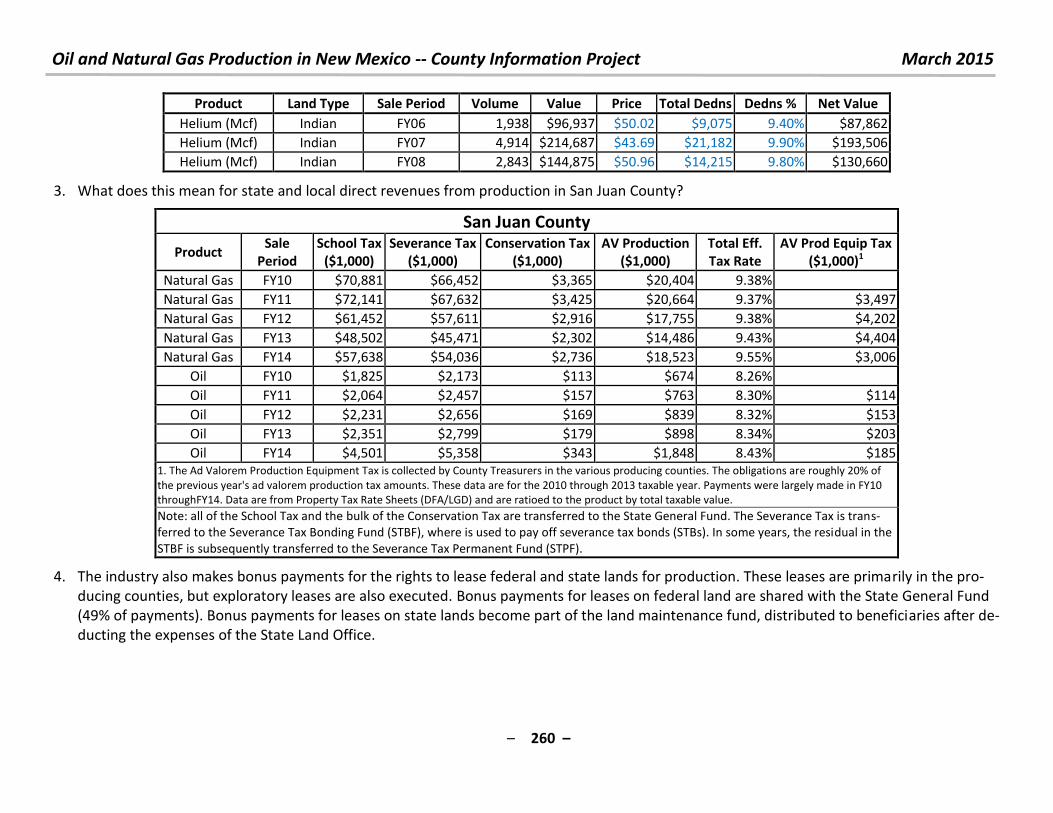
Oil and Natural Gas Production in New Mexico -- County Information Project March 2015
– 260 –
Product Land Type Sale Period Volume Value Price Total Dedns Dedns % Net Value
Helium (Mcf) Indian FY06 1,938 $96,937 $50.02 $9,075 9.40% $87,862
Helium (Mcf) Indian FY07 4,914 $214,687 $43.69 $21,182 9.90% $193,506
Helium (Mcf) Indian FY08 2,843 $144,875 $50.96 $14,215 9.80% $130,660
3. What does this mean for state and local direct revenues from production in San Juan County?
San Juan County
Product Sale
Period
School Tax
($1,000)
Severance Tax
($1,000)
Conservation Tax
($1,000)
AV Production
($1,000)
Total Eff.
Tax Rate
AV Prod Equip Tax
($1,000)1
Natural Gas FY10 $70,881 $66,452 $3,365 $20,404 9.38%
Natural Gas FY11 $72,141 $67,632 $3,425 $20,664 9.37% $3,497
Natural Gas FY12 $61,452 $57,611 $2,916 $17,755 9.38% $4,202
Natural Gas FY13 $48,502 $45,471 $2,302 $14,486 9.43% $4,404
Natural Gas FY14 $57,638 $54,036 $2,736 $18,523 9.55% $3,006
Oil FY10 $1,825 $2,173 $113 $674 8.26%
Oil FY11 $2,064 $2,457 $157 $763 8.30% $114
Oil FY12 $2,231 $2,656 $169 $839 8.32% $153
Oil FY13 $2,351 $2,799 $179 $898 8.34% $203
Oil FY14 $4,501 $5,358 $343 $1,848 8.43% $185 1. The Ad Valorem Production Equipment Tax is collected by County Treasurers in the various producing counties. The obligations are roughly 20% of
the previous year's ad valorem production tax amounts. These data are for the 2010 through 2013 taxable year. Payments were largely made in FY10
throughFY14. Data are from Property Tax Rate Sheets (DFA/LGD) and are ratioed to the product by total taxable value.
Note: all of the School Tax and the bulk of the Conservation Tax are transferred to the State General Fund. The Severance Tax is trans-
ferred to the Severance Tax Bonding Fund (STBF), where is used to pay off severance tax bonds (STBs). In some years, the residual in the
STBF is subsequently transferred to the Severance Tax Permanent Fund (STPF).
4. The industry also makes bonus payments for the rights to lease federal and state lands for production. These leases are primarily in the pro-
ducing counties, but exploratory leases are also executed. Bonus payments for leases on federal land are shared with the State General Fund
(49% of payments). Bonus payments for leases on state lands become part of the land maintenance fund, distributed to beneficiaries after de-
ducting the expenses of the State Land Office.
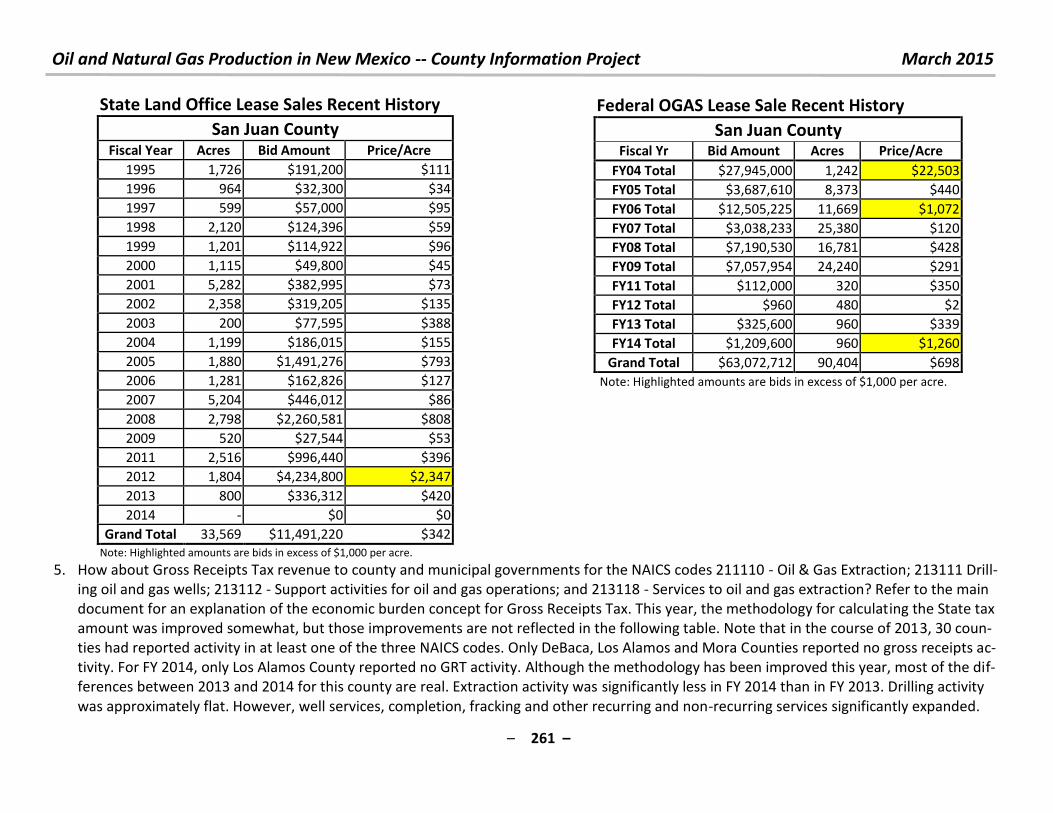
Oil and Natural Gas Production in New Mexico -- County Information Project March 2015
– 261 –
State Land Office Lease Sales Recent History
San Juan County Fiscal Year Acres Bid Amount Price/Acre
1995 1,726 $191,200 $111
1996 964 $32,300 $34
1997 599 $57,000 $95
1998 2,120 $124,396 $59
1999 1,201 $114,922 $96
2000 1,115 $49,800 $45
2001 5,282 $382,995 $73
2002 2,358 $319,205 $135
2003 200 $77,595 $388
2004 1,199 $186,015 $155
2005 1,880 $1,491,276 $793
2006 1,281 $162,826 $127
2007 5,204 $446,012 $86
2008 2,798 $2,260,581 $808
2009 520 $27,544 $53
2011 2,516 $996,440 $396
2012 1,804 $4,234,800 $2,347
2013 800 $336,312 $420
2014 - $0 $0
Grand Total 33,569 $11,491,220 $342
Note: Highlighted amounts are bids in excess of $1,000 per acre.
Federal OGAS Lease Sale Recent History
San Juan County Fiscal Yr Bid Amount Acres Price/Acre
FY04 Total $27,945,000 1,242 $22,503
FY05 Total $3,687,610 8,373 $440
FY06 Total $12,505,225 11,669 $1,072
FY07 Total $3,038,233 25,380 $120
FY08 Total $7,190,530 16,781 $428
FY09 Total $7,057,954 24,240 $291
FY11 Total $112,000 320 $350
FY12 Total $960 480 $2
FY13 Total $325,600 960 $339
FY14 Total $1,209,600 960 $1,260
Grand Total $63,072,712 90,404 $698
Note: Highlighted amounts are bids in excess of $1,000 per acre.
5. How about Gross Receipts Tax revenue to county and municipal governments for the NAICS codes 211110 - Oil & Gas Extraction; 213111 Drill-
ing oil and gas wells; 213112 - Support activities for oil and gas operations; and 213118 - Services to oil and gas extraction? Refer to the main
document for an explanation of the economic burden concept for Gross Receipts Tax. This year, the methodology for calculating the State tax
amount was improved somewhat, but those improvements are not reflected in the following table. Note that in the course of 2013, 30 coun-
ties had reported activity in at least one of the three NAICS codes. Only DeBaca, Los Alamos and Mora Counties reported no gross receipts ac-
tivity. For FY 2014, only Los Alamos County reported no GRT activity. Although the methodology has been improved this year, most of the dif-
ferences between 2013 and 2014 for this county are real. Extraction activity was significantly less in FY 2014 than in FY 2013. Drilling activity
was approximately flat. However, well services, completion, fracking and other recurring and non-recurring services significantly expanded.
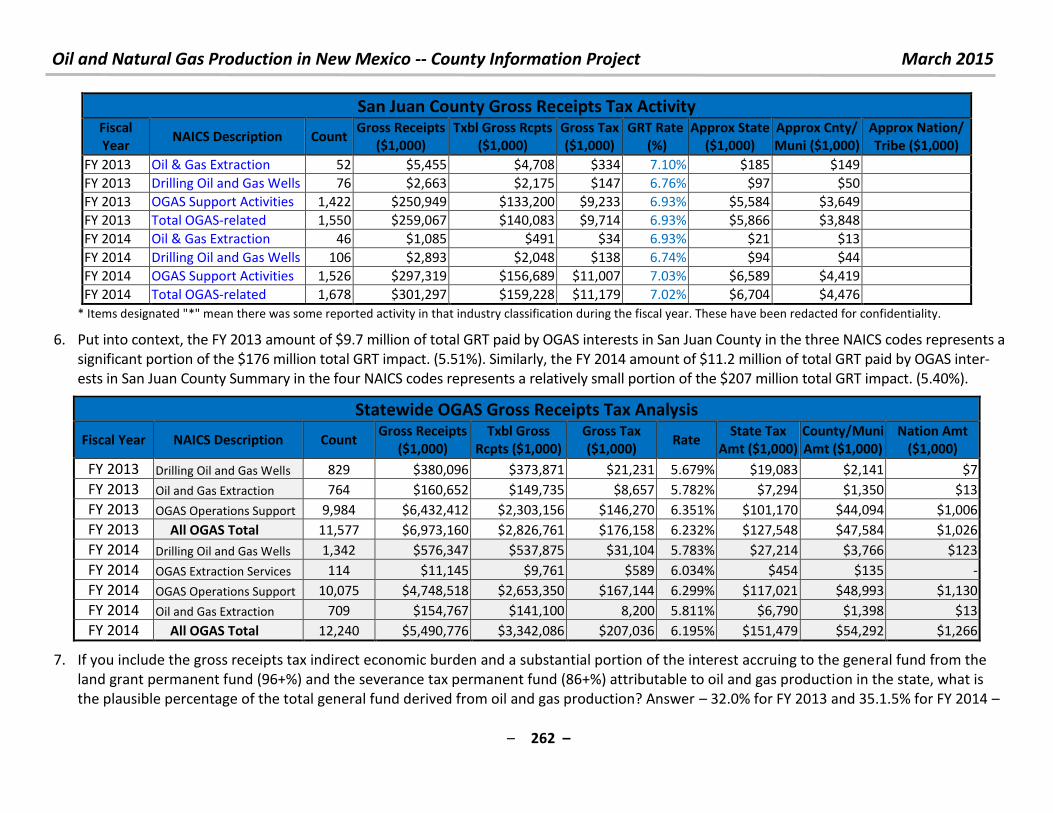
Oil and Natural Gas Production in New Mexico -- County Information Project March 2015
– 262 –
San Juan County Gross Receipts Tax Activity Fiscal
Year NAICS Description Count
Gross Receipts
($1,000)
Txbl Gross Rcpts
($1,000)
Gross Tax
($1,000)
GRT Rate
(%)
Approx State
($1,000)
Approx Cnty/
Muni ($1,000)
Approx Nation/
Tribe ($1,000)
FY 2013 Oil & Gas Extraction 52 $5,455 $4,708 $334 7.10% $185 $149
FY 2013 Drilling Oil and Gas Wells 76 $2,663 $2,175 $147 6.76% $97 $50
FY 2013 OGAS Support Activities 1,422 $250,949 $133,200 $9,233 6.93% $5,584 $3,649
FY 2013 Total OGAS-related 1,550 $259,067 $140,083 $9,714 6.93% $5,866 $3,848
FY 2014 Oil & Gas Extraction 46 $1,085 $491 $34 6.93% $21 $13
FY 2014 Drilling Oil and Gas Wells 106 $2,893 $2,048 $138 6.74% $94 $44
FY 2014 OGAS Support Activities 1,526 $297,319 $156,689 $11,007 7.03% $6,589 $4,419
FY 2014 Total OGAS-related 1,678 $301,297 $159,228 $11,179 7.02% $6,704 $4,476
* Items designated "*" mean there was some reported activity in that industry classification during the fiscal year. These have been redacted for confidentiality.
6. Put into context, the FY 2013 amount of $9.7 million of total GRT paid by OGAS interests in San Juan County in the three NAICS codes represents a
significant portion of the $176 million total GRT impact. (5.51%). Similarly, the FY 2014 amount of $11.2 million of total GRT paid by OGAS inter-
ests in San Juan County Summary in the four NAICS codes represents a relatively small portion of the $207 million total GRT impact. (5.40%).
Statewide OGAS Gross Receipts Tax Analysis
Fiscal Year NAICS Description Count Gross Receipts
($1,000)
Txbl Gross
Rcpts ($1,000)
Gross Tax
($1,000) Rate
State Tax
Amt ($1,000)
County/Muni
Amt ($1,000)
Nation Amt
($1,000)
FY 2013 Drilling Oil and Gas Wells 829 $380,096 $373,871 $21,231 5.679% $19,083 $2,141 $7
FY 2013 Oil and Gas Extraction 764 $160,652 $149,735 $8,657 5.782% $7,294 $1,350 $13
FY 2013 OGAS Operations Support 9,984 $6,432,412 $2,303,156 $146,270 6.351% $101,170 $44,094 $1,006
FY 2013 All OGAS Total 11,577 $6,973,160 $2,826,761 $176,158 6.232% $127,548 $47,584 $1,026
FY 2014 Drilling Oil and Gas Wells 1,342 $576,347 $537,875 $31,104 5.783% $27,214 $3,766 $123
FY 2014 OGAS Extraction Services 114 $11,145 $9,761 $589 6.034% $454 $135 -
FY 2014 OGAS Operations Support 10,075 $4,748,518 $2,653,350 $167,144 6.299% $117,021 $48,993 $1,130
FY 2014 Oil and Gas Extraction 709 $154,767 $141,100 8,200 5.811% $6,790 $1,398 $13
FY 2014 All OGAS Total 12,240 $5,490,776 $3,342,086 $207,036 6.195% $151,479 $54,292 $1,266
7. If you include the gross receipts tax indirect economic burden and a substantial portion of the interest accruing to the general fund from the
land grant permanent fund (96+%) and the severance tax permanent fund (86+%) attributable to oil and gas production in the state, what is
the plausible percentage of the total general fund derived from oil and gas production? Answer – 32.0% for FY 2013 and 35.1.5% for FY 2014 –
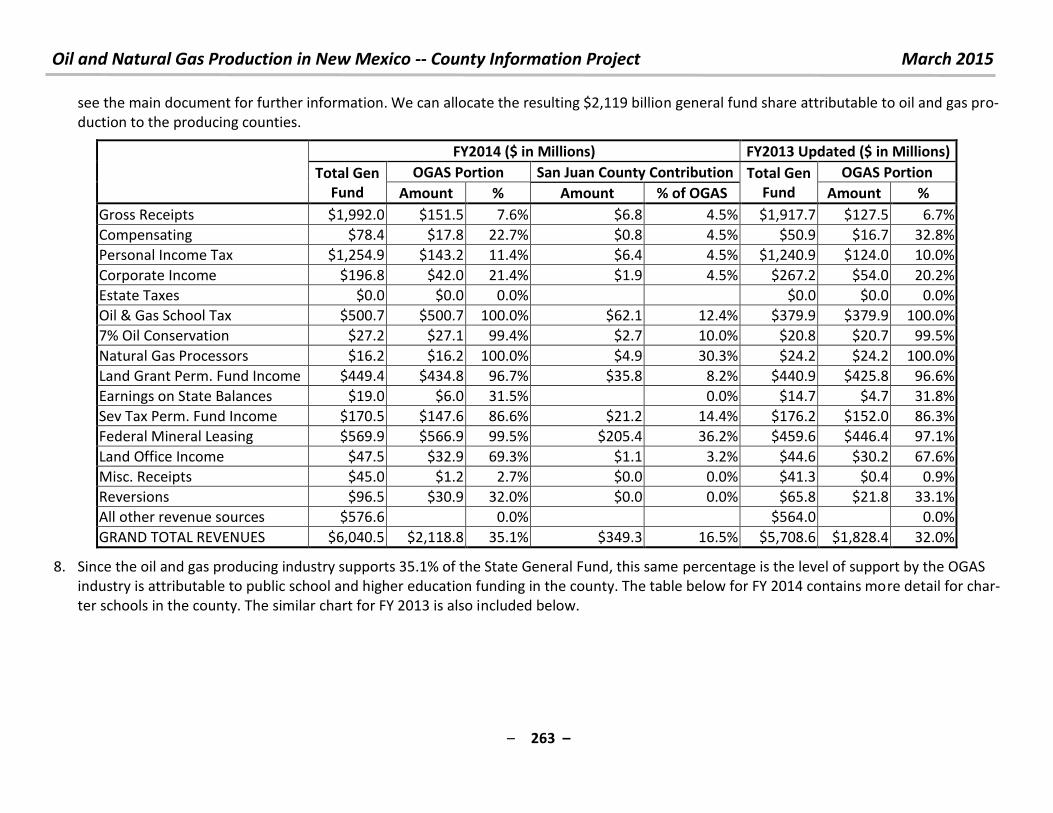
Oil and Natural Gas Production in New Mexico -- County Information Project March 2015
– 263 –
see the main document for further information. We can allocate the resulting $2,119 billion general fund share attributable to oil and gas pro-
duction to the producing counties.
FY2014 ($ in Millions) FY2013 Updated ($ in Millions)
Total Gen
Fund
OGAS Portion San Juan County Contribution Total Gen
Fund
OGAS Portion
Amount % Amount % of OGAS Amount %
Gross Receipts $1,992.0 $151.5 7.6% $6.8 4.5% $1,917.7 $127.5 6.7%
Compensating $78.4 $17.8 22.7% $0.8 4.5% $50.9 $16.7 32.8%
Personal Income Tax $1,254.9 $143.2 11.4% $6.4 4.5% $1,240.9 $124.0 10.0%
Corporate Income $196.8 $42.0 21.4% $1.9 4.5% $267.2 $54.0 20.2%
Estate Taxes $0.0 $0.0 0.0% $0.0 $0.0 0.0%
Oil & Gas School Tax $500.7 $500.7 100.0% $62.1 12.4% $379.9 $379.9 100.0%
7% Oil Conservation $27.2 $27.1 99.4% $2.7 10.0% $20.8 $20.7 99.5%
Natural Gas Processors $16.2 $16.2 100.0% $4.9 30.3% $24.2 $24.2 100.0%
Land Grant Perm. Fund Income $449.4 $434.8 96.7% $35.8 8.2% $440.9 $425.8 96.6%
Earnings on State Balances $19.0 $6.0 31.5% 0.0% $14.7 $4.7 31.8%
Sev Tax Perm. Fund Income $170.5 $147.6 86.6% $21.2 14.4% $176.2 $152.0 86.3%
Federal Mineral Leasing $569.9 $566.9 99.5% $205.4 36.2% $459.6 $446.4 97.1%
Land Office Income $47.5 $32.9 69.3% $1.1 3.2% $44.6 $30.2 67.6%
Misc. Receipts $45.0 $1.2 2.7% $0.0 0.0% $41.3 $0.4 0.9%
Reversions $96.5 $30.9 32.0% $0.0 0.0% $65.8 $21.8 33.1%
All other revenue sources $576.6 0.0% $564.0 0.0%
GRAND TOTAL REVENUES $6,040.5 $2,118.8 35.1% $349.3 16.5% $5,708.6 $1,828.4 32.0%
8. Since the oil and gas producing industry supports 35.1% of the State General Fund, this same percentage is the level of support by the OGAS
industry is attributable to public school and higher education funding in the county. The table below for FY 2014 contains more detail for char-
ter schools in the county. The similar chart for FY 2013 is also included below.
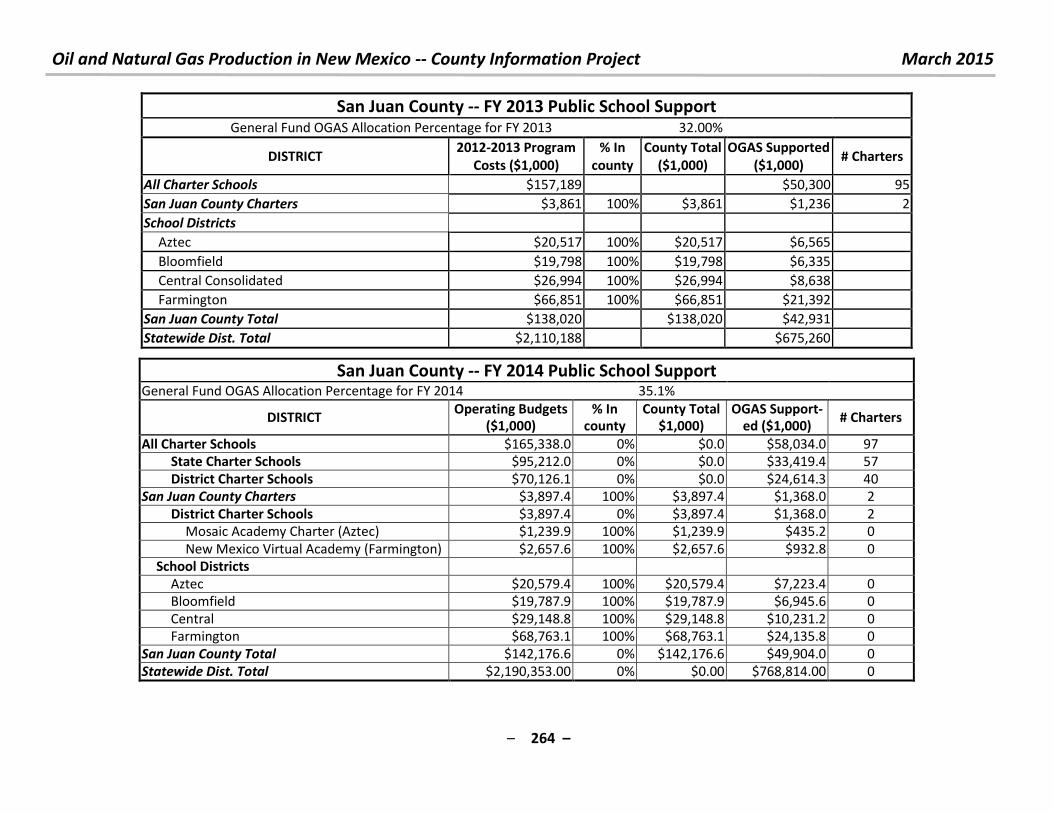
Oil and Natural Gas Production in New Mexico -- County Information Project March 2015
– 264 –
San Juan County -- FY 2013 Public School Support General Fund OGAS Allocation Percentage for FY 2013 32.00%
DISTRICT 2012-2013 Program
Costs ($1,000)
% In
county
County Total
($1,000)
OGAS Supported
($1,000) # Charters
All Charter Schools $157,189
$50,300 95
San Juan County Charters $3,861 100% $3,861 $1,236 2
School Districts
Aztec $20,517 100% $20,517 $6,565
Bloomfield $19,798 100% $19,798 $6,335
Central Consolidated $26,994 100% $26,994 $8,638
Farmington $66,851 100% $66,851 $21,392
San Juan County Total $138,020 $138,020 $42,931
Statewide Dist. Total $2,110,188 $675,260
San Juan County -- FY 2014 Public School Support General Fund OGAS Allocation Percentage for FY 2014 35.1%
DISTRICT Operating Budgets
($1,000) % In
county County Total
$1,000) OGAS Support-
ed ($1,000) # Charters
All Charter Schools $165,338.0 0% $0.0 $58,034.0 97
State Charter Schools $95,212.0 0% $0.0 $33,419.4 57
District Charter Schools $70,126.1 0% $0.0 $24,614.3 40
San Juan County Charters $3,897.4 100% $3,897.4 $1,368.0 2
District Charter Schools $3,897.4 0% $3,897.4 $1,368.0 2
Mosaic Academy Charter (Aztec) $1,239.9 100% $1,239.9 $435.2 0
New Mexico Virtual Academy (Farmington) $2,657.6 100% $2,657.6 $932.8 0
School Districts
Aztec $20,579.4 100% $20,579.4 $7,223.4 0
Bloomfield $19,787.9 100% $19,787.9 $6,945.6 0
Central $29,148.8 100% $29,148.8 $10,231.2 0
Farmington $68,763.1 100% $68,763.1 $24,135.8 0
San Juan County Total $142,176.6 0% $142,176.6 $49,904.0 0
Statewide Dist. Total $2,190,353.00 0% $0.00 $768,814.00 0
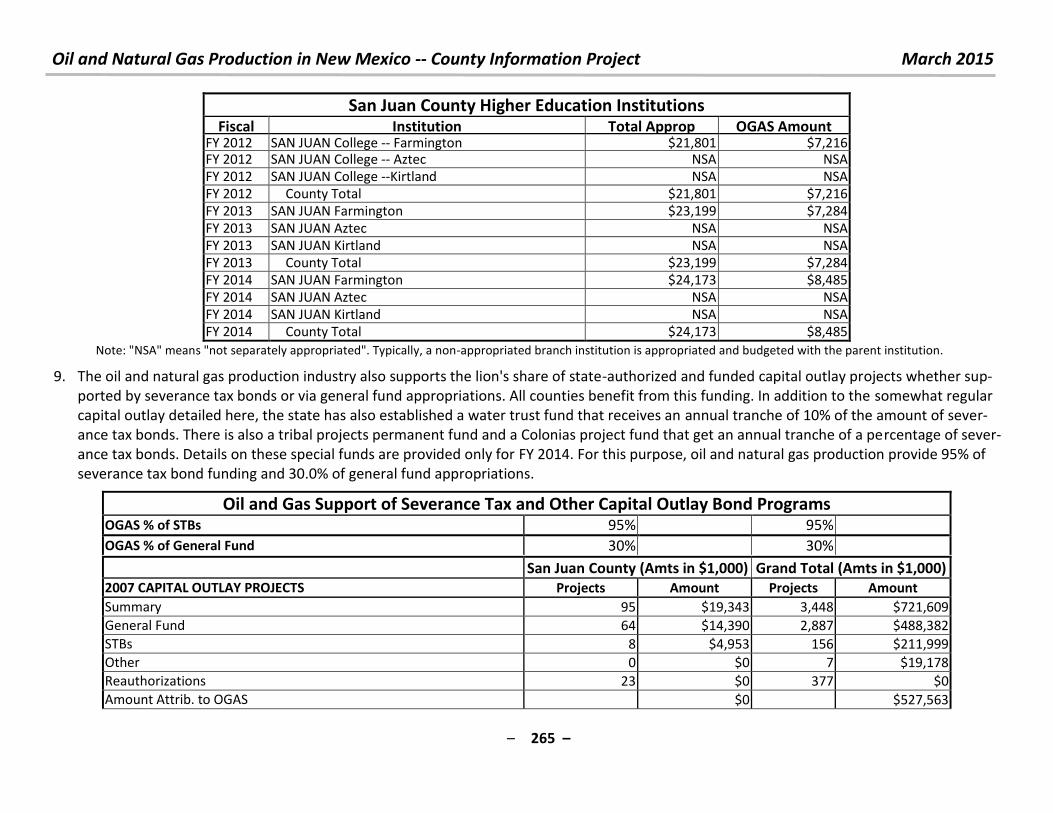
Oil and Natural Gas Production in New Mexico -- County Information Project March 2015
– 265 –
San Juan County Higher Education Institutions Fiscal Institution Total Approp OGAS Amount
FY 2012 SAN JUAN College -- Farmington $21,801 $7,216 FY 2012 SAN JUAN College -- Aztec NSA NSA
FY 2012 SAN JUAN College --Kirtland NSA NSA
FY 2012 County Total $21,801 $7,216
FY 2013 SAN JUAN Farmington $23,199 $7,284
FY 2013 SAN JUAN Aztec NSA NSA
FY 2013 SAN JUAN Kirtland NSA NSA
FY 2013 County Total $23,199 $7,284
FY 2014 SAN JUAN Farmington $24,173 $8,485
FY 2014 SAN JUAN Aztec NSA NSA
FY 2014 SAN JUAN Kirtland NSA NSA
FY 2014 County Total $24,173 $8,485
Note: "NSA" means "not separately appropriated". Typically, a non-appropriated branch institution is appropriated and budgeted with the parent institution.
9. The oil and natural gas production industry also supports the lion's share of state-authorized and funded capital outlay projects whether sup-
ported by severance tax bonds or via general fund appropriations. All counties benefit from this funding. In addition to the somewhat regular
capital outlay detailed here, the state has also established a water trust fund that receives an annual tranche of 10% of the amount of sever-
ance tax bonds. There is also a tribal projects permanent fund and a Colonias project fund that get an annual tranche of a percentage of sever-
ance tax bonds. Details on these special funds are provided only for FY 2014. For this purpose, oil and natural gas production provide 95% of
severance tax bond funding and 30.0% of general fund appropriations.
Oil and Gas Support of Severance Tax and Other Capital Outlay Bond Programs OGAS % of STBs 95% 95%
OGAS % of General Fund 30% 30% San Juan County (Amts in $1,000) Grand Total (Amts in $1,000)
2007 CAPITAL OUTLAY PROJECTS Projects Amount Projects Amount
Summary 95 $19,343 3,448 $721,609
General Fund 64 $14,390 2,887 $488,382
STBs 8 $4,953 156 $211,999
Other 0 $0 7 $19,178
Reauthorizations 23 $0 377 $0
Amount Attrib. to OGAS $0 $527,563
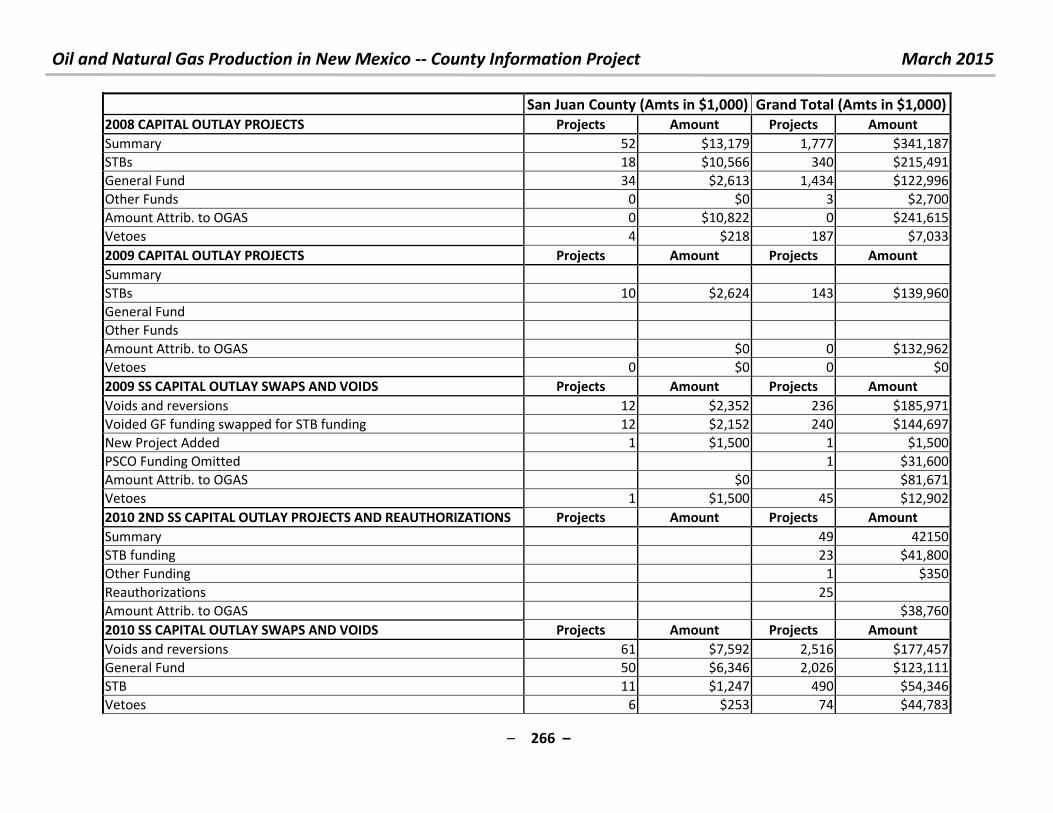
Oil and Natural Gas Production in New Mexico -- County Information Project March 2015
– 266 –
San Juan County (Amts in $1,000) Grand Total (Amts in $1,000)
2008 CAPITAL OUTLAY PROJECTS Projects Amount Projects Amount
Summary 52 $13,179 1,777 $341,187
STBs 18 $10,566 340 $215,491
General Fund 34 $2,613 1,434 $122,996
Other Funds 0 $0 3 $2,700
Amount Attrib. to OGAS 0 $10,822 0 $241,615
Vetoes 4 $218 187 $7,033
2009 CAPITAL OUTLAY PROJECTS Projects Amount Projects Amount
Summary
STBs 10 $2,624 143 $139,960
General Fund
Other Funds
Amount Attrib. to OGAS $0 0 $132,962
Vetoes 0 $0 0 $0
2009 SS CAPITAL OUTLAY SWAPS AND VOIDS Projects Amount Projects Amount
Voids and reversions 12 $2,352 236 $185,971
Voided GF funding swapped for STB funding 12 $2,152 240 $144,697
New Project Added 1 $1,500 1 $1,500
PSCO Funding Omitted 1 $31,600
Amount Attrib. to OGAS $0 $81,671
Vetoes 1 $1,500 45 $12,902
2010 2ND SS CAPITAL OUTLAY PROJECTS AND REAUTHORIZATIONS Projects Amount Projects Amount
Summary 49 42150
STB funding 23 $41,800
Other Funding 1 $350
Reauthorizations 25
Amount Attrib. to OGAS $38,760
2010 SS CAPITAL OUTLAY SWAPS AND VOIDS Projects Amount Projects Amount
Voids and reversions 61 $7,592 2,516 $177,457
General Fund 50 $6,346 2,026 $123,111
STB 11 $1,247 490 $54,346
Vetoes 6 $253 74 $44,783
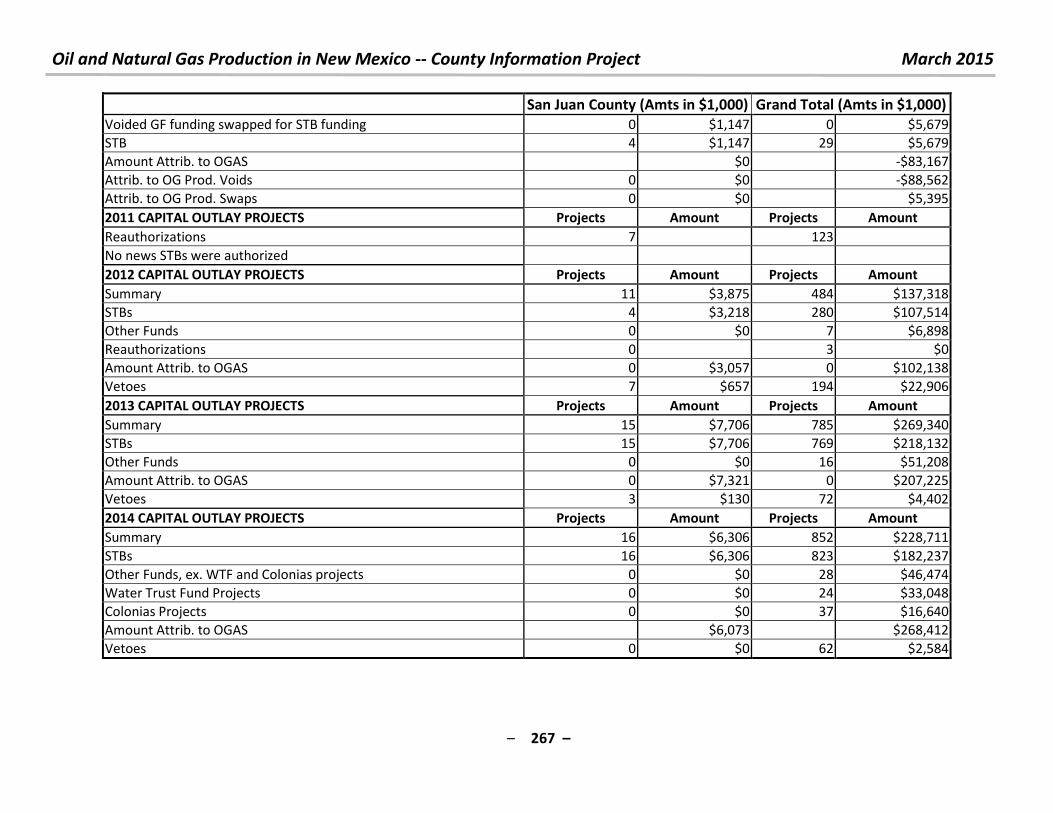
Oil and Natural Gas Production in New Mexico -- County Information Project March 2015
– 267 –
San Juan County (Amts in $1,000) Grand Total (Amts in $1,000)
Voided GF funding swapped for STB funding 0 $1,147 0 $5,679
STB 4 $1,147 29 $5,679
Amount Attrib. to OGAS $0 -$83,167
Attrib. to OG Prod. Voids 0 $0 -$88,562
Attrib. to OG Prod. Swaps 0 $0 $5,395
2011 CAPITAL OUTLAY PROJECTS Projects Amount Projects Amount
Reauthorizations 7 123
No news STBs were authorized
2012 CAPITAL OUTLAY PROJECTS Projects Amount Projects Amount
Summary 11 $3,875 484 $137,318
STBs 4 $3,218 280 $107,514
Other Funds 0 $0 7 $6,898
Reauthorizations 0 3 $0
Amount Attrib. to OGAS 0 $3,057 0 $102,138
Vetoes 7 $657 194 $22,906
2013 CAPITAL OUTLAY PROJECTS Projects Amount Projects Amount
Summary 15 $7,706 785 $269,340
STBs 15 $7,706 769 $218,132
Other Funds 0 $0 16 $51,208
Amount Attrib. to OGAS 0 $7,321 0 $207,225
Vetoes 3 $130 72 $4,402
2014 CAPITAL OUTLAY PROJECTS Projects Amount Projects Amount
Summary 16 $6,306 852 $228,711
STBs 16 $6,306 823 $182,237
Other Funds, ex. WTF and Colonias projects 0 $0 28 $46,474
Water Trust Fund Projects 0 $0 24 $33,048
Colonias Projects 0 $0 37 $16,640
Amount Attrib. to OGAS $6,073 $268,412
Vetoes 0 $0 62 $2,584
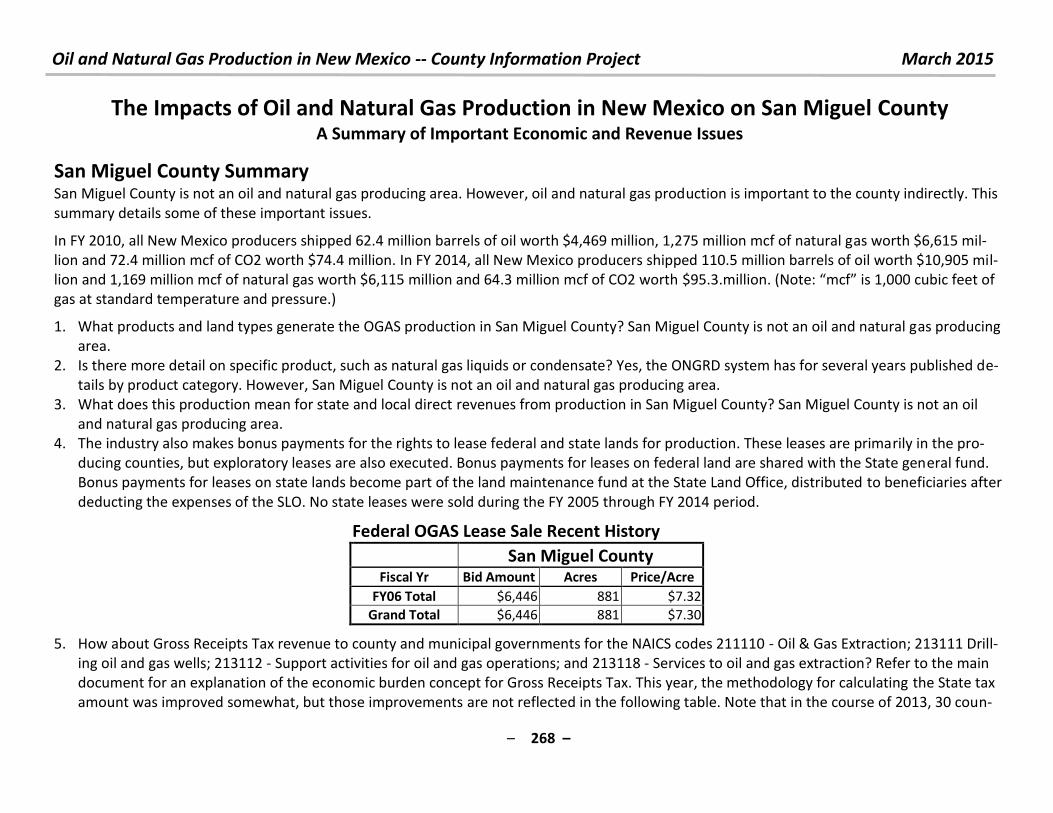
Oil and Natural Gas Production in New Mexico -- County Information Project March 2015
– 268 –
The Impacts of Oil and Natural Gas Production in New Mexico on San Miguel County A Summary of Important Economic and Revenue Issues
San Miguel County Summary
San Miguel County is not an oil and natural gas producing area. However, oil and natural gas production is important to the county indirectly. This
summary details some of these important issues.
In FY 2010, all New Mexico producers shipped 62.4 million barrels of oil worth $4,469 million, 1,275 million mcf of natural gas worth $6,615 mil-
lion and 72.4 million mcf of CO2 worth $74.4 million. In FY 2014, all New Mexico producers shipped 110.5 million barrels of oil worth $10,905 mil-
lion and 1,169 million mcf of natural gas worth $6,115 million and 64.3 million mcf of CO2 worth $ . . illio . Note: f is 1,000 cubic feet of
gas at standard temperature and pressure.)
1. What products and land types generate the OGAS production in San Miguel County? San Miguel County is not an oil and natural gas producing
area.
2. Is there more detail on specific product, such as natural gas liquids or condensate? Yes, the ONGRD system has for several years published de-
tails by product category. However, San Miguel County is not an oil and natural gas producing area.
3. What does this production mean for state and local direct revenues from production in San Miguel County? San Miguel County is not an oil
and natural gas producing area.
4. The industry also makes bonus payments for the rights to lease federal and state lands for production. These leases are primarily in the pro-
ducing counties, but exploratory leases are also executed. Bonus payments for leases on federal land are shared with the State general fund.
Bonus payments for leases on state lands become part of the land maintenance fund at the State Land Office, distributed to beneficiaries after
deducting the expenses of the SLO. No state leases were sold during the FY 2005 through FY 2014 period.
Federal OGAS Lease Sale Recent History
San Miguel County Fiscal Yr Bid Amount Acres Price/Acre
FY06 Total $6,446 881 $7.32
Grand Total $6,446 881 $7.30
5. How about Gross Receipts Tax revenue to county and municipal governments for the NAICS codes 211110 - Oil & Gas Extraction; 213111 Drill-
ing oil and gas wells; 213112 - Support activities for oil and gas operations; and 213118 - Services to oil and gas extraction? Refer to the main
document for an explanation of the economic burden concept for Gross Receipts Tax. This year, the methodology for calculating the State tax
amount was improved somewhat, but those improvements are not reflected in the following table. Note that in the course of 2013, 30 coun-
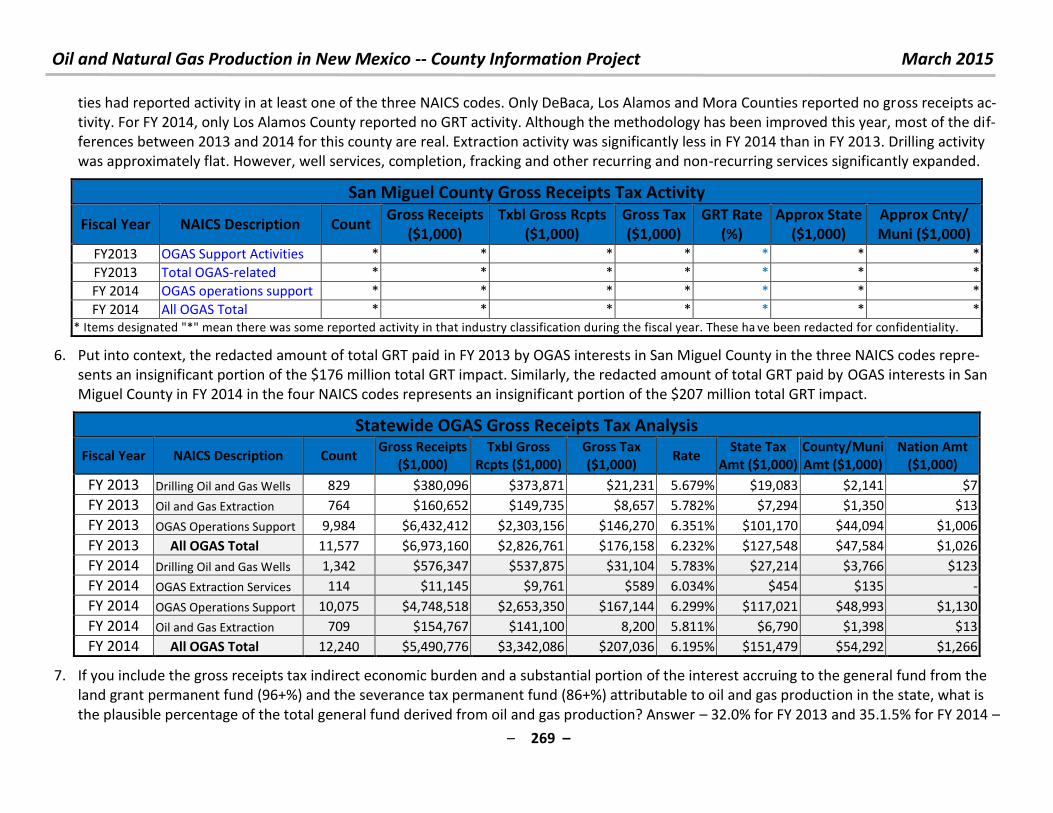
Oil and Natural Gas Production in New Mexico -- County Information Project March 2015
– 269 –
ties had reported activity in at least one of the three NAICS codes. Only DeBaca, Los Alamos and Mora Counties reported no gross receipts ac-
tivity. For FY 2014, only Los Alamos County reported no GRT activity. Although the methodology has been improved this year, most of the dif-
ferences between 2013 and 2014 for this county are real. Extraction activity was significantly less in FY 2014 than in FY 2013. Drilling activity
was approximately flat. However, well services, completion, fracking and other recurring and non-recurring services significantly expanded.
San Miguel County Gross Receipts Tax Activity
Fiscal Year NAICS Description Count Gross Receipts
($1,000)
Txbl Gross Rcpts
($1,000)
Gross Tax
($1,000)
GRT Rate
(%)
Approx State
($1,000)
Approx Cnty/
Muni ($1,000)
FY2013 OGAS Support Activities * * * * * * *
FY2013 Total OGAS-related * * * * * * *
FY 2014 OGAS operations support * * * * * * *
FY 2014 All OGAS Total * * * * * * *
* Items designated "*" mean there was some reported activity in that industry classification during the fiscal year. These ha ve been redacted for confidentiality.
6. Put into context, the redacted amount of total GRT paid in FY 2013 by OGAS interests in San Miguel County in the three NAICS codes repre-
sents an insignificant portion of the $176 million total GRT impact. Similarly, the redacted amount of total GRT paid by OGAS interests in San
Miguel County in FY 2014 in the four NAICS codes represents an insignificant portion of the $207 million total GRT impact.
Statewide OGAS Gross Receipts Tax Analysis
Fiscal Year NAICS Description Count Gross Receipts
($1,000)
Txbl Gross
Rcpts ($1,000)
Gross Tax
($1,000) Rate
State Tax
Amt ($1,000)
County/Muni
Amt ($1,000)
Nation Amt
($1,000)
FY 2013 Drilling Oil and Gas Wells 829 $380,096 $373,871 $21,231 5.679% $19,083 $2,141 $7
FY 2013 Oil and Gas Extraction 764 $160,652 $149,735 $8,657 5.782% $7,294 $1,350 $13
FY 2013 OGAS Operations Support 9,984 $6,432,412 $2,303,156 $146,270 6.351% $101,170 $44,094 $1,006
FY 2013 All OGAS Total 11,577 $6,973,160 $2,826,761 $176,158 6.232% $127,548 $47,584 $1,026
FY 2014 Drilling Oil and Gas Wells 1,342 $576,347 $537,875 $31,104 5.783% $27,214 $3,766 $123
FY 2014 OGAS Extraction Services 114 $11,145 $9,761 $589 6.034% $454 $135 -
FY 2014 OGAS Operations Support 10,075 $4,748,518 $2,653,350 $167,144 6.299% $117,021 $48,993 $1,130
FY 2014 Oil and Gas Extraction 709 $154,767 $141,100 8,200 5.811% $6,790 $1,398 $13
FY 2014 All OGAS Total 12,240 $5,490,776 $3,342,086 $207,036 6.195% $151,479 $54,292 $1,266
7. If you include the gross receipts tax indirect economic burden and a substantial portion of the interest accruing to the general fund from the
land grant permanent fund (96+%) and the severance tax permanent fund (86+%) attributable to oil and gas production in the state, what is
the plausible percentage of the total general fund derived from oil and gas production? Answer – 32.0% for FY 2013 and 35.1.5% for FY 2014 –
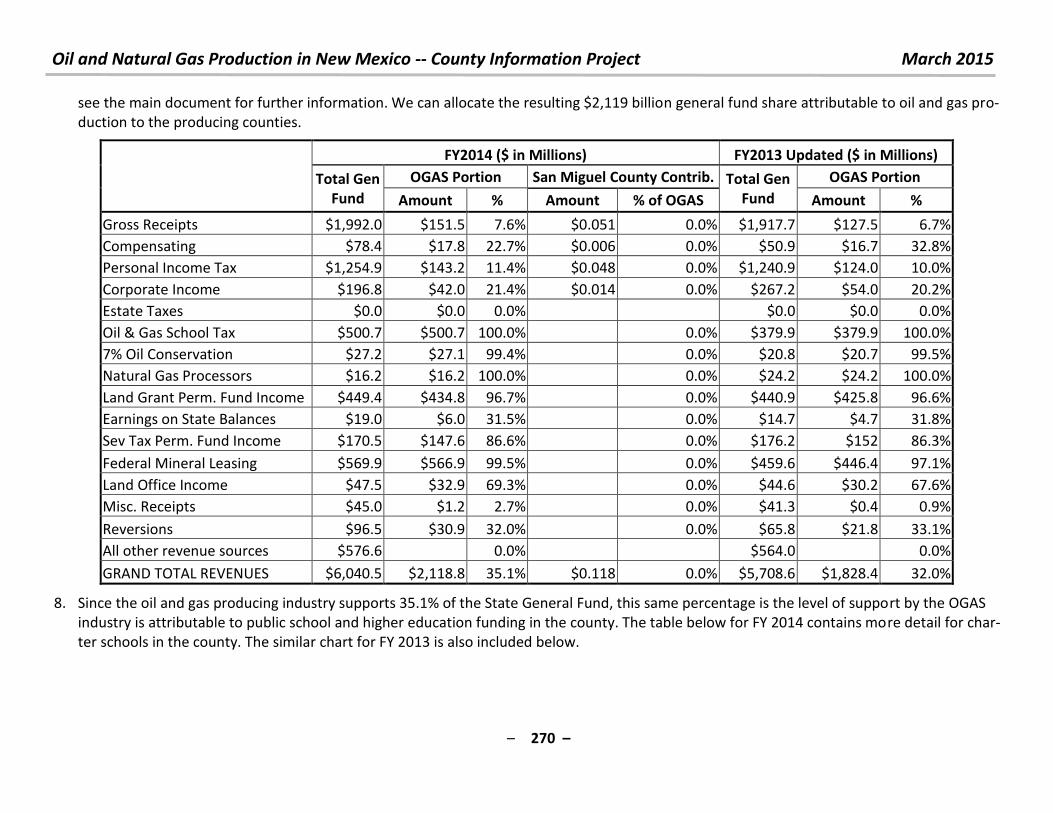
Oil and Natural Gas Production in New Mexico -- County Information Project March 2015
– 270 –
see the main document for further information. We can allocate the resulting $2,119 billion general fund share attributable to oil and gas pro-
duction to the producing counties.
FY2014 ($ in Millions) FY2013 Updated ($ in Millions)
Total Gen
Fund
OGAS Portion San Miguel County Contrib. Total Gen
Fund
OGAS Portion
Amount % Amount % of OGAS Amount %
Gross Receipts $1,992.0 $151.5 7.6% $0.051 0.0% $1,917.7 $127.5 6.7%
Compensating $78.4 $17.8 22.7% $0.006 0.0% $50.9 $16.7 32.8%
Personal Income Tax $1,254.9 $143.2 11.4% $0.048 0.0% $1,240.9 $124.0 10.0%
Corporate Income $196.8 $42.0 21.4% $0.014 0.0% $267.2 $54.0 20.2%
Estate Taxes $0.0 $0.0 0.0% $0.0 $0.0 0.0%
Oil & Gas School Tax $500.7 $500.7 100.0% 0.0% $379.9 $379.9 100.0%
7% Oil Conservation $27.2 $27.1 99.4% 0.0% $20.8 $20.7 99.5%
Natural Gas Processors $16.2 $16.2 100.0% 0.0% $24.2 $24.2 100.0%
Land Grant Perm. Fund Income $449.4 $434.8 96.7% 0.0% $440.9 $425.8 96.6%
Earnings on State Balances $19.0 $6.0 31.5% 0.0% $14.7 $4.7 31.8%
Sev Tax Perm. Fund Income $170.5 $147.6 86.6% 0.0% $176.2 $152 86.3%
Federal Mineral Leasing $569.9 $566.9 99.5% 0.0% $459.6 $446.4 97.1%
Land Office Income $47.5 $32.9 69.3% 0.0% $44.6 $30.2 67.6%
Misc. Receipts $45.0 $1.2 2.7% 0.0% $41.3 $0.4 0.9%
Reversions $96.5 $30.9 32.0% 0.0% $65.8 $21.8 33.1%
All other revenue sources $576.6 0.0% $564.0
0.0%
GRAND TOTAL REVENUES $6,040.5 $2,118.8 35.1% $0.118 0.0% $5,708.6 $1,828.4 32.0%
8. Since the oil and gas producing industry supports 35.1% of the State General Fund, this same percentage is the level of support by the OGAS
industry is attributable to public school and higher education funding in the county. The table below for FY 2014 contains more detail for char-
ter schools in the county. The similar chart for FY 2013 is also included below.
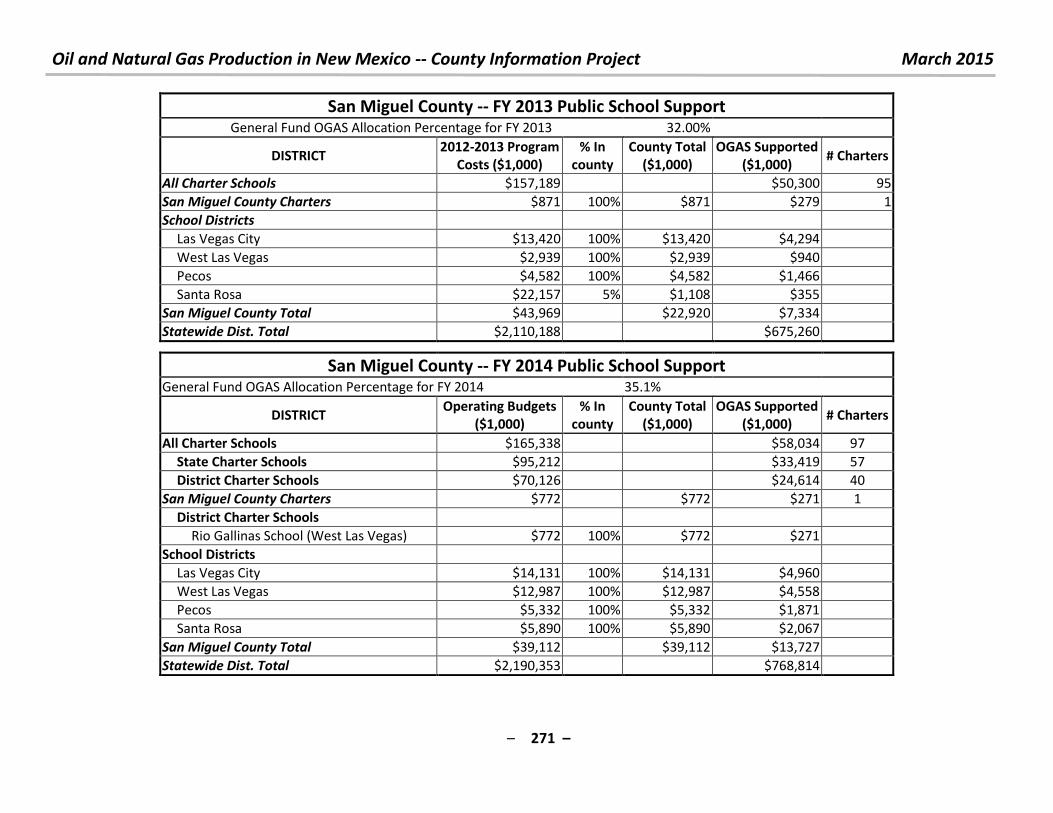
Oil and Natural Gas Production in New Mexico -- County Information Project March 2015
– 271 –
San Miguel County -- FY 2013 Public School Support General Fund OGAS Allocation Percentage for FY 2013 32.00%
DISTRICT 2012-2013 Program
Costs ($1,000)
% In
county
County Total
($1,000)
OGAS Supported
($1,000) # Charters
All Charter Schools $157,189 $50,300 95
San Miguel County Charters $871 100% $871 $279 1
School Districts
Las Vegas City $13,420 100% $13,420 $4,294
West Las Vegas $2,939 100% $2,939 $940
Pecos $4,582 100% $4,582 $1,466
Santa Rosa $22,157 5% $1,108 $355
San Miguel County Total $43,969 $22,920 $7,334
Statewide Dist. Total $2,110,188 $675,260
San Miguel County -- FY 2014 Public School Support
General Fund OGAS Allocation Percentage for FY 2014 35.1%
DISTRICT Operating Budgets
($1,000)
% In
county
County Total
($1,000)
OGAS Supported
($1,000) # Charters
All Charter Schools $165,338 $58,034 97
State Charter Schools $95,212 $33,419 57
District Charter Schools $70,126 $24,614 40
San Miguel County Charters $772 $772 $271 1
District Charter Schools
Rio Gallinas School (West Las Vegas) $772 100% $772 $271
School Districts
Las Vegas City $14,131 100% $14,131 $4,960
West Las Vegas $12,987 100% $12,987 $4,558
Pecos $5,332 100% $5,332 $1,871
Santa Rosa $5,890 100% $5,890 $2,067
San Miguel County Total $39,112 $39,112 $13,727
Statewide Dist. Total $2,190,353 $768,814
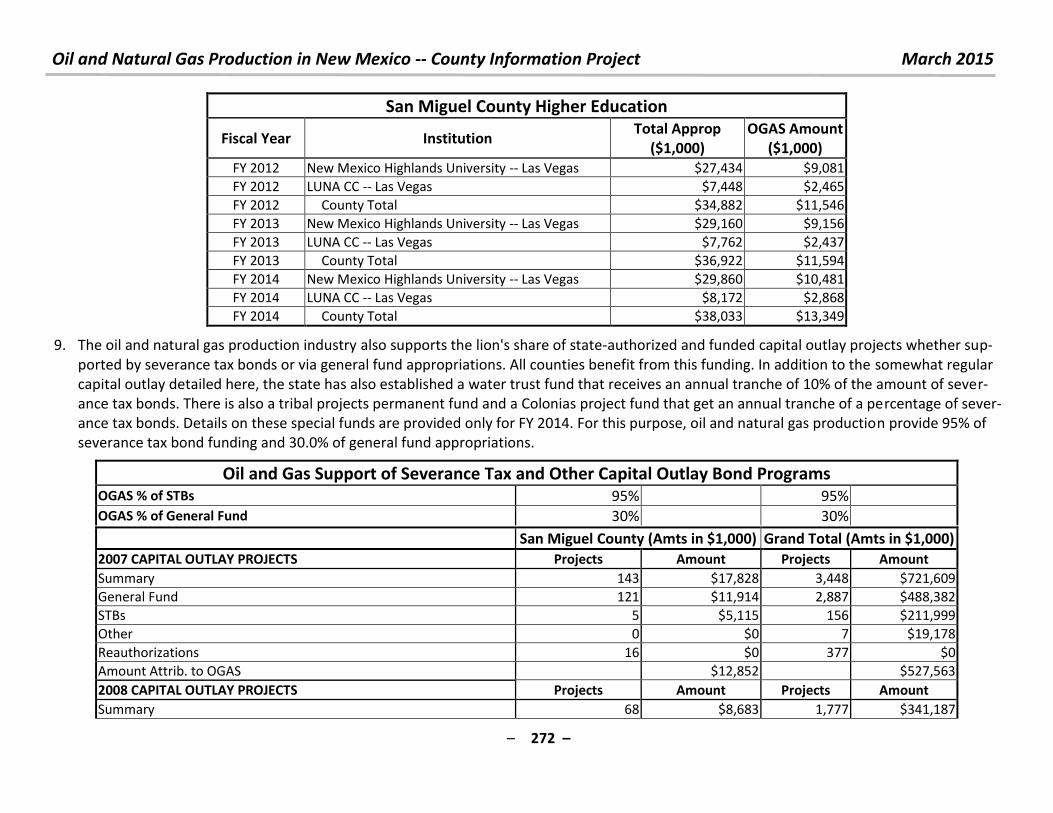
Oil and Natural Gas Production in New Mexico -- County Information Project March 2015
– 272 –
San Miguel County Higher Education
Fiscal Year Institution Total Approp
($1,000)
OGAS Amount
($1,000)
FY 2012 New Mexico Highlands University -- Las Vegas $27,434 $9,081
FY 2012 LUNA CC -- Las Vegas $7,448 $2,465
FY 2012 County Total $34,882 $11,546
FY 2013 New Mexico Highlands University -- Las Vegas $29,160 $9,156
FY 2013 LUNA CC -- Las Vegas $7,762 $2,437
FY 2013 County Total $36,922 $11,594
FY 2014 New Mexico Highlands University -- Las Vegas $29,860 $10,481
FY 2014 LUNA CC -- Las Vegas $8,172 $2,868
FY 2014 County Total $38,033 $13,349
9. The oil and natural gas production industry also supports the lion's share of state-authorized and funded capital outlay projects whether sup-
ported by severance tax bonds or via general fund appropriations. All counties benefit from this funding. In addition to the somewhat regular
capital outlay detailed here, the state has also established a water trust fund that receives an annual tranche of 10% of the amount of sever-
ance tax bonds. There is also a tribal projects permanent fund and a Colonias project fund that get an annual tranche of a percentage of sever-
ance tax bonds. Details on these special funds are provided only for FY 2014. For this purpose, oil and natural gas production provide 95% of
severance tax bond funding and 30.0% of general fund appropriations.
Oil and Gas Support of Severance Tax and Other Capital Outlay Bond Programs OGAS % of STBs 95% 95%
OGAS % of General Fund 30% 30%
San Miguel County (Amts in $1,000) Grand Total (Amts in $1,000)
2007 CAPITAL OUTLAY PROJECTS Projects Amount Projects Amount
Summary 143 $17,828 3,448 $721,609
General Fund 121 $11,914 2,887 $488,382
STBs 5 $5,115 156 $211,999
Other 0 $0 7 $19,178
Reauthorizations 16 $0 377 $0
Amount Attrib. to OGAS $12,852 $527,563
2008 CAPITAL OUTLAY PROJECTS Projects Amount Projects Amount
Summary 68 $8,683 1,777 $341,187
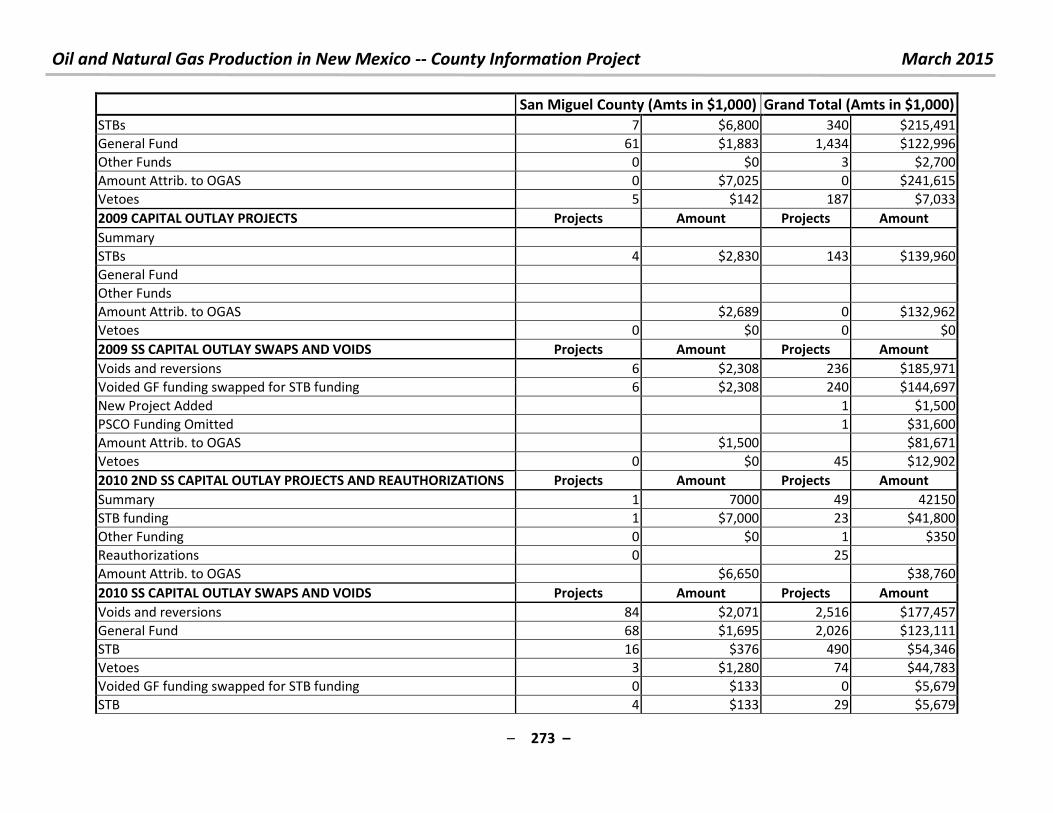
Oil and Natural Gas Production in New Mexico -- County Information Project March 2015
– 273 –
San Miguel County (Amts in $1,000) Grand Total (Amts in $1,000)
STBs 7 $6,800 340 $215,491
General Fund 61 $1,883 1,434 $122,996
Other Funds 0 $0 3 $2,700
Amount Attrib. to OGAS 0 $7,025 0 $241,615
Vetoes 5 $142 187 $7,033
2009 CAPITAL OUTLAY PROJECTS Projects Amount Projects Amount
Summary
STBs 4 $2,830 143 $139,960
General Fund
Other Funds
Amount Attrib. to OGAS $2,689 0 $132,962
Vetoes 0 $0 0 $0
2009 SS CAPITAL OUTLAY SWAPS AND VOIDS Projects Amount Projects Amount
Voids and reversions 6 $2,308 236 $185,971
Voided GF funding swapped for STB funding 6 $2,308 240 $144,697
New Project Added 1 $1,500
PSCO Funding Omitted 1 $31,600
Amount Attrib. to OGAS $1,500 $81,671
Vetoes 0 $0 45 $12,902
2010 2ND SS CAPITAL OUTLAY PROJECTS AND REAUTHORIZATIONS Projects Amount Projects Amount
Summary 1 7000 49 42150
STB funding 1 $7,000 23 $41,800
Other Funding 0 $0 1 $350
Reauthorizations 0 25
Amount Attrib. to OGAS $6,650 $38,760
2010 SS CAPITAL OUTLAY SWAPS AND VOIDS Projects Amount Projects Amount
Voids and reversions 84 $2,071 2,516 $177,457
General Fund 68 $1,695 2,026 $123,111
STB 16 $376 490 $54,346
Vetoes 3 $1,280 74 $44,783
Voided GF funding swapped for STB funding 0 $133 0 $5,679
STB 4 $133 29 $5,679
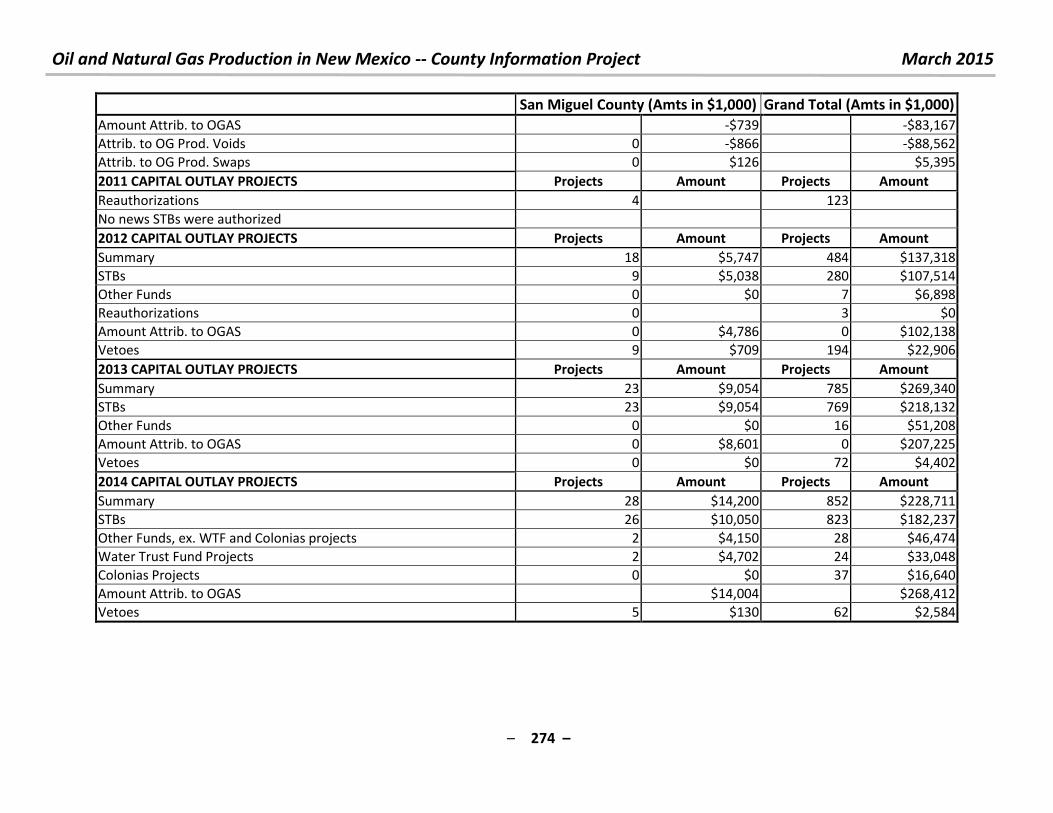
Oil and Natural Gas Production in New Mexico -- County Information Project March 2015
– 274 –
San Miguel County (Amts in $1,000) Grand Total (Amts in $1,000)
Amount Attrib. to OGAS -$739 -$83,167
Attrib. to OG Prod. Voids 0 -$866 -$88,562
Attrib. to OG Prod. Swaps 0 $126 $5,395
2011 CAPITAL OUTLAY PROJECTS Projects Amount Projects Amount
Reauthorizations 4 123
No news STBs were authorized
2012 CAPITAL OUTLAY PROJECTS Projects Amount Projects Amount
Summary 18 $5,747 484 $137,318
STBs 9 $5,038 280 $107,514
Other Funds 0 $0 7 $6,898
Reauthorizations 0 3 $0
Amount Attrib. to OGAS 0 $4,786 0 $102,138
Vetoes 9 $709 194 $22,906
2013 CAPITAL OUTLAY PROJECTS Projects Amount Projects Amount
Summary 23 $9,054 785 $269,340
STBs 23 $9,054 769 $218,132
Other Funds 0 $0 16 $51,208
Amount Attrib. to OGAS 0 $8,601 0 $207,225
Vetoes 0 $0 72 $4,402
2014 CAPITAL OUTLAY PROJECTS Projects Amount Projects Amount
Summary 28 $14,200 852 $228,711
STBs 26 $10,050 823 $182,237
Other Funds, ex. WTF and Colonias projects 2 $4,150 28 $46,474
Water Trust Fund Projects 2 $4,702 24 $33,048
Colonias Projects 0 $0 37 $16,640
Amount Attrib. to OGAS $14,004 $268,412
Vetoes 5 $130 62 $2,584

Oil and Natural Gas Production in New Mexico -- County Information Project March 2015
– 275 –
10. For questions, comments or criticisms of this work, contact:
Laird Graeser
505 424-9023
or
Richard L. Anklam, President & Executive Director, New Mexico Tax Research Institute
505-269-6791
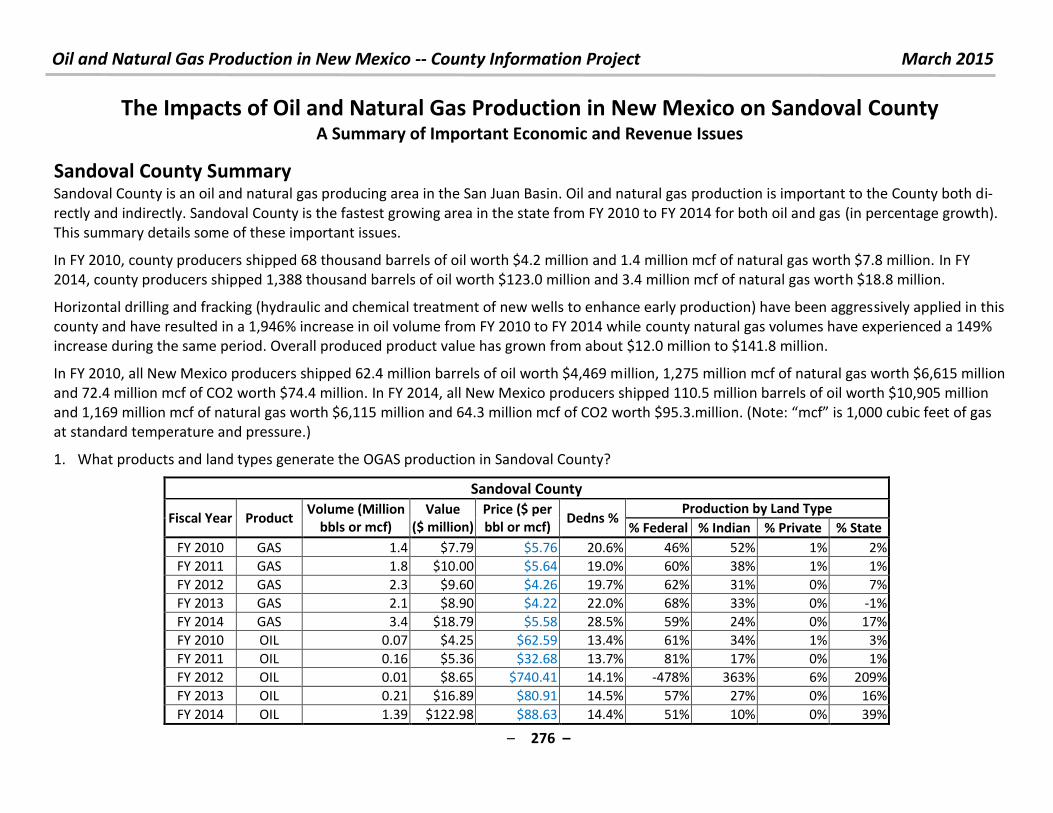
Oil and Natural Gas Production in New Mexico -- County Information Project March 2015
– 276 –
The Impacts of Oil and Natural Gas Production in New Mexico on Sandoval County A Summary of Important Economic and Revenue Issues
Sandoval County Summary
Sandoval County is an oil and natural gas producing area in the San Juan Basin. Oil and natural gas production is important to the County both di-
rectly and indirectly. Sandoval County is the fastest growing area in the state from FY 2010 to FY 2014 for both oil and gas (in percentage growth).
This summary details some of these important issues.
In FY 2010, county producers shipped 68 thousand barrels of oil worth $4.2 million and 1.4 million mcf of natural gas worth $7.8 million. In FY
2014, county producers shipped 1,388 thousand barrels of oil worth $123.0 million and 3.4 million mcf of natural gas worth $18.8 million.
Horizontal drilling and fracking (hydraulic and chemical treatment of new wells to enhance early production) have been aggressively applied in this
county and have resulted in a 1,946% increase in oil volume from FY 2010 to FY 2014 while county natural gas volumes have experienced a 149%
increase during the same period. Overall produced product value has grown from about $12.0 million to $141.8 million.
In FY 2010, all New Mexico producers shipped 62.4 million barrels of oil worth $4,469 million, 1,275 million mcf of natural gas worth $6,615 million
and 72.4 million mcf of CO2 worth $74.4 million. In FY 2014, all New Mexico producers shipped 110.5 million barrels of oil worth $10,905 million
and 1,169 million mcf of natural gas worth $6,115 million and 64.3 million mcf of CO2 worth $ . . illio . Note: f is , u i feet of gas at standard temperature and pressure.)
1. What products and land types generate the OGAS production in Sandoval County?
Sandoval County
Fiscal Year Product Volume (Million
bbls or mcf)
Value
($ million)
Price ($ per
bbl or mcf) Dedns %
Production by Land Type
% Federal % Indian % Private % State
FY 2010 GAS 1.4 $7.79 $5.76 20.6% 46% 52% 1% 2%
FY 2011 GAS 1.8 $10.00 $5.64 19.0% 60% 38% 1% 1%
FY 2012 GAS 2.3 $9.60 $4.26 19.7% 62% 31% 0% 7%
FY 2013 GAS 2.1 $8.90 $4.22 22.0% 68% 33% 0% -1%
FY 2014 GAS 3.4 $18.79 $5.58 28.5% 59% 24% 0% 17%
FY 2010 OIL 0.07 $4.25 $62.59 13.4% 61% 34% 1% 3%
FY 2011 OIL 0.16 $5.36 $32.68 13.7% 81% 17% 0% 1%
FY 2012 OIL 0.01 $8.65 $740.41 14.1% -478% 363% 6% 209%
FY 2013 OIL 0.21 $16.89 $80.91 14.5% 57% 27% 0% 16%
FY 2014 OIL 1.39 $122.98 $88.63 14.4% 51% 10% 0% 39%
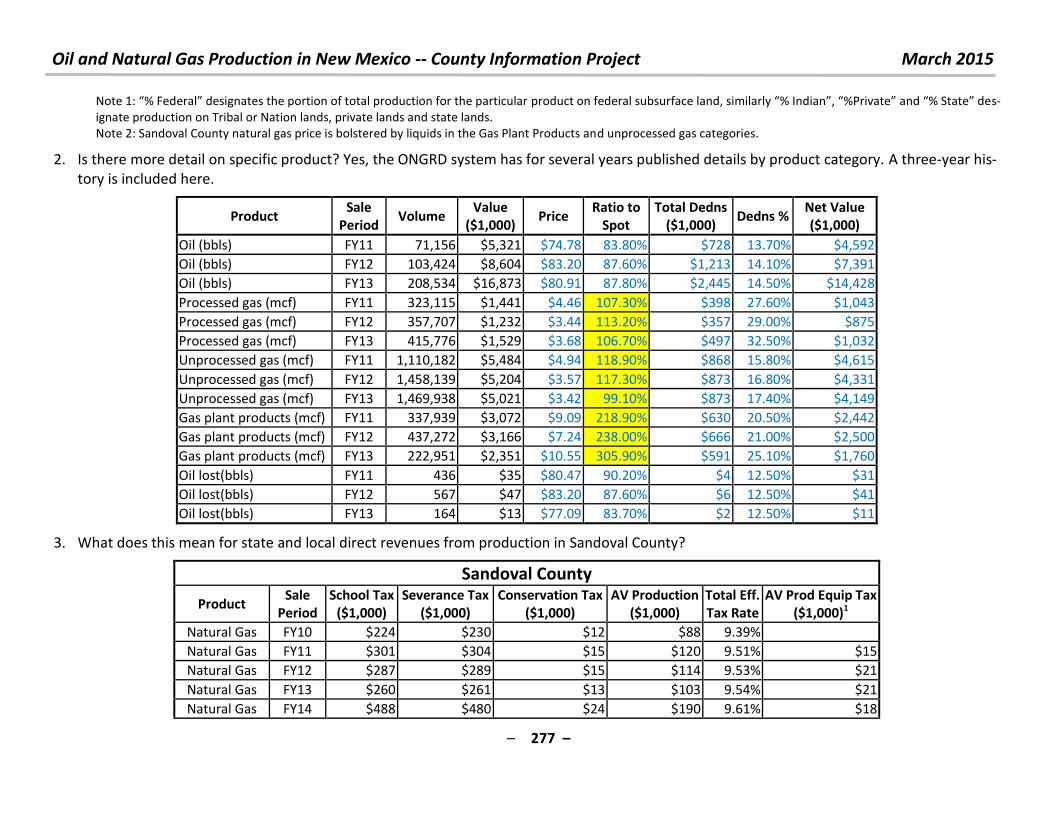
Oil and Natural Gas Production in New Mexico -- County Information Project March 2015
– 277 –
Note : % Fede al desig ates the po tio of total p odu tio fo the pa ti ula p odu t o fede al su su fa e la d, si ila l % I dia , %P i ate a d % “tate des-
ignate production on Tribal or Nation lands, private lands and state lands.
Note 2: Sandoval County natural gas price is bolstered by liquids in the Gas Plant Products and unprocessed gas categories.
2. Is there more detail on specific product? Yes, the ONGRD system has for several years published details by product category. A three-year his-
tory is included here.
Product Sale
Period Volume
Value
($1,000) Price
Ratio to
Spot
Total Dedns
($1,000) Dedns %
Net Value
($1,000)
Oil (bbls) FY11 71,156 $5,321 $74.78 83.80% $728 13.70% $4,592
Oil (bbls) FY12 103,424 $8,604 $83.20 87.60% $1,213 14.10% $7,391
Oil (bbls) FY13 208,534 $16,873 $80.91 87.80% $2,445 14.50% $14,428
Processed gas (mcf) FY11 323,115 $1,441 $4.46 107.30% $398 27.60% $1,043
Processed gas (mcf) FY12 357,707 $1,232 $3.44 113.20% $357 29.00% $875
Processed gas (mcf) FY13 415,776 $1,529 $3.68 106.70% $497 32.50% $1,032
Unprocessed gas (mcf) FY11 1,110,182 $5,484 $4.94 118.90% $868 15.80% $4,615
Unprocessed gas (mcf) FY12 1,458,139 $5,204 $3.57 117.30% $873 16.80% $4,331
Unprocessed gas (mcf) FY13 1,469,938 $5,021 $3.42 99.10% $873 17.40% $4,149
Gas plant products (mcf) FY11 337,939 $3,072 $9.09 218.90% $630 20.50% $2,442
Gas plant products (mcf) FY12 437,272 $3,166 $7.24 238.00% $666 21.00% $2,500
Gas plant products (mcf) FY13 222,951 $2,351 $10.55 305.90% $591 25.10% $1,760
Oil lost(bbls) FY11 436 $35 $80.47 90.20% $4 12.50% $31
Oil lost(bbls) FY12 567 $47 $83.20 87.60% $6 12.50% $41
Oil lost(bbls) FY13 164 $13 $77.09 83.70% $2 12.50% $11
3. What does this mean for state and local direct revenues from production in Sandoval County?
Sandoval County
Product Sale
Period
School Tax
($1,000)
Severance Tax
($1,000)
Conservation Tax
($1,000)
AV Production
($1,000)
Total Eff.
Tax Rate
AV Prod Equip Tax
($1,000)1
Natural Gas FY10 $224 $230 $12 $88 9.39%
Natural Gas FY11 $301 $304 $15 $120 9.51% $15
Natural Gas FY12 $287 $289 $15 $114 9.53% $21
Natural Gas FY13 $260 $261 $13 $103 9.54% $21
Natural Gas FY14 $488 $480 $24 $190 9.61% $18
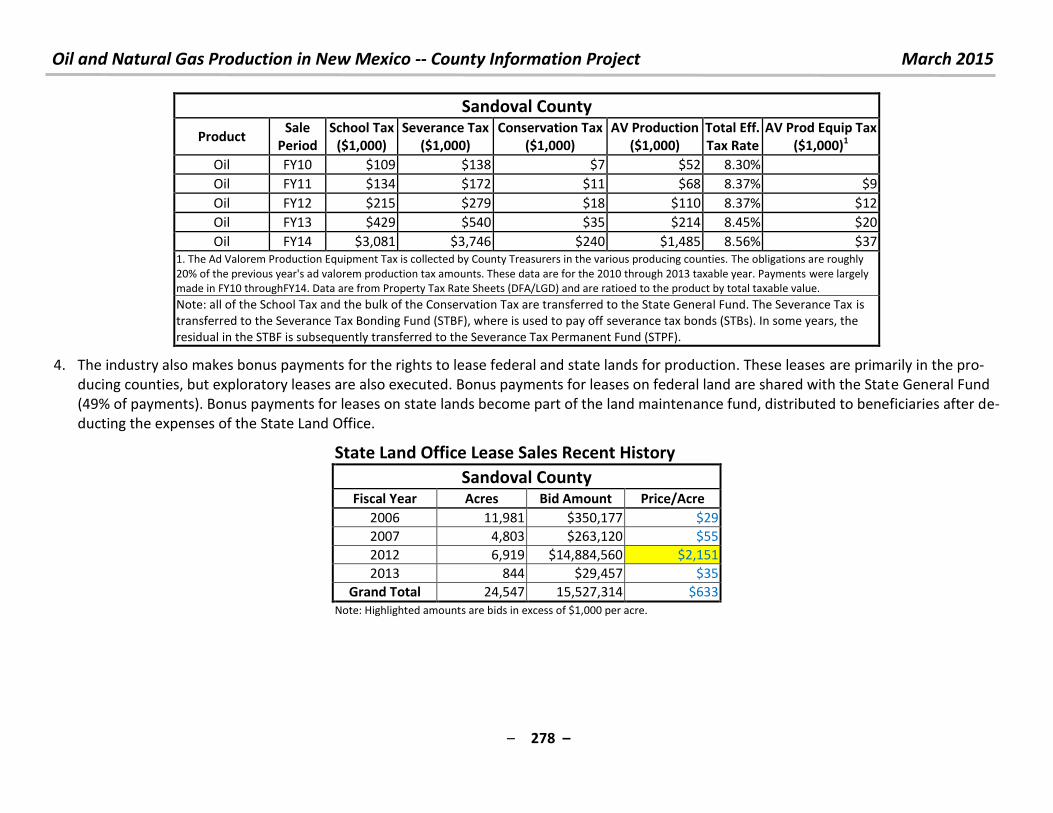
Oil and Natural Gas Production in New Mexico -- County Information Project March 2015
– 278 –
Sandoval County
Product Sale
Period
School Tax
($1,000)
Severance Tax
($1,000)
Conservation Tax
($1,000)
AV Production
($1,000)
Total Eff.
Tax Rate
AV Prod Equip Tax
($1,000)1
Oil FY10 $109 $138 $7 $52 8.30%
Oil FY11 $134 $172 $11 $68 8.37% $9
Oil FY12 $215 $279 $18 $110 8.37% $12
Oil FY13 $429 $540 $35 $214 8.45% $20
Oil FY14 $3,081 $3,746 $240 $1,485 8.56% $37 1. The Ad Valorem Production Equipment Tax is collected by County Treasurers in the various producing counties. The obligations are roughly
20% of the previous year's ad valorem production tax amounts. These data are for the 2010 through 2013 taxable year. Payments were largely
made in FY10 throughFY14. Data are from Property Tax Rate Sheets (DFA/LGD) and are ratioed to the product by total taxable value.
Note: all of the School Tax and the bulk of the Conservation Tax are transferred to the State General Fund. The Severance Tax is
transferred to the Severance Tax Bonding Fund (STBF), where is used to pay off severance tax bonds (STBs). In some years, the
residual in the STBF is subsequently transferred to the Severance Tax Permanent Fund (STPF).
4. The industry also makes bonus payments for the rights to lease federal and state lands for production. These leases are primarily in the pro-
ducing counties, but exploratory leases are also executed. Bonus payments for leases on federal land are shared with the State General Fund
(49% of payments). Bonus payments for leases on state lands become part of the land maintenance fund, distributed to beneficiaries after de-
ducting the expenses of the State Land Office.
State Land Office Lease Sales Recent History
Sandoval County Fiscal Year Acres Bid Amount Price/Acre
2006 11,981 $350,177 $29
2007 4,803 $263,120 $55
2012 6,919 $14,884,560 $2,151
2013 844 $29,457 $35
Grand Total 24,547 15,527,314 $633
Note: Highlighted amounts are bids in excess of $1,000 per acre.
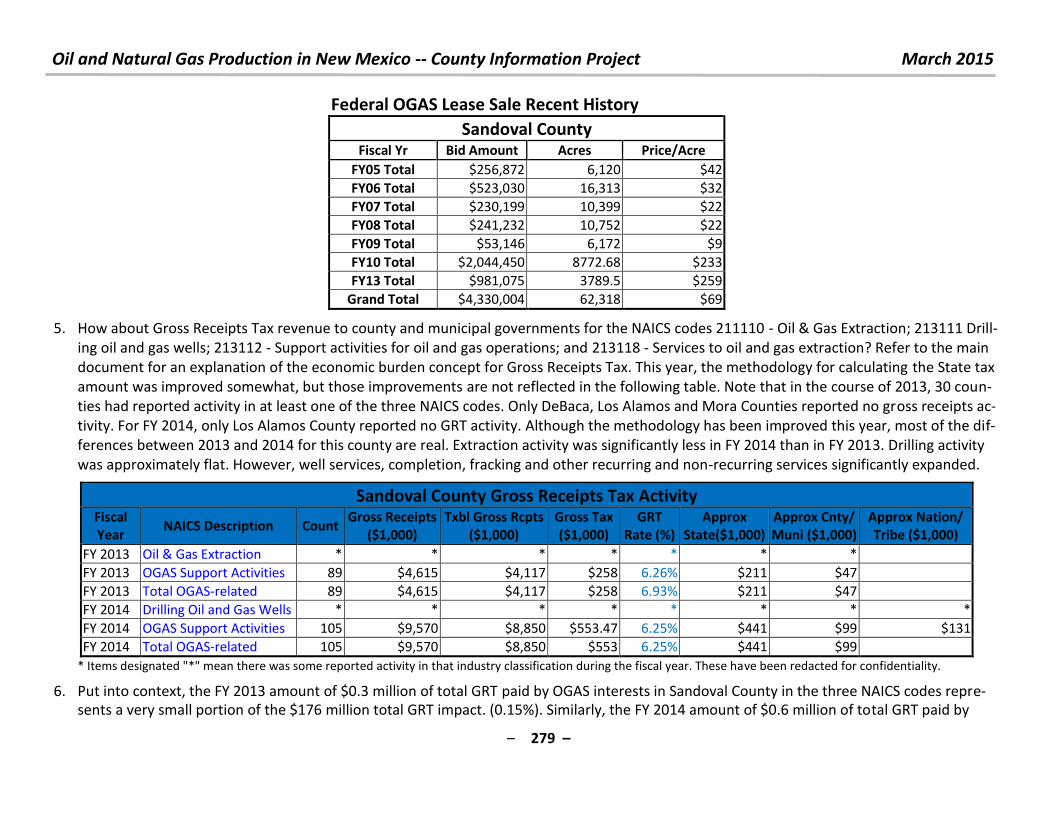
Oil and Natural Gas Production in New Mexico -- County Information Project March 2015
– 279 –
Federal OGAS Lease Sale Recent History
Sandoval County Fiscal Yr Bid Amount Acres Price/Acre
FY05 Total $256,872 6,120 $42
FY06 Total $523,030 16,313 $32
FY07 Total $230,199 10,399 $22
FY08 Total $241,232 10,752 $22
FY09 Total $53,146 6,172 $9
FY10 Total $2,044,450 8772.68 $233
FY13 Total $981,075 3789.5 $259
Grand Total $4,330,004 62,318 $69
5. How about Gross Receipts Tax revenue to county and municipal governments for the NAICS codes 211110 - Oil & Gas Extraction; 213111 Drill-
ing oil and gas wells; 213112 - Support activities for oil and gas operations; and 213118 - Services to oil and gas extraction? Refer to the main
document for an explanation of the economic burden concept for Gross Receipts Tax. This year, the methodology for calculating the State tax
amount was improved somewhat, but those improvements are not reflected in the following table. Note that in the course of 2013, 30 coun-
ties had reported activity in at least one of the three NAICS codes. Only DeBaca, Los Alamos and Mora Counties reported no gross receipts ac-
tivity. For FY 2014, only Los Alamos County reported no GRT activity. Although the methodology has been improved this year, most of the dif-
ferences between 2013 and 2014 for this county are real. Extraction activity was significantly less in FY 2014 than in FY 2013. Drilling activity
was approximately flat. However, well services, completion, fracking and other recurring and non-recurring services significantly expanded.
Sandoval County Gross Receipts Tax Activity Fiscal
Year NAICS Description Count
Gross Receipts
($1,000)
Txbl Gross Rcpts
($1,000)
Gross Tax
($1,000)
GRT
Rate (%)
Approx
State($1,000)
Approx Cnty/
Muni ($1,000)
Approx Nation/
Tribe ($1,000)
FY 2013 Oil & Gas Extraction * * * * * * *
FY 2013 OGAS Support Activities 89 $4,615 $4,117 $258 6.26% $211 $47
FY 2013 Total OGAS-related 89 $4,615 $4,117 $258 6.93% $211 $47
FY 2014 Drilling Oil and Gas Wells * * * * * * * *
FY 2014 OGAS Support Activities 105 $9,570 $8,850 $553.47 6.25% $441 $99 $131
FY 2014 Total OGAS-related 105 $9,570 $8,850 $553 6.25% $441 $99
* Items designated "*" mean there was some reported activity in that industry classification during the fiscal year. These have been redacted for confidentiality.
6. Put into context, the FY 2013 amount of $0.3 million of total GRT paid by OGAS interests in Sandoval County in the three NAICS codes repre-
sents a very small portion of the $176 million total GRT impact. (0.15%). Similarly, the FY 2014 amount of $0.6 million of total GRT paid by
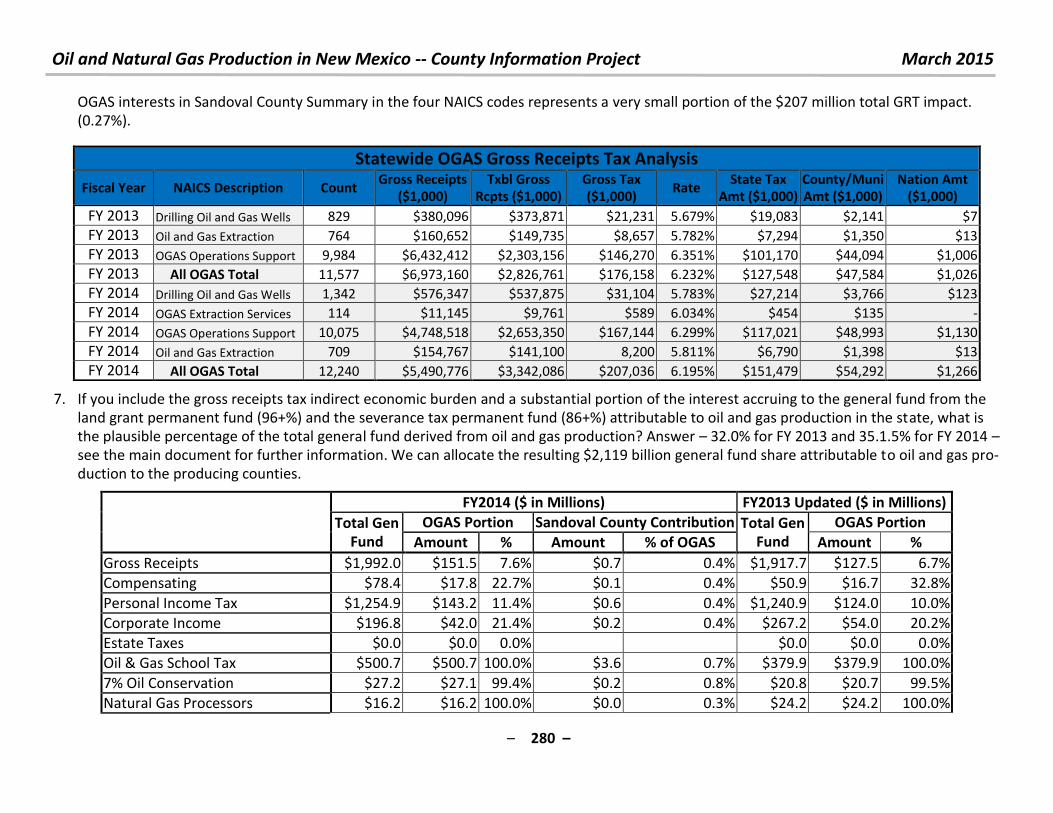
Oil and Natural Gas Production in New Mexico -- County Information Project March 2015
– 280 –
OGAS interests in Sandoval County Summary in the four NAICS codes represents a very small portion of the $207 million total GRT impact.
(0.27%).
7. If you include the gross receipts tax indirect economic burden and a substantial portion of the interest accruing to the general fund from the
land grant permanent fund (96+%) and the severance tax permanent fund (86+%) attributable to oil and gas production in the state, what is
the plausible percentage of the total general fund derived from oil and gas production? Answer – 32.0% for FY 2013 and 35.1.5% for FY 2014 –
see the main document for further information. We can allocate the resulting $2,119 billion general fund share attributable to oil and gas pro-
duction to the producing counties.
FY2014 ($ in Millions) FY2013 Updated ($ in Millions)
Total Gen
Fund
OGAS Portion Sandoval County Contribution Total Gen
Fund
OGAS Portion
Amount % Amount % of OGAS Amount %
Gross Receipts $1,992.0 $151.5 7.6% $0.7 0.4% $1,917.7 $127.5 6.7%
Compensating $78.4 $17.8 22.7% $0.1 0.4% $50.9 $16.7 32.8%
Personal Income Tax $1,254.9 $143.2 11.4% $0.6 0.4% $1,240.9 $124.0 10.0%
Corporate Income $196.8 $42.0 21.4% $0.2 0.4% $267.2 $54.0 20.2%
Estate Taxes $0.0 $0.0 0.0% $0.0 $0.0 0.0%
Oil & Gas School Tax $500.7 $500.7 100.0% $3.6 0.7% $379.9 $379.9 100.0%
7% Oil Conservation $27.2 $27.1 99.4% $0.2 0.8% $20.8 $20.7 99.5%
Natural Gas Processors $16.2 $16.2 100.0% $0.0 0.3% $24.2 $24.2 100.0%
Statewide OGAS Gross Receipts Tax Analysis
Fiscal Year NAICS Description Count Gross Receipts
($1,000)
Txbl Gross
Rcpts ($1,000)
Gross Tax
($1,000) Rate
State Tax
Amt ($1,000)
County/Muni
Amt ($1,000)
Nation Amt
($1,000)
FY 2013 Drilling Oil and Gas Wells 829 $380,096 $373,871 $21,231 5.679% $19,083 $2,141 $7
FY 2013 Oil and Gas Extraction 764 $160,652 $149,735 $8,657 5.782% $7,294 $1,350 $13
FY 2013 OGAS Operations Support 9,984 $6,432,412 $2,303,156 $146,270 6.351% $101,170 $44,094 $1,006
FY 2013 All OGAS Total 11,577 $6,973,160 $2,826,761 $176,158 6.232% $127,548 $47,584 $1,026
FY 2014 Drilling Oil and Gas Wells 1,342 $576,347 $537,875 $31,104 5.783% $27,214 $3,766 $123
FY 2014 OGAS Extraction Services 114 $11,145 $9,761 $589 6.034% $454 $135 -
FY 2014 OGAS Operations Support 10,075 $4,748,518 $2,653,350 $167,144 6.299% $117,021 $48,993 $1,130
FY 2014 Oil and Gas Extraction 709 $154,767 $141,100 8,200 5.811% $6,790 $1,398 $13
FY 2014 All OGAS Total 12,240 $5,490,776 $3,342,086 $207,036 6.195% $151,479 $54,292 $1,266
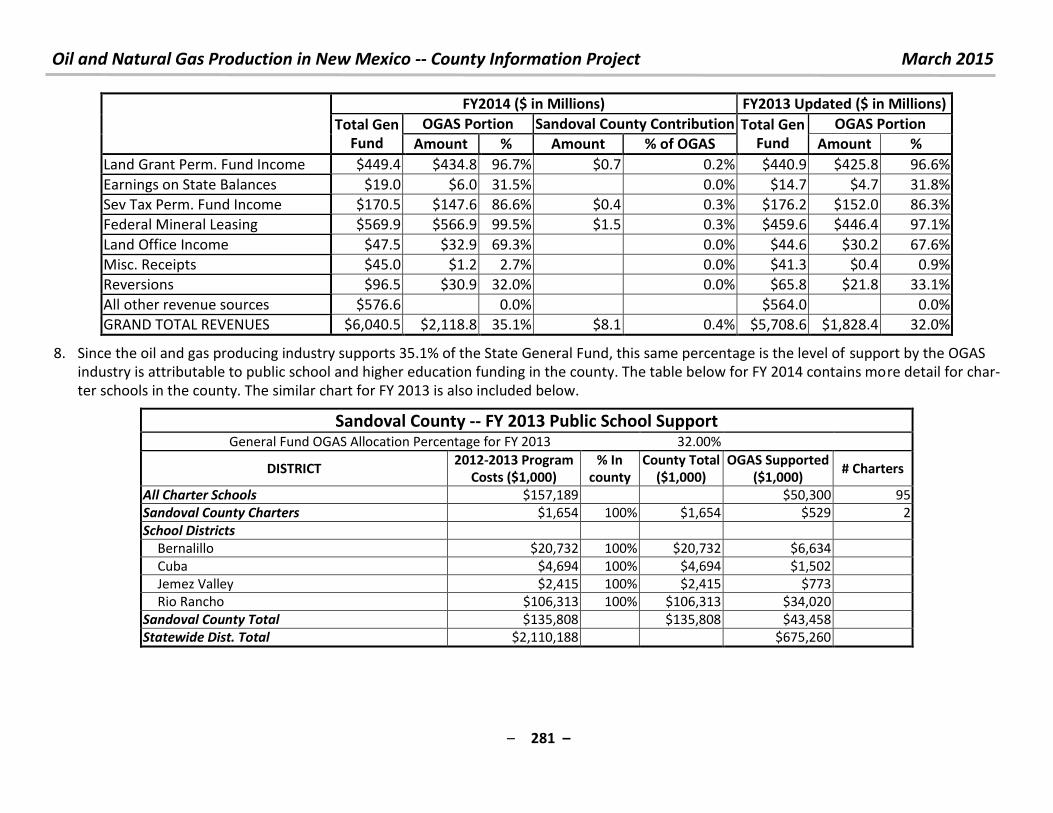
Oil and Natural Gas Production in New Mexico -- County Information Project March 2015
– 281 –
FY2014 ($ in Millions) FY2013 Updated ($ in Millions)
Total Gen
Fund
OGAS Portion Sandoval County Contribution Total Gen
Fund
OGAS Portion
Amount % Amount % of OGAS Amount %
Land Grant Perm. Fund Income $449.4 $434.8 96.7% $0.7 0.2% $440.9 $425.8 96.6%
Earnings on State Balances $19.0 $6.0 31.5% 0.0% $14.7 $4.7 31.8%
Sev Tax Perm. Fund Income $170.5 $147.6 86.6% $0.4 0.3% $176.2 $152.0 86.3%
Federal Mineral Leasing $569.9 $566.9 99.5% $1.5 0.3% $459.6 $446.4 97.1%
Land Office Income $47.5 $32.9 69.3% 0.0% $44.6 $30.2 67.6%
Misc. Receipts $45.0 $1.2 2.7% 0.0% $41.3 $0.4 0.9%
Reversions $96.5 $30.9 32.0% 0.0% $65.8 $21.8 33.1%
All other revenue sources $576.6 0.0% $564.0 0.0%
GRAND TOTAL REVENUES $6,040.5 $2,118.8 35.1% $8.1 0.4% $5,708.6 $1,828.4 32.0%
8. Since the oil and gas producing industry supports 35.1% of the State General Fund, this same percentage is the level of support by the OGAS
industry is attributable to public school and higher education funding in the county. The table below for FY 2014 contains more detail for char-
ter schools in the county. The similar chart for FY 2013 is also included below.
Sandoval County -- FY 2013 Public School Support General Fund OGAS Allocation Percentage for FY 2013 32.00%
DISTRICT 2012-2013 Program
Costs ($1,000)
% In
county
County Total
($1,000)
OGAS Supported
($1,000) # Charters
All Charter Schools $157,189 $50,300 95
Sandoval County Charters $1,654 100% $1,654 $529 2
School Districts
Bernalillo $20,732 100% $20,732 $6,634
Cuba $4,694 100% $4,694 $1,502
Jemez Valley $2,415 100% $2,415 $773
Rio Rancho $106,313 100% $106,313 $34,020
Sandoval County Total $135,808 $135,808 $43,458
Statewide Dist. Total $2,110,188 $675,260
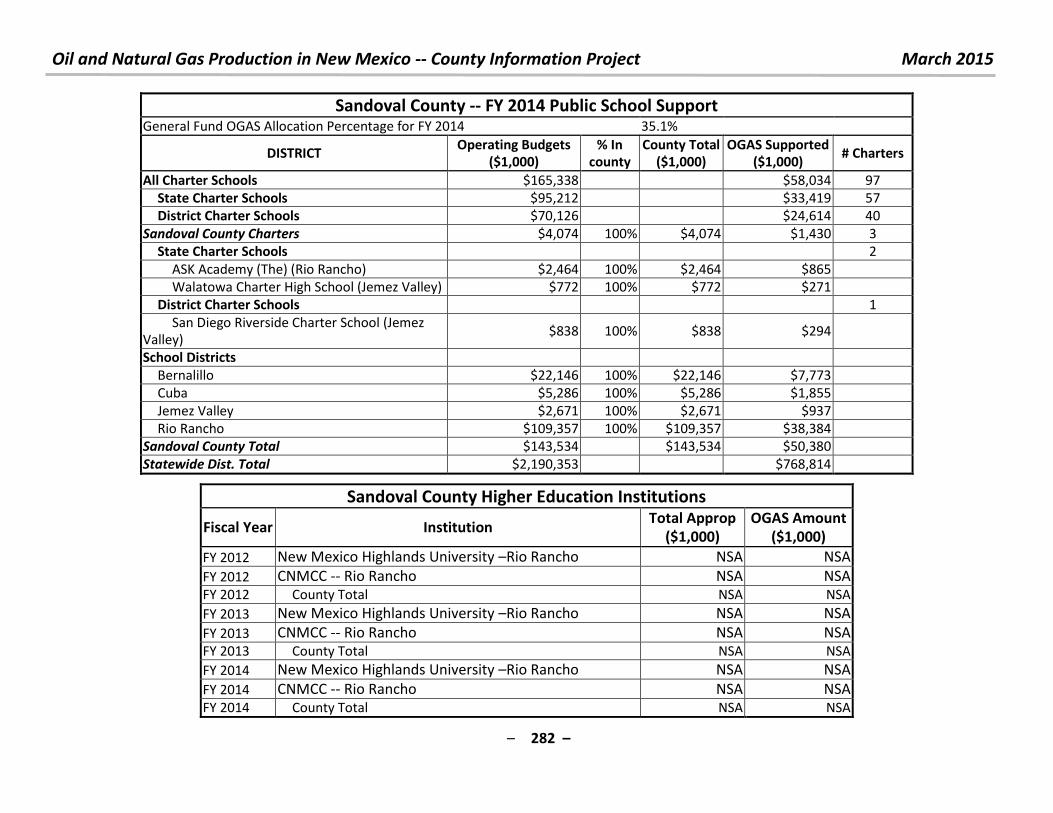
Oil and Natural Gas Production in New Mexico -- County Information Project March 2015
– 282 –
Sandoval County -- FY 2014 Public School Support General Fund OGAS Allocation Percentage for FY 2014 35.1%
DISTRICT Operating Budgets
($1,000)
% In
county
County Total
($1,000)
OGAS Supported
($1,000) # Charters
All Charter Schools $165,338 $58,034 97
State Charter Schools $95,212 $33,419 57
District Charter Schools $70,126 $24,614 40
Sandoval County Charters $4,074 100% $4,074 $1,430 3
State Charter Schools 2
ASK Academy (The) (Rio Rancho) $2,464 100% $2,464 $865
Walatowa Charter High School (Jemez Valley) $772 100% $772 $271
District Charter Schools 1
San Diego Riverside Charter School (Jemez
Valley) $838 100% $838 $294
School Districts
Bernalillo $22,146 100% $22,146 $7,773
Cuba $5,286 100% $5,286 $1,855
Jemez Valley $2,671 100% $2,671 $937
Rio Rancho $109,357 100% $109,357 $38,384
Sandoval County Total $143,534 $143,534 $50,380
Statewide Dist. Total $2,190,353 $768,814
Sandoval County Higher Education Institutions
Fiscal Year Institution Total Approp
($1,000)
OGAS Amount
($1,000)
FY 2012 New Mexico Highlands University –Rio Rancho NSA NSA
FY 2012 CNMCC -- Rio Rancho NSA NSA FY 2012 County Total NSA NSA
FY 2013 New Mexico Highlands University –Rio Rancho NSA NSA
FY 2013 CNMCC -- Rio Rancho NSA NSA FY 2013 County Total NSA NSA
FY 2014 New Mexico Highlands University –Rio Rancho NSA NSA
FY 2014 CNMCC -- Rio Rancho NSA NSA FY 2014 County Total NSA NSA
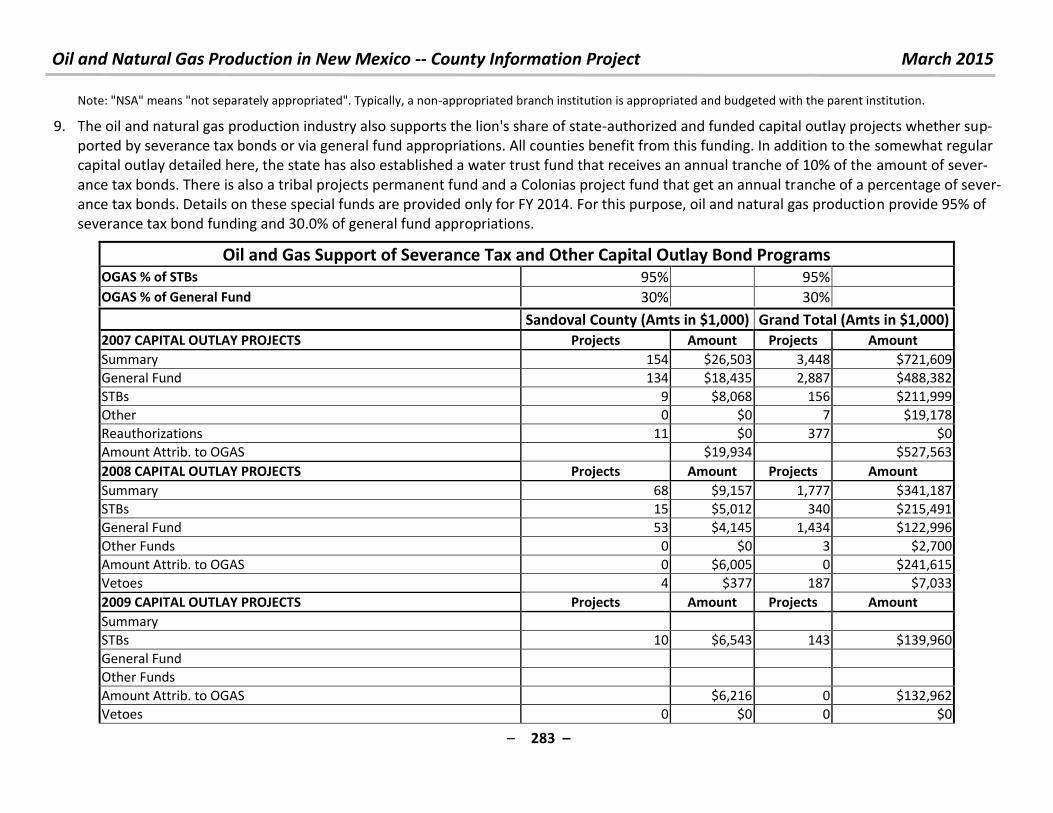
Oil and Natural Gas Production in New Mexico -- County Information Project March 2015
– 283 –
Note: "NSA" means "not separately appropriated". Typically, a non-appropriated branch institution is appropriated and budgeted with the parent institution.
9. The oil and natural gas production industry also supports the lion's share of state-authorized and funded capital outlay projects whether sup-
ported by severance tax bonds or via general fund appropriations. All counties benefit from this funding. In addition to the somewhat regular
capital outlay detailed here, the state has also established a water trust fund that receives an annual tranche of 10% of the amount of sever-
ance tax bonds. There is also a tribal projects permanent fund and a Colonias project fund that get an annual tranche of a percentage of sever-
ance tax bonds. Details on these special funds are provided only for FY 2014. For this purpose, oil and natural gas production provide 95% of
severance tax bond funding and 30.0% of general fund appropriations.
Oil and Gas Support of Severance Tax and Other Capital Outlay Bond Programs OGAS % of STBs 95% 95%
OGAS % of General Fund 30% 30%
Sandoval County (Amts in $1,000) Grand Total (Amts in $1,000)
2007 CAPITAL OUTLAY PROJECTS Projects Amount Projects Amount
Summary 154 $26,503 3,448 $721,609
General Fund 134 $18,435 2,887 $488,382
STBs 9 $8,068 156 $211,999
Other 0 $0 7 $19,178
Reauthorizations 11 $0 377 $0
Amount Attrib. to OGAS $19,934 $527,563
2008 CAPITAL OUTLAY PROJECTS Projects Amount Projects Amount
Summary 68 $9,157 1,777 $341,187
STBs 15 $5,012 340 $215,491
General Fund 53 $4,145 1,434 $122,996
Other Funds 0 $0 3 $2,700
Amount Attrib. to OGAS 0 $6,005 0 $241,615
Vetoes 4 $377 187 $7,033
2009 CAPITAL OUTLAY PROJECTS Projects Amount Projects Amount
Summary
STBs 10 $6,543 143 $139,960
General Fund
Other Funds
Amount Attrib. to OGAS $6,216 0 $132,962
Vetoes 0 $0 0 $0
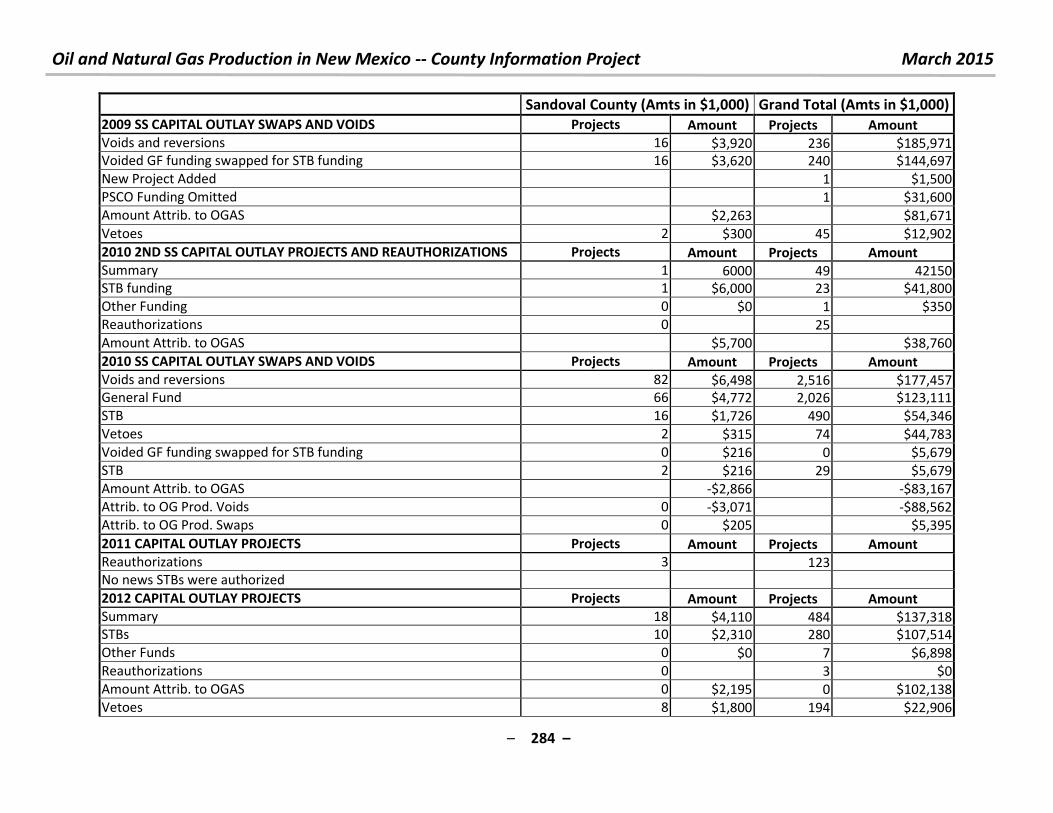
Oil and Natural Gas Production in New Mexico -- County Information Project March 2015
– 284 –
Sandoval County (Amts in $1,000) Grand Total (Amts in $1,000)
2009 SS CAPITAL OUTLAY SWAPS AND VOIDS Projects Amount Projects Amount
Voids and reversions 16 $3,920 236 $185,971
Voided GF funding swapped for STB funding 16 $3,620 240 $144,697
New Project Added 1 $1,500
PSCO Funding Omitted 1 $31,600
Amount Attrib. to OGAS $2,263 $81,671
Vetoes 2 $300 45 $12,902
2010 2ND SS CAPITAL OUTLAY PROJECTS AND REAUTHORIZATIONS Projects Amount Projects Amount
Summary 1 6000 49 42150
STB funding 1 $6,000 23 $41,800
Other Funding 0 $0 1 $350
Reauthorizations 0 25
Amount Attrib. to OGAS $5,700 $38,760
2010 SS CAPITAL OUTLAY SWAPS AND VOIDS Projects Amount Projects Amount
Voids and reversions 82 $6,498 2,516 $177,457
General Fund 66 $4,772 2,026 $123,111
STB 16 $1,726 490 $54,346
Vetoes 2 $315 74 $44,783
Voided GF funding swapped for STB funding 0 $216 0 $5,679
STB 2 $216 29 $5,679
Amount Attrib. to OGAS -$2,866 -$83,167
Attrib. to OG Prod. Voids 0 -$3,071 -$88,562
Attrib. to OG Prod. Swaps 0 $205 $5,395
2011 CAPITAL OUTLAY PROJECTS Projects Amount Projects Amount
Reauthorizations 3 123
No news STBs were authorized
2012 CAPITAL OUTLAY PROJECTS Projects Amount Projects Amount
Summary 18 $4,110 484 $137,318
STBs 10 $2,310 280 $107,514
Other Funds 0 $0 7 $6,898
Reauthorizations 0 3 $0
Amount Attrib. to OGAS 0 $2,195 0 $102,138
Vetoes 8 $1,800 194 $22,906
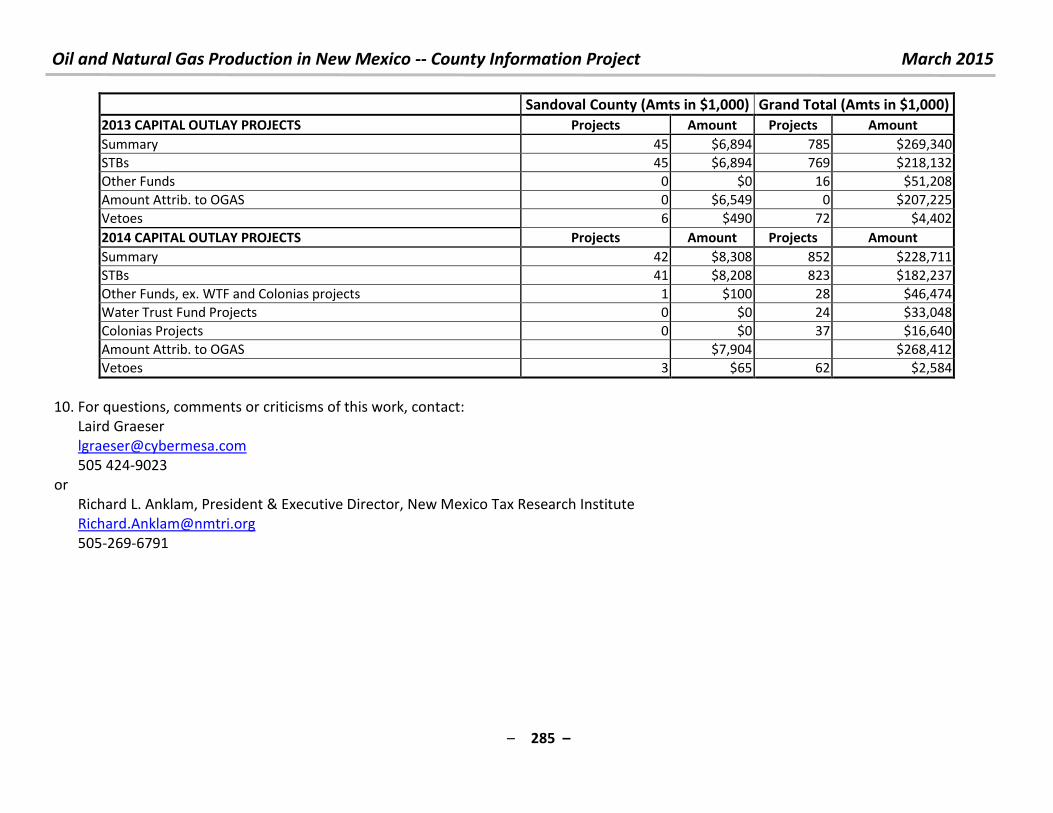
Oil and Natural Gas Production in New Mexico -- County Information Project March 2015
– 285 –
Sandoval County (Amts in $1,000) Grand Total (Amts in $1,000)
2013 CAPITAL OUTLAY PROJECTS Projects Amount Projects Amount
Summary 45 $6,894 785 $269,340
STBs 45 $6,894 769 $218,132
Other Funds 0 $0 16 $51,208
Amount Attrib. to OGAS 0 $6,549 0 $207,225
Vetoes 6 $490 72 $4,402
2014 CAPITAL OUTLAY PROJECTS Projects Amount Projects Amount
Summary 42 $8,308 852 $228,711
STBs 41 $8,208 823 $182,237
Other Funds, ex. WTF and Colonias projects 1 $100 28 $46,474
Water Trust Fund Projects 0 $0 24 $33,048
Colonias Projects 0 $0 37 $16,640
Amount Attrib. to OGAS $7,904 $268,412
Vetoes 3 $65 62 $2,584
10. For questions, comments or criticisms of this work, contact:
Laird Graeser
505 424-9023
or
Richard L. Anklam, President & Executive Director, New Mexico Tax Research Institute
505-269-6791
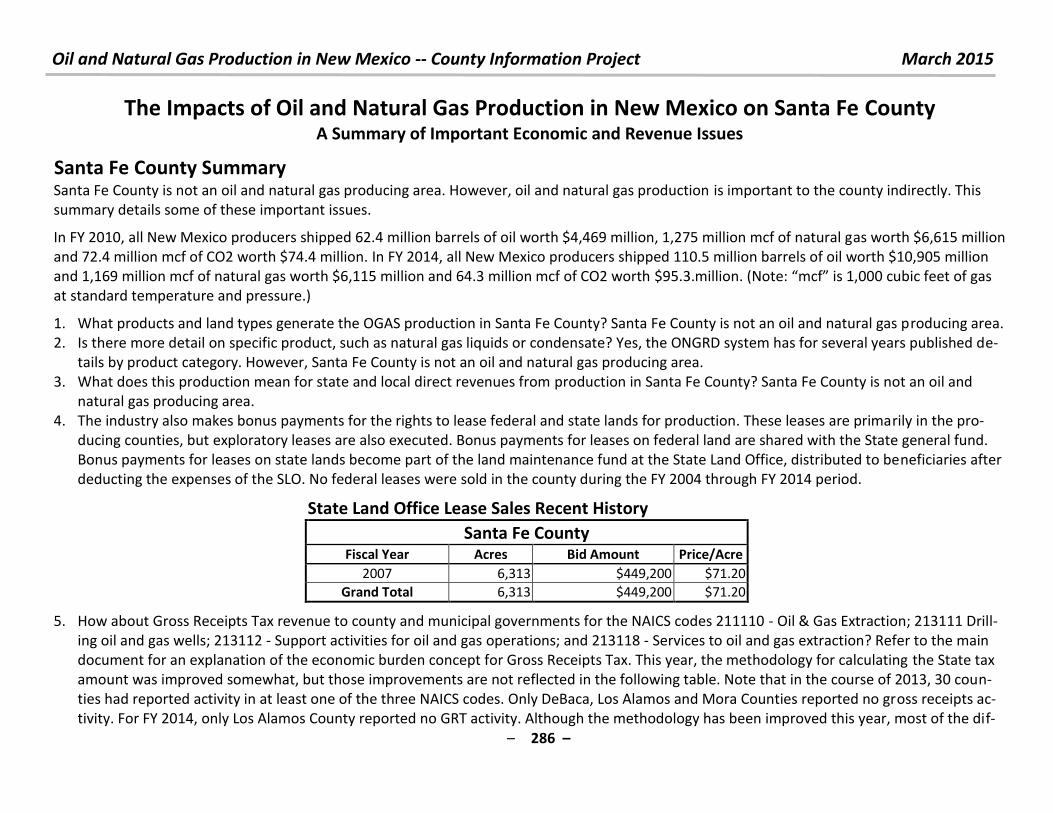
Oil and Natural Gas Production in New Mexico -- County Information Project March 2015
– 286 –
The Impacts of Oil and Natural Gas Production in New Mexico on Santa Fe County A Summary of Important Economic and Revenue Issues
Santa Fe County Summary
Santa Fe County is not an oil and natural gas producing area. However, oil and natural gas production is important to the county indirectly. This
summary details some of these important issues.
In FY 2010, all New Mexico producers shipped 62.4 million barrels of oil worth $4,469 million, 1,275 million mcf of natural gas worth $6,615 million
and 72.4 million mcf of CO2 worth $74.4 million. In FY 2014, all New Mexico producers shipped 110.5 million barrels of oil worth $10,905 million
and 1,169 million mcf of natural gas worth $6,115 million and 64.3 million mcf of CO2 worth $ . . illio . Note: f is ,000 cubic feet of gas
at standard temperature and pressure.)
1. What products and land types generate the OGAS production in Santa Fe County? Santa Fe County is not an oil and natural gas producing area.
2. Is there more detail on specific product, such as natural gas liquids or condensate? Yes, the ONGRD system has for several years published de-
tails by product category. However, Santa Fe County is not an oil and natural gas producing area.
3. What does this production mean for state and local direct revenues from production in Santa Fe County? Santa Fe County is not an oil and
natural gas producing area.
4. The industry also makes bonus payments for the rights to lease federal and state lands for production. These leases are primarily in the pro-
ducing counties, but exploratory leases are also executed. Bonus payments for leases on federal land are shared with the State general fund.
Bonus payments for leases on state lands become part of the land maintenance fund at the State Land Office, distributed to beneficiaries after
deducting the expenses of the SLO. No federal leases were sold in the county during the FY 2004 through FY 2014 period.
State Land Office Lease Sales Recent History
Santa Fe County Fiscal Year Acres Bid Amount Price/Acre
2007 6,313 $449,200 $71.20
Grand Total 6,313 $449,200 $71.20
5. How about Gross Receipts Tax revenue to county and municipal governments for the NAICS codes 211110 - Oil & Gas Extraction; 213111 Drill-
ing oil and gas wells; 213112 - Support activities for oil and gas operations; and 213118 - Services to oil and gas extraction? Refer to the main
document for an explanation of the economic burden concept for Gross Receipts Tax. This year, the methodology for calculating the State tax
amount was improved somewhat, but those improvements are not reflected in the following table. Note that in the course of 2013, 30 coun-
ties had reported activity in at least one of the three NAICS codes. Only DeBaca, Los Alamos and Mora Counties reported no gross receipts ac-
tivity. For FY 2014, only Los Alamos County reported no GRT activity. Although the methodology has been improved this year, most of the dif-
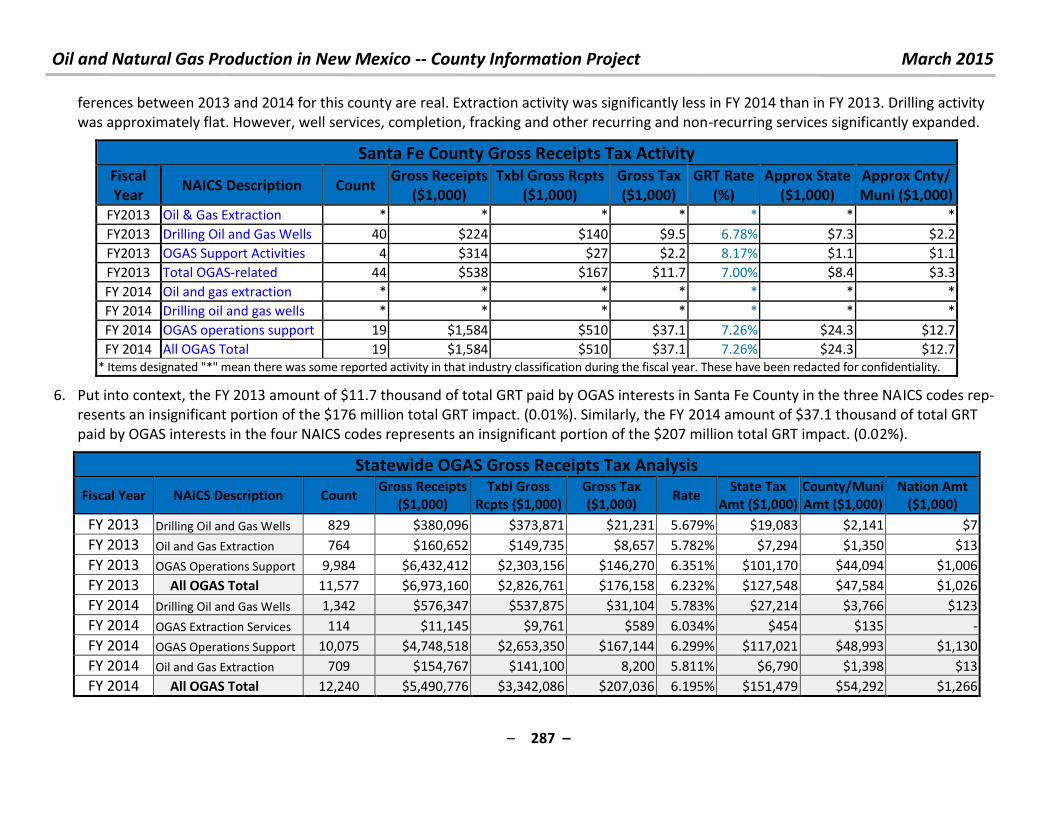
Oil and Natural Gas Production in New Mexico -- County Information Project March 2015
– 287 –
ferences between 2013 and 2014 for this county are real. Extraction activity was significantly less in FY 2014 than in FY 2013. Drilling activity
was approximately flat. However, well services, completion, fracking and other recurring and non-recurring services significantly expanded.
Santa Fe County Gross Receipts Tax Activity
Fiscal
Year NAICS Description Count
Gross Receipts
($1,000)
Txbl Gross Rcpts
($1,000)
Gross Tax
($1,000)
GRT Rate
(%)
Approx State
($1,000)
Approx Cnty/
Muni ($1,000)
FY2013 Oil & Gas Extraction * * * * * * *
FY2013 Drilling Oil and Gas Wells 40 $224 $140 $9.5 6.78% $7.3 $2.2
FY2013 OGAS Support Activities 4 $314 $27 $2.2 8.17% $1.1 $1.1
FY2013 Total OGAS-related 44 $538 $167 $11.7 7.00% $8.4 $3.3
FY 2014 Oil and gas extraction * * * * * * *
FY 2014 Drilling oil and gas wells * * * * * * *
FY 2014 OGAS operations support 19 $1,584 $510 $37.1 7.26% $24.3 $12.7
FY 2014 All OGAS Total 19 $1,584 $510 $37.1 7.26% $24.3 $12.7
* Items designated "*" mean there was some reported activity in that industry classification during the fiscal year. These have been redacted for confidentiality.
6. Put into context, the FY 2013 amount of $11.7 thousand of total GRT paid by OGAS interests in Santa Fe County in the three NAICS codes rep-
resents an insignificant portion of the $176 million total GRT impact. (0.01%). Similarly, the FY 2014 amount of $37.1 thousand of total GRT
paid by OGAS interests in the four NAICS codes represents an insignificant portion of the $207 million total GRT impact. (0.02%).
Statewide OGAS Gross Receipts Tax Analysis
Fiscal Year NAICS Description Count Gross Receipts
($1,000)
Txbl Gross
Rcpts ($1,000)
Gross Tax
($1,000) Rate
State Tax
Amt ($1,000)
County/Muni
Amt ($1,000)
Nation Amt
($1,000)
FY 2013 Drilling Oil and Gas Wells 829 $380,096 $373,871 $21,231 5.679% $19,083 $2,141 $7
FY 2013 Oil and Gas Extraction 764 $160,652 $149,735 $8,657 5.782% $7,294 $1,350 $13
FY 2013 OGAS Operations Support 9,984 $6,432,412 $2,303,156 $146,270 6.351% $101,170 $44,094 $1,006
FY 2013 All OGAS Total 11,577 $6,973,160 $2,826,761 $176,158 6.232% $127,548 $47,584 $1,026
FY 2014 Drilling Oil and Gas Wells 1,342 $576,347 $537,875 $31,104 5.783% $27,214 $3,766 $123
FY 2014 OGAS Extraction Services 114 $11,145 $9,761 $589 6.034% $454 $135 -
FY 2014 OGAS Operations Support 10,075 $4,748,518 $2,653,350 $167,144 6.299% $117,021 $48,993 $1,130
FY 2014 Oil and Gas Extraction 709 $154,767 $141,100 8,200 5.811% $6,790 $1,398 $13
FY 2014 All OGAS Total 12,240 $5,490,776 $3,342,086 $207,036 6.195% $151,479 $54,292 $1,266
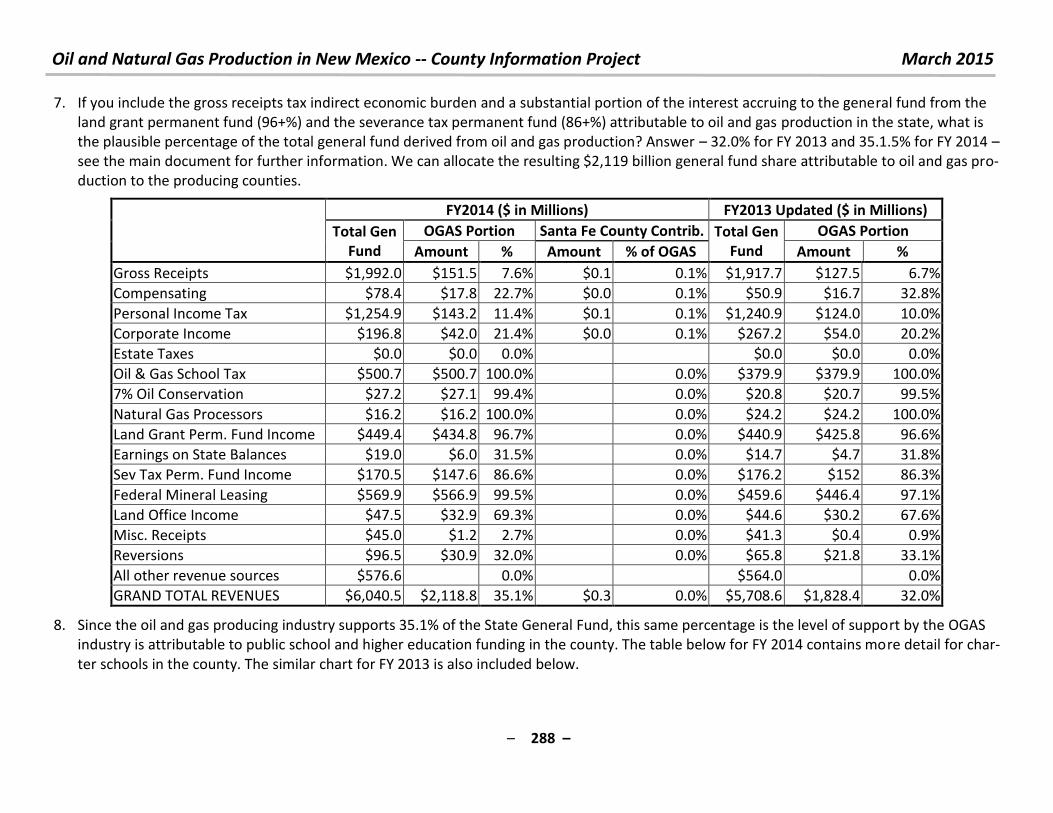
Oil and Natural Gas Production in New Mexico -- County Information Project March 2015
– 288 –
7. If you include the gross receipts tax indirect economic burden and a substantial portion of the interest accruing to the general fund from the
land grant permanent fund (96+%) and the severance tax permanent fund (86+%) attributable to oil and gas production in the state, what is
the plausible percentage of the total general fund derived from oil and gas production? Answer – 32.0% for FY 2013 and 35.1.5% for FY 2014 –
see the main document for further information. We can allocate the resulting $2,119 billion general fund share attributable to oil and gas pro-
duction to the producing counties.
FY2014 ($ in Millions) FY2013 Updated ($ in Millions)
Total Gen
Fund
OGAS Portion Santa Fe County Contrib. Total Gen
Fund
OGAS Portion
Amount % Amount % of OGAS Amount %
Gross Receipts $1,992.0 $151.5 7.6% $0.1 0.1% $1,917.7 $127.5 6.7%
Compensating $78.4 $17.8 22.7% $0.0 0.1% $50.9 $16.7 32.8%
Personal Income Tax $1,254.9 $143.2 11.4% $0.1 0.1% $1,240.9 $124.0 10.0%
Corporate Income $196.8 $42.0 21.4% $0.0 0.1% $267.2 $54.0 20.2%
Estate Taxes $0.0 $0.0 0.0% $0.0 $0.0 0.0%
Oil & Gas School Tax $500.7 $500.7 100.0% 0.0% $379.9 $379.9 100.0%
7% Oil Conservation $27.2 $27.1 99.4% 0.0% $20.8 $20.7 99.5%
Natural Gas Processors $16.2 $16.2 100.0% 0.0% $24.2 $24.2 100.0%
Land Grant Perm. Fund Income $449.4 $434.8 96.7% 0.0% $440.9 $425.8 96.6%
Earnings on State Balances $19.0 $6.0 31.5% 0.0% $14.7 $4.7 31.8%
Sev Tax Perm. Fund Income $170.5 $147.6 86.6% 0.0% $176.2 $152 86.3%
Federal Mineral Leasing $569.9 $566.9 99.5% 0.0% $459.6 $446.4 97.1%
Land Office Income $47.5 $32.9 69.3% 0.0% $44.6 $30.2 67.6%
Misc. Receipts $45.0 $1.2 2.7% 0.0% $41.3 $0.4 0.9%
Reversions $96.5 $30.9 32.0% 0.0% $65.8 $21.8 33.1%
All other revenue sources $576.6 0.0%
$564.0
0.0%
GRAND TOTAL REVENUES $6,040.5 $2,118.8 35.1% $0.3 0.0% $5,708.6 $1,828.4 32.0%
8. Since the oil and gas producing industry supports 35.1% of the State General Fund, this same percentage is the level of support by the OGAS
industry is attributable to public school and higher education funding in the county. The table below for FY 2014 contains more detail for char-
ter schools in the county. The similar chart for FY 2013 is also included below.
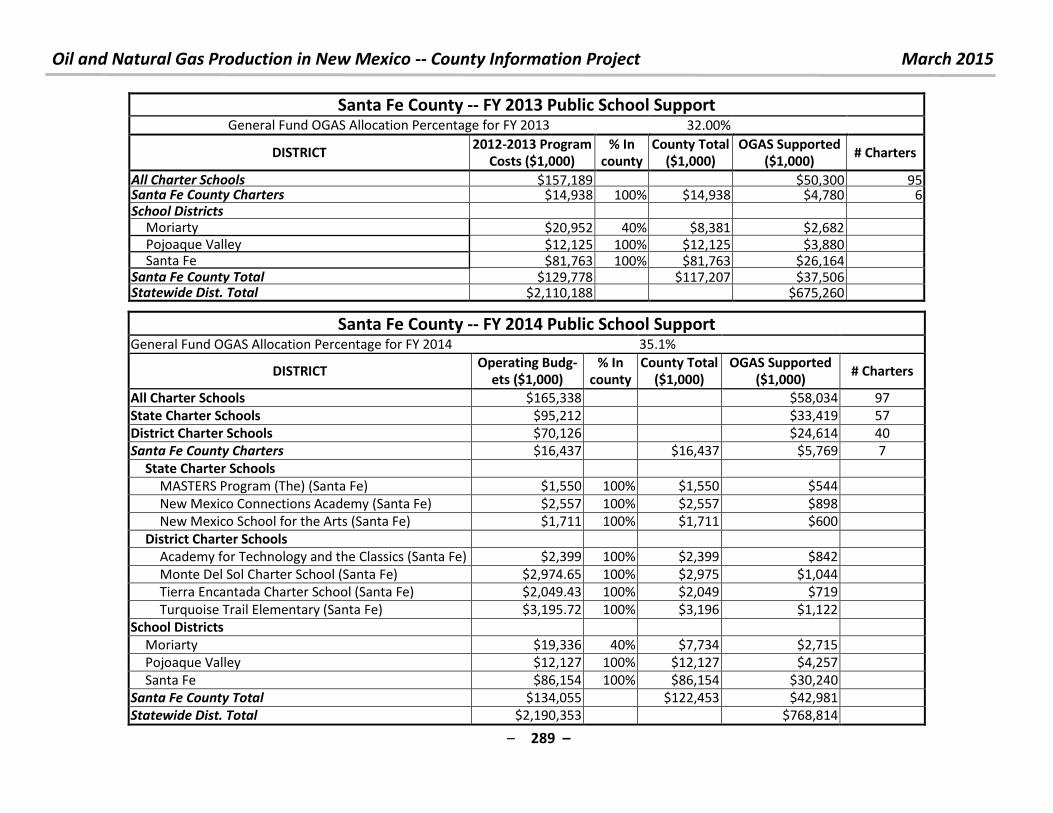
Oil and Natural Gas Production in New Mexico -- County Information Project March 2015
– 289 –
Santa Fe County -- FY 2013 Public School Support General Fund OGAS Allocation Percentage for FY 2013 32.00%
DISTRICT 2012-2013 Program
Costs ($1,000) % In
county County Total
($1,000) OGAS Supported
($1,000) # Charters
All Charter Schools $157,189
$50,300 95 Santa Fe County Charters $14,938 100% $14,938 $4,780 6 School Districts
Moriarty $20,952 40% $8,381 $2,682 Pojoaque Valley $12,125 100% $12,125 $3,880 Santa Fe $81,763 100% $81,763 $26,164
Santa Fe County Total $129,778 $117,207 $37,506 Statewide Dist. Total $2,110,188 $675,260
Santa Fe County -- FY 2014 Public School Support General Fund OGAS Allocation Percentage for FY 2014 35.1%
DISTRICT Operating Budg-
ets ($1,000) % In
county County Total
($1,000) OGAS Supported
($1,000) # Charters
All Charter Schools $165,338 $58,034 97
State Charter Schools $95,212 $33,419 57
District Charter Schools $70,126 $24,614 40
Santa Fe County Charters $16,437 $16,437 $5,769 7
State Charter Schools
MASTERS Program (The) (Santa Fe) $1,550 100% $1,550 $544
New Mexico Connections Academy (Santa Fe) $2,557 100% $2,557 $898
New Mexico School for the Arts (Santa Fe) $1,711 100% $1,711 $600
District Charter Schools
Academy for Technology and the Classics (Santa Fe) $2,399 100% $2,399 $842
Monte Del Sol Charter School (Santa Fe) $2,974.65 100% $2,975 $1,044
Tierra Encantada Charter School (Santa Fe) $2,049.43 100% $2,049 $719
Turquoise Trail Elementary (Santa Fe) $3,195.72 100% $3,196 $1,122
School Districts
Moriarty $19,336 40% $7,734 $2,715
Pojoaque Valley $12,127 100% $12,127 $4,257
Santa Fe $86,154 100% $86,154 $30,240
Santa Fe County Total $134,055 $122,453 $42,981
Statewide Dist. Total $2,190,353 $768,814
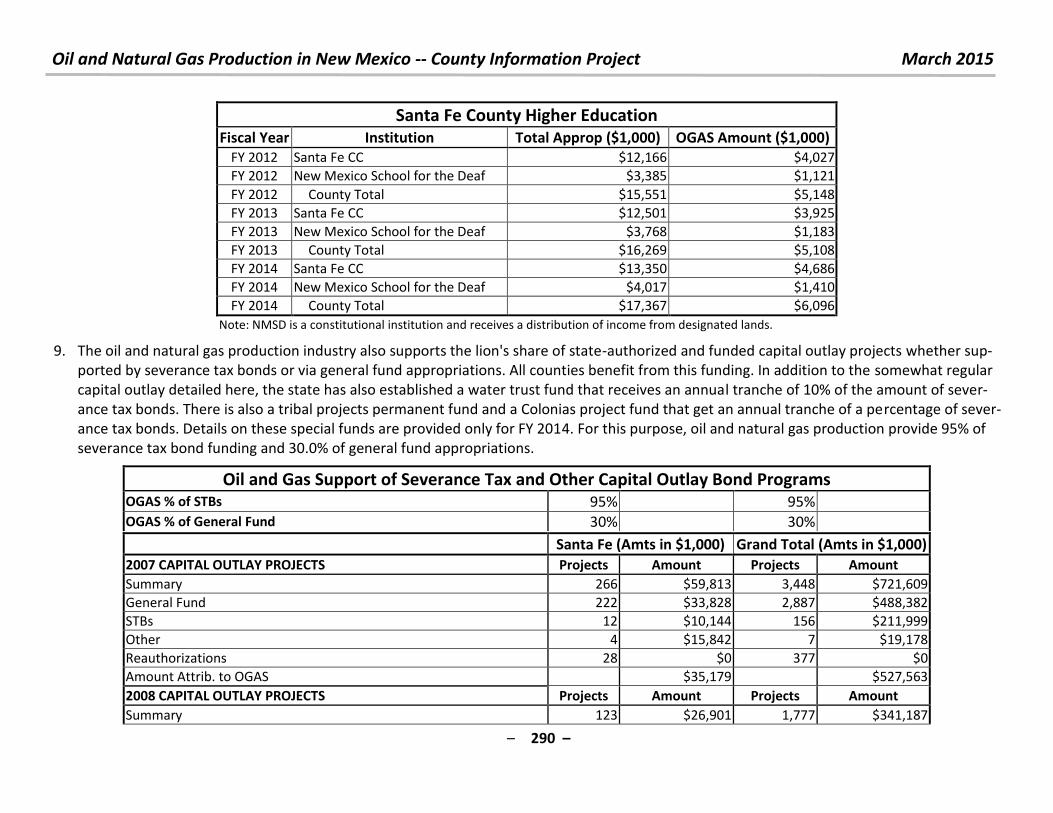
Oil and Natural Gas Production in New Mexico -- County Information Project March 2015
– 290 –
Santa Fe County Higher Education
Fiscal Year Institution Total Approp ($1,000) OGAS Amount ($1,000)
FY 2012 Santa Fe CC $12,166 $4,027
FY 2012 New Mexico School for the Deaf $3,385 $1,121
FY 2012 County Total $15,551 $5,148
FY 2013 Santa Fe CC $12,501 $3,925
FY 2013 New Mexico School for the Deaf $3,768 $1,183
FY 2013 County Total $16,269 $5,108
FY 2014 Santa Fe CC $13,350 $4,686
FY 2014 New Mexico School for the Deaf $4,017 $1,410
FY 2014 County Total $17,367 $6,096
Note: NMSD is a constitutional institution and receives a distribution of income from designated lands.
9. The oil and natural gas production industry also supports the lion's share of state-authorized and funded capital outlay projects whether sup-
ported by severance tax bonds or via general fund appropriations. All counties benefit from this funding. In addition to the somewhat regular
capital outlay detailed here, the state has also established a water trust fund that receives an annual tranche of 10% of the amount of sever-
ance tax bonds. There is also a tribal projects permanent fund and a Colonias project fund that get an annual tranche of a percentage of sever-
ance tax bonds. Details on these special funds are provided only for FY 2014. For this purpose, oil and natural gas production provide 95% of
severance tax bond funding and 30.0% of general fund appropriations.
Oil and Gas Support of Severance Tax and Other Capital Outlay Bond Programs OGAS % of STBs 95% 95%
OGAS % of General Fund 30% 30% Santa Fe (Amts in $1,000) Grand Total (Amts in $1,000)
2007 CAPITAL OUTLAY PROJECTS Projects Amount Projects Amount
Summary 266 $59,813 3,448 $721,609
General Fund 222 $33,828 2,887 $488,382
STBs 12 $10,144 156 $211,999
Other 4 $15,842 7 $19,178
Reauthorizations 28 $0 377 $0
Amount Attrib. to OGAS $35,179 $527,563
2008 CAPITAL OUTLAY PROJECTS Projects Amount Projects Amount
Summary 123 $26,901 1,777 $341,187
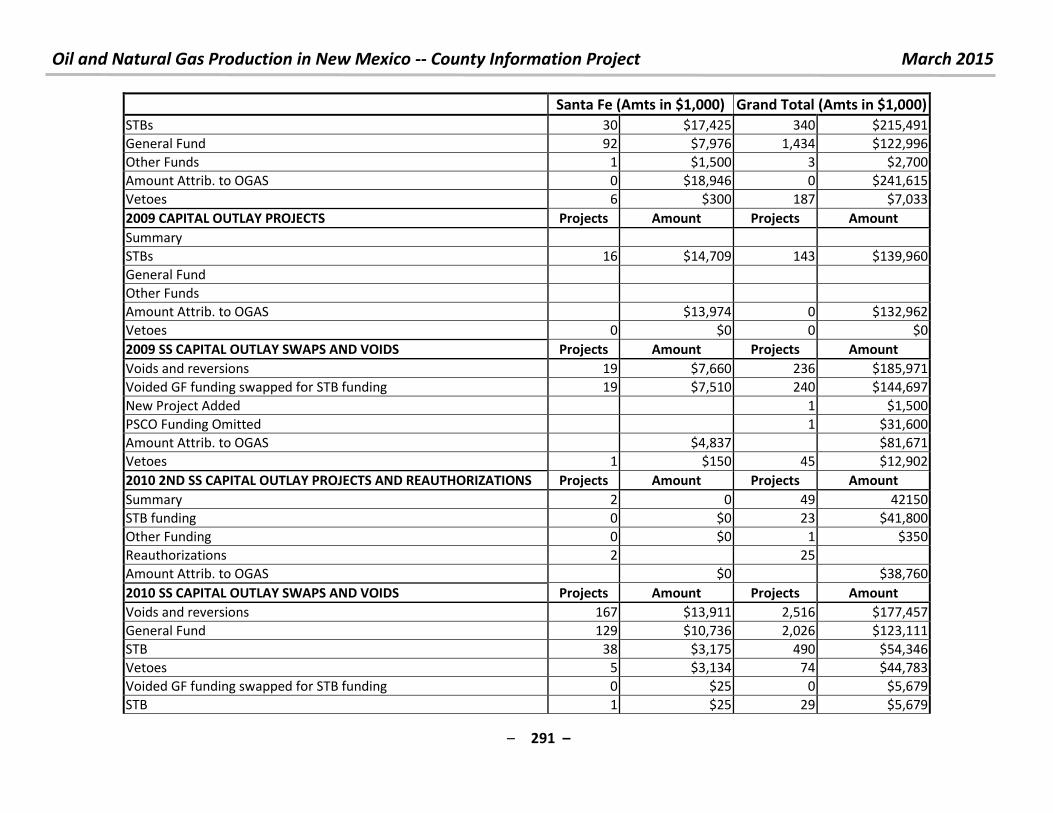
Oil and Natural Gas Production in New Mexico -- County Information Project March 2015
– 291 –
Santa Fe (Amts in $1,000) Grand Total (Amts in $1,000)
STBs 30 $17,425 340 $215,491
General Fund 92 $7,976 1,434 $122,996
Other Funds 1 $1,500 3 $2,700
Amount Attrib. to OGAS 0 $18,946 0 $241,615
Vetoes 6 $300 187 $7,033
2009 CAPITAL OUTLAY PROJECTS Projects Amount Projects Amount
Summary
STBs 16 $14,709 143 $139,960
General Fund
Other Funds
Amount Attrib. to OGAS $13,974 0 $132,962
Vetoes 0 $0 0 $0
2009 SS CAPITAL OUTLAY SWAPS AND VOIDS Projects Amount Projects Amount
Voids and reversions 19 $7,660 236 $185,971
Voided GF funding swapped for STB funding 19 $7,510 240 $144,697
New Project Added 1 $1,500
PSCO Funding Omitted 1 $31,600
Amount Attrib. to OGAS $4,837 $81,671
Vetoes 1 $150 45 $12,902
2010 2ND SS CAPITAL OUTLAY PROJECTS AND REAUTHORIZATIONS Projects Amount Projects Amount
Summary 2 0 49 42150
STB funding 0 $0 23 $41,800
Other Funding 0 $0 1 $350
Reauthorizations 2 25
Amount Attrib. to OGAS $0 $38,760
2010 SS CAPITAL OUTLAY SWAPS AND VOIDS Projects Amount Projects Amount
Voids and reversions 167 $13,911 2,516 $177,457
General Fund 129 $10,736 2,026 $123,111
STB 38 $3,175 490 $54,346
Vetoes 5 $3,134 74 $44,783
Voided GF funding swapped for STB funding 0 $25 0 $5,679
STB 1 $25 29 $5,679
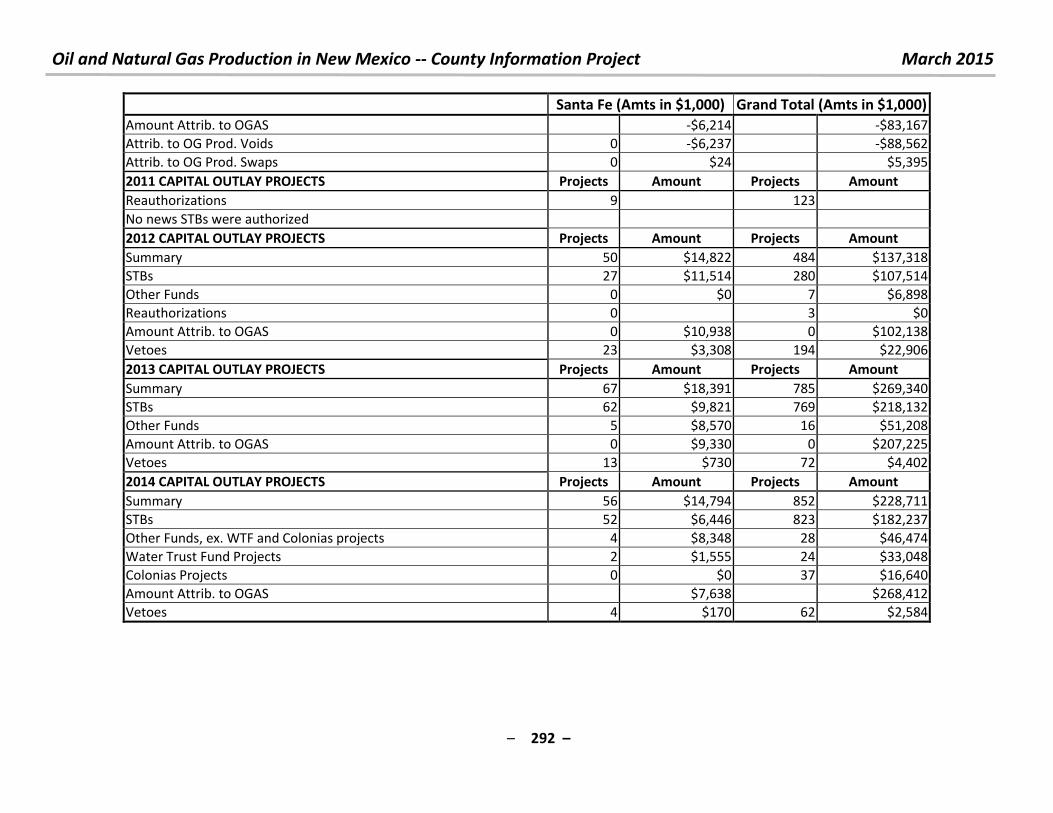
Oil and Natural Gas Production in New Mexico -- County Information Project March 2015
– 292 –
Santa Fe (Amts in $1,000) Grand Total (Amts in $1,000)
Amount Attrib. to OGAS -$6,214 -$83,167
Attrib. to OG Prod. Voids 0 -$6,237 -$88,562
Attrib. to OG Prod. Swaps 0 $24 $5,395
2011 CAPITAL OUTLAY PROJECTS Projects Amount Projects Amount
Reauthorizations 9 123
No news STBs were authorized
2012 CAPITAL OUTLAY PROJECTS Projects Amount Projects Amount
Summary 50 $14,822 484 $137,318
STBs 27 $11,514 280 $107,514
Other Funds 0 $0 7 $6,898
Reauthorizations 0 3 $0
Amount Attrib. to OGAS 0 $10,938 0 $102,138
Vetoes 23 $3,308 194 $22,906
2013 CAPITAL OUTLAY PROJECTS Projects Amount Projects Amount
Summary 67 $18,391 785 $269,340
STBs 62 $9,821 769 $218,132
Other Funds 5 $8,570 16 $51,208
Amount Attrib. to OGAS 0 $9,330 0 $207,225
Vetoes 13 $730 72 $4,402
2014 CAPITAL OUTLAY PROJECTS Projects Amount Projects Amount
Summary 56 $14,794 852 $228,711
STBs 52 $6,446 823 $182,237
Other Funds, ex. WTF and Colonias projects 4 $8,348 28 $46,474
Water Trust Fund Projects 2 $1,555 24 $33,048
Colonias Projects 0 $0 37 $16,640
Amount Attrib. to OGAS $7,638 $268,412
Vetoes 4 $170 62 $2,584
Oil and Natural Gas Production in New Mexico -- County Information Project March 2015
– 293 –
10. For questions, comments or criticisms of this work, contact:
Laird Graeser
505 424-9023
or
Richard L. Anklam, President & Executive Director, New Mexico Tax Research Institute
505-269-6791
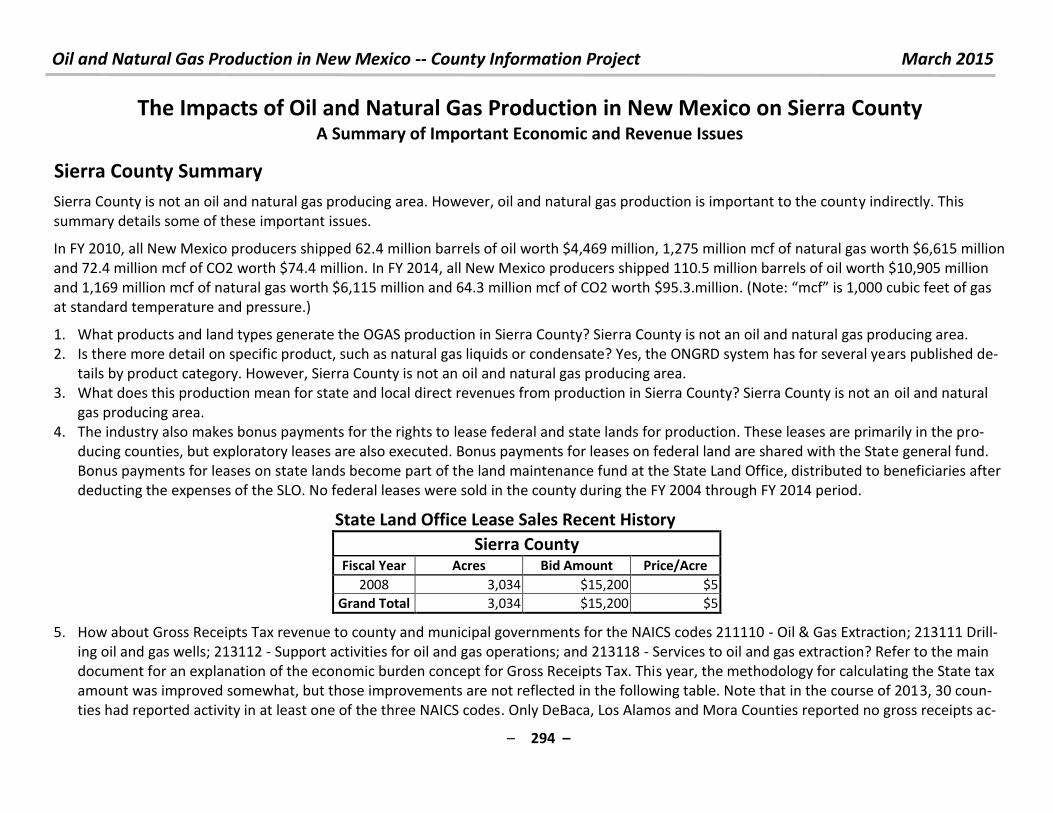
Oil and Natural Gas Production in New Mexico -- County Information Project March 2015
– 294 –
The Impacts of Oil and Natural Gas Production in New Mexico on Sierra County A Summary of Important Economic and Revenue Issues
Sierra County Summary
Sierra County is not an oil and natural gas producing area. However, oil and natural gas production is important to the county indirectly. This
summary details some of these important issues.
In FY 2010, all New Mexico producers shipped 62.4 million barrels of oil worth $4,469 million, 1,275 million mcf of natural gas worth $6,615 million
and 72.4 million mcf of CO2 worth $74.4 million. In FY 2014, all New Mexico producers shipped 110.5 million barrels of oil worth $10,905 million
and 1,169 million mcf of natural gas worth $6,115 million and 64.3 million mcf of CO2 worth $ . . illio . Note: f is , u i feet of gas at standard temperature and pressure.)
1. What products and land types generate the OGAS production in Sierra County? Sierra County is not an oil and natural gas producing area.
2. Is there more detail on specific product, such as natural gas liquids or condensate? Yes, the ONGRD system has for several years published de-
tails by product category. However, Sierra County is not an oil and natural gas producing area.
3. What does this production mean for state and local direct revenues from production in Sierra County? Sierra County is not an oil and natural
gas producing area.
4. The industry also makes bonus payments for the rights to lease federal and state lands for production. These leases are primarily in the pro-
ducing counties, but exploratory leases are also executed. Bonus payments for leases on federal land are shared with the State general fund.
Bonus payments for leases on state lands become part of the land maintenance fund at the State Land Office, distributed to beneficiaries after
deducting the expenses of the SLO. No federal leases were sold in the county during the FY 2004 through FY 2014 period.
State Land Office Lease Sales Recent History
Sierra County Fiscal Year Acres Bid Amount Price/Acre
2008 3,034 $15,200 $5
Grand Total 3,034 $15,200 $5
5. How about Gross Receipts Tax revenue to county and municipal governments for the NAICS codes 211110 - Oil & Gas Extraction; 213111 Drill-
ing oil and gas wells; 213112 - Support activities for oil and gas operations; and 213118 - Services to oil and gas extraction? Refer to the main
document for an explanation of the economic burden concept for Gross Receipts Tax. This year, the methodology for calculating the State tax
amount was improved somewhat, but those improvements are not reflected in the following table. Note that in the course of 2013, 30 coun-
ties had reported activity in at least one of the three NAICS codes. Only DeBaca, Los Alamos and Mora Counties reported no gross receipts ac-
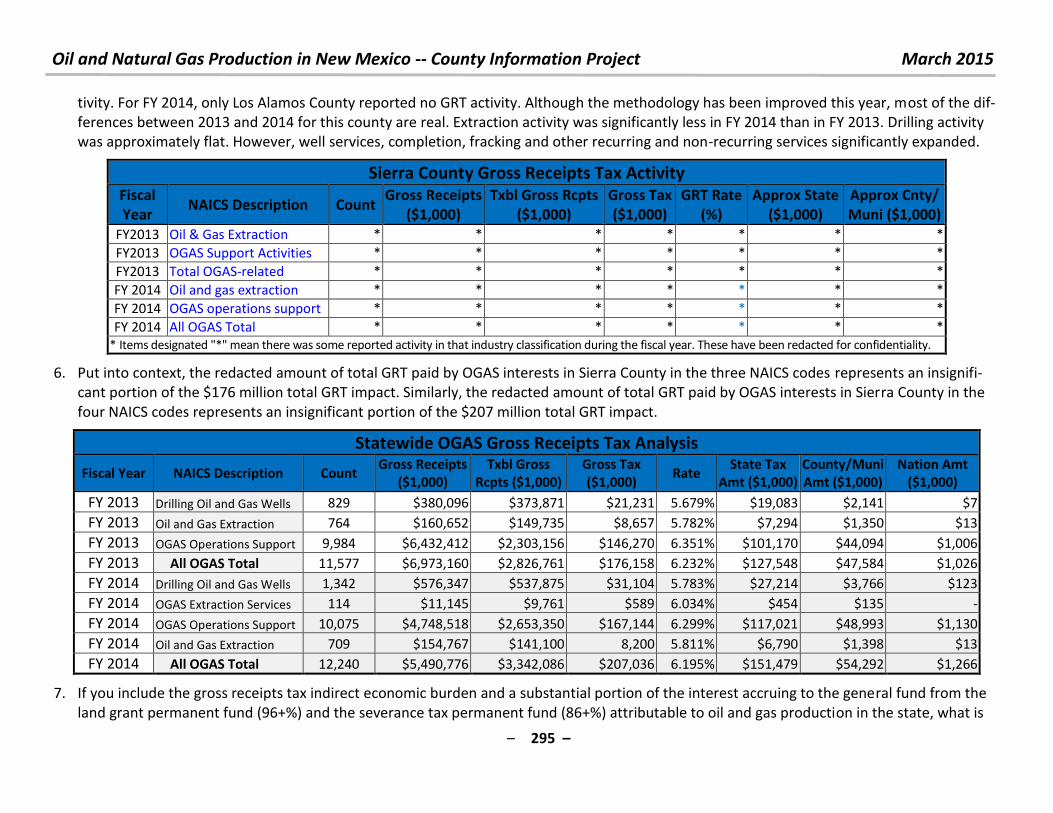
Oil and Natural Gas Production in New Mexico -- County Information Project March 2015
– 295 –
tivity. For FY 2014, only Los Alamos County reported no GRT activity. Although the methodology has been improved this year, most of the dif-
ferences between 2013 and 2014 for this county are real. Extraction activity was significantly less in FY 2014 than in FY 2013. Drilling activity
was approximately flat. However, well services, completion, fracking and other recurring and non-recurring services significantly expanded.
Sierra County Gross Receipts Tax Activity Fiscal
Year NAICS Description Count
Gross Receipts
($1,000)
Txbl Gross Rcpts
($1,000)
Gross Tax
($1,000)
GRT Rate
(%)
Approx State
($1,000)
Approx Cnty/
Muni ($1,000)
FY2013 Oil & Gas Extraction * * * * * * *
FY2013 OGAS Support Activities * * * * * * *
FY2013 Total OGAS-related * * * * * * *
FY 2014 Oil and gas extraction * * * * * * *
FY 2014 OGAS operations support * * * * * * *
FY 2014 All OGAS Total * * * * * * *
* Items designated "*" mean there was some reported activity in that industry classification during the fiscal year. These have been redacted for confidentiality.
6. Put into context, the redacted amount of total GRT paid by OGAS interests in Sierra County in the three NAICS codes represents an insignifi-
cant portion of the $176 million total GRT impact. Similarly, the redacted amount of total GRT paid by OGAS interests in Sierra County in the
four NAICS codes represents an insignificant portion of the $207 million total GRT impact.
Statewide OGAS Gross Receipts Tax Analysis
Fiscal Year NAICS Description Count Gross Receipts
($1,000)
Txbl Gross
Rcpts ($1,000)
Gross Tax
($1,000) Rate
State Tax
Amt ($1,000)
County/Muni
Amt ($1,000)
Nation Amt
($1,000)
FY 2013 Drilling Oil and Gas Wells 829 $380,096 $373,871 $21,231 5.679% $19,083 $2,141 $7
FY 2013 Oil and Gas Extraction 764 $160,652 $149,735 $8,657 5.782% $7,294 $1,350 $13
FY 2013 OGAS Operations Support 9,984 $6,432,412 $2,303,156 $146,270 6.351% $101,170 $44,094 $1,006
FY 2013 All OGAS Total 11,577 $6,973,160 $2,826,761 $176,158 6.232% $127,548 $47,584 $1,026
FY 2014 Drilling Oil and Gas Wells 1,342 $576,347 $537,875 $31,104 5.783% $27,214 $3,766 $123
FY 2014 OGAS Extraction Services 114 $11,145 $9,761 $589 6.034% $454 $135 -
FY 2014 OGAS Operations Support 10,075 $4,748,518 $2,653,350 $167,144 6.299% $117,021 $48,993 $1,130
FY 2014 Oil and Gas Extraction 709 $154,767 $141,100 8,200 5.811% $6,790 $1,398 $13
FY 2014 All OGAS Total 12,240 $5,490,776 $3,342,086 $207,036 6.195% $151,479 $54,292 $1,266
7. If you include the gross receipts tax indirect economic burden and a substantial portion of the interest accruing to the general fund from the
land grant permanent fund (96+%) and the severance tax permanent fund (86+%) attributable to oil and gas production in the state, what is
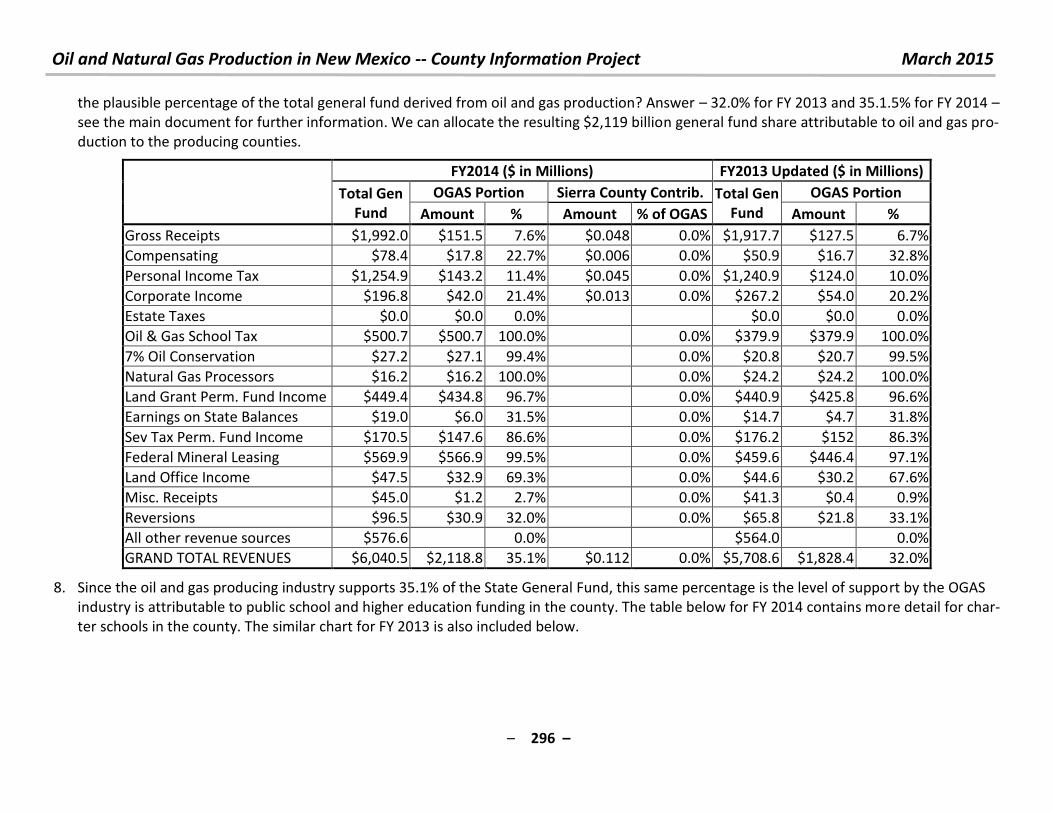
Oil and Natural Gas Production in New Mexico -- County Information Project March 2015
– 296 –
the plausible percentage of the total general fund derived from oil and gas production? Answer – 32.0% for FY 2013 and 35.1.5% for FY 2014 –
see the main document for further information. We can allocate the resulting $2,119 billion general fund share attributable to oil and gas pro-
duction to the producing counties.
FY2014 ($ in Millions) FY2013 Updated ($ in Millions)
Total Gen
Fund
OGAS Portion Sierra County Contrib. Total Gen
Fund
OGAS Portion
Amount % Amount % of OGAS Amount %
Gross Receipts $1,992.0 $151.5 7.6% $0.048 0.0% $1,917.7 $127.5 6.7%
Compensating $78.4 $17.8 22.7% $0.006 0.0% $50.9 $16.7 32.8%
Personal Income Tax $1,254.9 $143.2 11.4% $0.045 0.0% $1,240.9 $124.0 10.0%
Corporate Income $196.8 $42.0 21.4% $0.013 0.0% $267.2 $54.0 20.2%
Estate Taxes $0.0 $0.0 0.0% $0.0 $0.0 0.0%
Oil & Gas School Tax $500.7 $500.7 100.0% 0.0% $379.9 $379.9 100.0%
7% Oil Conservation $27.2 $27.1 99.4% 0.0% $20.8 $20.7 99.5%
Natural Gas Processors $16.2 $16.2 100.0% 0.0% $24.2 $24.2 100.0%
Land Grant Perm. Fund Income $449.4 $434.8 96.7% 0.0% $440.9 $425.8 96.6%
Earnings on State Balances $19.0 $6.0 31.5% 0.0% $14.7 $4.7 31.8%
Sev Tax Perm. Fund Income $170.5 $147.6 86.6% 0.0% $176.2 $152 86.3%
Federal Mineral Leasing $569.9 $566.9 99.5% 0.0% $459.6 $446.4 97.1%
Land Office Income $47.5 $32.9 69.3% 0.0% $44.6 $30.2 67.6%
Misc. Receipts $45.0 $1.2 2.7% 0.0% $41.3 $0.4 0.9%
Reversions $96.5 $30.9 32.0% 0.0% $65.8 $21.8 33.1%
All other revenue sources $576.6 0.0% $564.0
0.0%
GRAND TOTAL REVENUES $6,040.5 $2,118.8 35.1% $0.112 0.0% $5,708.6 $1,828.4 32.0%
8. Since the oil and gas producing industry supports 35.1% of the State General Fund, this same percentage is the level of support by the OGAS
industry is attributable to public school and higher education funding in the county. The table below for FY 2014 contains more detail for char-
ter schools in the county. The similar chart for FY 2013 is also included below.
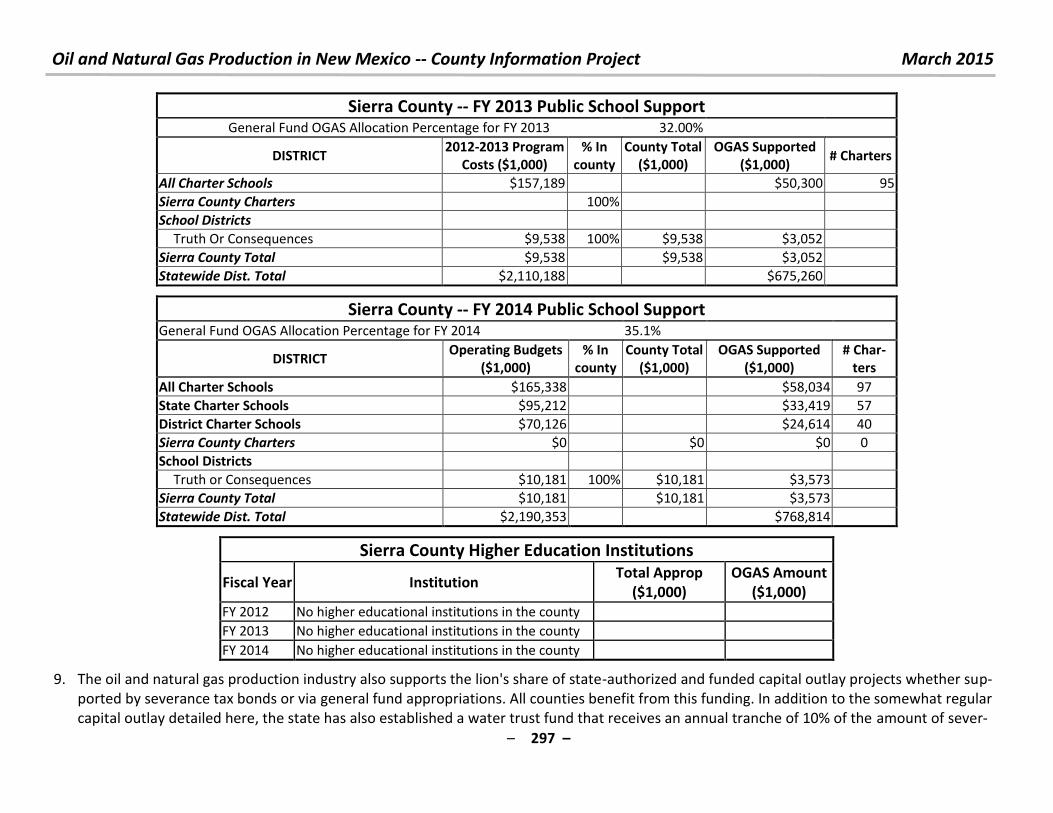
Oil and Natural Gas Production in New Mexico -- County Information Project March 2015
– 297 –
Sierra County -- FY 2013 Public School Support General Fund OGAS Allocation Percentage for FY 2013 32.00%
DISTRICT 2012-2013 Program
Costs ($1,000)
% In
county
County Total
($1,000)
OGAS Supported
($1,000) # Charters
All Charter Schools $157,189 $50,300 95
Sierra County Charters 100%
School Districts
Truth Or Consequences $9,538 100% $9,538 $3,052
Sierra County Total $9,538 $9,538 $3,052
Statewide Dist. Total $2,110,188 $675,260
Sierra County -- FY 2014 Public School Support General Fund OGAS Allocation Percentage for FY 2014 35.1%
DISTRICT Operating Budgets
($1,000)
% In
county
County Total
($1,000)
OGAS Supported
($1,000)
# Char-
ters
All Charter Schools $165,338 $58,034 97
State Charter Schools $95,212 $33,419 57
District Charter Schools $70,126 $24,614 40
Sierra County Charters $0 $0 $0 0
School Districts
Truth or Consequences $10,181 100% $10,181 $3,573
Sierra County Total $10,181 $10,181 $3,573
Statewide Dist. Total $2,190,353 $768,814
Sierra County Higher Education Institutions
Fiscal Year Institution Total Approp
($1,000)
OGAS Amount
($1,000)
FY 2012 No higher educational institutions in the county
FY 2013 No higher educational institutions in the county
FY 2014 No higher educational institutions in the county
9. The oil and natural gas production industry also supports the lion's share of state-authorized and funded capital outlay projects whether sup-
ported by severance tax bonds or via general fund appropriations. All counties benefit from this funding. In addition to the somewhat regular
capital outlay detailed here, the state has also established a water trust fund that receives an annual tranche of 10% of the amount of sever-
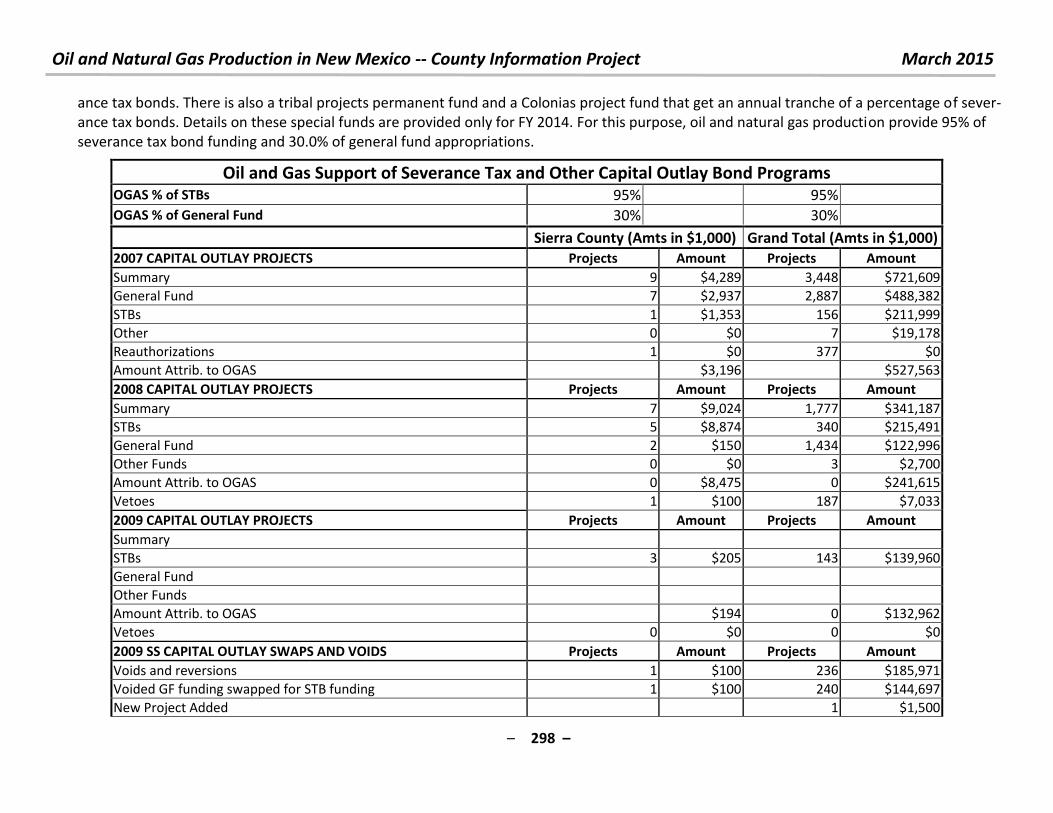
Oil and Natural Gas Production in New Mexico -- County Information Project March 2015
– 298 –
ance tax bonds. There is also a tribal projects permanent fund and a Colonias project fund that get an annual tranche of a percentage of sever-
ance tax bonds. Details on these special funds are provided only for FY 2014. For this purpose, oil and natural gas production provide 95% of
severance tax bond funding and 30.0% of general fund appropriations.
Oil and Gas Support of Severance Tax and Other Capital Outlay Bond Programs OGAS % of STBs 95% 95%
OGAS % of General Fund 30% 30% Sierra County (Amts in $1,000) Grand Total (Amts in $1,000)
2007 CAPITAL OUTLAY PROJECTS Projects Amount Projects Amount
Summary 9 $4,289 3,448 $721,609
General Fund 7 $2,937 2,887 $488,382
STBs 1 $1,353 156 $211,999
Other 0 $0 7 $19,178
Reauthorizations 1 $0 377 $0
Amount Attrib. to OGAS $3,196 $527,563
2008 CAPITAL OUTLAY PROJECTS Projects Amount Projects Amount
Summary 7 $9,024 1,777 $341,187
STBs 5 $8,874 340 $215,491
General Fund 2 $150 1,434 $122,996
Other Funds 0 $0 3 $2,700
Amount Attrib. to OGAS 0 $8,475 0 $241,615
Vetoes 1 $100 187 $7,033
2009 CAPITAL OUTLAY PROJECTS Projects Amount Projects Amount
Summary
STBs 3 $205 143 $139,960
General Fund
Other Funds
Amount Attrib. to OGAS $194 0 $132,962
Vetoes 0 $0 0 $0
2009 SS CAPITAL OUTLAY SWAPS AND VOIDS Projects Amount Projects Amount
Voids and reversions 1 $100 236 $185,971
Voided GF funding swapped for STB funding 1 $100 240 $144,697
New Project Added 1 $1,500
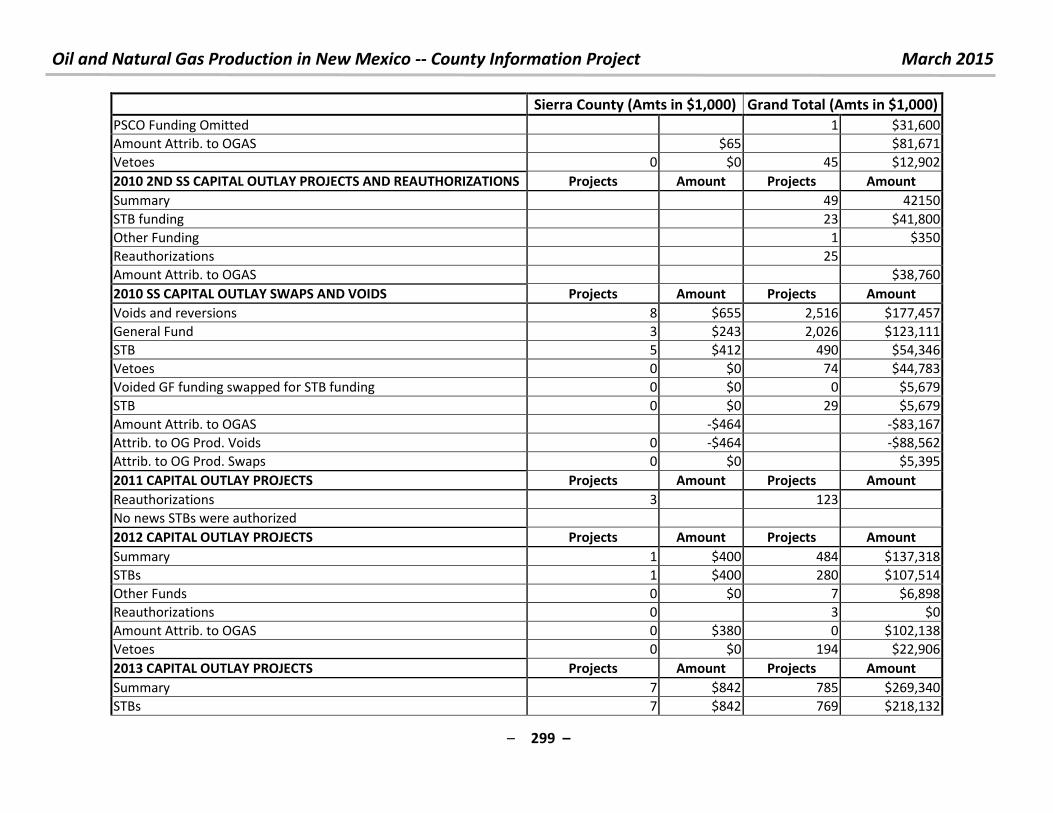
Oil and Natural Gas Production in New Mexico -- County Information Project March 2015
– 299 –
Sierra County (Amts in $1,000) Grand Total (Amts in $1,000)
PSCO Funding Omitted 1 $31,600
Amount Attrib. to OGAS $65 $81,671
Vetoes 0 $0 45 $12,902
2010 2ND SS CAPITAL OUTLAY PROJECTS AND REAUTHORIZATIONS Projects Amount Projects Amount
Summary 49 42150
STB funding 23 $41,800
Other Funding 1 $350
Reauthorizations 25
Amount Attrib. to OGAS $38,760
2010 SS CAPITAL OUTLAY SWAPS AND VOIDS Projects Amount Projects Amount
Voids and reversions 8 $655 2,516 $177,457
General Fund 3 $243 2,026 $123,111
STB 5 $412 490 $54,346
Vetoes 0 $0 74 $44,783
Voided GF funding swapped for STB funding 0 $0 0 $5,679
STB 0 $0 29 $5,679
Amount Attrib. to OGAS -$464 -$83,167
Attrib. to OG Prod. Voids 0 -$464 -$88,562
Attrib. to OG Prod. Swaps 0 $0 $5,395
2011 CAPITAL OUTLAY PROJECTS Projects Amount Projects Amount
Reauthorizations 3 123
No news STBs were authorized
2012 CAPITAL OUTLAY PROJECTS Projects Amount Projects Amount
Summary 1 $400 484 $137,318
STBs 1 $400 280 $107,514
Other Funds 0 $0 7 $6,898
Reauthorizations 0 3 $0
Amount Attrib. to OGAS 0 $380 0 $102,138
Vetoes 0 $0 194 $22,906
2013 CAPITAL OUTLAY PROJECTS Projects Amount Projects Amount
Summary 7 $842 785 $269,340
STBs 7 $842 769 $218,132
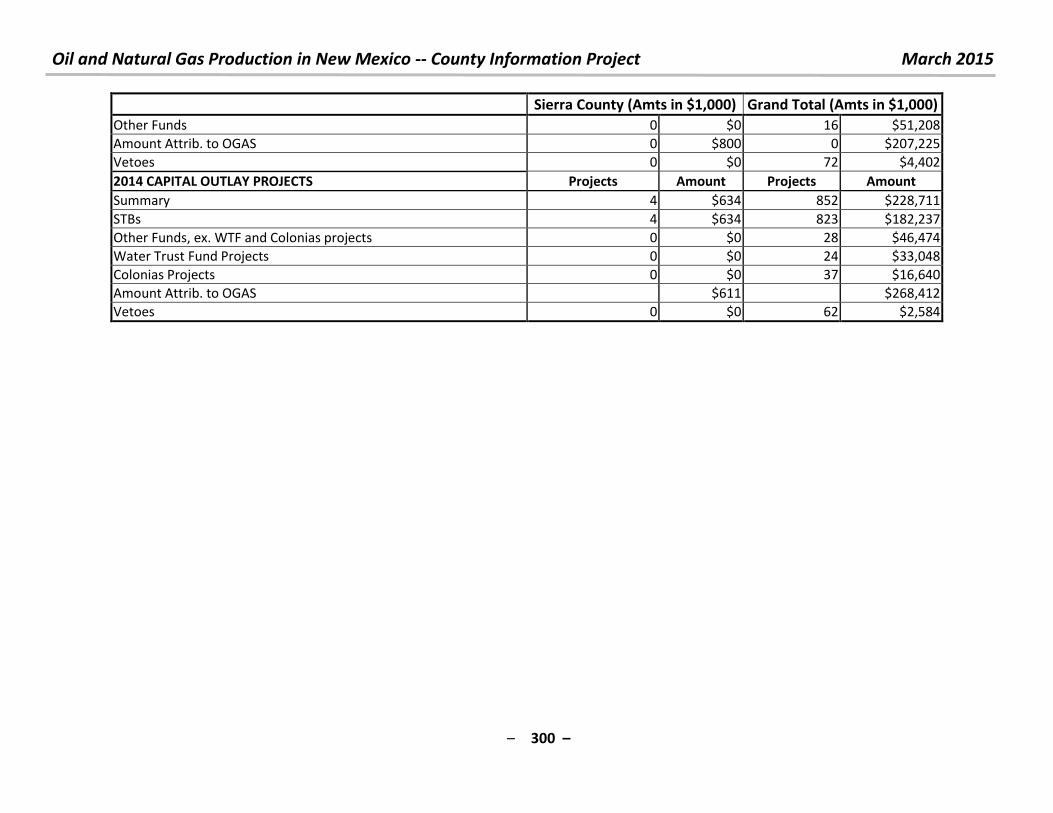
Oil and Natural Gas Production in New Mexico -- County Information Project March 2015
– 300 –
Sierra County (Amts in $1,000) Grand Total (Amts in $1,000)
Other Funds 0 $0 16 $51,208
Amount Attrib. to OGAS 0 $800 0 $207,225
Vetoes 0 $0 72 $4,402
2014 CAPITAL OUTLAY PROJECTS Projects Amount Projects Amount
Summary 4 $634 852 $228,711
STBs 4 $634 823 $182,237
Other Funds, ex. WTF and Colonias projects 0 $0 28 $46,474
Water Trust Fund Projects 0 $0 24 $33,048
Colonias Projects 0 $0 37 $16,640
Amount Attrib. to OGAS $611 $268,412
Vetoes 0 $0 62 $2,584

Oil and Natural Gas Production in New Mexico -- County Information Project March 2015
– 301 –
10. For questions, comments or criticisms of this work, contact:
Laird Graeser
505 424-9023
or
Richard L. Anklam, President & Executive Director, New Mexico Tax Research Institute
505-269-6791
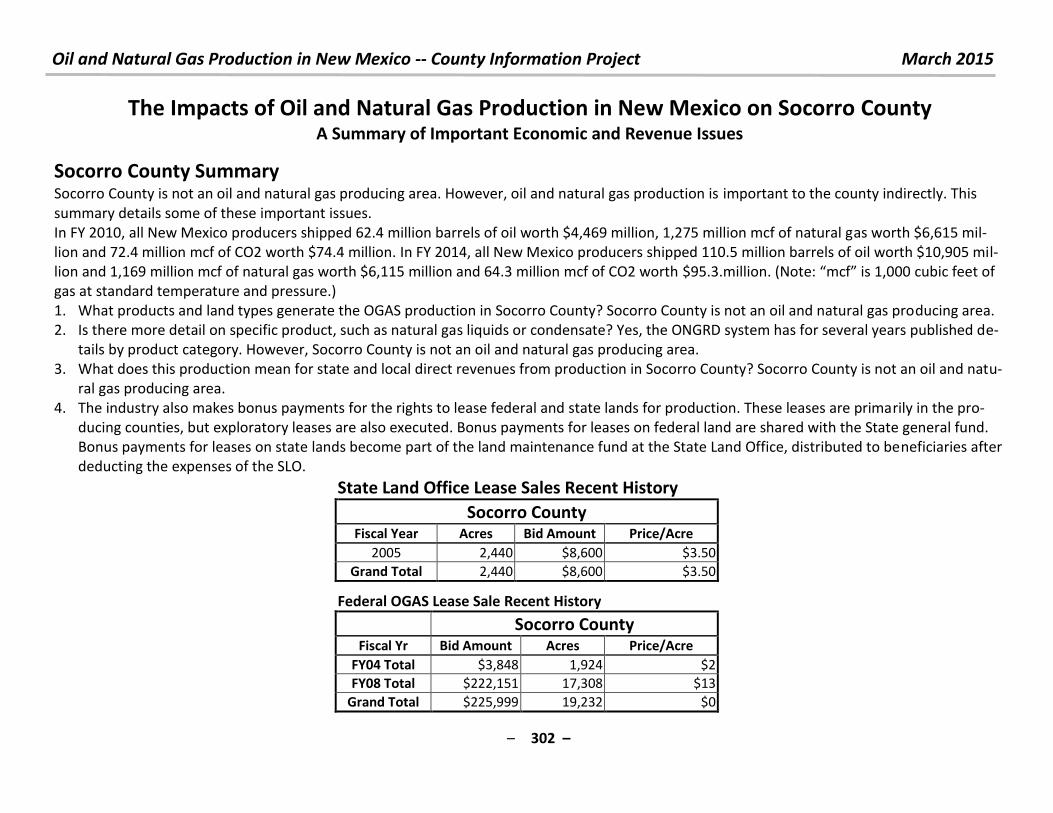
Oil and Natural Gas Production in New Mexico -- County Information Project March 2015
– 302 –
The Impacts of Oil and Natural Gas Production in New Mexico on Socorro County A Summary of Important Economic and Revenue Issues
Socorro County Summary
Socorro County is not an oil and natural gas producing area. However, oil and natural gas production is important to the county indirectly. This
summary details some of these important issues.
In FY 2010, all New Mexico producers shipped 62.4 million barrels of oil worth $4,469 million, 1,275 million mcf of natural gas worth $6,615 mil-
lion and 72.4 million mcf of CO2 worth $74.4 million. In FY 2014, all New Mexico producers shipped 110.5 million barrels of oil worth $10,905 mil-
lion and 1,169 million mcf of natural gas worth $6,115 million and 64.3 million mcf of CO2 worth $ . . illio . Note: f is , cubic feet of
gas at standard temperature and pressure.)
1. What products and land types generate the OGAS production in Socorro County? Socorro County is not an oil and natural gas producing area.
2. Is there more detail on specific product, such as natural gas liquids or condensate? Yes, the ONGRD system has for several years published de-
tails by product category. However, Socorro County is not an oil and natural gas producing area.
3. What does this production mean for state and local direct revenues from production in Socorro County? Socorro County is not an oil and natu-
ral gas producing area.
4. The industry also makes bonus payments for the rights to lease federal and state lands for production. These leases are primarily in the pro-
ducing counties, but exploratory leases are also executed. Bonus payments for leases on federal land are shared with the State general fund.
Bonus payments for leases on state lands become part of the land maintenance fund at the State Land Office, distributed to beneficiaries after
deducting the expenses of the SLO.
State Land Office Lease Sales Recent History
Socorro County Fiscal Year Acres Bid Amount Price/Acre
2005 2,440 $8,600 $3.50
Grand Total 2,440 $8,600 $3.50
Federal OGAS Lease Sale Recent History
Socorro County Fiscal Yr Bid Amount Acres Price/Acre
FY04 Total $3,848 1,924 $2
FY08 Total $222,151 17,308 $13
Grand Total $225,999 19,232 $0
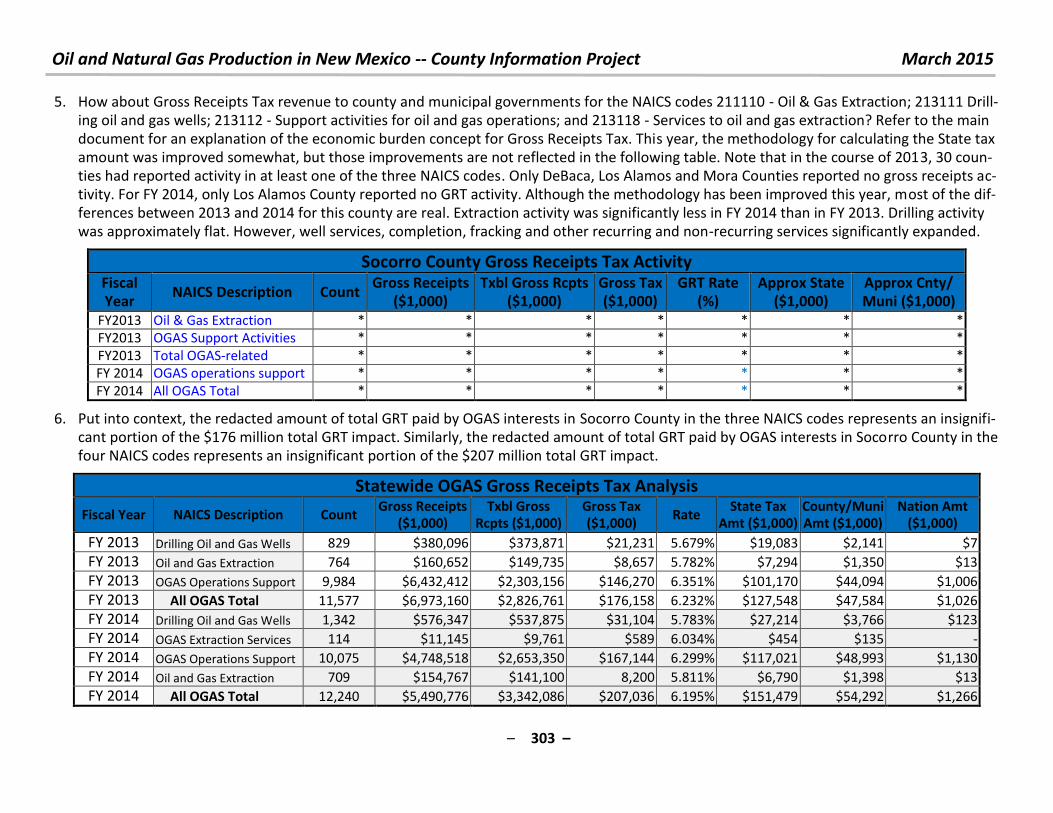
Oil and Natural Gas Production in New Mexico -- County Information Project March 2015
– 303 –
5. How about Gross Receipts Tax revenue to county and municipal governments for the NAICS codes 211110 - Oil & Gas Extraction; 213111 Drill-
ing oil and gas wells; 213112 - Support activities for oil and gas operations; and 213118 - Services to oil and gas extraction? Refer to the main
document for an explanation of the economic burden concept for Gross Receipts Tax. This year, the methodology for calculating the State tax
amount was improved somewhat, but those improvements are not reflected in the following table. Note that in the course of 2013, 30 coun-
ties had reported activity in at least one of the three NAICS codes. Only DeBaca, Los Alamos and Mora Counties reported no gross receipts ac-
tivity. For FY 2014, only Los Alamos County reported no GRT activity. Although the methodology has been improved this year, most of the dif-
ferences between 2013 and 2014 for this county are real. Extraction activity was significantly less in FY 2014 than in FY 2013. Drilling activity
was approximately flat. However, well services, completion, fracking and other recurring and non-recurring services significantly expanded.
Socorro County Gross Receipts Tax Activity Fiscal
Year NAICS Description Count
Gross Receipts
($1,000)
Txbl Gross Rcpts
($1,000)
Gross Tax
($1,000)
GRT Rate
(%)
Approx State
($1,000)
Approx Cnty/
Muni ($1,000)
FY2013 Oil & Gas Extraction * * * * * * *
FY2013 OGAS Support Activities * * * * * * *
FY2013 Total OGAS-related * * * * * * *
FY 2014 OGAS operations support * * * * * * *
FY 2014 All OGAS Total * * * * * * *
6. Put into context, the redacted amount of total GRT paid by OGAS interests in Socorro County in the three NAICS codes represents an insignifi-
cant portion of the $176 million total GRT impact. Similarly, the redacted amount of total GRT paid by OGAS interests in Socorro County in the
four NAICS codes represents an insignificant portion of the $207 million total GRT impact.
Statewide OGAS Gross Receipts Tax Analysis
Fiscal Year NAICS Description Count Gross Receipts
($1,000) Txbl Gross
Rcpts ($1,000) Gross Tax ($1,000)
Rate State Tax
Amt ($1,000) County/Muni Amt ($1,000)
Nation Amt ($1,000)
FY 2013 Drilling Oil and Gas Wells 829 $380,096 $373,871 $21,231 5.679% $19,083 $2,141 $7
FY 2013 Oil and Gas Extraction 764 $160,652 $149,735 $8,657 5.782% $7,294 $1,350 $13
FY 2013 OGAS Operations Support 9,984 $6,432,412 $2,303,156 $146,270 6.351% $101,170 $44,094 $1,006
FY 2013 All OGAS Total 11,577 $6,973,160 $2,826,761 $176,158 6.232% $127,548 $47,584 $1,026
FY 2014 Drilling Oil and Gas Wells 1,342 $576,347 $537,875 $31,104 5.783% $27,214 $3,766 $123
FY 2014 OGAS Extraction Services 114 $11,145 $9,761 $589 6.034% $454 $135 -
FY 2014 OGAS Operations Support 10,075 $4,748,518 $2,653,350 $167,144 6.299% $117,021 $48,993 $1,130
FY 2014 Oil and Gas Extraction 709 $154,767 $141,100 8,200 5.811% $6,790 $1,398 $13
FY 2014 All OGAS Total 12,240 $5,490,776 $3,342,086 $207,036 6.195% $151,479 $54,292 $1,266
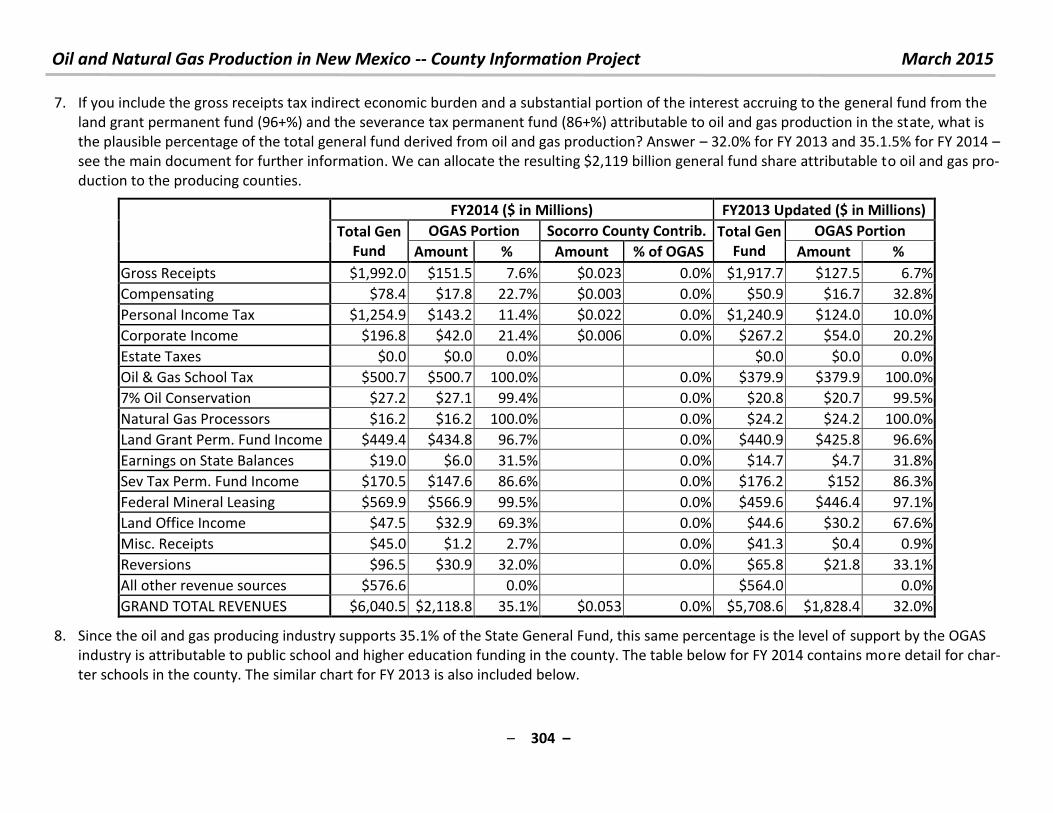
Oil and Natural Gas Production in New Mexico -- County Information Project March 2015
– 304 –
7. If you include the gross receipts tax indirect economic burden and a substantial portion of the interest accruing to the general fund from the
land grant permanent fund (96+%) and the severance tax permanent fund (86+%) attributable to oil and gas production in the state, what is
the plausible percentage of the total general fund derived from oil and gas production? Answer – 32.0% for FY 2013 and 35.1.5% for FY 2014 –
see the main document for further information. We can allocate the resulting $2,119 billion general fund share attributable to oil and gas pro-
duction to the producing counties.
FY2014 ($ in Millions) FY2013 Updated ($ in Millions)
Total Gen
Fund
OGAS Portion Socorro County Contrib. Total Gen
Fund
OGAS Portion
Amount % Amount % of OGAS Amount %
Gross Receipts $1,992.0 $151.5 7.6% $0.023 0.0% $1,917.7 $127.5 6.7%
Compensating $78.4 $17.8 22.7% $0.003 0.0% $50.9 $16.7 32.8%
Personal Income Tax $1,254.9 $143.2 11.4% $0.022 0.0% $1,240.9 $124.0 10.0%
Corporate Income $196.8 $42.0 21.4% $0.006 0.0% $267.2 $54.0 20.2%
Estate Taxes $0.0 $0.0 0.0% $0.0 $0.0 0.0%
Oil & Gas School Tax $500.7 $500.7 100.0% 0.0% $379.9 $379.9 100.0%
7% Oil Conservation $27.2 $27.1 99.4% 0.0% $20.8 $20.7 99.5%
Natural Gas Processors $16.2 $16.2 100.0% 0.0% $24.2 $24.2 100.0%
Land Grant Perm. Fund Income $449.4 $434.8 96.7% 0.0% $440.9 $425.8 96.6%
Earnings on State Balances $19.0 $6.0 31.5% 0.0% $14.7 $4.7 31.8%
Sev Tax Perm. Fund Income $170.5 $147.6 86.6% 0.0% $176.2 $152 86.3%
Federal Mineral Leasing $569.9 $566.9 99.5% 0.0% $459.6 $446.4 97.1%
Land Office Income $47.5 $32.9 69.3% 0.0% $44.6 $30.2 67.6%
Misc. Receipts $45.0 $1.2 2.7% 0.0% $41.3 $0.4 0.9%
Reversions $96.5 $30.9 32.0% 0.0% $65.8 $21.8 33.1%
All other revenue sources $576.6 0.0% $564.0
0.0%
GRAND TOTAL REVENUES $6,040.5 $2,118.8 35.1% $0.053 0.0% $5,708.6 $1,828.4 32.0%
8. Since the oil and gas producing industry supports 35.1% of the State General Fund, this same percentage is the level of support by the OGAS
industry is attributable to public school and higher education funding in the county. The table below for FY 2014 contains more detail for char-
ter schools in the county. The similar chart for FY 2013 is also included below.
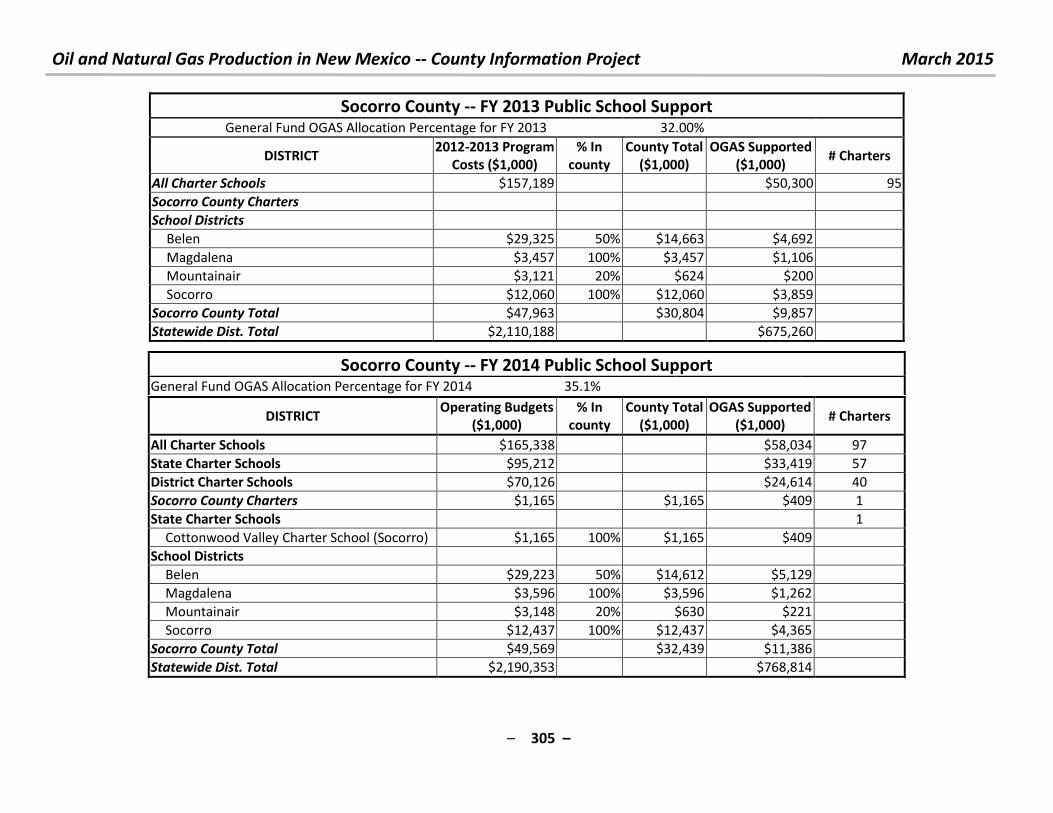
Oil and Natural Gas Production in New Mexico -- County Information Project March 2015
– 305 –
Socorro County -- FY 2013 Public School Support General Fund OGAS Allocation Percentage for FY 2013 32.00%
DISTRICT 2012-2013 Program
Costs ($1,000)
% In
county
County Total
($1,000)
OGAS Supported
($1,000) # Charters
All Charter Schools $157,189
$50,300 95
Socorro County Charters
School Districts
Belen $29,325 50% $14,663 $4,692
Magdalena $3,457 100% $3,457 $1,106
Mountainair $3,121 20% $624 $200
Socorro $12,060 100% $12,060 $3,859
Socorro County Total $47,963 $30,804 $9,857
Statewide Dist. Total $2,110,188 $675,260
Socorro County -- FY 2014 Public School Support General Fund OGAS Allocation Percentage for FY 2014 35.1%
DISTRICT Operating Budgets
($1,000)
% In
county
County Total
($1,000)
OGAS Supported
($1,000) # Charters
All Charter Schools $165,338 $58,034 97
State Charter Schools $95,212 $33,419 57
District Charter Schools $70,126 $24,614 40
Socorro County Charters $1,165 $1,165 $409 1
State Charter Schools 1
Cottonwood Valley Charter School (Socorro) $1,165 100% $1,165 $409
School Districts
Belen $29,223 50% $14,612 $5,129
Magdalena $3,596 100% $3,596 $1,262
Mountainair $3,148 20% $630 $221
Socorro $12,437 100% $12,437 $4,365
Socorro County Total $49,569 $32,439 $11,386
Statewide Dist. Total $2,190,353 $768,814
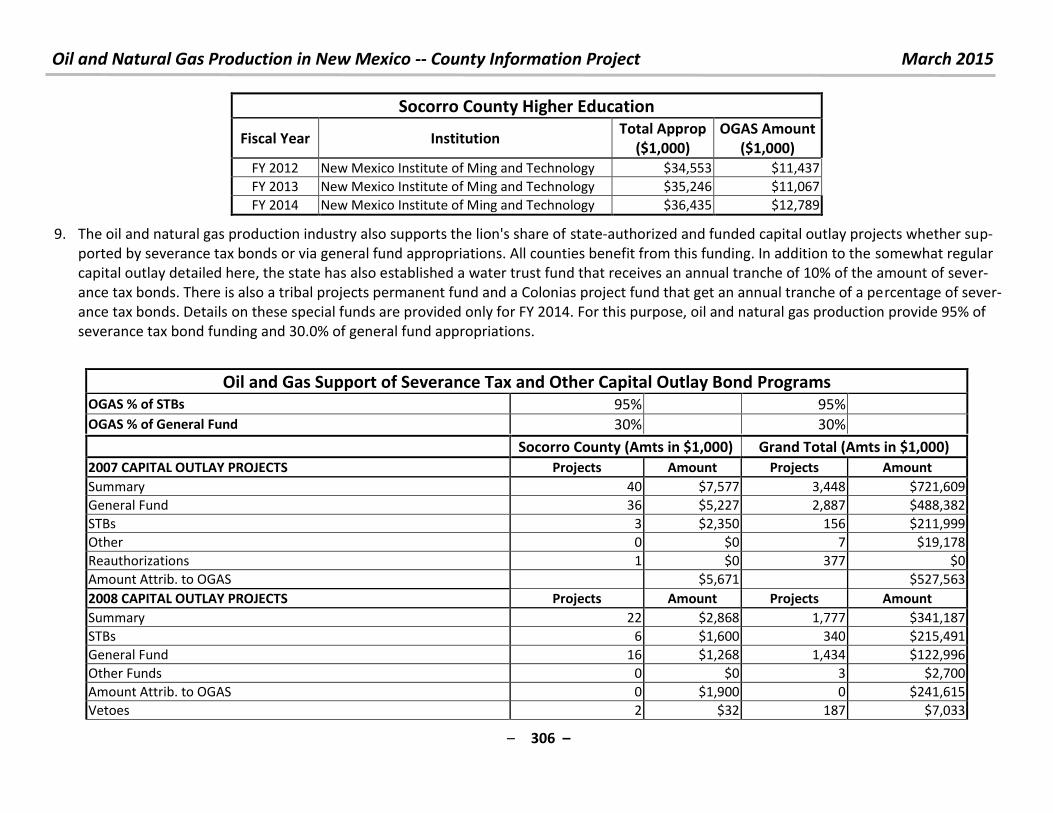
Oil and Natural Gas Production in New Mexico -- County Information Project March 2015
– 306 –
Socorro County Higher Education
Fiscal Year Institution Total Approp
($1,000)
OGAS Amount
($1,000)
FY 2012 New Mexico Institute of Ming and Technology $34,553 $11,437
FY 2013 New Mexico Institute of Ming and Technology $35,246 $11,067
FY 2014 New Mexico Institute of Ming and Technology $36,435 $12,789
9. The oil and natural gas production industry also supports the lion's share of state-authorized and funded capital outlay projects whether sup-
ported by severance tax bonds or via general fund appropriations. All counties benefit from this funding. In addition to the somewhat regular
capital outlay detailed here, the state has also established a water trust fund that receives an annual tranche of 10% of the amount of sever-
ance tax bonds. There is also a tribal projects permanent fund and a Colonias project fund that get an annual tranche of a percentage of sever-
ance tax bonds. Details on these special funds are provided only for FY 2014. For this purpose, oil and natural gas production provide 95% of
severance tax bond funding and 30.0% of general fund appropriations.
Oil and Gas Support of Severance Tax and Other Capital Outlay Bond Programs OGAS % of STBs 95% 95%
OGAS % of General Fund 30% 30%
Socorro County (Amts in $1,000) Grand Total (Amts in $1,000)
2007 CAPITAL OUTLAY PROJECTS Projects Amount Projects Amount
Summary 40 $7,577 3,448 $721,609
General Fund 36 $5,227 2,887 $488,382
STBs 3 $2,350 156 $211,999
Other 0 $0 7 $19,178
Reauthorizations 1 $0 377 $0
Amount Attrib. to OGAS $5,671 $527,563
2008 CAPITAL OUTLAY PROJECTS Projects Amount Projects Amount
Summary 22 $2,868 1,777 $341,187
STBs 6 $1,600 340 $215,491
General Fund 16 $1,268 1,434 $122,996
Other Funds 0 $0 3 $2,700
Amount Attrib. to OGAS 0 $1,900 0 $241,615
Vetoes 2 $32 187 $7,033
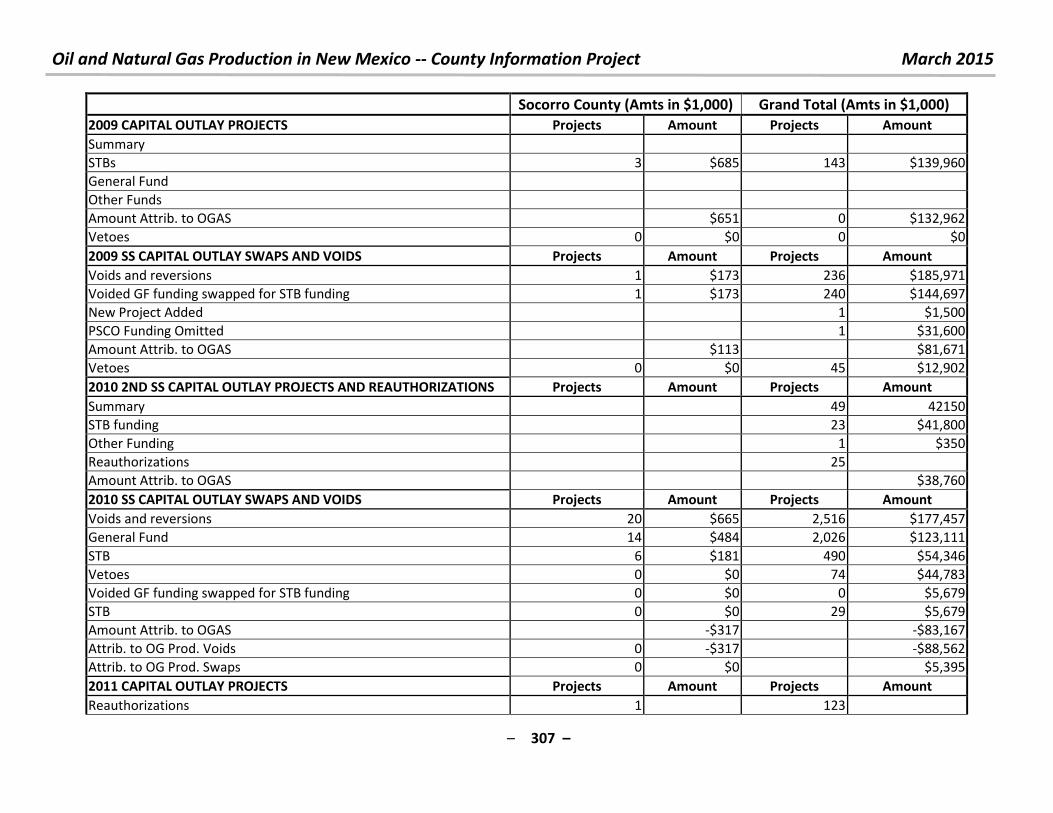
Oil and Natural Gas Production in New Mexico -- County Information Project March 2015
– 307 –
Socorro County (Amts in $1,000) Grand Total (Amts in $1,000)
2009 CAPITAL OUTLAY PROJECTS Projects Amount Projects Amount
Summary
STBs 3 $685 143 $139,960
General Fund
Other Funds
Amount Attrib. to OGAS $651 0 $132,962
Vetoes 0 $0 0 $0
2009 SS CAPITAL OUTLAY SWAPS AND VOIDS Projects Amount Projects Amount
Voids and reversions 1 $173 236 $185,971
Voided GF funding swapped for STB funding 1 $173 240 $144,697
New Project Added 1 $1,500
PSCO Funding Omitted 1 $31,600
Amount Attrib. to OGAS $113 $81,671
Vetoes 0 $0 45 $12,902
2010 2ND SS CAPITAL OUTLAY PROJECTS AND REAUTHORIZATIONS Projects Amount Projects Amount
Summary 49 42150
STB funding 23 $41,800
Other Funding 1 $350
Reauthorizations 25
Amount Attrib. to OGAS $38,760
2010 SS CAPITAL OUTLAY SWAPS AND VOIDS Projects Amount Projects Amount
Voids and reversions 20 $665 2,516 $177,457
General Fund 14 $484 2,026 $123,111
STB 6 $181 490 $54,346
Vetoes 0 $0 74 $44,783
Voided GF funding swapped for STB funding 0 $0 0 $5,679
STB 0 $0 29 $5,679
Amount Attrib. to OGAS -$317 -$83,167
Attrib. to OG Prod. Voids 0 -$317 -$88,562
Attrib. to OG Prod. Swaps 0 $0 $5,395
2011 CAPITAL OUTLAY PROJECTS Projects Amount Projects Amount
Reauthorizations 1 123
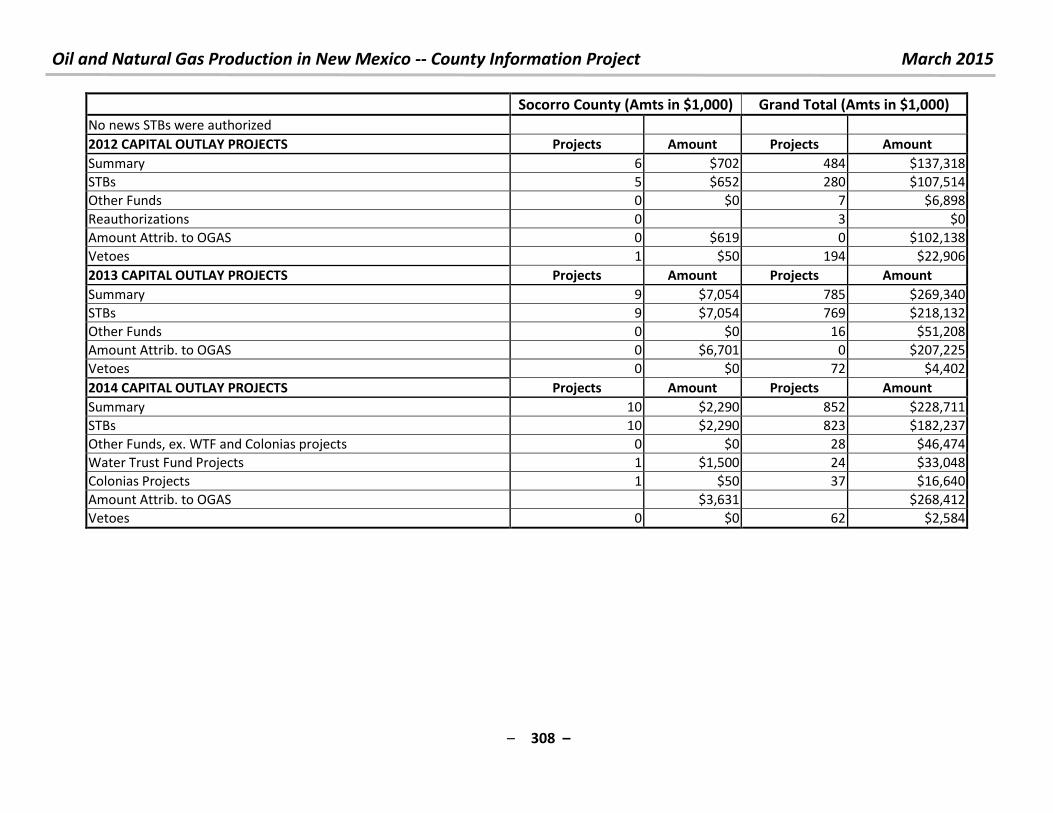
Oil and Natural Gas Production in New Mexico -- County Information Project March 2015
– 308 –
Socorro County (Amts in $1,000) Grand Total (Amts in $1,000)
No news STBs were authorized
2012 CAPITAL OUTLAY PROJECTS Projects Amount Projects Amount
Summary 6 $702 484 $137,318
STBs 5 $652 280 $107,514
Other Funds 0 $0 7 $6,898
Reauthorizations 0 3 $0
Amount Attrib. to OGAS 0 $619 0 $102,138
Vetoes 1 $50 194 $22,906
2013 CAPITAL OUTLAY PROJECTS Projects Amount Projects Amount
Summary 9 $7,054 785 $269,340
STBs 9 $7,054 769 $218,132
Other Funds 0 $0 16 $51,208
Amount Attrib. to OGAS 0 $6,701 0 $207,225
Vetoes 0 $0 72 $4,402
2014 CAPITAL OUTLAY PROJECTS Projects Amount Projects Amount
Summary 10 $2,290 852 $228,711
STBs 10 $2,290 823 $182,237
Other Funds, ex. WTF and Colonias projects 0 $0 28 $46,474
Water Trust Fund Projects 1 $1,500 24 $33,048
Colonias Projects 1 $50 37 $16,640
Amount Attrib. to OGAS $3,631 $268,412
Vetoes 0 $0 62 $2,584

Oil and Natural Gas Production in New Mexico -- County Information Project March 2015
– 309 –
10. For questions, comments or criticisms of this work, contact:
Laird Graeser
505 424-9023
or
Richard L. Anklam, President & Executive Director, New Mexico Tax Research Institute
505-269-6791
Oil and Natural Gas Production in New Mexico -- County Information Project March 2015
– 310 –
The Impacts of Oil and Natural Gas Production in New Mexico on Taos County A Summary of Important Economic and Revenue Issues
Taos County Summary
Taos County is not an oil and natural gas producing area. However, oil and natural gas production is important to the county indirectly. This sum-
mary details some of these important issues.
In FY 2010, all New Mexico producers shipped 62.4 million barrels of oil worth $4,469 million, 1,275 million mcf of natural gas worth $6,615 mil-
lion and 72.4 million mcf of CO2 worth $74.4 million. In FY 2014, all New Mexico producers shipped 110.5 million barrels of oil worth $10,905 mil-
lion and 1,169 million mcf of natural gas worth $6,115 million and 64.3 million mcf of CO2 worth $ . . illio . Note: f is , u i feet of gas at standard temperature and pressure.)
1. What products and land types generate the OGAS production in Taos County? Taos County is not an oil and natural gas producing area.
2. Is there more detail on specific product, such as natural gas liquids or condensate? Yes, the ONGRD system has for several years published de-
tails by product category. However, Taos County is not an oil and natural gas producing area.
3. What does this production mean for state and local direct revenues from production in Taos County? Taos County is not an oil and natural gas
producing area.
4. The industry also makes bonus payments for the rights to lease federal and state lands for production. These leases are primarily in the pro-
ducing counties, but exploratory leases are also executed. Bonus payments for leases on federal land are shared with the State general fund.
Bonus payments for leases on state lands become part of the land maintenance fund at the State Land Office, distributed to beneficiaries after
deducting the expenses of the SLO. No state or federal leases were sold in the county during the FY 2004 through FY 2014 period.
5. How about Gross Receipts Tax revenue to county and municipal governments for the NAICS codes 211110 - Oil & Gas Extraction; 213111 Drill-
ing oil and gas wells; 213112 - Support activities for oil and gas operations; and 213118 - Services to oil and gas extraction? Refer to the main
document for an explanation of the economic burden concept for Gross Receipts Tax. This year, the methodology for calculating the State tax
amount was improved somewhat, but those improvements are not reflected in the following table. Note that in the course of 2013, 30 coun-
ties had reported activity in at least one of the three NAICS codes. Only DeBaca, Los Alamos and Mora Counties reported no gross receipts ac-
tivity. For FY 2014, only Los Alamos County reported no GRT activity. Although the methodology has been improved this year, most of the dif-
ferences between 2013 and 2014 for this county are real. Extraction activity was significantly less in FY 2014 than in FY 2013. Drilling activity
was approximately flat. However, well services, completion, fracking and other recurring and non-recurring services significantly expanded.
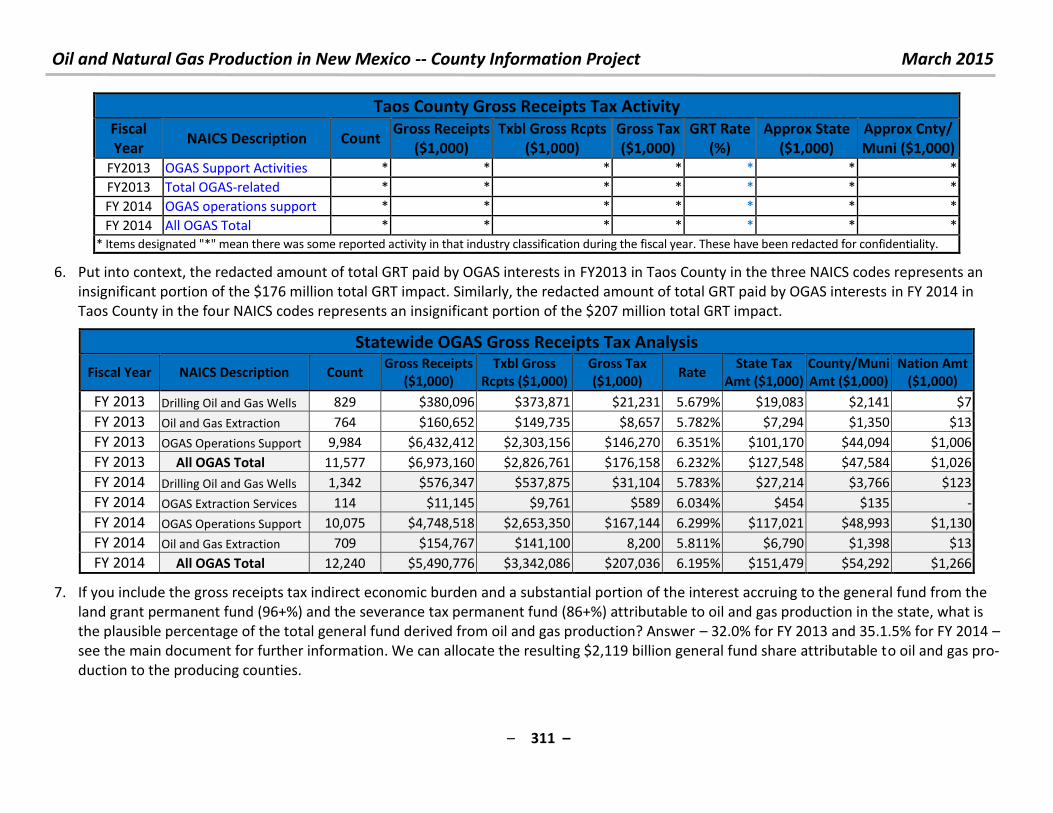
Oil and Natural Gas Production in New Mexico -- County Information Project March 2015
– 311 –
Taos County Gross Receipts Tax Activity
Fiscal
Year NAICS Description Count
Gross Receipts
($1,000)
Txbl Gross Rcpts
($1,000)
Gross Tax
($1,000)
GRT Rate
(%)
Approx State
($1,000)
Approx Cnty/
Muni ($1,000)
FY2013 OGAS Support Activities * * * * * * *
FY2013 Total OGAS-related * * * * * * *
FY 2014 OGAS operations support * * * * * * *
FY 2014 All OGAS Total * * * * * * *
* Items designated "*" mean there was some reported activity in that industry classification during the fiscal year. These have been redacted for confidentiality.
6. Put into context, the redacted amount of total GRT paid by OGAS interests in FY2013 in Taos County in the three NAICS codes represents an
insignificant portion of the $176 million total GRT impact. Similarly, the redacted amount of total GRT paid by OGAS interests in FY 2014 in
Taos County in the four NAICS codes represents an insignificant portion of the $207 million total GRT impact.
Statewide OGAS Gross Receipts Tax Analysis
Fiscal Year NAICS Description Count Gross Receipts
($1,000)
Txbl Gross
Rcpts ($1,000)
Gross Tax
($1,000) Rate
State Tax
Amt ($1,000)
County/Muni
Amt ($1,000)
Nation Amt
($1,000)
FY 2013 Drilling Oil and Gas Wells 829 $380,096 $373,871 $21,231 5.679% $19,083 $2,141 $7
FY 2013 Oil and Gas Extraction 764 $160,652 $149,735 $8,657 5.782% $7,294 $1,350 $13
FY 2013 OGAS Operations Support 9,984 $6,432,412 $2,303,156 $146,270 6.351% $101,170 $44,094 $1,006
FY 2013 All OGAS Total 11,577 $6,973,160 $2,826,761 $176,158 6.232% $127,548 $47,584 $1,026
FY 2014 Drilling Oil and Gas Wells 1,342 $576,347 $537,875 $31,104 5.783% $27,214 $3,766 $123
FY 2014 OGAS Extraction Services 114 $11,145 $9,761 $589 6.034% $454 $135 -
FY 2014 OGAS Operations Support 10,075 $4,748,518 $2,653,350 $167,144 6.299% $117,021 $48,993 $1,130
FY 2014 Oil and Gas Extraction 709 $154,767 $141,100 8,200 5.811% $6,790 $1,398 $13
FY 2014 All OGAS Total 12,240 $5,490,776 $3,342,086 $207,036 6.195% $151,479 $54,292 $1,266
7. If you include the gross receipts tax indirect economic burden and a substantial portion of the interest accruing to the general fund from the
land grant permanent fund (96+%) and the severance tax permanent fund (86+%) attributable to oil and gas production in the state, what is
the plausible percentage of the total general fund derived from oil and gas production? Answer – 32.0% for FY 2013 and 35.1.5% for FY 2014 –
see the main document for further information. We can allocate the resulting $2,119 billion general fund share attributable to oil and gas pro-
duction to the producing counties.
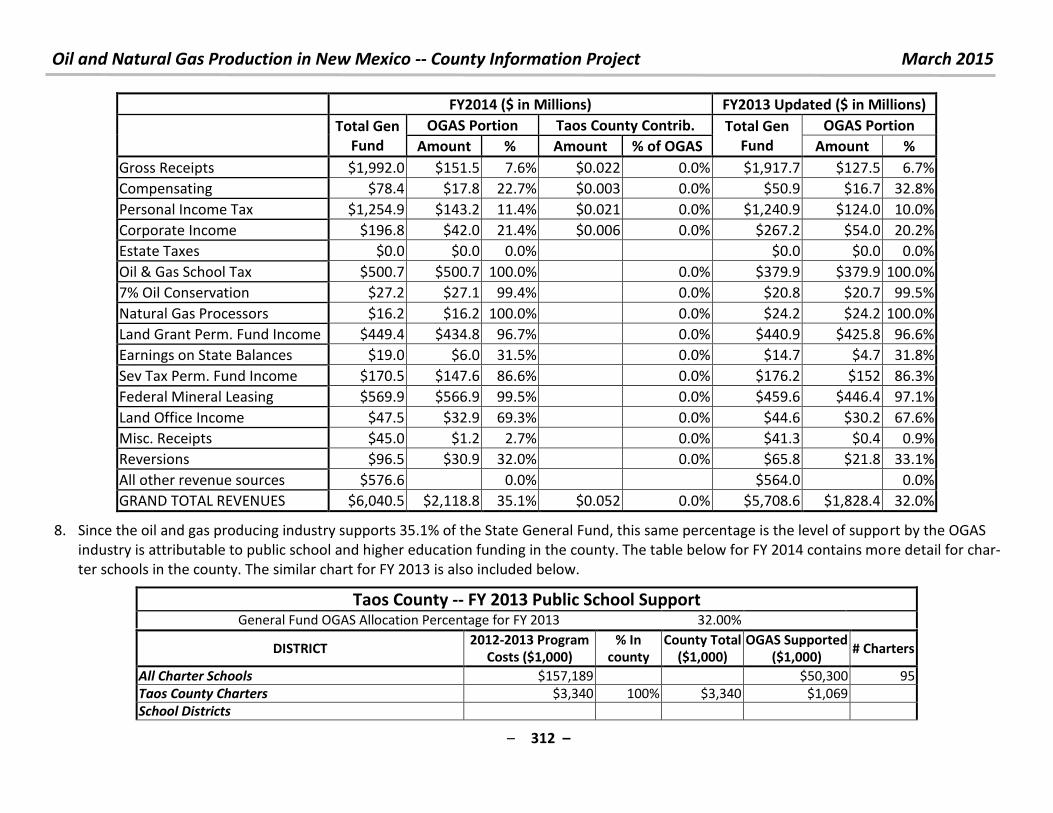
Oil and Natural Gas Production in New Mexico -- County Information Project March 2015
– 312 –
FY2014 ($ in Millions) FY2013 Updated ($ in Millions)
Total Gen
Fund
OGAS Portion Taos County Contrib. Total Gen
Fund
OGAS Portion
Amount % Amount % of OGAS Amount %
Gross Receipts $1,992.0 $151.5 7.6% $0.022 0.0% $1,917.7 $127.5 6.7%
Compensating $78.4 $17.8 22.7% $0.003 0.0% $50.9 $16.7 32.8%
Personal Income Tax $1,254.9 $143.2 11.4% $0.021 0.0% $1,240.9 $124.0 10.0%
Corporate Income $196.8 $42.0 21.4% $0.006 0.0% $267.2 $54.0 20.2%
Estate Taxes $0.0 $0.0 0.0% $0.0 $0.0 0.0%
Oil & Gas School Tax $500.7 $500.7 100.0% 0.0% $379.9 $379.9 100.0%
7% Oil Conservation $27.2 $27.1 99.4% 0.0% $20.8 $20.7 99.5%
Natural Gas Processors $16.2 $16.2 100.0% 0.0% $24.2 $24.2 100.0%
Land Grant Perm. Fund Income $449.4 $434.8 96.7% 0.0% $440.9 $425.8 96.6%
Earnings on State Balances $19.0 $6.0 31.5% 0.0% $14.7 $4.7 31.8%
Sev Tax Perm. Fund Income $170.5 $147.6 86.6% 0.0% $176.2 $152 86.3%
Federal Mineral Leasing $569.9 $566.9 99.5% 0.0% $459.6 $446.4 97.1%
Land Office Income $47.5 $32.9 69.3% 0.0% $44.6 $30.2 67.6%
Misc. Receipts $45.0 $1.2 2.7% 0.0% $41.3 $0.4 0.9%
Reversions $96.5 $30.9 32.0% 0.0% $65.8 $21.8 33.1%
All other revenue sources $576.6 0.0% $564.0
0.0%
GRAND TOTAL REVENUES $6,040.5 $2,118.8 35.1% $0.052 0.0% $5,708.6 $1,828.4 32.0%
8. Since the oil and gas producing industry supports 35.1% of the State General Fund, this same percentage is the level of support by the OGAS
industry is attributable to public school and higher education funding in the county. The table below for FY 2014 contains more detail for char-
ter schools in the county. The similar chart for FY 2013 is also included below.
Taos County -- FY 2013 Public School Support General Fund OGAS Allocation Percentage for FY 2013 32.00%
DISTRICT 2012-2013 Program
Costs ($1,000)
% In
county
County Total
($1,000)
OGAS Supported
($1,000) # Charters
All Charter Schools $157,189 $50,300 95
Taos County Charters $3,340 100% $3,340 $1,069
School Districts
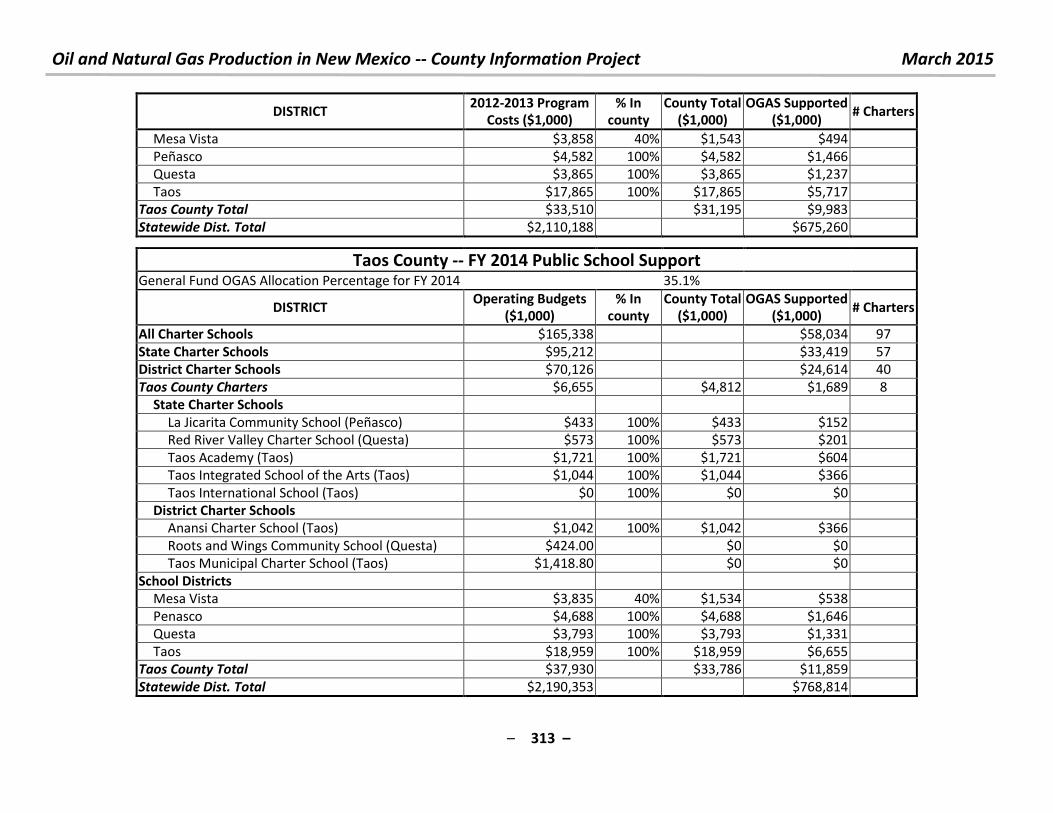
Oil and Natural Gas Production in New Mexico -- County Information Project March 2015
– 313 –
DISTRICT 2012-2013 Program
Costs ($1,000)
% In
county
County Total
($1,000)
OGAS Supported
($1,000) # Charters
Mesa Vista $3,858 40% $1,543 $494
Peñasco $4,582 100% $4,582 $1,466
Questa $3,865 100% $3,865 $1,237
Taos $17,865 100% $17,865 $5,717
Taos County Total $33,510 $31,195 $9,983
Statewide Dist. Total $2,110,188 $675,260
Taos County -- FY 2014 Public School Support
General Fund OGAS Allocation Percentage for FY 2014 35.1%
DISTRICT Operating Budgets
($1,000)
% In
county
County Total
($1,000)
OGAS Supported
($1,000) # Charters
All Charter Schools $165,338 $58,034 97
State Charter Schools $95,212 $33,419 57
District Charter Schools $70,126 $24,614 40
Taos County Charters $6,655 $4,812 $1,689 8
State Charter Schools
La Jicarita Community School (Peñasco) $433 100% $433 $152
Red River Valley Charter School (Questa) $573 100% $573 $201
Taos Academy (Taos) $1,721 100% $1,721 $604
Taos Integrated School of the Arts (Taos) $1,044 100% $1,044 $366
Taos International School (Taos) $0 100% $0 $0
District Charter Schools
Anansi Charter School (Taos) $1,042 100% $1,042 $366
Roots and Wings Community School (Questa) $424.00 $0 $0
Taos Municipal Charter School (Taos) $1,418.80 $0 $0
School Districts
Mesa Vista $3,835 40% $1,534 $538
Penasco $4,688 100% $4,688 $1,646
Questa $3,793 100% $3,793 $1,331
Taos $18,959 100% $18,959 $6,655
Taos County Total $37,930 $33,786 $11,859
Statewide Dist. Total $2,190,353 $768,814
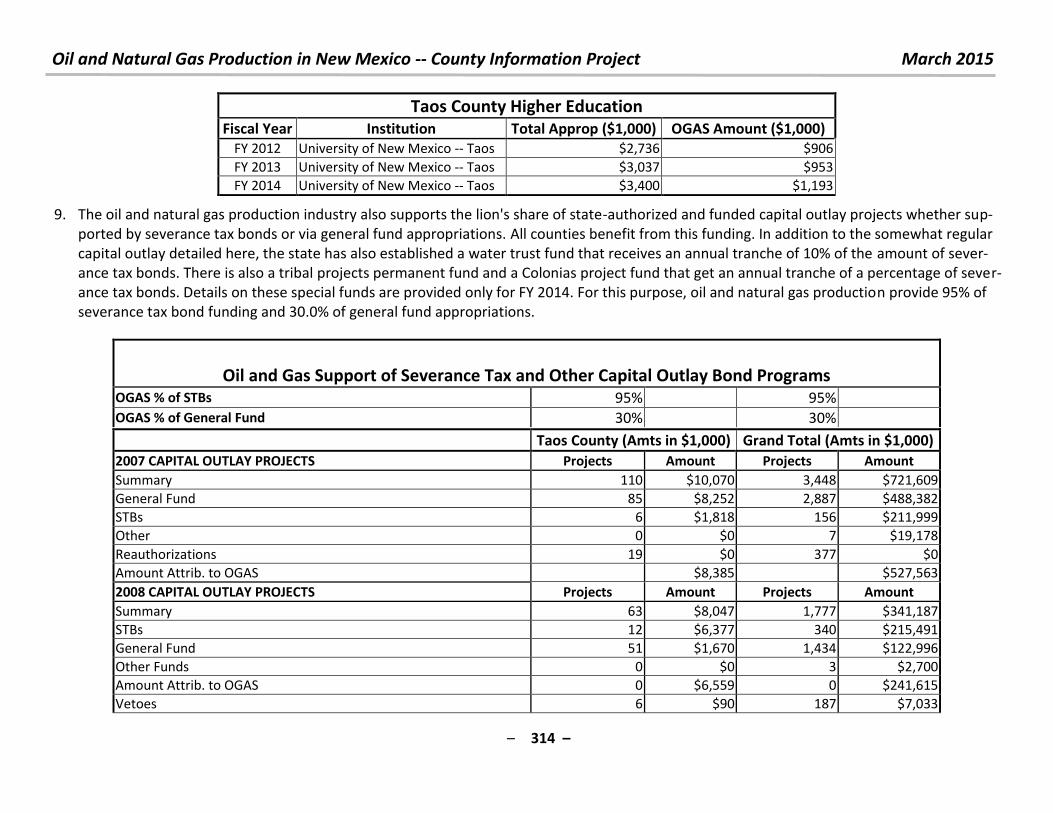
Oil and Natural Gas Production in New Mexico -- County Information Project March 2015
– 314 –
Taos County Higher Education
Fiscal Year Institution Total Approp ($1,000) OGAS Amount ($1,000)
FY 2012 University of New Mexico -- Taos $2,736 $906
FY 2013 University of New Mexico -- Taos $3,037 $953
FY 2014 University of New Mexico -- Taos $3,400 $1,193
9. The oil and natural gas production industry also supports the lion's share of state-authorized and funded capital outlay projects whether sup-
ported by severance tax bonds or via general fund appropriations. All counties benefit from this funding. In addition to the somewhat regular
capital outlay detailed here, the state has also established a water trust fund that receives an annual tranche of 10% of the amount of sever-
ance tax bonds. There is also a tribal projects permanent fund and a Colonias project fund that get an annual tranche of a percentage of sever-
ance tax bonds. Details on these special funds are provided only for FY 2014. For this purpose, oil and natural gas production provide 95% of
severance tax bond funding and 30.0% of general fund appropriations.
Oil and Gas Support of Severance Tax and Other Capital Outlay Bond Programs OGAS % of STBs 95% 95%
OGAS % of General Fund 30% 30%
Taos County (Amts in $1,000) Grand Total (Amts in $1,000)
2007 CAPITAL OUTLAY PROJECTS Projects Amount Projects Amount
Summary 110 $10,070 3,448 $721,609
General Fund 85 $8,252 2,887 $488,382
STBs 6 $1,818 156 $211,999
Other 0 $0 7 $19,178
Reauthorizations 19 $0 377 $0
Amount Attrib. to OGAS $8,385 $527,563
2008 CAPITAL OUTLAY PROJECTS Projects Amount Projects Amount
Summary 63 $8,047 1,777 $341,187
STBs 12 $6,377 340 $215,491
General Fund 51 $1,670 1,434 $122,996
Other Funds 0 $0 3 $2,700
Amount Attrib. to OGAS 0 $6,559 0 $241,615
Vetoes 6 $90 187 $7,033
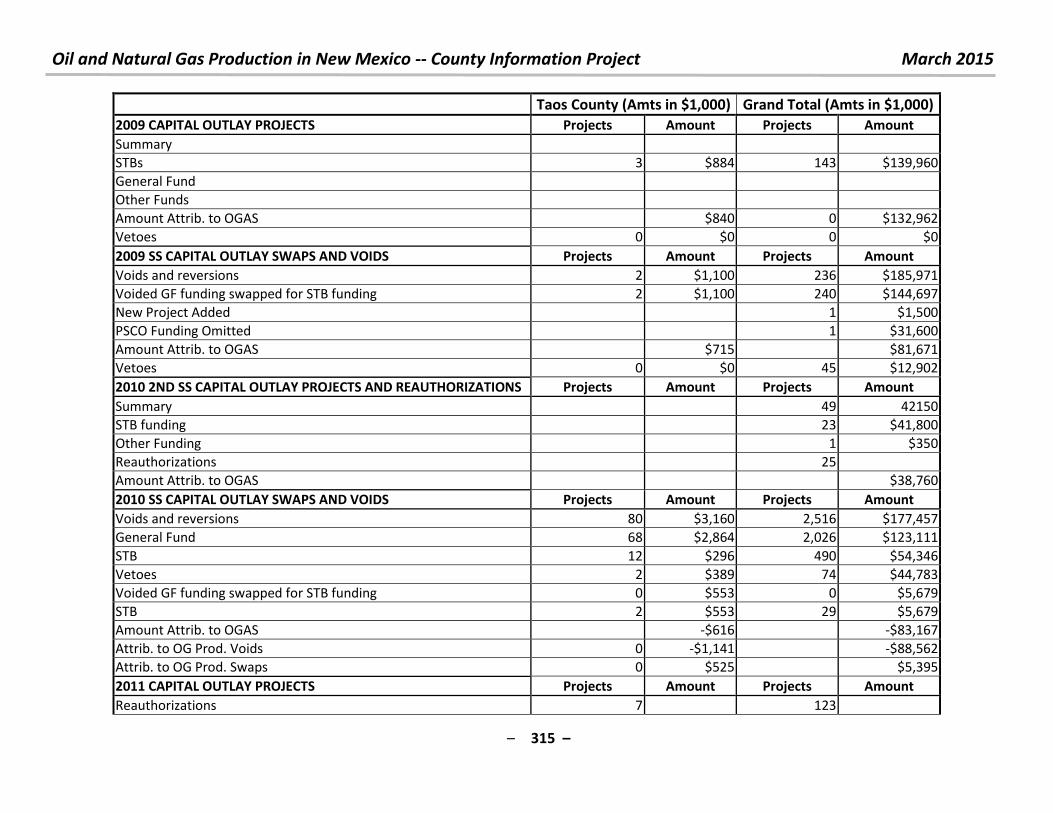
Oil and Natural Gas Production in New Mexico -- County Information Project March 2015
– 315 –
Taos County (Amts in $1,000) Grand Total (Amts in $1,000)
2009 CAPITAL OUTLAY PROJECTS Projects Amount Projects Amount
Summary
STBs 3 $884 143 $139,960
General Fund
Other Funds
Amount Attrib. to OGAS $840 0 $132,962
Vetoes 0 $0 0 $0
2009 SS CAPITAL OUTLAY SWAPS AND VOIDS Projects Amount Projects Amount
Voids and reversions 2 $1,100 236 $185,971
Voided GF funding swapped for STB funding 2 $1,100 240 $144,697
New Project Added 1 $1,500
PSCO Funding Omitted 1 $31,600
Amount Attrib. to OGAS $715 $81,671
Vetoes 0 $0 45 $12,902
2010 2ND SS CAPITAL OUTLAY PROJECTS AND REAUTHORIZATIONS Projects Amount Projects Amount
Summary 49 42150
STB funding 23 $41,800
Other Funding 1 $350
Reauthorizations 25
Amount Attrib. to OGAS $38,760
2010 SS CAPITAL OUTLAY SWAPS AND VOIDS Projects Amount Projects Amount
Voids and reversions 80 $3,160 2,516 $177,457
General Fund 68 $2,864 2,026 $123,111
STB 12 $296 490 $54,346
Vetoes 2 $389 74 $44,783
Voided GF funding swapped for STB funding 0 $553 0 $5,679
STB 2 $553 29 $5,679
Amount Attrib. to OGAS -$616 -$83,167
Attrib. to OG Prod. Voids 0 -$1,141 -$88,562
Attrib. to OG Prod. Swaps 0 $525 $5,395
2011 CAPITAL OUTLAY PROJECTS Projects Amount Projects Amount
Reauthorizations 7 123
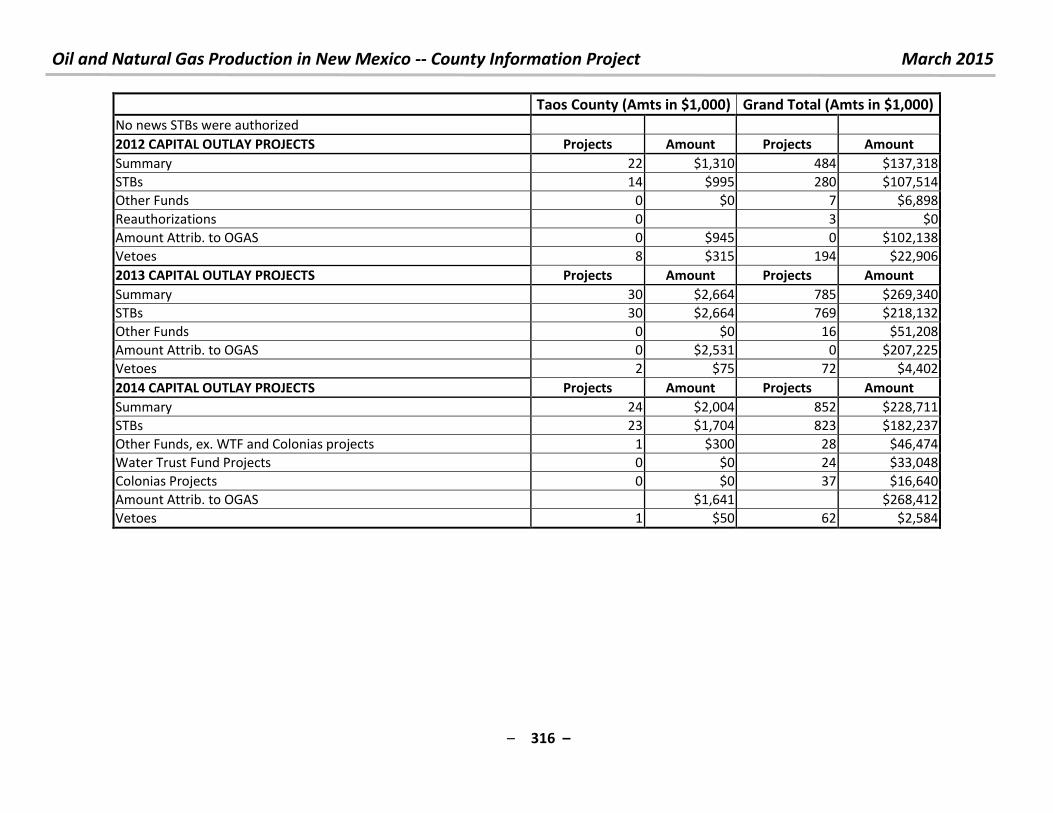
Oil and Natural Gas Production in New Mexico -- County Information Project March 2015
– 316 –
Taos County (Amts in $1,000) Grand Total (Amts in $1,000)
No news STBs were authorized
2012 CAPITAL OUTLAY PROJECTS Projects Amount Projects Amount
Summary 22 $1,310 484 $137,318
STBs 14 $995 280 $107,514
Other Funds 0 $0 7 $6,898
Reauthorizations 0 3 $0
Amount Attrib. to OGAS 0 $945 0 $102,138
Vetoes 8 $315 194 $22,906
2013 CAPITAL OUTLAY PROJECTS Projects Amount Projects Amount
Summary 30 $2,664 785 $269,340
STBs 30 $2,664 769 $218,132
Other Funds 0 $0 16 $51,208
Amount Attrib. to OGAS 0 $2,531 0 $207,225
Vetoes 2 $75 72 $4,402
2014 CAPITAL OUTLAY PROJECTS Projects Amount Projects Amount
Summary 24 $2,004 852 $228,711
STBs 23 $1,704 823 $182,237
Other Funds, ex. WTF and Colonias projects 1 $300 28 $46,474
Water Trust Fund Projects 0 $0 24 $33,048
Colonias Projects 0 $0 37 $16,640
Amount Attrib. to OGAS $1,641 $268,412
Vetoes 1 $50 62 $2,584

Oil and Natural Gas Production in New Mexico -- County Information Project March 2015
– 317 –
10. For questions, comments or criticisms of this work, contact:
Laird Graeser
505 424-9023
or
Richard L. Anklam, President & Executive Director, New Mexico Tax Research Institute
505-269-6791
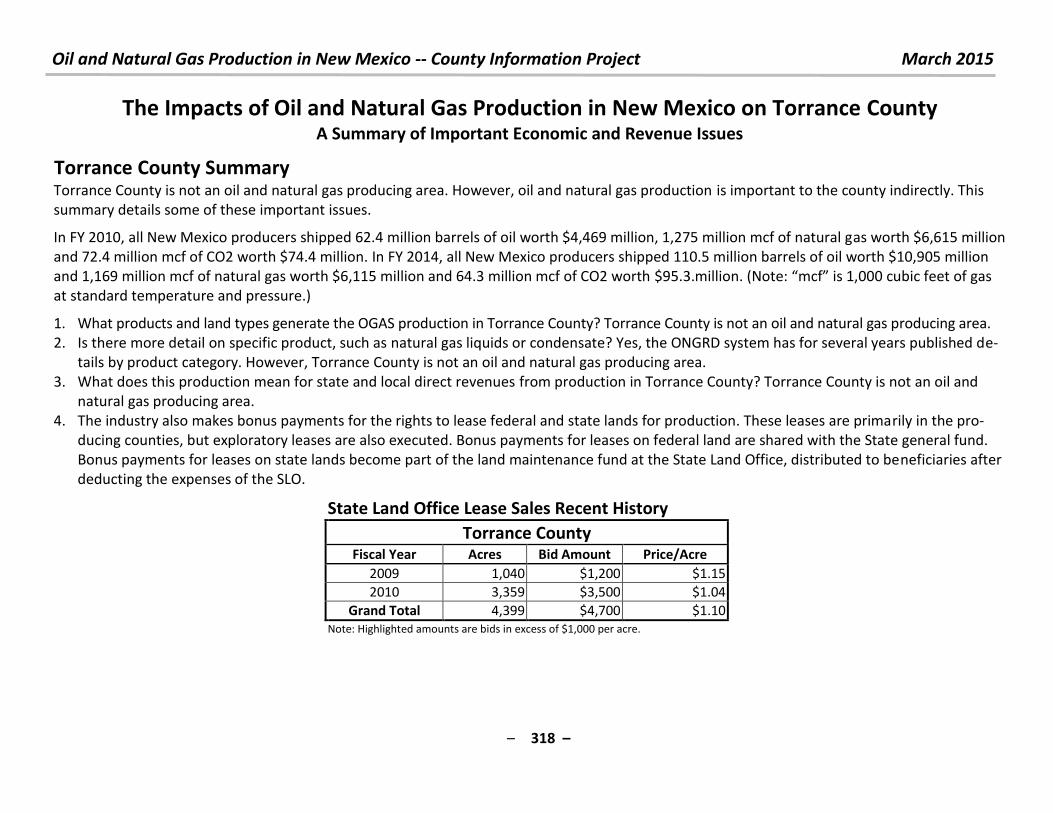
Oil and Natural Gas Production in New Mexico -- County Information Project March 2015
– 318 –
The Impacts of Oil and Natural Gas Production in New Mexico on Torrance County A Summary of Important Economic and Revenue Issues
Torrance County Summary
Torrance County is not an oil and natural gas producing area. However, oil and natural gas production is important to the county indirectly. This
summary details some of these important issues.
In FY 2010, all New Mexico producers shipped 62.4 million barrels of oil worth $4,469 million, 1,275 million mcf of natural gas worth $6,615 million
and 72.4 million mcf of CO2 worth $74.4 million. In FY 2014, all New Mexico producers shipped 110.5 million barrels of oil worth $10,905 million
and 1,169 million mcf of natural gas worth $6,115 million and 64.3 million mcf of CO2 worth $ . . illio . Note: f is ,000 cubic feet of gas
at standard temperature and pressure.)
1. What products and land types generate the OGAS production in Torrance County? Torrance County is not an oil and natural gas producing area.
2. Is there more detail on specific product, such as natural gas liquids or condensate? Yes, the ONGRD system has for several years published de-
tails by product category. However, Torrance County is not an oil and natural gas producing area.
3. What does this production mean for state and local direct revenues from production in Torrance County? Torrance County is not an oil and
natural gas producing area.
4. The industry also makes bonus payments for the rights to lease federal and state lands for production. These leases are primarily in the pro-
ducing counties, but exploratory leases are also executed. Bonus payments for leases on federal land are shared with the State general fund.
Bonus payments for leases on state lands become part of the land maintenance fund at the State Land Office, distributed to beneficiaries after
deducting the expenses of the SLO.
State Land Office Lease Sales Recent History
Torrance County Fiscal Year Acres Bid Amount Price/Acre
2009 1,040 $1,200 $1.15
2010 3,359 $3,500 $1.04
Grand Total 4,399 $4,700 $1.10
Note: Highlighted amounts are bids in excess of $1,000 per acre.
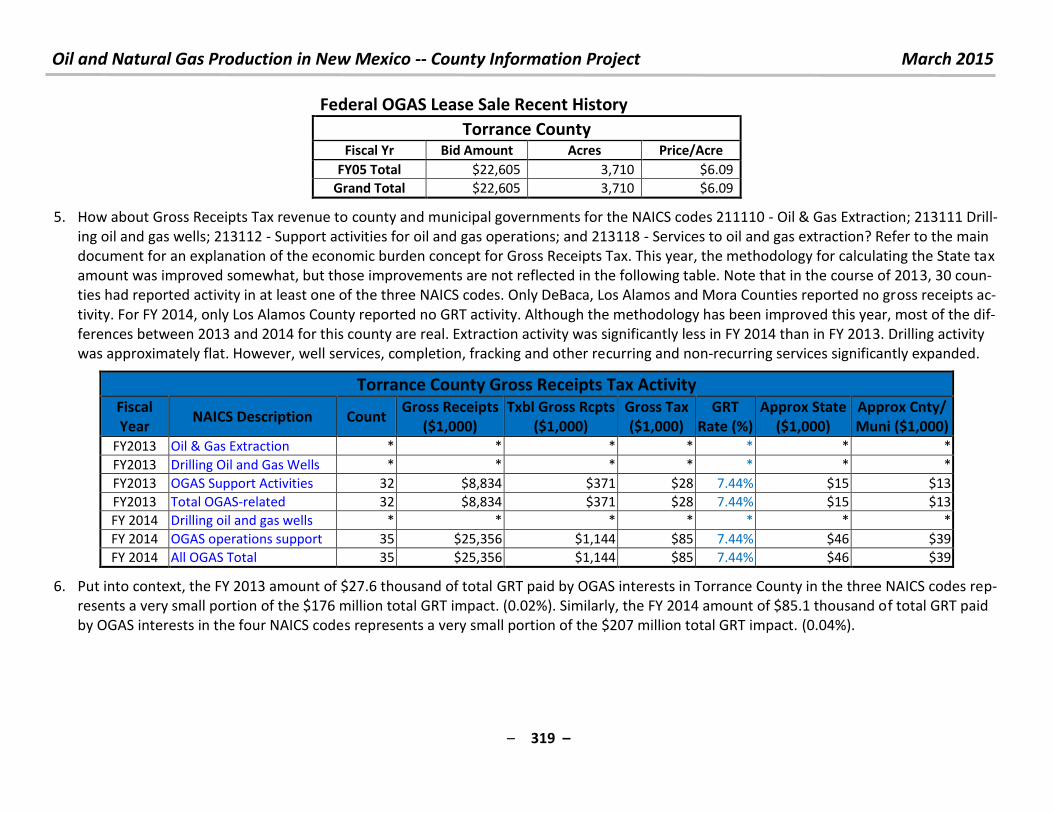
Oil and Natural Gas Production in New Mexico -- County Information Project March 2015
– 319 –
Federal OGAS Lease Sale Recent History
Torrance County Fiscal Yr Bid Amount Acres Price/Acre
FY05 Total $22,605 3,710 $6.09
Grand Total $22,605 3,710 $6.09
5. How about Gross Receipts Tax revenue to county and municipal governments for the NAICS codes 211110 - Oil & Gas Extraction; 213111 Drill-
ing oil and gas wells; 213112 - Support activities for oil and gas operations; and 213118 - Services to oil and gas extraction? Refer to the main
document for an explanation of the economic burden concept for Gross Receipts Tax. This year, the methodology for calculating the State tax
amount was improved somewhat, but those improvements are not reflected in the following table. Note that in the course of 2013, 30 coun-
ties had reported activity in at least one of the three NAICS codes. Only DeBaca, Los Alamos and Mora Counties reported no gross receipts ac-
tivity. For FY 2014, only Los Alamos County reported no GRT activity. Although the methodology has been improved this year, most of the dif-
ferences between 2013 and 2014 for this county are real. Extraction activity was significantly less in FY 2014 than in FY 2013. Drilling activity
was approximately flat. However, well services, completion, fracking and other recurring and non-recurring services significantly expanded.
Torrance County Gross Receipts Tax Activity
Fiscal
Year NAICS Description Count
Gross Receipts
($1,000)
Txbl Gross Rcpts
($1,000)
Gross Tax
($1,000)
GRT
Rate (%)
Approx State
($1,000)
Approx Cnty/
Muni ($1,000)
FY2013 Oil & Gas Extraction * * * * * * *
FY2013 Drilling Oil and Gas Wells * * * * * * *
FY2013 OGAS Support Activities 32 $8,834 $371 $28 7.44% $15 $13
FY2013 Total OGAS-related 32 $8,834 $371 $28 7.44% $15 $13
FY 2014 Drilling oil and gas wells * * * * * * *
FY 2014 OGAS operations support 35 $25,356 $1,144 $85 7.44% $46 $39
FY 2014 All OGAS Total 35 $25,356 $1,144 $85 7.44% $46 $39
6. Put into context, the FY 2013 amount of $27.6 thousand of total GRT paid by OGAS interests in Torrance County in the three NAICS codes rep-
resents a very small portion of the $176 million total GRT impact. (0.02%). Similarly, the FY 2014 amount of $85.1 thousand of total GRT paid
by OGAS interests in the four NAICS codes represents a very small portion of the $207 million total GRT impact. (0.04%).
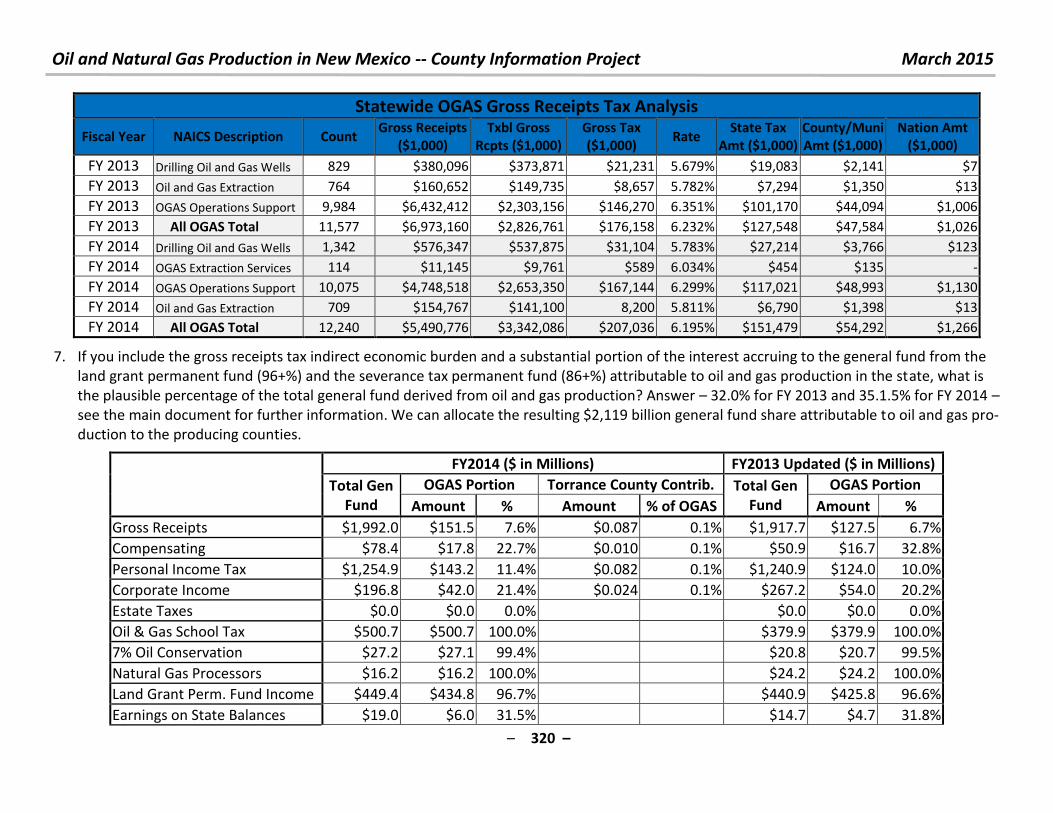
Oil and Natural Gas Production in New Mexico -- County Information Project March 2015
– 320 –
Statewide OGAS Gross Receipts Tax Analysis
Fiscal Year NAICS Description Count Gross Receipts
($1,000)
Txbl Gross
Rcpts ($1,000)
Gross Tax
($1,000) Rate
State Tax
Amt ($1,000)
County/Muni
Amt ($1,000)
Nation Amt
($1,000)
FY 2013 Drilling Oil and Gas Wells 829 $380,096 $373,871 $21,231 5.679% $19,083 $2,141 $7
FY 2013 Oil and Gas Extraction 764 $160,652 $149,735 $8,657 5.782% $7,294 $1,350 $13
FY 2013 OGAS Operations Support 9,984 $6,432,412 $2,303,156 $146,270 6.351% $101,170 $44,094 $1,006
FY 2013 All OGAS Total 11,577 $6,973,160 $2,826,761 $176,158 6.232% $127,548 $47,584 $1,026
FY 2014 Drilling Oil and Gas Wells 1,342 $576,347 $537,875 $31,104 5.783% $27,214 $3,766 $123
FY 2014 OGAS Extraction Services 114 $11,145 $9,761 $589 6.034% $454 $135 -
FY 2014 OGAS Operations Support 10,075 $4,748,518 $2,653,350 $167,144 6.299% $117,021 $48,993 $1,130
FY 2014 Oil and Gas Extraction 709 $154,767 $141,100 8,200 5.811% $6,790 $1,398 $13
FY 2014 All OGAS Total 12,240 $5,490,776 $3,342,086 $207,036 6.195% $151,479 $54,292 $1,266
7. If you include the gross receipts tax indirect economic burden and a substantial portion of the interest accruing to the general fund from the
land grant permanent fund (96+%) and the severance tax permanent fund (86+%) attributable to oil and gas production in the state, what is
the plausible percentage of the total general fund derived from oil and gas production? Answer – 32.0% for FY 2013 and 35.1.5% for FY 2014 –
see the main document for further information. We can allocate the resulting $2,119 billion general fund share attributable to oil and gas pro-
duction to the producing counties.
FY2014 ($ in Millions) FY2013 Updated ($ in Millions)
Total Gen
Fund
OGAS Portion Torrance County Contrib. Total Gen
Fund
OGAS Portion
Amount % Amount % of OGAS Amount %
Gross Receipts $1,992.0 $151.5 7.6% $0.087 0.1% $1,917.7 $127.5 6.7%
Compensating $78.4 $17.8 22.7% $0.010 0.1% $50.9 $16.7 32.8%
Personal Income Tax $1,254.9 $143.2 11.4% $0.082 0.1% $1,240.9 $124.0 10.0%
Corporate Income $196.8 $42.0 21.4% $0.024 0.1% $267.2 $54.0 20.2%
Estate Taxes $0.0 $0.0 0.0%
$0.0 $0.0 0.0%
Oil & Gas School Tax $500.7 $500.7 100.0%
$379.9 $379.9 100.0%
7% Oil Conservation $27.2 $27.1 99.4%
$20.8 $20.7 99.5%
Natural Gas Processors $16.2 $16.2 100.0%
$24.2 $24.2 100.0%
Land Grant Perm. Fund Income $449.4 $434.8 96.7%
$440.9 $425.8 96.6%
Earnings on State Balances $19.0 $6.0 31.5%
$14.7 $4.7 31.8%
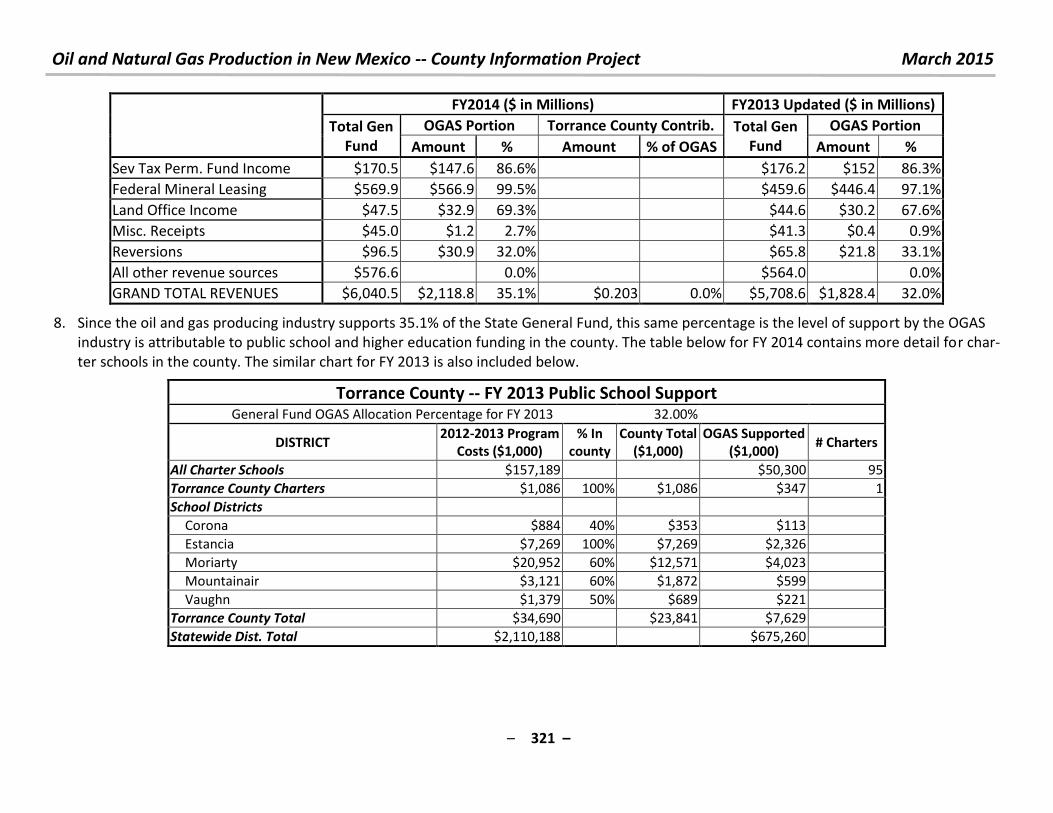
Oil and Natural Gas Production in New Mexico -- County Information Project March 2015
– 321 –
FY2014 ($ in Millions) FY2013 Updated ($ in Millions)
Total Gen
Fund
OGAS Portion Torrance County Contrib. Total Gen
Fund
OGAS Portion
Amount % Amount % of OGAS Amount %
Sev Tax Perm. Fund Income $170.5 $147.6 86.6%
$176.2 $152 86.3%
Federal Mineral Leasing $569.9 $566.9 99.5%
$459.6 $446.4 97.1%
Land Office Income $47.5 $32.9 69.3%
$44.6 $30.2 67.6%
Misc. Receipts $45.0 $1.2 2.7%
$41.3 $0.4 0.9%
Reversions $96.5 $30.9 32.0%
$65.8 $21.8 33.1%
All other revenue sources $576.6 0.0%
$564.0
0.0%
GRAND TOTAL REVENUES $6,040.5 $2,118.8 35.1% $0.203 0.0% $5,708.6 $1,828.4 32.0%
8. Since the oil and gas producing industry supports 35.1% of the State General Fund, this same percentage is the level of support by the OGAS
industry is attributable to public school and higher education funding in the county. The table below for FY 2014 contains more detail for char-
ter schools in the county. The similar chart for FY 2013 is also included below.
Torrance County -- FY 2013 Public School Support General Fund OGAS Allocation Percentage for FY 2013 32.00%
DISTRICT 2012-2013 Program
Costs ($1,000)
% In
county
County Total
($1,000)
OGAS Supported
($1,000) # Charters
All Charter Schools $157,189 $50,300 95
Torrance County Charters $1,086 100% $1,086 $347 1
School Districts
Corona $884 40% $353 $113
Estancia $7,269 100% $7,269 $2,326
Moriarty $20,952 60% $12,571 $4,023
Mountainair $3,121 60% $1,872 $599
Vaughn $1,379 50% $689 $221
Torrance County Total $34,690 $23,841 $7,629
Statewide Dist. Total $2,110,188 $675,260
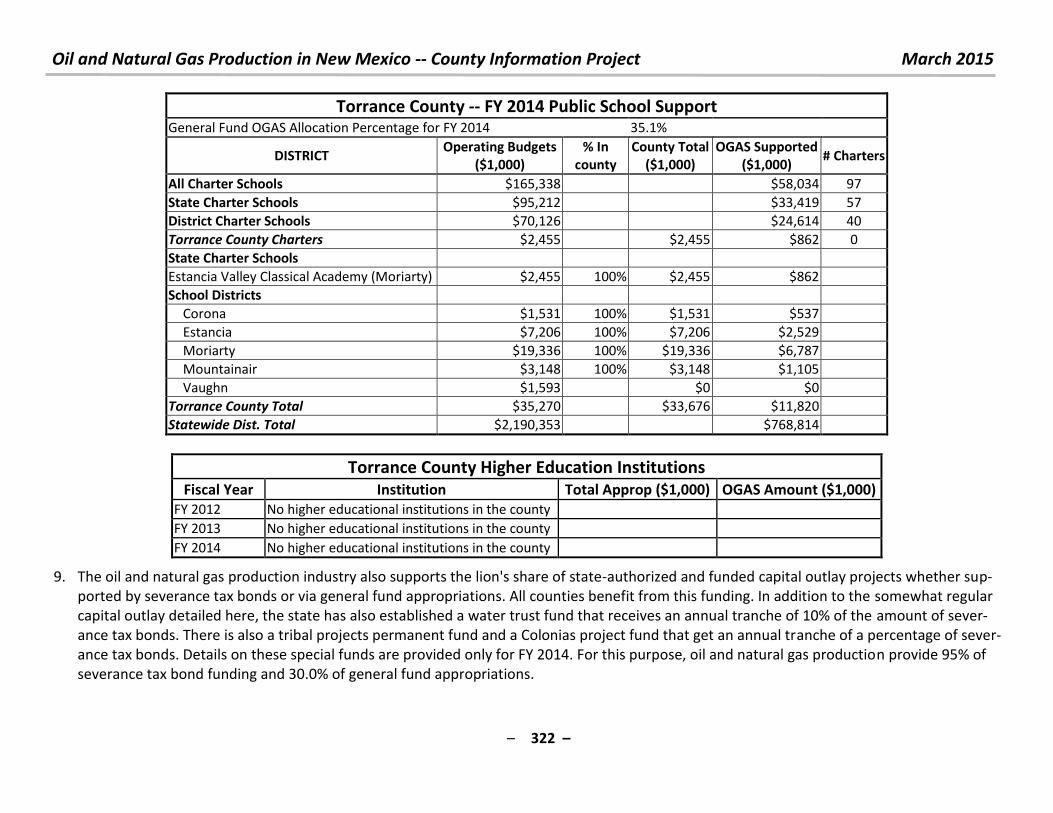
Oil and Natural Gas Production in New Mexico -- County Information Project March 2015
– 322 –
Torrance County -- FY 2014 Public School Support General Fund OGAS Allocation Percentage for FY 2014 35.1%
DISTRICT Operating Budgets
($1,000)
% In
county
County Total
($1,000)
OGAS Supported
($1,000) # Charters
All Charter Schools $165,338 $58,034 97
State Charter Schools $95,212 $33,419 57
District Charter Schools $70,126 $24,614 40
Torrance County Charters $2,455 $2,455 $862 0
State Charter Schools
Estancia Valley Classical Academy (Moriarty) $2,455 100% $2,455 $862
School Districts
Corona $1,531 100% $1,531 $537
Estancia $7,206 100% $7,206 $2,529
Moriarty $19,336 100% $19,336 $6,787
Mountainair $3,148 100% $3,148 $1,105
Vaughn $1,593 $0 $0
Torrance County Total $35,270 $33,676 $11,820
Statewide Dist. Total $2,190,353 $768,814
Torrance County Higher Education Institutions
Fiscal Year Institution Total Approp ($1,000) OGAS Amount ($1,000)
FY 2012 No higher educational institutions in the county
FY 2013 No higher educational institutions in the county
FY 2014 No higher educational institutions in the county
9. The oil and natural gas production industry also supports the lion's share of state-authorized and funded capital outlay projects whether sup-
ported by severance tax bonds or via general fund appropriations. All counties benefit from this funding. In addition to the somewhat regular
capital outlay detailed here, the state has also established a water trust fund that receives an annual tranche of 10% of the amount of sever-
ance tax bonds. There is also a tribal projects permanent fund and a Colonias project fund that get an annual tranche of a percentage of sever-
ance tax bonds. Details on these special funds are provided only for FY 2014. For this purpose, oil and natural gas production provide 95% of
severance tax bond funding and 30.0% of general fund appropriations.
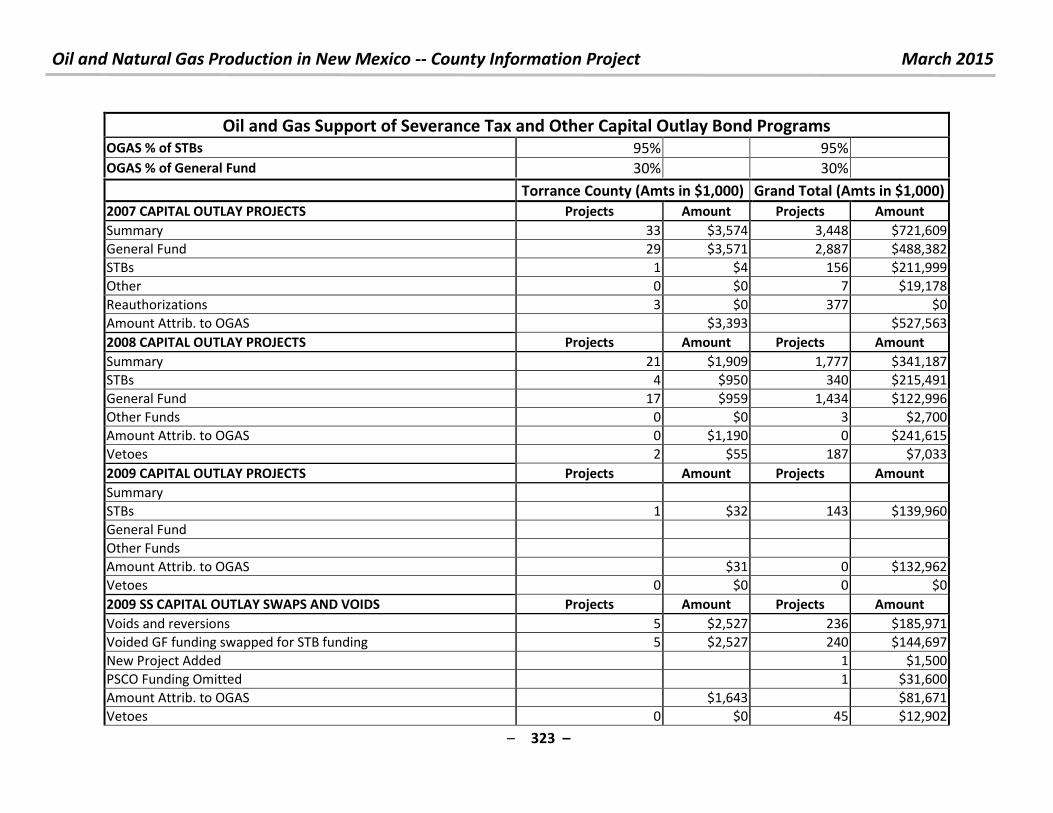
Oil and Natural Gas Production in New Mexico -- County Information Project March 2015
– 323 –
Oil and Gas Support of Severance Tax and Other Capital Outlay Bond Programs OGAS % of STBs 95% 95%
OGAS % of General Fund 30% 30%
Torrance County (Amts in $1,000) Grand Total (Amts in $1,000)
2007 CAPITAL OUTLAY PROJECTS Projects Amount Projects Amount
Summary 33 $3,574 3,448 $721,609
General Fund 29 $3,571 2,887 $488,382
STBs 1 $4 156 $211,999
Other 0 $0 7 $19,178
Reauthorizations 3 $0 377 $0
Amount Attrib. to OGAS $3,393 $527,563
2008 CAPITAL OUTLAY PROJECTS Projects Amount Projects Amount
Summary 21 $1,909 1,777 $341,187
STBs 4 $950 340 $215,491
General Fund 17 $959 1,434 $122,996
Other Funds 0 $0 3 $2,700
Amount Attrib. to OGAS 0 $1,190 0 $241,615
Vetoes 2 $55 187 $7,033
2009 CAPITAL OUTLAY PROJECTS Projects Amount Projects Amount
Summary
STBs 1 $32 143 $139,960
General Fund
Other Funds
Amount Attrib. to OGAS $31 0 $132,962
Vetoes 0 $0 0 $0
2009 SS CAPITAL OUTLAY SWAPS AND VOIDS Projects Amount Projects Amount
Voids and reversions 5 $2,527 236 $185,971
Voided GF funding swapped for STB funding 5 $2,527 240 $144,697
New Project Added 1 $1,500
PSCO Funding Omitted 1 $31,600
Amount Attrib. to OGAS $1,643 $81,671
Vetoes 0 $0 45 $12,902
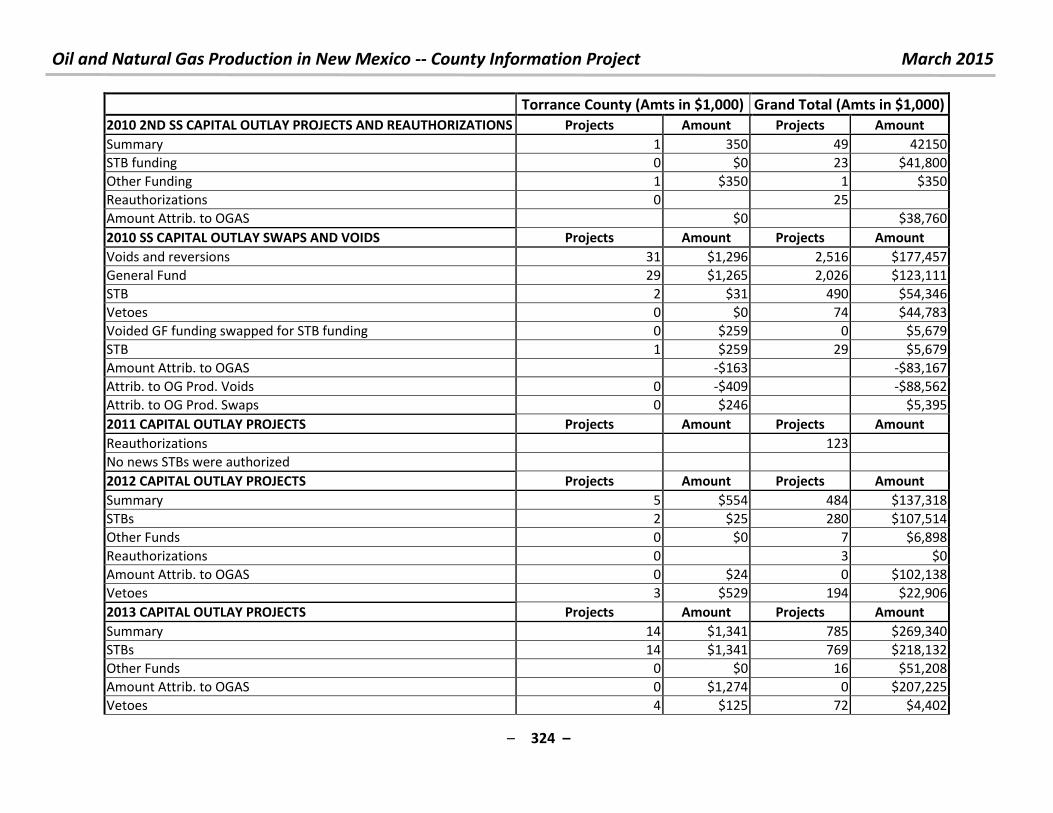
Oil and Natural Gas Production in New Mexico -- County Information Project March 2015
– 324 –
Torrance County (Amts in $1,000) Grand Total (Amts in $1,000)
2010 2ND SS CAPITAL OUTLAY PROJECTS AND REAUTHORIZATIONS Projects Amount Projects Amount
Summary 1 350 49 42150
STB funding 0 $0 23 $41,800
Other Funding 1 $350 1 $350
Reauthorizations 0 25
Amount Attrib. to OGAS $0 $38,760
2010 SS CAPITAL OUTLAY SWAPS AND VOIDS Projects Amount Projects Amount
Voids and reversions 31 $1,296 2,516 $177,457
General Fund 29 $1,265 2,026 $123,111
STB 2 $31 490 $54,346
Vetoes 0 $0 74 $44,783
Voided GF funding swapped for STB funding 0 $259 0 $5,679
STB 1 $259 29 $5,679
Amount Attrib. to OGAS -$163 -$83,167
Attrib. to OG Prod. Voids 0 -$409 -$88,562
Attrib. to OG Prod. Swaps 0 $246 $5,395
2011 CAPITAL OUTLAY PROJECTS Projects Amount Projects Amount
Reauthorizations 123
No news STBs were authorized
2012 CAPITAL OUTLAY PROJECTS Projects Amount Projects Amount
Summary 5 $554 484 $137,318
STBs 2 $25 280 $107,514
Other Funds 0 $0 7 $6,898
Reauthorizations 0 3 $0
Amount Attrib. to OGAS 0 $24 0 $102,138
Vetoes 3 $529 194 $22,906
2013 CAPITAL OUTLAY PROJECTS Projects Amount Projects Amount
Summary 14 $1,341 785 $269,340
STBs 14 $1,341 769 $218,132
Other Funds 0 $0 16 $51,208
Amount Attrib. to OGAS 0 $1,274 0 $207,225
Vetoes 4 $125 72 $4,402
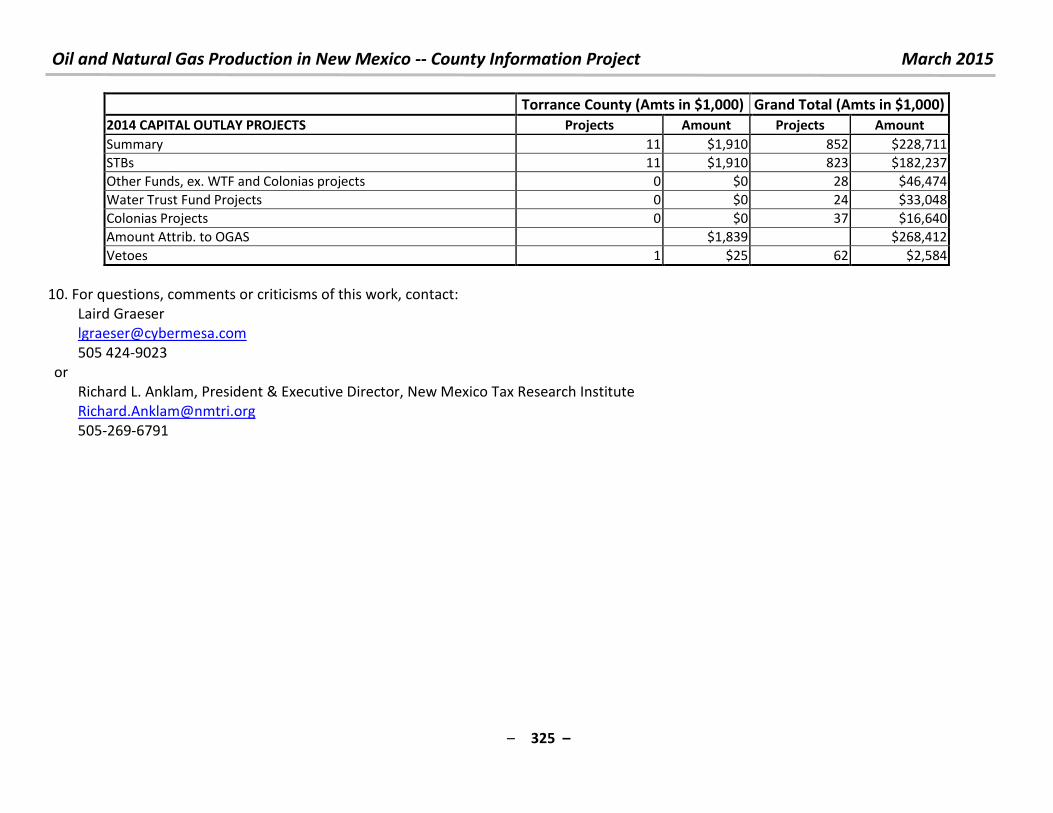
Oil and Natural Gas Production in New Mexico -- County Information Project March 2015
– 325 –
Torrance County (Amts in $1,000) Grand Total (Amts in $1,000)
2014 CAPITAL OUTLAY PROJECTS Projects Amount Projects Amount
Summary 11 $1,910 852 $228,711
STBs 11 $1,910 823 $182,237
Other Funds, ex. WTF and Colonias projects 0 $0 28 $46,474
Water Trust Fund Projects 0 $0 24 $33,048
Colonias Projects 0 $0 37 $16,640
Amount Attrib. to OGAS $1,839 $268,412
Vetoes 1 $25 62 $2,584
10. For questions, comments or criticisms of this work, contact:
Laird Graeser
505 424-9023
or
Richard L. Anklam, President & Executive Director, New Mexico Tax Research Institute
505-269-6791
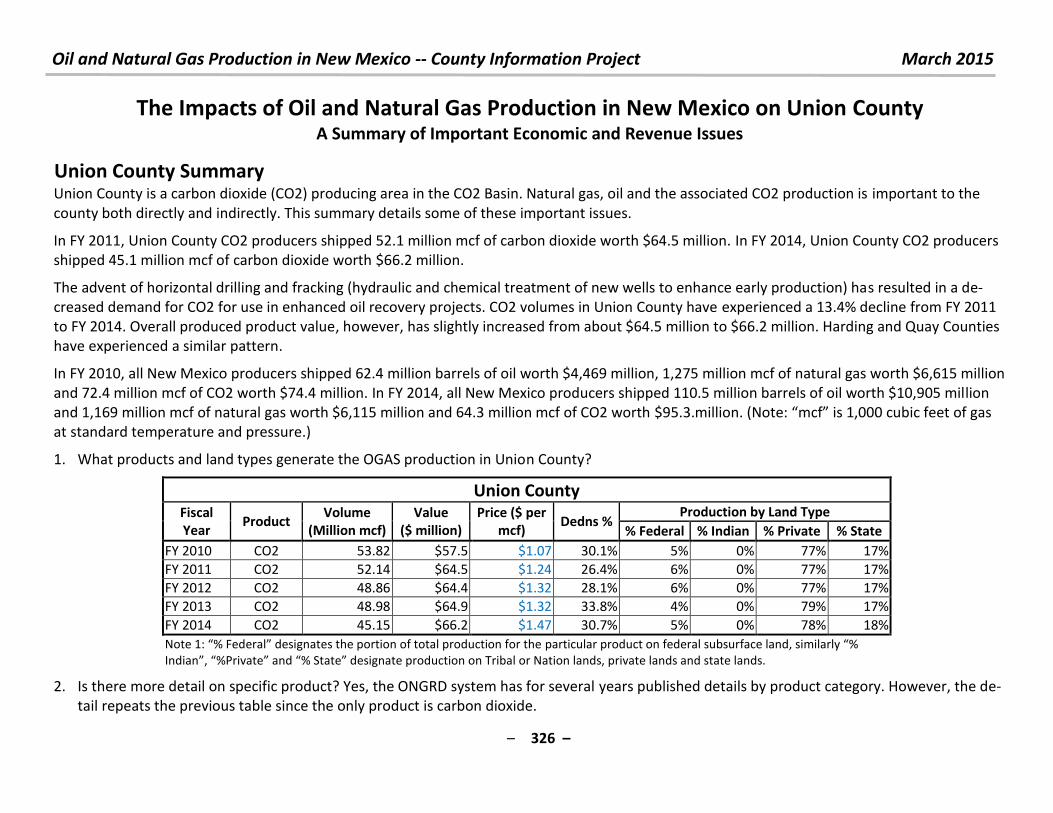
Oil and Natural Gas Production in New Mexico -- County Information Project March 2015
– 326 –
The Impacts of Oil and Natural Gas Production in New Mexico on Union County A Summary of Important Economic and Revenue Issues
Union County Summary
Union County is a carbon dioxide (CO2) producing area in the CO2 Basin. Natural gas, oil and the associated CO2 production is important to the
county both directly and indirectly. This summary details some of these important issues.
In FY 2011, Union County CO2 producers shipped 52.1 million mcf of carbon dioxide worth $64.5 million. In FY 2014, Union County CO2 producers
shipped 45.1 million mcf of carbon dioxide worth $66.2 million.
The advent of horizontal drilling and fracking (hydraulic and chemical treatment of new wells to enhance early production) has resulted in a de-
creased demand for CO2 for use in enhanced oil recovery projects. CO2 volumes in Union County have experienced a 13.4% decline from FY 2011
to FY 2014. Overall produced product value, however, has slightly increased from about $64.5 million to $66.2 million. Harding and Quay Counties
have experienced a similar pattern.
In FY 2010, all New Mexico producers shipped 62.4 million barrels of oil worth $4,469 million, 1,275 million mcf of natural gas worth $6,615 million
and 72.4 million mcf of CO2 worth $74.4 million. In FY 2014, all New Mexico producers shipped 110.5 million barrels of oil worth $10,905 million
and 1,169 million mcf of natural gas worth $6,115 million and 64.3 million mcf of CO2 worth $ . . illio . Note: f is , u i feet of gas at standard temperature and pressure.)
1. What products and land types generate the OGAS production in Union County?
Union County Fiscal
Year Product
Volume
(Million mcf)
Value
($ million)
Price ($ per
mcf) Dedns %
Production by Land Type
% Federal % Indian % Private % State
FY 2010 CO2 53.82 $57.5 $1.07 30.1% 5% 0% 77% 17%
FY 2011 CO2 52.14 $64.5 $1.24 26.4% 6% 0% 77% 17%
FY 2012 CO2 48.86 $64.4 $1.32 28.1% 6% 0% 77% 17%
FY 2013 CO2 48.98 $64.9 $1.32 33.8% 4% 0% 79% 17%
FY 2014 CO2 45.15 $66.2 $1.47 30.7% 5% 0% 78% 18%
Note : % Fede al desig ates the po tio of total p odu tio fo the pa ti ula p odu t o fede al su su fa e la d, si ila l % I dia , %P i ate a d % “tate desig ate p odu tio o T i al o Natio la ds, p i ate la ds a d state la ds.
2. Is there more detail on specific product? Yes, the ONGRD system has for several years published details by product category. However, the de-
tail repeats the previous table since the only product is carbon dioxide.
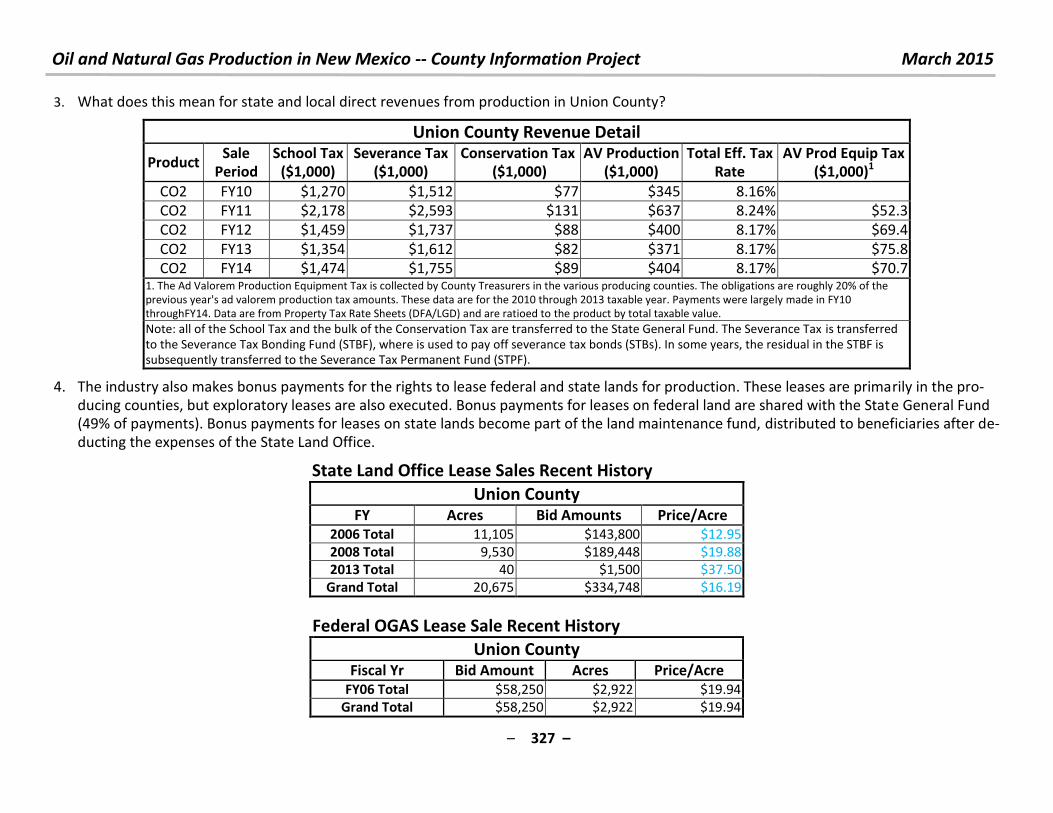
Oil and Natural Gas Production in New Mexico -- County Information Project March 2015
– 327 –
3. What does this mean for state and local direct revenues from production in Union County?
Union County Revenue Detail
Product Sale
Period
School Tax
($1,000)
Severance Tax
($1,000)
Conservation Tax
($1,000)
AV Production
($1,000)
Total Eff. Tax
Rate
AV Prod Equip Tax
($1,000)1
CO2 FY10 $1,270 $1,512 $77 $345 8.16%
CO2 FY11 $2,178 $2,593 $131 $637 8.24% $52.3
CO2 FY12 $1,459 $1,737 $88 $400 8.17% $69.4
CO2 FY13 $1,354 $1,612 $82 $371 8.17% $75.8
CO2 FY14 $1,474 $1,755 $89 $404 8.17% $70.7 1. The Ad Valorem Production Equipment Tax is collected by County Treasurers in the various producing counties. The obligations are roughly 20% of the
previous year's ad valorem production tax amounts. These data are for the 2010 through 2013 taxable year. Payments were largely made in FY10
throughFY14. Data are from Property Tax Rate Sheets (DFA/LGD) and are ratioed to the product by total taxable value.
Note: all of the School Tax and the bulk of the Conservation Tax are transferred to the State General Fund. The Severance Tax is transferred
to the Severance Tax Bonding Fund (STBF), where is used to pay off severance tax bonds (STBs). In some years, the residual in the STBF is
subsequently transferred to the Severance Tax Permanent Fund (STPF).
4. The industry also makes bonus payments for the rights to lease federal and state lands for production. These leases are primarily in the pro-
ducing counties, but exploratory leases are also executed. Bonus payments for leases on federal land are shared with the State General Fund (49% of payments). Bonus payments for leases on state lands become part of the land maintenance fund, distributed to beneficiaries after de-
ducting the expenses of the State Land Office.
State Land Office Lease Sales Recent History
Union County FY Acres Bid Amounts Price/Acre
2006 Total 11,105 $143,800 $12.95
2008 Total 9,530 $189,448 $19.88
2013 Total 40 $1,500 $37.50
Grand Total 20,675 $334,748 $16.19
Federal OGAS Lease Sale Recent History
Union County Fiscal Yr Bid Amount Acres Price/Acre
FY06 Total $58,250 $2,922 $19.94
Grand Total $58,250 $2,922 $19.94
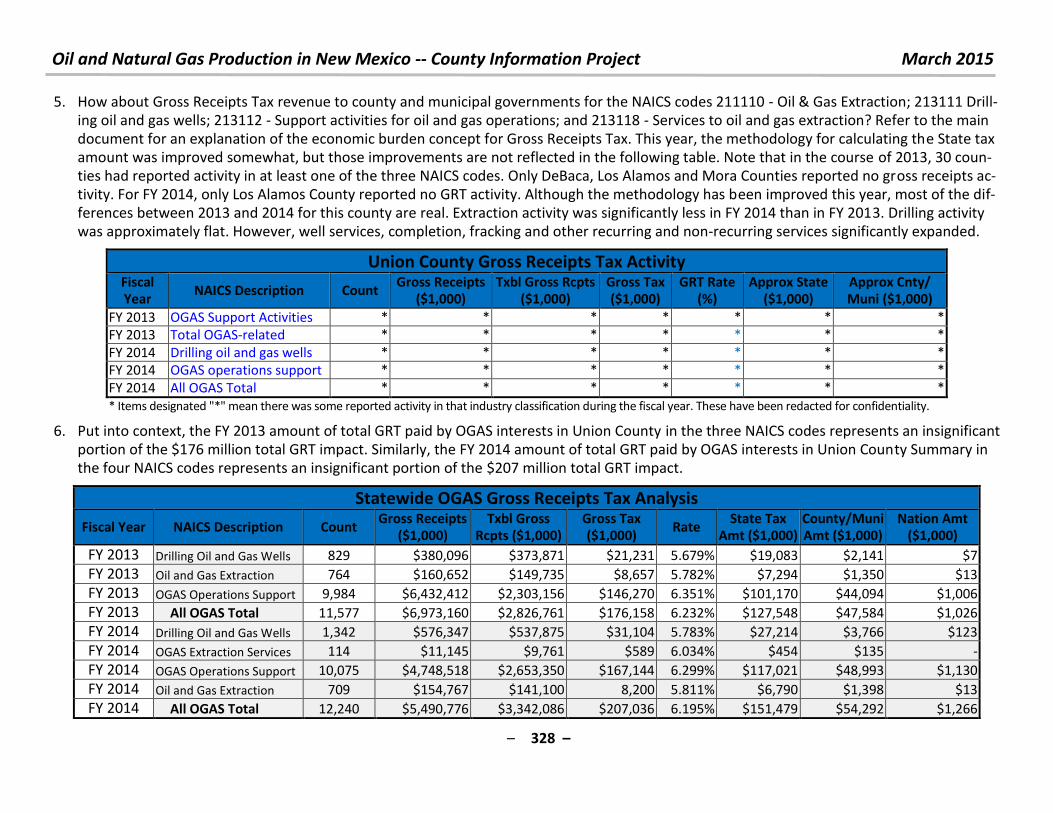
Oil and Natural Gas Production in New Mexico -- County Information Project March 2015
– 328 –
5. How about Gross Receipts Tax revenue to county and municipal governments for the NAICS codes 211110 - Oil & Gas Extraction; 213111 Drill-
ing oil and gas wells; 213112 - Support activities for oil and gas operations; and 213118 - Services to oil and gas extraction? Refer to the main
document for an explanation of the economic burden concept for Gross Receipts Tax. This year, the methodology for calculating the State tax
amount was improved somewhat, but those improvements are not reflected in the following table. Note that in the course of 2013, 30 coun-
ties had reported activity in at least one of the three NAICS codes. Only DeBaca, Los Alamos and Mora Counties reported no gross receipts ac-
tivity. For FY 2014, only Los Alamos County reported no GRT activity. Although the methodology has been improved this year, most of the dif-
ferences between 2013 and 2014 for this county are real. Extraction activity was significantly less in FY 2014 than in FY 2013. Drilling activity
was approximately flat. However, well services, completion, fracking and other recurring and non-recurring services significantly expanded.
Union County Gross Receipts Tax Activity Fiscal Year
NAICS Description Count Gross Receipts
($1,000) Txbl Gross Rcpts
($1,000) Gross Tax ($1,000)
GRT Rate (%)
Approx State ($1,000)
Approx Cnty/ Muni ($1,000)
FY 2013 OGAS Support Activities * * * * * * *
FY 2013 Total OGAS-related * * * * * * *
FY 2014 Drilling oil and gas wells * * * * * * *
FY 2014 OGAS operations support * * * * * * *
FY 2014 All OGAS Total * * * * * * *
* Items designated "*" mean there was some reported activity in that industry classification during the fiscal year. These have been redacted for confidentiality.
6. Put into context, the FY 2013 amount of total GRT paid by OGAS interests in Union County in the three NAICS codes represents an insignificant
portion of the $176 million total GRT impact. Similarly, the FY 2014 amount of total GRT paid by OGAS interests in Union County Summary in
the four NAICS codes represents an insignificant portion of the $207 million total GRT impact.
Statewide OGAS Gross Receipts Tax Analysis
Fiscal Year NAICS Description Count Gross Receipts
($1,000) Txbl Gross
Rcpts ($1,000) Gross Tax ($1,000)
Rate State Tax
Amt ($1,000) County/Muni Amt ($1,000)
Nation Amt ($1,000)
FY 2013 Drilling Oil and Gas Wells 829 $380,096 $373,871 $21,231 5.679% $19,083 $2,141 $7
FY 2013 Oil and Gas Extraction 764 $160,652 $149,735 $8,657 5.782% $7,294 $1,350 $13
FY 2013 OGAS Operations Support 9,984 $6,432,412 $2,303,156 $146,270 6.351% $101,170 $44,094 $1,006
FY 2013 All OGAS Total 11,577 $6,973,160 $2,826,761 $176,158 6.232% $127,548 $47,584 $1,026
FY 2014 Drilling Oil and Gas Wells 1,342 $576,347 $537,875 $31,104 5.783% $27,214 $3,766 $123
FY 2014 OGAS Extraction Services 114 $11,145 $9,761 $589 6.034% $454 $135 -
FY 2014 OGAS Operations Support 10,075 $4,748,518 $2,653,350 $167,144 6.299% $117,021 $48,993 $1,130
FY 2014 Oil and Gas Extraction 709 $154,767 $141,100 8,200 5.811% $6,790 $1,398 $13
FY 2014 All OGAS Total 12,240 $5,490,776 $3,342,086 $207,036 6.195% $151,479 $54,292 $1,266
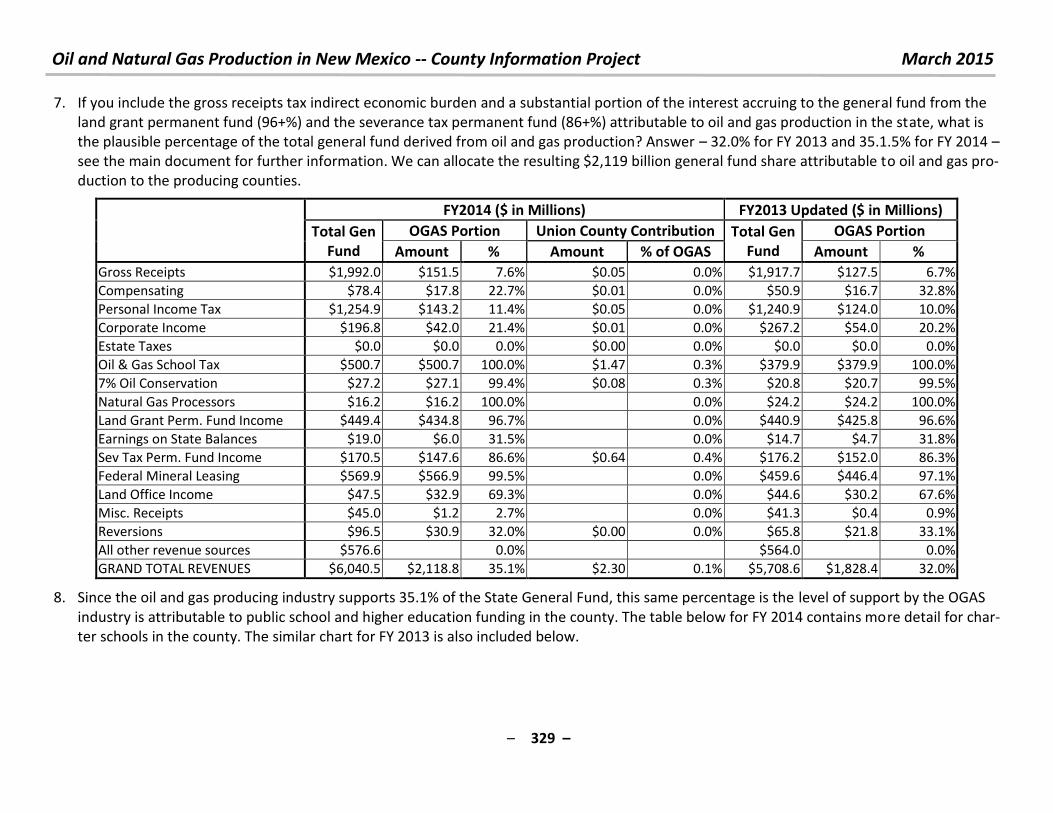
Oil and Natural Gas Production in New Mexico -- County Information Project March 2015
– 329 –
7. If you include the gross receipts tax indirect economic burden and a substantial portion of the interest accruing to the general fund from the
land grant permanent fund (96+%) and the severance tax permanent fund (86+%) attributable to oil and gas production in the state, what is
the plausible percentage of the total general fund derived from oil and gas production? Answer – 32.0% for FY 2013 and 35.1.5% for FY 2014 –
see the main document for further information. We can allocate the resulting $2,119 billion general fund share attributable to oil and gas pro-
duction to the producing counties.
FY2014 ($ in Millions) FY2013 Updated ($ in Millions)
Total Gen
Fund
OGAS Portion Union County Contribution Total Gen
Fund
OGAS Portion
Amount % Amount % of OGAS Amount %
Gross Receipts $1,992.0 $151.5 7.6% $0.05 0.0% $1,917.7 $127.5 6.7%
Compensating $78.4 $17.8 22.7% $0.01 0.0% $50.9 $16.7 32.8%
Personal Income Tax $1,254.9 $143.2 11.4% $0.05 0.0% $1,240.9 $124.0 10.0%
Corporate Income $196.8 $42.0 21.4% $0.01 0.0% $267.2 $54.0 20.2%
Estate Taxes $0.0 $0.0 0.0% $0.00 0.0% $0.0 $0.0 0.0%
Oil & Gas School Tax $500.7 $500.7 100.0% $1.47 0.3% $379.9 $379.9 100.0%
7% Oil Conservation $27.2 $27.1 99.4% $0.08 0.3% $20.8 $20.7 99.5%
Natural Gas Processors $16.2 $16.2 100.0% 0.0% $24.2 $24.2 100.0%
Land Grant Perm. Fund Income $449.4 $434.8 96.7% 0.0% $440.9 $425.8 96.6%
Earnings on State Balances $19.0 $6.0 31.5% 0.0% $14.7 $4.7 31.8%
Sev Tax Perm. Fund Income $170.5 $147.6 86.6% $0.64 0.4% $176.2 $152.0 86.3%
Federal Mineral Leasing $569.9 $566.9 99.5% 0.0% $459.6 $446.4 97.1%
Land Office Income $47.5 $32.9 69.3% 0.0% $44.6 $30.2 67.6%
Misc. Receipts $45.0 $1.2 2.7% 0.0% $41.3 $0.4 0.9%
Reversions $96.5 $30.9 32.0% $0.00 0.0% $65.8 $21.8 33.1%
All other revenue sources $576.6 0.0% $564.0 0.0%
GRAND TOTAL REVENUES $6,040.5 $2,118.8 35.1% $2.30 0.1% $5,708.6 $1,828.4 32.0%
8. Since the oil and gas producing industry supports 35.1% of the State General Fund, this same percentage is the level of support by the OGAS
industry is attributable to public school and higher education funding in the county. The table below for FY 2014 contains more detail for char-
ter schools in the county. The similar chart for FY 2013 is also included below.
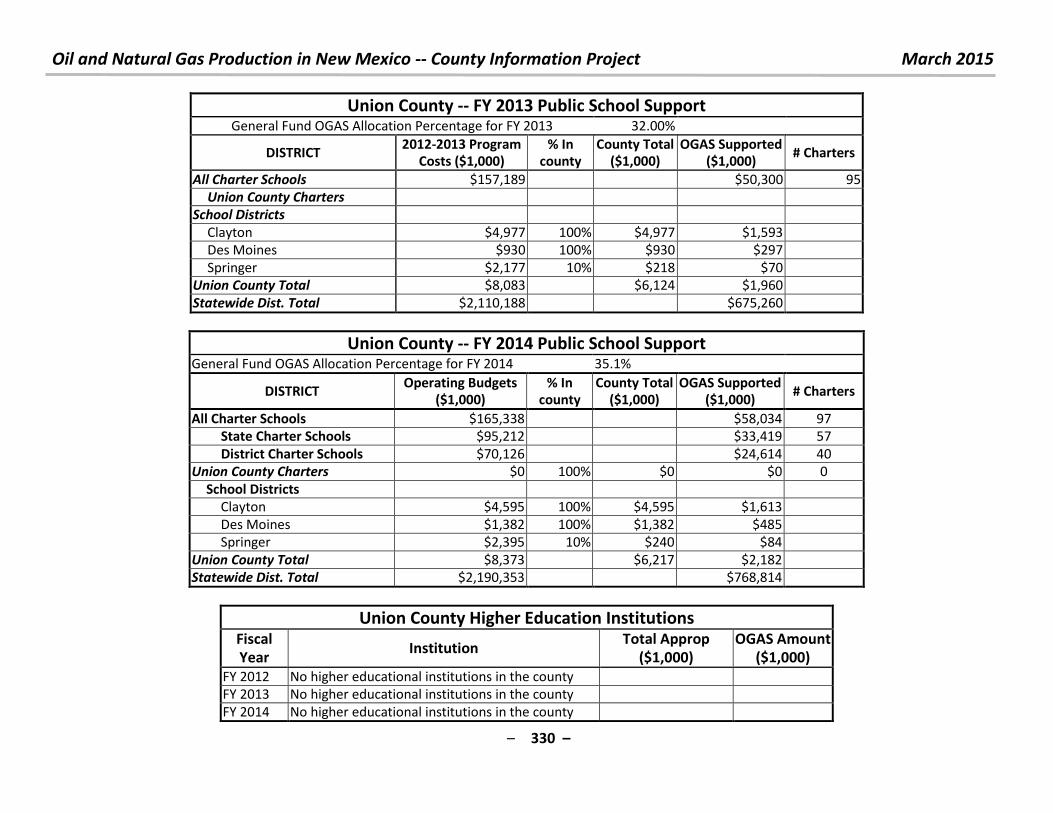
Oil and Natural Gas Production in New Mexico -- County Information Project March 2015
– 330 –
Union County -- FY 2013 Public School Support General Fund OGAS Allocation Percentage for FY 2013 32.00%
DISTRICT 2012-2013 Program
Costs ($1,000) % In
county County Total
($1,000) OGAS Supported
($1,000) # Charters
All Charter Schools $157,189 $50,300 95
Union County Charters
School Districts
Clayton $4,977 100% $4,977 $1,593
Des Moines $930 100% $930 $297
Springer $2,177 10% $218 $70
Union County Total $8,083 $6,124 $1,960
Statewide Dist. Total $2,110,188 $675,260
Union County -- FY 2014 Public School Support General Fund OGAS Allocation Percentage for FY 2014 35.1%
DISTRICT Operating Budgets
($1,000) % In
county County Total
($1,000) OGAS Supported
($1,000) # Charters
All Charter Schools $165,338 $58,034 97
State Charter Schools $95,212 $33,419 57
District Charter Schools $70,126 $24,614 40
Union County Charters $0 100% $0 $0 0
School Districts
Clayton $4,595 100% $4,595 $1,613
Des Moines $1,382 100% $1,382 $485
Springer $2,395 10% $240 $84
Union County Total $8,373 $6,217 $2,182
Statewide Dist. Total $2,190,353 $768,814
Union County Higher Education Institutions Fiscal
Year Institution
Total Approp
($1,000)
OGAS Amount
($1,000)
FY 2012 No higher educational institutions in the county
FY 2013 No higher educational institutions in the county
FY 2014 No higher educational institutions in the county
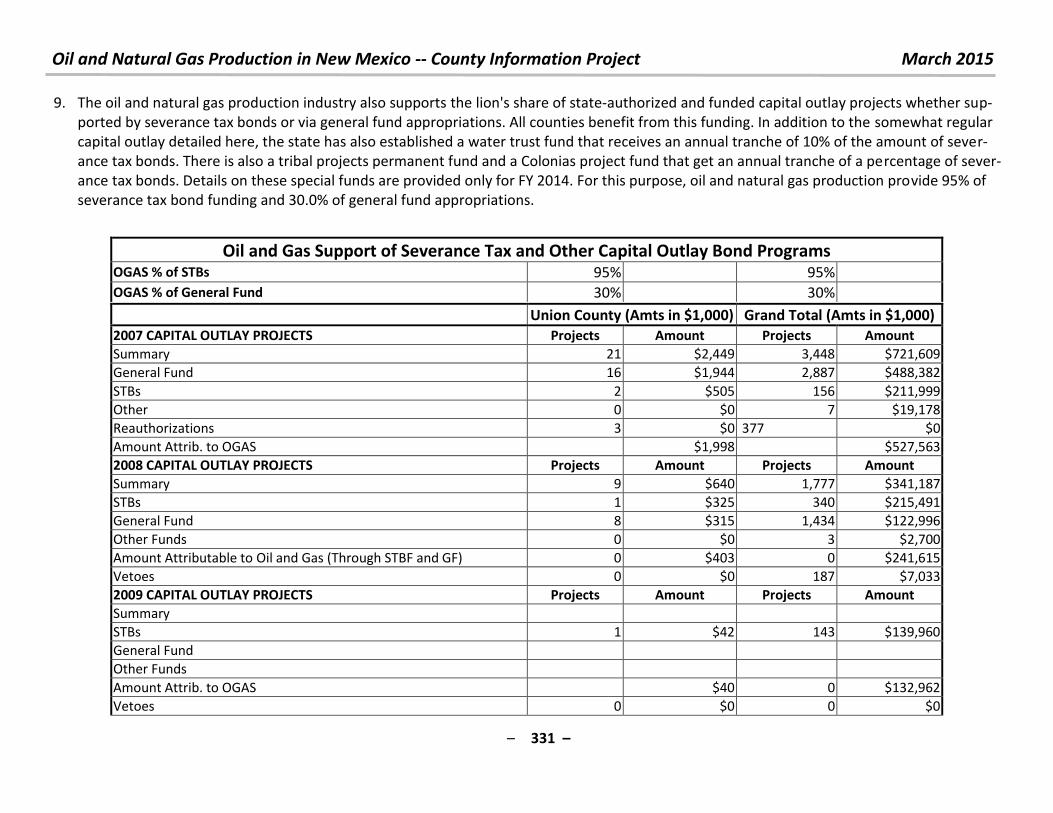
Oil and Natural Gas Production in New Mexico -- County Information Project March 2015
– 331 –
9. The oil and natural gas production industry also supports the lion's share of state-authorized and funded capital outlay projects whether sup-
ported by severance tax bonds or via general fund appropriations. All counties benefit from this funding. In addition to the somewhat regular
capital outlay detailed here, the state has also established a water trust fund that receives an annual tranche of 10% of the amount of sever-
ance tax bonds. There is also a tribal projects permanent fund and a Colonias project fund that get an annual tranche of a percentage of sever-
ance tax bonds. Details on these special funds are provided only for FY 2014. For this purpose, oil and natural gas production provide 95% of
severance tax bond funding and 30.0% of general fund appropriations.
Oil and Gas Support of Severance Tax and Other Capital Outlay Bond Programs OGAS % of STBs 95% 95%
OGAS % of General Fund 30% 30% Union County (Amts in $1,000) Grand Total (Amts in $1,000)
2007 CAPITAL OUTLAY PROJECTS Projects Amount Projects Amount
Summary 21 $2,449 3,448 $721,609
General Fund 16 $1,944 2,887 $488,382
STBs 2 $505 156 $211,999
Other 0 $0 7 $19,178
Reauthorizations 3 $0 377 $0
Amount Attrib. to OGAS $1,998 $527,563
2008 CAPITAL OUTLAY PROJECTS Projects Amount Projects Amount
Summary 9 $640 1,777 $341,187
STBs 1 $325 340 $215,491
General Fund 8 $315 1,434 $122,996
Other Funds 0 $0 3 $2,700
Amount Attributable to Oil and Gas (Through STBF and GF) 0 $403 0 $241,615
Vetoes 0 $0 187 $7,033
2009 CAPITAL OUTLAY PROJECTS Projects Amount Projects Amount
Summary
STBs 1 $42 143 $139,960
General Fund
Other Funds
Amount Attrib. to OGAS $40 0 $132,962
Vetoes 0 $0 0 $0
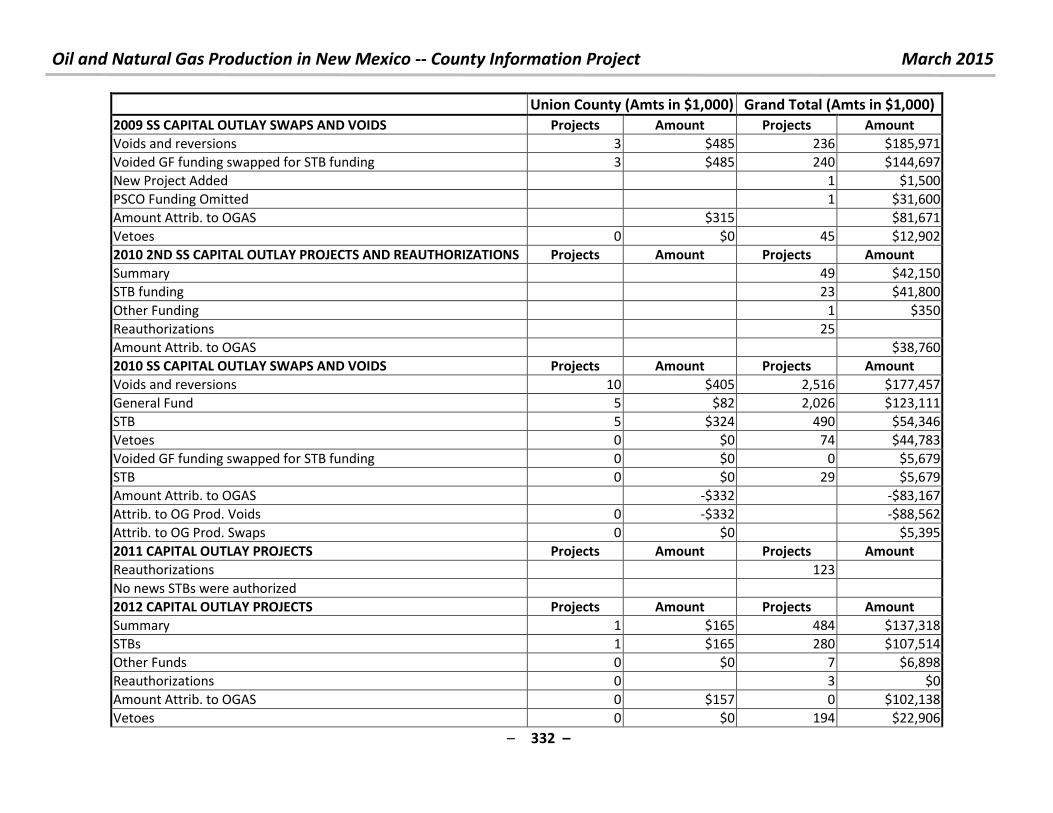
Oil and Natural Gas Production in New Mexico -- County Information Project March 2015
– 332 –
Union County (Amts in $1,000) Grand Total (Amts in $1,000)
2009 SS CAPITAL OUTLAY SWAPS AND VOIDS Projects Amount Projects Amount
Voids and reversions 3 $485 236 $185,971
Voided GF funding swapped for STB funding 3 $485 240 $144,697
New Project Added 1 $1,500
PSCO Funding Omitted 1 $31,600
Amount Attrib. to OGAS $315 $81,671
Vetoes 0 $0 45 $12,902
2010 2ND SS CAPITAL OUTLAY PROJECTS AND REAUTHORIZATIONS Projects Amount Projects Amount
Summary 49 $42,150
STB funding 23 $41,800
Other Funding 1 $350
Reauthorizations 25
Amount Attrib. to OGAS $38,760
2010 SS CAPITAL OUTLAY SWAPS AND VOIDS Projects Amount Projects Amount
Voids and reversions 10 $405 2,516 $177,457
General Fund 5 $82 2,026 $123,111
STB 5 $324 490 $54,346
Vetoes 0 $0 74 $44,783
Voided GF funding swapped for STB funding 0 $0 0 $5,679
STB 0 $0 29 $5,679
Amount Attrib. to OGAS -$332 -$83,167
Attrib. to OG Prod. Voids 0 -$332 -$88,562
Attrib. to OG Prod. Swaps 0 $0 $5,395
2011 CAPITAL OUTLAY PROJECTS Projects Amount Projects Amount
Reauthorizations 123
No news STBs were authorized
2012 CAPITAL OUTLAY PROJECTS Projects Amount Projects Amount
Summary 1 $165 484 $137,318
STBs 1 $165 280 $107,514
Other Funds 0 $0 7 $6,898
Reauthorizations 0 3 $0
Amount Attrib. to OGAS 0 $157 0 $102,138
Vetoes 0 $0 194 $22,906
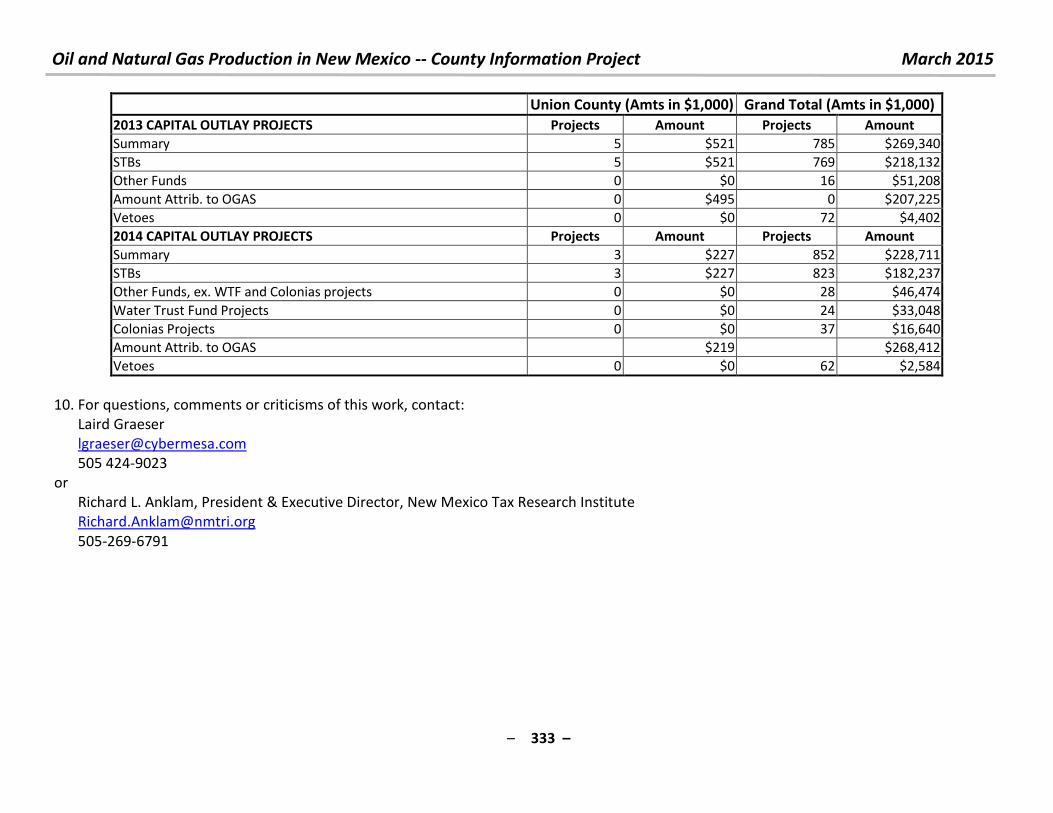
Oil and Natural Gas Production in New Mexico -- County Information Project March 2015
– 333 –
Union County (Amts in $1,000) Grand Total (Amts in $1,000)
2013 CAPITAL OUTLAY PROJECTS Projects Amount Projects Amount
Summary 5 $521 785 $269,340
STBs 5 $521 769 $218,132
Other Funds 0 $0 16 $51,208
Amount Attrib. to OGAS 0 $495 0 $207,225
Vetoes 0 $0 72 $4,402
2014 CAPITAL OUTLAY PROJECTS Projects Amount Projects Amount
Summary 3 $227 852 $228,711
STBs 3 $227 823 $182,237
Other Funds, ex. WTF and Colonias projects 0 $0 28 $46,474
Water Trust Fund Projects 0 $0 24 $33,048
Colonias Projects 0 $0 37 $16,640
Amount Attrib. to OGAS $219 $268,412
Vetoes 0 $0 62 $2,584
10. For questions, comments or criticisms of this work, contact:
Laird Graeser
505 424-9023
or
Richard L. Anklam, President & Executive Director, New Mexico Tax Research Institute
505-269-6791
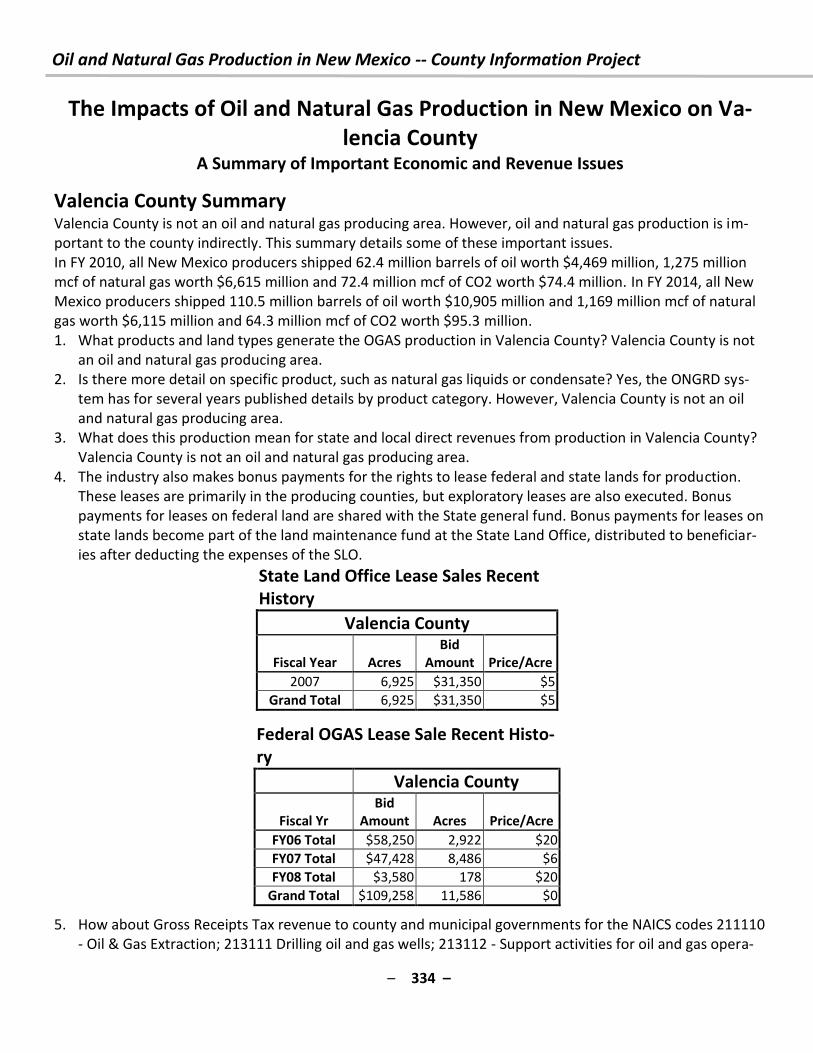
Oil and Natural Gas Production in New Mexico -- County Information Project
– 334 –
The Impacts of Oil and Natural Gas Production in New Mexico on Va-
lencia County A Summary of Important Economic and Revenue Issues
Valencia County Summary
Valencia County is not an oil and natural gas producing area. However, oil and natural gas production is im-
portant to the county indirectly. This summary details some of these important issues.
In FY 2010, all New Mexico producers shipped 62.4 million barrels of oil worth $4,469 million, 1,275 million
mcf of natural gas worth $6,615 million and 72.4 million mcf of CO2 worth $74.4 million. In FY 2014, all New
Mexico producers shipped 110.5 million barrels of oil worth $10,905 million and 1,169 million mcf of natural
gas worth $6,115 million and 64.3 million mcf of CO2 worth $95.3 million.
1. What products and land types generate the OGAS production in Valencia County? Valencia County is not
an oil and natural gas producing area.
2. Is there more detail on specific product, such as natural gas liquids or condensate? Yes, the ONGRD sys-
tem has for several years published details by product category. However, Valencia County is not an oil
and natural gas producing area.
3. What does this production mean for state and local direct revenues from production in Valencia County?
Valencia County is not an oil and natural gas producing area.
4. The industry also makes bonus payments for the rights to lease federal and state lands for production.
These leases are primarily in the producing counties, but exploratory leases are also executed. Bonus
payments for leases on federal land are shared with the State general fund. Bonus payments for leases on
state lands become part of the land maintenance fund at the State Land Office, distributed to beneficiar-
ies after deducting the expenses of the SLO.
State Land Office Lease Sales Recent
History
Valencia County
Fiscal Year Acres
Bid
Amount Price/Acre
2007 6,925 $31,350 $5
Grand Total 6,925 $31,350 $5
Federal OGAS Lease Sale Recent Histo-
ry
Valencia County
Fiscal Yr
Bid
Amount Acres Price/Acre
FY06 Total $58,250 2,922 $20
FY07 Total $47,428 8,486 $6
FY08 Total $3,580 178 $20
Grand Total $109,258 11,586 $0
5. How about Gross Receipts Tax revenue to county and municipal governments for the NAICS codes 211110
- Oil & Gas Extraction; 213111 Drilling oil and gas wells; 213112 - Support activities for oil and gas opera-
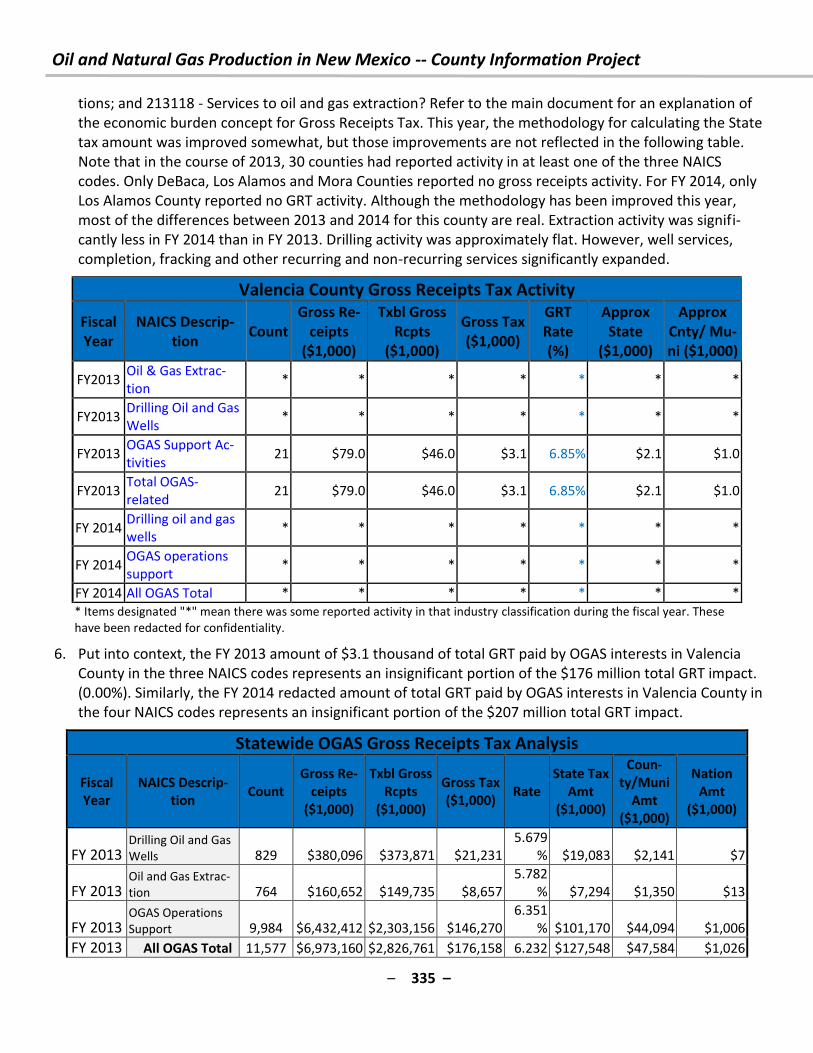
Oil and Natural Gas Production in New Mexico -- County Information Project
– 335 –
tions; and 213118 - Services to oil and gas extraction? Refer to the main document for an explanation of
the economic burden concept for Gross Receipts Tax. This year, the methodology for calculating the State
tax amount was improved somewhat, but those improvements are not reflected in the following table.
Note that in the course of 2013, 30 counties had reported activity in at least one of the three NAICS
codes. Only DeBaca, Los Alamos and Mora Counties reported no gross receipts activity. For FY 2014, only
Los Alamos County reported no GRT activity. Although the methodology has been improved this year,
most of the differences between 2013 and 2014 for this county are real. Extraction activity was signifi-
cantly less in FY 2014 than in FY 2013. Drilling activity was approximately flat. However, well services,
completion, fracking and other recurring and non-recurring services significantly expanded.
Valencia County Gross Receipts Tax Activity
Fiscal
Year
NAICS Descrip-
tion Count
Gross Re-
ceipts
($1,000)
Txbl Gross
Rcpts
($1,000)
Gross Tax
($1,000)
GRT
Rate
(%)
Approx
State
($1,000)
Approx
Cnty/ Mu-
ni ($1,000)
FY2013 Oil & Gas Extrac-
tion * * * * * * *
FY2013 Drilling Oil and Gas
Wells * * * * * * *
FY2013 OGAS Support Ac-
tivities 21 $79.0 $46.0 $3.1 6.85% $2.1 $1.0
FY2013 Total OGAS-
related 21 $79.0 $46.0 $3.1 6.85% $2.1 $1.0
FY 2014 Drilling oil and gas
wells * * * * * * *
FY 2014 OGAS operations
support * * * * * * *
FY 2014 All OGAS Total * * * * * * *
* Items designated "*" mean there was some reported activity in that industry classification during the fiscal year. These
have been redacted for confidentiality.
6. Put into context, the FY 2013 amount of $3.1 thousand of total GRT paid by OGAS interests in Valencia
County in the three NAICS codes represents an insignificant portion of the $176 million total GRT impact.
(0.00%). Similarly, the FY 2014 redacted amount of total GRT paid by OGAS interests in Valencia County in
the four NAICS codes represents an insignificant portion of the $207 million total GRT impact.
Statewide OGAS Gross Receipts Tax Analysis
Fiscal
Year
NAICS Descrip-
tion Count
Gross Re-
ceipts
($1,000)
Txbl Gross
Rcpts
($1,000)
Gross Tax
($1,000) Rate
State Tax
Amt
($1,000)
Coun-
ty/Muni
Amt
($1,000)
Nation
Amt
($1,000)
FY 2013 Drilling Oil and Gas
Wells 829 $380,096 $373,871 $21,231
5.679
% $19,083 $2,141 $7
FY 2013 Oil and Gas Extrac-
tion 764 $160,652 $149,735 $8,657
5.782
% $7,294 $1,350 $13
FY 2013 OGAS Operations
Support 9,984 $6,432,412 $2,303,156 $146,270
6.351
% $101,170 $44,094 $1,006
FY 2013 All OGAS Total 11,577 $6,973,160 $2,826,761 $176,158 6.232 $127,548 $47,584 $1,026
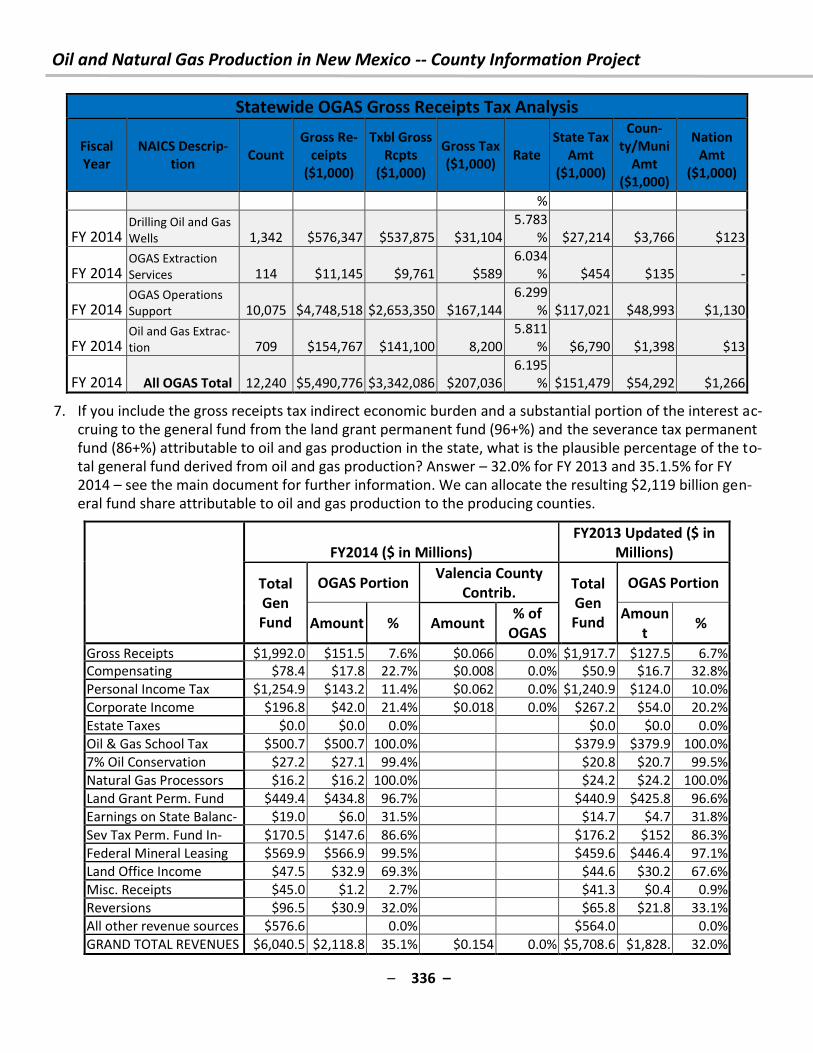
Oil and Natural Gas Production in New Mexico -- County Information Project
– 336 –
Statewide OGAS Gross Receipts Tax Analysis
Fiscal
Year
NAICS Descrip-
tion Count
Gross Re-
ceipts
($1,000)
Txbl Gross
Rcpts
($1,000)
Gross Tax
($1,000) Rate
State Tax
Amt
($1,000)
Coun-
ty/Muni
Amt
($1,000)
Nation
Amt
($1,000)
%
FY 2014 Drilling Oil and Gas
Wells 1,342 $576,347 $537,875 $31,104
5.783
% $27,214 $3,766 $123
FY 2014 OGAS Extraction
Services 114 $11,145 $9,761 $589
6.034
% $454 $135 -
FY 2014 OGAS Operations
Support 10,075 $4,748,518 $2,653,350 $167,144
6.299
% $117,021 $48,993 $1,130
FY 2014 Oil and Gas Extrac-
tion 709 $154,767 $141,100 8,200
5.811
% $6,790 $1,398 $13
FY 2014 All OGAS Total 12,240 $5,490,776 $3,342,086 $207,036
6.195
% $151,479 $54,292 $1,266
7. If you include the gross receipts tax indirect economic burden and a substantial portion of the interest ac-
cruing to the general fund from the land grant permanent fund (96+%) and the severance tax permanent
fund (86+%) attributable to oil and gas production in the state, what is the plausible percentage of the to-
tal general fund derived from oil and gas production? Answer – 32.0% for FY 2013 and 35.1.5% for FY
2014 – see the main document for further information. We can allocate the resulting $2,119 billion gen-
eral fund share attributable to oil and gas production to the producing counties.
FY2014 ($ in Millions)
FY2013 Updated ($ in
Millions)
Total
Gen
Fund
OGAS Portion Valencia County
Contrib. Total
Gen
Fund
OGAS Portion
Amount % Amount % of
OGAS
Amoun
t %
Gross Receipts $1,992.0 $151.5 7.6% $0.066 0.0% $1,917.7 $127.5 6.7%
Compensating $78.4 $17.8 22.7% $0.008 0.0% $50.9 $16.7 32.8%
Personal Income Tax $1,254.9 $143.2 11.4% $0.062 0.0% $1,240.9 $124.0 10.0%
Corporate Income $196.8 $42.0 21.4% $0.018 0.0% $267.2 $54.0 20.2%
Estate Taxes $0.0 $0.0 0.0% $0.0 $0.0 0.0%
Oil & Gas School Tax $500.7 $500.7 100.0% $379.9 $379.9 100.0%
7% Oil Conservation $27.2 $27.1 99.4% $20.8 $20.7 99.5%
Natural Gas Processors $16.2 $16.2 100.0% $24.2 $24.2 100.0%
Land Grant Perm. Fund $449.4 $434.8 96.7% $440.9 $425.8 96.6%
Earnings on State Balanc- $19.0 $6.0 31.5% $14.7 $4.7 31.8%
Sev Tax Perm. Fund In- $170.5 $147.6 86.6% $176.2 $152 86.3%
Federal Mineral Leasing $569.9 $566.9 99.5% $459.6 $446.4 97.1%
Land Office Income $47.5 $32.9 69.3% $44.6 $30.2 67.6%
Misc. Receipts $45.0 $1.2 2.7% $41.3 $0.4 0.9%
Reversions $96.5 $30.9 32.0% $65.8 $21.8 33.1%
All other revenue sources $576.6 0.0% $564.0
0.0%
GRAND TOTAL REVENUES $6,040.5 $2,118.8 35.1% $0.154 0.0% $5,708.6 $1,828. 32.0%
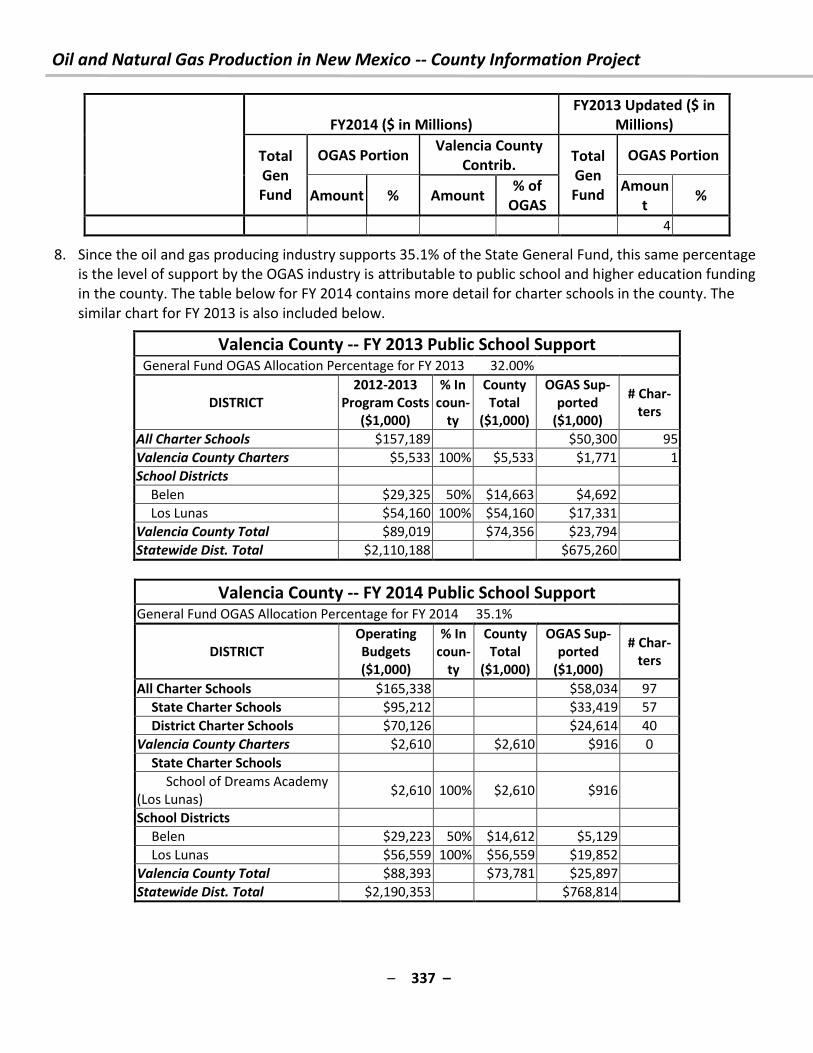
Oil and Natural Gas Production in New Mexico -- County Information Project
– 337 –
FY2014 ($ in Millions)
FY2013 Updated ($ in
Millions)
Total
Gen
Fund
OGAS Portion Valencia County
Contrib. Total
Gen
Fund
OGAS Portion
Amount % Amount % of
OGAS
Amoun
t %
4
8. Since the oil and gas producing industry supports 35.1% of the State General Fund, this same percentage
is the level of support by the OGAS industry is attributable to public school and higher education funding
in the county. The table below for FY 2014 contains more detail for charter schools in the county. The
similar chart for FY 2013 is also included below.
Valencia County -- FY 2013 Public School Support General Fund OGAS Allocation Percentage for FY 2013 32.00%
DISTRICT
2012-2013
Program Costs
($1,000)
% In
coun-
ty
County
Total
($1,000)
OGAS Sup-
ported
($1,000)
# Char-
ters
All Charter Schools $157,189 $50,300 95
Valencia County Charters $5,533 100% $5,533 $1,771 1
School Districts
Belen $29,325 50% $14,663 $4,692
Los Lunas $54,160 100% $54,160 $17,331
Valencia County Total $89,019 $74,356 $23,794
Statewide Dist. Total $2,110,188 $675,260
Valencia County -- FY 2014 Public School Support General Fund OGAS Allocation Percentage for FY 2014 35.1%
DISTRICT
Operating
Budgets
($1,000)
% In
coun-
ty
County
Total
($1,000)
OGAS Sup-
ported
($1,000)
# Char-
ters
All Charter Schools $165,338 $58,034 97
State Charter Schools $95,212 $33,419 57
District Charter Schools $70,126 $24,614 40
Valencia County Charters $2,610 $2,610 $916 0
State Charter Schools
School of Dreams Academy
(Los Lunas) $2,610 100% $2,610 $916
School Districts
Belen $29,223 50% $14,612 $5,129
Los Lunas $56,559 100% $56,559 $19,852
Valencia County Total $88,393 $73,781 $25,897
Statewide Dist. Total $2,190,353 $768,814
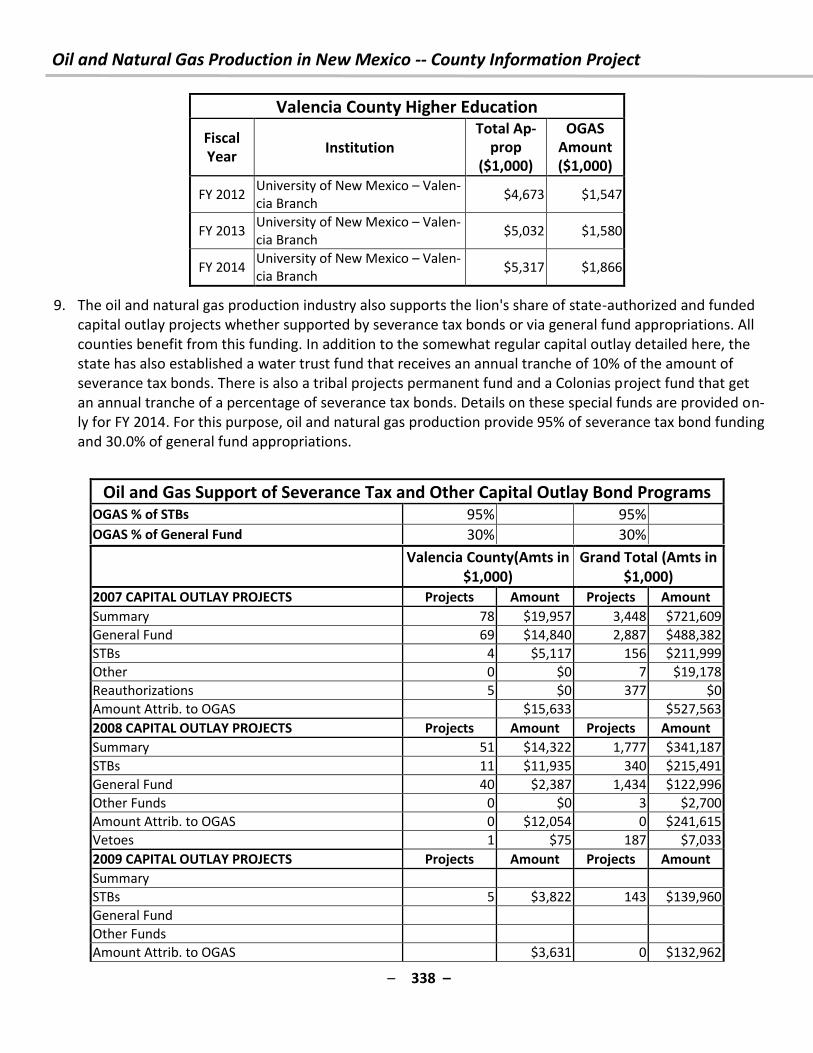
Oil and Natural Gas Production in New Mexico -- County Information Project
– 338 –
Valencia County Higher Education
Fiscal
Year Institution
Total Ap-
prop
($1,000)
OGAS
Amount
($1,000)
FY 2012 University of New Mexico – Valen-
cia Branch $4,673 $1,547
FY 2013 University of New Mexico – Valen-
cia Branch $5,032 $1,580
FY 2014 University of New Mexico – Valen-
cia Branch $5,317 $1,866
9. The oil and natural gas production industry also supports the lion's share of state-authorized and funded
capital outlay projects whether supported by severance tax bonds or via general fund appropriations. All
counties benefit from this funding. In addition to the somewhat regular capital outlay detailed here, the
state has also established a water trust fund that receives an annual tranche of 10% of the amount of
severance tax bonds. There is also a tribal projects permanent fund and a Colonias project fund that get
an annual tranche of a percentage of severance tax bonds. Details on these special funds are provided on-
ly for FY 2014. For this purpose, oil and natural gas production provide 95% of severance tax bond funding
and 30.0% of general fund appropriations.
Oil and Gas Support of Severance Tax and Other Capital Outlay Bond Programs OGAS % of STBs 95% 95%
OGAS % of General Fund 30% 30%
Valencia County(Amts in
$1,000)
Grand Total (Amts in
$1,000)
2007 CAPITAL OUTLAY PROJECTS Projects Amount Projects Amount
Summary 78 $19,957 3,448 $721,609
General Fund 69 $14,840 2,887 $488,382
STBs 4 $5,117 156 $211,999
Other 0 $0 7 $19,178
Reauthorizations 5 $0 377 $0
Amount Attrib. to OGAS $15,633 $527,563
2008 CAPITAL OUTLAY PROJECTS Projects Amount Projects Amount
Summary 51 $14,322 1,777 $341,187
STBs 11 $11,935 340 $215,491
General Fund 40 $2,387 1,434 $122,996
Other Funds 0 $0 3 $2,700
Amount Attrib. to OGAS 0 $12,054 0 $241,615
Vetoes 1 $75 187 $7,033
2009 CAPITAL OUTLAY PROJECTS Projects Amount Projects Amount
Summary
STBs 5 $3,822 143 $139,960
General Fund
Other Funds
Amount Attrib. to OGAS $3,631 0 $132,962
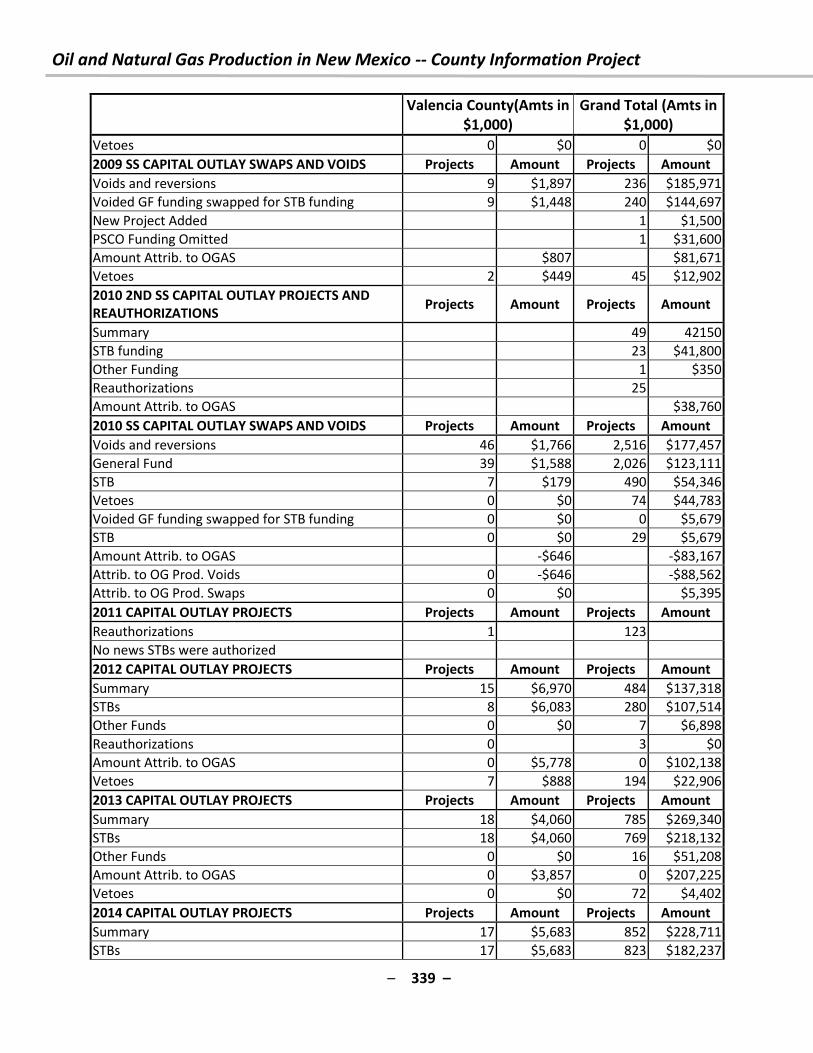
Oil and Natural Gas Production in New Mexico -- County Information Project
– 339 –
Valencia County(Amts in
$1,000)
Grand Total (Amts in
$1,000)
Vetoes 0 $0 0 $0
2009 SS CAPITAL OUTLAY SWAPS AND VOIDS Projects Amount Projects Amount
Voids and reversions 9 $1,897 236 $185,971
Voided GF funding swapped for STB funding 9 $1,448 240 $144,697
New Project Added 1 $1,500
PSCO Funding Omitted 1 $31,600
Amount Attrib. to OGAS $807 $81,671
Vetoes 2 $449 45 $12,902
2010 2ND SS CAPITAL OUTLAY PROJECTS AND
REAUTHORIZATIONS Projects Amount Projects Amount
Summary 49 42150
STB funding 23 $41,800
Other Funding 1 $350
Reauthorizations 25
Amount Attrib. to OGAS $38,760
2010 SS CAPITAL OUTLAY SWAPS AND VOIDS Projects Amount Projects Amount
Voids and reversions 46 $1,766 2,516 $177,457
General Fund 39 $1,588 2,026 $123,111
STB 7 $179 490 $54,346
Vetoes 0 $0 74 $44,783
Voided GF funding swapped for STB funding 0 $0 0 $5,679
STB 0 $0 29 $5,679
Amount Attrib. to OGAS -$646 -$83,167
Attrib. to OG Prod. Voids 0 -$646 -$88,562
Attrib. to OG Prod. Swaps 0 $0 $5,395
2011 CAPITAL OUTLAY PROJECTS Projects Amount Projects Amount
Reauthorizations 1 123
No news STBs were authorized
2012 CAPITAL OUTLAY PROJECTS Projects Amount Projects Amount
Summary 15 $6,970 484 $137,318
STBs 8 $6,083 280 $107,514
Other Funds 0 $0 7 $6,898
Reauthorizations 0 3 $0
Amount Attrib. to OGAS 0 $5,778 0 $102,138
Vetoes 7 $888 194 $22,906
2013 CAPITAL OUTLAY PROJECTS Projects Amount Projects Amount
Summary 18 $4,060 785 $269,340
STBs 18 $4,060 769 $218,132
Other Funds 0 $0 16 $51,208
Amount Attrib. to OGAS 0 $3,857 0 $207,225
Vetoes 0 $0 72 $4,402
2014 CAPITAL OUTLAY PROJECTS Projects Amount Projects Amount
Summary 17 $5,683 852 $228,711
STBs 17 $5,683 823 $182,237
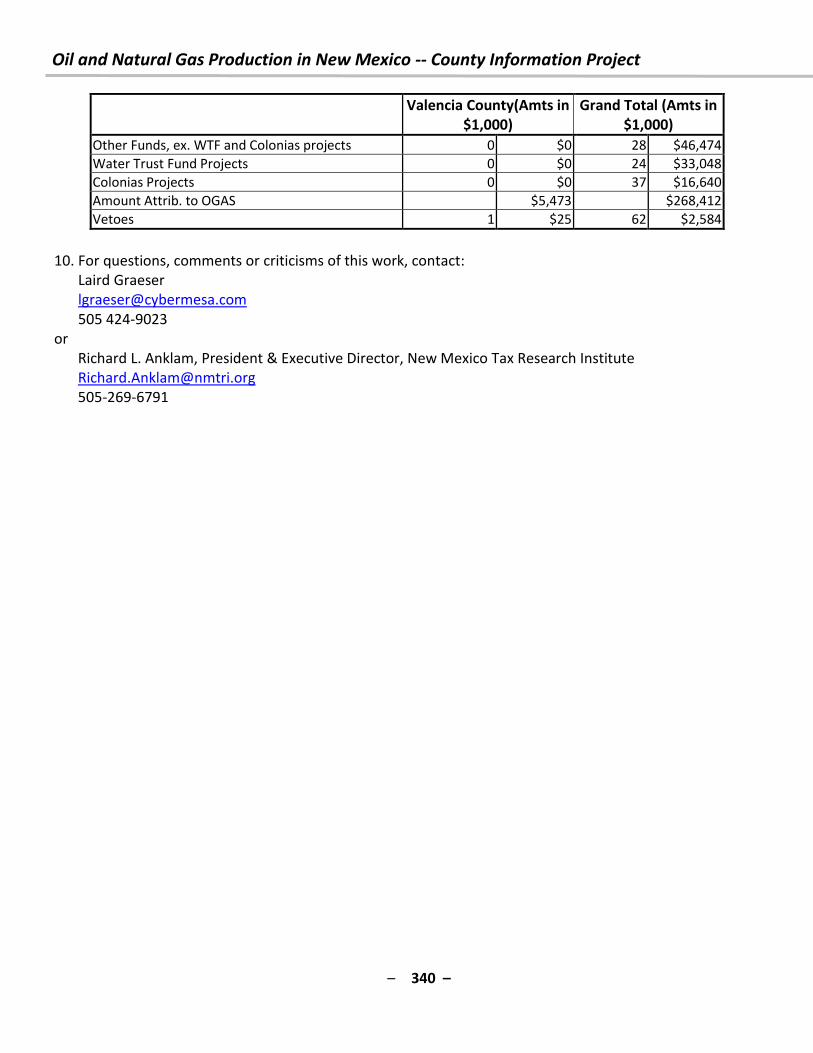
Oil and Natural Gas Production in New Mexico -- County Information Project
– 340 –
Valencia County(Amts in
$1,000)
Grand Total (Amts in
$1,000)
Other Funds, ex. WTF and Colonias projects 0 $0 28 $46,474
Water Trust Fund Projects 0 $0 24 $33,048
Colonias Projects 0 $0 37 $16,640
Amount Attrib. to OGAS $5,473 $268,412
Vetoes 1 $25 62 $2,584
10. For questions, comments or criticisms of this work, contact:
Laird Graeser
505 424-9023
or
Richard L. Anklam, President & Executive Director, New Mexico Tax Research Institute
505-269-6791