Embed Size (px)
Citation preview
A Coruña Aachen Aalborg Aberdeen Acireale Adana Aix-en-Provence Ajaccio Alba Iulia Albacete Alcalá de Henares Alcobendas Alcorcón Algeciras
Alicante Alkmaar Almada Almelo Almere Almería Alphen aan den Rijn Alytus Amadora Amersfoort Amstelveen Amsterdam Ancona Angoulême Ankara
Annecy Antalya Antwerpen Apeldoorn Arad Argenteuil - Bezons Århus Arnhem Arrecife Aschaffenburg Ashford Asti Athina Aubagne Augsburg Aveiro
Avellino Avilés Bacău Badajoz Badalona Baia Mare Balıkesir Bamberg Banská Bystrica Barakaldo Barcelona Bari Barking and Dagenham Bârlad Barletta
Barnet Barnsley Barreiro Basel Basildon Basingstoke and Deane Bath and North East Somerset Bayreuth Bedford Belfast Benevento Benidorm Bergamo
Bergen op Zoom Bergisch Gladbach Berlin Bern Besançon Bexley Białystok Biel Bielefeld Biella Bielsko-Biała Bilbao Birmingham Blackburn with Darwen
Blackpool Blagoevgrad Bochum Bologna Bolton Bolzano Bonn Borås Bordeaux Botoşani Bottrop Bournemouth Bracknell Forest Bradford Braga Brăila
Brandenburg an der Havel Braşov Bratislava Braunschweig Breda Bremen Bremerhaven Brent Brescia Brest Brighton and Hove Bristol Brno Bromley
Brugge Bruxelles Bucureşti Budapest Burgas Burgos Burnley Bursa Bury Busto Arsizio Buzău Bydgoszcz Bytom CA Brie Francilienne CA de la Vallée de
Montmorency CA de Seine Essonne CA de Sophia-Antipolis CA des deux Rives de la Seine CA des Lacs de l'Essonne CA du Plateau de Saclay CA du
Val d'Orge CA du Val d'Yerres CA Europ' Essonne CA le Parisis CA les Portes de l'Essonne CA Marne et Chantereine CA Sénart - Val de Seine CA Val
de France CA Val et Forêt Cáceres Cádiz Cagliari Calais Cǎlǎraşi Cambridge Camden Campobasso Cannock Chase Capelle aan den IJssel Cardiff
Carlisle Carrara Cartagena Caserta Castelldefels Castellón de la Plana Catania Catanzaro CC de la Boucle de la Seine CC de l'Ouest de la Plaine de
France CC des Coteaux de la Seine Celle Cerdanyola del Vallès Cergy-Pontoise České Budějovice Ceuta Charleroi Charleville-Mézières Chełm
Chelmsford Cheltenham Chemnitz Cherbourg Chesterfield Chorzów City of London Ciudad Real Cluj-Napoca Coimbra Colchester Colmar Como
Constanţa Córdoba Cork Cornellà de Llobregat Cosenza Coslada Cottbus Coventry Craiova Crawley Creil Cremona Croydon Częstochowa Dacorum
Darlington Darmstadt Daugavpils Debrecen Delft Denizli Derby Derry Dessau-Roßlau Deventer Diyarbakır Dobrich Doncaster Dordrecht Dortmund Dos
Hermanas Dresden Drobeta-Turnu Severin Dublin Dudley Duisburg Dundee City Dunkerque Düsseldorf Ealing East Staffordshire Eastbourne Ede
Edinburgh Edirne Eindhoven Elbląg Elche Elda Ełk Enfield Enschede Erfurt Erlangen Erzurum Espoo Essen Esslingen am Neckar Evry Exeter Falkirk
Fareham Faro Ferrara Ferrol Firenze Flensburg Focşani Foggia Forlì Fort-de-France Frankenthal (Pfalz) Frankfurt (Oder) Frankfurt am Main Freiburg im
Breisgau Fréjus Friedrichshafen Fuengirola Fuenlabrada Fulda Funchal Fürth Galaţi Galway Gandia Gateshead Gaziantep Gdańsk Gdynia Gelsenkirchen
Genève Genova Gent Gera Getafe Getxo Gießen Gijón Girona Giugliano in Campania Giurgiu Glasgow Gliwice Głogów Gloucester Gniezno Gondomar
Görlitz Gorzów Wielkopolski Göteborg Göttingen Gouda Granada Granollers Gravesham Graz Great Yarmouth Greenwich Greifswald Groningen
Grudziądz Guadalajara Guildford Guimarães Gyõr Haarlem Hackney Hagen Halle an der Saale Halton Hamburg Hamm Hammersmith and Fulham Hanau
Hannover Haringey Harlow Harrow Hartlepool Haskovo Hastings Hatay Havering Havířov Heerlen Heidelberg Heilbronn Helmond Helsingborg Hengelo
Hénin - Carvin Herne Hildesheim Hillingdon Hilversum Hoorn Hounslow Hradec Králové Huelva Hyndburn Iaşi Ingolstadt Innsbruck Inowrocław Ioannina
Ipswich Irakleio Irun Iserlohn Islington İstanbul İzmir Jaén Jastrzębie-Zdrój Jelenia Góra Jelgava Jena Jerez de la Frontera Jihlava Jönköping Jyväskylä
Kaiserslautern Kalamata Kalisz Karlovy Vary Karlsruhe Kars Karviná Kassel Kastamonu Katowice Katwijk Kaunas Kavala Kayseri Kecskemét Kempten
(Allgäu) Kensington and Chelsea Kiel Kielce Kingston upon Thames Kingston-upon-Hull Kirklees Kladno Klagenfurt Klaipėda København Koblenz Kocaeli
Köln Konin Konstanz Konya Kortrijk Košice Koszalin Kraków Krefeld Kristiansand Kuopio La Rochelle La Spezia Lahti /Lahtis Lambeth Landshut Larisa
Las Palmas Latina Lausanne Le Havre Lecce Lecco Leeds Leeuwarden Lefkosia Leganés Legnica Leicester Leiden Leidschendam-Voorburg Leipzig
Lelystad Lemesos Lens - Liévin León Leszno Leuven Leverkusen Lewisham L'Hospitalet de Llobregat Liberec Liège Liepāja Lille Limerick Lincoln
Línea de la Concepción, La Linköping Linz Lisboa Lisburn Liverpool Livorno Ljubljana Lleida Łódź Logroño Łomża Lübeck Lubin Lublin Ludwigsburg
Ludwigshafen am Rhein Lugano Lugo Lund Lüneburg Luton Luxembourg Luzern Maastricht Madrid Magdeburg Maidstone Mainz Majadahonda Málaga
Malatya Malmö Manchester Manisa Mannheim Manresa Mansfield Mantes en Yvelines Marbella Marburg Maribor Marne la Vallée Marseille Martigues
Massa Mataró Matera Matosinhos Meaux Medway Melilla Melun Merton Messina Middelburg Middlesbrough Milano Milton Keynes Miskolc Modena
Moers Mollet del Vallès Mönchengladbach Mons Montpellier Monza Most Móstoles Mülheim a.d.Ruhr München Münster Murcia Namur Nancy Nantes
Napoli Narva Neubrandenburg Neumünster Neuss Neu-Ulm Nevşehir Newcastle upon Tyne Newcastle-under-Lyme Newham Newport Nijmegen Nitra
Norrköping North East Lincolnshire North Lanarkshire North Tyneside Northampton Norwich Nottingham Novara Nowy Sącz Nuneaton and Bedworth
Nürnberg Nyíregyháza Oberhausen Odense Odivelas Offenbach am Main Offenburg Oldenburg Oldham Olomouc Olsztyn Oostende Opole
Oradea Örebro Orléans Osijek Oslo Osnabrück Ostrava Ostrów Wielkopolski Ostrowiec Świętokrzyski Ourense Oviedo Oxford Pabianice Paderborn
Padova Palencia Palermo Palma de Mallorca Pamplona/Iruña Panevėžys Pardubice Paredes Paris Parla Parma Passau Pátra Pavia Pazardzhik
Pécs Pernik Perugia Pesaro Pescara Peterborough Pforzheim Piacenza Piatra Neamţ Piła Piotrków Trybunalski Pisa Piteşti Plauen Pleven Płock Ploieşti
Plovdiv Plymouth Plzeň Ponferrada Ponta Delgada Pontevedra Poole Pordenone Porto Portsmouth Potenza Potsdam Póvoa de Varzim Poznań Pozuelo
de Alarcón Praha Prat de Llobregat, El Prato Prešov Preston Przemyśl Puerto de Santa María, El Purmerend Radom Râmnicu Vâlcea Ravenna Reading
Recklinghausen Redbridge Redditch Regensburg Reggio di Calabria Reggio nell'Emilia Reims Remscheid Reus Reutlingen Reykjavík Richmond
upon Thames Rīga Rijeka Rimini Roanne Rochdale Roma Roman Roosendaal Rosenheim Rostock Rotherham Rotterdam Rozas de Madrid, Las Rubí
Ruda Śląska Ruse Rybnik Rzeszów Saarbrücken Sabadell Saint Denis Saint-Brieuc Saint-Etienne Saint-Quentin en Yvelines Salamanca Salerno
Salford Salzburg Salzgitter Samsun San Cristóbal de la Laguna San Fernando San Sebastián de los Reyes San Sebastián/Donostia Sandwell Sankt
Augustin Sanlúcar de Barrameda Sanremo Sant Boi de Llobregat Sant Cugat del Vallès Santa Coloma de Gramenet Santa Cruz de Tenerife Santa Lucía
de Tirajana Santander Santiago de Compostela Sassari Satu Mare Savona Schiedam Schweinfurt Schwerin Sefton Seixal Sénart en Essonne
Setúbal Sevilla 's-Gravenhage Sheffield 's-Hertogenbosch Shumen Šiauliai Sibiu Siedlce Siegen Siirt Sindelfingen Sintra Siracusa Sittard-Geleen Slatina
Slavonski Brod Sliven Slough Słupsk Sofia Solihull Solingen Sosnowiec South Tyneside Southampton Southend-on-Sea Southwark Speyer Spijkenisse
Split St Albans St. Gallen St.Helens Stalowa Wola Stara Zagora Stargard Szczeciński Stavanger Stevenage Stockholm Stockport S tockton-on-Tees
Stoke-on-trent Stralsund Stuttgart Suceava Sunderland Sutton Suwałki Swansea Świdnica Swindon Szczecin Szeged Székesfehérvár Szombathely
Talavera de la Reina Tallinn Tameside Tampere / Tammerfors Tamworth Taranto Târgovişte Târgu Jiu Târgu Mureş Tarnów Tarragona Tartu Tczew
Telde Telford and Wrekin Terni Terrassa Thanet Thessaloniki Thurrock Tilburg Timişoara Toledo Tomaszów Mazowiecki Torbay Torino Torrejón de Ardoz
Torremolinos Torrevieja Toruń Tower Hamlets Trabzon Trafford Trenčín Trento Treviso Trier Trieste Trnava Tromsø Trondheim Tübingen Tulcea
Tunbridge Wells Turku Tychy Udine Ulm Umeå Uppsala Ústí nad Labem Utrecht Valence Valencia Valladolid Valletta Valongo Van Vantaa Varese Varna
Västerås Veliko Tarnovo Velsen Venezia Venlo Verona Versailles Viana do Castelo Viareggio Vicenza Vidin Vigevano Vigo Vila Franca de Xira Vila Nova
de Gaia Viladecans Vilanova i la Geltrú Villingen-Schwenningen Vilnius Viseu Vitoria/Gasteiz Vlaardingen Volos Vratsa Wakefield Wałbrzych Walsall
Waltham Forest Wandsworth Warrington Warszawa Warwick Waterford Waveney Weimar Westminster Wetzlar Wien Wiesbaden Wigan Wilhelmshaven
Winterthur Wirral Witten Włocławek Woking Wolfsburg Wolverhampton Worcester Worthing Wrexham Wrocław Wuppertal Würzburg
Wycombe Yambol York Zaanstad Zabrze Zagreb Zamora Zamość Zaragoza Zgierz Zielona Góra Žilina Zlín Zonguldak Żory Zürich Zwickau Zwolle
Joint project with the German Federal Statistical Office and the Statistical
Offices of the Federal States (Länder), promoted by Eurostat
Promoted by Eurostat, the statistical office of the European Union
KOSIS Association Urban Audit
The German Urban Audit
Quality of Life in the City and Suburban Areas

2 Table of contents
Publication Details
Title
Quality of Life in the City and Suburban Areas
Editor
KOSIS Association Urban Audit
c/o City of Mannheim, Municipal Statistics Office
PO Box 101832
68018 Mannheim
November 2017
Conception, editorial work and layout
Alexandra Dörzenbach, Tobias Link, and Ellen Schneider,
KOSIS Association Urban Audit
Production
City of Mannheim, city printing house
Funded by a EUROSTAT grant
Circulation and source
PDF version (German or English), print version (German, 280
pcs.; English, 50 pcs.): available free of charge, direct inquiries to
Cover page
Illustration: © European Union
The back cover lists all the Urban Audit cities for the 2016/2017
funding period.
© Reproduction, including excerpts, permitted with reference to the source.
Table of contents 3
Table of contents
Table of contents ........................................................................... 3
Introduction .................................................................................... 5
I A focus on spatial levels – the Urban Audit suburban areas ....... 8
1. Definition of an Urban Audit City and its Functional Urban
Area according to the degree of urbanization........................ 9
2. Urban Audit data for suburban areas – from compilation to
visualisation......................................................................... 13
3. Comparisons between cities and suburban areas using
German Urban Audit data ................................................... 18
4. Structures of the residential, household and population in the
Swiss core cities and their communiting zones ................... 28
II A focus on data – establishing sources for Urban Audit and data
use .......................................................................................... 32
1. Measuring the total length of cycle networks in Urban Audit
cities based on OpenStreetMap data .................................. 33
2. Data use made easy ........................................................... 55
Appendix...................................................................................... 57
Contacts and responsibilities ................................................... 57
Publications .............................................................................. 59

4 Table of contents
Introduction 5
Introduction
The current KOSIS Association Urban Audit brochure bears the
title “Quality of Life in the City and Suburban Areas” and is thus a
continuation of the long-term focus on the utilisation of
comparative urban data. While the last brochure focused on
measuring the quality of life, the primary emphasis of this brochure
is to compile existing data for cities and their suburban areas and
to assess alternative sources of data.
The first chapter is dedicated to the newly developed spatial level
of suburban areas, which is calculated from the difference
between the functional urban areas (FUAs) that were already
included in the data collection and the Urban Audit cities. As
requested by city representatives at various events during the last
year, it begins with an introduction of Eurostat’s definition of Urban
Audit cities and FUAs. Next, the technical calculation and the
provision of data for Germany is explained. Finally, two articles
discuss the evaluation of data: First, example indicators for the
quality of life in German cities and their suburban areas are
analysed. Second, the housing, household, and population
structure of core Swiss cities and their commuting zones are
compared with one another and with the rest of Europe.
The second chapter discusses the compilation of new sources of
data and provides an overview of possible uses for the data.
Whether geo-data from alternative sources can be used for the
variable “Length of cycle network in kilometres” is currently being
tested. Until now, data for this variable was supplied by the cities
themselves. The first results have encouraged additional
evaluations and are most certainly relevant, including for people
interested in fields other than the Urban Audit collection of city
data.
Overall, the urban dimension appears to be increasingly important.
This is reflected, for example, in the Eurostat annual work
programme and a renewed call for funding proposals for
subnational statistics. As the managing office of the KOSIS
Association Urban Audit, the city of Mannheim is again closely
cooperating with the statistical office of Eurostat to submit an
application for funding for the coming funding period in 2018/2019.
The funds were fully approved, so that we can look forward to a
continued contribution to the European collection of urban data.
During the current funding period, we have been working
intensively on compiling and providing data for suburban areas. In

6 Introduction
these times of a rapidly increasing production of data, the focus of
the next funding period will, once again, most certainly be on
establishing new sources of data – this year’s brochure on the use
of open data will be a preview in this respect.
I hope you will enjoy reading this Urban Audit brochure!
Dr Ellen Schneider
City of Mannheim
Director, Municipal Statistics Office
Mannheim, 10 November 2017

Introduction 7
8 I A focus on spatial levels – the Urban Audit suburban
areas
I A focus on spatial levels – the Urban Audit
suburban areas
The KOSIS Association Urban Audit collects data not only for 127
German cities but also for 96 functional urban areas (FUAs).
The latter comprise a combination of cities and suburban areas
that share commuting patterns. A direct comparison with suburban
areas is also extremely interesting for cities. For this reason, the
managing office of the KOSIS Association Urban Audit compiled
data for the suburban areas, which was calculated from the
difference between the FUAs that were already part of the data
collection and the Urban Audit cities.
In order to make it easier for cities to use this new data, the
Eurostat definition of Urban Audit cities and FUAs will be
presented in the first article of this chapter. This definition focuses
on the degree of urbanisation, which is the basis for defining the
city limits, and the commuting patterns, which define the suburban
areas.
The second section demonstrates how city values can be
subtracted from the FUA data that was previously provided for
Germany in order to calculate values for the suburban areas of
German cities. In addition to the technical aspect of calculating
and providing data and adapting and integrating geometries, the
illustration of this data for suburban areas is addressed in the
Structural Data Atlas.
These articles, which are somewhat technical and methodical in
nature, are followed by two practical texts. First, Christina
Neuhaus uses objective indicators to compare the quality of life in
German cities and their suburban areas.
Finally, Anna-Katharina Lautenschütz analyses the housing,
household and population structures in the Swiss core cities and
their commuting zones. To do so, she also makes European
comparisons.
Chapter overview
Definition Urban Audit city/ functional urban area
Compilation and illustration of data for suburban areas in the German Urban Audit
A comparison of cities and suburban areas in Germany
A comparison of cities and suburban areas in Switzerland
I A focus on spatial levels – the Urban Audit suburban areas
9
1. Definition of an Urban Audit City and its Functional Urban
Area according to the degree of urbanization1
by Alexandra Dörzenbach and Tobias Link
The degree of urbanisation as the basis for a harmonised
definition of cities
Urban and rural areas are two central concepts widely used in
politics, research and in international organisations such as the
United Nations or the EU. However, for a very long time there
were no uniform definitions for these concepts and whenever
transnational data were published, country-specific definitions
were always the basis, which opposed the desire for
comparability.
A first approach to the standardisation of territorial schemes based
on the degree of urbanisation dates back to 1991. It
distinguishes between densely, intermediate and thinly populated
areas on the basis of the respective population size or density in
local administrative units level 2 (LAU2), which in Germany
correspond to the municipalities and unincorporated areas. As the
size of LAU2s varies considerably between countries, this affects
comparability between countries with large and such with small
LAU2s. As a result, the original threshold of urbanisation had to be
set at a fairly low 500 inhabitants per km2 (and at least 50,000
inhabitants) in order for cities in large LAU2s to still receive the
status of densely populated. For countries with smaller LAU2s, this
meant that too many fell into the "densely populated" category.
To avoid this kind of bias, a way had to be found to look at the
population distribution within the LAU2s using smaller spatial units
of equal size. The use of a population grid with a resolution of
one km2 should solve this problem. At EU level, a population grid
covering all member states was established. On the one hand,
data from individual member states that had already established
such a population grid on the basis of local population registers or
other detailed sources could be used (bottom-up method). On the
other hand, for countries without a population grid using the
bottom-up method, a disaggregation grid could be created (top-
down method), which assigns population data at LAU2 level to the
1 This article is based on information from publications of the European Commission (Working Papers WP 01/2014, Lewis Dijkstra und Hugo Poelman: „A harmonised definition of cities and rural areas: the new degree of urbanisation“) and Eurostat (Methodological manual on city statistics, 2017 edition)
10 I A focus on spatial levels – the Urban Audit suburban
areas
individual one km2 grid cells according to land use and land cover
information, e.g. from satellite images.
The degree of urbanisation newly defined in 2010/11 on the basis
of the population grid retains the three previous classifications for
LAU2 areas, but the criteria applied are changing: In densely
populated areas (cities) at least 50% of the population must live in
urban centres (also called high-density clusters). This is
explained in more detail in the following section. In areas with an
intermediate population density, less than 50% of the population
live in rural grid cells (less than 300 inhabitants per km2) and less
than 50% of the population in urban centres. Thinly populated
areas are characterised by the fact that more than 50% of the
population live in rural grid cells.
The Urban Audit City
The procedure for identifying an Urban Audit City will be discussed
in more detail in the following. The foundation for this is the new
degree of urbanisation on the basis of the population grid as
described in the previous section.
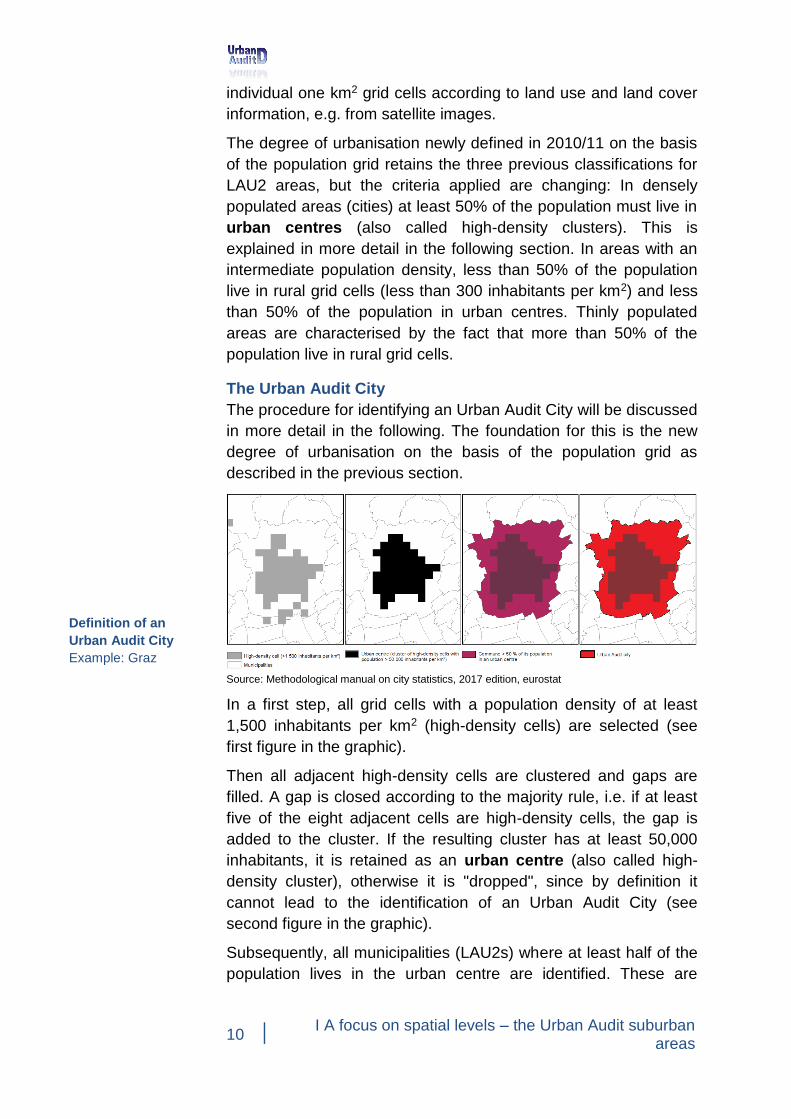
Source: Methodological manual on city statistics, 2017 edition, eurostat
In a first step, all grid cells with a population density of at least
1,500 inhabitants per km2 (high-density cells) are selected (see
first figure in the graphic).
Then all adjacent high-density cells are clustered and gaps are
filled. A gap is closed according to the majority rule, i.e. if at least
five of the eight adjacent cells are high-density cells, the gap is
added to the cluster. If the resulting cluster has at least 50,000
inhabitants, it is retained as an urban centre (also called high-
density cluster), otherwise it is "dropped", since by definition it
cannot lead to the identification of an Urban Audit City (see
second figure in the graphic).
Subsequently, all municipalities (LAU2s) where at least half of the
population lives in the urban centre are identified. These are
Definition of an
Urban Audit City
Example: Graz
I A focus on spatial levels – the Urban Audit suburban areas
11
candidates to become part of the city (see third figure in the
graphic).
Finally, the following criteria must be met for the city area
determined in this way: There is a link to a political (administrative)
level, at least 50% of the total urban population live in an urban
centre and at least 75% of the population of the urban centre live
in the city. In most cases, this last step is not necessary, since the
city usually consists of a municipality which as an administrative
unit completely encloses the urban centre and the great majority of
the city dwellers live in this urban centre.
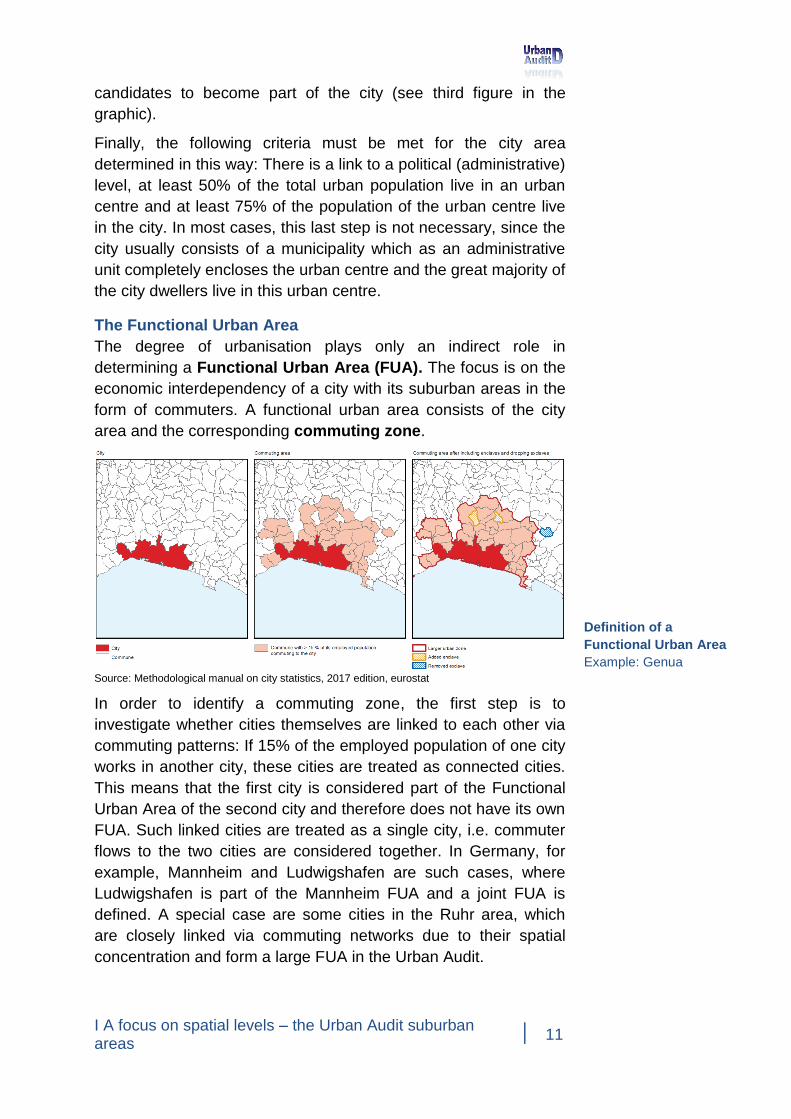
The Functional Urban Area
The degree of urbanisation plays only an indirect role in
determining a Functional Urban Area (FUA). The focus is on the
economic interdependency of a city with its suburban areas in the
form of commuters. A functional urban area consists of the city
area and the corresponding commuting zone.
Source: Methodological manual on city statistics, 2017 edition, eurostat
In order to identify a commuting zone, the first step is to
investigate whether cities themselves are linked to each other via
commuting patterns: If 15% of the employed population of one city
works in another city, these cities are treated as connected cities.
This means that the first city is considered part of the Functional
Urban Area of the second city and therefore does not have its own
FUA. Such linked cities are treated as a single city, i.e. commuter
flows to the two cities are considered together. In Germany, for
example, Mannheim and Ludwigshafen are such cases, where
Ludwigshafen is part of the Mannheim FUA and a joint FUA is
defined. A special case are some cities in the Ruhr area, which
are closely linked via commuting networks due to their spatial
concentration and form a large FUA in the Urban Audit.
Definition of a
Functional Urban Area
Example: Genua
12 I A focus on spatial levels – the Urban Audit suburban
areas
In a second step, all surrounding municipalities are selected in
which at least 15% of the employed residential population works in
the (linked) city (see second figure in the graphic).
Finally, those municipalities that were not selected in the second
step but are completely surrounded by FUA affiliated
municipalities will be included in the selection. Selected
municipalities that are isolated and do not border other selected
communities are excluded from the selection (see third figure in
the graphic).
If a municipality fulfils the selection criterion for two different, not
connected cities, then it should be allocated to the FUA of the city
for which the percentage of commuters is higher.
Alexandra Dörzenbach is the national coordinator of the Urban Audit Project for Germany ([email protected]). Tobias Link is the contact person for the data collection of the KOSIS Association Urban Audit (tobias.link @mannheim.de).
I A focus on spatial levels – the Urban Audit suburban areas
13
2. Urban Audit data for suburban areas – from compilation to
visualisation
by Alexandra Dörzenbach and Tobias Link
Data for suburban areas – calculation and provision
The Urban Audit suburban areas do not represent new areas but
rather a newly developed spatial level: they are calculated from
the difference between the functional urban areas (FUAs)2 in the
data collection and the Urban Audit cities3. While the previous
data provided for the FUAs included the city values, these values
are subtracted from the corresponding FUA data to calculate the
values for suburban areas.
This difference cannot be calculated for Urban Audit cities whose
area is per definition identical to that of their functional urban area.
This is the case for 11 cities4. Some cities also belong to the same
functional urban area. In these cases, the value for the suburban
area was calculated separately for each city. As a result, the FUA
Ludwigshafen/Mannheim consists of six additional districts as well
as the administratively independent cities of Ludwigshafen and
Mannheim. The value for the suburban area of Mannheim, for
example, was calculated from these six districts plus the value for
Ludwigshafen. Analogously, the value for the suburban area of
Ludwigshafen was calculated from these six districts plus the
value for Mannheim. The same approach was taken for the FUA
Braunschweig-Salzgitter-Wolfsburg.
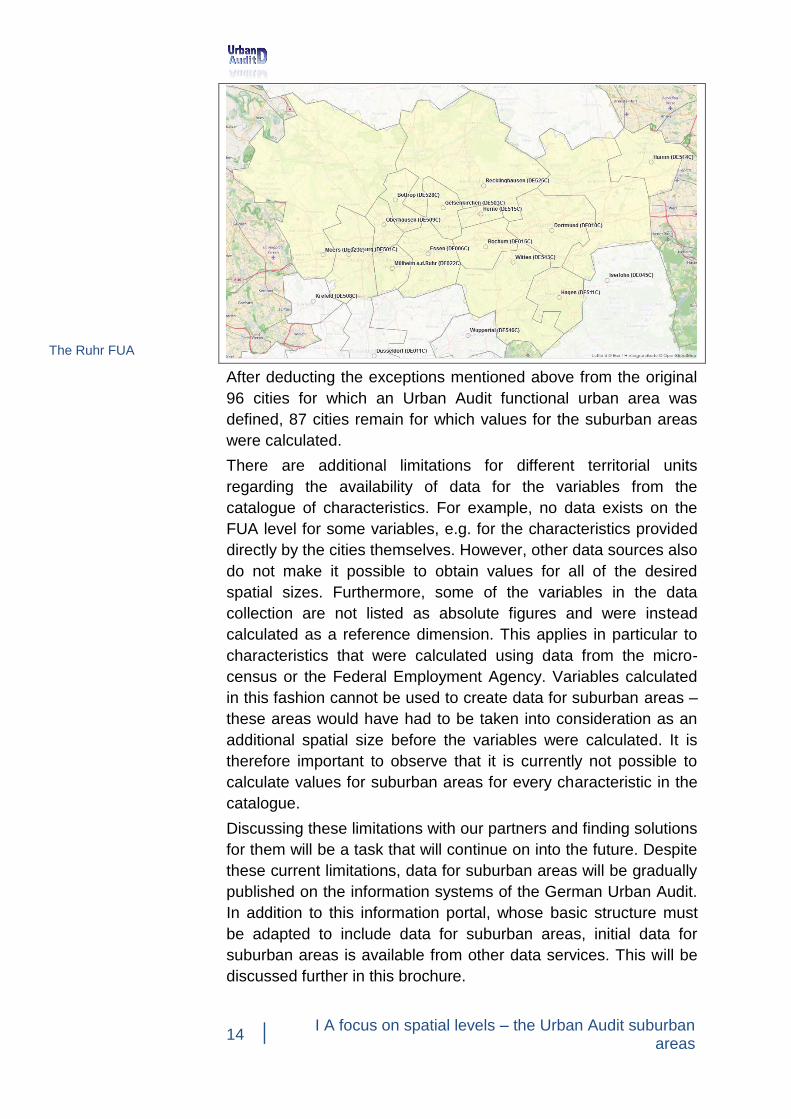
When calculating data for suburban areas for a comparison of
cities and suburban areas, the Ruhr posed a unique problem,
which was difficult to resolve: the Ruhr FUA consists of 15 districts
(eleven cities and four administrative districts). Calculating values
for the suburban areas of the 14 Urban Audit cities in this region
using the method described above did not appear to be practical,
although principally possible.
2 For more information on the Urban Audit functional urban areas, see
http://www.staedtestatistik.de/1156.html?&F=1%2520. 3 For more information on the Urban Audit cities, see
http://www.staedtestatistik.de/1157.html?&K=&F=1. 4 For the cities of Bielefeld, Brandenburg an der Havel, Chemnitz, Dessau-
Roßlau, Frankfurt (Oder), Krefeld, Mönchengladbach, Neumünster, Remscheid, Solingen, and Wuppertal, the urban area is identical with the functional urban area. As a result, there is no Urban Audit suburban area.
14 I A focus on spatial levels – the Urban Audit suburban
areas
After deducting the exceptions mentioned above from the original
96 cities for which an Urban Audit functional urban area was
defined, 87 cities remain for which values for the suburban areas
were calculated.
There are additional limitations for different territorial units
regarding the availability of data for the variables from the
catalogue of characteristics. For example, no data exists on the
FUA level for some variables, e.g. for the characteristics provided
directly by the cities themselves. However, other data sources also
do not make it possible to obtain values for all of the desired
spatial sizes. Furthermore, some of the variables in the data
collection are not listed as absolute figures and were instead
calculated as a reference dimension. This applies in particular to
characteristics that were calculated using data from the micro-
census or the Federal Employment Agency. Variables calculated
in this fashion cannot be used to create data for suburban areas –
these areas would have had to be taken into consideration as an
additional spatial size before the variables were calculated. It is
therefore important to observe that it is currently not possible to
calculate values for suburban areas for every characteristic in the
catalogue.
Discussing these limitations with our partners and finding solutions
for them will be a task that will continue on into the future. Despite
these current limitations, data for suburban areas will be gradually
published on the information systems of the German Urban Audit.
In addition to this information portal, whose basic structure must
be adapted to include data for suburban areas, initial data for
suburban areas is available from other data services. This will be
discussed further in this brochure.
The Ruhr FUA
I A focus on spatial levels – the Urban Audit suburban areas
15
Suburban geometries – adaptation and integration
In order to visualise comparisons between cities and suburban
areas in the Structural Data Atlas, the corresponding geometries
must be prepared and integrated. Data from the cities and
functional urban areas served as the basis to achieve this. For
both of these levels, geometries already exist, which have been in
use for some time in the Structural Data Atlas. These geometries
are based on the corresponding data for the municipalities and
districts of the Federal Agency for Cartography and Geodesy
(BKG)5 and can be downloaded for free on their website. For the
urban level, the 125 Urban Audit cities were taken from the
municipality shapefile (VG250_GEM.shp). The district shapefile
(VG250_KRS.shp) was used for the functional urban areas. The
required districts were removed and some were spatially
consolidated with the functional areas. A Eurostat code was then
assigned to each area. Finally, the shapefiles were converted to
the coordinate system required for use in the Structural Data Atlas.
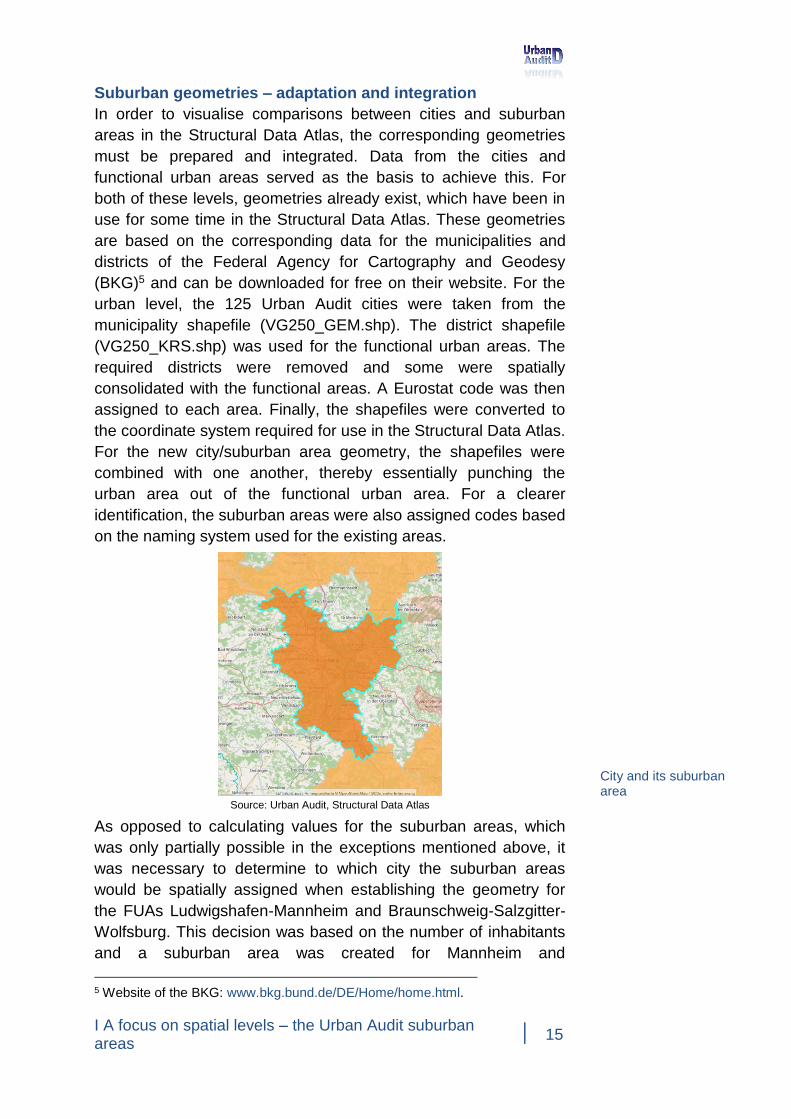
For the new city/suburban area geometry, the shapefiles were
combined with one another, thereby essentially punching the
urban area out of the functional urban area. For a clearer
identification, the suburban areas were also assigned codes based
on the naming system used for the existing areas.
Source: Urban Audit, Structural Data Atlas
As opposed to calculating values for the suburban areas, which
was only partially possible in the exceptions mentioned above, it
was necessary to determine to which city the suburban areas
would be spatially assigned when establishing the geometry for
the FUAs Ludwigshafen-Mannheim and Braunschweig-Salzgitter-
Wolfsburg. This decision was based on the number of inhabitants
and a suburban area was created for Mannheim and
5 Website of the BKG: www.bkg.bund.de/DE/Home/home.html.
City and its suburban area
16 I A focus on spatial levels – the Urban Audit suburban
areas
Braunschweig. As was the case when calculating the data, this
approach did not seem appropriate for creating a city/suburban
area geometry for the FUA Ruhr. For this reason, it is not included
in the geometry. The new city/suburban area shapefile6 therefore
contains 84 cities and their suburban areas. This shapefile was
then used for visualisation in the Structural Data Atlas (cf. next
chapter) and the current cartographic representation in this
brochure (cf. chapter 3 of this section).
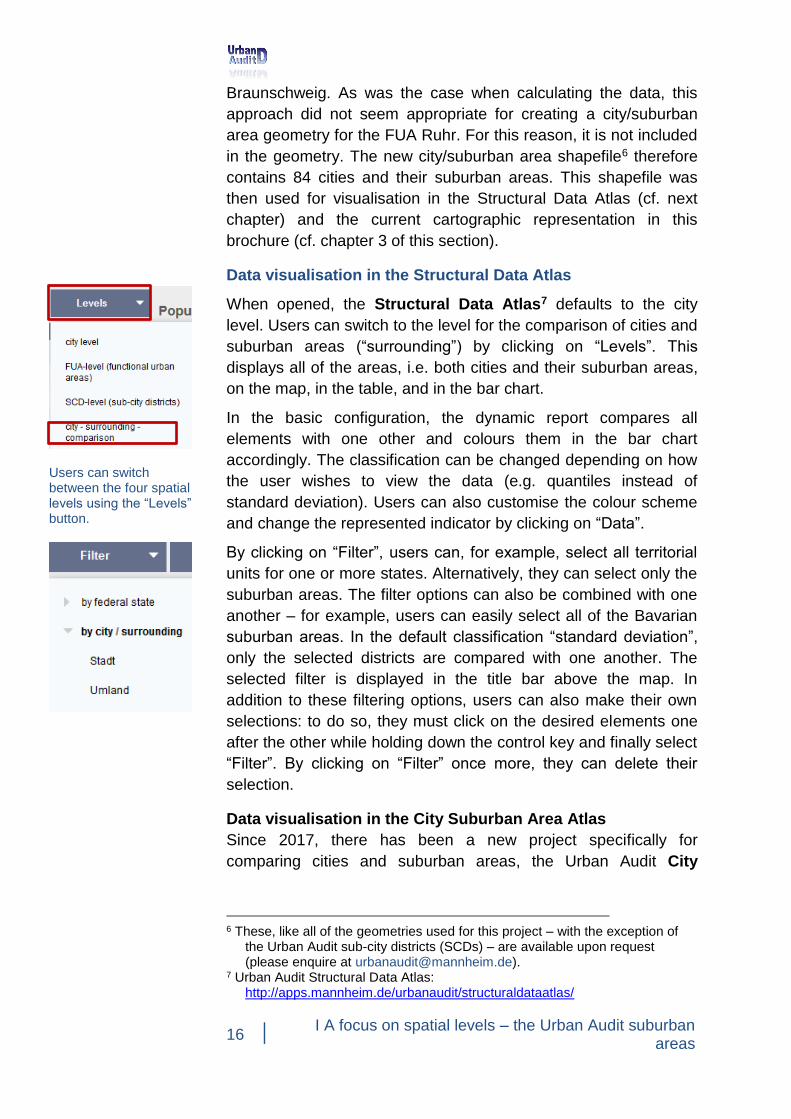
Data visualisation in the Structural Data Atlas
When opened, the Structural Data Atlas7 defaults to the city
level. Users can switch to the level for the comparison of cities and
suburban areas (“surrounding”) by clicking on “Levels”. This
displays all of the areas, i.e. both cities and their suburban areas,
on the map, in the table, and in the bar chart.
In the basic configuration, the dynamic report compares all
elements with one other and colours them in the bar chart
accordingly. The classification can be changed depending on how
the user wishes to view the data (e.g. quantiles instead of
standard deviation). Users can also customise the colour scheme
and change the represented indicator by clicking on “Data”.
By clicking on “Filter”, users can, for example, select all territorial
units for one or more states. Alternatively, they can select only the
suburban areas. The filter options can also be combined with one
another – for example, users can easily select all of the Bavarian
suburban areas. In the default classification “standard deviation”,
only the selected districts are compared with one another. The
selected filter is displayed in the title bar above the map. In
addition to these filtering options, users can also make their own
selections: to do so, they must click on the desired elements one
after the other while holding down the control key and finally select
“Filter”. By clicking on “Filter” once more, they can delete their
selection.
Data visualisation in the City Suburban Area Atlas
Since 2017, there has been a new project specifically for
comparing cities and suburban areas, the Urban Audit City
6 These, like all of the geometries used for this project – with the exception of
the Urban Audit sub-city districts (SCDs) – are available upon request (please enquire at [email protected]).
7 Urban Audit Structural Data Atlas: http://apps.mannheim.de/urbanaudit/structuraldataatlas/
Users can switch between the four spatial levels using the “Levels” button.
I A focus on spatial levels – the Urban Audit suburban areas
17
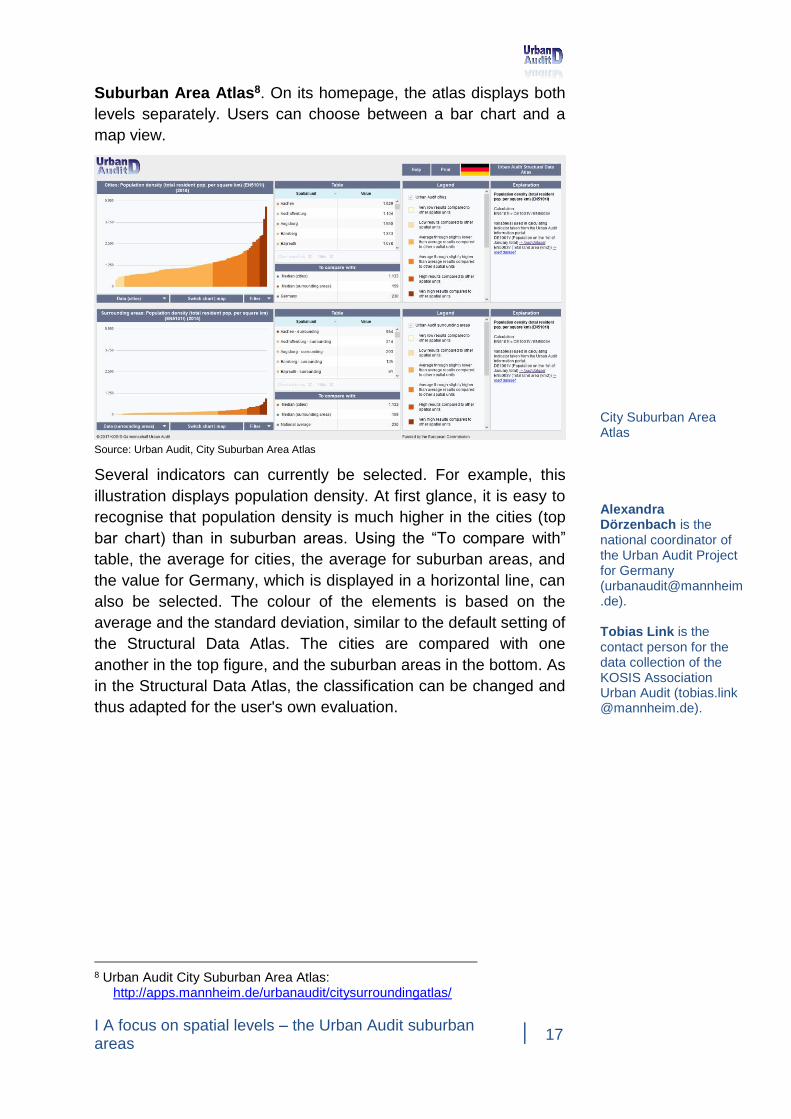
Suburban Area Atlas8. On its homepage, the atlas displays both
levels separately. Users can choose between a bar chart and a
map view.
Source: Urban Audit, City Suburban Area Atlas
Several indicators can currently be selected. For example, this
illustration displays population density. At first glance, it is easy to
recognise that population density is much higher in the cities (top
bar chart) than in suburban areas. Using the “To compare with”
table, the average for cities, the average for suburban areas, and
the value for Germany, which is displayed in a horizontal line, can
also be selected. The colour of the elements is based on the
average and the standard deviation, similar to the default setting of
the Structural Data Atlas. The cities are compared with one
another in the top figure, and the suburban areas in the bottom. As
in the Structural Data Atlas, the classification can be changed and
thus adapted for the user's own evaluation.
8 Urban Audit City Suburban Area Atlas:
http://apps.mannheim.de/urbanaudit/citysurroundingatlas/
City Suburban Area Atlas
Alexandra Dörzenbach is the national coordinator of the Urban Audit Project for Germany ([email protected]). Tobias Link is the contact person for the data collection of the KOSIS Association Urban Audit (tobias.link @mannheim.de).
18 I A focus on spatial levels – the Urban Audit suburban
areas
3. Comparisons between cities and suburban areas using
German Urban Audit data
by Christina Neuhaus
The focus of this article is on comparing objective indicators for the
quality of life in German cities with their suburban areas using the
Urban Audit structural database. This juxtaposition allows cities to
analyse their relationship and interdependency with their suburban
areas as well as enabling a national comparison between cities.
Using a uniform definition for suburban areas and a systematic
method for calculating data for these areas provides a common
basis for cities to compare their relationship to their suburban
areas with that of other cities (cf. discussion in the previous
chapter). The indicators “youth ratio”, “proportion of foreigners”,
“unemployment rate”, “proportion of households who live in
detached and semi-detached houses” and “proportion of the
population with higher professional qualifications” will be used to
illustrate this point.
Youth ratio
The youth ratio compares the population under 20 with the
population between the ages of 20 and 64. A value of 30 means
that there are 30 children and adolescents for every 100 people of
working age.
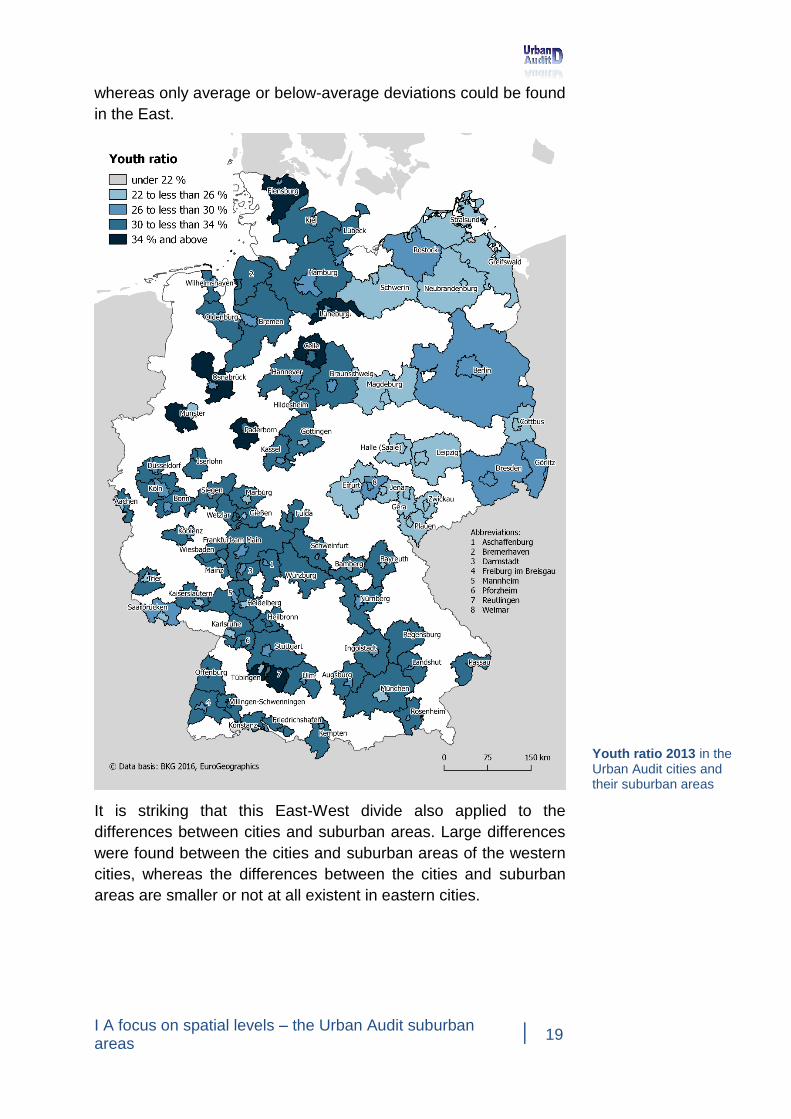
The average youth ratio in the Urban Audit cities for which
corresponding data is available was 27.1 percent. The proportion
of the population under 20 compared with the population between
the ages of 20 and 64 was highest in Iserlohn (32.1%) and
Solingen (32.0%), and lowest in Würzburg (21.6%) and Greifswald
(21.7%). In almost nine out of ten cases, the average youth ratio in
suburban areas was 30.7 and thus higher than in the
corresponding cities. The suburban areas had an average of just
under four more 20-year-olds for every one hundred 20- to 64-
year-olds than the cities. The youth ratio was highest in the
suburban areas of Paderborn, at 35.8 percent, and lowest in the
suburban areas of Cottbus, at 22.7 percent.
The following map shows a significant difference between eastern
and western Germany. Above-average deviations were found
exclusively in the West and almost exclusively in suburban areas –
e.g. the suburban areas of Flensburg, Münster, or Reutlingen –
Comparisons
between cities and
suburban areas
I A focus on spatial levels – the Urban Audit suburban areas
19
whereas only average or below-average deviations could be found
in the East.
It is striking that this East-West divide also applied to the
differences between cities and suburban areas. Large differences
were found between the cities and suburban areas of the western
cities, whereas the differences between the cities and suburban
areas are smaller or not at all existent in eastern cities.
Youth ratio 2013 in the Urban Audit cities and their suburban areas
20 I A focus on spatial levels – the Urban Audit suburban
areas
Proportion of foreigners
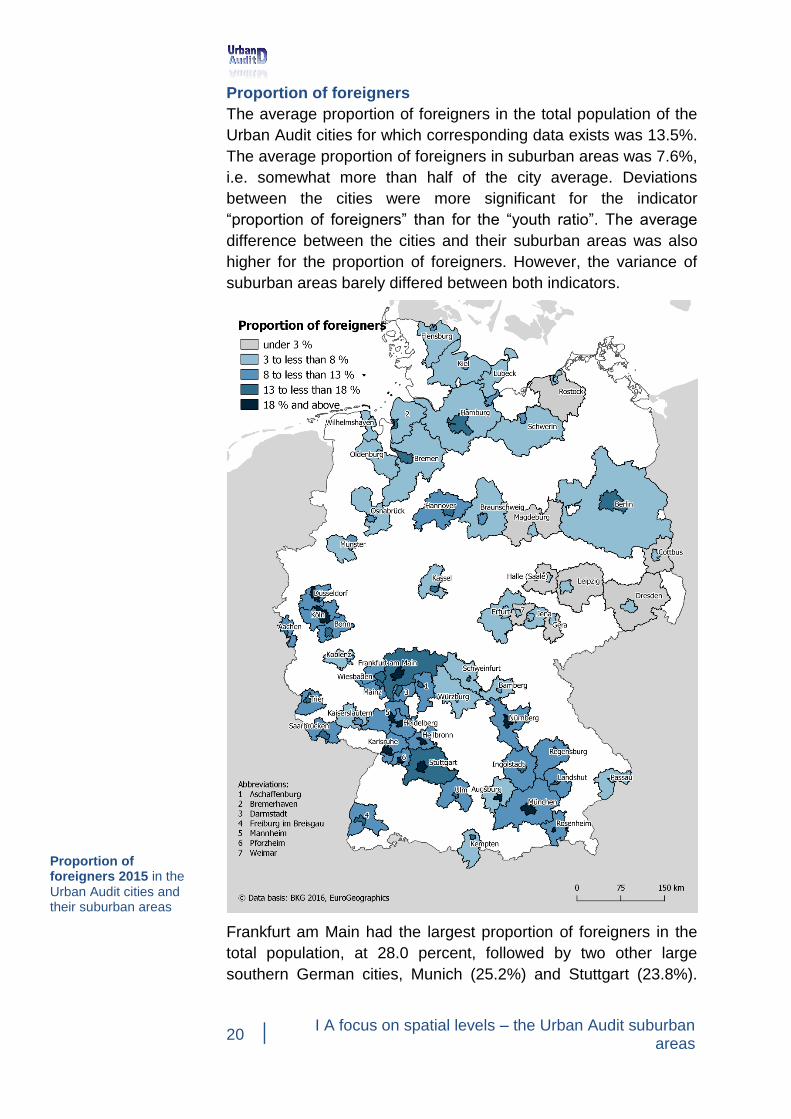
The average proportion of foreigners in the total population of the
Urban Audit cities for which corresponding data exists was 13.5%.
The average proportion of foreigners in suburban areas was 7.6%,
i.e. somewhat more than half of the city average. Deviations
between the cities were more significant for the indicator
“proportion of foreigners” than for the “youth ratio”. The average
difference between the cities and their suburban areas was also
higher for the proportion of foreigners. However, the variance of
suburban areas barely differed between both indicators.
Frankfurt am Main had the largest proportion of foreigners in the
total population, at 28.0 percent, followed by two other large
southern German cities, Munich (25.2%) and Stuttgart (23.8%).
Proportion of foreigners 2015 in the Urban Audit cities and their suburban areas
I A focus on spatial levels – the Urban Audit suburban areas
21
The proportion of foreigners in the total population was lowest in
the eastern German cities of Brandenburg an der Havel (3.5%),
Dessau-Roßlau (4.1%), and Rostock (4.4%). In suburban areas,
the proportion of foreigners varied between 2.0 percent in the
suburban areas of Gera and 16.1 percent in the suburban areas of
Frankfurt.
The map shows that the proportion of foreigners differed more
strongly across regions than between cities and their suburban
areas. In the south-western suburban areas, the proportion of
foreigners was still much lower than in the corresponding cities but
generally much higher than in the north-eastern suburban areas,
where the differences between the cities and their suburban areas
were much smaller. In the East, a significant difference between
the city and its suburban areas could only be found in Berlin
(+11.7 percentage points), which was only surpassed by Frankfurt
am Main (+11.9 percentage points) and Munich (+12.3 percentage
points) in the West.
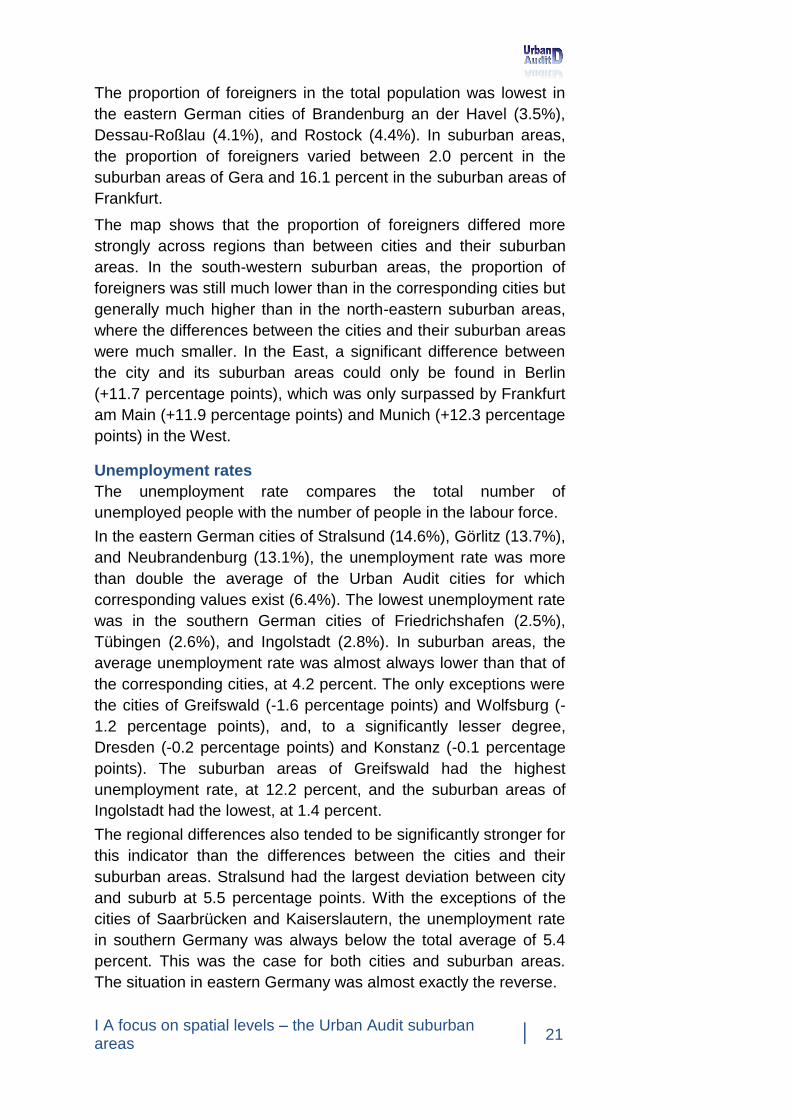
Unemployment rates
The unemployment rate compares the total number of
unemployed people with the number of people in the labour force.
In the eastern German cities of Stralsund (14.6%), Görlitz (13.7%),
and Neubrandenburg (13.1%), the unemployment rate was more
than double the average of the Urban Audit cities for which
corresponding values exist (6.4%). The lowest unemployment rate
was in the southern German cities of Friedrichshafen (2.5%),
Tübingen (2.6%), and Ingolstadt (2.8%). In suburban areas, the
average unemployment rate was almost always lower than that of
the corresponding cities, at 4.2 percent. The only exceptions were
the cities of Greifswald (-1.6 percentage points) and Wolfsburg (-
1.2 percentage points), and, to a significantly lesser degree,
Dresden (-0.2 percentage points) and Konstanz (-0.1 percentage
points). The suburban areas of Greifswald had the highest
unemployment rate, at 12.2 percent, and the suburban areas of
Ingolstadt had the lowest, at 1.4 percent.
The regional differences also tended to be significantly stronger for
this indicator than the differences between the cities and their
suburban areas. Stralsund had the largest deviation between city
and suburb at 5.5 percentage points. With the exceptions of the
cities of Saarbrücken and Kaiserslautern, the unemployment rate
in southern Germany was always below the total average of 5.4
percent. This was the case for both cities and suburban areas.
The situation in eastern Germany was almost exactly the reverse.
22 I A focus on spatial levels – the Urban Audit suburban
areas
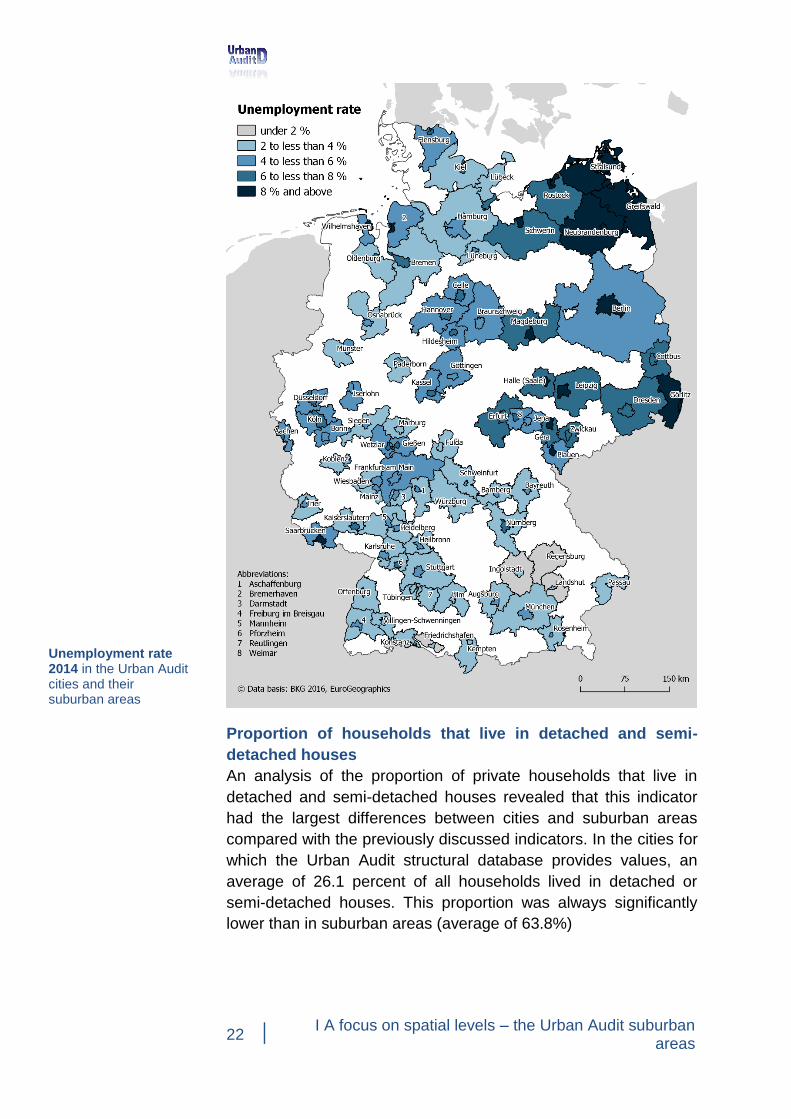
Proportion of households that live in detached and semi-
detached houses
An analysis of the proportion of private households that live in
detached and semi-detached houses revealed that this indicator
had the largest differences between cities and suburban areas
compared with the previously discussed indicators. In the cities for
which the Urban Audit structural database provides values, an
average of 26.1 percent of all households lived in detached or
semi-detached houses. This proportion was always significantly
lower than in suburban areas (average of 63.8%)
Unemployment rate 2014 in the Urban Audit cities and their suburban areas
I A focus on spatial levels – the Urban Audit suburban areas
23
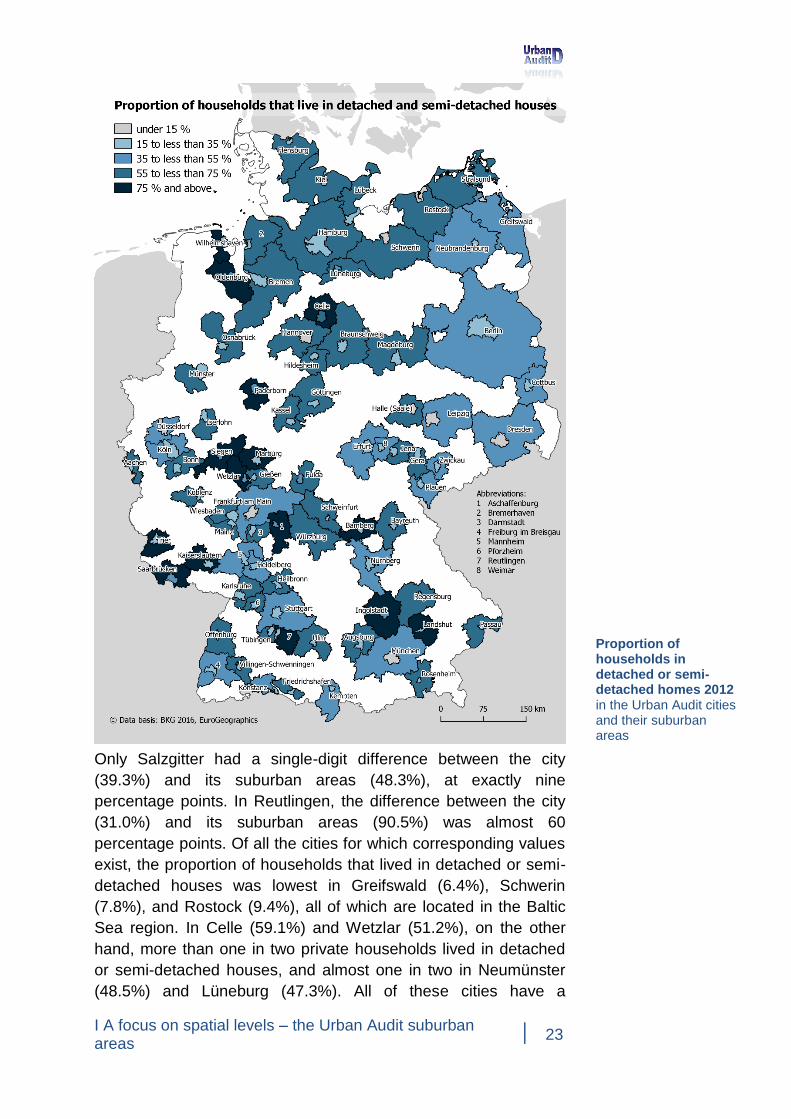
Only Salzgitter had a single-digit difference between the city
(39.3%) and its suburban areas (48.3%), at exactly nine
percentage points. In Reutlingen, the difference between the city
(31.0%) and its suburban areas (90.5%) was almost 60
percentage points. Of all the cities for which corresponding values
exist, the proportion of households that lived in detached or semi-
detached houses was lowest in Greifswald (6.4%), Schwerin
(7.8%), and Rostock (9.4%), all of which are located in the Baltic
Sea region. In Celle (59.1%) and Wetzlar (51.2%), on the other
hand, more than one in two private households lived in detached
or semi-detached houses, and almost one in two in Neumünster
(48.5%) and Lüneburg (47.3%). All of these cities have a
Proportion of households in detached or semi-detached homes 2012 in the Urban Audit cities and their suburban areas
24 I A focus on spatial levels – the Urban Audit suburban
areas
population of 50,000 to just under 100,000 inhabitants. In
comparison, a smaller proportion of households lived in detached
or in semi-detached houses in the suburban areas of Düsseldorf
(41.8%), Konstanz (43.4%), Kempten im Allgäu (44.4%), Dresden
(46.0%), and Ludwigshafen am Rhein (47.0%) than in the
corresponding four cities. In contrast, nine in ten households lived
in detached or semi-detached houses in the suburban areas of
Reutlingen and Paderborn (90.5% and 90.0% respectively).
The striking difference between the East and the West for the
previous indicators does not play a role for the indicator
households that live in detached or semi-detached houses. The
total average for all of the territorial units included in the analysis
was 43.8% for this indicator. Only cities had values (slightly) below
the average in both the East and the West. In all of the larger cities
with more than 500,000 inhabitants, the proportion of households
that live in detached or semi-detached houses was far below the
total average. Furthermore, many smaller Urban Audit cities –
such as Passau and Greifswald – also had values significantly
below the average.
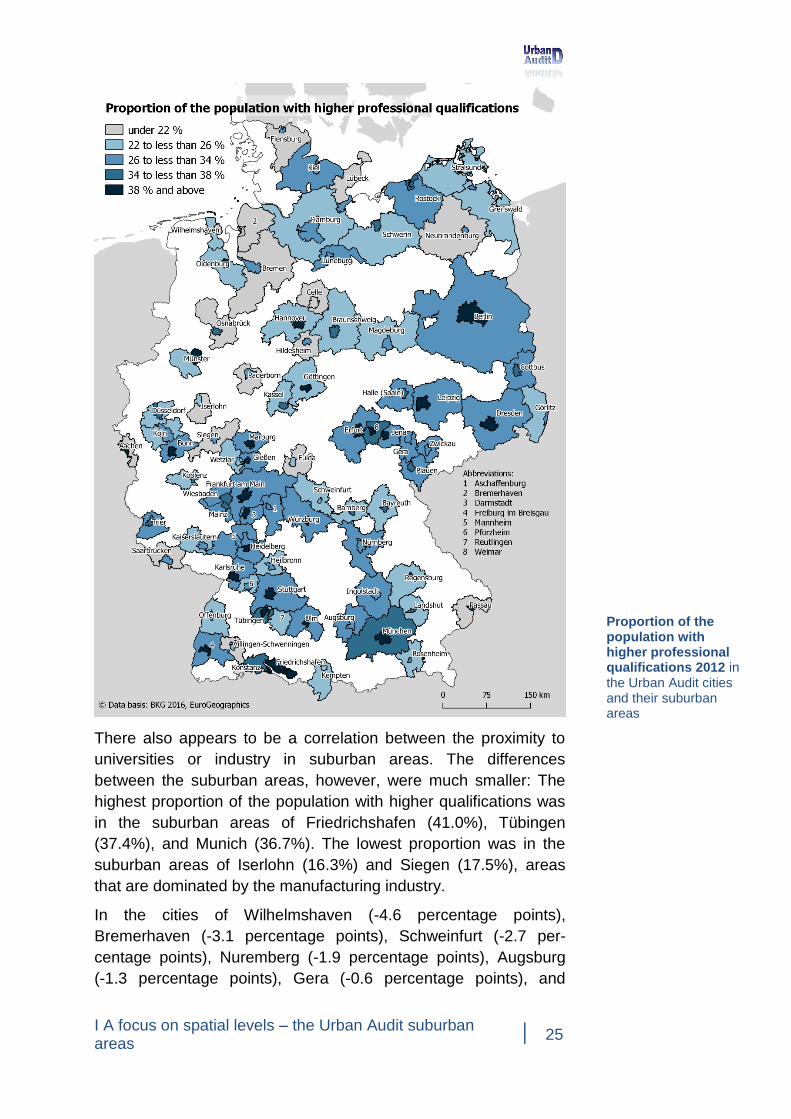
Proportion of the population with higher professional
qualifications
For this comparison, the share of the population aged 25 to 64 that
has a university degree or master craftsman’s diploma9 is
compared with the total population of the same age group. In
almost all of the cities for which corresponding data exists, an
average of 34.2 percent of the population had higher qualifications
and thus a higher proportion than in suburban areas (average
26.3%). However, there were significant differences between the
cities: in the university cities of Tübingen (55.1%), Heidelberg
(52.8%), Bonn (52.3%), and Ulm (50.3%), more than every second
inhabitant aged 25 to 64 had a university degree or master
craftsman's diploma, while in the more industrial cities of
Neumünster (18.0%), Wilhelmshaven (18.4%), Remscheid
(18.6%), and Bremerhaven (18.7%) not even one in five did.
9 ISCED (2011) level 5 to 8 diploma, roughly corresponds to levels 5 and 6 of the ISCED 97.
I A focus on spatial levels – the Urban Audit suburban areas
25
There also appears to be a correlation between the proximity to
universities or industry in suburban areas. The differences
between the suburban areas, however, were much smaller: The
highest proportion of the population with higher qualifications was
in the suburban areas of Friedrichshafen (41.0%), Tübingen
(37.4%), and Munich (36.7%). The lowest proportion was in the
suburban areas of Iserlohn (16.3%) and Siegen (17.5%), areas
that are dominated by the manufacturing industry.
In the cities of Wilhelmshaven (-4.6 percentage points),
Bremerhaven (-3.1 percentage points), Schweinfurt (-2.7 per-
centage points), Nuremberg (-1.9 percentage points), Augsburg
(-1.3 percentage points), Gera (-0.6 percentage points), and
Proportion of the population with higher professional qualifications 2012 in the Urban Audit cities and their suburban areas
26 I A focus on spatial levels – the Urban Audit suburban
areas
Kempten im Allgäu (-0.5 percentage points), the proportion of the
population with higher qualifications was lower than in the
corresponding suburban areas. In the southern German cities of
Passau, Ulm, and Regensburg, the difference to the suburban
areas was most pronounced, at approximately +25 percentage
points respectively.
There were no clear regional differences between the East and
West or the North and South for this indicator.
Conclusion
The variables and indicators for suburban areas were recalculated
based on the Urban Audit structural database, enabling the
discovery and analysis of a variety of new aspects in the
relationships between cities and their commuting zones. Instead of
an overall analysis of the functional urban areas, which always
includes the entire urban area, additional aspects can be
incorporated into the analysis of the relationships between urban
areas using the mathematical delimitation of the suburban areas.
Comparisons between cities and suburban areas are primarily
limited due to the structure of the Urban Audit database. In order
to calculate values for suburban areas, two conditions must be
fulfilled:
1. Data must be available for both the city level and the level
of the functional urban area.
2. Data for the corresponding territorial unit must be available
in the form of absolute values.
While the structural database has values for the level of the
functional urban area for the majority of variables, some
exceptions continue to exist for which no data sources are
available on this territorial level. This also includes the variables
we received directly from the cities themselves. The second
condition is problematic because variables were calculated based
on the micro-census and reported in reference or average values.
Because they represent a reference size, these variables are not
suitable for calculating values for suburban areas. The values for
the suburban areas would have to be calculated directly based on
the micro-census.

I A focus on spatial levels – the Urban Audit suburban areas
27
Despite its limitations, the Urban Audit data provides a wide range
of characteristics. Comparisons between cities and suburban
areas based on the Urban Audit can help to recognise potential
problems or parallel developments between cities and suburban
areas and compare these on a European level.
By selecting a set canon of cities, it would also be possible to
deduce potential structures from the comparisons in order to
illustrate trends in cross-regional developments and examine
existing characteristics in different subject areas.
Christina Neuhaus studies economics/political economics at the University of Heidelberg and completed an internship at the Municipal Statistics Office of the city of Manheim ([email protected]).
28 I A focus on spatial levels – the Urban Audit suburban
areas
4. Structures of the residential, household and population in
the Swiss core cities and their communiting zones
by Anna-Katharina Lautenschütz10
This analysis will examine residential, household and population
structures for the eight Swiss cities of the City Statistics (Urban
Audit). Comparisons will also be made at European level where
possible.
Residential structure
Single-family houses frequently imply a higher per capita living
space and a private garden. In the core cities of the City Statistics,
the share of single-family houses in the number of dwellings is low
at 6% in comparison with the average for all Swiss core cities of
9% (reference year 2016). Switzerland’s largest core cities also
often have the highest population density. With 12 434 and 7 124
inhabitants per km2, Geneva and Basel are notably far above the
average of both the City Statistics cities (4 431) and the Swiss
core cities in general (1 457).
In the commuting zones of the eight City Statistics cities, the share
of single-family houses in all dwellings is around 25% on average
and thus four times higher than in the core cities (6%). This also
corresponds to the average of 26% for all 49 Swiss commuting
zones. With increasing distance from the core city, the share of
single-family houses increases whereas the population density
decreases. On average, the municipalities in the Swiss commuting
zones have a population density of 385 inhabitants per km2.
The average living space available per person differs between
cities of the City Statistics by up to 10 m2. Furthermore, we can
note a difference between the core cities with an average of 42 m2
living space and the commuting zones with 46 m2.
While home ownership can cause high initial costs and can lead
to greater debt, it also allows people more freedom to shape their
lives. In the core cities of the Swiss agglomerations, only around
one fifth of households are home owners. In the eight core cities of
the City Statistics, the home ownership rate is even lower at 14%
on average. In comparison, this rate is more than two times higher
10 This article is an abridged edition of the original report published by the Swiss Federal Statistical Office (FSO (2017): Living in cities: a comparison between the larger core cities and their commuting zones. In FSO News number 1159-1700. Available at https://www.bfs.admin.ch/bfs/en/home/statistics/cross-sectional-topics/city-statistics.gnpdetail.2017-0196.html.
Core city and commuting zone according to City Statistics The City Statistics project is a European project comparing living conditions in towns and cities with more than 50 000 inhabitants and enables cities to be analysed at different spatial levels. This publication looks at the:. – Core city = the core of the agglomeration; this corresponds to the political administrative unit of the city concerned. – Commuting zone = peripheral municipalities of the core city that together with the core city form a cohesive agglomeration area (in Switzerland this is pursuant to the 2012 FSO definition).
I A focus on spatial levels – the Urban Audit suburban areas
29
in the commuting zones of the eight City Statistics cities (41%).
The share of households living in owned dwellings is on average
43% in all of Switzerland’s commuting zones.
The share of empty dwellings is an important indicator for the
ratio between supply and demand of housing. In the core cities of
the City Statistics, the share of vacant dwellings is only 0.8% on
average. In the eight commuting zones, the share is somewhat
higher at 1.1% on average.
In contrast, in Switzerland’s core cities an average of 9% of
dwellings are overcrowded dwellings, i. e. with more than one
person per room. In the commuting zones of the City Statistics
cities the share of overcrowded dwellings is slightly lower, being
similar to the average of all Swiss agglomerations with 7%.
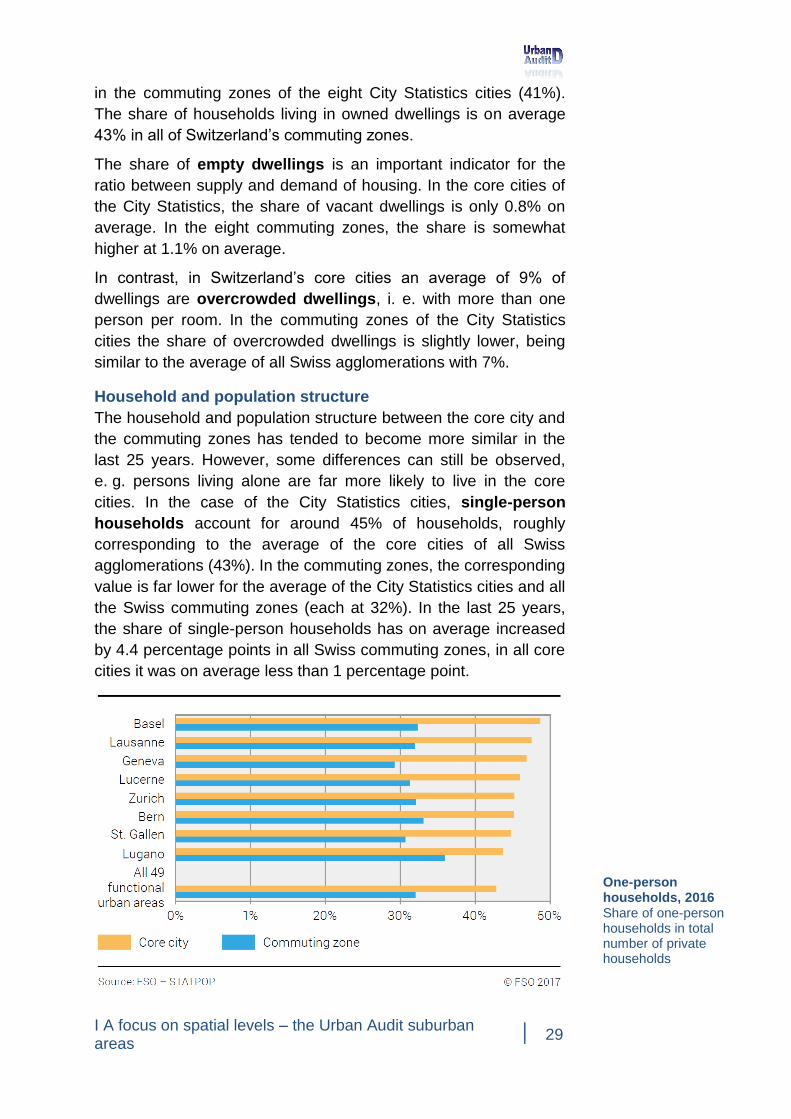
Household and population structure
The household and population structure between the core city and
the commuting zones has tended to become more similar in the
last 25 years. However, some differences can still be observed,
e. g. persons living alone are far more likely to live in the core
cities. In the case of the City Statistics cities, single-person
households account for around 45% of households, roughly
corresponding to the average of the core cities of all Swiss
agglomerations (43%). In the commuting zones, the corresponding
value is far lower for the average of the City Statistics cities and all
the Swiss commuting zones (each at 32%). In the last 25 years,
the share of single-person households has on average increased
by 4.4 percentage points in all Swiss commuting zones, in all core
cities it was on average less than 1 percentage point.
One-person households, 2016 Share of one-person households in total number of private households
30 I A focus on spatial levels – the Urban Audit suburban
areas
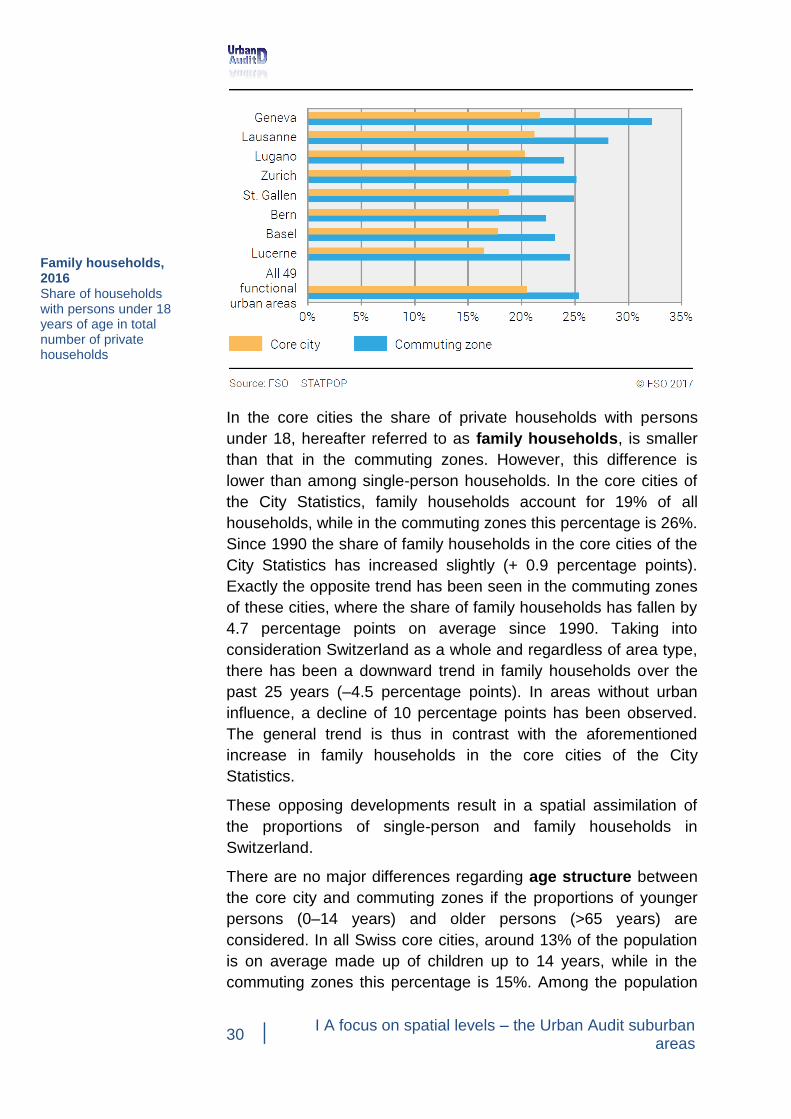
In the core cities the share of private households with persons
under 18, hereafter referred to as family households, is smaller
than that in the commuting zones. However, this difference is
lower than among single-person households. In the core cities of
the City Statistics, family households account for 19% of all
households, while in the commuting zones this percentage is 26%.
Since 1990 the share of family households in the core cities of the
City Statistics has increased slightly (+ 0.9 percentage points).
Exactly the opposite trend has been seen in the commuting zones
of these cities, where the share of family households has fallen by
4.7 percentage points on average since 1990. Taking into
consideration Switzerland as a whole and regardless of area type,
there has been a downward trend in family households over the
past 25 years (–4.5 percentage points). In areas without urban
influence, a decline of 10 percentage points has been observed.
The general trend is thus in contrast with the aforementioned
increase in family households in the core cities of the City
Statistics.
These opposing developments result in a spatial assimilation of
the proportions of single-person and family households in
Switzerland.
There are no major differences regarding age structure between
the core city and commuting zones if the proportions of younger
persons (0–14 years) and older persons (>65 years) are
considered. In all Swiss core cities, around 13% of the population
is on average made up of children up to 14 years, while in the
commuting zones this percentage is 15%. Among the population
Family households, 2016 Share of households with persons under 18 years of age in total number of private households
I A focus on spatial levels – the Urban Audit suburban areas
31
aged 65 years and over, the difference between the core city and
the commuting zone is less than one percentage point.
On average, the share of the foreign resident population in the
Swiss core cities is 32%. In the commuting zones, the share of the
foreign resident population is generally lower than in the core
cities. On average in Switzerland this share is just under 24%.
How do our European neighbours live?
In the cities of neighbouring countries, the share of private
households that live in single and two-family houses varies
considerably. In the German City Statistics core cities, around
26% of households live in single or two-family houses. In all core
cities of Switzerland, this value is around 12%. In the French cities
of Strasbourg, Grenoble and Annecy, 20% of households also live
in single or two-family houses, while this is the case for as many
as 30% of households in Besançon. In the commuting zones in
Germany, on average more than 60% of households live in single
or two-family houses.
In the German core cities of the City Statistics, on average around
30% of households own their homes while this share is almost
58% in the German commuting zones, considerably more than the
14% of the core of those of Switzerland and the 41% of their
commuting zones. The population density in the German and
Swiss core cities is almost identical with 1 422 or 1 457 inhabitants
per km2.
The household structure is similar in Switzerland to its European
neighbours. Single-person households are also mostly found in
the core cities. For example, they account for 46% of households
in the German core cities, while their respective share in the
commuting zones is around 35%. The difference between the core
city and the commuting zones, however, is less marked when it
comes to family households. In Germany, for example, these
make up 18% of all households in the core cities and 22% in the
commuting zones. In contrast, in France this difference is slightly
greater than in Germany. In Besancon the share of family
households in the core city is 24% and in its commuting zone
47%. Similar values can be found in Grenoble with a 25% share in
the core city and 36% in the commuting zone. Accordingly, the
age structure of the population in the core cities and commuting
zones is also quite similar. In Germany, children under 18 years
and people aged 65 and over are even equally represented in both
of the specified areas.
Dr. Anna-Katharina Lautenschütz was a scientific collaborator at the Swiss Federal Statistical Office (FSO) and project manager for the Urban Audit Switzerland ([email protected]. ch).
32 II A focus on data – establishing sources for Urban Audit
and data use
II A focus on data – establishing sources for Urban
Audit and data use
As was demonstrated in the last chapter, the KOSIS Association
Urban Audit aims to make existing data as usable as possible and
– where necessary – to establish new sources of data. For the
Urban Audit suburban areas, no new data was required. Instead,
existing data was recompiled and analysed for the cities and
functional urban areas. In this chapter, the focus will be on
establishing possible new sources of data and determining the
easiest method for using existing data.
This data collection attempts to relieve the cities as much as
possible from the burden of submitting their own data and to gain
information from central sources. Some of the data requested from
Eurostat, however, can only be submitted by the Urban Audit cities
themselves. For enquires regarding the length of the designated
cycle network of a city, the large number of erroneous data and
difficulties in comparing data were striking. During his internship
with the city of Mannheim, Sebastian Schmidt therefore used
OpenStreetMap as a central source for determining the length of a
city’s cycle network. He demonstrated that this method is a viable
alternative if the types of cycle routes are carefully selected and
the chances and risks of open source data are recognised.
The following article will present an overview of the availability of
the data collected and analysed by Urban Audit and the various
options for accessing it.
Chapter overview
OpenStreetMap as an alternative source of data for measuring the length of a cycle network
Data use made easy
II A focus on data – establishing sources for Urban Audit and data use
33
1. Measuring the total length of cycle networks in Urban
Audit cities based on OpenStreetMap data
by Sebastian Schmidt
Precisely 200 years ago, Karl von Drais discovered the draisine in
Mannheim, the predecessor for today's bicycle, thus changing
local transport in the long term. It would be impossible to think of
the world’s cities today without bicycles. They are an ecological
and economic alternative to motorised traffic.
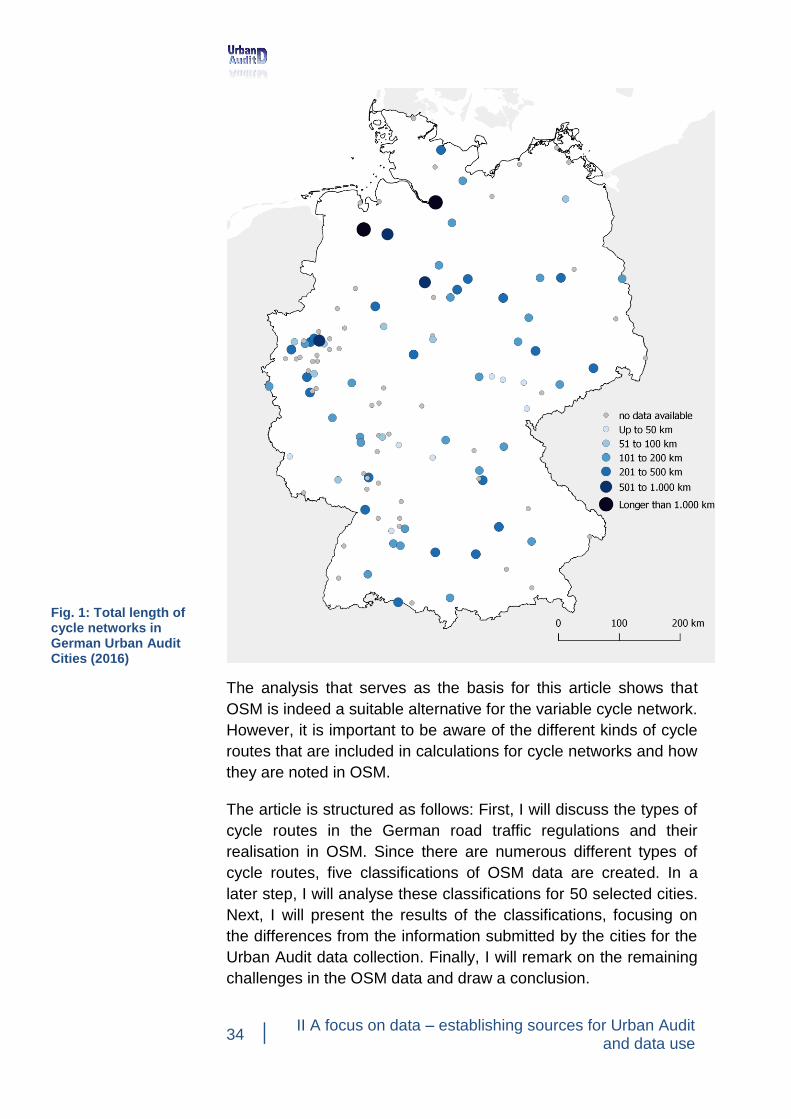
For the Urban Audit European city data collection, the length of the
existing cycle networks is therefore rightfully one of the variables
for urban comparisons. The KOSIS Association Urban Audit
conducted city surveys of German cities in compliance with EU
regulations to calculate the cycle network, i.e. the routes whose
primary function is dedicated to cycling (cf. fig. 1). These include
cycle lanes, i.e. lanes designated for use by cyclists that are
located on roads used for other purposes.
The large proportion of erroneous data (approx. 40%) and the
large differences in the compilation of cycle networks for individual
cities have, until now, made it difficult to make comparisons
between cities. For this reason, this article examines whether
alternative sources of data could be a possible solution for this
problem. Since no data is available on cycle networks in cities
across Germany, the article focuses on open data. The data in
question was geo-data, i.e. data with a spatial reference, that was
compiled by users as part of the OpenStreetMap project. The
objective of OpenStreetMap (OSM) is to create a “free world map”
that can be altered and used by anyone, thus enabling users to
access and analyse the underlying data free of cost.
One of the alternative views for OpenStreetMap is
OpenCycleMap. It displays cycle routes and numerous additional
cycling components. These include specialist stores, public toilets,
and fountains with drinking water as well as routes designated for
cycling and cycle lanes. The data basis is the same as in the
standard edition of OSM, which is why I will refer directly to OSM
in this article.
34 II A focus on data – establishing sources for Urban Audit
and data use
The analysis that serves as the basis for this article shows that
OSM is indeed a suitable alternative for the variable cycle network.
However, it is important to be aware of the different kinds of cycle
routes that are included in calculations for cycle networks and how
they are noted in OSM.
The article is structured as follows: First, I will discuss the types of
cycle routes in the German road traffic regulations and their
realisation in OSM. Since there are numerous different types of
cycle routes, five classifications of OSM data are created. In a
later step, I will analyse these classifications for 50 selected cities.
Next, I will present the results of the classifications, focusing on
the differences from the information submitted by the cities for the
Urban Audit data collection. Finally, I will remark on the remaining
challenges in the OSM data and draw a conclusion.
Fig. 1: Total length of cycle networks in German Urban Audit Cities (2016)
II A focus on data – establishing sources for Urban Audit and data use
35
Source: http://velogo.cherif.de/wp-content/uploads/2014/05/Radwege.png (27/09/2017)
Types of cycle routes in the road traffic regulations and in
OSM
In Germany, there are numerous different cycle routes, which are
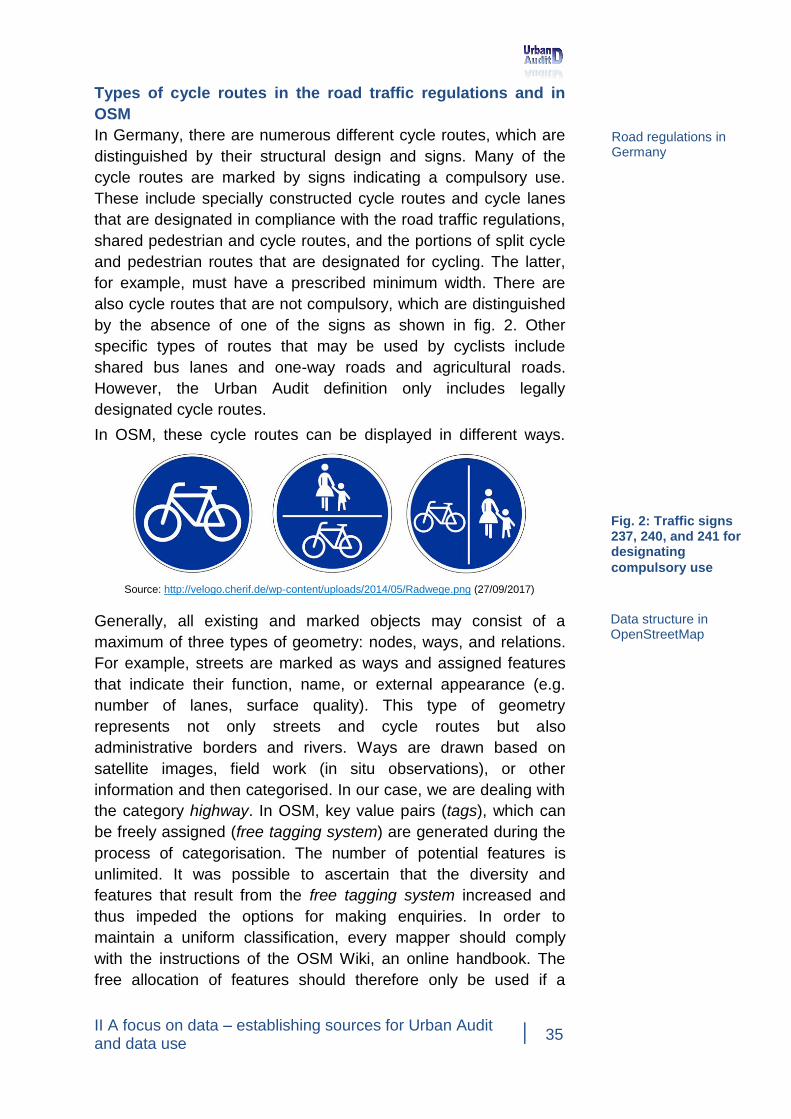
distinguished by their structural design and signs. Many of the
cycle routes are marked by signs indicating a compulsory use.
These include specially constructed cycle routes and cycle lanes
that are designated in compliance with the road traffic regulations,
shared pedestrian and cycle routes, and the portions of split cycle
and pedestrian routes that are designated for cycling. The latter,
for example, must have a prescribed minimum width. There are
also cycle routes that are not compulsory, which are distinguished
by the absence of one of the signs as shown in fig. 2. Other
specific types of routes that may be used by cyclists include
shared bus lanes and one-way roads and agricultural roads.
However, the Urban Audit definition only includes legally
designated cycle routes.
In OSM, these cycle routes can be displayed in different ways.
Generally, all existing and marked objects may consist of a
maximum of three types of geometry: nodes, ways, and relations.
For example, streets are marked as ways and assigned features
that indicate their function, name, or external appearance (e.g.
number of lanes, surface quality). This type of geometry
represents not only streets and cycle routes but also
administrative borders and rivers. Ways are drawn based on
satellite images, field work (in situ observations), or other
information and then categorised. In our case, we are dealing with
the category highway. In OSM, key value pairs (tags), which can
be freely assigned (free tagging system) are generated during the
process of categorisation. The number of potential features is
unlimited. It was possible to ascertain that the diversity and
features that result from the free tagging system increased and
thus impeded the options for making enquiries. In order to
maintain a uniform classification, every mapper should comply
with the instructions of the OSM Wiki, an online handbook. The
free allocation of features should therefore only be used if a
Road regulations in Germany
Data structure in OpenStreetMap
Fig. 2: Traffic signs 237, 240, and 241 for designating
compulsory use
36 II A focus on data – establishing sources for Urban Audit
and data use
suggested standard feature is not suitable for a specific case.
Whether users always comply with the OSM Wiki, however, is
doubtful.
Within a key/value pair, the key represents the category, i.e. the
kind of object. This includes main categories such as building,
highway, or railway as well as sub-categories such as maxspeed,
tunnel, or cycleway. The value that is added to each key provides
essential details about the corresponding category. This leads to
key/value pairs such as building=church, highway=motorway or
railway=subway. In the sub-categories, details, such as
maxspeed=80, tunnel=yes, are possible. The features are always
listed in English in OSM.
The exclusive use of the OSM key bicycle is not recommended.
This key includes the values designated, official, yes, and n/a.
Problems can occur because the feature bicycle=yes, for example,
is also assigned to ferries or properties set up for learner drivers
and therefore produces undesired results regarding the total
length of a cycle network. In order to avoid this, the key/value pair
should always be linked to a specific path (e.g. track, path) when
submitting an enquiry.
Theoretically, the tag bicycle=designated asks for the central
criteria defined in the Urban Audit European data collection as this
tag includes all of the cycle routes that are explicitly designated for
cycling. Even if the tag bicycle=designated is linked to specific
types of streets, a selection based exclusively on these two tags
should not be made, since the variety of features in OSM would
exclude numerous cycle routes.
If a cycle route is on or next to a road, it can be marked as a
subcategory for this road. However, it is also possible to mark
cycle routes that either run parallel to roads or are separated from
them using the key/value pair highway=cycleway.
If a cycle route runs along a road, it can also be tagged
cycleway=track. Specifying the position of a cycle route alongside
a road can be done by changing the existing tag to cycleway: right
or cycleway: left or to the key/value pair cycleway=opposite_track.
The latter refers to a cycle route that runs in the opposite direction
from the traffic lane. The same cycle routes could also be
represented in two different ways, making the selection process
Key/value pairs for cycle routes in OSM
II A focus on data – establishing sources for Urban Audit and data use
37
more complicated. A double representation in OSM cannot be
excluded for geometrical and visual reasons.
Bicycle roads are marked with the tag bicycle_road = yes. Bicycle
roads are defined as roads of mixed usage on which cyclists are
given the right of way. This is a relatively seldom category that is
mostly found in larger cities.
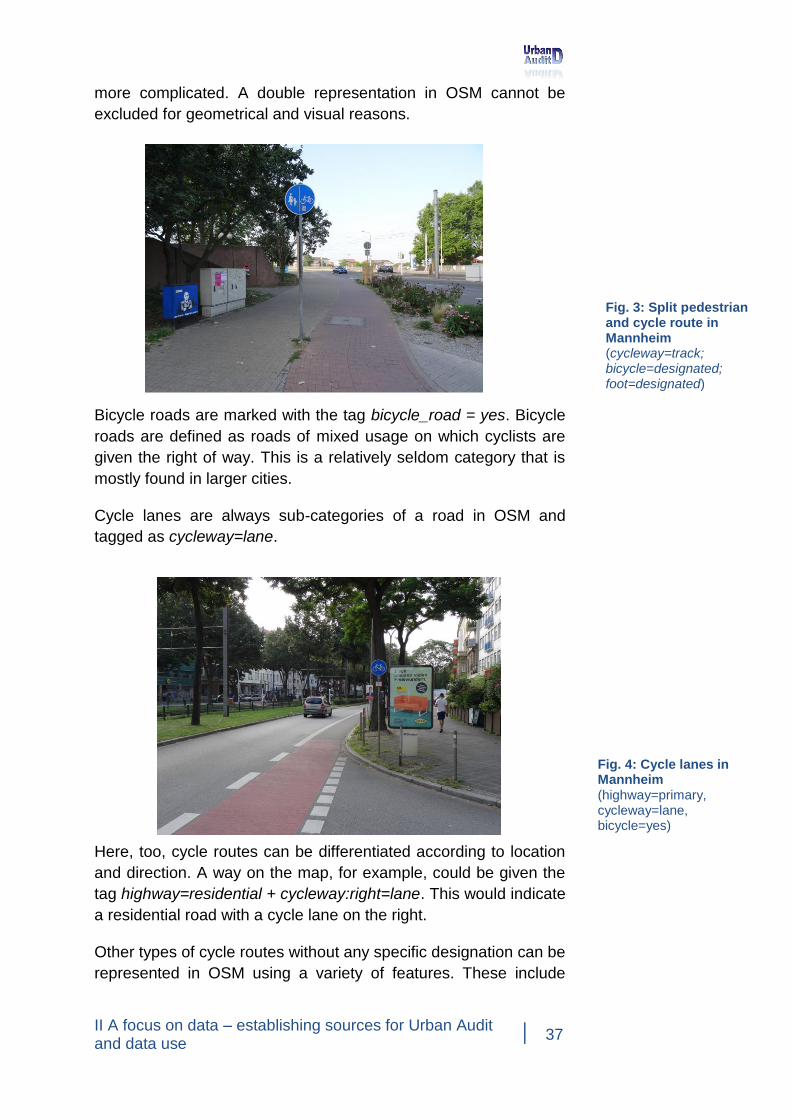
Cycle lanes are always sub-categories of a road in OSM and
tagged as cycleway=lane.
Here, too, cycle routes can be differentiated according to location
and direction. A way on the map, for example, could be given the
tag highway=residential + cycleway:right=lane. This would indicate
a residential road with a cycle lane on the right.
Other types of cycle routes without any specific designation can be
represented in OSM using a variety of features. These include
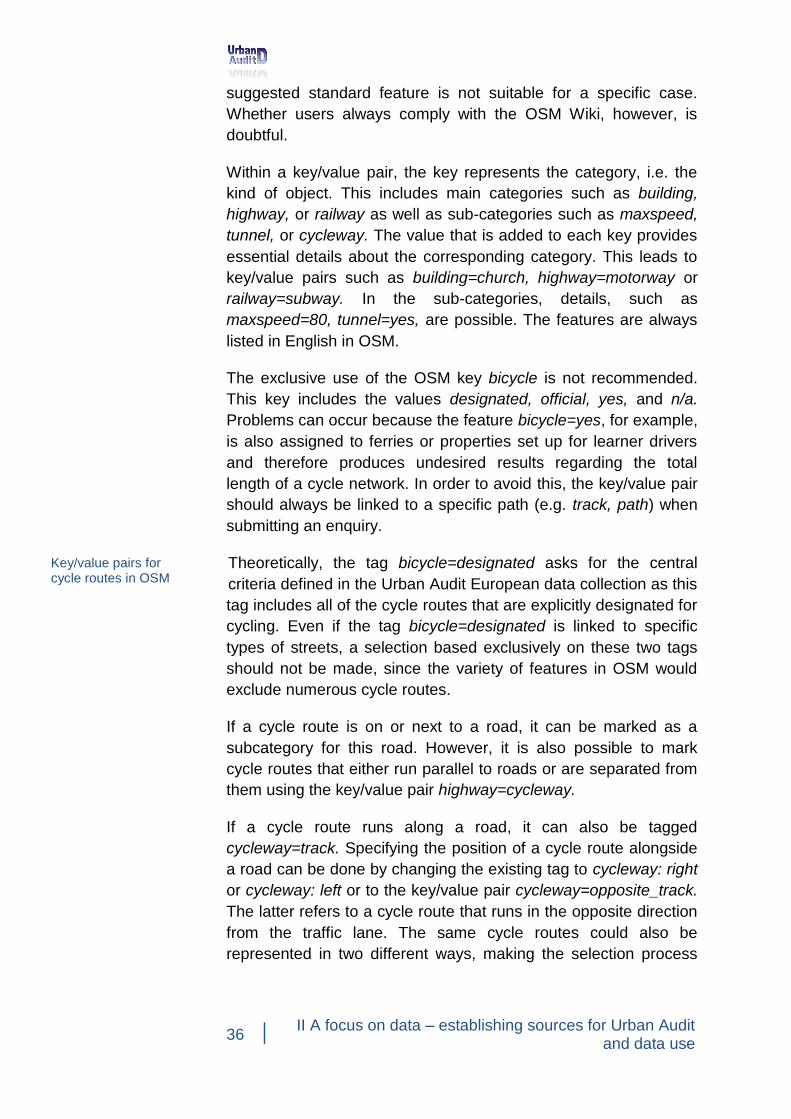
Fig. 3: Split pedestrian and cycle route in Mannheim (cycleway=track; bicycle=designated; foot=designated)
Fig. 4: Cycle lanes in Mannheim (highway=primary, cycleway=lane, bicycle=yes)
38 II A focus on data – establishing sources for Urban Audit
and data use
one-way roads that may be used by cyclists driving in the opposite
direction from the traffic (cycleway=opposite) and shared bus
lanes (cycleway: right/left=share_busway). The majority of the
paths that do not have a specific designation are multipurpose or
agricultural roads where motorised traffic is forbidden
(highway=path or highway=track AND bicycle=yes). One example
are forest paths that can be easily used by cyclists on a regular
basis. The key/value pair highway=path, in particular, can be seen
as a universal tag in OSM, since it can also be used for normal
footpaths. However, this results in a significant problem. Although
many of these routes do exist in OSM, they do not contain specific
details about their use as cycle routes (e.g. no details about the
surface of the road).
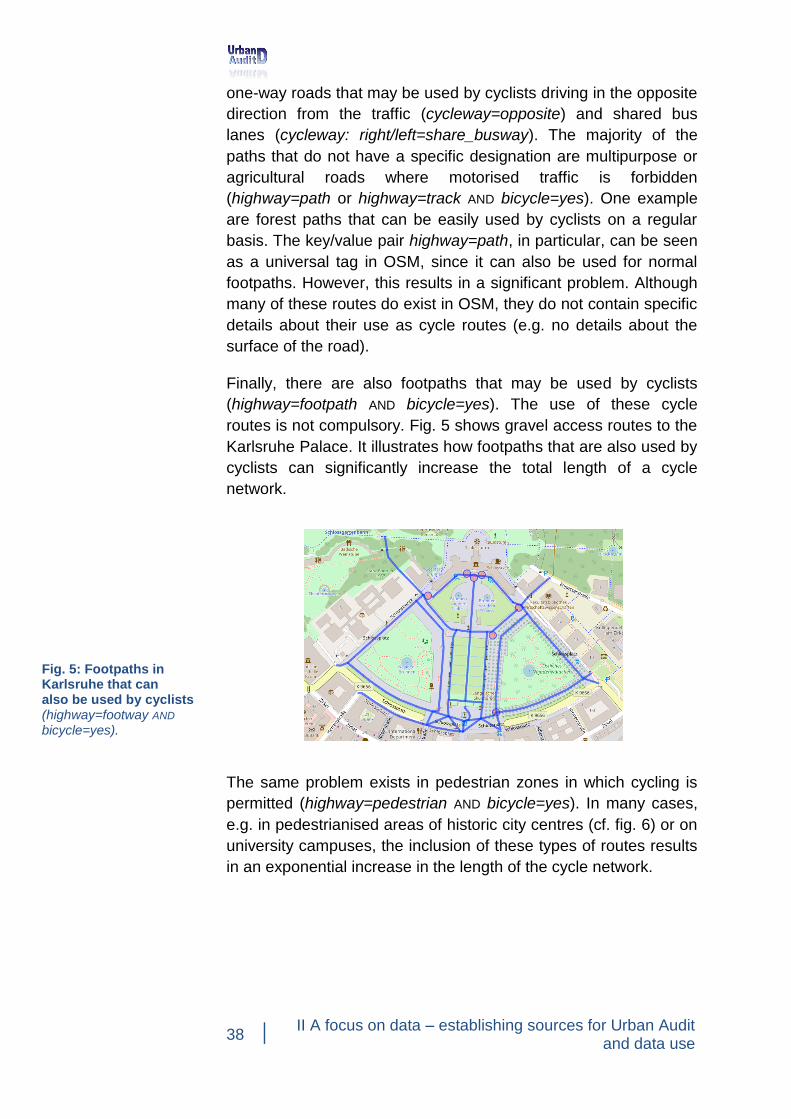
Finally, there are also footpaths that may be used by cyclists
(highway=footpath AND bicycle=yes). The use of these cycle
routes is not compulsory. Fig. 5 shows gravel access routes to the
Karlsruhe Palace. It illustrates how footpaths that are also used by
cyclists can significantly increase the total length of a cycle
network.
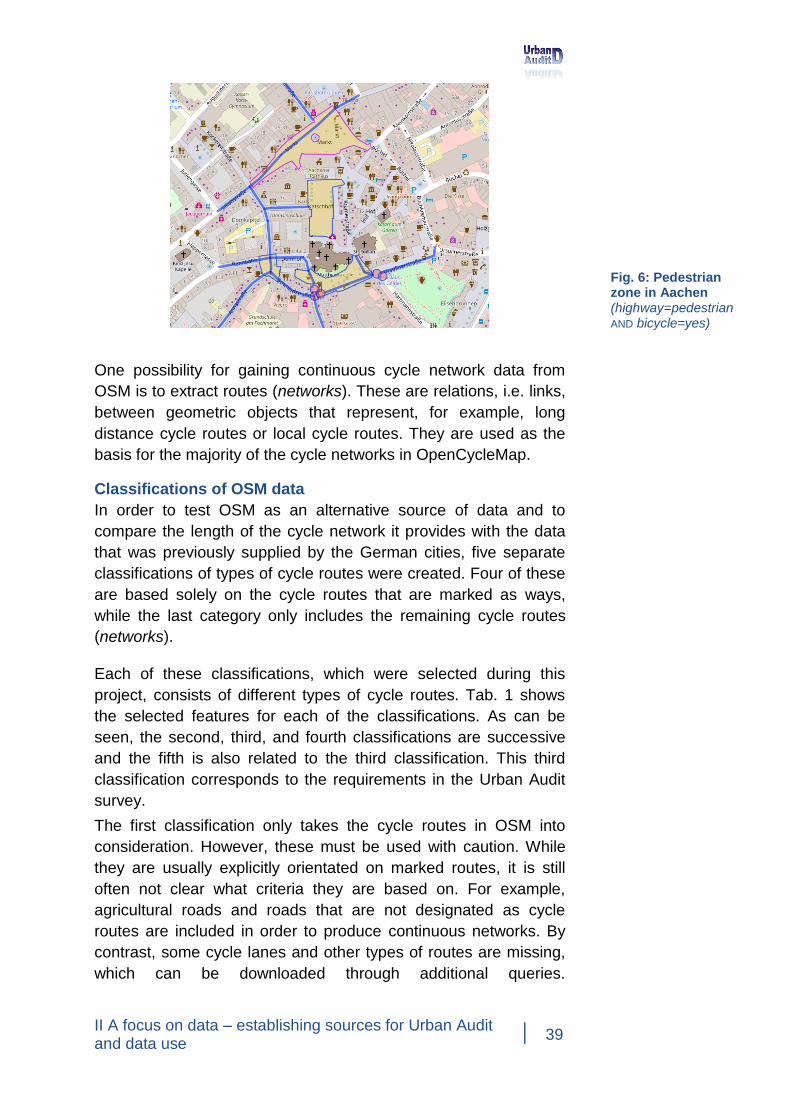
The same problem exists in pedestrian zones in which cycling is
permitted (highway=pedestrian AND bicycle=yes). In many cases,
e.g. in pedestrianised areas of historic city centres (cf. fig. 6) or on
university campuses, the inclusion of these types of routes results
in an exponential increase in the length of the cycle network.
Fig. 5: Footpaths in Karlsruhe that can also be used by cyclists (highway=footway AND bicycle=yes).
II A focus on data – establishing sources for Urban Audit and data use
39
One possibility for gaining continuous cycle network data from
OSM is to extract routes (networks). These are relations, i.e. links,
between geometric objects that represent, for example, long
distance cycle routes or local cycle routes. They are used as the
basis for the majority of the cycle networks in OpenCycleMap.
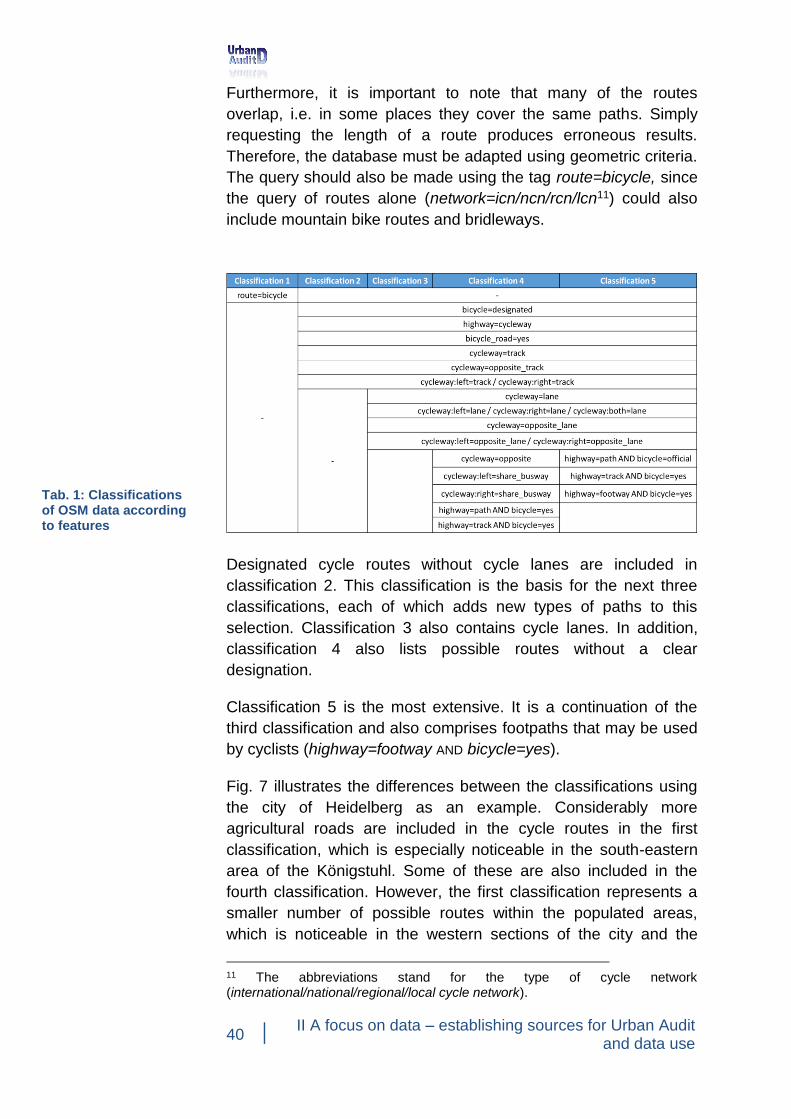
Classifications of OSM data
In order to test OSM as an alternative source of data and to
compare the length of the cycle network it provides with the data
that was previously supplied by the German cities, five separate
classifications of types of cycle routes were created. Four of these
are based solely on the cycle routes that are marked as ways,
while the last category only includes the remaining cycle routes
(networks).
Each of these classifications, which were selected during this
project, consists of different types of cycle routes. Tab. 1 shows
the selected features for each of the classifications. As can be
seen, the second, third, and fourth classifications are successive
and the fifth is also related to the third classification. This third
classification corresponds to the requirements in the Urban Audit
survey.
The first classification only takes the cycle routes in OSM into
consideration. However, these must be used with caution. While
they are usually explicitly orientated on marked routes, it is still
often not clear what criteria they are based on. For example,
agricultural roads and roads that are not designated as cycle
routes are included in order to produce continuous networks. By
contrast, some cycle lanes and other types of routes are missing,
which can be downloaded through additional queries.
Fig. 6: Pedestrian zone in Aachen (highway=pedestrian AND bicycle=yes)
40 II A focus on data – establishing sources for Urban Audit
and data use
Furthermore, it is important to note that many of the routes
overlap, i.e. in some places they cover the same paths. Simply
requesting the length of a route produces erroneous results.
Therefore, the database must be adapted using geometric criteria.
The query should also be made using the tag route=bicycle, since
the query of routes alone (network=icn/ncn/rcn/lcn11) could also
include mountain bike routes and bridleways.
Designated cycle routes without cycle lanes are included in
classification 2. This classification is the basis for the next three
classifications, each of which adds new types of paths to this
selection. Classification 3 also contains cycle lanes. In addition,
classification 4 also lists possible routes without a clear
designation.
Classification 5 is the most extensive. It is a continuation of the
third classification and also comprises footpaths that may be used
by cyclists (highway=footway AND bicycle=yes).
Fig. 7 illustrates the differences between the classifications using
the city of Heidelberg as an example. Considerably more
agricultural roads are included in the cycle routes in the first
classification, which is especially noticeable in the south-eastern
area of the Königstuhl. Some of these are also included in the
fourth classification. However, the first classification represents a
smaller number of possible routes within the populated areas,
which is noticeable in the western sections of the city and the
11 The abbreviations stand for the type of cycle network (international/national/regional/local cycle network).
Tab. 1: Classifications of OSM data according to features
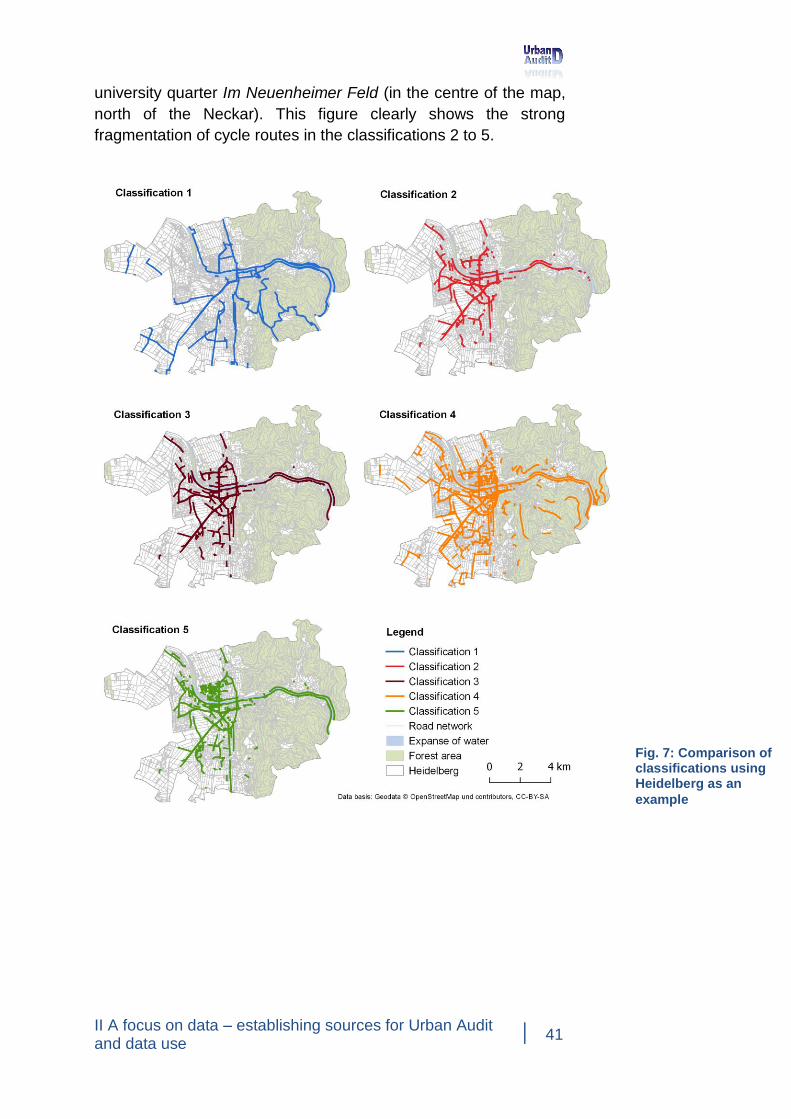
II A focus on data – establishing sources for Urban Audit and data use
41
university quarter Im Neuenheimer Feld (in the centre of the map,
north of the Neckar). This figure clearly shows the strong
fragmentation of cycle routes in the classifications 2 to 5.
Fig. 7: Comparison of classifications using Heidelberg as an
example
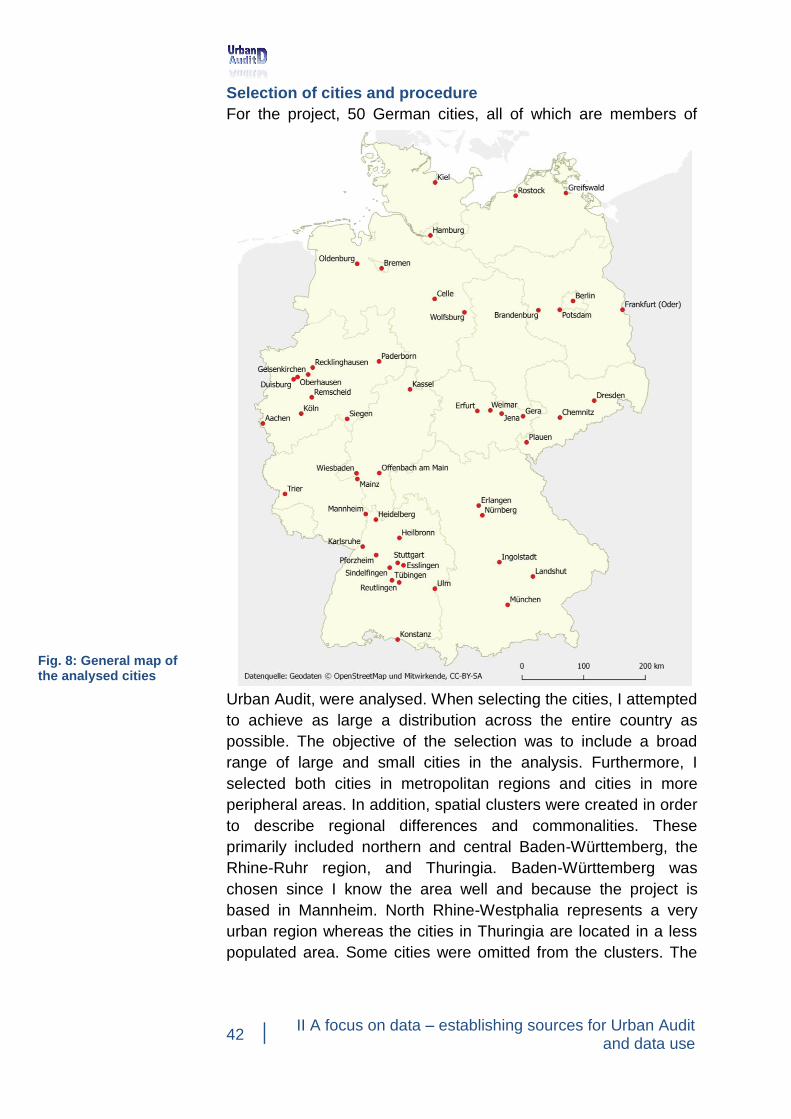
42 II A focus on data – establishing sources for Urban Audit
and data use
Selection of cities and procedure
For the project, 50 German cities, all of which are members of
Urban Audit, were analysed. When selecting the cities, I attempted
to achieve as large a distribution across the entire country as
possible. The objective of the selection was to include a broad
range of large and small cities in the analysis. Furthermore, I
selected both cities in metropolitan regions and cities in more
peripheral areas. In addition, spatial clusters were created in order
to describe regional differences and commonalities. These
primarily included northern and central Baden-Württemberg, the
Rhine-Ruhr region, and Thuringia. Baden-Württemberg was
chosen since I know the area well and because the project is
based in Mannheim. North Rhine-Westphalia represents a very
urban region whereas the cities in Thuringia are located in a less
populated area. Some cities were omitted from the clusters. The
Fig. 8: General map of the analysed cities
II A focus on data – establishing sources for Urban Audit and data use
43
reason for this was missing or inconsistent data in the Urban Audit
data collection.
The same analyses were carried out for all of the cities. Each of
the OSM databases was downloaded using Overpass Turbo12
according to the criteria mentioned above and customised for the
specific area. The area in question was always determined by the
general municipal code. This was especially important for the
routes, because they often cross state and national borders. In the
final step, the calculated total length for each of the classifications
was compared with the data submitted by the cities for the Urban
Audit. The majority of the data was from 2016. Older data was
only included when information was missing or was evidently
flawed. The entire analysis of the data was carried out in QGIS13.
The results of the project will be presented in detail in the next
section.
Results of the project
Depending on the classification of OSM data, there were
significant differences in the total length of the cycle network of the
50 selected cities (cf. fig. 9).
As anticipated, the total length of the cycle network in OSM varied
dramatically between the 50 cities in the selection. The highest
value was found in Berlin in the fifth classification, with 2,256.6 km
of cycle routes, and the lowest value was found in Esslingen in the
second category, with 17.8 km. The values in each of the
classifications also varied greatly from one another. Fig. 9 shows
these differences for the 50 cities.
12 Overpass Turbo is an online data filtering tool for OpenStreetMap: http://overpass-turbo.eu. 13 A free open source geographical information system: http://qgis.org
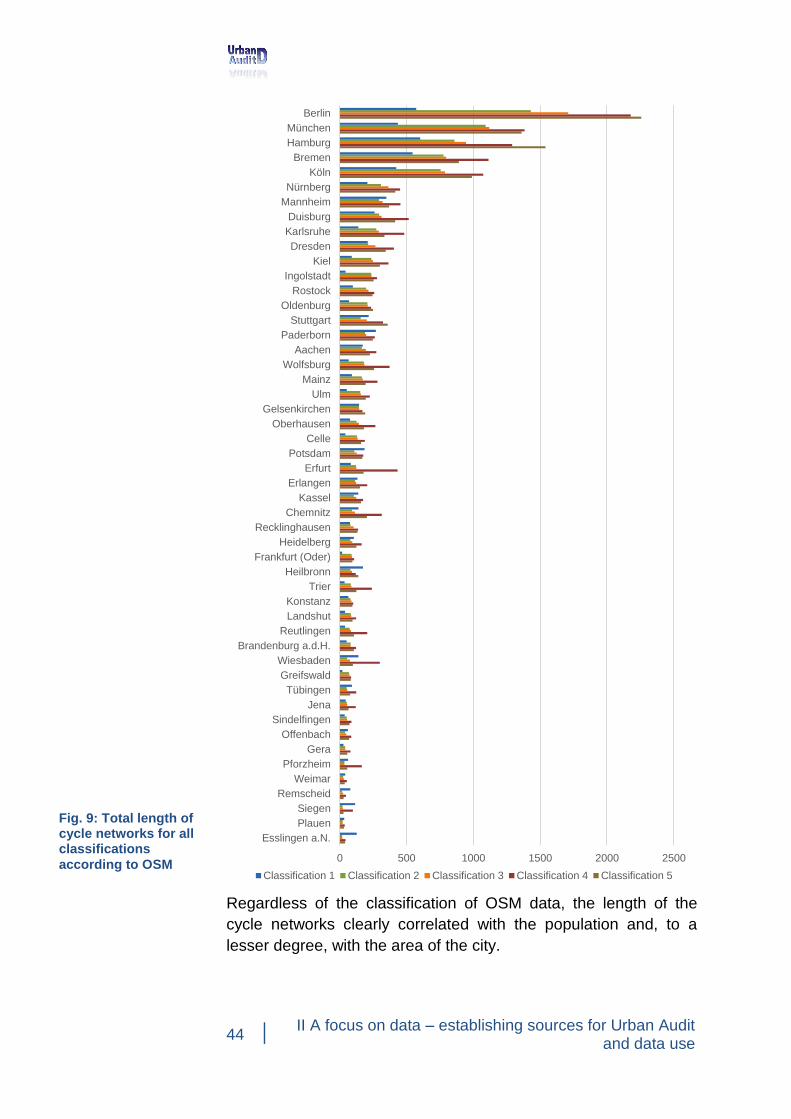
44 II A focus on data – establishing sources for Urban Audit
and data use
Regardless of the classification of OSM data, the length of the
cycle networks clearly correlated with the population and, to a
lesser degree, with the area of the city.
Fig. 9: Total length of cycle networks for all classifications
according to OSM 0 500 1000 1500 2000 2500
Esslingen a.N.
Plauen
Siegen
Remscheid
Weimar
Pforzheim
Gera
Offenbach
Sindelfingen
Jena
Tübingen
Greifswald
Wiesbaden
Brandenburg a.d.H.
Reutlingen
Landshut
Konstanz
Trier
Heilbronn
Frankfurt (Oder)
Heidelberg
Recklinghausen
Chemnitz
Kassel
Erlangen
Erfurt
Potsdam
Celle
Oberhausen
Gelsenkirchen
Ulm
Mainz
Wolfsburg
Aachen
Paderborn
Stuttgart
Oldenburg
Rostock
Ingolstadt
Kiel
Dresden
Karlsruhe
Duisburg
Mannheim
Nürnberg
Köln
Bremen
Hamburg
München
Berlin
Classification 1 Classification 2 Classification 3 Classification 4 Classification 5
II A focus on data – establishing sources for Urban Audit and data use
45
I will now discuss the individual classifications in more detail and
compare them with the data on the length of cycle networks
submitted by the cities for the Urban Audit data collection.
The first classification comprises only the routes (cycle networks)
in OSM. Thirty-nine of the fifty cities (78%) fell significantly short of
the official data in some places. The enormous differences in the
metropolises are particularly striking (Hamburg: -1198 km; Berlin: -
875 km; Munich: -521 km). The cities whose official data was
closest to the OSM data were Tübingen (+2 km), Wiesbaden (-6
km), and Chemnitz (+14 km). The largest positive deviations were
found in cities with very low official data, such as Remscheid (+61
km) and Pforzheim (+59 km). Substantially negative deviations
were found in Ingolstadt (-231 km) and Ulm (-234 km), among
others.
The second classification was restricted to the designated cycle
routes of a city, without taking cycle lanes into consideration. This
classification does not correspond to the Urban Audit guidelines,
but was nonetheless selected in order to test whether cycle lanes
were relevant for the total length. The calculated values closely
approximated the Urban Audit data, but they still showed a high
dispersion. For example, there were matching results in
Remscheid (-0.1 km), Berlin (-18 km), and Nuremberg (+7 km).
However, some values also varied strongly, such as in Trier (+53
km), Paderborn (+92 km), and Esslingen am Neckar (-153 km). In
this category, as well, negative deviations were most common
(74% of the 50 cities).
The third classification only differed from the second classification
in the addition of cycle lanes. This definition was the central
classification criteria as it concurs with the data requested by the
Urban Audit city survey. Once again, the total length of the cycle
networks calculated in OSM was lower than the information
submitted for the data collection for the majority of the cities
(68%). However, compared with the second classification, the
average deviation from the Urban Audit data is lower. As a result,
it is recommended that cycle lanes be included in this
classification.
The approximation to the Urban Audit data is a result of the fact
that every city – with the exception of Plauen – has a certain
number of cycle lanes in OpenStreetMap. However, these lanes
may only measure a few hundred metres, as is the case in
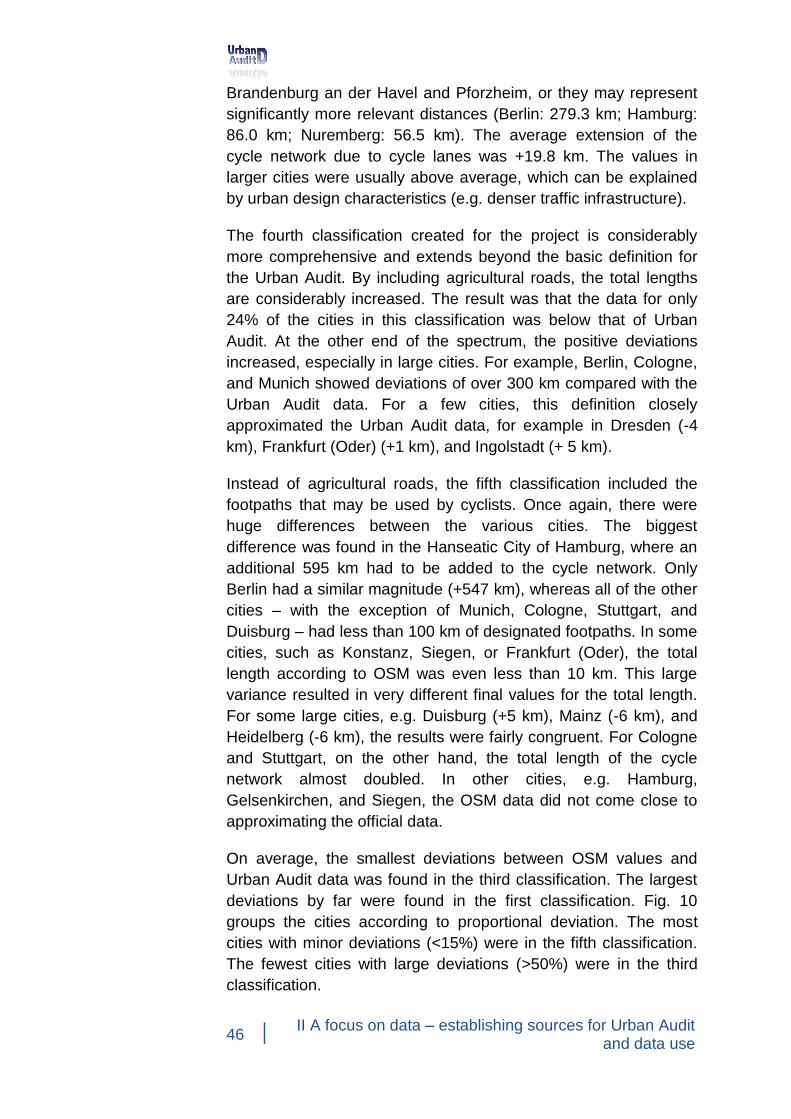
46 II A focus on data – establishing sources for Urban Audit
and data use
Brandenburg an der Havel and Pforzheim, or they may represent
significantly more relevant distances (Berlin: 279.3 km; Hamburg:
86.0 km; Nuremberg: 56.5 km). The average extension of the
cycle network due to cycle lanes was +19.8 km. The values in
larger cities were usually above average, which can be explained
by urban design characteristics (e.g. denser traffic infrastructure).
The fourth classification created for the project is considerably
more comprehensive and extends beyond the basic definition for
the Urban Audit. By including agricultural roads, the total lengths
are considerably increased. The result was that the data for only
24% of the cities in this classification was below that of Urban
Audit. At the other end of the spectrum, the positive deviations
increased, especially in large cities. For example, Berlin, Cologne,
and Munich showed deviations of over 300 km compared with the
Urban Audit data. For a few cities, this definition closely
approximated the Urban Audit data, for example in Dresden (-4
km), Frankfurt (Oder) (+1 km), and Ingolstadt (+ 5 km).
Instead of agricultural roads, the fifth classification included the
footpaths that may be used by cyclists. Once again, there were
huge differences between the various cities. The biggest
difference was found in the Hanseatic City of Hamburg, where an
additional 595 km had to be added to the cycle network. Only
Berlin had a similar magnitude (+547 km), whereas all of the other
cities – with the exception of Munich, Cologne, Stuttgart, and
Duisburg – had less than 100 km of designated footpaths. In some
cities, such as Konstanz, Siegen, or Frankfurt (Oder), the total
length according to OSM was even less than 10 km. This large
variance resulted in very different final values for the total length.
For some large cities, e.g. Duisburg (+5 km), Mainz (-6 km), and
Heidelberg (-6 km), the results were fairly congruent. For Cologne
and Stuttgart, on the other hand, the total length of the cycle
network almost doubled. In other cities, e.g. Hamburg,
Gelsenkirchen, and Siegen, the OSM data did not come close to
approximating the official data.
On average, the smallest deviations between OSM values and
Urban Audit data was found in the third classification. The largest
deviations by far were found in the first classification. Fig. 10
groups the cities according to proportional deviation. The most
cities with minor deviations (<15%) were in the fifth classification.
The fewest cities with large deviations (>50%) were in the third
classification.
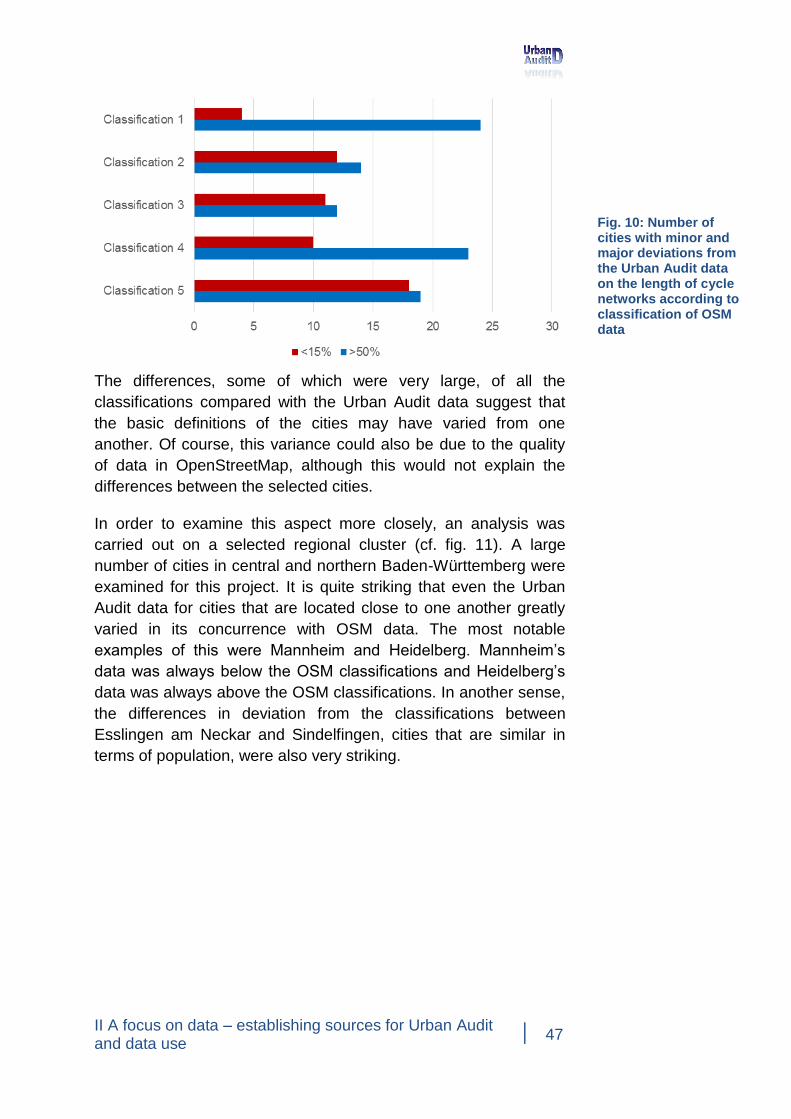
II A focus on data – establishing sources for Urban Audit and data use
47
The differences, some of which were very large, of all the
classifications compared with the Urban Audit data suggest that
the basic definitions of the cities may have varied from one
another. Of course, this variance could also be due to the quality
of data in OpenStreetMap, although this would not explain the
differences between the selected cities.
In order to examine this aspect more closely, an analysis was
carried out on a selected regional cluster (cf. fig. 11). A large
number of cities in central and northern Baden-Württemberg were
examined for this project. It is quite striking that even the Urban
Audit data for cities that are located close to one another greatly
varied in its concurrence with OSM data. The most notable
examples of this were Mannheim and Heidelberg. Mannheim’s
data was always below the OSM classifications and Heidelberg’s
data was always above the OSM classifications. In another sense,
the differences in deviation from the classifications between
Esslingen am Neckar and Sindelfingen, cities that are similar in
terms of population, were also very striking.
Fig. 10: Number of cities with minor and major deviations from the Urban Audit data on the length of cycle networks according to classification of OSM data
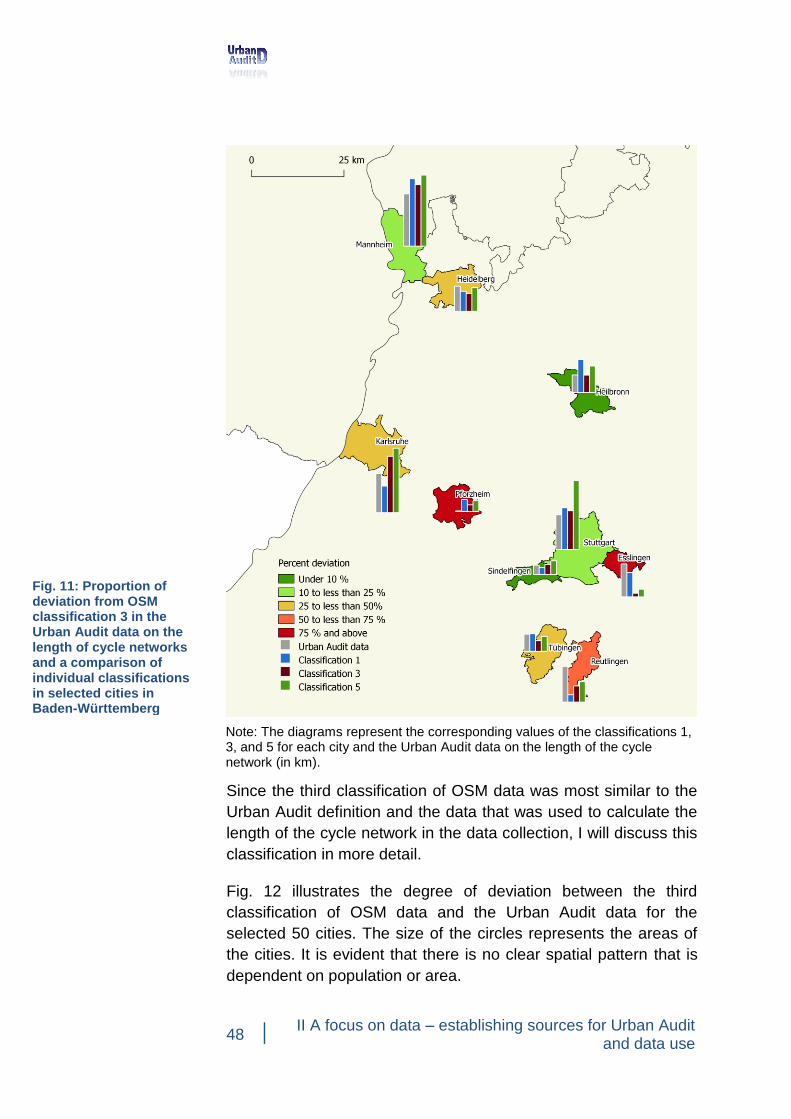
48 II A focus on data – establishing sources for Urban Audit
and data use
Note: The diagrams represent the corresponding values of the classifications 1, 3, and 5 for each city and the Urban Audit data on the length of the cycle network (in km).
Since the third classification of OSM data was most similar to the
Urban Audit definition and the data that was used to calculate the
length of the cycle network in the data collection, I will discuss this
classification in more detail.
Fig. 12 illustrates the degree of deviation between the third
classification of OSM data and the Urban Audit data for the
selected 50 cities. The size of the circles represents the areas of
the cities. It is evident that there is no clear spatial pattern that is
dependent on population or area.
Fig. 11: Proportion of deviation from OSM classification 3 in the Urban Audit data on the length of cycle networks and a comparison of individual classifications in selected cities in Baden-Württemberg
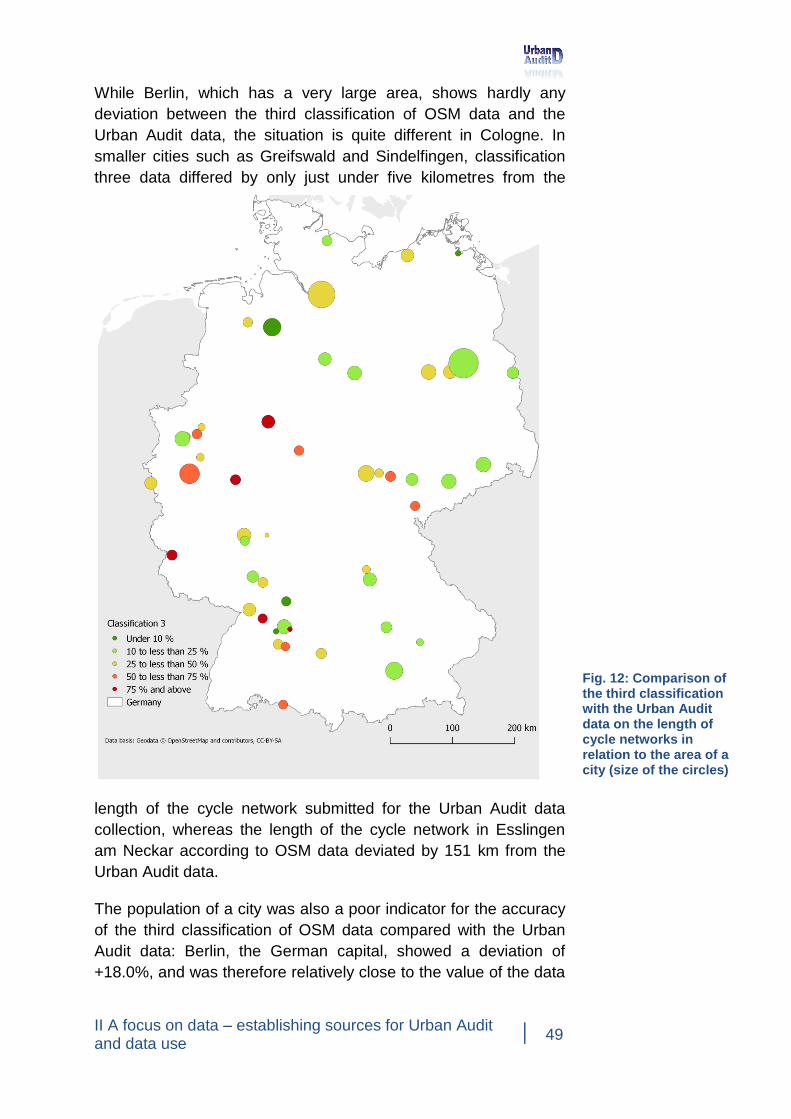
II A focus on data – establishing sources for Urban Audit and data use
49
While Berlin, which has a very large area, shows hardly any
deviation between the third classification of OSM data and the
Urban Audit data, the situation is quite different in Cologne. In
smaller cities such as Greifswald and Sindelfingen, classification
three data differed by only just under five kilometres from the
length of the cycle network submitted for the Urban Audit data
collection, whereas the length of the cycle network in Esslingen
am Neckar according to OSM data deviated by 151 km from the
Urban Audit data.
The population of a city was also a poor indicator for the accuracy
of the third classification of OSM data compared with the Urban
Audit data: Berlin, the German capital, showed a deviation of
+18.0%, and was therefore relatively close to the value of the data
Fig. 12: Comparison of the third classification with the Urban Audit data on the length of cycle networks in relation to the area of a city (size of the circles)
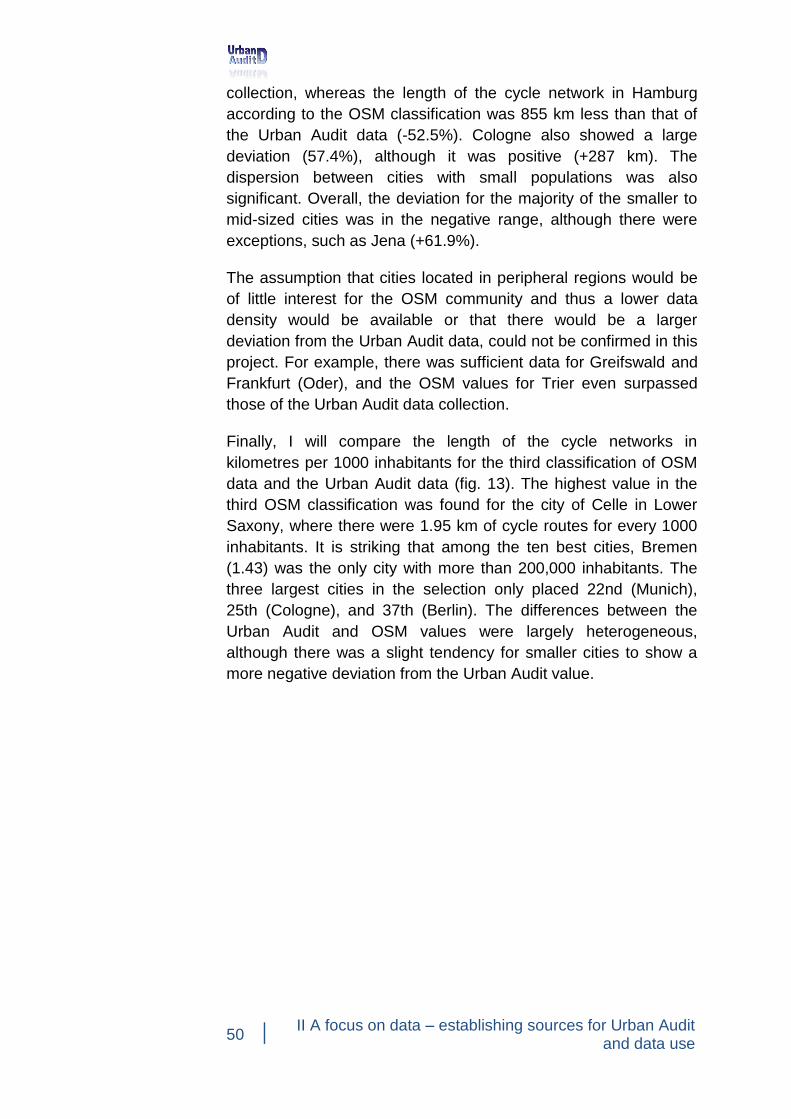
50 II A focus on data – establishing sources for Urban Audit
and data use
collection, whereas the length of the cycle network in Hamburg
according to the OSM classification was 855 km less than that of
the Urban Audit data (-52.5%). Cologne also showed a large
deviation (57.4%), although it was positive (+287 km). The
dispersion between cities with small populations was also
significant. Overall, the deviation for the majority of the smaller to
mid-sized cities was in the negative range, although there were
exceptions, such as Jena (+61.9%).
The assumption that cities located in peripheral regions would be
of little interest for the OSM community and thus a lower data
density would be available or that there would be a larger
deviation from the Urban Audit data, could not be confirmed in this
project. For example, there was sufficient data for Greifswald and
Frankfurt (Oder), and the OSM values for Trier even surpassed
those of the Urban Audit data collection.
Finally, I will compare the length of the cycle networks in
kilometres per 1000 inhabitants for the third classification of OSM
data and the Urban Audit data (fig. 13). The highest value in the
third OSM classification was found for the city of Celle in Lower
Saxony, where there were 1.95 km of cycle routes for every 1000
inhabitants. It is striking that among the ten best cities, Bremen
(1.43) was the only city with more than 200,000 inhabitants. The
three largest cities in the selection only placed 22nd (Munich),
25th (Cologne), and 37th (Berlin). The differences between the
Urban Audit and OSM values were largely heterogeneous,
although there was a slight tendency for smaller cities to show a
more negative deviation from the Urban Audit value.
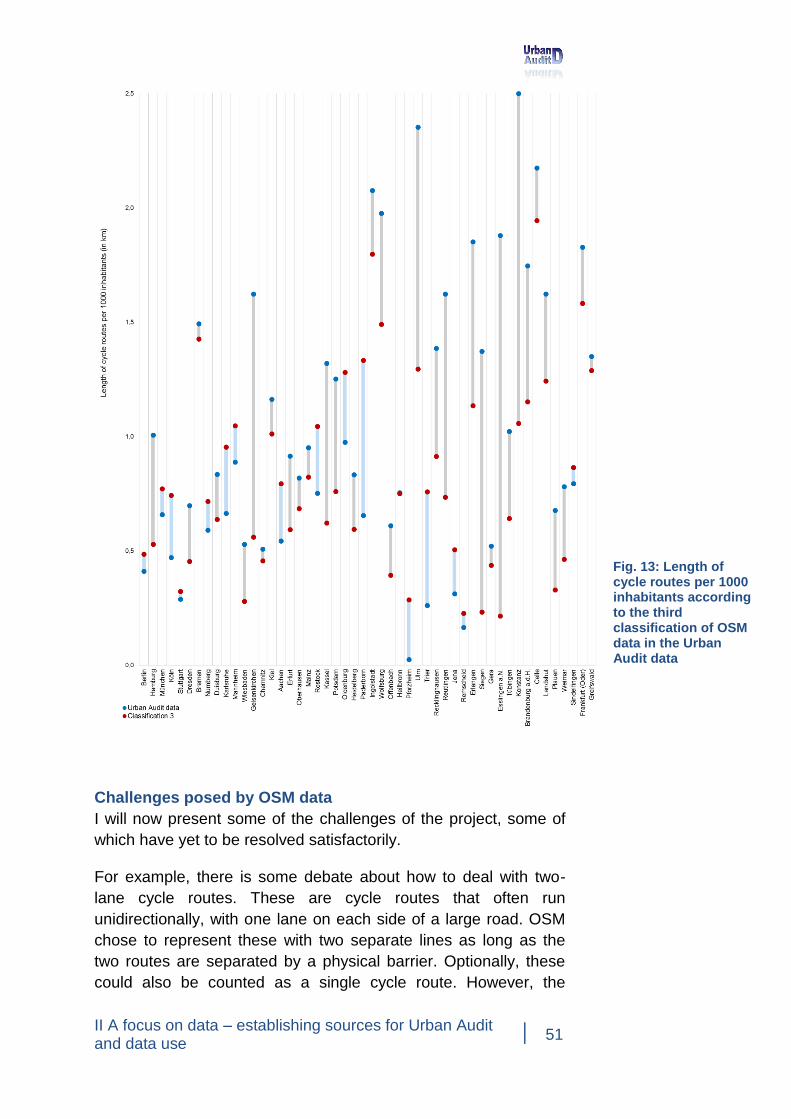
II A focus on data – establishing sources for Urban Audit and data use
51
Challenges posed by OSM data
I will now present some of the challenges of the project, some of
which have yet to be resolved satisfactorily.
For example, there is some debate about how to deal with two-
lane cycle routes. These are cycle routes that often run
unidirectionally, with one lane on each side of a large road. OSM
chose to represent these with two separate lines as long as the
two routes are separated by a physical barrier. Optionally, these
could also be counted as a single cycle route. However, the
Fig. 13: Length of cycle routes per 1000 inhabitants according to the third classification of OSM data in the Urban Audit data
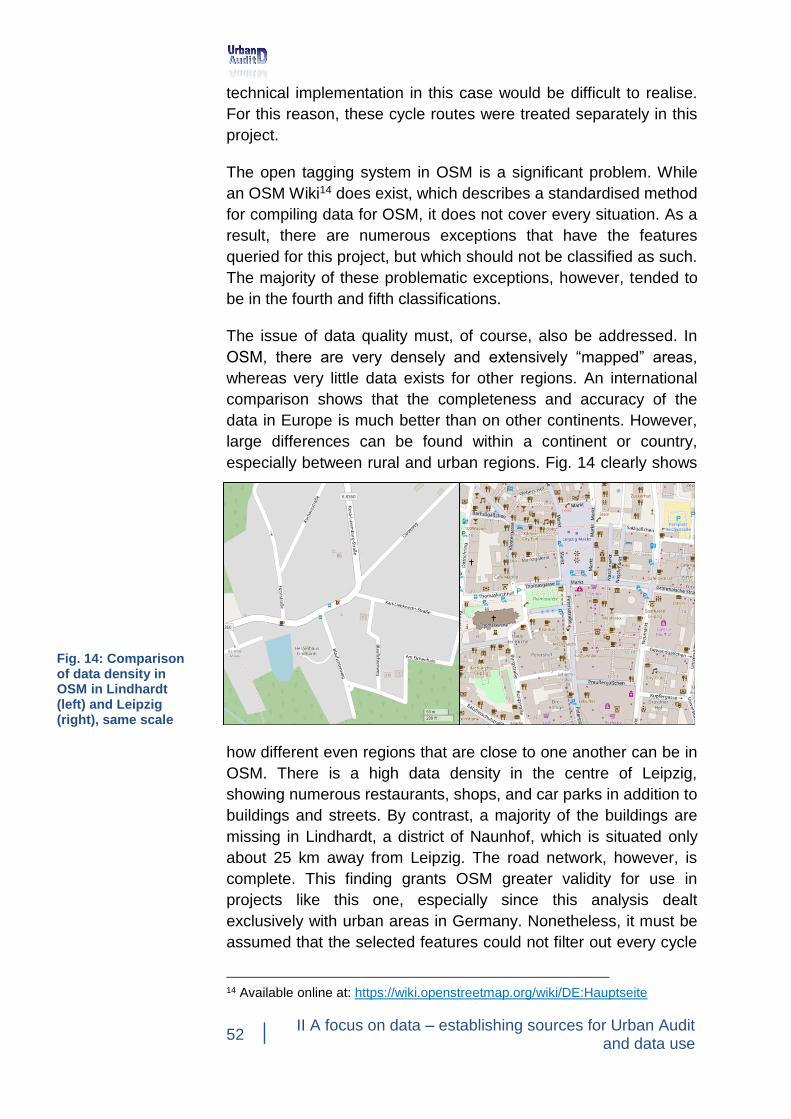
52 II A focus on data – establishing sources for Urban Audit
and data use
technical implementation in this case would be difficult to realise.
For this reason, these cycle routes were treated separately in this
project.
The open tagging system in OSM is a significant problem. While
an OSM Wiki14 does exist, which describes a standardised method
for compiling data for OSM, it does not cover every situation. As a
result, there are numerous exceptions that have the features
queried for this project, but which should not be classified as such.
The majority of these problematic exceptions, however, tended to
be in the fourth and fifth classifications.
The issue of data quality must, of course, also be addressed. In
OSM, there are very densely and extensively “mapped” areas,
whereas very little data exists for other regions. An international
comparison shows that the completeness and accuracy of the
data in Europe is much better than on other continents. However,
large differences can be found within a continent or country,
especially between rural and urban regions. Fig. 14 clearly shows
how different even regions that are close to one another can be in
OSM. There is a high data density in the centre of Leipzig,
showing numerous restaurants, shops, and car parks in addition to
buildings and streets. By contrast, a majority of the buildings are
missing in Lindhardt, a district of Naunhof, which is situated only
about 25 km away from Leipzig. The road network, however, is
complete. This finding grants OSM greater validity for use in
projects like this one, especially since this analysis dealt
exclusively with urban areas in Germany. Nonetheless, it must be
assumed that the selected features could not filter out every cycle
14 Available online at: https://wiki.openstreetmap.org/wiki/DE:Hauptseite
Fig. 14: Comparison of data density in OSM in Lindhardt (left) and Leipzig (right), same scale
II A focus on data – establishing sources for Urban Audit and data use
53
route of a city, if only because of irregularities in the assignment of
features or a lack of data.
Conclusion
OpenStreetMap represents both the advantages and
disadvantages of user generated content. The question of data
quality, in particular, must be examined considering this wealth of
free geo-data. How good can data be if it was compiled by
volunteers and remote mappers? One of the biggest problems
with OSM, while also one of its great strengths, is certainly the free
tagging system. On the one hand, it enables precision in assigning
features. On the other, it makes it more difficult to compare these
features. The resulting variety makes it difficult to select features,
which in turn can lead to some undesired omissions and
inclusions. The potential inaccuracy and a lack of data are also
some of OSM's weak points. The biggest strength, aside from the
fact that the data is up-to-date, is, however, the common
denominator that can be used for comparing cities. Until now, it
was not clear which criteria cities used to classify their cycle routes
and how precise they adhered to the Urban Audit guidelines. By
including OSM, it is possible to compare these criteria. Even
though there were large deviations from the previous Urban Audit
city data, it is likely that the findings achieved using this method
are suitable for a long-term comparison. OSM has been steadily
growing since its foundation in 2004 and will most likely
significantly reduce the existing data gaps in the near future. Since
the third classification of OSM data most closely approximated the
Urban Audit definition, as well as largely concurring with the Urban
Audit collection, it is the best possible solution. A selection using
routes only is not recommended, since this method shows the
highest average deviations. Furthermore, the selection of routes is
not based on a clear definition.
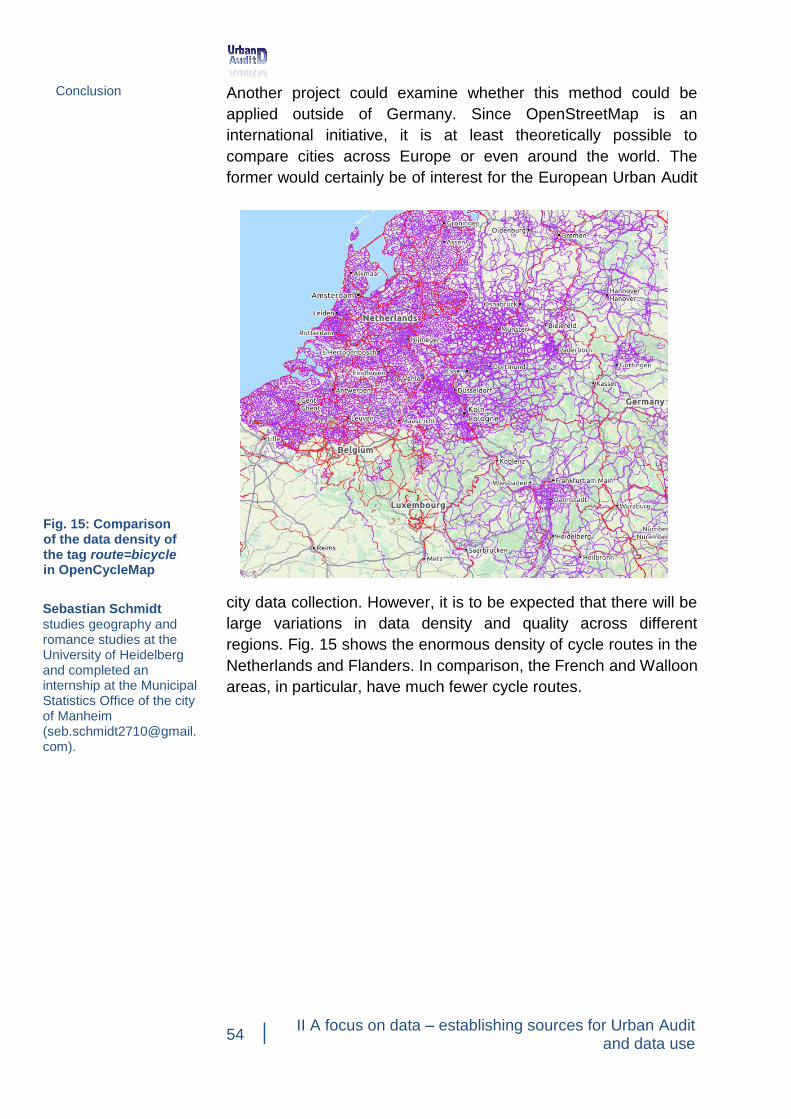
54 II A focus on data – establishing sources for Urban Audit
and data use
Another project could examine whether this method could be
applied outside of Germany. Since OpenStreetMap is an
international initiative, it is at least theoretically possible to
compare cities across Europe or even around the world. The
former would certainly be of interest for the European Urban Audit
city data collection. However, it is to be expected that there will be
large variations in data density and quality across different
regions. Fig. 15 shows the enormous density of cycle routes in the
Netherlands and Flanders. In comparison, the French and Walloon
areas, in particular, have much fewer cycle routes.
Fig. 15: Comparison of the data density of the tag route=bicycle in OpenCycleMap
Sebastian Schmidt studies geography and romance studies at the University of Heidelberg and completed an internship at the Municipal Statistics Office of the city of Manheim ([email protected]).
Conclusion
II A focus on data – establishing sources for Urban Audit and data use
55
2. Data use made easy
by Alexandra Dörzenbach and Tobias Link
The data collected and prepared in the Urban Audit is available to
all interested users without restriction on the internet. There are
different ways to access the data, depending on the intended use.
The services offered by the KOSIS Association Urban Audit
include an information portal and a dynamic report (Urban
Audit Structural Data Atlas) for all Urban Audit territorial units as
well as an additional dynamic report that also contains the results
from the Quality of Life Survey in European cities. Eurostat15, the
statistical office of the European Union, provides a database for
access to this data.
The DUVA information portal
The data that was collected, recorded, adjusted, and tested for
quality for all territorial units and reporting years of the German
Urban Audit cities can be found in the DUVA-based information
portal16. The information portal can be found at
www.urbanaudit.de via the “Daten, Indikatoren” menu option in the
“Daten, Grafiken, Karten” menu, replacing the previous web
catalogue from 2015.
Data on cities, FUAs, SCDs, individual reference years, variable
characteristics or characteristic groups can be individually selected
and downloaded. Supplementary indicators as well as base data
are available for many characteristics. This service is
complemented by a cartographic display using the DUVA map tool
and the option of directly accessing the evaluation and display
options of the Structural Data Atlas.
Since 2017, the DUVA evaluation assistant has been successively
used for providing data in tables and diagrams. The newest
feature enables the creation of dynamic graphs that users can
adapt to meet their needs.
15 http://ec.europa.eu/eurostat/de/web/cities/data/database. 16 Further information on DUVA is available at www.duva.de.
DUVA -
Information portal
56 II A focus on data – establishing sources for Urban Audit
and data use
The Urban Audit Structural Data Atlas
The Structural Data Atlas17 at www.urbanaudit.de allows users to
access this data via the menu option “Graphs, maps” in the “Data,
graphs, maps” menu. As a dynamic reporting supplement to the
information portal, it enables the interactive generation of
customised data tables, diagrams, and maps for selected base
data and indicators for different German Urban Audit territorial
levels (municipal level, functional urban areas – FUAs and sub-city
district level – SCDs) and reporting years. In late 2016, the
Structural Data Atlas was converted to HTML5 format, and, since
2017, comparisons of cities and suburban areas can be made by
clicking on “Levels”. For the functionality of the Structural Data
Atlas, please refer to the online “Urban Audit Structural Data Atlas
- User manual”, which can be accessed by clicking on “Help”.
The Urban Audit Perception Survey Atlas
The Urban Audit Perception Survey Atlas provides the results of
the central European survey and the German coordinated survey
on the quality of life in cities over time for all of the participating
cities. Predefined filters and options for users to create their own
filters enable targeted comparisons with individual city groups.
This atlas was also converted to HTML5 format in late 2016. A
help file was attached to the programme, which provides detailed
explanations of the different functions.
Urban Audit city profile
InstantAtlas’s Builder Report for creating city profiles using static
and dynamic features is currently being tested.
17 Direct link: https://web2.mannheim.de/urbanaudit/strukturdatenatlas/
Structural Data Atlas
Perception Survey Atlas
City profile

Appendix 57
Appendix
Contacts and responsibilities
In Germany, the KOSIS Association Urban Audit acts as the
project partner for data collection to support the European urban
comparison. In 2016, the city of Mannheim was elected as the
managing office for another year. The project is supervised by the
municipal statistical office of Mannheim. The managing office is
responsible for business management, represents the
association within its mandate, heads the steering group, carries
out bookkeeping, and manages the funds of the association.
KOSIS Association Urban Audit
c/o Stadt Mannheim, Kommunale Statistikstelle
PO Box 101832
68018 Mannheim
Email: [email protected]
The director of the Municipal Statistics Office of the city of
Mannheim, Dr Ellen Schneider, is responsible for the managing
office.
Dr Ellen Schneider
Tel.: +49 (0) 621 / 293 7486
Fax: +49 (0) 621 / 293 7750
Email: [email protected]
Mr Tobias Link is the contact person for the KOSIS Association
Urban Audit in all matters relating to the collection of structural
data.
Tobias Link
Tel.: +49 (0) 621 / 293 7486
Fax: +49 (0) 621 / 293 7750
Email: [email protected]
In the European nations participating in Urban Audit, the project is
coordinated on the national level by the respective national Urban
Audit coordinator (NUAC). In Germany, this coordinator is
appointed by the KOSIS Association Urban Audit.
Alexandra Dörzenbach
Tel.: +49 (0) 621 / 293 7857
Fax: +49 (0) 621 / 293 7750
Email: [email protected]
The Federal Statistical Office is the project coordinator for the
structural database and therefore the point of contact for Eurostat
www.urbanaudit.de
KOSIS Association
Urban Audit
NUAC
Federal Statistical
Office
58 Appendix
for all legal and financial matters. The contact person at
DESTATIS is Gabriele Rutmann.
Statistisches Bundesamt
Fachgebiet B103
Gabriele Rutmann
Gustav-Stresemann-Ring 11
65189 Wiesbaden
Tel.: +49 (0) 611 / 75 20822
Email: [email protected]
Eurostat Directorate E, Sectoral and Regional Statistics, has
overall responsibility for the project. The contact person is Teodora
Brandmüller in Sectoral and Regional Statistics and Geographical
Information.
Eurostat
Directorate E - Sectoral and Regional Statistics
Teodora Brandmüller
Bâtiment Bech
11, rue Alphonse Weicker
L-2721 Luxembourg
Tel.: +352 (0) 4301 / 1 (central telephone number)
Email:[email protected]
The German survey, carried out parallel to the European survey
on the quality of life from a citizen's perspective, is coordinated by
the VDSt (Association of German Municipal Statisticians) Survey
Working Group (VDSt AG Umfragen).
Survey officer
Ulrike Schönfeld-Nastoll
Bereich Statistik und Wahlen
Essener Straße 66
46042 Oberhausen
Tel.: +49 (0) 208 / 825 2649
Email: [email protected]
Alternate
Dr Ralf Gutfleisch
Bürgeramt, Statistik und Wahlen
Zeil 3
60313 Frankfurt am Main
Tel.: +49 (0) 69 / 212 38493
Email: [email protected]
www.destatis.de
Eurostat
epp.eurostat.ec.europa.eu
VDSt AG Umfragen
www.staedtestatistik.de
Appendix 59
Publications
Free print copies of all publications of the KOSIS Association
Urban Audit can be requested by sending an email to
[email protected]. The PDF versions are available for
download in the download section on the website
www.urbanaudit.de – where you can also find many other national
and international publications on the topic of Urban Audit.
The German Urban Audit – Comparison of Cities in the European
Statistical System. (2013): The compact brochure
provides interesting information on the project
background, organisation, and use of data for the
German Urban Audit. Also available in English.
Data – indicators information. (2015): The focus of
this brochure is on the utilisation of comparative urban
data. Let these national and international examples
inspire you! Also available in English.
Regionalisierung des Mikrozensus für den
europäischen Städtevergleich (Regionalisation of the
micro-census for a comparison of European cities)
(2016): This brochure documents the small estimation
method which enables the utilisation of results from
the regular micro-census survey and the registered
statistics from the Federal Employment Agency for
showing small, regionalised, socio-economic
reference features.
Urban Audit Brochure 2013
Urban Audit Brochure 2015
Regionalisation of the micro-census

60 Appendix
A Coruña Aachen Aalborg Aberdeen Acireale Adana Aix-en-Provence Ajaccio Alba Iulia Albacete Alcalá de Henares Alcobendas Alcorcón Algeciras
Alicante Alkmaar Almada Almelo Almere Almería Alphen aan den Rijn Alytus Amadora Amersfoort Amstelveen Amsterdam Ancona Angoulême Ankara
Annecy Antalya Antwerpen Apeldoorn Arad Argenteuil - Bezons Århus Arnhem Arrecife Aschaffenburg Ashford Asti Athina Aubagne Augsburg Aveiro
Avellino Avilés Bacău Badajoz Badalona Baia Mare Balıkesir Bamberg Banská Bystrica Barakaldo Barcelona Bari Barking and Dagenham Bârlad Barletta
Barnet Barnsley Barreiro Basel Basildon Basingstoke and Deane Bath and North East Somerset Bayreuth Bedford Belfast Benevento Benidorm Bergamo
Bergen Bergen op Zoom Bergisch Gladbach Berlin Bern Besançon Bexley Białystok Biel Bielefeld Biella Bielsko-Biała Bilbao Birmingham Blackburn with
Darwen Blackpool Blagoevgrad Bochum Bologna Bolton Bolzano Bonn Borås Bordeaux Botoşani Bottrop Bournemouth Bracknell Forest Bradford Braga
Brăila Brandenburg an der Havel Braşov Bratislava Braunschweig Breda Bremen Bremerhaven Brent Brescia Brest Brighton and Hove Bristol Brno
Bromley Brugge Bruxelles Bucureşti Budapest Burgas Burgos Burnley Bursa Bury Busto Arsizio Buzău Bydgoszcz Bytom CA Brie Francilienne CA de la
Vallée de Montmorency CA de Seine Essonne CA de Sophia-Antipolis CA des deux Rives de la Seine CA des Lacs de l'Essonne CA du Plateau de
Saclay CA du Val d'Orge CA du Val d'Yerres CA Europ' Essonne CA le Parisis CA les Portes de l'Essonne CA Marne et Chantereine CA Sénart - Val de
Seine CA Val de France CA Val et Forêt Cáceres Cádiz Cagliari Calais Cǎlǎraşi Cambridge Camden Campobasso Cannock Chase Capelle aan den
IJssel Cardiff Carlisle Carrara Cartagena Caserta Castelldefels Castellón de la Plana Catania Catanzaro CC de la Boucle de la Seine CC de l'Ouest de la
Plaine de France CC des Coteaux de la Seine Celle Cerdanyola del Vallès Cergy-Pontoise České Budějovice Ceuta Charleroi Charleville-Mézières
Chełm Chelmsford Cheltenham Chemnitz Cherbourg Chesterfield Chorzów City of London Ciudad Real Cluj-Napoca Coimbra Colchester Colmar Como
Constanţa Córdoba Cork Cornellà de Llobregat Cosenza Coslada Cottbus Coventry Craiova Crawley Creil Cremona Croydon Częstochowa Dacorum
Darlington Darmstadt Daugavpils Debrecen Delft Denizli Derby Derry Dessau-Roßlau Deventer Diyarbakır Dobrich Doncaster Dordrecht Dortmund Dos
Hermanas Dresden Drobeta-Turnu Severin Dublin Dudley Duisburg Dundee City Dunkerque Düsseldorf Ealing East Staffordshire Eastbourne Ede
Edinburgh Edirne Eindhoven Elbląg Elche Elda Ełk Enfield Enschede Erfurt Erlangen Erzurum Espoo Essen Esslingen am Neckar Evry Exeter Falkirk
Fareham Faro Ferrara Ferrol Firenze Flensburg Focşani Foggia Forlì Fort-de-France Frankenthal (Pfalz) Frankfurt (Oder) Frankfurt am Main Freiburg im
Breisgau Fréjus Friedrichshafen Fuengirola Fuenlabrada Fulda Funchal Fürth Galaţi Galway Gandia Gateshead Gaziantep Gdańsk Gdynia Gelsenkirchen
Genève Genova Gent Gera Getafe Getxo Gießen Gijón Girona Giugliano in Campania Giurgiu Glasgow Gliwice Głogów Gloucester Gniezno Gondomar
Görlitz Gorzów Wielkopolski Göteborg Göttingen Gouda Granada Granollers Gravesham Graz Great Yarmouth Greenwich Greifswald Groningen
Grudziądz Guadalajara Guildford Guimarães Gyõr Haarlem Hackney Hagen Halle an der Saale Halton Hamburg Hamm Hammersmith and Fulham Hanau
Hannover Haringey Harlow Harrow Hartlepool Haskovo Hastings Hatay Havering Havířov Heerlen Heidelberg Heilbronn Helmond Helsingborg Hengelo
Hénin - Carvin Herne Hildesheim Hillingdon Hilversum Hoorn Hounslow Hradec Králové Huelva Hyndburn Iaşi Ingolstadt Innsbruck Inowrocław Ioannina
Ipswich Irakleio Irun Iserlohn Islington İstanbul İzmir Jaén Jastrzębie-Zdrój Jelenia Góra Jelgava Jena Jerez de la Frontera Jihlava Jönköping Jyväskylä
Kaiserslautern Kalamata Kalisz Karlovy Vary Karlsruhe Kars Karviná Kassel Kastamonu Katowice Katwijk Kaunas Kavala Kayseri Kecskemét Kempten
(Allgäu) Kensington and Chelsea Kiel Kielce Kingston upon Thames Kingston-upon-Hull Kirklees Kladno Klagenfurt Klaipėda København Koblenz Kocaeli
Köln Konin Konstanz Konya Kortrijk Košice Koszalin Kraków Krefeld Kristiansand Kuopio La Rochelle La Spezia Lahti /Lahtis Lambeth Landshut Larisa
Las Palmas Latina Lausanne Le Havre Lecce Lecco Leeds Leeuwarden Lefkosia Leganés Legnica Leicester Leiden Leidschendam-Voorburg Leipzig
Lelystad Lemesos Lens - Liévin León Leszno Leuven Leverkusen Lewisham L'Hospitalet de Llobregat Liberec Liège Liepāja Lille Limerick Lincoln
Línea de la Concepción, La Linköping Linz Lisboa Lisburn Liverpool Livorno Ljubljana Lleida Łódź Logroño Łomża Lübeck Lubin Lublin Ludwigsburg
Ludwigshafen am Rhein Lugano Lugo Lund Lüneburg Luton Luxembourg Luzern Maastricht Madrid Magdeburg Maidstone Mainz Majadahonda Málaga
Malatya Malmö Manchester Manisa Mannheim Manresa Mansfield Mantes en Yvelines Marbella Marburg Maribor Marne la Vallée Marseille Martigues
Massa Mataró Matera Matosinhos Meaux Medway Melilla Melun Merton Messina Middelburg Middlesbrough Milano Milton Keynes Miskolc Modena
Moers Mollet del Vallès Mönchengladbach Mons Montpellier Monza Most Móstoles Mülheim a.d.Ruhr München Münster Murcia Namur Nancy Nantes
Napoli Narva Neubrandenburg Neumünster Neuss Neu-Ulm Nevşehir Newcastle upon Tyne Newcastle-under-Lyme Newham Newport Nijmegen Nitra
Norrköping North East Lincolnshire North Lanarkshire North Tyneside Northampton Norwich Nottingham Novara Nowy Sącz Nuneaton and Bedworth
Nürnberg Nyíregyháza Oberhausen Odense Odivelas Offenbach am Main Offenburg Oldenburg Oldham Olomouc Olsztyn Oostende Opole
Oradea Örebro Orléans Osijek Oslo Osnabrück Ostrava Ostrów Wielkopolski Ostrowiec Świętokrzyski Ourense Oviedo Oxford Pabianice Paderborn
Padova Palencia Palermo Palma de Mallorca Pamplona/Iruña Panevėžys Pardubice Paredes Paris Parla Parma Passau Pátra Pavia Pazardzhik
Pécs Pernik Perugia Pesaro Pescara Peterborough Pforzheim Piacenza Piatra Neamţ Piła Piotrków Trybunalski Pisa Piteşti Plauen Pleven Płock Ploieşti
Plovdiv Plymouth Plzeň Ponferrada Ponta Delgada Pontevedra Poole Pordenone Porto Portsmouth Potenza Potsdam Póvoa de Varzim Poznań Pozuelo
de Alarcón Praha Prat de Llobregat, El Prato Prešov Preston Przemyśl Puerto de Santa María, El Purmerend Radom Râmnicu Vâlcea Ravenna Reading
Recklinghausen Redbridge Redditch Regensburg Reggio di Calabria Reggio nell'Emilia Reims Remscheid Reus Reutlingen Reykjavík Richmond
upon Thames Rīga Rijeka Rimini Roanne Rochdale Roma Roman Roosendaal Rosenheim Rostock Rotherham Rotterdam Rozas de Madrid, Las Rubí
Ruda Śląska Ruse Rybnik Rzeszów Saarbrücken Sabadell Saint Denis Saint-Brieuc Saint-Etienne Saint-Quentin en Yvelines Salamanca Salerno
Salford Salzburg Salzgitter Samsun San Cristóbal de la Laguna San Fernando San Sebastián de los Reyes San Sebastián/Donostia Sandwell Sankt
Augustin Sanlúcar de Barrameda Sanremo Sant Boi de Llobregat Sant Cugat del Vallès Santa Coloma de Gramenet Santa Cruz de Tenerife Santa Lucía
de Tirajana Santander Santiago de Compostela Sassari Satu Mare Savona Schiedam Schweinfurt Schwerin Sefton Seixal Sénart en Essonne
Setúbal Sevilla 's-Gravenhage Sheffield 's-Hertogenbosch Shumen Šiauliai Sibiu Siedlce Siegen Siirt Sindelfingen Sintra Siracusa Sittard-Geleen Slatina
Slavonski Brod Sliven Slough Słupsk Sofia Solihull Solingen Sosnowiec South Tyneside Southampton Southend-on-Sea Southwark Speyer Spijkenisse
Split St Albans St. Gallen St.Helens Stalowa Wola Stara Zagora Stargard Szczeciński Stavanger Stevenage Stockholm Stockport Stockton-on-Tees
Stoke-on-trent Stralsund Stuttgart Suceava Sunderland Sutton Suwałki Swansea Świdnica Swindon Szczecin Szeged Székesfehérvár Szombathely
Talavera de la Reina Tallinn Tameside Tampere / Tammerfors Tamworth Taranto Târgovişte Târgu Jiu Târgu Mureş Tarnów Tarragona Tartu Tczew
Telde Telford and Wrekin Terni Terrassa Thanet Thessaloniki Thurrock Tilburg Timişoara Toledo Tomaszów Mazowiecki Torbay Torino Torrejón de Ardoz
Torremolinos Torrevieja Toruń Tower Hamlets Trabzon Trafford Trenčín Trento Treviso Trier Trieste Trnava Tromsø Trondheim Tübingen Tulcea
Tunbridge Wells Turku Tychy Udine Ulm Umeå Uppsala Ústí nad Labem Utrecht Valence Valencia Valladolid Valletta Valongo Van Vantaa Varese Varna
Västerås Veliko Tarnovo Velsen Venezia Venlo Verona Versailles Viana do Castelo Viareggio Vicenza Vidin Vigevano Vigo Vila Franca de Xira Vila Nova
de Gaia Viladecans Vilanova i la Geltrú Villingen-Schwenningen Vilnius Viseu Vitoria/Gasteiz Vlaardingen Volos Vratsa Wakefield Wałbrzych Walsall
Waltham Forest Wandsworth Warrington Warszawa Warwick Waterford Waveney Weimar Westminster Wetzlar Wien Wiesbaden Wigan Wilhelmshaven
Winterthur Wirral Witten Włocławek Woking Wolfsburg Wolverhampton Worcester Worthing Wrexham Wrocław Wuppertal Würzburg
Wycombe Yambol York Zaanstad Zabrze Zagreb Zamora Zamość Zaragoza Zgierz Zielona Góra Žilina Zlín Zonguldak Żory Zürich Zwickau Zwolle