Embed Size (px)
Citation preview

VYSOKÉ UČENÍ TECHNICKÉ V BRNĚBRNO UNIVERSITY OF TECHNOLOGY
FAKULTA CHEMICKÁ
ÚSTAV CHEMIE A TECHNOLOGIE OCHRANYŽIVOTNÍHO PROSTŘEDÍ
FACULTY OF CHEMISTRY
INSTITUTE OF CHEMISTRY AND TECHNOLOGY OFENVIRONMENTAL PROTECTION
THE INFLUENCE OF USED TESTED ORGANISM(FRESH-WATER ALGAE) ON THE ACUTETOXICITY MICROASSAY
VLIV POUŽITÉHO TESTOVACÍHO ORGANISMU (SLADKOVODNÍ ŘASY) NA TESTOVÁNÍ
AKUTNÍ
TOXICITY MIKROMETODOU
DIPLOMOVÁ PRÁCEMASTER'S THESIS
AUTOR PRÁCE Bc. KATEŘINA HALATOVÁAUTHOR
VEDOUCÍ PRÁCE RNDr. HANA MLEJNKOVÁ, Ph.D.SUPERVISOR
BRNO 2009

Brno University of TechnologyFaculty of Chemistry
Purkyňova 464/118, 61200 Brno 12
Master's thesis Assignment
Number of master's thesis: FCH-DIP0337/2008 Academic year: 2008/2009
Institute: Institute of Chemistry and Technology of Environmental Protection
Student: Bc. Kateřina Halatová
Study programme: Chemistry and Technology of Environmental Protection (N2805)
Study branch: Chemistry and Technology of Environmental Protection (2805T002)
Head of master's thesis: RNDr. Hana Mlejnková, Ph.D.
Consultants of the master's thesis:
Title of master's thesis:
The influence of used tested organism (fresh-water algae) on the acute
toxicity microassay
Master's thesis assignment:
Evaluation of the choice of test organism on the outcome of the determination of toxic effects. Comparing
the results of the determination of acute toxicity microassay by using 4 different species of freshwater algae
(TNV 75 7741), assessment of differences in the sensitivity of the species, methodology optimization.
Deadline for master's thesis delivery: 22.5.2009
Master's thesis is necessary to deliver to a secreatry of institute in three copies and in an electronic way to
a head of master's thesis. This assignment is enclosure of master's thesis.
- - - - - - - - - - - - - - - - - - - - - - - - - - - - - - - - - - - - - - - - - - - - - - - - - - - - - - - - - - - - - - - - - - - - -Bc. Kateřina Halatová RNDr. Hana Mlejnková, Ph.D. doc. Ing. Josef Čáslavský, CSc.
Student Head of thesis Head of institute
- - - - - - - - - - - - - - - - - - - - - - -In Brno, 1.10.2008 doc. Ing. Jaromír Havlica, DrSc.
Dean

3
ABSTRACT Evaluation of the choice of test organism on the outcome of the determination of toxic effects. Comparing the results of the determination of acute toxicity microassay by using 4 different species of freshwater algae (TNV 75 7741), assessment of differences in the sensitivity of the species, methodology optimization. KLÍČOVÁ SLOVA Ekotoxikologie, testy ekotoxicity, mikrotest, řasové testy toxicity KEY WORDS Ecotoxicology, tests of ecotoxicity, microtests, algal toxicity testing

4
HALATOVÁ, K. Vliv použitého testovacího organismu (sladkovodní řasy) na testování akutní toxicity mikrometodou. Brno: Vysoké učení technické v Brně, Fakulta chemická, 2009. 58 s. Vedoucí diplomové práce RNDr. Hana Mlejnková, Ph.D. DECLARATION I declare that the diploma thesis has been worked out by myself and that all the quotations from the used literary sources are accurate and complete. The content of the diploma thesis is the property of the Faculty of Chemistry of Brno University of Technology and all commercial uses are allowed only if approved by both the supervisor and the dean of the Faculty of Chemistry, BUT.
………………… student’s signature I would like to thank:
RNDr. Hana Mlejnková, PhD. for her flexibility and patient supervision, Ing. Katarina Slezáková to her practical advices. My thanks also belongs to my close friends and family for their support.

5
Content
1. Introduction ........................................................................................................................ 6
2. Ecotoxicology ..................................................................................................................... 7
2.1 Ecotoxicity ................................................................................................................... 8 2.1.1 Current European legislation ................................................................................ 8 2.1.2 Current legislation in Czech Republic ............................................................... 10
2.2 Toxicity testing methods (Bioassay, Biotest, Ecotoxicological bioassay) ............... 11
2.2.1 Testing procedure ............................................................................................... 12 2.2.2 Utilization of bioassays ...................................................................................... 15 2.2.3 Classification of bioassay according to the ecological level of test organisms . 15
2.2.4 Classification of bioassay according to the level of the development of the method ............................................................................................................................ 16
2.2.5 Classification of bioassay according to tested matrix and tested sample .......... 16
2.2.6 Classification of bioassays according to the spectrum of the tested organisms and the method of their evaluation ................................................................................... 17 2.2.7 Classification of bioassays according to the duration of exposition .................. 17
2.2.8 Classification of bioassays according to the exposure designes ........................ 18
2.3 Evaluation of the toxicity test results ........................................................................ 19 2.4 The Algal bioassays ................................................................................................... 21
2.4.1 Algae .................................................................................................................. 21 2.4.2 The Algae as test organism ................................................................................ 25
3. Experimental part ............................................................................................................. 29 3.1 Used protocol ............................................................................................................. 29
Principle of the used method ............................................................................................ 29 3.1.1 Material and equipment ...................................................................................... 29 3.1.2 Tested organism and solutions ........................................................................... 31
3.1.3 Preparation of toxicity standards ........................................................................ 32 3.1.4 Operation procedure ........................................................................................... 32
3.2 Conversion curves ..................................................................................................... 34 3.3 Algal microassay ....................................................................................................... 34 3.4 Growth characteristics ............................................................................................... 35 3.5 Assessment of EC50 .................................................................................................. 36 3.6 Comparsion of yield of method for two types of shaking ......................................... 37
4. Results .............................................................................................................................. 38
4.1 Conversion curves ..................................................................................................... 38 4.2 Growth curves............................................................................................................ 41 4.3 Evaluation of EC50 ................................................................................................... 46 4.4 Comparsion of yield of the method for two types of shaking ................................... 47
5. Conclucions and discussion ............................................................................................. 52 6. Refrences .......................................................................................................................... 54
7. List of abbrevations .......................................................................................................... 57 8. Enclosure list – list of related legal enactments ............................................................... 58

6
1. INTRODUCTION
Hand in hand with the increased worldwide industrialization came problems with toxic contaminat in our environment. After some cases people realized that they should pay more attention to their environment which led to „discovering“ new discipline and methods.
These disciplines should not lead only to evaluating the risks but also to preventing other problems.
The human activities cause a leakage of the contaminants which can persist and bioaccumulate in the environment.
Because of the degradation of the aquatic resources was necessary to establish quality crieteria to protect the aquatic environment in view of sustainable management.

7
2. ECOTOXICOLOGY
Ecotoxicology is a multidisciplinary science, which combines the knowledge of ecology and toxicology. It aims to quantify the effects of stressors upon natural populations, communities, or ecosystems. This branch is monitoring the effects of substances on the organisms and their ways in environment.
The ultimate goal of this approach is to be able to predict the effects of pollution so that the most efficient and effective action to prevent or remediate any harmful effect can be identified. The ecotoxicological studies can help in those ecosystems that are already impacted by pollution.1,2
The term ecotoxicology was created by René Truhaut in 1969 who defined it as "the branch of toxicology concerned with the study of toxic effects, caused by natural or synthetic pollutants, to the constituents of ecosystems, animal (including human), vegetable and microbial, in an integral context”.2
Ecotoxicology differs from environmental toxicology because it integrates the effects of stressors across all levels of biological organisation. It covers the molecules, the whole communities and ecosystems. Whereas environmental toxicology focuses on effects at the level of the individual and below.3
Ecotoxicology, unlike human toxicology, is more concerned with effects to population than individuals. Human toxicology is based on the extrapolation of data from many species to one species, man; wherease ecotoxicology uses the extrapolation from a few species to many.4
The two watershed events, that are well-known even in public and resulted in a paradigm shift (dilution paradigm to boomerang paradigm), were Minamata disease and DDT accumulation in raptors and fish-eating birds (fig.1). Together, they forced us to pay more attention to leaking of pollutants into ecological systems. They were among the first issues which gave impulsion to the sience of ecotoxicology.5
Everyone would like to believe that these problems reflects mistakes made earlier in the techno-industrial revolution that will not be repeated. This is unfotunately a different case. Environmental problems continue to occur despite of our new technologies and more knowledge. In reality, problems seem to extend more and more frequently to worldwide scale.5
About 50 years ago, the dilution example failed with clearly unacceptable consequences to human health and ecological systems. Expertise in ecotoxicology is now crucial to our well-being. Major environmental problems remain and new challenges arise daily which are as significant as the historical problems. Therefore, expertise in ecotoxicology is essential for determining the costs and benefits of the technological and industrial decisions affecting our lives.5
Ecotoxicology is very important and irreplaceable discipline for the assessment of the environment and the human influence on the environment.

8
Figure 1: DDT accumulation5
2.1 Ecotoxicity
Ecotoxicity is one of the main characteristics of the chemical compounds, agents and wastes. Legislation in Czech Republic and the European Union determines the statutory duty to assess the ecotoxicity.
2.1.1 Current European legislation
Since 1981, European chemical legislation requires submission of notification for new chemical substances manufactured or imported in the European Union. Test reports have to include physicochemical properties and toxicological and ecotoxicological data. With a 7th Amendment (Directive 92/32/EEC), besides acute toxicity test for fish and Daphnia, also the growth inhibition test on algae was required for base set notifications, i.e., chemicals produced at ≥1 t/year/producer. The European Chemicals Bureau is responsible for coordinating notification dossier reception and distribution to the national competent authorities of the EU member states. All dossier handling is managed through the New Chemicals Database. Currently, the database contains information on about 2,500 substances. The tests for a notification have to be carried out according to Annex V of the directive, i.e.:
• acute toxicity for fish (8 species from 8 genera are allowed; Oncorhynchus mykiss and
Brachydario rerio are preferred) • acute toxicity for Daphnia (Daphnia magna and Daphnia pulex) • algal grow inhibition test (Selenastrum capricornutum and Scenedesmus subspicatus
are preferred) 6
These are equivalent to the Organization for Economic Cooperation and Development guidlines (OECD). All tests have to be carried out with the agreement of the principles of good laboratory practice, and the national competent authorities check data quality. Test results are usually reported on measured concentrations unless there is clear evidence (e.g.,

9
from measured concentrations in range/finder tests) that a loss of test substance cannot be expected.6, 7 WHO recommended classification of pesticides by hazard
The judicious use of pesticides has become a very important issue. As was written above the first alarm problem which also lead to bigger awareness of pollution problems were problem with pesticide (DDT).
In December 2002 the United Nations Committee of Experts on the Transport of Dangerous Goods and on the Globally Harmonized System of Classification and Labelling of Chemicals (UNCETDG/GHS) approved a document called "The Globally Harmonized System of Classification and Labelling of Chemicals" to provide a globally-harmonized system to address classification of chemicals, labels, and safety data sheets.
Classification and labelling based on acute toxicity form a part of the GHS, and there are some differences between the GHS and the WHO traditional classification of pesticides by hazard. WHO is in the process of adapting the Pesticide Classification to conform to the GHS. This process should be finished in two years.8 Hazard
Hazard is the inherent property to cause a potential harmful effect. The hazard presented by any pesticide depends on the toxicity of the active ingredient, its concentration in a formulation, and the physical form of the formulation.9
Figure 2: WHO Hazard classes I. 9
The classification is based primarily on the acute oral and dermal toxicity to the rat since these determinations are standard procedures in toxicology. Evaluated parameters are LD50 values.8

10
Figure 2: WHO Hazard classes II. 8
2.1.2 Current legislation in Czech Republic
The toxicity assessment is in Czech Republic required for: waste, wastewater, new chemical compounds
• The act no. 157/1998 Collection of Laws about chemical compounds and chemical
agents as amended by The act no. 356/2003 Collection of Laws (requires the reults of ecotoxicological tests).
• The act no. 326/2004 Collection of Laws of the phytosanitary (for registration of new
chemical compounds used for plant protection is necessary to prove that they are not ecotoxic).
• The act about waste no. 185/2001 Collection of Laws as amended by The act
no. 314/2006 (determines hazardous properties of the waste; one of them is „ecotoxicity“).
• The act no. 376/2001 Collection of Laws about the conditions of storage of waste on
the tips and their using in the landscape (determines the criteria of the waste storaged on the surface of landscape; requires the results of ecotoxicological tests).
• Czech Standard ČSN EN 14735 (83 8004)/2007 Characterization of waste –
Preparation of waste samples for ecotoxicity tests; This standard is the Czech version of the European Standard EN 1435:2005 including its corrigendum EN 14735:2005/AC:2006-06. (contains all the steps required before testing and test records of standard tests).
• Czech Standard EN 8692 (75 7740)/2005 Water quality - Freshwater algal growth
inhibition test with unicelular green algae; This standard is the Czech version of the European Standard EN ISO 8692:2004. (describes method of determination of algal inhibition by chemical compounds contained in water or wastewater).

11
The act no. 376/2001 as amended by The act no. 502/2004 Legislation in the Czech Republic uses the term „ecotoxicity“ as one of the characteristics
for the evaluation of the waste. The hazardous property known as a code H14 – ecotoxicity has a waste which is or can be
an acute or chronic risk for one or more environment components. The hazardous waste is the waste whose aqueous extract provokes the response in the acute
toxicity testing at least for one of the testing organisms. The duration of the test is determined by the method and the values are: LC (EC, IC)50 <= 10 ml.l
-1
The test organisms are:
• Poecilia reticulata or Brachydanio rerio (exposure time 96 hours) • Daphnia magna (exposure time 48 hours) • Raphidocelis subcapitata (Selenastrum capricornutum) or Desmodesmus
subspicatus (exposure time 72 hours) • seeds of Sinapis alba (exposure time 72 hours)
If these four tests do not prove the toxic effects on the test organisms the tested substance is
evaluated as a negative in the property „ecotoxicity“. In the case when the tested sample responds to only one test organism we have to consider the chemical substances as a ecotoxic positive.10
These tests are described in Czech Standards which versions of the European Standards. Toxicity of substances for the environment can not be evaluated by simple quantifiable
value. So it is not possible to determine the „values“ of ecotoxicity for two substances and compare them.
Tested substances are negative or positive, on the basis of the performed tests, in the characteristic ecotoxicity. As it was already mentioned ecotoxicity is evaluated but not measured on the basis of the set of bioassays on the different trophic levels.10, 6
2.2 Toxicity testing methods (Bioassay, Biotest, Ecotoxicological bioassay)
Toxicity test are experimental methods by which we search for a response to exposure to toxic substances. Toxicity tests have been carried out for centuries and medical practise has been deeply interested in toxicity testing of medicines since the 17th century. The subject of toxicological tests has always been a man. Although toxicity tests were conducted on different organisms, all the information obtained was to apply the priority to humans.11, 12
Not until the 60s of the 20th century began to describe the toxic effects on the environment. Therefore, methods have been developed capable of describing the toxic effects of substances produced by man on the environment and living organisms there. In the 80 years, was published a large number of diverse methods of toxicity testing of substances on aquatic organisms in order to assess their effects on aquatic ecosystems. It was a specific single-toxicity tests.11, 12
The development of knowledge about the complexity of the possible effects of environmental pollutants leaded to developing methods for assessing the effects of controlled substances at the level of communities. Monitoring of the changes in the frequency of

12
individuals of each species revealed to be important for the evaluation of the real environmental risks. It is as a more sensitive parameter for assessing the potential adverse effects than mortality surveillance of individuals of one specie.11, 12
A basic tool of the ecotoxicological work is toxicity testing. They are used to identify or estimate the potential impact of toxic substances, tested or mixed samples on living organisms and the general level on the environment. Ecotoxicological tests (biotest, bioassays, tests of toxicity) are used for the evaluation of ecotoxicological properties of substances. These tests allow quick and adequate assessment of the properties of chemicals, chemical products or extracts from the waste, which may be use for the negative effect estimation. Tests also submitted information on the biological activity and the ability of toxic substances to transpierce biomembranes and are based on physiological ways, biochemical changes, on the process of photosynthesis and cell respiration. Bioassays, or tests on biological materials, have as a main objective determining the border concentrations of considered substances, in which the selected test organisms can live. The importance of these tests is to summary the effects of disability of all the components in the test solution to test the material, whether it's the body, culture, tissues or cells.11, 12
Bioassay - determination of the strength or biological activity of a substance, such as a drug
or hormone, by comparing its effects with those of a standard preparation on a culture of living cells or a test organism. It is a shortucut for commonly used term biological assay and the synonymum is biotest or Ecotoxicological bioassay.13, 14, 15
2.2.1 Testing procedure
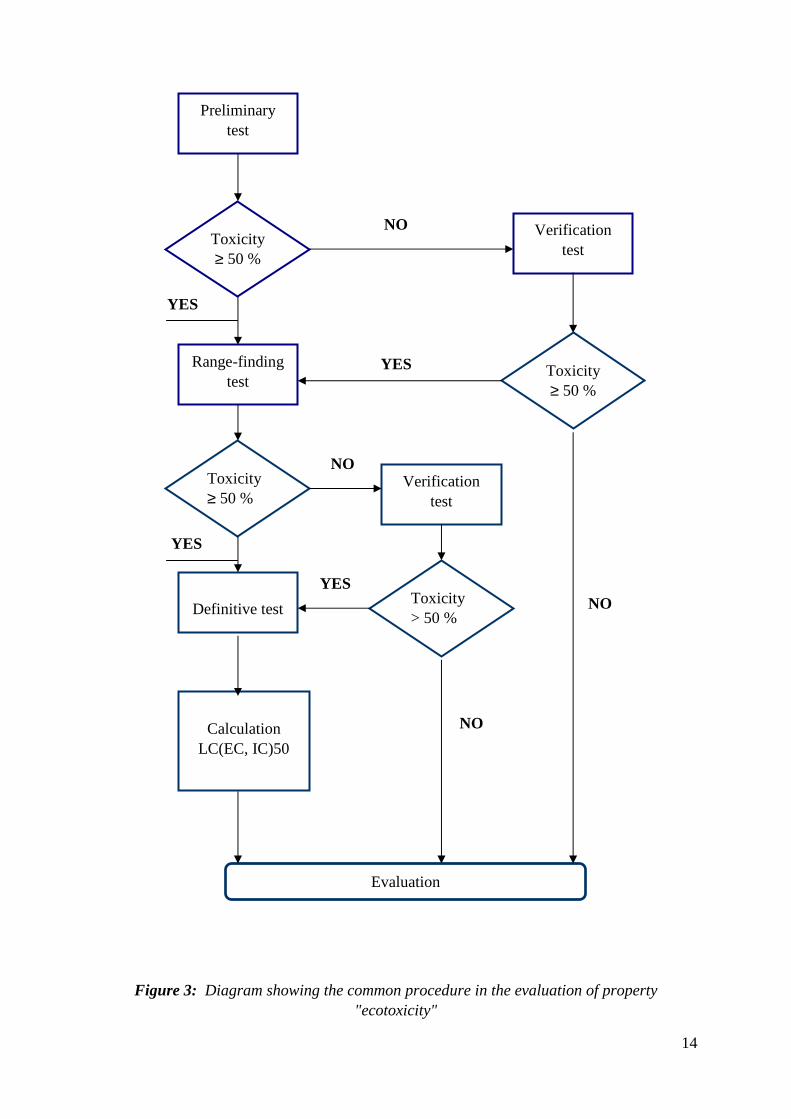
Testing procedure is usually based on following steps, but some method has different procedure scheme.
Preliminary test The sample of unknow toxicity is tested for the first time with tested organisms. The aim is
to find out if the chemical substance is toxic or not. Two paralel tests are made with two controls. If no organism dies the preliminary test is evaluated as a negative and the verification test is made.16
Verification test The negative result of the preliminary test is checked by the six paralel tests. If there is no
death in tested sample or is less than 10% according to the control test, the test is evaluated as a negative too. Other tests are not made. If the result is positive, the death in tested sample is higher than 10% according to the control test, another procedure depends on the degree of the imobilization or mortality. In the case, that the mortality is less than 50%, other test are not carried out and the results are written in the record. When the mortality is higher than 50% the rage-finding test is carried out.16
Range-finding test A range-finding test is usually conducted to establish the appropriate test solution
concentrations for the definitive test. In the range-finding test, the test organisms are exposed to a series of widely-spaced concentrations of the test material, e.g., 0.1, 1.0, 10, 100 mg/L,

13
etc. (Note that for effluents, range-finding tests may not be practical due to limitations on holding times of samples). In a range-finding test, no replicates are required and nominal concentrations of the test material are acceptable.17
Definitive test The goal of the definitive test is to determine concentration-response curves and IC50
(EC50, LC50) values (with 95 percent confidence intervals and standard error) for each species tested. In addition, the slopes of the concentration-response curves, the associated standard errors and the 95% confidence intervals of the slopes should be determined. For this determination, a minimum of five concentrations of the test material, plus appropriate controls, are required. The range of concentrations tested should reach the expected IC50 value. Analytical confirmation of test concentrations should be performed using an acceptable validated analytical method.17
Limit test In some situations, it is only necessary to find that the IC50 (EC50, LC50) is above a
certain limit. In a limit test, at least three replicate test vessels are exposed to a single “limit concentration,” with the same number of test vessels containing the appropriate control solution(s). If the IC50 (EC50, LC50) is greater than the limit concentration, multiple-concentration definitive testing may be forewent. Acceptable limit tests must meet all the requirements for acceptable multi-concentration definitive tests, with the exception of the number of test concentrations and endpoint determinations. Acceptable limit tests require analytical confirmation of the limit concentration.16, 17
14
NO YES YES
NO YES YES NO NO
Figure 3: Diagram showing the common procedure in the evaluation of property "ecotoxicity"
Toxicity ≥ 50 %
Verification test
Range-finding test
Toxicity ≥ 50 %
Toxicity ≥ 50 %
Toxicity > 50 %
Verification test
Definitive test
Calculation
LC(EC, IC)50
Evaluation
Preliminary test

15
2.2.2 Utilization of bioassays
Toxicity tests use organisms from different feeding levels and from different environment. This approach is good for assessment of new chemical substances. They are used usually for assessments of hazardous properties of wasted destined for landfills and the substances released into the environment as a result of accidents chemical production, the leakage of wastewater into surface or groundwater resources. Biotests are also used for evaluation of wastewater treatment effect and possible negative effect of water from waste pipes. These biotests are very important in monitoring of environment, and they are also used for predicting the risks associated with the occurrence of toxic substances in the environment.12, 18 Bioassays can be divided according to several criteria:
2.2.3 Classification of bioassay according to the ecological level of test organisms
• Tests on the cells and tissues – these tests are used to clarify the theoretical knowledge gained in experiments on organisms for the theoretical explanation of the toxic effects. The advantage is their good reproducibility, sensitivity and low financial and time demands. Conversely, a disadvantage is a significant difference between the results of „in-vitro“ and results obtained from „in-vivo“ testing, which is a consequence of the fact that these systems can not substitute enzyme-immune system of living organism.1, 2
• Tests on the organisms – These tests represent the majority of currently carried out toxicity tests. While there are some problems with their reproducibility and with a risk of interpreting the results and their extrapolation to natural conditions, these tests are a suitable compromise acceptable for both technical and economic therm. For the selection of the test organism is important to cover every trophic level in the environment. In practice we talk about the producers, consumers and decomposers, e.g. in the aquatic environment present these levels: bacteria, algae, plankton organisms and fish. The results of tests for individual organisms are not identical in the presence of toxic substance. It's influenced by the availability of toxicant, the way how is the toxicant accepts by organism, its bioaccumulation and also the ability of toxic substance degradation. In ecotoxicological monitoring should never draw conclusions from the testing of only one organism. It is important to perform testing on a larger number of organisms, thereby increasing the value of the procedure investigated for a tested sample.19
• Tests on communities, biocoenosis – advantage of the toxicity tests for biocoenosis is the possibility to monitor toxicant in nature or in the model. In determining the effect of toxic substances on the composition of biocoenosis, the changes can not be caused by toxic substance, but may be the result of disturbance of the food chain for example. Also, the reproducibility of these tests is limited because it is not possible to create exactly the same conditions that were in the previous test. These tests are used to monitor the impact of substances and products located in the aquatic environment; in practice we talked about pharmaceuticals, disinfectants and feed; in this case it is

16
observed the effect of these substances on the individual components in the aquatic environment.19, 20
2.2.4 Classification of bioassay according to the level of the development of the method
• Bioassays of the 1st generation – the first generation of the test is presented by classic, standard and conventional methodology, which is based on the acute toxicity testing for the laboratory cultivated organisms and cultures; examples are species of the fish Poecilia reticulata and Brachydanio rerio, crustaceans Daphnia magna, chlororcoccus algae species Scenedesmus quadricauda and Scenedesmus subspicatus, seeds of sprouted cultural plant Sinapis alba and Lactuca sativa. These tests are accepted by international legislation, but their implementation is not economic because the laboratory cultivation of the organisms is really expensive.5, 19, 21
• Bioassays of the 2nd generation – the second generation of the test is nowadays very popular and used. It is presented by the alternative bioassays, which are known as a microbioassays. Tested organisms are bacteria, protozoa, algae, invertebrates, fish tissue cultures, etc. These tests use puiescences of these organisms. The tests on invertebrates use cyst (rotifer) a ephippia (daphnia). The tests on fish are applied on tissue cultures and fish eggs, for the tests on bacteria are used their lyophilized cultures and for the tests on algae are used immobilized forms and deep-frozen algal cultures13. More recently, the original test on sprouted plants replaced by the test on callus which is a tissue culture of non-differentiated cells.5, 19
• Bioassays of the 3rd generation – entirely on the initial level, is the development and use of third-generation toxicity tests that use biosensors, biomarkers and biosonds. These tests are based on fluorescent marking of toxic substance. Their application is expected particulary in the on-line monitoring systems and screening toxicity tests.1, 2, 5, 19
2.2.5 Classification of bioassay according to tested matrix and tested sample
There are lot of different kinds of matrix, which can be ecotoxicologically evaluated. Tested matrix can be any environmental component; it can be water, soil, air, sediment and also the waste or chemical substances and their compounds.
The various types of tested samples are not entirely identical. It is possible to make a
ecotoxicological testing on: • pure chemical substances, which can be hydrophilic, hydrophobic or volatile • mixture of substances (known as well as unknown) • natural samples (mostly unknown, mixed, with unknown interaction)1, 2
The natural samples with unknown interactions are characterized by the most complicated interpretations.

17
2.2.6 Classification of bioassays according to the spectrum of the tested organisms and the method of their evaluation
According to the spectrum of the tested organisms, which are involved into the test, we can divide tests:
• Single Species • Multi Species
The results of bioassays may be the following effects, which then leads to the final
evaluation of tests: • lethal effects (mortality, immobilization) • sublethal effects (changes in the behavior of organisms, changes in speed or direction
of movement) • assessment of physiological activity, photosynthetic assimilation, enzymatic activity,
effects on membranes, inhibition of root growth of higher plants such as Sinapis alba, changes in health status and number of leaves of tested plants, e.g. Lemna minor, a higher susceptibility to attack of diseases, changes in increasing of the population or biomass, changes in reproductive activity, the genesis of malformations or teratogenicity.1, 2, 5, 19
2.2.7 Classification of bioassays according to the duration of exposition
According to the duration of the exposition we can divide the tests: Short, intermediate (subacute toxicity testing) and long-term toxicity tests (chronic toxicity testing).
Short-term toxicity tests - are used for routine monitoring suitable for effluent discharge permit requirements and for exploratory tests. These acute definitive tests typically used mortality as an end point or other discrete observations to determine effects due to the toxicant (LC50, EC50 or IC50 values). The duration of these tests is usually between 24 and 72 ± 2 hours. These tests may be also used to indicate a suitable range of toxicant concentrations for intermediate and long-term tests. Short-term test, rather than long-duration tests, are used to obtain toxicity data as rapidly inexpensively as possible. They are valuable for estimation of overall toxicity, for screening test solutions or materials for which toxicity data do not exist, for assessing relative toxicity of different toxicants or wastes to selected test organisms, or for relative sensitivity of different organisms to different conditions of such variables as temperature or pH. The results of these tests can be used to calculate acceptable concentrations for very short exposures, such as those that might occur as organisms pass through an effluent zone of initial dilution or a mixing zone.5, 21, 22, 23, 24
Intermediate tests – are toxicity tests, of intermediate duration, which are typically used
when longer exposure durations are necessary to determine the effect of the toxicant on various life stages of long-life-cycle organisms, and to indicate toxicant concentrations for life-cycle tests.24
These tests are used to determine the subacute effect of the chemical substance. The subacute effect is envoked by the much less amount of the harmful substance than in acute

18
toxicity tests, but the duration of the test is much longer. The tested substance is given to the test organisms repeatedly, usually once a day. The duration of these tests is variable between 28 and 90 days. The aim of the subacute tests is to determine the cumulative effect of the tested substance.5, 21, 22, 23, 24
Long-term toxicity tests - are generally used for estimating chronic toxicity. Long-term
toxicity testing may include early-life stage, partial-life-cycle, or full-life-cycle testing. Exposures may be as short as 7 days to expose the specific portions of an organism’s life cycle, 21 to 28 days to several months or longer for traditional partial-life-cycle and full-life-cycle tests with fish.24
These tests detect the accumulation, mutagenic, carcinogenic and teratogenic properties of substances. These tests are experimentally very demanding. The negative impact of toxic substances is evident to the other developmental stages, and generations of descendants.5, 21, 22, 23, 24
2.2.8 Classification of bioassays according to the exposure designes
Static toxicity tests - in these tests individuals are placed into one of a serie of exposure concentrations. The exposure water is not changed during the test. The advantage of this design is that is easy to perform and inexpensive. Also, minimal volumes of toxic solutions are produced. But toxicant concentrations can change during exposures due to sorption to the container walls and other solid phases, volatilization, bacterial transformation, photolysis, and many other actions. Waste products of the test organisms may created during the test and oxygen concentrations may drop to undesirable levels. For these reasons, most static tests are used to measure acute lethality, not the chronic lethality.5, 24
Static-renewal test – in these tests can minimize some of the problems from the static
toxicity testing. Test solutions are completly or partially replaced with new solutions periodically during the exposures, or organisms are periodically transferred to new solutions.5, 24
Flow-through test – in the flow-through tests use continuous flow or intermitten flow of
the toxicant solutions through the exposures tanks. The flow-through design eliminates or greatly minimizes the problems just discussed for static tests. However, flow-through tests produce large volumes of toxicant solutions that must be treated. They also require more time, space, and expense. Although individual containers of various toxicant concentrations can be used as sources of test waters, often a special apparatus called a proportional diluter mixes and delivers a series of dilutions of the contaminant solution or an effluent suspected of having an adverse effect on aquotic biota. With effluent testing, lethal effects are expressed as percentages of the total exposure water volume made up of the effluent resulting in the toxic response.5, 24
Sediments tests - the science of sediment-toxicity testing has rapidly expanded during the
past decade. Sediments in natural systems and in test systems often act as a sink for environmental pollutants, frequently reducing their bioavailability. There are several approach to solid phase testing. Organisms may be placed into spiked or contaminated soils. This type of test has been used with important soil invertebrates such as nematodes and earthworms.5, 24

19
Spiked bioassay – is a sediment toxicity tests with spiked sediment are one of the approaches used for assessing sediment quality and managing sediments. The spiked tests are usually carried on amphipods but also on some other organisms.spiked Concentration may be based on total concentration in some notionally bioavailable fraction of the sediments. The test is evalauted by the concentration-response curves.5, 24
Elutriate test - in this test, a nonbenthic specie such as Daphnia magna is exposed to an eluriate produced by mixing the test sediment with water and then centrifuging the mixture to remove solids from the elutriate. Exposure to varoius dilutions of the elutriate allows an amount-response analysis.5, 24
2.3 Evaluation of the toxicity test results
Data generated in acute toxicity test are quantal, that is, responses are measured with yes/no-type observations (e.g., did exposure cause immobilization, death, or not?). Continuous measurements that are measured in quantitative or graded tests, such as lenght, weight, or number of offspring, usually are not utilized as end points in an acute toxicity test. Acute toxicity results generally are characterized by the median lethal concentration (LC50) when mortality is the test end point, or median effective concentration (EC50) when sublethal effect (e.g., imobilization, fatigue in swimming, avoidance) is the endpoint.
It is important to recognize that the LC50 is the median response of a given test population and is an estimate of the „true“ median lethal concentration of that test material for the entire species.24
The easiest way how to express the toxicity tests results is to determine % inhibiton of living – exposures of test organisms. Generally we can characterize the test results this way:
The result of the bioassay is negative, when is not violated a 10% imobilization or mortality, according to the control test, in the verification test. If there is mortality of the tested organisms less than 50% (but more than 10%) in the verification test, the EC50 is not possible to determine and this fact is written in the report.25, 16
The result of the bioassay is positive, if the tested substance causes the death or
imobilization of more than 50% organisms, the result of the test is EC50 (additionaly EC10, EC90, EC50/NOEC). 25, 26
According to the different sensitivity of the test organisms is the evaluating of toxicity by
% of inhibited organisms also different. Lethal concentration (LC)
toxicant concentartion estimated to produce death in a specified proportion of test organisms. Usually defined as median (50%) lethal concentration, LC50, i.e., concentration killing 50% of exposed organisms at a specific time of observation, for example, 96-h LC50. 24

20
Effective concentration (EC) toxicant concentration estimated to cause a specified effect in a designated proportion of test organisms. The effect is usually sublethal, such as a change in respiration rate or loss of equilibrium, but is defined in quantal terms, i.e., a particular individual either shows the effect or not. The exposure time is also specified; for example, the 96 h EC50 for loss of equilibrium is the effective concentration for 50% of the test organisms in 96 h, for this kind of effect.24, 26
Figure 4: EC50
Inhibition concentration (IC)
toxicant concentration estimated to cause a specified percentage inhibition or impairment in a qualitative biological function. For example, an IC25 could be the concentration estimated to cause a 25% reduction in growth of larval fish, relative to the control. This term should be used with any toxicological test that measures a change in rate, such as respiration, number of offspring, increase in number of algal cells, etc. (the term EC50 is not appropriate for such changes because it is limited to quantal measurements). 24, 27
Toxicity unit TU
This non-dimensional unit is described as a quotient of number 100 and value EC(IC, LC)50 expressed as ml.l-1.28
( )50,
100
ICECLCTU =
No Effect Level Concentrations (NOEC)
is a risk assessment parameter that represents the greatest concentration of a pollutant that will not invoke any response29
No Observed Effect Level (NOEL)
the greatest concentration or amount of a substance that causes no alterations of morphology, functional capacity, growth, development, or life span of target

21
organisms distinguishable from those observed in normal (control) organisms of the same species and strain under the same defined conditions of exposure24
No Observed Edverse Effect Level (NOAEL)
the greatest concentration or amount of a substance, which causes no detectable adverse alteration of morphology, functional capacity, growth, development, or life span of the target organism under defined conditions of exposure24
Lowest Observed Effect Concentration (LOEC) the lowest concentration of a substance which causes detectable effect5
Lowest Observed Effect Level (LOEL) Lowest concentration or amount of a substance that causes any alteration in morphology, functional capacity, growth, development, or life span of target organisms distinguishable from normal (control) organisms of the same species and strain under the same defined conditions of exposure19
Lowest observed adverse effect level (LOAEL)
the lowest concentration or amount of a substance, found by experiment or observation, which causes an adverse alteration of morphology, functional capacity, growth, development, or life span of a target organism distinguishable from normal (control) organisms of the same species and strain under defined conditions of exposure19
2.4 The Algal bioassays
2.4.1 Algae
The term algae has no formal taxonomic standing. It is routinely used to indicate a polyphyletic (i.e., including organisms that do not share a common origin, but follow multiple and independent evolutionary lines), noncohesive, and artificial assemblage of O2-evolving, photosynthetic organisms (with several exceptions of colorless members undoubtedly related to pigmented forms). According to this definition, plants could be considered an algal division. Algae and plants produce the same storage compounds, use similar defense strategies against predators and parasites, and a strong morphological similarity exists between some algae and plants. Then how to differentiate algae from plants? The answer is quite easy because the similarities between algae and plants are much fewer than their differences. Plants show a very high degree of differentiation, with roots, leaves, stems, and xylem/phloem vascular network. Their reproductive organs are surounded by a jacket from sterile cells. They have a multicellular diploid embryo stage that remains developmentally and nutrionally dependent on the parental gamethophyte for a significant period (therefore the name embryophytes is given to plants) and tissue-generating parenchymatous meristems at the shoot and root apexes, producing tissues that defferentiate in a wide variety of shapes. Moreover, all plants have a digenetic life cycle with an alternation between a haploid gametophyte and diploid sporophyte.17

22
Algae are a large and diverse group of simple, typically autotrophic organisms, ranging from unicellular to multicellular forms. The largest and most complex marine forms are called seaweeds. They are photosynthetic, like plants, and "simple" because they lack the many distinct organs found in land plants. For that reason they are currently excluded from being considered plants.17
Though the prokaryotic Cyanobacteria (commonly referred to as Blue-green Algae) were traditionally included as "Algae" in older textbooks, many modern sources regard this as outdated and restrict the term Algae to eukaryotic organisms. All true algae therefore have a nucleus enclosed within a membrane and chloroplasts bound in one or more membranes. Algae constitute a paraphyletic and polyphyletic group, as they do not include all the offspring of the ancestor nor do they all descend from a common algal ancestor, although their chloroplasts seem to have a single origin.11, 12, 17
Algae lack the various structures that characterize land plants, such as phyllids and rhizoids in nonvascular plants, or leaves, roots, and other organs that are found in tracheophytes. Many are photoautotrophic, although some groups contain members that are mixotrophic, deriving energy both from photosynthesis and uptake of organic carbon either by osmotrophy, myzotrophy, or phagotrophy. Some unicellular species rely entirely on external energy sources and have limited or no photosynthetic apparatus.11, 12, 17
All algae have photosynthetic machinery ultimately derived from the Cyanobacteria, and so produce oxygen as a by-product of photosynthesis, unlike other photosynthetic bacteria such as purple and green sulfur bacteria.11, 12, 17
• Classification of algae according to the taxonomy
No easily definable classification system acceptable to all exists for algae because taxonomy is under constant and rapid revision at all levels following every day new genetic and ultrastructual evidence. Keeping in mind that the polyphyletic nature of the algal group is somewhat incompability with traditional taxonomic groupings, though they are still useful to define the general character and level organization, and the fact that taxonomic opinion may change as information accumulates, a provisional scheme of classification is adopted mainly based on the work of Van Den Hoek et al. (1995) and compared with the classifications of Bold and Wynne (1978), Margulis et al. (1990), Graham and Wilcox (2000), and South and Whittick (1987). Prokaryotic members of this assmblage are grouped into two division: Cyanophyta and Prochlorophyta, whereas eukaryotic members are grouped into nine divisions: Glaucophyta, Rhodophyta, Heterokontophyta, Haptophyta, Cryptophyta, Dinophyta, Euglenophyta, Chlorarachniophyta, and Chlorophyta.17

23
Figure 5: Classification scheme of different algae groups17
• Comparsion of used algal species
The tested species are often not a representative of the field communities of concern. Since response to toxicants can differ among algal species by 2-3 orders of magnitude, toxicity levels cannot simply be extrapolated from one species to others or to natural assemblages. Single-species laboratory studies may be inadequate for predicting the effects of chemicals on ecological communities.30
There are two approaches to overcoming this problem: development of test systems with two or more interacting species and development of population dynamic simulations incorporating selected species of an ecosystem and the impact of varying abiotic factors. Simple multispecies laboratory studies not only could be beneficial in the risk assessment process, but are most appropriate when a substance impacts a known key species within a food chain.30
Comparede species were Chlorella kessleri, Desmodesmus quadricauda, Desmodesmus subspicatus and Raphidocelis subcapitata. All the compared algal species belongs to the kingdom of Eukaryota, divison Chlorophyta and class Chlorophyceae.

24
Chlorella kessleri Chlorella is a kind of microscopic unicellular
green algae living in the freshwater. For its unique content of bioactive substances (vitamins, minerals, nucleic acid, amino acids, chlorophyll, fiber and many others) is a Chlorella an ideal "food of 3rd Millennium". Chlorella is also unique in its speed of growth and division. A spherical cell Chlorella favorable conditions for the divided every 3 hours to 4-8 daughter cells. Increase the weight of algal biomass is under these conditions, in comparison with higher plants, truly enormous.31
Figure 6: Chlorella kessleri (zoom 40 x 0,75)
.
Desmodesmus quadricauda and Desmodesmus subspicatus
Figure 7: Desmodesmus quadriacauda Figure 8: Desmodesmus subspicatus32
(zoom 40 x 0,75)
They are a small, nonmotile colonial green algae consisting of cells aligned in a flat plate.
The colonies most often have two or four cells, but may have 8, 16, or rarely 32 and are occasionally unicellular. The cells are usually cylindrical but may be more lunate, ovoid, or fusiform. Typically the end cells each have two long spines up to 200 µm in length protruding from their outer corners, and other cells may have additional spines or chitonous bristles. Each cell contains a single parietal, plate-like chloroplast with a single pyrenoid. The cell walls may be covered in bumps or reticulations that are best viewed with scanning electron microscopy. 33

25
Raphidocelis subcapitata
It is the autosporic chlorophycean alga species. This green, freshwater algae is often used as Daphnid food.34
Figure 9: Raphidocelis subcapitata (zoom 40 x 0,75)
2.4.2 The Algae as test organism
As important oxygen producers and as a vital food source to some other trophic levels, algae are an essential component of aquatic ecosystems. The concern over multiple stresses imposed upon phototrophic systems is sparking renewed research tendency with micro-algae, now recognized as useful indicators of environmental quality. Under a worst case scenario situation xenobiotic-mediated phytotoxicity could theoretically alter algal species composition and lead to changes in secondary producers. Such an event could have disruptive effects on food chain energy flow and ultimately cause ecosystem functional/structual modifications. Clearly, such as potentially devastating consequences would be unacceptable and environmental management should have available early warning systems that can enable to make decision to be ideally proactive instead of reactive to pollutional activities. Simple algal bioassays conducted in the laboratory can contribute valuable information in this consideration.4, 11, 35
Micro-algae posses attractive features favouring their use for water quality assessment. As ubiquitous inhabitors of water bodies, their representativity as indicators of the phytoplanktonic network is undeniable. In general, they are easily grown under laboratory conditions and display sensitivity to a wide array of both inorganic and organic chemicals. In addition, planktonic algae are sensitive indicators for testing different effects of pollutants discharged into the water. Several authors showed greater sensitivity of algae than invertebrates and fish to several compounds and municipal and industrial effluents. Different environmental samples like sewage samples, leachates, surface waters, and soil elutriates as well as chemicals and mixtures are ecotoxicologically characterized using algal growth-inhibition assays, 4, 11, 12, 35, 36
Micro-algae – are unicellular aquatic plants (phytoplankton), the starting point of the
aquatic food chain.13
Undertaking tests with algae are uncomplicated and simply requires a basic set of
experimental conditions. Obviously, an inoculum is necessary and it will vary according to the intended assay exposure period.4
26
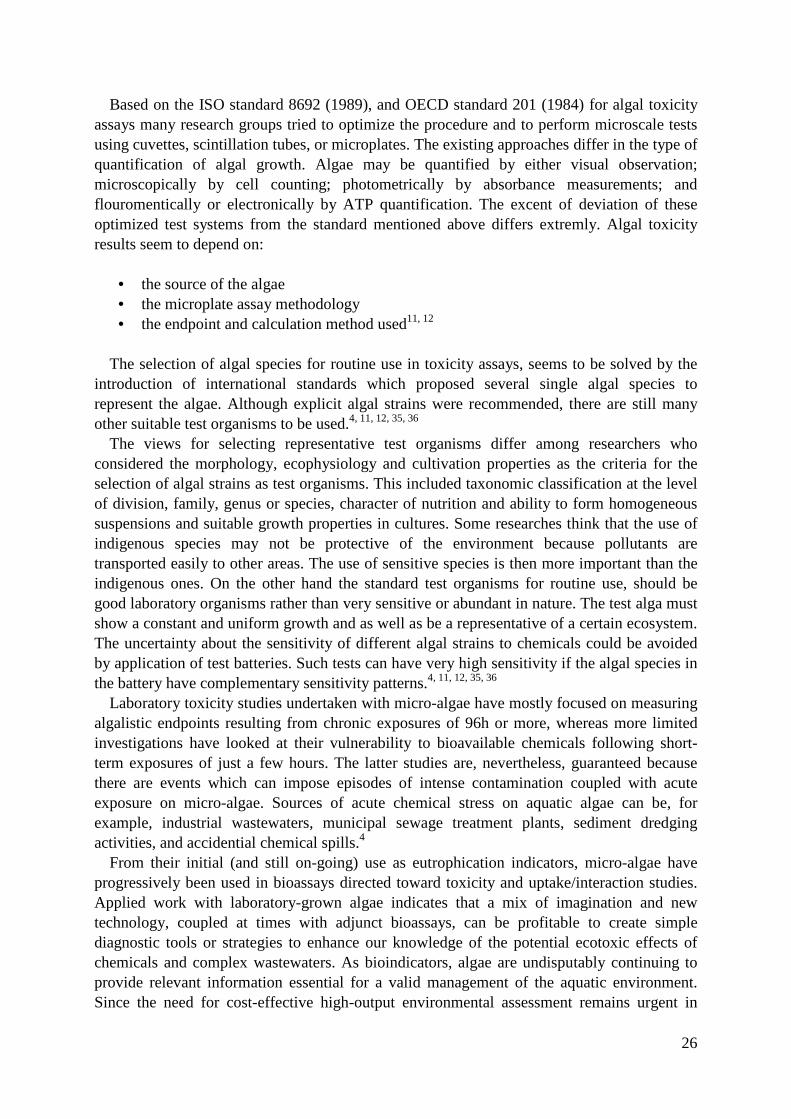
Based on the ISO standard 8692 (1989), and OECD standard 201 (1984) for algal toxicity assays many research groups tried to optimize the procedure and to perform microscale tests using cuvettes, scintillation tubes, or microplates. The existing approaches differ in the type of quantification of algal growth. Algae may be quantified by either visual observation; microscopically by cell counting; photometrically by absorbance measurements; and flouromentically or electronically by ATP quantification. The excent of deviation of these optimized test systems from the standard mentioned above differs extremly. Algal toxicity results seem to depend on:
• the source of the algae • the microplate assay methodology • the endpoint and calculation method used11, 12
The selection of algal species for routine use in toxicity assays, seems to be solved by the
introduction of international standards which proposed several single algal species to represent the algae. Although explicit algal strains were recommended, there are still many other suitable test organisms to be used.4, 11, 12, 35, 36
The views for selecting representative test organisms differ among researchers who considered the morphology, ecophysiology and cultivation properties as the criteria for the selection of algal strains as test organisms. This included taxonomic classification at the level of division, family, genus or species, character of nutrition and ability to form homogeneous suspensions and suitable growth properties in cultures. Some researches think that the use of indigenous species may not be protective of the environment because pollutants are transported easily to other areas. The use of sensitive species is then more important than the indigenous ones. On the other hand the standard test organisms for routine use, should be good laboratory organisms rather than very sensitive or abundant in nature. The test alga must show a constant and uniform growth and as well as be a representative of a certain ecosystem. The uncertainty about the sensitivity of different algal strains to chemicals could be avoided by application of test batteries. Such tests can have very high sensitivity if the algal species in the battery have complementary sensitivity patterns.4, 11, 12, 35, 36
Laboratory toxicity studies undertaken with micro-algae have mostly focused on measuring algalistic endpoints resulting from chronic exposures of 96h or more, whereas more limited investigations have looked at their vulnerability to bioavailable chemicals following short-term exposures of just a few hours. The latter studies are, nevertheless, guaranteed because there are events which can impose episodes of intense contamination coupled with acute exposure on micro-algae. Sources of acute chemical stress on aquatic algae can be, for example, industrial wastewaters, municipal sewage treatment plants, sediment dredging activities, and accidential chemical spills.4
From their initial (and still on-going) use as eutrophication indicators, micro-algae have progressively been used in bioassays directed toward toxicity and uptake/interaction studies. Applied work with laboratory-grown algae indicates that a mix of imagination and new technology, coupled at times with adjunct bioassays, can be profitable to create simple diagnostic tools or strategies to enhance our knowledge of the potential ecotoxic effects of chemicals and complex wastewaters. As bioindicators, algae are undisputably continuing to provide relevant information essential for a valid management of the aquatic environment. Since the need for cost-effective high-output environmental assessment remains urgent in

27
today’s world, simple and practical phytotoxicological tests will continue to be developed in many laboratories in next years.4
Therefore, this optimised algal microbioassay using a sensitive test organism and a test system with low deviation from the standard ISO 8692, seems a useful and valid tool for phytotoxicity screening of chemicals and environmental samples.36
• The Algal Microplate Assay
Concisely, algal flask toxicity assays developed essentialy from earlier eutrophication studies flask tests. While algal toxicity tests performed with glassware flasks cannot be criticised scientifically, they are nevertheless laborious and lack cost-effectiveness. In early 1982 Dr. Daniel Drive suggested that attempts should be made to miniaturize the flask toxicity assay on 96-well microtiter plates. An initial modest publication indicated the feasibility of this venture. Because of the evident advantages of using microplates to conduct algal bioassays, further experimentation strove to validate this new microtest with the reference flask assay.4, 36, 37
The first Czech inovator in this area was RNDr. Jaromír Lukavský, CSc. who first tried the tests on the microplates in 1984. He is also the author if the Czech Standard TNV 75 7741/1997(article microtest).
Advantages of using microplates of bioassays:
• small sample volume requirement • increased yield in processing samples • incubation space economy • automation potential • elimination of post-experimental washing of glassware (microplates are
disposable) • elimination of potential contamination and/or toxicity problems resulting from re-
use of glassware • increased number of replicates per test concentration4
The advantage of reducing the test solution volumes is obvious when large number of
samples or chemicals need to be tested. Smaller test volume allows more flexibility in experimental design and more samples and/or more sample concentrations and replicates can be tested at the same time, with time and space saving. In addition, low sample volumes will also minimizes problems with low generation of waste, and the use of disposable microplates will eliminate the risk of contamination from reused test vessels.35, 38
Although the results from some works were comparable with the standard flask assay,
criticisms on algal microplate assay arise from several factors:
• the toxicity associated to polystyrene microplates • inefficient shaking • evaporation problems

28
These problems can be solved by using the microplates sterilised by UV radiation, which are reffered as less toxic algae, sealing the microplate with their covers with condensation rings to prevent evaporation and consequently the cells concentration in microplates wells, and using a special microplate shaker.35, 39
29
3. EXPERIMENTAL PART
The own experimental part included:
• Protocol of the used method • Construction of conversion curves • Evaluating of specific growth rate • Evaluating of EC50 of potassium dichromate for tested algae • Comprasion of yield of the method for two types of shaking
The practical work was focused on a comparsion of 4 algal species by using microplate
toxicity testing. Besides that different types of shaking the plates were verified. The experimental work was carried out in laboratory of T.G. Masaryk Water Research
Institute (Výzkumný ústav vodohospodářský T.G.M. v.v.i.) in Brno. The Standard Operation Procedure of the acute toxicity microassay used in the laboratory is
based on the Czech Standard TNV 75 7741/1997. This method is possible to used for evaluation of the toxicity of the chemical compounds
which are soluable in the water under the conditions of the test method, or they can be conserve like a stable suspensions or dispersions under the conditions of the test method and they do not decomposed; then also for all kinds of water especially for the waste water (cleaned or not cleaned), surface water and underground water.
3.1 Used protocol
Principle of the used method
The tested solution is, after sterilization and inoculation by the tested organism, cultivated for the required time. The growth of the biomass is evaluated in the stationary phase. The amount of the biomass (comparsion with control) inversely proportional to toxicity effect of the evaluated solution. The EC50 is evaluated for the tested compound or tested water sample.
The method is used standardly for evaluation of toxicity of water or water-leaches. The
results are determined as a % inhibition or EC50. The differences in yields by using different species of algae, as a test organisms, and different type of shaking were compared in this work.
3.1.1 Material and equipment
• cultivation equipment by TNV 75 7741 (fig. 13) • UV emitor for sterilization of microplates • spectrofotometer Multiscan Bichromatic (fig. 10) • Laboratory Vortex Mixer (fig. 11) • vaccination box with a laminar flow • analytical balance • refrigerator • microscope Olympus BX51 • steam sterilizer STERILAB

30
• aquarium air pump • plastic microplates with flat bottom (12 x 8 wells) + cover • automatic micropipettes + tips • laboratory glassware • luxmeter • counting chamber CYRUS I • Millipore Q (producer of deionizated water)
Figure 10: Spectrometer Multiscan Bichromatic

31
Figure 11: Vortex mixer
3.1.2 Tested organism and solutions
Tested organisms: • Chlorella kessleri FOTT et NOVAK, strain LARG/1 • Desmodesmus quadricauda (TURP.)BREB., strain GREIFSWALD/15 • Desmodesmus subspicatus (CHOD.)HEGEW et SCHMIDT, strain
LEPAILLEUR/CCAP 276-20 • Raphidocelis subcapitata (KORS)NYG. et al., strain SKULBERG
1959/1
All organisms were obtained from the Culture Collection of Autotrophic Organisms of Institute of Botany, Academy of Sciences of the Czech Republic Centre of Phycology, Dukelská 135, TŘEBOŇ CZ-379 82.
• agar medium for cultivation of algal culture
Procedure of preparation: 10g of agar (polysaccharide agar-agar) is swelled in distillation water to the second day (min. 2 hours), it is filled to the 500 ml by distillation water, it is boiled and sterilizated in 20 minutes in autoclave (121 °C). Agar is after cooling (55 °C) filled into Erlenmayer flasks (100 ml), which are closed by tinfoil and the agar is let to stiffen in a sloping position.
• distillation water (deionization water, sterilized by UV) • potassium dichromate (K2Cr2O7) – salt with guaranteed analytical quality, qualify as a
„TOXICITY STANDARD“, stored in a store of chemicals

32
Nutrient solution (TNV 75 7741) The solutions are stored in a dark (4°C), and has to be renewed after creation of turbidity and sediment.
Stock solution A • 20 220 mg KNO3 (for 1 l)
filled by H2O to 1 l Stock solution B
• 2 090 mg K2HPO4 (for 1 l) filled by H2O to 1 l
Stock solution C • 2 465 mg MgSO4.7H2O2 (for 1 l) • 108 mg FeCl3. 6H2O (for 1 l) • 150 mg Chelaton III (for 1 l)
filled by H2O to 1 l Stock solution D
• 2 470 mg H3BO3 (for 1 l) • 1 508 mg MnCl2.4H2O (for 1 l) • 24 mg Na2MoO4.2H2O (for 1 l) • 230 mg ZnSO4.7H2O (for 1 l) • 38 mg CoCl2.6H2O (for 1 l) • 100 mg CuSO4.5H2O (for 1 l)
filled by H2O to 1 l Stock solution E
• 1 ml of stock solution D filled by H2O to 1 l Used solution – 20 ml of solutions A, B, C, E is filled by H2O to 1 l.
3.1.3 Preparation of toxicity standards
1. Potassium dichromate – Stock solution (contains 100 mg Cr/1 litre) The 566 mg K2Cr2O7 is dissolved in nutrient solution in graduated flask (1000 ml), filled to punch mark and mixed. It is stored in dark (4°C)
2. Potassium dichromate – Working solution (contains 30 mg Cr/1 litre) The 30 ml of Stock solution is put (by pipette) into graduated flask (100 ml) and filled by Nutrient solution to the punch mark and mixed. It is always prepared fresh.
3.1.4 Operation procedure
• Preparation of inoculum: Algal inoculum is taken from exponentially growing algal culture. Inoculation culture is put into pre-cultivation 2 days before beginning of the test: The inoculum is added into the Erlenmayer flask (150 ml) with nutrient solution. The cell density should be about 10 000/1 ml. The inoculated culture is aerated 2 days in the cultivation equipment with light intensity 30 W/m2 (6 000 lx) and temperature 30±2 °C. (fig. 12)

33
Figure 12: Aeration of inoculum
Figure 13: Cultivation equipment

34
3.2 Conversion curves
Preparing of gradient of cell density: cells are counted in counting chamber, the row is prepared from 3 values of cell density for each algae
Inoculation and filling of the microplates: The microplate is filled by the micropippet with amount 2 ml. The coulumns are filled with the gradient of the cells. The first microplate is filled: 1-5 well by the algae Raphidocelis subcapitata (the gradient from the lowest amount till the highest) an 7-11 by the algae Chlorella kessleri. The second microplate is filled: 1-5 well by the algae Desmodesmus quadricauda and 7-11 well by the algae Desmodesmus subspicatus.
The measuring: The absorbance (750 nm) in the wells is measured imediately after the filling the microplates.
The construction of conversion curve: the conversion curve is made from the results for each algal specie.
3.3 Algal microassay
• Sterilization of the microplates: Empty microplates are sterilized at least 2 hours under the UV lamp.
• Calculation of amount of the algal inoculum for the toxicity test: The cells have to
be counted after the pre-cultivation and it has to be modified to required value (400 000 cells/1 ml). The counting chamber (CYRUS I) is used for the counting. The microscope (zoom 12,5 x 16) is used for the counting only living and healthy cells. Then the number of the cells is counted by the equation:
amount of the cells in 1 ml of inoculum = arithmetic average * 4000
From the regression equation was counted the amount of the inoculum which is used for the test so that the amount of the cells in 1 ml is 400 000/ml.
• Inoculation and filling of the microplates: The inoculum is put into the test tubes with the tested solution (K2Cr2O7) and mixed. The microplate is filled by the micropippet with amount 2 ml for each well. The microplates were inoculated according to the following scheme (fig. 14) and incubated in cultivation equipment (30 ± 2°C); light intensity 30 W/m2. The surround wells are filled with distiled water. The second column is filled with distiled water and inoculum (control). The columns 3-6 are filled with the concentration row of K2Cr2O7 and inoculum. The seventh column is filled with nutrient soulution and inoculum. The columns 8-11 are again filled with the concentration row of K2Cr2O7 and inoculum. For each algae are prepared 2 same microplates, each for different shaking.
• Measuring: The absorbance (750 nm) in the wells is measured the first day after the
inoculation and then every second day (48 hours) till the stationary phase, usually about 14 days.

35
Figure 14: Filling the microplates
The measured results were saved into the PC and used for another evaluation. The evaluation of the results were made by using Excel, where were imported primary data
from the spectrometer. Data were corrected for the absorbance of distiled water which was inoculated in the circuit wells on the microplate. The column no. 2, which was disitiled water with inoculum, was used as a inner control of growth of tested algae.
For the construction of growth curves were used values of absorbance of growth in the nutrient solution with the inoculum.
For evaluation of EC50 were used values of absorbance of algae inhibited by adding of different concentration of potassium dichromate.
3.4 Growth characteristics
• For evaluating of specific growth rate and construction of growth curves were used the absorbance values for the growth curve taken from the 7th column from the microplates described above for each algae (2 microplates for each algae – 2 different shaking)
• The curves were made from the absorbance values, the cell density were counted according to relevant calibration curve.
• The growth curve was constructed and the growth rate was counted for each algae.

36
• The growth rate was counted according to this equation:
µi growth rate Nn the cell density (the last measuring) in 1 ml N0 the cell density (the first measuring) in 1 ml tn duration of measuring (days)
3.5 Assessment of EC50
• Preparation of concentration gradient of solutions of K2Cr2O7: The stock and working solutions of potassium dichromate was diluted by nutrient solution and distiled water to the required concentrations: 1; 0,1; 0,01; 0,001 mg/l Cr (fig. 14)
• Evaluation of results: Value EC50 was counted from the equation of regression by
following scheme:
y = ax – b
where x = log of concentration y = % inhibition
y = 50 → 50 = ax – b → 50 + b = ax x = log EC50 = (50 + b) / a
then just delogaritmus of the x leads to EC50
a, b are values from the graphs (equation of regression)

37
Graph 1: Chlorella kessleri (shaking on multiscan) graph for EC50 evaluation
y = 75,8x + 51,078
y = 50 → 50 = 75,8 + 51,078 → 50 – 51,078 = 75,8x x = log EC50 = (50 – 51,078) / 75,8 = -0,0142
EC50 = 0,968 ≈ 1
• The test is considered to be valid if : � the number of the cells in control sample (nutrient solution) is 16times
higher in the end of the test than in the distiled water � EC50 of potassium dichromate (K2Cr2O7) is in the range of values:
0,60 mg/l – 1,03 mg/l (by ČSN EN 28920)
3.6 Comparsion of yield of method for two types of shaking
The absorbance was measured after 2 types of shaking: • the shaking intergrated in the multiscan (fig. 10) • the shaking by vortex with microplate adapter (fig. 11)
The microplate was shaking for 15 seconds and then immediately measured and then
repeated. So the microplates was measured and shaked twice. The values of absorbance, the growth curves and EC50 values were compared for both
types of shaking.
38
4. RESULTS
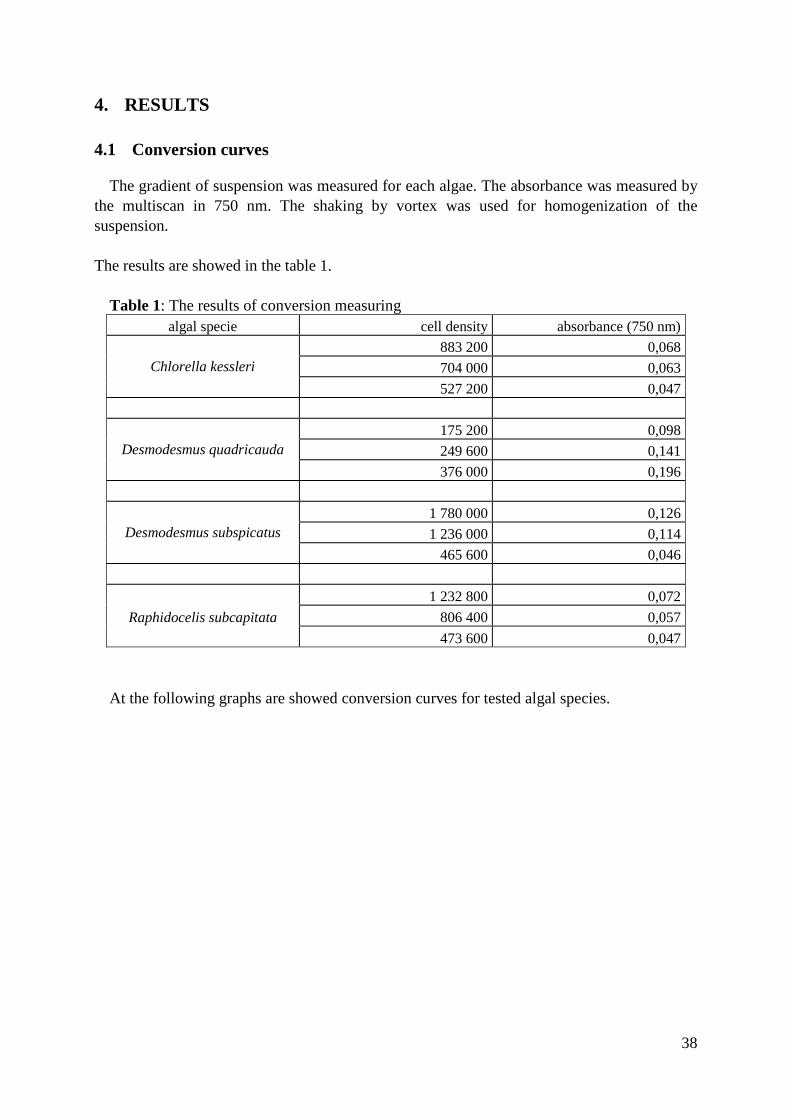
4.1 Conversion curves
The gradient of suspension was measured for each algae. The absorbance was measured by the multiscan in 750 nm. The shaking by vortex was used for homogenization of the suspension. The results are showed in the table 1.
Table 1: The results of conversion measuring
algal specie cell density absorbance (750 nm)
Chlorella kessleri 883 200 0,068
704 000 0,063
527 200 0,047
Desmodesmus quadricauda 175 200 0,098
249 600 0,141
376 000 0,196
Desmodesmus subspicatus 1 780 000 0,126
1 236 000 0,114
465 600 0,046
Raphidocelis subcapitata
1 232 800 0,072
806 400 0,057
473 600 0,047
At the following graphs are showed conversion curves for tested algal species.

39
Graph 2: Conversion curve of Chlorella kessleri
Graph 3: Conversion curve of Desmodesmus quadricauda
40
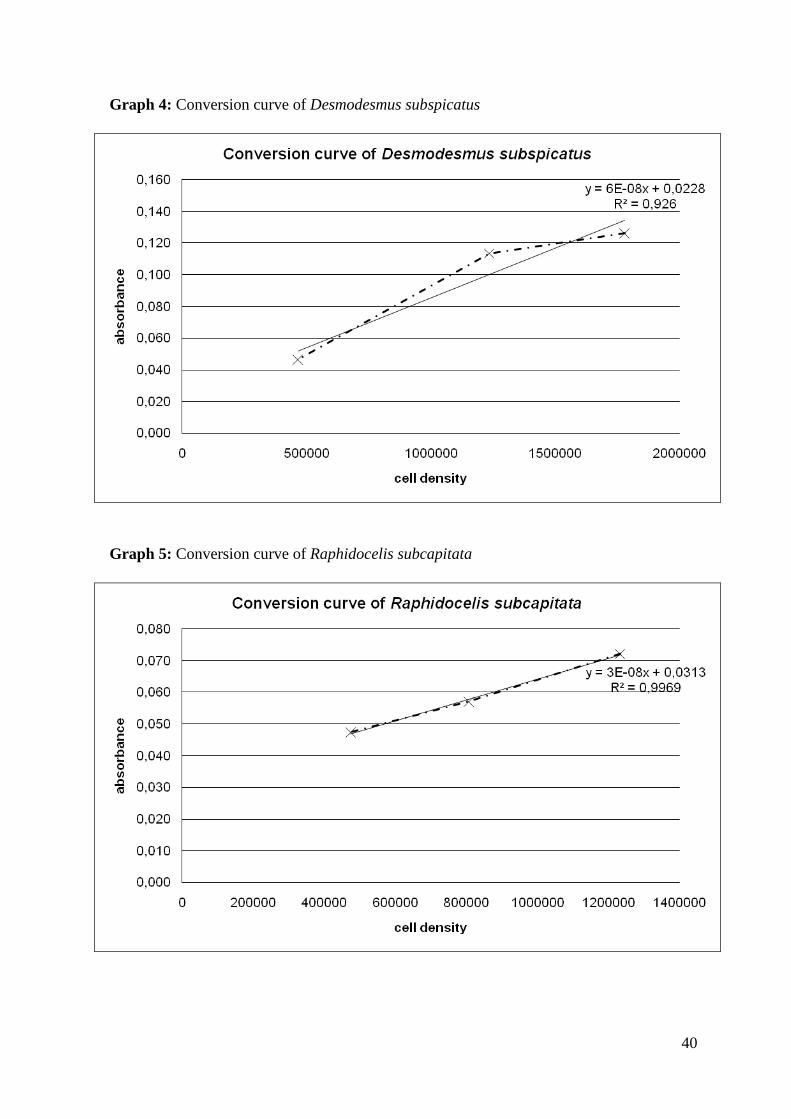
Graph 4: Conversion curve of Desmodesmus subspicatus
Graph 5: Conversion curve of Raphidocelis subcapitata
41
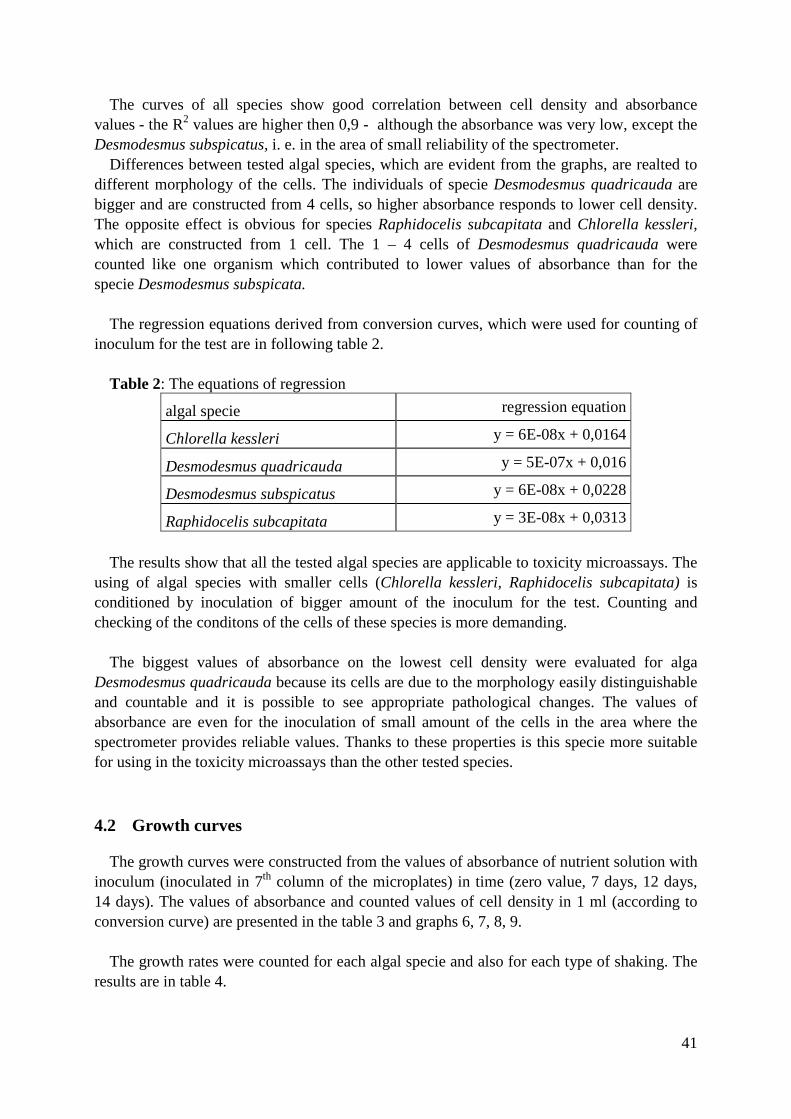
The curves of all species show good correlation between cell density and absorbance values - the R2 values are higher then 0,9 - although the absorbance was very low, except the Desmodesmus subspicatus, i. e. in the area of small reliability of the spectrometer.
Differences between tested algal species, which are evident from the graphs, are realted to different morphology of the cells. The individuals of specie Desmodesmus quadricauda are bigger and are constructed from 4 cells, so higher absorbance responds to lower cell density. The opposite effect is obvious for species Raphidocelis subcapitata and Chlorella kessleri, which are constructed from 1 cell. The 1 – 4 cells of Desmodesmus quadricauda were counted like one organism which contributed to lower values of absorbance than for the specie Desmodesmus subspicata.
The regression equations derived from conversion curves, which were used for counting of
inoculum for the test are in following table 2.
Table 2: The equations of regression
algal specie regression equation
Chlorella kessleri y = 6E-08x + 0,0164
Desmodesmus quadricauda y = 5E-07x + 0,016
Desmodesmus subspicatus y = 6E-08x + 0,0228
Raphidocelis subcapitata y = 3E-08x + 0,0313
The results show that all the tested algal species are applicable to toxicity microassays. The
using of algal species with smaller cells (Chlorella kessleri, Raphidocelis subcapitata) is conditioned by inoculation of bigger amount of the inoculum for the test. Counting and checking of the conditons of the cells of these species is more demanding.
The biggest values of absorbance on the lowest cell density were evaluated for alga
Desmodesmus quadricauda because its cells are due to the morphology easily distinguishable and countable and it is possible to see appropriate pathological changes. The values of absorbance are even for the inoculation of small amount of the cells in the area where the spectrometer provides reliable values. Thanks to these properties is this specie more suitable for using in the toxicity microassays than the other tested species.
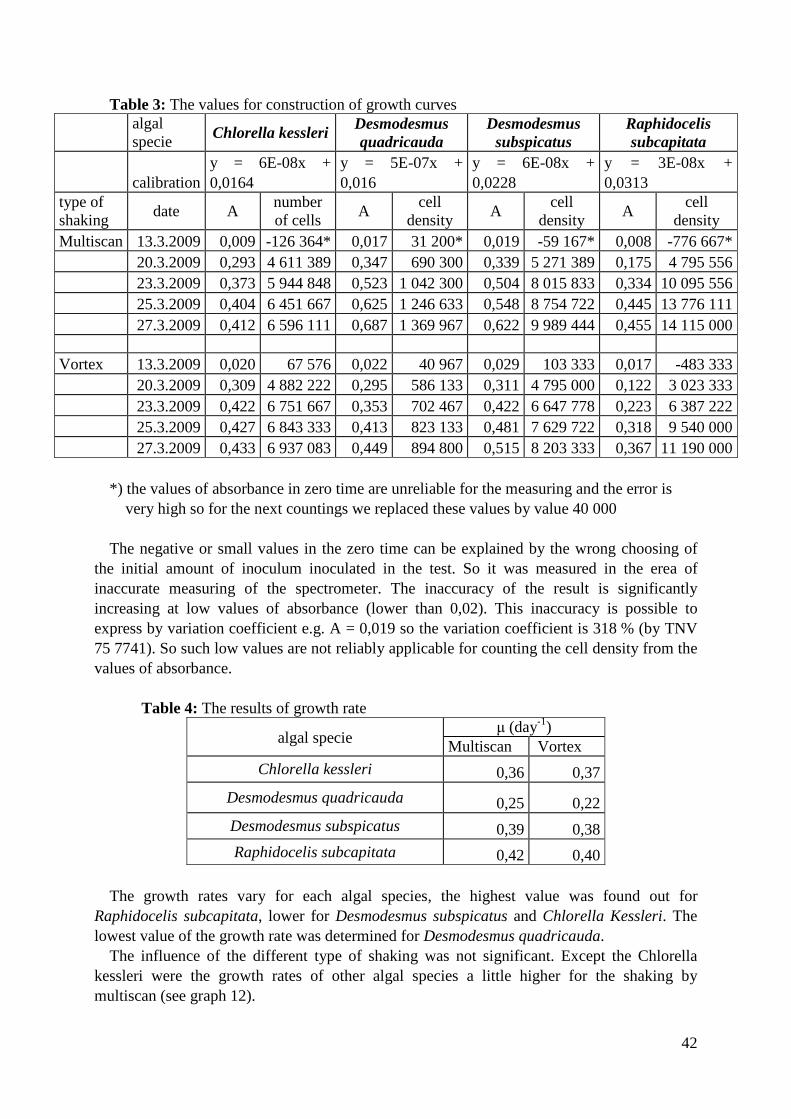
4.2 Growth curves
The growth curves were constructed from the values of absorbance of nutrient solution with inoculum (inoculated in 7th column of the microplates) in time (zero value, 7 days, 12 days, 14 days). The values of absorbance and counted values of cell density in 1 ml (according to conversion curve) are presented in the table 3 and graphs 6, 7, 8, 9.
The growth rates were counted for each algal specie and also for each type of shaking. The
results are in table 4.
42
Table 3: The values for construction of growth curves algal specie
Chlorella kessleri Desmodesmus quadricauda
Desmodesmus subspicatus
Raphidocelis subcapitata
calibration y = 6E-08x + 0,0164
y = 5E-07x + 0,016
y = 6E-08x + 0,0228
y = 3E-08x + 0,0313
type of shaking
date A number of cells
A cell
density A
cell density
A cell
density Multiscan 13.3.2009 0,009 -126 364* 0,017 31 200* 0,019 -59 167* 0,008 -776 667*
20.3.2009 0,293 4 611 389 0,347 690 300 0,339 5 271 389 0,175 4 795 556 23.3.2009 0,373 5 944 848 0,523 1 042 300 0,504 8 015 833 0,334 10 095 556 25.3.2009 0,404 6 451 667 0,625 1 246 633 0,548 8 754 722 0,445 13 776 111 27.3.2009 0,412 6 596 111 0,687 1 369 967 0,622 9 989 444 0,455 14 115 000
Vortex 13.3.2009 0,020 67 576 0,022 40 967 0,029 103 333 0,017 -483 333 20.3.2009 0,309 4 882 222 0,295 586 133 0,311 4 795 000 0,122 3 023 333 23.3.2009 0,422 6 751 667 0,353 702 467 0,422 6 647 778 0,223 6 387 222 25.3.2009 0,427 6 843 333 0,413 823 133 0,481 7 629 722 0,318 9 540 000 27.3.2009 0,433 6 937 083 0,449 894 800 0,515 8 203 333 0,367 11 190 000
*) the values of absorbance in zero time are unreliable for the measuring and the error is very high so for the next countings we replaced these values by value 40 000 The negative or small values in the zero time can be explained by the wrong choosing of
the initial amount of inoculum inoculated in the test. So it was measured in the erea of inaccurate measuring of the spectrometer. The inaccuracy of the result is significantly increasing at low values of absorbance (lower than 0,02). This inaccuracy is possible to express by variation coefficient e.g. A = 0,019 so the variation coefficient is 318 % (by TNV 75 7741). So such low values are not reliably applicable for counting the cell density from the values of absorbance.
Table 4: The results of growth rate
algal specie µ (day-1)
Multiscan Vortex
Chlorella kessleri 0,36 0,37
Desmodesmus quadricauda 0,25 0,22
Desmodesmus subspicatus 0,39 0,38
Raphidocelis subcapitata 0,42 0,40
The growth rates vary for each algal species, the highest value was found out for Raphidocelis subcapitata, lower for Desmodesmus subspicatus and Chlorella Kessleri. The lowest value of the growth rate was determined for Desmodesmus quadricauda.
The influence of the different type of shaking was not significant. Except the Chlorella kessleri were the growth rates of other algal species a little higher for the shaking by multiscan (see graph 12).

43
Graph 6: Growth curve of Chlorella kessleri
The growth curve of alga Chlorella kessleri shows that the stacionary phase was reached
approximately after 10 days of cultivation when the cell density exceeded value 6x10⁶. Higher yield was achieved by vortex shaking.
Graph 7: Growth curve of Desmodesmus quadricauda

44
The lowest growth rate from all the tested algal species was determined for the alga Desmodesmus quadricauda which is evident from the graph 7. The decreasing of the growth rate happened after 10 days of cultivation, but the stacionary phase was not achieved – and the number of cells were still a bit increasing after 14 days.
Higher yield of the test was achieved for the shaking by multiscan. Graph 8: Growth curve of Desmodesmus subspicatus
Desmodesmus subspicata achieved higher growth rates in comparsion to Desmodesmus quadricauda. The value 6x10⁶ was achieved after 10 days similary to Chlorella kessleri. The stacionary phase was not achieved during the test.
Higher yield was determined for shaking of microplates by multiscan.

45
Graph 9: Growth curve of Raphidocelis subcapitata
Raphidocelis subcapitata had the highest value of the growth rate from all tested species. The value 14x106 of the cells in 1 ml was achieved after 14 days of the test. The phase of slowed-down growth was achieved after 10 days of cultivation. The stacionary phase was not reached after 14 days of test.
Higher yield of the test was determined for the shaking by multiscan.

46
4.3 Evaluation of EC50
The EC50 values were determined by the algal toxicity microassay by the concentration gradient of potassium dichromate. Absorbance of the algal suspension of the cells was measured after the inoculation into the microplates, then 7 days after and then every second day for next 14 days.
There are values of absorbance of our tested algal species in table 4.
Table 5: The results of measuring for evaluation of EC50
The next table shows values of EC50 calculated from the values in the table 5.
Table 6: The results of EC50
algal specie EC50
Multiscan Vortex
Chlorella kessleri 1,0 0,6
Desmodesmus quadricauda 1,9 1,5
Desmodesmus subspicatus 1,3 1,0
Raphidocelis subcapitata 1,3 1,1
algae specie Chlorella kessleri Desmodesmus quadricauda
Desmodesmus subspicatus
Raphidocelis subcapitata
measuring 0. 4. 0. 4. 0. 4. 0. 4. concentration of K2Cr2O7(mg/l) Absorbance Absorbance Absorbance Absorbance
Multiscan 1 0,007 0,008 0,009 0,016 0,001 0,003 0,002 0,004 0,1 0,007 0,011 0,009 0,325 0,003 0,226 0,003 0,141
0,01 0,001 0,501 0,011 0,710 0,003 0,524 0,004 0,560 0,001 0,006 0,477 0,013 0,679 0,006 0,585 0,005 0,607
Vortex 1 0,006 0,003 0,010 0,006 0,009 0,011 0,004 0,003 0,1 0,004 0,005 0,012 0,350 0,024 0,069 0,003 0,118
0,01 0,004 0,456 0,014 0,555 0,025 0,524 0,006 0,368 0,001 0,006 0,449 0,016 0,597 0,025 0,496 0,003 0,363

47
Graph 10: Dependence of different type of shaking and algal species on EC50
The values EC50 of tested algal species range from 0,6 value to 1,9 value. The results show evidently that according to EC50 value for potassium dichromate are the
most sensitive algae Chlorella kessleri. Similar sesitivity have Raphidocelis subcapitata and Desmodesmus subspicatus. The lower sensitivity showed specie Desmodesmus quadricauda. The recognized differences are not too big so we can say that all tested species are suitable fo toxicity microassays.
The higher sensitivity for all algal species was achieved by using the vortex for shaking the microplate.
4.4 Comparsion of yield of the method for two types of shaking
The differences between two types of shaking were tested by the algal microassay. The two types of shaking were: integrated shaking in multiscan and shaking by vortex.We can say that intensity of vortex shaking was higher (fig. 15, 16). The algal suspension was mixed in the whole volume of the well, in contrast to shaking by multiscan where the layer of algae stayed on the bottom of the well. The difference between the shaking should not be find out, when the distribution of the algae is homogenized, at measuring of absorbance.
At comparsion of the growth curves for each algal specie the values of absorbance
determined in the end of the test were higher for the shaking by multiscan than by vortex for all algal species (table 4). The differences of application between two types of shaking was not significant. The comparsion is showed in the graph 11.

48
Graph 11: Dependence of different type of shaking and algal species on growth curves
The same results were detrmined at comprasion of the growth rates of all algal species for
both types of shaking (table 4, graph 12), i.e. the higher growth rates were considered for 3 from 4 species for the shaking by multiscan. Only Chlorella kessleri had higher growth rate for the vortex shaking.
The values were not significantly different so we can say that for using of algal microassays are suitable both types of shaking.

49
Graph 12: Dependence of different type of shaking and algal species on growth rates
Different results were determined for evaluating of EC50, where the higher sensitivity, i.e.
lower concentration needed for the 50% inhibition of the algal growth, was determined for the vortex shaking. This fact is possible to explain by increased contact of toxic substance with algal cells in homogenized suspension then in the layer on the bottom.
The influence of the type of shaking is also evident at the graph 10 of EC50 values. At following pictures (fig. 15, 16) we also see how can the type of shaking influence the
measuring.

50
Figure 15: Desmodesmus quadricauda; right: Multiscan shaking, left: Vortex shaking
Figure 16: Raphidocelis subcapitata; right: Multiscan shaking, left: Vortex shaking
51
From the pictures is obvoius that during the shaking by Multiscan the suspension was not homogenized perfectly in whole volume of wells. This fact should not effect the results of measuring of absorbance by spectrometer significantly because the suspension is spread on the bottom equally after the shaking by Multiscan.

52
5. CONCLUCIONS AND DISCUSSION
• According to conversion curves which show connection between absorbance and cell density we can say that the best algal specie, which was tested in this work, is Desmodesmus quadricauda because its morphology the counting and checking the cell conditions is easier also the values of absorbance are in the area of reliable measuring for the spectrometer. For valid implementation of algal microassay is necessary to choose the tested range of cell density in values of absorbance higher than 1.
• The highest value of the growth rate had Raphidocelis subcapitata, lower had
Desmodesmus subspicatus and Chlorella kessleri, the lowest value was determined for Desmodesmus quadricauda. For practical reasons would be the best to use, that algal species with the highest growth rate or that which achieve the stacionary phase in the shortest time, for algal microassays. The stacionary phase was not achived for our tested species during the 14 days. The closest to the stacionary phase were species Chlorella kessleri and Desmodesmus quadricauda.
• The most sensitive alga according to evaluating of EC50 for potassium dichromate
was Chlorella kessleri, then Raphidocelis subcapiata and then Desmodesmus subspicatus, the less sensitive was Desmodesmus quadriacauda. In the work of Maršálek, Rojíčková was as the most sensitive algae according to this value considered Raphidocelis subcapiata but closely following by the Chlorella kessleri. In this work of Maršálek were also compared Desmodesmus subspicatus and Desmodesmus quadricauda11. Desmodesmus quadricauda was also considered to be the less sensitive from the used algal species which is also evident from our results. For real tests it is better to use species with higher sensitivity to toxic substances which was in our case Chlorella kessleri.
• The values of EC50 mentioned in the work of Maršálek, Rojíčková for each algal specie was for: Chlorella kessleri 0,6 (which respons to EC50 value for vortex
shaking, see table 6) Desmodesmus quadricauda 2,5 (which does not respons to our values) Desmodesmus subspicatus 0,8 (which is more close to our value from vortex shaking) Raphidocelis subcapiata 0,4 (which does not respons to our values)
• The influence of different types of shaking on the results of the algal microassay is not
significant. Determined differences were in the range of the error of the method. • For routine application of the test is better to use the vortex shaking because the
homogenization is more complete and the access of the nutrients and toxicants to the algal cells is better.

53
The results from performed work show that for carring out of the microassays is better to use: • Desmodesmus quadricauda for simplification of the work from the view of cell
morphology • Chlorella kessleri from the view of higher sensitivity • Raphidocelis subcapiata from the view of higher growth rate • shaking by the vortex from the view of better contact of the tested organism with
environment • measuring in the rage of absorbance values lower than 1,0
Use of mentioned observations can lead to increasing quality of analytical results from
algal toxicity microassays.
• In agreement with this work many authors assess as suitable algal specie for toxicity microassays Desmodesmus quadricauda. However, Komárek and Marvan39 warn that is necessary to pay attention to the choosing of the tested organism to generalize the obtained results. Žáková40 tested different algal species for use in the algal tests for evaluation of trophic potential, including natural population, which showed lot of deficiencies. For test of algal grow inhibition was in the Czech Republic standardly used specie Desmodesmus quadricauda (Scenedesmus quadricauda)41. The micromethod for evaluation of trophic potential and toxicity of water by algal test was in the Czech Republic established by Lukavský42 in 1985, the test organism was Chlorella kessleri. Simanov43 mentions that in foreign countries was used algal species Raphidocelis subcapitata (Selenastrum capricornutum) and Ankritodermus falcatus. He also successfully tested alga established in the Czech republic Desmodesmus quadricauda.

54
6. REFRENCES
1. MITÁŠOVÁ, K. Ekotoxikologické sledování výluhů polyuretanových pěn. [s.l.], 2006. 53 s. VUT Brno, Fakulta chemická. Vedoucí diplomové práce Prof. RNDr. Milada Vávrová, CSc.
2. KOČÍ, V. Ekotoxikologie [online]. 2007. Praha : VŠCHT, Fakulta chemie ochrany prostředí, 2007 [cit. 2007-05-20]. Text v češtině. Kompletní přednášky z ekotoxikologie. Dostupný z WWW: <http://www.vscht.cz/uchop/ekotoxikologie/studijni_materialy/Ekotox/Ekotox%201.pdf>.
3. KOEMAN, J.H. Ecotoxicology and enviromental quality. Environmental Monitoring and Assessment. 1983, vol. 3, no. 3-4, s. 227-228. Dostupný z WWW: <http://springerlink.metapress.com/content/l74451633qv78323/?p=1b1f79d669da4177b7dd2b42590a7622&pi=3>.
4. RICHARDSON, Mervyn. Ecotoxicology monitoring. Weinheim : VCH Verlagsgesellschaft, 1993. 384 s. ISBN 3-527-28560-1.
5. NEWMAN, Michael C. Fundamentals of Ecotoxicology. Boca Raton : Lewis Publishers, 2001. 402 s. ISBN 1-57504-013-1.
6. WEYERS, Arnd, et al. Acute toxicity data: A comprehensive comparsion of results of fish, Daphnia, and algae tests with new substances notified in the European Union. Environmental Toxicology and Chemistry. 2000, vol. 19, no. 7, s. 1931-1933.
7. SCHULTZ, T.W., SEWARD, J.R. Health-effects related structure]toxicity relationships: a paradigm for the first decade of the new millennium. The Science of the Total Environment. 2000, no. 294, s. 73-84.
8. World Health Organization. The WHO recommended classification of pesticides by hazard and guidelines to classification. Geneva : Marketing and Dissemination, 2005. 60 s. ISBN 92 4 154663 8.
9. World Health Organization. Decision-Making for the Judicious Use of Insecticides. 3rd edition. Geneva : Marketing and Dissemination, 2004. 37 s.
10. Kočí V.: Význam testů toxicity pro hodnocení vlivů látek na životní prostředí, Chemické listy 100, 882-888(2006)
11. MARŠÁLEK, Blahoslav, ROJÍČKOVÁ-PÁDRTOVÁ, Renata. Selection and sensitivity comparsions of algal species for toxicity testing. Chemosphere. 1999, vol. 38, no. 14, s. 3329-3338.
12. MAXAM, Gudrun, et al. Use of Bioassays for Assessment of Water-Extractable Ecotoxic Potential of Soils. Ecotoxicology and Environmental safety. 2000, no. 45, s. 240-246.
13. The Free Dictionary [online]. c2009 [cit. 2009-05-03]. Dostupný z WWW: <http://www.thefreedictionary.com/>.
14. Mondofacto [online]. c2008 [cit. 2009-05-03]. Dostupný z WWW: <http://www.mondofacto.com>.
15. GIRLING, A.E., et al. Development of Methods for Evaluating Toxicity to Freshwater Ecosystems. Ecotoxicology and Environmental safety. 2000, no. 45, s. 148-176.
16. KOČÍ, Vladimír, RAKOVICKÝ, Tomáš, ŠVAGR, Andrej. Testy akutní a semichronické toxicity [online]. 2001 [cit. 2009-04-23]. Dostupný z WWW: <http://www.vscht.cz/uchop/ekotoxikologie/dokumenty/Obecna.htm>.
55
17. EPA. Ecological Effects Test Guidelines : Algal Toxicity. [s.l.] : [s.n.], 1996. 11 s. 18. MA, Jianyi, et al. Differential responses of eight cyanobacterial and green algal
species, to carbamate insecticides. Ecotoxicology and Environmental safety. 2006, no. 63, s. 268-274.
19. HOFFMAN, D., et al. Handbook of ecotoxicology. 2nd edition. Boca Raton : Lewis publishers, 2003. 1290 s. ISBN 1-56670-546-0.
20. Shaw I. C., Chadwick J.:Principle of Environmental Toxicology, Taylor & Francis LtD, London 1998, 216 p., ISBN 0-7484-0355-8
21. TICHÝ, M. Toxikologie pro chemiky : Toxikologie obecná, speciální, analytická a legislativa. 2. vyd. Praha : Univerzita Karlova, Karolinum, 2004. 119 s. ISBN 80-246-0566-X.
22. Horák J., Linhart I., Klusoň P.: Úvod do toxikologie a ekologie pro chemiky, VŠCHT Praha, 1. vyd., Praha 2004, 187 s., ISBN 80-7080-548-X BEZCHLEBOVÁ, Jitka. Využití žížal v půdní ekotoxikologii [online]. 2006 [cit. 2007-06-20]. Dostupný z WWW: <http://www.recetox.muni.cz/sources/lse/ekotoxikologie_zizal_review.pdf>.
23. Paleček J., Linhart I., Horák J.: Toxikologie a bezpečnost práce v chemii, VŠCHT Praha, 1. vyd.(dotisk 1999), Praha 1996, 189 s., ISBN 80-7080-266-9
24. SVOBODOVÁ, Z., et al. Ekotoxikologie praktická cvičení část I.. Brno : Veterinární a farmaceutická univerzita, Fakulta veterinární hygieny a ekologie, Ústav veterinární ekologie a ochrany životního prostředí, 2000. 72 s. ISBN 80-85114-95-X.
25. GREENSBERG, Arnold E., CLESCERI, Lenore S., EATON, Eaton D. Standard Methods for the Examination of Water & Wastewater. 18th edition. Washington : American Public Health Association, 1992. 1336 s. ISBN 0-87553-207-1.
26. AMBROŽOVÁ ŘÍHOVÁ, J. Encyklopedie hydrobiologie [online]. Praha : VŠCHT, c2006 [cit. 2007-05-10]. Dostupný z WWW: <http://vydavatelstvi.vscht.cz/knihy/uid_es-006/ebook.html?p=T001>.
27. MOSTAFA, Fadwa I.Y., HELLING, Charles S. Impact of four pesticides on the growth and metabolic activities of two photosythetic algae. Journal of Environmental Science and Health. 2002, vol. B37, no. 5, s. 417-444.
28. The act no. 157/1998 Collection of Laws about chemical compounds and chemical agents as amended by The act no. 356/2003 Collection of Laws (requires the reults of ecotoxicological tests).
29. TJALLING, Jager, HEUGENS, Evelyn H.W., KOOIJMAN, Sebastiaan A.L.M. Making sense of ecotoxicological test results: towards application of process-based models. Ecotoxicology. 2006, no. 25, s. 305-314.
30. MA, Jianyi, et al. Differential sensitivity of two green algae, Scenedesmus quadricauda and Chlorella vulgaris, to 14 pesticides adjuvants. Ecotoxicology and Environmental safety. 2004, no. 58, s. 61-67.
31. SILVA, Aurora, et al. Ecotoxicity tests using the green algae Chlorella vulgaris—A useful tool in hazardous effluents management. Journal of Hazardous Materials. 2009, s. 1-7.
32. JOHNSON, Joni L., FAWLEY, Marvin W., FAWLEY, Karen P. The diversity of Scenedesmus and Desmodesmus (Chlorophyceae) in Itasca State Park, Minnesota, USA . Phycologia. 2007, vol. 46, is. 2, s. 214-229.
56
33. Institute of Botany, Academy of Sciences of the Czech Republic, Centre of Phycology. Culture Collection of Autotrophic Organisms [online]. 2005 , 27.04.2009 [cit. 2009-05-04]. Dostupný z WWW: <http://www.butbn.cas.cz/ccala/>.
34. JOHN, D.M., WHITTON, B.A., BROOK, A.J. The fresh water algal flora of British isles. Cambridge : Cambridge University Press, 2002. 702 s. ISBN 0521770513. STAVELEY, Jane P., SMRCHEK, Jerry C. Algal Toxicity Test. Small-scale Freshwater Toxicity Investigations. 2005, vol. 1, no. 1, s. 181-202.
35. PAIXAO, Susana M., et al. Performance of miniaturized algal bioassaz in phytotoxicity screening. Ecotoxicology. 2007, no. 17, s. 165-171.
36. RIEDL, Janet, ALTENBURGER, Rolf. Physicochemical substance properties as indicators for unreliable exposure in microplate-based bioassays. Chemosphere. 2007, vol. 67, no. 2, s. 2210-2220.
37. MA, Jianyi, et al. Differential Sensitivity of Two Green Algae Scenedesmus obliqnus and Chlorella pyrenoidosa, to 12 pesticides . Ecotoxicology and Environmental safety. 2002, vol. 52, no. 2, s. 57-61.
38. MA, Jianyi. Differential Sensitivity of Three Cyanobacterial and Five Green Algae Species to Organotins and Pyrethroids Pesticides . Science of the Total Environment. 2004, no. 341, s. 109-117.
39. Komárek, J., Marvan, P, 1976: Výběr a registrace kmenů jako testovacích organismů. Sborník Kolokvium o řasových testech, Třeboň, ČB, 121-124.
40. Žáková, Z., 1980: Trofický potenciál a jeho aplikace ve vodním hospodářství. Práce a studie, sešit 154, VÚV Praha, 116 s.
41. Dočkal, P., Soldán, P. 1988: Metody testů akutní toxicity a biodegradability xenobiotik. Účelová publikace VÚV 18, VÚV Praha, 117 s.
42. Lukavský, J. 1985. Mikrometoda stanovení trof. potenc. a toxicity vody řasovým testem. In. Řasové testy a jejich aplikace, Sborník přednášek ČSVTS, Praha, 92-96.
43. Simanov, L 1985: Řasové testy ve vodohospodářské toxikologii, In. Řasové testy a jejich aplikace, Sborník přednášek ČSVTS, Praha, 108-116.

57
7. LIST OF ABBREVATIONS
DDT – dichlorodiphenyltrichloroethane DDD – dichlorodiphenyldichloroethane DDE – dichlorodiphenyldichloroethylene EEC – European Economic Community EU – European Union OECD - Organization for Economic Cooperation and Development WHO - World Health Organization UNCETDG - United Nationals Committee of Experts on the Transport of Dangerous Goods GHS - Globally Harmonized System LD – Lethal Dose LC – Lethal Concentration EC - Effective Concentration IC – Inhibition Concentration NOEC – No Observed Effect Level NOAEL - No Observed Edverse Effect Level LOEC - Lowest Observed Effect Concentration LOEL - Lowest Observed Effect Level LOAEL - Lowest observed adverse effect level pH – potential of hydrogen TU - Toxicity Unit ATP - Adenosine triphosphate UV – ultraviolet PC – personal computer VÚV T.G.M. v.v.i.– Výzkumný ústav vodohospodářský T.G. Masaryka veřejná výzkumná
instituce (T.G. Masaryk Water Research Institute, Public Research Institute)

58
8. ENCLOSURE LIST – LIST OF RELATED LEGAL ENACTMENTS
1. The act no. 157/1998 Collection of Laws about chemical compounds and chemical agents as amended by The act no. 356/2003 Collection of Laws
2. The act no. 326/2004 Collection of Laws of the phytosanitary
3. The act about waste no. 185/2001 Collection of Laws as amended by The act
no. 314/2006 4. The act no. 376/2001 Collection of Laws about the conditions of storage of waste on
the tips and their using in the landscape
5. Czech Standard ČSN EN 14735 (83 8004)/2007 Characterization of waste – Preparation of waste samples for ecotoxicity tests
6. Czech Standard EN 8692 (75 7740)/2005 Water quality - Freshwater algal growth
inhibition test with unicelular green algae