Embed Size (px)
Citation preview

The Millennial GenerationThe Next Greatest Generation?
American Association of School Administrators801 N. Quincy St., Suite 700
Arlington, VA 22203
Standing Up For Public EducationStanding Up For Kids

Most major negativeindicators are
falling

SOURCE: National Institutes of Health, National Institute on Drug Abuse, Monitoring the Future Survey.
Percentage of students who reported smoking cigarettes daily in the previous 30 days by school grade (1980-2003)

Percentage of students who reported having five or more alcoholic beverages in a row in the last 2 weeks by grade, 1980-2003
SOURCE: National Institutes of Health, National Institute on Drug Abuse, Monitoring the Future Survey.

NOTE: Illicit drugs include marijuana, cocaine (including crack), heroin, hallucinogens (including LSD, PCP, and ecstasy [MDMA]), amphetamines (including methamphetamine), and nonmedical use of psychotherapeutics. SOURCE: National Institutes of Health, National Institute on Drug Abuse, Monitoring the Future Survey.
Percentage of students who reported using illicit drugs in the previous 30 days by grade (1980-2003)

Rate of serious violent crime victimization of youth ages 12 to 17 by gender (1980-2000)
NOTE: Serious violent crimes include aggravated assault, rape, robbery (stealing by force or threat of violence), and homicide. Because of changes made in the victimization survey, data prior to 1992 are adjusted to make them comparable with data collected under the redesigned methodology. Numbers for 2000 are preliminary and do not contain final homicide estimates. SOURCE: U.S. Department of Justice, Bureau of Justice Statistics, National Crime Victimization Survey. Federal Bureau of Investigation, Uniform Crime Reporting Program, Supplementary Homicide Reports.

Serious violent crime offending rate by youth ages 12 to 17, 1980-2000
SOURCE: U.S. Department of Justice, Bureau of Justice Statistics, National Crime Victimization Survey. Federal Bureau of Investigation, Uniform Crime Reporting Program, Supplementary Homicide Reports.

Serious violent crime victimization and perpetration rates for youth ages 12 to 17
SOURCE: U.S. Department of Justice, Bureau of Justice Statistics, National Crime Victimization Survey. Federal Bureau of Investigation, Uniform Crime Reporting Program, Supplementary Homicide Reports.
Above figure at ChildStats.gov

In the 10 years between 1992 and 2001, the decline in the number of violent crime arrests was greater for juveniles than adults:
Violent Crime Index
–21%
–9%
Murder –62 –29
Forcible rape
–24 –29
Robbery –32 –23
Aggravated assault
–14 –3
Data source: Crime in the United States 2001, table 32.
Juvenile Adult

1.All the growth in the juvenile violent crime arrest rate that began in the latter part of the 1980s was erased by 2001.
The juvenile Violent Crime Index arrest rate in 2001 was at its lowest level since 1983—44% below the peak year of 1994
Data source: Analysis of arrest data from the FBI and population data from the U.S. Bureau of the Census.

After years of relative stability, the juvenile arrest rate for Property Crime Index offenses began a decline in the mid-1990s
that continued through 2001
Data source: Analysis of arrest data from the FBI and population data from the U.S. Bureau of the Census.

Data source: Analysis of arrest data from the FBI and population data from the U.S. Bureau of the Census.
Trends in juvenile arrest rates for weapons law violations and for murder were similar between 1980 and 2001

Data source: Analysis of arrest data from the FBI and population data from the U.S. Bureau of the Census.
The juvenile arrest rate for drug abuse violations soared in the mid-1990s

Adolescent mortality: Death rates among adolescents ages 15 to 19 by cause of death
SOURCE: Centers for Disease Control and Prevention, National Immunization Program and National Center for Health Statistics, National Immunization Survey.
Above figure at ChildStats.gov
Above found at School Violence Resource Center website, Fact Sheet:What are the Odds?

Pregnancy Rate per 1,000 women aged 15-19
116.9 115.3 111 108 104.6 99.6 95.6 91.4 88.7 85.7 83.6
223.8 222.3 216.6 209.9198.7
181.4 175.1 168.1 162 156.1 153.3
0
50
100
150
200
250
1990 1991 1992 1993 1994 1995 1996 1997 1998 1999 2000
All women Black women
Source: The Alan Guttmacher Institute, 2004.

Birth rates by mother's age, race, and Hispanic origin 1980-2002
SOURCE: Centers for Disease Control and Prevention, National Immunization Program and National Center for Health Statistics, National Immunization Survey.
Above figure at ChildStats.gov

Birth Rate per 1,000 women aged 15-19
0
20
40
60
80
100
120
140
1990 1991 1992 1993 1994 1995 1996 1997 1998 1999 2000
All women Black women
Source: The Alan Guttmacher Institute, 2004.
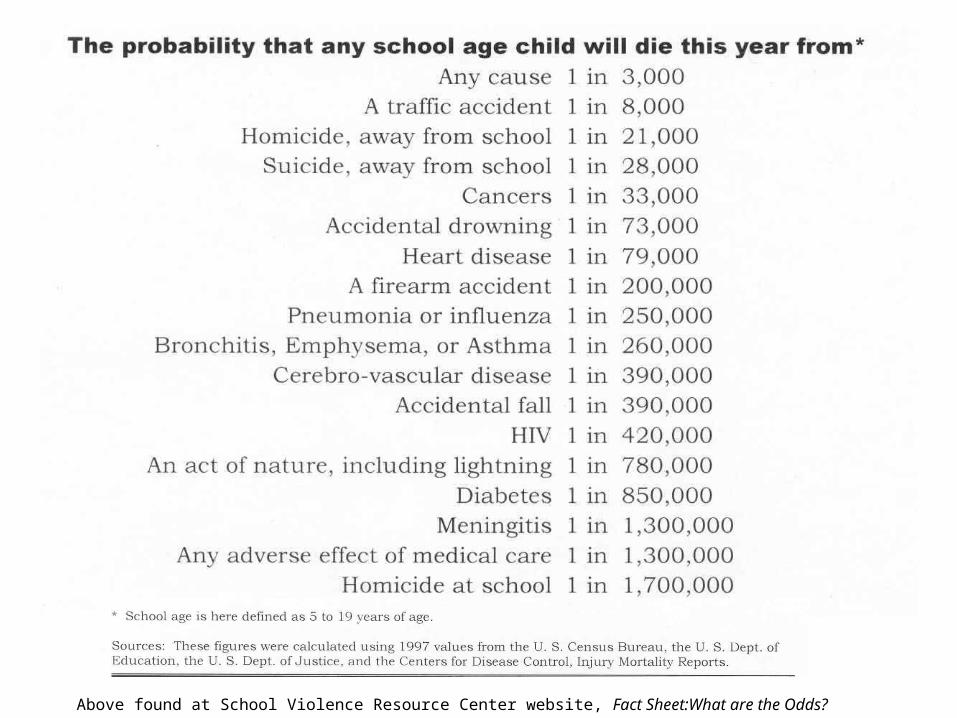
Abortion Rate per 1,000 women aged 15-19
0
10
20
30
40
50
60
70
80
90
1990 1991 1992 1993 1994 1995 1996 1997 1998 1999 2000
All women Black women
Source: The Alan Guttmacher Institute, 2004.

Percentage of youth ages 16 to 19 who are neither enrolled in school nor working by gender, race, and Hispanic origin
SOURCE: U.S. Bureau of Labor Statistics, Current Population Survey.Above figure at ChildStats.gov

Number of homicides and suicides of youth ages 5-19 at school
1 Homicides and suicides of youth ages 5–19 at school from July 1,1992 to June 30,2002.2 Data are preliminary and subject to change.SOURCE: Centers for Disease Control and Prevention (CDC), 1992–2002 School-Associated Violent Deaths Surveillance System, previously unpublished tabulation (August 2003).Above found in National Center for Education Statistics Indicators of School Crime and Safety, 2003.

SOURCE: U.S. Department of Justice, Bureau of Justice Statistics, National Crime Victimization Survey (NCVS), 1992–2001.Above found in National Center for Education Statistics Indicators of School Crime and Safety, 2003.
Rate of Non-fatal crimes against students ages 12-18 per 1000 students, by location

Percentage of students in grades 9-12 who reported carryinga weapon at least 1 day during the previous 30 days, by sex
SOURCE: Centers for Disease Control and Prevention, National Center for Chronic Disease Prevention and Health Promotion, Youth Risk Behavior Surveillance System (YRBSS), “Youth Risk Behavior Survey” (YRBS), selected years 1993–2001.Above found in National Center for Education Statistics Indicators of School Crime and Safety, 2003.

At the same time, positive indicators
are rising

Year AP Schools AP Candidates AP Exams Taken Colleges Receiving AP Grades
1955-56 104 1,229 2,199 130
1960-61 1,126 13,283 17,603 617
1965-66 2,518 38,178 50,104 1,076
1970-71 3,342 57,850 74,409 1,382
1975-76 3,937 75,651 98,898 1,580
1980-81 5,253 133,702 178,159 1,955
1985-86 7,201 231,378 319,224 2,125
1990-91 9,786 359,120 535,186 2,587
1995-96 11,712 537,428 843,423 2,895
1996-97 12,022 581,554 921,601 2,872
1997-98 12,486 635,168 1,016,657 2,964
1998-99 12,886 704,298 1,149,515 3,007
1999-2000 13,253 768,586 1,272,317 3,070
2000-01 13,680 844,741 1,414,387 3,199
2001-02 14,157 937,951 1,585,516 3,388
cumulative (1955-02):
10,541,457* 16,118,698
Source: College Board

0
200,000
400,000
600,000
800,000
1,000,000
1,200,000
1,400,000
1,600,000
1981 1986 1991 1996 1997 1998 1999 2000 2001 2002
AP Candidates AP Exams
AP Candidates and Exams Taken
Source: College Board

5,253
7,201
9,786
11,712 12,02212,486 12,886 13,253
13,68014,157
1981 1986 1991 1996 1997 1998 1999 2000 2001 2002
Source: College Board
Number of Schools offering AP Courses

21.5823 23.53 24.17
25.1426.05
0
5
10
15
20
25
30
1982 1987 1990 1994 1998 2000
Average Number of Carnegie Units Earned by PublicHigh School Graduates from 1982-2000
Source: National Center for Education Statistics, November 2002
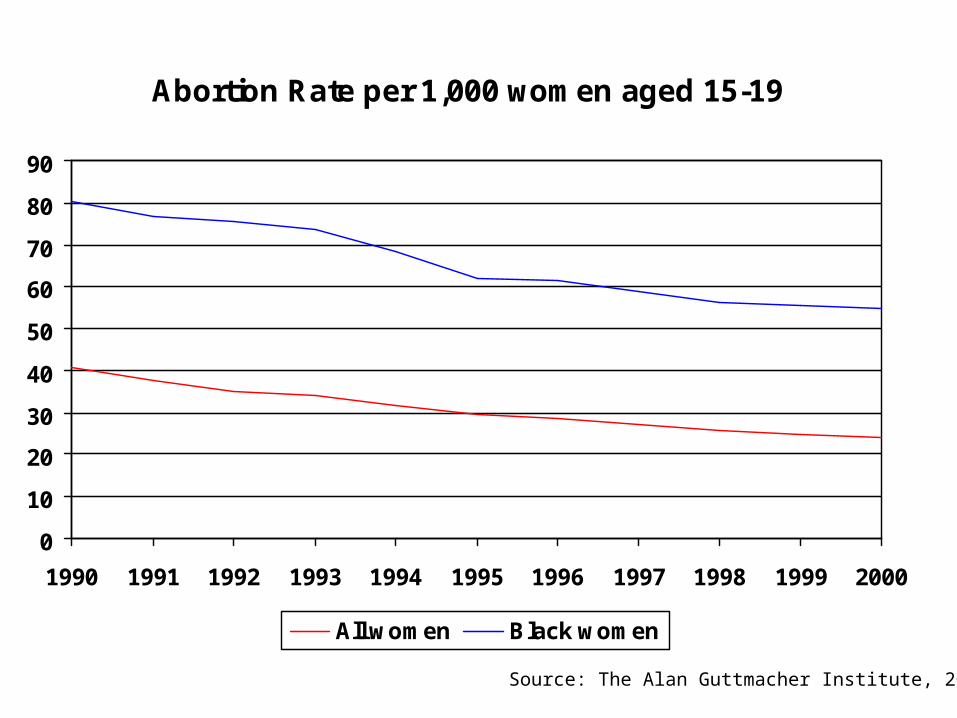
1.74
2.15 2.25
2.572.73
2.95
2.2
2.542.75
3.04 3.12 3.2
0.99
1.351.54
1.711.85 1.95
0
0.5
1
1.5
2
2.5
3
3.5
1982 1987 1990 1994 1998 2000
Math-Algebra or Higher Total Science Foreign Language
Average Number of Carnegie Units Earned by PublicHigh School Graduates from 1982-2000
Source: National Center for Education Statistics, November 2002

Percentage of high school graduates who completed high-level coursework in mathematics, science, English, and foreign language
SOURCE: U.S. Department of Education, National Center for Education Statistics, High School and Beyond Survey, National Education Longitudinal Study of 1988, and National Assessment of Educational Progress Transcript Study.
Above figure at ChildStats.gov

• Adults have a mistaken impression of young people.– Adults think kids are more dangerous and
commit more crimes– Adults think schools are more dangerous – But adults do acknowledge that kids work
harder in school than they did, but not by a wide margin
– Some good things about today’s kids must be sinking in with adults because they do see them as better citizens than they were
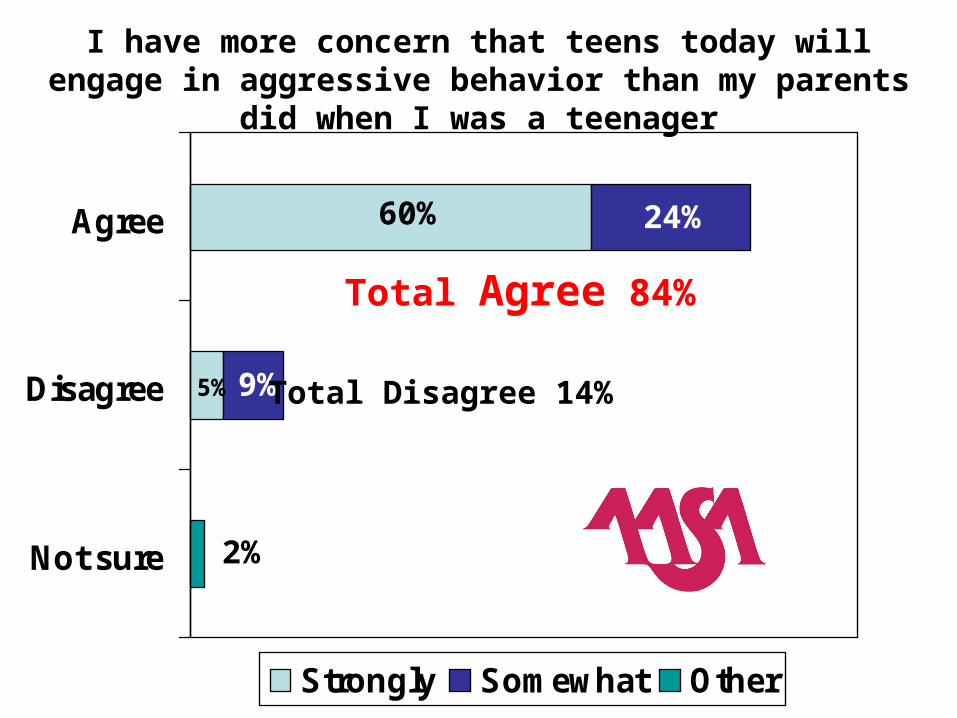
I have more concern that teens today will engage in aggressive behavior than my parents did when I was a teenager
Not sure
Disagree
Agree
Strongly Somewhat Other
11%
2%
5% 9%
60% 24%
Total Agree 84%
Total Disagree 14%

Today’s young people commit fewer crimes and are less likely to use drugs than previous generations
Not sure
Disagree
Agree
Strongly Somewhat Other
11%
2%
11% 16%
25%46%
Total Agree 27%
Total Disagree 71%

Do you think that ELEMENTARY SCHOOLS are (much/somewhat) more or less dangerous than when you were a child?
Much more26%
Somewhat more40%
Somewhat less15%
Much less6%
Neither12%
TotalsMore Dangerous – 66%Less Dangerous – 21%

Do you think that MIDDLE SCHOOLS are (much/somewhat) more or less dangerous than when you were a child?
Much more43%
Somewhat more37%
Somewhat less9%
TotalsMore Dangerous – 80%Less Dangerous – 12%
Neither 6%Much less 3%

Do you think that HIGH SCHOOLS are (much/somewhat) more or less dangerous than when you were a child?
Much more56%
Somewhat more31%
Somewhat less6%
TotalsMore Dangerous – 87%Less Dangerous – 8%
Neither 4%Much less 2%

26
%
40
%
15
%
6%
12
%
43
%
37
%
9%
3% 6
%
56
%
31
%
6%
2% 4
%
Much More Somewhat More Somewhat Less Much Less Neither
Elementary Middle High
Do you think that (insert item) schools are (more/somewhat) more or lessdangerous than when you were a child?
Total MoreElementary 66%Middle 80%High 87%Total LessElementary 21%Middle 12%High 8%

Children today work harder in school-they take more classes and harder classes-than previous generations
Other
Disagree
Agree
Strongly Somewhat Other
11%
3%
29% 29%
21%18%
Total Agree 58%
Total Disagree 40%

Children today are more likely to be good citizens
Other
Disagree
Agree
Strongly Somewhat Other
11%
2%
14% 41%
28%15%
Total Agree 54%
Total Disagree 43%

Persons in selected age groups as a percentage of the total U.S. population
SOURCE: U.S. Census Bureau, Population Estimates and ProjectionsAbove figure at ChildStats.gov