Embed Size (px)
Citation preview

The Role of Trade: The Role of Trade: South-South and South-South and
GlobalGlobal
Presentation byPresentation by
T. C. Venkat SubramanianT. C. Venkat Subramanian
Export-Import Bank of IndiaExport-Import Bank of IndiaNew Delhi, November 13, 2003 New Delhi, November 13, 2003
IPC SEMINAR IPC SEMINAR && MEETING MEETING
EXIM EXIM BANKBANK

Structure of PresentationStructure of Presentation GLOBALISATION GLOBALISATION
ROLE OF INTERNATIONAL TRADEROLE OF INTERNATIONAL TRADE
THE GLOBAL TRADING SYSTEMTHE GLOBAL TRADING SYSTEM
GLOBAL TRADE – AN OVERVIEWGLOBAL TRADE – AN OVERVIEW
GLOBAL TRADE – RECENT TRENDSGLOBAL TRADE – RECENT TRENDS
TRADE AND DEVELOPING COUNTRIESTRADE AND DEVELOPING COUNTRIES
SOUTH-SOUTH TRADESOUTH-SOUTH TRADE
INDIA’S EXTERNAL TRADEINDIA’S EXTERNAL TRADE
ACHIEVING GLOBAL INTEGRATIONACHIEVING GLOBAL INTEGRATION
INDIA’S AGRICULTURE EXPORTSINDIA’S AGRICULTURE EXPORTS
WORLD AGRICULTURAL TRADEWORLD AGRICULTURAL TRADE
AGRI TRADE LIBERALISATIONAGRI TRADE LIBERALISATION
OUTLOOK & PROSPECTSOUTLOOK & PROSPECTS

GlobalisationGlobalisation GlobalisationGlobalisation – growing interdependence of countries – growing interdependence of countries
resulting from increasing integration of trade, resulting from increasing integration of trade,
finance, people, and ideas in one global marketplacefinance, people, and ideas in one global marketplace
Main elements of this integration – Main elements of this integration – International Trade International Trade Cross-border Investment FlowsCross-border Investment Flows
Globalization – has potential to advance developmentGlobalization – has potential to advance development Expediting economic growth Expediting economic growth Creating jobs Creating jobs Raising incomesRaising incomes
Challenge – equitable distribution of economic Challenge – equitable distribution of economic
growthgrowth

Role of International TradeRole of International Trade International TradeInternational Trade – An indispensable engine of – An indispensable engine of
economic growtheconomic growth
Trade – Expands markets, facilitates competition, Trade – Expands markets, facilitates competition,
increases productivity & disseminates knowledgeincreases productivity & disseminates knowledge
Trade openness – Spurs economic growth and Trade openness – Spurs economic growth and
technological progress; Growth raises living technological progress; Growth raises living
standardsstandards
Countries that have grown fastest have done so Countries that have grown fastest have done so
with rapid increases in their participation in world with rapid increases in their participation in world
tradetrade
Trade liberalisation must be complemented by Trade liberalisation must be complemented by
other policy measuresother policy measures

The Global Trading The Global Trading
SystemSystem Global trading system – allows a country to Global trading system – allows a country to
increase the benefits of opennessincrease the benefits of openness
Entails global trading system to have clear rules, Entails global trading system to have clear rules,
flexibility, effective enforcement of rulesflexibility, effective enforcement of rules
World Trade Organisation (WTO)World Trade Organisation (WTO) – the only – the only
multilateral institution governing international multilateral institution governing international
tradetrade
Provides institutional context for increased cooperationProvides institutional context for increased cooperation
Standardisation & harmonisation of domestic policyStandardisation & harmonisation of domestic policy
Although increasing trend toward Regionalism, Although increasing trend toward Regionalism,
RTAs are no substitutes for multilateral trading RTAs are no substitutes for multilateral trading
systemsystem

Global Trade: An OverviewGlobal Trade: An Overview
Between 1952 & 2000 merchandise trade Between 1952 & 2000 merchandise trade
increased by 6% p.a. vis -à-vis global output increased by 6% p.a. vis -à-vis global output
growth of 4% p.a. growth of 4% p.a.
Global trade grew more rapidly than world GDP Global trade grew more rapidly than world GDP
in all but a few years of cyclical downturnsin all but a few years of cyclical downturns
During the decade of the 1990s, growth rate of During the decade of the 1990s, growth rate of
world trade was more than twice that of the world trade was more than twice that of the
GDP growth rate GDP growth rate
The ratio of global trade in goods & services to The ratio of global trade in goods & services to
global GDP increased from 8% in 1950 to 29.5% global GDP increased from 8% in 1950 to 29.5%
in 2000in 2000
Contd…Contd…

Global Trade: An OverviewGlobal Trade: An Overview
Source: World Economic Outlook, IMFSource: World Economic Outlook, IMF
Volume of world trade in goods & services Volume of world trade in goods & services increased by 3.2% in 2002increased by 3.2% in 2002
Both exports & imports of developing Both exports & imports of developing countries outpaced those of advanced nationscountries outpaced those of advanced nations
Trade growth in 2003 likely to slow down Trade growth in 2003 likely to slow down marginallymarginally
1996 1997 1998 1999 2000 2001 20022003*
Trade Growth in volume (%) 7.0 10.4 4.4 5.8 12.6 0.1 3.2 2.9
Advanced countries 6.1 10.6 4.2 5.5 12.0 -0.8 2.2 1.6
Developing countries 9.5 13.5 5.5 5.4 14.4 2.7 6.5 4.3
Advanced countries 6.4 9.4 6.0 8.1 11.9 -1.0 2.2 2.8
Developing countries 9.9 10.5 -0.8 2.4 16.1 1.6 6.0 5.1
Imports volume growth (%)
Export volume growth (%)
* Projections* Projections
Contd…Contd…

Global Trade: Recent Global Trade: Recent
TrendsTrends Merchandise exports (2002) – Merchandise exports (2002) – US$ 6424 bnUS$ 6424 bn – –
growth 4% growth 4% Service exports (2002) – Service exports (2002) – US$ 1540 bn.US$ 1540 bn.
(growth 5%) (growth 5%) Major players – US, UK, Germany & JapanMajor players – US, UK, Germany & Japan Merchandise trade recovered more strongly Merchandise trade recovered more strongly
than output in 2002than output in 2002
Contd…Contd…
Gro
wth
(p
erce
nt)
Gro
wth
(p
erce
nt)
Source: International Trade Statistics, WTOSource: International Trade Statistics, WTO

Global Trade: Recent Global Trade: Recent
TrendsTrends Trade growth was strong in Asia and the Trade growth was strong in Asia and the
transition economies transition economies Recovery of global trade retarded by Recovery of global trade retarded by
stagnation of Western Europe’s imports stagnation of Western Europe’s imports and contraction of Latin America’s and contraction of Latin America’s importsimports
Source: WTOSource: WTO Growth (%)Growth (%)
Reg
ion
Reg
ion
Contd…Contd…

Trade Trade & & Developing Developing CountriesCountries
Developing countries embrace globalization since Developing countries embrace globalization since
it:it: Expands the range of choices for consumers Expands the range of choices for consumers Places downward pressure on prices Places downward pressure on prices Raises real value of workers’ earningsRaises real value of workers’ earnings
Developing countries – benefited from Developing countries – benefited from
intensification of trade in manufactures & intensification of trade in manufactures &
associated productivity gainsassociated productivity gains
More than three-quarters of WTO members are More than three-quarters of WTO members are
developing nationsdeveloping nations
Export-led growth has a proven record of success, Export-led growth has a proven record of success,
while its alternative – protectionism – has failed while its alternative – protectionism – has failed
where it has been triedwhere it has been tried Contd…Contd…

Trade Trade & & Developing Developing CountriesCountries
Reverse Linkages – increasing impact of Reverse Linkages – increasing impact of
developing nations on industrial countries developing nations on industrial countries
During 1990s, developing countries’ During 1990s, developing countries’
merchandise exports increased at an annual merchandise exports increased at an annual
rate of 8.5%rate of 8.5%Merchandise exports, % of GDPMerchandise exports, % of GDP
Source: World BankSource: World BankContd…Contd…
Export-GDP ratios Export-GDP ratios
risen sharply within risen sharply within
a decade in a decade in
developing developing
countries from less countries from less
than 15% to 25% in than 15% to 25% in
2002 2002
Drastic changes in Drastic changes in
sectoral and sectoral and
regional regional
composition of trade composition of trade

Trade Trade & & Developing Developing CountriesCountries
Change in composition of exports – major Change in composition of exports – major factor underpinning export growthfactor underpinning export growth
Manufactures grew to 80% of exports from Manufactures grew to 80% of exports from South AsiaSouth Asia
Growth fastest where share of manufactured Growth fastest where share of manufactured products in total exports was already largeproducts in total exports was already large
Source: World BankSource: World Bank
Driving forces: Driving forces: Policy reformsPolicy reforms
Structural changes Structural changes
in global production in global production
process process
Economic trends Economic trends
related to increases related to increases
in real per capita in real per capita
incomesincomes
Contd…Contd…
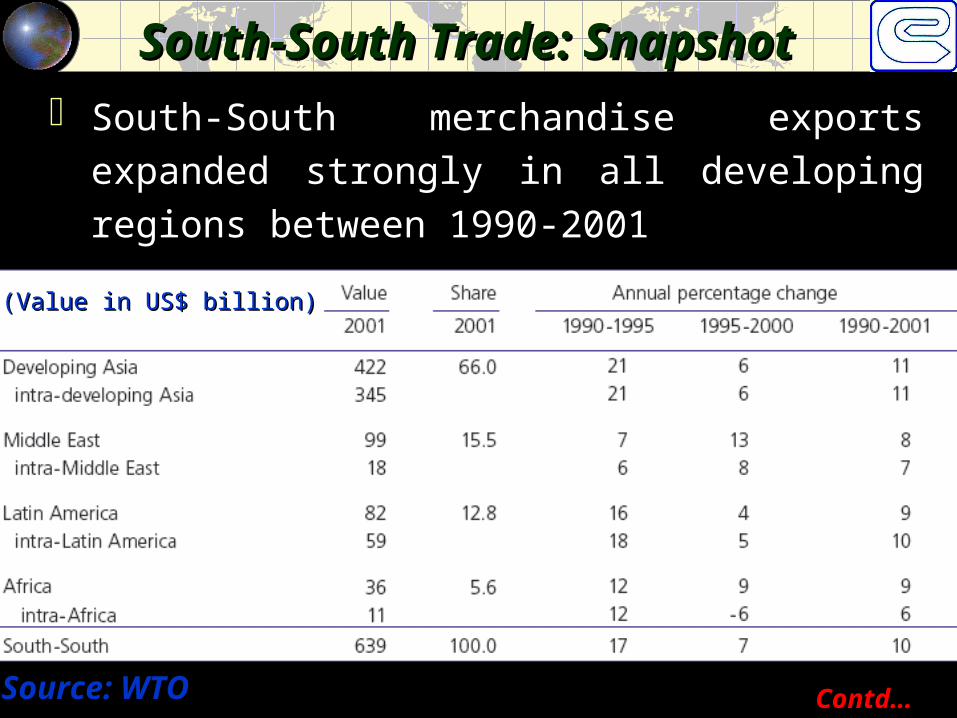
South-South Trade: SnapshotSouth-South Trade: Snapshot South-South merchandise exports expanded South-South merchandise exports expanded
strongly in all developing regions between strongly in all developing regions between
1990-2001 1990-2001
Contd…Contd…Source: WTOSource: WTO
(Value in US$ billion)(Value in US$ billion)

South-South TradeSouth-South Trade South-South trade promoted as: -South-South trade promoted as: -
Means to reduce the dependence of Means to reduce the dependence of developing countries on markets of developed developing countries on markets of developed countries countries
Enhance diversification of Southern exports Enhance diversification of Southern exports beyond primary commoditiesbeyond primary commodities
South-South trade rose from US$ 219 bn. in South-South trade rose from US$ 219 bn. in
1990 to US$ 640 bn. in 2001 – twice as fast as 1990 to US$ 640 bn. in 2001 – twice as fast as
world trade (10% versus 5%)world trade (10% versus 5%)
Share of intra-developing country trade in Share of intra-developing country trade in
world merchandise exports rose from 6.5% to world merchandise exports rose from 6.5% to
10.7% during this period10.7% during this period
Primary reason – Positive growth performance Primary reason – Positive growth performance
of developing nations in the 1990sof developing nations in the 1990sContd…Contd…

South-South TradeSouth-South Trade Share of developing country exports to Share of developing country exports to
other developing countries rose from other developing countries rose from
28% to 37% of their total exports 28% to 37% of their total exports
during the same periodduring the same period
The figures in case of imports were The figures in case of imports were
31% & 41% 31% & 41%
Much of the expansion in South-South Much of the expansion in South-South
trade took place in developing Asia trade took place in developing Asia
This high share reflects the relatively This high share reflects the relatively
large size of the developing markets in large size of the developing markets in
AsiaAsiaContd…Contd…

South-South TradeSouth-South Trade Share of developing Asia in intra-Share of developing Asia in intra-
developing country exports rose from developing country exports rose from
60% in 1990 to 66% in 200160% in 1990 to 66% in 2001
Developing Asia accounted for more than Developing Asia accounted for more than
two-thirds of total intra-developing two-thirds of total intra-developing
country importscountry imports
Contd…Contd…
perc
enta
gepe
rcen
tage
Source: WTOSource: WTO

South-South TradeSouth-South Trade
Trade in manufactured goods – most dynamic Trade in manufactured goods – most dynamic
component of intra-developing country component of intra-developing country
merchandise exports – expanded by 12% merchandise exports – expanded by 12%
annually during 1990sannually during 1990s
Agricultural trade expanded at only half that Agricultural trade expanded at only half that
rate; mining products (mainly fuels) averaged rate; mining products (mainly fuels) averaged
9%9%
Impediments still exist – high levels of tariff Impediments still exist – high levels of tariff
protection & non-tariff barriersprotection & non-tariff barriers
Persistence of these barriers suggests the Persistence of these barriers suggests the
potential for further trade liberalization and potential for further trade liberalization and
consequent expansion of South-South trade.consequent expansion of South-South trade.
Contd…Contd…

Increasing importance of international trade for Increasing importance of international trade for
IndiaIndia
Trade-GDP ratio increased from 13% in 1990-91 to Trade-GDP ratio increased from 13% in 1990-91 to
over 22% in 2002-03over 22% in 2002-03
Unit value index of exports increased from 292.5 to Unit value index of exports increased from 292.5 to
618.0 during the same period (1978-79=100)618.0 during the same period (1978-79=100)
Share in world merchandise exports increased from Share in world merchandise exports increased from
0.6% in 1995 to 0.8% in 20020.6% in 1995 to 0.8% in 2002
Share in world services trade increased to 1.3%Share in world services trade increased to 1.3%
Exports in 2002-03 amounted to US$ 52.2 bn. while Exports in 2002-03 amounted to US$ 52.2 bn. while
imports stood at US$ 61.3 bn. (growth of 19.2 % imports stood at US$ 61.3 bn. (growth of 19.2 %
each)each)
Contd…Contd…
India’s External TradeIndia’s External Trade

India’s External TradeIndia’s External Trade India’s exports increased from less than India’s exports increased from less than
US$ 25 bn. in 1993-94 to over US$ 50 bn. in US$ 25 bn. in 1993-94 to over US$ 50 bn. in
2002-032002-03
Imports during the same period increased Imports during the same period increased
from US$ 23 bn. to over US$ 60 bn.from US$ 23 bn. to over US$ 60 bn.
Contd…Contd…
43.8
51.4
42.4
61.3
28.7
36.739.2 41.5
49.7 50.4
23.3 26.3
36.833.231.8 33.5
44.6
35
52.2
22.2
0
10
20
30
40
50
60
70
1993-94 1994-95 1995-96 1996-97 1997-98 1998-99 1999-00 2000-01 2001-02 2002-03
Imports Exports
US$ billion
Source: Ministry of Commerce & IndustrySource: Ministry of Commerce & Industry

0.00
2.00
4.00
6.00
8.00
10.00
12.00U
S$ b
n.
2000-01 20001-02 2002-03
India’s export basket – 2000-01 to India’s export basket – 2000-01 to
2002-032002-03
Contd…Contd…
India’s External TradeIndia’s External Trade
Source: Ministry of Commerce & IndustrySource: Ministry of Commerce & Industry

Asia & Oceania – share of 43% in 2002-03Asia & Oceania – share of 43% in 2002-03
Western Europe & America – share of 48%Western Europe & America – share of 48%
Contd…Contd…
India’s External TradeIndia’s External Trade
Source: Ministry of Commerce & IndustrySource: Ministry of Commerce & Industry
0.0
5.0
10.0
15.0
20.0
25.0
30.0
35.0
40.0
45.0
Per
cent
1998-99
1999-2000
2000-01
2001-02
2002-03

The study outlines an analytical approach for The study outlines an analytical approach for
achieving a significant increase in India's exportsachieving a significant increase in India's exports
Focuses on Africa, Latin America & China which Focuses on Africa, Latin America & China which
together imported about US$ 760 bn. in 2001 together imported about US$ 760 bn. in 2001
(about 12% of global imports)(about 12% of global imports)
Estimates that India could aim to achieve Estimates that India could aim to achieve
cumulative exports of US$ 24 bn. to these regions cumulative exports of US$ 24 bn. to these regions
by 2007 – up from US$ 4.7 bn. in 2001; Agriculture by 2007 – up from US$ 4.7 bn. in 2001; Agriculture
to account for US$ 7 bn. of this incremental exportto account for US$ 7 bn. of this incremental export
Free Trade Agreement (FTA) with Thailand – Free Trade Agreement (FTA) with Thailand –
significant step towards global integrationsignificant step towards global integration
Reported FTA with China would further reinforce Reported FTA with China would further reinforce
thisthis
Achieving Global Achieving Global IntegrationIntegration

India’s Agri ExportsIndia’s Agri Exports
India’s share in global agriculture exports – 1.1% India’s share in global agriculture exports – 1.1%
Marine products have led the way in India’s agri Marine products have led the way in India’s agri
exportsexports
Value addition in India is low at 7% as against 23% in Value addition in India is low at 7% as against 23% in
China, 45% in Philippines and 188% in U.K. respectively China, 45% in Philippines and 188% in U.K. respectively
((Source: CII-McKinseySource: CII-McKinsey))
The emerging WTO regime offers considerable scope for The emerging WTO regime offers considerable scope for
export of Indian agricultural products to the global export of Indian agricultural products to the global
marketsmarkets
Year Value (US$ bn) Growth (%) Share (%)
2000-01 5.92 5.63 13.29
2001-02 5.89 -0.56 13.44
2002-03 6.40 8.64 12.25
India's Exports of Agriculture & Allied Porducts
Contd…Contd…

India’s Agri ExportsIndia’s Agri ExportsAGRI EXPORT ZONESAGRI EXPORT ZONES AEZ – centered around a cluster approach AEZ – centered around a cluster approach
Identifying the potential products, Identifying the potential products, Geographical region in which these are grownGeographical region in which these are grown Adopting an end to end approach of integrating Adopting an end to end approach of integrating
the entire process right from the stage of the entire process right from the stage of production till it reaches the marketproduction till it reaches the market
52 AEZs already notified; e.g.52 AEZs already notified; e.g.
PRODUCT STATE
Durum Wheat Madhya Pradesh
Mango Maharashtra
Potato Punjab
Medicinal Plants Uttaranchal
Flowers Tamil Nadu
Ginger Sikkim

World Agriculture TradeWorld Agriculture Trade About 73% of poor in developing countries live in rural About 73% of poor in developing countries live in rural
areas – rural development central to alleviating povertyareas – rural development central to alleviating poverty
During the 1990s 56% of the growth of developing During the 1990s 56% of the growth of developing
country (DC) agri trade accounted for by sales to other country (DC) agri trade accounted for by sales to other
DCsDCs
DCs lost export market share during the 1980s, but DCs lost export market share during the 1980s, but
reversed that trend in the 1990sreversed that trend in the 1990s
International markets important to sustained income International markets important to sustained income
growth in DCsgrowth in DCs
High border protection in rich countries frustrates High border protection in rich countries frustrates
developmentdevelopment
Evolving structure of agri trade: toward nontraditional Evolving structure of agri trade: toward nontraditional
products with lower rates of protectionproducts with lower rates of protection
Contd…Contd…
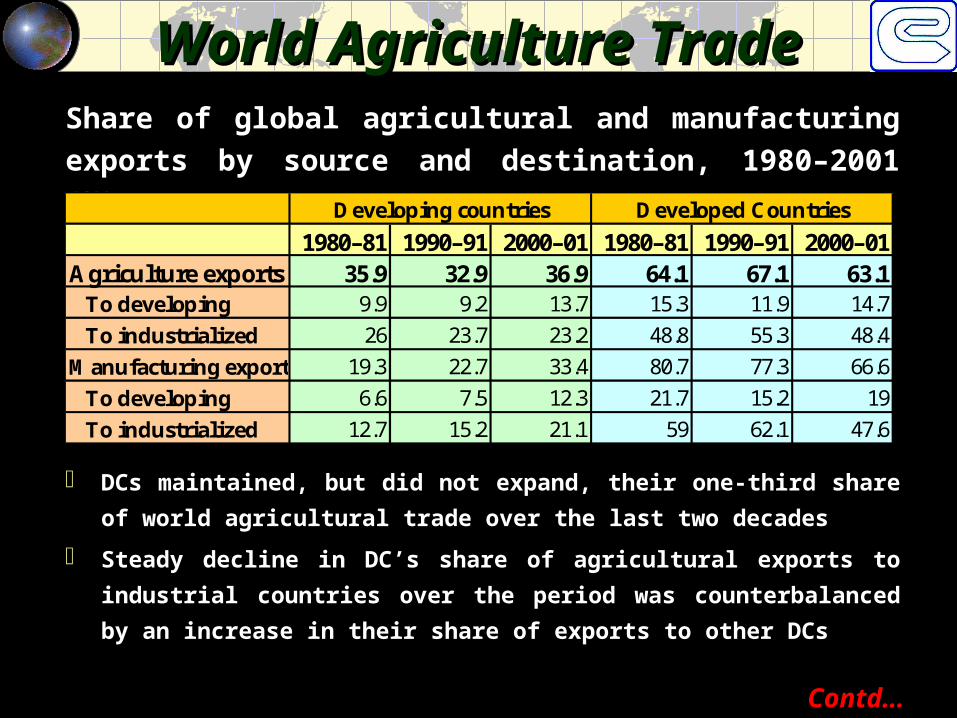
World Agriculture TradeWorld Agriculture Trade
DCs maintained, but did not expand, their one-third share DCs maintained, but did not expand, their one-third share
of world agricultural trade over the last two decadesof world agricultural trade over the last two decades
Steady decline in DC’s share of agricultural exports to Steady decline in DC’s share of agricultural exports to
industrial countries over the period was counterbalanced industrial countries over the period was counterbalanced
by an increase in their share of exports to other DCsby an increase in their share of exports to other DCs
Share of global agricultural and manufacturing Share of global agricultural and manufacturing
exports by source and destination, 1980–2001 (%)exports by source and destination, 1980–2001 (%)
Contd…Contd…
1980–81 1990–91 2000–01 1980–81 1990–91 2000–01Agriculture exports 35.9 32.9 36.9 64.1 67.1 63.1
To developing 9.9 9.2 13.7 15.3 11.9 14.7
To industrialized 26 23.7 23.2 48.8 55.3 48.4
Manufacturing exports 19.3 22.7 33.4 80.7 77.3 66.6
To developing 6.6 7.5 12.3 21.7 15.2 19
To industrialized 12.7 15.2 21.1 59 62.1 47.6
Developing countries Developed Countries

Global GDP, Total Exports & Agricultural Export Growth TrendGlobal GDP, Total Exports & Agricultural Export Growth Trend
-10.0
-5.0
0.0
5.0
10.0
15.0
20.0
25.0
1992 1993 1994 1995 1996 1997 1998 1999 2000 2001 2002
Per
centf
Total Exports Agriculture Exports GDP
Source: International Trade Statistics 2003, WTO
World Agriculture World Agriculture TradeTrade
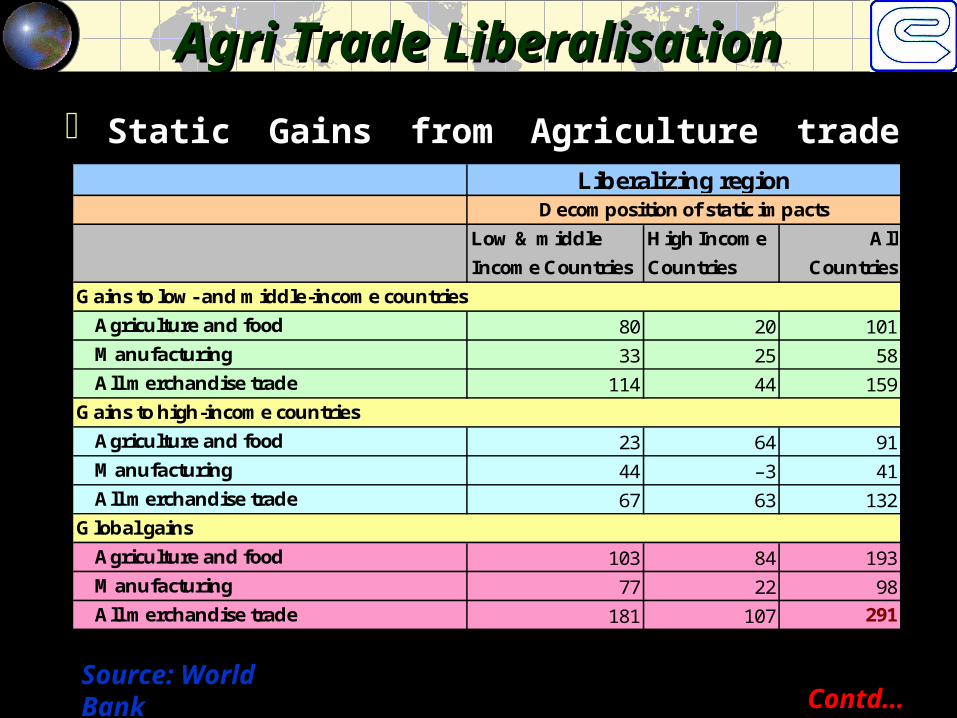
Agri Trade LiberalisationAgri Trade Liberalisation
Static Gains from Agriculture trade Static Gains from Agriculture trade
liberalisationliberalisation
Source: World BankSource: World BankContd…Contd…
Low & middle
Income Countries
High Income
Countries
All
Countries
Agriculture and food 80 20 101
Manufacturing 33 25 58
All merchandise trade 114 44 159
Agriculture and food 23 64 91
Manufacturing 44 –3 41
All merchandise trade 67 63 132
Agriculture and food 103 84 193
Manufacturing 77 22 98
All merchandise trade 181 107 291
Decomposition of static impacts
Liberalizing region
Gains to low- and middle-income countries
Gains to high-income countries
Global gains

Agri Trade LiberalisationAgri Trade Liberalisation
Dynamic Gains from Agriculture trade Dynamic Gains from Agriculture trade
liberalisationliberalisation
Source: World BankSource: World BankContd…Contd…
Low & middle
Income Countries
High Income
Countries
All
Countries
Agriculture and food 167 75 240
Manufacturing 95 9 108
All merchandise trade 265 85 349
Agriculture and food 19 100 117
Manufacturing 36 13 48
All merchandise trade 55 115 169
Agriculture and food 185 174 358
Manufacturing 131 22 156
All merchandise trade 321 199 518
Decomposition of dynamic impacts
Gains to low- and middle-income countries
Gains to high-income countries
Global gains
Liberalizing region
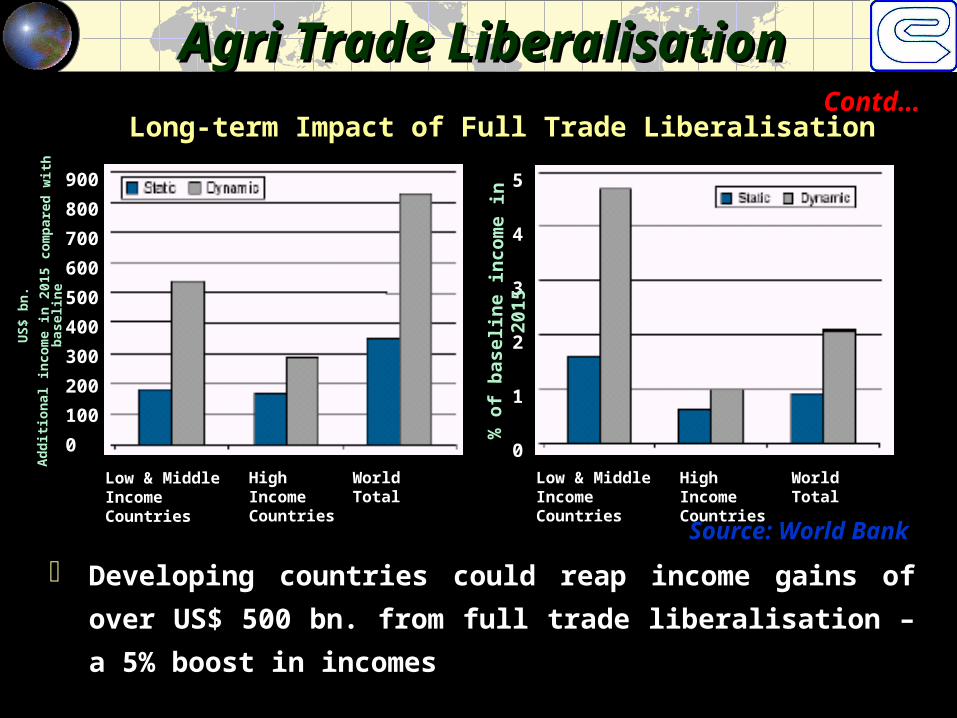
Long-term Impact of Full Trade LiberalisationLong-term Impact of Full Trade Liberalisation
Developing countries could reap income gains of Developing countries could reap income gains of
over US$ 500 bn. from full trade liberalisation – a over US$ 500 bn. from full trade liberalisation – a
5% boost in incomes5% boost in incomes
900
800
700
600
500
400
300
200
100
0
5
4
3
2
1
0
Low & Middle Income Countries
Low & Middle Income Countries
High Income Countries
World Total High Income Countries
World Total
Source: World Bank Source: World Bank
US$
bn.
Add
iti o
nal i
ncom
e in
201
5 co
mpa
red
wit
h ba
seli n
e
% o
f b
a sel
ine
inco
me
in 2
015
Contd…Contd…
Agri Trade LiberalisationAgri Trade Liberalisation

Reduction of trade barriers in agriculture Reduction of trade barriers in agriculture
& food yield US$ 193 billion in 2015& food yield US$ 193 billion in 2015
More than 50% of these gains in More than 50% of these gains in
agriculture and food are reaped by agriculture and food are reaped by
developing countriesdeveloping countries
Reform of agriculture & food in rich Reform of agriculture & food in rich
countries would lead to a gain of US$ 20 countries would lead to a gain of US$ 20
billion for developing countries as a wholebillion for developing countries as a whole
South-South trade to become a strategic South-South trade to become a strategic
necessity for the countries of the South necessity for the countries of the South
For India, broad-basing the market canvas For India, broad-basing the market canvas
becomes imperativebecomes imperative
Contd…Contd…
Agri Trade LiberalisationAgri Trade Liberalisation
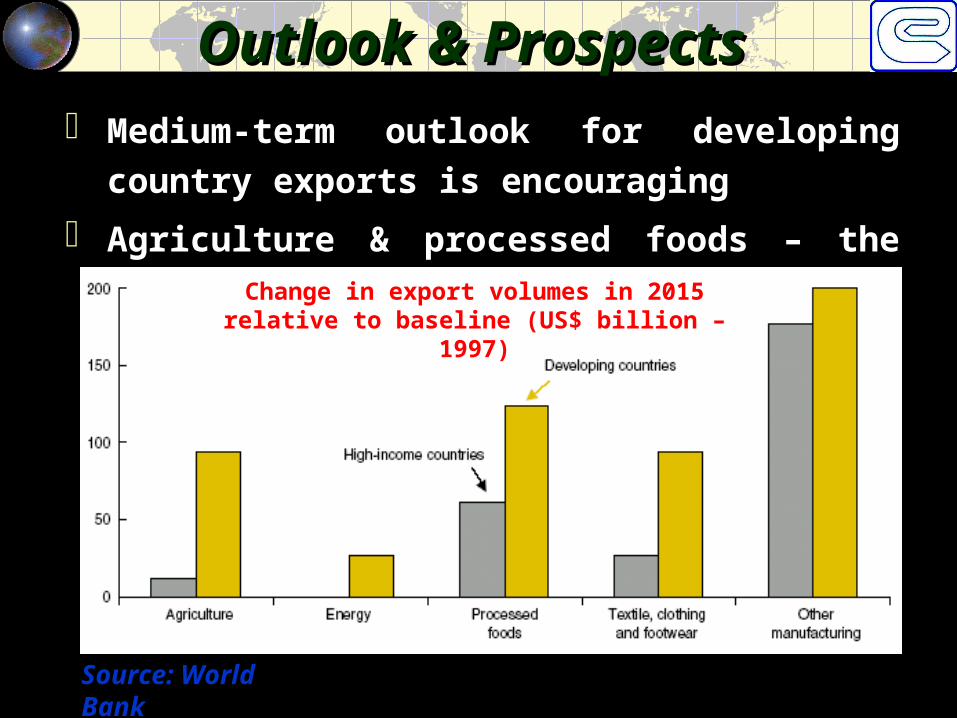
Outlook Outlook && Prospects Prospects Medium-term outlook for developing Medium-term outlook for developing
country exports is encouragingcountry exports is encouraging
Agriculture & processed foods – the Agriculture & processed foods – the
future starsfuture starsChange in export volumes in 2015 relative to baseline (US$ billion – 1997)
Source: World BankSource: World Bank

THANK YOU
EXIM EXIM BANKBANK
IPC SEMINAR IPC SEMINAR && MEETING MEETING