Embed Size (px)
Citation preview
0
1
Table of Contents 1.0 – Executive Summary……………………………………………………………….………………… P. 2
2.0 – TJX Overview……………………………………………………………......……….………………… P. 2
2.1 Business Segmentation………………………......……….………………..……………… P. 2
2.2 Corporate Social Responsibility………………………......………….………………… P. 3
2.3 TJX Stock Performance………………………......……….………………………...……… P. 3
2.4 Consolidated Performance………………………......……….………………...………… P. 4
2.5 Advantages of TJX………………………......……….…………………………………..…… P. 5
2.6 Recent News………………………......……….…………………………………..…………… P. 6
a. Domestic and International Store Expansion………………………………...…… P. 6
b. Strong Q3 FY11 Sales and EPS Growth…………………………........……………… P. 6
3.0 – Industry Analysis………………………......……….…………………………………...…………… P. 6
4.0 - Ratio Analysis………………………......……….………………………………………...…………… P. 10
4.1 Cash Flow………………………….………………………………………………………..………… P. 10
4.2 Profitability………………………........................................................……….………………… P. 14
4.3 Liquidity………………………………………………………………….....……….………………… P. 17
4.4 Efficiency……………………………………………………………….......……….………………… P. 18
4.5 Long-term Solvency…………………………………………………....……….………………… P. 19
4.6 DuPont Analysis………………………................................................……….………………… P. 21
5.0 – Earning Forecast………………………......……….…………………………………….…………… P. 23
6.0 – Relative Valuation………………………......…………………………………..….………………… P. 25
7.0 – Absolute Valuation………………………......…………………………………….………………… P. 27
8.0 Conclusion………………………......……….………………………………………………..…………… P. 29
9.0 Bibliography………………………......……….………………………………………………..………… P. 30
2
1. Executive Summary After analyzing TJX and its position within the overall Retail industry, we find sufficient support to believe that this company is a worthwhile investment and thus recommend it as an addition to the St. John’s University Graduate Student Managed Investment Fund portfolio. This decision is based upon: the strength of the company in comparison to its peers and the Retail industry as a whole through ratio analysis, relative valuation’s indication of value, absolute valuation’s indication of value, macro analysis of the economy, current happenings within the company, and the analysis of future trends. This report will serve to support our recommendation to purchase shares of TJX as it is currently a viable option and will be a fruitful investment in the future.
2. TJX Overview The TJX Companies, Inc. (TJX) was founded in 1976 in Massachusetts as an off-price retailer of apparel and home fashions. The company has grown over the past three decades into a world leader and engaged in a series of mergers and acquisitions in the process. As of fiscal 2010, TJX operates eight off-price retail chains, including T.J. Maxx, Marshalls, HomeGoods, A.J. Wright, Winners, HomeSense( in Canada), T.K. Maxx and Homesense( in the U.K. ) with over 2,700 locations in the US, Canada, and Europe.
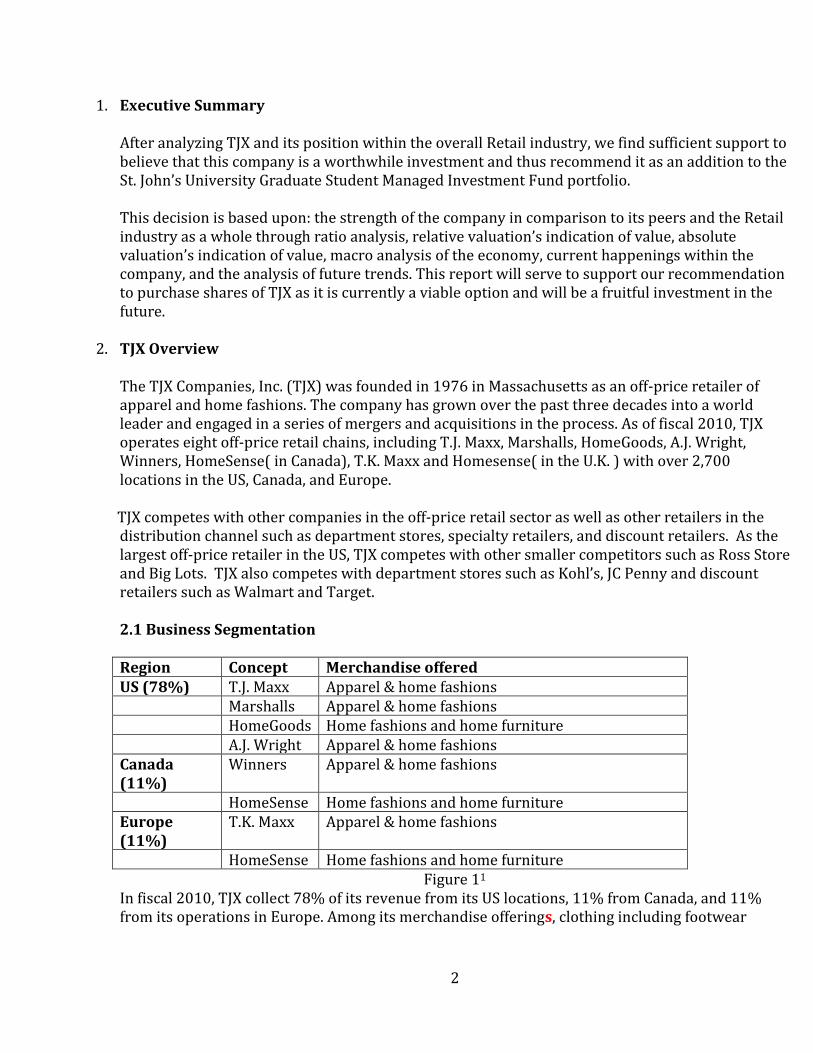
TJX competes with other companies in the off-price retail sector as well as other retailers in the distribution channel such as department stores, specialty retailers, and discount retailers. As the largest off-price retailer in the US, TJX competes with other smaller competitors such as Ross Store and Big Lots. TJX also competes with department stores such as Kohl’s, JC Penny and discount retailers such as Walmart and Target. 2.1 Business Segmentation Region Concept Merchandise offered US (78%) T.J. Maxx Apparel & home fashions Marshalls Apparel & home fashions HomeGoods Home fashions and home furniture A.J. Wright Apparel & home fashions Canada (11%)
Winners Apparel & home fashions
HomeSense Home fashions and home furniture Europe (11%)
T.K. Maxx Apparel & home fashions
HomeSense Home fashions and home furniture Figure 11
In fiscal 2010, TJX collect 78% of its revenue from its US locations, 11% from Canada, and 11% from its operations in Europe. Among its merchandise offerings, clothing including footwear
3
accounts for 61% of total revenue, while home fashions accounts for 26% and jewelries and accessories accounts for 13%. 2.2 Corporate Social Responsibility “Since The TJX Companies’ Inception, delivering value to their customers has been their mission, valuing their associates has been at their core, returning value to their shareholders has been a constant priority and adding value to their communities has been a central pursuit. Above all else, their corporate value has always been acting with integrity, which informs everything they do.” ( TJX 10K 2010) So as TJX grows, they introduce their global Corporate Social Responsibility program. V.A.L.U.E ! Each letter in the word stands for one of the five tenets of social responsibility for TJX. Those areas are: Vendor Social Compliance, Attention to Governance, Leveraging Differences, United with Our Communities, and Environmental Initiatives. This Program is aimed at helping TJX continue to make a positive, sustainable impact within these areas which they believe are key to business and the interests of their shareholders, Associates, customers, vendors and communities. 2.3 TJX Stock Performance
Figure 22
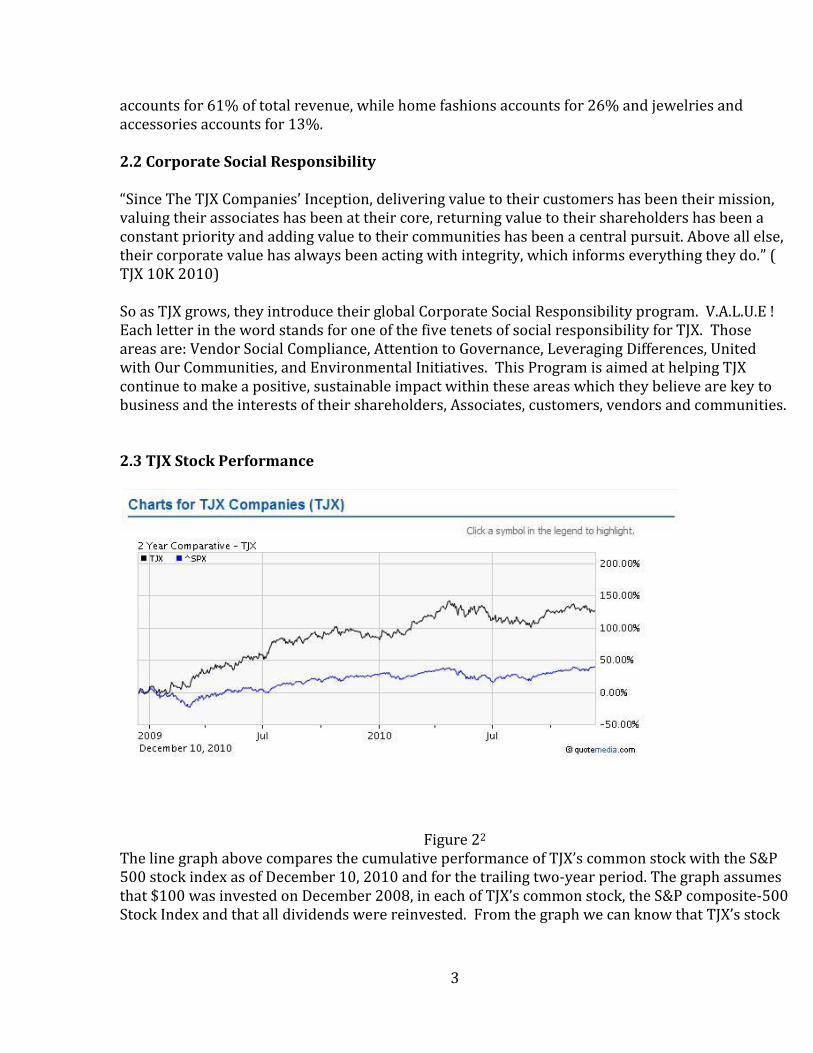
The line graph above compares the cumulative performance of TJX’s common stock with the S&P 500 stock index as of December 10, 2010 and for the trailing two-year period. The graph assumes that $100 was invested on December 2008, in each of TJX’s common stock, the S&P composite-500 Stock Index and that all dividends were reinvested. From the graph we can know that TJX’s stock
4
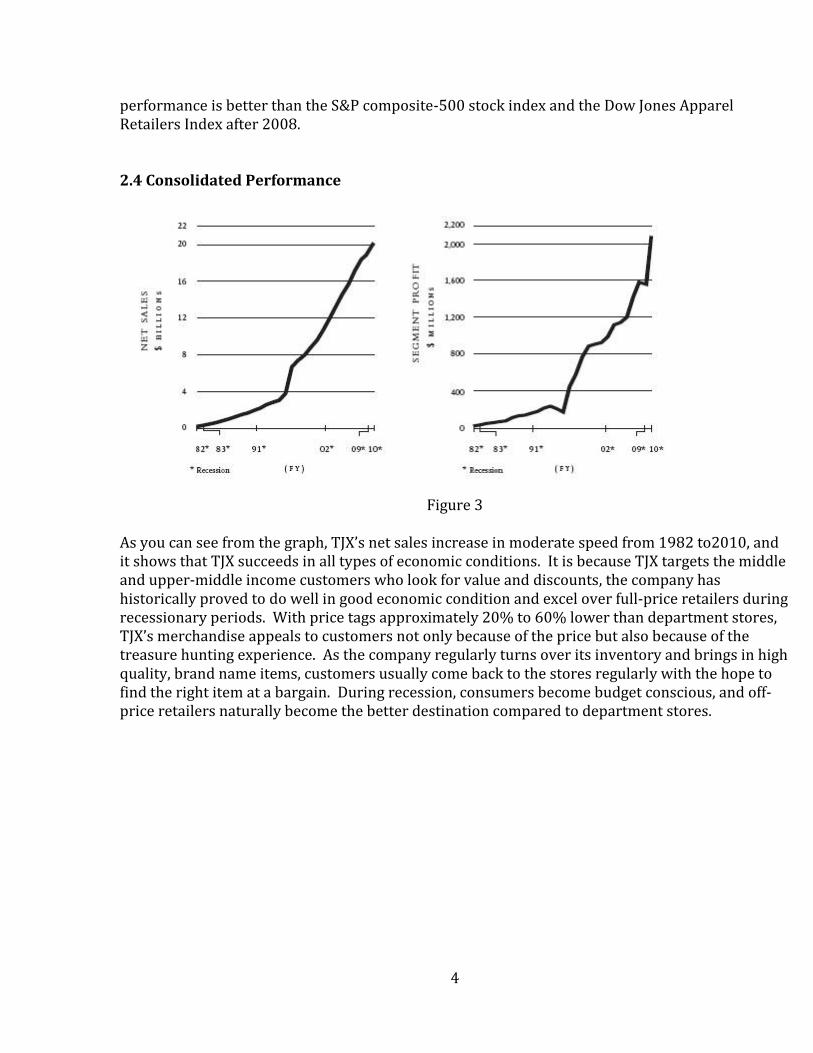
performance is better than the S&P composite-500 stock index and the Dow Jones Apparel Retailers Index after 2008. 2.4 Consolidated Performance
Figure 3
As you can see from the graph, TJX’s net sales increase in moderate speed from 1982 to2010, and it shows that TJX succeeds in all types of economic conditions. It is because TJX targets the middle and upper-middle income customers who look for value and discounts, the company has historically proved to do well in good economic condition and excel over full-price retailers during recessionary periods. With price tags approximately 20% to 60% lower than department stores, TJX’s merchandise appeals to customers not only because of the price but also because of the treasure hunting experience. As the company regularly turns over its inventory and brings in high quality, brand name items, customers usually come back to the stores regularly with the hope to find the right item at a bargain. During recession, consumers become budget conscious, and off-price retailers naturally become the better destination compared to department stores.
5
2.5 Advantages of TJX The most important strategies that TJX’s management implements, are opportunistic buying, flexible flooring space, low cost operations, efficient inventories management, and scale. TJX buys excess inventories from a network of 10,000 vendors every year. Due to the unpredictable consumers demand in the apparel and home fashions industry, there are constant opportunities for TJX to purchase merchandise at huge discount. By maintaining excellent vendor relationships, TJX is able to catch the opportunities and work with the vendors who are in need of selling excess inventories at the right time. This opportunistic buying allows TJX to obtain high quality, brand name merchandise at wholesale prices and to offer deep discounts to consumers. By focusing on discount price tag, TJX appeals to a large customer base in both good and bad economy. Efficient inventories management is another successful strategy. TJX’s merchants are on the market virtually every week, buying for the current season. This allows TJX stores to update merchandise on a weekly basis. This is the value that regular department store and specialty stores could not provide. Customers also love the treasure hunting experience created by this quick inventory replacing. They pay more visits to the stores, knowing there would be different merchandise than those they saw during the last visit. This definitely helps TJX compete well not only with full-price retailers but also other off-price retailers. Not all off-price retailers can offer the same speed of inventory turnover Low cost operations fit perfectly into TJX’s business model. Throughout its business operation, TJX focuses on expenses control. The store has low advertising budget compared to traditional stores. TJX also does not spend heavily on store fixtures and design. Instead, the stores have flexible layout without walls and separation, allowing quick changes in quantities within each department according to consumers’ demand. This allows TJX to compete even better in the discount segment; low operations cost translate to low price tag. As the nation’s leader, TJX has already established its brand exposure among consumers and low advertising budget strategy works perfectly well for the company. Last but not least, TJX benefit from its scale. As part of its strategy, TJX operates more than 2,700 stores in North America and Europe, allowing it to enhance its brand name without heavily investing in advertising. More importantly, its scale helps amplify its low margin into profit and helps TJX maintain low margin as a strong selling point to attract customers. This proved to be a huge advantage over smaller off-price retailers.
6
2.6 Recent News
a. Domestic and International Store Expansion “Leading the charge is the off-price retailer TJ Maxx, with new stores under construction on East 59th Street and on West 57th Street near the Time Warner Center. The company is also in discussions for a third location, at 14 Wall Street, according to brokers who did not want to be quoted by name because the lease was not yet completed. The company had a single store in Manhattan, at Sixth Avenue and 18th Street, until last year when it opened an outpost at 100th Street and Columbus Avenue on the Upper West Side. “ (
Besides, TJX Cos. will open six Marshalls Stores in Canada in 2011 with more possible in the long term.4
“Now is the right time for our company to be expanding,” said Sherry Lang, a spokeswoman for TJ Maxx, which has 890 stores nationwide. “We have done better than other retailers in the past one-and-one-half years, and we do think that value is here to stay.” b. Strong Q3 FY11 Sales and EPS Growth On Nov. 16, TJX announced that for the first nine months of fiscal 2011, net sales were $15.6 billion, a 9% increase over last year, and consolidated comparable store sales increased 4% over last year. Adjusted diluted EPS for the first nine months of Fiscal 2011 were $2.45, a 28% increase over the prior year. Carol Meyrowitz, President and Chief Executive Officer of The TJX Companies, Inc., stated, “I am very pleased with our third quarter overall performance, which exceeded the high end of our expectations. Earnings per share increased 14% on top of 40% EPS growth last year, demonstrating our ability to continue to grow earnings even against challenging comparisons. Importantly, we were able to sustain last year’s significant increase in profit margin by continuing to run our business with lean inventories, which has led to additional improvement in merchandise margins.”5
3. Industry Analysis
Retailing industry As most of our class agreed, the U.S. economy is gradually emerging from the deep recession. For 2011, Standard & Poor’s economists are projecting real gross domestic product (GDP) and consumer spending to increase 2.5% and 2.3%, respectively.
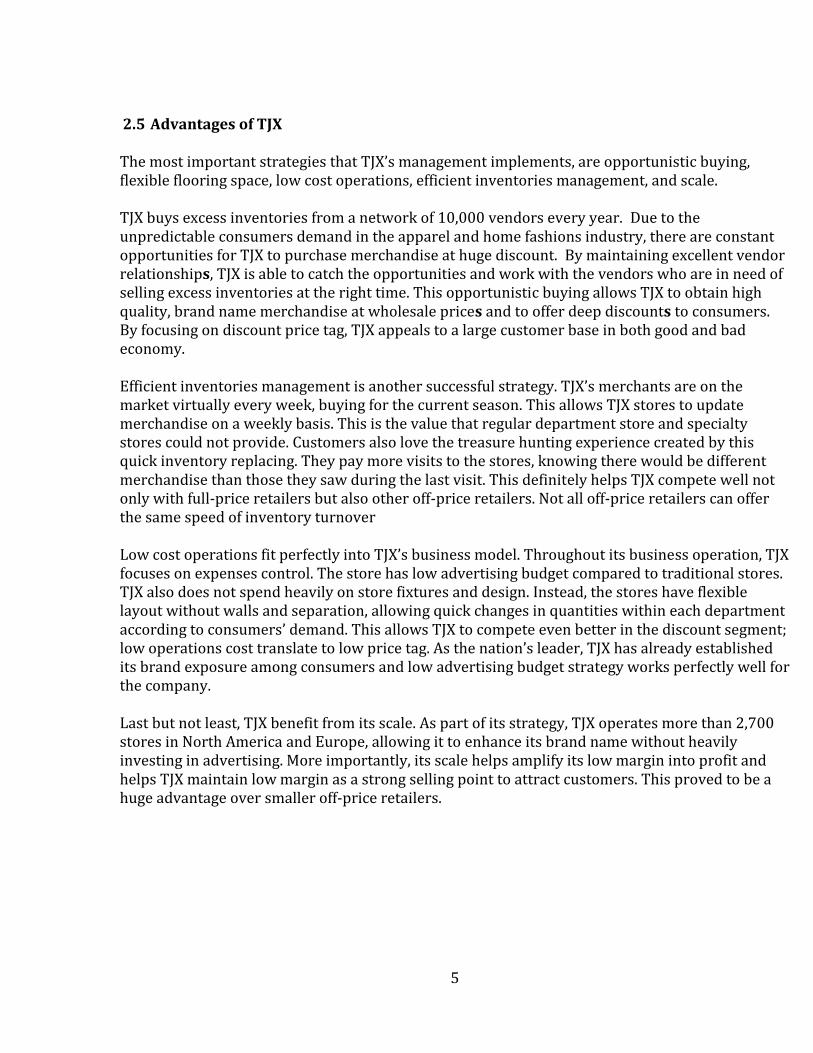
According data issued by U.S. Census Bureau, Retail industry’s revenues increased gradually from Jan, 2001 to Jan, 2009, but was down 4.583% in Jan, 2010 because of economic crisis.
7
TJX’s fiscal year is ending in January.
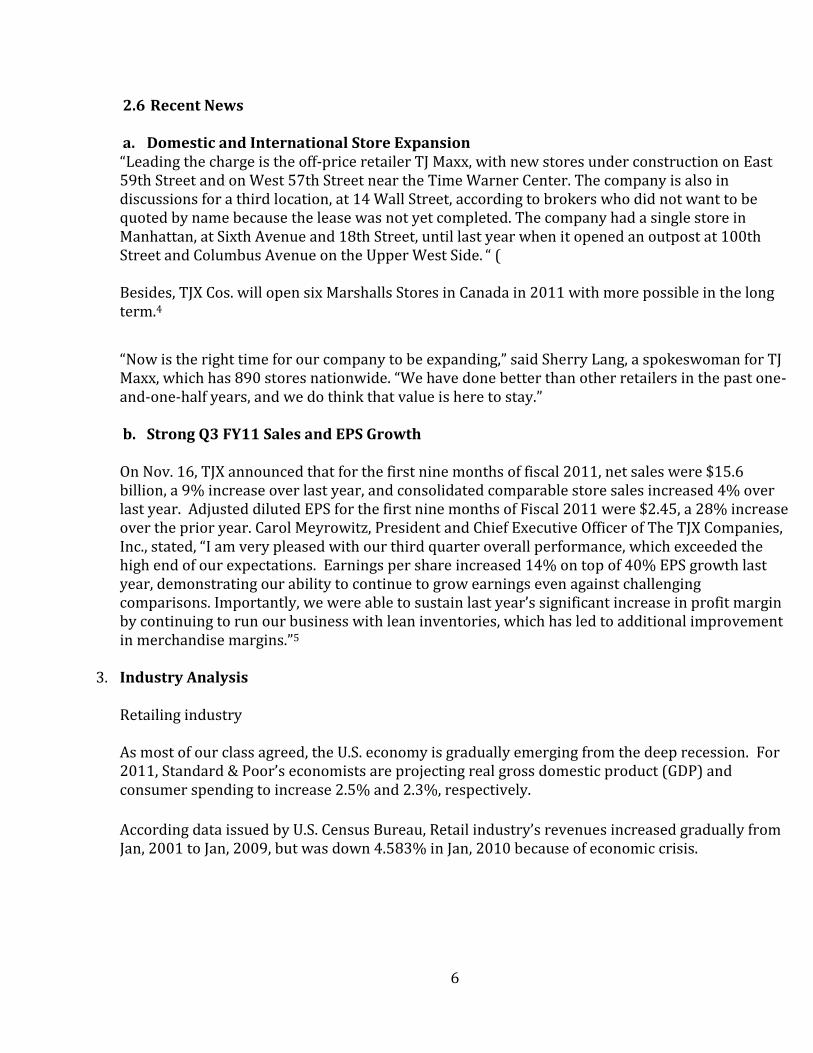
Figure 4
According to US department of commerce, the retail industry revenue has better performance than prior year, although it doesn’t reach the previous level. But as the S&P analysis shows that the recession hit department stores harder than discounters, as consumers made mostly need-based purchases. Consumers can live without new fashion
8
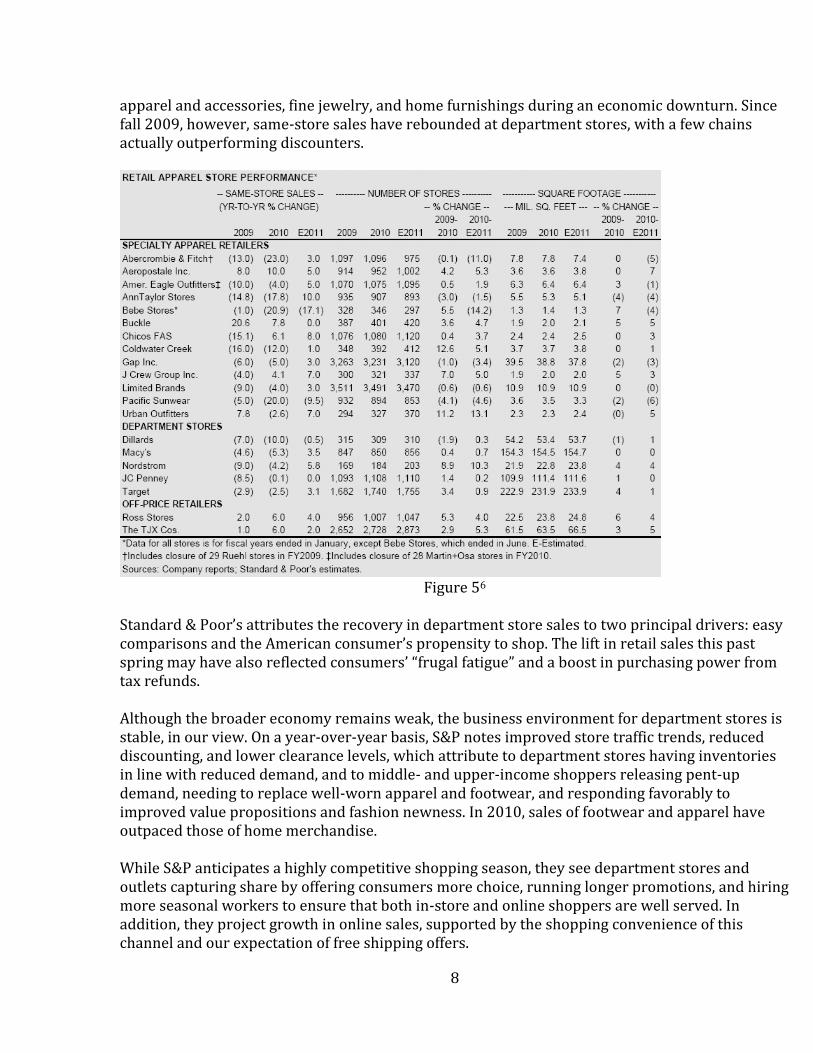
apparel and accessories, fine jewelry, and home furnishings during an economic downturn. Since fall 2009, however, same-store sales have rebounded at department stores, with a few chains actually outperforming discounters.
Figure 56
Standard & Poor’s attributes the recovery in department store sales to two principal drivers: easy comparisons and the American consumer’s propensity to shop. The lift in retail sales this past spring may have also reflected consumers’ “frugal fatigue” and a boost in purchasing power from tax refunds. Although the broader economy remains weak, the business environment for department stores is stable, in our view. On a year-over-year basis, S&P notes improved store traffic trends, reduced discounting, and lower clearance levels, which attribute to department stores having inventories in line with reduced demand, and to middle- and upper-income shoppers releasing pent-up demand, needing to replace well-worn apparel and footwear, and responding favorably to improved value propositions and fashion newness. In 2010, sales of footwear and apparel have outpaced those of home merchandise. While S&P anticipates a highly competitive shopping season, they see department stores and outlets capturing share by offering consumers more choice, running longer promotions, and hiring more seasonal workers to ensure that both in-store and online shoppers are well served. In addition, they project growth in online sales, supported by the shopping convenience of this channel and our expectation of free shipping offers.
9
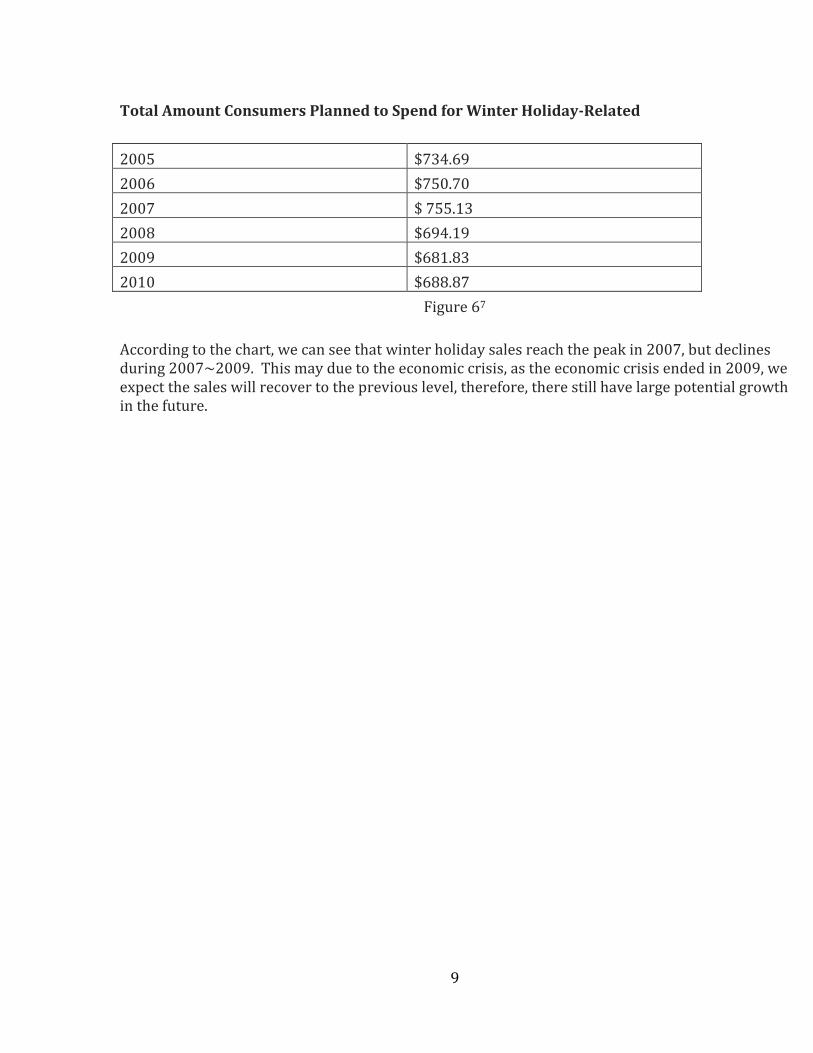
Total Amount Consumers Planned to Spend for Winter Holiday-Related
2005 $734.69
2006 $750.70
2007 $ 755.13
2008 $694.19
2009 $681.83
2010 $688.87
Figure 67
According to the chart, we can see that winter holiday sales reach the peak in 2007, but declines during 2007~2009. This may due to the economic crisis, as the economic crisis ended in 2009, we expect the sales will recover to the previous level, therefore, there still have large potential growth in the future.
10
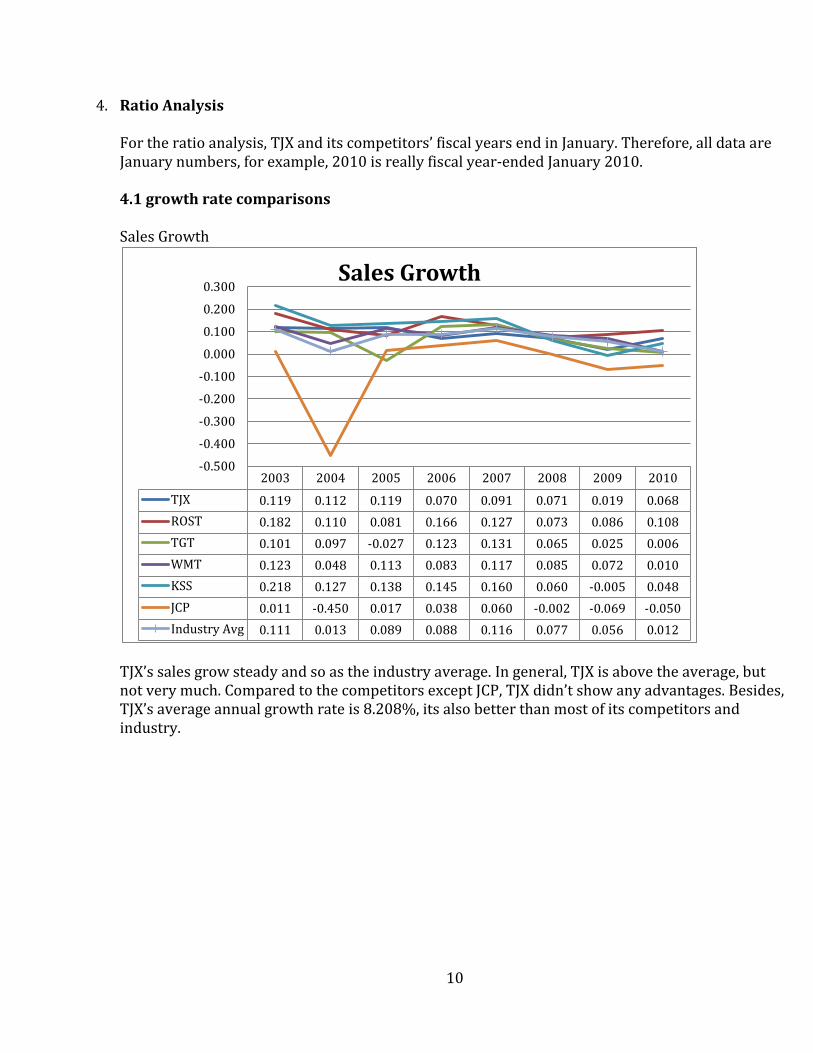
4. Ratio Analysis For the ratio analysis, TJX and its competitors’ fiscal years end in January. Therefore, all data are January numbers, for example, 2010 is really fiscal year-ended January 2010. 4.1 growth rate comparisons Sales Growth
TJX’s sales grow steady and so as the industry average. In general, TJX is above the average, but not very much. Compared to the competitors except JCP, TJX didn’t show any advantages. Besides, TJX’s average annual growth rate is 8.208%, its also better than most of its competitors and industry.
2003 2004 2005 2006 2007 2008 2009 2010
TJX 0.119 0.112 0.119 0.070 0.091 0.071 0.019 0.068
ROST 0.182 0.110 0.081 0.166 0.127 0.073 0.086 0.108
TGT 0.101 0.097 -0.027 0.123 0.131 0.065 0.025 0.006
WMT 0.123 0.048 0.113 0.083 0.117 0.085 0.072 0.010
KSS 0.218 0.127 0.138 0.145 0.160 0.060 -0.005 0.048
JCP 0.011 -0.450 0.017 0.038 0.060 -0.002 -0.069 -0.050
Industry Avg 0.111 0.013 0.089 0.088 0.116 0.077 0.056 0.012
-0.500
-0.400
-0.300
-0.200
-0.100
0.000
0.100
0.200
0.300Sales Growth
11
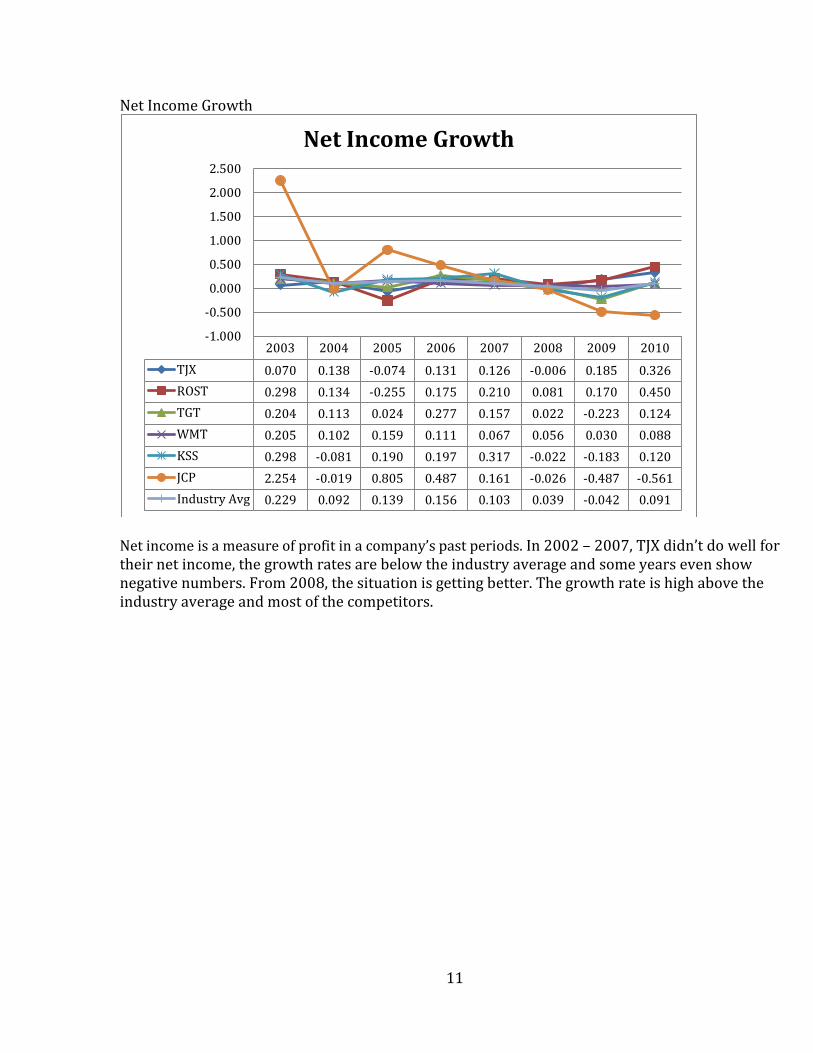
Net Income Growth
Net income is a measure of profit in a company’s past periods. In 2002 – 2007, TJX didn’t do well for their net income, the growth rates are below the industry average and some years even show negative numbers. From 2008, the situation is getting better. The growth rate is high above the industry average and most of the competitors.
2003 2004 2005 2006 2007 2008 2009 2010
TJX 0.070 0.138 -0.074 0.131 0.126 -0.006 0.185 0.326
ROST 0.298 0.134 -0.255 0.175 0.210 0.081 0.170 0.450
TGT 0.204 0.113 0.024 0.277 0.157 0.022 -0.223 0.124
WMT 0.205 0.102 0.159 0.111 0.067 0.056 0.030 0.088
KSS 0.298 -0.081 0.190 0.197 0.317 -0.022 -0.183 0.120
JCP 2.254 -0.019 0.805 0.487 0.161 -0.026 -0.487 -0.561
Industry Avg 0.229 0.092 0.139 0.156 0.103 0.039 -0.042 0.091
-1.000
-0.500
0.000
0.500
1.000
1.500
2.000
2.500
Net Income Growth
12
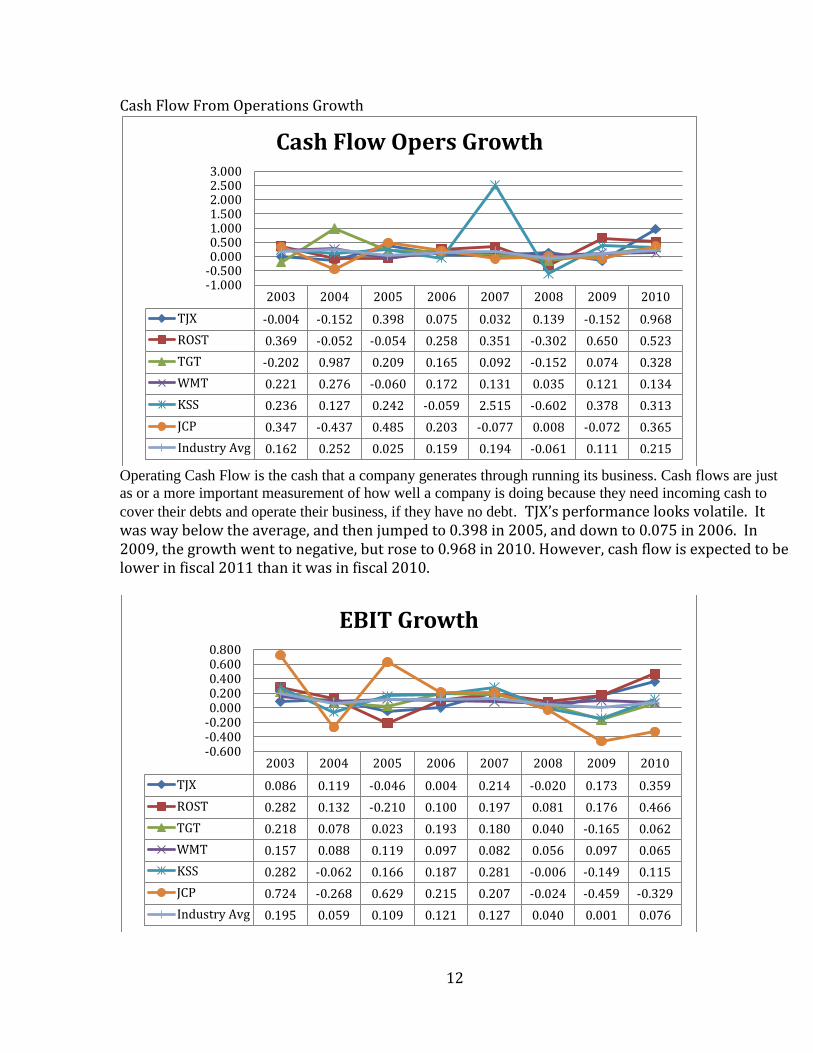
Cash Flow From Operations Growth
Operating Cash Flow is the cash that a company generates through running its business. Cash flows are just
as or a more important measurement of how well a company is doing because they need incoming cash to
cover their debts and operate their business, if they have no debt. TJX’s performance looks volatile. It was way below the average, and then jumped to 0.398 in 2005, and down to 0.075 in 2006. In 2009, the growth went to negative, but rose to 0.968 in 2010. However, cash flow is expected to be lower in fiscal 2011 than it was in fiscal 2010.
2003 2004 2005 2006 2007 2008 2009 2010
TJX -0.004 -0.152 0.398 0.075 0.032 0.139 -0.152 0.968
ROST 0.369 -0.052 -0.054 0.258 0.351 -0.302 0.650 0.523
TGT -0.202 0.987 0.209 0.165 0.092 -0.152 0.074 0.328
WMT 0.221 0.276 -0.060 0.172 0.131 0.035 0.121 0.134
KSS 0.236 0.127 0.242 -0.059 2.515 -0.602 0.378 0.313
JCP 0.347 -0.437 0.485 0.203 -0.077 0.008 -0.072 0.365
Industry Avg 0.162 0.252 0.025 0.159 0.194 -0.061 0.111 0.215
-1.000-0.5000.0000.5001.0001.5002.0002.5003.000
Cash Flow Opers Growth
2003 2004 2005 2006 2007 2008 2009 2010
TJX 0.086 0.119 -0.046 0.004 0.214 -0.020 0.173 0.359
ROST 0.282 0.132 -0.210 0.100 0.197 0.081 0.176 0.466
TGT 0.218 0.078 0.023 0.193 0.180 0.040 -0.165 0.062
WMT 0.157 0.088 0.119 0.097 0.082 0.056 0.097 0.065
KSS 0.282 -0.062 0.166 0.187 0.281 -0.006 -0.149 0.115
JCP 0.724 -0.268 0.629 0.215 0.207 -0.024 -0.459 -0.329
Industry Avg 0.195 0.059 0.109 0.121 0.127 0.040 0.001 0.076
-0.600-0.400-0.2000.0000.2000.4000.6000.800
EBIT Growth
13
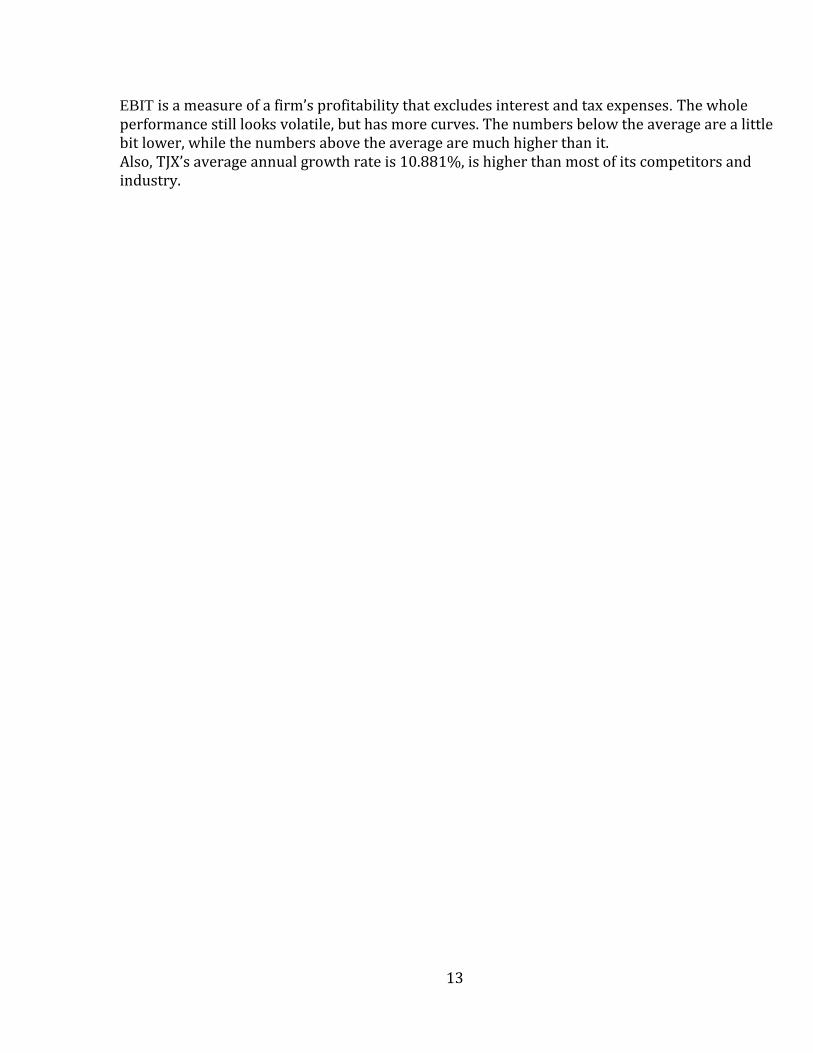
EBIT is a measure of a firm’s profitability that excludes interest and tax expenses. The whole performance still looks volatile, but has more curves. The numbers below the average are a little bit lower, while the numbers above the average are much higher than it. Also, TJX’s average annual growth rate is 10.881%, is higher than most of its competitors and industry.
14
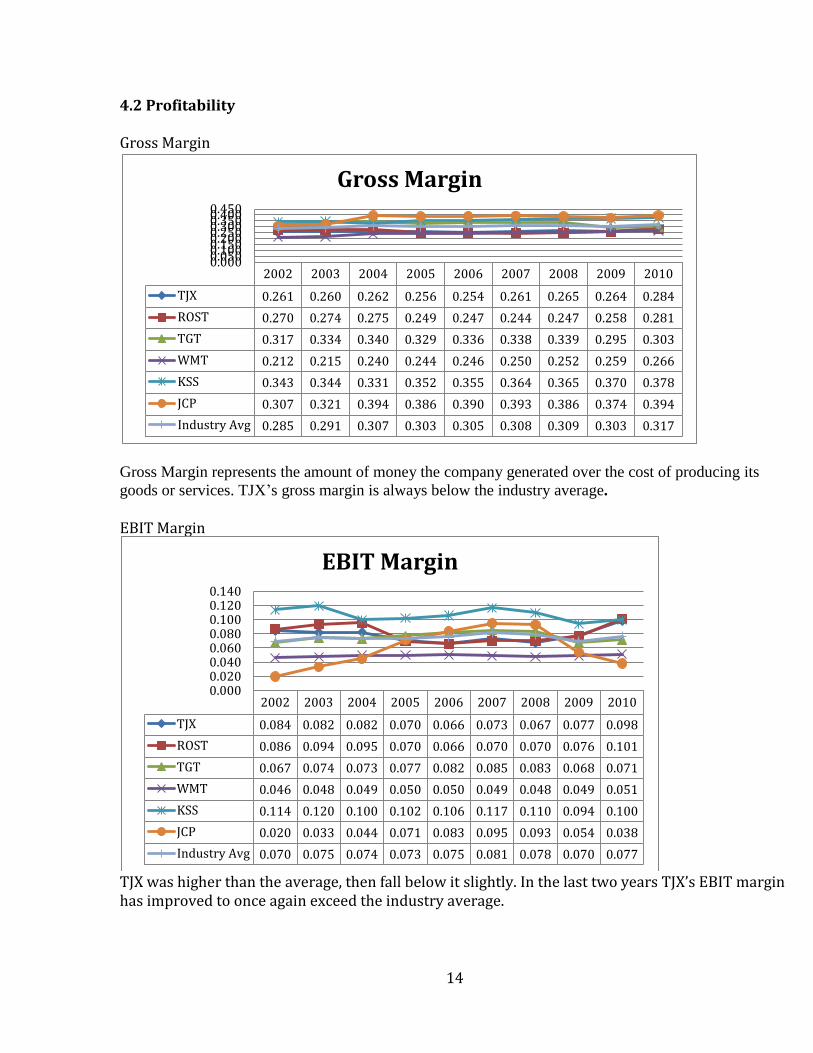
4.2 Profitability Gross Margin
Gross Margin represents the amount of money the company generated over the cost of producing its
goods or services. TJX’s gross margin is always below the industry average.
EBIT Margin
TJX was higher than the average, then fall below it slightly. In the last two years TJX’s EBIT margin has improved to once again exceed the industry average.
2002 2003 2004 2005 2006 2007 2008 2009 2010
TJX 0.261 0.260 0.262 0.256 0.254 0.261 0.265 0.264 0.284
ROST 0.270 0.274 0.275 0.249 0.247 0.244 0.247 0.258 0.281
TGT 0.317 0.334 0.340 0.329 0.336 0.338 0.339 0.295 0.303
WMT 0.212 0.215 0.240 0.244 0.246 0.250 0.252 0.259 0.266
KSS 0.343 0.344 0.331 0.352 0.355 0.364 0.365 0.370 0.378
JCP 0.307 0.321 0.394 0.386 0.390 0.393 0.386 0.374 0.394
Industry Avg 0.285 0.291 0.307 0.303 0.305 0.308 0.309 0.303 0.317
0.0000.0500.1000.1500.2000.2500.3000.3500.4000.450
Gross Margin
2002 2003 2004 2005 2006 2007 2008 2009 2010
TJX 0.084 0.082 0.082 0.070 0.066 0.073 0.067 0.077 0.098
ROST 0.086 0.094 0.095 0.070 0.066 0.070 0.070 0.076 0.101
TGT 0.067 0.074 0.073 0.077 0.082 0.085 0.083 0.068 0.071
WMT 0.046 0.048 0.049 0.050 0.050 0.049 0.048 0.049 0.051
KSS 0.114 0.120 0.100 0.102 0.106 0.117 0.110 0.094 0.100
JCP 0.020 0.033 0.044 0.071 0.083 0.095 0.093 0.054 0.038
Industry Avg 0.070 0.075 0.074 0.073 0.075 0.081 0.078 0.070 0.077
0.0000.0200.0400.0600.0800.1000.1200.140
EBIT Margin
15
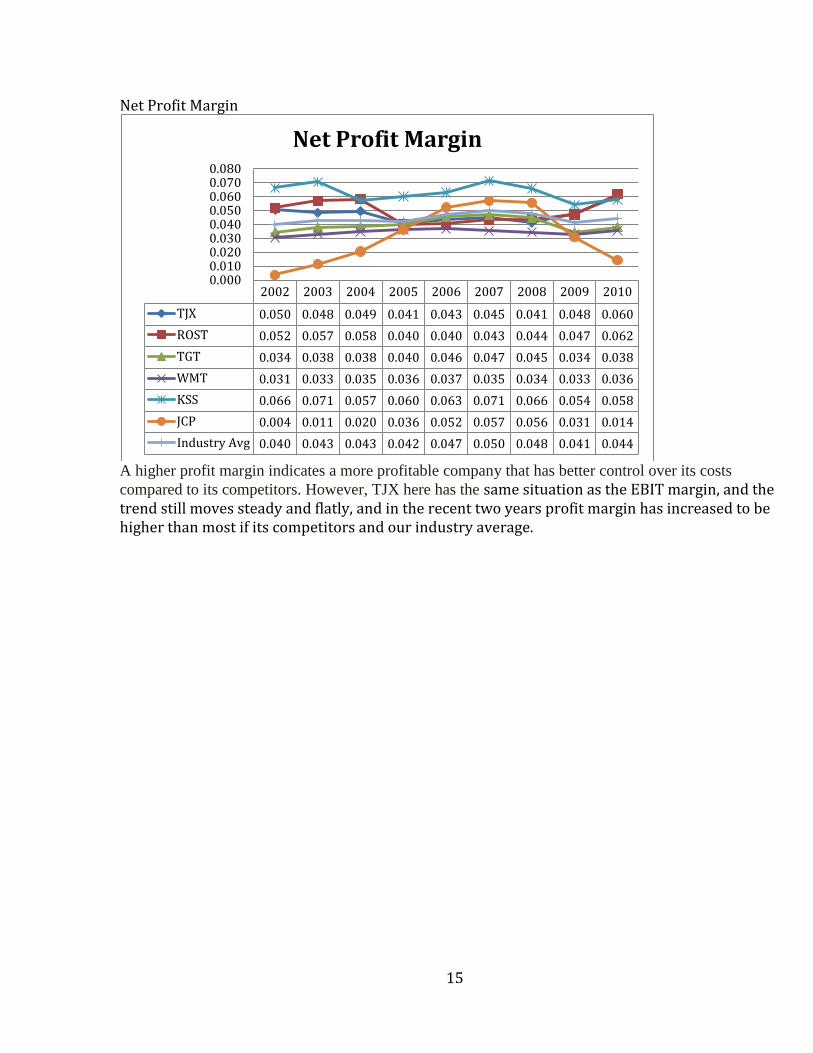
Net Profit Margin
A higher profit margin indicates a more profitable company that has better control over its costs
compared to its competitors. However, TJX here has the same situation as the EBIT margin, and the trend still moves steady and flatly, and in the recent two years profit margin has increased to be higher than most if its competitors and our industry average.
2002 2003 2004 2005 2006 2007 2008 2009 2010
TJX 0.050 0.048 0.049 0.041 0.043 0.045 0.041 0.048 0.060
ROST 0.052 0.057 0.058 0.040 0.040 0.043 0.044 0.047 0.062
TGT 0.034 0.038 0.038 0.040 0.046 0.047 0.045 0.034 0.038
WMT 0.031 0.033 0.035 0.036 0.037 0.035 0.034 0.033 0.036
KSS 0.066 0.071 0.057 0.060 0.063 0.071 0.066 0.054 0.058
JCP 0.004 0.011 0.020 0.036 0.052 0.057 0.056 0.031 0.014
Industry Avg 0.040 0.043 0.043 0.042 0.047 0.050 0.048 0.041 0.044
0.0000.0100.0200.0300.0400.0500.0600.0700.080
Net Profit Margin
16
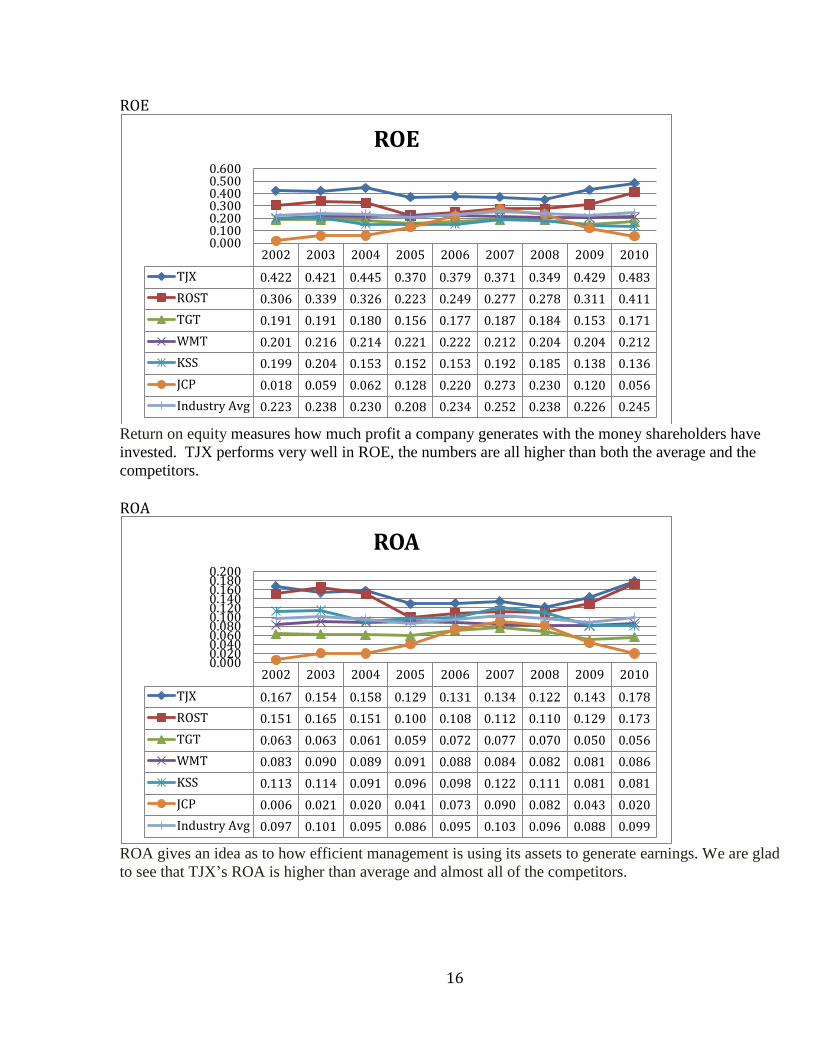
ROE
Return on equity measures how much profit a company generates with the money shareholders have
invested. TJX performs very well in ROE, the numbers are all higher than both the average and the
competitors. ROA
ROA gives an idea as to how efficient management is using its assets to generate earnings. We are glad
to see that TJX’s ROA is higher than average and almost all of the competitors.
2002 2003 2004 2005 2006 2007 2008 2009 2010
TJX 0.422 0.421 0.445 0.370 0.379 0.371 0.349 0.429 0.483
ROST 0.306 0.339 0.326 0.223 0.249 0.277 0.278 0.311 0.411
TGT 0.191 0.191 0.180 0.156 0.177 0.187 0.184 0.153 0.171
WMT 0.201 0.216 0.214 0.221 0.222 0.212 0.204 0.204 0.212
KSS 0.199 0.204 0.153 0.152 0.153 0.192 0.185 0.138 0.136
JCP 0.018 0.059 0.062 0.128 0.220 0.273 0.230 0.120 0.056
Industry Avg 0.223 0.238 0.230 0.208 0.234 0.252 0.238 0.226 0.245
0.0000.1000.2000.3000.4000.5000.600
ROE
2002 2003 2004 2005 2006 2007 2008 2009 2010
TJX 0.167 0.154 0.158 0.129 0.131 0.134 0.122 0.143 0.178
ROST 0.151 0.165 0.151 0.100 0.108 0.112 0.110 0.129 0.173
TGT 0.063 0.063 0.061 0.059 0.072 0.077 0.070 0.050 0.056
WMT 0.083 0.090 0.089 0.091 0.088 0.084 0.082 0.081 0.086
KSS 0.113 0.114 0.091 0.096 0.098 0.122 0.111 0.081 0.081
JCP 0.006 0.021 0.020 0.041 0.073 0.090 0.082 0.043 0.020
Industry Avg 0.097 0.101 0.095 0.086 0.095 0.103 0.096 0.088 0.099
0.0000.0200.0400.0600.0800.1000.1200.1400.1600.1800.200
ROA
17
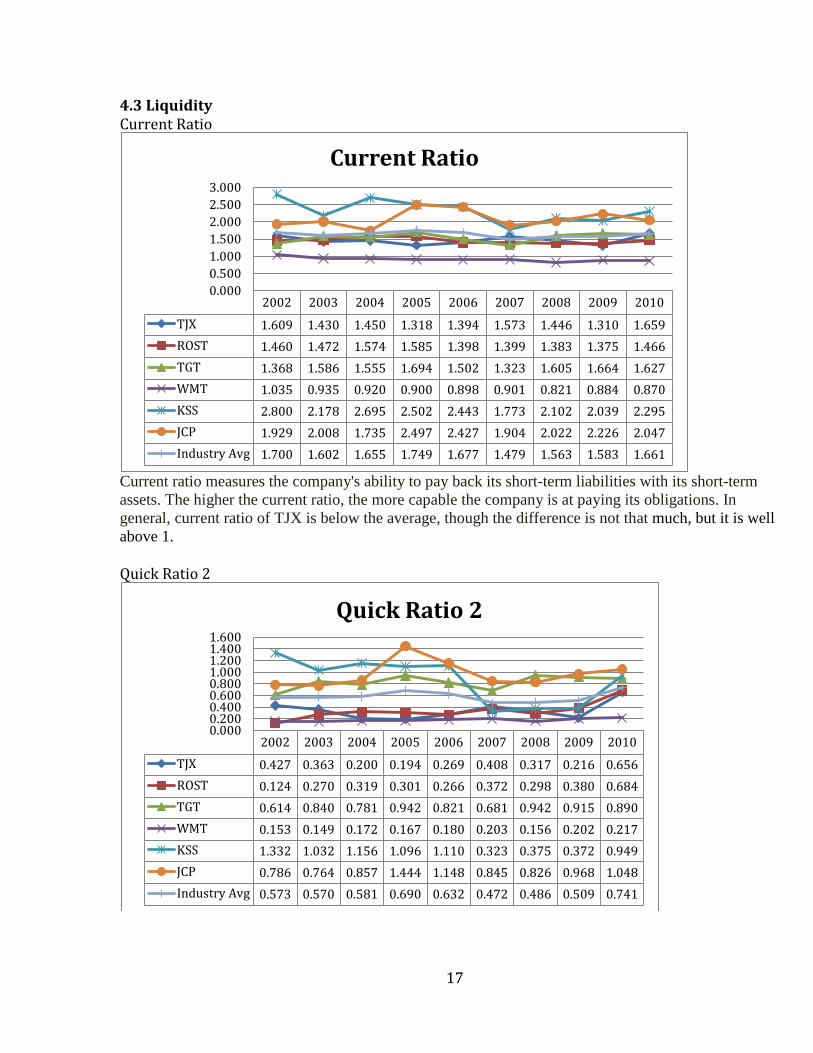
4.3 Liquidity Current Ratio
Current ratio measures the company's ability to pay back its short-term liabilities with its short-term
assets. The higher the current ratio, the more capable the company is at paying its obligations. In
general, current ratio of TJX is below the average, though the difference is not that much, but it is well
above 1.
Quick Ratio 2
2002 2003 2004 2005 2006 2007 2008 2009 2010
TJX 1.609 1.430 1.450 1.318 1.394 1.573 1.446 1.310 1.659
ROST 1.460 1.472 1.574 1.585 1.398 1.399 1.383 1.375 1.466
TGT 1.368 1.586 1.555 1.694 1.502 1.323 1.605 1.664 1.627
WMT 1.035 0.935 0.920 0.900 0.898 0.901 0.821 0.884 0.870
KSS 2.800 2.178 2.695 2.502 2.443 1.773 2.102 2.039 2.295
JCP 1.929 2.008 1.735 2.497 2.427 1.904 2.022 2.226 2.047
Industry Avg 1.700 1.602 1.655 1.749 1.677 1.479 1.563 1.583 1.661
0.000
0.500
1.000
1.500
2.000
2.500
3.000
Current Ratio
2002 2003 2004 2005 2006 2007 2008 2009 2010
TJX 0.427 0.363 0.200 0.194 0.269 0.408 0.317 0.216 0.656
ROST 0.124 0.270 0.319 0.301 0.266 0.372 0.298 0.380 0.684
TGT 0.614 0.840 0.781 0.942 0.821 0.681 0.942 0.915 0.890
WMT 0.153 0.149 0.172 0.167 0.180 0.203 0.156 0.202 0.217
KSS 1.332 1.032 1.156 1.096 1.110 0.323 0.375 0.372 0.949
JCP 0.786 0.764 0.857 1.444 1.148 0.845 0.826 0.968 1.048
Industry Avg 0.573 0.570 0.581 0.690 0.632 0.472 0.486 0.509 0.741
0.0000.2000.4000.6000.8001.0001.2001.4001.600
Quick Ratio 2
18
Quick ratio 2 measures a company's ability to meet its short-term obligations with its most liquid assets
and is calculated by dividing the sum of cash, accounts receivable, and short-term marketable security
by current liabilities. In the past 9 years, TJX kept lower than the average and below some of the
competitors.
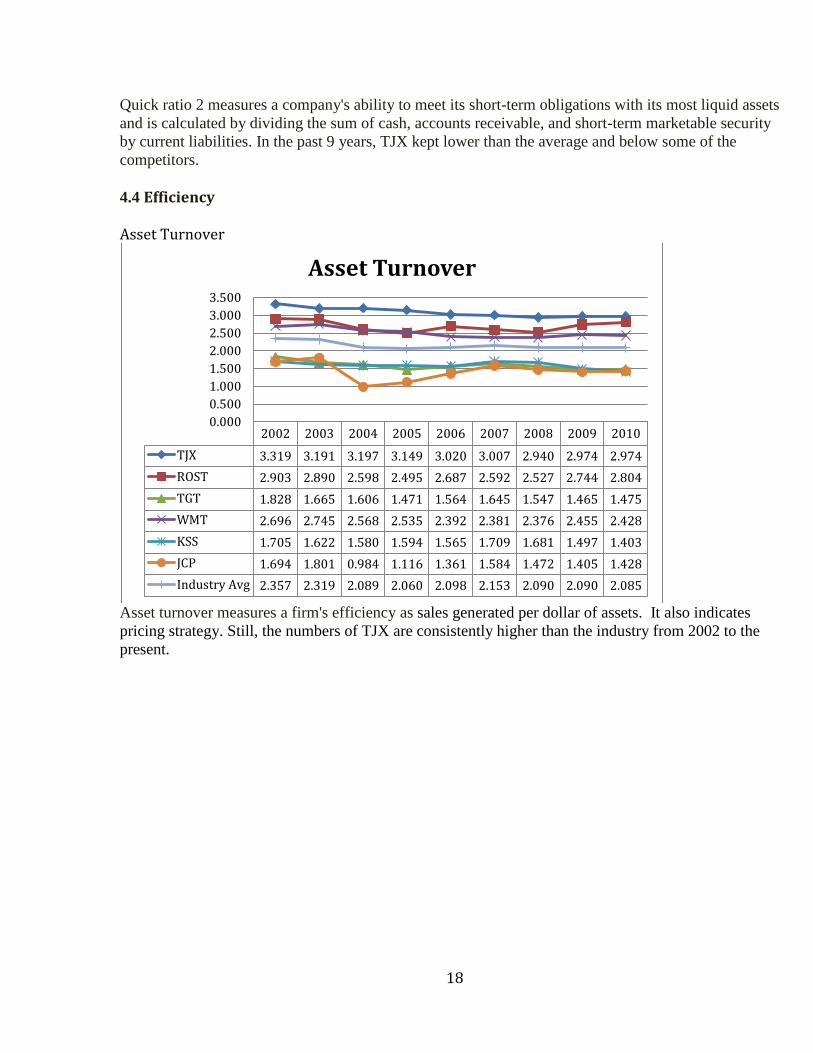
4.4 Efficiency
Asset Turnover
Asset turnover measures a firm's efficiency as sales generated per dollar of assets. It also indicates
pricing strategy. Still, the numbers of TJX are consistently higher than the industry from 2002 to the
present.
2002 2003 2004 2005 2006 2007 2008 2009 2010
TJX 3.319 3.191 3.197 3.149 3.020 3.007 2.940 2.974 2.974
ROST 2.903 2.890 2.598 2.495 2.687 2.592 2.527 2.744 2.804
TGT 1.828 1.665 1.606 1.471 1.564 1.645 1.547 1.465 1.475
WMT 2.696 2.745 2.568 2.535 2.392 2.381 2.376 2.455 2.428
KSS 1.705 1.622 1.580 1.594 1.565 1.709 1.681 1.497 1.403
JCP 1.694 1.801 0.984 1.116 1.361 1.584 1.472 1.405 1.428
Industry Avg 2.357 2.319 2.089 2.060 2.098 2.153 2.090 2.090 2.085
0.000
0.500
1.000
1.500
2.000
2.500
3.000
3.500
Asset Turnover
19
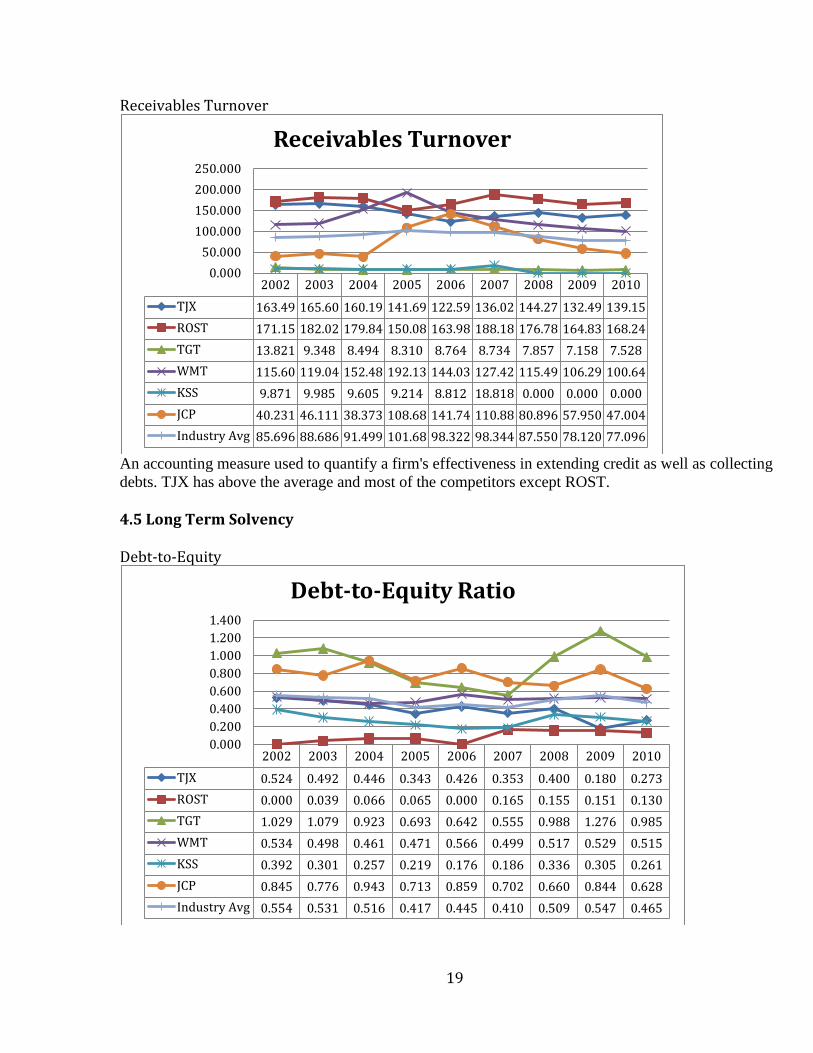
Receivables Turnover
An accounting measure used to quantify a firm's effectiveness in extending credit as well as collecting
debts. TJX has above the average and most of the competitors except ROST.
4.5 Long Term Solvency Debt-to-Equity
2002 2003 2004 2005 2006 2007 2008 2009 2010
TJX 163.49 165.60 160.19 141.69 122.59 136.02 144.27 132.49 139.15
ROST 171.15 182.02 179.84 150.08 163.98 188.18 176.78 164.83 168.24
TGT 13.821 9.348 8.494 8.310 8.764 8.734 7.857 7.158 7.528
WMT 115.60 119.04 152.48 192.13 144.03 127.42 115.49 106.29 100.64
KSS 9.871 9.985 9.605 9.214 8.812 18.818 0.000 0.000 0.000
JCP 40.231 46.111 38.373 108.68 141.74 110.88 80.896 57.950 47.004
Industry Avg 85.696 88.686 91.499 101.68 98.322 98.344 87.550 78.120 77.096
0.000
50.000
100.000
150.000
200.000
250.000
Receivables Turnover
2002 2003 2004 2005 2006 2007 2008 2009 2010
TJX 0.524 0.492 0.446 0.343 0.426 0.353 0.400 0.180 0.273
ROST 0.000 0.039 0.066 0.065 0.000 0.165 0.155 0.151 0.130
TGT 1.029 1.079 0.923 0.693 0.642 0.555 0.988 1.276 0.985
WMT 0.534 0.498 0.461 0.471 0.566 0.499 0.517 0.529 0.515
KSS 0.392 0.301 0.257 0.219 0.176 0.186 0.336 0.305 0.261
JCP 0.845 0.776 0.943 0.713 0.859 0.702 0.660 0.844 0.628
Industry Avg 0.554 0.531 0.516 0.417 0.445 0.410 0.509 0.547 0.465
0.000
0.200
0.400
0.600
0.800
1.000
1.200
1.400
Debt-to-Equity Ratio
20
Debt-to-Equity indicates what proportion of equity and debt the company is using to finance its assets.
TJX’s numbers show that it is aggressive in financing its growth with debt slightly. TJX uses less debt
than its competitors and industry average.
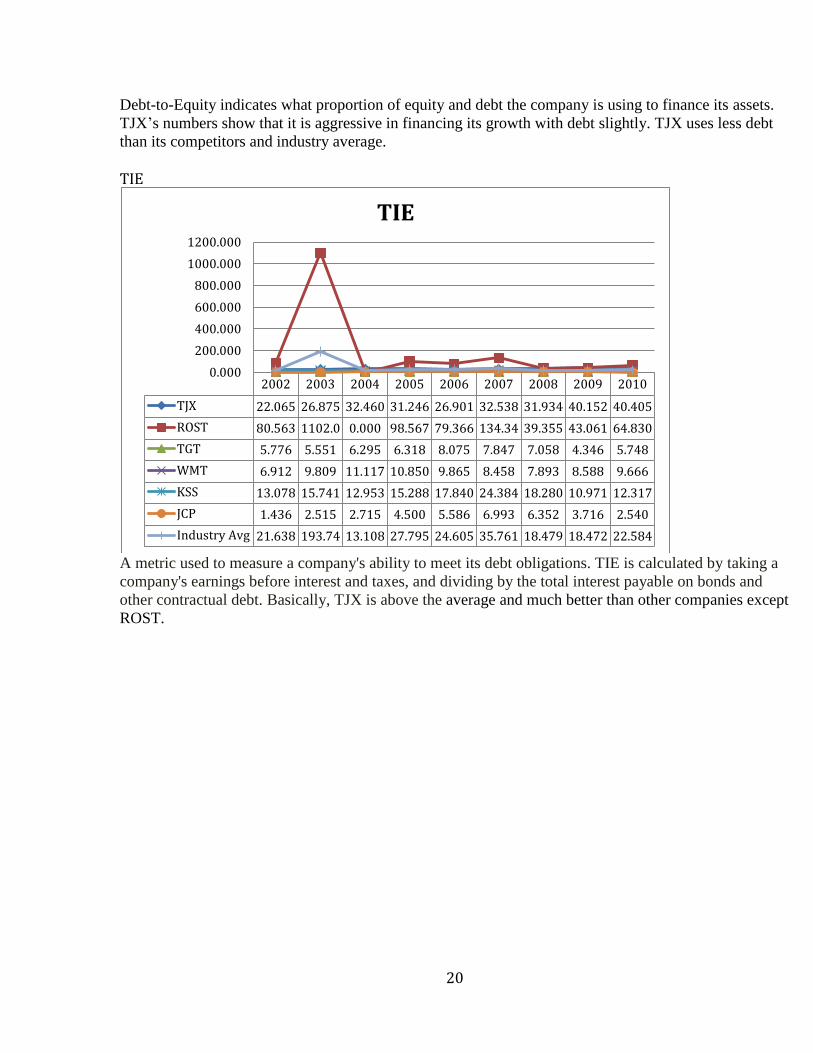
TIE
A metric used to measure a company's ability to meet its debt obligations. TIE is calculated by taking a
company's earnings before interest and taxes, and dividing by the total interest payable on bonds and
other contractual debt. Basically, TJX is above the average and much better than other companies except
ROST.
2002 2003 2004 2005 2006 2007 2008 2009 2010
TJX 22.065 26.875 32.460 31.246 26.901 32.538 31.934 40.152 40.405
ROST 80.563 1102.0 0.000 98.567 79.366 134.34 39.355 43.061 64.830
TGT 5.776 5.551 6.295 6.318 8.075 7.847 7.058 4.346 5.748
WMT 6.912 9.809 11.117 10.850 9.865 8.458 7.893 8.588 9.666
KSS 13.078 15.741 12.953 15.288 17.840 24.384 18.280 10.971 12.317
JCP 1.436 2.515 2.715 4.500 5.586 6.993 6.352 3.716 2.540
Industry Avg 21.638 193.74 13.108 27.795 24.605 35.761 18.479 18.472 22.584
0.000
200.000
400.000
600.000
800.000
1000.000
1200.000
TIE
21
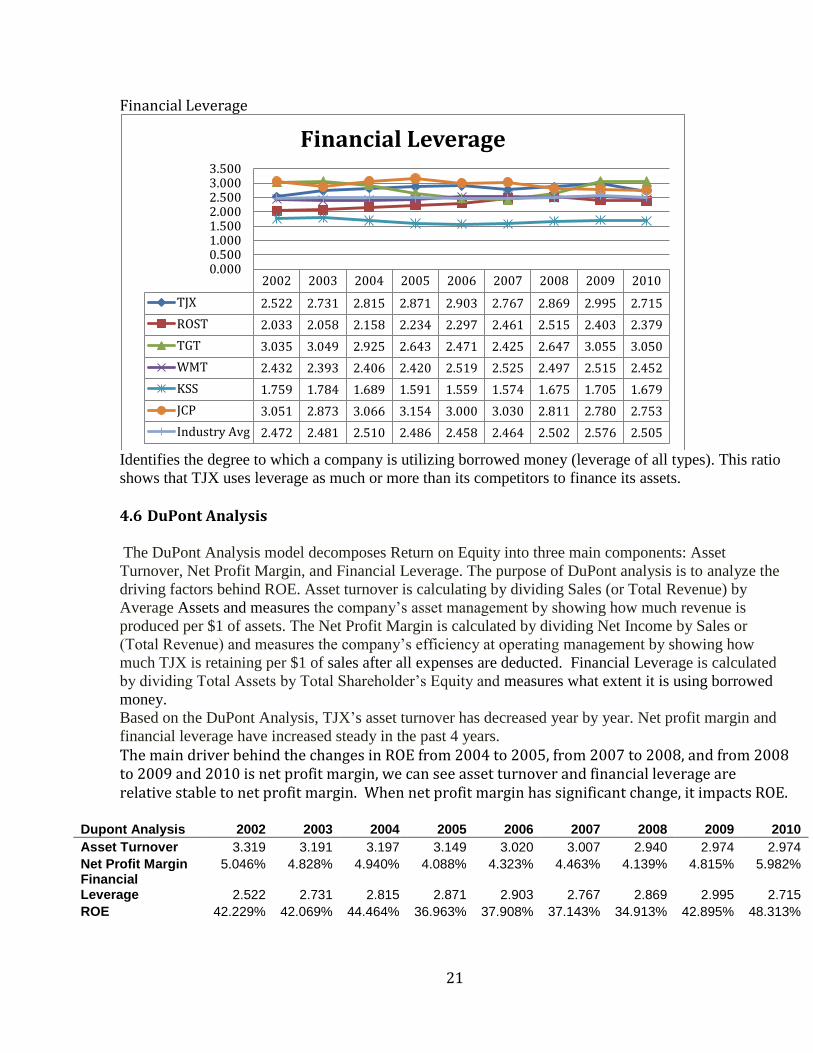
Financial Leverage
Identifies the degree to which a company is utilizing borrowed money (leverage of all types). This ratio
shows that TJX uses leverage as much or more than its competitors to finance its assets. 4.6 DuPont Analysis
The DuPont Analysis model decomposes Return on Equity into three main components: Asset
Turnover, Net Profit Margin, and Financial Leverage. The purpose of DuPont analysis is to analyze the
driving factors behind ROE. Asset turnover is calculating by dividing Sales (or Total Revenue) by
Average Assets and measures the company’s asset management by showing how much revenue is
produced per $1 of assets. The Net Profit Margin is calculated by dividing Net Income by Sales or
(Total Revenue) and measures the company’s efficiency at operating management by showing how
much TJX is retaining per $1 of sales after all expenses are deducted. Financial Leverage is calculated
by dividing Total Assets by Total Shareholder’s Equity and measures what extent it is using borrowed
money.
Based on the DuPont Analysis, TJX’s asset turnover has decreased year by year. Net profit margin and
financial leverage have increased steady in the past 4 years.
The main driver behind the changes in ROE from 2004 to 2005, from 2007 to 2008, and from 2008 to 2009 and 2010 is net profit margin, we can see asset turnover and financial leverage are relative stable to net profit margin. When net profit margin has significant change, it impacts ROE.
Dupont Analysis 2002 2003 2004 2005 2006 2007 2008 2009 2010
Asset Turnover 3.319 3.191 3.197 3.149 3.020 3.007 2.940 2.974 2.974
Net Profit Margin 5.046% 4.828% 4.940% 4.088% 4.323% 4.463% 4.139% 4.815% 5.982% Financial Leverage 2.522 2.731 2.815 2.871 2.903 2.767 2.869 2.995 2.715
ROE 42.229% 42.069% 44.464% 36.963% 37.908% 37.143% 34.913% 42.895% 48.313%
2002 2003 2004 2005 2006 2007 2008 2009 2010
TJX 2.522 2.731 2.815 2.871 2.903 2.767 2.869 2.995 2.715
ROST 2.033 2.058 2.158 2.234 2.297 2.461 2.515 2.403 2.379
TGT 3.035 3.049 2.925 2.643 2.471 2.425 2.647 3.055 3.050
WMT 2.432 2.393 2.406 2.420 2.519 2.525 2.497 2.515 2.452
KSS 1.759 1.784 1.689 1.591 1.559 1.574 1.675 1.705 1.679
JCP 3.051 2.873 3.066 3.154 3.000 3.030 2.811 2.780 2.753
Industry Avg 2.472 2.481 2.510 2.486 2.458 2.464 2.502 2.576 2.505
0.0000.5001.0001.5002.0002.5003.0003.500
Financial Leverage
22
Income Statement Forecast for 2012
TJX
2002 2003 2004 2005 2006 2007 2008 2009 2010 YTD2011 2011(E) 2012
Oct. 2010
Yearly share 0.475% 0.516% 0.547% 0.569% 0.564% 0.582% 0.600% 0.602% 0.679% 0.673% 0.690%
2.484%
Industry Revenues 2,253,665 2,323,987 2,436,593 2,621,949 2,826,764 2,988,504 3,107,566 3,153,953 2,988,958 2,318,590 3,158,818 3274665
2.279% 3.120% 4.845% 7.607% 7.812% 5.722% 3.984% 1.493% -5.231% 5.683% 3.667%
Total Rev 10,709.0 11,981.2 13,327.9 14,913.5 15,955.9 17,404.6 18,647.1 18,999.5 20,288.4 15,610.5 22,595.2
11.797% 11.880% 11.240% 11.896% 6.990% 9.079% 7.139% 1.890% 6.784%
Total COGS excl. D&A 7,918.8 8,871.7 9,838.8 11,088.9 11,900.4 12,860.6 13,713.1 13,993.0 14,530.4 11033.19 16264.54
COGS excl. D&A as % of
Rev 73.95% 74.05% 73.82% 74.35% 74.58% 73.89% 73.54% 73.65% 71.62% 70.68% 71.98%
GROSS PROFIT 2,790.157 3,109.504 3,489.129 3,824.586 4,055.557 4,544.044 4,934.074 5,006.456 5,758.015 4577.28 6330.65
SGA, Operating Expenses 1,684.4 1,922.5 2,155.2 2,500.1 2,691.3 2,916.5 3,119.0 3,170.0 3,328.9 2590.00 3767.17
Op Exp as % of Revenue 15.73% 16.05% 16.17% 16.76% 16.87% 16.76% 16.73% 16.68% 16.41% 16.59% 16.67% Other Extraordinary
Expense 197 -30.5 -11.6
OPERATING INCOME $1,105.77 $1,186.97 $1,333.96 $1,324.47 $1,364.29 $1,627.52 $1,618.11 $1,866.94 $2,429.07 $1,998.88 $2,563.49
Cash & ST Investment $492.80 $492.30 $246.40 $307.20 $465.60 $856.70 $732.60 $453.50 $1,750.90 $1,469.10 $1,670.00
The return of investment 11.321% 2.131% 1.320% 3.125% 3.060% 5.069% 4.751% 3.030% 1.987% 0.497% 0.700%
OTHER INCOME
(EXPENSE)
Interest/Investment Income 15.0 10.5 6.5 7.7 9.4 23.6 40.7 22.2 9.0 $8.700 $11.690
Interest Expense 40.6 35.9 33.8 33.5 39.0 39.2 39.1 36.5 48.5 $30.000 $43.010 Net Interest Expense
(Income) $25.643 $25.373 $27.252 $25.757 $29.632 $15.566 -$1.598 $14.291 $39.509 $21.300 $31.320
Unusual Expense 2.0 16.0 30.7 12.0 12.0 7.6
Depreciation 204.1 207.9 238.4 279.1 314.3 353.1 369.4 401.7 438.0 $341.100 $460.000 $490.000
EBT $874.04 $937.72 $1,068.33 $988.95 $1,008.37 $1,246.85 $1,242.71 $1,450.94 $1,951.56 $1,636.48 $2,042.17
Income Taxes 333.6 359.3 410.0 379.3 318.9 470.1 470.9 536.1 738.0 $621.00 $776.02
EAT $540.40 $578.39 $658.37 $609.65 $689.46 $776.76 $771.77 $914.89 $1,213.57 $1,015.48 $1,266.14
After Tax Adjustment -$40.000 -$0.60 -$34.300
Extraordinary $38.10
NET INCOME $500.40 $578.39 $658.37 $609.65 $689.46 $738.06 $771.77 $880.59 $1,213.57 $1,015.48 $1,266.14
Wgt Avg Diluted Shares 556268 554645 531301 509661 491500 480045 468046 442255 427619 409742 397000
EPS $0.90 $1.04 $1.24 $1.20 $1.40 $1.54 $1.65 $1.99 $2.84 $2.48 $3.19
Realized Tax Rates: 38.17% 38.32% 38.37% 38.35% 31.63% 37.70% 37.90% 36.95% 37.82% 37.95% 38.00%
23
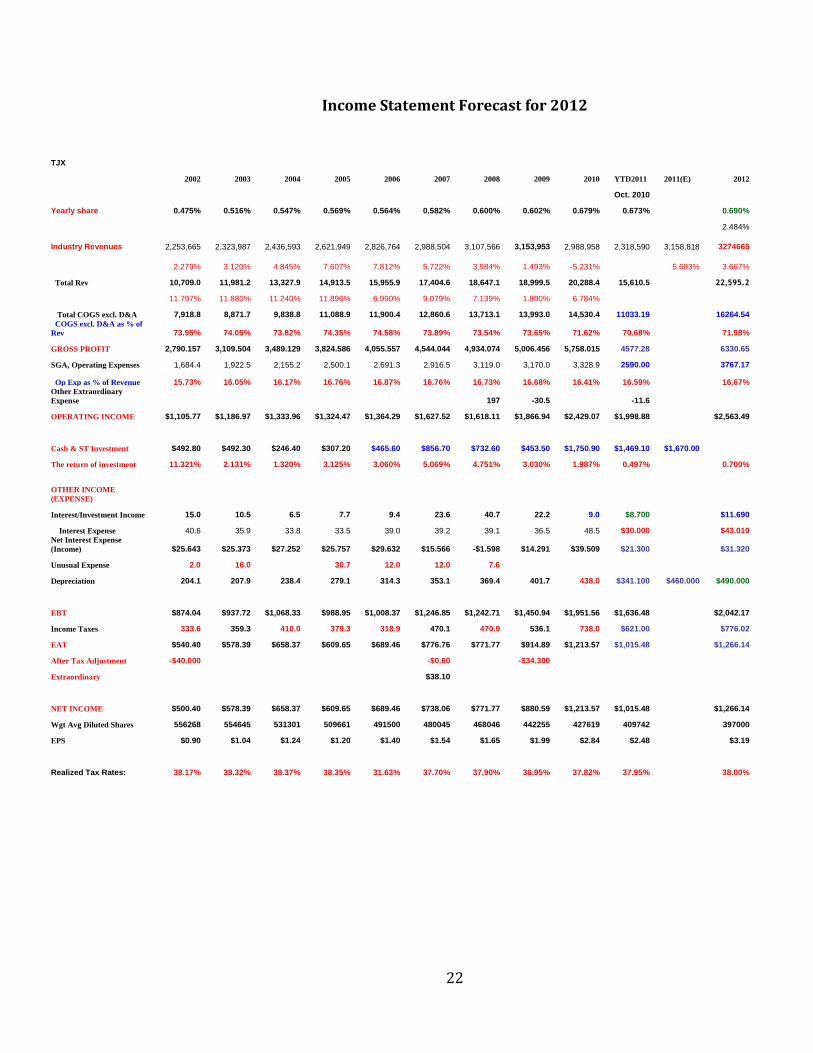
5. Earning Forecast This section forecasts the Income Statement for Fiscal 2012 by estimating the industry revenue and then to estimate the EPS of 2012. Industry Revenue Retail industry is highly related to the economic condition. If the economic condition is good, people are willing to spend more. Therefore, the retail industry will have better performance. The National Bureau of Economic Research announced that the recession ended in June 2009. Although the economy is in an early stage of recovery, consumer confidence remains weak and unemployment high. Nevertheless, business for many retailers has stabilized over the past year. We believe the economy is on the path of slow recovery, so we estimate the retail industry growth rate in 2012 is 3.667%, which is the geometric average growth rate of past 10 year, we think this number is reasonable and convincible. The data we use for the historical data is from US Census Bureau, it is monthly data, so we can adjust the number to match the fiscal year end in January. Market Share The market share of TJX has constantly grown in the past 10 years. Due to the expansion programs we mentioned before, we believe TJX’s market share will continue growth in the future. Thus, we use 0.69% to be the market share in 2012. TJX Revenue After we estimated the industry revenue and market share for 2012, we generate the total revenue of TJX is forecasted to be $22,595.2 million. COGS The percentage of cost of good sold excluding Depreciation and Amortization to revenue shows a decrease trend since 2006, from 74.58% to 70.68%. For the conservative purpose, we use the last two years and the 2011 YTD numbers to get an average 71.98% and multiply this by our revenue estimate to calculate our COGS expense estimate. SGA, Operating expenses The percentages of SG&A expense to revenue were stable during the past years. Therefore, we use the average of the last five years to get the number 16.67%. Interest/Investment Income The interest/Investment Income is influenced by the prior year’s Cash and ST investment. We calculated the rate of return of investment for each year and found that the rate was continuing decreasing from 2007 to now. That is because the FED decreased interest rate during this period.
24
Since the FED decided to maintain the expansionary monetary policy, we expect the interest rate will remain in the low level in the foreseeable future. So we use the 0.7% to be the return rate times the cash and ST investment we estimate for the Fiscal 2011 to get the $11.69 million for 2012. Interest expense TJX has two corporate notes. One is $375 million and the effective coupon rate 7.00%. The other one is $400 million and the effective coupon rate 4.19%. Then we got the interest expense for Fiscal 2012 is $43.01 million. Depreciation The depreciation expense was increased stable during the past few years. We notice that the increase is about $30 million each year, so we use this number to forecast the depreciation expense for 2012. Tax rate The effective tax rate we use 38% is disclosed in the TJX annual report 2010. TJX anticipated the tax rate would be 38%~38.5% in the future. Earning Per Shares To forecast weighted average diluted shares has several steps. First, we know TJX has two $1 billion repurchase programs. One was completed in the third quarter in Fiscal 2011(Oct 2010) and the second repurchase program has about $950 million remaining at Oct. 30, 2010. TJX repurchase their stock each quarter continually, therefore, we believe they will complete the second repurchase program in Fiscal 2012. Second, we use the $950 million divided by $45 to get how many shares they can repurchase. Third, we calculated the gap between Shares Outstanding and Diluted shares and found the median of the gap is 22.3 million. Fourth, we use current shares outstanding less the repurchase shares then plus the gap to get the number we forecast the weighted average diluted shares for Fiscal 2012. Then we use the Net Income divided by the weighted average diluted shares to get out EPS in 2012.
25
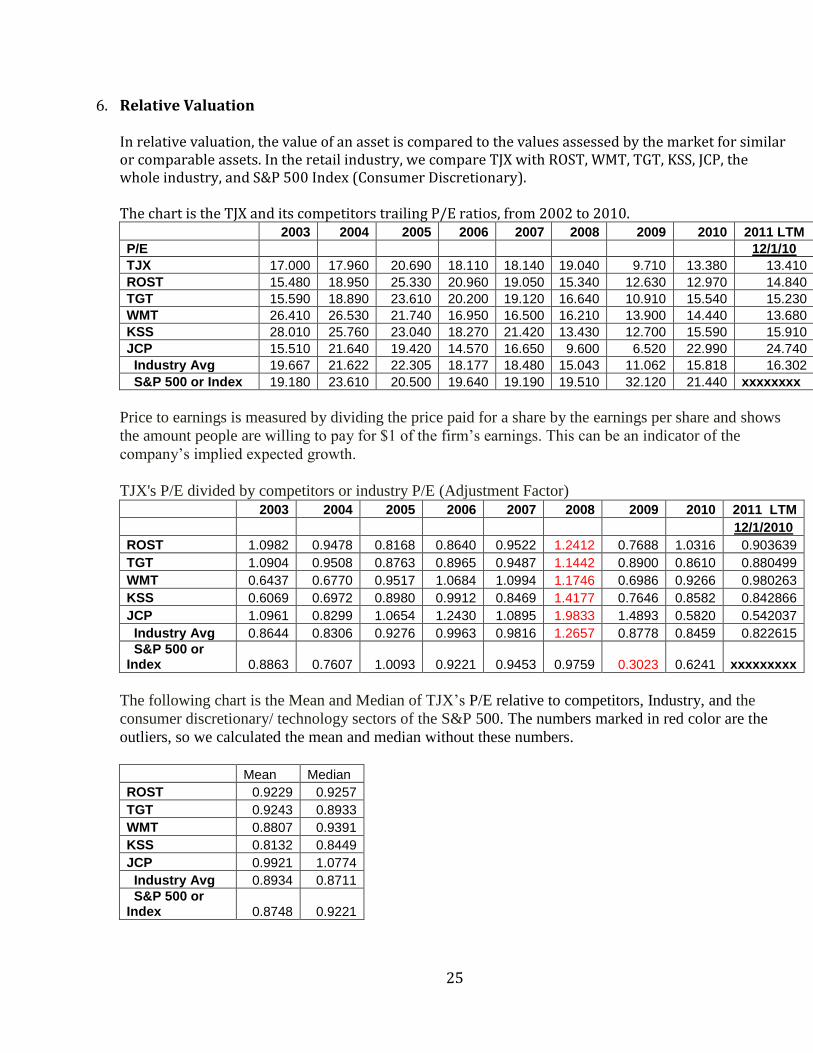
6. Relative Valuation In relative valuation, the value of an asset is compared to the values assessed by the market for similar or comparable assets. In the retail industry, we compare TJX with ROST, WMT, TGT, KSS, JCP, the whole industry, and S&P 500 Index (Consumer Discretionary). The chart is the TJX and its competitors trailing P/E ratios, from 2002 to 2010. 2003 2004 2005 2006 2007 2008 2009 2010 2011 LTM
P/E 12/1/10
TJX 17.000 17.960 20.690 18.110 18.140 19.040 9.710 13.380 13.410
ROST 15.480 18.950 25.330 20.960 19.050 15.340 12.630 12.970 14.840
TGT 15.590 18.890 23.610 20.200 19.120 16.640 10.910 15.540 15.230
WMT 26.410 26.530 21.740 16.950 16.500 16.210 13.900 14.440 13.680
KSS 28.010 25.760 23.040 18.270 21.420 13.430 12.700 15.590 15.910
JCP 15.510 21.640 19.420 14.570 16.650 9.600 6.520 22.990 24.740
Industry Avg 19.667 21.622 22.305 18.177 18.480 15.043 11.062 15.818 16.302
S&P 500 or Index 19.180 23.610 20.500 19.640 19.190 19.510 32.120 21.440 xxxxxxxx
Price to earnings is measured by dividing the price paid for a share by the earnings per share and shows
the amount people are willing to pay for $1 of the firm’s earnings. This can be an indicator of the
company’s implied expected growth.
TJX's P/E divided by competitors or industry P/E (Adjustment Factor)
2003 2004 2005 2006 2007 2008 2009 2010 2011 LTM
12/1/2010
ROST 1.0982 0.9478 0.8168 0.8640 0.9522 1.2412 0.7688 1.0316 0.903639
TGT 1.0904 0.9508 0.8763 0.8965 0.9487 1.1442 0.8900 0.8610 0.880499
WMT 0.6437 0.6770 0.9517 1.0684 1.0994 1.1746 0.6986 0.9266 0.980263
KSS 0.6069 0.6972 0.8980 0.9912 0.8469 1.4177 0.7646 0.8582 0.842866
JCP 1.0961 0.8299 1.0654 1.2430 1.0895 1.9833 1.4893 0.5820 0.542037
Industry Avg 0.8644 0.8306 0.9276 0.9963 0.9816 1.2657 0.8778 0.8459 0.822615
S&P 500 or Index 0.8863 0.7607 1.0093 0.9221 0.9453 0.9759 0.3023 0.6241 xxxxxxxxx
The following chart is the Mean and Median of TJX’s P/E relative to competitors, Industry, and the
consumer discretionary/ technology sectors of the S&P 500. The numbers marked in red color are the
outliers, so we calculated the mean and median without these numbers.
Mean Median
ROST 0.9229 0.9257
TGT 0.9243 0.8933
WMT 0.8807 0.9391
KSS 0.8132 0.8449
JCP 0.9921 1.0774
Industry Avg 0.8934 0.8711
S&P 500 or Index 0.8748 0.9221
26
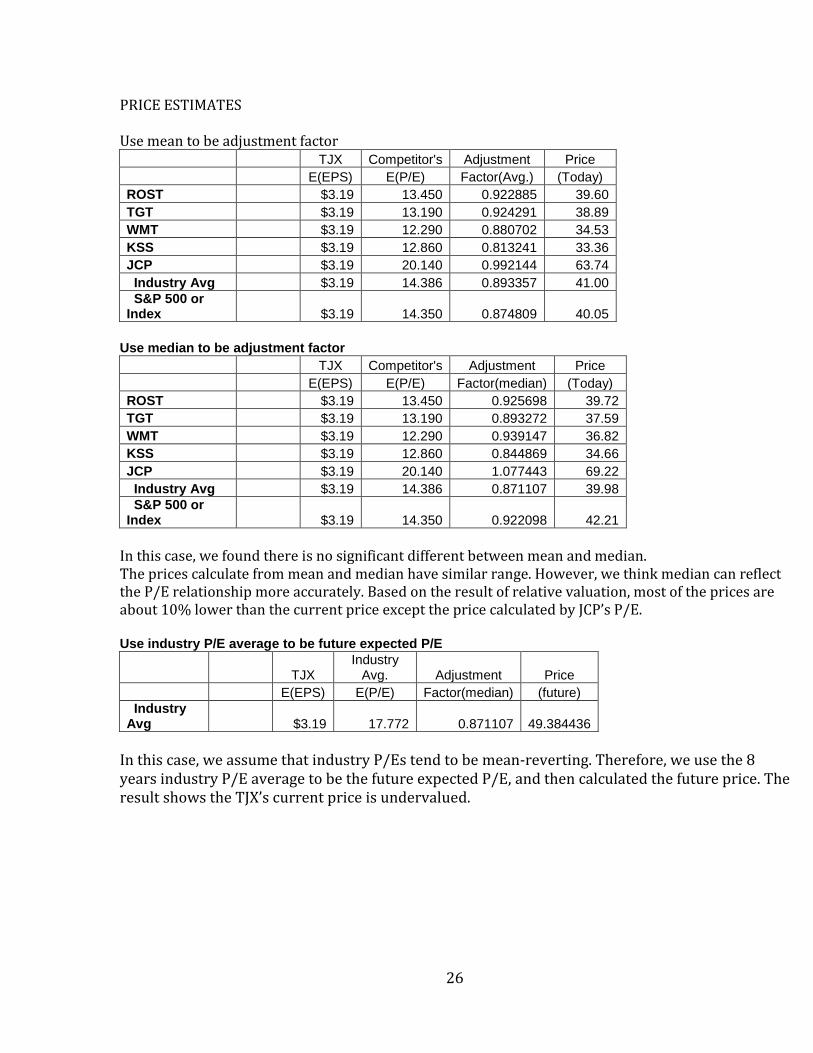
PRICE ESTIMATES Use mean to be adjustment factor TJX Competitor's Adjustment Price
E(EPS) E(P/E) Factor(Avg.) (Today)
ROST $3.19 13.450 0.922885 39.60
TGT $3.19 13.190 0.924291 38.89
WMT $3.19 12.290 0.880702 34.53
KSS $3.19 12.860 0.813241 33.36
JCP $3.19 20.140 0.992144 63.74
Industry Avg $3.19 14.386 0.893357 41.00
S&P 500 or Index $3.19 14.350 0.874809 40.05
Use median to be adjustment factor
TJX Competitor's Adjustment Price
E(EPS) E(P/E) Factor(median) (Today)
ROST $3.19 13.450 0.925698 39.72
TGT $3.19 13.190 0.893272 37.59
WMT $3.19 12.290 0.939147 36.82
KSS $3.19 12.860 0.844869 34.66
JCP $3.19 20.140 1.077443 69.22
Industry Avg $3.19 14.386 0.871107 39.98
S&P 500 or Index $3.19 14.350 0.922098 42.21
In this case, we found there is no significant different between mean and median. The prices calculate from mean and median have similar range. However, we think median can reflect the P/E relationship more accurately. Based on the result of relative valuation, most of the prices are about 10% lower than the current price except the price calculated by JCP’s P/E. Use industry P/E average to be future expected P/E
TJX Industry
Avg. Adjustment Price
E(EPS) E(P/E) Factor(median) (future)
Industry Avg $3.19 17.772 0.871107 49.384436
In this case, we assume that industry P/Es tend to be mean-reverting. Therefore, we use the 8 years industry P/E average to be the future expected P/E, and then calculated the future price. The result shows the TJX’s current price is undervalued.
27
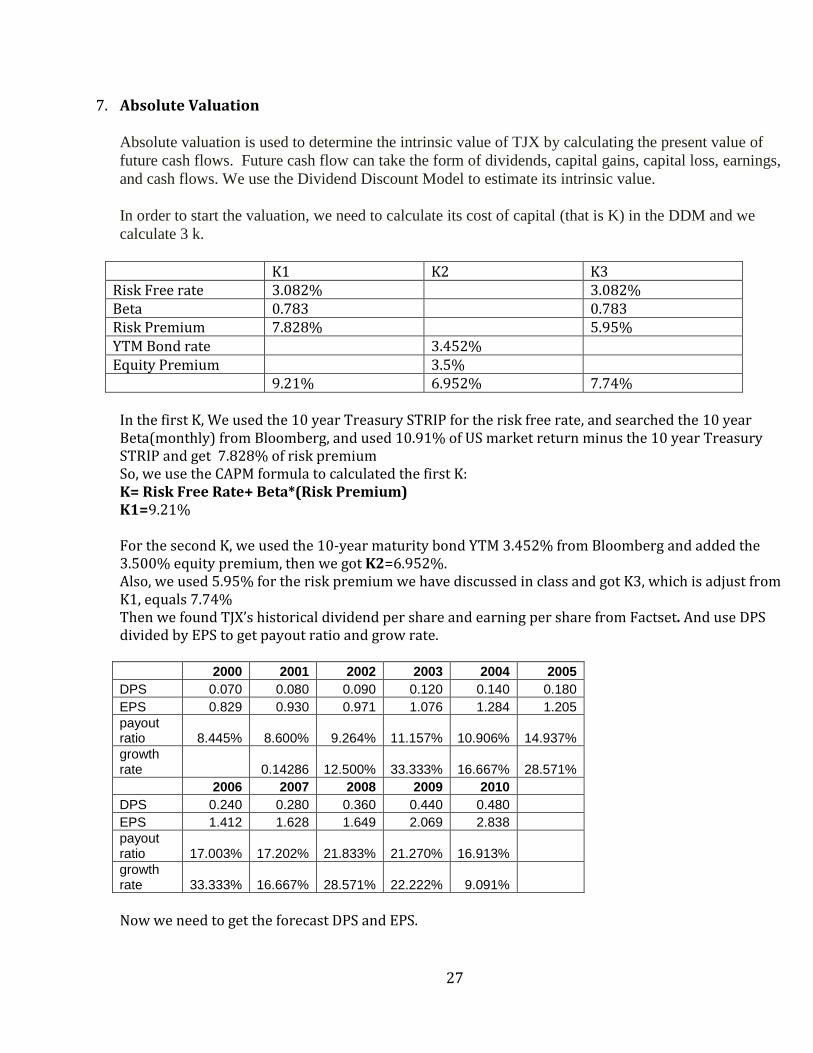
7. Absolute Valuation Absolute valuation is used to determine the intrinsic value of TJX by calculating the present value of
future cash flows. Future cash flow can take the form of dividends, capital gains, capital loss, earnings,
and cash flows. We use the Dividend Discount Model to estimate its intrinsic value.
In order to start the valuation, we need to calculate its cost of capital (that is K) in the DDM and we
calculate 3 k.
K1 K2 K3 Risk Free rate 3.082% 3.082% Beta 0.783 0.783 Risk Premium 7.828% 5.95% YTM Bond rate 3.452% Equity Premium 3.5% 9.21% 6.952% 7.74%
In the first K, We used the 10 year Treasury STRIP for the risk free rate, and searched the 10 year Beta(monthly) from Bloomberg, and used 10.91% of US market return minus the 10 year Treasury STRIP and get 7.828% of risk premium So, we use the CAPM formula to calculated the first K: K= Risk Free Rate+ Beta*(Risk Premium) K1=9.21% For the second K, we used the 10-year maturity bond YTM 3.452% from Bloomberg and added the 3.500% equity premium, then we got K2=6.952%. Also, we used 5.95% for the risk premium we have discussed in class and got K3, which is adjust from K1, equals 7.74% Then we found TJX’s historical dividend per share and earning per share from Factset. And use DPS divided by EPS to get payout ratio and grow rate. 2000 2001 2002 2003 2004 2005
DPS 0.070 0.080 0.090 0.120 0.140 0.180
EPS 0.829 0.930 0.971 1.076 1.284 1.205
payout ratio 8.445% 8.600% 9.264% 11.157% 10.906% 14.937%
growth rate 0.14286 12.500% 33.333% 16.667% 28.571%
2006 2007 2008 2009 2010
DPS 0.240 0.280 0.360 0.440 0.480
EPS 1.412 1.628 1.649 2.069 2.838
payout ratio 17.003% 17.202% 21.833% 21.270% 16.913%
growth rate 33.333% 16.667% 28.571% 22.222% 9.091%
Now we need to get the forecast DPS and EPS.
28
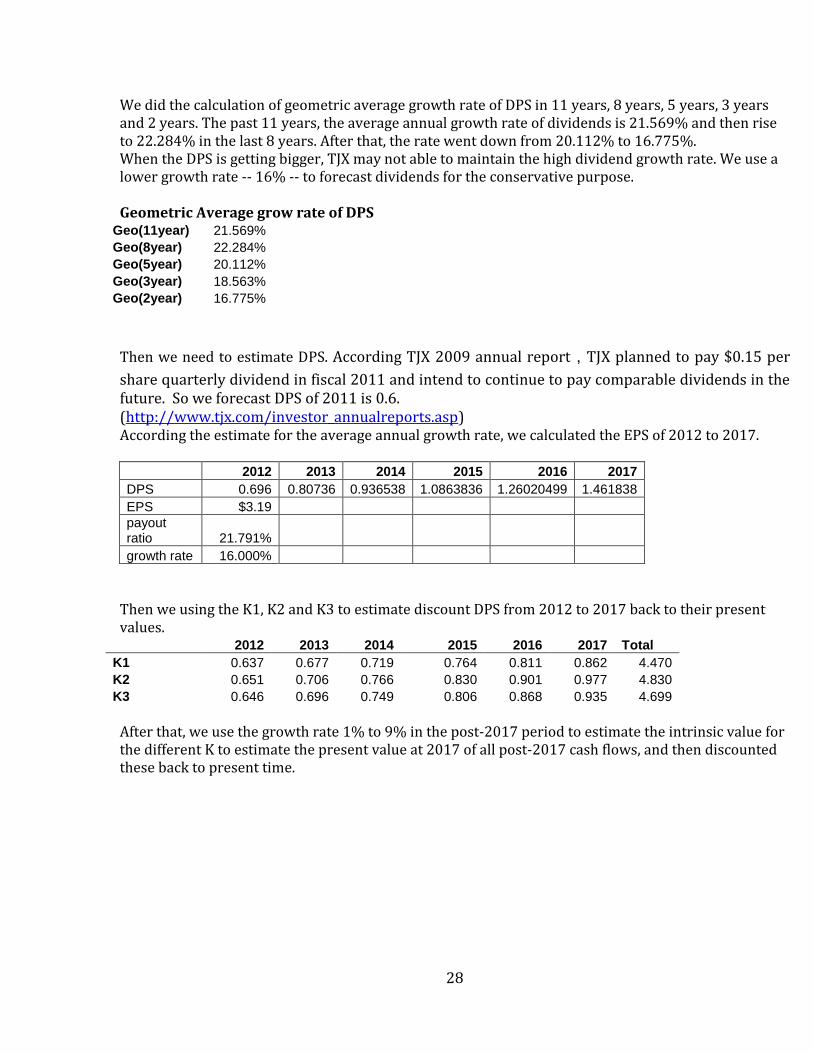
We did the calculation of geometric average growth rate of DPS in 11 years, 8 years, 5 years, 3 years and 2 years. The past 11 years, the average annual growth rate of dividends is 21.569% and then rise to 22.284% in the last 8 years. After that, the rate went down from 20.112% to 16.775%. When the DPS is getting bigger, TJX may not able to maintain the high dividend growth rate. We use a lower growth rate -- 16% -- to forecast dividends for the conservative purpose. Geometric Average grow rate of DPS
Geo(11year) 21.569%
Geo(8year) 22.284%
Geo(5year) 20.112%
Geo(3year) 18.563%
Geo(2year) 16.775%
Then we need to estimate DPS. According TJX 2009 annual report,TJX planned to pay $0.15 per
share quarterly dividend in fiscal 2011 and intend to continue to pay comparable dividends in the future. So we forecast DPS of 2011 is 0.6. (http://www.tjx.com/investor_annualreports.asp) According the estimate for the average annual growth rate, we calculated the EPS of 2012 to 2017. 2012 2013 2014 2015 2016 2017
DPS 0.696 0.80736 0.936538 1.0863836 1.26020499 1.461838
EPS $3.19
payout ratio 21.791%
growth rate 16.000%
Then we using the K1, K2 and K3 to estimate discount DPS from 2012 to 2017 back to their present values.
2012 2013 2014 2015 2016 2017 Total
K1 0.637 0.677 0.719 0.764 0.811 0.862 4.470
K2 0.651 0.706 0.766 0.830 0.901 0.977 4.830
K3 0.646 0.696 0.749 0.806 0.868 0.935 4.699
After that, we use the growth rate 1% to 9% in the post-2017 period to estimate the intrinsic value for the different K to estimate the present value at 2017 of all post-2017 cash flows, and then discounted these back to present time.
29
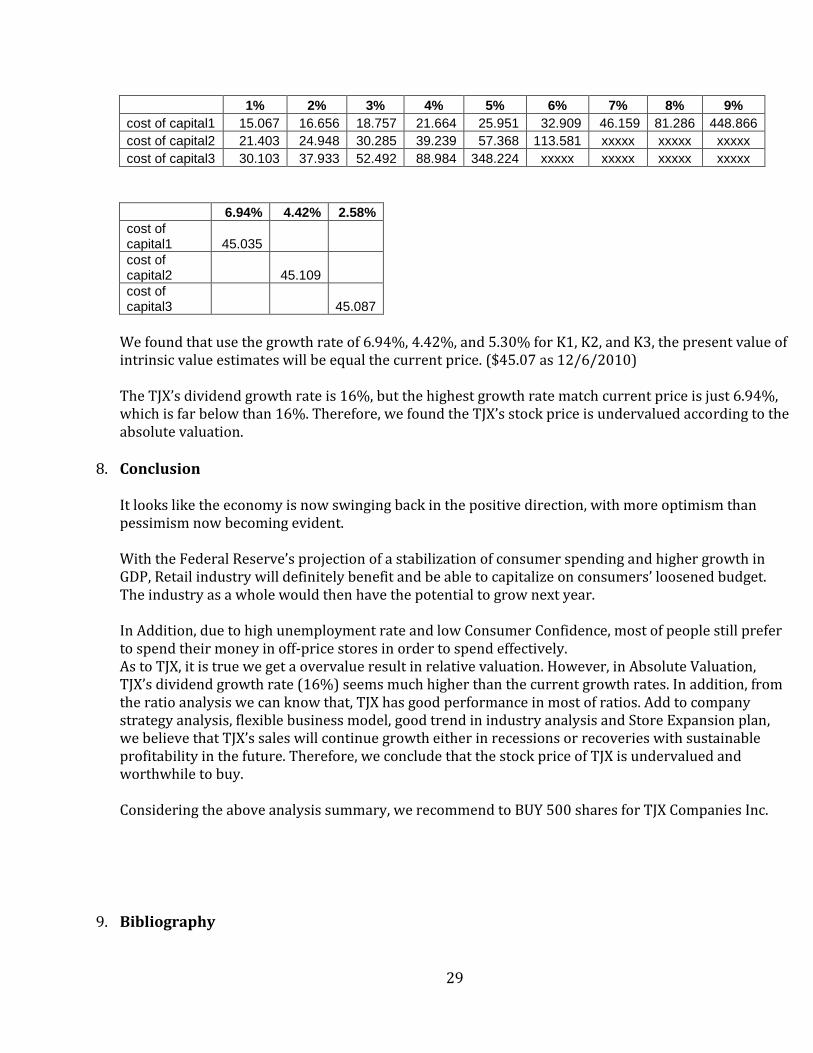
1% 2% 3% 4% 5% 6% 7% 8% 9%
cost of capital1 15.067 16.656 18.757 21.664 25.951 32.909 46.159 81.286 448.866
cost of capital2 21.403 24.948 30.285 39.239 57.368 113.581 xxxxx xxxxx xxxxx
cost of capital3 30.103 37.933 52.492 88.984 348.224 xxxxx xxxxx xxxxx xxxxx
6.94% 4.42% 2.58%
cost of capital1 45.035
cost of capital2 45.109
cost of capital3 45.087
We found that use the growth rate of 6.94%, 4.42%, and 5.30% for K1, K2, and K3, the present value of intrinsic value estimates will be equal the current price. ($45.07 as 12/6/2010) The TJX’s dividend growth rate is 16%, but the highest growth rate match current price is just 6.94%, which is far below than 16%. Therefore, we found the TJX’s stock price is undervalued according to the absolute valuation.
8. Conclusion It looks like the economy is now swinging back in the positive direction, with more optimism than pessimism now becoming evident. With the Federal Reserve’s projection of a stabilization of consumer spending and higher growth in GDP, Retail industry will definitely benefit and be able to capitalize on consumers’ loosened budget. The industry as a whole would then have the potential to grow next year. In Addition, due to high unemployment rate and low Consumer Confidence, most of people still prefer to spend their money in off-price stores in order to spend effectively. As to TJX, it is true we get a overvalue result in relative valuation. However, in Absolute Valuation, TJX’s dividend growth rate (16%) seems much higher than the current growth rates. In addition, from the ratio analysis we can know that, TJX has good performance in most of ratios. Add to company strategy analysis, flexible business model, good trend in industry analysis and Store Expansion plan, we believe that TJX’s sales will continue growth either in recessions or recoveries with sustainable profitability in the future. Therefore, we conclude that the stock price of TJX is undervalued and worthwhile to buy. Considering the above analysis summary, we recommend to BUY 500 shares for TJX Companies Inc.
9. Bibliography
30
1. TJX 2009 Annual Report- Retrieved Dec 2, 2010, from <http://www.tjx.com/investor_annualreports.asp> 2. http://finance.yahoo.com/ 3.Discount Stores Crop Up in Manhattan’s Elite Neighborhoods, Oct.12, 2010 http://www.nytimes.com/2010/10/13/realestate/commercial/13discount.html 4. TJX to open Marshalls Stores In Canada, July 20, 2010 http://money.ca.msn.com/investing/news/breaking-news/article.aspx?cp-documentid=24932659 5. The TJX Companies, Inc. Reports Strong Q3 FY11 EPS, up 14% over 40% Growth Last Year, Nov. 16,2010 http://www.businesswire.com/news/tjx/20101116006260/en 6. Standard & Poor’s Retailing Industry Survey http://www.netadvantage.standardandpoors.com/NASApp/NetAdvantage/showIndustrySurvey.do?code=reg 7. Christmas Holiday Spending & Retail Buying Trends, http://retailindustry.about.com/od/statisticsresearch/a/Christmas-Holiday-Spending-And-Retail-Buying-Trends-2005-2010-Sales-Predictions.htm


![[HR];[Report];[The most productive companies in Vietnam 2010]](https://img.pdfslide.tips/doc/110x75/55585c46d8b42a943b8b5092/hrreportthe-most-productive-companies-in-vietnam-2010.jpg)