Embed Size (px)
Citation preview

Title Near-ultraviolet inverse photoemission spectroscopy usingultra-low energy electrons
Author(s) Yoshida, Hiroyuki
Citation Chemical Physics Letters (2012)
Issue Date 2012-05
URL http://hdl.handle.net/2433/155958
Right
© 2012 Elsevier B.V.; This is not the published version. Pleasecite only the published version. この論文は出版社版でありません。引用の際には出版社版をご確認ご利用ください。
Type Journal Article
Textversion author
Kyoto University

1
Near-ultraviolet inverse photoemission spectroscopy using
ultra-low energy electrons
Hiroyuki Yoshida a,b
a Institute for Chemical Research, Kyoto University, Uji, Kyoto 611-0011, Japan
b Japan Science and Technology Agency, PRESTO, 4-1-8 Honcho Kawaguchi Saitama
332-0012,, Japan
TEL: +81-774-38-3083, FAX: +81-774-38-3084
Email-address: [email protected]
Key words: inverse photoemission spectroscopy; unoccupied state; electron affinity;
organic semiconductor; radiation damage
ABSTRACT
In previous inverse photoemission spectroscopy (IPES) experiments, either X-ray (h > 1
keV) or vacuum ultraviolet (h≈ 10 eV) photons were detected following the injection of
electrons with energies of 10 1000 eV into solid materials. Here, we demonstrate IPES in
the near-ultraviolet range (h < 5 eV) using electrons with kinetic energies less than 4 eV.
The energy resolution of the instrument is attained to be 0.27 eV. From the spectra of
copper phthalocyanine films, it is found that damage to the organic sample is significantly
reduced, demonstrating that this method is especially suitable for organic semiconducting
materials.
0 1 2 3 4 5
inte
nsity
(arb
. units)
280 nm (4.46 eV)
electron kinetic energy Ek / eV
335 nm (3.71 eV)
h = 250 nm (4.97 eV)
electron affinity:2.92±0.07 eV
CuPc
Evac
N
N
N
N
N
N
N
NCu
Evac
e -
unoccupied
states
valence
states
near UV light
h < 5 eV
slow electron
Ek = 0 – 4 eV
EA
inverse photoemission

2
1. Introduction
The frontier energy levels play a crucial role in
the physical properties of materials such as
electronic properties of semiconductors.
Regarding the frontier electronic states, the
valence states have been intensively examined by
photoemission spectroscopy (PES). In contrast,
the study of the unoccupied states has been
limited due to the lack of suitable experimental
methods. In principle, unoccupied states can be
examined by inverse photoemission spectroscopy
(IPES), which is a complimentary of PES [1, 2].
However, the cross section of IPES is lower than
that of PES by several orders of magnitude [3, 4].
As a result, energy resolution and signal intensity
must be compromised in the design of an IPES
apparatus. The low cross section also causes a
radiation damage of organic materials or
biomolecules, because a high total charge is
required to gain a reasonable signal-to-noise (SN)
ratio.
IPES can be regarded as a time-inversion of
PES. In IPES, mono-energetic electrons are
incident on a sample surface and the emitted
photons as a result of the radiative transition of
the electrons to a particular unoccupied state are
detected. The density of unoccupied states is
mapped out either by sweeping an electron kinetic
energy with a fixed photon energy, called the
Bremsstrahlung isochromat (BIS) mode, or by
scanning the photon energy at a fixed electron
kinetic energy, known as the tunable photon
energy (TPE) mode [1]. Compared with other
techniques such as optical or X-ray absorption, the
cross section of IPES is not strongly affected by
selection rules and the IPES intensity is usually
considered to represent the total density of
unoccupied states. In addition, the energy of
final anionic states is measured with respect to
the neutral ground state. Thus the electron
affinity (EA) of the sample can be evaluated from
the IPES spectrum.
IPES was first accomplished in the region of
X-ray energy [6, 7]. Usually electrons with
kinetic energies above 1 keV are incident to a
sample surface and emitted X-rays are analyzed
by a monochromator [8]. The instrumentation is
complicated and the throughput is significantly
low. In the late 1970’s, IPES in the vacuum
ultraviolet (VUV) range was demonstrated [9].
The measurement was carried out in the BIS
mode using a photon detector consisting of a
Geiger-Müller tube filled with iodine gas having
sensitivity above 9.23 eV and a calcium fluoride
(CaF2) window having a cut-off energy of 10 eV
making a bandpass sensitivity centered at 9.7 eV
with a pass band of 0.7 eV. This apparatus was
easy to construct and had high sensitivity and
reasonable energy resolution. Considerable efforts
have since been made to improve the energy
resolution of bandpass detectors by changing filter
materials, operating temperatures [10-12], or
filling gases [13, 14]. So far, the best reported
resolution is 82 meV [12]. The gas-filled
Geiger-Müller tube has sometimes been replaced
with a solid-state detector to further facilitate
operation [15-17].
The severe drawback of these VUV bandpass
detectors is that the bandpass energy and the
resolution are substantially limited by the
properties of the materials. High resolution is
inevitably achieved at a cost of sensitivity. In
addition, the asymmetric response function of the
detector and its low energy resolution have
prevented a precise analysis of the spectral peaks.
In this regard, the TPE mode using spectrometers
or spectrographs has an advantage in that much
higher freedom in the choice of the energy and
resolution is available and the response function is
well-defined [18-20]. The sensitivity, however, is
lower by one order of magnitude than the
bandpass detectors because of the small
acceptance angle of the grating and focusing optics
[1].
IPES has never been attempted in the
near-ultraviolet (NUV) or visible range. This is
probably because the theory predicts that the
cross section of inverse-photoemission process
decreases with photon energy. The ratio of the
differential cross sections for IPES, IPES , and
PES, PES , is expressed as
2ePESIPES / h
(1)
where e and h, respectively, are the wavelengths
of emitted electrons and photons [5]. The ratio is
103 in the X-ray range whereas it is decreased to
105 in the VUV range. The cross section
therefore is predicted to be even lower in IPES in
the NUV range which should be challenging in
terms of the signal intensity. On the other hand,
detection of photons in the NUV range allows
access to a wider range of selection in the photon
detection systems. Multilayer dielectric
interference filters [21, 22], for example, are
available which possess bandpass properties
centered from NUV (typically 250 nm) to infrared
range with a band width as small as 50 meV. The
transmittance at the center wavelength usually

3
photomultiplier
vacuum chamber
bandpassfilter
e-
lenssampleelectron gun
Evac
e-
h
5 eV etc.
Ek
0 – 4 eV
EB
< 4.5 eV
IPESspectrum
E
unoccupied states
valence states
(a) (b)
Figure 1. (a) Energy level diagram of inverse photoemission spectroscopy. Typical energy
values for the measurement in the NUV region are also indicated. (b) Schematic diagram of the
experimental setup which implements the concept displayed in panel (a).
exceeds 60%. The transmittance function is
usually rectangular, i.e. the transmittance is
almost constant in the transmission range while it
abruptly falls below 0.01% in the blocking range.
High resolution can thus be achieved without
losing the throughput. The transmitted photons
are then detectable with a highly-efficient
photomultiplier.
The radiation damage to organic or bio-related
samples has always been an important issue of the
IPES in the X-ray or VUV range. The damage
can be significantly reduced in the NUV IPES
scheme. Figure 1(a) shows the energy level
diagram of IPES with typical energies for the
NUV detection. Electrons of kinetic energy Ek
are incident on the sample surface and the
photons with the energy h are detected. The EA
of the organic materials falls mostly in the range
between 1 to 4.5 eV [23, 24]. If the NUV light of
e.g. 5 eV is detected, IPES spectra ranging
between 1 and 5 eV in the binding energy with
respect to the vacuum level can be measured with
the electron kinetic energy of 0 4 eV. It is
reported that the radiation damage of organic
molecules can be dramatically reduced at the
electron energy below 5 eV [25]. Thus the
method is particularly suitable for organic
materials such as organic semiconductors or
biomolecules to avoid the irradiation damage.
In the present study, we demonstrate the IPES
in the near-ultraviolet (NUV) range for the first
time. Measurements have been carried out in the
BIS-mode by sweeping the electron energy from 0
to 4 eV and detecting the NUV or visible photons
(250 434 nm). After discussion on the energy
resolution and sensitivity of the photon detector,
spectra are shown for a silver (Ag) film and copper
phthalocyanine (CuPc), which is a typical organic
semiconductor material, as examples, and the
overall energy resolution, determination of the
electron affinity, and the level of damage to
organic samples are discussed.
2. Experimental
Figure 1(b) shows a schematic diagram of the
experimental setup. The electron gun and the
sample specimen were placed inside the vacuum
chamber below 1 x 10⁷ Pa. The optical lens,
bandpass filter and photomultiplier were installed
in air.
The electron beam was generated by an
Erdman-Zipf electron gun [26] equipped with a
barium-oxide (BaO) coated disc cathode. The BaO
cathode was chosen for its low operating
temperature of T = 1150 K aiming to minimize the
thermal spread of electron velocities and avoid
excess stray light in the NUV region. The electron
current ranged from 0.2 to 2.0 A with a beam
diameter of 4 mm corresponding to current
densities in the ranges between 106 and 105 A
cm2. The electron current at the substrate is
recorded as a function of electron kinetic energy
measured by 6487 Picoammeter/Voltage Source,
Keithley Instruments Inc. The maximum of the
first derivative of the current is taken as the
origin of the electron kinetic energy; see

4
Supplementary Information for an example for the
Ag film.
In order to minimize the broadening in the beam
energy and size due to the space charge effect, a
bias voltage of 25 V was applied to the sample,
and the electron gun was placed as close to the
sample surface as possible. For this purpose,
optically transparent substrates were used, and
the photons transmitted through the sample
specimen were detected (see Supplementary
Information for the optical transmission spectra of
the substrate and samples).
The emitted photons were collected and focused
into a photon detector using a quartz lens with a
diameter of 50 mm placed 100 mm from the
sample. The acceptance angle was 0.11 sr. The
photon detector consisted of an optical bandpass
filter (BrightLine, Semrock Inc.) and a
photomultiplier tube (R585, Hamamatsu
Photonics K.K). The IPES spectrum was
obtained as photon intensities normalized by the
electron current at the sample.
3. Results and discussion
3.1. Properties of the bandpass detector
Five bandpass filters with nominal center
wavelengths of 254, 280, 285, 335, and 434 nm
were employed. The response function was well
expressed by a rectangular function. The
transmittances in the passband exceeded 65% for
filters with the center wavelength shorter than
300 nm and 90 % for those longer than 300 nm.
The band widths were chosen to be within 0.1 to
0.3 eV considering the energy spread of the
electron beam, 0.25 eV.
Figure 2(a) shows the sensitivity of the photon
detectors, composed of the bandpass filters and
the photomultiplier. The quantum efficiency was
calculated using the measured transmittances of
the filters and the reported quantum efficiency of
the photomultiplier [27]. The determined center
energies were 4.97, 4.46, 4.38, 3.71 and 2.86 eV
with full-widths at half maximum (FWHM) of 0.29,
0.20, 0.26, 0.11 and 0.14 eV, respectively.
For comparison, the sensitivities of typical VUV
IPES detectors composed of CaF2 or SrF2 filters
and an alkali halide (KCl) sensitized electron
multiplier are shown in Figure 2(b) [17]. The use
of optical multilayer interference bandpass filters
has a clear advantage in the energy resolution, the
sensitivity and the response function. The
resolution is more than two-fold and the quantum
efficiency is increased from three to six times. In
addition, tailing of the sensitivity curve of the
VUV bandpass detector on the low-energy side,
which impedes accurate determination of the
onset of IPES spectra, is absent.
3.2. IPES of Ag and energy resolution
The IPES spectrum of Ag is measured using the
bandpass detector described above. As shown in
Figure 3(a), the spectrum taken with a bandpass
filter of 4.46 eV (0.20 eV in FWHM) displays a
clearly visible Fermi edge. The instrumental
function is evaluated from the first derivative of
the spectrum around the Fermi level. The overall
resolution of the apparatus is estimated from
3 4 50.00
0.05
0.10
0.15
qu
an
tum
eff
icie
ncy
photon energy / eV
4.97 eV
4.46 eV
4.38 eV
3.71 eV2.86 eV
8 9 10 11
qu
an
tum
eff
icie
ncy
photon energy (eV)
SrF2+KCl
CaF2+KCl
(a) (b)
0.00
0.01
0.02
0.03
0.04
Figure 2. Comparison of the response functions of (a) combinations of optical bandpass filters
and a photomultiplier used in this study and (b) VUV bandpass detector typically used in IPES
measurements of organic materials [17]. Note that the scales of the photon energy are
identical in the two panels to facilitate comparison of the energy resolutions and response
functions.

5
Figure 3(b) to be 0.33±0.03 eV. When a bandpass
filter of 4.97 eV (0.29 eV in FWHM) is used, the
FWHM of the instrument is slightly increased to
0.37±0.03 eV.
The overall energy resolution is mainly
determined by the energy spread of the electrons
E and the energy resolution of the bandpass
filter w. If the instrumental function is expressed
by convolution of only the energy spread of
electrons and the response function of bandpass
detector yields
2 = E2 + w2. (2)
The energy spread electron can be expressed as a
Maxwell-Boltzmann distribution with its width of
E =2.5 kT, where k is the Boltzmann constant.
The temperature of T = 1150 K for the BaO
cathode yields E = 0.25 eV. This value agrees
well with the experimental value obtained as an
FWHM of the first derivative of the electron
current at the substrate (see Supplementary
Information for the I-V curve and its first
derivative). We can therefore assume the
electron energy spread to be E = 0.25 eV with
confidence.
According to Eq. (2), the overall energy resolutions
are calculated to be = 0.32 eV for filters of 4.46
eV (w = 0.20 eV) and 0.38 eV for that of 4.97 eV (w = 0.29 eV). These estimates agree with the
experimental values from the Fermi edge of Ag.
Although the Fermi edge of Ag is not accessible
with other filters having lower center energies, the
overall energy resolution can reasonably be
estimated from Eq. (2). For example, the filter
centered at 3.71 eV with w = 0.11 eV gives overall
resolution of 0.27 eV in FWHM. Since the values
are close to E = 0.25 eV, the overall resolution is
considered to be limited by the energy spread of
electron rather than the resolution of band pass
filters.
3.3. IPES spectra of an organic sample, CuPc The present method has been applied to an
organic material, CuPc, because this compound
was frequently measured in earlier studies [28-36]
and therefore provides a good reference for
comparison of the performance of IPES
spectrometers. The IPES spectra measured with
different bandpass filters are plotted in Figure 4
as a function of electron kinetic energy. The
vacuum levels Evac, indicated by dotted lines, are
the photon energy above the origin of the electron
kinetic energy. The Fermi levels EF are
determined as that of the Ag layer discussed in
Sec. 3.2. The kinetic energy of electrons was
swept from 0 to 4 eV. Each scan took 4000 s with
an electron current of ~1.3 A. Similar spectra
were obtained with 0.25 A to confirm that the
sample films were not damaged by the electron
irradiation. Nor were any spectral changes
observed after at least 13 extended scans. The
spectra shown in Figure 4 are an average of 3 or 4
scans.
The overall features of the spectra are similar to
those reported previously in the VUV range
[28-36]. The onsets (indicated by the arrows) and
the spectral features (vertical lines) shift rigidly
according to the center transmission energies of
the bandpass filters. From this observation, the
following three facts have been revealed:
1. We have confirmed that the measured IPES
spectrum reflects the density of unoccupied states
of CuPc. The IPES process can be regarded as
radiative transition of electrons from a state above
the vacuum level (initial state) to an unoccupied
state of the CuPc molecule (final state). Since the
electron energy is low, the initial state might be
influenced by the potential produced by the
molecules. Nevertheless, similarity of the
spectra observed at different detection energies
suggests that the effect of the initial state is
negligible.
Figure 3. (a) IPES spectrum around the Fermi
level of an Ag thin film using a bandpass filter of
4.46 ± 0.1 eV. (b) The first derivative of the
experimental spectrum showing the
instrumental function (see Supplementary
Information) to evaluate the overall energy
resolution.

6
2. A wider range of energy region can be surveyed
by changing the bandpass filters even if only a
limited range of the electron energy is swept. In
the present experiment, for instance, the IPES
spectra covered the range of more than 6 eV (from
4.97 to 1.14 eV with respect to the vacuum level),
as shown in Figure 4, even though the electron
kinetic energy was varied only from 0 to 4 eV.
This feature is advantageous for significant
reduction of the electron irradiation damage [25].
3. Property parameters of the sample such as
electron affinity and transport energy gaps can be
determined more accurately than when the
spectra are measured at only a single photon
energy. In the measurement of IPES, the kinetic
energy of electrons is usually assumed to change
linearly with the cathode potential. However,
this hypothesis does not strictly hold, because
slower electrons may be affected more easily by
the surrounding electrostatic and magnetic fields
as well as the space charge. Such systematic
errors can in principle be reduced by measuring
the spectra at different photon energies.
Figure 5 shows the onset energy of the spectra
as a function of the photon energy. The onsets
are determined as the intersection between the
baseline and a straight line fitted to the spectral
onset, which is commonly used in the analysis of
photoemission spectra of organic materials. After
subtracting the values by half of the instrumental
resolution calculated by Eq. (2) (plotted by circles),
the onset energies are fitted to a linear function
with a slope of unity (solid line) to determine the
electron affinity from the intercept; the threshold
electron affinity of CuPc in the solid state
determined with this procedure, 2.92 0.07 eV,
agrees well with previous reports [29, 32].
Contrary to the previous reports, however, the
onset of the spectra is clearly observed in the
present work, which enables us to determine the
electron affinity more precisely.
3.4. Sample damage induced by electron irradiation
We have examined the sample damage induced
by electron irradiation. Figure 6(a) compares the
1st, 6th and 13th scans of the spectra. As one
scan takes 4000 s, the durations of the electron
irradiation before the measurements correspond
to 0, 6.6 and 14.4 hours, respectively. During
each scan, the sample is irradiated with electrons
ranging between 0 and 4.0 eV in kinetic energy
0
10
20
0
20
40
0 1 2 3 4 50
10
20
300
20
40
0
10
200 1 2 3 4 5
EF
inte
nsity /
cp
s
A-1
4.46 eV
4.38 eV
electron kinetic energy / eV
2.86 eV
3.71 eV
Evac
EF
4.97 eV
EF
Figure 4. IPES spectra of copper
phthalocyanine (CuPc) using the bandpass
filters with different center energies. The
vacuum Evac and Fermi EF levels are shown
by vertical dotted and solid lines, respectively,
while the onset and significant features are
indicated by arrows and vertical bars,
respectively.
3.0
3.5
4.0
4.5
5.0
0.0 0.5 1.0 1.5 2.0
onset energy / eV
photo
n e
nerg
y /
eV
electron affinity
Figure 5. The onset energies determined by
the spectra shown in Figure 4 plotted against
the photon energy (squares). The
instrumental resolution is taken into account
(circles), being fitted to a linear relation with
the slope of unity (line) to determine the
electron affinity of CuPc from the intercept of
the line (see text).

7
and 1.3 A in current. Even after 14.4 hours of
this electron irradiation, no significant
degradation of spectral features was observed.
In conventional IPES measured in the VUV
range, the electron energies are usually scanned
from 5 to 20 eV, which takes 20 to 30 min with a
density of 107 to 104 A cm [37-39]. In order to
assess the sample damage under such conditions,
the spectral changes were examined after every 10
min of electron irradiation at 10 eV in kinetic
energy with 1.4 A in current (corresponding to ~
1x10⁵ A cm2 in current density). As shown in
Figure 6(b), the spectral line shape is broadened
and the onset of the spectrum changes to lower
energy after only 10 min of electron irradiation.
After one hour, the onset of the spectrum becomes
totally unclear. Some of the spectra of CuPc
reported earlier [28, 31, 32] showed broad peaks
tailing to the Fermi level of the substrate with no
distinct onset. Such spectral features have been
explained by the limited energy resolution, but the
present results indicate that radiation damage
also significantly influences the spectra. CuPc is
regarded as one of the most durable organic
compounds against electron irradiation [40]; this
suggests that most of the organic materials are
readily damaged under the irradiation condition of
the conventional IPES in the VUV region.
4. Conclusion
We have demonstrated inverse photoemission
spectroscopy in the near-ultraviolet or visible
photon range. Detection of photons having
wavelengths longer than 250 nm (less than 5 eV in
the photon energy) enables us to use a
combination of optical bandpass filters and a
photomultiplier. The resulting energy resolution
of the photons ranges from 0.11 to 0.29 eV and the
quantum efficiency exceeds 10%. The attained
resolution is almost comparable to the best record
achieved with bandpass detectors in the VUV
range reported in the literature [11, 12]. The
overall energy resolution estimated from the
Fermi edge of Ag is ~ 0.3 eV, (ranging between
0.27 eV and 0.37 eV depending on the bandpass
filter), which is mainly limited by the thermal
spread of the electron energy.
The performance of the apparatus has been
examined by measuring the IPES spectra of
typical organic semiconductor material, copper
phthalocyanine (CuPc). Since the energy
resolution is high enough, the response function of
the photon detector is rectangular, and the
measurements are carried out at various photon
energies, the threshold electron affinity can be
determined much more precisely than before; the
determined value is 2.92 0.07 eV.
As the detected photon energy is below 5 eV, most
of the solid material can be measured with
electrons with kinetic energies below 4 eV. The
use of electrons with low enough kinetic energy
has caused significant reduction of radiation
damage in organic samples. The damage in CuPc
is found to be negligible in NUV IPES even after
14 hours of measurements, whereas significant
Figure 6. Time dependence of IPES spectra showing the radiation damage of CuPc samples.
(a) The spectra taken under normal experimental conditions. No significant spectral changes
are observed even after 14.4 hours of the measurement. (b) Spectra taken after electron
irradiations of 10 eV in kinetic energy with 1.4 A in current. This condition is similar to the
usual VUV IPES measurement showing apparent spectral changes due to the sample damage.

8
degradation was observed within one hour with
VUV-UPS measured under otherwise comparable
conditions. IPES in the NUV range is therefore
especially suitable for studies of unoccupied states
of organic materials.
Acknowledgements
The author thanks Prof. Yuika Saito of Osaka
University for valuable information on the optical
bandpass filters, and Prof. Kaname Kanai of
Tokyo Science University, Prof. Ian Hill of
Dalhousie University, and Dr. Gerog Koller of
Karl-Franzens University Graz for helpful
information on the electron gun. Prof. Naoki
Sato and Dr. Richard Murdey of Kyoto University
are acknowledged for their continual
encouragement. This work was supported by JST,
PRESTO.
References
[1] P.D. Johnson, S.L. Hulbert, Rev. Sci. Instrum.
61 (1990) 2277.
[2] J.C. Fuggle, J.E. Inglesfield, Top. Appl. Phys.
69 (1992) 1.
[3] J.B. Pendry, Phys. Rev. Lett. 45 (1980) 1356.
[4] J.B. Pendry, J. Phys. C 14 (1981) 1381.
[5] P.D. Johnson, J.W. Davenport, Phy. Rev. B 31
(1985) 7521.
[6] P. Ohlin, Ark. Mat. Astron. Fys. 29A (1942) 3.
[7] B.R.A. Nijboer, Physica 12 (1946) 461.
[8] J.K. Lang, Y. Baer, Rev. Sci. Instrum. 50 (1979)
221.
[9] V. Dose, Appl. Phys. 14 (1977) 117.
[10] V. Dose, T. Fauster, R. Schneider, Appl. Phys.
A-Mater. Sci. Process. 40 (1986) 203.
[11] R. Stiepel, R. Ostendorf, C. Benesch, H.
Zacharias, Rev. Sci. Instrum. 76 (2005) 063109.
[12] M. Maniraj, S.W. D'Souza, J. Nayak, A. Rai, S.
Singh, B.N.R. Sekhar, S.R. Barman, Rev. Sci.
Instrum. 82 (2011) 093901.
[13] D. Funnemann, H. Merz, J. Phys. E 19 (1986)
554.
[14] J.A. Lipton-Duffin, A.G. Mark, A.B. McLean,
Rev. Sci. Instrum. 73 (2002) 3149.
[15] N. Babbe, W. Drube, I. Schafer, M. Skibowski,
J. of Phys. E 18 (1985) 158.
[16] K. Yokoyama, K. Nishihara, K. Mimura, Y.
Hari, M. Taniguchi, Y. Ueda, M. Fujisawa, Rev. Sci.
Instrum. 64 (1993) 87.
[17] F. Schedin, G. Thornton, R.I.G. Uhrberg, Rev.
Sci. Instrum. 68 (1997) 41.
[18] G. Chauvet, R. Baptist, J. Electron Spectrosc.
Relat. Phenom. 24 (1981) 255.
[19] T. Fauster, F.J. Himpsel, J.J. Donelon, A.
Marx, Rev. Sci. Instrum. 54 (1983) 68.
[20] T. Fauster, D. Straub, J.J. Donelon, D. Grimm,
A. Marx, F.J. Himpsel, Rev. Sci. Instrum. 56 (1985)
1212.
[21] J.H. Moore, C.C. Davis, M.A. Coplan, S.C.
Greer, Building Scientific Apparatus, 4th ed.,
Cambridge University Press, New York, 2009,
Chap. 4.3.8 and Table 4.9.
[22] L. Martinu, D. Poitras, J. Vac. Sci. Technol. A
18 (2000) 2619.
[23] A. Kahn, N. Koch, W.Y. Gao, J. Polym. Sci. B
41 (2003) 2529.
[24] P.I. Djurovich, E.I. Mayo, S.R. Forrest, M.E.
Thompson, Org. Electron. 10 (2009) 515.
[25] B. Boudaiffa, P. Cloutier, D. Hunting, M.A.
Huels, L. Sanche, Science 287 (2000) 1658.
[26] P.W. Erdman, E.C. Zipf, Rev. Sci. Instrum. 53
(1982) 225.
[27]
http://jp.hamamatsu.com/resources/products/etd/p
df/R464_R585_TPMH1140E03.pdf
[28] M.L.M. Rocco, K.H. Frank, P. Yannoulis, E.E.
Koch, J. Chem. Phys. 93 (1990) 6859.
[29] I.G. Hill, A. Kahn, Z.G. Soos, R.A. Pascal,
Chem. Phys. Lett. 327 (2000) 181.
[30] H. Yoshida, K. Tsutsumi, N. Sato, J. Electron
Spectrosc. Relat. Phenom. 121 (2001) 83.
[31] R. Murdey, N. Sato, M. Bouvet, Mol. Cryst.
Liquid Cryst. 455 (2006) 211.
[32] D.R.T. Zahn, G.N. Gavrila, M. Gorgoi, Chem.
Phys. 325 (2006) 99.
[33] H.J. Ding, Y.L. Gao, Appl. Phys. Lett. 92
(2008) 053309.
[34] S. Krause, M. B. Casu, A. Schöll, E. Umbach,
New J. Phys. 10 (2008) 085001.
[35] J. Xiao, P.A. Dowben, J. Mater. Chem. 19
(2009) 2172.
[36] K. Akaike, A. Opitz, J. Wagner, W. Brutting, K.
Kanai, Y. Ouchi, K. Seki, Org. Electron. 11 (2010)
1853.
[37] C.I. Wu, Y. Hirose, H. Sirringhaus, A. Kahn,
Chem. Phys. Lett. 272 (1997) 43.
[38] N. Sato, H. Yoshida, K. Tsutsumi, J. Electron
Spectrosc. Relat. Phenom. 88 (1998) 861.
[39] T. Nishi, T. Iwahashi, H. Yamane, Y. Ouchi, K.
Kanai, K. Seki, Chem. Phys. Lett. 455 (2008) 213.
[40] L. Reimer, in: P. W. Hawkes (Ed.),
Transmission Electron Microscopy: Physics of
Image Formation and Microanalysis, Springer
Series in Optical Sciences, Vol. 36, Springer,
Berlin, 1997, Chap. 11.

Supplementary Information for
“Near ultraviolet inverse photoemission spectroscopy using
ultra-low energy electrons” by Hiroyuki Yoshida
S1. Sample preparation and transmittance of NUV light
Sample materials of Ag and CuPc were vacuum-deposited on quartz glass plates coated
with indium tin-oxide (ITO) with the thickness of 10 or 20 nm. The thicknesses of Ag
and CuPc were 2 and 7 20 nm, respectively, and the deposition rates were ~ 1 nm
min1. The transmittance of NUV light ranged between 40 and 80%, as shown in
Figure S1.
200 400 600 8000
20
40
60
80
100
200 400 600 8000
20
40
60
80
100
(b)
tran
sm
itta
nce %
CuPc 10nm/ITO 20nm
CuPc 10nm/ITO 20nm
CuPc 2nm/ITO 20nm
ITO 20nm
(a)
tran
sm
itta
nce %
CuPc 10nm/ITO 10nm
CuPc 10nm/ITO 10nm
CuPc 2nm/ITO 10nm
ITO 10nm
Figure S1: Optical transmission spectra of vacuum-deposited bare ITO samples on
quartz glass plates and those of CuPc on ITO-coated plates. The thicknesses of the
ITO layers were (a) 10 nm and (b) 20 nm.

S2. Sample current and energy spread of electron beam
The electron current measured at the Ag film on ITO substrate was recorded as a
function of electron kinetic energy, as shown in Figure S2. The first derivative of the
current shown in panel (b) is ascribed to the energy spread of the electron beam. The
energy spread is well approximated with the Maxwellian distribution having FWHM of
0.25 eV. The results are consistent with the thermal energy spread of electrons
estimated from a cathode with T = 1150 K. The peak of the first derivative of the
current for each sample is assigned to the origin of the electron kinetic energy.
Figure S2: (a) The sample current of the Ag thin film as a function of electron kinetic
energy. (b) The first derivative of the sample current showing the energy spread of the
electron beam.
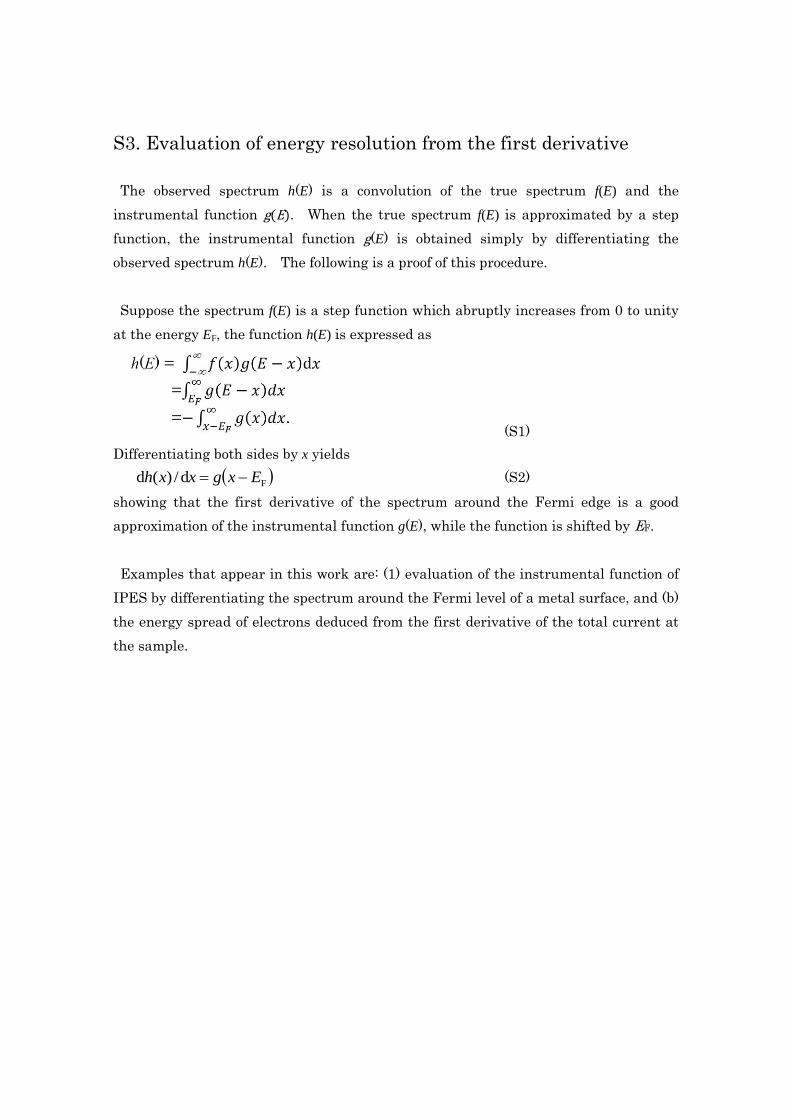
S3. Evaluation of energy resolution from the first derivative
The observed spectrum h(E) is a convolution of the true spectrum f(E) and the
instrumental function g(E). When the true spectrum f(E) is approximated by a step
function, the instrumental function g(E) is obtained simply by differentiating the
observed spectrum h(E). The following is a proof of this procedure.
Suppose the spectrum f(E) is a step function which abruptly increases from 0 to unity
at the energy EF, the function h(E) is expressed as
(S1)
Differentiating both sides by x yields
Fd/)(d Exgxxh (S2)
showing that the first derivative of the spectrum around the Fermi edge is a good
approximation of the instrumental function g(E), while the function is shifted by EF.
Examples that appear in this work are: (1) evaluation of the instrumental function of
IPES by differentiating the spectrum around the Fermi level of a metal surface, and (b)
the energy spread of electrons deduced from the first derivative of the total current at
the sample.