Embed Size (px)
Citation preview
Title Oxidation Kinetics of Methyl Linoleate and α-Linolenate inBulk and Oil-in-water Emulsion Systems( Dissertation_全文 )
Author(s) Ma, Tiezheng
Citation Kyoto University (京都大学)
Issue Date 2014-03-24
URL https://doi.org/10.14989/doctor.k18313
Right
Type Thesis or Dissertation
Textversion ETD
Kyoto University

Oxidation Kinetics of Methyl Linoleate and α-Linolenate in
Bulk and Oil-in-water Emulsion Systems
Tiezheng Ma
2014

i
CONTENTS
General Introduction …………………………………………………………………1
I.1 Oxidation of Unsaturated Fatty Acids in Food Systems …………………………1
I.2 Oxidation of Unsaturated Fatty Acids in Bulk Phase ……………………………3
I.3 Oxidation of Unsaturated Fatty Acids in Emulsion ………………………………4
I.4 Aims of This Thesis ………………………………………………………………6
Chapter 1
Kinetics of Oxidation of Different Depths of Methyl Linoleate in Bulk Phase ……
…………………………………………………………………………………………7
1.1 Introduction ………………………………………………………………………7
1.2 Materials and Methods …………………………………………………………8
1.3 Results and Discussion …………………………………………………………9
1.4 Conclusion ………………………………………………………………………17
Chapter 2
Oxidation of Methyl Linoleate Mixed with Methyl Octanoate, Laurate or
Palmitate ……………………………………………………………………………18
2.1 Introduction ……………………………………………………………………18
2.2 Materials and Methods …………………………………………………………18
2.3 Results and Discussion …………………………………………………………21
2.4 Conclusion ………………………………………………………………………27

ii
Chapter 3
Effects of Various Emulsification Methods on the Oxidation of Methyl Linoleate
…………………………………………………………………………………………29
3.1 Introduction ……………………………………………………………………29
3.2 Materials and Methods …………………………………………………………29
3.3 Results and Discussion …………………………………………………………32
3.4 Conclusion ………………………………………………………………………37
Chapter 4
Effect of Droplet Size on Autoxidation Rates of Methyl Linoleate and α-Linolenate
in an Oil-in-water Emulsion …………………………………………………………38
4.1 Introduction ……………………………………………………………………38
4.2 Materials and Methods …………………………………………………………38
4.3 Results and Discussion …………………………………………………………41
4.4 Conclusion ………………………………………………………………………47
Concluding Remarks ………………………………………………………………49
References ……………………………………………………………………………51
Acknowledgements …………………………………………………………………59
List of Publications …………………………………………………………………61

1
General Introduction
I.1 Oxidation of Unsaturated Fatty Acids in Food Systems
Polyunsaturated fatty acids (PUFAs), such as linoleic, α-linolenic, arachidonic,
eicosapentaenoic and docosahexaenoic acids, would have many biological functions. It
was reported that PUFAs reduce the susceptibility to mental illness or Alzheimer’s
disease, and protect against heart disease by decreasing serum triacylglycerol and
cholesterol (Krutulyte et al., 2008; Ritter-Gooder et al., 2008; Siró et al., 2008;
Ramsden et al., 2013). However, their chemical instability makes them susceptible to
oxidation and other chemical changes that lead to deterioration and rancidity in natural
and processed foods (Coupland et al., 1996; Furuta et al., 2005). The lipid oxidation,
which occurs during processing, storage and cooking, is always of great concern to the
food industry because it leads to the generation of undesirable rancidity and potentially
toxic reaction products (Frankel, 1980; Guillén and Goicoechea, 2008; Uriarte and
Guillén, 2010). Oxidation of lipids results in the formation of hydroperoxide, which is
the primary product of the oxidation and may have physiological toxicity. Nutritional
values of foods would be damaged by a wide range of volatile and non-volatile
secondary products formed from the hydroperoxides (Frankel, 1980; Simic et al., 1992;
Halliwell et al., 1995). Therefore, food manufactures need to develop methods for
preventing, or at least retarding the oxidation in food products.
Progression of the oxidation, which is affected by many factors, such as temperature,
humidity, and the presence of a prooxidant or antioxidant, is considered to be very
complicated (Labuza, 1973; Frankel, 1980; Simic et al., 1992; Park et al., 2005;
Aladedunye et al., 2012; Kadowaki et al., 2012a; Kadowaki et al., 2012b; Roman et al.,
2
2013; Kim et al., 2014). The oxidation process, including initiation, propagation and
termination steps, is interpreted as a free radical chain mechanism (Frenkel et al., 1991;
Simic et al., 1992). At the initiation step, unsaturated fatty acids (LH) form alkyl
radicals (L·) in the presence of initiators (In·), including endogenous and exogenous
species (Frankel, 1980).
In· + LH → InH + L·
In the presence of light, unsaturated lipids also form hydroperoxides by reacting with
singlet oxygen which is produced by sensitized photooxidation (Gollnick, 1978).
Because of high reactivity of peroxyl radicals with the allylic or bisallylic bonds as well
as high reactivity of resulting fatty acid radicals with oxygen, the peroxidation of
unsaturated fatty acids is mainly a chain reaction. By the radical chain mechanism,
hydroperoxides (LOOH) is prone to be formed as the primary product of the oxidation
at the propagation step (Simic et al., 1992).
L· + O2 → LOO·
LOO· + LH → LOOH + L·
This radical chain mechanism terminates through the following reactions (McClements
and Decker, 2000).
LOO· + LOO· → LOOL + O2
LOO· + L· → LOOL
L· + L· → LL
By controlling a certain step, usually the initiation step or one of the early propagation
steps, it is possible to effectively retard the lipid oxidation (McClements and Decker,
2000).
The most commonly used method for retarding lipid oxidation in foods is the addition

3
of antioxidants (Giroux et al., 2007; Huber et al., 2009). Unfortunately, some of the food
additives, especially the chemically synthesized antioxidants, are recognized as unsafe
ingredients in spite of their relatively higher efficiency. In addition, it is difficult to
approve new antioxidants due to economic barriers and food safety regulations. Thus,
food manufacturers are prompted to use existing antioxidants more efficiently
(Chaiyasit et al., 2007). Combination of different kinds of the antioxidants would be
better for lipid antioxidation (Choe and Min, 2006). Furthermore, undesirable lipid
oxidation is also retarded by the control of oxygen concentration in food. The
concentration of oxygen can be reduced by packing foods under vacuum or nitrogen.
The rancidity potential can also be reduced by partial hydrogenation of lipids to convert
the unsaturated lipid constituents into the saturated ones. However, it would lead to the
formation of trans fatty acids, which is atherogenic by increasing low density
lipoprotein and decreasing high density lipoprotein (Duxbury, 2005).
I.2 Oxidation of Unsaturated Fatty Acids in Bulk Phase
When oils are stored in a bulk phase, there is an interface between oil and air through
which oxygen diffuses into oil. In a gas-liquid reaction, diffusion of the gas into the
liquid generally affects the reaction rate of the gas with the liquid (Levenspiel, 1962).
During the oxidation reaction, the stoichiometric coefficient of oxygen to PUFA would
be equal to or greater than unity (Adachi et al., 1995a). Thus, at low oxygen
concentrations, the rate-limiting step for lipid oxidation is the diffusion of oxygen. At
the higher concentrations, the rate of oxygen diffusion is much higher than that of lipid
oxidation, thus oxidation itself becomes the rate-limiting step (Coupland et al., 1996).
Therefore, the reaction rate of oxidation can be limited by the supply of oxygen in some

4
cases (Karel, 1986).
Moreover, the reaction rate of lipid oxidation depends on the degree of unsaturation
and the concentration of fatty acids (Chen et al., 2001; Achir et al., 2006; Marmesat et
al., 2012; Richaud et al., 2012; Maire et al., 2013). It was reported that the presence of
saturated fatty acid or its methyl ester also retarded the oxidation of an unsaturated
substrate because the saturated component acts as a diluent to decrease the
concentration of the unsaturated substrate (Ishido et al., 2001; Ishido et al., 2002a;
Ishido et al., 2002b). Methyl esters of fatty acids, which are more prone to evaporate,
are often used in the model oxidation systems for kinetic analysis. In these model
systems, there is a possibility that the concentration of the coexisting methyl esters
changes as the reaction processes by the evaporation, especially at relatively high
temperature. Thus, the oxidation behavior of unsaturated substrate would also be
affected.
I.3 Oxidation of Unsaturated Fatty Acids in Emulsion
A system that consists of oil droplets dispersed in an aqueous phase is called an
oil-in-water (O/W) emulsion. To prepare O/W emulsions that are kinetically stable for a
reasonable period of time, chemical substances known as emulsifiers must be added
prior to emulsification. Emulsifiers, which are surface active molecules that adsorb on
the surface of the freshly formed droplets during emulsification, would greatly impact
the lipid oxidation rate in the oil phase of emulsion by affecting the electrical charge of
droplet, or the physical- or chemical-barrier effect (Chen and Nawar, 1991; Mei et al.,
1998; Mancuso et al., 1999; McClements and Decker, 2000; Silvestre et al., 2000; Boon
et al., 2008; Taherian et al., 2011; Berton-Carabin et al., 2013). As mentioned before, the
5
presence of a saturated fatty acid affects the oxidation of the mixed unsaturated
substrate. This dilution effect also occurred in an O/W emulsion system where droplets
of the unsaturated lipid are covered with an emulsifier, the hydrophobic moiety of
which was a saturated acyl group (Imai et al., 2008).
There are various emulsification methods for preparing emulsions. High-speed
stirring, high-pressure homogenization, ultrasonic homogenization and membrane
filtration are commonly used. In some methods, the emulsification process subjects the
oil to mechanical stress, which causes deterioration of the oil (Kuhn et al., 2012).
However, some results have shown that oil deterioration is suppressed in emulsions
(Atarés et al., 2012; Poliseli-Scopel et al., 2012; Rodriguez-Turienzo et al., 2012; Kim
et al., 2013). Therefore, there are no definite conclusions regarding the loss of oil quality,
including its oxidation, during emulsification. This uncertainty arises because the
oxidation of lipid is evaluated by using food-based materials containing various
components, especially the emulsifiers.
As a critical physical characteristic of the droplets in O/W emulsions, the size of oil
droplet is very considerable, especially for the possibility of its effect on oxidation rate
of the unsaturated fatty acid which would be contained in the oil phase. These
unsaturated fatty acids can be oxidized by oxygen supplied from the aqueous phase
through the O/W interface. When the specific surface area of oil droplet becomes large,
and sufficient amount of oxygen is supplied through the interface, the oxidation reaction
itself would be the rate limiting step. However, the effect of the mass transfer of oxygen
through the interface on the oxidation rate of the fatty acid can be significant when the
oil droplet size becomes large. Thus, lipid oxidation in O/W emulsion systems may
depend on oil droplet size. It was reported that the oxidation of docosahexaenoic acid
6
and sunflower seed oil is accelerated in emulsions with smaller oil droplets (Gohtani et
al., 1999; Lethuaut et al., 2002). Conversely, decreases in oil droplet size reportedly
decelerate lipid oxidation (Nakaya et al., 2005; Imai et al., 2008; Ries et al., 2010). In
addition, no significant effect of oil droplet size on the oxidation rate has also been
reported (Roozen et al., 1994; Osbern et al., 2004; Dimakou et al., 2007; Sun et al.,
2009). The inconsistency in conclusions regarding the dependence of susceptibility to
oxidation on oil droplet size may be explained by differences in susceptibility to
oxidation of the lipid used as the oil phase, the range of tested oil droplet sizes,
temperature, and the method used to assess lipid oxidation.
I.4 Aims of This Thesis
In this study, methyl linoleate as a representative PUFA was used for kinetic analysis
of oxidation with different depths or amounts in bulk phase to elucidate the impact of
oxygen diffusion. Effect of the partial pressure of oxygen on the oxidation was also
evaluated. In addition, the oxidation process of methyl linoleate was evaluated in the
presence of saturated fatty acid methyl esters in the consideration of the volatility of the
methyl esters.
Different methods were applied for the emulsification of methyl linoleate without an
emulsifier to estimate the effects of the emulsification method on lipid deterioration.
Furthermore, in order to evaluate the effect of droplet size on the oxidation of PUFAs in
O/W emulsion system, the oxidation processes of methyl linoleate and methyl
α-linolenate were evaluated when they were emulsified in various oil droplet sizes on a
micrometer scale.
7
Chapter 1
Kinetics of Oxidation of Different Depths of Methyl Linoleate in Bulk
Phase
1.1 Introduction
When the specific interface area between the gas and liquid is sufficiently small in
gas-liquid reaction, diffusion of the gas into the liquid is limited, thereby retarding the
reaction. This is applicable to the oxidation of bulk oil because the specific interfacial
area of air and oil stored in bulk phase is usually small; thus, diffusion of oxygen into
oil would be limited. However, there are few quantitative studies regarding the
oxidation behavior of bulk oil from the viewpoint of the effect of oxygen diffusion on
the oxidation reaction rate.
The stoichiometric coefficient of oxygen to PUFA is equal to or greater than unity for
the oxidation (Adachi et al., 1995a). Therefore, the oxidation is also retarded when the
amount or partial pressure of oxygen is limited. There are some reports for the effect of
the partial pressure or the concentration of oxygen on the oxidation kinetics (Adachi et
al., 1995b; Yoshii et al., 1999). However, the quantitative studies of the oxidation still
remain insufficient.
In this chapter, the oxidation of different amounts of methyl linoleate as a model oil
was kinetically analyzed. The effect of the partial pressure of oxygen on the oxidation of
methyl linoleate was also evaluated.
8
1.2 Materials and Methods
1.2.1 Materials
Methyl linoleate (purity, > 95%) and methyl myristate (> 98%) were purchased from
Tokyo Chemical Industry (Tokyo, Japan).
1.2.2 Oxidation of different depths or amounts of methyl linoleate
To evaluate the effect of the depth of methyl linoleate on oxidation, different amounts
of methyl linoleate (i.e., 0.147, 0.299, 0.736, 1.47 or 2.94 g) were placed in
flat-bottomed glass cups (1.5 cm I.D. × 3.0 cm); these samples corresponded to oil
depths of 1.0, 2.0, 5.0, 10 and 20 mm, respectively. Approximately 90 sets of the
samples were placed in a plastic container (300 mm length × 150 mm width × 150 mm
height). Air was then flowed through the container at 15 mL/min after passing through
silica gel for conducting the oxidation reaction. The plastic container was stored at 65°C
in an oven (DN-400, Yamato Scientific, Tokyo, Japan).
Three samples were used to monitor the change in the weight of methyl linoleate. At
appropriate intervals, these samples were removed from the container, weighed, and
replaced in the container. Concurrently, a sample for gas chromatographic (GC) analysis
was also removed, and the substrate in the cup was well mixed. Approximately
0.12‒0.14 g of accurately weighed substrate was transferred into another cup containing
a given amount (ca. 4‒5 g) of 0.1 mol/L methyl myristate in hexane as the internal
standard for GC analysis.
A small-amount sample of methyl linoleate was also oxidized. Methyl linoleate
(2.208 g) was dissolved in 50 mL of hexane, and a sample of the solution (20, 40, 100
or 200 μL) was placed in a flat-bottomed glass cup. Hexane was then removed under
9
reduced pressure, resulting in 1, 2, 5 and 10 μL, respectively, of methyl linoleate in the
cups. Oxidation was then performed by using the method described above. At
appropriate intervals, a cup was removed from the container, and the amount of
unoxidized methyl linoleate in the sample was determined by GC.
1.2.3 Effects of partial pressure of oxygen on oxidation
Methyl linoleate (2 µL) was placed in a flat-bottomed cup, which was then loaded
into a 50 mL screw-cap bottle. Approximately 10 bottles were placed in a desiccator,
which was then evacuated and filled with nitrogen-air mixed gas. The partial pressures
of oxygen in the mixed gas ranged from 0.2 to 10 kPa. The evacuation and filling
operations were performed twice to ensure sufficient replacement of air with the mixed
gas. The bottles were then immediately capped and placed in an oven at 65°C to
perform the oxidation. Periodically, a bottle was removed and its contents of unoxidized
methyl linoleate were measured by GC.
1.2.4 Gas chromatographic analysis
The amount of unoxidized methyl linoleate was determined by GC (GC-2014A,
Shimadzu, Kyoto, Japan) equipped with a DB-1ht column (0.25 mm I.D. × 30 m,
Agilent Technologies, CA, USA) and a flame ionization detector. The injector, column,
and detector were held at 230, 205 and 240°C, respectively.
1.3 Results and Discussion
1.3.1 Effect of depth or amount of methyl linoleate on oxidation
Figure 1-1 shows the time courses for the oxidation of different depths or amounts of
methyl linoleate. For 1‒10 μL of methyl linoleate, the oxidation proceeded quickly and

10
Fig. 1-1. Time courses of the fraction of unoxidized methyl linoleate at various depths
(amounts) at 65ºC. Open symbols , , , and represent depths of 1, 2, 5, 10
and 20 mm, respectively. Closed symbols , , ▲ and represent 1, 2, 5 and 10 μL
of methyl linoleate, respectively. The curves are empirically drawn.
was almost complete within 20 h except for 10 μL of methyl linoleate. The induction
periods for the oxidation were around 4‒6 h for 1‒5 μL of methyl linoleate, while 10 μL
of the substrate required 24 h for complete oxidation. These results indicate that the
effect of the diffusion of oxygen on the oxidation of methyl linoleate became significant
when 10 μL or more of the substrate was used under the investigated conditions.
When a greater amount of methyl linoleate was exposed to oxidation, i.e., the depths
of methyl linoleate were increased from 1 to 20 mm, oxidation was significantly
retarded. The induction periods in these cases were longer than 8 h. In addition, a
significant decrease in the fraction of the unoxidized methyl linoleate was not observed
during the test duration when the depths were 10 and 20 mm, which indicates that most
of the oxygen supplied through the oil and air interface was consumed at or near the
0
0.2
0.4
0.6
0.8
1.0
0 8 16 24 32
Time [h]
Fra
ctio
n o
f u
no
xid
ized
met
hy
l lin
ole
ate

11
Fig. 1-2. Increase of the relative weight of methyl linoleate with depth during oxidation
at 65°C; w0 and w indicate the initial weight and increase in the weight of methyl
linoleate, respectively. The symbols are the same as in Fig. 1-1.
interface.
Figure 1-2 shows the time courses of the oxidation with increasing relative weight,
Δw/w0, of different depths of methyl linoleate, where Δw is the increase in the weight of
the substrate and w0 is the initial weight of the substrate. After the induction period, the
relative weights of the samples with depths of 1‒5 mm began to increase. In contrast,
only a slight increase was observed for the samples with depths of 10 and 20 mm. These
results correlate well with those in Fig. 1-1, indicating that the measurement of the
weight change can also be used to effectively estimate the induction period (Usuki,
1983).
The fractions of unoxidized methyl linoleate at different depths of the original sample
were plotted against the increase in the relative weight of the substrate (Fig. 1-3). The
0
0.02
0.04
0.06
0 8 16 24 32
Time [h]
Incr
ease
in
rel
ati
ve
wei
gh
t, ∆
w/w
0
12
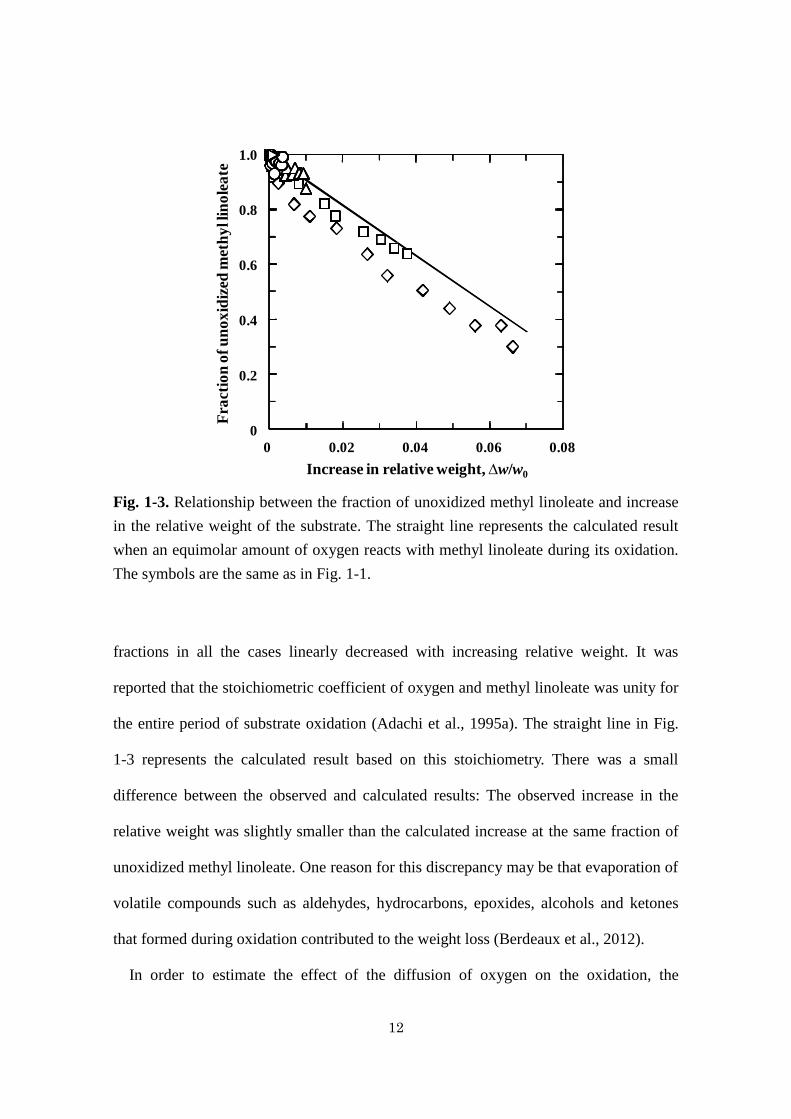
Fig. 1-3. Relationship between the fraction of unoxidized methyl linoleate and increase
in the relative weight of the substrate. The straight line represents the calculated result
when an equimolar amount of oxygen reacts with methyl linoleate during its oxidation.
The symbols are the same as in Fig. 1-1.
fractions in all the cases linearly decreased with increasing relative weight. It was
reported that the stoichiometric coefficient of oxygen and methyl linoleate was unity for
the entire period of substrate oxidation (Adachi et al., 1995a). The straight line in Fig.
1-3 represents the calculated result based on this stoichiometry. There was a small
difference between the observed and calculated results: The observed increase in the
relative weight was slightly smaller than the calculated increase at the same fraction of
unoxidized methyl linoleate. One reason for this discrepancy may be that evaporation of
volatile compounds such as aldehydes, hydrocarbons, epoxides, alcohols and ketones
that formed during oxidation contributed to the weight loss (Berdeaux et al., 2012).
In order to estimate the effect of the diffusion of oxygen on the oxidation, the
0
0.2
0.4
0.6
0.8
1.0
0 0.02 0.04 0.06 0.08
Increase in relative weight,∆w/w0
Fra
ctio
n o
f u
no
xid
ized
met
hy
l lin
ole
ate
13
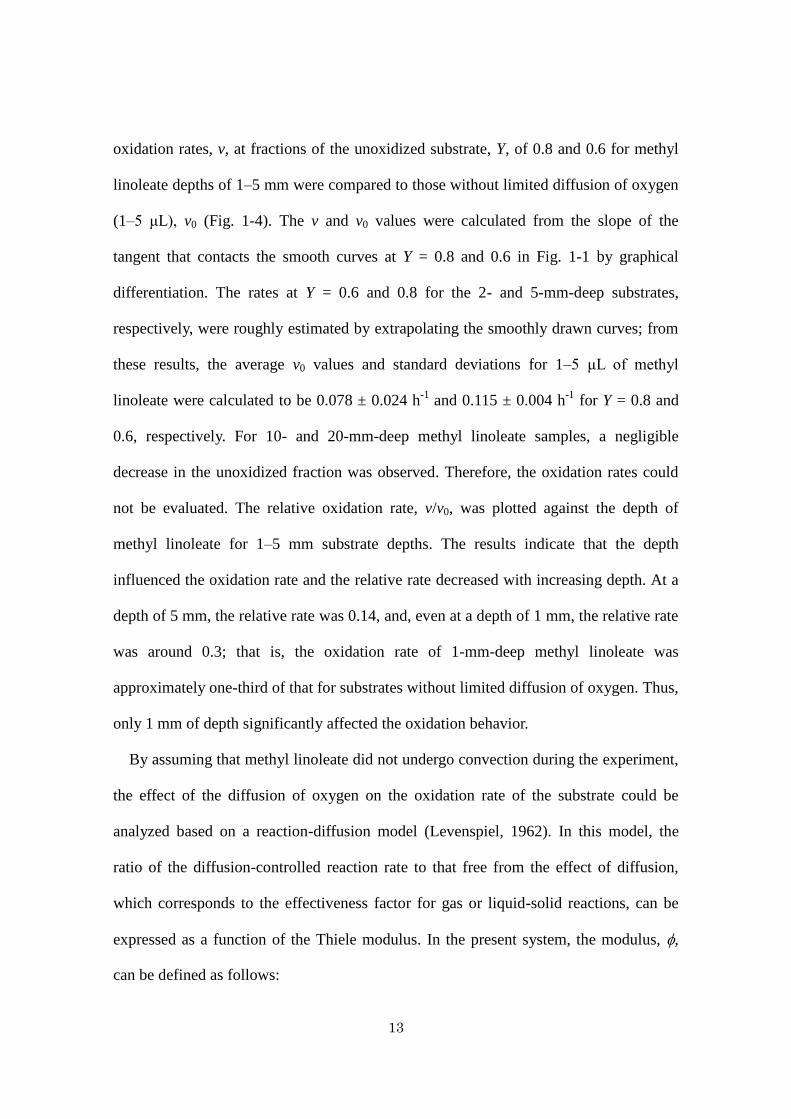
oxidation rates, v, at fractions of the unoxidized substrate, Y, of 0.8 and 0.6 for methyl
linoleate depths of 1‒5 mm were compared to those without limited diffusion of oxygen
(1‒5 μL), v0 (Fig. 1-4). The v and v0 values were calculated from the slope of the
tangent that contacts the smooth curves at Y = 0.8 and 0.6 in Fig. 1-1 by graphical
differentiation. The rates at Y = 0.6 and 0.8 for the 2- and 5-mm-deep substrates,
respectively, were roughly estimated by extrapolating the smoothly drawn curves; from
these results, the average v0 values and standard deviations for 1‒5 μL of methyl
linoleate were calculated to be 0.078 ± 0.024 h-1
and 0.115 ± 0.004 h-1
for Y = 0.8 and
0.6, respectively. For 10- and 20-mm-deep methyl linoleate samples, a negligible
decrease in the unoxidized fraction was observed. Therefore, the oxidation rates could
not be evaluated. The relative oxidation rate, v/v0, was plotted against the depth of
methyl linoleate for 1‒5 mm substrate depths. The results indicate that the depth
influenced the oxidation rate and the relative rate decreased with increasing depth. At a
depth of 5 mm, the relative rate was 0.14, and, even at a depth of 1 mm, the relative rate
was around 0.3; that is, the oxidation rate of 1-mm-deep methyl linoleate was
approximately one-third of that for substrates without limited diffusion of oxygen. Thus,
only 1 mm of depth significantly affected the oxidation behavior.
By assuming that methyl linoleate did not undergo convection during the experiment,
the effect of the diffusion of oxygen on the oxidation rate of the substrate could be
analyzed based on a reaction-diffusion model (Levenspiel, 1962). In this model, the
ratio of the diffusion-controlled reaction rate to that free from the effect of diffusion,
which corresponds to the effectiveness factor for gas or liquid-solid reactions, can be
expressed as a function of the Thiele modulus. In the present system, the modulus, ,
can be defined as follows:
14
D
kL (1-1)
where L is the depth of the substrate, k is the rate constant for oxidation under
conditions of sufficient oxygen, and D is the diffusion coefficient of oxygen in the
substrate. The line in Fig. 1-4 was extrapolated, as shown by the dashed line; the value
at the intersection of the extrapolated line and a ratio of 1, c, was evaluated to be 0.11.
At values larger than 0.11, the diffusion of oxygen affects the oxidation rate of the
substrate. The oxidation of n-6 PUFAs and their esters can be expressed by the
following equation, which is based on the autocatalytic model (Adachi et al., 1995b):
0
01ln
1ln
Y
Ykt
Y
Y
(1-2)
where t is the time elapsed, k is the rate constant for the oxidation, and Y0 is Y at t = 0.
Based on Eq. (1-2), the rate constant k could be obtained by plotting ln (1–Y)/Y versus t.
Fig. 1-4. Relationships between the relative rates, v/v0, at Y = () 0.8 and () 0.6 and
the depth of methyl linoleate.
Depth of methyl linoleate [mm]
0.1
1.0
0.5
10.1 10
Rel
ati
ve
ox
ida
tio
n r
ate
, v/
v 0
15
Accordingly, the k values for 1, 2, and 5 μL of methyl linoleate were evaluated, and the
average value (0.505 ± 0.019 h−1
) is regarded as the k value. The D value was roughly
estimated to be 1.2 × 10⁻⁹
m2/s from the Wilke-Chang method (Wilke and Chang, 1955).
From the c, k, and D values, it can be estimated that the diffusion of oxygen affects the
oxidation rate at a substrate depth of 0.33 mm or more. The k and D values at any
temperature can be evaluated according to our previous study (Adachi et al., 1995b) and
the Wilke-Chang method, respectively; thus, the minimum depth at which the diffusion
of oxygen begins to affect the oxidation rate of methyl linoleate can be determined. The
c value would be applicable to the oxidation of other lipids with oxidation kinetics that
can be expressed via an autocatalytic rate equation.
1.3.2 Oxidation of methyl linoleate at different partial pressures of oxygen
As described above, oxidation was increasingly retarded with increasing depths of
methyl linoleate. There are a few factors that affect the oxidation of methyl linoleate,
including the partial pressure of oxygen; therefore, we investigated the effect of the
partial pressure of oxygen on the oxidation rate constant.
Figure 1-5 shows the time courses of the fraction of unoxidized methyl linoleate at
different partial pressures of oxygen, PO2. The induction period increased with
decreasing partial pressure. When the oxidation was performed in air (PO2 = 21 kPa) or
at a PO2 of 5 kPa, the induction period was around 6 h, but extended to around 9 h at a
PO2 of 0.2 kPa. Based on Eq. (1-2), the rate constants, k, were obtained by plotting
ln (1−Y)/Y versus t.
The rate constant was ca. 0.5 h−1
when the oxidation was performed in air; it
gradually decreased with decreasing partial pressure of oxygen, and sharply decreased

16
Fig. 1-5. Oxidation of methyl linoleate at different partial pressures of oxygen at 65ºC.
Symbols , , , , , and represent oxygen partial pressures of 0.2, 0.5, 1, 2,
5, 10 and 21 kPa, respectively. The curves were calculated using the estimated k and Y0
values.
Fig. 1-6. Dependence of the oxidation rate constant on the partial pressure of oxygen at
65ºC.
0
0.2
0.4
0.6
0.8
1.0
0 10 20 30 40
Time [h]
Fra
ctio
n o
f u
no
xid
ized
met
hy
l lin
ole
ate
Partial pressure of oxygen, PO2 [kPa]
0
0.2
0.4
0.6
0 5 10 15 20 25
Ox
ida
tio
n r
ate
co
nst
an
t [h
-1]
17
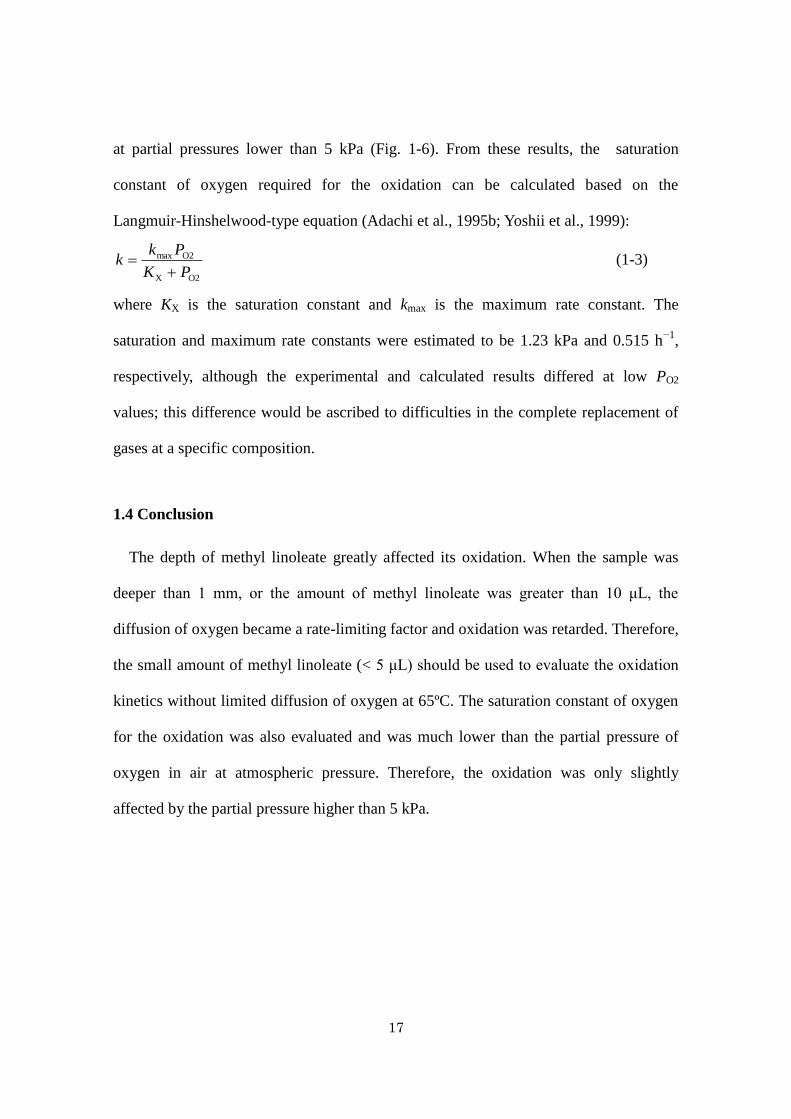
at partial pressures lower than 5 kPa (Fig. 1-6). From these results, the saturation
constant of oxygen required for the oxidation can be calculated based on the
Langmuir-Hinshelwood-type equation (Adachi et al., 1995b; Yoshii et al., 1999):
O2X
O2max
PK
Pkk
(1-3)
where KX is the saturation constant and kmax is the maximum rate constant. The
saturation and maximum rate constants were estimated to be 1.23 kPa and 0.515 h−1
,
respectively, although the experimental and calculated results differed at low PO2
values; this difference would be ascribed to difficulties in the complete replacement of
gases at a specific composition.
1.4 Conclusion
The depth of methyl linoleate greatly affected its oxidation. When the sample was
deeper than 1 mm, or the amount of methyl linoleate was greater than 10 μL, the
diffusion of oxygen became a rate-limiting factor and oxidation was retarded. Therefore,
the small amount of methyl linoleate (< 5 μL) should be used to evaluate the oxidation
kinetics without limited diffusion of oxygen at 65ºC. The saturation constant of oxygen
for the oxidation was also evaluated and was much lower than the partial pressure of
oxygen in air at atmospheric pressure. Therefore, the oxidation was only slightly
affected by the partial pressure higher than 5 kPa.
18
Chapter 2
Oxidation of Methyl Linoleate Mixed with Methyl Octanoate, Laurate
or Palmitate
2.1 Introduction
In the previous study on the kinetics of the oxidation at 65ºC of linoleic acid or
methyl linoleate mixed with one of lauric, myristic and palmitic acids or their methyl
esters, no volatility of the fatty acids and their methyl esters was assumed (Ishido et al.,
2001). However, there is a possibility that the unsaturated lipid and the coexisting
saturated one are volatilized at 65ºC. Especially, methyl esters of fatty acids are prone to
evaporation.
In this chapter, the oxidation process of methyl linoleate was re-evaluated in the
presence of methyl octanoate, laurate or palmitate in consideration of the volatility of
the methyl esters.
2.2 Materials and Methods
2.2.1 Materials
Methyl linoleate (purity, > 95%) was purchased from Tokyo Chemical Industry
(Tokyo, Japan). Methyl octanoate (> 98%), methyl laurate (> 98%), and methyl
palmitate (> 95%) were purchased from Wako Pure Chemical Industries (Osaka, Japan).
2.2.2 Oxidation of methyl linoleate
For the oxidation of methyl linoleate in a single-component system, 2 g of methyl
linoleate was dissolved in 10 mL of methanol. Fifty microliters of the solution was
19
placed using a micropipette in a flat-bottomed glass cup (1.5 cm i.d. and 3.0 cm height);
then the methanol was removed under reduced pressure. About 80 cups were placed in a
plastic container. Air was allowed to flow at 5 mL/min (0.03 cm/min) into the container
after passing through a column packed with silica gel. The rate of oxygen supplied by
the air flow was sufficiently higher than that of oxygen consumed by the oxidation of
methyl linoleate. The desiccator was stored in a DN-400 oven (Yamato Scientific,
Tokyo, Japan) at 65ºC. Periodically, a cup was removed, and 1 mL of 0.01 mol/L methyl
myristate was added to the cup as the internal standard in gas chromatographic analysis.
Unoxidized methyl linoleate was determined by subjecting 1 μL of the mixture to a
Shimadzu GC-2014AFsc gas chromatograph (Kyoto, Japan) equipped with a hydrogen
flame-ionization detector and a DB-1 column (J&W Scientific, Santa Clara, CA, USA).
The inner diameter and the length of the column were 0.25 mm and 30 m, respectively.
The analytical conditions were a column temperature of 230ºC, injection temperature of
260ºC, detector temperature of 280ºC and helium as the carrier gas at a flow rate of 168
mL/min. The ratio of the amount of methyl linoleate to that of methyl myristate was
obtained from the areas under their peaks. The fraction of the unoxidized substrate was
calculated from the ratio.
Methyl linoleate was mixed with methyl octanoate, methyl laurate or methyl
palmitate to produce a weight of 2 g at a molar ratio of 1:1 in 10 mL of methanol in
order to measure the oxidation processes of methyl linoleate in a mixed system. The
oxidation of methyl linoleate mixed with methyl laurate at molar ratios of 1:3 and 3:1
was also measured. Other procedures were the same as those above-mentioned for the
oxidation in the single-component system.
20
2.2.3 Additivity in volume of fatty acid esters
In order to measure the density of methyl octanoate, methyl laurate or methyl
palmitate, 0.5 g of the methyl ester was put into a 10-mL graduated cylinder, which had
been calibrated using distilled water. The cylinder was immersed in a water-bath kept at
25ºC for methyl octanoate and laurate or 35ºC for methyl palmitate for 10 min, and then
the volume was read. A further 0.5 g of the methyl ester was added to the cylinder. The
same operations were repeated until 2.5 g of the methyl ester was added.
One gram of methyl linoleate had been put in the graduated cylinder, and 0.5 g of
methyl octanoate, methyl laurate or methyl palmitate was added to the cylinder. The
mixture was mixed magnetically at 25ºC or 35ºC for 10 min, and its volume was read.
At every 0.5 g of methyl ester added, the volume was read until 2.5 g of the methyl ester
was added.
2.2.4 Volatility of fatty acid ester
Methyl octanoate (16.96 mg), methyl laurate (17.40 mg), methyl palmitate (21.05
mg) or methyl linoleate (22.13 mg) was put in a 6 mmϕ × 2.5 mm platinum cell, and the
weight change was measured at 65ºC under flowing nitrogen gas at a rate of 20 mL/min
using a TGA-50H thermogravimeter (Shimadzu, Kyoto, Japan).
Methyl linoleate and methyl laurate were mixed to produce the molar ratio of 1:3, 1:1
or 3:1, and the mixture was put in the glass cups. The cups were held in the plastic
container at 65ºC under flowing nitrogen gas at 5 mL/min. A cup was removed and the
amount of remaining methyl laurate was determined by gas chromatography as
above-mentioned. It was also confirmed by determining the amount of unoxidized
methyl linoleate that no oxidation of methyl linoleate occurred.
21
2.3 Results and Discussion
2.3.1 Oxidation of methyl linoleate
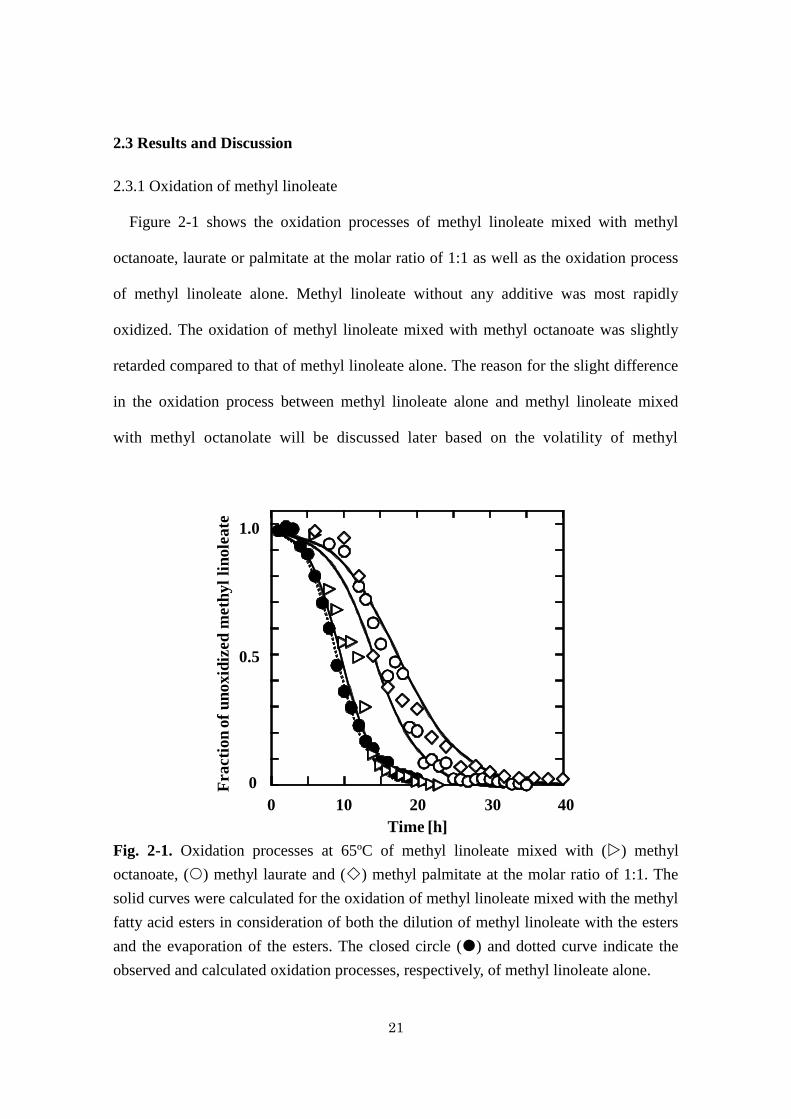
Figure 2-1 shows the oxidation processes of methyl linoleate mixed with methyl
octanoate, laurate or palmitate at the molar ratio of 1:1 as well as the oxidation process
of methyl linoleate alone. Methyl linoleate without any additive was most rapidly
oxidized. The oxidation of methyl linoleate mixed with methyl octanoate was slightly
retarded compared to that of methyl linoleate alone. The reason for the slight difference
in the oxidation process between methyl linoleate alone and methyl linoleate mixed
with methyl octanolate will be discussed later based on the volatility of methyl
Fig. 2-1. Oxidation processes at 65ºC of methyl linoleate mixed with () methyl
octanoate, () methyl laurate and () methyl palmitate at the molar ratio of 1:1. The
solid curves were calculated for the oxidation of methyl linoleate mixed with the methyl
fatty acid esters in consideration of both the dilution of methyl linoleate with the esters
and the evaporation of the esters. The closed circle () and dotted curve indicate the
observed and calculated oxidation processes, respectively, of methyl linoleate alone.
0 10 20 30 40
Time [h]
0
0.5
1.0
Fra
cti
on
of
un
ox
idiz
ed
meth
yl
lin
ole
ate

22
Fig. 2-2. Oxidation processes at 65ºC of methyl linoleate mixed with methyl laurate at
the molar ratios of () 1:3, () 1:1 and () 3:1. The data for the ratio of 1:1 are the
same as those in Fig. 2-1. The dotted curve is the oxidation process calculated for
methyl linoleate alone. The solid curves were calculated in consideration of both the
dilution of methyl linoleate with methyl laurate and the evaporation of the methyl
laurate, while the broken curves were calculated taking only the dilution of methyl
linoleate by the methyl laurate into consideration.
octanoate. The addition of methyl laurate or palmitate to methyl linoleate largely
retarded the oxidation of methyl linoleate. Because the molar volume is larger in the
order of methyl palmitate, laurate and octanoate, the concentration of methyl linoleate
was lower in its equimolar mixtures with methyl palmitate, laurate and octanoate in this
order. The lower concentration of methyl linoleate would retard its oxidation more.
The oxidation processes of methyl linoleate mixed with methyl laurate at the molar
ratios of 1:3 and 3:1 were also measured (Fig. 2-2). The oxidation process of methyl
linoleate mixed with methyl laurate at the molar ratio of 1:1, which has been shown in
Fig. 2-1, is also shown in Fig. 2-2 in order to facilitate understanding the effect of the
0
0.5
1.0
Fracti
on
of
un
oxid
ized
meth
yl
lin
ole
ate
0 10 20 30 40
Time [h]

23
molar ratio on the oxidation of methyl linoleate. Methyl linoleate was more slowly
oxidized at the higher molar ratio of methyl laurate to methyl linoleate. Because the
concentration of methyl linoleate in its mixture with methyl laurate was lower at the
higher molar ratio, the slower oxidation of methyl linoleate at the higher molar ratio
would be ascribed to the dilution effect by methyl laurate (Ishido et al., 2001; Ishido et
al., 2002a; Ishido et al., 2002b).
2.3.2 Additivity in volume
The densities of methyl linoleate, octanoate and laurate at 25ºC were estimated to be
835.3, 879.2 and 861.2 g/L, respectively, in their single-component systems. The
density of methyl palmitate at 35ºC was also estimated to be 839.8 g/L. The volume, V,
of methyl linoleate mixed with methyl octanoate, laurate or palmitate is calculated by
Fig. 2-3. Additivity in volume between methyl linoleate and () methyl octanoate, ()
methyl laurate and () methyl palmitate.
0
1
2
3
4
5
0 1 2 3 4 5
Vcal [mL]
V ob
s[m
L]

24
Eq. (2-1) if the additivity in the volume holds.
MS
MS
ML
ML
wwV (2-1)
where w and are the weight and density, and the subscripts, ML and MS, indicate
methyl linoleate and methyl ester of saturated fatty acid (methyl octanoate, laurate or
palmitate). The densities of methyl linoleate, octanoate, laurate and palmitate at 65ºC
were assumed to be 801.9, 844.0, 826.8 and 806.2 g/L, respectively, with the help of the
temperature dependence on density of some methyl esters of fatty acids.
The observed volumes of methyl linoleate mixed with methyl esters of saturated fatty
acids, Vobs, are plotted against the volumes calculated by Eq. (2-1), Vcal, in Fig. 2-3. The
plots lie on a diagonal line, indicating that the additivity in volume holds.
Fig. 2-4. Evaporation at 65ºC of () methyl octanoate, () methyl laurate and ()
methyl palmitate in their single-component system, and that of methyl laurate mixed
with methyl linoleate at the molar ratios of ()1:3 (methyl linoleate:methyl laurate),
() 1:1 and () 3:1.
0.01
0.1
1.0
0.5 1 10 50
Time [h]
Fra
ctio
n o
f ev
ap
ora
ted
met
hy
l es
ter

25
2.3.3 Volatility of fatty acid ester
No decrease in weight was observed for methyl linoleate at 65ºC under flowing
nitrogen gas. The decrease in methyl octanoate, laurate or palmitate at 65ºC was
observed as a function of time. The fractions of evaporated methyl ester, which is
calculated by (nMS0–nMS)/nMS0 where nMS0 and nMS are the initial moles of methyl ester
and that at any time t, are plotted against t in double logarithmic chart (Fig. 2-4). The
plots for methyl ester alone lie on a line with a slope of unity, indicating that the fraction
is proportional to the time. Because the fractions of methyl laurate mixed with methyl
linoleate at various molar ratios also lie on the line for methyl laurate alone and the
molar ratio of methyl laurate to methyl linoleate did not affect the evaporation, it would
appear that methyl laurate was evaporated independently of the presence of methyl
linoleate. Therefore, the amount of remaining methyl ester, nMS, is expressed as the
function of t by the following equation:
)1( evMS0MS tknn (2-2)
where kev is the rate constant for the evaporation, and the kev values were evaluated to be
0.685, 0.0279 and 0.00117 h-1
for methyl octanoate, laurate and palmitate, respectively.
2.3.4 Oxidation kinetics for methyl linoleate in the mixed system
The whole process for the oxidation of an n-6 fatty acid or its ester, such as methyl
linoleate, could be expressed by the kinetic equation of the autocatalytic type for both
single-component and mixed system (Ishido et al., 2001; Özilgen et al., 1990; Adachi et
al., 1995b).
)( MLMLtMLoxML CCCk
dt
dC (2-3)
where CML is the concentration of unoxidized methyl linoleate, CMLt is the total

26
concentration of unoxidized and oxidized substrates, and kox is the rate constant.
For the oxidation of methyl linoleate alone, Eq. (2-3) can be rewritten as follows:
)1(Y YYkdt
dY (2-4)
where Y (= CML/CMLt) is the fraction of unoxidized substrate, and kY is the rate constant
and is related to kox by Eq. (2-5).
MLtoxY Ckk (2-5)
Equation (2-4) can be solved under the initial condition of Y = Y0 at t = 0 as follows:
]}/)1ln[(exp{1
1
00Y YYtkY
(2-6)
where Y0 is the parameter corresponding to the initial fraction of unoxidized methyl
linoleate. The kY and Y0 values, by which the calculated Y values were best-fitted to the
experimental ones, were estimated to be 0.435 h-1
and 0.981, respectively, using the
Solver of Microsoft®
Excel 2007. The calculated process is given by the dotted curve in
both Figs. 2-1 and 2-2.
For the oxidation of methyl linoleate mixed with methyl octanoate, laurate or
palmitate, Eq. (2-3) can be rewritten as follows:
V
nnnk
dt
dn )( MLMLtMLoxML (2-7)
where nML and nMLt are the moles of unoxidized methyl linoleate and the total moles of
unoxidized and oxidized substrates. As mentioned above, the volume, V, changes with
time because of the evaporation of methyl octanoate, laurate or palmitate and is
calculated by the following equations:
MS
MSevMS0
ML
MLMLt )1(
MtknMnV
( evtt ) (2-8a)
ML
MLMLt
Mn ( evtt ) (2-8b)
where M is the molecular mass, and tev is the time when all of the methyl ester of

27
saturated fatty acid is evaporated and is calculated by
ev
ev
1
kt (2-9)
The oxidation processes of methyl linoleate mixed with methyl octanoate, laurate or
palmitate were calculated by solving Eqs. (2-7) and (2-8) simultaneously as shown by
the solid curves in Figs. 2-1 and 2-2. The curves coincided with the experimental
results.
Because methyl octanoate was evaporated in the early stage of the process (tev = 1.46
h), methyl linoleate mixed with methyl octanoate was oxidized similarly to the substrate
alone (Fig. 2-1). The dilution effect by methyl palmitate was significant because of the
low volatility of methyl palmitate and the oxidation of methyl linoleate was largely
retarded.
Under the assumption of no volatilization of methyl laurate, the oxidation processes
of methyl linoleate mixed with methyl laurate at various molar ratios were calculated
and are shown by the broken curves in Fig. 2-2. The difference between the solid and
broken curves was small at the molar ratios of 3:1 and 1:1, while the difference was
large at the ratio of 1:3. The broken curve for the ratio of 1:3 was far from the
experimental results. This fact indicates that the evaporation of methyl ester of a
saturated fatty acid should be considered to exactly predict the oxidation process of an
unsaturated fatty acid mixed with the ester.
2.4 Conclusion
The evaporation of the mixed methyl esters of saturated fatty acids affected the
oxidation rate of methyl linoleate. Methyl linoleate was oxidized more rapidly when it
was mixed with equimolar amount of methyl ester of saturated fatty acid with higher

28
volatility. When methyl linoleate was mixed with methyl laurate at lower molar ratio, its
oxidation was more retarded. The oxidation processes could be well calculated by the
autocatalytic kinetic equation in consideration of the independent evaporation of the
mixed fatty acid esters.
29
Chapter 3
Effects of Various Emulsification Methods on the Oxidation of Methyl
Linoleate
3.1 Introduction
Emulsions are widely used in many foods, and there are various methods for
preparing emulsions, such as high-speed stirring, high-pressure homogenization,
ultrasonic homogenization, and membrane emulsification. As described in General
Introduction, mechanical stress during the emulsification would cause deterioration of
oil.
In this chapter, the four emulsification methods were applied to the mixtures of water
and methyl linoleate without an emulsifier to estimate the effects of the emulsification
method on lipid oxidation. After the emulsification, the extent of the oxidation of bulk
methyl linoleate was determined to evaluate the influence of mechanical stress applied
during emulsification on the oxidation rate constant and induction period.
3.2 Materials and Methods
3.2.1 Materials
Methyl linoleate (purity, > 95%) and methyl myristate (> 98%) were purchased from
Tokyo Chemical Industry (Tokyo, Japan).
3.2.2 Emulsification of methyl linoleate by different methods
Emulsification was performed as follows. Methyl linoleate was added to distilled
water at a final concentration of 10% (w/v), and the mixture was vortexed for 10 s using
30
a test-tube mixer (TM-351, Iwaki Glass, Tokyo, Japan). The mixture was then rapidly
subjected to one of the four emulsification methods (high-pressure homogenization,
high-speed stirring, ultrasonic homogenization, and membrane emulsification).
Homogenization by high-speed stirring was carried out using a polytron homogenizer
(PT20SK, Kinematica, Luzern, Switzerland). First, 40 mL of the mixture of water and
methyl linoleate were transferred to a 50-mL beaker, in which the stirring was
performed. The stirring speeds were 3 × 10³, 8 × 10
3 and 1.5 × 10
4 rpm, with a stirring
time of 2.0 min. The effects of the stirring time were also evaluated by setting the time
at 0.50, 2.0 and 8.0 min, with a stirring speed of 8 × 10³ rpm.
Ultrasonic homogenization was performed using an ultrasonic homogenizer (Nissei
US-300T, Nihon Seiki, Tokyo, Japan) with an ultrasonic tip diameter of 20 mm. The
ultrasonic tip was inserted into the 40 mL of the mixture of water and methyl linoleate.
The intensity of ultrasonic wave was controlled by adjusting the output dial at the levels
1.0, 5.0 and 9.0, with a treatment time of 2.0 min, to investigate the influence of the
intensity. The effects of the treatment time (0.50, 2.0 and 8.0 min) were also examined,
with an output level of 5.0.
For high-pressure homogenization, the mixture of water and methyl linoleate was
homogenized using a high-pressure homogenizer (Nanomizer PEL-20, Yoshida Kikai,
Aichi, Japan). The homogenization was performed at 40, 81 and 152 MPa, and the
number of passes through the homogenizer was two. The effects of the number of
passes were also evaluated for 1, 2, 4 and 8 passes at 81 MPa.
Membrane emulsification was performed as follows. The mixture of water and
methyl linoleate was transferred to a 50-mL plastic syringe connected to a membrane
filter (DISMIC-25CS cellulose acetate membrane filter, pore size 0.80 μm, or mixed
31
cellulose ester membrane filter, pore size 0.80 μm; Toyo Roshi, Tokyo, Japan). The
syringe interior was pressurized with nitrogen at 0.20 MPa. The number of passes
through the membrane filter was 1, 2 or 4.
3.2.3 Effects of the amount of a membrane on the oxidation
A cellulose acetate membrane was taken from a DISMIC cellulose acetate membrane
filter. The cellulose acetate membrane (2.5‒40 mg) or mixed cellulose ester membrane
(2.5‒40 mg) was immersed in 4 g of methyl linoleate placed in a 50-mL amber vial. The
vial was filled with nitrogen and then kept at 4°C in dark for 18 h, with occasional
stirring.
3.2.4 Oxidation of methyl linoleate
The mixture, which was subjected to each emulsification method, was then separated
into oil and aqueous phases. The oil phase was collected and centrifuged at 1.5 × 10⁴
rpm for 10 min using a high-speed microcentrifuge (MC-150, Tomy, Tokyo, Japan). The
oxidation of methyl linoleate was performed as follows. The oil phase (440 mg) was
dissolved in 25 mL of methanol. Then, 100 μL of the solution were placed in a
flat-bottomed glass cup (1.5 cm I.D. × 3.0 cm); 120‒240 samples were prepared.
Methanol was then removed under reduced pressure. The cups were placed in a plastic
container (300 mm width × 150 mm height × 150 mm depth), with a dry-air flow of 5
mL/min after passing through silica gel. The plastic container was stored at 55°C in an
oven (DN-400, Yamato Scientific, Tokyo, Japan).
The cups were periodically removed from the container, and 1.0 mL of a methanol
solution of methyl myristate (1.455 g/L), as the internal standard for gas
chromatographic analysis, was added to the cup. Unoxidized methyl linoleate was

32
determined using a gas chromatograph (GC-2014, Shimadzu, Kyoto, Japan) equipped
with a flame ionization detector and a DB-1ht column (0.25 mm I.D. × 30 m, Agilent
Technologies, CA, USA). The temperatures of the injector, column, and detector were
230, 205 and 240°C, respectively.
3.3 Results and Discussion
3.3.1 Oxidation of emulsified methyl linoleate
Figures 3-1, 3-2, 3-3 and 3-4 show the time course characteristics of the changes in
the unoxidized fractions of methyl linoleate emulsified by different methods. In
high-speed stirring emulsification, the oxidation of methyl linoleate with different
stirring speeds showed almost the same behavior as that of methyl linoleate without
Fig. 3-1. Oxidation of methyl linoleate treated by high-speed stirring. The treatment was
performed for 0.50‒8.0 min at 8 × 10³ rpm: () 0.50, () 2.0 and () 8.0 min. Symbol
represents the result obtained by performing oxidation without emulsification; all the
curves are the calculated results.
1.0
0
0.2
0.4
0.6
0.8
Fra
ctio
n o
f u
no
xid
ized
met
hy
l li
no
lea
te
0 10 20 30 40
Time [h]

33
Fig. 3-2. Oxidation of methyl linoleate treated by ultrasonic homogenization. The
treatment was carried out at output levels of 1.0–9.0 for 2.0 min: () 1.0, () 5.0 and
() 9.0. Symbol is the same as in Fig. 3-1; all curves are the calculated results.
Fig. 3-3. Oxidation of methyl linoleate treated by high-pressure homogenization. The
treatment was performed one to four times at 81 MPa: () 1, () 2, () 3 and () 4
times. Symbol is the same as in Fig. 3-1; all the curves are the calculated results.
1.0
0
0.2
0.4
0.6
0.8
Fra
ctio
n o
f u
no
xid
ized
met
hy
l li
no
lea
te
0 10 20 30 40
Time [h]
1.0
0
0.2
0.4
0.6
0.8
Fra
ctio
n o
f u
no
xid
ized
met
hy
l li
no
lea
te
0 10 20 30 40
Time [h]

34
Fig. 3-4. Oxidation of methyl linoleate treated by emulsification method of membrane
filtration. The treatment was performed by using a cellulose acetate membrane with one
to four passes through the membrane: () 1, () 2 and () 4 passes. Symbol is the
same as in Fig. 3-1; all the curves are the calculated results.
emulsification (Fig. 3-1). Other emulsification methods, i.e., ultrasonic emulsification
and high-pressure homogenization, showed that the effects of power of ultrasonic wave
and number of passes on oxidation were minor (Figs. 3-2 and 3-3). Although the rise of
temperature would occur during the emulsification, its effects were not also significant.
Therefore, the mechanical stress on methyl linoleate during emulsification would not
affect the stability of methyl linoleate.
In contrast, membrane emulsification affected the oxidation behavior of methyl
linoleate when a cellulose acetate membrane was used (Fig. 3-4). The induction period
for the oxidation significantly increased on increasing the number of passes of the
emulsion through the membrane filter. These results indicate that some radicals, which
had been initially present in methyl linoleate, were adsorbed on the membrane, delaying
1.0
0
0.2
0.4
0.6
0.8
Fra
ctio
n o
f u
no
xid
ized
met
hy
l li
no
lea
te
0 10 20 30 40
Time [h]
35
the oxidation.
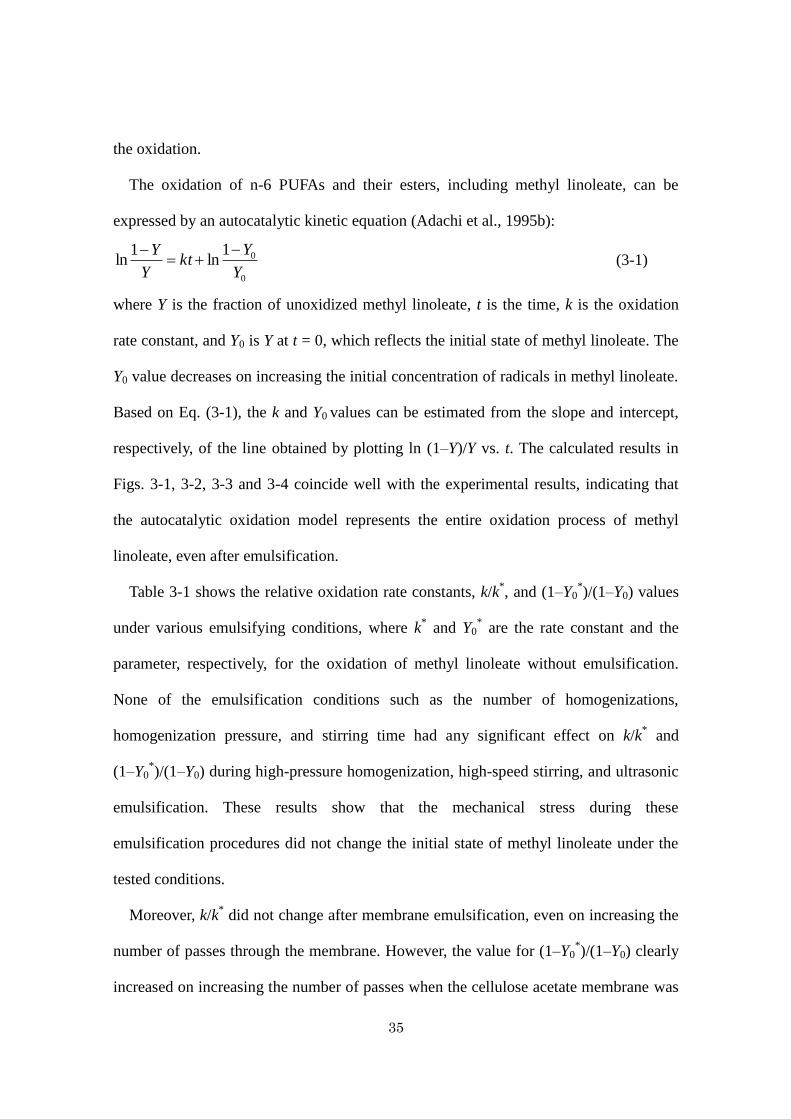
The oxidation of n-6 PUFAs and their esters, including methyl linoleate, can be
expressed by an autocatalytic kinetic equation (Adachi et al., 1995b):
0
01ln
1ln
Y
Ykt
Y
Y
(3-1)
where Y is the fraction of unoxidized methyl linoleate, t is the time, k is the oxidation
rate constant, and Y0 is Y at t = 0, which reflects the initial state of methyl linoleate. The
Y0 value decreases on increasing the initial concentration of radicals in methyl linoleate.
Based on Eq. (3-1), the k and Y0 values can be estimated from the slope and intercept,
respectively, of the line obtained by plotting ln (1–Y)/Y vs. t. The calculated results in
Figs. 3-1, 3-2, 3-3 and 3-4 coincide well with the experimental results, indicating that
the autocatalytic oxidation model represents the entire oxidation process of methyl
linoleate, even after emulsification.
Table 3-1 shows the relative oxidation rate constants, k/k*, and (1–Y0
*)/(1–Y0) values
under various emulsifying conditions, where k* and Y0
* are the rate constant and the
parameter, respectively, for the oxidation of methyl linoleate without emulsification.
None of the emulsification conditions such as the number of homogenizations,
homogenization pressure, and stirring time had any significant effect on k/k* and
(1–Y0*)/(1–Y0) during high-pressure homogenization, high-speed stirring, and ultrasonic
emulsification. These results show that the mechanical stress during these
emulsification procedures did not change the initial state of methyl linoleate under the
tested conditions.
Moreover, k/k* did not change after membrane emulsification, even on increasing the
number of passes through the membrane. However, the value for (1–Y0*)/(1–Y0) clearly
increased on increasing the number of passes when the cellulose acetate membrane was

36
Table 3-1. Dependences of the relative oxidation rate constant and the parameter,
(1–Y0*)/(1–Y0), on the emulsifying conditions.
Emulsification condition Relative rate constant, k /k* (1–Y 0
*)/(1–Y 0)
0.50 0.98 1.12
2.0 1.00 1.07
8.0 1.01 0.89
3.0 1.02 1.04
8.0 0.99 1.14
15.0 0.99 1.10
0.50 0.96 1.04
2.0 0.99 1.06
8.0 0.98 1.02
1.0 0.99 0.93
5.0 0.98 0.93
9.0 0.98 1.02
1 1.05 0.88
2 1.07 1.00
4 1.06 1.08
8 1.06 1.10
40 1.03 0.84
81 1.03 1.00
152 1.02 1.10
1 1.03 1.80
2 1.08 2.77
4 1.06 3.71
1 1.01 1.03
2 1.01 0.88
4 1.03 0.90
0.63 0.96 0.95
2.5 0.98 0.95
10 0.92 1.68
0.63 0.98 1.04
2.5 0.99 0.96
10 0.99 0.89
Pressure of homogenization
(MPa)
Number of passes through
a cellulose acetate filter
Number of the passes through
a mixed cellulose ester filter
Concentration of a cellulose
acetate membrane
(mg-membrane/g-oil)
Concentration of a mixed
cellulose ester membrane
(mg-membrane/g-oil)
Stirring time (min)
Stirring speed×10-3
(rpm)
Time of ultrasonic treatment
(min)
Power of ultrasonic
(the number of dial)
Number of homogenization

37
used. A possible reason for this increase is the adsorption of the radicals initially present
in methyl linoleate on the membrane. However, the value of (1–Y0*)/(1–Y0) did not
depend much on the number of passes when a mixed cellulose ester membrane was
used. Although the reason for this observation is not clear at present, the chemical
structures of the membranes probably affect the adsorption behavior.
3.3.2 Effects of the weight ratio of membrane to methyl linoleate on the oxidation
Significant changes in (1–Y0*)/(1–Y0) were not observed when the concentration of
the cellulose acetate membrane was 2.5 mg/g-oil, or when a mixed cellulose ester
membrane was used. However, the value of (1–Y0*)/(1–Y0) increased when the cellulose
acetate membrane concentration was 10 mg/g-oil. These results show that a cellulose
acetate membrane concentration of at least 2.5‒10 mg/g-oil is needed for the adsorption
of the radicals in methyl linoleate.
3.4 Conclusion
The mechanical stress caused during emulsification did not affect the oxidation
behavior of methyl linoleate. The relative oxidation rate constant was almost constant,
regardless of the type of emulsification method. However, the induction period and the
value of (1–Y0*)/(1–Y0) increased in the presence of a cellulose acetate membrane. This
increase was probably caused by the adsorption of radicals initially present in methyl
linoleate on the membrane.

38
Chapter 4
Effect of Droplet Size on Autoxidation Rates of Methyl Linoleate and
α-Linolenate in an Oil-in-water Emulsion
4.1 Introduction
Lipid autoxidation in O/W emulsion systems depends on their oil droplet sizes as
described in General Introduction; there are many contradictious reports whether the
lipid autoxidation rate would be affected by the droplet size.
In this chapter, we measured the autoxidation processes of methyl linoleate and
methyl α-linolenate, which are n-6 and n-3 PUFAs, respectively, that differ greatly in
their susceptibility to autoxidation in O/W emulsions with various oil droplet sizes on a
micrometer scale. The processes were kinetically analyzed to estimate the rate constants,
and the effect of oil droplet size on the rate constants was determined.
4.2 Materials and Methods
4.2.1 Materials
Methyl linoleate (purity, > 95%) and methyl α-linolenate (> 98%) were purchased
from Tokyo Chemical Industry (Tokyo, Japan), and methyl palmitate (> 95%) was
purchased from Wako Pure Chemical Industries (Osaka, Japan). Decaglycerol
monolaurate (ML-750, Lot. 11010) was obtained from Sakamoto Yakuhin Kogyo
(Osaka, Japan). Advantec Dismic-25cs cellulose acetate membrane filters (pore sizes of
0.45 and 0.80 μm) were purchased from Toyo Roshi (Tokyo, Japan), and membrane
filters with a pore size of 5 μm were from Sartorius Stedim Biotech (Goettingen,
Germany). Borosilicate glass filters (type 3G3 with pore sizes of 20‒30 μm and 3G1

39
with pore sizes of 100‒120 μm) were purchased from Asahi Glass (Tokyo, Japan).
4.2.2 Preparation of O/W emulsion
The aqueous phase of emulsion contained 0.15% (w/v) ML-750 and 1 mmol/L
sodium azide as the emulsifier and the preservative, respectively, in distilled water.
Methyl linoleate or methyl α-linolenate (1%, w/v) was added to the aqueous phase, and
the mixture was vortex-mixed using a test tube mixer.
The coarse emulsion then underwent membrane emulsification. Emulsions of small
oil droplet size (≤ 10 μm) were prepared by passage through a cellulose acetate
membrane filter, and those of large oil droplet size (> 10 μm) were prepared by passage
through a borosilicate glass filter. The coarse emulsion was transferred into a plastic
syringe (50 mL) connected to a membrane filter on the bottom to produce emulsions
with small oil droplet sizes. The syringe was pressurized with nitrogen gas at 0.25, 0.20
or 0.12 MPa. Membrane emulsification was repeated twice to obtain stably
monodispersed emulsions. For the preparation of stably monodispersed emulsions with
large oil droplet size, the coarse emulsion was passed through a 3G3 or 3G1 borosilicate
glass filter. When type 3G3 was used, the membrane emulsification was repeated twice.
4.2.3 Measurement of oil droplet size
A Shimadzu laser diffraction particle size analyzer (SALD-2100, Kyoto, Japan) was
used to measure the oil droplet size of the emulsion. The oil droplet size of the methyl
linoleate emulsion was measured immediately after preparation and then monitored
every 4 h until autoxidation was complete. Measurement of the oil droplet size of the
methyl α-linolenate emulsion was performed just after preparation and after complete
autoxidation.
40
4.2.4 Autoxidation in O/W emulsion
For the autoxidation experiment, 1.2 mL of emulsion was sealed in a sample vial (20
mL) with adequate air (18.8 mL). The sample vials were placed on a Variomag
magnetic stirrer (Telesystem 60.07, Oberschleiβheim, Germany) with gentle stirring at
55°C in a DN-400 oven (Yamato Scientific, Tokyo, Japan). Periodically, a vial was
removed from the oven and 500 μL of the emulsion was removed and thoroughly
blended with 1200 μL of the extraction solvent, which was composed of chloroform and
methanol in a 2:1 ratio (v/v). The mixture was then centrifuged at 1.5 × 10⁴ rpm for 5
min using a Tomy high-speed microcentrifuge (MC-150, Tokyo, Japan). A portion of the
lower phase (400 μL), which was composed mainly of chloroform, was mixed with 400
μL of 0.02 mol/L methyl palmitate solution in methanol as the internal standard for gas
chromatographic analysis.
Unoxidized methyl linoleate or methyl α-linolenate was measured by analyzing 1 μL
of the mixture using a Shimadzu GC-2014AFsc gas chromatograph (Kyoto, Japan)
equipped with a hydrogen flame ionization detector and a J&W Scientific DB-1ht
column (Santa Clara, USA). The inner diameter and the length of the column were 0.25
mm and 30 m, respectively. The temperatures for the column, injector, and detector
were 205°C, 230°C and 240°C, respectively. Helium was used as the carrier gas at a
flow rate of 139 mL/min. The fractions of unoxidized methyl linoleate and methyl
α-linolenate were calculated from the ratio of their areas under the peak to that of
methyl palmitate.
41
4.3 Results and Discussion
4.3.1 Oil droplet size of emulsion
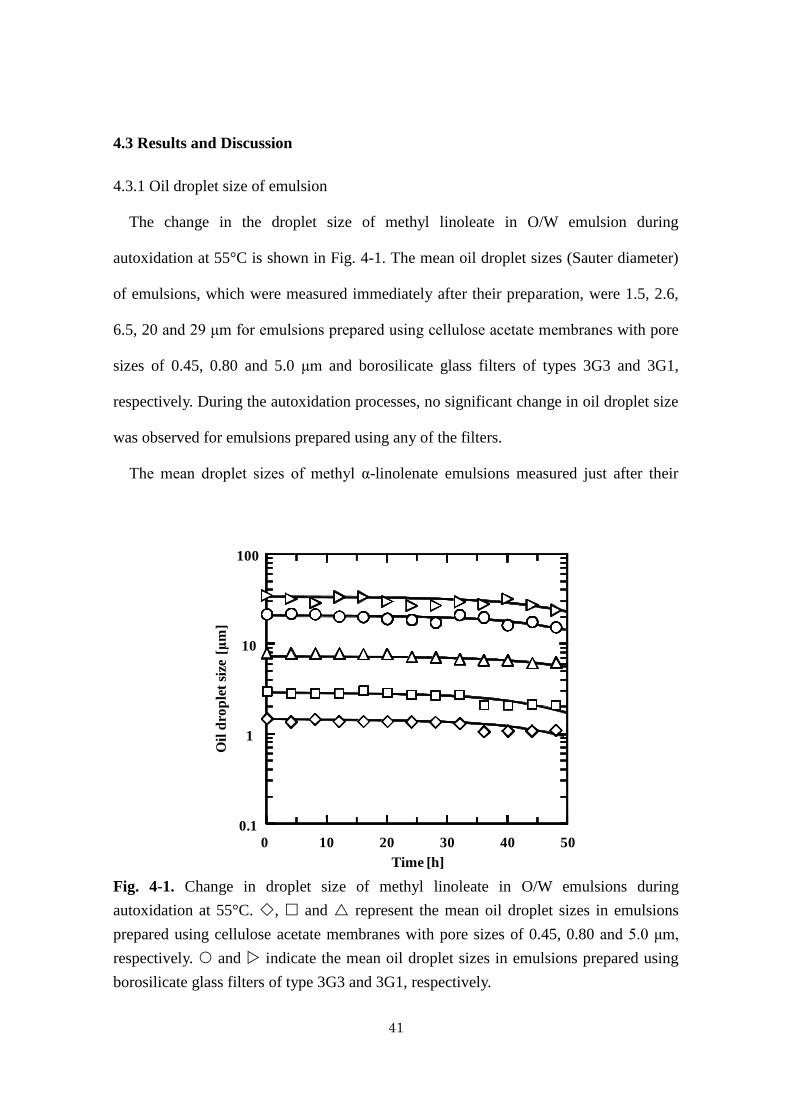
The change in the droplet size of methyl linoleate in O/W emulsion during
autoxidation at 55°C is shown in Fig. 4-1. The mean oil droplet sizes (Sauter diameter)
of emulsions, which were measured immediately after their preparation, were 1.5, 2.6,
6.5, 20 and 29 μm for emulsions prepared using cellulose acetate membranes with pore
sizes of 0.45, 0.80 and 5.0 μm and borosilicate glass filters of types 3G3 and 3G1,
respectively. During the autoxidation processes, no significant change in oil droplet size
was observed for emulsions prepared using any of the filters.
The mean droplet sizes of methyl α-linolenate emulsions measured just after their
Fig. 4-1. Change in droplet size of methyl linoleate in O/W emulsions during
autoxidation at 55°C. , and represent the mean oil droplet sizes in emulsions
prepared using cellulose acetate membranes with pore sizes of 0.45, 0.80 and 5.0 μm,
respectively. and indicate the mean oil droplet sizes in emulsions prepared using
borosilicate glass filters of type 3G3 and 3G1, respectively.
0.1
1
10
100
0 10 20 30 40 50
Time [h]
Oil
dro
ple
t si
ze[μ
m]

42
preparation were 1.4, 2.8, 7.4, 31 and 33 μm for emulsions prepared using cellulose
acetate membranes with pore sizes of 0.45, 0.80 and 5.0 μm and borosilicate glass filters
of types 3G3 and 3G1, respectively. The oil droplet sizes prepared using cellulose
acetate membranes were almost the same as those obtained using methyl linoleate.
Because the emulsions prepared using the borosilicate glass filters had almost the same
oil droplet size, only the emulsion prepared using type 3G3 was used in the autoxidation
experiment that follows. When autoxidation was complete, the oil droplet sizes of the
emulsions, which were prepared using cellulose acetate membranes with pore sizes of
0.45, 0.80 and 5.0 and the 3G3 borosilicate glass filter, were 1.1, 2.1, 6.4 and 26 μm,
respectively. Thus, all of the methyl α-linolenate emulsions were also stable during
autoxidation.
4.3.2 Autoxidation of methyl linoleate and methyl α-linolenate in O/W emulsion
Figure 4-2a shows the change in the residual fraction of methyl linoleate during its
autoxidation at 55°C in O/W emulsions with 5 oil droplet sizes. The autoxidation of
methyl linoleate showed almost the same behavior, indicating that oil droplet size did
not affect the autoxidation of methyl linoleate. This observation was confirmed by
evaluating the autoxidation rate constant for each emulsion. The entire autoxidation
process of n-6 PUFAs and their esters can be expressed with the following kinetic
equation (Adachi et al., 1995b; Minemoto et al., 1999):
)1(1 YYkdt
dY (4-1)
where Y is the fraction of the unoxidized substrate, t is the time, and k1 is the
autoxidation rate constant. Under the conditions of Y = Y0 at t = 0, Eq. (4-1) can be
integrated to give

43
Fig. 4-2. Autoxidation of methyl linoleate at 55°C in O/W emulsion. (a) Change in the
fraction of unoxidized methyl linoleate during its autoxidation. (b) Estimation of the
rate constant based on Eq. (4-2). The symbols are the same as those in Fig. 4-1. The
curves in Fig. 4-2a were drawn using the kinetic parameters k1 and Y0 estimated from
the lines in Fig. 4-2b.
1.0
0
0.2
0.4
0.6
0.8
0 10 20 30 40 50
Time [h]
(a)
Fra
cti
on
of
un
ox
idiz
ed
meth
yl
lin
ole
ate
- 6
-4
-2
0
2
4
6
0 10 20 30 40 50
Time [h]
(b)
ln [
(1-Y
)/Y
]

44
Fig. 4-3. Autoxidation of methyl α-linolenate at 55°C in O/W emulsion. (a) Change in
the fraction of unoxidized methyl α-linolenate during its autoxidation. (b) Estimation of
the rate constants for the first and last halves of the autoxidation was based on Eqs.
(4-2) and (4-4), respectively. The symbols are the same as those in Fig. 4-1.
1.0
0
0.2
0.4
0.6
0.8
0 5 10 15 20 25
Time [h]
(a)
Fracti
on
of
un
oxid
ized
meth
yl
lin
ole
nate
0 5 10 15 20 25
- 4
- 2
0
2
4
Time [h]
(b)
ln [
(1-Y
)/Y
], ln
2Y

45
0
01
1ln
1ln
Y
Ytk
Y
Y
(4-2)
where Y0 reflects the initial state of the substrate, and k1 is the autoxidation rate constant.
The applicability of Eq. (4-2) to the autoxidation processes of methyl linoleate was
examined by plotting ln [(1–Y)/Y] versus t as shown in Fig. 4-2b. The plots gave straight
lines for each oil droplet size. Therefore, k1 and Y0 could be evaluated from the slope
and the intercept of the line, respectively. The curves in Fig. 4-2a, which were
calculated using Eq. (4-1) and estimated k1 and Y0 values, coincided well with the
experimental results.
Figure 4-3a shows the change in the fraction of unoxidized methyl α-linolenate
during autoxidation at 55°C in O/W emulsions with 4 oil-droplet sizes. The first half of
the autoxidation process did not depend on oil droplet size (Y ≥ 0.5), whereas the
autoxidation progressed more slowly in the emulsion with larger oil droplet size in the
last half (Y < 0.5). Based on our previous study (Adachi et al., 1995b), the rate constants
for the first and last halves of the autoxidation were evaluated for each emulsion.
The autoxidation in the first half of the autoxidation process of methyl α-linolenate
could be expressed by Eq. (4-1), and that in the last half could be empirically expressed
by
Ykdt
dY2 (4-3)
where k2 is the rate constant. Integrating Eq. (4-3) with Y = 0.5 at t = t0.5 gives the
following equation:
)(2ln 5.02 ttkY (4-4)
where t0.5 is the time when Y reaches 0.5. This value can be obtained from Eq. (4-2) as
follows:
46
0
0
1
5.01
ln1
Y
Y
kt
(4-5)
For the autoxidation of methyl α-linolenate, ln [(1–Y)/Y] in the first half and ln 2Y in the
last half of the process were plotted against time, t, as shown in Fig. 4-3b. The plots
gave straight lines for each emulsion. The curves in Fig. 4-3a were calculated using Eqs.
(4-1) and (4-3) and estimated k1, Y0 and k2 values.
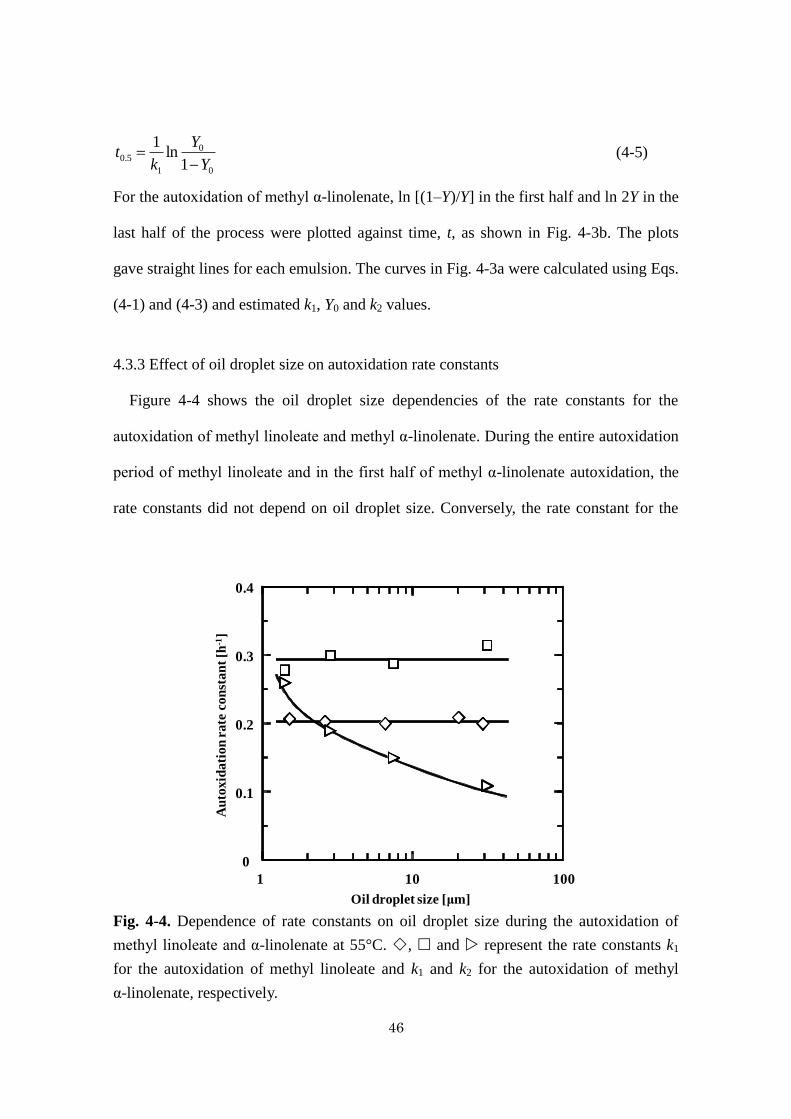
4.3.3 Effect of oil droplet size on autoxidation rate constants
Figure 4-4 shows the oil droplet size dependencies of the rate constants for the
autoxidation of methyl linoleate and methyl α-linolenate. During the entire autoxidation
period of methyl linoleate and in the first half of methyl α-linolenate autoxidation, the
rate constants did not depend on oil droplet size. Conversely, the rate constant for the
Fig. 4-4. Dependence of rate constants on oil droplet size during the autoxidation of
methyl linoleate and α-linolenate at 55°C. , and represent the rate constants k1
for the autoxidation of methyl linoleate and k1 and k2 for the autoxidation of methyl
α-linolenate, respectively.
0
0.1
0.2
0.3
0.4
1 10 100
Au
toxid
ati
on
rate
con
stan
t [h
-1]
Oil droplet size [μm]

47
last half of the methyl α-linolenate autoxidation was smaller for emulsions with larger
oil droplet sizes. It has been reported that the autoxidation of linoleic acid and sunflower
oil, respectively, containing linoleoyl residues did not depend on oil droplet size in O/W
emulsion systems, findings similar to our results (Roozen et al., 1994; Dimakou et al.,
2007). Therefore, in the case of n-6 PUFAs and their esters, oil droplet size apparently
did not affect the autoxidation rate in O/W emulsions with oil droplet sizes on the
micrometer scale.
The rate constant for the autoxidation of methyl α-linolenate was independent of oil
droplet size during the first half of the autoxidation, but it decreased with increasing oil
droplet size during the last half. The stoichiometric coefficient of oxygen during the
autoxidation of methyl α-linolenate was unity during the first half of the process, but it
gradually became larger during the last half as autoxidation proceeded (Adachi et al.,
1995a). These results indicate that more oxygen is necessary to oxidize methyl
α-linolenate during the last half of autoxidation and that the effect of the mass transfer
of oxygen through the oil-water phase on the autoxidation becomes significant. This
effect explains why oil droplet size affected the autoxidation rate only in the last half of
the process.
4.4 Conclusion
The effect of oil droplet size on the autoxidation of methyl linoleate and methyl
α-linolenate in O/W emulsions was investigated at 55°C in the range of 1‒30 μm. Oil
droplet size did not affect the rate constant throughout the entire autoxidation process of
methyl linoleate or during the first half of methyl α-linolenate autoxidation. However,
during the last half of the autoxidation of methyl α-linolenate, the rate constant was
48
smaller for the emulsions with larger oil droplet size. The slower autoxidation for the
larger oil droplet size can be ascribed to the consumption of more oxygen in the last half
period, during which the effect of the mass transfer of oxygen through the oil-water
interface becomes significant.
49
Concluding Remarks
Chapter 1
Bulk methyl linoleate was oxidized at 65°C and almost 0% relative humidity to
quantitatively evaluate the effect of the depth of the layer (i.e., amount) of methyl
linoleate on its oxidation kinetics: Oxidation was retarded when the depths was greater
than 1 mm or the volume was greater than 10 μL and barely occurred at depths greater
than 5 mm. The oxidation behavior was also evaluated under a limited range of oxygen
partial pressure (0.2‒10 kPa). The saturation constant of oxygen for oxidation was
estimated to be 1.23 kPa, which is sufficiently lower than the partial pressure of oxygen
in air at atmospheric pressure.
Chapter 2
The oxidation process of methyl linoleate mixed with methyl octanoate, laurate or
palmitate at the molar ratio of 1:1 was measured at 65ºC. Methyl linoleate with methyl
octanoate was oxidized most rapidly, and the oxidation of the substrates mixed with
methyl laurate and palmitate followed. Methyl linoleate was mixed with methyl laurate
at the molar ratios of 1:3, 1:1 and 3:1, and its oxidation processes were measured.
Methyl linoleate mixed at the lower ratio (1:3) was the most retarded. The oxidation
processes were well simulated based on the kinetic equation of the autocatalytic type in
consideration of the independent evaporation of methyl octanoate, laurate or palmitate.
Chapter 3
Effects of mechanical stress during emulsification on the oxidation of methyl

50
linoleate were investigated by four methods (high-speed stirring, ultrasonic
homogenization, high-pressure homogenization and membrane emulsification). The
oxidation rates and induction periods were almost constant, regardless of the
emulsification method, except for membrane emulsification. When membrane
emulsification was performed using a cellulose acetate membrane, the induction period
was prolonged.
Chapter 4
Methyl linoleate and α-linolenate were used as representative n-6 and n-3 PUFA
esters, respectively, to examine the effect of oil droplet size on autoxidative stability in
O/W emulsion systems. The emulsions, which were prepared via membrane
emulsification and had a mean oil droplet size of approximately 1‒30 μm, had a stable
size during the autoxidation of each substrate at 55°C. The autoxidation of methyl
linoleate did not depend on oil droplet size during the entire process, and that of methyl
α-linolenate was independent of oil droplet size during the first half of the autoxidation
process. However, the autoxidation rate of methyl α-linolenate proceeded faster in the
emulsion with smaller oil droplet size during the last half of the autoxidation process.
51
References
Achir N., Kara W., Chipeaux C., Trezzani I., Cuvelier M.-E. Effect of energy transfer
conditions on the chemical degradation of frying oil. Eur. J. Lipid Sci. Technol., 108:
999‒1006 (2006).
Adachi S., Ishiguro T., Matsuno R. Thermal analysis of autoxidation of ethyl esters of
n-3 and n-6 fatty acids. Food Sci. Technol. Intl., 1: 1‒4 (1995a).
Adachi S., Ishiguro T., Matsuno R. Autoxidation kinetics for fatty acids and their ester. J.
Am. Oil Chem. Soc., 72: 547‒551 (1995b).
Aladedunye F., Catel Y., Przybylski R. Novel caffeic acid amide antioxidants: Synthesis,
radical scavenging activity and performance under storage and frying conditions.
Food Chem., 130: 945‒952 (2012).
Atarés L., Marshall L.J., Akhtar M., Murray B.S. Structure and oxidative stability of oil
in water emulsions as affected by rutin and homogenization procedure. Food Chem.,
134: 1418‒1424 (2012).
Berdeaux O., Fontagné S., Sémon E., Velasco J., Sébédio J.L., Dobarganes C. A detailed
identification study on high-temperature degradation products of oleic and linoleic
acid methyl esters by GC-MS and GC-FTIR. Chem. Phys. Lipids, 165: 338‒347
(2012).
Berton-Carabin C., Genot C., Gaillard C., Guibert D., Ropers M.H. Design of interfacial
films to control lipid oxidation in oil-in-water emulsions. Food Hydrocoll., 33:
99‒105 (2013).
Boon C.S., Xu Z., Yue X., McClements D.J., Weiss J., Decker E.A. Factors affecting
lycopene oxidation in oil-in-water emulsions. J. Agric. Food Chem., 56: 1408‒1414
(2008).
52
Chaiyasit W., Elias R.J., McClements D.J., Decker E.A. Role of physical structures in
bulk oils on lipid oxidation. Crit. Rev. Food Sci. Nutr., 47: 299‒317 (2007).
Chen Z.Y., Nawar W.W. The role of amino acids in the autoxidation of milk fat. J. Am.
Oil Chem. Soc., 86:47‒50 (1991).
Chen J.F., Tai C.-Y., Chen Y.C., Chen B.H. Effect of conjugated linoleic acid on the
degradation and oxidation stability of model lipids during heating and illumination.
Food Chem., 72: 199‒206 (2001).
Choe E., Min D.B. Mechanisms and factors for edible oil oxidation. Compr. Rev. Food
Sci. Food Saf., 5: 169‒186 (2006).
Coupland J.N., McClements D.J. Lipid oxidation in food emulsions. Trends Food Sci.
Technol., 7: 83‒91 (1996).
Dimakou C.P., Kiokias S.N., Tsaprouni I.V., Oreopoulou V. Effect of processing and
storage parameters on the oxidative deterioration of oil-in-water emulsions. Food
Biophys., 2: 38‒45 (2007).
Duxbury D. Omega-3s offer solutions to trans fat substitution problems. Food Technol.,
59: 34‒39 (2005).
Frankel E.N. Lipid oxidation. Progr. Lipid Res., 19: 1‒22 (1980).
Frankel E.N. Recent Advances in Lipid Oxidation. J. Sci. Food Agric., 54: 495‒511
(1991).
Furuta T., Zhao R., Nojima M., Soottitantawat A., Yoshii H., Linko P. Effect of
emulsion size on the stability of emulsified docosahexaenoic acid and its esters. In
“Asian Pacific Confederation of Chemical Engineers congress program and
abstracts”, The Society of Chemical Engineers, Japan, Tokyo, 3J-12, on-line number
558 (2005).

53
Giroux H.G., St-Amant J.B., Fustier P., Chapuzet J.M., Britten M. Effect of
electroreduction and heat treatments on oxidative degradation of a dairy beverage
enriched with polyunsaturated fatty acids. Food Res. Int., 41: 145‒153 (2007).
Gohtani S., Sirendi M., Yamamoto N., Kajikawa K., Yamono Y. Effect of droplet size on
oxidation of docosahexaenoic acid in emulsion system. J. Disper. Sci. Technol., 20:
1319‒1325 (1999).
Gollnick K., Mechanism and kinetics of chemical reactions of singlet oxygen with
organic compounds. In “Singlet Oxygen”, edited by Ranby B. and Rabek J.F., John
Wiley & Sons, New York, pp. 111‒134 (1978).
Guillén M.D., Goicoechea E. Formation of oxygenated α, β-unsaturated aldehydes and
other toxic compounds in sunflower oil oxidation at room temperature in closed
receptacles. Food Chem., 111: 157‒164 (2008).
Halliwell B., Murcia M.A., Chirico S., Aruoma O.I. Free radicals and antioxidants in
food and in vivo: What they do and how they work. Crit. Rev. Food Sci. Nutr., 35:
7‒20 (1995).
Huber G.M., Vasantha Rupasinghe H.P., Shahidi F. Inhibition of oxidation of omega-3
polyunsaturated fatty acids and fish oil by quercetin glycosides. Food Chem., 51:
1696‒1700 (2009).
Imai H., Maeda T., Shima M., Adachi S. Oxidation of methyl linoleate in O/W micro-
and nanoemulsion systems. J. Am. Oil Chem. Soc., 85: 809‒815 (2008).
Ishido E., Minemoto Y., Adachi S., Matsuno R. Oxidation of linoleic acid and methyl
linoleate mixed with saturated fatty acid or its methyl ester. Lebensm.-Wiss.
u.-Technol., 34: 234‒238 (2001).
Ishido E., Minemoto Y., Adachi S., Matsuno R. Oxidation of polyunsaturated

54
acylglycerol mixed with saturated or unsaturated acylglycerol. Food Sci. Technol.
Res., 8: 353‒356 (2002a).
Ishido E., Adachi S., Minemoto Y., Matsuno R. Kinetic expression for the oxidation of
linoleic acid and arachidonic acid esters in their mixed system. Biosci. Biotechnol.
Biochem., 66: 73‒77 (2002b).
Kadowaki, A., Iwamoto, S., and Yamauchi, R. The antioxidative effect of fullerenes
during the peroxidation of methyl linoleate in toluene. Biosci. Biotechnol. Biochem.,
76: 212‒214 (2012a).
Kadowaki, A., Iwamoto, S., and Yamauchi, R. Reaction products of [60]fullerene during
the autoxidation of methyl linoleate in bulk phase. Chem. Phys. Lipids, 165, 178‒185
(2012b).
Karel M., Control of lipid oxidation in dried foods. In “Concentration and Drying of
Foods”, edited by MacCarthy D., Elsevier Applied Science, London, pp. 37‒51
(1986).
Kim J.Y., Seo T.R., Lim S.T. Preparation of aqueous dispersion of β-carotene
nano-composites through complex formation with starch dextrin. Food Hydrocoll.,
33: 256‒263 (2013).
Kim J.Y., Kim M.-J., Lee J. Role of moisture on the lipid oxidation determined by D2O
in a linoleic acid model system. Food Chem., 146, 134‒140 (2014).
Krutulyte R., Grunert K.G., Scholderer J., Hagemann K.S., Elgaard P., Nielsen, B.
Motivational factors for consuming omega-3 PUFAs: an exploratory study with
Danish consumers. Appetite, 51: 137‒147 (2008).
Kuhn K.R., Cunha R.L. Flaxseed oil - Whey protein isolate emulsions: Effect of high
pressure homogenization. J. Food Eng., 111: 449‒457 (2012).

55
Labuza T.P. Kinetics of lipid oxidation in foods. Crit. Rev. Food Technol., 2: 355‒404
(1973).
Lethuaut L., Métro F., Genot C. Effect of droplet size on lipid oxidation rates of
oil-in-water emulsions stabilized by protein. J. Am. Oil Chem. Soc., 79: 425‒430
(2002).
Levenspiel O. Fluid-fluid reactions and solid-catalyzed reactions. In “Chemical
Reaction Engineering”, John Wiley & Sons, New York, Chapters 13 and 14 (1962).
Maire M., Rega B., Curelier M.-E., Sato P., Giampaoli P. Lipid oxidation in baked
products: Impact of formula and process on the generation of volatile compounds.
Food Chem., 141: 3510‒3518 (2013).
Marmesat S., Morales A., Velasco J., Dobarganes M.C. Influence of fatty acid
composition on chemical changes in blends of sunflower oils during thermoxidation
and flying. Food Chem., 135: 2333‒2339 (2012).
Mancuso J.R., McClements D.J., Decker D.A. The effects of surfactant type, pH, and
chelators on the oxidation of salmon oil-in-water emulsions. J. Agric. Food Chem.,
47: 4112‒4116 (1999).
McClements D.J., Decker E.A. Lipid oxidation in oil-in-water emulsions: impact of
molecular environment on chemical reactions in heterogeneous food systems. J. Food
Sci., 65: 1270‒1282 (2000).
Mei L.Y., McClements D.J., Wu J.N., Decker E.A. Iron-catalyzed lipid oxidation in
emulsion as affected by surfactant, pH and NaCl. Food Chem., 61: 307‒312 (1998).
Minemoto Y., Ishido E., Adachi S., Matsuno R. Autoxidation kinetics for
polyunsaturated acylglycerols. Food Sci. Technol. Res., 5: 104‒107 (1999).
Nakaya K., Ushino H., Matsukawa S., Shimizu M., Ohshima T. Effect of droplet size on
56
the oxidative stability of oil-in-water emulsions. Lipids, 40: 501‒507 (2005).
Osborn H.T., Akoh C.C. Effect of emulsifier type, droplet size, and oil concentration on
lipid oxidation in structured lipid-based oil-in-water emulsions. Food Chem., 84:
451‒456 (2004).
Özilgen S., Özilgen M. Kinetic Model of lipid oxidation in foods. J. Food Sci., 55:
498‒501 (1990).
Park E.Y., Murakami H., Mori T., Matsumura Y. Effect of protein addition on lipid
oxidation in powder model system. J. Agric. Food Chem., 53: 137‒144 (2005).
Poliseli-Scopel F.H., Hernádez-Herrero M., Guamis B., Ferragut V. Comparison of ultra
high pressure homogenization and conventional thermal treatments on the
microbiological, physical and chemical quality of soymilk. LWT - Food Sci. Technol.,
46: 42‒48 (2012).
Ramsden C.E., Zamora D., Leelarthaepin B., Majchrzak-Hong S.F., Faurot K.R.,
Suchindran C.M., Ringel A., Davis J.M., Hibbeln J.R. Use of dietary linoleic acid for
secondary prevention of coronary heart disease and death: evaluation of recovered
data from the Sydney Diet Heart Study and updated meta-analysis. Br. Med. J., 346:
e8707 (2013).
Richaud E., Audouin L., Fayolle B., Verdu J., Matisová-Rychlá L., Rychlý J. Rate
constants of oxidation of unsaturated fatty esters studied by chemiluminescence.
Chem. Phys. Lipids, 165: 753‒759 (2012).
Ries D., Ye A., Haisman D., Singh H. Antioxidant properties of caseins and whey
proteins in model oil-in-water emulsions. Intl. Dairy J., 20: 72‒78 (2010).
Ritter-Gooder P.K., Lewis N.M., Barber-Heidal K., Waltz-Hill M. Development and
pilot testing of an omega-3 fatty acid food frequency questionnaire. J. Food Compos.
57
Anal., 21: S43‒S49 (2008).
Rodriguez-Turienzo L., Cobos A., Diaz O. Effects of edible coatings based on
ultrasound-treated whey proteins in quality attributes of frozen Atlantic salmon
(Salmo salar). Innov. Food Sci. Emerg. Technol., 14: 92‒98 (2012).
Roman O., Heyd B., Broyart B., Castillo R., Maillard M. Oxidative reactivity of
unsaturated fatty acids from sunflower, high oleic sunflower and rapeseed oils
subjected to heat treatment, under controlled conditions. LWT - Food Sci. Technol.,
52: 49‒59 (2013).
Roozen J.P., Frankel E.N., Kinesella J.E. Enzymatic and autoxidation of lipids in low fat
foods: model of linoleic acid in emulsified hexadecane. Food Chem., 50: 33‒38
(1994).
Silvestre M.P.C., Chaiyasit W., Brannan R.G., McClements D.J., Decker E.A. Ability of
surfactant head group size to alter lipid and antioxidant oxidation in oil-in-water
emulsions. J. Agric. Food Chem., 48: 2057‒2061 (2000).
Simic M.G., Jovanovic S.V., Niki E. Mechanisms of lipid oxidative processes and their
inhibition. In “Lipid oxidation in food (ACS symposium series 500)”, edited by A.J.
St. Angelo, American Chemical Society, Washington, pp. 14‒32 (1992).
Siró I., Kápolna E., Kápolna B., Lugasi A. Functional food product development,
marketing and consumer acceptance - a review. Appetite, 51: 456‒467 (2008).
Sun S., Gunasekaran S. Effects of protein concentration and oil-phase volume fraction
on the stability and rheology of menhaden oil-in-water emulsions stabilized by whey
protein isolate with xanthan gum. Food Hydrocoll., 23: 165‒174 (2009).
Taherian A.R., Britten M., Sabik H., Fustier P. Ability of whey protein isolate and/or
fish to inhibit physical separation and lipid oxidation in fish oil-in-water beverage
58
emulsion. Food Hydrocoll., 25: 868‒878 (2011).
Uriarte P.S., Guillén M.D. Formation of toxic alkylbenzenes in edible oils submitted to
frying temperature influence of oil composition in main components and heating time.
Food Res. Intl., 43: 2161‒2170 (2010).
Usuki R. Measurements of lipid peroxides. In “Experimental Techniques for Lipid
Peroxides” (in Japanese), edited by Kaneda T. and Ueda N., Ishiyaku Shuppan, Tokyo,
pp. 42‒43 (1983).
Wilke C.R., Chang P. Correlation of diffusion coefficients in dilute solutions. AIChE J.,
1: 264‒270 (1955).
Yoshii H., Furuta T., Itoh T., Yoshimura K., Misawa Y., Hata N., Kobayashi H., Linko
Y.Y., Linko P. Kinetic analysis of the autoxidation of eicosapentaenoate at different
oxygen levels. Biosci. Biotechnol. Biochem., 63: 662‒665 (1999).

59
Acknowledgements
This three years and a half of study at Kyoto University is one of the most valuable
experiences in my life. Studying abroad changed my outlook on life and gave me more
confidence in the future. I want to take this opportunity to convey my sincere
appreciations to those people who helped me and shaped my experience for the better.
First and the most, I would like to express my deepest gratitude and highest respect to
my supervisor, Professor Shuji Adachi, for his patient guidance and direction with
professional insight and experience. It would be an impossible mission for me to finish
this thesis without his kind helps, great supports and inspiring advices. I would also like
to appreciate his gracious tolerance of my persistence.
I would like to express my cordial acknowledgement to Associate Professor Kyuya
Nakagawa for his helpful discussions, warm encouragements and valuable advices.
My sincere gratitude is due to Assistant Professor Takashi Kobayashi, for his
supportive assistances and valuable discussions on my experiments. I could not finish
my research paper writing work on time without his careful guidance and responsible
supervision.
I would like to express my particularly grateful to Rumiko Kamiya, for her valuable
works and special cares for me and other foreign students in this laboratory. With her
help and support, the daily laboratory life goes more smoothly and efficiently.
I want to appreciate the great cares and kind helps I have received from all the
members of the Bioengineering Laboratory. I am deeply grateful to Rongchun Wang
and Tai-Ying Chiou for their instant helps and encouraging supports with endless
patience, especially in the first days when I just came to Japan. My sincerely thanks go
to the members of emulsions and enzymes research group, Kyohei Sasaki, Akiko
60
Minami, Tomoko Takahashi, Naho Mizuno and Akane Ogino, for their valuable
discussions and generous helps, particularly for their precious supports and guidance on
instruments and technologies. I want to thank the foreign students, Tangkhavanich
Boonnakhom, Incharoensakdi Chaiyapat, Daming Gao, Intira Koomyart and Teeraya
Jarunglumlert, for their kind helps and caring supports with my study and life
throughout those memorable days. I would also like to give thanks to Takenobu Ogawa
for his helpful advices and suggestions of the laboratory seminar and scientific meeting
presentation. I want to express my thanks to Utano Aimoto, Satoshi Koizumi, Yukie
Ohishi, Yuki Sha, Masashi Yoshino, Takao Roppongi, Hironori Nagamizu and Yayoi
Miyagawa, for their patient assistances and kind supports, especially for their helps on
the Japanese language modifications of my laboratory seminar resumes and oral
presentation materials. My thankfulness also goes to Keisuke Nakata, Ayako Hasegawa,
Yayoi Tomita, Kenichiro Takeda, Kaori Koyama, Kazutaka Katsuki, Soma Fukuzawa
and Risako Yamamoto, who were nice, helpful and encouraging to me.
I gratefully acknowledge the Monbukagakusho scholarship from the Japanese
Government for financial support of my doctoral study and contribution to my life in
Japan.
Finally, I would like to express my sincere appreciate to my parents, for their fully
trust, supports and encouragements throughout the entire period of my study and my life.
No matter what I do and where I go, my parents always stand beside me, providing their
incessant helps, loves and cares.

61
List of Publications
T. Ma, T. Takahashi, T. Kobayashi, S. Adachi. Oxidation of methyl linoleate mixed with
methyl octanoate, laurate and palmitate. Japan Journal of Food Engineering, 13 (2):
25‒29 (2012).
T. Ma, T. Kobayashi, S. Adachi. Effect of droplet size on autoxidation rates of methyl
linoleate and α-linolenate in an oil-in-water emulsion. Journal of Oleo Science, 62 (12):
1003‒1008 (2013).
T. Ma, T. Kobayashi, S. Adachi. Kinetics of oxidation of different depths of methyl
linoleate in bulk phase. Food Science and Technology Research, in press.
T. Ma, T. Kobayashi, S. Adachi. Effects of various emulsification methods on the
oxidation of methyl linoleate. Bioscience, Biotechnology, and Biochemistry, in press.