Embed Size (px)
Citation preview
TIỂU BAN BÊ TÔNG - VẬT LIỆU XÂY DùNG
SESSION:
CONCRETE AND CONSTRUCTION MATERIALS

Hội nghị khoa học quốc tế Kỷ niệm 55 năm ngày thành lập Viện KHCN Xây dựng
29
ẢNH HƯỞNG CỦA KÍCH THƯỚC CỐT LIỆU BÊ TÔNG NỀN ĐẾN TÍNH CHẤT CỦA BÊ TÔNG NHẸ CỐT LIỆU POLYSTYRENE
EFFECT OF MATRIX PARTICLE SIZE ON EPS LIGHTWEIGHT CONCRETE PROPERTIES
ThS. Lê Phượng Ly, TS. Hoàng Minh Đức Viện Khoa học Công nghệ Xây dựng, Email: [email protected]
TÓM TẮT: Bê tông nhẹ polystyrene là vật liệu composite được chế tạo bằng cách đưa hạt polystyrene phồng nở vào hỗn hợp bê tông thông thường, gọi là (bê tông nền). Kết quả nghiên cứu trình bày trong bài báo này cho thấy tính chất của bê tông polystyrene kết cấu, như tính công tác và cường độ chịu nén, phụ thuộc vào kích thước hạt lớn nhất trong bê tông nền. Giảm kích thước hạt lớn nhất trong bê tông nền là biện pháp hữu hiệu để tăng tính công tác và cường độ chịu nén của bê tông polystyrene kết cấu. Tỷ lệ giảm cường độ chịu nén của bê tông trong cấp phối nền có đường kính hạt lớn nhất là 20 mm lớn gấp đôi so với bê tông trên cơ sở cấp phối nền có đường kính hạt lớn nhất là 1,25 mm. Ở cùng khối lượng thể tích, cường độ chịu nén của bê tông polystyrene kết cấu giảm đáng kể khi đường kính hạt lớn nhất trong bê tông nền lớn hơn 10 mm. Nghiên cứu đã chế tạo được bê tông polystyrene kết cấu có khối lượng thể tích trong khoảng từ 1.400 kg/m³ đến 1.800 kg/m³ và cường độ chịu nén lớn hơn 20 MPa, đáp ứng yêu cầu về cường độ và khối lượng thể tích cho kết cấu bê tông và bê tông cốt thép sử dụng bê tông nhẹ.
TỪ KHÓA: bê tông nhẹ, cốt liệu polystyrene phồng nở, bê tông polystyrene kết cấu, độ sụt, cường độ chịu nén.
ABSTRACT: Expanded polystyrene lightweight concrete is a composite which can be made by adding expanded polystyrene aggregate in normalweight concrete as matrix. The research is focused on the effect of properties and volume of the matrix on the properties of lightweight concrete. The results show that properties of structural polystyrene concrete, such as workability and compressive strength, depend on the aggregate's size of the matrix. It also shows that decreasing normal aggregate's size of the matrix is the effective way to increase workability and compressive strength of concrete. The percentage decrease in strength of the concretes base on matrix containing 20 mm normal aggregate was large double size compared to the concretes base on matrix containing 1.25 mm normal aggregate. At the same density, the compressive strength of the structural polystyrenre concrete significantly decreased when the concrete aggregate diameter greater than 10 mm. The research has produced expanded polystyrene concrete with density from 1,400 kg/m³ to 2,000 kg/m³ and compressive strength more than 20 MPa for structural application.
KEYWORDS: Lightweight concrete, Expanded polystyrene, Structural polystyrene concrete, Slump, Compressive strength.
1. MỞ ĐẦU Bê tông nhẹ sử dụng cốt liệu nhẹ vô cơ như
keramzit, agropolite đã được áp dụng khá phổ biến trong các công trình xây dựng và giao thông trên thế giới. Trong khi đó, bê tông nhẹ sử dụng cốt liệu nhẹ hữu cơ như hạt polystyrene phồng nở (EPS) mặc dù đã có các ứng dụng đáng khích lệ nhưng vẫn cần được nghiên cứu một cách toàn diện hơn. Bê tông polystyrene cách nhiệt kết cấu, có khối lượng thể tích từ khoảng 500 kg/m³ đến 900 kg/m³ dùng cho các sản phẩm như viên xây, panel nhẹ không chịu lực, đã được nghiên cứu và ứng dụng nhiều. Bê tông polystyrene có thể được chế tạo với khối lượng thể tích và cường độ cao hơn, đáp ứng yêu cầu của bê tông cho các kết cấu chịu lực, tuy vậy, bê tông kết cấu sử dụng cốt liệu polystyrene phồng nở chưa được đề cập đến trong các tiêu chuẩn thiết kế kết cấu bê tông và bê tông cốt thép.
Bê tông polystyrene có thể sử dụng để chế tạo các cấu kiện chịu lực dạng cấu kiện đúc sẵn hoặc thi công tại công trường [1, 2]. Đây là một ưu thế rất lớn so với
bê tông khí chưng áp hay bê tông bọt. Khối lượng thể tích của bê tông polystyrene có thể được điều chỉnh khá dễ dàng và linh hoạt bằng cách thay đổi lượng sử dụng cốt liệu EPS [3, 4]. Cốt liệu polystyrene có thể sử dụng là hạt polystyrene phồng nở hoặc cốt liệu thu được sau khi nghiền phế thải polystyrene dạng tấm [6]. Chất lượng của bê tông polystyrene có thể được điều chỉnh bằng nhiều biện pháp, như việc sử dụng phụ gia khoáng hoạt tính tro bay [5, 6, 7], phụ gia khoáng silicafume [4], Phụ gia tro trấu nghiền mịn [9]. Nghiên cứu [10] đã sử dụng nano silica fume trong thành phần bê tông chế tạo bê tông polystyrene và đạt được hiệu quả nâng cao cường độ so với phương án sử dụng phụ gia silicafume thông thường. Việc sử dụng các loại phụ gia khoáng hoạt tính bên cạnh việc cải thiện cường độ của bê tông còn có ảnh hưởng nhất định đến tính công tác của bê tông polystyrene nên để nâng cao cường độ đồng thời đảm bảo tính công tác của hỗn hợp bê tông, các nghiên cứu [8, 10] đã sử dụng phụ gia giảm nước trong thành phần chế tạo bê tông.
Hội nghị khoa học quốc tế Kỷ niệm 55 năm ngày thành lập Viện KHCN Xây dựng
30
Các nghiên cứu [4, 10, 11] cũng cho thấy kích thước hạt cốt liệu EPS có ảnh hưởng đến tính chất của bê tông polystyrene, đặc biệt là cường độ chịu nén. Tuy nhiên ảnh hưởng này rất rõ ràng đối với bê tông có khối lượng thể tích thấp, nhưng lại là không đáng kể đối với bê tông khối lượng thể tích cao [4]. Ngoài ra, nghiên cứu [10] cho thấy hạt EPS có kích thước 1 mm đến 2,5 mm ít ảnh hưởng đến cường độ chịu nén của bê tông [10]. Như vậy, trong chế tạo bê tông polystyrene kết cấu (BPK) có khối lượng thể tích trong khoảng từ 1.400 kg/m³ đến 2.000 kg/m³ thì sử dụng hạt nhẹ kích thước từ 1 mm đến 2,5 mm không ảnh hưởng nhiều đến cường độ chịu nén của bê tông.
Cốt liệu EPS là sản phẩm thu được khi gia công nhiệt hạt polystyrene nguyên liệu. Hạt EPS có dạng hình cầu chuẩn có cấu trúc xốp bên trong và bề mặt hạt trơn nhẵn, không hút nước. Do đó, khác với các loại cốt liệu nhẹ khác như keramzit hay peclit, vốn là loại cốt liệu nhẹ có đặc điểm hút nước mạnh, sự có mặt của EPS trong bê tông không làm thay đổi lượng nước tự do, cũng như tỷ lệ nước trên xi măng của bê tông nền. Hạt EPS không tương tác về mặt hóa học với bê tông nền mà chỉ làm giảm khối lượng thể tích của hỗn hợp bê tông. Tuy nhiên, sự có mặt của EPS với modun đàn hồi thấp cũng có ảnh hưởng nhất định đến các tính chất vật lý, cơ lý, biến dạng,... của bê tông nền. Có thể coi bê tông polystyrene là hệ vật liệu composit mà ở đó hạt EPS được phân bố đều trong vật liệu nền là bê tông nặng thông thường. Trong đó, hạt EPS được đưa vào nhằm biến tính vật liệu nền theo hướng làm giảm khối lượng thể tích và qua đó cũng làm thay đổi các tính chất khác của hỗn hợp bê tông và bê tông. Tính chất của bê tông polystyrene có thể được nghiên cứu trong mối quan hệ ảnh hưởng của tính chất hạt EPS, tính chất bê tông nền và tỷ lệ giữa hai thành phần trên.
Cốt liệu EPS có kích thước hạt từ 1,5 đến 5,0 mm, nằm trong kích thước cốt liệu nhỏ. Trong bê tông polystyrene, tương quan kích thước hạt cốt liệu EPS so với kích thước hạt lớn nhất trong bê tông nền có thể chia làm ba trường hợp.
Khi kích thước hạt cốt liệu EPS lớn hơn kích thước hạt lớn nhất của cốt liệu trong bê tông nền, hỗn hợp vữa xi măng bao bọc xung quanh EPS, hạt cốt liệu EPS đóng vai trò là cốt liệu lớn. Sau khi đóng rắn thì lớp này hình thành khung chịu lực cho bê tông. Chiều dày vách tạo bởi vữa xi măng này bằng khoảng cách giữa các hạt cốt liệu EPS. Giả thiết là hạt cốt liệu EPS phân bố đều trong thành phần bê tông theo mô hình sắp xếp chặt khít nhất. Khi đó, với cùng kích thước hạt thì khoảng cách giữa các hạt cốt liệu EPS là như nhau. Trường hợp này, tương tự như cấu trúc bê tông keramzit với việc sử dụng cốt liệu lớn keramzit và bê tông nền sử dụng cốt liệu nhỏ là cát nặng thông thường. Do đó, có thể tính được hệ số dư vữa trong bê tông. Nghiên cứu [3] đã cho thấy hệ số dư vữa có ảnh hưởng lớn đến các tính chất bê tông polystyrene có khối lượng thể tích thấp hơn 700 kg/m³.
Tuy nhiên với BPK, có khối lượng thể tích trong khoảng từ 1.400 kg/m³ đến 2.000 kg/m³ và có kích thước lớn nhất của cốt liệu nặng nhỏ hơn kích thước cốt liệu EPS thì hệ số dư vữa cao. Do cường độ chịu nén của cốt liệu EPS là không đáng kể nên bê tông nền đóng vai trò làm khung chịu lực. Tính công tác của BPK phụ thuộc vào tính chất bê tông nền và khoảng cách giữa các hạt cốt liệu EPS.
Mặt khác, với BPK có khối lượng thể tích trong khoảng từ 1.400 kg/m³ đến 2.000 kg/m³, khoảng cách giữa cốt liệu EPS đủ lớn để sử dụng cốt liệu lớn trong bê tông nền. Khi đó, kích thước hạt cốt liệu EPS nhỏ hơn hoặc bằng kích thước hạt lớn nhất của cốt liệu trong bê tông nền. Với tỷ lệ thể tích bê tông nền cao, khối lượng thể tích hỗn hợp bê tông cao, chiều dày thành vách tạo bởi bê tông nền bằng khoảng cách giữa các hạt EPS. Tuy nhiên, khi giảm tỷ lệ thể tích bê tông nền thì sự có mặt của cốt liệu lớn có thể ảnh hưởng đến phân bố EPS trong bê tông. Khi đó, có thể xem như EPS phân bố đều trong hỗn hợp vữa xi măng của bê tông nền. Lúc này, giảm tỷ lệ thể tích bê tông nền thì lượng vữa xi măng giảm, khoảng cách giữa cốt liệu EPS giảm, ảnh hưởng của kích thước cốt liệu nặng trong bê tông nền đến cường độ BPK tăng.
Kết quả ứng dụng thực tế đã cho thấy bê tông polystyrene được đánh giá là vật liệu có nhiều triển vọng phát triển tại Việt Nam do có ưu thế so với bê tông tổ ong ở khả năng chống thấm, có ưu thế so với bê tông keramzit ở khả năng chủ động nguồn nguyên liệu. Mở rộng ứng dụng bê tông polystyrene trong xây dựng ở Việt Nam trong giai đoạn tới có thể đạt được nhờ phát triển hệ sản phẩm BPK với khối lượng thể tích đến 2.000 kg/m³, cường độ chịu nén trên 20 MPa, đáp ứng yêu cầu sử dụng trong các cấu kiện, kết cấu bê tông cốt thép chịu lực. Bài báo này trình bày các nghiên cứu được thực hiện tại Viện Chuyên ngành Bê tông - Viện Khoa học Công nghệ xây dựng về ảnh hưởng của kích thước hạt lớn nhất của cốt liệu trong bê tông nền đến tính công tác và cường độ chịu nén của BPK có khối lượng thể tích từ 1.400 kg/m³ đến 2.000 kg/m³.
2. VẬT LIỆU VÀ PHƯƠNG PHÁP
2.1. Vật liệu Nghiên cứu đã sử dụng cốt liệu EPS sản xuất bởi
Công ty Cổ phần Hanel Xốp nhựa. Các tính chất của EPS được trình bày tại Bảng 1.
Xi măng sử dụng là PC40 Bút Sơn, có cường độ tuổi 28 ngày là 44,3 MPa, khối lượng riêng là 3,05 g/cm3, độ mịn là 3.410 cm²/g. Silicafume D920 có khối lượng riêng là 2,2 g/cmg/cm3 chỉ số hoạt tính theo cường độ là 1,0. Để tăng tính công tác, đã sử dụng phụ gia siêu dẻo gốc polycarboxylate SP có khả năng giảm nước 25-30%, tỷ trọng 1,05 ± 0,02 g/ml, hàm lượng chất khô 28,7%. Để
Hội nghị khoa học quốc tế Kỷ niệm 55 năm ngày thành lập Viện KHCN Xây dựng
31
điều chỉnh độ nhớt của hỗn hợp bê tông đã sử dụng phụ gia dạng bột trên cơ sở hydroxy propyl metyl xenlulo, ký hiệu VM, có độ pH 4-8, độ nhớt 35.000 - 47.000 mPa.s (dung dịch 2% ở 20°C).
Cốt liệu lớn sử dụng trong nghiên cứu là đá dăm gốc cacbonate, gồm hai loại D1 và D2, có kích thước hạt lớn nhất tương ứng là 10 mm và 20 mm. Cốt liệu nhỏ gồm có 3 loại ký hiệu là C1, C2, C3 có kích thước
hạt lớn nhất tương ứng là 0,63 mm, 1,25 mm, 5 mm. Các tính chất của cốt liệu được trình bày trong Bảng 2.
Bảng 1. Các tính chất của hạt EPS
STT Chỉ tiêu Đơn vị Giá trị
1 Kích thước hạt mm 1,5÷2,5
2 Khối lượng thể tích của hạt kg/m³ 19,7
3 Khối lượng thể tích xốp kg/m³ 11,1
Bảng 2. Tính chất của cốt liệu
STT Chỉ tiêu kỹ thuật Đơn vị C1 C2 C3 D1 D2
1 Khối lượng riêng g/cm³ 2,66 2,65 2,65 2,85 2,85
2 Khối lượng thể tích bão hoà nước g/cm³ 2,64 2,64 2,64 2,84 2,84
3 Khối lượng thể tích khô g/cm³ 2,62 2,63 2,63 2,8 2,8
4 Độ hút nước % 0,4 0,2 0,2 0,5 0,5
5 Khối lượng thể tích xốp kg/m³ 1.310 1.430 1.440 1400 1410
6 Độ hổng % 0,45 0,45 0,45 0,50 0,50
7 Hàm lượng bùn, bụi, sét % 0,7 0,5 0,5 - -
8
Thành phần hạt (sót riêng) 20 mm 10 mm 5 mm 2,5 mm 1,25 mm 0,63 mm 0,315 mm 0,14 mm đáy sàng (< 0,14)
%
- - 0 0 0 0
45,7 48,9 5,4
- - 0 0 0
47,1 28,6 19,9 4,4
- - 0
8,5 16,8 21,8 27,7 20,8 4,4
- 0
100 0 - - - - -
0
100 0 - - - - - -
2.2. Phương pháp thí nghiệm
Tính chất của vật liệu sử dụng và hỗn hợp bê tông được xác định theo các phương pháp tiêu chuẩn quy định trong tiêu chuẩn quốc gia. Riêng với hạt EPS, do có khối lượng thể tích nhỏ hơn nhiều so với khối lượng thể tích của cốt liệu thông thường, nên nghiên cứu này đã xác định khối lượng thể tích hạt EPS bằng tính toán, thông qua việc xác định khối lượng thể tích xốp và độ rỗng của cốt liệu, theo phương pháp đã áp dụng trong nghiên cứu [2]. Độ hổng giữa các hạt được xác định bằng tỷ lệ thể tích nước thêm vào ống đong với các hạt EPS được đổ sẵn và giữ ở mức cố định.
Nghiên cứu đã sử dụng mô hình toán để tính nội suy các giá trị cường độ tại các mức khối lượng thể tích và cường độ chịu nén dựa trên các số liệu thí nghiệm thực tế.
2.3. Cách chế tạo bê tông
BPK được chế tạo bằng cách thêm một lượng cốt liệu EPS nhất định vào bê tông nền.
Để nghiên cứu ảnh hưởng của bê tông nền và EPS đến tính chất của BPK đã sử dụng các cấp phối bê tông nền với tính chất và vật liệu khác nhau (Bảng 3). Lượng dùng vật liệu BPK được tính toán trên cơ sở khối lượng thể tích hỗn hợp bê tông và tính chất vật liệu đầu vào.
Hội nghị khoa học quốc tế Kỷ niệm 55 năm ngày thành lập Viện KHCN Xây dựng
32
Bảng 3. Cấp phối bê tông nền sử dụng trong nghiên cứu
Lượng dùng vật liệu Tính chất
Ký hiệu Dmax, mm X,
kg/m³ N,
lit/m³ C,
kg/m³Đ,
kg/m³ SF,
kg/m³ SP, l/m³
MC,kg/m³
Khối lượng
thể tích,
kg/m³
Độ sụt, mm
Cường độ chịu nén,
MPa
M0.63.80.21 0,63 793 309 970 - 79,34 7,93 1,19 2.160 220 82,0
M0.63.80.18 0,63 779 303 953 - 77,94 5,80 1,17 2.120 180 72,0
M0.63.80.14 0,63 776 302 949 - 77,61 4,66 1,16 2.110 140 60,4
M1.25.80.21 1,25 768 299 938 - 76,76 7,68 1,15 2.090 210 82,5
M1.25.80.18 1,25 754 293 921 - 75,37 5,61 1,13 2.050 180 84,1
M100.80.21 10 595 231 727 661 59,47 5,95 0,89 2.280 205 78,2
M100.80.18 10 587 228 718 653 58,73 4,44 0,88 2.250 180 76,5
M100.80.14 10 574 223 702 638 57,44 3,51 0,86 2.200 140 75,5
M200.80.21 20 597 232 730 664 59,73 5,97 0,90 2.290 205 81,1
M200.80.18 20 593 231 724 659 59,27 3,62 0,89 2.270 180 82,4
M200.80.14 20 587 228 718 653 58,75 3,59 0,88 2.250 140 82,2
3. KẾT QUẢ VÀ BÀN LUẬN
3.1. Tính công tác của bê tông polystyrene kết cấu Trước tiên, để nghiên cứu ảnh hưởng của khối
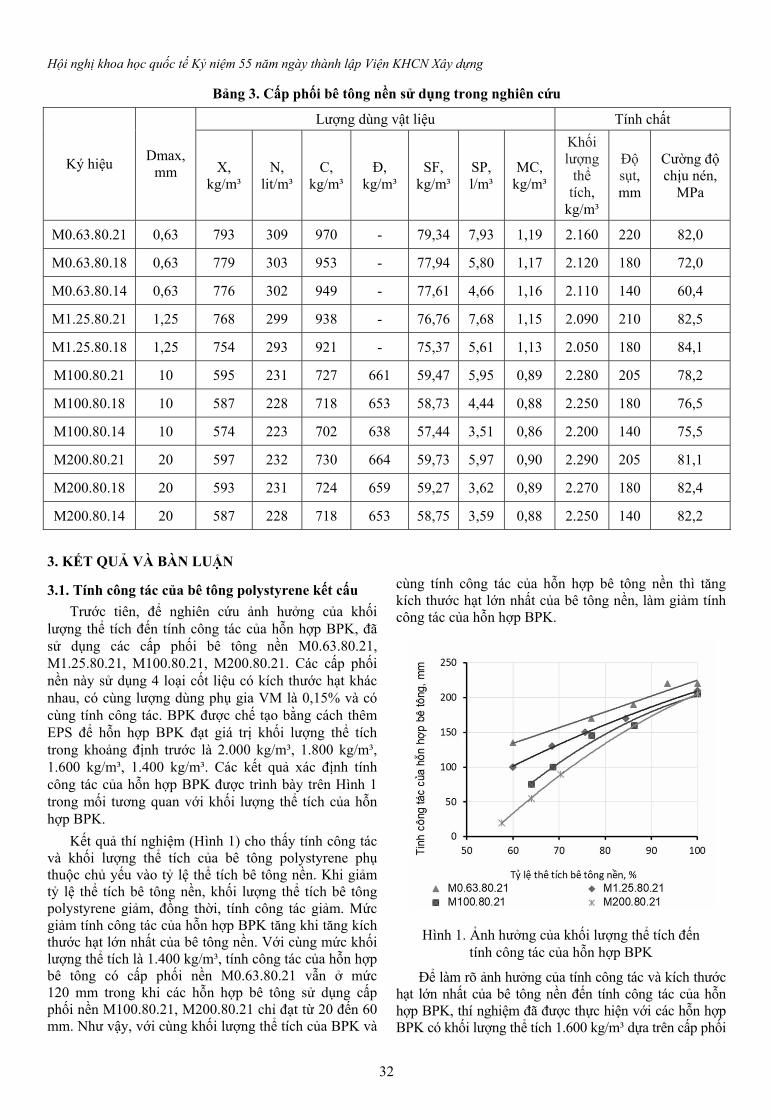
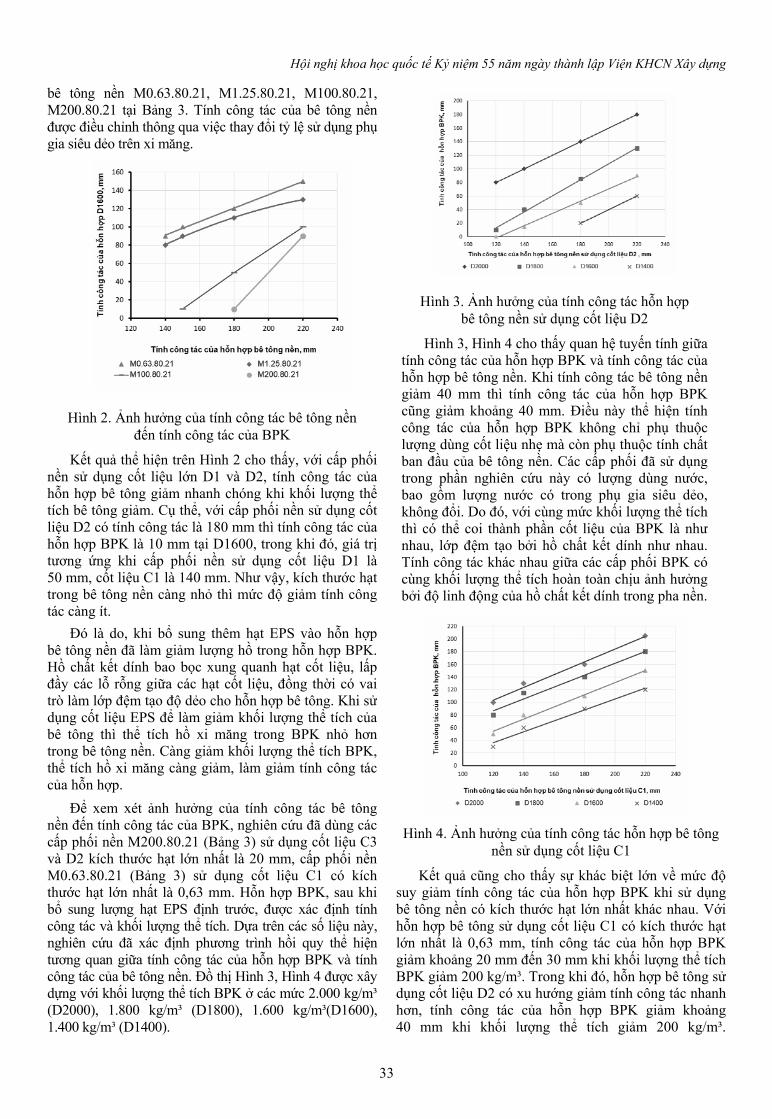
lượng thể tích đến tính công tác của hỗn hợp BPK, đã sử dụng các cấp phối bê tông nền M0.63.80.21, M1.25.80.21, M100.80.21, M200.80.21. Các cấp phối nền này sử dụng 4 loại cốt liệu có kích thước hạt khác nhau, có cùng lượng dùng phụ gia VM là 0,15% và có cùng tính công tác. BPK được chế tạo bằng cách thêm EPS để hỗn hợp BPK đạt giá trị khối lượng thể tích trong khoảng định trước là 2.000 kg/m³, 1.800 kg/m³, 1.600 kg/m³, 1.400 kg/m³. Các kết quả xác định tính công tác của hỗn hợp BPK được trình bày trên Hình 1 trong mối tương quan với khối lượng thể tích của hỗn hợp BPK.
Kết quả thí nghiệm (Hình 1) cho thấy tính công tác và khối lượng thể tích của bê tông polystyrene phụ thuộc chủ yếu vào tỷ lệ thể tích bê tông nền. Khi giảm tỷ lệ thể tích bê tông nền, khối lượng thể tích bê tông polystyrene giảm, đồng thời, tính công tác giảm. Mức giảm tính công tác của hỗn hợp BPK tăng khi tăng kích thước hạt lớn nhất của bê tông nền. Với cùng mức khối lượng thể tích là 1.400 kg/m³, tính công tác của hỗn hợp bê tông có cấp phối nền M0.63.80.21 vẫn ở mức 120 mm trong khi các hỗn hợp bê tông sử dụng cấp phối nền M100.80.21, M200.80.21 chỉ đạt từ 20 đến 60 mm. Như vậy, với cùng khối lượng thể tích của BPK và
cùng tính công tác của hỗn hợp bê tông nền thì tăng kích thước hạt lớn nhất của bê tông nền, làm giảm tính công tác của hỗn hợp BPK.
Hình 1. Ảnh hưởng của khối lượng thể tích đến tính công tác của hỗn hợp BPK
Để làm rõ ảnh hưởng của tính công tác và kích thước hạt lớn nhất của bê tông nền đến tính công tác của hỗn hợp BPK, thí nghiệm đã được thực hiện với các hỗn hợp BPK có khối lượng thể tích 1.600 kg/m³ dựa trên cấp phối
Hội nghị khoa học quốc tế Kỷ niệm 55 năm ngày thành lập Viện KHCN Xây dựng
33
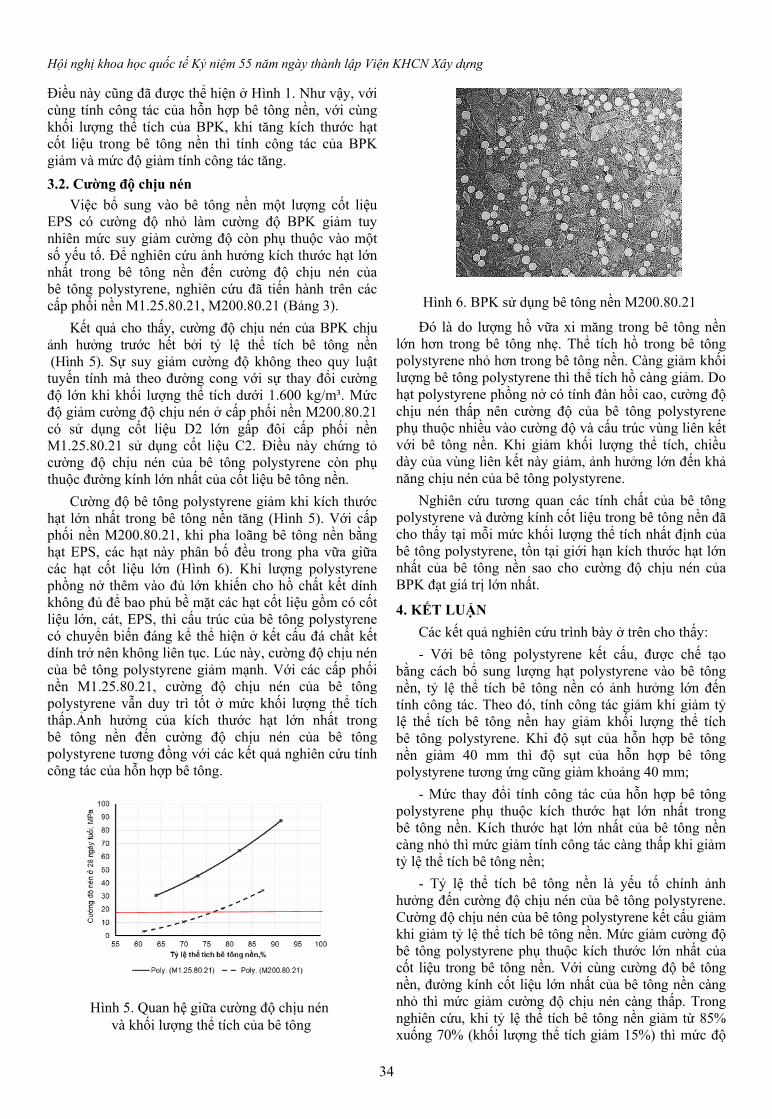
bê tông nền M0.63.80.21, M1.25.80.21, M100.80.21, M200.80.21 tại Bảng 3. Tính công tác của bê tông nền được điều chỉnh thông qua việc thay đổi tỷ lệ sử dụng phụ gia siêu dẻo trên xi măng.
Hình 2. Ảnh hưởng của tính công tác bê tông nền đến tính công tác của BPK
Kết quả thể hiện trên Hình 2 cho thấy, với cấp phối nền sử dụng cốt liệu lớn D1 và D2, tính công tác của hỗn hợp bê tông giảm nhanh chóng khi khối lượng thể tích bê tông giảm. Cụ thể, với cấp phối nền sử dụng cốt liệu D2 có tính công tác là 180 mm thì tính công tác của hỗn hợp BPK là 10 mm tại D1600, trong khi đó, giá trị tương ứng khi cấp phối nền sử dụng cốt liệu D1 là 50 mm, cốt liệu C1 là 140 mm. Như vậy, kích thước hạt trong bê tông nền càng nhỏ thì mức độ giảm tính công tác càng ít.
Đó là do, khi bổ sung thêm hạt EPS vào hỗn hợp bê tông nền đã làm giảm lượng hồ trong hỗn hợp BPK. Hồ chất kết dính bao bọc xung quanh hạt cốt liệu, lấp đầy các lỗ rỗng giữa các hạt cốt liệu, đồng thời có vai trò làm lớp đệm tạo độ dẻo cho hỗn hợp bê tông. Khi sử dụng cốt liệu EPS để làm giảm khối lượng thể tích của bê tông thì thể tích hồ xi măng trong BPK nhỏ hơn trong bê tông nền. Càng giảm khối lượng thể tích BPK, thể tích hồ xi măng càng giảm, làm giảm tính công tác của hỗn hợp.
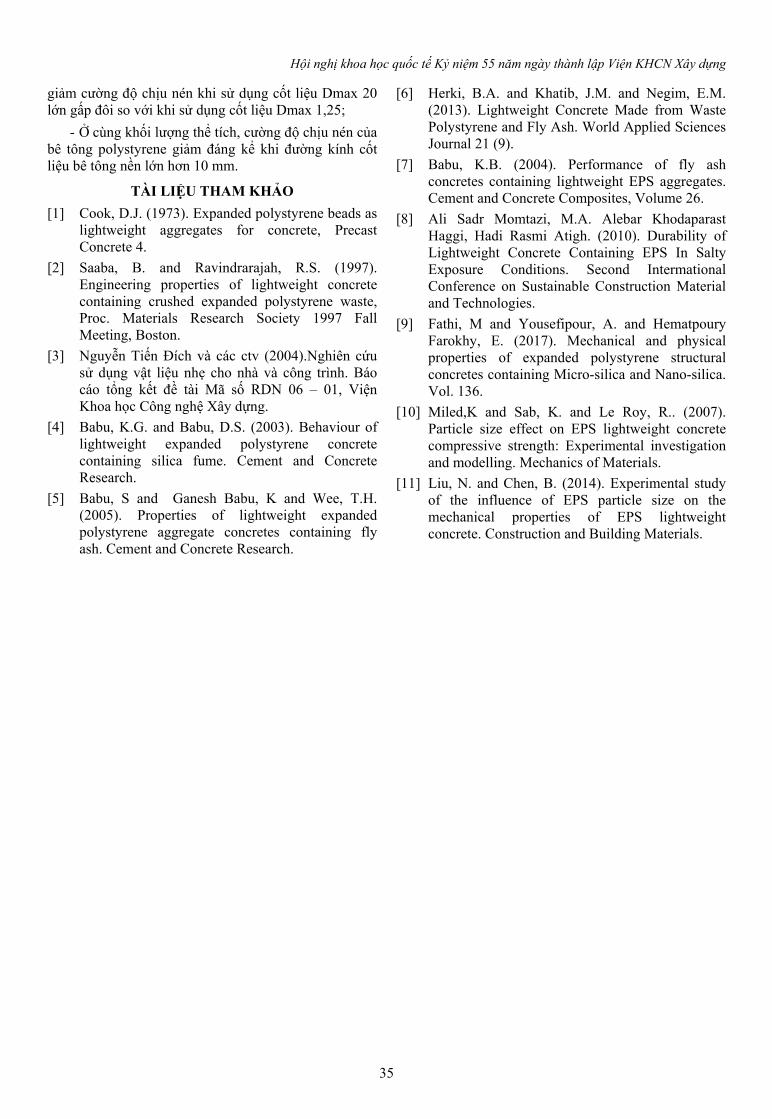
Để xem xét ảnh hưởng của tính công tác bê tông nền đến tính công tác của BPK, nghiên cứu đã dùng các cấp phối nền M200.80.21 (Bảng 3) sử dụng cốt liệu C3 và D2 kích thước hạt lớn nhất là 20 mm, cấp phối nền M0.63.80.21 (Bảng 3) sử dụng cốt liệu C1 có kích thước hạt lớn nhất là 0,63 mm. Hỗn hợp BPK, sau khi bổ sung lượng hạt EPS định trước, được xác định tính công tác và khối lượng thể tích. Dựa trên các số liệu này, nghiên cứu đã xác định phương trình hồi quy thể hiện tương quan giữa tính công tác của hỗn hợp BPK và tính công tác của bê tông nền. Đồ thị Hình 3, Hình 4 được xây dựng với khối lượng thể tích BPK ở các mức 2.000 kg/m³ (D2000), 1.800 kg/m³ (D1800), 1.600 kg/m³(D1600), 1.400 kg/m³ (D1400).
Hình 3. Ảnh hưởng của tính công tác hỗn hợp bê tông nền sử dụng cốt liệu D2
Hình 3, Hình 4 cho thấy quan hệ tuyến tính giữa tính công tác của hỗn hợp BPK và tính công tác của hỗn hợp bê tông nền. Khi tính công tác bê tông nền giảm 40 mm thì tính công tác của hỗn hợp BPK cũng giảm khoảng 40 mm. Điều này thể hiện tính công tác của hỗn hợp BPK không chỉ phụ thuộc lượng dùng cốt liệu nhẹ mà còn phụ thuộc tính chất ban đầu của bê tông nền. Các cấp phối đã sử dụng trong phần nghiên cứu này có lượng dùng nước, bao gồm lượng nước có trong phụ gia siêu dẻo, không đổi. Do đó, với cùng mức khối lượng thể tích thì có thể coi thành phần cốt liệu của BPK là như nhau, lớp đệm tạo bởi hồ chất kết dính như nhau. Tính công tác khác nhau giữa các cấp phối BPK có cùng khối lượng thể tích hoàn toàn chịu ảnh hưởng bởi độ linh động của hồ chất kết dính trong pha nền.
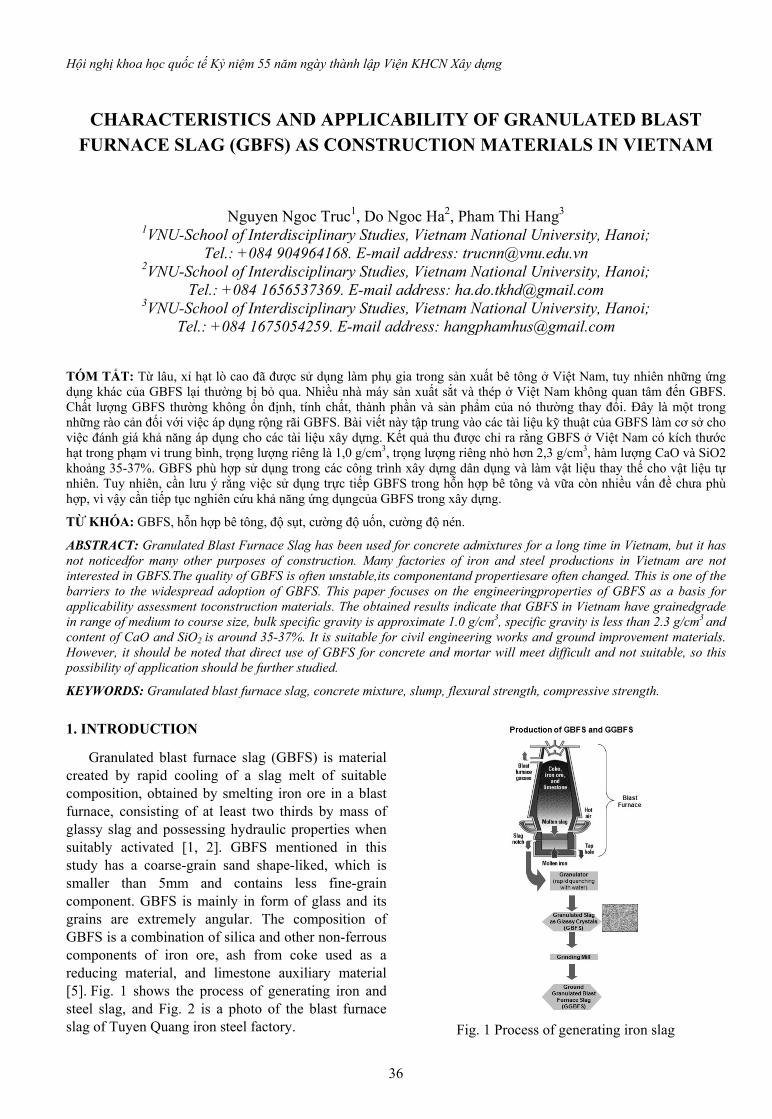
Hình 4. Ảnh hưởng của tính công tác hỗn hợp bê tông
nền sử dụng cốt liệu C1
Kết quả cũng cho thấy sự khác biệt lớn về mức độ suy giảm tính công tác của hỗn hợp BPK khi sử dụng bê tông nền có kích thước hạt lớn nhất khác nhau. Với hỗn hợp bê tông sử dụng cốt liệu C1 có kích thước hạt lớn nhất là 0,63 mm, tính công tác của hỗn hợp BPK giảm khoảng 20 mm đến 30 mm khi khối lượng thể tích BPK giảm 200 kg/m³. Trong khi đó, hỗn hợp bê tông sử dụng cốt liệu D2 có xu hướng giảm tính công tác nhanh hơn, tính công tác của hỗn hợp BPK giảm khoảng 40 mm khi khối lượng thể tích giảm 200 kg/m³.
Hội nghị khoa học quốc tế Kỷ niệm 55 năm ngày thành lập Viện KHCN Xây dựng
34
Điều này cũng đã được thể hiện ở Hình 1. Như vậy, với cùng tính công tác của hỗn hợp bê tông nền, với cùng khối lượng thể tích của BPK, khi tăng kích thước hạt cốt liệu trong bê tông nền thì tính công tác của BPK giảm và mức độ giảm tính công tác tăng. 3.2. Cường độ chịu nén
Việc bổ sung vào bê tông nền một lượng cốt liệu EPS có cường độ nhỏ làm cường độ BPK giảm tuy nhiên mức suy giảm cường độ còn phụ thuộc vào một số yếu tố. Để nghiên cứu ảnh hưởng kích thước hạt lớn nhất trong bê tông nền đến cường độ chịu nén của bê tông polystyrene, nghiên cứu đã tiến hành trên các cấp phối nền M1.25.80.21, M200.80.21 (Bảng 3).
Kết quả cho thấy, cường độ chịu nén của BPK chịu ảnh hưởng trước hết bởi tỷ lệ thể tích bê tông nền (Hình 5). Sự suy giảm cường độ không theo quy luật tuyến tính mà theo đường cong với sự thay đổi cường độ lớn khi khối lượng thể tích dưới 1.600 kg/m³. Mức độ giảm cường độ chịu nén ở cấp phối nền M200.80.21 có sử dụng cốt liệu D2 lớn gấp đôi cấp phối nền M1.25.80.21 sử dụng cốt liệu C2. Điều này chứng tỏ cường độ chịu nén của bê tông polystyrene còn phụ thuộc đường kính lớn nhất của cốt liệu bê tông nền.
Cường độ bê tông polystyrene giảm khi kích thước hạt lớn nhất trong bê tông nền tăng (Hình 5). Với cấp phối nền M200.80.21, khi pha loãng bê tông nền bằng hạt EPS, các hạt này phân bố đều trong pha vữa giữa các hạt cốt liệu lớn (Hình 6). Khi lượng polystyrene phồng nở thêm vào đủ lớn khiến cho hồ chất kết dính không đủ để bao phủ bề mặt các hạt cốt liệu gồm có cốt liệu lớn, cát, EPS, thì cấu trúc của bê tông polystyrene có chuyển biến đáng kể thể hiện ở kết cấu đá chất kết dính trở nên không liên tục. Lúc này, cường độ chịu nén của bê tông polystyrene giảm mạnh. Với các cấp phối nền M1.25.80.21, cường độ chịu nén của bê tông polystyrene vẫn duy trì tốt ở mức khối lượng thể tích thấp.Ảnh hưởng của kích thước hạt lớn nhất trong bê tông nền đến cường độ chịu nén của bê tông polystyrene tương đồng với các kết quả nghiên cứu tính công tác của hỗn hợp bê tông.
Hình 5. Quan hệ giữa cường độ chịu nén và khối lượng thể tích của bê tông
Hình 6. BPK sử dụng bê tông nền M200.80.21
Đó là do lượng hồ vữa xi măng trong bê tông nền lớn hơn trong bê tông nhẹ. Thể tích hồ trong bê tông polystyrene nhỏ hơn trong bê tông nền. Càng giảm khối lượng bê tông polystyrene thì thể tích hồ càng giảm. Do hạt polystyrene phồng nở có tính đàn hồi cao, cường độ chịu nén thấp nên cường độ của bê tông polystyrene phụ thuộc nhiều vào cường độ và cấu trúc vùng liên kết với bê tông nền. Khi giảm khối lượng thể tích, chiều dày của vùng liên kết này giảm, ảnh hưởng lớn đến khả năng chịu nén của bê tông polystyrene.
Nghiên cứu tương quan các tính chất của bê tông polystyrene và đường kính cốt liệu trong bê tông nền đã cho thấy tại mỗi mức khối lượng thể tích nhất định của bê tông polystyrene, tồn tại giới hạn kích thước hạt lớn nhất của bê tông nền sao cho cường độ chịu nén của BPK đạt giá trị lớn nhất.
4. KẾT LUẬN Các kết quả nghiên cứu trình bày ở trên cho thấy: - Với bê tông polystyrene kết cấu, được chế tạo
bằng cách bổ sung lượng hạt polystyrene vào bê tông nền, tỷ lệ thể tích bê tông nền có ảnh hưởng lớn đến tính công tác. Theo đó, tính công tác giảm khi giảm tỷ lệ thể tích bê tông nền hay giảm khối lượng thể tích bê tông polystyrene. Khi độ sụt của hỗn hợp bê tông nền giảm 40 mm thì độ sụt của hỗn hợp bê tông polystyrene tương ứng cũng giảm khoảng 40 mm;
- Mức thay đổi tính công tác của hỗn hợp bê tông polystyrene phụ thuộc kích thước hạt lớn nhất trong bê tông nền. Kích thước hạt lớn nhất của bê tông nền càng nhỏ thì mức giảm tính công tác càng thấp khi giảm tỷ lệ thể tích bê tông nền;
- Tỷ lệ thể tích bê tông nền là yếu tố chính ảnh hưởng đến cường độ chịu nén của bê tông polystyrene. Cường độ chịu nén của bê tông polystyrene kết cấu giảm khi giảm tỷ lệ thể tích bê tông nền. Mức giảm cường độ bê tông polystyrene phụ thuộc kích thước lớn nhất của cốt liệu trong bê tông nền. Với cùng cường độ bê tông nền, đường kính cốt liệu lớn nhất của bê tông nền càng nhỏ thì mức giảm cường độ chịu nén càng thấp. Trong nghiên cứu, khi tỷ lệ thể tích bê tông nền giảm từ 85% xuống 70% (khối lượng thể tích giảm 15%) thì mức độ
Hội nghị khoa học quốc tế Kỷ niệm 55 năm ngày thành lập Viện KHCN Xây dựng
35
giảm cường độ chịu nén khi sử dụng cốt liệu Dmax 20 lớn gấp đôi so với khi sử dụng cốt liệu Dmax 1,25;
- Ở cùng khối lượng thể tích, cường độ chịu nén của bê tông polystyrene giảm đáng kể khi đường kính cốt liệu bê tông nền lớn hơn 10 mm.
TÀI LIỆU THAM KHẢO [1] Cook, D.J. (1973). Expanded polystyrene beads as
lightweight aggregates for concrete, Precast Concrete 4.
[2] Saaba, B. and Ravindrarajah, R.S. (1997). Engineering properties of lightweight concrete containing crushed expanded polystyrene waste, Proc. Materials Research Society 1997 Fall Meeting, Boston.
[3] Nguyễn Tiến Đích và các ctv (2004).Nghiên cứu sử dụng vật liệu nhẹ cho nhà và công trình. Báo cáo tổng kết đề tài Mã số RDN 06 – 01, Viện Khoa học Công nghệ Xây dựng.
[4] Babu, K.G. and Babu, D.S. (2003). Behaviour of lightweight expanded polystyrene concrete containing silica fume. Cement and Concrete Research.
[5] Babu, S and Ganesh Babu, K and Wee, T.H. (2005). Properties of lightweight expanded polystyrene aggregate concretes containing fly ash. Cement and Concrete Research.
[6] Herki, B.A. and Khatib, J.M. and Negim, E.M. (2013). Lightweight Concrete Made from Waste Polystyrene and Fly Ash. World Applied Sciences Journal 21 (9).
[7] Babu, K.B. (2004). Performance of fly ash concretes containing lightweight EPS aggregates. Cement and Concrete Composites, Volume 26.
[8] Ali Sadr Momtazi, M.A. Alebar Khodaparast Haggi, Hadi Rasmi Atigh. (2010). Durability of Lightweight Concrete Containing EPS In Salty Exposure Conditions. Second Intermational Conference on Sustainable Construction Material and Technologies.
[9] Fathi, M and Yousefipour, A. and Hematpoury Farokhy, E. (2017). Mechanical and physical properties of expanded polystyrene structural concretes containing Micro-silica and Nano-silica. Vol. 136.
[10] Miled,K and Sab, K. and Le Roy, R.. (2007). Particle size effect on EPS lightweight concrete compressive strength: Experimental investigation and modelling. Mechanics of Materials.
[11] Liu, N. and Chen, B. (2014). Experimental study of the influence of EPS particle size on the mechanical properties of EPS lightweight concrete. Construction and Building Materials.
Hội nghị khoa học quốc tế Kỷ niệm 55 năm ngày thành lập Viện KHCN Xây dựng
36
CHARACTERISTICS AND APPLICABILITY OF GRANULATED BLAST FURNACE SLAG (GBFS) AS CONSTRUCTION MATERIALS IN VIETNAM
Nguyen Ngoc Truc1, Do Ngoc Ha2, Pham Thi Hang3
1VNU-School of Interdisciplinary Studies, Vietnam National University, Hanoi; Tel.: +084 904964168. E-mail address: [email protected]
2VNU-School of Interdisciplinary Studies, Vietnam National University, Hanoi; Tel.: +084 1656537369. E-mail address: [email protected]
3VNU-School of Interdisciplinary Studies, Vietnam National University, Hanoi; Tel.: +084 1675054259. E-mail address: [email protected]
TÓM TẮT: Từ lâu, xỉ hạt lò cao đã được sử dụng làm phụ gia trong sản xuất bê tông ở Việt Nam, tuy nhiên những ứng dụng khác của GBFS lại thường bị bỏ qua. Nhiều nhà máy sản xuất sắt và thép ở Việt Nam không quan tâm đến GBFS. Chất lượng GBFS thường không ổn định, tính chất, thành phần và sản phẩm của nó thường thay đổi. Đây là một trong những rào cản đối với việc áp dụng rộng rãi GBFS. Bài viết này tập trung vào các tài liệu kỹ thuật của GBFS làm cơ sở cho việc đánh giá khả năng áp dụng cho các tài liệu xây dựng. Kết quả thu được chỉ ra rằng GBFS ở Việt Nam có kích thước hạt trong phạm vi trung bình, trọng lượng riêng là 1,0 g/cm3, trọng lượng riêng nhỏ hơn 2,3 g/cm3, hàm lượng CaO và SiO2 khoảng 35-37%. GBFS phù hợp sử dụng trong các công trình xây dựng dân dụng và làm vật liệu thay thế cho vật liệu tự nhiên. Tuy nhiên, cần lưu ý rằng việc sử dụng trực tiếp GBFS trong hỗn hợp bê tông và vữa còn nhiều vấn đề chưa phù hợp, vì vậy cần tiếp tục nghiên cứu khả năng ứng dụngcủa GBFS trong xây dựng.
TỪ KHÓA: GBFS, hỗn hợp bê tông, độ sụt, cường độ uốn, cường độ nén.
ABSTRACT: Granulated Blast Furnace Slag has been used for concrete admixtures for a long time in Vietnam, but it has not noticedfor many other purposes of construction. Many factories of iron and steel productions in Vietnam are not interested in GBFS.The quality of GBFS is often unstable,its componentand propertiesare often changed. This is one of the barriers to the widespread adoption of GBFS. This paper focuses on the engineeringproperties of GBFS as a basis for applicability assessment toconstruction materials. The obtained results indicate that GBFS in Vietnam have grainedgrade in range of medium to course size, bulk specific gravity is approximate 1.0 g/cm3, specific gravity is less than 2.3 g/cm3 and content of CaO and SiO2 is around 35-37%. It is suitable for civil engineering works and ground improvement materials. However, it should be noted that direct use of GBFS for concrete and mortar will meet difficult and not suitable, so this possibility of application should be further studied.
KEYWORDS: Granulated blast furnace slag, concrete mixture, slump, flexural strength, compressive strength.
1. INTRODUCTION
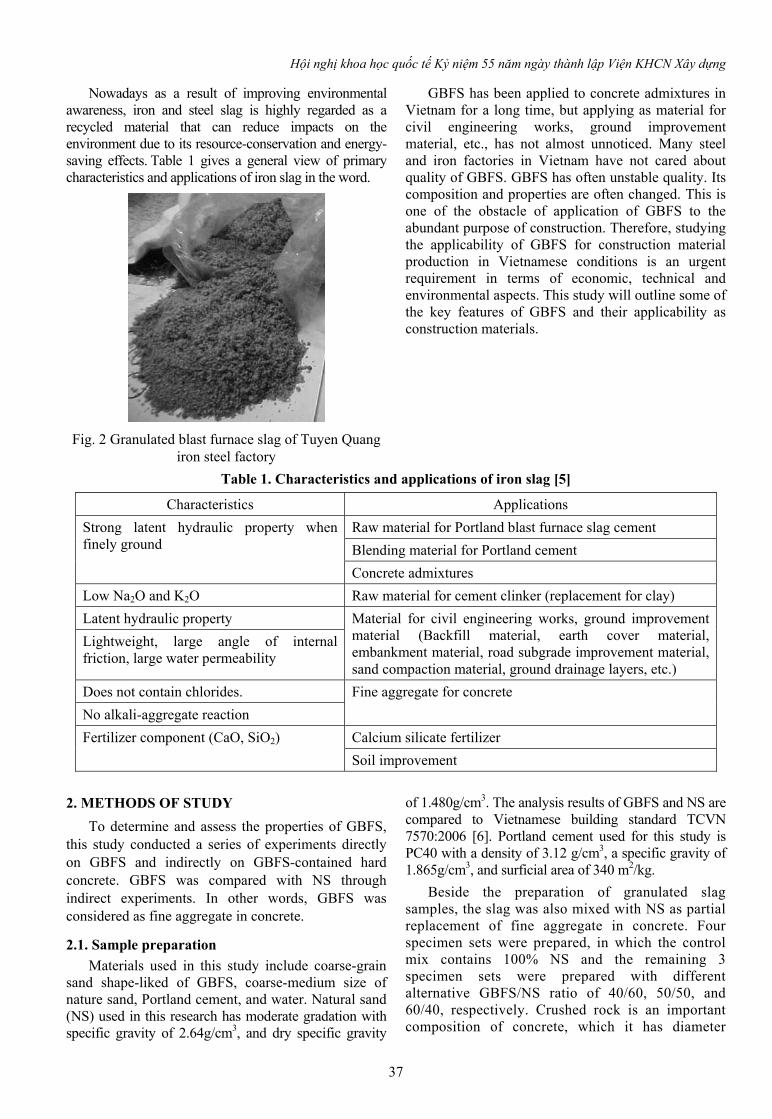
Granulated blast furnace slag (GBFS) is material created by rapid cooling of a slag melt of suitable composition, obtained by smelting iron ore in a blast furnace, consisting of at least two thirds by mass of glassy slag and possessing hydraulic properties when suitably activated [1, 2]. GBFS mentioned in this study has a coarse-grain sand shape-liked, which is smaller than 5mm and contains less fine-grain component. GBFS is mainly in form of glass and its grains are extremely angular. The composition of GBFS is a combination of silica and other non-ferrous components of iron ore, ash from coke used as a reducing material, and limestone auxiliary material [5]. Fig. 1 shows the process of generating iron and steel slag, and Fig. 2 is a photo of the blast furnace slag of Tuyen Quang iron steel factory.
Fig. 1 Process of generating iron slag
Hội nghị khoa học quốc tế Kỷ niệm 55 năm ngày thành lập Viện KHCN Xây dựng
37
Nowadays as a result of improving environmental awareness, iron and steel slag is highly regarded as a recycled material that can reduce impacts on the environment due to its resource-conservation and energy-saving effects. Table 1 gives a general view of primary characteristics and applications of iron slag in the word.
Fig. 2 Granulated blast furnace slag of Tuyen Quang iron steel factory
GBFS has been applied to concrete admixtures in Vietnam for a long time, but applying as material for civil engineering works, ground improvement material, etc., has not almost unnoticed. Many steel and iron factories in Vietnam have not cared about quality of GBFS. GBFS has often unstable quality. Its composition and properties are often changed. This is one of the obstacle of application of GBFS to the abundant purpose of construction. Therefore, studying the applicability of GBFS for construction material production in Vietnamese conditions is an urgent requirement in terms of economic, technical and environmental aspects. This study will outline some of the key features of GBFS and their applicability as construction materials.
Table 1. Characteristics and applications of iron slag [5]
Characteristics Applications
Raw material for Portland blast furnace slag cement
Blending material for Portland cement
Strong latent hydraulic property when finely ground
Concrete admixtures
Low Na2O and K2O Raw material for cement clinker (replacement for clay)
Latent hydraulic property
Lightweight, large angle of internal friction, large water permeability
Material for civil engineering works, ground improvement material (Backfill material, earth cover material, embankment material, road subgrade improvement material, sand compaction material, ground drainage layers, etc.)
Does not contain chlorides.
No alkali-aggregate reaction
Fine aggregate for concrete
Calcium silicate fertilizer Fertilizer component (CaO, SiO2)
Soil improvement
2. METHODS OF STUDY
To determine and assess the properties of GBFS, this study conducted a series of experiments directly on GBFS and indirectly on GBFS-contained hard concrete. GBFS was compared with NS through indirect experiments. In other words, GBFS was considered as fine aggregate in concrete.
2.1. Sample preparation
Materials used in this study include coarse-grain sand shape-liked of GBFS, coarse-medium size of nature sand, Portland cement, and water. Natural sand (NS) used in this research has moderate gradation with specific gravity of 2.64g/cm3, and dry specific gravity
of 1.480g/cm3. The analysis results of GBFS and NS are compared to Vietnamese building standard TCVN 7570:2006 [6]. Portland cement used for this study is PC40 with a density of 3.12 g/cm3, a specific gravity of 1.865g/cm3, and surficial area of 340 m2/kg.
Beside the preparation of granulated slag samples, the slag was also mixed with NS as partial replacement of fine aggregate in concrete. Four specimen sets were prepared, in which the control mix contains 100% NS and the remaining 3 specimen sets were prepared with different alternative GBFS/NS ratio of 40/60, 50/50, and 60/40, respectively. Crushed rock is an important composition of concrete, which it has diameter
Hội nghị khoa học quốc tế Kỷ niệm 55 năm ngày thành lập Viện KHCN Xây dựng
38
of 20mm in maximum. The ratio of water/cement (w/c ratio) was equal to 0.56 and 0.66 in order to keep the initial slump of the mixture around 9.0 and the slump after 30 minutes around 6.0-6.5 among the GBFS/NS ratios. The amount of each material need for 1.0 m3 concrete is given in Table 2. Those materials were mixed together in order to carry out the experiments and to spicemert cubic with the dimension of 150x150x150mm for compressive test and 150x150x300mm for flexural test.
Table2. Component of 1.0 m3of concrete mixture [4]
Fine aggregate (kg) Sample set
Cement PC40 (kg)
Crushed rock (kg) Total NS GBFS
Water (l)
M0 35.2 110.4 72.2 72.2 0 19.8
M1 35.2 110.4 72.2 43.3 28.9 21.6
M2 35.2 110.4 72.2 36.1 36.1 22.6
M3 35.2 110.4 72.2 28.9 43.3 23.1
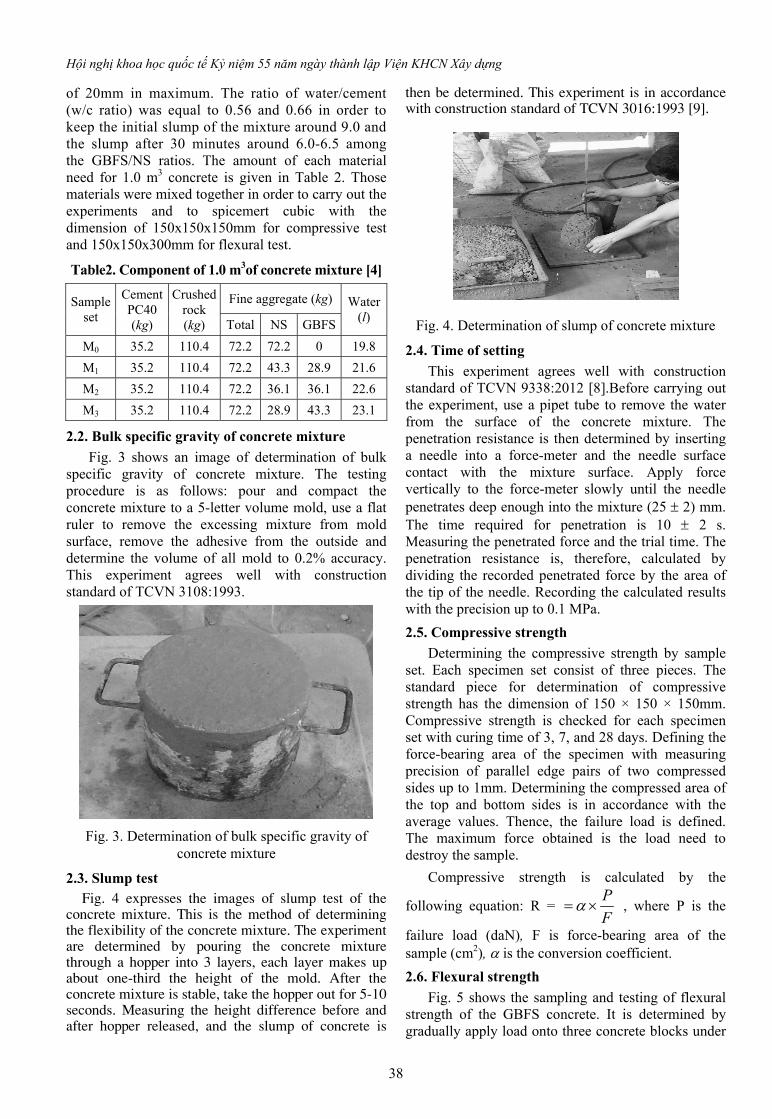
2.2. Bulk specific gravity of concrete mixture
Fig. 3 shows an image of determination of bulk specific gravity of concrete mixture. The testing procedure is as follows: pour and compact the concrete mixture to a 5-letter volume mold, use a flat ruler to remove the excessing mixture from mold surface, remove the adhesive from the outside and determine the volume of all mold to 0.2% accuracy. This experiment agrees well with construction standard of TCVN 3108:1993.
Fig. 3. Determination of bulk specific gravity of concrete mixture
2.3. Slump test Fig. 4 expresses the images of slump test of the
concrete mixture. This is the method of determining the flexibility of the concrete mixture. The experiment are determined by pouring the concrete mixture through a hopper into 3 layers, each layer makes up about one-third the height of the mold. After the concrete mixture is stable, take the hopper out for 5-10 seconds. Measuring the height difference before and after hopper released, and the slump of concrete is
then be determined. This experiment is in accordance with construction standard of TCVN 3016:1993 [9].
Fig. 4. Determination of slump of concrete mixture
2.4. Time of setting
This experiment agrees well with construction standard of TCVN 9338:2012 [8].Before carrying out the experiment, use a pipet tube to remove the water from the surface of the concrete mixture. The penetration resistance is then determined by inserting a needle into a force-meter and the needle surface contact with the mixture surface. Apply force vertically to the force-meter slowly until the needle penetrates deep enough into the mixture (25 2) mm. The time required for penetration is 10 2 s. Measuring the penetrated force and the trial time. The penetration resistance is, therefore, calculated by dividing the recorded penetrated force by the area of the tip of the needle. Recording the calculated results with the precision up to 0.1 MPa.
2.5. Compressive strength
Determining the compressive strength by sample set. Each specimen set consist of three pieces. The standard piece for determination of compressive strength has the dimension of 150 × 150 × 150mm. Compressive strength is checked for each specimen set with curing time of 3, 7, and 28 days. Defining the force-bearing area of the specimen with measuring precision of parallel edge pairs of two compressed sides up to 1mm. Determining the compressed area of the top and bottom sides is in accordance with the average values. Thence, the failure load is defined. The maximum force obtained is the load need to destroy the sample.
Compressive strength is calculated by the
following equation: R = P
F , where P is the
failure load (daN), F is force-bearing area of the sample (cm2), is the conversion coefficient.
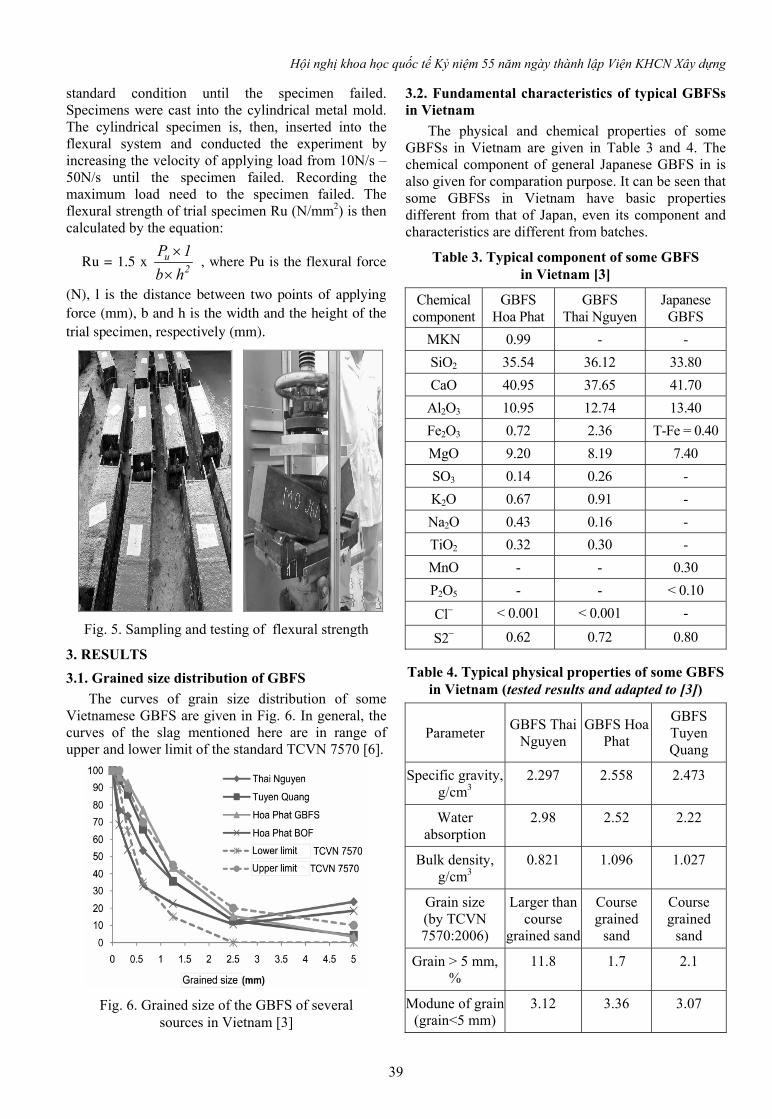
2.6. Flexural strength
Fig. 5 shows the sampling and testing of flexural strength of the GBFS concrete. It is determined by gradually apply load onto three concrete blocks under
Hội nghị khoa học quốc tế Kỷ niệm 55 năm ngày thành lập Viện KHCN Xây dựng
39
standard condition until the specimen failed. Specimens were cast into the cylindrical metal mold. The cylindrical specimen is, then, inserted into the flexural system and conducted the experiment by increasing the velocity of applying load from 10N/s – 50N/s until the specimen failed. Recording the maximum load need to the specimen failed. The flexural strength of trial specimen Ru (N/mm2) is then calculated by the equation:
Ru = 1.5 x u2
P 1
b h
, where Pu is the flexural force
(N), l is the distance between two points of applying
force (mm), b and h is the width and the height of the
trial specimen, respectively (mm).
Fig. 5. Sampling and testing of flexural strength
3. RESULTS
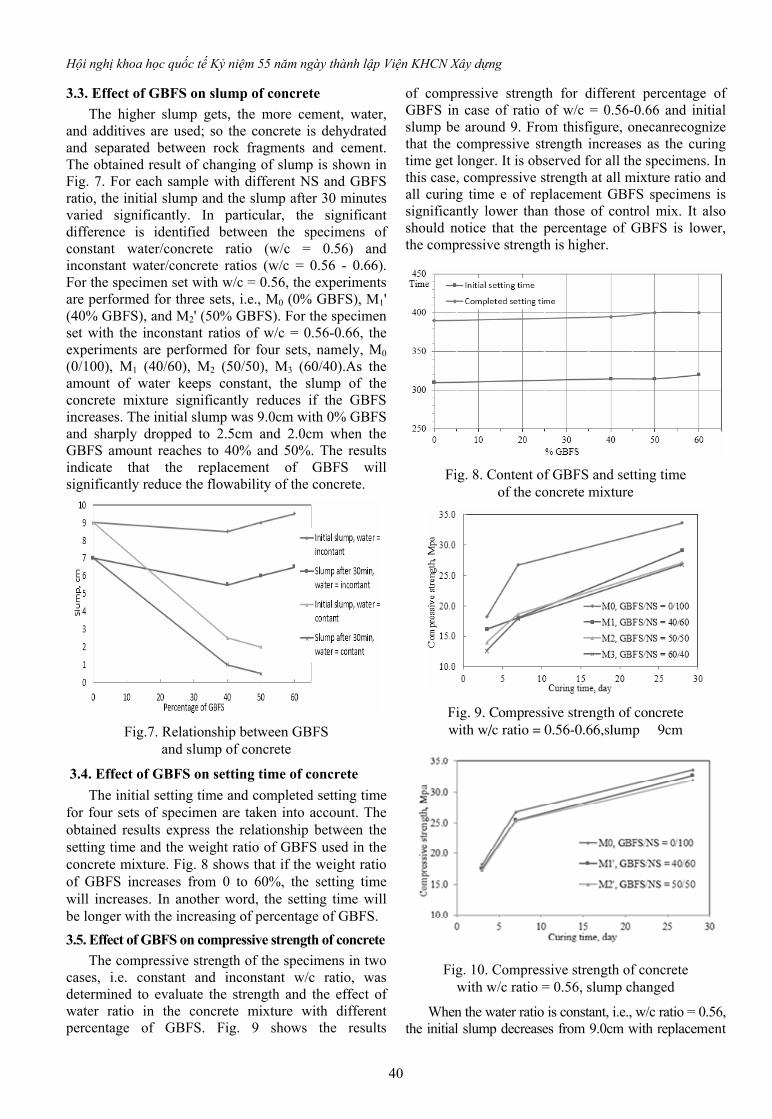
3.1. Grained size distribution of GBFS
The curves of grain size distribution of some Vietnamese GBFS are given in Fig. 6. In general, the curves of the slag mentioned here are in range of upper and lower limit of the standard TCVN 7570 [6].
Fig. 6. Grained size of the GBFS of several sources in Vietnam [3]
3.2. Fundamental characteristics of typical GBFSs in Vietnam
The physical and chemical properties of some GBFSs in Vietnam are given in Table 3 and 4. The chemical component of general Japanese GBFS in is also given for comparation purpose. It can be seen that some GBFSs in Vietnam have basic properties different from that of Japan, even its component and characteristics are different from batches.
Table 3. Typical component of some GBFS in Vietnam [3]
Chemical component
GBFS Hoa Phat
GBFS Thai Nguyen
Japanese GBFS
MKN 0.99 - -
SiO2 35.54 36.12 33.80
CaO 40.95 37.65 41.70
Al2O3 10.95 12.74 13.40
Fe2O3 0.72 2.36 T-Fe = 0.40
MgO 9.20 8.19 7.40
SO3 0.14 0.26 -
K2O 0.67 0.91 -
Na2O 0.43 0.16 -
TiO2 0.32 0.30 -
MnO - - 0.30
P2O5 - - < 0.10
Cl < 0.001 < 0.001 -
S2 0.62 0.72 0.80
Table 4. Typical physical properties of some GBFS in Vietnam (tested results and adapted to [3])
Parameter GBFS Thai
Nguyen GBFS Hoa
Phat
GBFS Tuyen Quang
Specific gravity, g/cm3
2.297 2.558 2.473
Water absorption
2.98 2.52 2.22
Bulk density, g/cm3
0.821 1.096 1.027
Grain size (by TCVN 7570:2006)
Larger than course
grained sand
Course grained
sand
Course grained
sand
Grain > 5 mm, %
11.8 1.7 2.1
Modune of grain (grain<5 mm)
3.12 3.36 3.07
Hội nghị khoa học quốc tế Kỷ niệm 55 năm ngày thành lập Viện KHCN Xây dựng
40
3.3. Effect of GBFS on slump of concrete
The higher slump gets, the more cement, water, and additives are used; so the concrete is dehydrated and separated between rock fragments and cement. The obtained result of changing of slump is shown in Fig. 7. For each sample with different NS and GBFS ratio, the initial slump and the slump after 30 minutes varied significantly. In particular, the significant difference is identified between the specimens of constant water/concrete ratio (w/c = 0.56) and inconstant water/concrete ratios (w/c = 0.56 - 0.66). For the specimen set with w/c = 0.56, the experiments are performed for three sets, i.e., M0 (0% GBFS), M1' (40% GBFS), and M2' (50% GBFS). For the specimen set with the inconstant ratios of w/c = 0.56-0.66, the experiments are performed for four sets, namely, M0 (0/100), M1 (40/60), M2 (50/50), M3 (60/40).As the amount of water keeps constant, the slump of the concrete mixture significantly reduces if the GBFS increases. The initial slump was 9.0cm with 0% GBFS and sharply dropped to 2.5cm and 2.0cm when the GBFS amount reaches to 40% and 50%. The results indicate that the replacement of GBFS will significantly reduce the flowability of the concrete.
Fig.7. Relationship between GBFS and slump of concrete
3.4. Effect of GBFS on setting time of concrete
The initial setting time and completed setting time for four sets of specimen are taken into account. The obtained results express the relationship between the setting time and the weight ratio of GBFS used in the concrete mixture. Fig. 8 shows that if the weight ratio of GBFS increases from 0 to 60%, the setting time will increases. In another word, the setting time will be longer with the increasing of percentage of GBFS.
3.5. Effect of GBFS on compressive strength of concrete
The compressive strength of the specimens in two cases, i.e. constant and inconstant w/c ratio, was determined to evaluate the strength and the effect of water ratio in the concrete mixture with different percentage of GBFS. Fig. 9 shows the results
of compressive strength for different percentage of GBFS in case of ratio of w/c = 0.56-0.66 and initial slump be around 9. From thisfigure, onecanrecognize that the compressive strength increases as the curing time get longer. It is observed for all the specimens. In this case, compressive strength at all mixture ratio and all curing time e of replacement GBFS specimens is significantly lower than those of control mix. It also should notice that the percentage of GBFS is lower, the compressive strength is higher.
Fig. 8. Content of GBFS and setting time of the concrete mixture
Fig. 9. Compressive strength of concrete
with w/c ratio = 0.56-0.66,slump � 9cm
Fig. 10. Compressive strength of concrete with w/c ratio = 0.56, slump changed
When the water ratio is constant, i.e., w/c ratio = 0.56, the initial slump decreases from 9.0cm with replacement
Hội nghị khoa học quốc tế Kỷ niệm 55 năm ngày thành lập Viện KHCN Xây dựng
41
GBFS = 0% to 2.0cm with replacement GBFS = 50% (Fig. 10). In this case, values of compressive strength of the specimen M1’, M2’ isapproximate that of control mix of M0. The compressive strength values increase gradually overcuring times of 3, 7, and 28 daysfor all specimens with differentreplacement GBFS. The compression strength isinverse ratio to percentage of GBFS.
3.6. Effect of GBFS on flexural strength of concrete
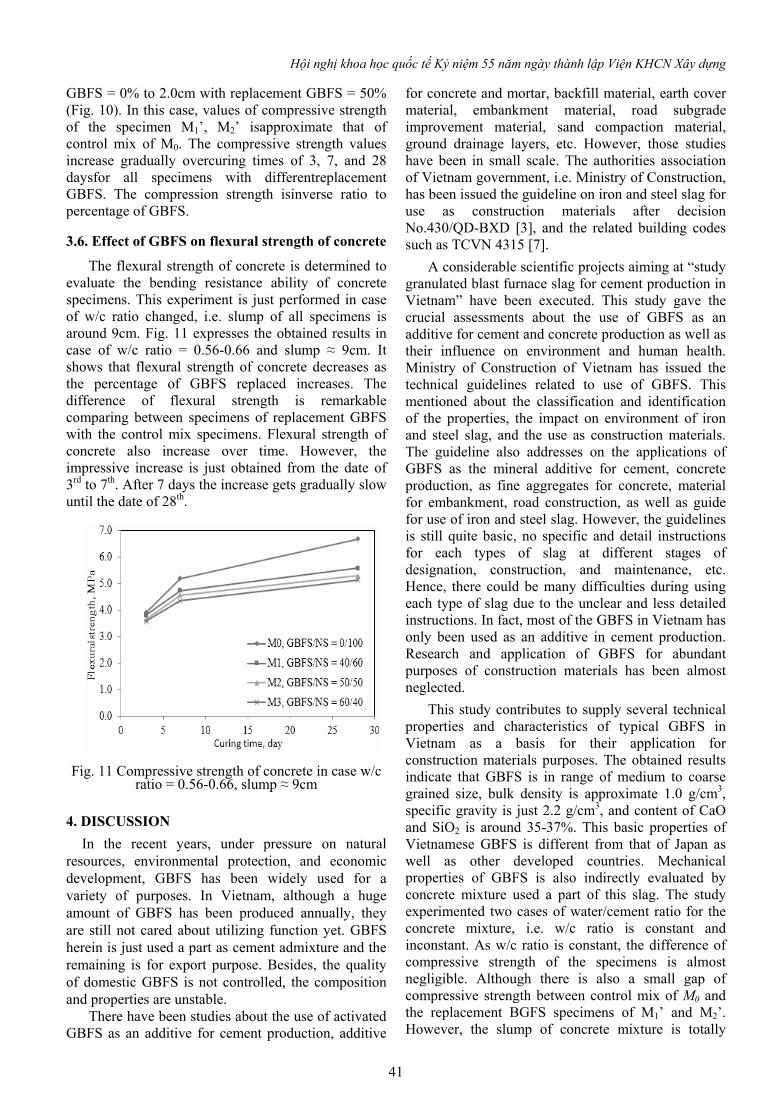
The flexural strength of concrete is determined to evaluate the bending resistance ability of concrete specimens. This experiment is just performed in case of w/c ratio changed, i.e. slump of all specimens is around 9cm. Fig. 11 expresses the obtained results in case of w/c ratio = 0.56-0.66 and slump ≈ 9cm. It shows that flexural strength of concrete decreases as the percentage of GBFS replaced increases. The difference of flexural strength is remarkable comparing between specimens of replacement GBFS with the control mix specimens. Flexural strength of concrete also increase over time. However, the impressive increase is just obtained from the date of 3rd to 7th. After 7 days the increase gets gradually slow until the date of 28th.
Fig. 11 Compressive strength of concrete in case w/c ratio = 0.56-0.66, slump ≈ 9cm
4. DISCUSSION
In the recent years, under pressure on natural resources, environmental protection, and economic development, GBFS has been widely used for a variety of purposes. In Vietnam, although a huge amount of GBFS has been produced annually, they are still not cared about utilizing function yet. GBFS herein is just used a part as cement admixture and the remaining is for export purpose. Besides, the quality of domestic GBFS is not controlled, the composition and properties are unstable.
There have been studies about the use of activated GBFS as an additive for cement production, additive
for concrete and mortar, backfill material, earth cover material, embankment material, road subgrade improvement material, sand compaction material, ground drainage layers, etc. However, those studies have been in small scale. The authorities association of Vietnam government, i.e. Ministry of Construction, has been issued the guideline on iron and steel slag for use as construction materials after decision No.430/QD-BXD [3], and the related building codes such as TCVN 4315 [7].
A considerable scientific projects aiming at “study granulated blast furnace slag for cement production in Vietnam” have been executed. This study gave the crucial assessments about the use of GBFS as an additive for cement and concrete production as well as their influence on environment and human health. Ministry of Construction of Vietnam has issued the technical guidelines related to use of GBFS. This mentioned about the classification and identification of the properties, the impact on environment of iron and steel slag, and the use as construction materials. The guideline also addresses on the applications of GBFS as the mineral additive for cement, concrete production, as fine aggregates for concrete, material for embankment, road construction, as well as guide for use of iron and steel slag. However, the guidelines is still quite basic, no specific and detail instructions for each types of slag at different stages of designation, construction, and maintenance, etc. Hence, there could be many difficulties during using each type of slag due to the unclear and less detailed instructions. In fact, most of the GBFS in Vietnam has only been used as an additive in cement production. Research and application of GBFS for abundant purposes of construction materials has been almost neglected.
This study contributes to supply several technical properties and characteristics of typical GBFS in Vietnam as a basis for their application for construction materials purposes. The obtained results indicate that GBFS is in range of medium to coarse grained size, bulk density is approximate 1.0 g/cm3, specific gravity is just 2.2 g/cm3, and content of CaO and SiO2 is around 35-37%. This basic properties of Vietnamese GBFS is different from that of Japan as well as other developed countries. Mechanical properties of GBFS is also indirectly evaluated by concrete mixture used a part of this slag. The study experimented two cases of water/cement ratio for the concrete mixture, i.e. w/c ratio is constant and inconstant. As w/c ratio is constant, the difference of compressive strength of the specimens is almost negligible. Although there is also a small gap of compressive strength between control mix of M0 and the replacement BGFS specimens of M1’ and M2’. However, the slump of concrete mixture is totally
Hội nghị khoa học quốc tế Kỷ niệm 55 năm ngày thành lập Viện KHCN Xây dựng
42
different. The initial slump of M1’ and M2’ gets 2.5cm and 2.0cm. Concrete mixture with such slump will cause difficulties for the actual construction. For w/c ratio is inconstant, which slump is kept at 9.0cm the difference of compressive and flexural strength between control mix of M0 and the rest ones is significant. Compressive and flexural strength of the specimens decrease as the amount of GBFS increase in the concrete mixture.
5. CONCLUSIONS
The quality of GBFS in Vietnam is normally not controlled, its composition and properties are unstable. This may lead to difficulties in applicability of GBFS as construction material purposes. This paper focuses on the technical properties of some GBFSs for construction material purposes. The findings are given below:
- GBFS in Vietnam is commonly in range of medium to coarsed grained size, content of CaO and SiO2 is around 35-37%. This basic properties of Viernamese GBFS is different from that of Japan, where the slag is almost controlled in high and stable quality.
- The mechanical properties of GBFS is indirectly evaluated. In case of the w/c ratio = 0.56, slump of the concrete mixture decreases as the GBFS increases. The compressive strength of the partial GBFS specimens reaches value of the control mix. In case of the w/c ratio = 0.56-0.66, slump is kept almost constant. The compressive strength values at all mixed ratio and all curing time of replacement GBFS specimens is lower than those of control mix. The amount of GBFS is lower, the compressive strength is higher. Flexural strength of the specimens decreases as the amount of GBFS increases. Flexural strength values of the partial GBFS specimens are lower than those of control mix.
- GBFS in Vietnam are suitable for making civil engineering works and ground improvement
materials. However, it should take much more studies to make it clearer.
ACKNOWLEDGEMENTS
The paper is completed with the support of the project “Applicable ability the Granulated Blast Furnace Slag as fine aggregate in concrete for sustainable resource development”, VNU-School of Interdisciplinary Studies, Vietnam National University, Hanoi.
REFERENCES
[1] European Standard EN 15167-1:2006. Ground granulatedblast furnace slag foruse in concrete, mortarand grout - Part 1: Definitions, specifications andconformity criteria.
[2] European Standard EN 15167-2:2006. Ground granulated blast furnace slag for use in concrete, mortarand grout - Part 2: Conformity evaluation.
[3] Ministry of Construction, 2017. Decision No.430/QD-BXD:Guideline on iron and steel slag for use as construction materials.
[4] Nguyen Ngoc Truc & Nguyen Van Vu, 2018. Partial replacement of natural sand by granulated blast furnace slag (GBFS) in fine aggregate for concrete: practical application in Vietnam. 18th International Multidisciplinary Scientific GeoConference SGEM2018.
[5] Nippon Slag Association and Coastal Development Institute of Technology, 2000.Guidebookfor the Use of Iron and Steel Slag in Port and Harbor Construction.
[6] TCVN 7570: 2006. Aggregates for concrete and mortar – Specifications.
[7] TCVN 4315: 2007. Granulated blast furnace slag for cement production.
[8] TCVN 9338:2012. Heavyweight concrete mixtures - Determination of time of setting.
[9] TCVN 3016: 1993. Heavyweight concrete compounds - Slump test.
Hội nghị khoa học quốc tế Kỷ niệm 55 năm ngày thành lập Viện KHCN Xây dựng
43
CƯỜNG ĐỘ CHỊU NÉN Ở NHIỆT ĐỘ CAO CỦA BÊ TÔNG CƯỜNG ĐỘ CAO, CỐT LIỆU CÁT NGHIỀN
ThS. Hoàng Anh Giang Viện Chuyên ngành Kết cấu Công trình xây dựng - Viện KHCN Xây dựng,
Email: [email protected]
TÓM TẮT: Bài viết trình bày các kết quả nghiên cứu thực nghiệm tại Viện KHCN Xây dựng để xác định cường độ chịu nén của bê tông cường độ cao chế tạo từ cốt liệu cát nghiền khi chịu nung nóng ở các mức nhiệt độ từ 100 oC đến 800 oC. Kết quả nghiên cứu này được so sánh với một số kết quả nghiên cứu tương tự đã được thực hiện ở nước ngoài để xem xét tính tương đồng cũng như khẳng định thêm về cơ sở thực tiễn của nghiên cứu tại Việt Nam.
TỪ KHÓA: Nhiệt độ cao, Bê tông cường độ cao, Cát nghiền, Cường độ chịu nén.
ABSTRACT: This paper describes the results of experimental research implemented in Vietnam Institute for Building Science and Technology (IBST) determining compressive strength of concrete manufactured by using crushed sand being heated by elevated temperature of 100 oC to 800 oC. The result is evaluated against similar researchs from overseas for compartibility and qualification of the technical base of the research in Vietnam.
KEYWORDS: Elevated temperature, High strength concrete, Crushed sand, Compressive strength.
1. MỞ ĐẦU Kết cấu bê tông cốt thép thường được coi là có
nhiều lợi thế khi làm việc trong điều kiện chịu tác động của lửa [1]. Điều này có được là nhờ vào một số đặc điểm tự nhiên (tính không cháy, tính dẫn nhiệt thấp, …) giúp bê tông không những bảo vệ được cho cốt thép chịu lực mà còn duy trì được vai trò tham gia chịu lực trong tiết diện theo tính toán thiết kế. Khi tính toán thiết kế các kết cấu, cấu kiện bê tông cốt thép nói chung chịu tác động của lửa đòi hỏi phải xem xét các đặc trưng cơ học và vật lý của bê tông theo nguyên tắc có biến đổi, cụ thể là các đặc trưng vật liệu thay đổi theo mức nhiệt độ tác động. Trên thế giới đã có nhiều nghiên cứu về ảnh hưởng của nhiệt độ cao đến các đặc trưng cơ, lý, nhiệt của bê tông nói chung, được tổng hợp và trình bày trong một số tài liệu như [2, 3, 4, 5, 6]. Các nghiên cứu đã chỉ ra nhiều yếu tố ảnh hưởng đến đặc trưng vật liệu của bê tông khi chịu tác động của nhiệt độ cao, như loại cốt liệu, khối lượng thể tích, độ ẩm, cấp cường độ, loại xi măng, sự tham gia của các chất trộn thêm hoặc phụ gia… trong đó loại cốt liệu đóng vai trò rất quan trọng. Điều này cho thấy các đặc điểm cụ thể của mỗi quốc gia hoặc hẹp hơn là vùng cung cấp vật liệu để chế tạo bê tông cũng có thể cần được xem xét riêng để đảm bảo khả năng áp dụng của các mô hình phân tích lý thuyết vào thực tế được phù hợp hơn.
Việt Nam hiện nay đang áp dụng một số tiêu chuẩn nước ngoài để thiết kế kết cấu bê tông chịu tác động của lửa, ví dụ như [7, 8, 9, 10]. Theo các tiêu chuẩn này, cách thiết kế đơn giản nhất là lựa chọn chiều dày lớp bê tông bảo vệ theo các bảng tra
hoặc biểu đồ cho trước căn cứ vào đặc điểm của loại bê tông, cấu tạo tiết diện và thời gian chịu lửa yêu cầu. Bên cạnh đó còn có các phương pháp tính toán nâng cao đòi hỏi phải xem xét đến những vấn đề phức tạp hơn, ví dụ điều kiện liên kết, các đặc trưng vật liệu, sự phân bố của nhiệt độ trên tiết diện,… Một yêu cầu cơ bản để áp dụng được các phương pháp thiết kế nâng cao là phải có các số liệu về đặc trưng vật liệu thay đổi theo nhiệt độ. Căn cứ vào các nghiên cứu đã có, tài liệu [7] đề xuất các số liệu áp dụng chung cho thiết kế song vẫn khuyến cáo có những đánh giá riêng theo điều kiện áp dụng cụ thể ở mỗi quốc gia hoặc mỗi loại vật liệu.
Qua tìm hiểu tại một số cơ sở trong nước có sản xuất cấu kiện bê tông cốt thép đúc sẵn, hiện nay việc sử dụng các dạng cốt liệu mịn thay thế cát tự nhiên, ví dụ thứ phẩm khi nghiền đá dăm (cát nghiền) hoặc tro xỉ nhiệt điện, để làm bê tông đang dần phổ biến. Thành phần khoáng hóa của các vật liệu đó có thể không giống như của cát tự nhiên có nguồn gốc từ đá trầm tích với thành phần chủ yếu là Dioxit Silic (SiO2) [11]. Khi được sử dụng để chế tạo bê tông dùng trong các cấu kiện xây dựng và chịu tác động của điều kiện nhiệt độ bình thường (không cao hơn 50oC) [12], những khác biệt này có thể không ảnh hưởng nhiều đến tính năng chiu lực của kết cấu, song dưới tác động của điều kiện nhiệt độ cao như khi chịu tác động của lửa thì điều đó có những ảnh hưởng nhất định [3].
Tổng hợp các kết quả nghiên cứu đã có ở ngoài nước [13] chưa thấy rõ được ảnh hưởng của nhiệt độ cao đến các đặc trưng cơ học của bê tông sử dụng cốt liệu mịn là cát nghiền. Ở Việt Nam, hiện chưa thấy có
Hội nghị khoa học quốc tế Kỷ niệm 55 năm ngày thành lập Viện KHCN Xây dựng
44
công bố nào về kết quả nghiên cứu những ảnh hưởng của nhiệt độ cao đến đặc trưng cường độ của bê tông nói chung. Việc triển khai nghiên cứu về ảnh hưởng của nhiệt độ cao đến cường độ của bê tông cốt liệu cát nghiền ở Việt Nam bên cạnh mục tiêu chính còn nhằm xây dựng và khẳng định các cơ sở về phương pháp luận cũng như thiết bị phục vụ cho nghiên cứu thực nghiệm trong nước đối với bê tông nói chung trong điều kiện nhiệt độ cao.
2. NGHIÊN CỨU THỰC NGHIỆM
2.1. Quy trình và thiết bị thử nghiệm
Liên quan đến nghiên cứu thực nghiệm xem xét ảnh hưởng của nhiệt độ cao đối với bê tông cường độ cao, có 2 công trình đáng quan tâm là: (1) H. L. Malhotra [14]; và (2) Phan T. Long và Nicholas J. Carino [15].
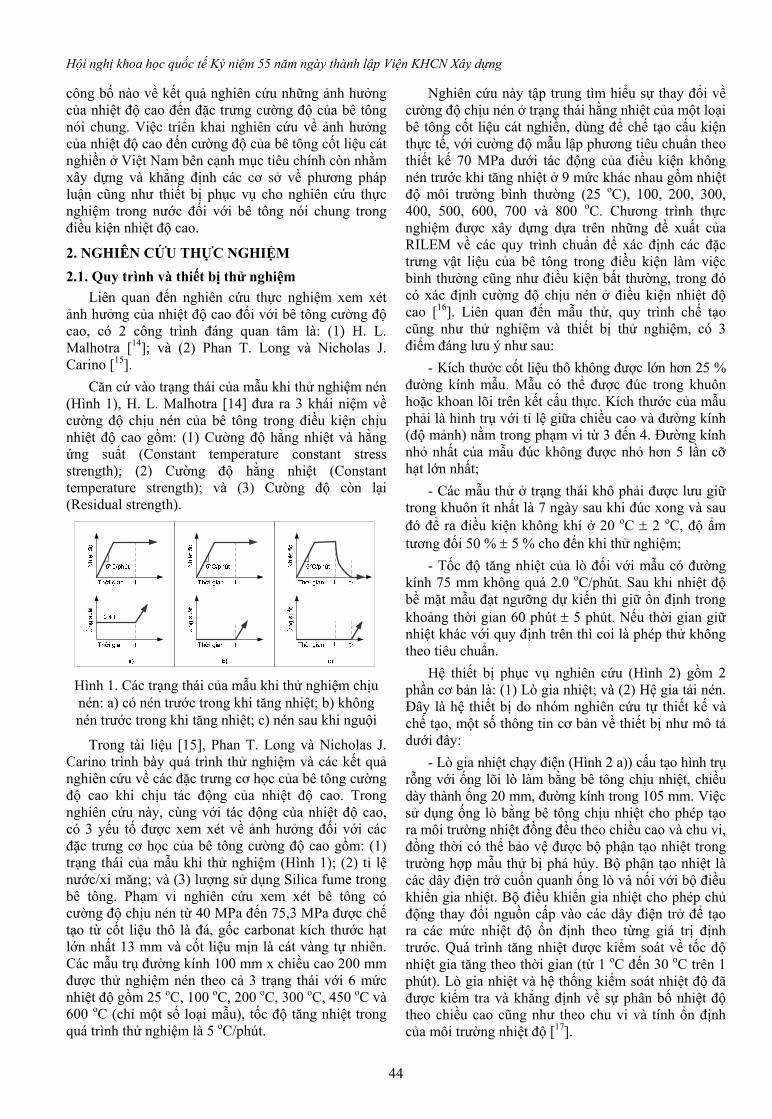
Căn cứ vào trạng thái của mẫu khi thử nghiệm nén (Hình 1), H. L. Malhotra [14] đưa ra 3 khái niệm về cường độ chịu nén của bê tông trong điều kiện chịu nhiệt độ cao gồm: (1) Cường độ hằng nhiệt và hằng ứng suất (Constant temperature constant stress strength); (2) Cường độ hằng nhiệt (Constant temperature strength); và (3) Cường độ còn lại (Residual strength).
Hình 1. Các trạng thái của mẫu khi thử nghiệm chịu nén: a) có nén trước trong khi tăng nhiệt; b) không nén trước trong khi tăng nhiệt; c) nén sau khi nguội
Trong tài liệu [15], Phan T. Long và Nicholas J. Carino trình bày quá trình thử nghiệm và các kết quả nghiên cứu về các đặc trưng cơ học của bê tông cường độ cao khi chịu tác động của nhiệt độ cao. Trong nghiên cứu này, cùng với tác động của nhiệt độ cao, có 3 yếu tố được xem xét về ảnh hưởng đối với các đặc trưng cơ học của bê tông cường độ cao gồm: (1) trạng thái của mẫu khi thử nghiệm (Hình 1); (2) tỉ lệ nước/xi măng; và (3) lượng sử dụng Silica fume trong bê tông. Phạm vi nghiên cứu xem xét bê tông có cường độ chịu nén từ 40 MPa đến 75,3 MPa được chế tạo từ cốt liệu thô là đá, gốc carbonat kích thước hạt lớn nhất 13 mm và cốt liệu mịn là cát vàng tự nhiên. Các mẫu trụ đường kính 100 mm x chiều cao 200 mm được thử nghiệm nén theo cả 3 trạng thái với 6 mức nhiệt độ gồm 25 oC, 100 oC, 200 oC, 300 oC, 450 oC và 600 oC (chỉ một số loại mẫu), tốc độ tăng nhiệt trong quá trình thử nghiệm là 5 oC/phút.
Nghiên cứu này tập trung tìm hiểu sự thay đổi về cường độ chịu nén ở trạng thái hằng nhiệt của một loại bê tông cốt liệu cát nghiền, dùng để chế tạo cấu kiện thực tế, với cường độ mẫu lập phương tiêu chuẩn theo thiết kế 70 MPa dưới tác động của điều kiện không nén trước khi tăng nhiệt ở 9 mức khác nhau gồm nhiệt độ môi trường bình thường (25 oC), 100, 200, 300, 400, 500, 600, 700 và 800 oC. Chương trình thực nghiệm được xây dựng dựa trên những đề xuất của RILEM về các quy trình chuẩn để xác định các đặc trưng vật liệu của bê tông trong điều kiện làm việc bình thường cũng như điều kiện bất thường, trong đó có xác định cường độ chịu nén ở điều kiện nhiệt độ cao [16]. Liên quan đến mẫu thử, quy trình chế tạo cũng như thử nghiệm và thiết bị thử nghiệm, có 3 điểm đáng lưu ý như sau:
- Kích thước cốt liệu thô không được lớn hơn 25 % đường kính mẫu. Mẫu có thể được đúc trong khuôn hoặc khoan lõi trên kết cấu thực. Kích thước của mẫu phải là hình trụ với tỉ lệ giữa chiều cao và đường kính (độ mảnh) nằm trong phạm vi từ 3 đến 4. Đường kính nhỏ nhất của mẫu đúc không được nhỏ hơn 5 lần cỡ hạt lớn nhất;
- Các mẫu thử ở trạng thái khô phải được lưu giữ trong khuôn ít nhất là 7 ngày sau khi đúc xong và sau đó để ra điều kiện không khí ở 20 oC 2 oC, độ ẩm tương đối 50 % 5 % cho đến khi thử nghiệm;
- Tốc độ tăng nhiệt của lò đối với mẫu có đường kính 75 mm không quá 2.0 oC/phút. Sau khi nhiệt độ bề mặt mẫu đạt ngưỡng dự kiến thì giữ ổn định trong khoảng thời gian 60 phút 5 phút. Nếu thời gian giữ nhiệt khác với quy định trên thì coi là phép thử không theo tiêu chuẩn.
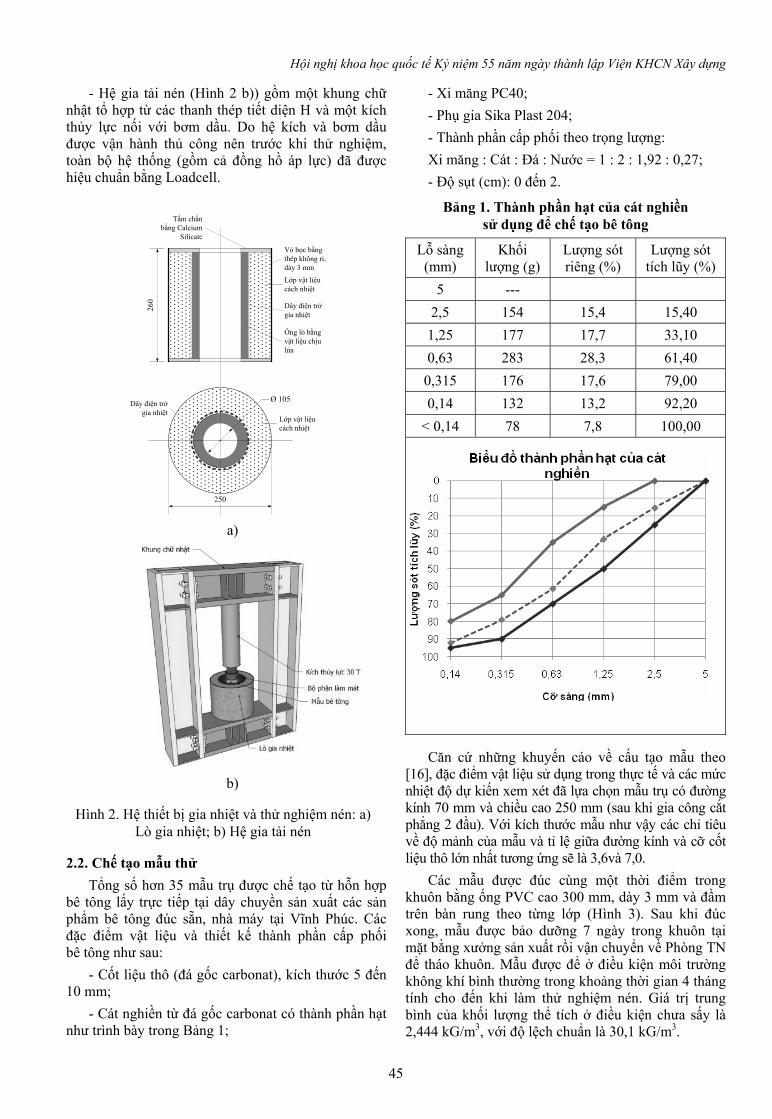
Hệ thiết bị phục vụ nghiên cứu (Hình 2) gồm 2 phần cơ bản là: (1) Lò gia nhiệt; và (2) Hệ gia tải nén. Đây là hệ thiết bị do nhóm nghiên cứu tự thiết kế và chế tạo, một số thông tin cơ bản về thiết bị như mô tả dưới đây:
- Lò gia nhiệt chạy điện (Hình 2 a)) cấu tạo hình trụ rỗng với ống lõi lò làm bằng bê tông chịu nhiệt, chiều dày thành ống 20 mm, đường kính trong 105 mm. Việc sử dụng ống lò bằng bê tông chịu nhiệt cho phép tạo ra môi trường nhiệt đồng đều theo chiều cao và chu vi, đồng thời có thể bảo vệ được bộ phận tạo nhiệt trong trường hợp mẫu thử bị phá hủy. Bộ phận tạo nhiệt là các dây điện trở cuốn quanh ống lò và nối với bộ điều khiển gia nhiệt. Bộ điều khiển gia nhiệt cho phép chủ động thay đổi nguồn cấp vào các dây điện trở để tạo ra các mức nhiệt độ ổn định theo từng giá trị định trước. Quá trình tăng nhiệt được kiểm soát về tốc độ nhiệt gia tăng theo thời gian (từ 1 oC đến 30 oC trên 1 phút). Lò gia nhiệt và hệ thống kiểm soát nhiệt độ đã được kiểm tra và khẳng định về sự phân bố nhiệt độ theo chiều cao cũng như theo chu vi và tính ổn định của môi trường nhiệt độ [17].
Hội nghị khoa học quốc tế Kỷ niệm 55 năm ngày thành lập Viện KHCN Xây dựng
45
- Hệ gia tải nén (Hình 2 b)) gồm một khung chữ nhật tổ hợp từ các thanh thép tiết diện H và một kích thủy lực nối với bơm dầu. Do hệ kích và bơm dầu được vận hành thủ công nên trước khi thử nghiệm, toàn bộ hệ thống (gồm cả đồng hồ áp lực) đã được hiệu chuẩn bằng Loadcell.
a)
b)
Hình 2. Hệ thiết bị gia nhiệt và thử nghiệm nén: a) Lò gia nhiệt; b) Hệ gia tải nén
2.2. Chế tạo mẫu thử Tổng số hơn 35 mẫu trụ được chế tạo từ hỗn hợp
bê tông lấy trực tiếp tại dây chuyền sản xuất các sản phẩm bê tông đúc sẵn, nhà máy tại Vĩnh Phúc. Các đặc điểm vật liệu và thiết kế thành phần cấp phối bê tông như sau:
- Cốt liệu thô (đá gốc carbonat), kích thước 5 đến 10 mm;
- Cát nghiền từ đá gốc carbonat có thành phần hạt như trình bày trong Bảng 1;
- Xi măng PC40; - Phụ gia Sika Plast 204; - Thành phần cấp phối theo trọng lượng: Xi măng : Cát : Đá : Nước = 1 : 2 : 1,92 : 0,27; - Độ sụt (cm): 0 đến 2.
Bảng 1. Thành phần hạt của cát nghiền sử dụng để chế tạo bê tông
Lỗ sàng (mm)
Khối lượng (g)
Lượng sót riêng (%)
Lượng sót tích lũy (%)
5 --- 2,5 154 15,4 15,40
1,25 177 17,7 33,10 0,63 283 28,3 61,40 0,315 176 17,6 79,00 0,14 132 13,2 92,20
< 0,14 78 7,8 100,00
Căn cứ những khuyến cáo về cấu tạo mẫu theo [16], đặc điểm vật liệu sử dụng trong thực tế và các mức nhiệt độ dự kiến xem xét đã lựa chọn mẫu trụ có đường kính 70 mm và chiều cao 250 mm (sau khi gia công cắt phẳng 2 đầu). Với kích thước mẫu như vậy các chỉ tiêu về độ mảnh của mẫu và tỉ lệ giữa đường kính và cỡ cốt liệu thô lớn nhất tương ứng sẽ là 3,6và 7,0.
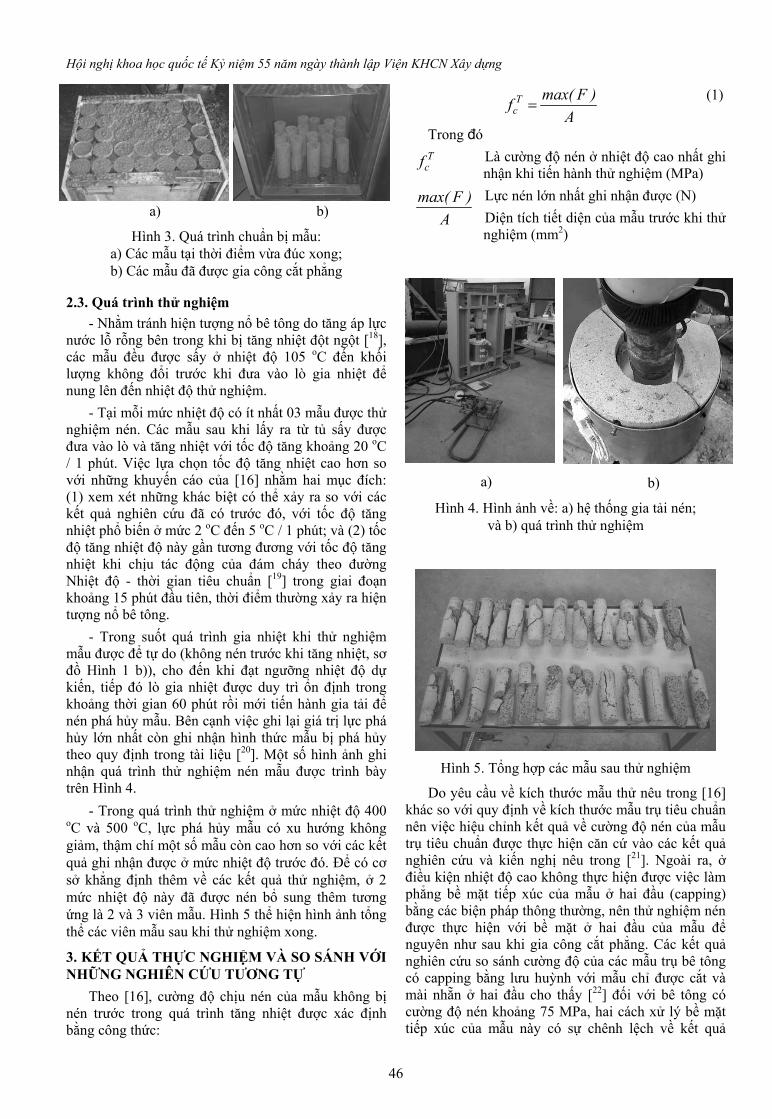
Các mẫu được đúc cùng một thời điểm trong khuôn bằng ống PVC cao 300 mm, dày 3 mm và đầm trên bàn rung theo từng lớp (Hình 3). Sau khi đúc xong, mẫu được bảo dưỡng 7 ngày trong khuôn tại mặt bằng xưởng sản xuất rồi vận chuyển về Phòng TN để tháo khuôn. Mẫu được để ở điều kiện môi trường không khí bình thường trong khoảng thời gian 4 tháng tính cho đến khi làm thử nghiệm nén. Giá trị trung bình của khối lượng thể tích ở điều kiện chưa sấy là 2,444 kG/m3, với độ lệch chuẩn là 30,1 kG/m3.
Ø 105
250
260
Vỏ bọc bằng thép không ri, dày 3 mm
Lớp vật liệu cách nhiệt
Dây điện trở gia nhiệt
Ống lò bằng vật liệu chịu lửa
Tấm chắn bằng Calcium
Silicate
Lớp vật liệu cách nhiệt
Dây điện trở gia nhiệt
Hội nghị khoa học quốc tế Kỷ niệm 55 năm ngày thành lập Viện KHCN Xây dựng
46
a) b)
Hình 3. Quá trình chuẩn bị mẫu: a) Các mẫu tại thời điểm vừa đúc xong; b) Các mẫu đã được gia công cắt phẳng
2.3. Quá trình thử nghiệm - Nhằm tránh hiện tượng nổ bê tông do tăng áp lực
nước lỗ rỗng bên trong khi bị tăng nhiệt đột ngột [18], các mẫu đều được sấy ở nhiệt độ 105 oC đến khối lượng không đổi trước khi đưa vào lò gia nhiệt để nung lên đến nhiệt độ thử nghiệm.
- Tại mỗi mức nhiệt độ có ít nhất 03 mẫu được thử nghiệm nén. Các mẫu sau khi lấy ra từ tủ sấy được đưa vào lò và tăng nhiệt với tốc độ tăng khoảng 20 oC / 1 phút. Việc lựa chọn tốc độ tăng nhiệt cao hơn so với những khuyến cáo của [16] nhằm hai mục đích: (1) xem xét những khác biệt có thể xảy ra so với các kết quả nghiên cứu đã có trước đó, với tốc độ tăng nhiệt phổ biến ở mức 2 oC đến 5 oC / 1 phút; và (2) tốc độ tăng nhiệt độ này gần tương đương với tốc độ tăng nhiệt khi chịu tác động của đám cháy theo đường Nhiệt độ - thời gian tiêu chuẩn [19] trong giai đoạn khoảng 15 phút đầu tiên, thời điểm thường xảy ra hiện tượng nổ bê tông.
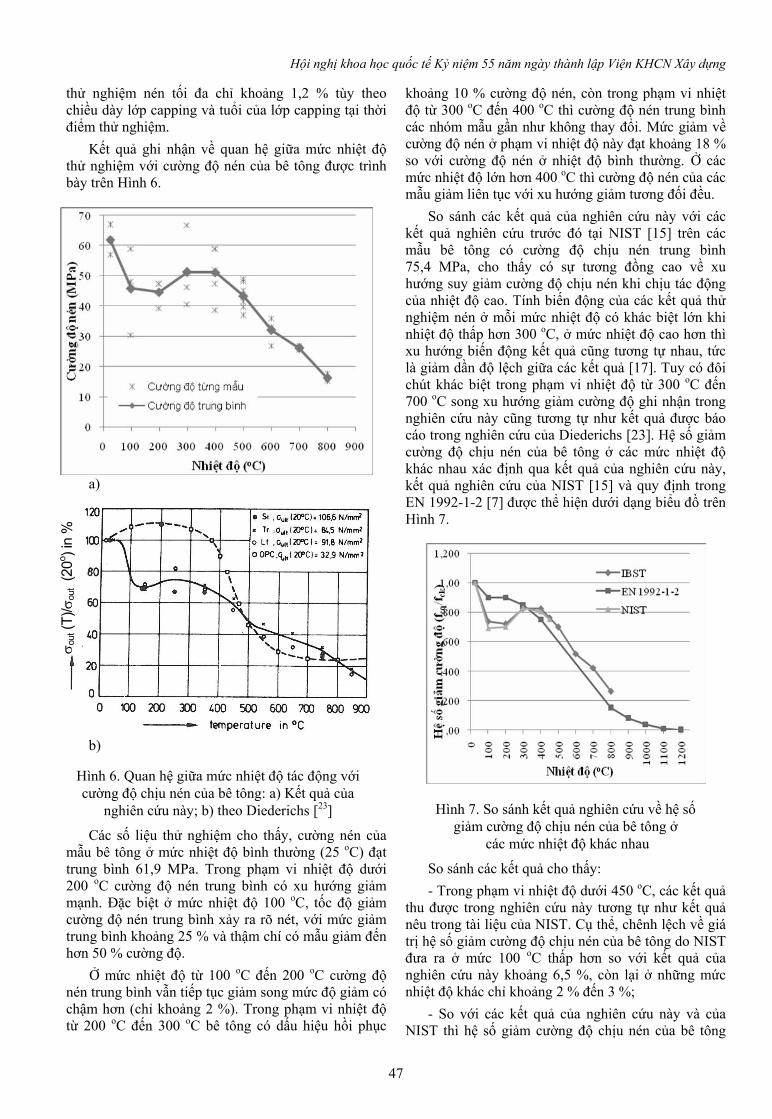
- Trong suốt quá trình gia nhiệt khi thử nghiệm mẫu được để tự do (không nén trước khi tăng nhiệt, sơ đồ Hình 1 b)), cho đến khi đạt ngưỡng nhiệt độ dự kiến, tiếp đó lò gia nhiệt được duy trì ổn định trong khoảng thời gian 60 phút rồi mới tiến hành gia tải để nén phá hủy mẫu. Bên cạnh việc ghi lại giá trị lực phá hủy lớn nhất còn ghi nhận hình thức mẫu bị phá hủy theo quy định trong tài liệu [20]. Một số hình ảnh ghi nhận quá trình thử nghiệm nén mẫu được trình bày trên Hình 4.
- Trong quá trình thử nghiệm ở mức nhiệt độ 400 oC và 500 oC, lực phá hủy mẫu có xu hướng không giảm, thậm chí một số mẫu còn cao hơn so với các kết quả ghi nhận được ở mức nhiệt độ trước đó. Để có cơ sở khẳng định thêm về các kết quả thử nghiệm, ở 2 mức nhiệt độ này đã được nén bổ sung thêm tương ứng là 2 và 3 viên mẫu. Hình 5 thể hiện hình ảnh tổng thể các viên mẫu sau khi thử nghiệm xong.
3. KẾT QUẢ THỰC NGHIỆM VÀ SO SÁNH VỚI NHỮNG NGHIÊN CỨU TƯƠNG TỰ
Theo [16], cường độ chịu nén của mẫu không bị nén trước trong quá trình tăng nhiệt được xác định bằng công thức:
Tc
max( F )fA
= (1)
Trong đó T
cf Là cường độ nén ở nhiệt độ cao nhất ghi nhận khi tiến hành thử nghiệm (MPa) Lực nén lớn nhất ghi nhận được (N) max( F )
A
Diện tích tiết diện của mẫu trước khi thử nghiệm (mm2)
a) b)
Hình 4. Hình ảnh về: a) hệ thống gia tải nén; và b) quá trình thử nghiệm
Hình 5. Tổng hợp các mẫu sau thử nghiệm
Do yêu cầu về kích thước mẫu thử nêu trong [16] khác so với quy định về kích thước mẫu trụ tiêu chuẩn nên việc hiệu chỉnh kết quả về cường độ nén của mẫu trụ tiêu chuẩn được thực hiện căn cứ vào các kết quả nghiên cứu và kiến nghị nêu trong [21]. Ngoài ra, ở điều kiện nhiệt độ cao không thực hiện được việc làm phẳng bề mặt tiếp xúc của mẫu ở hai đầu (capping) bằng các biện pháp thông thường, nên thử nghiệm nén được thực hiện với bề mặt ở hai đầu của mẫu để nguyên như sau khi gia công cắt phẳng. Các kết quả nghiên cứu so sánh cường độ của các mẫu trụ bê tông có capping bằng lưu huỳnh với mẫu chỉ được cắt và mài nhẵn ở hai đầu cho thấy [22] đối với bê tông có cường độ nén khoảng 75 MPa, hai cách xử lý bề mặt tiếp xúc của mẫu này có sự chênh lệch về kết quả
Hội nghị khoa học quốc tế Kỷ niệm 55 năm ngày thành lập Viện KHCN Xây dựng
47
thử nghiệm nén tối đa chỉ khoảng 1,2 % tùy theo chiều dày lớp capping và tuổi của lớp capping tại thời điểm thử nghiệm.
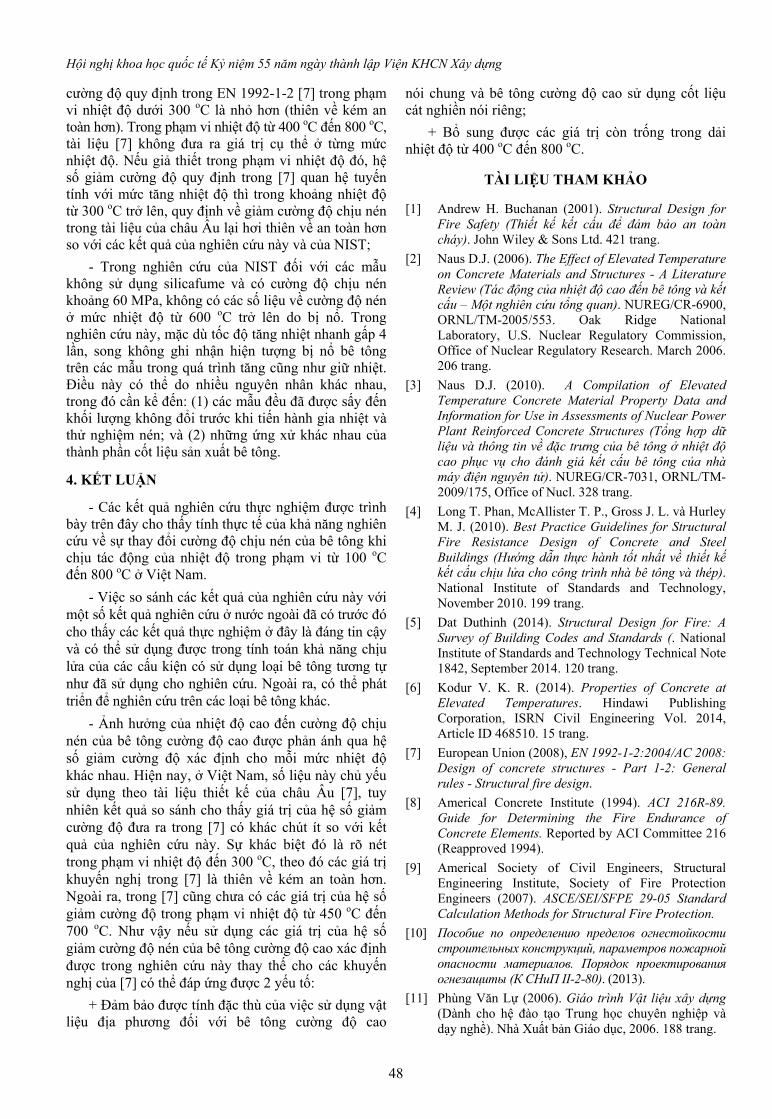
Kết quả ghi nhận về quan hệ giữa mức nhiệt độ thử nghiệm với cường độ nén của bê tông được trình bày trên Hình 6.
a)
b)
Hình 6. Quan hệ giữa mức nhiệt độ tác động với cường độ chịu nén của bê tông: a) Kết quả của
nghiên cứu này; b) theo Diederichs [23]
Các số liệu thử nghiệm cho thấy, cường nén của mẫu bê tông ở mức nhiệt độ bình thường (25 oC) đạt trung bình 61,9 MPa. Trong phạm vi nhiệt độ dưới 200 oC cường độ nén trung bình có xu hướng giảm mạnh. Đặc biệt ở mức nhiệt độ 100 oC, tốc độ giảm cường độ nén trung bình xảy ra rõ nét, với mức giảm trung bình khoảng 25 % và thậm chí có mẫu giảm đến hơn 50 % cường độ.
Ở mức nhiệt độ từ 100 oC đến 200 oC cường độ nén trung bình vẫn tiếp tục giảm song mức độ giảm có chậm hơn (chỉ khoảng 2 %). Trong phạm vi nhiệt độ từ 200 oC đến 300 oC bê tông có dấu hiệu hồi phục
khoảng 10 % cường độ nén, còn trong phạm vi nhiệt độ từ 300 oC đến 400 oC thì cường độ nén trung bình các nhóm mẫu gần như không thay đổi. Mức giảm về cường độ nén ở phạm vi nhiệt độ này đạt khoảng 18 % so với cường độ nén ở nhiệt độ bình thường. Ở các mức nhiệt độ lớn hơn 400 oC thì cường độ nén của các mẫu giảm liên tục với xu hướng giảm tương đối đều.
So sánh các kết quả của nghiên cứu này với các kết quả nghiên cứu trước đó tại NIST [15] trên các mẫu bê tông có cường độ chịu nén trung bình 75,4 MPa, cho thấy có sự tương đồng cao về xu hướng suy giảm cường độ chịu nén khi chịu tác động của nhiệt độ cao. Tính biến động của các kết quả thử nghiệm nén ở mỗi mức nhiệt độ có khác biệt lớn khi nhiệt độ thấp hơn 300 oC, ở mức nhiệt độ cao hơn thì xu hướng biến động kết quả cũng tương tự nhau, tức là giảm dần độ lệch giữa các kết quả [17]. Tuy có đôi chút khác biệt trong phạm vi nhiệt độ từ 300 oC đến 700 oC song xu hướng giảm cường độ ghi nhận trong nghiên cứu này cũng tương tự như kết quả được báo cáo trong nghiên cứu của Diederichs [23]. Hệ số giảm cường độ chịu nén của bê tông ở các mức nhiệt độ khác nhau xác định qua kết quả của nghiên cứu này, kết quả nghiên cứu của NIST [15] và quy định trong EN 1992-1-2 [7] được thể hiện dưới dạng biểu đồ trên Hình 7.
Hình 7. So sánh kết quả nghiên cứu về hệ số giảm cường độ chịu nén của bê tông ở
các mức nhiệt độ khác nhau
So sánh các kết quả cho thấy: - Trong phạm vi nhiệt độ dưới 450 oC, các kết quả
thu được trong nghiên cứu này tương tự như kết quả nêu trong tài liệu của NIST. Cụ thể, chênh lệch về giá trị hệ số giảm cường độ chịu nén của bê tông do NIST đưa ra ở mức 100 oC thấp hơn so với kết quả của nghiên cứu này khoảng 6,5 %, còn lại ở những mức nhiệt độ khác chỉ khoảng 2 % đến 3 %;
- So với các kết quả của nghiên cứu này và của NIST thì hệ số giảm cường độ chịu nén của bê tông
σ out (T
)/σou
t (20
o ) in
%
Hội nghị khoa học quốc tế Kỷ niệm 55 năm ngày thành lập Viện KHCN Xây dựng
48
cường độ quy định trong EN 1992-1-2 [7] trong phạm vi nhiệt độ dưới 300 oC là nhỏ hơn (thiên về kém an toàn hơn). Trong phạm vi nhiệt độ từ 400 oC đến 800 oC, tài liệu [7] không đưa ra giá trị cụ thể ở từng mức nhiệt độ. Nếu giả thiết trong phạm vi nhiệt độ đó, hệ số giảm cường độ quy định trong [7] quan hệ tuyến tính với mức tăng nhiệt độ thì trong khoảng nhiệt độ từ 300 oC trở lên, quy định về giảm cường độ chịu nén trong tài liệu của châu Âu lại hơi thiên về an toàn hơn so với các kết quả của nghiên cứu này và của NIST;
- Trong nghiên cứu của NIST đối với các mẫu không sử dụng silicafume và có cường độ chịu nén khoảng 60 MPa, không có các số liệu về cường độ nén ở mức nhiệt độ từ 600 oC trở lên do bị nổ. Trong nghiên cứu này, mặc dù tốc độ tăng nhiệt nhanh gấp 4 lần, song không ghi nhận hiện tượng bị nổ bê tông trên các mẫu trong quá trình tăng cũng như giữ nhiệt. Điều này có thể do nhiều nguyên nhân khác nhau, trong đó cần kể đến: (1) các mẫu đều đã được sấy đến khối lượng không đổi trước khi tiến hành gia nhiệt và thử nghiệm nén; và (2) những ứng xử khác nhau của thành phần cốt liệu sản xuất bê tông.
4. KẾT LUẬN
- Các kết quả nghiên cứu thực nghiệm được trình bày trên đây cho thấy tính thực tế của khả năng nghiên cứu về sự thay đổi cường độ chịu nén của bê tông khi chịu tác động của nhiệt độ trong phạm vi từ 100 oC đến 800 oC ở Việt Nam.
- Việc so sánh các kết quả của nghiên cứu này với một số kết quả nghiên cứu ở nước ngoài đã có trước đó cho thấy các kết quả thực nghiệm ở đây là đáng tin cậy và có thể sử dụng được trong tính toán khả năng chịu lửa của các cấu kiện có sử dụng loại bê tông tương tự như đã sử dụng cho nghiên cứu. Ngoài ra, có thể phát triển để nghiên cứu trên các loại bê tông khác.
- Ảnh hưởng của nhiệt độ cao đến cường độ chịu nén của bê tông cường độ cao được phản ánh qua hệ số giảm cường độ xác định cho mỗi mức nhiệt độ khác nhau. Hiện nay, ở Việt Nam, số liệu này chủ yếu sử dụng theo tài liệu thiết kế của châu Âu [7], tuy nhiên kết quả so sánh cho thấy giá trị của hệ số giảm cường độ đưa ra trong [7] có khác chút ít so với kết quả của nghiên cứu này. Sự khác biệt đó là rõ nét trong phạm vi nhiệt độ đến 300 oC, theo đó các giá trị khuyến nghị trong [7] là thiên về kém an toàn hơn. Ngoài ra, trong [7] cũng chưa có các giá trị của hệ số giảm cường độ trong phạm vi nhiệt độ từ 450 oC đến 700 oC. Như vậy nếu sử dụng các giá trị của hệ số giảm cường độ nén của bê tông cường độ cao xác định được trong nghiên cứu này thay thế cho các khuyến nghị của [7] có thể đáp ứng được 2 yếu tố:
+ Đảm bảo được tính đặc thù của việc sử dụng vật liệu địa phương đối với bê tông cường độ cao
nói chung và bê tông cường độ cao sử dụng cốt liệu cát nghiền nói riêng;
+ Bổ sung được các giá trị còn trống trong dải nhiệt độ từ 400 oC đến 800 oC.
TÀI LIỆU THAM KHẢO
[1] Andrew H. Buchanan (2001). Structural Design for Fire Safety (Thiết kế kết cấu để đảm bảo an toàn cháy). John Wiley & Sons Ltd. 421 trang.
[2] Naus D.J. (2006). The Effect of Elevated Temperature on Concrete Materials and Structures - A Literature Review (Tác động của nhiệt độ cao đến bê tông và kết cấu – Một nghiên cứu tổng quan). NUREG/CR-6900, ORNL/TM-2005/553. Oak Ridge National Laboratory, U.S. Nuclear Regulatory Commission, Office of Nuclear Regulatory Research. March 2006. 206 trang.
[3] Naus D.J. (2010). A Compilation of Elevated Temperature Concrete Material Property Data and Information for Use in Assessments of Nuclear Power Plant Reinforced Concrete Structures (Tổng hợp dữ liệu và thông tin về đặc trưng của bê tông ở nhiệt độ cao phục vụ cho đánh giá kết cấu bê tông của nhà máy điện nguyên tử). NUREG/CR-7031, ORNL/TM-2009/175, Office of Nucl. 328 trang.
[4] Long T. Phan, McAllister T. P., Gross J. L. và Hurley M. J. (2010). Best Practice Guidelines for Structural Fire Resistance Design of Concrete and Steel Buildings (Hướng dẫn thực hành tốt nhất về thiết kế kết cấu chịu lửa cho công trình nhà bê tông và thép). National Institute of Standards and Technology, November 2010. 199 trang.
[5] Dat Duthinh (2014). Structural Design for Fire: A Survey of Building Codes and Standards (. National Institute of Standards and Technology Technical Note 1842, September 2014. 120 trang.
[6] Kodur V. K. R. (2014). Properties of Concrete at Elevated Temperatures. Hindawi Publishing Corporation, ISRN Civil Engineering Vol. 2014, Article ID 468510. 15 trang.
[7] European Union (2008), EN 1992-1-2:2004/AC 2008: Design of concrete structures - Part 1-2: General rules - Structural fire design.
[8] Americal Concrete Institute (1994). ACI 216R-89. Guide for Determining the Fire Endurance of Concrete Elements. Reported by ACI Committee 216 (Reapproved 1994).
[9] Americal Society of Civil Engineers, Structural Engineering Institute, Society of Fire Protection Engineers (2007). ASCE/SEI/SFPE 29-05 Standard Calculation Methods for Structural Fire Protection.
[10] Пособие по определению пределов огнестойкости строительных конструкций, параметров пожарной опасности материалов. Порядок проектирования огнезащиты (К СНиП II-2-80). (2013).
[11] Phùng Văn Lự (2006). Giáo trình Vật liệu xây dựng (Dành cho hệ đào tạo Trung học chuyên nghiệp và dạy nghề). Nhà Xuất bản Giáo dục, 2006. 188 trang.
Hội nghị khoa học quốc tế Kỷ niệm 55 năm ngày thành lập Viện KHCN Xây dựng
49
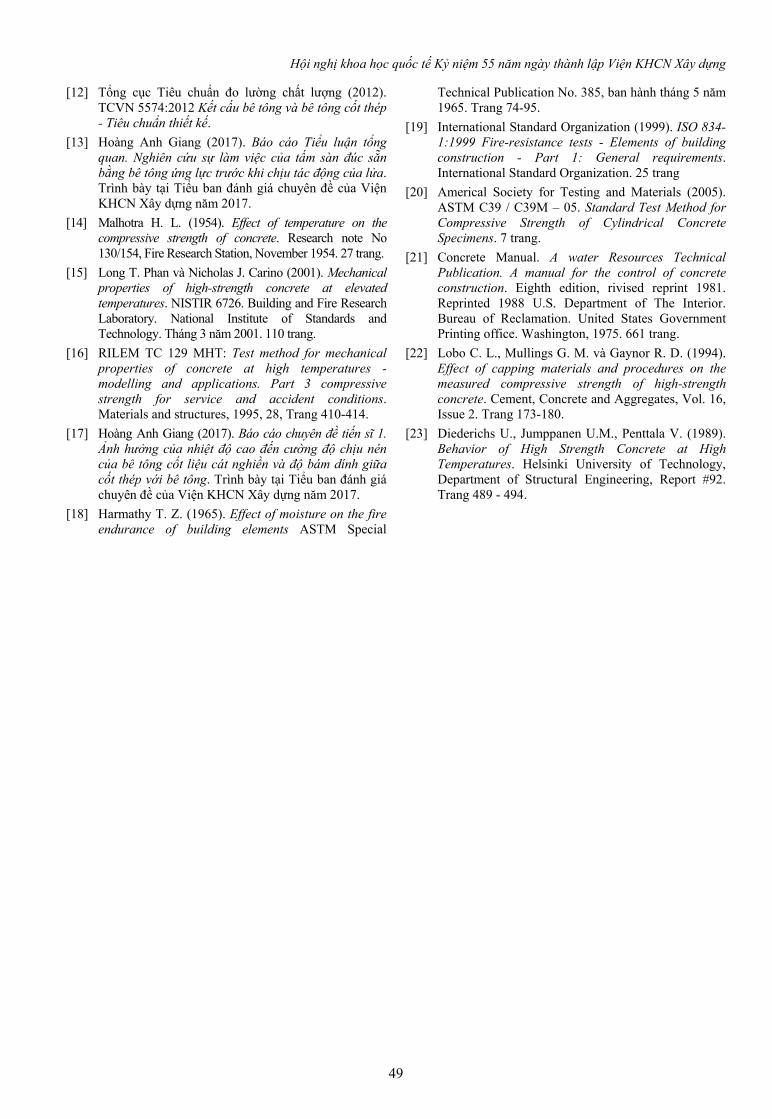
[12] Tổng cục Tiêu chuẩn đo lường chất lượng (2012). TCVN 5574:2012 Kết cấu bê tông và bê tông cốt thép - Tiêu chuẩn thiết kế.
[13] Hoàng Anh Giang (2017). Báo cáo Tiểu luận tổng quan. Nghiên cứu sự làm việc của tấm sàn đúc sẵn bằng bê tông ứng lực trước khi chịu tác động của lửa. Trình bày tại Tiểu ban đánh giá chuyên đề của Viện KHCN Xây dựng năm 2017.
[14] Malhotra H. L. (1954). Effect of temperature on the compressive strength of concrete. Research note No 130/154, Fire Research Station, November 1954. 27 trang.
[15] Long T. Phan và Nicholas J. Carino (2001). Mechanical properties of high-strength concrete at elevated temperatures. NISTIR 6726. Building and Fire Research Laboratory. National Institute of Standards and Technology. Tháng 3 năm 2001. 110 trang.
[16] RILEM TC 129 MHT: Test method for mechanical properties of concrete at high temperatures -modelling and applications. Part 3 compressive strength for service and accident conditions. Materials and structures, 1995, 28, Trang 410-414.
[17] Hoàng Anh Giang (2017). Báo cáo chuyên đề tiến sĩ 1. Ảnh hưởng của nhiệt độ cao đến cường độ chịu nén của bê tông cốt liệu cát nghiền và độ bám dính giữa cốt thép với bê tông. Trình bày tại Tiểu ban đánh giá chuyên đề của Viện KHCN Xây dựng năm 2017.
[18] Harmathy T. Z. (1965). Effect of moisture on the fire endurance of building elements ASTM Special
Technical Publication No. 385, ban hành tháng 5 năm 1965. Trang 74-95.
[19] International Standard Organization (1999). ISO 834-1:1999 Fire-resistance tests - Elements of building construction - Part 1: General requirements. International Standard Organization. 25 trang
[20] Americal Society for Testing and Materials (2005). ASTM C39 / C39M – 05. Standard Test Method for Compressive Strength of Cylindrical Concrete Specimens. 7 trang.
[21] Concrete Manual. A water Resources Technical Publication. A manual for the control of concrete construction. Eighth edition, rivised reprint 1981. Reprinted 1988 U.S. Department of The Interior. Bureau of Reclamation. United States Government Printing office. Washington, 1975. 661 trang.
[22] Lobo C. L., Mullings G. M. và Gaynor R. D. (1994). Effect of capping materials and procedures on the measured compressive strength of high-strength concrete. Cement, Concrete and Aggregates, Vol. 16, Issue 2. Trang 173-180.
[23] Diederichs U., Jumppanen U.M., Penttala V. (1989). Behavior of High Strength Concrete at High Temperatures. Helsinki University of Technology, Department of Structural Engineering, Report #92. Trang 489 - 494.
Hội nghị khoa học quốc tế Kỷ niệm 55 năm ngày thành lập Viện KHCN Xây dựng
50
EXPERIMENT STUDY OF CONCRETE PUMPING EFFICIENCY IMPROVEMENT USING ELECTRO-MAGNETIC FORCE DEVICE FOR
SUPER-TALL BUILDING
Yuseung Kim1, Young Jin, Kim2
1Research Manager, TECOLAB Co. Ltd, Email: [email protected] 2Korea Concrete Institute, Email: [email protected]
ABSTRACTS: Concrete pumping is the main process for building construction to deliver the material. There is so many research to study pumping process and achieved the researches to analyse the pumping process. Usually these researches have focused on the analysing process. In this paper, through various concrete pumping tests, EMF method can affect to improve the pumping efficiency and it gives a useful solution for concrete pumping.
KEYWORDS: Concrete pumping, Friction, Concrete Material Property, EMF pulsation.
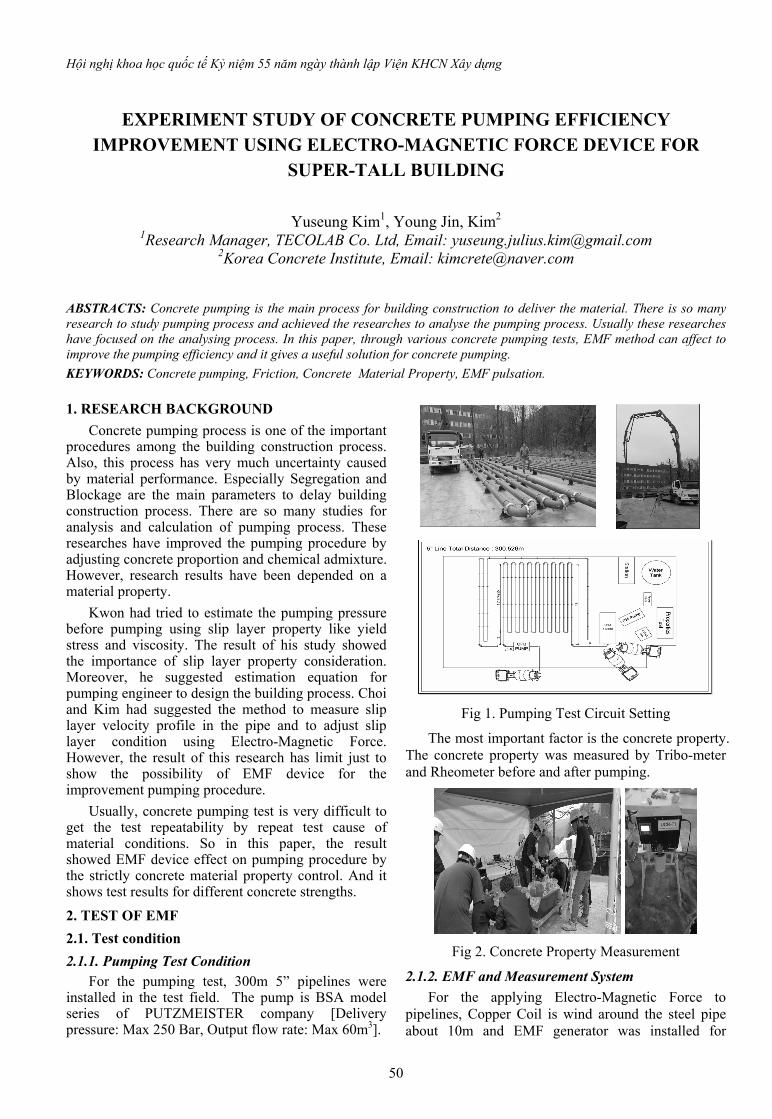
1. RESEARCH BACKGROUND
Concrete pumping process is one of the important procedures among the building construction process. Also, this process has very much uncertainty caused by material performance. Especially Segregation and Blockage are the main parameters to delay building construction process. There are so many studies for analysis and calculation of pumping process. These researches have improved the pumping procedure by adjusting concrete proportion and chemical admixture. However, research results have been depended on a material property.
Kwon had tried to estimate the pumping pressure before pumping using slip layer property like yield stress and viscosity. The result of his study showed the importance of slip layer property consideration. Moreover, he suggested estimation equation for pumping engineer to design the building process. Choi and Kim had suggested the method to measure slip layer velocity profile in the pipe and to adjust slip layer condition using Electro-Magnetic Force. However, the result of this research has limit just to show the possibility of EMF device for the improvement pumping procedure.
Usually, concrete pumping test is very difficult to get the test repeatability by repeat test cause of material conditions. So in this paper, the result showed EMF device effect on pumping procedure by the strictly concrete material property control. And it shows test results for different concrete strengths.
2. TEST OF EMF
2.1. Test condition
2.1.1. Pumping Test Condition For the pumping test, 300m 5” pipelines were
installed in the test field. The pump is BSA model series of PUTZMEISTER company [Delivery pressure: Max 250 Bar, Output flow rate: Max 60m3].
Fig 1. Pumping Test Circuit Setting
The most important factor is the concrete property. The concrete property was measured by Tribo-meter and Rheometer before and after pumping.
Fig 2. Concrete Property Measurement
2.1.2. EMF and Measurement System
For the applying Electro-Magnetic Force to pipelines, Copper Coil is wind around the steel pipe about 10m and EMF generator was installed for
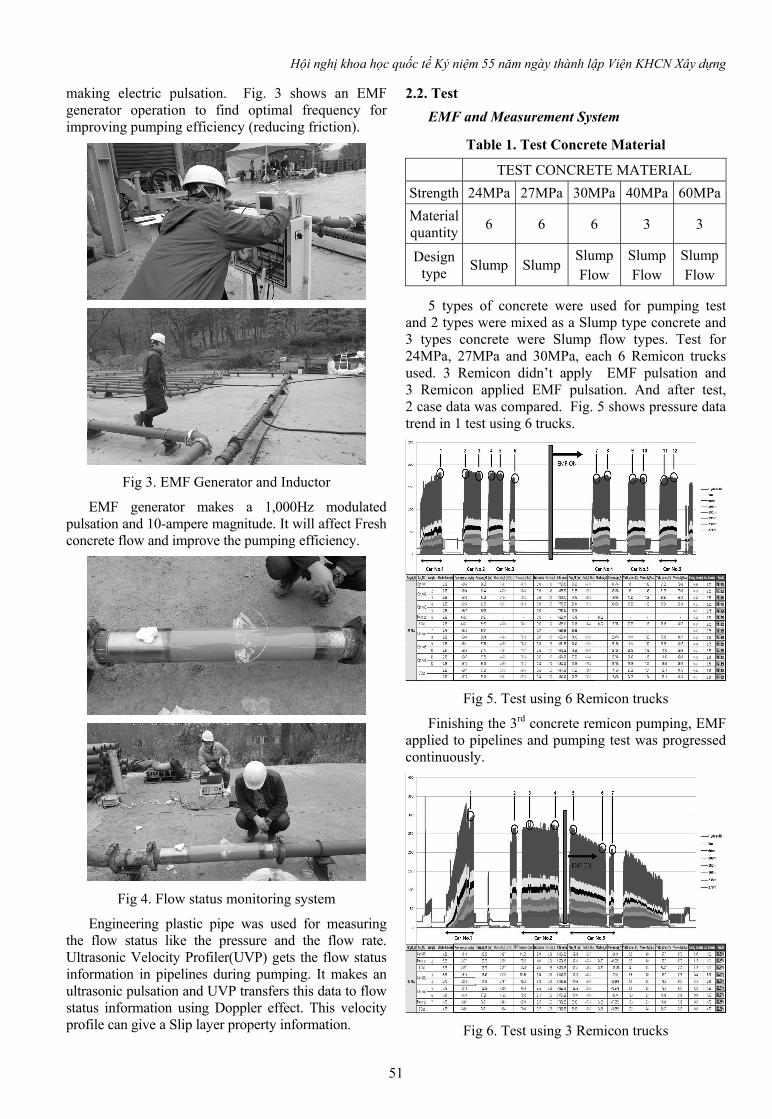
Hội nghị khoa học quốc tế Kỷ niệm 55 năm ngày thành lập Viện KHCN Xây dựng
51
making electric pulsation. Fig. 3 shows an EMF generator operation to find optimal frequency for improving pumping efficiency (reducing friction).
Fig 3. EMF Generator and Inductor
EMF generator makes a 1,000Hz modulated pulsation and 10-ampere magnitude. It will affect Fresh concrete flow and improve the pumping efficiency.
Fig 4. Flow status monitoring system
Engineering plastic pipe was used for measuring the flow status like the pressure and the flow rate. Ultrasonic Velocity Profiler(UVP) gets the flow status information in pipelines during pumping. It makes an ultrasonic pulsation and UVP transfers this data to flow status information using Doppler effect. This velocity profile can give a Slip layer property information.
2.2. Test
EMF and Measurement System
Table 1. Test Concrete Material
TEST CONCRETE MATERIAL
Strength 24MPa 27MPa 30MPa 40MPa 60MPa
Material quantity
6 6 6 3 3
Design type
Slump Slump Slump Flow
Slump Flow
Slump Flow
5 types of concrete were used for pumping test and 2 types were mixed as a Slump type concrete and 3 types concrete were Slump flow types. Test for 24MPa, 27MPa and 30MPa, each 6 Remicon trucks used. 3 Remicon didn’t apply EMF pulsation and 3 Remicon applied EMF pulsation. And after test, 2 case data was compared. Fig. 5 shows pressure data trend in 1 test using 6 trucks.
Fig 5. Test using 6 Remicon trucks
Finishing the 3rd concrete remicon pumping, EMF applied to pipelines and pumping test was progressed continuously.
Fig 6. Test using 3 Remicon trucks
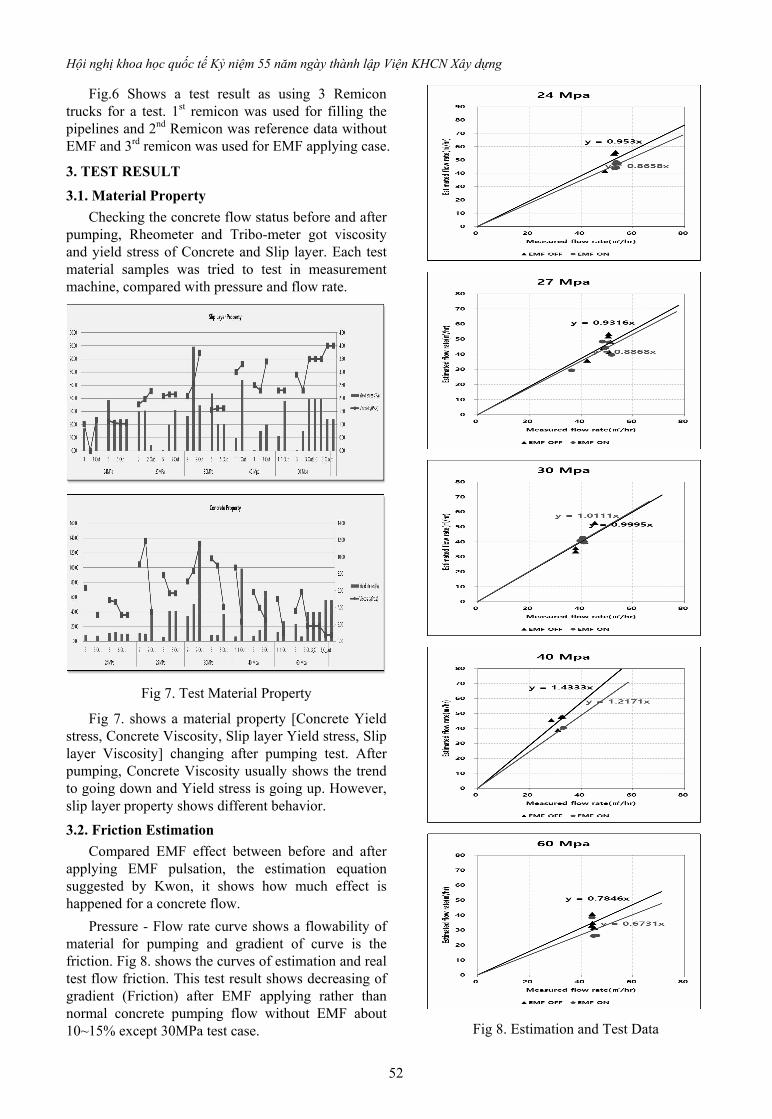
Hội nghị khoa học quốc tế Kỷ niệm 55 năm ngày thành lập Viện KHCN Xây dựng
52
Fig.6 Shows a test result as using 3 Remicon trucks for a test. 1st remicon was used for filling the pipelines and 2nd Remicon was reference data without EMF and 3rd remicon was used for EMF applying case.
3. TEST RESULT
3.1. Material Property
Checking the concrete flow status before and after pumping, Rheometer and Tribo-meter got viscosity and yield stress of Concrete and Slip layer. Each test material samples was tried to test in measurement machine, compared with pressure and flow rate.
Fig 7. Test Material Property
Fig 7. shows a material property [Concrete Yield stress, Concrete Viscosity, Slip layer Yield stress, Slip layer Viscosity] changing after pumping test. After pumping, Concrete Viscosity usually shows the trend to going down and Yield stress is going up. However, slip layer property shows different behavior.
3.2. Friction Estimation
Compared EMF effect between before and after applying EMF pulsation, the estimation equation suggested by Kwon, it shows how much effect is happened for a concrete flow.
Pressure - Flow rate curve shows a flowability of material for pumping and gradient of curve is the friction. Fig 8. shows the curves of estimation and real test flow friction. This test result shows decreasing of gradient (Friction) after EMF applying rather than normal concrete pumping flow without EMF about 10~15% except 30MPa test case.
Fig 8. Estimation and Test Data
Hội nghị khoa học quốc tế Kỷ niệm 55 năm ngày thành lập Viện KHCN Xây dựng
53
4. CONCLUSION
In this paper, EMF Device makes a pulsation which affects to the fresh concrete flow during pumping. Each strength concrete flow property is changed after applying EMF pulsation and it’ direction is a direction of decreasing friction. Just 30MPa strength concrete shows a different behavior, it may be caused by uncertainty of material property. As a result, EMF pulsation will affect to change a concrete material property during pumping and it will give a benefit to construction process like reducing building time. Even this test was achieved under strictly material control to maintain stable material conditions, it needs to try more test to get the repeatability and more various conditions. However EMF pulsation clearly shows effect to improve pumping efficiency.
5. ACKNOWLEDGEMENT
This research was supported by a grant (18AUDP-B106327-01) from Architecture & Urban Development Research Program funded by Ministry of Land, Infrastructure and Transport of Korean Government.
TÀI LIỆU THAM KHẢO
[1] Kim, Y. S., Lee, M. H., Lee, Y. J. (2014), “ Test Study about Electro magnetic force effect to apply dredging soil transport", Journal of academia-industrial technology, Vol. 8, No .6, pp2883-2890.
[2] Choi, M. S., Kim, Y. S., Kim, J. H., Kim, J. S., Kwon, S. H. (2014), “Effects of an externally imposed electromagnetic field on the formation of a lubrication layer in concrete pumping”, Construction and Building Materials, Vol.61 pp.18-23.
[3] Su, N., Wu, C. F. (2003), "Effect of magnetic field treated water on mortar and concrete containing fly ash". Cement and Concrete Composites, Vol. 25, No. 7 pp.681–688.
[4] Jang, Kyung pil., Kown, Seung Hee., “ Verification on the Prediction Method of Concrete Pumping Through a Real Site Vertical Pumping Test”, KCI, Vol.29 No.2 (2017-10) pp.385-3.
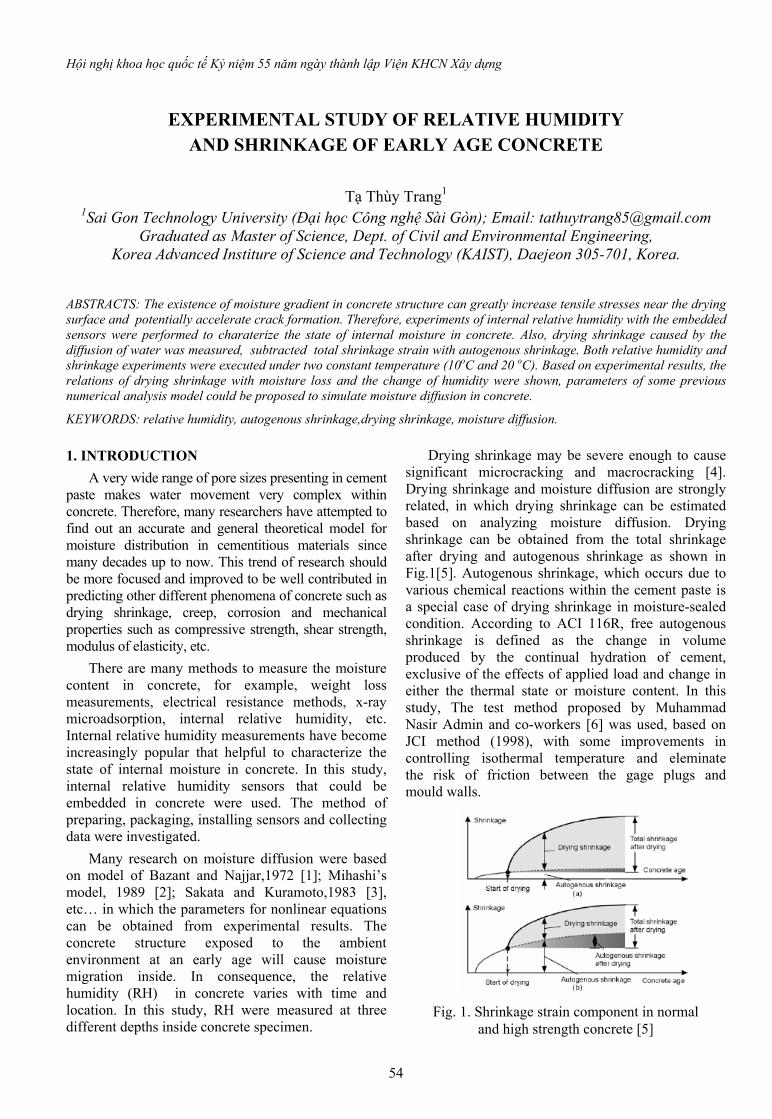
Hội nghị khoa học quốc tế Kỷ niệm 55 năm ngày thành lập Viện KHCN Xây dựng
54
EXPERIMENTAL STUDY OF RELATIVE HUMIDITY AND SHRINKAGE OF EARLY AGE CONCRETE
Tạ Thùy Trang1
1Sai Gon Technology University (Đại học Công nghệ Sài Gòn); Email: [email protected] Graduated as Master of Science, Dept. of Civil and Environmental Engineering,
Korea Advanced Institure of Science and Technology (KAIST), Daejeon 305-701, Korea.
ABSTRACTS: The existence of moisture gradient in concrete structure can greatly increase tensile stresses near the drying surface and potentially accelerate crack formation. Therefore, experiments of internal relative humidity with the embedded sensors were performed to charaterize the state of internal moisture in concrete. Also, drying shrinkage caused by the diffusion of water was measured, subtracted total shrinkage strain with autogenous shrinkage. Both relative humidity and shrinkage experiments were executed under two constant temperature (10oC and 20 oC). Based on experimental results, the relations of drying shrinkage with moisture loss and the change of humidity were shown, parameters of some previous numerical analysis model could be proposed to simulate moisture diffusion in concrete.
KEYWORDS: relative humidity, autogenous shrinkage,drying shrinkage, moisture diffusion.
1. INTRODUCTION
A very wide range of pore sizes presenting in cement paste makes water movement very complex within concrete. Therefore, many researchers have attempted to find out an accurate and general theoretical model for moisture distribution in cementitious materials since many decades up to now. This trend of research should be more focused and improved to be well contributed in predicting other different phenomena of concrete such as drying shrinkage, creep, corrosion and mechanical properties such as compressive strength, shear strength, modulus of elasticity, etc.
There are many methods to measure the moisture content in concrete, for example, weight loss measurements, electrical resistance methods, x-ray microadsorption, internal relative humidity, etc. Internal relative humidity measurements have become increasingly popular that helpful to characterize the state of internal moisture in concrete. In this study, internal relative humidity sensors that could be embedded in concrete were used. The method of preparing, packaging, installing sensors and collecting data were investigated.
Many research on moisture diffusion were based on model of Bazant and Najjar,1972 [1]; Mihashi’s model, 1989 [2]; Sakata and Kuramoto,1983 [3], etc… in which the parameters for nonlinear equations can be obtained from experimental results. The concrete structure exposed to the ambient environment at an early age will cause moisture migration inside. In consequence, the relative humidity (RH) in concrete varies with time and location. In this study, RH were measured at three different depths inside concrete specimen.
Drying shrinkage may be severe enough to cause significant microcracking and macrocracking [4]. Drying shrinkage and moisture diffusion are strongly related, in which drying shrinkage can be estimated based on analyzing moisture diffusion. Drying shrinkage can be obtained from the total shrinkage after drying and autogenous shrinkage as shown in Fig.1[5]. Autogenous shrinkage, which occurs due to various chemical reactions within the cement paste is a special case of drying shrinkage in moisture-sealed condition. According to ACI 116R, free autogenous shrinkage is defined as the change in volume produced by the continual hydration of cement, exclusive of the effects of applied load and change in either the thermal state or moisture content. In this study, The test method proposed by Muhammad Nasir Admin and co-workers [6] was used, based on JCI method (1998), with some improvements in controlling isothermal temperature and eleminate the risk of friction between the gage plugs and mould walls.
Fig. 1. Shrinkage strain component in normal and high strength concrete [5]
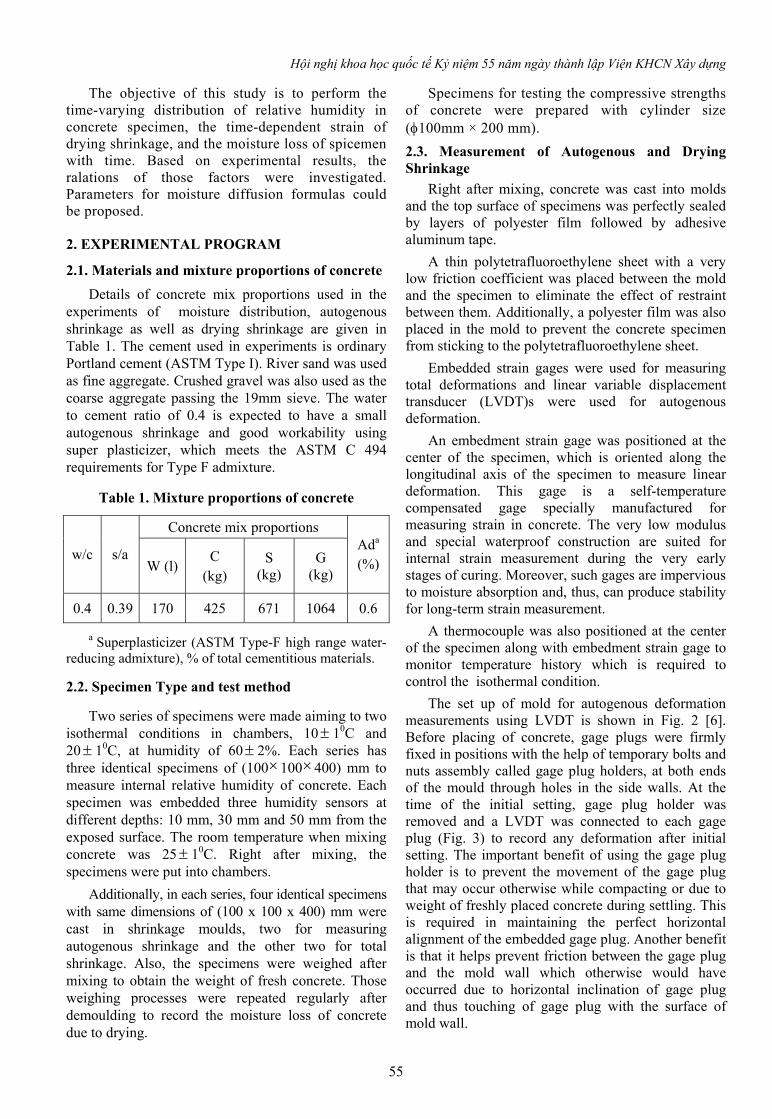
Hội nghị khoa học quốc tế Kỷ niệm 55 năm ngày thành lập Viện KHCN Xây dựng
55
The objective of this study is to perform the time-varying distribution of relative humidity in concrete specimen, the time-dependent strain of drying shrinkage, and the moisture loss of spicemen with time. Based on experimental results, the ralations of those factors were investigated. Parameters for moisture diffusion formulas could be proposed.
2. EXPERIMENTAL PROGRAM
2.1. Materials and mixture proportions of concrete
Details of concrete mix proportions used in the experiments of moisture distribution, autogenous shrinkage as well as drying shrinkage are given in Table 1. The cement used in experiments is ordinary Portland cement (ASTM Type I). River sand was used as fine aggregate. Crushed gravel was also used as the coarse aggregate passing the 19mm sieve. The water to cement ratio of 0.4 is expected to have a small autogenous shrinkage and good workability using super plasticizer, which meets the ASTM C 494 requirements for Type F admixture.
Table 1. Mixture proportions of concrete
Concrete mix proportions
w/c s/a W (l)
C (kg)
S (kg)
G (kg)
Ada (%)
0.4 0.39 170 425 671 1064 0.6
a Superplasticizer (ASTM Type-F high range water-reducing admixture), % of total cementitious materials.
2.2. Specimen Type and test method
Two series of specimens were made aiming to two isothermal conditions in chambers, 10 10C and 20 10C, at humidity of 60 2%. Each series has three identical specimens of (100100400) mm to measure internal relative humidity of concrete. Each specimen was embedded three humidity sensors at different depths: 10 mm, 30 mm and 50 mm from the exposed surface. The room temperature when mixing concrete was 25 10C. Right after mixing, the specimens were put into chambers.
Additionally, in each series, four identical specimens with same dimensions of (100 x 100 x 400) mm were cast in shrinkage moulds, two for measuring autogenous shrinkage and the other two for total shrinkage. Also, the specimens were weighed after mixing to obtain the weight of fresh concrete. Those weighing processes were repeated regularly after demoulding to record the moisture loss of concrete due to drying.
Specimens for testing the compressive strengths of concrete were prepared with cylinder size (100mm × 200 mm).
2.3. Measurement of Autogenous and Drying Shrinkage
Right after mixing, concrete was cast into molds and the top surface of specimens was perfectly sealed by layers of polyester film followed by adhesive aluminum tape.
A thin polytetrafluoroethylene sheet with a very low friction coefficient was placed between the mold and the specimen to eliminate the effect of restraint between them. Additionally, a polyester film was also placed in the mold to prevent the concrete specimen from sticking to the polytetrafluoroethylene sheet.
Embedded strain gages were used for measuring total deformations and linear variable displacement transducer (LVDT)s were used for autogenous deformation.
An embedment strain gage was positioned at the center of the specimen, which is oriented along the longitudinal axis of the specimen to measure linear deformation. This gage is a self-temperature compensated gage specially manufactured for measuring strain in concrete. The very low modulus and special waterproof construction are suited for internal strain measurement during the very early stages of curing. Moreover, such gages are impervious to moisture absorption and, thus, can produce stability for long-term strain measurement.
A thermocouple was also positioned at the center of the specimen along with embedment strain gage to monitor temperature history which is required to control the isothermal condition.
The set up of mold for autogenous deformation measurements using LVDT is shown in Fig. 2 [6]. Before placing of concrete, gage plugs were firmly fixed in positions with the help of temporary bolts and nuts assembly called gage plug holders, at both ends of the mould through holes in the side walls. At the time of the initial setting, gage plug holder was removed and a LVDT was connected to each gage plug (Fig. 3) to record any deformation after initial setting. The important benefit of using the gage plug holder is to prevent the movement of the gage plug that may occur otherwise while compacting or due to weight of freshly placed concrete during settling. This is required in maintaining the perfect horizontal alignment of the embedded gage plug. Another benefit is that it helps prevent friction between the gage plug and the mold wall which otherwise would have occurred due to horizontal inclination of gage plug and thus touching of gage plug with the surface of mold wall.
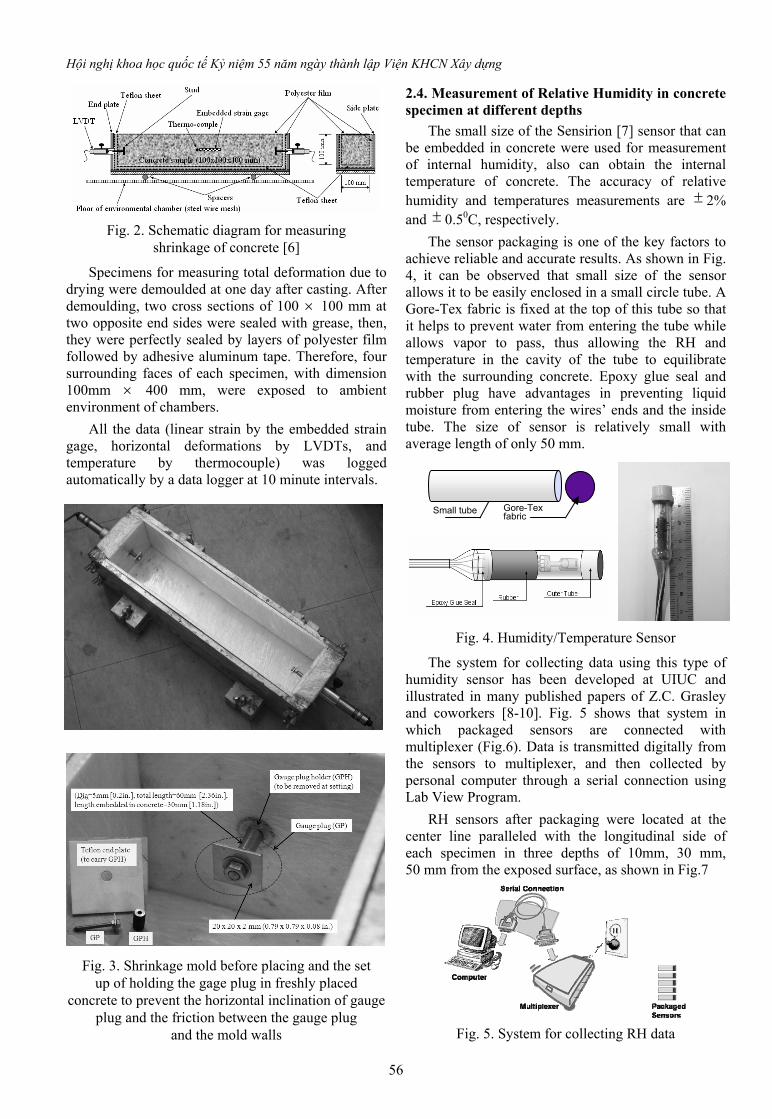
Hội nghị khoa học quốc tế Kỷ niệm 55 năm ngày thành lập Viện KHCN Xây dựng
56
Fig. 2. Schematic diagram for measuring shrinkage of concrete [6]
Specimens for measuring total deformation due to drying were demoulded at one day after casting. After demoulding, two cross sections of 100 100 mm at two opposite end sides were sealed with grease, then, they were perfectly sealed by layers of polyester film followed by adhesive aluminum tape. Therefore, four surrounding faces of each specimen, with dimension 100mm 400 mm, were exposed to ambient environment of chambers.
All the data (linear strain by the embedded strain gage, horizontal deformations by LVDTs, and temperature by thermocouple) was logged automatically by a data logger at 10 minute intervals.
Fig. 3. Shrinkage mold before placing and the set up of holding the gage plug in freshly placed
concrete to prevent the horizontal inclination of gauge plug and the friction between the gauge plug
and the mold walls
2.4. Measurement of Relative Humidity in concrete specimen at different depths
The small size of the Sensirion [7] sensor that can be embedded in concrete were used for measurement of internal humidity, also can obtain the internal temperature of concrete. The accuracy of relative humidity and temperatures measurements are 2% and 0.50C, respectively.
The sensor packaging is one of the key factors to achieve reliable and accurate results. As shown in Fig. 4, it can be observed that small size of the sensor allows it to be easily enclosed in a small circle tube. A Gore-Tex fabric is fixed at the top of this tube so that it helps to prevent water from entering the tube while allows vapor to pass, thus allowing the RH and temperature in the cavity of the tube to equilibrate with the surrounding concrete. Epoxy glue seal and rubber plug have advantages in preventing liquid moisture from entering the wires’ ends and the inside tube. The size of sensor is relatively small with average length of only 50 mm.
Fig. 4. Humidity/Temperature Sensor
The system for collecting data using this type of humidity sensor has been developed at UIUC and illustrated in many published papers of Z.C. Grasley and coworkers [8-10]. Fig. 5 shows that system in which packaged sensors are connected with multiplexer (Fig.6). Data is transmitted digitally from the sensors to multiplexer, and then collected by personal computer through a serial connection using Lab View Program.
RH sensors after packaging were located at the center line paralleled with the longitudinal side of each specimen in three depths of 10mm, 30 mm, 50 mm from the exposed surface, as shown in Fig.7
Fig. 5. System for collecting RH data
Small tube Gore-Tex fabric
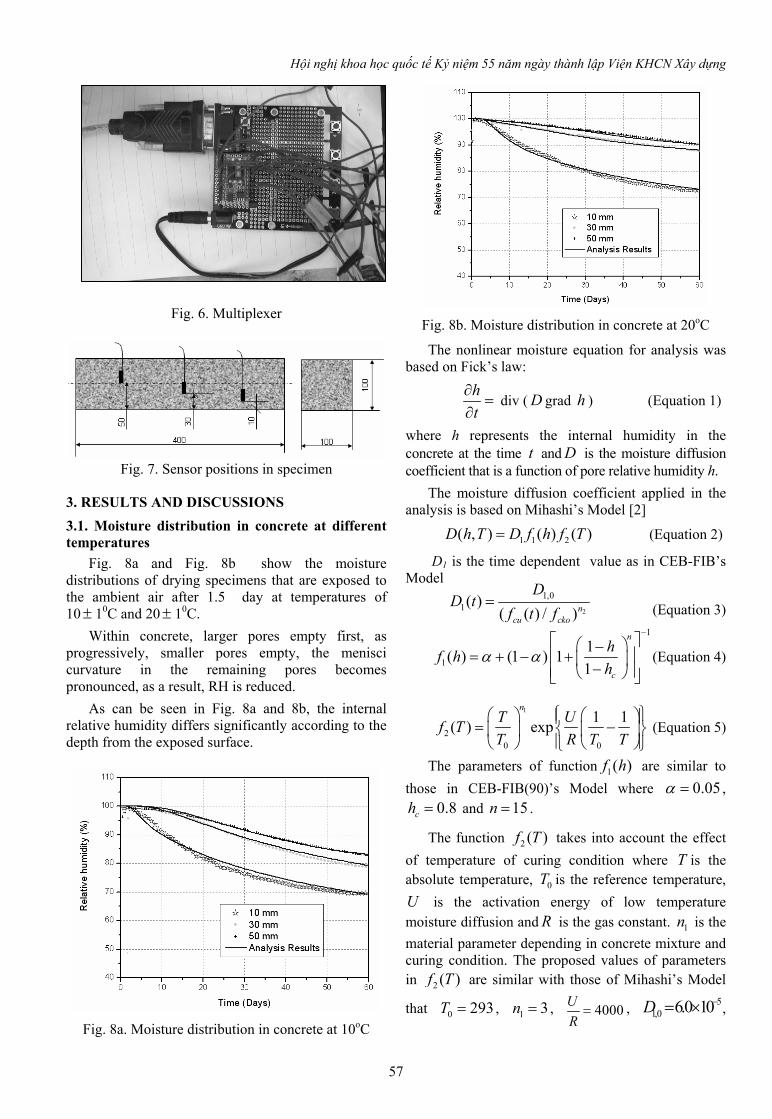
Hội nghị khoa học quốc tế Kỷ niệm 55 năm ngày thành lập Viện KHCN Xây dựng
57
Fig. 6. Multiplexer
Fig. 7. Sensor positions in specimen
3. RESULTS AND DISCUSSIONS
3.1. Moisture distribution in concrete at different temperatures
Fig. 8a and Fig. 8b show the moisture distributions of drying specimens that are exposed to the ambient air after 1.5 day at temperatures of 10 10C and 20 10C.
Within concrete, larger pores empty first, as progressively, smaller pores empty, the menisci curvature in the remaining pores becomes pronounced, as a result, RH is reduced.
As can be seen in Fig. 8a and 8b, the internal relative humidity differs significantly according to the depth from the exposed surface.
Fig. 8a. Moisture distribution in concrete at 10oC
Fig. 8b. Moisture distribution in concrete at 20oC
The nonlinear moisture equation for analysis was based on Fick’s law:
h
t
div ( D grad h ) (Equation 1)
where h represents the internal humidity in the concrete at the time t and D is the moisture diffusion coefficient that is a function of pore relative humidity h.
The moisture diffusion coefficient applied in the analysis is based on Mihashi’s Model [2]
1 1 2( , ) ( ) ( )D h T D f h f T (Equation 2)
D1 is the time dependent value as in CEB-FIB’s Model
(Equation 3)
1
1
1( ) (1 ) 1
1
n
c
hf h
h
(Equation 4)
1
20 0
1 1( ) exp
nT U
f TT R T T
(Equation 5)
The parameters of function 1( )f h are similar to
those in CEB-FIB(90)’s Model where 0.05 , 0.8ch and 15n .
The function 2 ( )f T takes into account the effect
of temperature of curing condition where T is the absolute temperature, 0T is the reference temperature,
U is the activation energy of low temperature moisture diffusion and R is the gas constant. 1n is the
material parameter depending in concrete mixture and curing condition. The proposed values of parameters in 2 ( )f T are similar with those of Mihashi’s Model
that 0 293T , 1 3n , 4000U
R ,
51,0 6.0 10D ,
2
1,01( )
( ( ) / )ncu cko
DD t
f t f
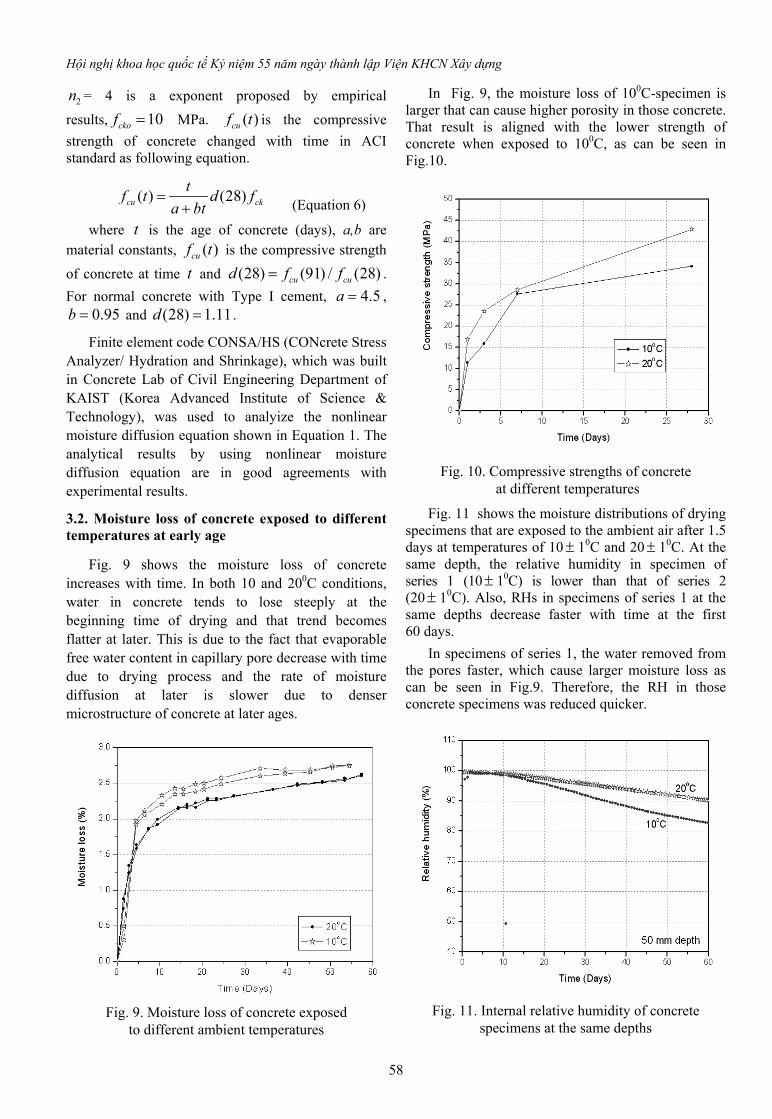
Hội nghị khoa học quốc tế Kỷ niệm 55 năm ngày thành lập Viện KHCN Xây dựng
58
2n = 4 is a exponent proposed by empirical
results, 10ckof MPa. ( )cuf t is the compressive
strength of concrete changed with time in ACI standard as following equation.
(Equation 6)
where t is the age of concrete (days), a,b are material constants, ( )cuf t is the compressive strength
of concrete at time t and (28) (91) / (28)cu cud f f .
For normal concrete with Type I cement, 4.5a , 0.95b and (28) 1.11d .
Finite element code CONSA/HS (CONcrete Stress Analyzer/ Hydration and Shrinkage), which was built in Concrete Lab of Civil Engineering Department of KAIST (Korea Advanced Institute of Science & Technology), was used to analyize the nonlinear moisture diffusion equation shown in Equation 1. The analytical results by using nonlinear moisture diffusion equation are in good agreements with experimental results.
3.2. Moisture loss of concrete exposed to different temperatures at early age
Fig. 9 shows the moisture loss of concrete increases with time. In both 10 and 200C conditions, water in concrete tends to lose steeply at the beginning time of drying and that trend becomes flatter at later. This is due to the fact that evaporable free water content in capillary pore decrease with time due to drying process and the rate of moisture diffusion at later is slower due to denser microstructure of concrete at later ages.
Fig. 9. Moisture loss of concrete exposed to different ambient temperatures
In Fig. 9, the moisture loss of 100C-specimen is larger that can cause higher porosity in those concrete. That result is aligned with the lower strength of concrete when exposed to 100C, as can be seen in Fig.10.
Fig. 10. Compressive strengths of concrete at different temperatures
Fig. 11 shows the moisture distributions of drying specimens that are exposed to the ambient air after 1.5 days at temperatures of 10 10C and 20 10C. At the same depth, the relative humidity in specimen of series 1 (10 10C) is lower than that of series 2 (20 10C). Also, RHs in specimens of series 1 at the same depths decrease faster with time at the first 60 days.
In specimens of series 1, the water removed from the pores faster, which cause larger moisture loss as can be seen in Fig.9. Therefore, the RH in those concrete specimens was reduced quicker.
Fig. 11. Internal relative humidity of concrete specimens at the same depths
( ) (28)cu ck
tf t d f
a bt
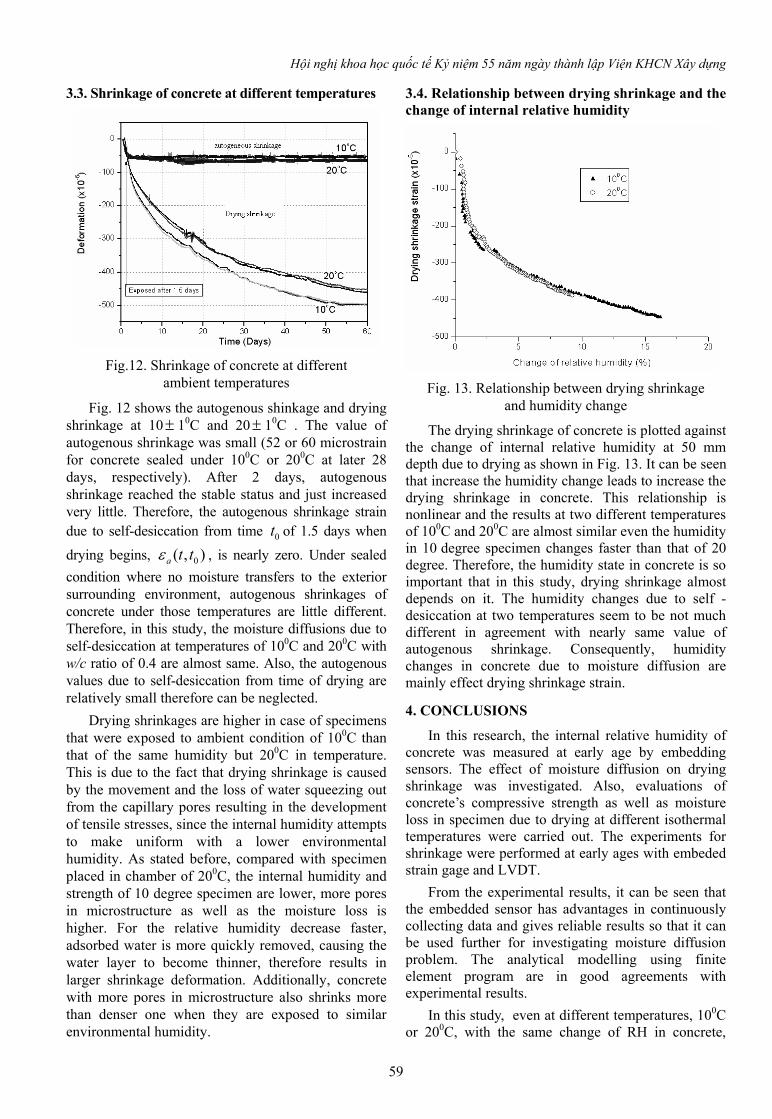
Hội nghị khoa học quốc tế Kỷ niệm 55 năm ngày thành lập Viện KHCN Xây dựng
59
3.3. Shrinkage of concrete at different temperatures
Fig.12. Shrinkage of concrete at different
ambient temperatures
Fig. 12 shows the autogenous shinkage and drying shrinkage at 10 10C and 20 10C . The value of autogenous shrinkage was small (52 or 60 microstrain for concrete sealed under 100C or 200C at later 28 days, respectively). After 2 days, autogenous shrinkage reached the stable status and just increased very little. Therefore, the autogenous shrinkage strain due to self-desiccation from time 0t of 1.5 days when
drying begins, 0( , )a t t , is nearly zero. Under sealed
condition where no moisture transfers to the exterior surrounding environment, autogenous shrinkages of concrete under those temperatures are little different. Therefore, in this study, the moisture diffusions due to self-desiccation at temperatures of 100C and 200C with w/c ratio of 0.4 are almost same. Also, the autogenous values due to self-desiccation from time of drying are relatively small therefore can be neglected.
Drying shrinkages are higher in case of specimens that were exposed to ambient condition of 100C than that of the same humidity but 200C in temperature. This is due to the fact that drying shrinkage is caused by the movement and the loss of water squeezing out from the capillary pores resulting in the development of tensile stresses, since the internal humidity attempts to make uniform with a lower environmental humidity. As stated before, compared with specimen placed in chamber of 200C, the internal humidity and strength of 10 degree specimen are lower, more pores in microstructure as well as the moisture loss is higher. For the relative humidity decrease faster, adsorbed water is more quickly removed, causing the water layer to become thinner, therefore results in larger shrinkage deformation. Additionally, concrete with more pores in microstructure also shrinks more than denser one when they are exposed to similar environmental humidity.
3.4. Relationship between drying shrinkage and the change of internal relative humidity
Fig. 13. Relationship between drying shrinkage and humidity change
The drying shrinkage of concrete is plotted against the change of internal relative humidity at 50 mm depth due to drying as shown in Fig. 13. It can be seen that increase the humidity change leads to increase the drying shrinkage in concrete. This relationship is nonlinear and the results at two different temperatures of 100C and 200C are almost similar even the humidity in 10 degree specimen changes faster than that of 20 degree. Therefore, the humidity state in concrete is so important that in this study, drying shrinkage almost depends on it. The humidity changes due to self - desiccation at two temperatures seem to be not much different in agreement with nearly same value of autogenous shrinkage. Consequently, humidity changes in concrete due to moisture diffusion are mainly effect drying shrinkage strain.
4. CONCLUSIONS
In this research, the internal relative humidity of concrete was measured at early age by embedding sensors. The effect of moisture diffusion on drying shrinkage was investigated. Also, evaluations of concrete’s compressive strength as well as moisture loss in specimen due to drying at different isothermal temperatures were carried out. The experiments for shrinkage were performed at early ages with embeded strain gage and LVDT.
From the experimental results, it can be seen that the embedded sensor has advantages in continuously collecting data and gives reliable results so that it can be used further for investigating moisture diffusion problem. The analytical modelling using finite element program are in good agreements with experimental results.
In this study, even at different temperatures, 100C or 200C, with the same change of RH in concrete,
Hội nghị khoa học quốc tế Kỷ niệm 55 năm ngày thành lập Viện KHCN Xây dựng
60
drying shrinkage strains are similar. Drying shrinkage of the normal concrete in this experimental program is mostly influenced by moisture diffusion.
Compared with the 200C-specimens, the 100C-specimens have lower compressive strength, faster rate of moisture loss and moisture diffusion, as consequences, larger drying shrinkage strain occurs.
5. ACKNOWLEDGEMENTS
This work was supported by the Concrete Lab of Civil and Environmental Engineering Department of KAIST, advised by Professor Jin- Keun Kim.
https://www.researchgate.net/profile/Jin-Keun_Kim
6. REFERENCES
[1] Bazant, Z.P., Najjar, L.J., Nonlinear water diffusion in nonsaturated concrete. Matériaux et Constructions, Vol.5, No.25, 1972.
[2] Mihashi, H. and Numao, T., Influence of Curing Condition on Diffusion Process of Concrete at Elevated Temperatures. Proceeding of the Japan Concrete Institute, Vol.11, No.1, 1989, pp.229-234.
[3] Sakata, K., A study on Moisture Diffusion in Drying and Drying Shrinkage of Concrete. Cement and Concrete Research, Vol.13, 1983, pp.216-224.
[4] Bazant, Z.P. and Najjar, L.J., Drying of Concrete as a Nonlinear Diffusion Problem. Cement and Concrete Research, Vol.1, 1971, pp.461-473.
[5] Sakata, K. & Shimomura, T., Recent progress in research on and code evaluation of concrete creep and shrinkage in Japan. Journal of Advanced Concrete of Technology, 2004, pp.133-140.
[6] Muhammad Nasir Amin, Jeoung- Su Kim, Tran Thanh Dat and Jin-Keun Kim, Improving test methods to measure early age autogenous shrinkage in concrete based on air cooling. The IES Journal Part A: Civil & Structural Engineering, Vol. 3, No.4, November 2010, pp. 244-256
[7] Sensirion, Inc., Data sheet Humidity Sensor SHT1X/SHT7X. v2.04, Staefa, Switzerland, 2005.
[8] Grasley, Z.C., Internal Relative humidity, drying stress gradients and hygrothermal dilation of concrete. Materials and structures, Vol.39, No.9, 2006.
[9] Grasley, Z.C., Lange, D.A., D’Ambrosia, M.D., and Villalobos-Chapa, S., Relative Humidity in Concrete, what does it mean?. A contribution from ACI Committee 236, 2006.
[10] Grasley, Z.C., Lange, D.A., Thermal dilation and internal relative humidity of hardened cement paste. Materials and Structures, 2007, pp. 311-317.