Embed Size (px)
Citation preview
Trajnostna urbana infrastrukturaLjubljana – Pogled v leto 2050Raziskovalni projekt Mestne občine Ljubljana, Centra za energetsko učinkovitost Instituta Jožef Stefan in Siemensa
www.ljubljanapametnomesto.si
www.siemens.si
Založnik: Siemens d.o.o.Bratislavska 51000 Ljubljana
Za založnika: Martina Merslavič
Naročnik raziskaveSiemens d.o.o.
Izvedba raziskovalnega projekta:Center za energetsko učinkovitost inštituta Jožef Stefan
Koordinatorki projekta s strani naročnika: Nataša Jazbinšek Seršen, Oddelek za varstvo okolja Mestne občine LjubljanaMartina Merslavič, vodja korporativnega komuniciranja, Siemens d.o.o.
Besedilo: Martina Merslavič
Izvedbeno oblikovanje: Jan Jereb
Tisk: Tiskarna Pleško
Fotografije: B. Čeak, M. Lenardič, arhiv Mestne občine Ljubljana in Siemensa
Študija predstavlja informativni vir, ki lahko služi kot podlaga za sprejemanje odločitev. Vsi izračuni so opravljeni skrbno in z vsem strokovnim znanjem, vendar pa temeljijo na predpostavkah,
ki se lahko v prihodnosti spreminjajo. Zato avtorji in naročnik ne sprejemajo nikakršne odgovornosti za posledice odločitev, ukrepov ali aktivnosti, izvedenih na podlagi te študije.
Siemens d.o.o. Bratislavska 5 SI-1000 Ljubljana Slovenija
Tel: 01 4746 100
KazaloI. Vizija in strateški okvir 5
Unikatnost študije 6
Kontekst študije 7
Relevantnost študije 8
Metodologija 9
Povzetek ključnih ugotovitev 10
II. Vhodni podatki in predpostavke 13
Projekcija BDP do leta 2050 14
Projekcija cen energije do leta 2050 15
Delež MOL v rabi energije v Sloveniji 17
Struktura rabe energije in stroškov v stavbah v lasti MOL 18
Struktura rabe energije in stroškov v industriji 19
Rast števila prebivalcev in gospodinjstev 20
Stavbne površine javnega in storitvenega sektorja 21
Promet – poraba na prevoženi kilometer 22
III. Možnosti doseganja scenarijev 25
Industrija 26
Gospodinjstva 32
Javni in storitveni sektor 41
Promet 49
Oskrba s toploto 54
Oskrba s pitno vodo 55
IV. Ukrepi v MOL in javnih podjetjih 57
Ovire, priložnosti in ukrepi 58
Novi organizacijski model 59
4 Trajnostna urbana infrastruktura - Ljubljana – pogled v leto 2050
Trajnostna urbana infrastruktura - Ljubljana – pogled v leto 2050 5
I. Vizija in strateški okvir
Mesta so s svojim okoljskim vplivom zelo pomemben dejavnik klimatskih sprememb – pozitivnih in negativnih. Zaradi svoje ekonomske moči igrajo v državah odločilno vlogo v gospodarskem razvoju. Tako kot gospodarske organizacije tudi mesta nastopajo v močno globaliziranem konkurenčnem okolju, kjer si prizadevajo za rast in napredek z ustvarjanjem delovnih mest,
dobrih pogojev za bivanje in ponujanjem odličnih storitev posameznikom in organizacijam. Mestna uprava Ljubljane si prizadeva za trajnostno rast in za nenehno zviševanje kakovosti bivanja. Ne glede na časovni obseg svojega mandata želi že danes izvajati ukrepe, ki bodo prihodnjim generacijam omogočile primerno okolje za ustvarjanje in življenje.
6 Trajnostna urbana infrastruktura - Ljubljana – pogled v leto 2050
Unikatnost študije
Tovrstna študija v Sloveniji na ravni mesta še ni bila izdelana. Sorodni strateški dokumenti so namreč zastavljeni na krajši rok: do leta 2030 (Nacionalni energetski program) oziroma do leta 2020 (Lokalni energetski koncept).
Po naših informacijah ne obstaja veliko mest, ki bi izvajala podobne raziskovalno-analitske projekte. Ljubljana je torej v elitni družbi nekaj zahodnoevropskih prestolnic, ki so se odločile, da želijo že danes stopiti na pot okoljske trajnosti.
Izsledki sorodnih mednarodnih analitičnih projektov v Munchnu, Londonu, Dublinu in Berlinu namreč kažejo, da imajo mesta veliko potencialov pri izboljševanju svoje okoljske učinkovitosti – pri tem pa pozitivni učinki segajo tudi na področje ekonomike mesta, kakovosti življenja in s tem njihove mednarodne konkurenčnosti.
Vizija in strateški okvir
Trajnostna urbana infrastruktura - Ljubljana – pogled v leto 2050 7
Kontekst študije
Študija je nastala v sklopu projekta Ljubljana, pametno mesto, v katerem Mestna občina Ljubljana (MOL) v sodelovanju z družbo Siemens razvija, komunicira in promovira svoje projekte in dosežke na področju okoljske učinkovitosti.
Razvoj mesta je dolgoročen proces. Sedanja uprava MOL si prizadeva za dolgoročen, trajnostni razvoj mesta ne glede na časovne omejitve trenutnega mandata. Zato študija daje uvid v dejavnike, ki na ta razvoj lahko vplivajo. Projekcije so narejene do leta 2050.
Ljubljana ima visok delež v porabi energije in povzročanju emisij v Sloveniji. Samo z ukrepi mestne oblasti ni možno doseči ambicioznih okoljskih ciljev. Prehod v trajnostno odličnost prestolnice torej ne more biti zgolj vprašanje mesta, pač pa je nacionalno vprašanje, pri reševanju katerega mora aktivno sodelovati država, organizacije in posamezniki. Investicije v tehnologije in
infrastrukturo, ki bodo omogočile pot v trajnostno odlično družbo, so visoke, zato mora obstajati konsenz med mestnimi in nacionalnimi strukturami, organizacijami in posamezniki. Študija daje izhodišča za dialog, ki lahko do takšnega konsenza pripelje. Ponuja ukrepe, ki lahko vodijo k doseganju ciljev.
Mestna uprava danske prestolnice Kopenhagen je vzpostavila načrt okoljske učinkovitosti in trajnostnega razvoja že leta 1970, ko so zaradi naftne krize želeli zmanjšati energetsko odvisnost od nafte. Zastavili so okoljske smernice, ki jim sistematično sledijo že desetletja, in se jim danes obrestujejo. Študija daje izhodišča za postavljanje dolgoročnih okoljskih politik na ravni mesta. S študijo mestna uprava dokazuje, da je naravnana dolgoročno, strateško in ciljno, predvsem pa, da je prepoznala prihodnje izzive in jih naslovila že danes, čeprav morda ne bo nosila odgovornosti za soočanje z njimi.
Vizija in strateški okvir
8 Trajnostna urbana infrastruktura - Ljubljana – pogled v leto 2050
Relevantnost študije
Energija je visok strošek v proračunu katerekoli organizacije. Prihranek energije je pomemben okoljski cilj, a hkrati tudi izjemna poslovna priložnost.
V Sloveniji je leta 2008 letni strošek skupne rabe primarne energije znašal 1,95 milijard EUR (5,2% bruto domačega proizvoda).
• Okrog 80% energije se je porabilo v mestnih naseljih in v mestih, kar pomeni da so mestna naselja in mesta odgovorna za 1,6 milijard EUR stroškov za energijo.
• Z zmanjšanjem rabe energije za 20% na ravni mestnih naselij in mest bi lahko prihranili okrog 312 milijonov EUR/letno oziroma skoraj 1% BDP iz leta 2008.
Tudi na ravni mesta Ljubljana je poraba energije bistvena postavka v ekonomiki delovanja:
• Strošek za energijo v objektih MOL je v letu 2008 znašal 5,9 milijona EUR (približno 2% mestnega proračuna 2008).
• Z uvajanjem sistematičnega upravljanja z energijo bi lahko stroške za energijo znižali na letni ravni za 708.000 EUR (znesek je primerljiv s proračunsko postavko »transferi nezaposlenim« v letu 2008).
• Investicija, potrebna za doseganje teh prihrankov, je ocenjena na 4,15 milijona EUR, njena vračilna doba je 5,5 let.
• S poslovnim modelom energetskega pogodbeništva je možno doseči, da MOL v doseganje prihrankov ni potrebno neposredno vlagati, po 6 letih pa lahko “obdrži” dosežene energetske prihranke (življenjski cikel opreme, predvidene za doseganje prihrankov, je praviloma daljši od 10 let).
Vizija in strateški okvir
Trajnostna urbana infrastruktura - Ljubljana – pogled v leto 2050 9
Metodologija
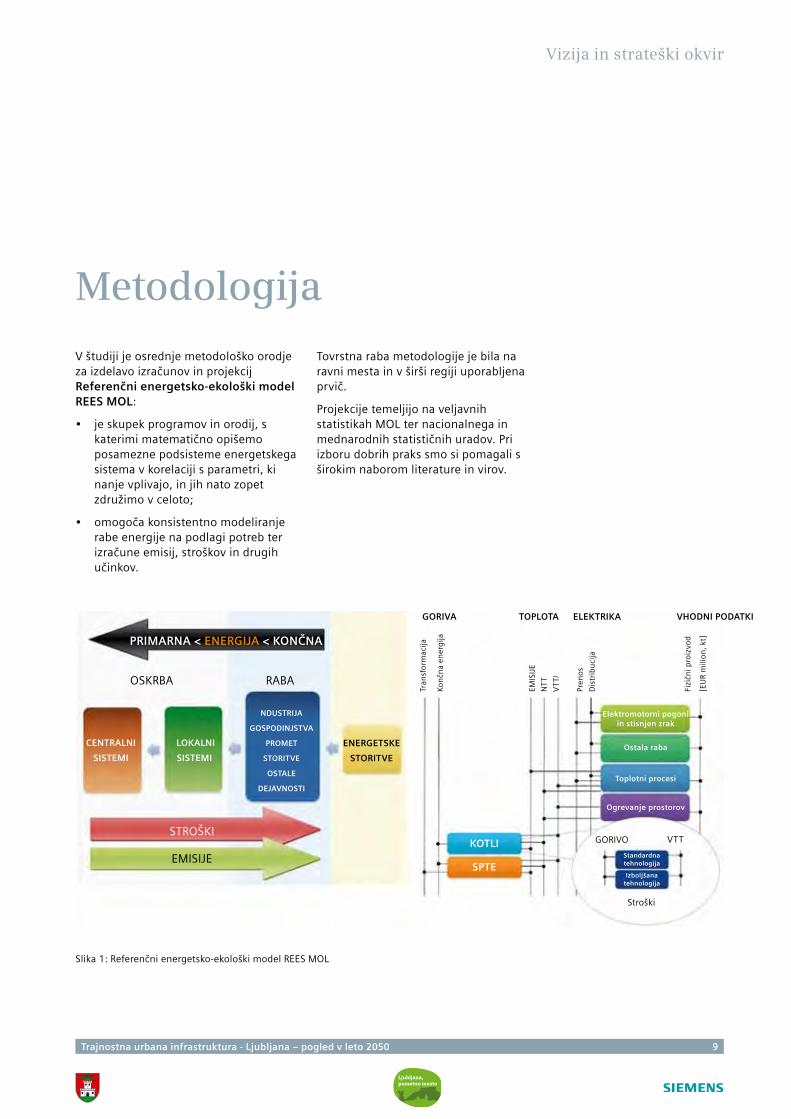
V študiji je osrednje metodološko orodje za izdelavo izračunov in projekcij Referenčni energetsko-ekološki model REES MOL:
• je skupek programov in orodij, s katerimi matematično opišemo posamezne podsisteme energetskega sistema v korelaciji s parametri, ki nanje vplivajo, in jih nato zopet združimo v celoto;
• omogoča konsistentno modeliranje rabe energije na podlagi potreb ter izračune emisij, stroškov in drugih učinkov.
Tovrstna raba metodologije je bila na ravni mesta in v širši regiji uporabljena prvič.
Projekcije temeljijo na veljavnih statistikah MOL ter nacionalnega in mednarodnih statističnih uradov. Pri izboru dobrih praks smo si pomagali s širokim naborom literature in virov.
Vizija in strateški okvir
Slika 1: Referenčni energetsko-ekološki model REES MOL
GORIVA TOPLOTA ELEKTRIKA VHODNI PODATKI
PRIMARNA < ENERGIJA < KONČNA
OSKRBA RABA
STROŠKI
EMISIJE
Tran
sfo
rmac
ija
Kon
čna
ener
gija
EMIS
IJE
NT
T
VT
T/
Pren
os
Dis
trib
uci
ja
Fizi
čni p
roiz
vod
[EU
R m
ilio
n, k
t]
Elektromotorni pogoni in stisnjen zrak
Ostala raba
Toplotni procesi
Ogrevanje prostorov
KOTLI
SPTE
GORIVO VTT
Standardna tehnologija
Izboljšanatehnologija
Stroški
CENTRALNI
SISTEMI
LOKALNI
SISTEMI
NDUSTRIJA
GOSPODINJSTVA
PROMET
STORITVE
OSTALE
DEJAVNOSTI
ENERGETSKE
STORITVE
10 Trajnostna urbana infrastruktura - Ljubljana – pogled v leto 2050
Povzetek ključnih ugotovitev
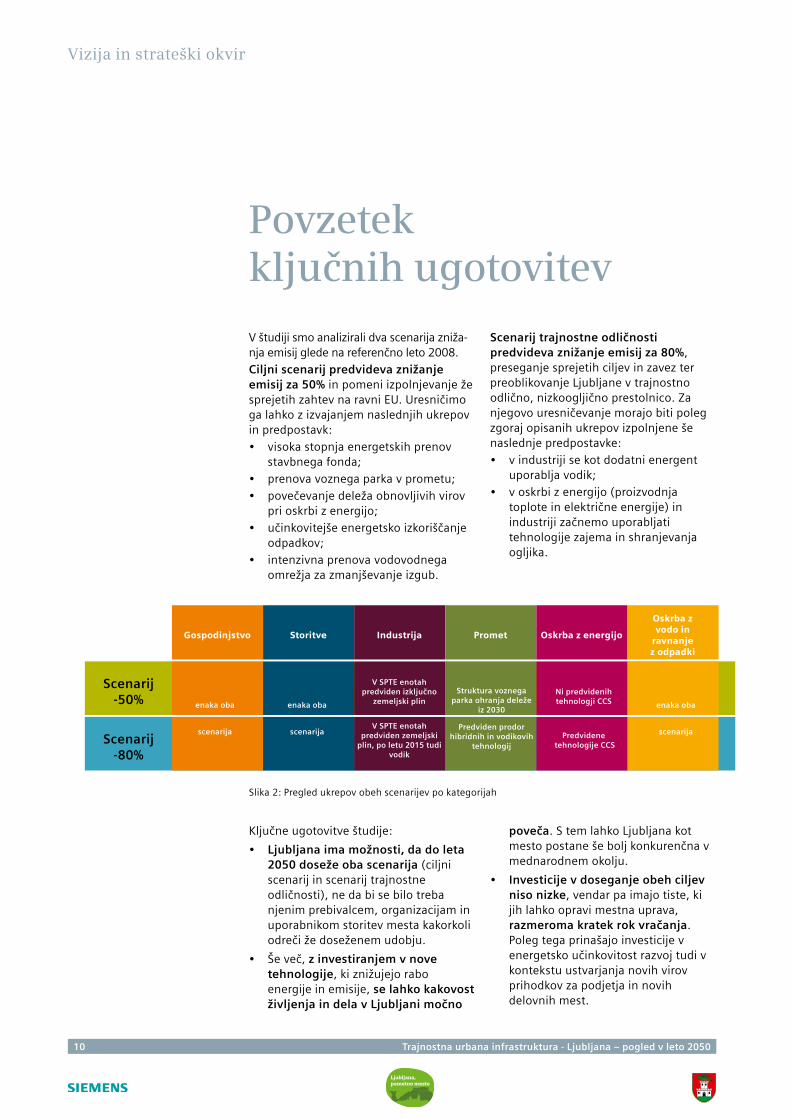
V študiji smo analizirali dva scenarija zniža-nja emisij glede na referenčno leto 2008. Ciljni scenarij predvideva znižanje emisij za 50% in pomeni izpolnjevanje že sprejetih zahtev na ravni EU. Uresničimo ga lahko z izvajanjem naslednjih ukrepov in predpostavk: • visoka stopnja energetskih prenov
stavbnega fonda;• prenova voznega parka v prometu;• povečevanje deleža obnovljivih virov
pri oskrbi z energijo; • učinkovitejše energetsko izkoriščanje
odpadkov;• intenzivna prenova vodovodnega
omrežja za zmanjševanje izgub.
Scenarij trajnostne odličnosti predvideva znižanje emisij za 80%, preseganje sprejetih ciljev in zavez ter preoblikovanje Ljubljane v trajnostno odlično, nizkoogljično prestolnico. Za njegovo uresničevanje morajo biti poleg zgoraj opisanih ukrepov izpolnjene še naslednje predpostavke: • v industriji se kot dodatni energent
uporablja vodik;• v oskrbi z energijo (proizvodnja
toplote in električne energije) in industriji začnemo uporabljati tehnologije zajema in shranjevanja ogljika.
Vizija in strateški okvir
Slika 2: Pregled ukrepov obeh scenarijev po kategorijah
Ključne ugotovitve študije:
• Ljubljana ima možnosti, da do leta 2050 doseže oba scenarija (ciljni scenarij in scenarij trajnostne odličnosti), ne da bi se bilo treba njenim prebivalcem, organizacijam in uporabnikom storitev mesta kakorkoli odreči že doseženem udobju.
• Še več, z investiranjem v nove tehnologije, ki znižujejo rabo energije in emisije, se lahko kakovost življenja in dela v Ljubljani močno
poveča. S tem lahko Ljubljana kot mesto postane še bolj konkurenčna v mednarodnem okolju.
• Investicije v doseganje obeh ciljev niso nizke, vendar pa imajo tiste, ki jih lahko opravi mestna uprava, razmeroma kratek rok vračanja. Poleg tega prinašajo investicije v energetsko učinkovitost razvoj tudi v kontekstu ustvarjanja novih virov prihodkov za podjetja in novih delovnih mest.
Gospodinjstvo Storitve Industrija Promet Oskrba z energijo
Oskrba z vodo in
ravnanje z odpadki
Scenarij -50%
Scenarij -80%
enaka oba
scenarija
enaka oba
scenarija
V SPTE enotah predviden izključno
zemeljski plin
V SPTE enotah predviden zemeljski
plin, po letu 2015 tudi vodik
Struktura voznega parka ohranja deleže
iz 2030
Predviden prodor hibridnih in vodikovih
tehnologij
Ni predvidenih tehnologji CCS
Predvidene tehnologije CCS
enaka oba
scenarija
Trajnostna urbana infrastruktura - Ljubljana – pogled v leto 2050 11
Vizija in strateški okvir
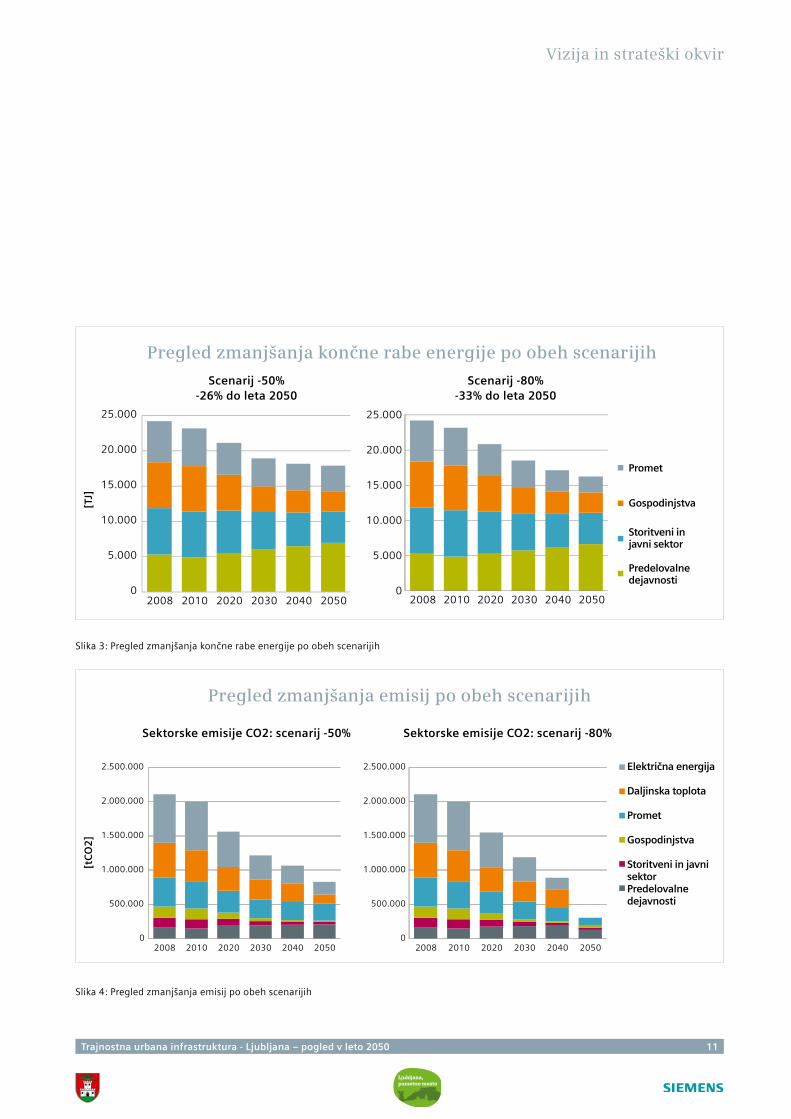
Slika 3: Pregled zmanjšanja končne rabe energije po obeh scenarijih
Slika 4: Pregled zmanjšanja emisij po obeh scenarijih
Pregled zmanjšanja končne rabe energije po obeh scenarijih
[TJ
]
Promet
0
5.000
10.000
15.000
20.000
25.000
2008 2010 2020 2030 2040 20500
5.000
10.000
15.000
20.000
25.000
2008 2010 2020 2030 2040 2050
Scenarij -50%-26% do leta 2050
Scenarij -80%-33% do leta 2050
Gospodinjstva
Storitveni in javni sektor
Predelovalne dejavnosti
Pregled zmanjšanja emisij po obeh scenarijih
Sektorske emisije CO2: scenarij -50% Sektorske emisije CO2: scenarij -80%
Električna energija
Daljinska toplota
Promet
Gospodinjstva
Storitveni in javni sektorPredelovalne dejavnosti
0
500.000
1.000.000
1.500.000
2.000.000
2.500.000
2008 2010 2020 2030 2040 20500
500.000
1.000.000
1.500.000
2.000.000
2.500.000
2008 2010 2020 2030 2040 2050
[tC
O2
]

12 Trajnostna urbana infrastruktura - Ljubljana – pogled v leto 2050
Trajnostna urbana infrastruktura - Ljubljana – pogled v leto 2050 13
II. Vhodni podatki in predpostavke
V času močno spremenjenih in zaostrenih gospodarskih razmer so napovedi za desetletja v prihodnost lahko nehvaležne. Vseeno pa je bolje izkoristiti podatkovni in metodološki instrumentarij, ki nam je trenutno na voljo, kot pa pred prihodnostjo zaradi njene nepredvidljivosti povsem zatisniti oči. Projekcije v nadaljevanju tega gradiva so
izdelane na podlagi veljavnih statistik slovenskega in mednarodnih statističnih uradov ter optimističnega predvidevanja, da se bo ekonomska kriza spreobrnila v konjunkturo. Vključujejo znana predvidevanja o pričakovanih tehnoloških spremembah in opisujejo, kakšni pogoji so potrebni, da Ljubljana doseže ambiciozne okoljske cilje.

14 Trajnostna urbana infrastruktura - Ljubljana – pogled v leto 2050
Projekcija BDP do leta 2050
V izračunih je do leta 2030 upoštevan ciljni scenarij gospodarskega razvoja, ki so ga za predlog Nacionalnega energetskega programa pripravili strokovnjaki Urada Republike Slovenije za makroekonomske analize in razvoj (UMAR). Projekcija gospodarskega razvoja do leta 2050 temelji na predpostavki ohranjanja absolutne vrednosti rasti fizičnega proizvoda, ki je bila predvidena med letoma 2025 in 2030. Po spodbudnem začetku v letu 2007, ko je Slovenija dosegla rekordno gospodarsko
rast, se je zaradi finančne krize in recesije na ključnih izvoznih trgih soočila z gospodarsko krizo. Gospodarska rast se je že v letu 2008 močno upočasnila, v letu 2009 pa je bila močno negativna (-8,1%) in bistveno nižja od pričakovanj. V skladu z izdelanimi projekcijami gospodarske rasti povprečna letna rast BDP-a v ciljnem scenariju za obdobje od 2010 do 2050 znaša 2,6%. Zaradi razmer na globalnih trgih in v regiji so napovedi gospodarskih gibanj v tem trenutku sicer izjemno negotove.
Vhodni podatki in predpostavke
Slika 5: Projekcija indeksa rasti BDP Slovenije do leta 2050 (BDP 2006 = 100)
Projekcija indeksa rasti BDP Slovenije do leta 2050 (BDP 2006 = 100)
Ind
eks
ras
ti B
DP-
a (B
DP
20
06
= 1
00
)
0
50
100
150
200
250
300
350
2006 2011 2016 2021 2026 2031 2036 2041 2046
BDP ZGORNJI SCENARIJ
BDP CILJNI SCENARIJ
BDP SPODNJI SCENARIJ
Trajnostna urbana infrastruktura - Ljubljana – pogled v leto 2050 15
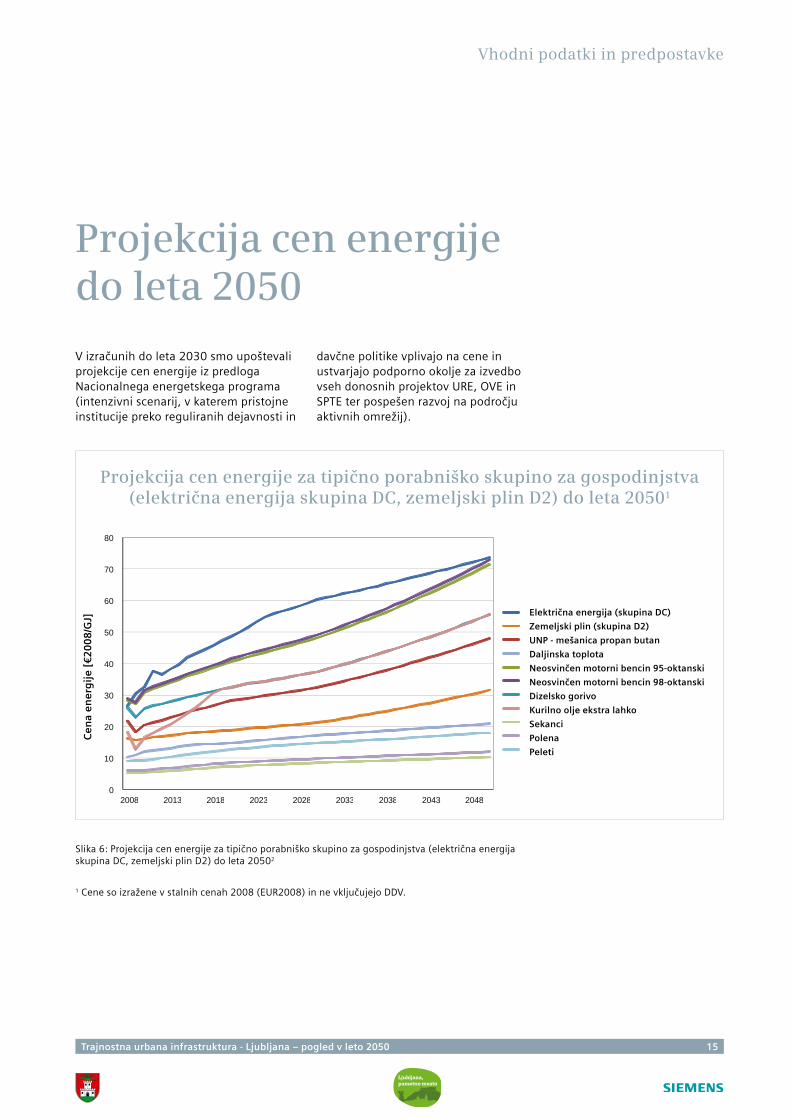
Slika 6: Projekcija cen energije za tipično porabniško skupino za gospodinjstva (električna energija skupina DC, zemeljski plin D2) do leta 20502
Vhodni podatki in predpostavke
Projekcija cen energije do leta 2050
V izračunih do leta 2030 smo upoštevali projekcije cen energije iz predloga Nacionalnega energetskega programa (intenzivni scenarij, v katerem pristojne institucije preko reguliranih dejavnosti in
davčne politike vplivajo na cene in ustvarjajo podporno okolje za izvedbo vseh donosnih projektov URE, OVE in SPTE ter pospešen razvoj na področju aktivnih omrežij).
1 Cene so izražene v stalnih cenah 2008 (EUR2008) in ne vključujejo DDV.
Projekcija cen energije za tipično porabniško skupino za gospodinjstva (električna energija skupina DC, zemeljski plin D2) do leta 20501
Ce
na
en
erg
ije
[€
20
08
/GJ]
Električna energija (skupina DC)
Zemeljski plin (skupina D2)
UNP - mešanica propan butan
Daljinska toplota
Neosvinčen motorni bencin 95-oktanski
Neosvinčen motorni bencin 98-oktanski
Dizelsko gorivo
Kurilno olje ekstra lahko
Sekanci
Polena
Peleti
0
10
20
30
40
50
60
70
80
2008 2013 2018 2023 2028 2033 2038 2043 2048
16 Trajnostna urbana infrastruktura - Ljubljana – pogled v leto 2050
0
10
20
30
40
50
60
70
80
2008 2013 2018 2023 2028 2033 2038 2043 2048
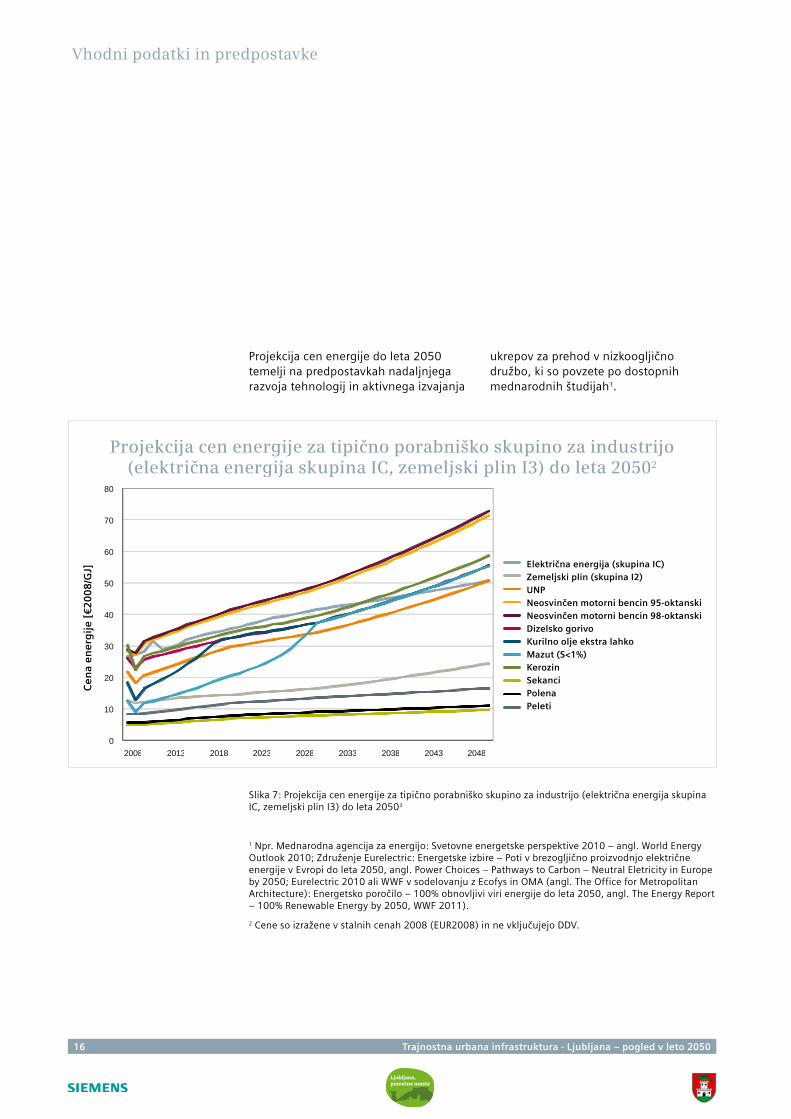
Slika 7: Projekcija cen energije za tipično porabniško skupino za industrijo (električna energija skupina IC, zemeljski plin I3) do leta 20503
1 Npr. Mednarodna agencija za energijo: Svetovne energetske perspektive 2010 – angl. World Energy Outlook 2010; Združenje Eurelectric: Energetske izbire – Poti v brezogljično proizvodnjo električne energije v Evropi do leta 2050, angl. Power Choices – Pathways to Carbon – Neutral Eletricity in Europe by 2050; Eurelectric 2010 ali WWF v sodelovanju z Ecofys in OMA (angl. The Office for Metropolitan Architecture): Energetsko poročilo – 100% obnovljivi viri energije do leta 2050, angl. The Energy Report – 100% Renewable Energy by 2050, WWF 2011).
2 Cene so izražene v stalnih cenah 2008 (EUR2008) in ne vključujejo DDV.
Električna energija (skupina IC)Zemeljski plin (skupina I2)UNPNeosvinčen motorni bencin 95-oktanskiNeosvinčen motorni bencin 98-oktanskiDizelsko gorivoKurilno olje ekstra lahkoMazut (S<1%)KerozinSekanciPolenaPeleti
Vhodni podatki in predpostavke
Projekcija cen energije za tipično porabniško skupino za industrijo (električna energija skupina IC, zemeljski plin I3) do leta 20502
Ce
na
en
erg
ije
[€
20
08
/GJ]
Projekcija cen energije do leta 2050 temelji na predpostavkah nadaljnjega razvoja tehnologij in aktivnega izvajanja
ukrepov za prehod v nizkoogljično družbo, ki so povzete po dostopnih mednarodnih študijah1.
Trajnostna urbana infrastruktura - Ljubljana – pogled v leto 2050 17
Delež MOL v rabi energije v Sloveniji
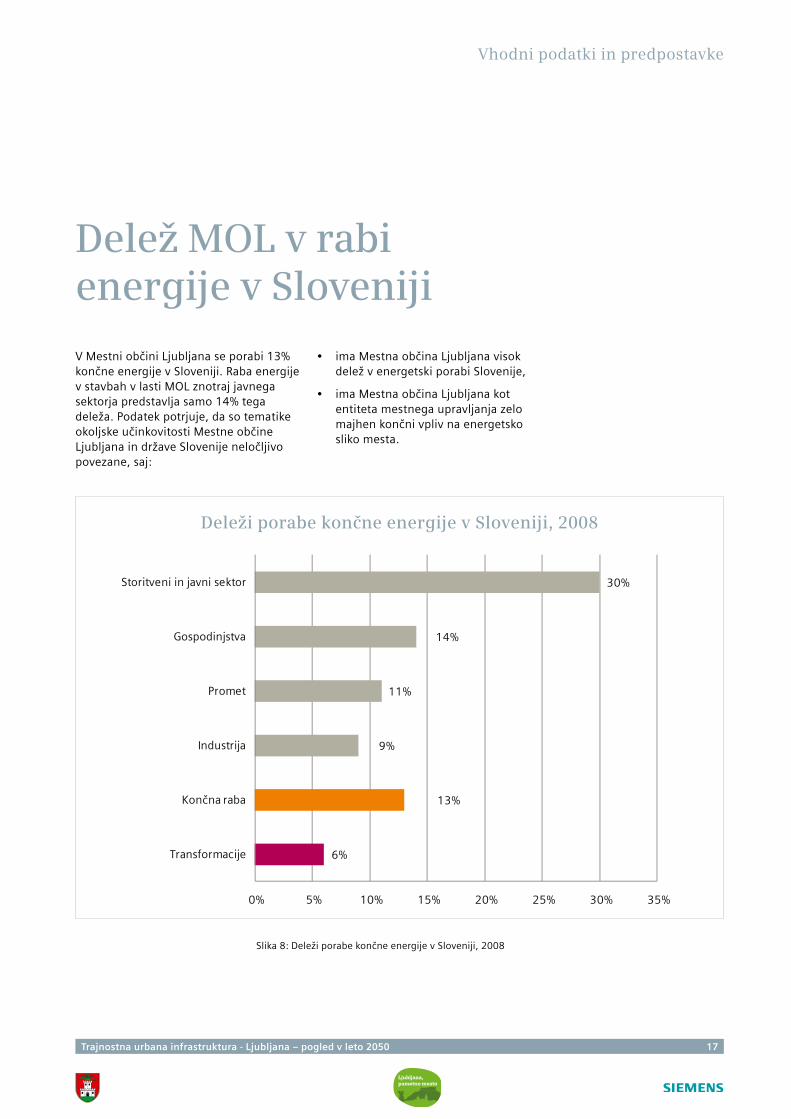
V Mestni občini Ljubljana se porabi 13% končne energije v Sloveniji. Raba energije v stavbah v lasti MOL znotraj javnega sektorja predstavlja samo 14% tega deleža. Podatek potrjuje, da so tematike okoljske učinkovitosti Mestne občine Ljubljana in države Slovenije neločljivo povezane, saj:
• ima Mestna občina Ljubljana visok delež v energetski porabi Slovenije,
• ima Mestna občina Ljubljana kot entiteta mestnega upravljanja zelo majhen končni vpliv na energetsko sliko mesta.
Slika 8: Deleži porabe končne energije v Sloveniji, 2008
Vhodni podatki in predpostavke
Deleži porabe končne energije v Sloveniji, 2008
6%
13%
9%
11%
14%
30%
0% 5% 10% 15% 20% 25% 30% 35%
Transformacije
Končna raba
Industrija
Promet
Gospodinjstva
Storitveni in javni sektor
18 Trajnostna urbana infrastruktura - Ljubljana – pogled v leto 2050
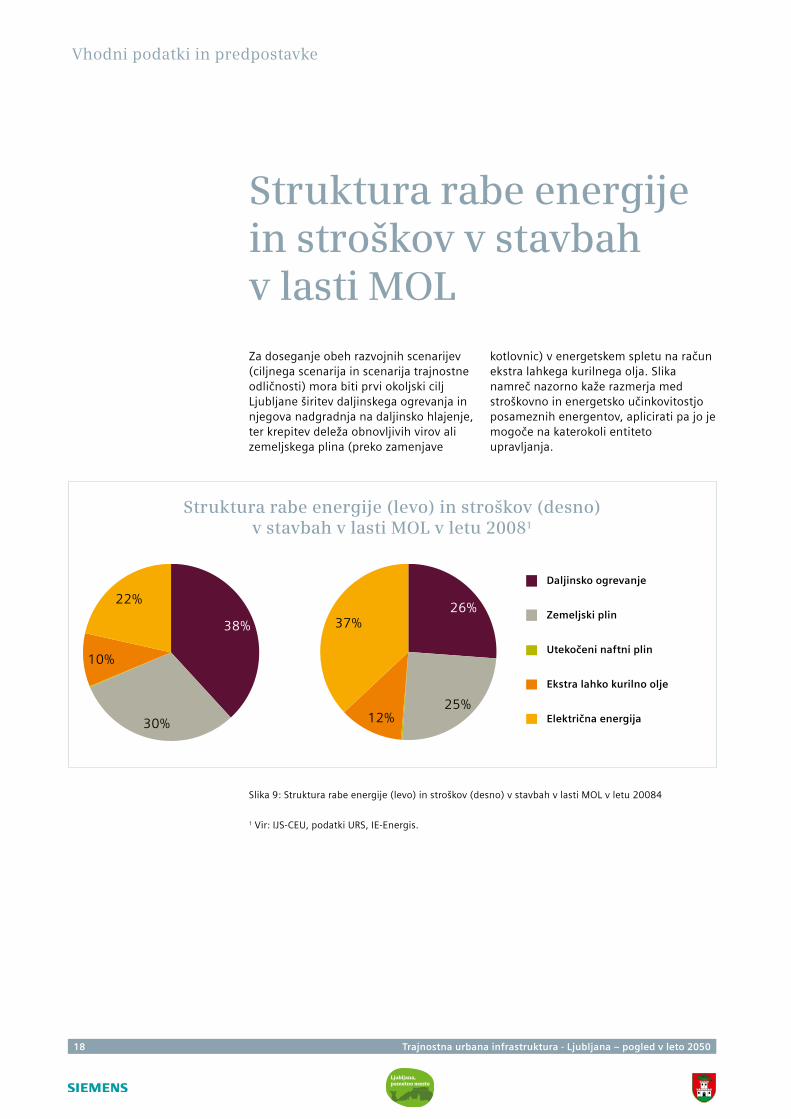
Slika 9: Struktura rabe energije (levo) in stroškov (desno) v stavbah v lasti MOL v letu 20084
Struktura rabe energije in stroškov v stavbah v lasti MOL
Za doseganje obeh razvojnih scenarijev (ciljnega scenarija in scenarija trajnostne odličnosti) mora biti prvi okoljski cilj Ljubljane širitev daljinskega ogrevanja in njegova nadgradnja na daljinsko hlajenje, ter krepitev deleža obnovljivih virov ali zemeljskega plina (preko zamenjave
kotlovnic) v energetskem spletu na račun ekstra lahkega kurilnega olja. Slika namreč nazorno kaže razmerja med stroškovno in energetsko učinkovitostjo posameznih energentov, aplicirati pa jo je mogoče na katerokoli entiteto upravljanja.
Vhodni podatki in predpostavke
1 Vir: IJS-CEU, podatki URS, IE-Energis.
Daljinsko ogrevanje
Zemeljski plin
Utekočeni naftni plin
Ekstra lahko kurilno olje
Električna energija
Struktura rabe energije (levo) in stroškov (desno) v stavbah v lasti MOL v letu 20081
38%
30%
10%
22%26%
25%12%
37%
Trajnostna urbana infrastruktura - Ljubljana – pogled v leto 2050 19
Vhodni podatki in predpostavke
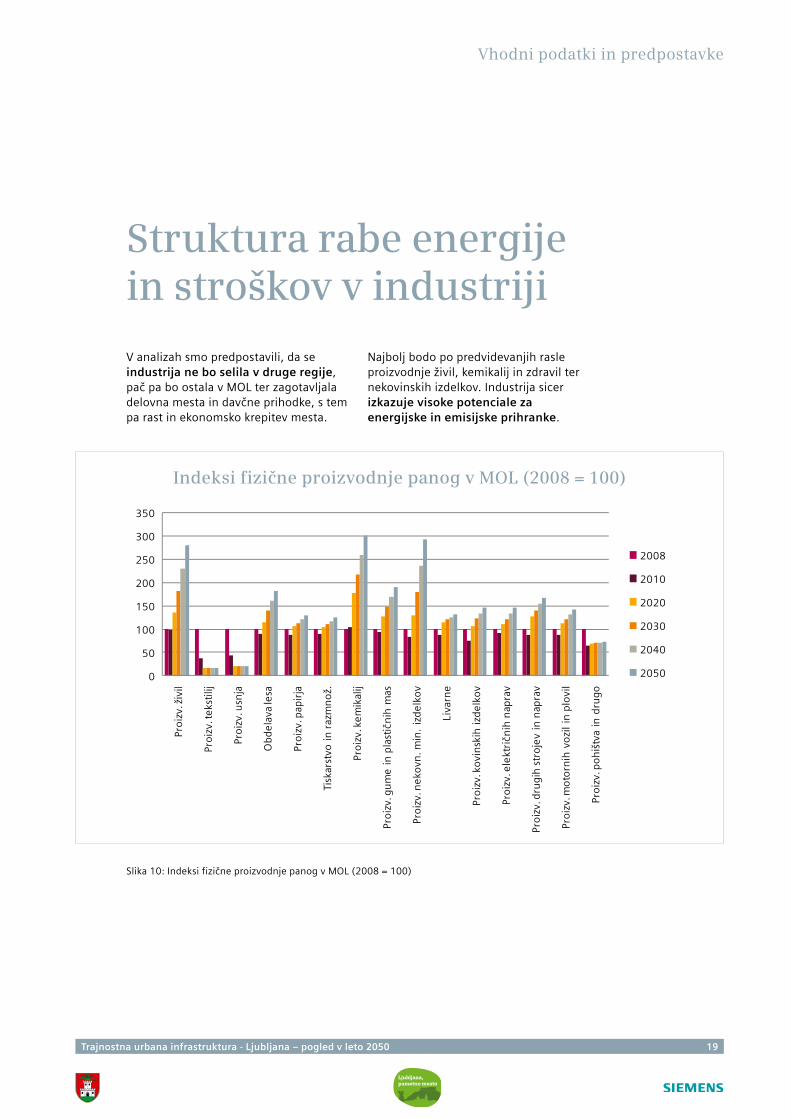
Struktura rabe energije in stroškov v industriji
V analizah smo predpostavili, da se industrija ne bo selila v druge regije, pač pa bo ostala v MOL ter zagotavljala delovna mesta in davčne prihodke, s tem pa rast in ekonomsko krepitev mesta.
Najbolj bodo po predvidevanjih rasle proizvodnje živil, kemikalij in zdravil ter nekovinskih izdelkov. Industrija sicer izkazuje visoke potenciale za energijske in emisijske prihranke.
Slika 10: Indeksi fizične proizvodnje panog v MOL (2008 = 100)
Indeksi fizične proizvodnje panog v MOL (2008 = 100)
0
50
100
150
200
250
300
350
Pro
izv.
živ
il
Pro
izv.
teks
tilij
Pro
izv.
usn
ja
Ob
del
ava
lesa
Pro
izv.
pap
irja
Tisk
arst
vo i
n r
azm
no
ž.
Pro
izv.
kem
ikal
ij
Pro
izv.
gu
me
in p
last
ičn
ih m
as
Pro
izv.
nek
ovn
. min
. iz
del
kov
Liva
rne
Pro
izv.
ko
vin
skih
izd
elko
v
Pro
izv.
ele
ktri
čnih
nap
rav
Pro
izv.
dru
gih
str
oje
v in
nap
rav
Pro
izv.
mo
torn
ih v
ozi
l in
plo
vil
Pro
izv.
po
hiš
tva
in d
rugo
2008
2010
2020
2030
2040
2050
20 Trajnostna urbana infrastruktura - Ljubljana – pogled v leto 2050
Indeksi rasti števila prebivalcev, gospodinjstev in članov gospodinjstev
Vhodni podatki in predpostavke
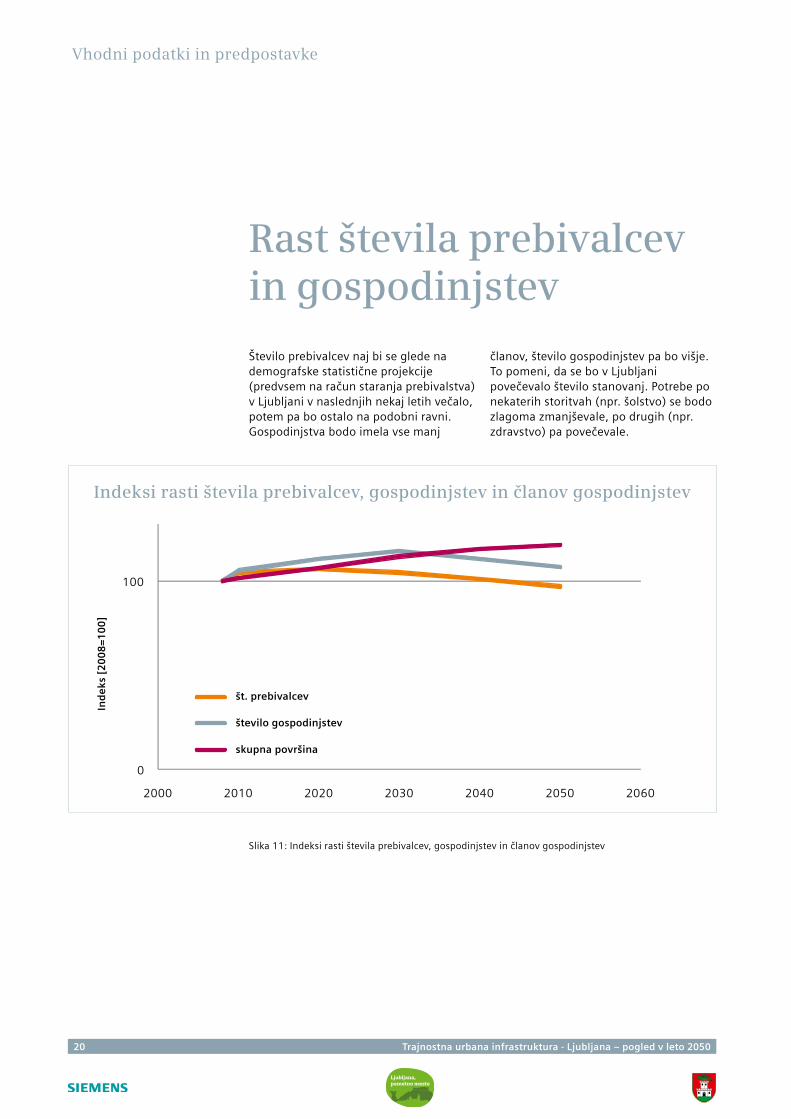
Rast števila prebivalcev in gospodinjstev
Število prebivalcev naj bi se glede na demografske statistične projekcije (predvsem na račun staranja prebivalstva) v Ljubljani v naslednjih nekaj letih večalo, potem pa bo ostalo na podobni ravni. Gospodinjstva bodo imela vse manj
članov, število gospodinjstev pa bo višje. To pomeni, da se bo v Ljubljani povečevalo število stanovanj. Potrebe po nekaterih storitvah (npr. šolstvo) se bodo zlagoma zmanjševale, po drugih (npr. zdravstvo) pa povečevale.
Slika 11: Indeksi rasti števila prebivalcev, gospodinjstev in članov gospodinjstev
0
100
2000 2010 2020 2030 2040 2050 2060
št. prebivalcev
število gospodinjstev
skupna površina
Ind
eks
[2
00
8=
10
0]
Trajnostna urbana infrastruktura - Ljubljana – pogled v leto 2050 21
Vhodni podatki in predpostavke
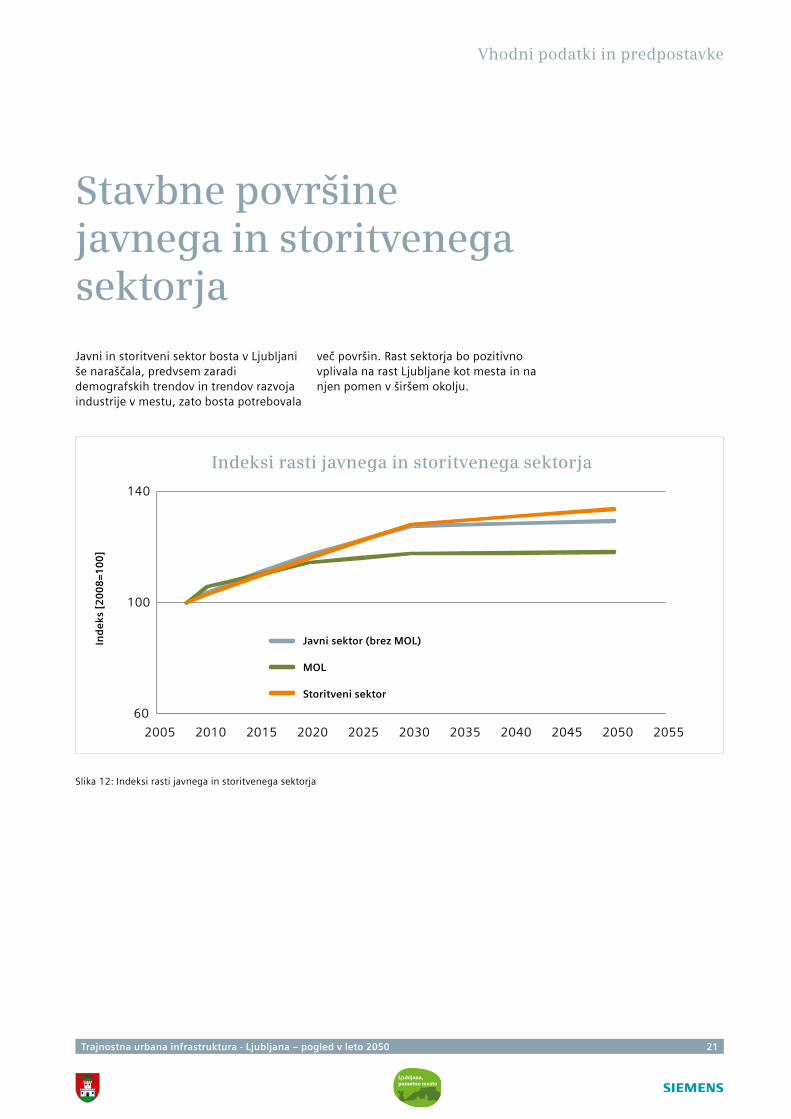
Stavbne površine javnega in storitvenega sektorja
Javni in storitveni sektor bosta v Ljubljani še naraščala, predvsem zaradi demografskih trendov in trendov razvoja industrije v mestu, zato bosta potrebovala
več površin. Rast sektorja bo pozitivno vplivala na rast Ljubljane kot mesta in na njen pomen v širšem okolju.
Slika 12: Indeksi rasti javnega in storitvenega sektorja
Indeksi rasti javnega in storitvenega sektorja
Ind
eks
[2
00
8=
10
0]
60
100
140
2005 2010 2015 2020 2025 2030 2035 2040 2045 2050 2055
Javni sektor (brez MOL)
MOL
Storitveni sektor
22 Trajnostna urbana infrastruktura - Ljubljana – pogled v leto 2050
0,000
0,500
1,000
1,500
2,000
2,500
3,000
2008 2010 2015 2020 2025 2030 2035 2040 2045 2050
Vhodni podatki in predpostavke
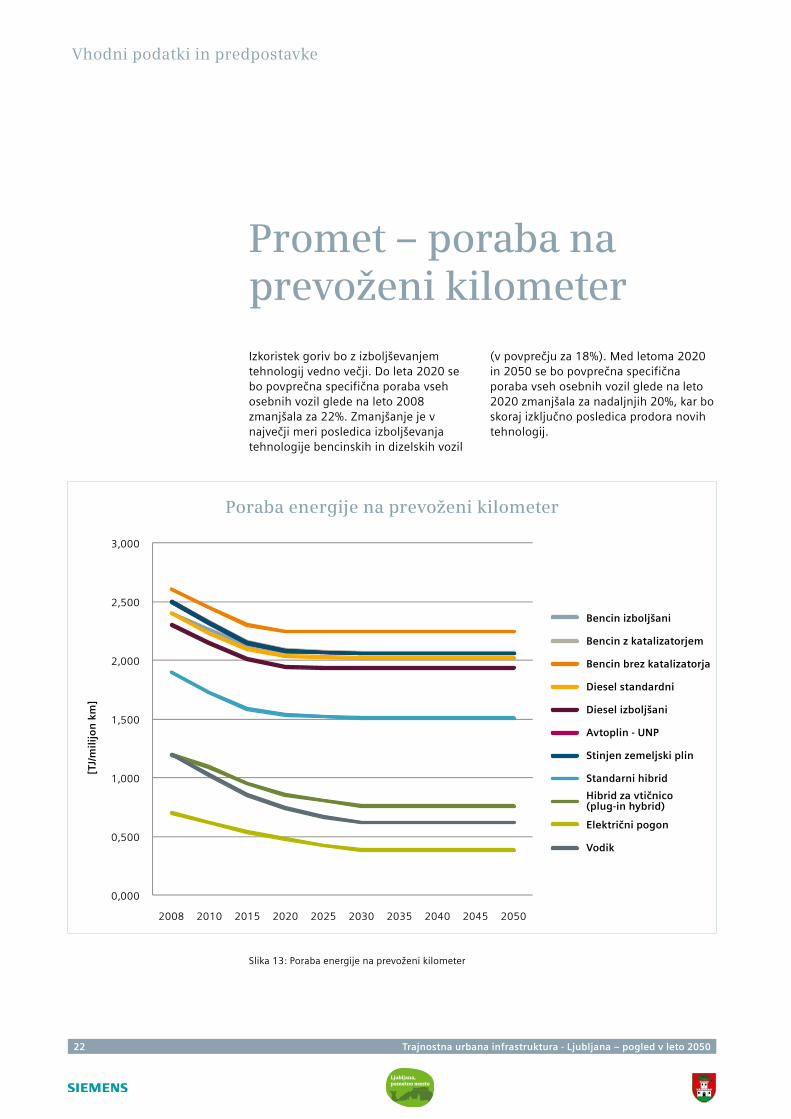
Promet – poraba na prevoženi kilometer
Izkoristek goriv bo z izboljševanjem tehnologij vedno večji. Do leta 2020 se bo povprečna specifična poraba vseh osebnih vozil glede na leto 2008 zmanjšala za 22%. Zmanjšanje je v največji meri posledica izboljševanja tehnologije bencinskih in dizelskih vozil
(v povprečju za 18%). Med letoma 2020 in 2050 se bo povprečna specifična poraba vseh osebnih vozil glede na leto 2020 zmanjšala za nadaljnjih 20%, kar bo skoraj izključno posledica prodora novih tehnologij.
Slika 13: Poraba energije na prevoženi kilometer
Poraba energije na prevoženi kilometer
[TJ/
mil
ijo
n k
m]
Bencin izboljšani
Bencin z katalizatorjem
Bencin brez katalizatorja
Diesel standardni
Diesel izboljšani
Avtoplin - UNP
Stinjen zemeljski plin
Standarni hibrid
Hibrid za vtičnico (plug-in hybrid)
Električni pogon
Vodik
Trajnostna urbana infrastruktura - Ljubljana – pogled v leto 2050 23

24 Trajnostna urbana infrastruktura - Ljubljana – pogled v leto 2050
Trajnostna urbana infrastruktura - Ljubljana – pogled v leto 2050 25
III. Možnosti doseganja scenarijev
V študiji smo analizirali dva scenarija: ciljni scenarij, ki predvideva zmanjšanje emisij za 50%, ter scenarij trajnostne odličnosti, po katerem bi Ljubljana do leta 2050 zmanjšala emisije za 80%. Največ pozornosti smo posvetili oskrbi z energijo v industriji, gospodinjstvih in javnem ter storitvenem sektorju,
podrobno smo analizirali tudi področje prometa. V tem poglavju opisujemo pogoje, potrebne za doseganje vsakega od scenarijev na različnih področjih, analiziramo potrebne ukrepe in tehnološke spremembe ter, kjer je možno, ocenjujemo finančne posledice uresničevanja posameznega scenarija.
26 Trajnostna urbana infrastruktura - Ljubljana – pogled v leto 2050
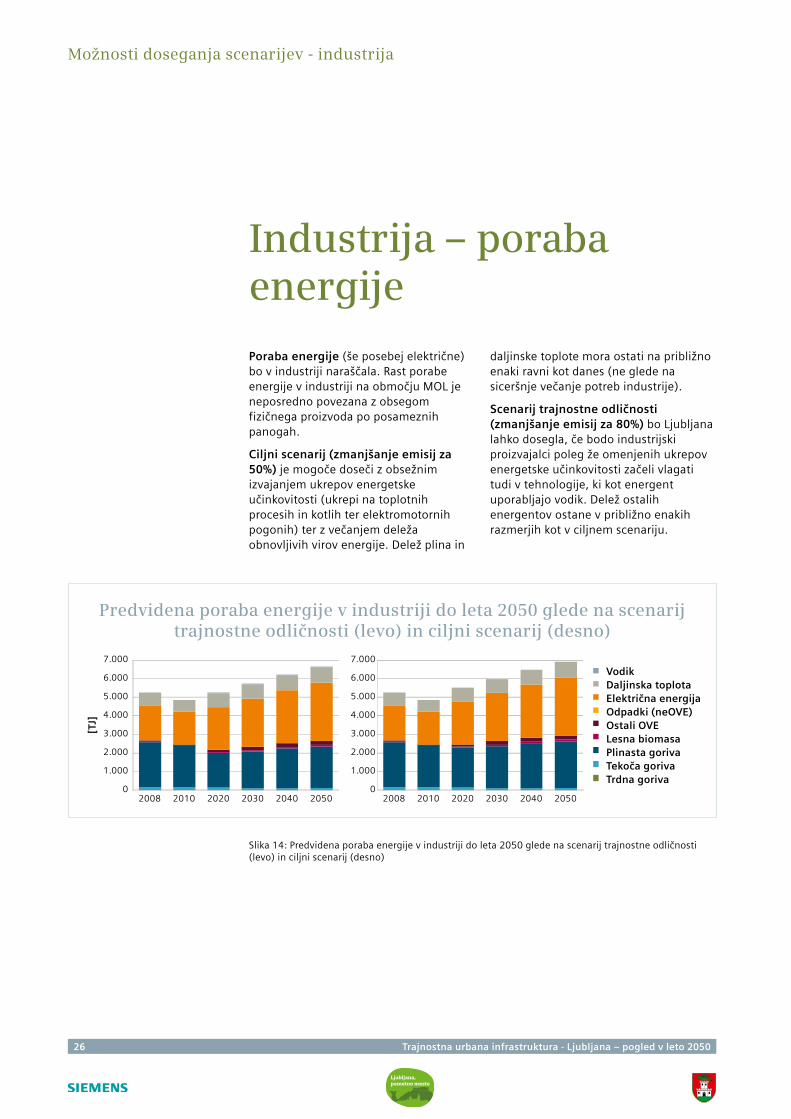
Industrija – poraba energije
Poraba energije (še posebej električne) bo v industriji naraščala. Rast porabe energije v industriji na območju MOL je neposredno povezana z obsegom fizičnega proizvoda po posameznih panogah.
Ciljni scenarij (zmanjšanje emisij za 50%) je mogoče doseči z obsežnim izvajanjem ukrepov energetske učinkovitosti (ukrepi na toplotnih procesih in kotlih ter elektromotornih pogonih) ter z večanjem deleža obnovljivih virov energije. Delež plina in
daljinske toplote mora ostati na približno enaki ravni kot danes (ne glede na siceršnje večanje potreb industrije).
Scenarij trajnostne odličnosti (zmanjšanje emisij za 80%) bo Ljubljana lahko dosegla, če bodo industrijski proizvajalci poleg že omenjenih ukrepov energetske učinkovitosti začeli vlagati tudi v tehnologije, ki kot energent uporabljajo vodik. Delež ostalih energentov ostane v približno enakih razmerjih kot v ciljnem scenariju.
Možnosti doseganja scenarijev - industrija
Slika 14: Predvidena poraba energije v industriji do leta 2050 glede na scenarij trajnostne odličnosti (levo) in ciljni scenarij (desno)
Predvidena poraba energije v industriji do leta 2050 glede na scenarij trajnostne odličnosti (levo) in ciljni scenarij (desno)
[TJ]
VodikDaljinska toplotaElektrična energijaOdpadki (neOVE)Ostali OVELesna biomasaPlinasta gorivaTekoča gorivaTrdna goriva
0
1.000
2.000
3.000
4.000
5.000
6.000
7.000
2008 2010 2020 2030 2040 20500
1.000
2.000
3.000
4.000
5.000
6.000
7.000
2008 2010 2020 2030 2040 2050
Trajnostna urbana infrastruktura - Ljubljana – pogled v leto 2050 27
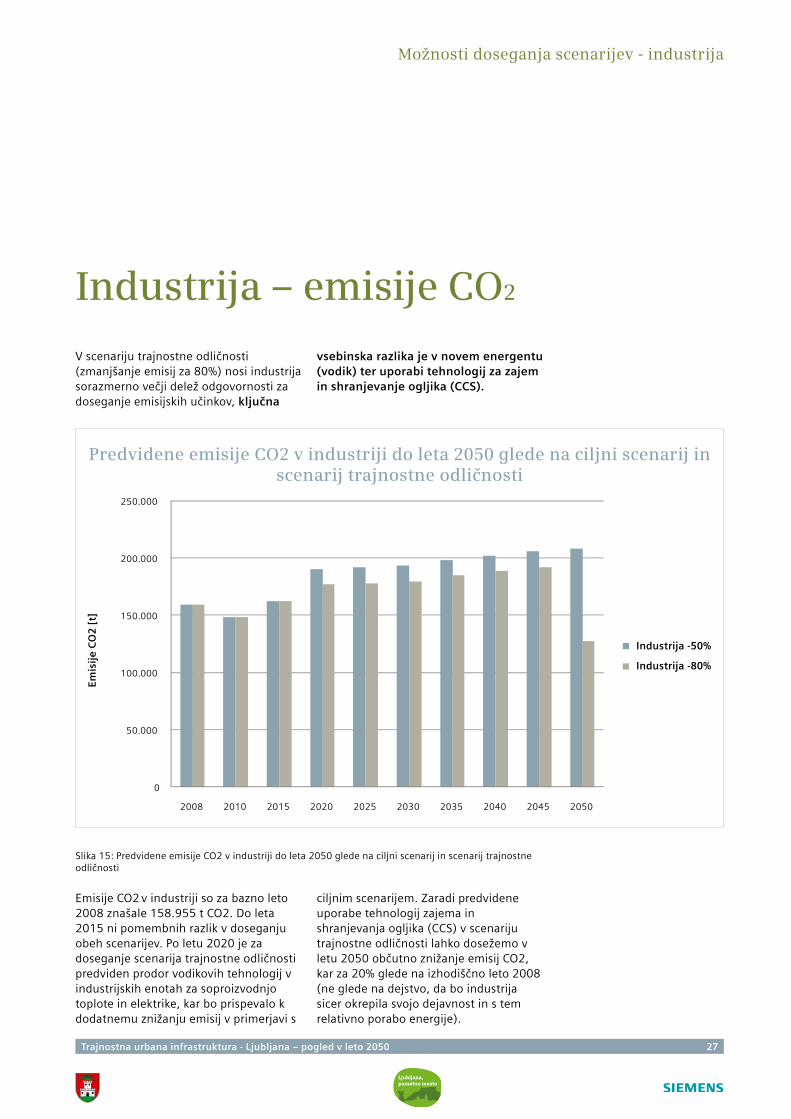
Industrija – emisije CO2
V scenariju trajnostne odličnosti (zmanjšanje emisij za 80%) nosi industrija sorazmerno večji delež odgovornosti za doseganje emisijskih učinkov, ključna
vsebinska razlika je v novem energentu (vodik) ter uporabi tehnologij za zajem in shranjevanje ogljika (CCS).
Možnosti doseganja scenarijev - industrija
Slika 15: Predvidene emisije CO2 v industriji do leta 2050 glede na ciljni scenarij in scenarij trajnostne odličnosti
Emisije CO2 v industriji so za bazno leto 2008 znašale 158.955 t CO2. Do leta 2015 ni pomembnih razlik v doseganju obeh scenarijev. Po letu 2020 je za doseganje scenarija trajnostne odličnosti predviden prodor vodikovih tehnologij v industrijskih enotah za soproizvodnjo toplote in elektrike, kar bo prispevalo k dodatnemu znižanju emisij v primerjavi s
ciljnim scenarijem. Zaradi predvidene uporabe tehnologij zajema in shranjevanja ogljika (CCS) v scenariju trajnostne odličnosti lahko dosežemo v letu 2050 občutno znižanje emisij CO2, kar za 20% glede na izhodiščno leto 2008 (ne glede na dejstvo, da bo industrija sicer okrepila svojo dejavnost in s tem relativno porabo energije).
Predvidene emisije CO2 v industriji do leta 2050 glede na ciljni scenarij in scenarij trajnostne odličnosti
Industrija -50%
Industrija -80%
0
50.000
100.000
150.000
200.000
250.000
2008 2010 2015 2020 2025 2030 2035 2040 2045 2050
Emis
ije
CO
2 [
t]
28 Trajnostna urbana infrastruktura - Ljubljana – pogled v leto 2050
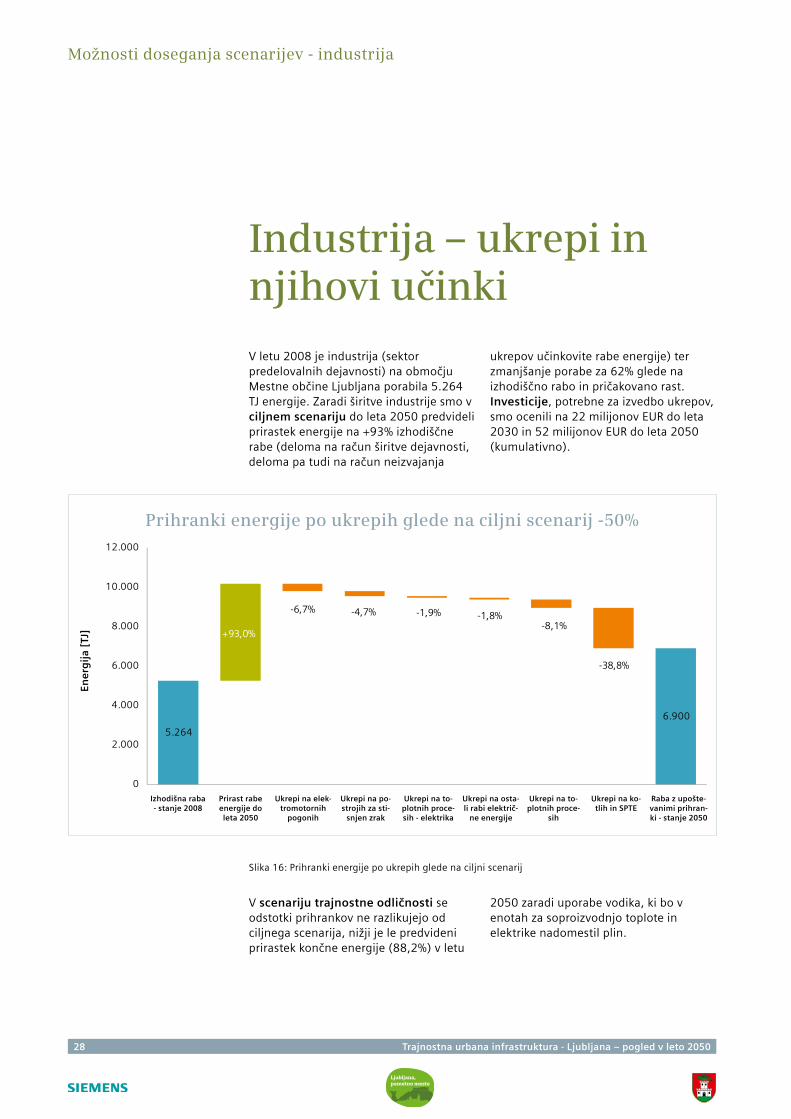
Industrija – ukrepi in njihovi učinki
V letu 2008 je industrija (sektor predelovalnih dejavnosti) na območju Mestne občine Ljubljana porabila 5.264 TJ energije. Zaradi širitve industrije smo v ciljnem scenariju do leta 2050 predvideli prirastek energije na +93% izhodiščne rabe (deloma na račun širitve dejavnosti, deloma pa tudi na račun neizvajanja
ukrepov učinkovite rabe energije) ter zmanjšanje porabe za 62% glede na izhodiščno rabo in pričakovano rast. Investicije, potrebne za izvedbo ukrepov, smo ocenili na 22 milijonov EUR do leta 2030 in 52 milijonov EUR do leta 2050 (kumulativno).
Slika 16: Prihranki energije po ukrepih glede na ciljni scenarij
V scenariju trajnostne odličnosti se odstotki prihrankov ne razlikujejo od ciljnega scenarija, nižji je le predvideni prirastek končne energije (88,2%) v letu
2050 zaradi uporabe vodika, ki bo v enotah za soproizvodnjo toplote in elektrike nadomestil plin.
Možnosti doseganja scenarijev - industrija
Prihranki energije po ukrepih glede na ciljni scenarij -50%
Ene
rgij
a [T
J]
Izhodišna raba - stanje 2008
Prirast rabe energije do leta 2050
Ukrepi na elek-tromotornih
pogonih
Ukrepi na po-strojih za sti-
snjen zrak
Ukrepi na to-plotnih proce-sih - elektrika
Ukrepi na osta-li rabi električ-
ne energije
Ukrepi na to-plotnih proce-
sih
Ukrepi na ko-tlih in SPTE
Raba z upošte-vanimi prihran-ki - stanje 2050
5.264
6.900
0
2.000
4.000
6.000
8.000
10.000
12.000
-6,7% -4,7% -1,9% -1,8%-8,1%
-38,8%
+93,0%
Trajnostna urbana infrastruktura - Ljubljana – pogled v leto 2050 29
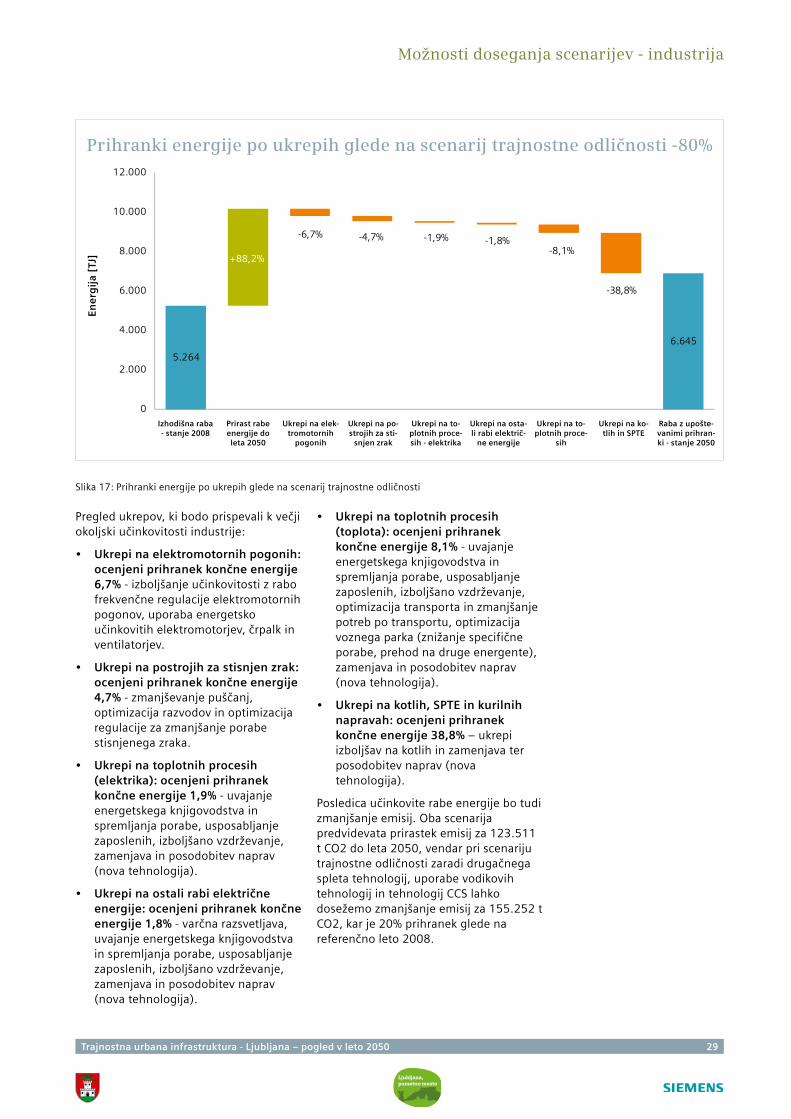
Slika 17: Prihranki energije po ukrepih glede na scenarij trajnostne odličnosti
Pregled ukrepov, ki bodo prispevali k večji okoljski učinkovitosti industrije:
• Ukrepi na elektromotornih pogonih: ocenjeni prihranek končne energije 6,7% - izboljšanje učinkovitosti z rabo frekvenčne regulacije elektromotornih pogonov, uporaba energetsko učinkovitih elektromotorjev, črpalk in ventilatorjev.
• Ukrepi na postrojih za stisnjen zrak: ocenjeni prihranek končne energije 4,7% - zmanjševanje puščanj, optimizacija razvodov in optimizacija regulacije za zmanjšanje porabe stisnjenega zraka.
• Ukrepi na toplotnih procesih (elektrika): ocenjeni prihranek končne energije 1,9% - uvajanje energetskega knjigovodstva in spremljanja porabe, usposabljanje zaposlenih, izboljšano vzdrževanje, zamenjava in posodobitev naprav (nova tehnologija).
• Ukrepi na ostali rabi električne energije: ocenjeni prihranek končne energije 1,8% - varčna razsvetljava, uvajanje energetskega knjigovodstva in spremljanja porabe, usposabljanje zaposlenih, izboljšano vzdrževanje, zamenjava in posodobitev naprav (nova tehnologija).
• Ukrepi na toplotnih procesih (toplota): ocenjeni prihranek končne energije 8,1% - uvajanje energetskega knjigovodstva in spremljanja porabe, usposabljanje zaposlenih, izboljšano vzdrževanje, optimizacija transporta in zmanjšanje potreb po transportu, optimizacija voznega parka (znižanje specifične porabe, prehod na druge energente), zamenjava in posodobitev naprav (nova tehnologija).
• Ukrepi na kotlih, SPTE in kurilnih napravah: ocenjeni prihranek končne energije 38,8% – ukrepi izboljšav na kotlih in zamenjava ter posodobitev naprav (nova tehnologija).
Posledica učinkovite rabe energije bo tudi zmanjšanje emisij. Oba scenarija predvidevata prirastek emisij za 123.511 t CO2 do leta 2050, vendar pri scenariju trajnostne odličnosti zaradi drugačnega spleta tehnologij, uporabe vodikovih tehnologij in tehnologij CCS lahko dosežemo zmanjšanje emisij za 155.252 t CO2, kar je 20% prihranek glede na referenčno leto 2008.
Možnosti doseganja scenarijev - industrija
Prihranki energije po ukrepih glede na scenarij trajnostne odličnosti -80%
Ene
rgij
a [T
J]
Izhodišna raba - stanje 2008
Prirast rabe energije do leta 2050
Ukrepi na elek-tromotornih
pogonih
Ukrepi na po-strojih za sti-
snjen zrak
Ukrepi na to-plotnih proce-sih - elektrika
Ukrepi na osta-li rabi električ-
ne energije
Ukrepi na to-plotnih proce-
sih
Ukrepi na ko-tlih in SPTE
Raba z upošte-vanimi prihran-ki - stanje 2050
5.264
6.645
0
2.000
4.000
6.000
8.000
10.000
12.000
-6,7% -4,7% -1,9% -1,8%-8,1%
-38,8%
+88,2%
30 Trajnostna urbana infrastruktura - Ljubljana – pogled v leto 2050
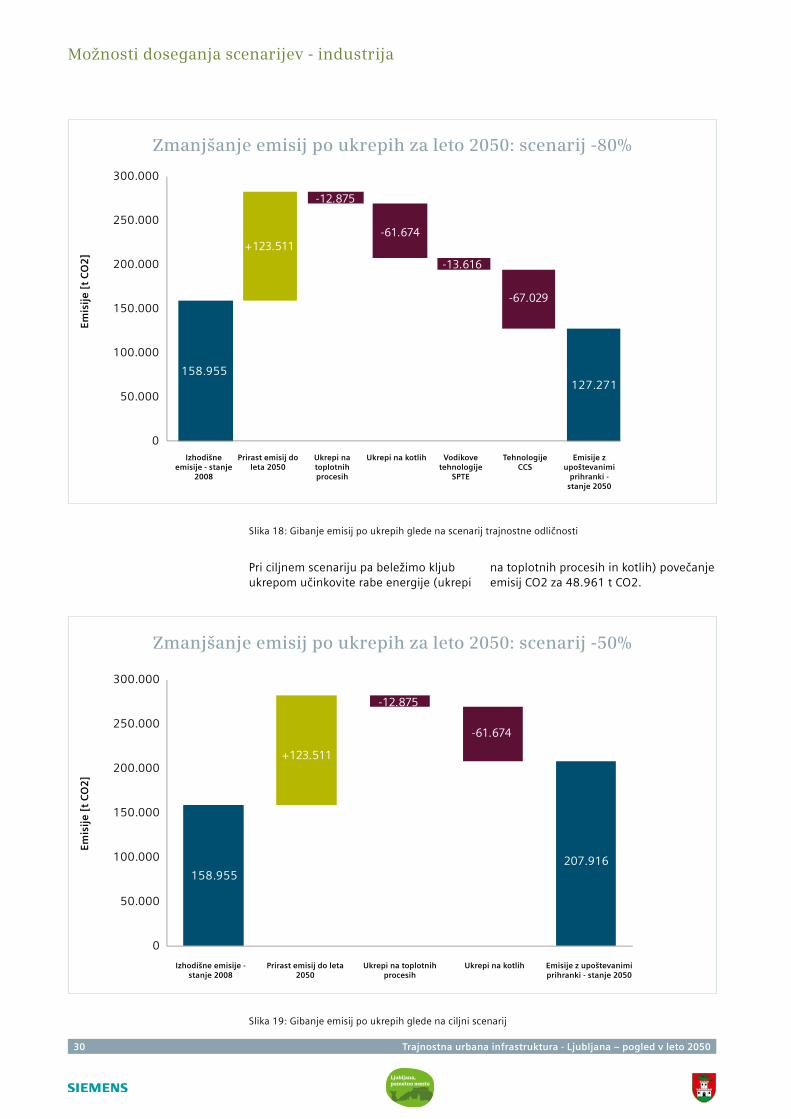
Slika 18: Gibanje emisij po ukrepih glede na scenarij trajnostne odličnosti
Pri ciljnem scenariju pa beležimo kljub ukrepom učinkovite rabe energije (ukrepi
Slika 19: Gibanje emisij po ukrepih glede na ciljni scenarij
na toplotnih procesih in kotlih) povečanje emisij CO2 za 48.961 t CO2.
Možnosti doseganja scenarijev - industrija
Zmanjšanje emisij po ukrepih za leto 2050: scenarij -80%
Emis
ije
[t
CO
2]
Izhodišne emisije - stanje
2008
Prirast emisij do leta 2050
Ukrepi na toplotnih procesih
Ukrepi na kotlih Vodikove tehnologije
SPTE
Tehnologije CCS
Emisije z upoštevanimi
prihranki - stanje 2050
Zmanjšanje emisij po ukrepih za leto 2050: scenarij -50%
Emis
ije
[t
CO
2]
Izhodišne emisije - stanje 2008
Prirast emisij do leta 2050
Ukrepi na toplotnih procesih
Ukrepi na kotlih Emisije z upoštevanimi prihranki - stanje 2050
158.955127.271
0
50.000
100.000
150.000
200.000
250.000
300.000
-12.875
-61.674+123.511
-67.029
-13.616
158.955
0
50.000
100.000
150.000
200.000
250.000
300.000
-12.875
-61.674
+123.511
207.916
Trajnostna urbana infrastruktura - Ljubljana – pogled v leto 2050 31
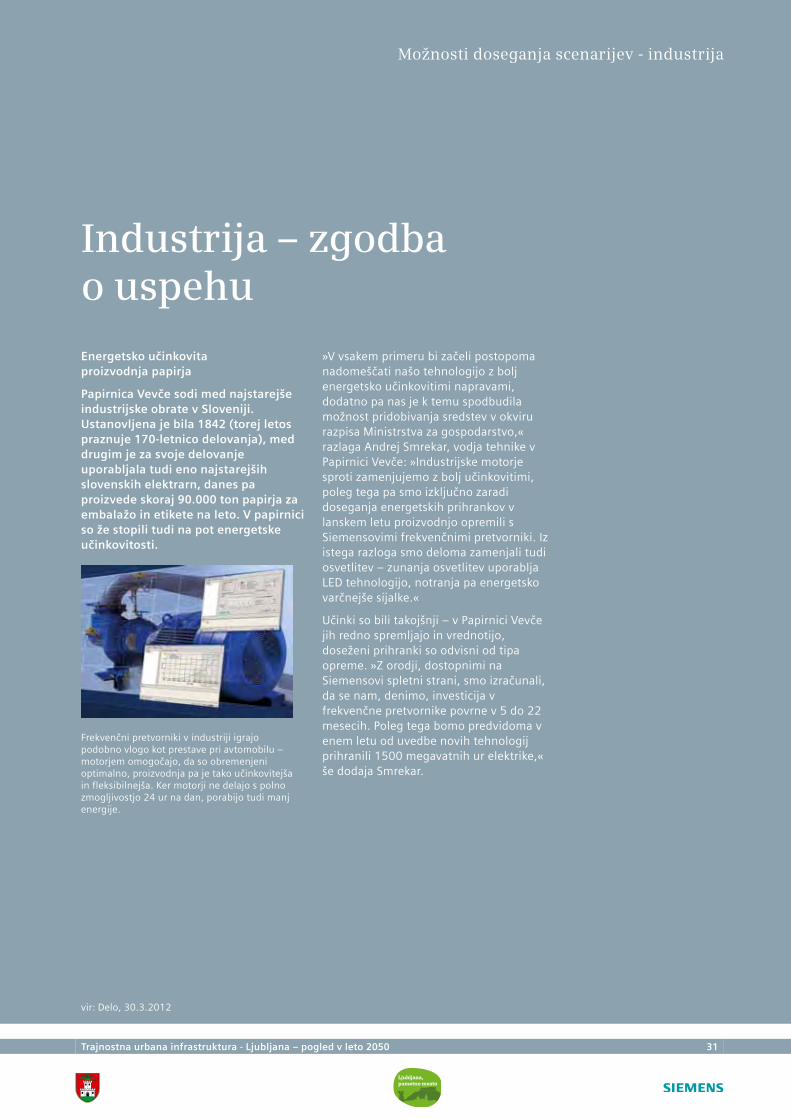
Industrija – zgodba o uspehu
Energetsko učinkovita proizvodnja papirja
Papirnica Vevče sodi med najstarejše industrijske obrate v Sloveniji. Ustanovljena je bila 1842 (torej letos praznuje 170-letnico delovanja), med drugim je za svoje delovanje uporabljala tudi eno najstarejših slovenskih elektrarn, danes pa proizvede skoraj 90.000 ton papirja za embalažo in etikete na leto. V papirnici so že stopili tudi na pot energetske učinkovitosti.
»V vsakem primeru bi začeli postopoma nadomeščati našo tehnologijo z bolj energetsko učinkovitimi napravami, dodatno pa nas je k temu spodbudila možnost pridobivanja sredstev v okviru razpisa Ministrstva za gospodarstvo,« razlaga Andrej Smrekar, vodja tehnike v Papirnici Vevče: »Industrijske motorje sproti zamenjujemo z bolj učinkovitimi, poleg tega pa smo izključno zaradi doseganja energetskih prihrankov v lanskem letu proizvodnjo opremili s Siemensovimi frekvenčnimi pretvorniki. Iz istega razloga smo deloma zamenjali tudi osvetlitev – zunanja osvetlitev uporablja LED tehnologijo, notranja pa energetsko varčnejše sijalke.«
Učinki so bili takojšnji – v Papirnici Vevče jih redno spremljajo in vrednotijo, doseženi prihranki so odvisni od tipa opreme. »Z orodji, dostopnimi na Siemensovi spletni strani, smo izračunali, da se nam, denimo, investicija v frekvenčne pretvornike povrne v 5 do 22 mesecih. Poleg tega bomo predvidoma v enem letu od uvedbe novih tehnologij prihranili 1500 megavatnih ur elektrike,« še dodaja Smrekar.
Možnosti doseganja scenarijev - industrija
Frekvenčni pretvorniki v industriji igrajo podobno vlogo kot prestave pri avtomobilu – motorjem omogočajo, da so obremenjeni optimalno, proizvodnja pa je tako učinkovitejša in fleksibilnejša. Ker motorji ne delajo s polno zmogljivostjo 24 ur na dan, porabijo tudi manj energije.
vir: Delo, 30.3.2012
32 Trajnostna urbana infrastruktura - Ljubljana – pogled v leto 2050
Gospodinjstva – poraba energije v stavbah
Največji delež energije v gospodinjstvu se porabi za ogrevanje in toplo vodo, sledi energija za gospodinjske aparate.
Ljubljana lahko doseže ciljni scenarij in scenarij trajnostne odličnosti z energetsko obnovo objektov, zamenjavo virov za ogrevanje, toplo vodo in kuhanje v gospodinjstvih ter z izboljšanjem energetske učinkovitosti aparatov in razsvetljave.
Z izvajanjem teh ukrepov lahko Ljubljana:
– za 65% zmanjša porabo energije za pripravo toplote za ogrevanje, toplo vodo in kuhanje v gospodinjstvih;
– za 85% zmanjša emisije, ki jih povzroči energija za pripravo toplote za ogrevanje, toplo vodo in kuhanje;
– na račun večje energetske učinkovitosti gospodinjskih aparatov lahko do 2050 dodatno zmanjša rabo energije za 4%.
Ker tovrstnih ukrepov ni možno administrativno predpisati, je bistveno še osveščanje prebivalcev in razvoj finančnih produktov (ugodni krediti, energetsko pogodbeništvo), ki lahko stimulirajo odločitve posameznikov (lastnikov stanovanj) in organizacij (investitorjev, finančnih ustanov, upraviteljev in drugih subjektov).
Investicije za celovito prenovo stavbenega fonda v sektorju gospodinjstva so do leta 2050 ocenjene na 3,1 milijard EUR od tega 1,95 milijard EUR za enodružinske hiše in 1,15 milijard EUR za večstanovanjske objekte.
Možnosti doseganja scenarijev - gospodinjstva
Trajnostna urbana infrastruktura - Ljubljana – pogled v leto 2050 33
Gospodinjstva – obnove stavb kot vzvod zmanjševanja porabe energije
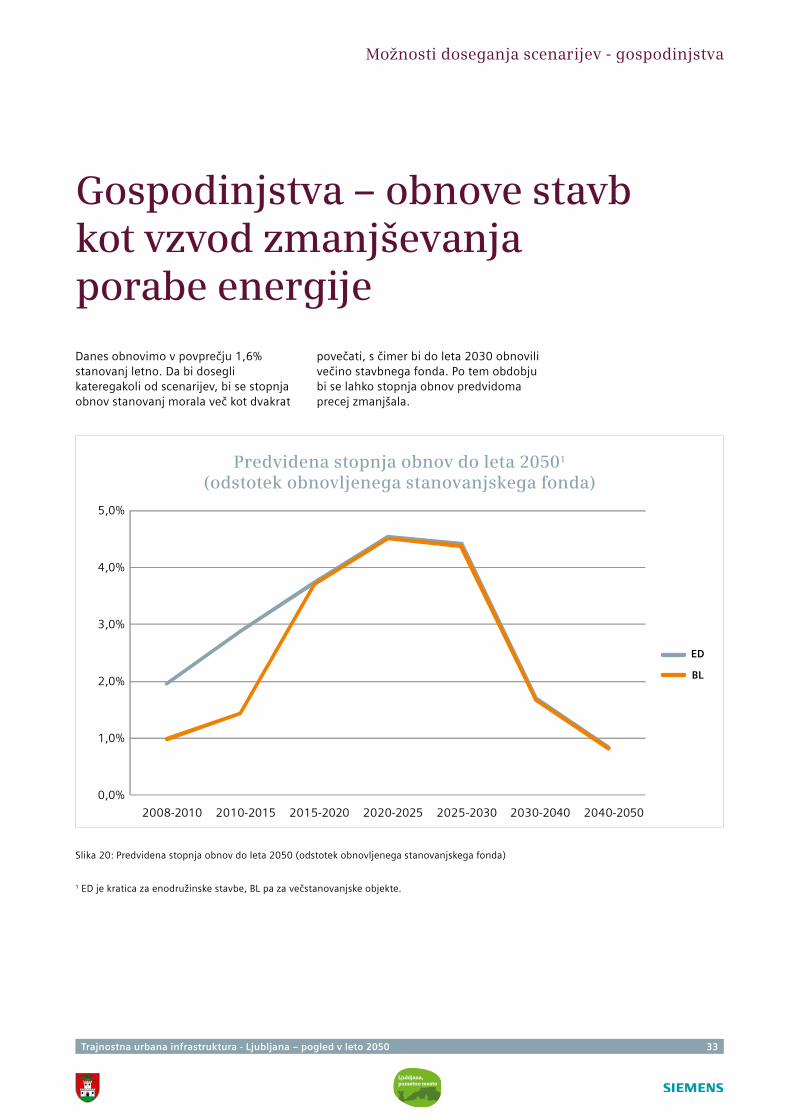
Danes obnovimo v povprečju 1,6% stanovanj letno. Da bi dosegli kateregakoli od scenarijev, bi se stopnja obnov stanovanj morala več kot dvakrat
povečati, s čimer bi do leta 2030 obnovili večino stavbnega fonda. Po tem obdobju bi se lahko stopnja obnov predvidoma precej zmanjšala.
Slika 20: Predvidena stopnja obnov do leta 2050 (odstotek obnovljenega stanovanjskega fonda)
1 ED je kratica za enodružinske stavbe, BL pa za večstanovanjske objekte.
Možnosti doseganja scenarijev - gospodinjstva
Predvidena stopnja obnov do leta 20501 (odstotek obnovljenega stanovanjskega fonda)
ED
BL
0,0%
1,0%
2,0%
3,0%
4,0%
5,0%
2008-2010 2010-2015 2015-2020 2020-2025 2025-2030 2030-2040 2040-2050
34 Trajnostna urbana infrastruktura - Ljubljana – pogled v leto 2050
Gospodinjstva – ukrepi in njihov prispevek k nižanju porabe energije
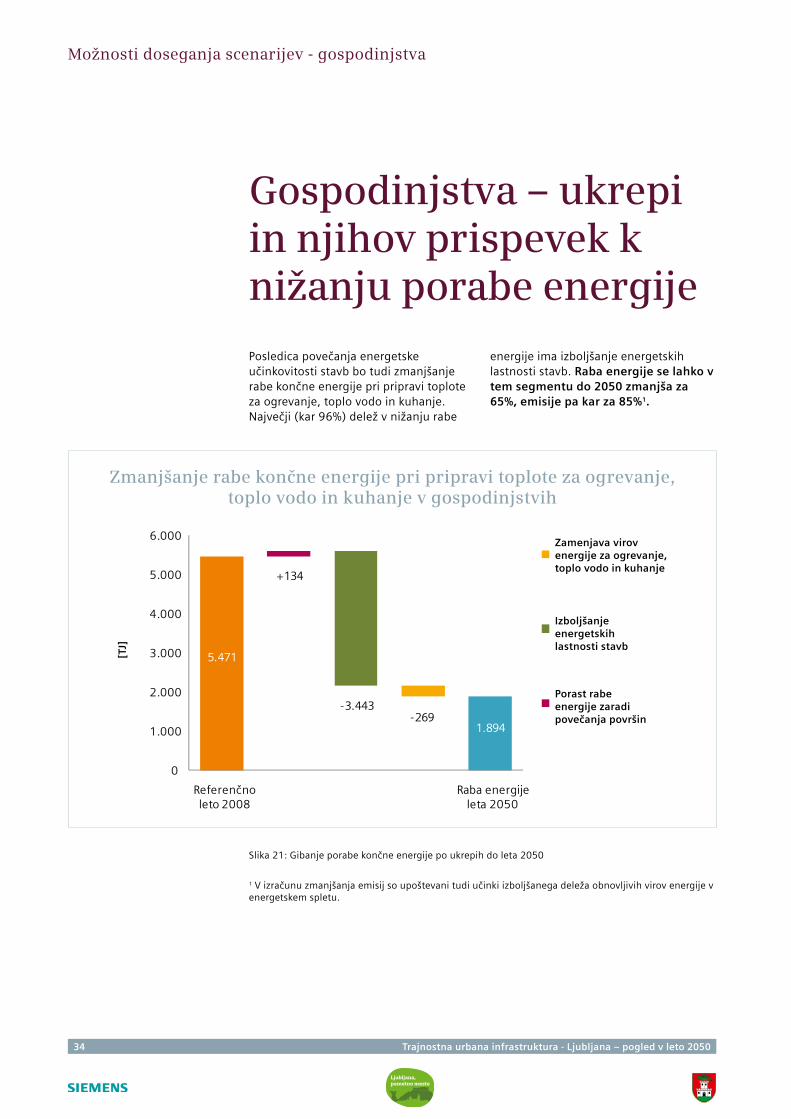
Posledica povečanja energetske učinkovitosti stavb bo tudi zmanjšanje rabe končne energije pri pripravi toplote za ogrevanje, toplo vodo in kuhanje. Največji (kar 96%) delež v nižanju rabe
energije ima izboljšanje energetskih lastnosti stavb. Raba energije se lahko v tem segmentu do 2050 zmanjša za 65%, emisije pa kar za 85%1.
Slika 21: Gibanje porabe končne energije po ukrepih do leta 2050
1 V izračunu zmanjšanja emisij so upoštevani tudi učinki izboljšanega deleža obnovljivih virov energije v energetskem spletu.
Možnosti doseganja scenarijev - gospodinjstva
Zmanjšanje rabe končne energije pri pripravi toplote za ogrevanje, toplo vodo in kuhanje v gospodinjstvih
Zamenjava virov energije za ogrevanje, toplo vodo in kuhanje
0
1.000
2.000
3.000
4.000
5.000
6.000
Referenčno leto 2008
Raba energije leta 2050
+134
-3.443-269
5.471
1.894
Porast rabe energije zaradi povečanja površin
Izboljšanje energetskih lastnosti stavb
[TJ]
Trajnostna urbana infrastruktura - Ljubljana – pogled v leto 2050 35
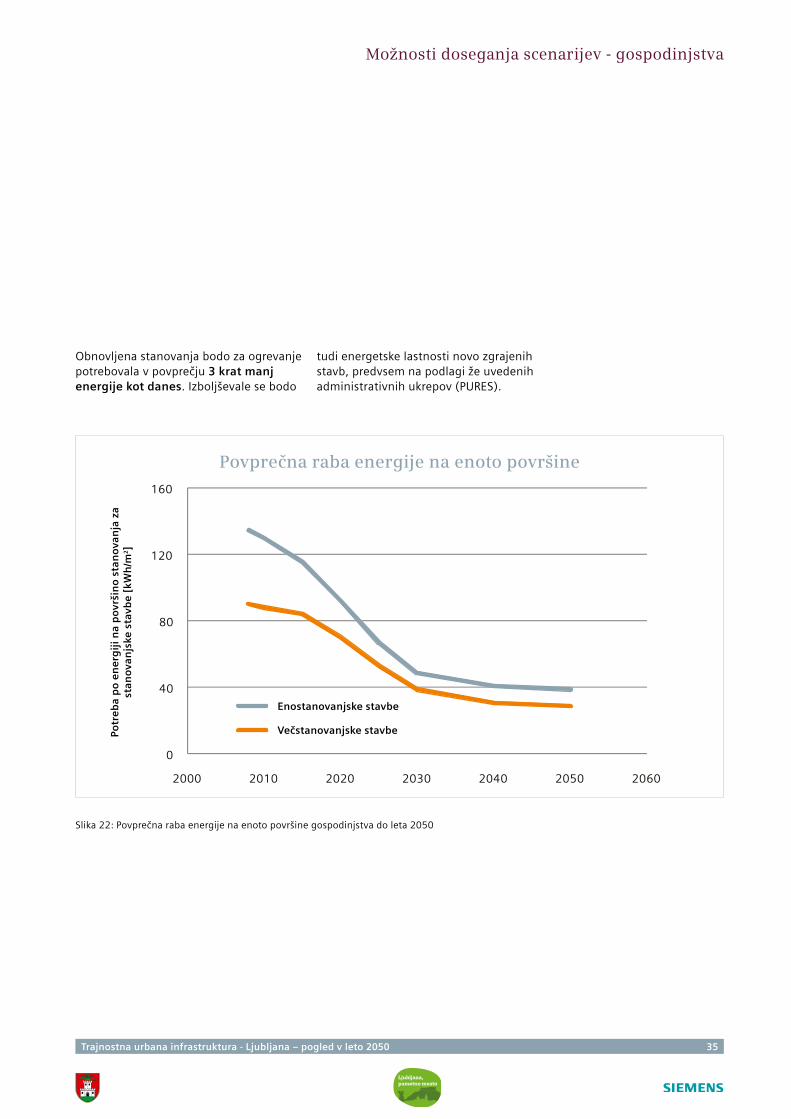
Obnovljena stanovanja bodo za ogrevanje potrebovala v povprečju 3 krat manj energije kot danes. Izboljševale se bodo
tudi energetske lastnosti novo zgrajenih stavb, predvsem na podlagi že uvedenih administrativnih ukrepov (PURES).
Slika 22: Povprečna raba energije na enoto površine gospodinjstva do leta 2050
Povprečna raba energije na enoto površine
Potr
eb
a p
o e
ne
rgij
i na
po
vrši
no
sta
no
van
ja z
a st
ano
van
jske
sta
vbe
[kW
h/m
2]
0
40
80
120
160
2000 2010 2020 2030 2040 2050 2060
Enostanovanjske stavbe
Večstanovanjske stavbe
Možnosti doseganja scenarijev - gospodinjstva
36 Trajnostna urbana infrastruktura - Ljubljana – pogled v leto 2050
Gospodinjstva – nižanje emisij
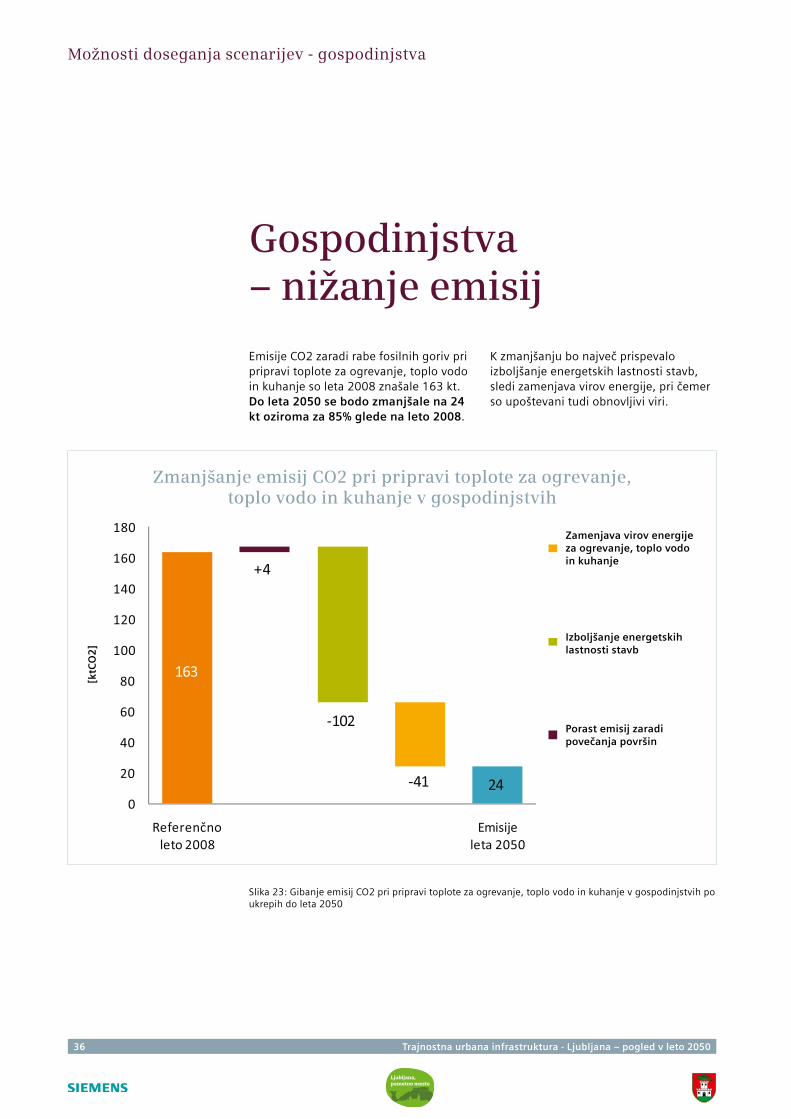
Emisije CO2 zaradi rabe fosilnih goriv pri pripravi toplote za ogrevanje, toplo vodo in kuhanje so leta 2008 znašale 163 kt. Do leta 2050 se bodo zmanjšale na 24 kt oziroma za 85% glede na leto 2008.
K zmanjšanju bo največ prispevalo izboljšanje energetskih lastnosti stavb, sledi zamenjava virov energije, pri čemer so upoštevani tudi obnovljivi viri.
Slika 23: Gibanje emisij CO2 pri pripravi toplote za ogrevanje, toplo vodo in kuhanje v gospodinjstvih po ukrepih do leta 2050
Možnosti doseganja scenarijev - gospodinjstva
Zmanjšanje emisij CO2 pri pripravi toplote za ogrevanje, toplo vodo in kuhanje v gospodinjstvih
[ktC
O2
]
Izboljšanje energetskih lastnosti stavb
0
20
40
60
80
100
120
140
160
180
Referenčno leto 2008
Emisije leta 2050
+4
-102
-41
163
24
Zamenjava virov energije za ogrevanje, toplo vodo in kuhanje
Porast emisij zaradi povečanja površin
Trajnostna urbana infrastruktura - Ljubljana – pogled v leto 2050 37
Gospodinjstva – tehnologije za ogrevanje in pripravo tople vode
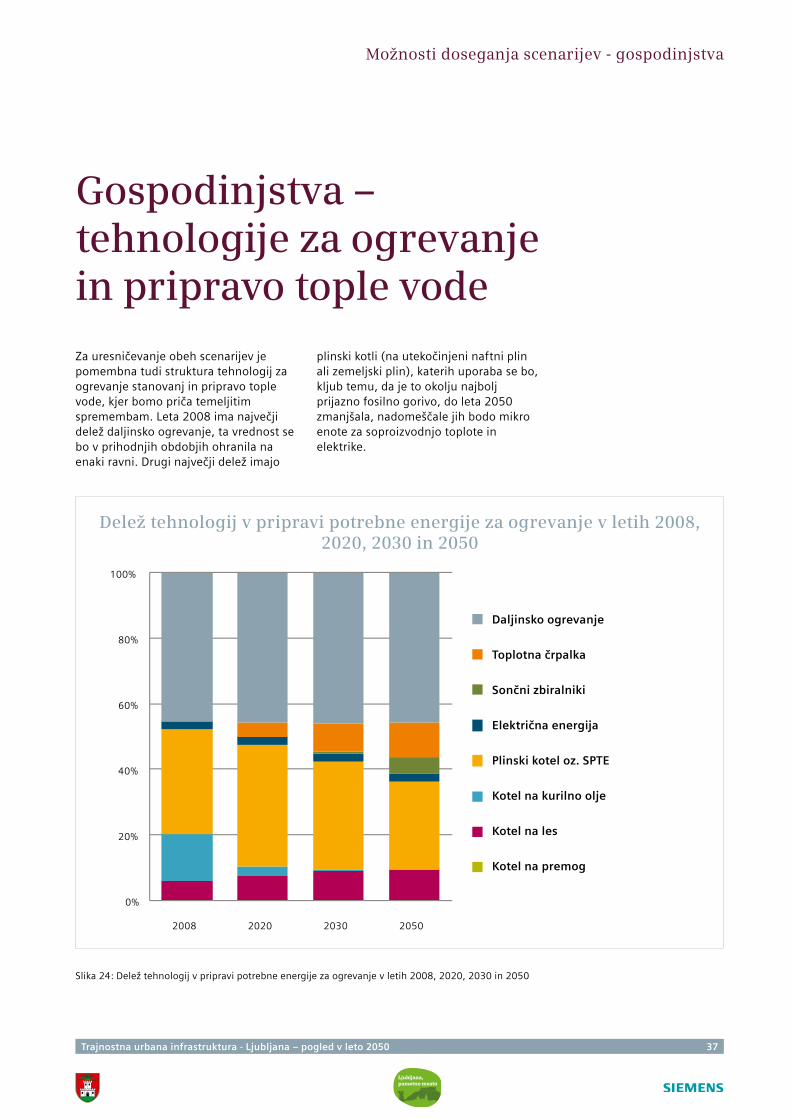
Za uresničevanje obeh scenarijev je pomembna tudi struktura tehnologij za ogrevanje stanovanj in pripravo tople vode, kjer bomo priča temeljitim spremembam. Leta 2008 ima največji delež daljinsko ogrevanje, ta vrednost se bo v prihodnjih obdobjih ohranila na enaki ravni. Drugi največji delež imajo
plinski kotli (na utekočinjeni naftni plin ali zemeljski plin), katerih uporaba se bo, kljub temu, da je to okolju najbolj prijazno fosilno gorivo, do leta 2050 zmanjšala, nadomeščale jih bodo mikro enote za soproizvodnjo toplote in elektrike.
Možnosti doseganja scenarijev - gospodinjstva
Slika 24: Delež tehnologij v pripravi potrebne energije za ogrevanje v letih 2008, 2020, 2030 in 2050
Delež tehnologij v pripravi potrebne energije za ogrevanje v letih 2008, 2020, 2030 in 2050
Daljinsko ogrevanje
Toplotna črpalka
Sončni zbiralniki
Električna energija
Plinski kotel oz. SPTE
Kotel na kurilno olje
Kotel na les
Kotel na premog
0%
20%
40%
60%
80%
100%
2008 2020 2030 2050
38 Trajnostna urbana infrastruktura - Ljubljana – pogled v leto 2050
Delež tehnologij v pripravi tople vode v letih 2008, 2020, 2030 in 2050
Daljinsko ogrevanje
Toplotna črpalka
Sončni zbiralniki
Električna energija
Plinski kotel oz. SPTE
Kotel na kurilno olje
Kotel na les
Kotel na premog
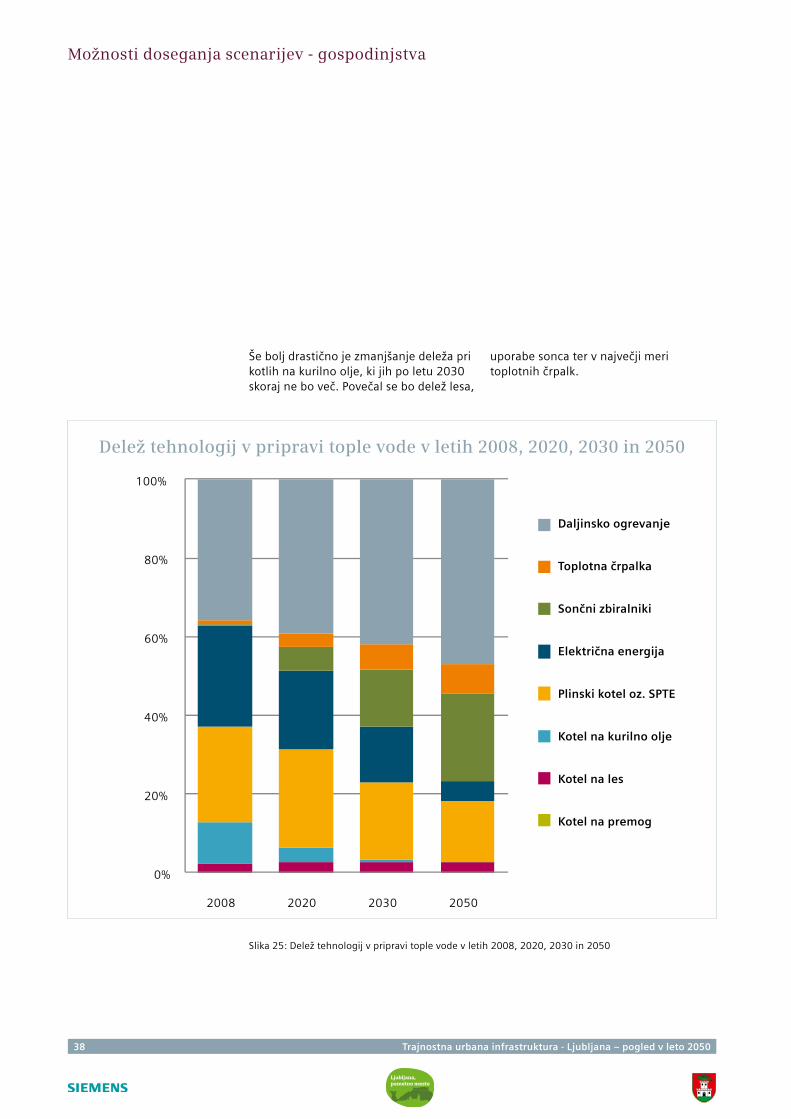
Slika 25: Delež tehnologij v pripravi tople vode v letih 2008, 2020, 2030 in 2050
0%
20%
40%
60%
80%
100%
2008 2020 2030 2050
Možnosti doseganja scenarijev - gospodinjstva
Še bolj drastično je zmanjšanje deleža pri kotlih na kurilno olje, ki jih po letu 2030 skoraj ne bo več. Povečal se bo delež lesa,
uporabe sonca ter v največji meri toplotnih črpalk.
Trajnostna urbana infrastruktura - Ljubljana – pogled v leto 2050 39
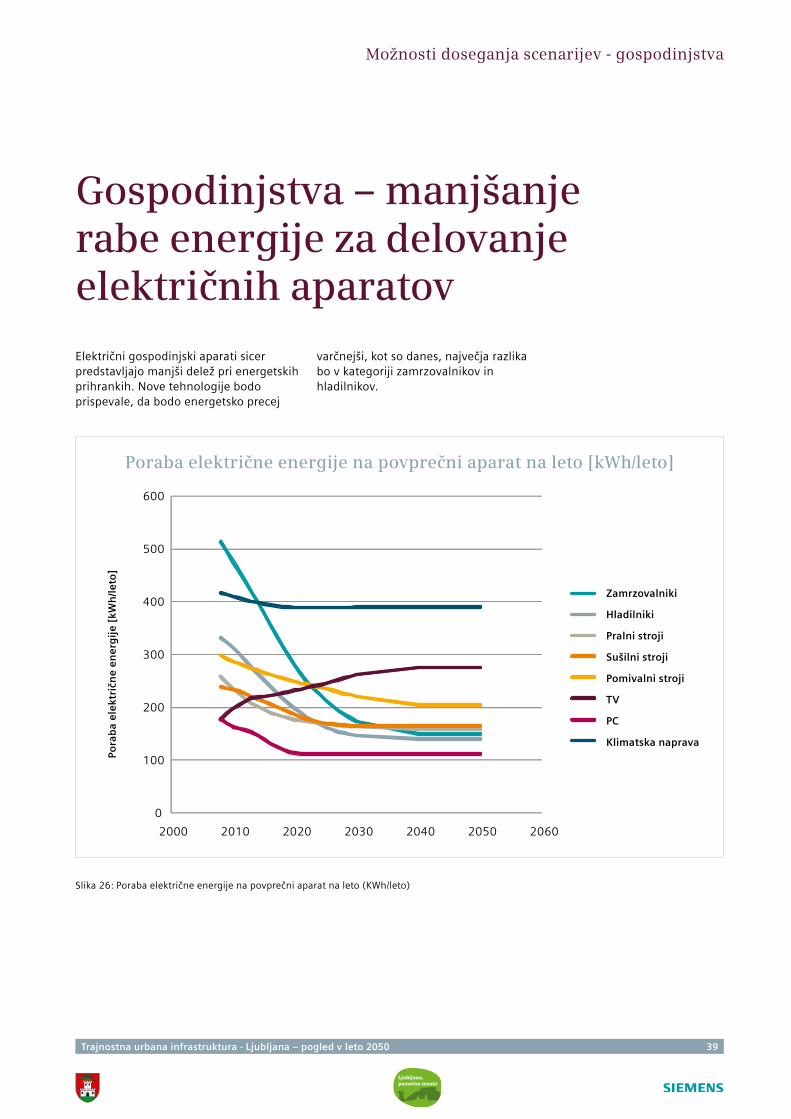
Gospodinjstva – manjšanje rabe energije za delovanje električnih aparatov
Električni gospodinjski aparati sicer predstavljajo manjši delež pri energetskih prihrankih. Nove tehnologije bodo prispevale, da bodo energetsko precej
varčnejši, kot so danes, največja razlika bo v kategoriji zamrzovalnikov in hladilnikov.
Možnosti doseganja scenarijev - gospodinjstva
Slika 26: Poraba električne energije na povprečni aparat na leto (KWh/leto)
Poraba električne energije na povprečni aparat na leto [kWh/leto]
Pora
ba
ele
ktri
čne
en
erg
ije
[kW
h/le
to]
Zamrzovalniki
Hladilniki
Pralni stroji
Sušilni stroji
Pomivalni stroji
TV
PC
Klimatska naprava
0
100
200
300
400
500
600
2000 2010 2020 2030 2040 2050 2060
40 Trajnostna urbana infrastruktura - Ljubljana – pogled v leto 2050
Gospodinjstva – zgodba o uspehu
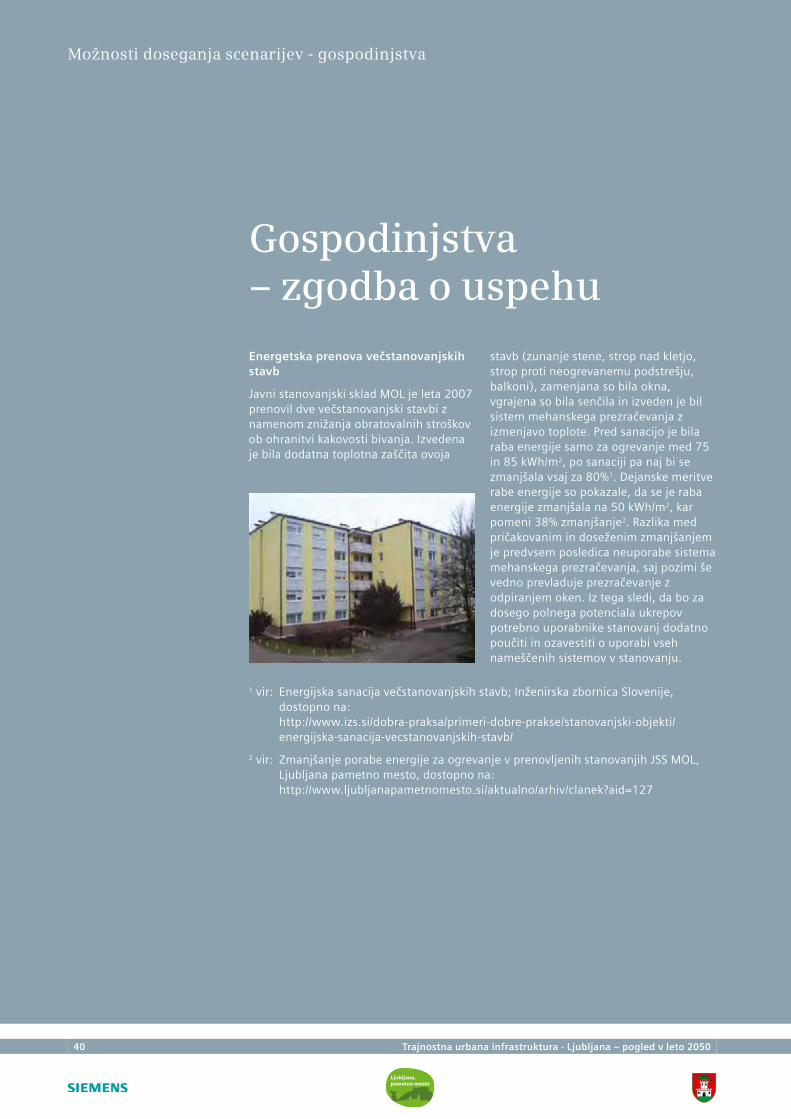
Energetska prenova večstanovanjskih stavb
Javni stanovanjski sklad MOL je leta 2007 prenovil dve večstanovanjski stavbi z namenom znižanja obratovalnih stroškov ob ohranitvi kakovosti bivanja. Izvedena je bila dodatna toplotna zaščita ovoja
stavb (zunanje stene, strop nad kletjo, strop proti neogrevanemu podstrešju, balkoni), zamenjana so bila okna, vgrajena so bila senčila in izveden je bil sistem mehanskega prezračevanja z izmenjavo toplote. Pred sanacijo je bila raba energije samo za ogrevanje med 75 in 85 kWh/m2, po sanaciji pa naj bi se zmanjšala vsaj za 80%1. Dejanske meritve rabe energije so pokazale, da se je raba energije zmanjšala na 50 kWh/m2, kar pomeni 38% zmanjšanje2. Razlika med pričakovanim in doseženim zmanjšanjem je predvsem posledica neuporabe sistema mehanskega prezračevanja, saj pozimi še vedno prevladuje prezračevanje z odpiranjem oken. Iz tega sledi, da bo za dosego polnega potenciala ukrepov potrebno uporabnike stanovanj dodatno poučiti in ozavestiti o uporabi vseh nameščenih sistemov v stanovanju.
Možnosti doseganja scenarijev - gospodinjstva
1 vir: Energijska sanacija večstanovanjskih stavb; Inženirska zbornica Slovenije, dostopno na: http://www.izs.si/dobra-praksa/primeri-dobre-prakse/stanovanjski-objekti/energijska-sanacija-vecstanovanjskih-stavb/
2 vir: Zmanjšanje porabe energije za ogrevanje v prenovljenih stanovanjih JSS MOL, Ljubljana pametno mesto, dostopno na: http://www.ljubljanapametnomesto.si/aktualno/arhiv/clanek?aid=127
Trajnostna urbana infrastruktura - Ljubljana – pogled v leto 2050 41
Javni in storitveni sektor – poraba energije v stavbah
Največji delež energije se tudi v javnem in storitvenem sektorju (JSS) porabi za ogrevanje in toplo vodo, sledi električna energija za naprave in razsvetljavo.
Ciljni scenarij in scenarij trajnostne odličnosti je mogoče doseči z naslednjimi ukrepi:
• energetska obnova objektov;
• ukrepi na ogrevalnih sistemih;
• zamenjava virov za ogrevanje in pripravo tople vode;
• izboljšanje energetske učinkovitosti razsvetljave in naprav na električno energijo.
Z izvajanjem teh ukrepov lahko dosežemo več pozitivnih učinkov:
• zmanjšanje rabe energije za pripravo toplote za ogrevanje in toplo vodo (v javnem sektorju brez objektov v lasti MOL je zmanjšanje lahko 59%, v objektih MOL 61%, v storitvenem sektorju pa 30%);
• zmanjšanje emisij (v javnem sektorju brez objektov v lasti MOL je zmanjšanje emisij lahko 82%, v objektih MOL 80%, v storitvenem sektorju pa 70%);
• zmanjšanje rabe električne energije za druge namene (brez ogrevanja in priprave tople vode) se lahko v javnem sektorju (brez stavb MOL), kljub občutnemu povečanju dejavnosti, poveča samo za 4%, zmanjša pa v objektih MOL (za 13%) in v storitvenem sektorju (za 13%).
Ker gre za javne stavbe, uporabniki posledic neracionalnega ravnanja ne čutijo kot svoj strošek. Zato je izjemnega pomena osveščanje ter uvajanje novih organizacijskih modelov in modelov nagrajevanja oziroma motivacije na podlagi pozitivnih učinkov zmanjšanja rabe energije in emisij.
Skupni investicijski stroški za doseganje zgoraj zapisanih ciljev, ki vodijo tudi k doseganju ciljnega scenarija in scenarija trajnostne odličnosti, so ocenjeni na 147 milijonov EUR do leta 2050. Ukrepi bodo sicer predvidoma prinesli za okrog 6 milijonov EUR prihrankov na leto.
Možnosti doseganja scenarijev - javni in storitveni sektor
42 Trajnostna urbana infrastruktura - Ljubljana – pogled v leto 2050
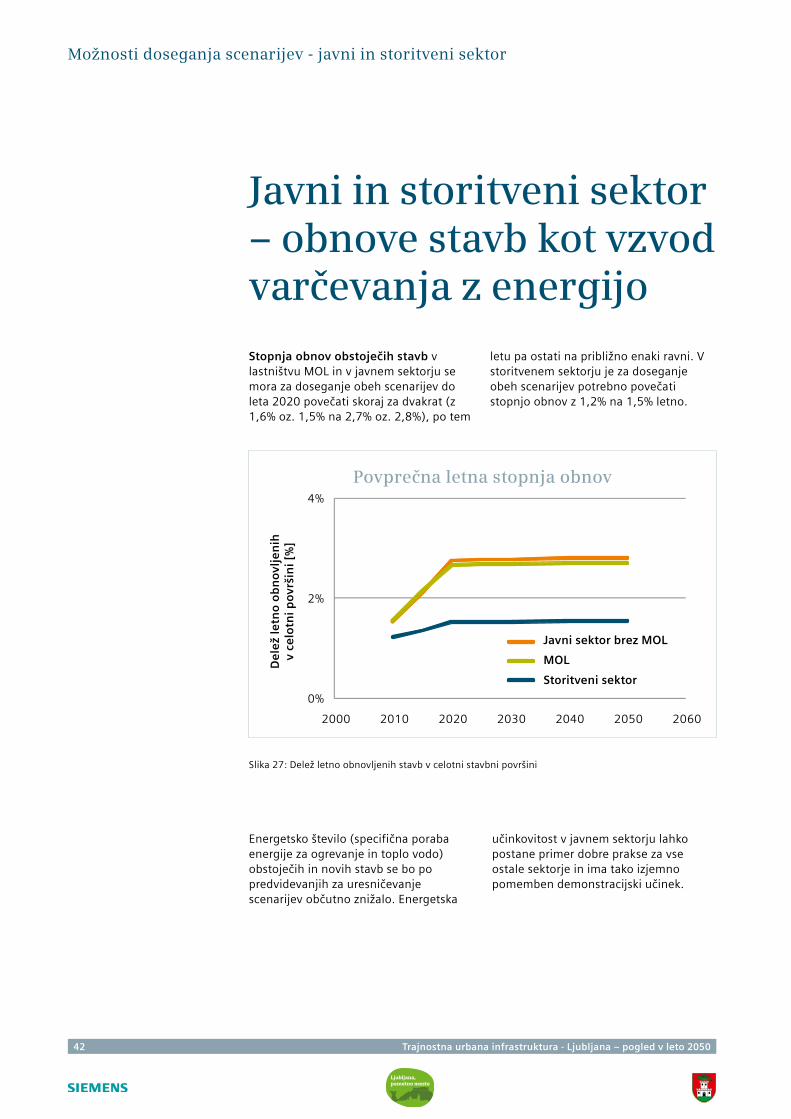
Javni in storitveni sektor – obnove stavb kot vzvod varčevanja z energijo
Stopnja obnov obstoječih stavb v lastništvu MOL in v javnem sektorju se mora za doseganje obeh scenarijev do leta 2020 povečati skoraj za dvakrat (z 1,6% oz. 1,5% na 2,7% oz. 2,8%), po tem
letu pa ostati na približno enaki ravni. V storitvenem sektorju je za doseganje obeh scenarijev potrebno povečati stopnjo obnov z 1,2% na 1,5% letno.
Slika 27: Delež letno obnovljenih stavb v celotni stavbni površini
Možnosti doseganja scenarijev - javni in storitveni sektor
Povprečna letna stopnja obnov
De
lež
letn
o o
bn
ovl
jen
ih
v ce
lotn
i po
vrši
ni [
%]
0%
2%
4%
2000 2010 2020 2030 2040 2050 2060
Javni sektor brez MOL
MOL
Storitveni sektor
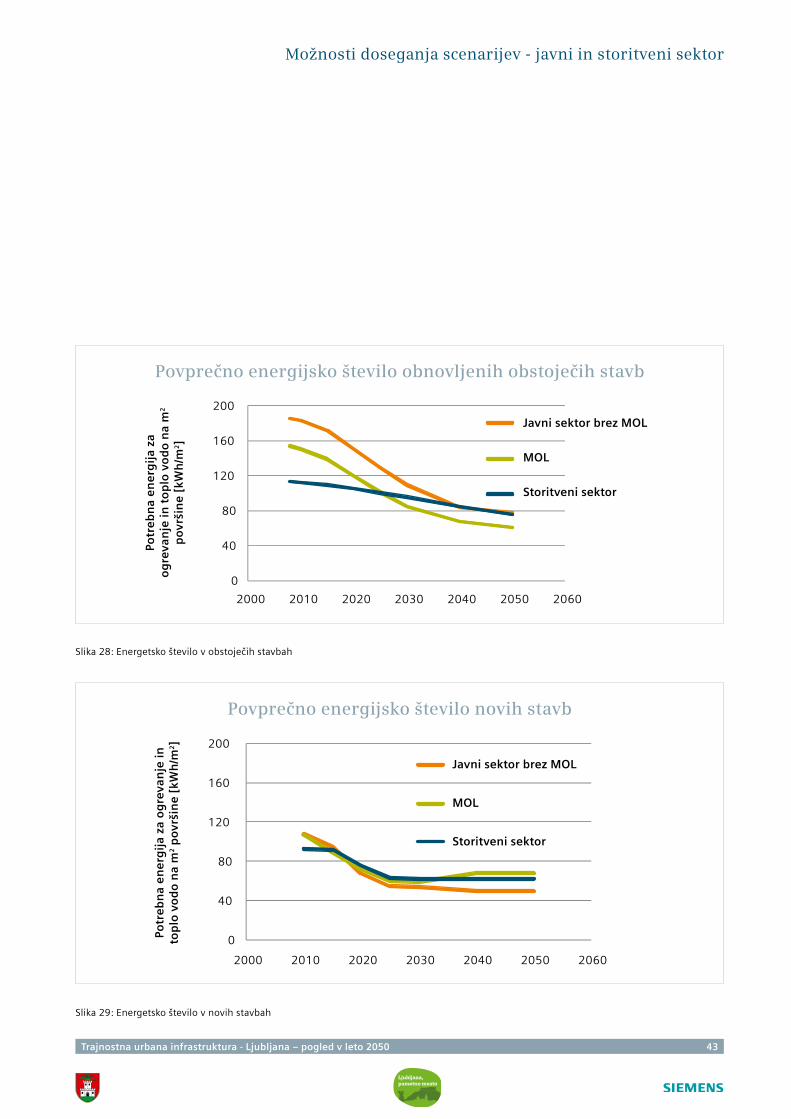
Energetsko število (specifična poraba energije za ogrevanje in toplo vodo) obstoječih in novih stavb se bo po predvidevanjih za uresničevanje scenarijev občutno znižalo. Energetska
učinkovitost v javnem sektorju lahko postane primer dobre prakse za vse ostale sektorje in ima tako izjemno pomemben demonstracijski učinek.
Trajnostna urbana infrastruktura - Ljubljana – pogled v leto 2050 43
Povprečno energijsko število novih stavb
Povprečno energijsko število obnovljenih obstoječih stavb
Slika 29: Energetsko število v novih stavbah
Potr
eb
na
en
erg
ija
za
og
reva
nje
in t
op
lo v
od
o n
a m
2
po
vrši
ne
[kW
h/m
2]
Možnosti doseganja scenarijev - javni in storitveni sektor
Potr
eb
na
en
erg
ija
za o
gre
van
je in
to
plo
vo
do
na
m2 p
ovr
šin
e [
kWh
/m2]
Slika 28: Energetsko število v obstoječih stavbah
0
40
80
120
160
200
2000 2010 2020 2030 2040 2050 2060
Javni sektor brez MOL
MOL
Storitveni sektor
0
40
80
120
160
200
2000 2010 2020 2030 2040 2050 2060
Javni sektor brez MOL
MOL
Storitveni sektor
44 Trajnostna urbana infrastruktura - Ljubljana – pogled v leto 2050
Možnosti doseganja scenarijev - javni in storitveni sektor
Javni in storitveni sektor – tehnologije za pripravo energije za ogrevanje in toplo vodo
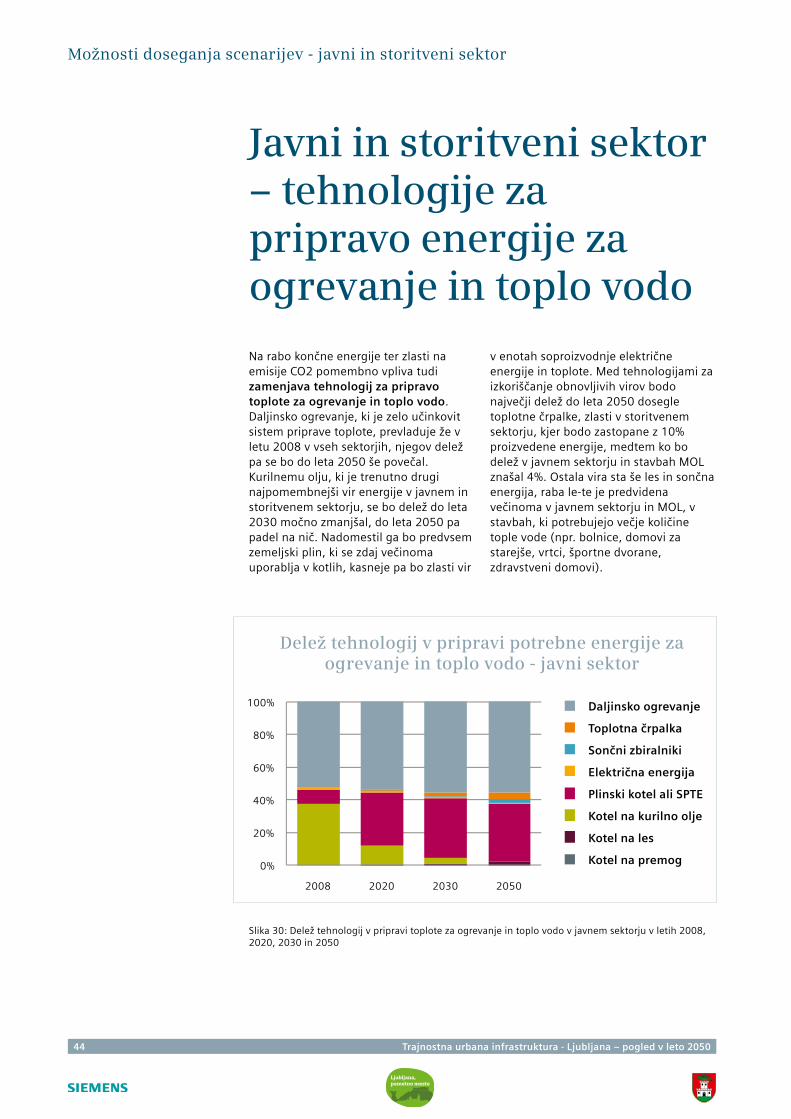
Na rabo končne energije ter zlasti na emisije CO2 pomembno vpliva tudi zamenjava tehnologij za pripravo toplote za ogrevanje in toplo vodo. Daljinsko ogrevanje, ki je zelo učinkovit sistem priprave toplote, prevladuje že v letu 2008 v vseh sektorjih, njegov delež pa se bo do leta 2050 še povečal. Kurilnemu olju, ki je trenutno drugi najpomembnejši vir energije v javnem in storitvenem sektorju, se bo delež do leta 2030 močno zmanjšal, do leta 2050 pa padel na nič. Nadomestil ga bo predvsem zemeljski plin, ki se zdaj večinoma uporablja v kotlih, kasneje pa bo zlasti vir
v enotah soproizvodnje električne energije in toplote. Med tehnologijami za izkoriščanje obnovljivih virov bodo največji delež do leta 2050 dosegle toplotne črpalke, zlasti v storitvenem sektorju, kjer bodo zastopane z 10% proizvedene energije, medtem ko bo delež v javnem sektorju in stavbah MOL znašal 4%. Ostala vira sta še les in sončna energija, raba le-te je predvidena večinoma v javnem sektorju in MOL, v stavbah, ki potrebujejo večje količine tople vode (npr. bolnice, domovi za starejše, vrtci, športne dvorane, zdravstveni domovi).
Slika 30: Delež tehnologij v pripravi toplote za ogrevanje in toplo vodo v javnem sektorju v letih 2008, 2020, 2030 in 2050
Delež tehnologij v pripravi potrebne energije za ogrevanje in toplo vodo - javni sektor
Daljinsko ogrevanje
Toplotna črpalka
Sončni zbiralniki
Električna energija
Plinski kotel ali SPTE
Kotel na kurilno olje
Kotel na les
Kotel na premog0%
20%
40%
60%
80%
100%
2008 2020 2030 2050
Trajnostna urbana infrastruktura - Ljubljana – pogled v leto 2050 45
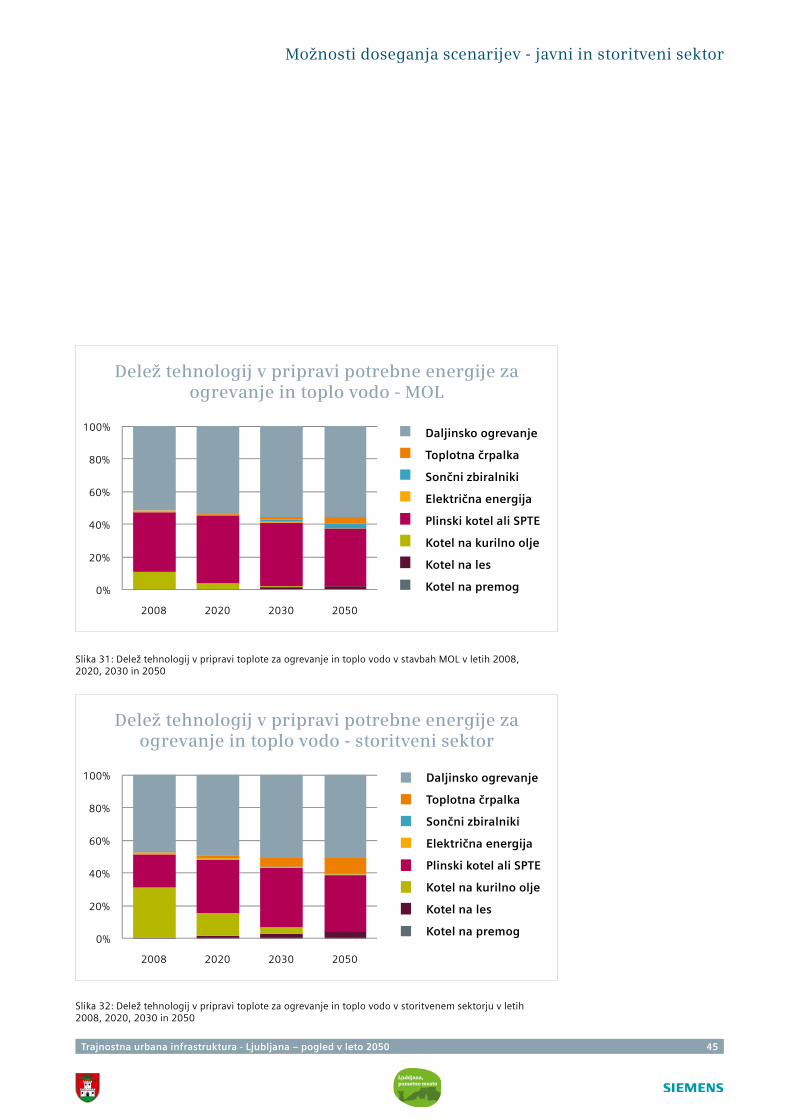
Slika 32: Delež tehnologij v pripravi toplote za ogrevanje in toplo vodo v storitvenem sektorju v letih 2008, 2020, 2030 in 2050
Slika 31: Delež tehnologij v pripravi toplote za ogrevanje in toplo vodo v stavbah MOL v letih 2008, 2020, 2030 in 2050
Delež tehnologij v pripravi potrebne energije za ogrevanje in toplo vodo - MOL
Delež tehnologij v pripravi potrebne energije za ogrevanje in toplo vodo - storitveni sektor
Daljinsko ogrevanje
Toplotna črpalka
Sončni zbiralniki
Električna energija
Plinski kotel ali SPTE
Kotel na kurilno olje
Kotel na les
Kotel na premog
Daljinsko ogrevanje
Toplotna črpalka
Sončni zbiralniki
Električna energija
Plinski kotel ali SPTE
Kotel na kurilno olje
Kotel na les
Kotel na premog
0%
20%
40%
60%
80%
100%
2008 2020 2030 2050
0%
20%
40%
60%
80%
100%
2008 2020 2030 2050
Možnosti doseganja scenarijev - javni in storitveni sektor
46 Trajnostna urbana infrastruktura - Ljubljana – pogled v leto 2050
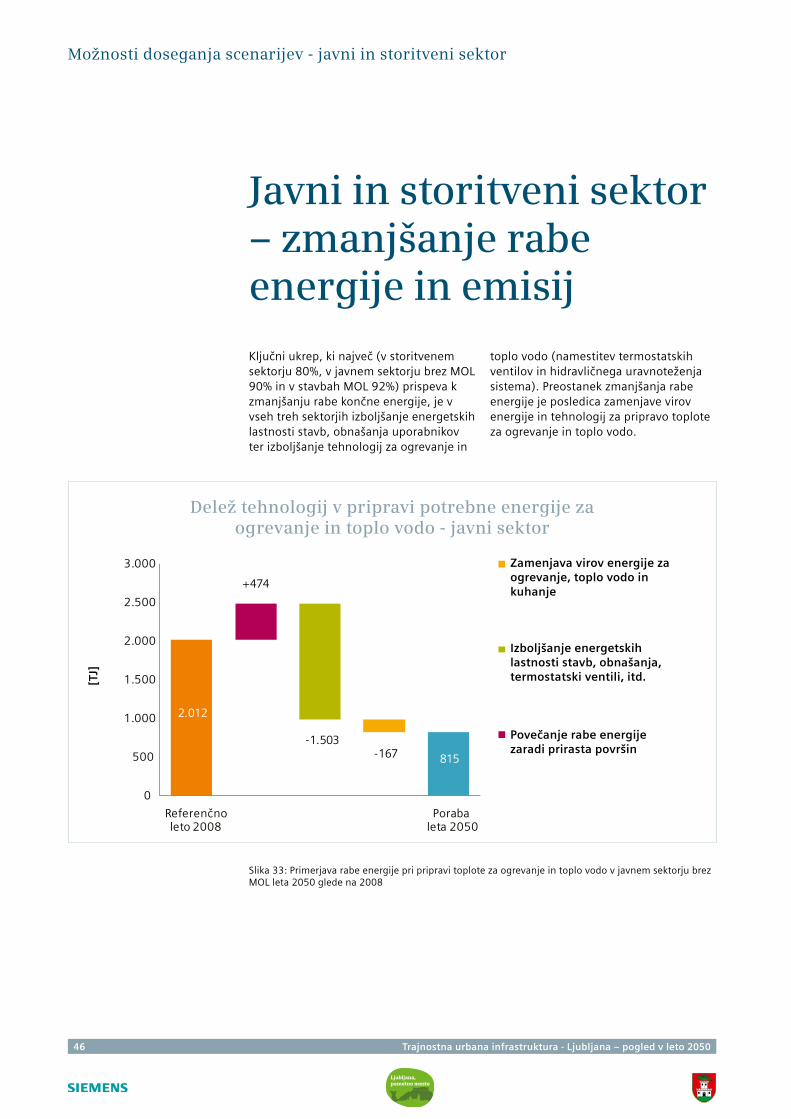
Javni in storitveni sektor – zmanjšanje rabe energije in emisij
Ključni ukrep, ki največ (v storitvenem sektorju 80%, v javnem sektorju brez MOL 90% in v stavbah MOL 92%) prispeva k zmanjšanju rabe končne energije, je v vseh treh sektorjih izboljšanje energetskih lastnosti stavb, obnašanja uporabnikov ter izboljšanje tehnologij za ogrevanje in
toplo vodo (namestitev termostatskih ventilov in hidravličnega uravnoteženja sistema). Preostanek zmanjšanja rabe energije je posledica zamenjave virov energije in tehnologij za pripravo toplote za ogrevanje in toplo vodo.
Slika 33: Primerjava rabe energije pri pripravi toplote za ogrevanje in toplo vodo v javnem sektorju brez MOL leta 2050 glede na 2008
Možnosti doseganja scenarijev - javni in storitveni sektor
Delež tehnologij v pripravi potrebne energije za ogrevanje in toplo vodo - javni sektor
Zamenjava virov energije za ogrevanje, toplo vodo in kuhanje
Povečanje rabe energije zaradi prirasta površin
Izboljšanje energetskih lastnosti stavb, obnašanja, termostatski ventili, itd.[T
J]
0
500
1.000
1.500
2.000
2.500
3.000
Referenčno leto 2008
Poraba leta 2050
+474
-1.503-167
2.012
815
Trajnostna urbana infrastruktura - Ljubljana – pogled v leto 2050 47
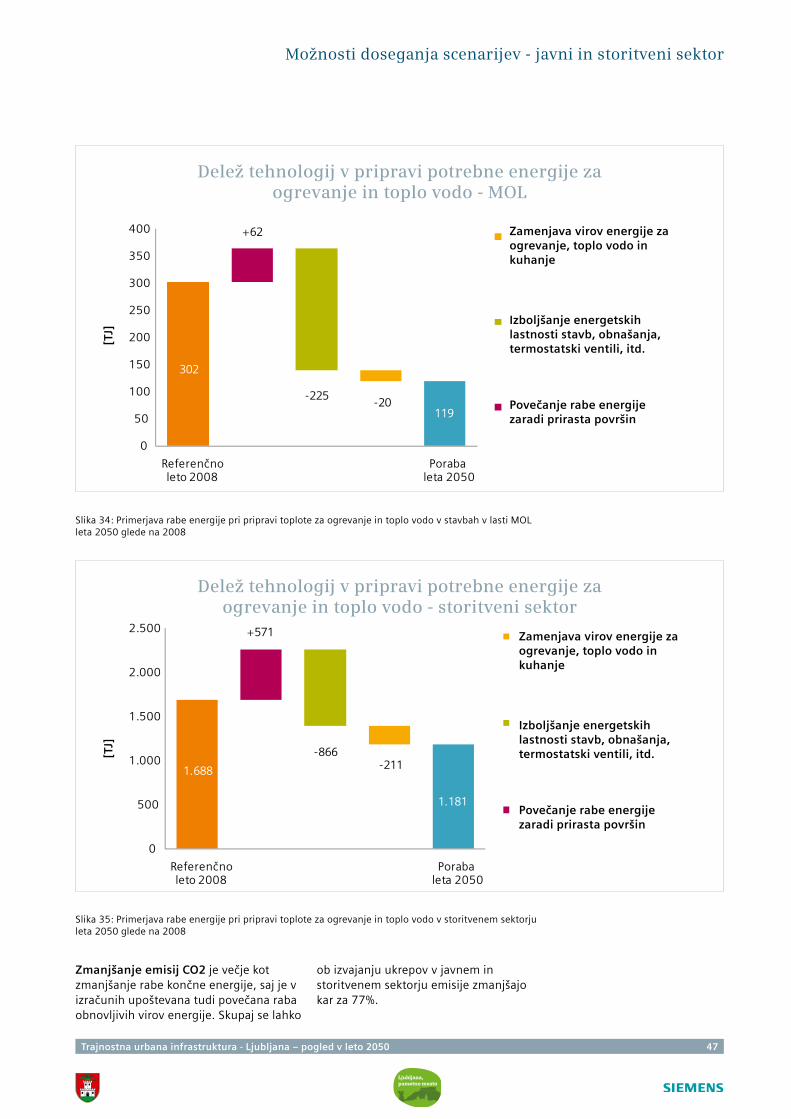
Zmanjšanje emisij CO2 je večje kot zmanjšanje rabe končne energije, saj je v izračunih upoštevana tudi povečana raba obnovljivih virov energije. Skupaj se lahko
ob izvajanju ukrepov v javnem in storitvenem sektorju emisije zmanjšajo kar za 77%.
Slika 34: Primerjava rabe energije pri pripravi toplote za ogrevanje in toplo vodo v stavbah v lasti MOL leta 2050 glede na 2008
Slika 35: Primerjava rabe energije pri pripravi toplote za ogrevanje in toplo vodo v storitvenem sektorju leta 2050 glede na 2008
Možnosti doseganja scenarijev - javni in storitveni sektor
Delež tehnologij v pripravi potrebne energije za ogrevanje in toplo vodo - MOL
Delež tehnologij v pripravi potrebne energije za ogrevanje in toplo vodo - storitveni sektor
[TJ]
[TJ]
0
50
100
150
200
250
300
350
400
Referenčno leto 2008
Poraba leta 2050
+62
-225-20
302
119
0
500
1.000
1.500
2.000
2.500
Referenčno leto 2008
Poraba leta 2050
+571
-866-2111.688
1.181
Zamenjava virov energije za ogrevanje, toplo vodo in kuhanje
Povečanje rabe energije zaradi prirasta površin
Izboljšanje energetskih lastnosti stavb, obnašanja, termostatski ventili, itd.
Zamenjava virov energije za ogrevanje, toplo vodo in kuhanje
Povečanje rabe energije zaradi prirasta površin
Izboljšanje energetskih lastnosti stavb, obnašanja, termostatski ventili, itd.
48 Trajnostna urbana infrastruktura - Ljubljana – pogled v leto 2050
Javni in storitveni sektor – zgodbi o uspehu
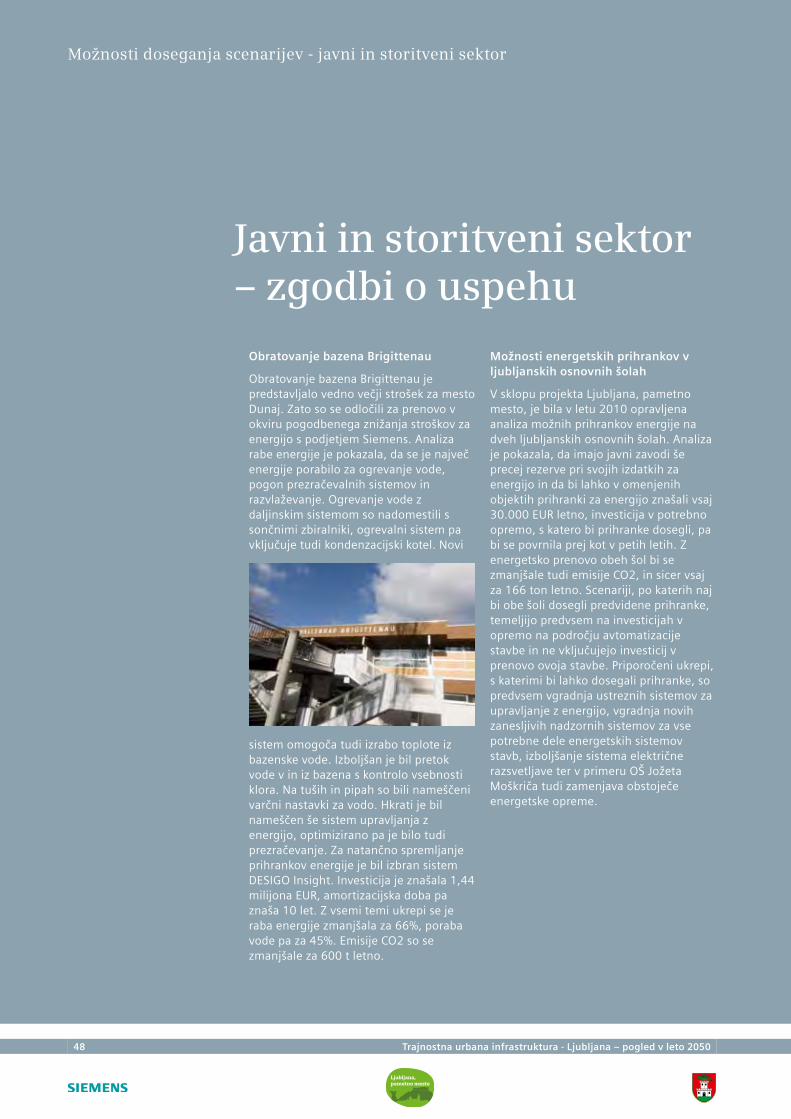
sistem omogoča tudi izrabo toplote iz bazenske vode. Izboljšan je bil pretok vode v in iz bazena s kontrolo vsebnosti klora. Na tuših in pipah so bili nameščeni varčni nastavki za vodo. Hkrati je bil nameščen še sistem upravljanja z energijo, optimizirano pa je bilo tudi prezračevanje. Za natančno spremljanje prihrankov energije je bil izbran sistem DESIGO Insight. Investicija je znašala 1,44 milijona EUR, amortizacijska doba pa znaša 10 let. Z vsemi temi ukrepi se je raba energije zmanjšala za 66%, poraba vode pa za 45%. Emisije CO2 so se zmanjšale za 600 t letno.
Možnosti energetskih prihrankov v ljubljanskih osnovnih šolah
V sklopu projekta Ljubljana, pametno mesto, je bila v letu 2010 opravljena analiza možnih prihrankov energije na dveh ljubljanskih osnovnih šolah. Analiza je pokazala, da imajo javni zavodi še precej rezerve pri svojih izdatkih za energijo in da bi lahko v omenjenih objektih prihranki za energijo znašali vsaj 30.000 EUR letno, investicija v potrebno opremo, s katero bi prihranke dosegli, pa bi se povrnila prej kot v petih letih. Z energetsko prenovo obeh šol bi se zmanjšale tudi emisije CO2, in sicer vsaj za 166 ton letno. Scenariji, po katerih naj bi obe šoli dosegli predvidene prihranke, temeljijo predvsem na investicijah v opremo na področju avtomatizacije stavbe in ne vključujejo investicij v prenovo ovoja stavbe. Priporočeni ukrepi, s katerimi bi lahko dosegali prihranke, so predvsem vgradnja ustreznih sistemov za upravljanje z energijo, vgradnja novih zanesljivih nadzornih sistemov za vse potrebne dele energetskih sistemov stavb, izboljšanje sistema električne razsvetljave ter v primeru OŠ Jožeta Moškriča tudi zamenjava obstoječe energetske opreme.
Možnosti doseganja scenarijev - javni in storitveni sektor
Obratovanje bazena Brigittenau
Obratovanje bazena Brigittenau je predstavljalo vedno večji strošek za mesto Dunaj. Zato so se odločili za prenovo v okviru pogodbenega znižanja stroškov za energijo s podjetjem Siemens. Analiza rabe energije je pokazala, da se je največ energije porabilo za ogrevanje vode, pogon prezračevalnih sistemov in razvlaževanje. Ogrevanje vode z daljinskim sistemom so nadomestili s sončnimi zbiralniki, ogrevalni sistem pa vključuje tudi kondenzacijski kotel. Novi
Trajnostna urbana infrastruktura - Ljubljana – pogled v leto 2050 49
Tipični ukrepi energetske politike na področju prometa, ki jih nekatere države že izvajajo, so:
• ukrepi davčne politike: obdavčenje goriv in vozil ter dajatve za uporabo cest glede na okoljske kriterije s postopnim povečanjem razpona davčnih stopenj;
• zmanjševanje specifične porabe novih vozil: uredba 443/2009 Evropskega parlamenta o določitvi standardov emisijskih vrednosti za nove osebne avtomobile, informiranje kupcev o specifičnih emisijah CO2 pri nakupu novega avtomobila, spodbujanje nakupa hibridnih vozil idr.;
• spodbude za uvajanje električnih akumulatorskih vozil in vozil na vodik ter spodbujanje razvoja in izgradnje polnilne infrastrukture za električna vozila;
• zelena javna naročila;
• uvajanje biogoriv in ostalih obnovljivih virov energije v prometu;
• boljše vzdrževanje vozil, redni nadzor nad izpušnimi plini, boljše spremljanje prometa, omejitve hitrosti idr.;
• informacijske in promocijske akcije za spodbujanje varčnejše vožnje in trajnostnih oblik prevoza.
Ljubljana lahko doseže ciljni scenarij in scenarij trajnostne odličnosti, če bo pri tem upoštevala naslednje dejavnike, katerih učinke podrobneje opisujemo v nadaljevanju poročila:
• dostopen, učinkovit, cenovno sprejemljiv javni promet in trajnostna prometna infrastruktura (železniška in cestna, ki sta obe investicijsko izjemno zahtevni);
• širjenje omrežja kolesarskih stez in območij za pešce;
• sprememba strukture voznega parka za osebna vozila;
• sprememba strukture voznega parka za avtobuse mestnega prometa;
• sprememba deležev potniških kilometrov.
Promet – ukrepi in učinki za nižanje emisij
Možnosti doseganja scenarijev - promet
50 Trajnostna urbana infrastruktura - Ljubljana – pogled v leto 2050
Promet – struktura potniških kilometrov
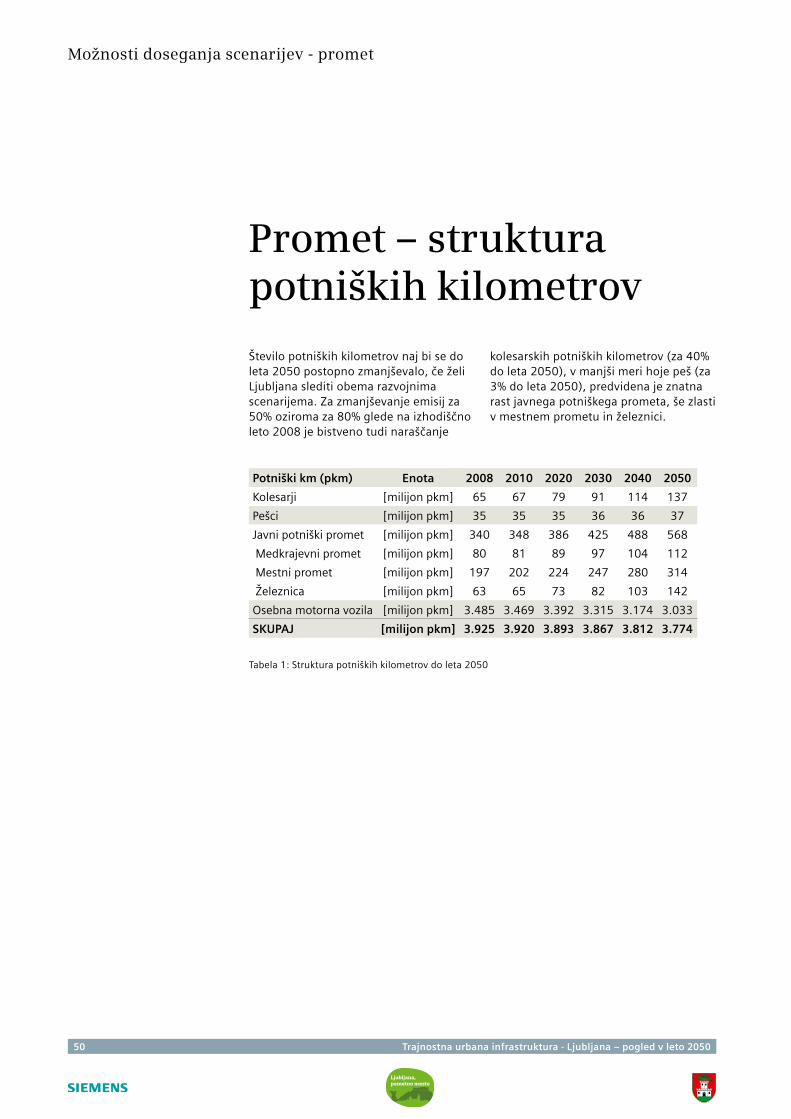
Število potniških kilometrov naj bi se do leta 2050 postopno zmanjševalo, če želi Ljubljana slediti obema razvojnima scenarijema. Za zmanjševanje emisij za 50% oziroma za 80% glede na izhodiščno leto 2008 je bistveno tudi naraščanje
kolesarskih potniških kilometrov (za 40% do leta 2050), v manjši meri hoje peš (za 3% do leta 2050), predvidena je znatna rast javnega potniškega prometa, še zlasti v mestnem prometu in železnici.
Možnosti doseganja scenarijev - promet
Tabela 1: Struktura potniških kilometrov do leta 2050
Potniški km (pkm) Enota 2008 2010 2020 2030 2040 2050
Kolesarji [milijon pkm] 65 67 79 91 114 137
Pešci [milijon pkm] 35 35 35 36 36 37
Javni potniški promet [milijon pkm] 340 348 386 425 488 568
Medkrajevni promet [milijon pkm] 80 81 89 97 104 112
Mestni promet [milijon pkm] 197 202 224 247 280 314
Železnica [milijon pkm] 63 65 73 82 103 142
Osebna motorna vozila [milijon pkm] 3.485 3.469 3.392 3.315 3.174 3.033
SKUPAJ [milijon pkm] 3.925 3.920 3.893 3.867 3.812 3.774
Trajnostna urbana infrastruktura - Ljubljana – pogled v leto 2050 51
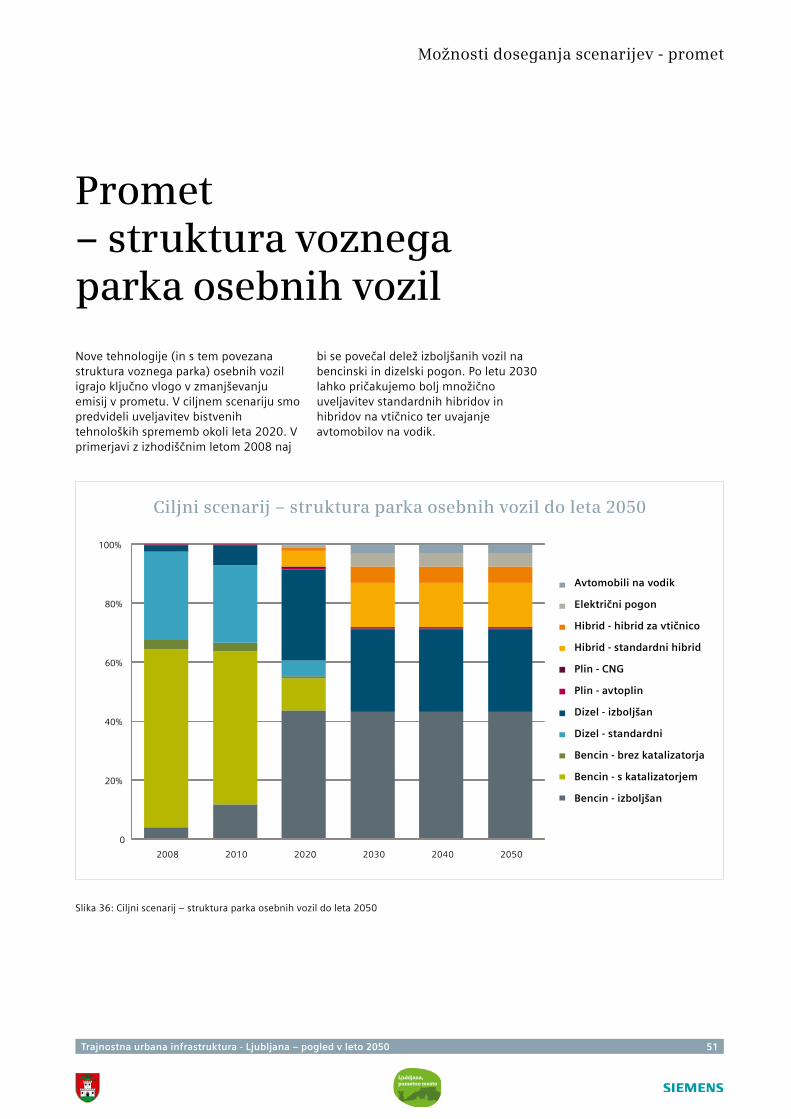
Nove tehnologije (in s tem povezana struktura voznega parka) osebnih vozil igrajo ključno vlogo v zmanjševanju emisij v prometu. V ciljnem scenariju smo predvideli uveljavitev bistvenih tehnoloških sprememb okoli leta 2020. V primerjavi z izhodiščnim letom 2008 naj
bi se povečal delež izboljšanih vozil na bencinski in dizelski pogon. Po letu 2030 lahko pričakujemo bolj množično uveljavitev standardnih hibridov in hibridov na vtičnico ter uvajanje avtomobilov na vodik.
Možnosti doseganja scenarijev - promet
Promet – struktura voznega parka osebnih vozil
Slika 36: Ciljni scenarij – struktura parka osebnih vozil do leta 2050
Ciljni scenarij – struktura parka osebnih vozil do leta 2050
Avtomobili na vodik
Električni pogon
Hibrid - hibrid za vtičnico
Hibrid - standardni hibrid
Plin - CNG
Plin - avtoplin
Dizel - izboljšan
Dizel - standardni
Bencin - brez katalizatorja
Bencin - s katalizatorjem
Bencin - izboljšan
2008 2010 2020 2030 2040 2050
0
20%
40%
60%
80%
100%
52 Trajnostna urbana infrastruktura - Ljubljana – pogled v leto 2050
Možnosti doseganja scenarijev - promet
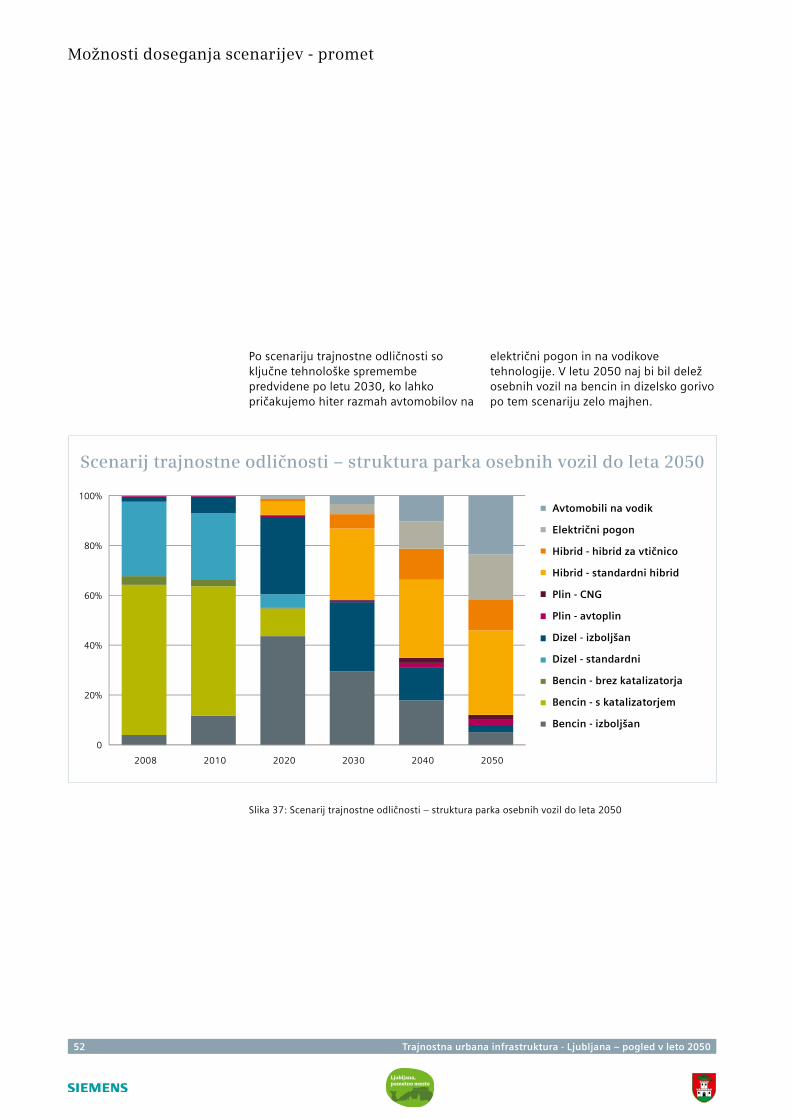
Slika 37: Scenarij trajnostne odličnosti – struktura parka osebnih vozil do leta 2050
Scenarij trajnostne odličnosti – struktura parka osebnih vozil do leta 2050
Avtomobili na vodik
Električni pogon
Hibrid - hibrid za vtičnico
Hibrid - standardni hibrid
Plin - CNG
Plin - avtoplin
Dizel - izboljšan
Dizel - standardni
Bencin - brez katalizatorja
Bencin - s katalizatorjem
Bencin - izboljšan
Po scenariju trajnostne odličnosti so ključne tehnološke spremembe predvidene po letu 2030, ko lahko pričakujemo hiter razmah avtomobilov na
električni pogon in na vodikove tehnologije. V letu 2050 naj bi bil delež osebnih vozil na bencin in dizelsko gorivo po tem scenariju zelo majhen.
0
20%
40%
60%
80%
100%
2008 2010 2020 2030 2040 2050
Trajnostna urbana infrastruktura - Ljubljana – pogled v leto 2050 53
Promet – nižanje emisij
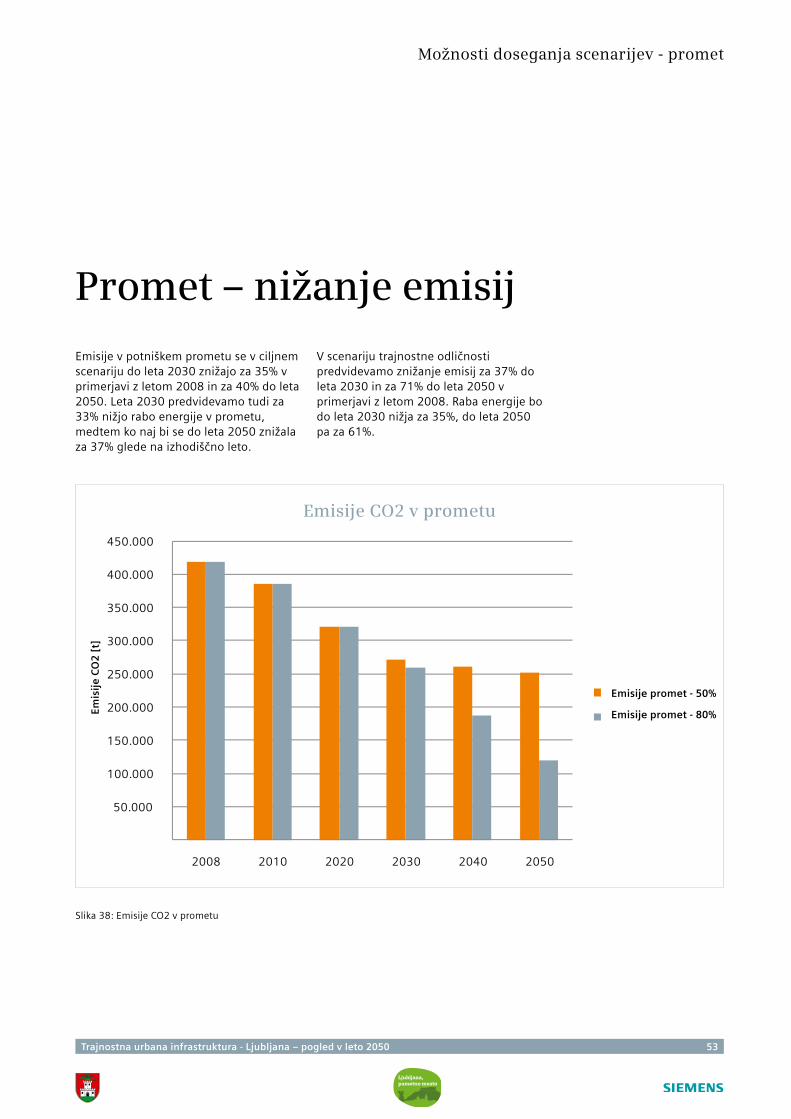
Emisije v potniškem prometu se v ciljnem scenariju do leta 2030 znižajo za 35% v primerjavi z letom 2008 in za 40% do leta 2050. Leta 2030 predvidevamo tudi za 33% nižjo rabo energije v prometu, medtem ko naj bi se do leta 2050 znižala za 37% glede na izhodiščno leto.
V scenariju trajnostne odličnosti predvidevamo znižanje emisij za 37% do leta 2030 in za 71% do leta 2050 v primerjavi z letom 2008. Raba energije bo do leta 2030 nižja za 35%, do leta 2050 pa za 61%.
Možnosti doseganja scenarijev - promet
Slika 38: Emisije CO2 v prometu
Emisije CO2 v prometu
Emis
ije
CO
2 [
t]
Emisije promet - 50%
Emisije promet - 80%
50.000
100.000
150.000
200.000
250.000
300.000
350.000
400.000
450.000
2008 2010 2020 2030 2040 2050
54 Trajnostna urbana infrastruktura - Ljubljana – pogled v leto 2050
Možnosti doseganja scenarijev – oskrba s toploto
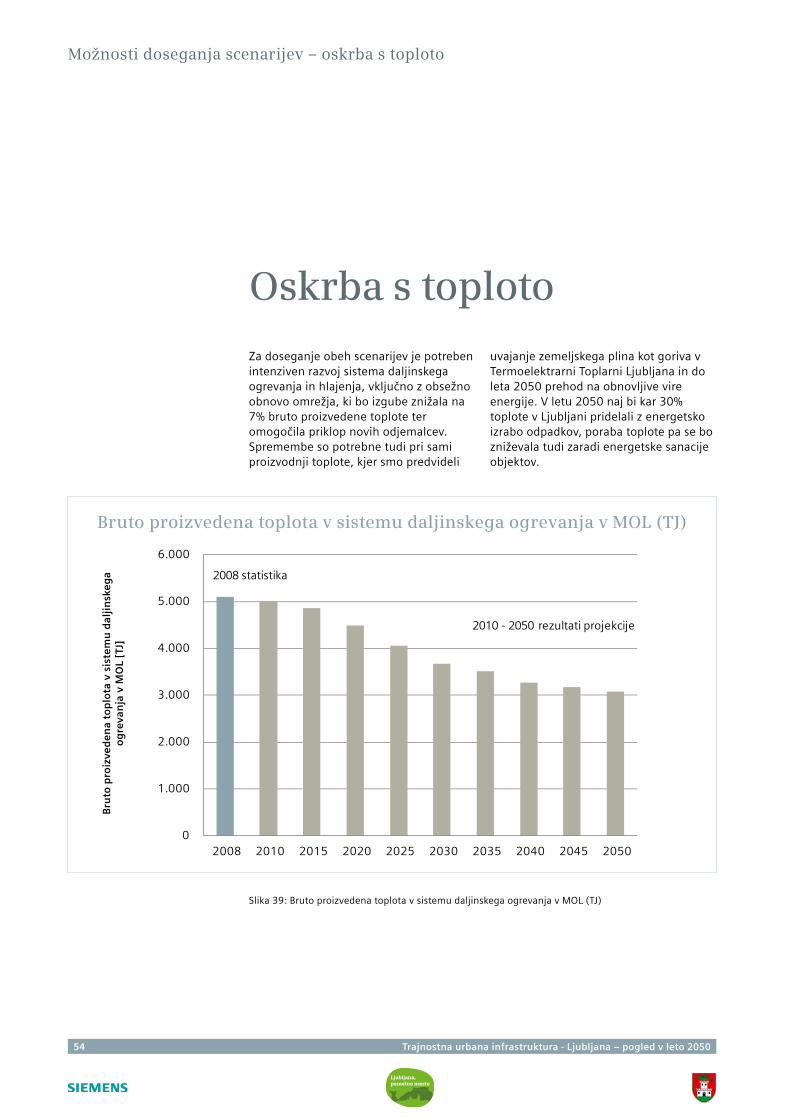
Za doseganje obeh scenarijev je potreben intenziven razvoj sistema daljinskega ogrevanja in hlajenja, vključno z obsežno obnovo omrežja, ki bo izgube znižala na 7% bruto proizvedene toplote ter omogočila priklop novih odjemalcev. Spremembe so potrebne tudi pri sami proizvodnji toplote, kjer smo predvideli
uvajanje zemeljskega plina kot goriva v Termoelektrarni Toplarni Ljubljana in do leta 2050 prehod na obnovljive vire energije. V letu 2050 naj bi kar 30% toplote v Ljubljani pridelali z energetsko izrabo odpadkov, poraba toplote pa se bo zniževala tudi zaradi energetske sanacije objektov.
Oskrba s toploto
Slika 39: Bruto proizvedena toplota v sistemu daljinskega ogrevanja v MOL (TJ)
Bruto proizvedena toplota v sistemu daljinskega ogrevanja v MOL (TJ)
Bru
to p
roiz
ved
en
a to
plo
ta v
sis
tem
u d
alji
nsk
eg
a o
gre
van
ja v
MO
L [T
J]
0
1.000
2.000
3.000
4.000
5.000
6.000
2008 2010 2015 2020 2025 2030 2035 2040 2045 2050
2008 statistika
2010 - 2050 rezultati projekcije
Trajnostna urbana infrastruktura - Ljubljana – pogled v leto 2050 55
Možnosti doseganja scenarijev – oskrba z vodo
Oskrba s pitno vodo
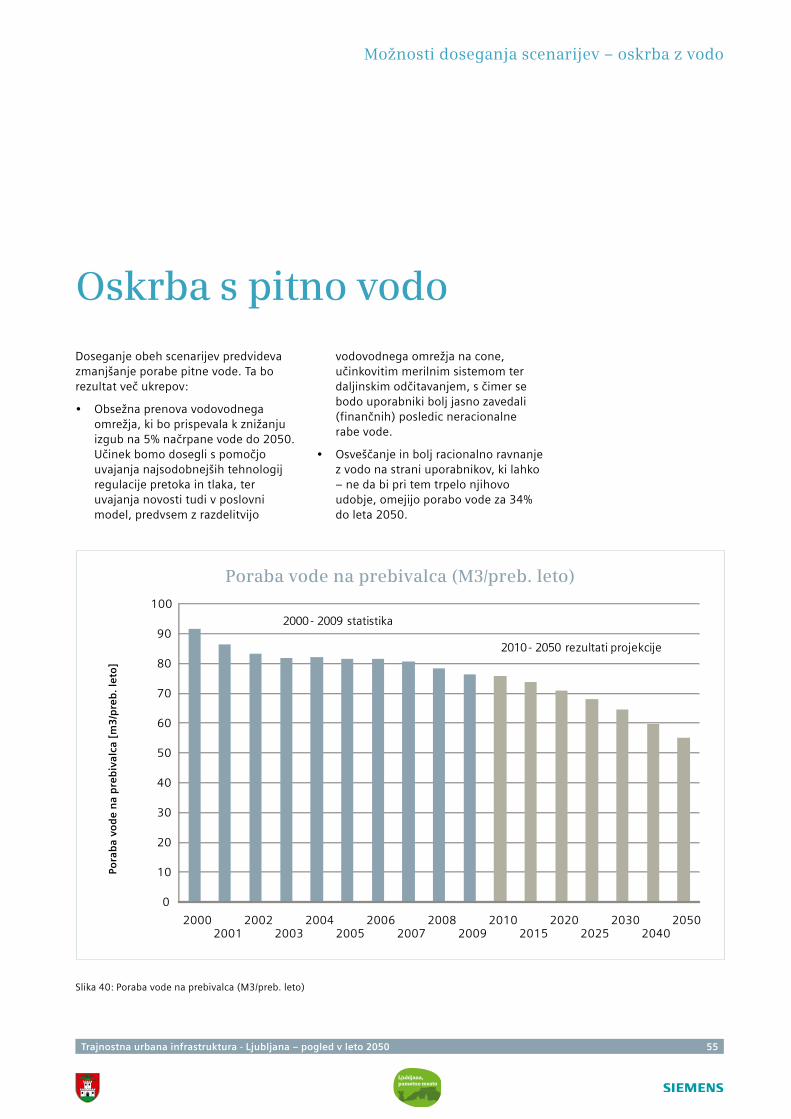
Doseganje obeh scenarijev predvideva zmanjšanje porabe pitne vode. Ta bo rezultat več ukrepov:
• Obsežna prenova vodovodnega omrežja, ki bo prispevala k znižanju izgub na 5% načrpane vode do 2050. Učinek bomo dosegli s pomočjo uvajanja najsodobnejših tehnologij regulacije pretoka in tlaka, ter uvajanja novosti tudi v poslovni model, predvsem z razdelitvijo
vodovodnega omrežja na cone, učinkovitim merilnim sistemom ter daljinskim odčitavanjem, s čimer se bodo uporabniki bolj jasno zavedali (finančnih) posledic neracionalne rabe vode.
• Osveščanje in bolj racionalno ravnanje z vodo na strani uporabnikov, ki lahko – ne da bi pri tem trpelo njihovo udobje, omejijo porabo vode za 34% do leta 2050.
Slika 40: Poraba vode na prebivalca (M3/preb. leto)
Poraba vode na prebivalca (M3/preb. leto)
Pora
ba
vod
e n
a p
reb
ival
ca [
m3
/pre
b. l
eto
]
0
10
20
30
40
50
60
70
80
90
100
20002001
20022003
20042005
20062007
20082009
20102015
20202025
20302040
2050
2000- 2009 statistika
2010- 2050 rezultati projekcije

56 Trajnostna urbana infrastruktura - Ljubljana – pogled v leto 2050
Trajnostna urbana infrastruktura - Ljubljana – pogled v leto 2050 57
IV. Ukrepi Mestne občine Ljubljana
Znano je, da imajo mestne oblasti pri doseganju ambicioznih okoljskih ciljev razmeroma omejen vpliv, večji del zaslug za zmanjševanje rabe energije in emisij s svojimi odločitvami nosijo organizacije in posamezniki. V tem poglavju podajamo natančen uvid v prve ukrepe, ki bi jih lahko na področju oskrbe z energijo v
stavbah, ki jih ima v lasti, sprejela Mestna občina Ljubljana, analiziramo finančne posledice takšnih odločitev in s tem ustvarjamo zgled, ki mu lahko sledijo druge občine, predvsem pa lastniki in upravniki stavb organizacij zasebnega in javnega sektorja.
58 Trajnostna urbana infrastruktura - Ljubljana – pogled v leto 2050
Ovire, priložnosti in ukrepi
Na poti učinkovitega upravljanja z energijo stoji več ovir. Tehnološke možnosti niso v celoti izkoriščene, energija pa je s strani uporabnikov prepoznana kot strošek, na katerega imamo zelo omejen vpliv. Sistem stimulacij za racionalno ravnanje z energijo je v pripravi, prav tako formalne zaveze k spoštovanju ciljev skrbnega ravnanja z energijo.
Priložnosti učinkovitega upravljanja z energijo:
• S prehodom v nizkoogljično družbo se vzpostavljajo trgi zelenih produktov, storitev in rešitev, ki so bili na dosedanjo ekonomsko krizo imuni.
• Storitve na področju zelenih tehnologij in učinkovitega upravljanja z energijo so lahko dodaten produkt ali storitev, ki ga na trgu ponujajo javna podjetja v MOL. S tem okrepijo zvestobo strank in ustvarijo dodatne vire prihodkov.
• Z investiranjem v energetsko učinkovitost (Sistem za upravljanje z energijo v objektih MOL) je mogoče že zelo hitro dosegati visoke prihranke: 708.000 EUR na letni ravni, investicija v potrebno opremo znaša 4,15 milijona EUR in se povrne v 5,5 letih.
Ukrepi za doseganje učinkov:
• Organizacijski ukrepi (model sistematičnega upravljanja z energijo, uvedba poslovne funkcije, pristojne za upravljanje z energijo).
• Investicijski ukrepi (strojna in programska oprema za izvajanje sistematičnega upravljanja z energijo v objektih v lasti MOL, energetska obnova stavb, zamenjava energetskih virov).
• Ukrepi na področju človeških virov (prilagoditev politike določanja plač na podlagi uspešnosti in doseganja ciljev, jasen sistem stimuliranja za učinkovitost, ozaveščanje vseh zaposlenih).
• Vključevanje nabav v sistem upravljanja z energijo.
Ukrepi Mestne občine Ljubljana
Trajnostna urbana infrastruktura - Ljubljana – pogled v leto 2050 59
Ukrepi Mestne občine Ljubljana
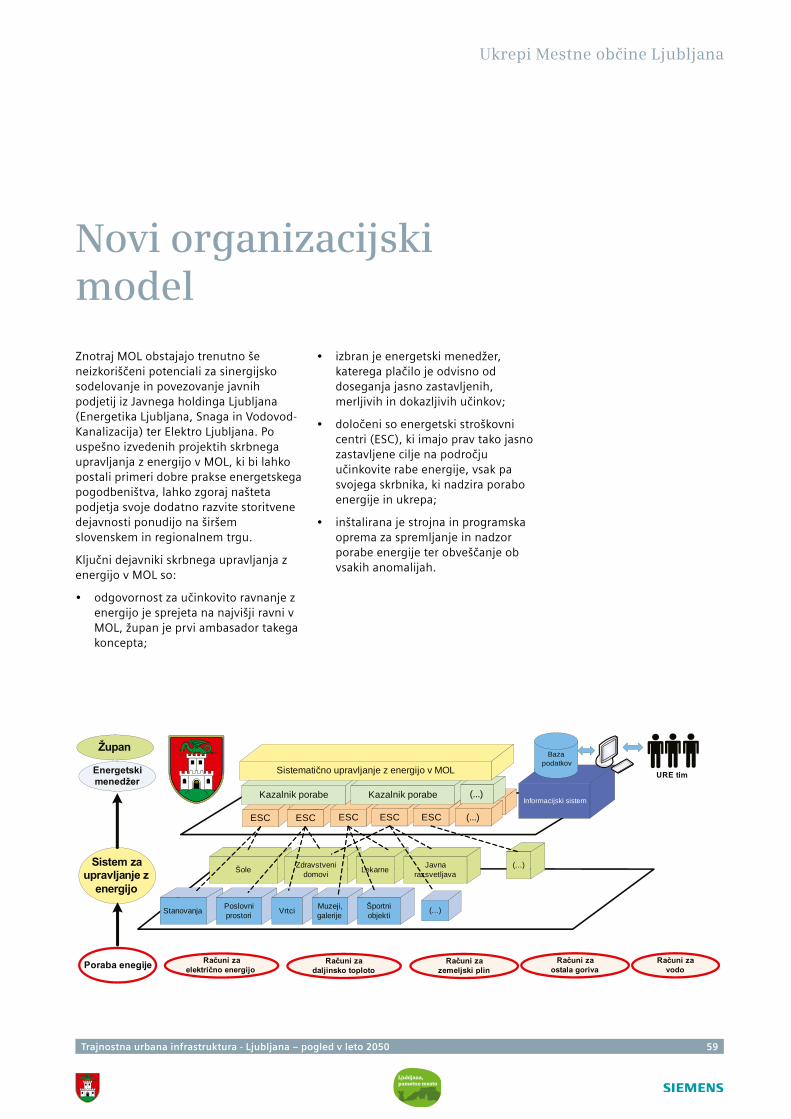
Novi organizacijski model
Znotraj MOL obstajajo trenutno še neizkoriščeni potenciali za sinergijsko sodelovanje in povezovanje javnih podjetij iz Javnega holdinga Ljubljana (Energetika Ljubljana, Snaga in Vodovod-Kanalizacija) ter Elektro Ljubljana. Po uspešno izvedenih projektih skrbnega upravljanja z energijo v MOL, ki bi lahko postali primeri dobre prakse energetskega pogodbeništva, lahko zgoraj našteta podjetja svoje dodatno razvite storitvene dejavnosti ponudijo na širšem slovenskem in regionalnem trgu.
Ključni dejavniki skrbnega upravljanja z energijo v MOL so:
• odgovornost za učinkovito ravnanje z energijo je sprejeta na najvišji ravni v MOL, župan je prvi ambasador takega koncepta;
• izbran je energetski menedžer, katerega plačilo je odvisno od doseganja jasno zastavljenih, merljivih in dokazljivih učinkov;
• določeni so energetski stroškovni centri (ESC), ki imajo prav tako jasno zastavljene cilje na področju učinkovite rabe energije, vsak pa svojega skrbnika, ki nadzira porabo energije in ukrepa;
• inštalirana je strojna in programska oprema za spremljanje in nadzor porabe energije ter obveščanje ob vsakih anomalijah.
ETCESC
ETCESC
ETCESC
Stanovanja
Energetski menedžer
Župan
Sistem za upravljanje z
energijo
Računi za električno energijo
Računi za daljinsko toploto
Računi za zemeljski plin
Računi za vodo
Šole Zdravstveni domovi Lekarne Javna
razsvetljava
Poslovni prostori Vrtci Muzeji,
galerijeŠportni objekti
(...)
Poraba enegije
Kazalnik porabeETC
ESCETC
ESCETC
(...)
Kazalnik porabe (...)
Sistematično upravljanje z energijo v MOL
Informacijski sistem
(...)
Baza podatkov
URE tim
Računi za ostala goriva
60 Trajnostna urbana infrastruktura - Ljubljana – pogled v leto 2050
V okviru študije smo ocenili, da bi proces vzpostavitve sistema za upravljanje z energijo v MOL trajal štiri leta in potekal v več fazah:
• vzpostavitev organizacijske strukture za sistematično upravljanje z energijo v vseh objektih v lasti MOL;
• vzpostavitev predlaganih energetskih stroškovnih centrov ter določitev kazalnikov za merjenje učinkovitosti;
• vzpostavitev informacijskega sistema za upravljanje z energijo v objektih v lasti MOL;
• implementacija in spremljanje učinkov, morebitne korekcije zastavljenih ciljev;
• usposabljanje in motivacija vseh zaposlenih v MOL;
• komunikacija z zainteresiranimi javnostmi ter ocena napredka.
Stroški zgoraj omenjenih aktivnosti, ki so povezane z vzpostavitvijo sistema za upravljanje z energijo v vseh objetih v lasti MOL, so ocenjeni na 4,15 milijona EUR. V navedenem znesku so upoštevane naslednje vrste stroškov:
• informacijski sistem za upravljanje z energijo;
• dodatna merilna oprema;
• vzpostavitev sistema;
• izvajanje in spremljanje mehkih ukrepov (npr. pravilna uporaba termostatskih ventilov, uvajanje koncepta ekološke odgovornosti, motivacijsko – izobraževalne aktivnosti za zaposlene itn.);
• komuniciranje z javnostmi;
• približno 60% zgoraj omenjenih stroškov predstavljajo stroški nove strojne in programske opreme.
Ukrepi Mestne občine Ljubljana

Trajnostna urbana infrastruktura - Ljubljana – pogled v leto 2050 61
www.ljubljanapametnomesto.si
Sustainable Urban InfrastructureLjubljana – A View to 2050Research project of the City of Ljubljana, Centre for Energy Efficiency at the Jožef Stefan Institute and Siemens
www.siemens.si
Publisher: Siemens d.o.o.Bratislavska 51000 Ljubljana
For the publisher: Martina Merslavič
Commissioned by:Siemens d.o.o.
Research project written and compiled by:Centre for Energy Efficiency at the Jožef Stefan Institute
Project coordinators for the client: Nataša Jazbinšek Seršen, Department of Environmental Protection at the City of LjubljanaMartina Merslavič, head of corporate communication, Siemens d.o.o.
Text: Martina Merslavič
Executive design: Jan Jereb
Printed by: Tiskarna Pleško
Photographs: B. Čeak, M. Lenardič, Archives of City of Ljubljana and Siemens
This study represents a source of information that may serve as a basis for decision-making. All calculations have been made carefully and with all relevant expertise, but they are based on assumptions that may change in the
future. The authors and client therefore accept no liability whatsoever for the consequences of decisions, measures or activities implemented on the basis of this study.
Siemens d.o.o. Bratislavska 5 SI-1000 Ljubljana Slovenija
Tel: 01 4746 100
ContentsI. Vision and strategic framework 5
Unique nature of the study 6
Context of study 7
Relevance of the study 8
Methodology 9
Summary of key findings 10
II. Input data and assumptions 13
GDP projections to 2050 14
Projection of energy prices up to 2050 15
Share of City of Ljubljana in Slovenian energy consumption 17
Structure of energy use and costs in buildings owned by City of Ljubljana 18
Structure of energy use and costs in industry 19
Growth in the number of inhabitants and households 20
Buildings surface area in the public and service sectors 21
Transport – consumption per kilometre travelled 22
III. Possibilities for achieving the scenarios 25
Industry 26
Households 32
Public and service sectors 41
Transport 49
Heat supply 54
Drinking water supply 55
IV. Measures in City of Ljubljana and public companies 57
Barriers, opportunities and measures 58
New organisational model 59

4 Sustainable Urban Infrastructure - Ljubljana – A View to 2050
Sustainable Urban Infrastructure - Ljubljana – A View to 2050 5
I. Vision and strategic framework
With their environmental impact, cities are an extremely important factor in climate change – both positive and negative. Given their commercial power, they play a decisive part in the economic development of entire countries. Just like commercial organisations, cities operate in a heavily globalised, competitive environment, where they strive for growth and progress through the creation of jobs and good living conditions, and
by offering outstanding services to individuals and organisations. The city administration of Ljubljana is striving for sustainable growth and for a constant enhancement of the quality of life. Regardless of the time frame of its mandate, the administration is seeking to implement measures right now that will lay the ground for future generations to enjoy an environment suitable for creativity and living.
6 Sustainable Urban Infrastructure - Ljubljana – A View to 2050
Unique nature of the study
No such study has previously been conducted in Slovenia on the city level. Related strategic documents have been set for a shorter perspective: up to 2030 (National Energy Programme) and 2020 (Local Energy Concept).
According to our information, there are few cities that would conduct similar projects of research and analysis. Ljubljana is therefore in the elite company of a few Western European capitals that have decided they wish to embark today on the path of environmental sustainability.
The findings of similar international analytical projects in Munich, London, Dublin and Berlin indeed show that cities have great potential for improving their environmental efficiency – and here, the positive effects even stretch into the areas of urban economics, quality of life and thereby also the international competitiveness of cities.
Vision and strategic framework
Sustainable Urban Infrastructure - Ljubljana – A View to 2050 7
Context of study
This study has been produced as part of the project Ljubljana, Smart City, in which the City of Ljubljana in cooperation with the Siemens company is developing, communicating and promoting its projects and achievements in the area of environmental efficiency.
Developing a city is a long-term process. The current City of Ljubljana administration is striving for long-term, sustainable development of the city irrespective of the time limitations of its current term in office. The study therefore provides a glimpse of the factors that can influence that development. Projections have been made up to 2050.
Ljubljana accounts for a high proportion of energy consumption and generation of emissions in Slovenia. It will not be possible to achieve the ambitious environmental targets solely through measures implemented by the city authorities. The transition to sustainable excellence of the capital city cannot therefore be merely an issue for the city, rather it is a national issue, where solutions will necessarily require the active participation of the state, organisations and individuals.
The investments in technology and infrastructure required to enable the path to a society of sustainable excellence will be high, so there needs to be consensus between city and national structures, organisations and individuals. This study serves as a starting point for dialogue that can lead to such consensus. It offers measures that might lead to achieving the targets.
The city authorities of the Danish capital, Copenhagen, established a plan of environmental efficiency and sustainable development back in 1970, when the oil crisis prompted them to reduce their energy dependence on oil. They set environmental guidelines that they have been pursuing systematically now for decades, and this is yielding rewards. This study serves as a starting point for establishing long-term environmental policies on the city level. Through this study the city authorities are demonstrating that their orientation is long-term, strategic and target-based, and above all that they recognise the coming challenges and have addressed them today, even though they may not bear responsibility for ultimately facing them.
Vision and strategic framework
8 Sustainable Urban Infrastructure - Ljubljana – A View to 2050
Relevance of the study
Energy represents a high cost in the budget of any organisation. Energy saving is an important environmental target, and at the same time an exceptional business opportunity.
In 2008 Slovenia recorded total annual costs of all consumption of primary energy of EUR 1.95 billion (5.2% of gross domestic product).
• Around 80% of the energy is consumed in urban settlements and cities, meaning that urban settlements and cities account for EUR 1.6 billion of the energy costs.
• Reducing energy consumption by 20% on the urban settlement and city level could save around EUR 312 million/year, or almost 1% of the 2008 GDP.
On the City of Ljubljana level, too, energy consumption is a major item in operational economics:
• The cost of energy in City of Ljubljana buildings and structures in 2008 amounted to EUR 5.9 million (approximately 2% of the city budget for 2008).
• By introducing systematic energy management, we could reduce energy costs on an annual level by EUR 708,000 (this amount compares to the budget item “transfers to unemployed persons” – unemployment benefit – for 2008).
• The investment required to achieve these savings has been estimated at EUR 4.15 million, and its return period is 5.5 years.
• Using the business model of energy contracting, it would be possible for City of Ljubljana not to have to carry out any direct investments to make such savings, and after six years it could “sustain” the achieved energy savings (the life cycle of equipment envisaged for such savings is generally more than 10 years).
Vision and strategic framework
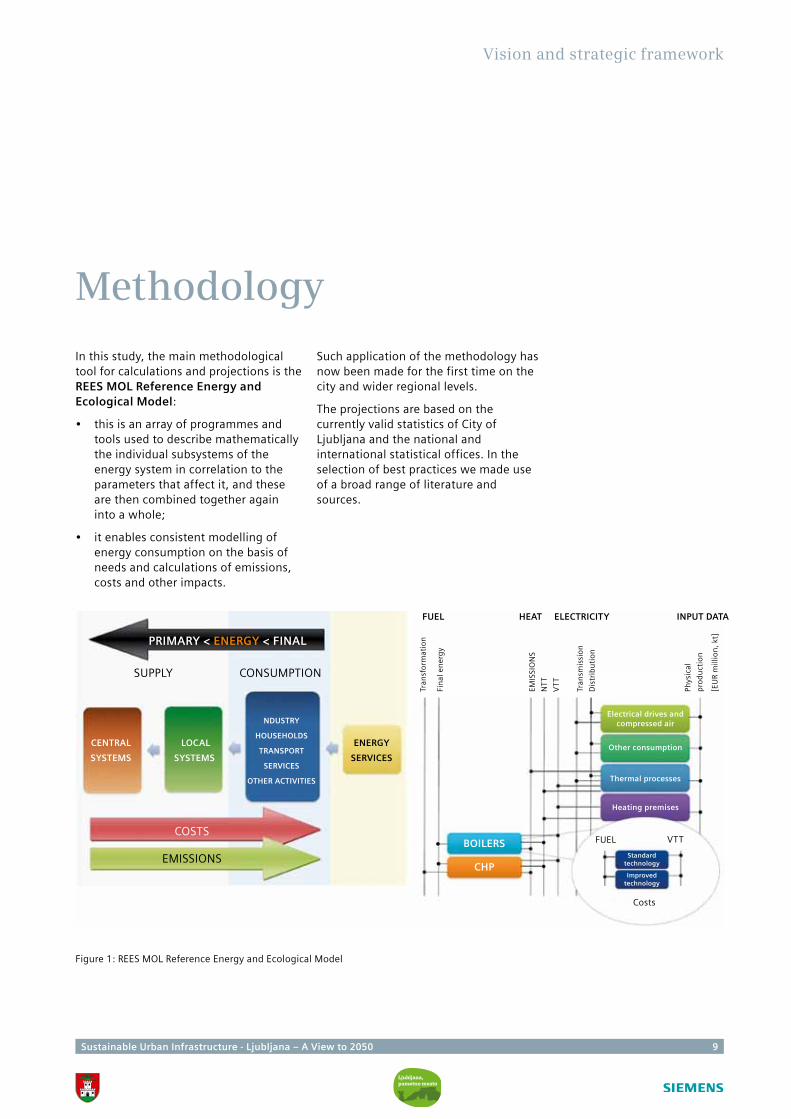
Sustainable Urban Infrastructure - Ljubljana – A View to 2050 9
Methodology
In this study, the main methodological tool for calculations and projections is the REES MOL Reference Energy and Ecological Model:
• this is an array of programmes and tools used to describe mathematically the individual subsystems of the energy system in correlation to the parameters that affect it, and these are then combined together again into a whole;
• it enables consistent modelling of energy consumption on the basis of needs and calculations of emissions, costs and other impacts.
Such application of the methodology has now been made for the first time on the city and wider regional levels.
The projections are based on the currently valid statistics of City of Ljubljana and the national and international statistical offices. In the selection of best practices we made use of a broad range of literature and sources.
Vision and strategic framework
Figure 1: REES MOL Reference Energy and Ecological Model
FUEL HEAT ELECTRICITY INPUT DATA
PRIMARY < ENERGY < FINAL
SUPPLY CONSUMPTION
COSTS
EMISSIONS
Tran
sfo
rmat
ion
Fin
al e
ner
gy
EMIS
SIO
NS
NT
T
VT
T
Tran
smis
sio
n
Dis
trib
uti
on
Phys
ical
pro
du
ctio
n
[EU
R m
illio
n, k
t]Electrical drives and
compressed air
Other consumption
Thermal processes
Heating premises
BOILERS
CHP
FUEL VTT
Standard technology
Improvedtechnology
Costs
CENTRAL
SYSTEMS
LOCAL
SYSTEMS
NDUSTRY
HOUSEHOLDS
TRANSPORT
SERVICES
OTHER ACTIVITIES
ENERGY
SERVICES
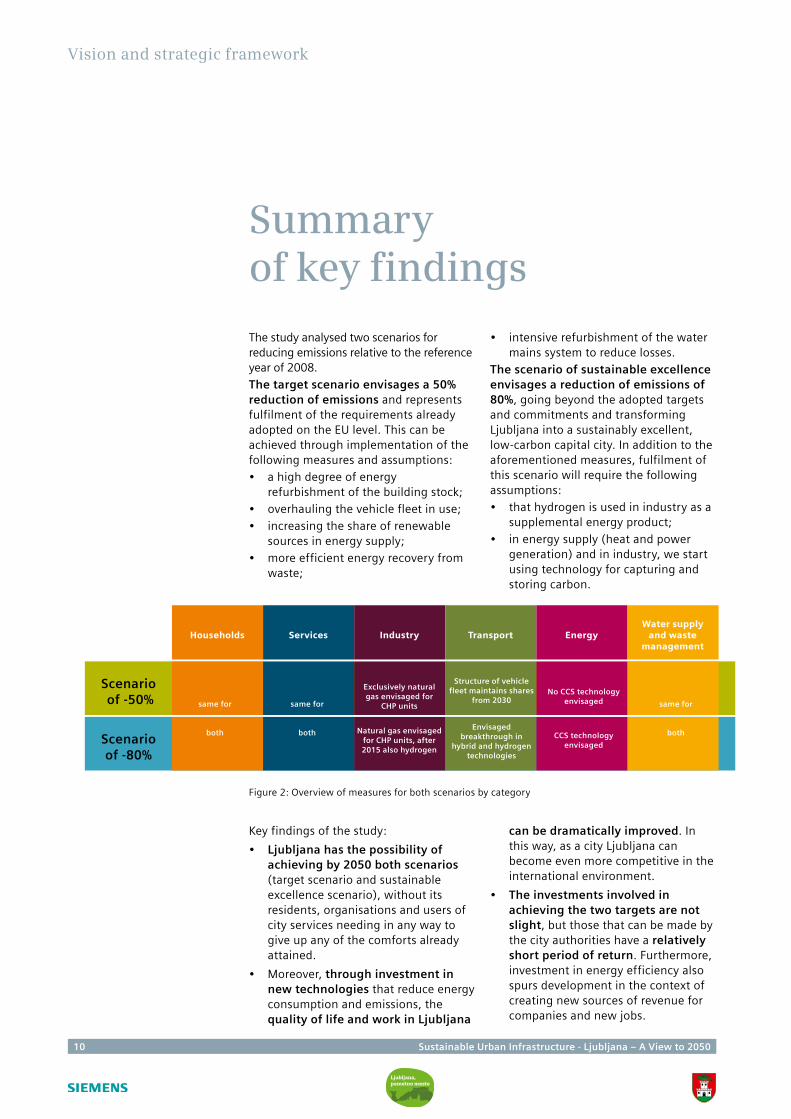
10 Sustainable Urban Infrastructure - Ljubljana – A View to 2050
Summary of key findings
The study analysed two scenarios for reducing emissions relative to the reference year of 2008. The target scenario envisages a 50% reduction of emissions and represents fulfilment of the requirements already adopted on the EU level. This can be achieved through implementation of the following measures and assumptions: • a high degree of energy
refurbishment of the building stock;• overhauling the vehicle fleet in use;• increasing the share of renewable
sources in energy supply; • more efficient energy recovery from
waste;
• intensive refurbishment of the water mains system to reduce losses.
The scenario of sustainable excellence envisages a reduction of emissions of 80%, going beyond the adopted targets and commitments and transforming Ljubljana into a sustainably excellent, low-carbon capital city. In addition to the aforementioned measures, fulfilment of this scenario will require the following assumptions: • that hydrogen is used in industry as a
supplemental energy product;• in energy supply (heat and power
generation) and in industry, we start using technology for capturing and storing carbon.
Vision and strategic framework
Figure 2: Overview of measures for both scenarios by category
Key findings of the study:
• Ljubljana has the possibility of achieving by 2050 both scenarios (target scenario and sustainable excellence scenario), without its residents, organisations and users of city services needing in any way to give up any of the comforts already attained.
• Moreover, through investment in new technologies that reduce energy consumption and emissions, the quality of life and work in Ljubljana
can be dramatically improved. In this way, as a city Ljubljana can become even more competitive in the international environment.
• The investments involved in achieving the two targets are not slight, but those that can be made by the city authorities have a relatively short period of return. Furthermore, investment in energy efficiency also spurs development in the context of creating new sources of revenue for companies and new jobs.
Households Services Industry Transport EnergyWater supply
and waste management
Scenario of -50%
Scenario of -80%
same for
both
same for
both
Exclusively natural gas envisaged for
CHP units
Natural gas envisaged for CHP units, after 2015 also hydrogen
Structure of vehicle fleet maintains shares
from 2030
Envisaged
breakthrough in hybrid and hydrogen
technologies
No CCS technology envisaged
CCS technology envisaged
same for
both
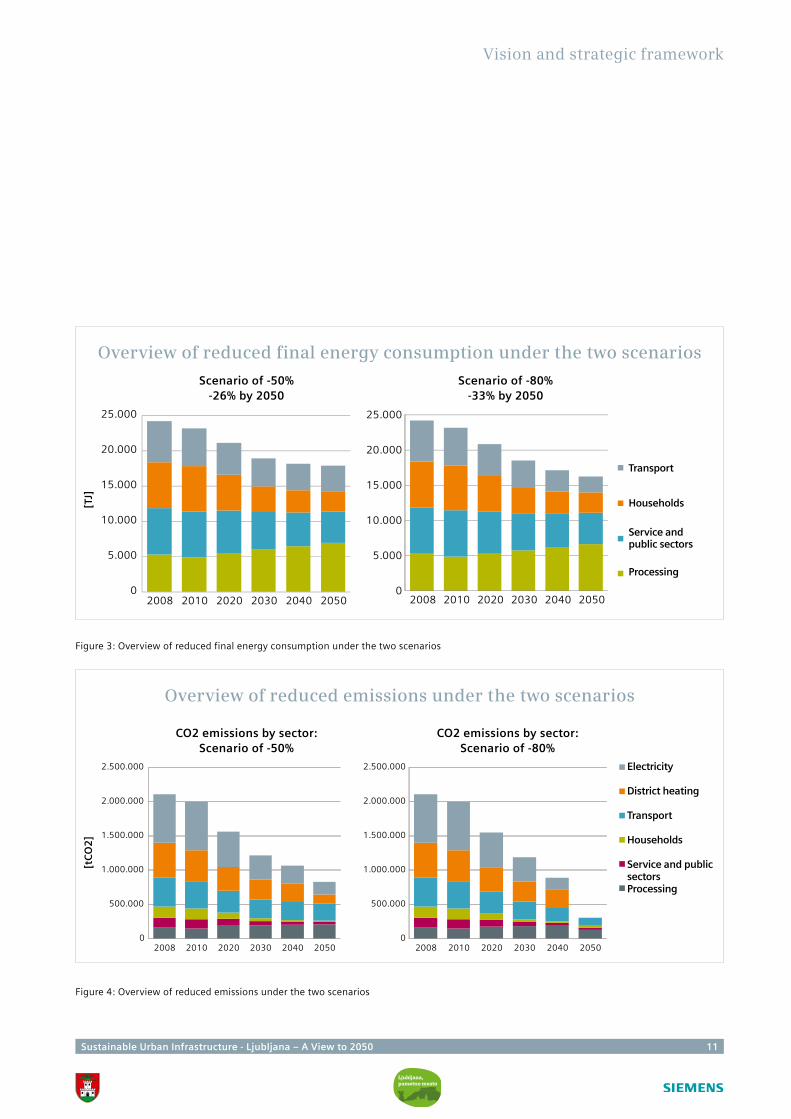
Sustainable Urban Infrastructure - Ljubljana – A View to 2050 11
Vision and strategic framework
Figure 3: Overview of reduced final energy consumption under the two scenarios
Figure 4: Overview of reduced emissions under the two scenarios
Overview of reduced final energy consumption under the two scenarios
[TJ
]
Transport
0
5.000
10.000
15.000
20.000
25.000
2008 2010 2020 2030 2040 20500
5.000
10.000
15.000
20.000
25.000
2008 2010 2020 2030 2040 2050
Scenario of -50%-26% by 2050
Scenario of -80%-33% by 2050
Households
Service and public sectors
Processing
Overview of reduced emissions under the two scenarios
CO2 emissions by sector: Scenario of -50%
CO2 emissions by sector: Scenario of -80%
Electricity
District heating
Transport
Households
Service and public sectorsProcessing
0
500.000
1.000.000
1.500.000
2.000.000
2.500.000
2008 2010 2020 2030 2040 20500
500.000
1.000.000
1.500.000
2.000.000
2.500.000
2008 2010 2020 2030 2040 2050
[tC
O2
]
12 Sustainable Urban Infrastructure - Ljubljana – A View to 2050
Sustainable Urban Infrastructure - Ljubljana – A View to 2050 13
II. Input data and assumptions
At a time of radical change and tough economic conditions, trying to predict the coming decades can be a thankless task. Nevertheless it is better to make use of the data and methodological tools currently available to us than to keep our eyes closed to the future because of its unpredictability. The projections in the material below have been made based on
the valid statistics of the Slovenian and international statistical offices, and on an optimistic view that the economic crisis will be transformed into growth. They include well-known visions of anticipated technological change, and describe the conditions needed for Ljubljana to achieve its ambitious environmental targets.
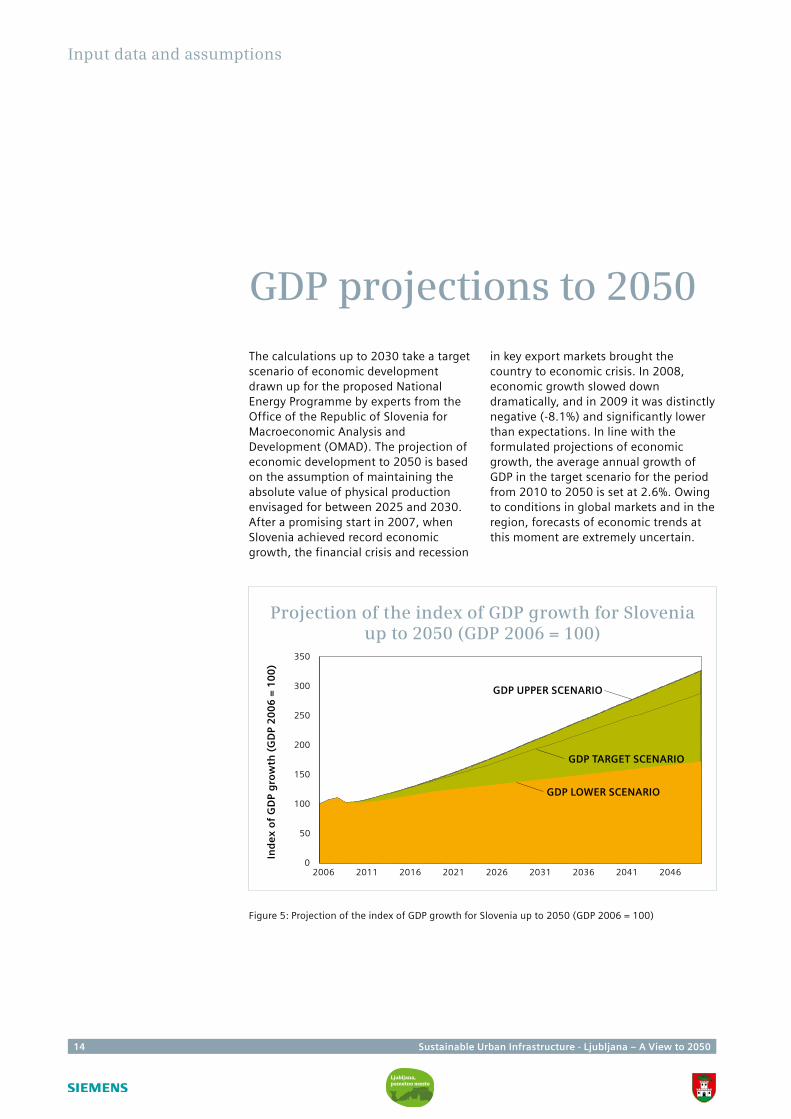
14 Sustainable Urban Infrastructure - Ljubljana – A View to 2050
GDP projections to 2050
The calculations up to 2030 take a target scenario of economic development drawn up for the proposed National Energy Programme by experts from the Office of the Republic of Slovenia for Macroeconomic Analysis and Development (OMAD). The projection of economic development to 2050 is based on the assumption of maintaining the absolute value of physical production envisaged for between 2025 and 2030. After a promising start in 2007, when Slovenia achieved record economic growth, the financial crisis and recession
in key export markets brought the country to economic crisis. In 2008, economic growth slowed down dramatically, and in 2009 it was distinctly negative (-8.1%) and significantly lower than expectations. In line with the formulated projections of economic growth, the average annual growth of GDP in the target scenario for the period from 2010 to 2050 is set at 2.6%. Owing to conditions in global markets and in the region, forecasts of economic trends at this moment are extremely uncertain.
Input data and assumptions
Figure 5: Projection of the index of GDP growth for Slovenia up to 2050 (GDP 2006 = 100)
Projection of the index of GDP growth for Slovenia up to 2050 (GDP 2006 = 100)
Ind
ex o
f G
DP
gro
wth
(G
DP
20
06
= 1
00
)
0
50
100
150
200
250
300
350
2006 2011 2016 2021 2026 2031 2036 2041 2046
GDP UPPER SCENARIO
GDP TARGET SCENARIO
GDP LOWER SCENARIO
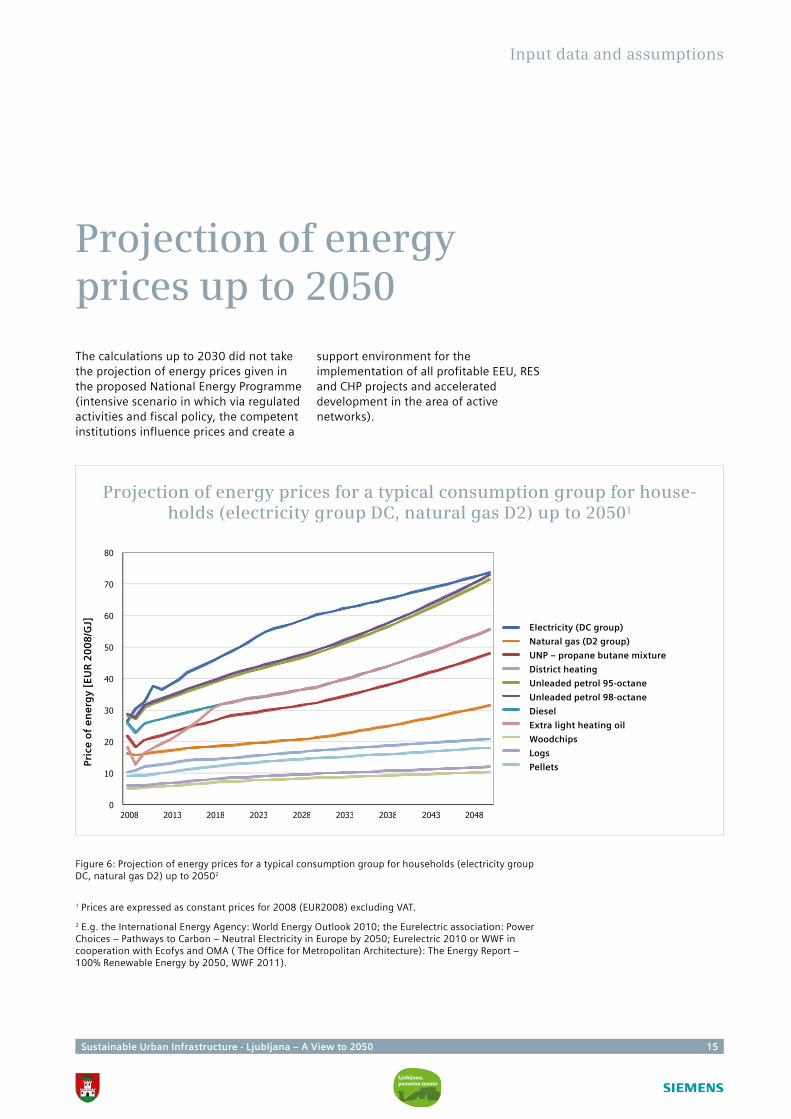
Sustainable Urban Infrastructure - Ljubljana – A View to 2050 15
Figure 6: Projection of energy prices for a typical consumption group for households (electricity group DC, natural gas D2) up to 20502
Input data and assumptions
Projection of energy prices up to 2050
The calculations up to 2030 did not take the projection of energy prices given in the proposed National Energy Programme (intensive scenario in which via regulated activities and fiscal policy, the competent institutions influence prices and create a
support environment for the implementation of all profitable EEU, RES and CHP projects and accelerated development in the area of active networks).
1 Prices are expressed as constant prices for 2008 (EUR2008) excluding VAT.
2 E.g. the International Energy Agency: World Energy Outlook 2010; the Eurelectric association: Power Choices – Pathways to Carbon – Neutral Electricity in Europe by 2050; Eurelectric 2010 or WWF in cooperation with Ecofys and OMA ( The Office for Metropolitan Architecture): The Energy Report – 100% Renewable Energy by 2050, WWF 2011).
Projection of energy prices for a typical consumption group for house-holds (electricity group DC, natural gas D2) up to 20501
Pric
e o
f e
ne
rgy
[EU
R 2
00
8/G
J] Electricity (DC group)
Natural gas (D2 group)
UNP – propane butane mixture
District heating
Unleaded petrol 95-octane
Unleaded petrol 98-octane
Diesel
Extra light heating oil
Woodchips
Logs
Pellets
0
10
20
30
40
50
60
70
80
2008 2013 2018 2023 2028 2033 2038 2043 2048
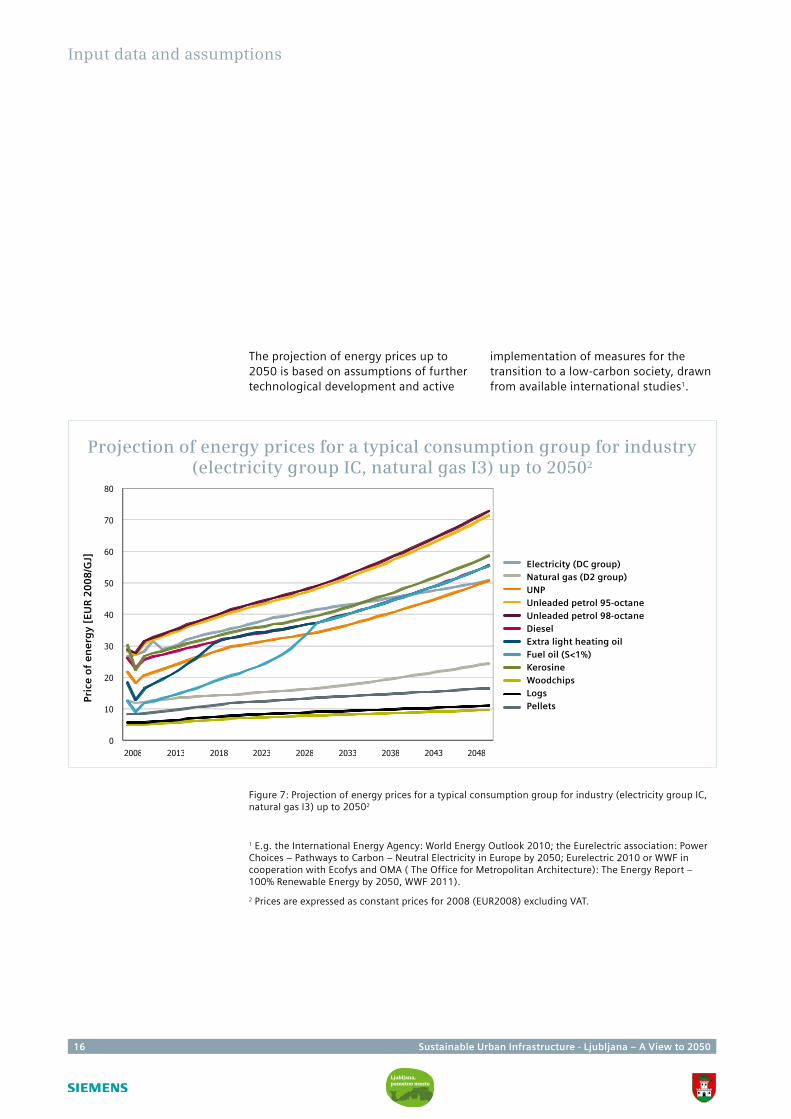
16 Sustainable Urban Infrastructure - Ljubljana – A View to 2050
0
10
20
30
40
50
60
70
80
2008 2013 2018 2023 2028 2033 2038 2043 2048
Figure 7: Projection of energy prices for a typical consumption group for industry (electricity group IC, natural gas I3) up to 20502
1 E.g. the International Energy Agency: World Energy Outlook 2010; the Eurelectric association: Power Choices – Pathways to Carbon – Neutral Electricity in Europe by 2050; Eurelectric 2010 or WWF in cooperation with Ecofys and OMA ( The Office for Metropolitan Architecture): The Energy Report – 100% Renewable Energy by 2050, WWF 2011).
2 Prices are expressed as constant prices for 2008 (EUR2008) excluding VAT.
Electricity (DC group)Natural gas (D2 group)UNPUnleaded petrol 95-octaneUnleaded petrol 98-octaneDieselExtra light heating oilFuel oil (S<1%)KerosineWoodchipsLogsPellets
Input data and assumptions
Projection of energy prices for a typical consumption group for industry (electricity group IC, natural gas I3) up to 20502
Pric
e o
f e
ne
rgy
[EU
R 2
00
8/G
J]
The projection of energy prices up to 2050 is based on assumptions of further technological development and active
implementation of measures for the transition to a low-carbon society, drawn from available international studies1.
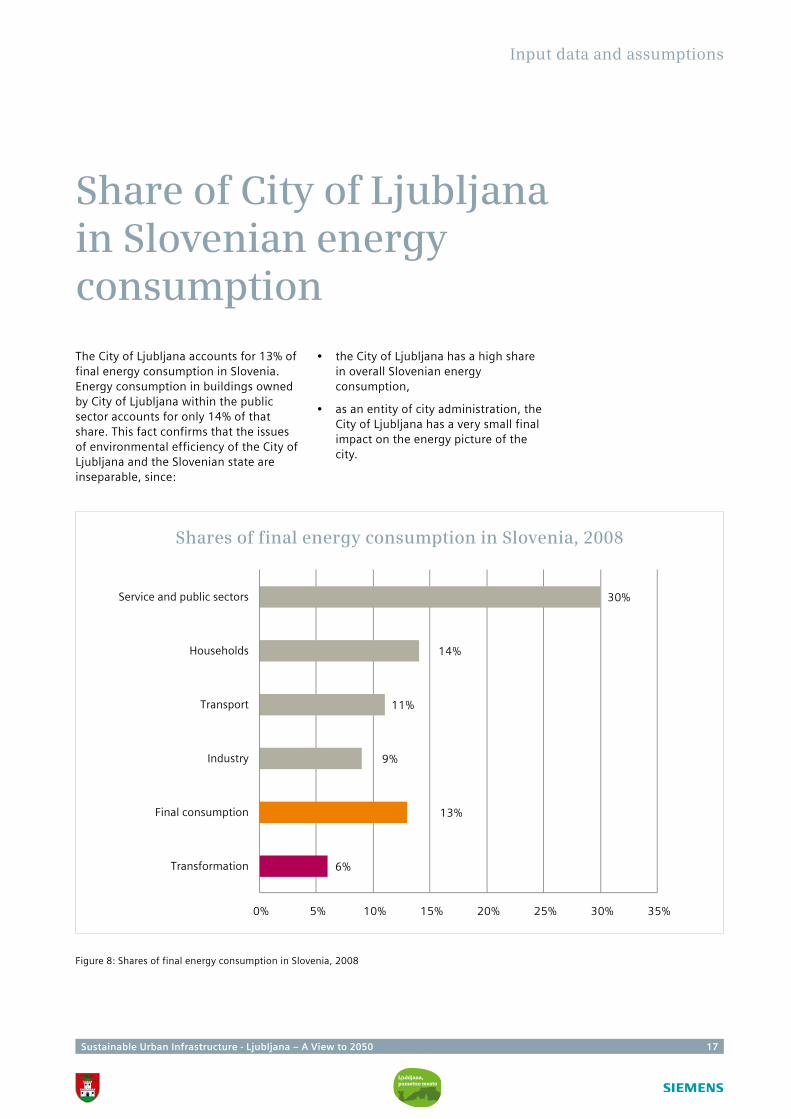
Sustainable Urban Infrastructure - Ljubljana – A View to 2050 17
Share of City of Ljubljana in Slovenian energy consumption
The City of Ljubljana accounts for 13% of final energy consumption in Slovenia. Energy consumption in buildings owned by City of Ljubljana within the public sector accounts for only 14% of that share. This fact confirms that the issues of environmental efficiency of the City of Ljubljana and the Slovenian state are inseparable, since:
• the City of Ljubljana has a high share in overall Slovenian energy consumption,
• as an entity of city administration, the City of Ljubljana has a very small final impact on the energy picture of the city.
Figure 8: Shares of final energy consumption in Slovenia, 2008
Input data and assumptions
Shares of final energy consumption in Slovenia, 2008
6%
13%
9%
11%
14%
30%
0% 5% 10% 15% 20% 25% 30% 35%
Transformation
Final consumption
Industry
Transport
Households
Service and public sectors
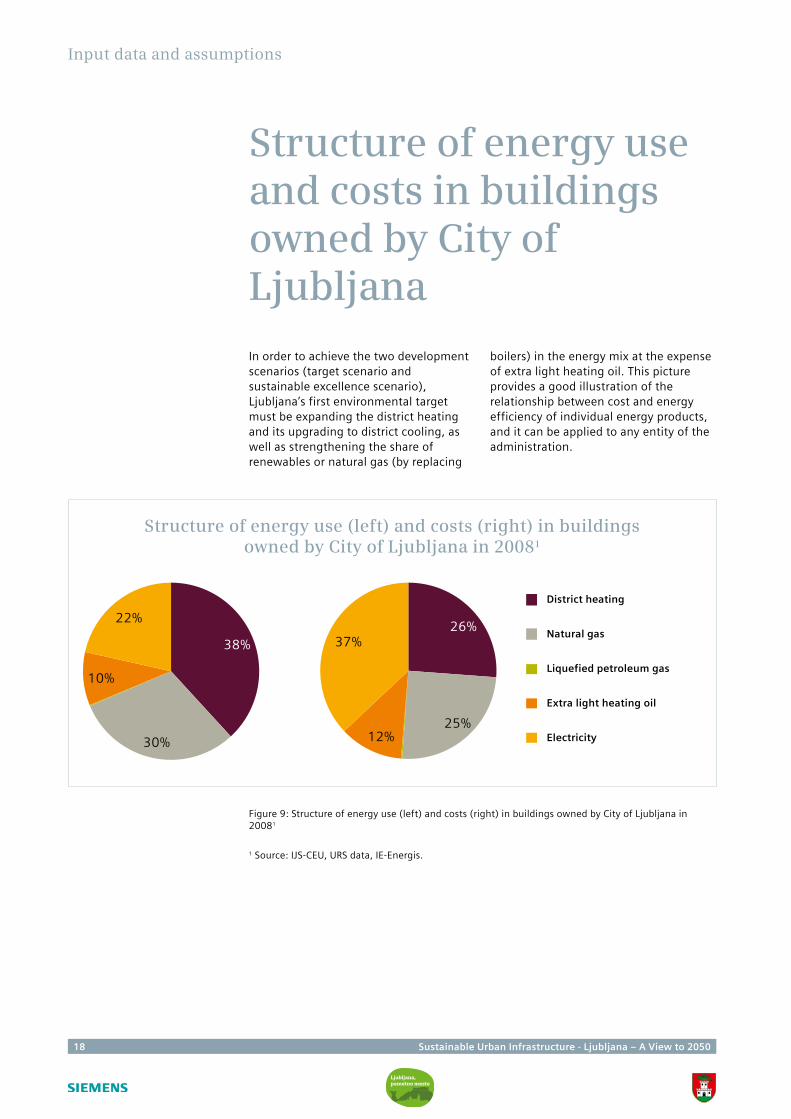
18 Sustainable Urban Infrastructure - Ljubljana – A View to 2050
Figure 9: Structure of energy use (left) and costs (right) in buildings owned by City of Ljubljana in 20081
Structure of energy use and costs in buildings owned by City of Ljubljana
In order to achieve the two development scenarios (target scenario and sustainable excellence scenario), Ljubljana’s first environmental target must be expanding the district heating and its upgrading to district cooling, as well as strengthening the share of renewables or natural gas (by replacing
boilers) in the energy mix at the expense of extra light heating oil. This picture provides a good illustration of the relationship between cost and energy efficiency of individual energy products, and it can be applied to any entity of the administration.
Input data and assumptions
1 Source: IJS-CEU, URS data, IE-Energis.
District heating
Natural gas
Liquefied petroleum gas
Extra light heating oil
Electricity
Structure of energy use (left) and costs (right) in buildings owned by City of Ljubljana in 20081
38%
30%
10%
22%26%
25%12%
37%
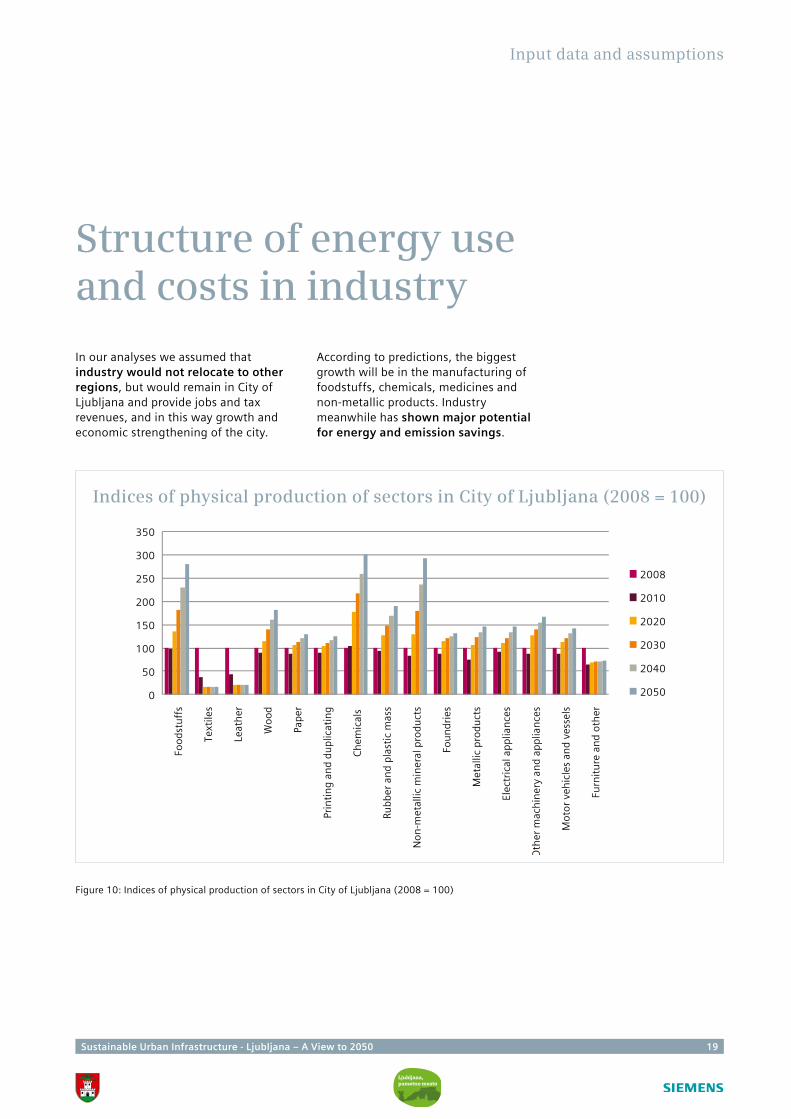
Sustainable Urban Infrastructure - Ljubljana – A View to 2050 19
Input data and assumptions
Structure of energy use and costs in industry
In our analyses we assumed that industry would not relocate to other regions, but would remain in City of Ljubljana and provide jobs and tax revenues, and in this way growth and economic strengthening of the city.
According to predictions, the biggest growth will be in the manufacturing of foodstuffs, chemicals, medicines and non-metallic products. Industry meanwhile has shown major potential for energy and emission savings.
Figure 10: Indices of physical production of sectors in City of Ljubljana (2008 = 100)
Indices of physical production of sectors in City of Ljubljana (2008 = 100)
0
50
100
150
200
250
300
350
Food
stu
ffs
Text
iles
Leat
her
Woo
d
Pape
r
Prin
tin
g an
d du
plic
atin
g
Ch
emic
als
Rubb
er a
nd
plas
tic
mas
s
Non
-met
allic
min
eral
pro
duct
s
Fou
ndr
ies
Met
allic
pro
duct
s
Elec
tric
al a
pplia
nce
s
Oth
er m
ach
iner
y an
d ap
plia
nce
s
Mot
or v
ehic
les
and
vess
els
Furn
itu
re a
nd
oth
er
2008
2010
2020
2030
2040
2050
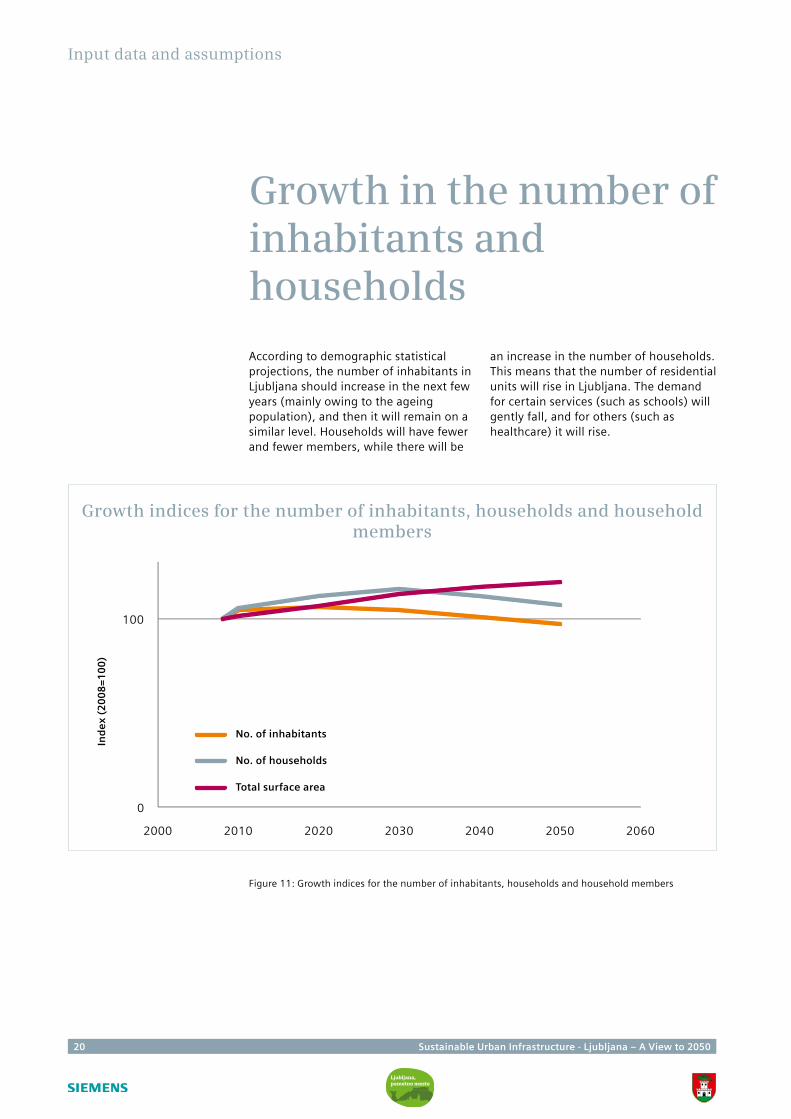
20 Sustainable Urban Infrastructure - Ljubljana – A View to 2050
Growth indices for the number of inhabitants, households and household members
Input data and assumptions
Growth in the number of inhabitants and households
According to demographic statistical projections, the number of inhabitants in Ljubljana should increase in the next few years (mainly owing to the ageing population), and then it will remain on a similar level. Households will have fewer and fewer members, while there will be
an increase in the number of households. This means that the number of residential units will rise in Ljubljana. The demand for certain services (such as schools) will gently fall, and for others (such as healthcare) it will rise.
Figure 11: Growth indices for the number of inhabitants, households and household members
0
100
2000 2010 2020 2030 2040 2050 2060
No. of inhabitants
No. of households
Total surface area
Ind
ex (
20
08
=1
00
)
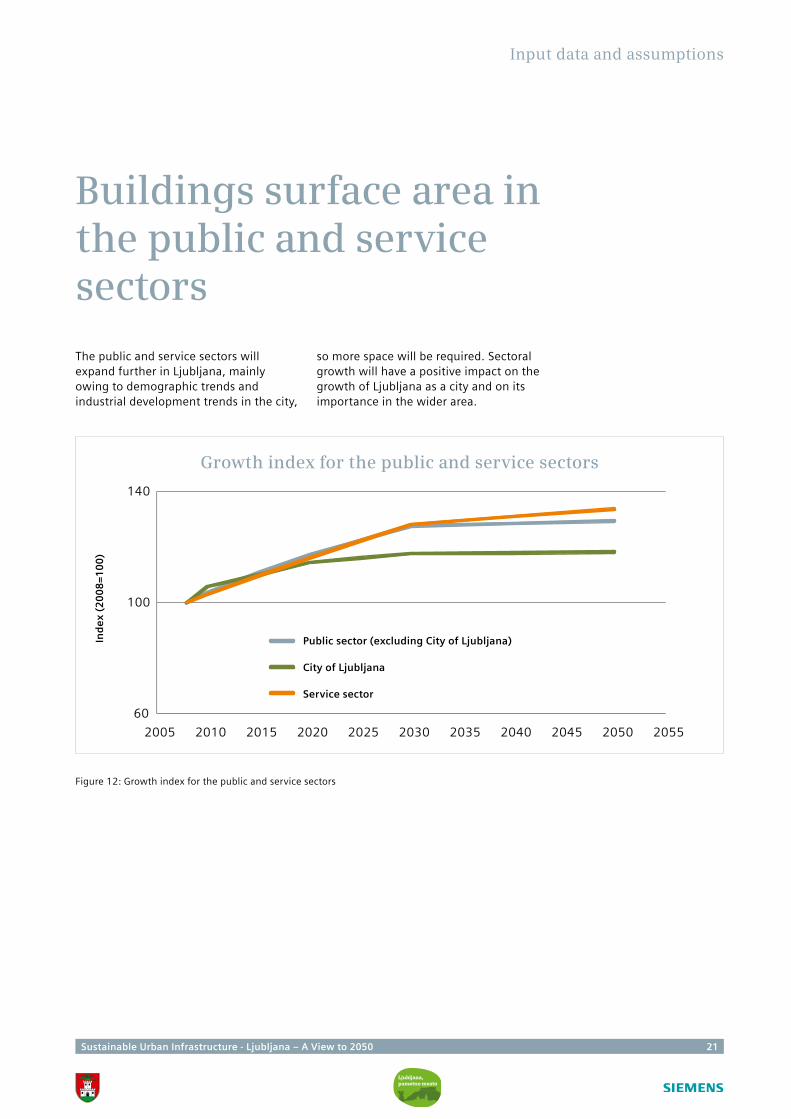
Sustainable Urban Infrastructure - Ljubljana – A View to 2050 21
Input data and assumptions
Buildings surface area in the public and service sectors
The public and service sectors will expand further in Ljubljana, mainly owing to demographic trends and industrial development trends in the city,
so more space will be required. Sectoral growth will have a positive impact on the growth of Ljubljana as a city and on its importance in the wider area.
Figure 12: Growth index for the public and service sectors
Growth index for the public and service sectors
Ind
ex (
20
08
=1
00
)
60
100
140
2005 2010 2015 2020 2025 2030 2035 2040 2045 2050 2055
Public sector (excluding City of Ljubljana)
City of Ljubljana
Service sector
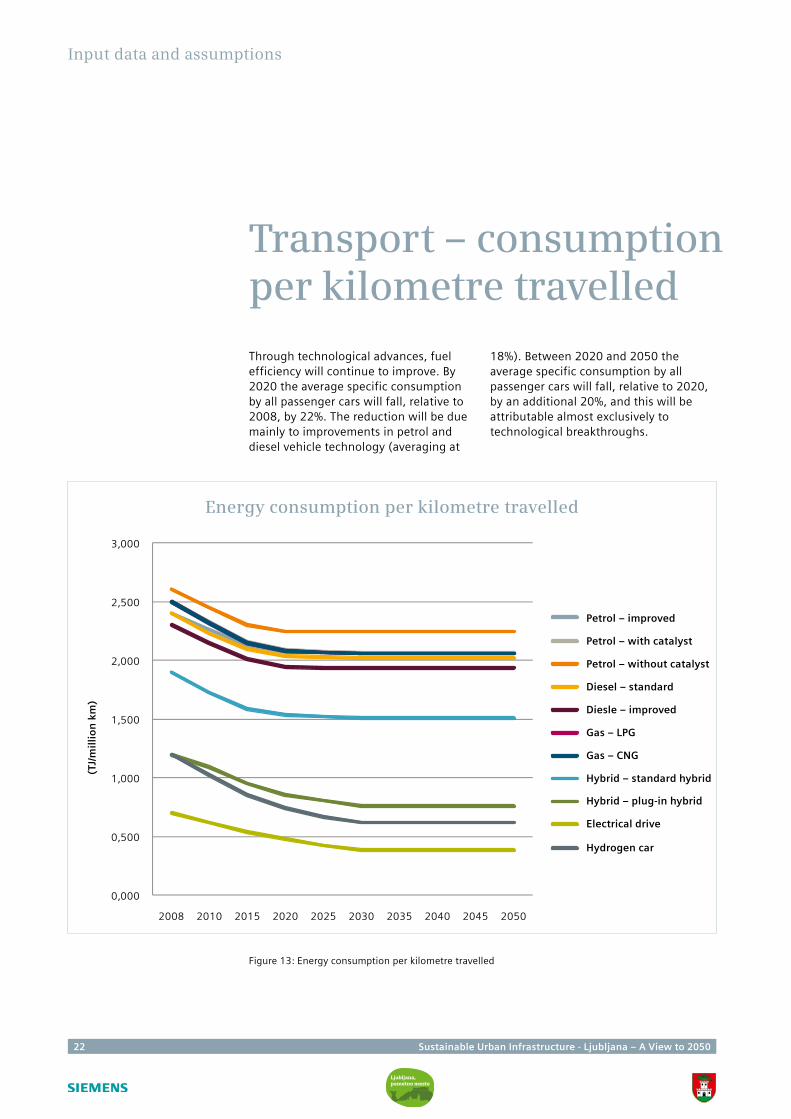
22 Sustainable Urban Infrastructure - Ljubljana – A View to 2050
0,000
0,500
1,000
1,500
2,000
2,500
3,000
2008 2010 2015 2020 2025 2030 2035 2040 2045 2050
Input data and assumptions
Transport – consumption per kilometre travelled
Through technological advances, fuel efficiency will continue to improve. By 2020 the average specific consumption by all passenger cars will fall, relative to 2008, by 22%. The reduction will be due mainly to improvements in petrol and diesel vehicle technology (averaging at
18%). Between 2020 and 2050 the average specific consumption by all passenger cars will fall, relative to 2020, by an additional 20%, and this will be attributable almost exclusively to technological breakthroughs.
Figure 13: Energy consumption per kilometre travelled
Energy consumption per kilometre travelled
(TJ/
mil
lio
n k
m)
Petrol – improved
Petrol – with catalyst
Petrol – without catalyst
Diesel – standard
Diesle – improved
Gas – LPG
Gas – CNG
Hybrid – standard hybrid
Hybrid – plug-in hybrid
Electrical drive
Hydrogen car

Sustainable Urban Infrastructure - Ljubljana – A View to 2050 23
24 Sustainable Urban Infrastructure - Ljubljana – A View to 2050
Sustainable Urban Infrastructure - Ljubljana – A View to 2050 25
III. Possibilities for achieving the scenarios
This study analyses two scenarios: the target scenario, which envisages a 50% reduction in emissions, and the sustainable excellence scenario, in which by 2050 Ljubljana would reduce emissions by 80%. The main focus of attention was on energy supply in industry, households and in the public and service sectors, while the area of
transport was also analysed in detail. In this chapter we describe the conditions needed to achieve each of the scenarios in different areas, we analyse the necessary measures and technological changes and, where possible, we assess the financial consequences of fulfilling the specific scenario.
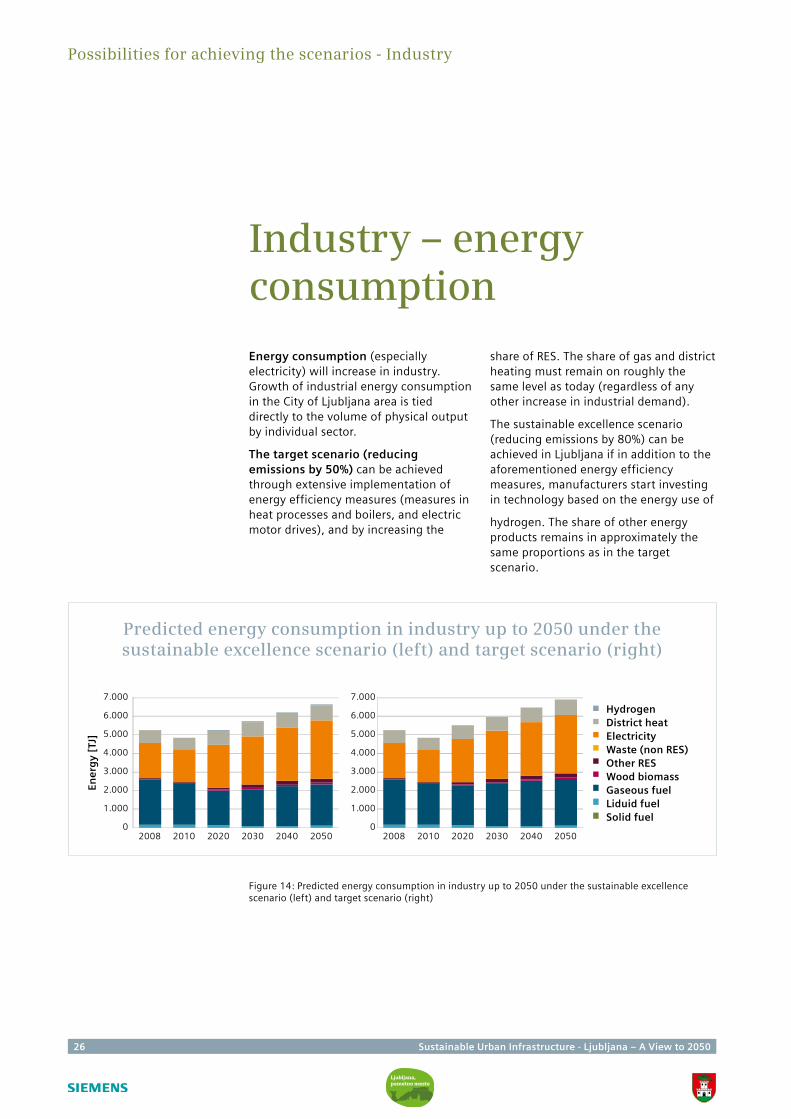
26 Sustainable Urban Infrastructure - Ljubljana – A View to 2050
Industry – energy consumption
Energy consumption (especially electricity) will increase in industry. Growth of industrial energy consumption in the City of Ljubljana area is tied directly to the volume of physical output by individual sector.
The target scenario (reducing emissions by 50%) can be achieved through extensive implementation of energy efficiency measures (measures in heat processes and boilers, and electric motor drives), and by increasing the
share of RES. The share of gas and district heating must remain on roughly the same level as today (regardless of any other increase in industrial demand).
The sustainable excellence scenario (reducing emissions by 80%) can be achieved in Ljubljana if in addition to the aforementioned energy efficiency measures, manufacturers start investing in technology based on the energy use of
hydrogen. The share of other energy products remains in approximately the same proportions as in the target scenario.
Possibilities for achieving the scenarios - Industry
Figure 14: Predicted energy consumption in industry up to 2050 under the sustainable excellence scenario (left) and target scenario (right)
Predicted energy consumption in industry up to 2050 under the sustainable excellence scenario (left) and target scenario (right)
Ene
rgy
[TJ]
HydrogenDistrict heatElectricityWaste (non RES)Other RESWood biomassGaseous fuelLiduid fuelSolid fuel
0
1.000
2.000
3.000
4.000
5.000
6.000
7.000
2008 2010 2020 2030 2040 20500
1.000
2.000
3.000
4.000
5.000
6.000
7.000
2008 2010 2020 2030 2040 2050
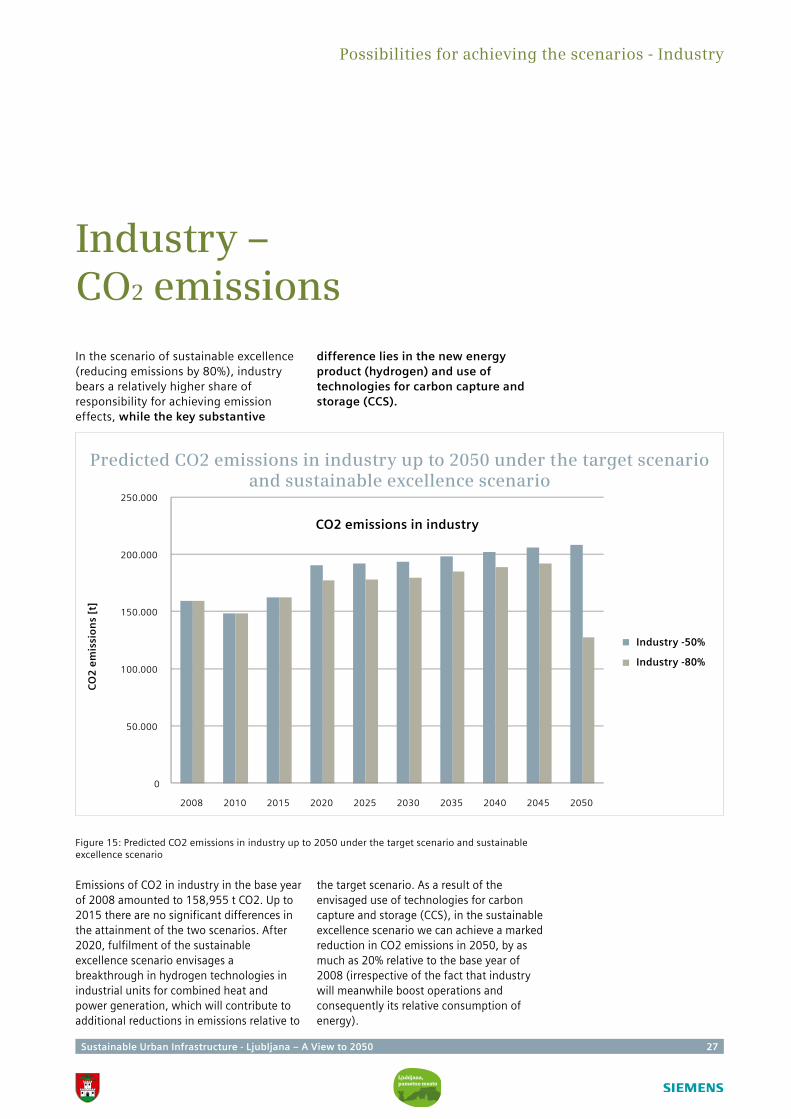
Sustainable Urban Infrastructure - Ljubljana – A View to 2050 27
Industry – CO2 emissions
In the scenario of sustainable excellence (reducing emissions by 80%), industry bears a relatively higher share of responsibility for achieving emission effects, while the key substantive
difference lies in the new energy product (hydrogen) and use of technologies for carbon capture and storage (CCS).
Possibilities for achieving the scenarios - Industry
Figure 15: Predicted CO2 emissions in industry up to 2050 under the target scenario and sustainable excellence scenario
Emissions of CO2 in industry in the base year of 2008 amounted to 158,955 t CO2. Up to 2015 there are no significant differences in the attainment of the two scenarios. After 2020, fulfilment of the sustainable excellence scenario envisages a breakthrough in hydrogen technologies in industrial units for combined heat and power generation, which will contribute to additional reductions in emissions relative to
the target scenario. As a result of the envisaged use of technologies for carbon capture and storage (CCS), in the sustainable excellence scenario we can achieve a marked reduction in CO2 emissions in 2050, by as much as 20% relative to the base year of 2008 (irrespective of the fact that industry will meanwhile boost operations and consequently its relative consumption of energy).
Predicted CO2 emissions in industry up to 2050 under the target scenario and sustainable excellence scenario
Industry -50%
Industry -80%
0
50.000
100.000
150.000
200.000
250.000
2008 2010 2015 2020 2025 2030 2035 2040 2045 2050
CO
2 e
mis
sio
ns
[t]
CO2 emissions in industry
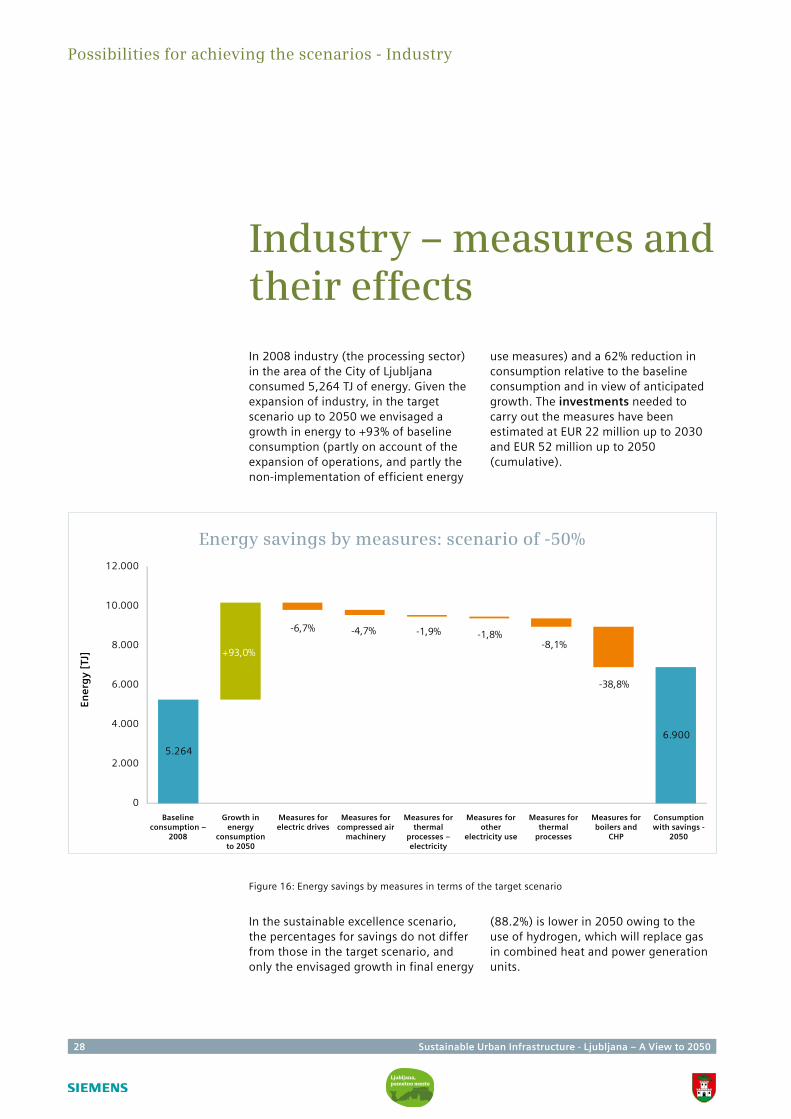
28 Sustainable Urban Infrastructure - Ljubljana – A View to 2050
Industry – measures and their effects
In 2008 industry (the processing sector) in the area of the City of Ljubljana consumed 5,264 TJ of energy. Given the expansion of industry, in the target scenario up to 2050 we envisaged a growth in energy to +93% of baseline consumption (partly on account of the expansion of operations, and partly the non-implementation of efficient energy
use measures) and a 62% reduction in consumption relative to the baseline consumption and in view of anticipated growth. The investments needed to carry out the measures have been estimated at EUR 22 million up to 2030 and EUR 52 million up to 2050 (cumulative).
Figure 16: Energy savings by measures in terms of the target scenario
In the sustainable excellence scenario, the percentages for savings do not differ from those in the target scenario, and only the envisaged growth in final energy
(88.2%) is lower in 2050 owing to the use of hydrogen, which will replace gas in combined heat and power generation units.
Possibilities for achieving the scenarios - Industry
Energy savings by measures: scenario of -50%
Ene
rgy
[TJ]
Baseline consumption –
2008
Growth in energy
consumption to 2050
Measures for electric drives
Measures for compressed air
machinery
Measures for thermal
processes – electricity
Measures for other
electricity use
Measures for thermal
processes
Measures for boilers and
CHP
Consumption with savings -
2050
5.264
6.900
0
2.000
4.000
6.000
8.000
10.000
12.000
-6,7% -4,7% -1,9% -1,8%-8,1%
-38,8%
+93,0%
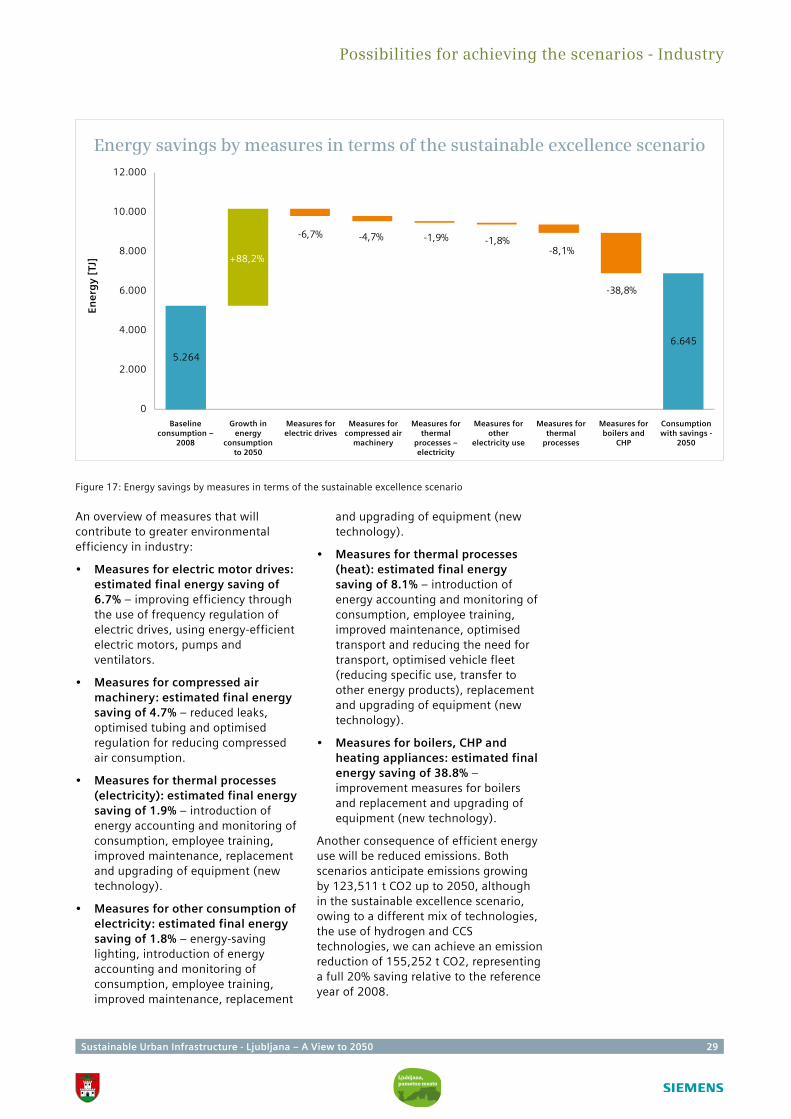
Sustainable Urban Infrastructure - Ljubljana – A View to 2050 29
Figure 17: Energy savings by measures in terms of the sustainable excellence scenario
An overview of measures that will contribute to greater environmental efficiency in industry:
• Measures for electric motor drives: estimated final energy saving of 6.7% – improving efficiency through the use of frequency regulation of electric drives, using energy-efficient electric motors, pumps and ventilators.
• Measures for compressed air machinery: estimated final energy saving of 4.7% – reduced leaks, optimised tubing and optimised regulation for reducing compressed air consumption.
• Measures for thermal processes (electricity): estimated final energy saving of 1.9% – introduction of energy accounting and monitoring of consumption, employee training, improved maintenance, replacement and upgrading of equipment (new technology).
• Measures for other consumption of electricity: estimated final energy saving of 1.8% – energy-saving lighting, introduction of energy accounting and monitoring of consumption, employee training, improved maintenance, replacement
and upgrading of equipment (new technology).
• Measures for thermal processes (heat): estimated final energy saving of 8.1% – introduction of energy accounting and monitoring of consumption, employee training, improved maintenance, optimised transport and reducing the need for transport, optimised vehicle fleet (reducing specific use, transfer to other energy products), replacement and upgrading of equipment (new technology).
• Measures for boilers, CHP and heating appliances: estimated final energy saving of 38.8% – improvement measures for boilers and replacement and upgrading of equipment (new technology).
Another consequence of efficient energy use will be reduced emissions. Both scenarios anticipate emissions growing by 123,511 t CO2 up to 2050, although in the sustainable excellence scenario, owing to a different mix of technologies, the use of hydrogen and CCS technologies, we can achieve an emission reduction of 155,252 t CO2, representing a full 20% saving relative to the reference year of 2008.
Possibilities for achieving the scenarios - Industry
Energy savings by measures in terms of the sustainable excellence scenario
Ene
rgy
[TJ]
Baseline consumption –
2008
Growth in energy
consumption to 2050
Measures for electric drives
Measures for compressed air
machinery
Measures for thermal
processes – electricity
Measures for other
electricity use
Measures for thermal
processes
Measures for boilers and
CHP
Consumption with savings -
2050
5.264
6.645
0
2.000
4.000
6.000
8.000
10.000
12.000
-6,7% -4,7% -1,9% -1,8%-8,1%
-38,8%
+88,2%
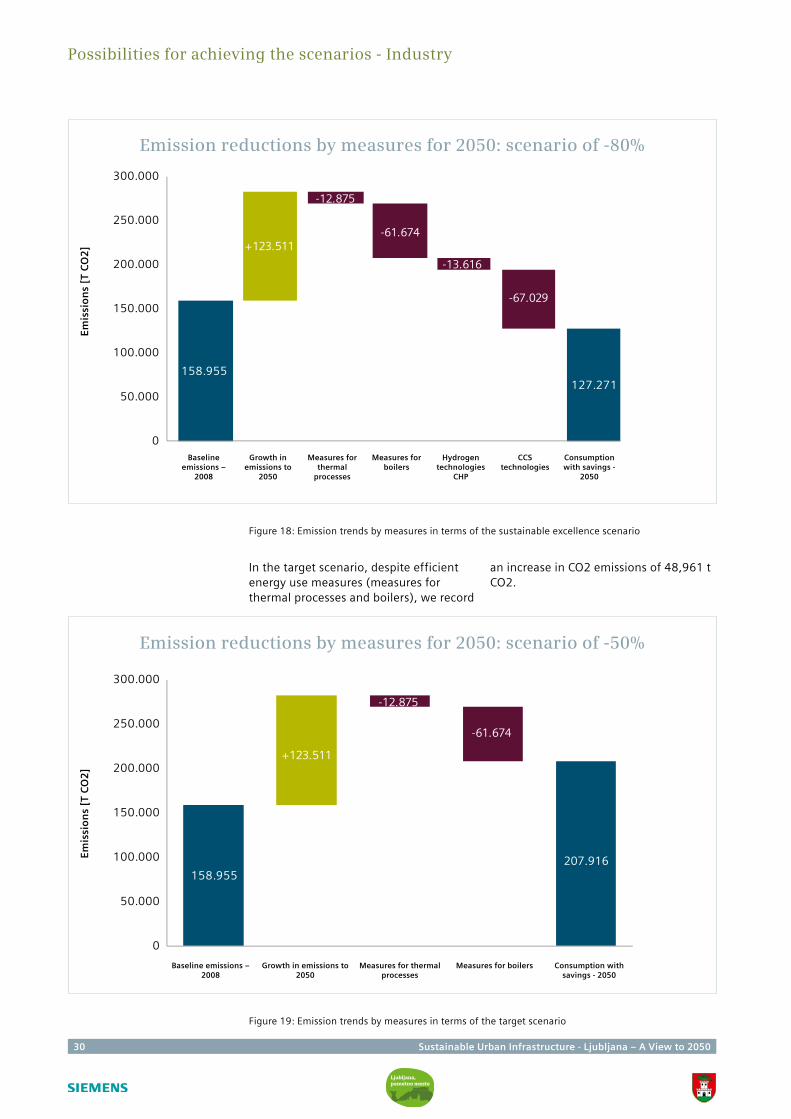
30 Sustainable Urban Infrastructure - Ljubljana – A View to 2050
Figure 18: Emission trends by measures in terms of the sustainable excellence scenario
In the target scenario, despite efficient energy use measures (measures for thermal processes and boilers), we record
Figure 19: Emission trends by measures in terms of the target scenario
an increase in CO2 emissions of 48,961 t CO2.
Possibilities for achieving the scenarios - Industry
Emission reductions by measures for 2050: scenario of -80%
Emis
sio
ns
[T C
O2
]
Baseline emissions –
2008
Growth in emissions to
2050
Measures for thermal
processes
Measures for boilers
Hydrogen technologies
CHP
CCS technologies
Consumption with savings -
2050
Emission reductions by measures for 2050: scenario of -50%
Emis
sio
ns
[T C
O2
]
Baseline emissions – 2008
Growth in emissions to 2050
Measures for thermal processes
Measures for boilers Consumption with savings - 2050
158.955127.271
0
50.000
100.000
150.000
200.000
250.000
300.000
-12.875
-61.674+123.511
-67.029
-13.616
158.955
0
50.000
100.000
150.000
200.000
250.000
300.000
-12.875
-61.674
+123.511
207.916
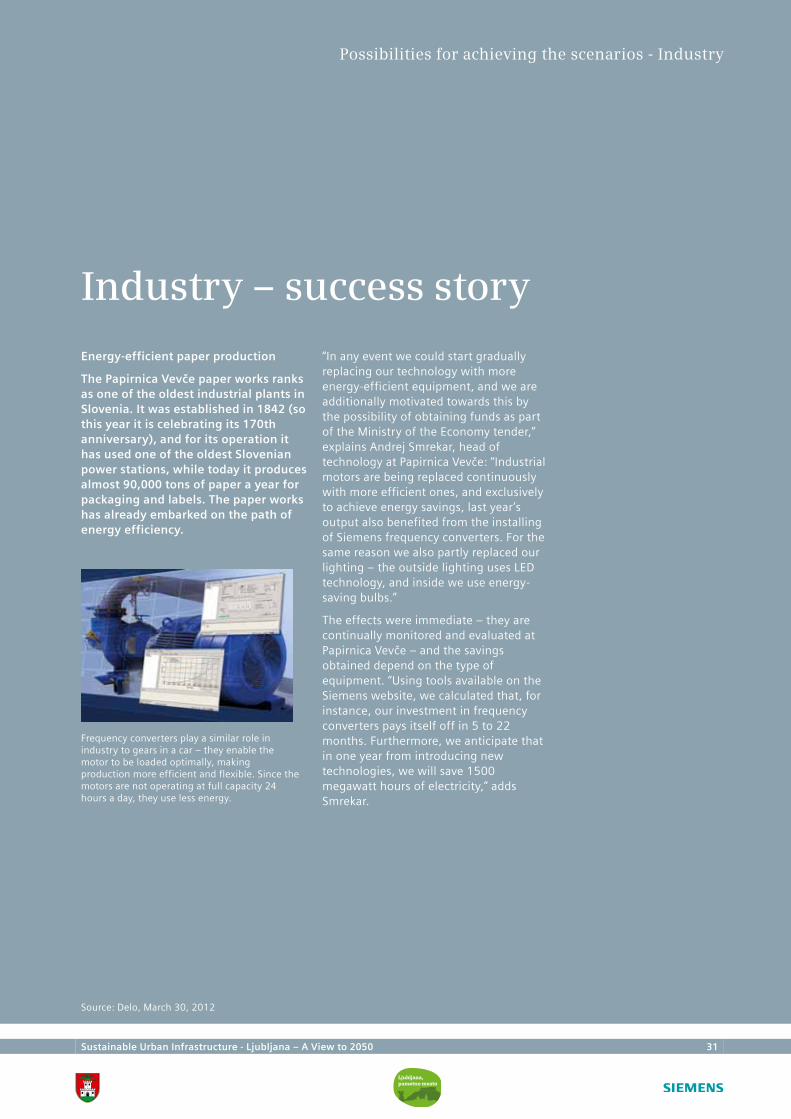
Sustainable Urban Infrastructure - Ljubljana – A View to 2050 31
Industry – success story
Energy-efficient paper production
The Papirnica Vevče paper works ranks as one of the oldest industrial plants in Slovenia. It was established in 1842 (so this year it is celebrating its 170th anniversary), and for its operation it has used one of the oldest Slovenian power stations, while today it produces almost 90,000 tons of paper a year for packaging and labels. The paper works has already embarked on the path of energy efficiency.
“In any event we could start gradually replacing our technology with more energy-efficient equipment, and we are additionally motivated towards this by the possibility of obtaining funds as part of the Ministry of the Economy tender,” explains Andrej Smrekar, head of technology at Papirnica Vevče: “Industrial motors are being replaced continuously with more efficient ones, and exclusively to achieve energy savings, last year’s output also benefited from the installing of Siemens frequency converters. For the same reason we also partly replaced our lighting – the outside lighting uses LED technology, and inside we use energy-saving bulbs.”
The effects were immediate – they are continually monitored and evaluated at Papirnica Vevče – and the savings obtained depend on the type of equipment. “Using tools available on the Siemens website, we calculated that, for instance, our investment in frequency converters pays itself off in 5 to 22 months. Furthermore, we anticipate that in one year from introducing new technologies, we will save 1500 megawatt hours of electricity,” adds Smrekar.
Possibilities for achieving the scenarios - Industry
Frequency converters play a similar role in industry to gears in a car – they enable the motor to be loaded optimally, making production more efficient and flexible. Since the motors are not operating at full capacity 24 hours a day, they use less energy.
Source: Delo, March 30, 2012
32 Sustainable Urban Infrastructure - Ljubljana – A View to 2050
Households – energy consumption in buildings
The greatest proportion of household energy is used for heating and hot water, followed by household appliances.
Ljubljana can achieve the target scenario and the sustainable excellence scenario through the energy rehabilitation of buildings, replacement of the sources of heating, hot water and cooking in households and by improving the energy efficiency of appliances and lighting.
By implementing these measures Ljubljana can:
• reduce by 65% energy consumption for generation of heat used in heating, hot water and cooking in households;
• reduce by 85% emissions produced by energy used in generation of heat for heating, hot water and cooking in;
• greater energy efficiency of household appliances could additionally reduce energy consumption by 4% by 2050.
Since such measures cannot be prescribed administratively, an essential factor is added awareness-raising among the population and development of financial products (favourable loans, energy contracting), which can stimulate decision-making by individuals (owners of residential units) and organisations (investors, financial institutions, administrators and other subjects).
Investments in the comprehensive renewal of the housing fund in the household sector up to 2050 have been estimated at EUR 3.1 billion, of which EUR 1.95 billion are for single family homes and EUR 1.15 billion for multi-dwelling buildings.
Possibilities for achieving the scenarios - Households
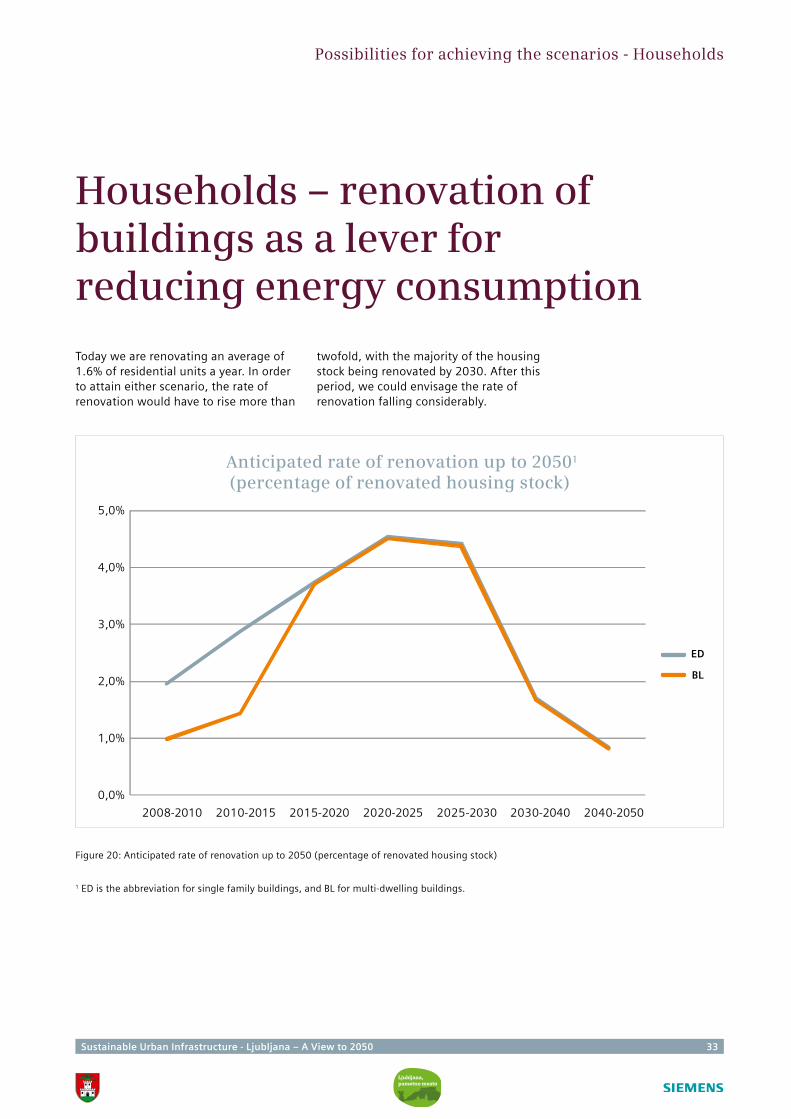
Sustainable Urban Infrastructure - Ljubljana – A View to 2050 33
Households – renovation of buildings as a lever for reducing energy consumption
Today we are renovating an average of 1.6% of residential units a year. In order to attain either scenario, the rate of renovation would have to rise more than
twofold, with the majority of the housing stock being renovated by 2030. After this period, we could envisage the rate of renovation falling considerably.
Figure 20: Anticipated rate of renovation up to 2050 (percentage of renovated housing stock)
1 ED is the abbreviation for single family buildings, and BL for multi-dwelling buildings.
Possibilities for achieving the scenarios - Households
Anticipated rate of renovation up to 20501
(percentage of renovated housing stock)
ED
BL
0,0%
1,0%
2,0%
3,0%
4,0%
5,0%
2008-2010 2010-2015 2015-2020 2020-2025 2025-2030 2030-2040 2040-2050
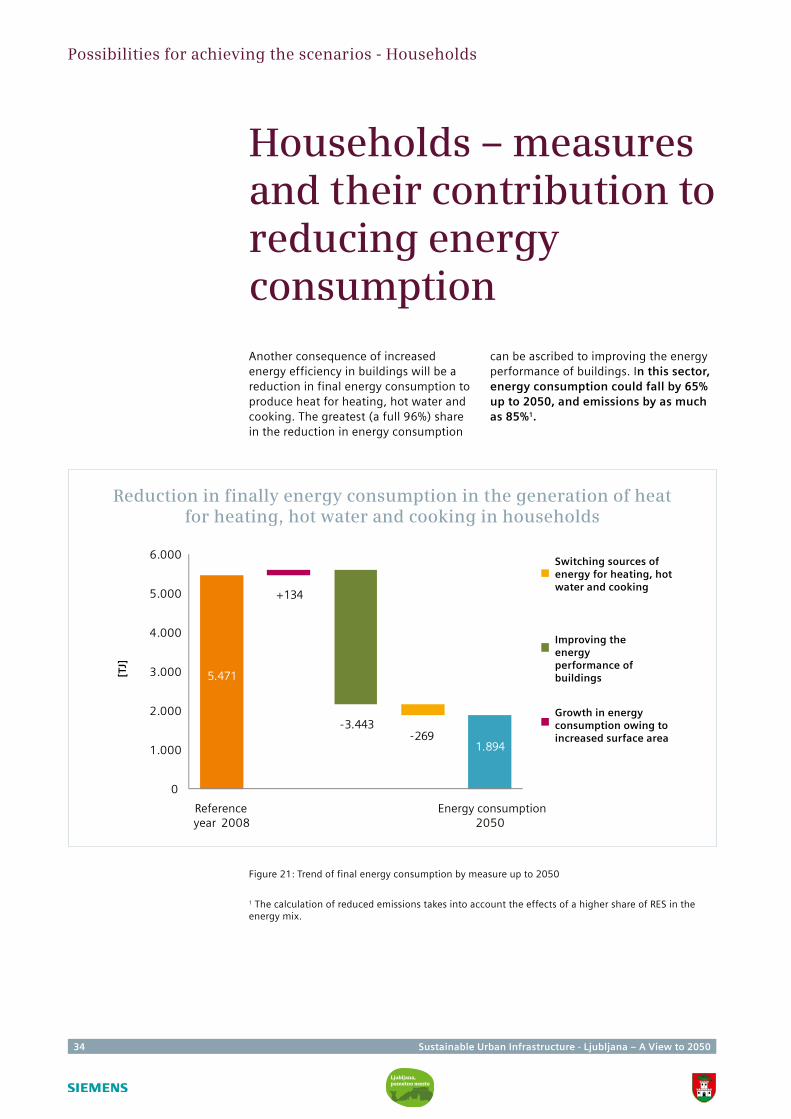
34 Sustainable Urban Infrastructure - Ljubljana – A View to 2050
Households – measures and their contribution to reducing energy consumption
Another consequence of increased energy efficiency in buildings will be a reduction in final energy consumption to produce heat for heating, hot water and cooking. The greatest (a full 96%) share in the reduction in energy consumption
can be ascribed to improving the energy performance of buildings. In this sector, energy consumption could fall by 65% up to 2050, and emissions by as much as 85%1.
Figure 21: Trend of final energy consumption by measure up to 2050
1 The calculation of reduced emissions takes into account the effects of a higher share of RES in the energy mix.
Possibilities for achieving the scenarios - Households
Reduction in finally energy consumption in the generation of heat for heating, hot water and cooking in households
Switching sources of energy for heating, hot water and cooking
0
1.000
2.000
3.000
4.000
5.000
6.000
Reference year 2008
Energy consumption 2050
+134
-3.443-269
5.471
1.894
Growth in energy consumption owing to increased surface area
Improving the energy performance of buildings[T
J]
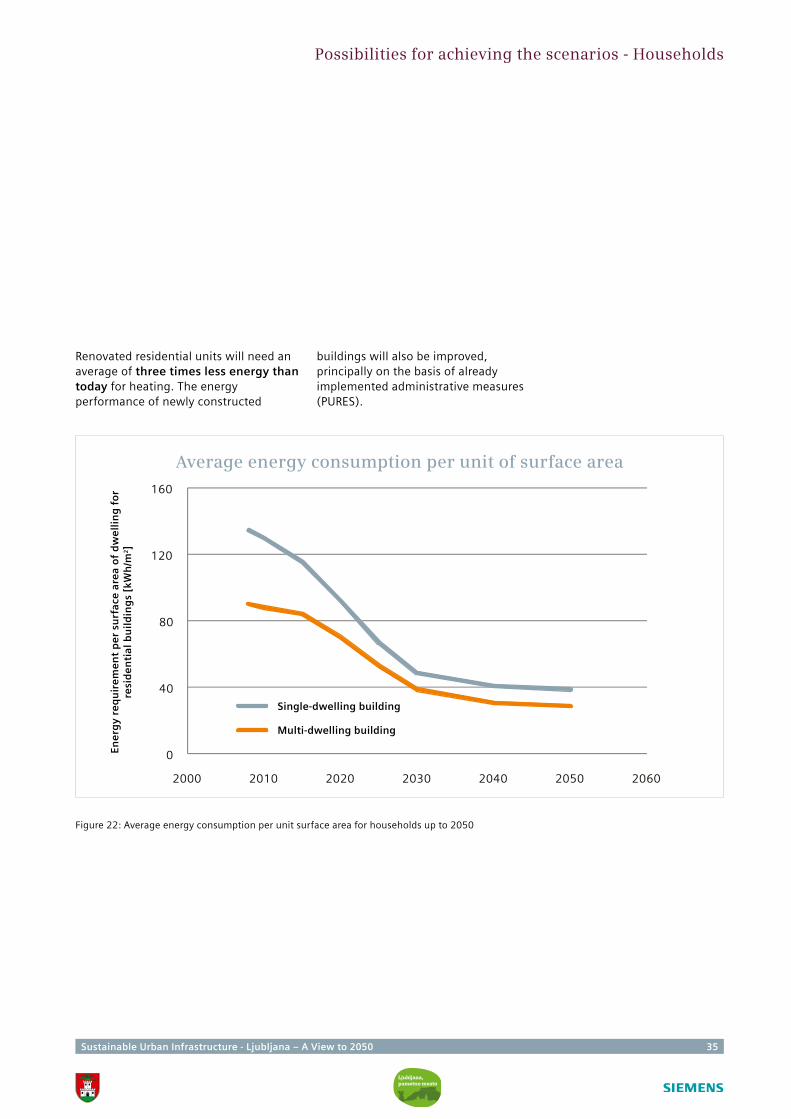
Sustainable Urban Infrastructure - Ljubljana – A View to 2050 35
Renovated residential units will need an average of three times less energy than today for heating. The energy performance of newly constructed
buildings will also be improved, principally on the basis of already implemented administrative measures (PURES).
Figure 22: Average energy consumption per unit surface area for households up to 2050
Average energy consumption per unit of surface area
Ene
rgy
req
uir
em
en
t p
er
surf
ace
are
a o
f d
we
llin
g f
or
resi
de
nti
al b
uil
din
gs
[kW
h/m
2]
0
40
80
120
160
2000 2010 2020 2030 2040 2050 2060
Single-dwelling building
Multi-dwelling building
Possibilities for achieving the scenarios - Households
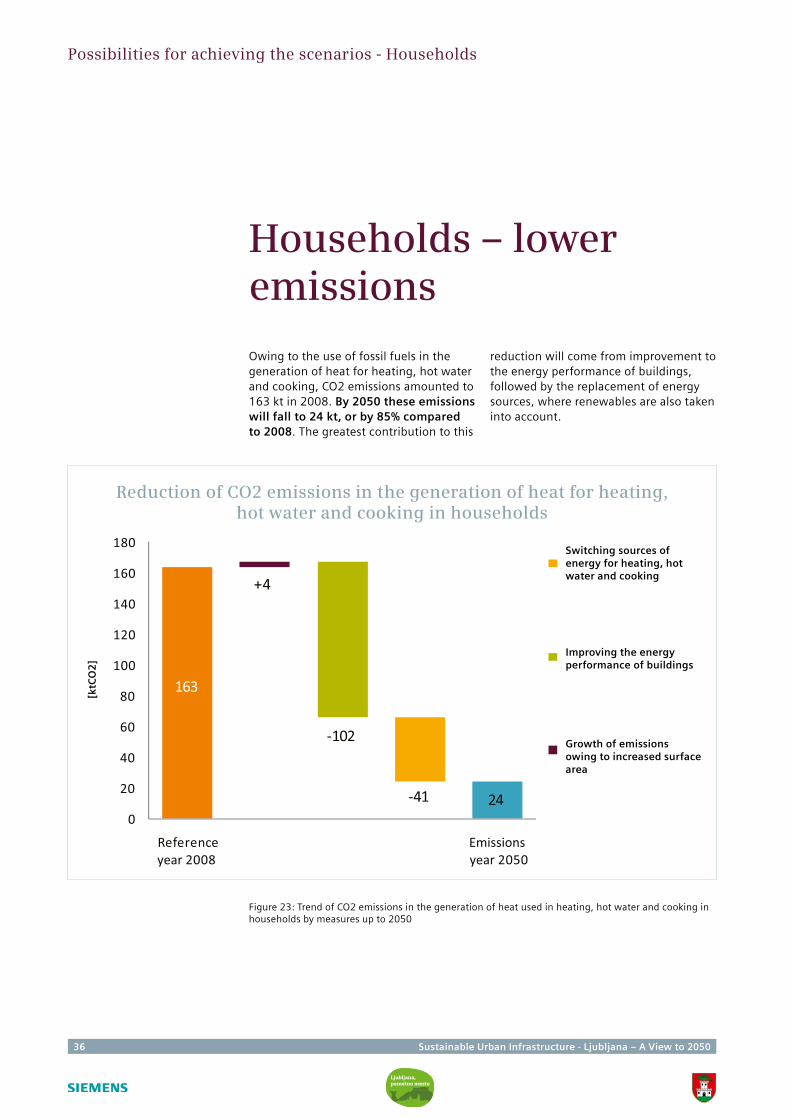
36 Sustainable Urban Infrastructure - Ljubljana – A View to 2050
Households – lower emissions
Owing to the use of fossil fuels in the generation of heat for heating, hot water and cooking, CO2 emissions amounted to 163 kt in 2008. By 2050 these emissions will fall to 24 kt, or by 85% compared to 2008. The greatest contribution to this
reduction will come from improvement to the energy performance of buildings, followed by the replacement of energy sources, where renewables are also taken into account.
Figure 23: Trend of CO2 emissions in the generation of heat used in heating, hot water and cooking in households by measures up to 2050
Possibilities for achieving the scenarios - Households
Reduction of CO2 emissions in the generation of heat for heating,hot water and cooking in households
[ktC
O2
]
Improving the energy performance of buildings
0
20
40
60
80
100
120
140
160
180
Reference year 2008
Emissions year 2050
+4
-102
-41
163
24
Switching sources of energy for heating, hot water and cooking
Growth of emissions owing to increased surface area
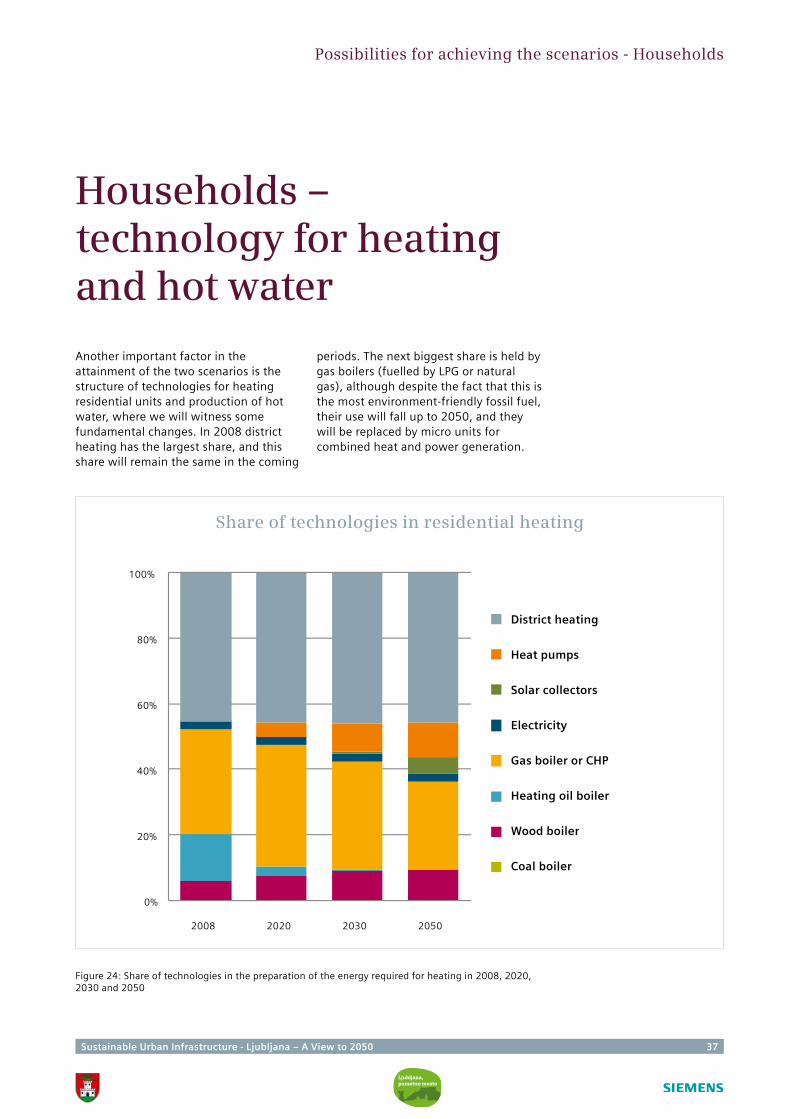
Sustainable Urban Infrastructure - Ljubljana – A View to 2050 37
Households – technology for heating and hot water
Another important factor in the attainment of the two scenarios is the structure of technologies for heating residential units and production of hot water, where we will witness some fundamental changes. In 2008 district heating has the largest share, and this share will remain the same in the coming
periods. The next biggest share is held by gas boilers (fuelled by LPG or natural gas), although despite the fact that this is the most environment-friendly fossil fuel, their use will fall up to 2050, and they will be replaced by micro units for combined heat and power generation.
Possibilities for achieving the scenarios - Households
Figure 24: Share of technologies in the preparation of the energy required for heating in 2008, 2020, 2030 and 2050
Share of technologies in residential heating
District heating
Heat pumps
Solar collectors
Electricity
Gas boiler or CHP
Heating oil boiler
Wood boiler
Coal boiler
0%
20%
40%
60%
80%
100%
2008 2020 2030 2050
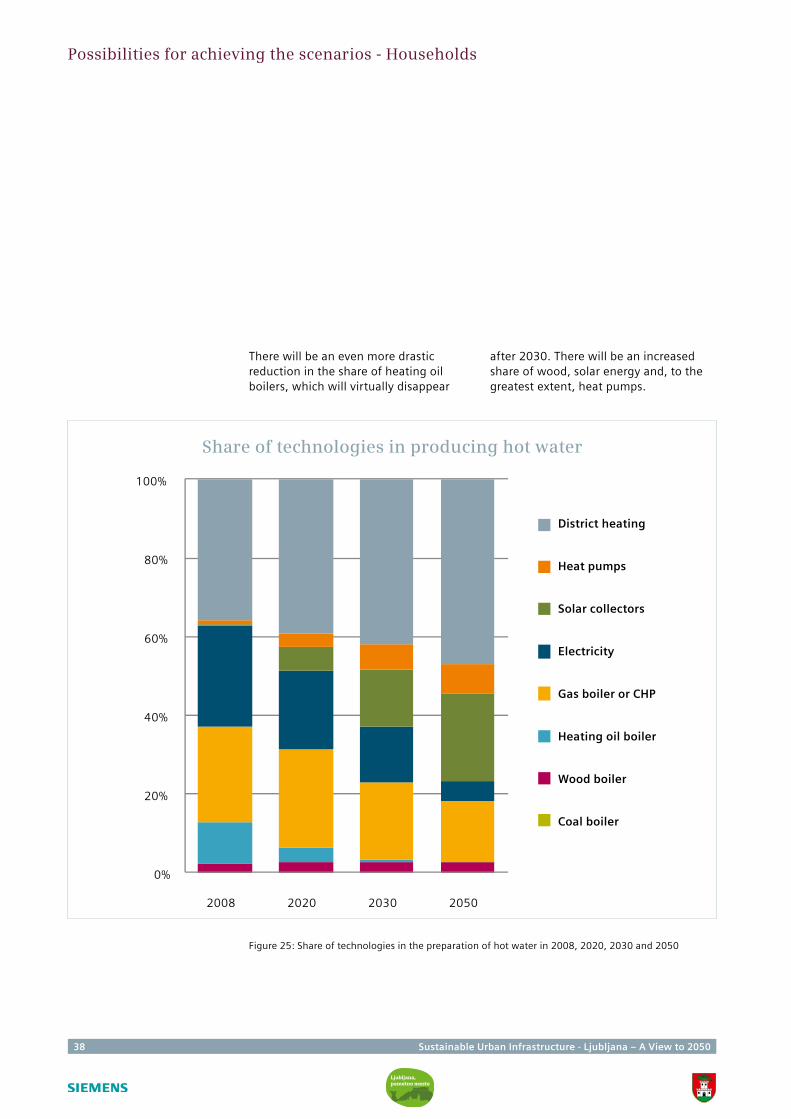
38 Sustainable Urban Infrastructure - Ljubljana – A View to 2050
Share of technologies in producing hot water
District heating
Heat pumps
Solar collectors
Electricity
Gas boiler or CHP
Heating oil boiler
Wood boiler
Coal boiler
Figure 25: Share of technologies in the preparation of hot water in 2008, 2020, 2030 and 2050
0%
20%
40%
60%
80%
100%
2008 2020 2030 2050
Possibilities for achieving the scenarios - Households
There will be an even more drastic reduction in the share of heating oil boilers, which will virtually disappear
after 2030. There will be an increased share of wood, solar energy and, to the greatest extent, heat pumps.
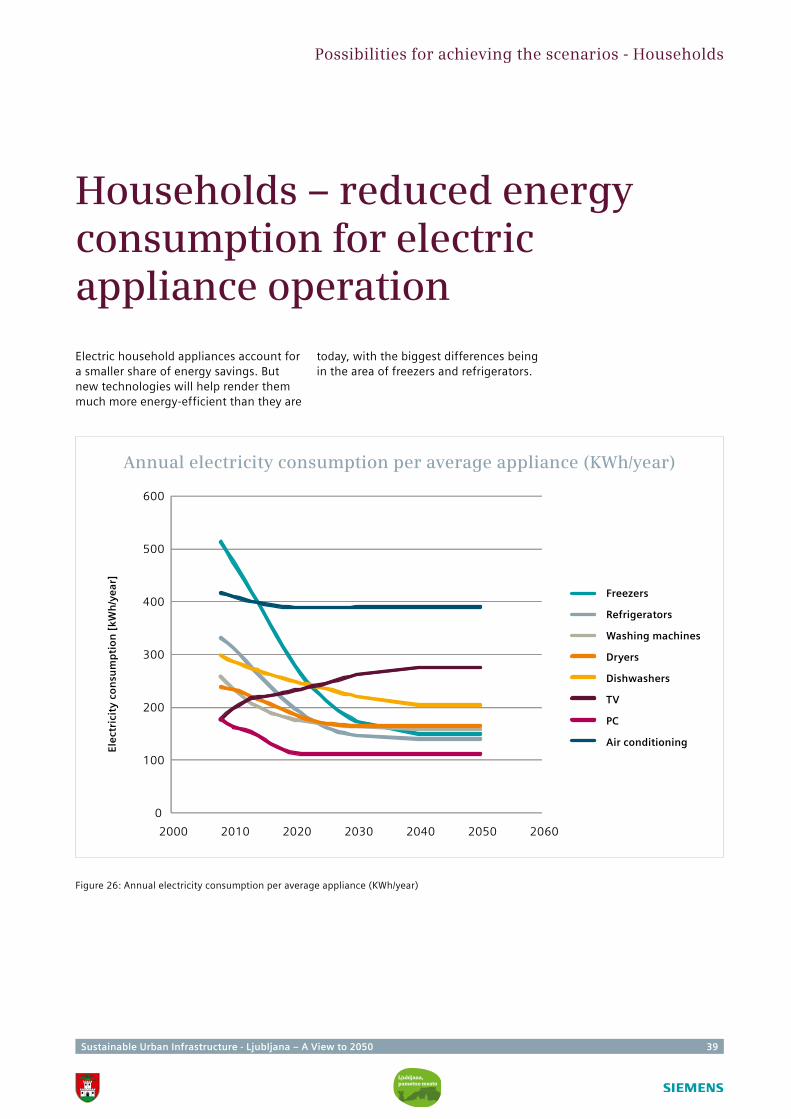
Sustainable Urban Infrastructure - Ljubljana – A View to 2050 39
Households – reduced energy consumption for electric appliance operation
Electric household appliances account for a smaller share of energy savings. But new technologies will help render them much more energy-efficient than they are
today, with the biggest differences being in the area of freezers and refrigerators.
Possibilities for achieving the scenarios - Households
Figure 26: Annual electricity consumption per average appliance (KWh/year)
Annual electricity consumption per average appliance (KWh/year)
Ele
ctri
city
co
nsu
mp
tio
n [
kWh
/ye
ar]
Freezers
Refrigerators
Washing machines
Dryers
Dishwashers
TV
PC
Air conditioning
0
100
200
300
400
500
600
2000 2010 2020 2030 2040 2050 2060
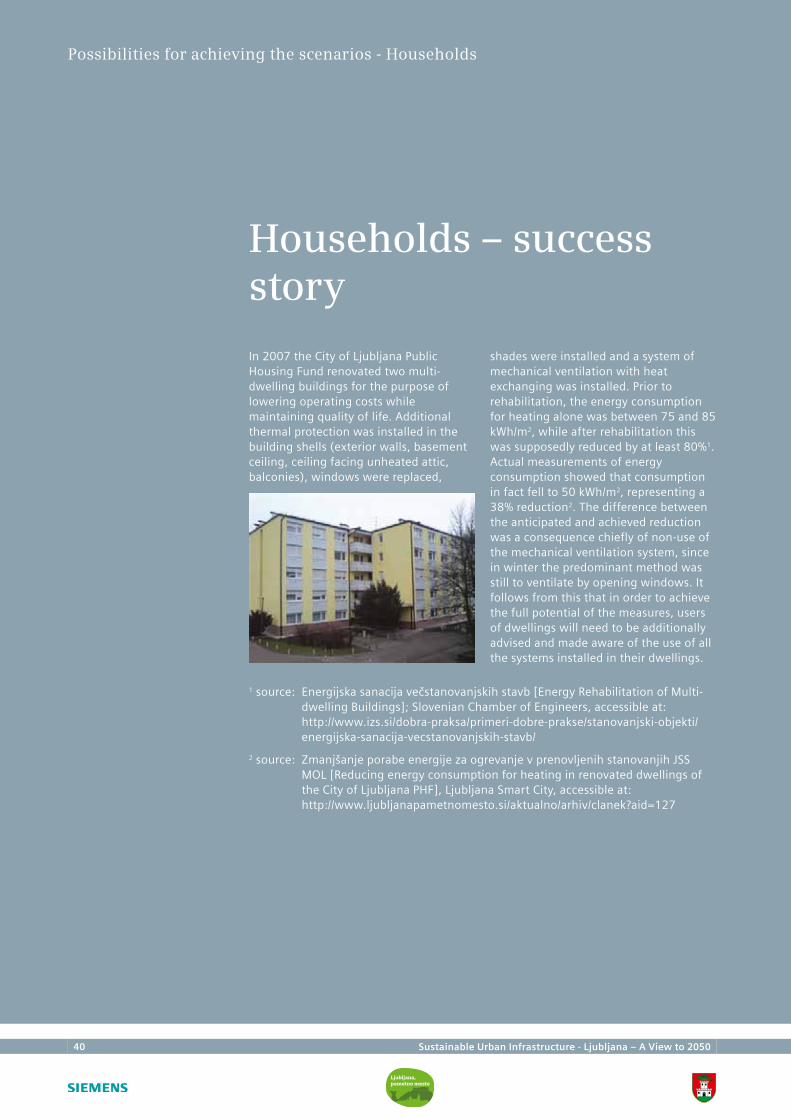
40 Sustainable Urban Infrastructure - Ljubljana – A View to 2050
Households – success story
In 2007 the City of Ljubljana Public Housing Fund renovated two multi-dwelling buildings for the purpose of lowering operating costs while maintaining quality of life. Additional thermal protection was installed in the building shells (exterior walls, basement ceiling, ceiling facing unheated attic, balconies), windows were replaced,
shades were installed and a system of mechanical ventilation with heat exchanging was installed. Prior to rehabilitation, the energy consumption for heating alone was between 75 and 85 kWh/m2, while after rehabilitation this was supposedly reduced by at least 80%1. Actual measurements of energy consumption showed that consumption in fact fell to 50 kWh/m2, representing a 38% reduction2. The difference between the anticipated and achieved reduction was a consequence chiefly of non-use of the mechanical ventilation system, since in winter the predominant method was still to ventilate by opening windows. It follows from this that in order to achieve the full potential of the measures, users of dwellings will need to be additionally advised and made aware of the use of all the systems installed in their dwellings.
Possibilities for achieving the scenarios - Households
1 source: Energijska sanacija večstanovanjskih stavb [Energy Rehabilitation of Multi-dwelling Buildings]; Slovenian Chamber of Engineers, accessible at: http://www.izs.si/dobra-praksa/primeri-dobre-prakse/stanovanjski-objekti/energijska-sanacija-vecstanovanjskih-stavb/
2 source: Zmanjšanje porabe energije za ogrevanje v prenovljenih stanovanjih JSS MOL [Reducing energy consumption for heating in renovated dwellings of the City of Ljubljana PHF], Ljubljana Smart City, accessible at: http://www.ljubljanapametnomesto.si/aktualno/arhiv/clanek?aid=127
Sustainable Urban Infrastructure - Ljubljana – A View to 2050 41
Public and service sectors – energy consumption in buildings
The greatest proportion of household energy use in the public and service sectors is also for heating and hot water, followed by electricity for appliances and lighting.
The target scenario and the scenario of sustainable excellence can be achieved through the following measures:
• energy-efficient renovation of buildings;
• measures for heating systems;
• switching sources for heating and hot water;
• improving the energy efficiency of lighting and electrical appliances.
By implementing these measures we can achieve several positive effects:
• reducing energy consumption for heat used in heating and hot water (in the public sector excluding buildings owned by City of Ljubljana, the reduction could be 59%, in City of Ljubljana buildings 61% and in the service sector 30%);
• reducing emissions (in the public sector excluding buildings owned by City of Ljubljana, the emissions reduction could be 82%, in City of Ljubljana buildings 80% and in the service sector 70%);
• reducing electricity consumption for other purposes (not including heating and hot water) despite the obvious increase in activities, in the public sector (excluding City of Ljubljana buildings) the increase could be limited to just 4%, while it could be reduced in City of Ljubljana buildings (by 13%) and in the service sector (by 13%).
Since this involves public buildings, users do not feel the consequences of irrational practices on their own wallet. For this reason it is extremely important to provide awareness-raising and to introduce new patterns and models for rewards and motivation based on the positive effects of reducing energy consumption and emissions.
The total investment costs for achieving the above targets, which will also lead to attaining the target scenario and the sustainable excellence scenario, have been estimated at EUR 147 million up to 2050. These measures should yield around EUR 6 million in savings each year.
Possibilities for achieving the scenarios - Public and service sectors
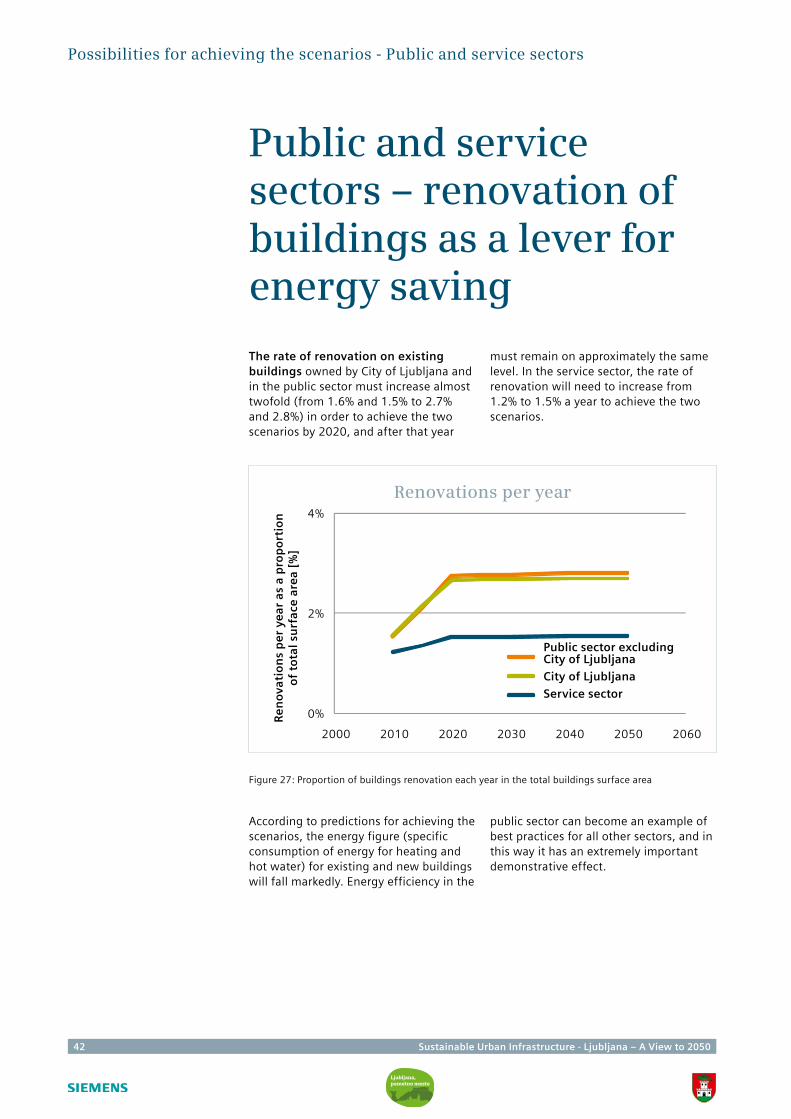
42 Sustainable Urban Infrastructure - Ljubljana – A View to 2050
Public and service sectors – renovation of buildings as a lever for energy saving
The rate of renovation on existing buildings owned by City of Ljubljana and in the public sector must increase almost twofold (from 1.6% and 1.5% to 2.7% and 2.8%) in order to achieve the two scenarios by 2020, and after that year
must remain on approximately the same level. In the service sector, the rate of renovation will need to increase from 1.2% to 1.5% a year to achieve the two scenarios.
Figure 27: Proportion of buildings renovation each year in the total buildings surface area
Possibilities for achieving the scenarios - Public and service sectors
Renovations per year
Re
no
vati
on
s p
er
year
as
a p
rop
ort
ion
o
f to
tal s
urf
ace
are
a [%
]
0%
2%
4%
2000 2010 2020 2030 2040 2050 2060
Public sector excluding City of Ljubljana
City of Ljubljana
Service sector
According to predictions for achieving the scenarios, the energy figure (specific consumption of energy for heating and hot water) for existing and new buildings will fall markedly. Energy efficiency in the
public sector can become an example of best practices for all other sectors, and in this way it has an extremely important demonstrative effect.
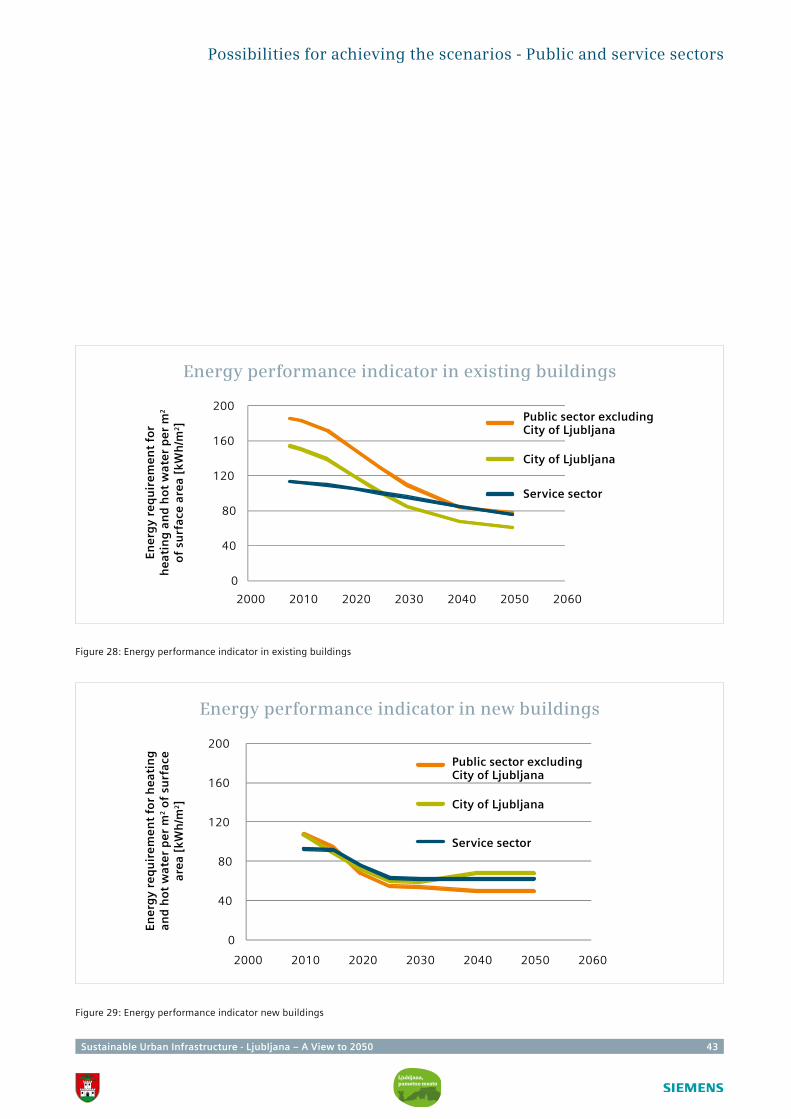
Sustainable Urban Infrastructure - Ljubljana – A View to 2050 43
Energy performance indicator in new buildings
Energy performance indicator in existing buildings
Figure 29: Energy performance indicator new buildings
Ene
rgy
req
uir
em
en
t fo
r h
eat
ing
an
d h
ot
wat
er
pe
r m
2
of
surf
ace
are
a [k
Wh
/m2]
Possibilities for achieving the scenarios - Public and service sectors
Ene
rgy
req
uir
em
en
t fo
r h
eat
ing
an
d h
ot
wat
er
pe
r m
2 o
f su
rfac
e ar
ea
[kW
h/m
2]
Figure 28: Energy performance indicator in existing buildings
0
40
80
120
160
200
2000 2010 2020 2030 2040 2050 2060
Public sector excluding City of Ljubljana
City of Ljubljana
Service sector
0
40
80
120
160
200
2000 2010 2020 2030 2040 2050 2060
Public sector excluding City of Ljubljana
City of Ljubljana
Service sector
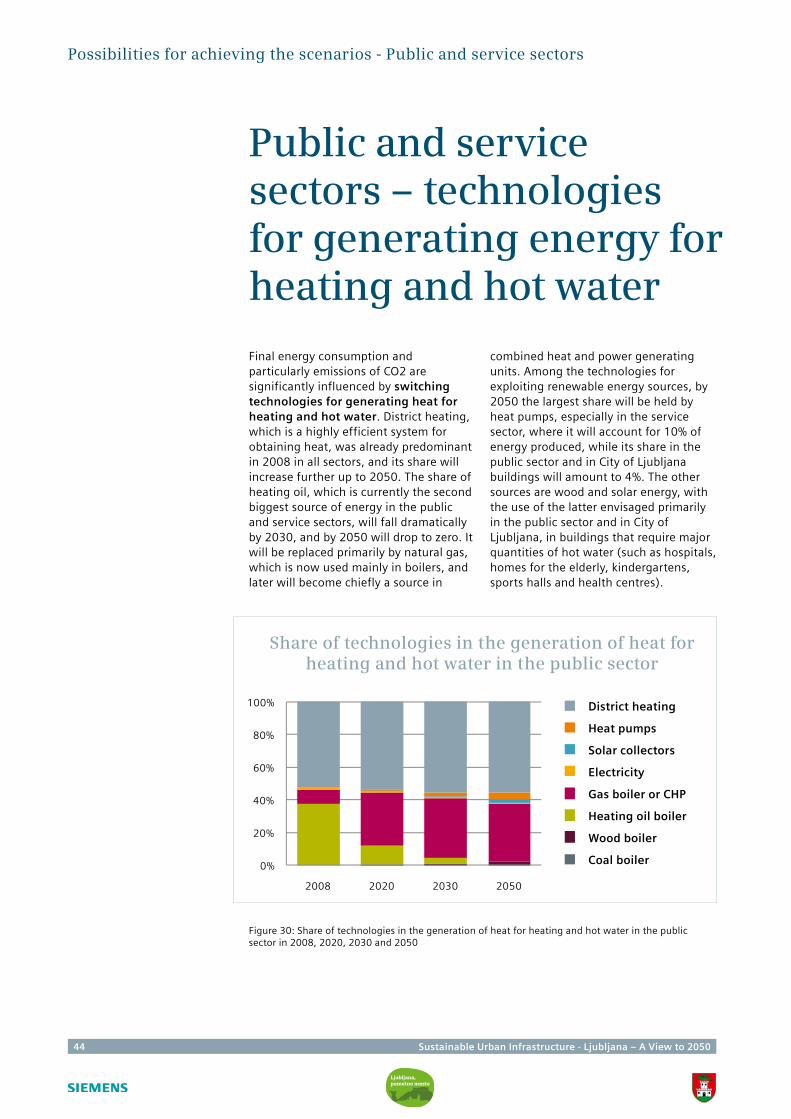
44 Sustainable Urban Infrastructure - Ljubljana – A View to 2050
Possibilities for achieving the scenarios - Public and service sectors
Public and service sectors – technologies for generating energy for heating and hot water
Final energy consumption and particularly emissions of CO2 are significantly influenced by switching technologies for generating heat for heating and hot water. District heating, which is a highly efficient system for obtaining heat, was already predominant in 2008 in all sectors, and its share will increase further up to 2050. The share of heating oil, which is currently the second biggest source of energy in the public and service sectors, will fall dramatically by 2030, and by 2050 will drop to zero. It will be replaced primarily by natural gas, which is now used mainly in boilers, and later will become chiefly a source in
combined heat and power generating units. Among the technologies for exploiting renewable energy sources, by 2050 the largest share will be held by heat pumps, especially in the service sector, where it will account for 10% of energy produced, while its share in the public sector and in City of Ljubljana buildings will amount to 4%. The other sources are wood and solar energy, with the use of the latter envisaged primarily in the public sector and in City of Ljubljana, in buildings that require major quantities of hot water (such as hospitals, homes for the elderly, kindergartens, sports halls and health centres).
Figure 30: Share of technologies in the generation of heat for heating and hot water in the public sector in 2008, 2020, 2030 and 2050
Share of technologies in the generation of heat for heating and hot water in the public sector
District heating
Heat pumps
Solar collectors
Electricity
Gas boiler or CHP
Heating oil boiler
Wood boiler
Coal boiler0%
20%
40%
60%
80%
100%
2008 2020 2030 2050
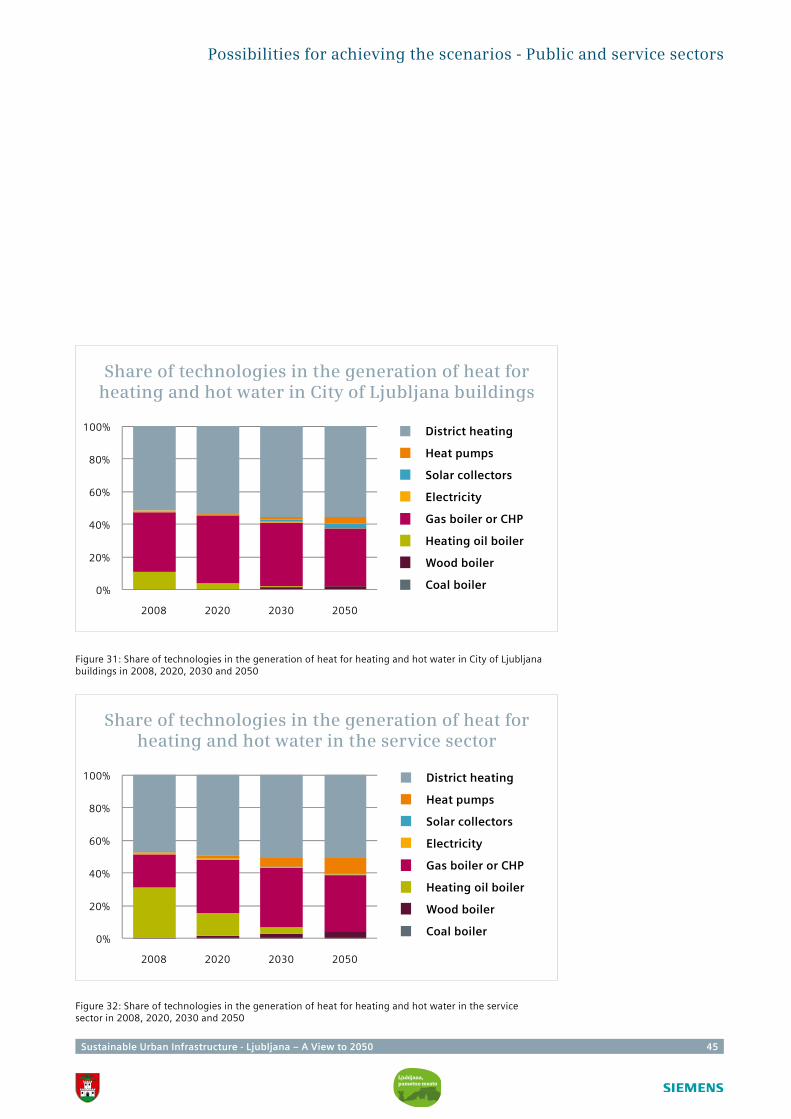
Sustainable Urban Infrastructure - Ljubljana – A View to 2050 45
Figure 32: Share of technologies in the generation of heat for heating and hot water in the service sector in 2008, 2020, 2030 and 2050
Figure 31: Share of technologies in the generation of heat for heating and hot water in City of Ljubljana buildings in 2008, 2020, 2030 and 2050
Share of technologies in the generation of heat for heating and hot water in City of Ljubljana buildings
Share of technologies in the generation of heat for heating and hot water in the service sector
District heating
Heat pumps
Solar collectors
Electricity
Gas boiler or CHP
Heating oil boiler
Wood boiler
Coal boiler
District heating
Heat pumps
Solar collectors
Electricity
Gas boiler or CHP
Heating oil boiler
Wood boiler
Coal boiler
0%
20%
40%
60%
80%
100%
2008 2020 2030 2050
0%
20%
40%
60%
80%
100%
2008 2020 2030 2050
Possibilities for achieving the scenarios - Public and service sectors
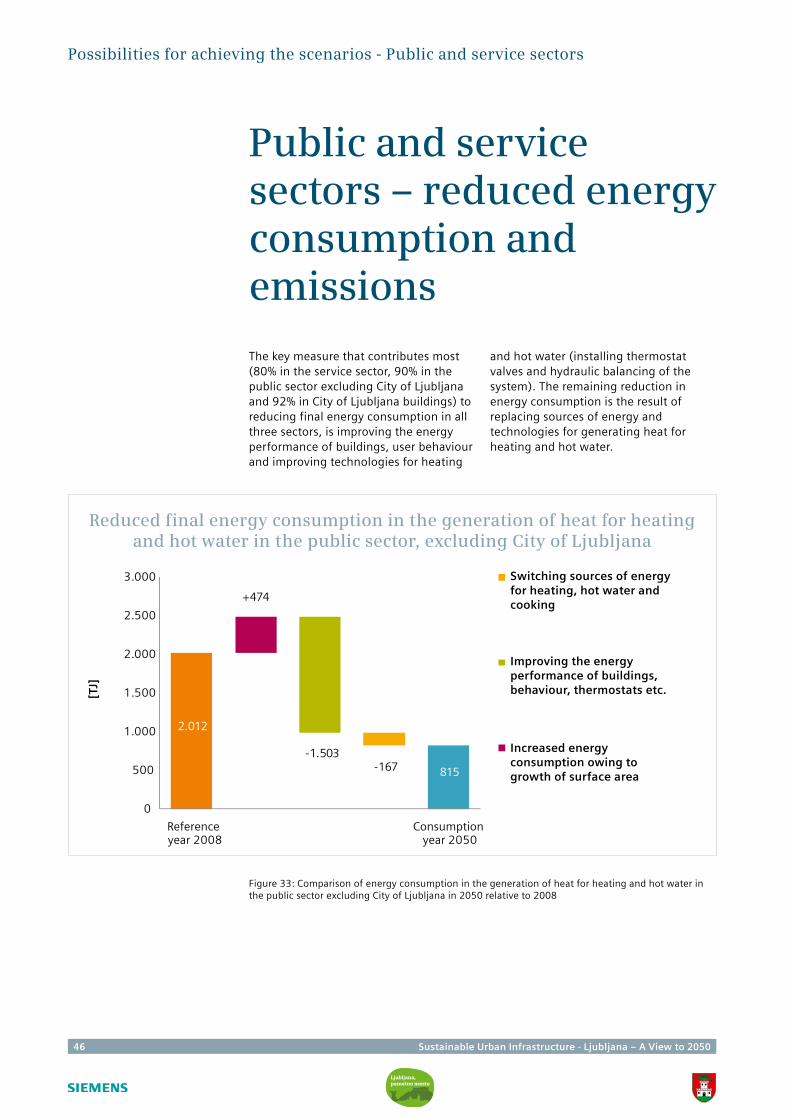
46 Sustainable Urban Infrastructure - Ljubljana – A View to 2050
Public and service sectors – reduced energy consumption and emissions
The key measure that contributes most (80% in the service sector, 90% in the public sector excluding City of Ljubljana and 92% in City of Ljubljana buildings) to reducing final energy consumption in all three sectors, is improving the energy performance of buildings, user behaviour and improving technologies for heating
and hot water (installing thermostat valves and hydraulic balancing of the system). The remaining reduction in energy consumption is the result of replacing sources of energy and technologies for generating heat for heating and hot water.
Figure 33: Comparison of energy consumption in the generation of heat for heating and hot water in the public sector excluding City of Ljubljana in 2050 relative to 2008
Possibilities for achieving the scenarios - Public and service sectors
Reduced final energy consumption in the generation of heat for heating and hot water in the public sector, excluding City of Ljubljana
Switching sources of energy for heating, hot water and cooking
Increased energy consumption owing to growth of surface area
Improving the energy performance of buildings, behaviour, thermostats etc.[T
J]
0
500
1.000
1.500
2.000
2.500
3.000
Reference year 2008
Consumption year 2050
+474
-1.503-167
2.012
815
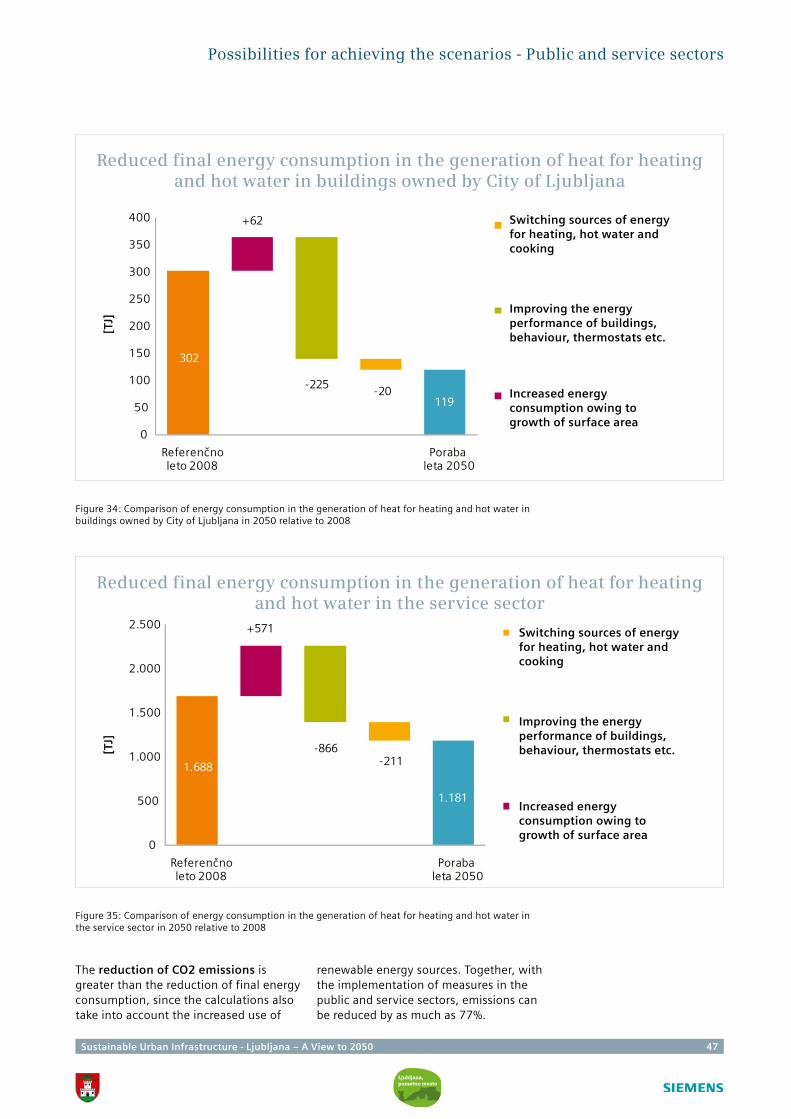
Sustainable Urban Infrastructure - Ljubljana – A View to 2050 47
The reduction of CO2 emissions is greater than the reduction of final energy consumption, since the calculations also take into account the increased use of
renewable energy sources. Together, with the implementation of measures in the public and service sectors, emissions can be reduced by as much as 77%.
Figure 34: Comparison of energy consumption in the generation of heat for heating and hot water in buildings owned by City of Ljubljana in 2050 relative to 2008
Figure 35: Comparison of energy consumption in the generation of heat for heating and hot water in the service sector in 2050 relative to 2008
Possibilities for achieving the scenarios - Public and service sectors
Reduced final energy consumption in the generation of heat for heating and hot water in buildings owned by City of Ljubljana
Reduced final energy consumption in the generation of heat for heating and hot water in the service sector
[TJ]
[TJ]
0
50
100
150
200
250
300
350
400
Referenčno leto 2008
Poraba leta 2050
+62
-225-20
302
119
0
500
1.000
1.500
2.000
2.500
Referenčno leto 2008
Poraba leta 2050
+571
-866-2111.688
1.181
Switching sources of energy for heating, hot water and cooking
Increased energy consumption owing to growth of surface area
Improving the energy performance of buildings, behaviour, thermostats etc.
Switching sources of energy for heating, hot water and cooking
Increased energy consumption owing to growth of surface area
Improving the energy performance of buildings, behaviour, thermostats etc.
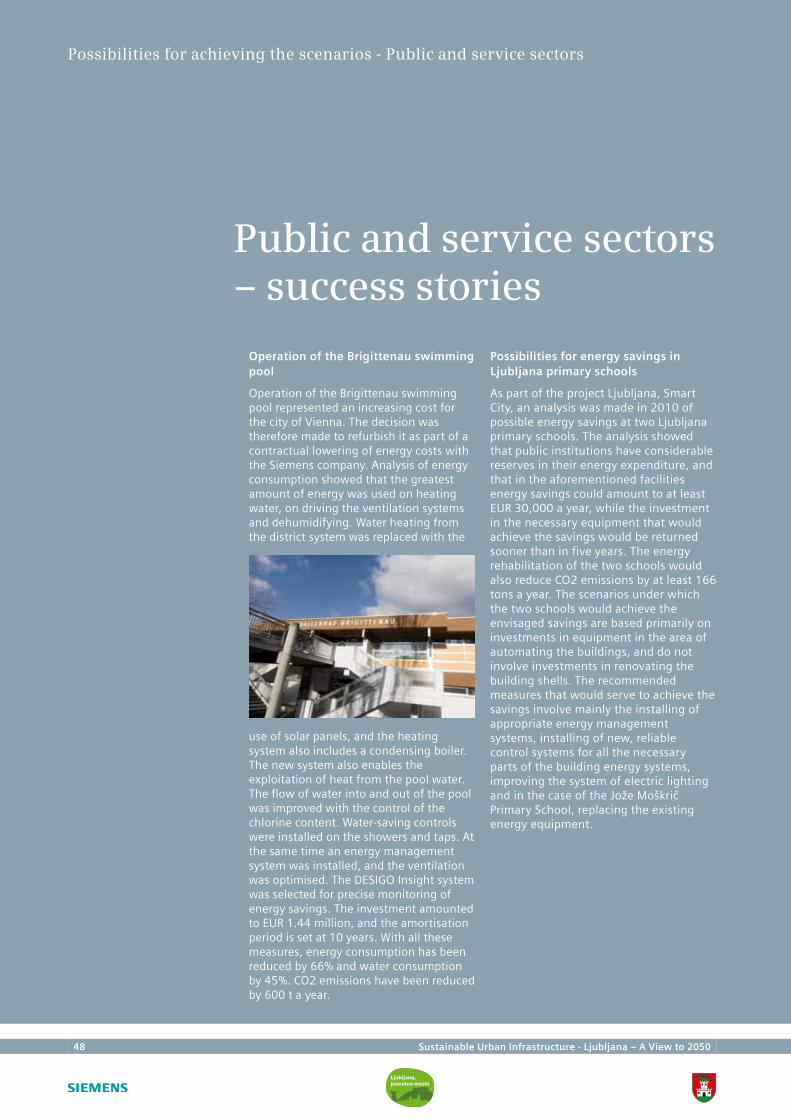
48 Sustainable Urban Infrastructure - Ljubljana – A View to 2050
Public and service sectors – success stories
use of solar panels, and the heating system also includes a condensing boiler. The new system also enables the exploitation of heat from the pool water. The flow of water into and out of the pool was improved with the control of the chlorine content. Water-saving controls were installed on the showers and taps. At the same time an energy management system was installed, and the ventilation was optimised. The DESIGO Insight system was selected for precise monitoring of energy savings. The investment amounted to EUR 1.44 million, and the amortisation period is set at 10 years. With all these measures, energy consumption has been reduced by 66% and water consumption by 45%. CO2 emissions have been reduced by 600 t a year.
Possibilities for energy savings in Ljubljana primary schools
As part of the project Ljubljana, Smart City, an analysis was made in 2010 of possible energy savings at two Ljubljana primary schools. The analysis showed that public institutions have considerable reserves in their energy expenditure, and that in the aforementioned facilities energy savings could amount to at least EUR 30,000 a year, while the investment in the necessary equipment that would achieve the savings would be returned sooner than in five years. The energy rehabilitation of the two schools would also reduce CO2 emissions by at least 166 tons a year. The scenarios under which the two schools would achieve the envisaged savings are based primarily on investments in equipment in the area of automating the buildings, and do not involve investments in renovating the building shells. The recommended measures that would serve to achieve the savings involve mainly the installing of appropriate energy management systems, installing of new, reliable control systems for all the necessary parts of the building energy systems, improving the system of electric lighting and in the case of the Jože Moškrič Primary School, replacing the existing energy equipment.
Possibilities for achieving the scenarios - Public and service sectors
Operation of the Brigittenau swimming pool
Operation of the Brigittenau swimming pool represented an increasing cost for the city of Vienna. The decision was therefore made to refurbish it as part of a contractual lowering of energy costs with the Siemens company. Analysis of energy consumption showed that the greatest amount of energy was used on heating water, on driving the ventilation systems and dehumidifying. Water heating from the district system was replaced with the
Sustainable Urban Infrastructure - Ljubljana – A View to 2050 49
The typical measures of energy policy in the area of transport that some countries are already implementing are as follows:
• fiscal policy measures: taxing fuels and vehicles and fees for the use of roads in terms of environmental criteria, with a gradual increase in the range of tax rates;
• reducing the specific consumption of new vehicles: Regulation (EC) No 443/2009 of the European Parliament and of the Council setting emission performance standards for new passenger cars, informing buyers of specific CO2 emissions when they purchase new cars, promoting the purchase of hybrid vehicles and so forth;
• incentives for introducing electric battery cars and hydrogen-powered cars and promoting the development and construction of charging facilities for electric cars;
• green public procurement;
• introducing biofuels and other RES in transport;
• better vehicle maintenance, regular monitoring of exhaust gases, better monitoring of traffic, speed limits etc.;
• information and promotion campaigns to promote more economical driving and sustainable forms of transport.
Ljubljana can achieve the target scenario and the sustainable excellence scenario if it observes the following factors, whose effects we describe in greater detail later in this report:
• accessible, efficient, affordable public transport and sustainable transport infrastructure (rail and road, which both demand major investment);
• expanding the network of cycle paths and pedestrian zones;
• altering the structure of the fleet of passenger cars;
• altering the structure of the city bus fleet;
• changing the share of passenger kilometres.
Transport – measures and effects for reducing emissions
Possibilities for achieving the scenarios - Transport
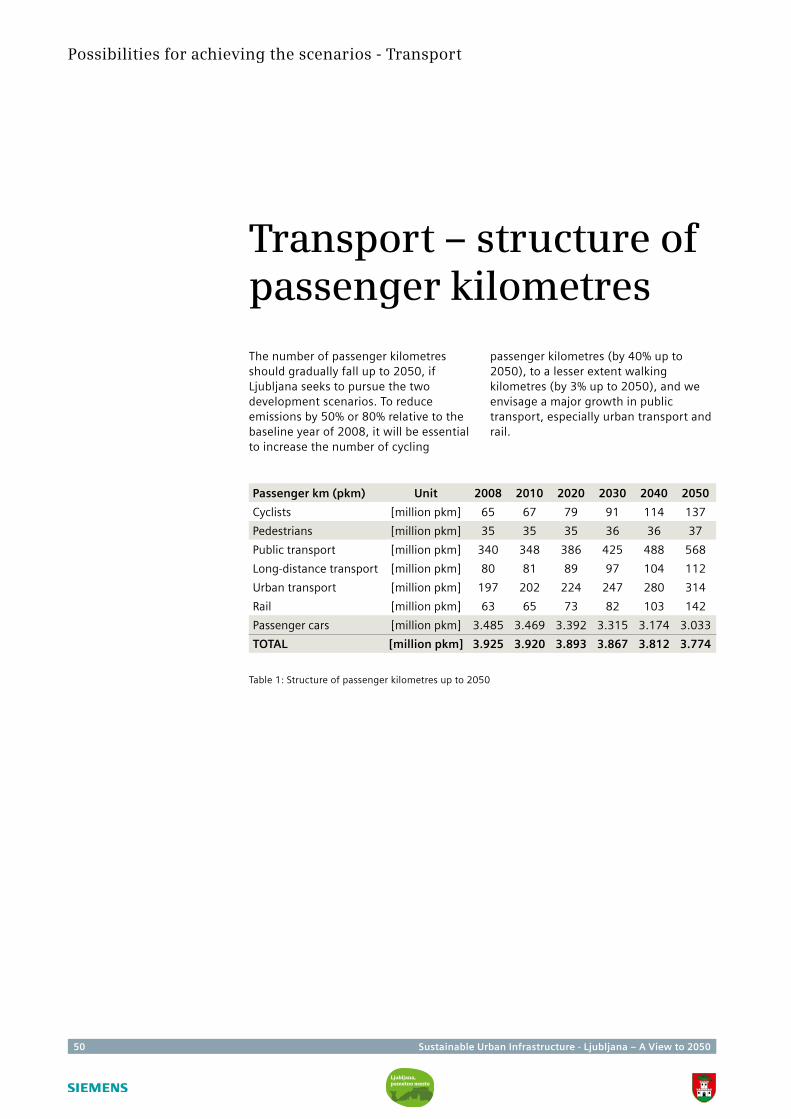
50 Sustainable Urban Infrastructure - Ljubljana – A View to 2050
Transport – structure of passenger kilometres
The number of passenger kilometres should gradually fall up to 2050, if Ljubljana seeks to pursue the two development scenarios. To reduce emissions by 50% or 80% relative to the baseline year of 2008, it will be essential to increase the number of cycling
passenger kilometres (by 40% up to 2050), to a lesser extent walking kilometres (by 3% up to 2050), and we envisage a major growth in public transport, especially urban transport and rail.
Possibilities for achieving the scenarios - Transport
Table 1: Structure of passenger kilometres up to 2050
Passenger km (pkm) Unit 2008 2010 2020 2030 2040 2050
Cyclists [million pkm] 65 67 79 91 114 137
Pedestrians [million pkm] 35 35 35 36 36 37
Public transport [million pkm] 340 348 386 425 488 568
Long-distance transport [million pkm] 80 81 89 97 104 112
Urban transport [million pkm] 197 202 224 247 280 314
Rail [million pkm] 63 65 73 82 103 142
Passenger cars [million pkm] 3.485 3.469 3.392 3.315 3.174 3.033
TOTAL [million pkm] 3.925 3.920 3.893 3.867 3.812 3.774
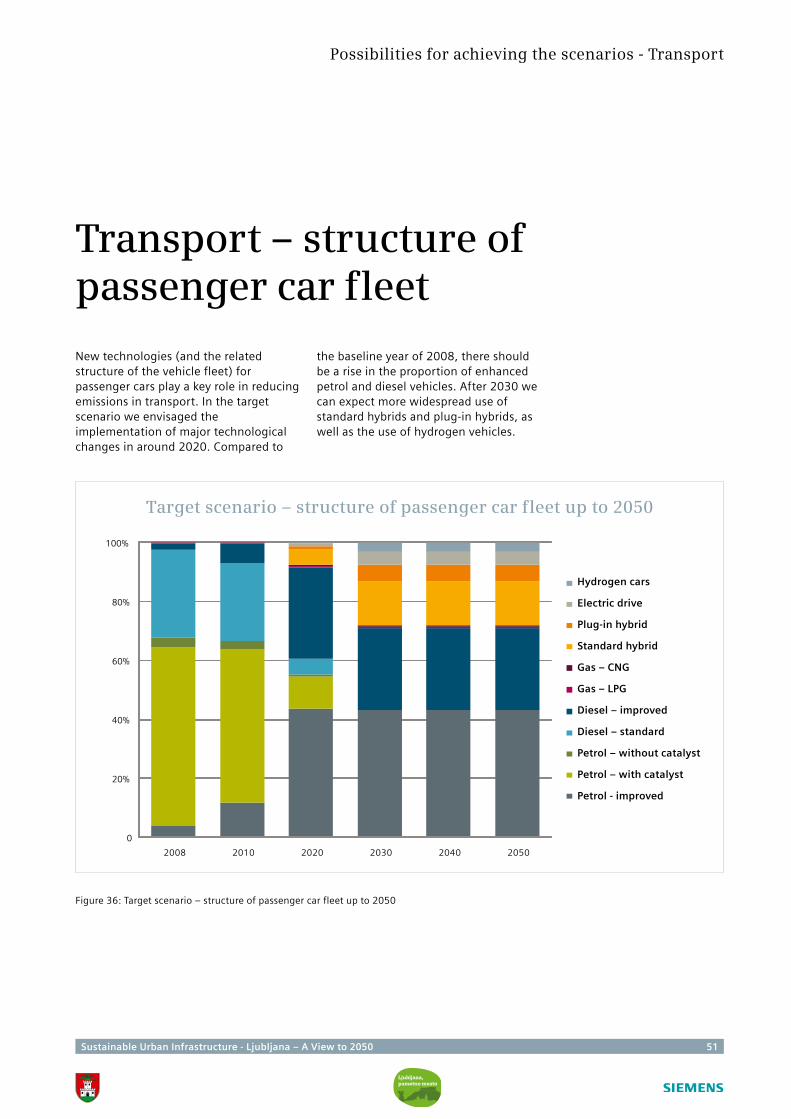
Sustainable Urban Infrastructure - Ljubljana – A View to 2050 51
New technologies (and the related structure of the vehicle fleet) for passenger cars play a key role in reducing emissions in transport. In the target scenario we envisaged the implementation of major technological changes in around 2020. Compared to
the baseline year of 2008, there should be a rise in the proportion of enhanced petrol and diesel vehicles. After 2030 we can expect more widespread use of standard hybrids and plug-in hybrids, as well as the use of hydrogen vehicles.
Possibilities for achieving the scenarios - Transport
Transport – structure of passenger car fleet
Figure 36: Target scenario – structure of passenger car fleet up to 2050
Target scenario – structure of passenger car fleet up to 2050
Hydrogen cars
Electric drive
Plug-in hybrid
Standard hybrid
Gas – CNG
Gas – LPG
Diesel – improved
Diesel – standard
Petrol – without catalyst
Petrol – with catalyst
Petrol - improved
2008 2010 2020 2030 2040 2050
0
20%
40%
60%
80%
100%
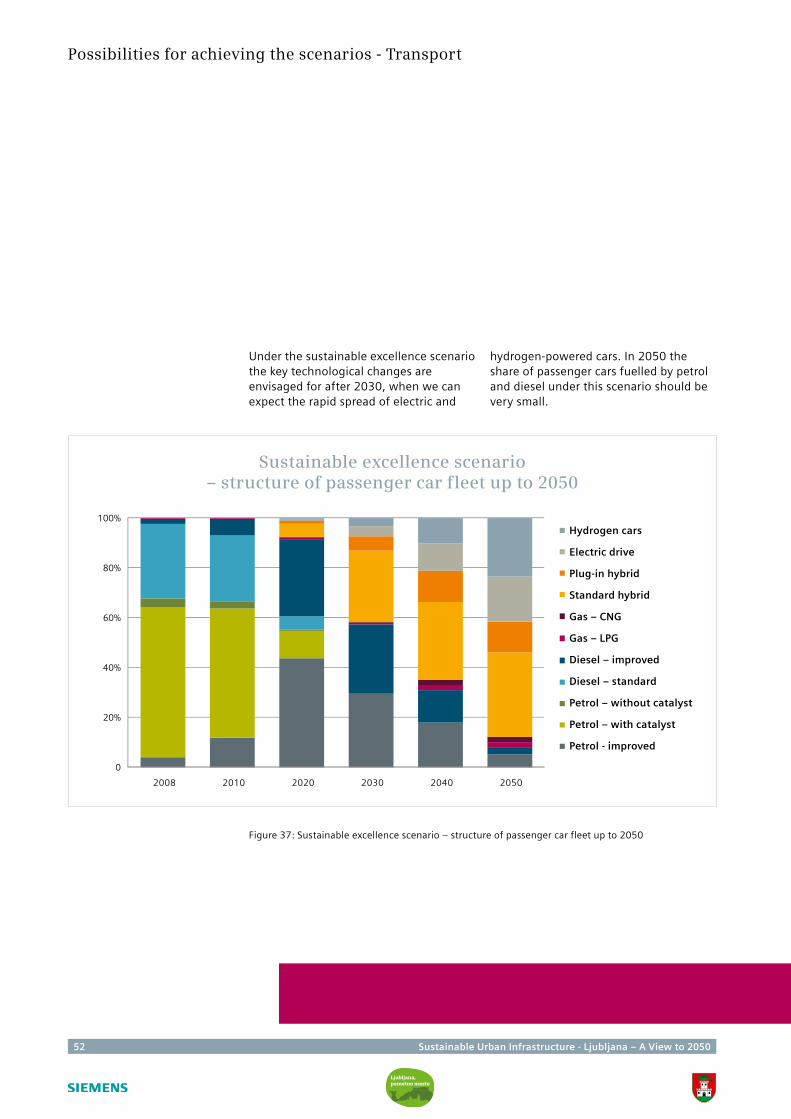
52 Sustainable Urban Infrastructure - Ljubljana – A View to 2050
Possibilities for achieving the scenarios - Transport
Figure 37: Sustainable excellence scenario – structure of passenger car fleet up to 2050
Sustainable excellence scenario – structure of passenger car fleet up to 2050
Hydrogen cars
Electric drive
Plug-in hybrid
Standard hybrid
Gas – CNG
Gas – LPG
Diesel – improved
Diesel – standard
Petrol – without catalyst
Petrol – with catalyst
Petrol - improved
Under the sustainable excellence scenario the key technological changes are envisaged for after 2030, when we can expect the rapid spread of electric and
hydrogen-powered cars. In 2050 the share of passenger cars fuelled by petrol and diesel under this scenario should be very small.
0
20%
40%
60%
80%
100%
2008 2010 2020 2030 2040 2050
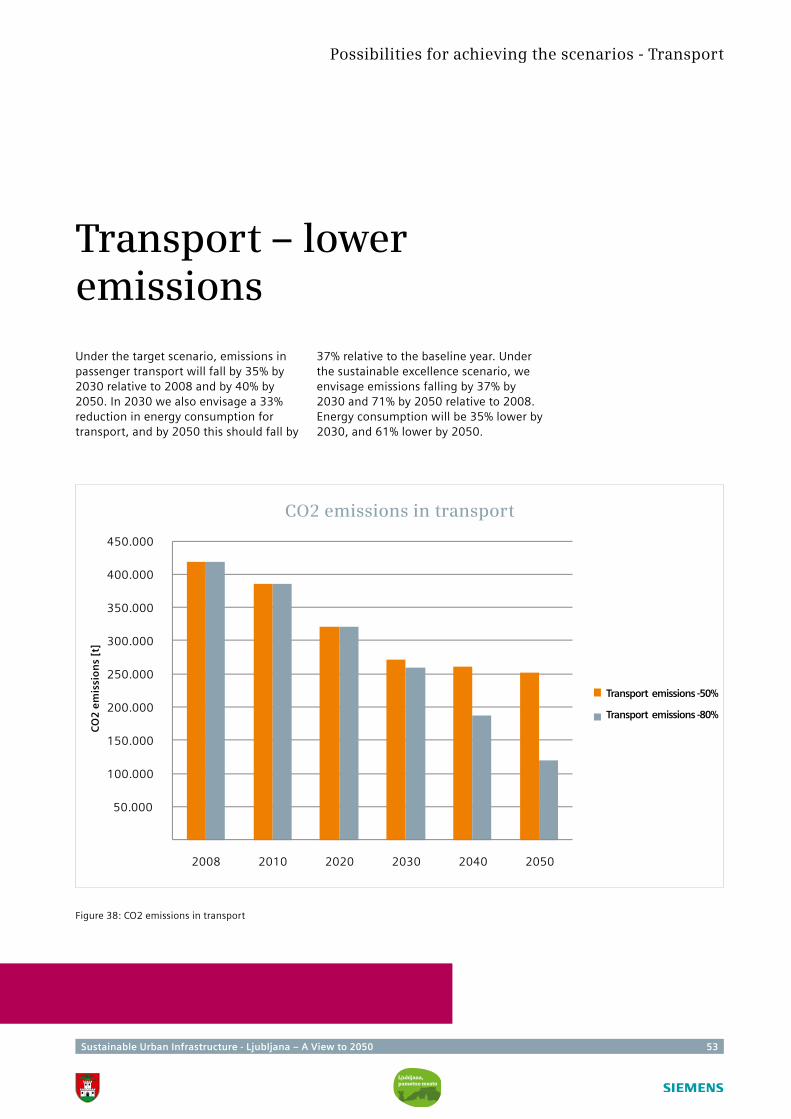
Sustainable Urban Infrastructure - Ljubljana – A View to 2050 53
Transport – lower emissions
Under the target scenario, emissions in passenger transport will fall by 35% by 2030 relative to 2008 and by 40% by 2050. In 2030 we also envisage a 33% reduction in energy consumption for transport, and by 2050 this should fall by
37% relative to the baseline year. Under the sustainable excellence scenario, we envisage emissions falling by 37% by 2030 and 71% by 2050 relative to 2008. Energy consumption will be 35% lower by 2030, and 61% lower by 2050.
Possibilities for achieving the scenarios - Transport
Figure 38: CO2 emissions in transport
CO2 emissions in transport
CO
2 e
mis
sio
ns
[t]
Transport emissions -50%
Transport emissions -80%
50.000
100.000
150.000
200.000
250.000
300.000
350.000
400.000
450.000
2008 2010 2020 2030 2040 2050
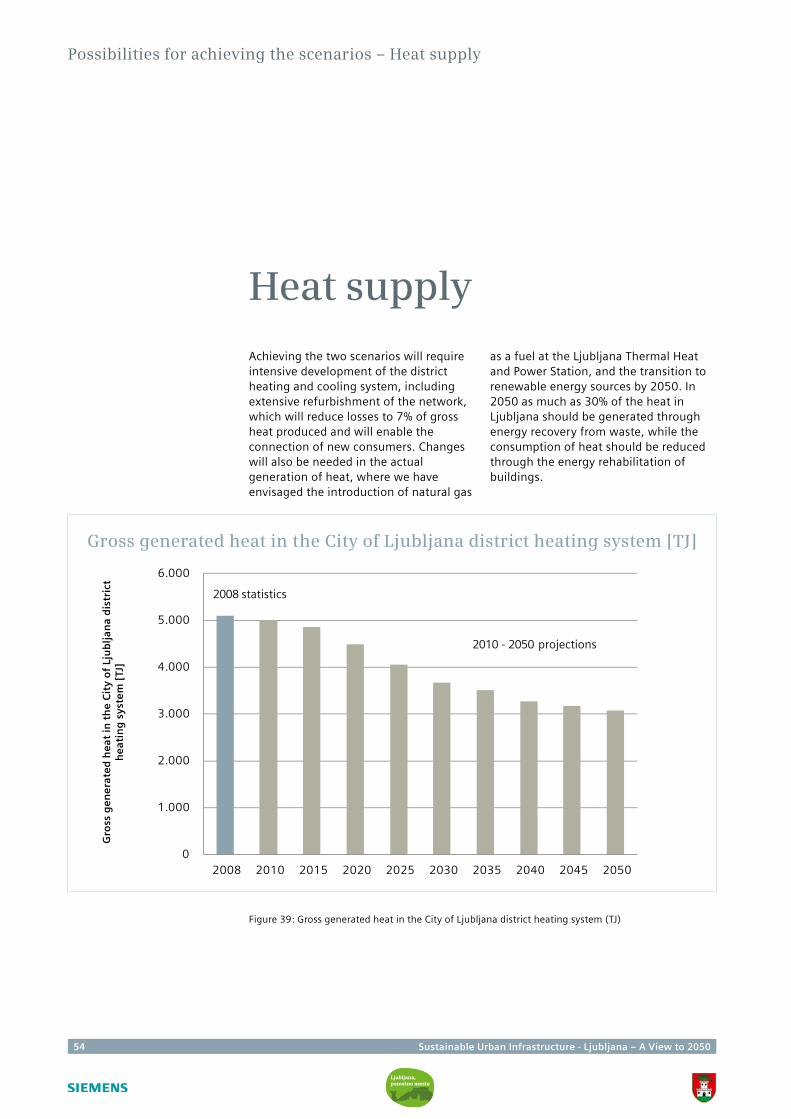
54 Sustainable Urban Infrastructure - Ljubljana – A View to 2050
Possibilities for achieving the scenarios – Heat supply
Achieving the two scenarios will require intensive development of the district heating and cooling system, including extensive refurbishment of the network, which will reduce losses to 7% of gross heat produced and will enable the connection of new consumers. Changes will also be needed in the actual generation of heat, where we have envisaged the introduction of natural gas
as a fuel at the Ljubljana Thermal Heat and Power Station, and the transition to renewable energy sources by 2050. In 2050 as much as 30% of the heat in Ljubljana should be generated through energy recovery from waste, while the consumption of heat should be reduced through the energy rehabilitation of buildings.
Heat supply
Figure 39: Gross generated heat in the City of Ljubljana district heating system (TJ)
Gross generated heat in the City of Ljubljana district heating system [TJ]
Gro
ss g
en
era
ted
he
at in
th
e C
ity
of
Lju
blj
ana
dis
tric
t h
eat
ing
sys
tem
[TJ
]
0
1.000
2.000
3.000
4.000
5.000
6.000
2008 2010 2015 2020 2025 2030 2035 2040 2045 2050
2008 statistics
2010 - 2050 projections
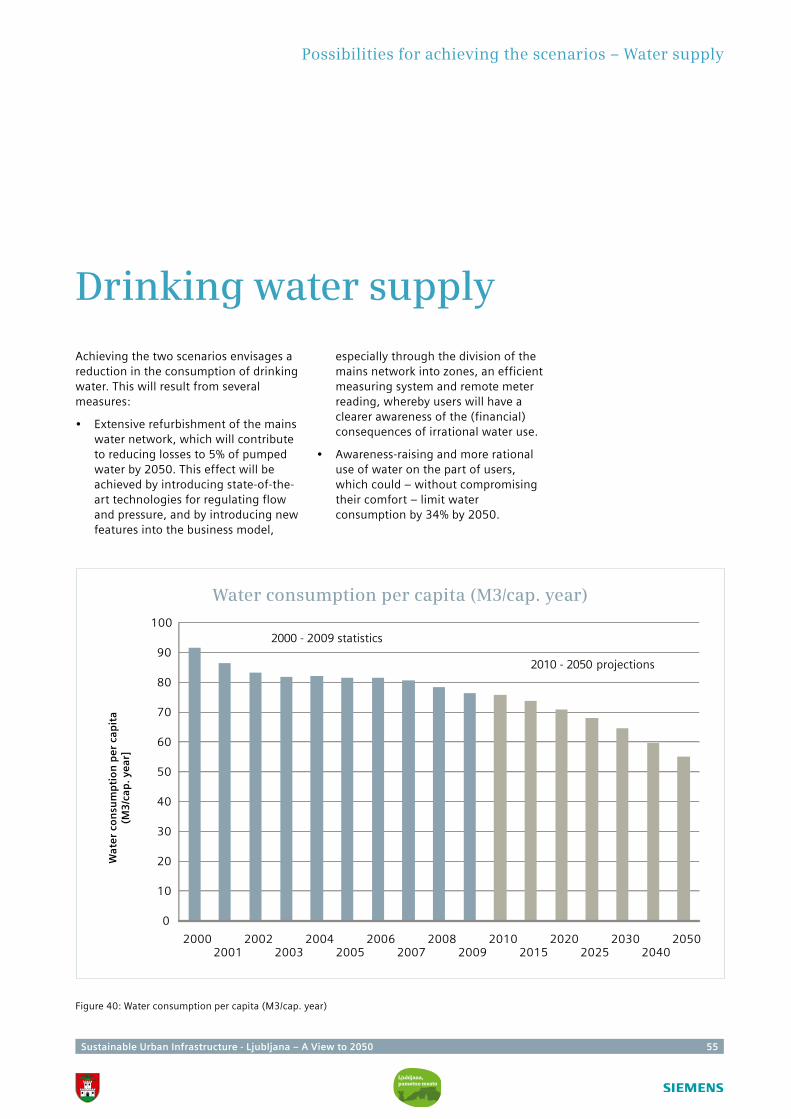
Sustainable Urban Infrastructure - Ljubljana – A View to 2050 55
Possibilities for achieving the scenarios – Water supply
Drinking water supply
Achieving the two scenarios envisages a reduction in the consumption of drinking water. This will result from several measures:
• Extensive refurbishment of the mains water network, which will contribute to reducing losses to 5% of pumped water by 2050. This effect will be achieved by introducing state-of-the-art technologies for regulating flow and pressure, and by introducing new features into the business model,
especially through the division of the mains network into zones, an efficient measuring system and remote meter reading, whereby users will have a clearer awareness of the (financial) consequences of irrational water use.
• Awareness-raising and more rational use of water on the part of users, which could – without compromising their comfort – limit water consumption by 34% by 2050.
Figure 40: Water consumption per capita (M3/cap. year)
Water consumption per capita (M3/cap. year)
Wat
er
con
sum
pti
on
pe
r ca
pit
a (M
3/c
ap. y
ear
]
0
10
20
30
40
50
60
70
80
90
100
20002001
20022003
20042005
20062007
20082009
20102015
20202025
20302040
2050
2000 - 2009 statistics
2010 - 2050 projections
56 Sustainable Urban Infrastructure - Ljubljana – A View to 2050
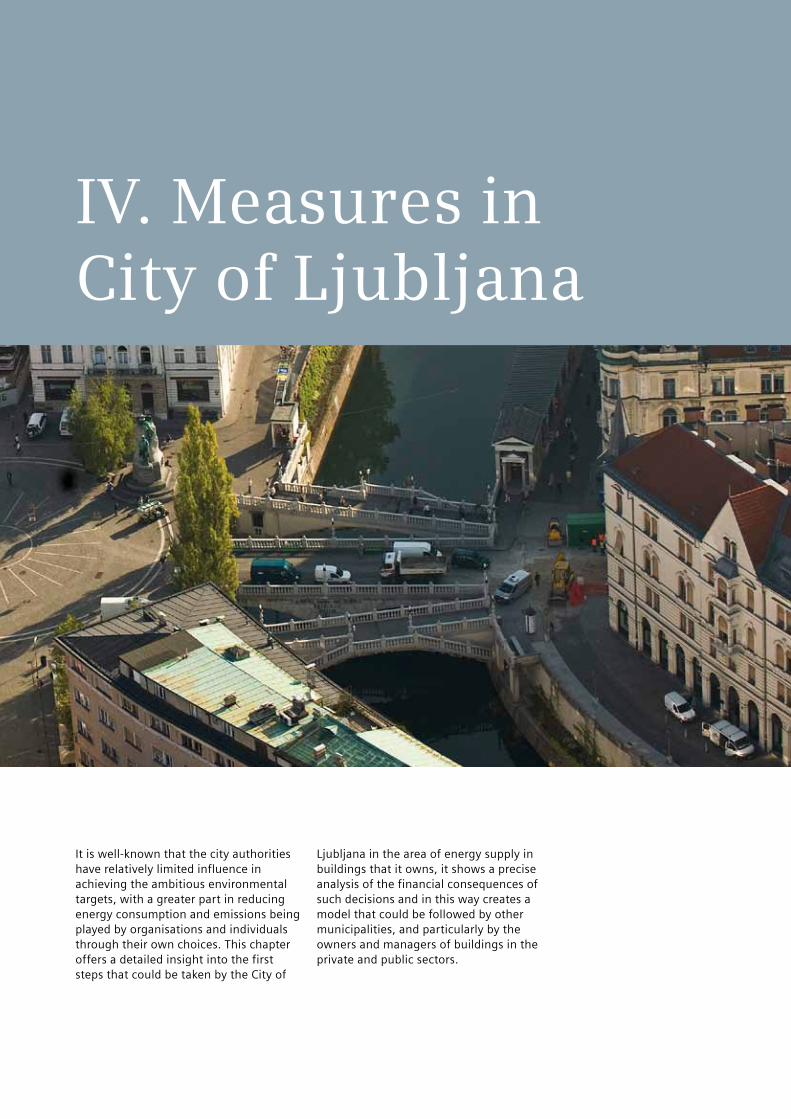
Sustainable Urban Infrastructure - Ljubljana – A View to 2050 57
IV. Measures in City of Ljubljana
It is well-known that the city authorities have relatively limited influence in achieving the ambitious environmental targets, with a greater part in reducing energy consumption and emissions being played by organisations and individuals through their own choices. This chapter offers a detailed insight into the first steps that could be taken by the City of
Ljubljana in the area of energy supply in buildings that it owns, it shows a precise analysis of the financial consequences of such decisions and in this way creates a model that could be followed by other municipalities, and particularly by the owners and managers of buildings in the private and public sectors.
58 Sustainable Urban Infrastructure - Ljubljana – A View to 2050
Efficient energy management in City of
Ljubljana – barriers, opportunities and measures
There are several barriers along the path to efficient energy management. The technological possibilities are not being entirely exploited, and energy is identified as a cost over which we have very little influence. The system of incentives to pursue rational energy use is in preparation, as well as formal objectives of careful energy use.
Opportunities for efficient energy management:
• The transition to a low-carbon society has seen the establishing of markets for green products, services and solutions that have been immune this far to the economic crisis.
• Services in the area of green technology and efficient energy management can be an additional product/service offered in the market by public companies in City of Ljubljana. This will serve to bolster customer loyalty and create additional sources of income.
• By investing in energy efficiency (Energy Management System in City of Ljubljana buildings) it will be possible very quickly to achieve major savings: EUR 708,000 on an annual basis, with investment in the necessary equipment amounting to EUR 4.15 million and the return period being 5.5 years.
Measures for achievement of the effects:
• Organisational measures (model of systematic energy management, introduction of the business position of energy manager).
• Investment measures (hardware and software for implementing systematic energy management in buildings owned by City of Ljubljana, energy renovation of buildings, replacing energy sources).
• Human resources measures (adjusting the pay scale policy based on performance and achievement of targets, a clear system of incentives for efficiency, awareness-raising among all employees).
• Including procurement in the energy management system.
Measures in City of Ljubljana
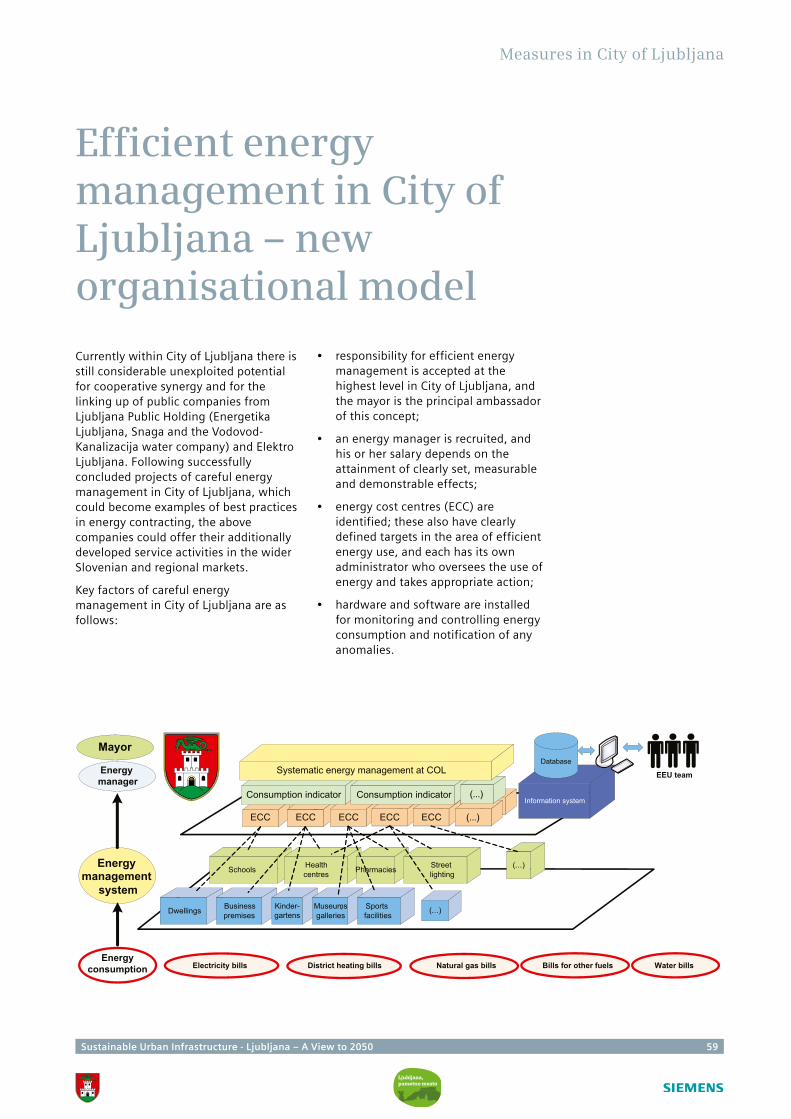
Sustainable Urban Infrastructure - Ljubljana – A View to 2050 59
Measures in City of Ljubljana
Efficient energy management in City of Ljubljana – new organisational model
Currently within City of Ljubljana there is still considerable unexploited potential for cooperative synergy and for the linking up of public companies from Ljubljana Public Holding (Energetika Ljubljana, Snaga and the Vodovod-Kanalizacija water company) and Elektro Ljubljana. Following successfully concluded projects of careful energy management in City of Ljubljana, which could become examples of best practices in energy contracting, the above companies could offer their additionally developed service activities in the wider Slovenian and regional markets.
Key factors of careful energy management in City of Ljubljana are as follows:
• responsibility for efficient energy management is accepted at the highest level in City of Ljubljana, and the mayor is the principal ambassador of this concept;
• an energy manager is recruited, and his or her salary depends on the attainment of clearly set, measurable and demonstrable effects;
• energy cost centres (ECC) are identified; these also have clearly defined targets in the area of efficient energy use, and each has its own administrator who oversees the use of energy and takes appropriate action;
• hardware and software are installed for monitoring and controlling energy consumption and notification of any anomalies.
ETCECC
ETCECC
ETCECC
Dwellings
Energy manager
Mayor
Energy management
system
Electricity bills District heating bills Natural gas bills Water bills
Schools Health centres Pharmacies Street
lighting
Business premises
Kinder-gartens
Museums, galleries
Sports facilities
(...)
Energyconsumption
Consumption indicatorETC
ECCETC
ECCETC
(...)
Consumption indicator (...)
Systematic energy management at COL
Information system
(...)
Database
EEU team
Bills for other fuels
60 Sustainable Urban Infrastructure - Ljubljana – A View to 2050
As part of the study we estimated that the process of setting up the energy management system in City of Ljubljana would take four years and be implemented in several phases:
• establishing an organisational structure for systematic energy management in all buildings owned by City of Ljubljana;
• establishing the proposed energy cost centres and determining the indicators for measuring efficiency;
• setting up an information system for energy management in buildings owned by City of Ljubljana;
• implementation and monitoring of effects, possible correction of set targets;
• training and motivation of all City of Ljubljana employees;
• communication with stakeholders and evaluation of progress.
The costs of these activities, which are associated with establishing an energy management system in all buildings owned by City of Ljubljana, have been estimated at EUR 4.15 million. This amount includes the following types of cost:
• the information system for energy management;
• additional measuring equipment;
• system deployment;
• implementing and monitoring soft measures (e.g. correct use of thermostat valves, introducing the concept of ecological responsibility, motivational and training activities for employees etc.);
• communication with the public;
• approximately 60% of the above costs represent the cost of new hardware and software.
Measures in City of Ljubljana

Sustainable Urban Infrastructure - Ljubljana – A View to 2050 61
62 Sustainable Urban Infrastructure - Ljubljana – A View to 2050
Sustainable Urban Infrastructure - Ljubljana – A View to 2050 63