Embed Size (px)
Citation preview
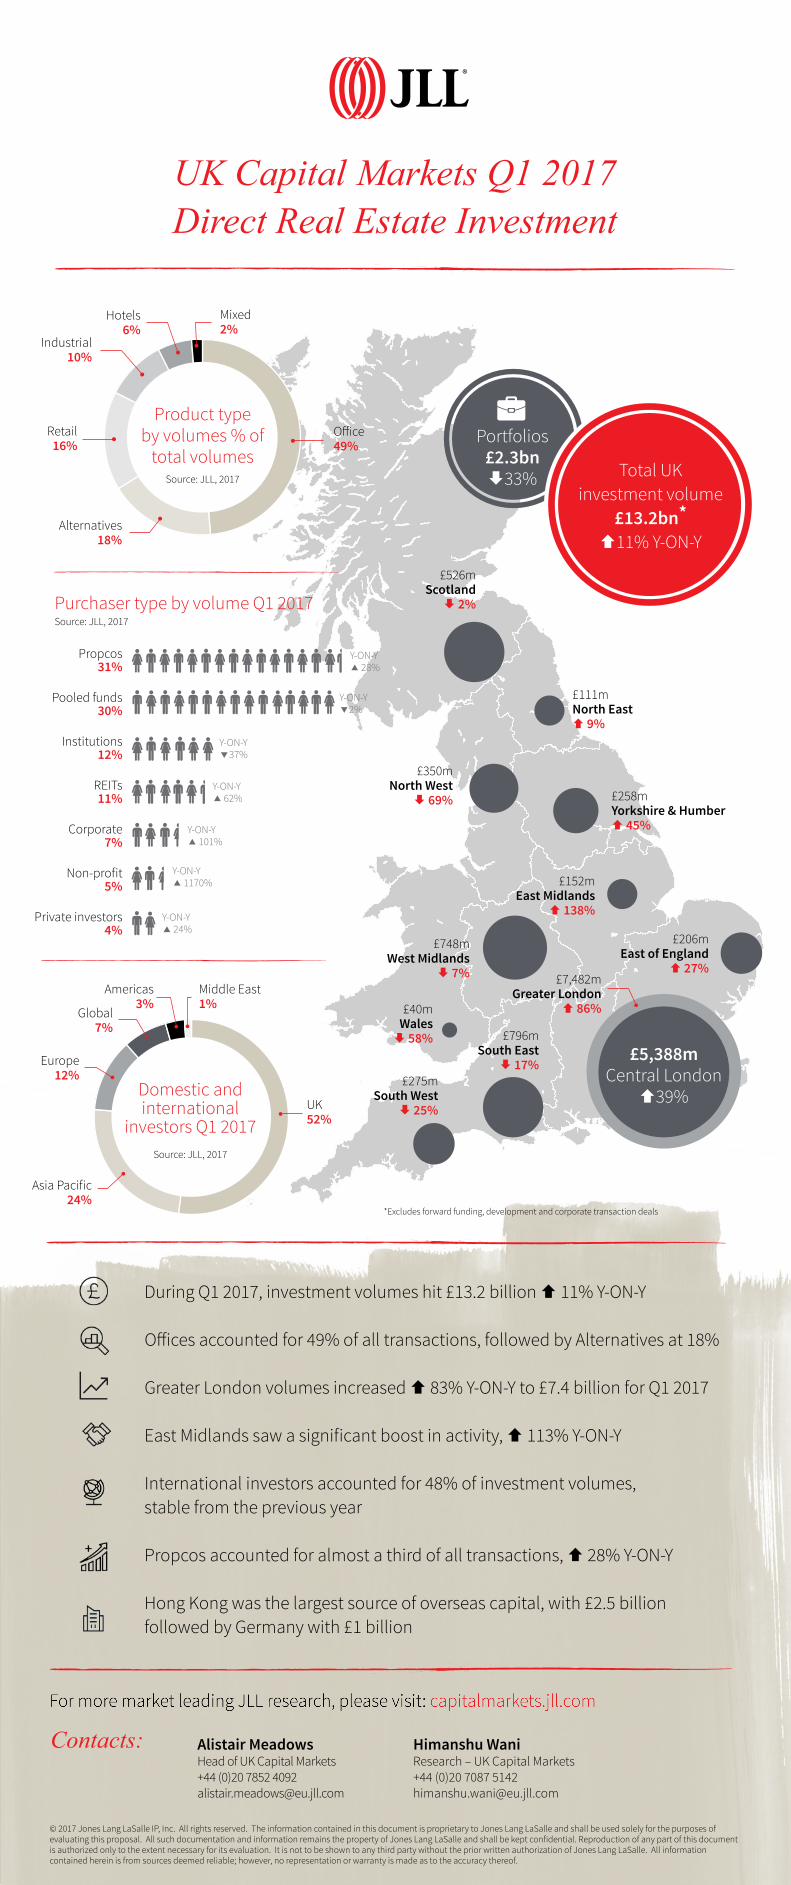
Propcos31%
Pooled funds30%
Institutions12%
REITs11%
Corporate7%
Non-profit5%
Private investors4%
Purchaser type by volume Q1 2017Source: JLL, 2017
£7,482mGreater London
86%
£206mEast of England
27%
£796mSouth East
È 17%£275m
South WestÈ 25%
£40m WalesÈ 58%
£748mWest Midlands
È 7%
£152mEast Midlands
138%
£258mYorkshire & Humber 45%
£350mNorth West
È 69%
£526mScotlandÈ 2%
£111mNorth East 9%
Y-ON-Y 28%
Y-ON-Y 62%
Y-ON-Y 37%
Y-ON-Y 2%
Y-ON-Y 1170%
Y-ON-Y 101%
£5,388mCentral London
39%
*Excludes forward funding, development and corporate transaction deals
UK Capital Markets Q1 2017Direct Real Estate Investment
Europe12%
Middle East1%
UK52%
Domestic and international
investors Q1 2017Source: JLL, 2017
Americas3%
Global7%
Portfolios£2.3bn È33% Total UK
investment volume £13.2bn*
11% Y-ON-Y
Alistair MeadowsHead of UK Capital Markets+44 (0)20 7852 [email protected]
Himanshu WaniResearch – UK Capital Markets+44 (0)20 7087 [email protected]
Contacts:
© 2017 Jones Lang LaSalle IP, Inc. All rights reserved. The information contained in this document is proprietary to Jones Lang LaSalle and shall be used solely for the purposes of evaluating this proposal. All such documentation and information remains the property of Jones Lang LaSalle and shall be kept confidential. Reproduction of any part of this document is authorized only to the extent necessary for its evaluation. It is not to be shown to any third party without the prior written authorization of Jones Lang LaSalle. All information contained herein is from sources deemed reliable; however, no representation or warranty is made as to the accuracy thereof.
During Q1 2017, investment volumes hit £13.2 billion 11% Y-ON-Y
Offices accounted for 49% of all transactions, followed by Alternatives at 18%
Greater London volumes increased 83% Y-ON-Y to £7.4 billion for Q1 2017
East Midlands saw a significant boost in activity, 113% Y-ON-Y
International investors accounted for 48% of investment volumes, stable from the previous year
Propcos accounted for almost a third of all transactions, 28% Y-ON-Y
Hong Kong was the largest source of overseas capital, with £2.5 billion followed by Germany with £1 billion
Office49%
Y-ON-Y 24%
Product type by volumes % of
total volumesSource: JLL, 2017
Retail16%
Alternatives18%
Industrial10%
Mixed2%
Asia Pacific24%
Hotels6%