Embed Size (px)
Citation preview
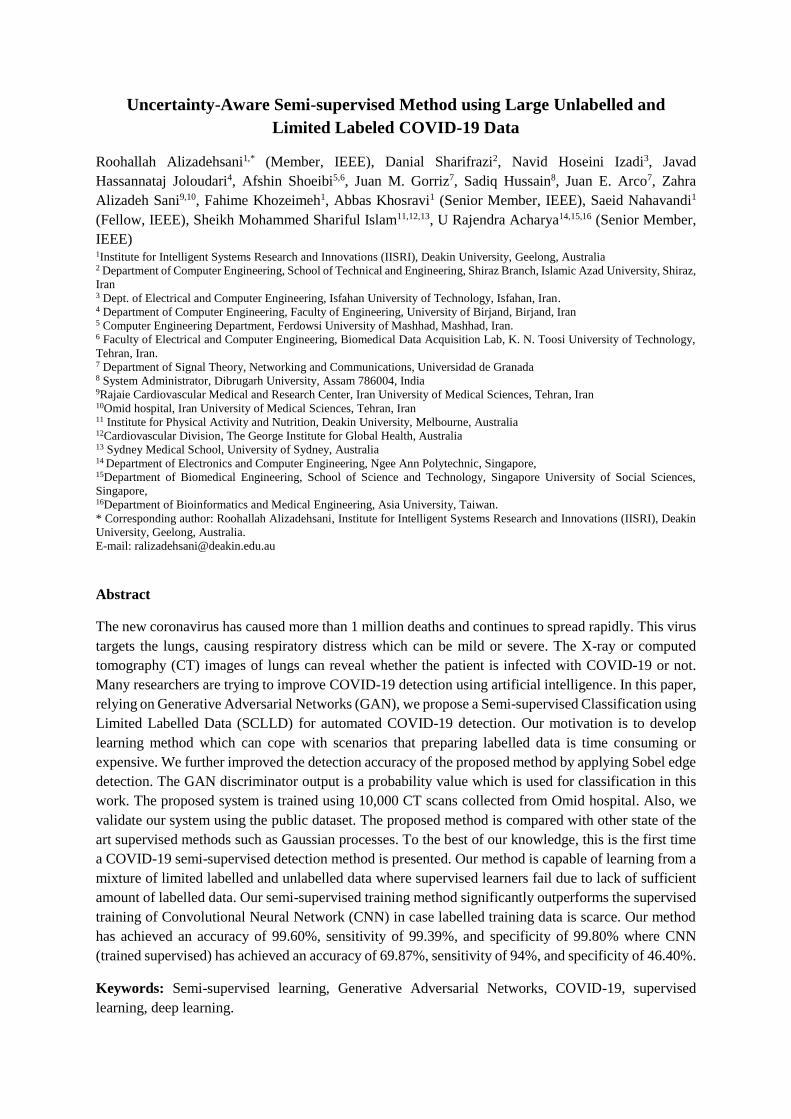
Uncertainty-Aware Semi-supervised Method using Large Unlabelled and
Limited Labeled COVID-19 Data
Roohallah Alizadehsani1,* (Member, IEEE), Danial Sharifrazi2, Navid Hoseini Izadi3, Javad
Hassannataj Joloudari4, Afshin Shoeibi5,6, Juan M. Gorriz7, Sadiq Hussain8, Juan E. Arco7, Zahra
Alizadeh Sani9,10, Fahime Khozeimeh1, Abbas Khosravi1 (Senior Member, IEEE), Saeid Nahavandi1
(Fellow, IEEE), Sheikh Mohammed Shariful Islam11,12,13, U Rajendra Acharya14,15,16 (Senior Member,
IEEE) 1Institute for Intelligent Systems Research and Innovations (IISRI), Deakin University, Geelong, Australia 2 Department of Computer Engineering, School of Technical and Engineering, Shiraz Branch, Islamic Azad University, Shiraz,
Iran 3 Dept. of Electrical and Computer Engineering, Isfahan University of Technology, Isfahan, Iran. 4 Department of Computer Engineering, Faculty of Engineering, University of Birjand, Birjand, Iran 5 Computer Engineering Department, Ferdowsi University of Mashhad, Mashhad, Iran. 6 Faculty of Electrical and Computer Engineering, Biomedical Data Acquisition Lab, K. N. Toosi University of Technology,
Tehran, Iran. 7 Department of Signal Theory, Networking and Communications, Universidad de Granada 8 System Administrator, Dibrugarh University, Assam 786004, India 9Rajaie Cardiovascular Medical and Research Center, Iran University of Medical Sciences, Tehran, Iran 10Omid hospital, Iran University of Medical Sciences, Tehran, Iran 11 Institute for Physical Activity and Nutrition, Deakin University, Melbourne, Australia 12Cardiovascular Division, The George Institute for Global Health, Australia 13 Sydney Medical School, University of Sydney, Australia 14 Department of Electronics and Computer Engineering, Ngee Ann Polytechnic, Singapore, 15Department of Biomedical Engineering, School of Science and Technology, Singapore University of Social Sciences,
Singapore, 16Department of Bioinformatics and Medical Engineering, Asia University, Taiwan.
* Corresponding author: Roohallah Alizadehsani, Institute for Intelligent Systems Research and Innovations (IISRI), Deakin
University, Geelong, Australia.
E-mail: [email protected]
Abstract
The new coronavirus has caused more than 1 million deaths and continues to spread rapidly. This virus
targets the lungs, causing respiratory distress which can be mild or severe. The X-ray or computed
tomography (CT) images of lungs can reveal whether the patient is infected with COVID-19 or not.
Many researchers are trying to improve COVID-19 detection using artificial intelligence. In this paper,
relying on Generative Adversarial Networks (GAN), we propose a Semi-supervised Classification using
Limited Labelled Data (SCLLD) for automated COVID-19 detection. Our motivation is to develop
learning method which can cope with scenarios that preparing labelled data is time consuming or
expensive. We further improved the detection accuracy of the proposed method by applying Sobel edge
detection. The GAN discriminator output is a probability value which is used for classification in this
work. The proposed system is trained using 10,000 CT scans collected from Omid hospital. Also, we
validate our system using the public dataset. The proposed method is compared with other state of the
art supervised methods such as Gaussian processes. To the best of our knowledge, this is the first time
a COVID-19 semi-supervised detection method is presented. Our method is capable of learning from a
mixture of limited labelled and unlabelled data where supervised learners fail due to lack of sufficient
amount of labelled data. Our semi-supervised training method significantly outperforms the supervised
training of Convolutional Neural Network (CNN) in case labelled training data is scarce. Our method
has achieved an accuracy of 99.60%, sensitivity of 99.39%, and specificity of 99.80% where CNN
(trained supervised) has achieved an accuracy of 69.87%, sensitivity of 94%, and specificity of 46.40%.
Keywords: Semi-supervised learning, Generative Adversarial Networks, COVID-19, supervised
learning, deep learning.
1 Introduction Since the beginning of 2020, the coronavirus disease 2019 (COVID-19) has been spreading all over the
globe as it is contagious in an unprecedented manner [1]. In severe cases, it may lead to multiple organ
failure, acute respiratory distress, heart problems, secondary infections in a comparatively high fraction
of patients, and thus may cause deaths [2, 3]. On January 30th, 2020, The World Health Organization
(WHO), announced the outbreak as a “public health emergency of international concern” (PHEIC). The
epicentre of the outbreak was the Huanan Seafood Wholesale Market in Wuhan City, Hubei Province,
China, and on March 11th, 2020, the WHO declared the COVID-19 a pandemic. Early detection and
initiation of treatment in severe cases are vital to deal with the disease and thus mitigating mortality [4].
Reverse-transcription polymerase chain reaction (RT-PCR) is generally utilized to confirm COVID-19.
The sensitivity and specificity of RT-PCR were not recorded as robust enough for the treatment of the
presumptive patients and early detection [5, 6]. A non-invasive imaging technique called computed
tomography (CT) scans can play a crucial role in identifying some characteristic symptoms in the lung
related to COVID-19 [7, 8]. A study using chest CT scans achieved 97% sensitivity (580/601 patients,
95% CI, 95-98%) for COVID-19 detection [6]. Hence, chest CT scans may be effectively utilized in
diagnosis and early detection of the disease. Since COVID-19 causes pulmonary changes, chest CT
scans may exhibit imaging features analogous to other types of pneumonia, leading to confusion during
COVID-19 detection. Hence, despite the advantages of CT, it is challenging to discriminate COVID-
19 from other types of pneumonia.
Accessibility to huge datasets facilitates deep learning tools and applications to process large amount
of unstructured information, allowing high level abstractions with enhanced generalisability and
permitting key feature extractions [9]. In the domain of medical imaging, deep learning has shown
outstanding performance in automatic feature extraction [10-12]. Due to the noteworthy performance
that deep learning methods achieved especially in image processing tasks, it is remarkably useful as
feature learners or automatic regressors in addition to classification tasks [9]. Deep learning is utilized
to differentiate and detect viral and bacterial pneumonia in pediatric chest CT scans [13]. Different
imaging features of chest CT can also be detected using deep learning [14, 15]. Chest CT scans of the
positive COVID-19 patients have a discrete radiographic pattern: multifocal patchy consolidation,
ground-glass opacities, and/or interstitial changes with a predominantly peripheral distribution [6, 7].
Chest CT scans with the help of deep learning methods have illustrated their efficacy in distinguishing
COVID-19 from other types of viral pneumonia and thus becomes a useful diagnostic tool. This, in
turn, leads to controlling and managing the pandemic situation [16].
Chest X-ray and CT scans have the potential to detect COVID-19 and isolate the patients in time. As
most hospitals are equipped with X-ray, it is the first choice of the radiologists. However, chest X-ray
images cannot distinguish soft tissues accurately [17]. Chest CT scan can be utilized as an alternative
method. As the number of radiologists is scarce and also busy in pandemic situations, automatic
detection of COVID-19 from chest images is highly desirable. Utilizing deep learning, Li et al. [18]
designed a COVID-19 detection model called COVNet by extracting features from chest CT. Other
non-pneumonia and community-acquired pneumonia (CAP) CT exams are conducted to evaluate the
robustness of the model. Their model could discriminate CAP from other lung diseases, accurately.
Wang et al. [19] utilized the deep learning strategies to derive the graphical features from the CT images
of COVID-19 patients. In these images, there are radiographical changes in the case of infected patients.
Gozes et al. [20] proposed an automated approach using CT images for quantification, detection, and
monitoring of COVID-19 patients. They used robust 3D and 2D models based on deep learning
concepts and integrated them with clinical perceptive. They utilized a multi-centre international dataset
and generated a corona score using a 3D volume review from thoracic CT features. This score helped
the system to compute the evolution of ailment over time.
Several studies have applied new approaches to detect COVID-19 cases using machine learning and
deep learning approaches. Hemdan et al. [21] devised a deep learning-based framework dubbed as
COVIDX-Net to aid clinicians to detect COVID-19 from X-ray images. They partitioned the dataset
into 80% for training and 20% for testing. Zhang et al. [22] presented an anomaly detection deep
technique for reliable and efficient COVID-19 detection. Apostolopoulos et al. [23] analysed the X-ray
images of normal incidents, confirmed COVID-19 cases, and common bacterial pneumonia for
automated detection of COVID-19 patients. They applied a convolutional neural network (CNN) with
transfer learning. Their model derived biomarkers related to the COVID-19 illness. Butt et al. [24]
compared multiple CNN models and devised a deep learning model based on 3D and 2D networks to
classify no-infection, influenza viral pneumonia, and COVID-19 samples. Their model successfully
differentiated the non-coronavirus and coronavirus cases per thoracic CT records.
Other approaches include Song et al. [25] who devised a CT diagnosis system based on deep learning
technology and termed it as DeepPneumonia for the identification of COVID-19 patients. Main lesion
features, including ground-glass opacity (GGO) which are the key in the diagnosis, are located by their
model. Sethy et al. [26] proposed a deep learning technique based on X-ray radiographs analysis for
detection of COVID-19 patients. They implemented support vector machine classifier using the deep
features to discriminate COVID-19 X-ray images from others. Their technique could assist the
radiologists in the diagnosis of COVID-19 patients.
The test kits for COVID-19 are limited in hospitals owing to the exponential growth of the cases.
Therefore, it is crucial to search for a fast alternative to detect such cases in order to confine the spread.
Narin et al. [27] presented detection of COVID-19 patients based on Inception-ResNetV2, InceptionV3,
and ResNet50 utilizing chest X-ray images. Confusion matrices and ROC analyses are performed with
5-fold cross-validation. Shi et al. [28] established a deep learning oriented CT and clinical features
based prognosis model for assessing the severity of COVID-19 infection. They applied the least
absolute shrinkage and selection operator (LASSO), and developed the pneumonia severity index (PSI).
Severe patients had higher PSI (p<0.001), percentage of infection (POICT), and mass of infection
(MOICT) than non-severe ones. Their model proved its efficacy in the prediction of patients’ severity.
Pervasive demands have arisen to combat COVID-19 pandemic crisis by designing an automated and
efficient diagnosis system. Maghdid et al. [29] presented an accurate deep learning tool with fast
detection mechanism for COVID-19 cases. Various CT and X-ray images have been integrated to
provide a comprehensive and publicly available dataset. The detection technique consists of transfer
learning and deep learning. The network is trained using AlexNet and CNN models on the CT and X-
rays dataset. The overview of published researches on COVID-19 detection is presented in Table 1.
Table 1. Summary of works conducted on the detection of COVID-19 patients using deep learning (DL)
techniques.
Researches Modalities Number of Cases/images/datasets DL architecture
Li et al. [18] CT 4356 chest CT Resnet50
Wang et al. [19] CT 453 CT images CNN
Gozes et al. [20] CT 157 cases Resnet-50
Hemdan et al. [21] X-ray 50 Chest X-ray images Google MobileNet and
modified VGG19
Zhang et al. [22] X-ray X-VIRAL and XCOVID datasets Residual CNN

Apostolopoulos et al. [23] X-ray 1427 X-ray images CNN with Transfer
Learning
Butt et al. [24] CT 219 cases CNN
Song et al. [25] CT 275 cases Resnet50
Sethy et al. [26] X-ray 2 datasets SVM plus Resnet50
Narin et al. [27] X-ray 100 images Inception-ResNetV2,
InceptionV3 and ResNet50
Shi et al. [28] CT 196 cases VB-Net
Maghdid et al. [29] CT and
X-ray
170 X-ray images and 361 CT
images
AlexNet
Zhao et al. [30] CT 349 cases DenseNet-169
ResNet-50
Ko et al. [31] CT 3993 chest CT images ResNet-50
Jaiswal et al. [16] CT 2492 CT scans DenseNet201
Ardakani et al. [32] CT 1020 CT Xception
ResNet-101
Kumar et al. [33] CT 34,006 CT scan slices Capsule Network
Ni et al. [34] CT 14,435 participants with chest CT
images
3D U-Net
MVP-Net
Alom et al. [35] CT and
X-ray
420 CT
704 chest X-ray
RNN with transfer learning
Javaheri et al. [36] CT 89,145 CT Slices 3D CNN
Saeedi et al. [37] CT 349 cases DenseNet121, ResNet50
V1&V2, InceptionV3 and
MobileNet V1&V2
Zhang et al. [38] CT 640 images CNN
Wang et al. [39] CT 640 images Graph convolutional
network (GCN) and CNN
Deep neural networks have great representation power but, their performance heavily relies on
availability of labelled training data. In case the labelled data is limited, the deep networks won’t be
able to learn well. However, we can still train the deep networks well by exploiting unlabelled data. The
justification behind our hypothesis is the success of transfer learning [40]. In a nutshell, in transfer
learning a learner trained for a specific task 𝑡𝑖 is modified for another task 𝑡𝑗 which bears some similarity
to 𝑡𝑖. Although tasks 𝑡𝑖 and 𝑡𝑗 are not the same, the learner trained for 𝑡𝑖 can still benefit the similarity
between 𝑡𝑖 and 𝑡𝑗 which accelerates the learning of 𝑡𝑗. This is the motivation for our two-phase semi-
supervised approach. In the first phase, the discriminator is trained to detect valid CT scan images. In
the second phase, using the gained expertise from the first phase, the trained discriminator can learn
sick and healthy CT images faster. The learning boost is due to the fact that regardless of being COVID
or healthy, each training/test image is a valid CT scan which the discriminator has mastered using
unlabelled data.
Considering the above argument, one may be tempted to use non-deep learners in an attempt to reduce
the required amount of the training data. However, the major drawback of such learners is that they
treat the input samples as vectors. To feed images to such non-deep learners, we are forced to reshape
the images into vectors. The reshaping operation destroys the meaningful features that each pixel has
to offer relative to its neighbouring pixels. Hence, the application of deep learning based models seems
to be inevitable if the features present in image inputs are to be captured properly. Hence using semi-
supervised learning to train deep models with a mixture of unlabelled and limited labelled data is the
best solution.
The main contribution of our work is twofold. First, we collected a dataset of lung CT scan images
useful for training/evaluation of COVID-19 detection methods. Second, to the best of our knowledge,
we are the first group to propose the semi-supervised COVID-19 detection method based on generative
adversarial network (GAN) [41] to detect this disease. The proposed method has been improved using
Sobel edge detection. Despite being semi-supervised, our method is competitive to its supervised
counterparts. This feature is beneficial when labelled data is hard to get. Although we have focused on
COVID-19 detection, our method is not limited to any specific dataset. The rest of the paper is organized
as follows: Section 2 provides prerequisites, Section 3 describes our dataset, Section 4 elaborates the
proposed method, Section 5 presents the experimental results and Section 6 concludes the paper.
2 Prerequisites In this section, the required mathematical concept are briefly reviewed. First, GAN is reviewed since
our method is based on it. The Gaussian Process is also reviewed since it is used during our experiments.
2.1 Generative Adversarial Networks Originally proposed by GoodFellow, GAN is a generative model with massive applications. Compared
to its predecessors, GAN is capable of generating high-quality images which are vivid and sharp.
Basically, GAN is made of two neural networks, namely Generator (G) and Discriminator (D). The job
of the Generator is to produce high-quality images which are called fake samples. The Discriminator
must distinguish between the real and fake samples. The two networks compete against each other in a
minimax game. That is why we call them adversarial networks. The objective function based on which
the two networks are trained is given as [41]:
min𝐺
max𝐷
𝑉(𝐷, 𝐺) = 𝔼𝑥~𝑝𝑑𝑎𝑡𝑎(𝑥)[𝑙𝑜𝑔𝐷(𝑥)] + 𝔼𝑧~𝑝𝑧(𝑧) [log (1 − 𝐷(𝐺(𝑧)))], (1)
where 𝑝𝑑𝑎𝑡𝑎(𝑥) is the real data (available dataset) distribution, 𝑝𝑧(𝑧) is the Generator input noise
distribution, D(x) is the Discriminator output, z is the (Gaussian) noise vector and G(z) is the Generator
output. As can be seen, the Generator is trying to minimize the objective function in equation (1), while
Discriminator is trying to maximize it. To this end, the following gradients are calculated:
∇𝜃𝑑
1
𝑚∑ [𝑙𝑜𝑔𝐷(𝑥(𝑖)) + log (1 − 𝐷 (𝐺(𝑧(𝑖))))]
𝑚
𝑖=1
, (2)
∇𝜃𝑔
1
𝑚∑ [log (1 − 𝐷 (𝐺(𝑧(𝑖))))]
𝑚
𝑖=1
, (3)
where 𝜃𝑑 and 𝜃𝑔 are the Discriminator and Generator parameters, respectively [41]. The gradients are
computed over mini-batch of m samples.
2.2 Gaussian Process Gaussian Process (GP) is a non-parametric probabilistic model which can be used for regression or
classification. GP can be considered as an infinite-dimensional Gaussian distribution which is defined
on functions as follows [42]:
Definition: f is a Gaussian process if for any index set {𝑡(𝑖) ∈ ℝ𝐷 , 𝑖 = 1, … , 𝑛}, vector 𝑓(𝑡) =
[𝑓(𝑡(1)), … , 𝑓(𝑡(𝑛))]𝑇 has a multivariate Gaussian distribution of the form 𝑓(𝑡)~𝒩(𝑚(𝑡), 𝐾(𝑡, 𝑡)).
Each 𝑓(𝑡(𝑖)) is a random variable, 𝑚(𝑡) is the mean function and 𝐾(𝑡, 𝑡) is the covariance matrix of
the Gaussian distribution [42]. The mean function is initialized to constant zero (𝑚(𝑡) = 0). Each
element of 𝐾(𝑡, 𝑡) is the output of a positive definite kernel function 𝑘: ℝ𝐷 × ℝ𝐷 → ℝ which receives
𝑡(𝑖) and 𝑡(𝑗) as input. In this paper we use squared exponential kernel:
𝑘(𝑡(𝑖), 𝑡(𝑗)) = 𝜎𝑓2 exp {∑
−1
2𝑙𝑑2 (𝑡𝑑
(𝑖)− 𝑡𝑑
(𝑗))
2𝐷
𝑑=1
} + 𝜎𝑛2𝛿𝑖𝑗 , 𝛿𝑖𝑗 = {
1, 𝑖𝑓 𝑖 = 𝑗0, 𝑜. 𝑤
, (4)
where the kernel function hyper-parameters 𝜎𝑓, 𝜎𝑛, and 𝑙 are signal variance, noise variance, and length
scale, respectively. The hyper-parameters are learned based on the available training data.
2.2.1 GP classification
In this paper, we focus on binary classification of healthy and sick people. Hence, in this section,
classification using GP is briefly reviewed. Following the binary classification conventions, the two
class labels are denoted as{−1, +1}. The basic idea behind binary classification using GP is as follows.
A prior GP is placed over the latent function 𝑓(𝑥). Output of GP is squashed through a logistic function
𝜎(. ) to obtain prior 𝜋(𝑥) ≜ 𝑝(𝑦 = +1|𝑥) = 𝜎(𝑓(𝑥)). Here 𝑓(𝑥) values are not observable and we are
not interested in them either. We only care about input vector 𝑥 and desired class label 𝑦. The sole
purpose of 𝑓(𝑥) is to make the model formulation more convenient.
Assuming that the training inputs are aggregated as column vectors in matrix 𝑋, and their corresponding
labels are expressed as vector 𝑦, the GP inference is carried out in two steps:
1. For a test case 𝑥∗, the distribution of the latent variable (𝑓∗) is computed as [42]:
𝑝(𝑓∗|𝑋, 𝑦, 𝑥∗) = ∫ 𝑝(𝑓∗|𝑋, 𝑥∗, 𝑓)𝑝(𝑓|𝑋, 𝑦)𝑑𝑓, (5)
where,
𝑝(𝑓|𝑋, 𝑦) =𝑝(𝑦|𝑓)𝑝(𝑓|𝑋)
𝑝(𝑦|𝑋). (6)
2. Now 𝑝(𝑓∗|𝑋, 𝑦, 𝑥∗) is used to produce a probabilistic prediction as:
�̃�∗ ≜ 𝑝(𝑦∗ = +1|𝑋, 𝑦, 𝑥∗) = ∫ 𝜎(𝑓∗)𝑝(𝑓∗|𝑋, 𝑦, 𝑥∗)𝑑𝑓∗. (7)
3 Dataset description In this study, 10000 lung CT scan images were captured at Omid Hospital in Tehran. The images have
been collected from February 2020 to April 2020. The mean and standard deviation of the patients’ age
were 49.5±18.5 years old with 45% of the cases were male. Each image has been checked by three
radiologists to determine whether the case is COVID-19 or not. Ethical approval to conduct use these
data was obtained from the hospital. Typical normal and COVID-19 CT images used for this study is
shown in Figure 1.
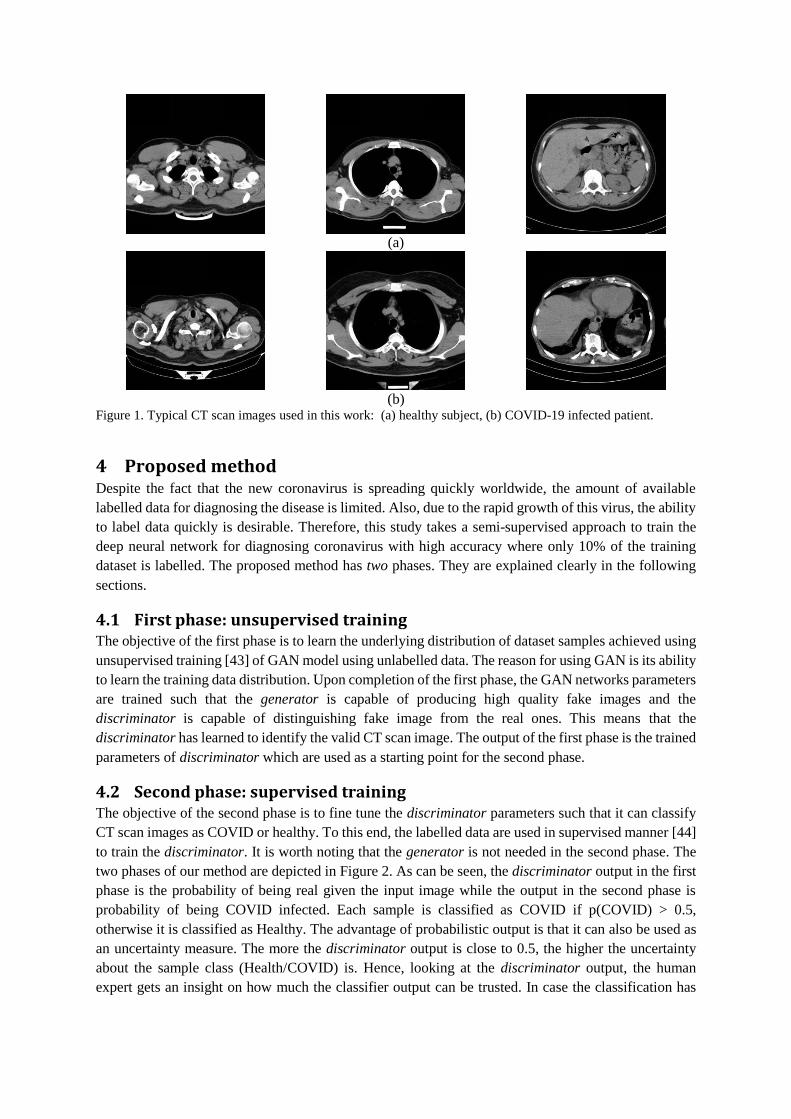
(a)
(b)
Figure 1. Typical CT scan images used in this work: (a) healthy subject, (b) COVID-19 infected patient.
4 Proposed method Despite the fact that the new coronavirus is spreading quickly worldwide, the amount of available
labelled data for diagnosing the disease is limited. Also, due to the rapid growth of this virus, the ability
to label data quickly is desirable. Therefore, this study takes a semi-supervised approach to train the
deep neural network for diagnosing coronavirus with high accuracy where only 10% of the training
dataset is labelled. The proposed method has two phases. They are explained clearly in the following
sections.
4.1 First phase: unsupervised training The objective of the first phase is to learn the underlying distribution of dataset samples achieved using
unsupervised training [43] of GAN model using unlabelled data. The reason for using GAN is its ability
to learn the training data distribution. Upon completion of the first phase, the GAN networks parameters
are trained such that the generator is capable of producing high quality fake images and the
discriminator is capable of distinguishing fake image from the real ones. This means that the
discriminator has learned to identify the valid CT scan image. The output of the first phase is the trained
parameters of discriminator which are used as a starting point for the second phase.
4.2 Second phase: supervised training The objective of the second phase is to fine tune the discriminator parameters such that it can classify
CT scan images as COVID or healthy. To this end, the labelled data are used in supervised manner [44]
to train the discriminator. It is worth noting that the generator is not needed in the second phase. The
two phases of our method are depicted in Figure 2. As can be seen, the discriminator output in the first
phase is the probability of being real given the input image while the output in the second phase is
probability of being COVID infected. Each sample is classified as COVID if p(COVID) > 0.5,
otherwise it is classified as Healthy. The advantage of probabilistic output is that it can also be used as
an uncertainty measure. The more the discriminator output is close to 0.5, the higher the uncertainty
about the sample class (Health/COVID) is. Hence, looking at the discriminator output, the human
expert gets an insight on how much the classifier output can be trusted. In case the classification has
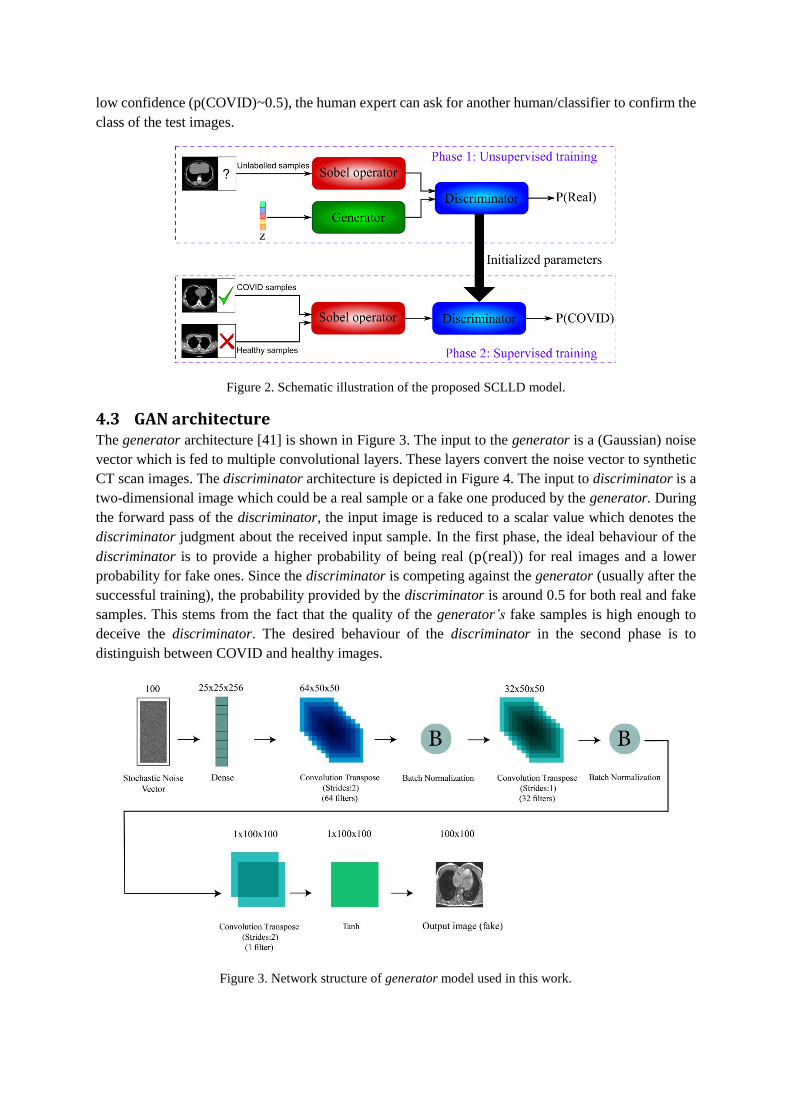
low confidence (p(COVID)~0.5), the human expert can ask for another human/classifier to confirm the
class of the test images.
Figure 2. Schematic illustration of the proposed SCLLD model.
4.3 GAN architecture The generator architecture [41] is shown in Figure 3. The input to the generator is a (Gaussian) noise
vector which is fed to multiple convolutional layers. These layers convert the noise vector to synthetic
CT scan images. The discriminator architecture is depicted in Figure 4. The input to discriminator is a
two-dimensional image which could be a real sample or a fake one produced by the generator. During
the forward pass of the discriminator, the input image is reduced to a scalar value which denotes the
discriminator judgment about the received input sample. In the first phase, the ideal behaviour of the
discriminator is to provide a higher probability of being real (p(real)) for real images and a lower
probability for fake ones. Since the discriminator is competing against the generator (usually after the
successful training), the probability provided by the discriminator is around 0.5 for both real and fake
samples. This stems from the fact that the quality of the generator’s fake samples is high enough to
deceive the discriminator. The desired behaviour of the discriminator in the second phase is to
distinguish between COVID and healthy images.
Figure 3. Network structure of generator model used in this work.
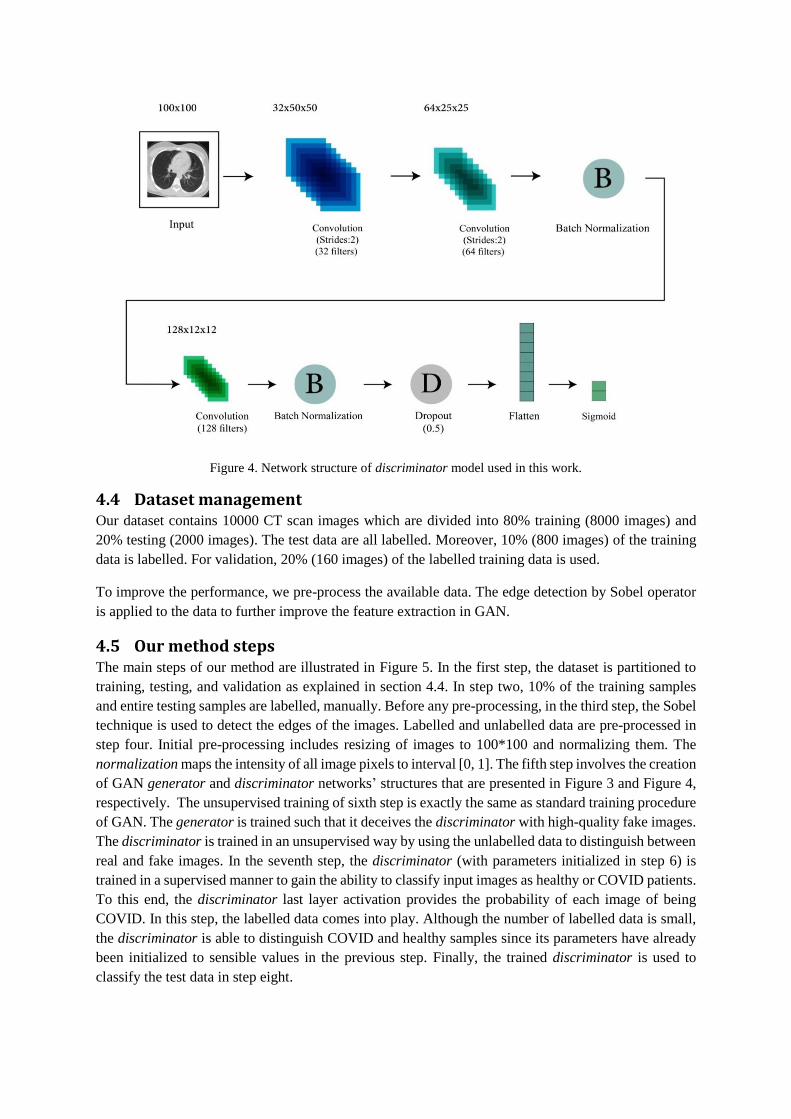
Figure 4. Network structure of discriminator model used in this work.
4.4 Dataset management Our dataset contains 10000 CT scan images which are divided into 80% training (8000 images) and
20% testing (2000 images). The test data are all labelled. Moreover, 10% (800 images) of the training
data is labelled. For validation, 20% (160 images) of the labelled training data is used.
To improve the performance, we pre-process the available data. The edge detection by Sobel operator
is applied to the data to further improve the feature extraction in GAN.
4.5 Our method steps The main steps of our method are illustrated in Figure 5. In the first step, the dataset is partitioned to
training, testing, and validation as explained in section 4.4. In step two, 10% of the training samples
and entire testing samples are labelled, manually. Before any pre-processing, in the third step, the Sobel
technique is used to detect the edges of the images. Labelled and unlabelled data are pre-processed in
step four. Initial pre-processing includes resizing of images to 100*100 and normalizing them. The
normalization maps the intensity of all image pixels to interval [0, 1]. The fifth step involves the creation
of GAN generator and discriminator networks’ structures that are presented in Figure 3 and Figure 4,
respectively. The unsupervised training of sixth step is exactly the same as standard training procedure
of GAN. The generator is trained such that it deceives the discriminator with high-quality fake images.
The discriminator is trained in an unsupervised way by using the unlabelled data to distinguish between
real and fake images. In the seventh step, the discriminator (with parameters initialized in step 6) is
trained in a supervised manner to gain the ability to classify input images as healthy or COVID patients.
To this end, the discriminator last layer activation provides the probability of each image of being
COVID. In this step, the labelled data comes into play. Although the number of labelled data is small,
the discriminator is able to distinguish COVID and healthy samples since its parameters have already
been initialized to sensible values in the previous step. Finally, the trained discriminator is used to
classify the test data in step eight.
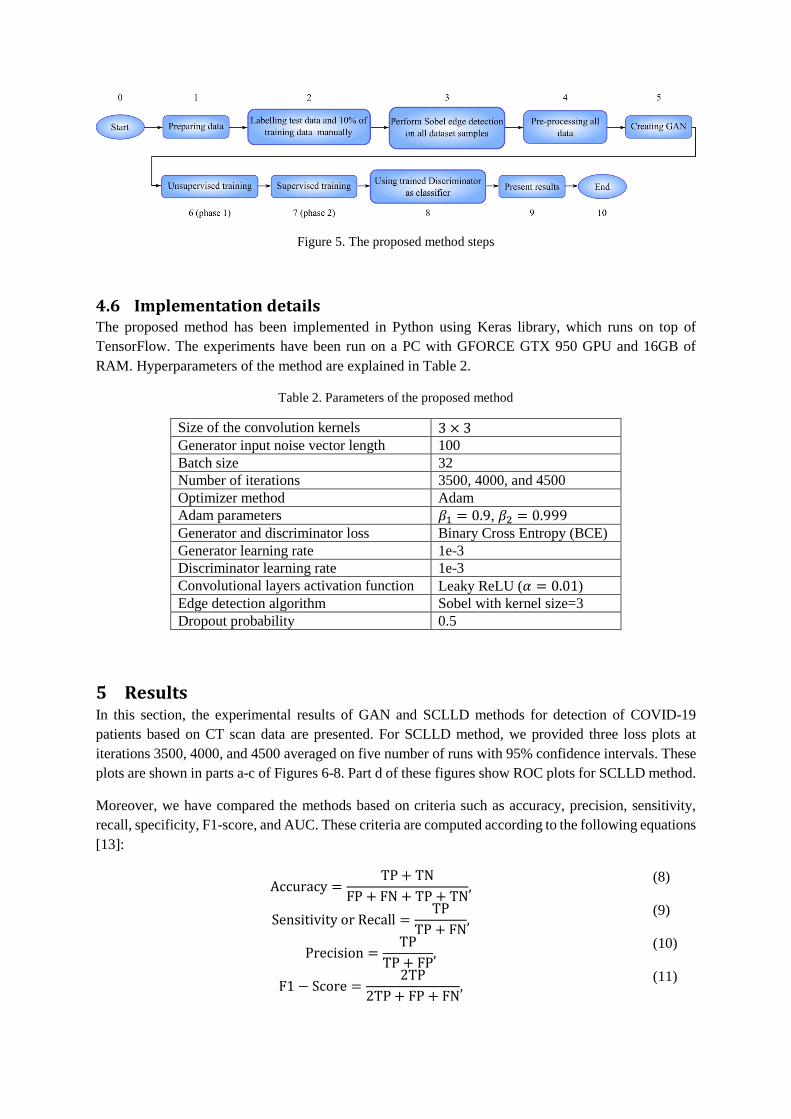
Figure 5. The proposed method steps
4.6 Implementation details The proposed method has been implemented in Python using Keras library, which runs on top of
TensorFlow. The experiments have been run on a PC with GFORCE GTX 950 GPU and 16GB of
RAM. Hyperparameters of the method are explained in Table 2.
Table 2. Parameters of the proposed method
Size of the convolution kernels 3 × 3
Generator input noise vector length 100
Batch size 32
Number of iterations 3500, 4000, and 4500
Optimizer method Adam
Adam parameters 𝛽1 = 0.9, 𝛽2 = 0.999
Generator and discriminator loss Binary Cross Entropy (BCE)
Generator learning rate 1e-3
Discriminator learning rate 1e-3
Convolutional layers activation function Leaky ReLU (𝛼 = 0.01)
Edge detection algorithm Sobel with kernel size=3
Dropout probability 0.5
5 Results In this section, the experimental results of GAN and SCLLD methods for detection of COVID-19
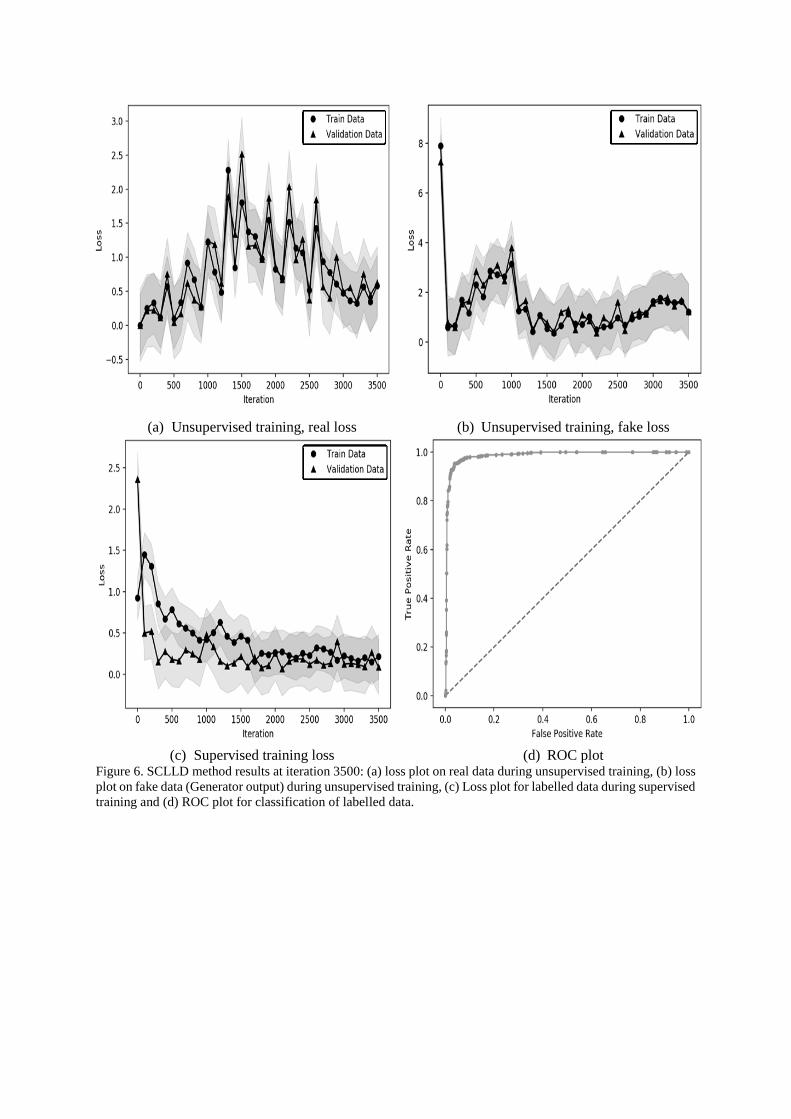
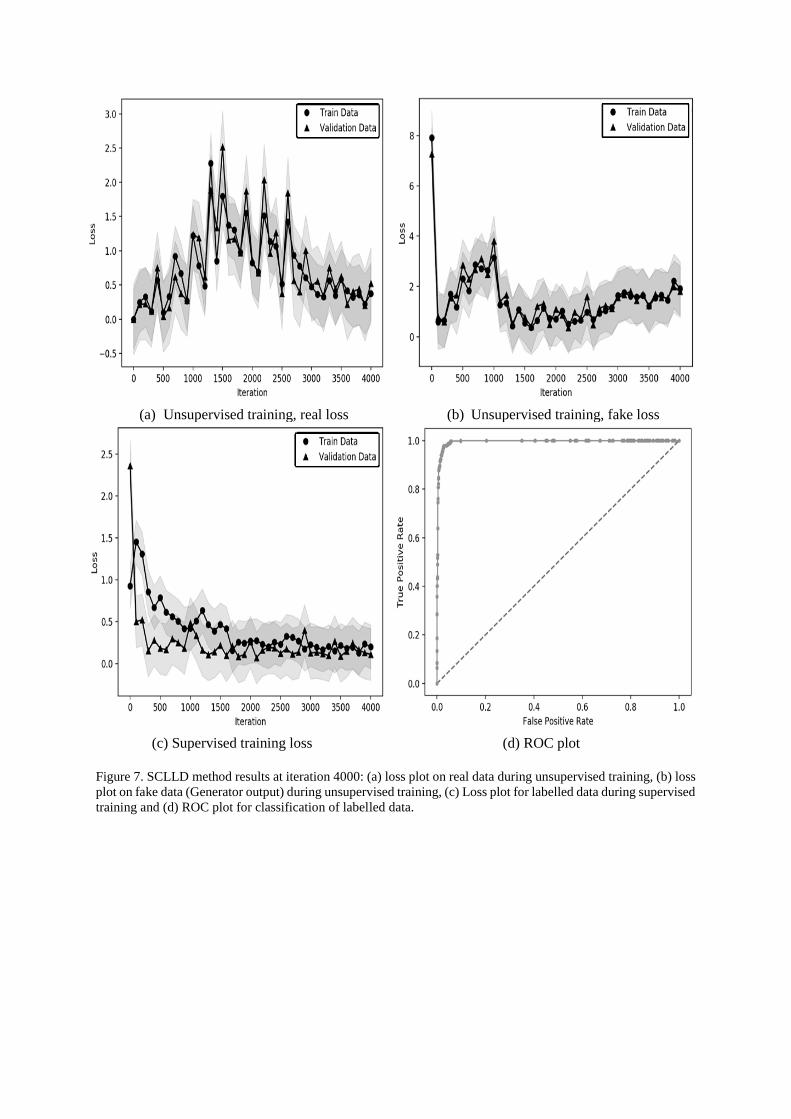
patients based on CT scan data are presented. For SCLLD method, we provided three loss plots at
iterations 3500, 4000, and 4500 averaged on five number of runs with 95% confidence intervals. These
plots are shown in parts a-c of Figures 6-8. Part d of these figures show ROC plots for SCLLD method.
Moreover, we have compared the methods based on criteria such as accuracy, precision, sensitivity,
recall, specificity, F1-score, and AUC. These criteria are computed according to the following equations
[13]:
Accuracy =TP + TN
FP + FN + TP + TN,
(8)
Sensitivity or Recall =TP
TP + FN,
(9)
Precision =TP
TP + FP,
(10)
F1 − Score =2TP
2TP + FP + FN,
(11)

Specificity =TN
TN + FP.
(12)
The experimental results for SCLLD method are presented in section 5.1. We have also summarised
the results in Table 3.
5.1 SCLLD results on our dataset The results of experiments at iterations 3500, 4000, and 4500 of SCLLD method are presented in
Figures 6-8. The proposed method has two training phases: unsupervised and supervised. The loss plots
in parts a and b of Figure 6 belong to the unsupervised training phase while the loss plot in part c is
related to supervised training. Part d of the figure illustrates the ROC plot of trained SCLLD. The
structure of plots in figures 7 and 8 are similar to the one explained in Figure 6. The only difference is
the iterations (4000 and 4500) at which the plots are presented. The motivation behind plotting the
results at multiple points during training is the investigation to the increasing number of iterations. This
investigation is important since at some point during the training, the performance of SCLLD may
degrade. Therefore, it is common practice to diagnose the SCLLD performance and stop the training
when the performance of the model does not improve any more.
It can be noted that, parts a and b of Figures 6-8 reveal that using Sobel operator has accelerated the
training pace. Therefore, the best performance is achieved at iteration 3500. Beyond that iteration, the
model has started to degrade quickly, leading to considerable loss value at iteration 4500 (part b of
figure 8).
The ROC plots at different iterations of SCLLD method match the accuracy results reported in Table
3. Considering that the best performance is achieved at iteration 3500, it makes sense that ROC plots at
this iteration reach value of 1.0 faster compared to their counterparts at iterations 4000 and 4500. For
SCLLD, the accuracy decreases at iteration 4000 but increases slightly at iteration 4500. That is why
ROC at iteration 4500 increases faster as compared to ROC at iteration 4000. An example of the CT
images, result of applying Soble filter on them and the final results of GRAD-CAM are shown in Figure
9. Grad-CAM is a generalization of the Class Activation Mapping. It does not needs re-training and can
be applied broadly to any CNN-based architectures [45].
5.1.1 Sensitivity analysis regarding labelled training data size
Based on the existing literature, GAN is good at capturing the underlying distribution of the training
dataset [42]. However, the limited number of available labelled data might hurt the classification
performance. This is the motivation for our semi-supervised approach SCLLD. In this section, we
evaluated the performance of our method for different number of labelled data. This experiment reveals
how much our semi-supervised approach can tolerate limited labelled data. The results for increasing
sample size of training labelled data (1% to 10%) are presented in Table 4. It is clear that even in a
semi-supervised setting, the amount of labelled data cannot be less than a certain threshold, otherwise
the performance drops dramatically. This scenario is observed if the labelled data falls less than 3%.
For labelled data size above 6%, the performance metrics are similar and the best results are achieved
when 8% of the data are labelled. Theoretically, increasing the training data should lead to better
performance. However, it is customary to train deep neural networks using mini-batch sizes smaller
than the whole dataset. The benefit of mini-batch training is twofold [46]. First, smaller batch size
reduces the memory demand for one step of training. Second, smaller batch size results in noisy
gradients which has regularization effect preventing over-fitting. The noisy gradients lead to
stochasticity during the learning process which is why the accuracy values in Table 4 do not necessarily
increase with larger labelled data size.
(a) Unsupervised training, real loss (b) Unsupervised training, fake loss
(c) Supervised training loss (d) ROC plot
Figure 6. SCLLD method results at iteration 3500: (a) loss plot on real data during unsupervised training, (b) loss
plot on fake data (Generator output) during unsupervised training, (c) Loss plot for labelled data during supervised
training and (d) ROC plot for classification of labelled data.
(a) Unsupervised training, real loss (b) Unsupervised training, fake loss
(c) Supervised training loss (d) ROC plot
Figure 7. SCLLD method results at iteration 4000: (a) loss plot on real data during unsupervised training, (b) loss
plot on fake data (Generator output) during unsupervised training, (c) Loss plot for labelled data during supervised
training and (d) ROC plot for classification of labelled data.
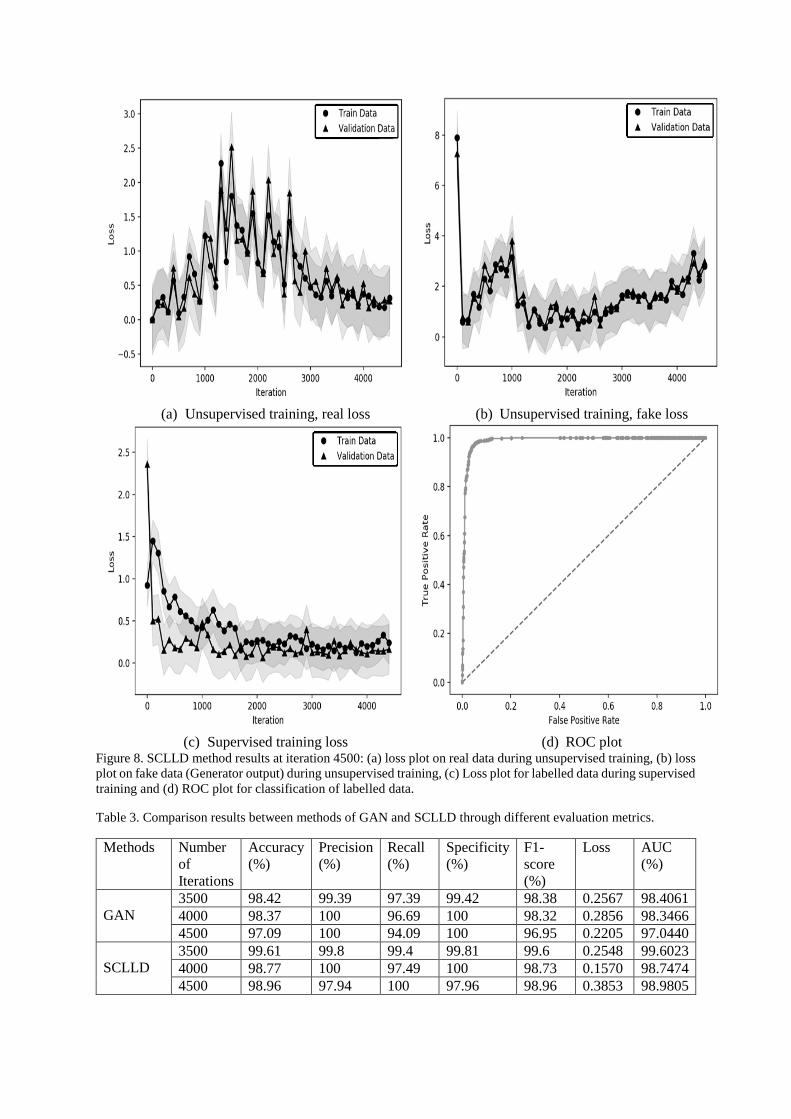
(a) Unsupervised training, real loss (b) Unsupervised training, fake loss
(c) Supervised training loss (d) ROC plot
Figure 8. SCLLD method results at iteration 4500: (a) loss plot on real data during unsupervised training, (b) loss
plot on fake data (Generator output) during unsupervised training, (c) Loss plot for labelled data during supervised
training and (d) ROC plot for classification of labelled data.
Table 3. Comparison results between methods of GAN and SCLLD through different evaluation metrics.
Methods Number
of
Iterations
Accuracy
(%)
Precision
(%)
Recall
(%)
Specificity
(%)
F1-
score
(%)
Loss AUC
(%)
GAN
3500 98.42 99.39 97.39 99.42 98.38 0.2567 98.4061
4000 98.37 100 96.69 100 98.32 0.2856 98.3466
4500 97.09 100 94.09 100 96.95 0.2205 97.0440
SCLLD
3500 99.61 99.8 99.4 99.81 99.6 0.2548 99.6023
4000 98.77 100 97.49 100 98.73 0.1570 98.7474
4500 98.96 97.94 100 97.96 98.96 0.3853 98.9805
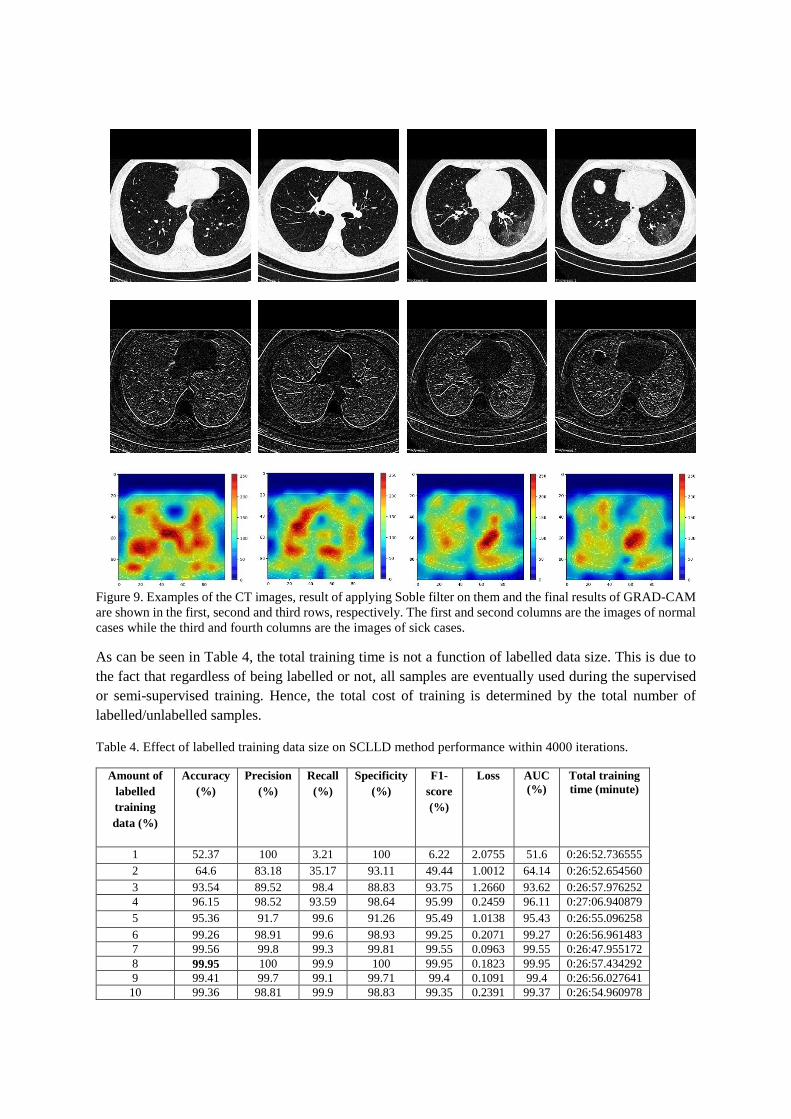
Figure 9. Examples of the CT images, result of applying Soble filter on them and the final results of GRAD-CAM
are shown in the first, second and third rows, respectively. The first and second columns are the images of normal
cases while the third and fourth columns are the images of sick cases.
As can be seen in Table 4, the total training time is not a function of labelled data size. This is due to
the fact that regardless of being labelled or not, all samples are eventually used during the supervised
or semi-supervised training. Hence, the total cost of training is determined by the total number of
labelled/unlabelled samples.
Table 4. Effect of labelled training data size on SCLLD method performance within 4000 iterations.
Amount of
labelled
training
data (%)
Accuracy
(%)
Precision
(%)
Recall
(%)
Specificity
(%)
F1-
score
(%)
Loss AUC
(%)
Total training
time (minute)
1 52.37 100 3.21 100 6.22 2.0755 51.6 0:26:52.736555
2 64.6 83.18 35.17 93.11 49.44 1.0012 64.14 0:26:52.654560
3 93.54 89.52 98.4 88.83 93.75 1.2660 93.62 0:26:57.976252
4 96.15 98.52 93.59 98.64 95.99 0.2459 96.11 0:27:06.940879
5 95.36 91.7 99.6 91.26 95.49 1.0138 95.43 0:26:55.096258
6 99.26 98.91 99.6 98.93 99.25 0.2071 99.27 0:26:56.961483
7 99.56 99.8 99.3 99.81 99.55 0.0963 99.55 0:26:47.955172
8 99.95 100 99.9 100 99.95 0.1823 99.95 0:26:57.434292
9 99.41 99.7 99.1 99.71 99.4 0.1091 99.4 0:26:56.027641
10 99.36 98.81 99.9 98.83 99.35 0.2391 99.37 0:26:54.960978
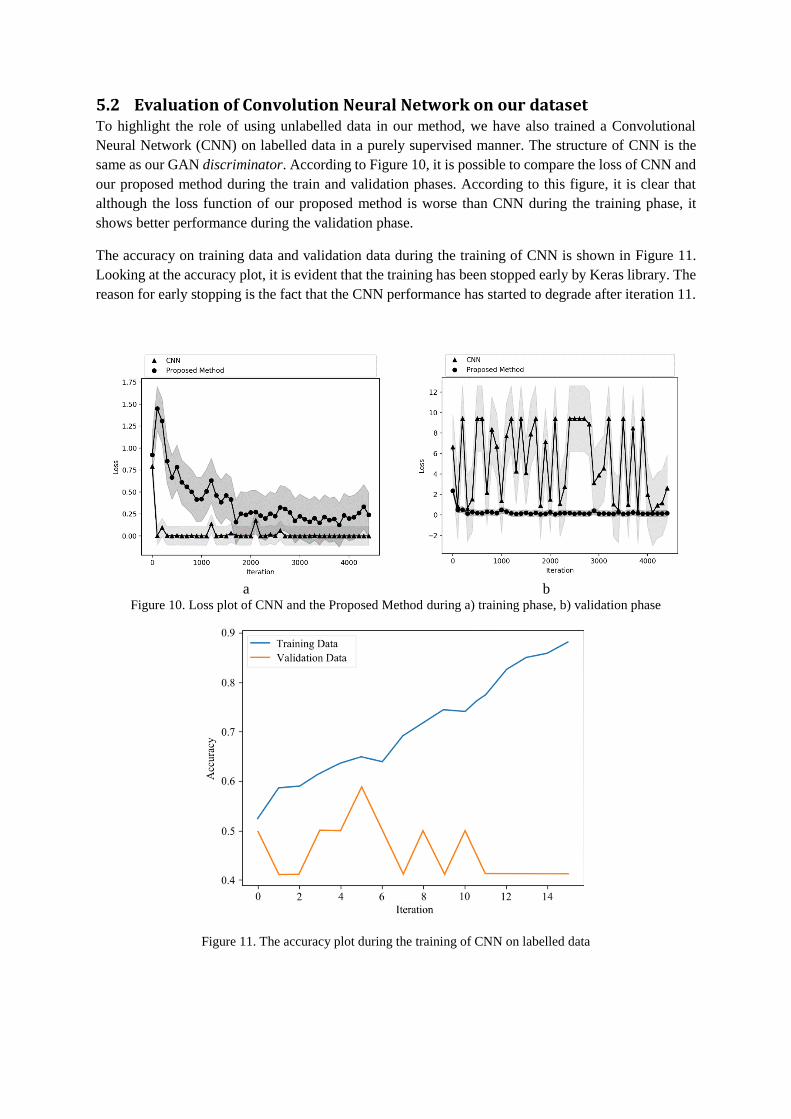
5.2 Evaluation of Convolution Neural Network on our dataset To highlight the role of using unlabelled data in our method, we have also trained a Convolutional
Neural Network (CNN) on labelled data in a purely supervised manner. The structure of CNN is the
same as our GAN discriminator. According to Figure 10, it is possible to compare the loss of CNN and
our proposed method during the train and validation phases. According to this figure, it is clear that
although the loss function of our proposed method is worse than CNN during the training phase, it
shows better performance during the validation phase.
The accuracy on training data and validation data during the training of CNN is shown in Figure 11.
Looking at the accuracy plot, it is evident that the training has been stopped early by Keras library. The
reason for early stopping is the fact that the CNN performance has started to degrade after iteration 11.
a b
Figure 10. Loss plot of CNN and the Proposed Method during a) training phase, b) validation phase
Figure 11. The accuracy plot during the training of CNN on labelled data
The performance of the trained CNN on test data is presented in Table 5. It is clear that CNN training
has suffered from the lack of sufficient amount of labelled data. While CNN requires a huge amount of
labelled training data in order to unleash its representation power; our method can enjoy unlabelled data
to reach significantly better performance even if labelled data are limited.
Table 5. Performance metrics of trained CNN on test data
Accuracy
(%)
Precision
(%)
Recall
(%)
Specificity
(%)
F1-score
(%)
AUC
(%)
Total training
time (minute)
69.87 63.00 94.00 46.40 75.00 70.24 0:00:09.940334
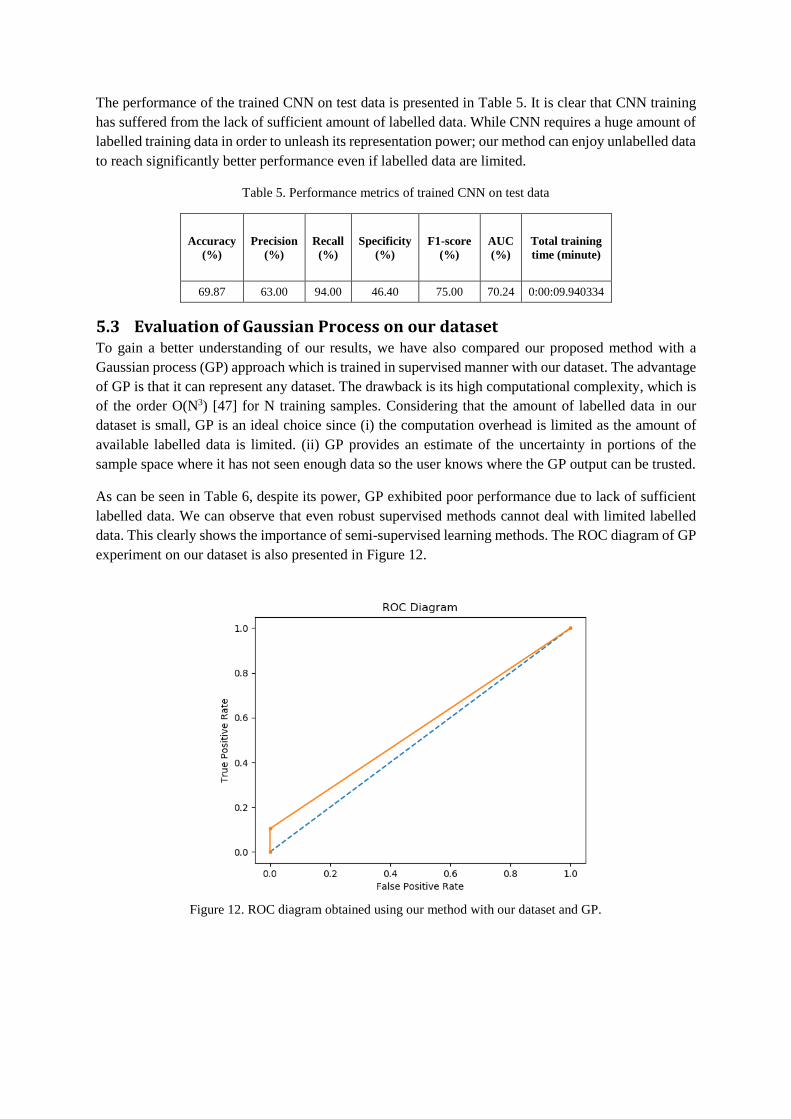
5.3 Evaluation of Gaussian Process on our dataset To gain a better understanding of our results, we have also compared our proposed method with a
Gaussian process (GP) approach which is trained in supervised manner with our dataset. The advantage
of GP is that it can represent any dataset. The drawback is its high computational complexity, which is
of the order O(N3) [47] for N training samples. Considering that the amount of labelled data in our
dataset is small, GP is an ideal choice since (i) the computation overhead is limited as the amount of
available labelled data is limited. (ii) GP provides an estimate of the uncertainty in portions of the
sample space where it has not seen enough data so the user knows where the GP output can be trusted.
As can be seen in Table 6, despite its power, GP exhibited poor performance due to lack of sufficient
labelled data. We can observe that even robust supervised methods cannot deal with limited labelled
data. This clearly shows the importance of semi-supervised learning methods. The ROC diagram of GP
experiment on our dataset is also presented in Figure 12.
Figure 12. ROC diagram obtained using our method with our dataset and GP.
Table 6. Performance of GP with our dataset.
Accuracy
(%)
Precision
(%)
Recall
(%)
Specificity
(%)
F1-score
(%)
AUC
(%)
Total training
time (minute)
54.48 52 100 10.38 68 55.19 0:16:52.914259
5.4 Evaluation of our method using a public dataset To evaluate the generalization of our method, we have evaluated the performance of our model using
the publicly available Kaggle dataset [13]. The dataset belongs to China National Centre for Bio-
information with 8535 positive and 9430 negative CT scan samples. It can be noted from the presented
results in Table 7 that our method has shown reasonable performance. Hence, our method is not limited
to a specific dataset.
Table 7. Results obtained using GAN and SCLLD methods with different evaluation metrics after 4000 training
iterations with 80% of Kaggle dataset [13] for training and 20% for testing.
Methods
Accuracy
(%)
Precision
(%)
Recall
(%)
Specificity
(%)
F1-score
(%) Loss
AUC
(%)
Total training
time (minute)
GAN 89.98 98.77 79.91 99.1 88.34 0.3669 89.50 0:26:56.824186
SCLLD 96.74 95.17 98.13 95.49 96.63 0.1977 96.81 0:26:59.223519
6 Discussion and Conclusion COVID-19 pandemic has led to more than 1 million deaths and is spreading faster than expected.
Currently, early detection of virus is of the highest importance which is a challenging task. Moreover,
the virus detection test is expensive and not robust. Hence, chest x-ray and CT scans may be the useful
tool to detect COVID-19 at an early stage. In addition to these detection techniques, researchers are
utilizing AI methods to accelerate the detection and treatment of COVID-19 infected patients. This is
the motivation behind our proposed method based on DL using a semi-supervised method.
Our objective is to classify healthy and COVID-19 infected patients accurately using chest CT scan
images. We have used the GAN method to deal with limited labelled data. To this end, GAN
discriminator network parameters are initialized using unlabelled data. Next, the network parameters
are fine-tuned with small number of labelled data. The proposed approach is further improved by pre-
processing the input images using Sobel edge detection. After the training, the GAN discriminator is
used to classify the test data. Using the probabilistic discriminator output, our system provides the
human experts with an uncertainty measure about its decision. The experimental results reveal the
superiority of SCLLD method as compared to the GAN method alone (Table 3).
To evaluate our SCLLD against other supervised methods, we have compared SCLLD performance
with our dataset and other methods using their datasets (Table 8). Testing on different datasets is
necessary since our dataset has limited labelled data which can hurt the performance of supervised
methods. This comparison reveals that while supervised learners are crippled in the absence of enough
labelled data, our method is capable of dealing with limited labelled data and learning from unlabelled
ones reaching performance which is on par with supervised methods. This is clearly the advantage of
our method, which is due to its semi-supervised nature.
The drawback of our method is its computation overhead. In this work, we have used two training
phases. In the first phase, standard GAN training is executed, which involves training of generator and
discriminator together. The first source of overhead is generator training since when training is done,
it is no longer needed. In the second phase of training, discriminator is trained using labelled data.
Hence, the second source of overhead is training of discriminator twice (unsupervised and supervised).
We may note that the final output of our method is the trained discriminator.
In future work, we investigate the effect of training the generator using feature matching [48].
Moreover, it is interesting to explore the effect of using soft labels [48] during the unsupervised training
phase of GAN. To this end, hard labels (zero and one) corresponding to fake and real samples are
replaced with a random number between [0, 0.3] and [0.7, 1], respectively. Soft labels usually lead to
stable training.
Table 8. Summary of comparison with other automated DL methods developed to detect COVID-19 with CT
images.
Authors DL method Training
approach
Number of
images Performance
Ardakani et al.
[32] ResNet-101 Supervised 1020 CT
AUC: 0.994
Sensitivity: 100%
Specificity: 99.02%
Accuracy: 99.51%
Li et al. [18] Resnet50 Supervised 4356 CT
Specificity: 92%
Sensitivity: 87%
AUC: 0.95
Wang et al. [19] CNN Supervised 453 CT
Sensitivity: 74%
Specificity: 67%
Accuracy: 73.1%
Gozes et al. [20] Resnet-50 Supervised 6150 CT
Specificity: 92.2%
Sensitivity: 98.2%
AUC: 0.996
Hemdan et al. [21] Google MobileNet and
modified VGG19 Supervised 50 X-ray F1 score: 91%
Apostolopoulos et al.
[23]
CNN with Transfer
Learning Supervised 1427 X-ray
Specificity: 96.46%
Sensitivity: 98.66%
Accuracy: 96.78%
Butt et al. [24] CNN Supervised 618 CT
Specificity: 92.2%,
Sensitivity: 98.2%
AUC: 0.996
Song et al. [25] Resnet50 Supervised 1485 CT Sensitivity: 0.93
AUC: 0.99
Sethy et al. [26] SVM plus Resnet50 Supervised 50 X-ray
Kappa: 90.76%
F1 score: 91.41%
FPR : 95.52%
Accuracy: 95.38%
Narin et al. [27]
Inception-ResNetV2,
InceptionV3 and
ResNet50
Supervised 3141 X-ray Accuracy: 98%.
Shi et al. [28] VB-Net Supervised 196 CT AUC: 0.89
Proposed method SCLLD Semi-
supervised 10000 CT
Accuracy: 99.60%
Specificity: 99.80%
Sensitivity: 99.39%
AUC: 99.60%
Acknowledgement This work was partly supported by the MINECO/ FEDER under the RTI2018-098913-B100, CV20-
45250 and A-TIC-080-UGR18 projects.
References [1] R. Alizadehsani, Z.A. Sani, M. Behjati, Z. Roshanzamir, S. Hussain, N. Abedini, F. Hasanzadeh, A. Khosravi,
A. Shoeibi, M. Roshanzamir, Risk Factors Prediction, Clinical Outcomes and Mortality of COVID‐19 Patients,
Journal of medical virology, (2020).
[2] M.L. Holshue, C. DeBolt, S. Lindquist, K.H. Lofy, J. Wiesman, H. Bruce, C. Spitters, K. Ericson, S.
Wilkerson, A. Tural, G. Diaz, A. Cohn, L. Fox, A. Patel, S.I. Gerber, L. Kim, S. Tong, X. Lu, S. Lindstrom, M.A.
Pallansch, W.C. Weldon, H.M. Biggs, T.M. Uyeki, S.K. Pillai, First Case of 2019 Novel Coronavirus in the United
States, New England Journal of Medicine, 382 (2020) 929-936.
[3] D. Wang, B. Hu, C. Hu, F. Zhu, X. Liu, J. Zhang, B. Wang, H. Xiang, Z. Cheng, Y. Xiong, Y. Zhao, Y. Li,
X. Wang, Z. Peng, Clinical Characteristics of 138 Hospitalized Patients With 2019 Novel Coronavirus–Infected
Pneumonia in Wuhan, China, JAMA, 323 (2020) 1061-1069.
[4] WHO. Coronavirus disease 2019 (COVID-19) situation report—114. May 13, 2020.
https://www.who.int/emergencies/diseases/novelcoronavirus-2019/situation-reports, 2020.
[5] Y. Fang, H. Zhang, J. Xie, M. Lin, L. Ying, P. Pang, W. Ji, Sensitivity of Chest CT for COVID-19: Comparison
to RT-PCR, Radiology, 296 (2020) E115-E117.
[6] T. Ai, Z. Yang, H. Hou, C. Zhan, C. Chen, W. Lv, Q. Tao, Z. Sun, L. Xia, Correlation of Chest CT and RT-
PCR Testing for Coronavirus Disease 2019 (COVID-19) in China: A Report of 1014 Cases, Radiology, 296
(2020) E32-E40.
[7] N. Chen, M. Zhou, X. Dong, J. Qu, F. Gong, Y. Han, Y. Qiu, J. Wang, Y. Liu, Y. Wei, J.a. Xia, T. Yu, X.
Zhang, L. Zhang, Epidemiological and clinical characteristics of 99 cases of 2019 novel coronavirus pneumonia
in Wuhan, China: a descriptive study, The Lancet, 395 (2020) 507-513.
[8] S. Tian, N. Hu, J. Lou, K. Chen, X. Kang, Z. Xiang, H. Chen, D. Wang, N. Liu, D. Liu, G. Chen, Y. Zhang,
D. Li, J. Li, H. Lian, S. Niu, L. Zhang, J. Zhang, Characteristics of COVID-19 infection in Beijing, Journal of
Infection, 80 (2020) 401-406.
[9] J.M. Górriz, J. Ramírez, A. Ortíz, F.J. Martínez-Murcia, F. Segovia, J. Suckling, M. Leming, Y.-D. Zhang,
J.R. Álvarez-Sánchez, G. Bologna, P. Bonomini, F.E. Casado, D. Charte, F. Charte, R. Contreras, A. Cuesta-
Infante, R.J. Duro, A. Fernández-Caballero, E. Fernández-Jover, P. Gómez-Vilda, M. Graña, F. Herrera, R.
Iglesias, A. Lekova, J. de Lope, E. López-Rubio, R. Martínez-Tomás, M.A. Molina-Cabello, A.S. Montemayor,
P. Novais, D. Palacios-Alonso, J.J. Pantrigo, B.R. Payne, F. de la Paz López, M.A. Pinninghoff, M. Rincón, J.
Santos, K. Thurnhofer-Hemsi, A. Tsanas, R. Varela, J.M. Ferrández, Artificial intelligence within the interplay
between natural and artificial computation: Advances in data science, trends and applications, Neurocomputing,
410 (2020) 237-270.
[10] A. Shoeibi, N. Ghassemi, M. Khodatars, M. Jafari, S. Hussain, R. Alizadehsani, P. Moridian, A. Khosravi,
H. Hosseini-Nejad, M. Rouhani, Epileptic seizure detection using deep learning techniques: A Review, arXiv
preprint arXiv:2007.01276, (2020).
[11] M. Khodatars, A. Shoeibi, N. Ghassemi, M. Jafari, A. Khadem, D. Sadeghi, P. Moridian, S. Hussain, R.
Alizadehsani, A. Zare, Deep Learning for Neuroimaging-based Diagnosis and Rehabilitation of Autism Spectrum
Disorder: A Review, arXiv preprint arXiv:2007.01285, (2020).
[12] D. Sharifrazi, R. Alizadehsani, J.H. Joloudari, S. Shamshirband, S. Hussain, Z.A. Sani, F. Hasanzadeh, A.
Shoaibi, A. Dehzangi, H. Alinejad-Rokny, CNN-KCL: Automatic Myocarditis Diagnosis using Convolutional
Neural Network Combined with K-means Clustering, (2020).
[13] A. Shoeibi, M. Khodatars, R. Alizadehsani, N. Ghassemi, M. Jafari, P. Moridian, A. Khadem, D. Sadeghi, S.
Hussain, A. Zare, Automated Detection and Forecasting of COVID-19 using Deep Learning Techniques: A
Review, arXiv preprint arXiv:2007.10785, (2020).
[14] M. Anthimopoulos, S. Christodoulidis, L. Ebner, A. Christe, S. Mougiakakou, Lung Pattern Classification
for Interstitial Lung Diseases Using a Deep Convolutional Neural Network, IEEE Transactions on Medical
Imaging, 35 (2016) 1207-1216.
[15] A. Depeursinge, A.S. Chin, A.N. Leung, D. Terrone, M. Bristow, G. Rosen, D.L. Rubin, Automated
classification of usual interstitial pneumonia using regional volumetric texture analysis in high-resolution
computed tomography, Invest Radiol, 50 (2015) 261-267.
[16] A. Jaiswal, N. Gianchandani, D. Singh, V. Kumar, M. Kaur, Classification of the COVID-19 infected patients
using DenseNet201 based deep transfer learning, Journal of Biomolecular Structure and Dynamics, (2020) 1-8.
[17] Y. Tingting, W. Junqian, W. Lintai, X. Yong, Three-stage network for age estimation, CAAI Transactions
on Intelligence Technology, 4 (2019) 122-126.
[18] L. Li, L. Qin, Z. Xu, Y. Yin, X. Wang, B. Kong, J. Bai, Y. Lu, Z. Fang, Q. Song, Artificial intelligence
distinguishes COVID-19 from community acquired pneumonia on chest CT, Radiology, (2020).
[19] S. Wang, B. Kang, J. Ma, X. Zeng, M. Xiao, J. Guo, M. Cai, J. Yang, Y. Li, X. Meng, A deep learning
algorithm using CT images to screen for Corona Virus Disease (COVID-19), MedRxiv, (2020).
[20] O. Gozes, M. Frid-Adar, H. Greenspan, P.D. Browning, H. Zhang, W. Ji, A. Bernheim, E. Siegel, Rapid ai
development cycle for the coronavirus (covid-19) pandemic: Initial results for automated detection & patient
monitoring using deep learning ct image analysis, arXiv preprint arXiv:2003.05037, (2020).
[21] E.E.-D. Hemdan, M.A. Shouman, M.E. Karar, Covidx-net: A framework of deep learning classifiers to
diagnose covid-19 in x-ray images, arXiv preprint arXiv:2003.11055, (2020).
[22] J. Zhang, Y. Xie, Y. Li, C. Shen, Y. Xia, Covid-19 screening on chest x-ray images using deep learning based
anomaly detection, arXiv preprint arXiv:2003.12338, (2020).
[23] I.D. Apostolopoulos, T.A. Mpesiana, Covid-19: automatic detection from x-ray images utilizing transfer
learning with convolutional neural networks, Physical and Engineering Sciences in Medicine, (2020) 1.
[24] C. Butt, J. Gill, D. Chun, B.A. Babu, Deep learning system to screen coronavirus disease 2019 pneumonia,
Applied Intelligence, (2020) 1.
[25] Y. Song, S. Zheng, L. Li, X. Zhang, X. Zhang, Z. Huang, J. Chen, H. Zhao, Y. Jie, R. Wang, Deep learning
enables accurate diagnosis of novel coronavirus (COVID-19) with CT images, medRxiv, (2020).
[26] P.K. Sethy, S.K. Behera, Detection of coronavirus disease (covid-19) based on deep features, Preprints,
2020030300 (2020) 2020.
[27] A. Narin, C. Kaya, Z. Pamuk, Automatic detection of coronavirus disease (covid-19) using x-ray images and
deep convolutional neural networks, arXiv preprint arXiv:2003.10849, (2020).
[28] W. Shi, X. Peng, T. Liu, Z. Cheng, H. Lu, S. Yang, J. Zhang, F. Li, M. Wang, X. Zhang, Deep Learning-
Based Quantitative Computed Tomography model in Predicting the Severity of COVID-19: A Retrospective
Study in 196 Patients, (2020).
[29] H.S. Maghdid, A.T. Asaad, K.Z. Ghafoor, A.S. Sadiq, M.K. Khan, Diagnosing COVID-19 pneumonia from
X-ray and CT images using deep learning and transfer learning algorithms, arXiv preprint arXiv:2004.00038,
(2020).
[30] J. Zhao, Y. Zhang, X. He, P. Xie, COVID-CT-Dataset: a CT scan dataset about COVID-19, arXiv preprint
arXiv:2003.13865, (2020).
[31] H. Ko, H. Chung, W.S. Kang, K.W. Kim, Y. Shin, S.J. Kang, J.H. Lee, Y.J. Kim, N.Y. Kim, H. Jung, J. Lee,
COVID-19 Pneumonia Diagnosis Using a Simple 2D Deep Learning Framework With a Single Chest CT Image:
Model Development and Validation, J Med Internet Res, 22 (2020) e19569.
[32] A.A. Ardakani, A.R. Kanafi, U.R. Acharya, N. Khadem, A. Mohammadi, Application of deep learning
technique to manage COVID-19 in routine clinical practice using CT images: Results of 10 convolutional neural
networks, Computers in Biology and Medicine, 121 (2020) 103795.
[33] R. Kumar, A.A. Khan, S. Zhang, W. Wang, Y. Abuidris, W. Amin, J. Kumar, Blockchain-federated-learning
and deep learning models for covid-19 detection using ct imaging, arXiv preprint arXiv:2007.06537, (2020).
[34] Q. Ni, Z.Y. Sun, L. Qi, W. Chen, Y. Yang, L. Wang, X. Zhang, L. Yang, Y. Fang, Z. Xing, A deep learning
approach to characterize 2019 coronavirus disease (COVID-19) pneumonia in chest CT images, European
radiology, (2020) 1-11.
[35] M.Z. Alom, M. Rahman, M.S. Nasrin, T.M. Taha, V.K. Asari, COVID_MTNet: COVID-19 Detection with
Multi-Task Deep Learning Approaches, arXiv preprint arXiv:2004.03747, (2020).
[36] T. Javaheri, M. Homayounfar, Z. Amoozgar, R. Reiazi, F. Homayounieh, E. Abbas, A. Laali, A.R. Radmard,
M.H. Gharib, S.A.J. Mousavi, Covidctnet: An open-source deep learning approach to identify covid-19 using ct
image, arXiv preprint arXiv:2005.03059, (2020).
[37] A. Saeedi, M. Saeedi, A. Maghsoudi, A novel and reliable deep learning web-based tool to detect COVID-
19 infection form chest CT-scan, arXiv preprint arXiv:2006.14419, (2020).
[38] Y.D. Zhang, S.C. Satapathy, L.Y. Zhu, J.M. Górriz, S.H. Wang, A seven-layer convolutional neural network
for chest CT based COVID-19 diagnosis using stochastic pooling, IEEE Sensors Journal, (2020) 1-1.
[39] S.-H. Wang, V.V. Govindaraj, J.M. Górriz, X. Zhang, Y.-D. Zhang, Covid-19 classification by FGCNet with
deep feature fusion from graph convolutional network and convolutional neural network, Information Fusion, 67
(2021) 208-229.
[40] L. Torrey, J. Shavlik, Transfer learning, Handbook of research on machine learning applications and trends:
algorithms, methods, and techniques, IGI global2010, pp. 242-264.
[41] I. Goodfellow, J. Pouget-Abadie, M. Mirza, B. Xu, D. Warde-Farley, S. Ozair, A. Courville, Y. Bengio,
Generative adversarial nets, Advances in neural information processing systems, 2014, pp. 2672-2680.
[42] C.K. Williams, C.E. Rasmussen, Gaussian processes for machine learning, MIT press Cambridge, MA2006.
[43] Z. Ghahramani, Unsupervised learning, Summer School on Machine Learning, Springer, 2003, pp. 72-112.

[44] R. Alizadehsani, A. Khosravi, M. Roshanzamir, M. Abdar, N. Sarrafzadegan, D. Shafie, F. Khozeimeh, A.
Shoeibi, S. Nahavandi, M. Panahiazar, A. Bishara, R.E. Beygui, R. Puri, S. Kapadia, R.-S. Tan, U.R. Acharya,
Coronary Artery Disease Detection Using Artificial Intelligence Techniques: A Survey of Trends, Geographical
Differences and Diagnostic Features 1991- 2020 Running Title: A mapping review of ML application for CAD
detection, Computers in Biology and Medicine, (2020).
[45] R.R. Selvaraju, M. Cogswell, A. Das, R. Vedantam, D. Parikh, D. Batra, Grad-cam: Visual explanations from
deep networks via gradient-based localization, Proceedings of the IEEE international conference on computer
vision, 2017, pp. 618-626.
[46] M. Li, T. Zhang, Y. Chen, A.J. Smola, Efficient mini-batch training for stochastic optimization, Proceedings
of the 20th ACM SIGKDD international conference on Knowledge discovery and data mining, 2014, pp. 661-
670.
[47] M. Belyaev, E. Burnaev, Y. Kapushev, Exact inference for Gaussian process regression in case of big data
with the Cartesian product structure, arXiv preprint arXiv:1403.6573, (2014).
[48] T. Salimans, I. Goodfellow, W. Zaremba, V. Cheung, A. Radford, X. Chen, Improved techniques for training
gans, Advances in neural information processing systems, 2016, pp. 2234-2242.