Embed Size (px)
Citation preview

Unilever Q1 2016 Results
Graeme Pitkethly / Andrew Stephen
April 14th 2016
This announcement may contain forward-looking statements, including ‘forward-looking statements’ within the meaning of the United States Private Securities Litigation Reform Act of 1995. Words such as ‘will’, ‘aim’, ‘expects’, ‘anticipates’, ‘intends’, ‘looks’, ‘believes’, ‘vision’, or the negative of these terms and other similar expressions of future performance or results, and their negatives, are intended to identify such forward-looking statements. These forward-looking statements are based upon current expectations and assumptions regarding anticipated developments and other factors affecting the Unilever Group (the “Group”). They are not historical facts, nor are they guarantees of future performance.
Because these forward-looking statements involve risks and uncertainties, there are important factors that could cause actual results todiffer materially from those expressed or implied by these forward-looking statements. Among other risks and uncertainties, the material or principal factors which could cause actual results to differ materially are: Unilever’s global brands not meeting consumer preferences; Unilever’s ability to innovate and remain competitive; Unilever’s investment choices in its portfolio management; inability to find sustainable solutions to support long-term growth; customer relationships; the recruitment and retention of talented employees; disruptions in our supply chain; the cost of raw materials and commodities; the production of safe and high quality products; secure and reliable IT infrastructure; successful execution of acquisitions, divestitures and business transformation projects; economic and political risks and natural disasters; financial risks; failure to meet high and ethical standards; and managing regulatory, tax and legal matters. These forward-looking statements speak only as of the date of this document. Except as required by any applicable law or regulation, the Group expressly disclaims any obligation or undertaking to release publicly any updates or revisions to any forward-looking statements contained herein to reflect any change in the Group’s expectations with regard thereto or any change in events, conditions or circumstances on which any such statement is based.
Further details of potential risks and uncertainties affecting the Group are described in the Group’s filings with the London Stock Exchange, Euronext Amsterdam and the US Securities and Exchange Commission, including in the Group’s Annual Report on Form 20-F for the year ended 31 December 2015 and the Annual Report and Accounts 2015.
SAFE HARBOUR STATEMENT
2

Graeme Pitkethly

-3%
-2%
-1%
0%
1%
2%
3%
4%
5%
6%
Mar-13 Dec-13 Sep-14 Jun-15 Mar-16
Markets continue to be challenging
Source: Nielsen volume market growth in Unilever categories
Mixed economic outlook Weak consumer demand
2016 GDP forecast
vs. prior forecast
US 2.0%
Eurozone 1.6%
Brazil (4.0%)
Russia (2.4%)
India 7.4%
China 6.2%
EM
D
Source: Oxford Economics estimates of real GDP growth
2013 2014 2015 2016
4
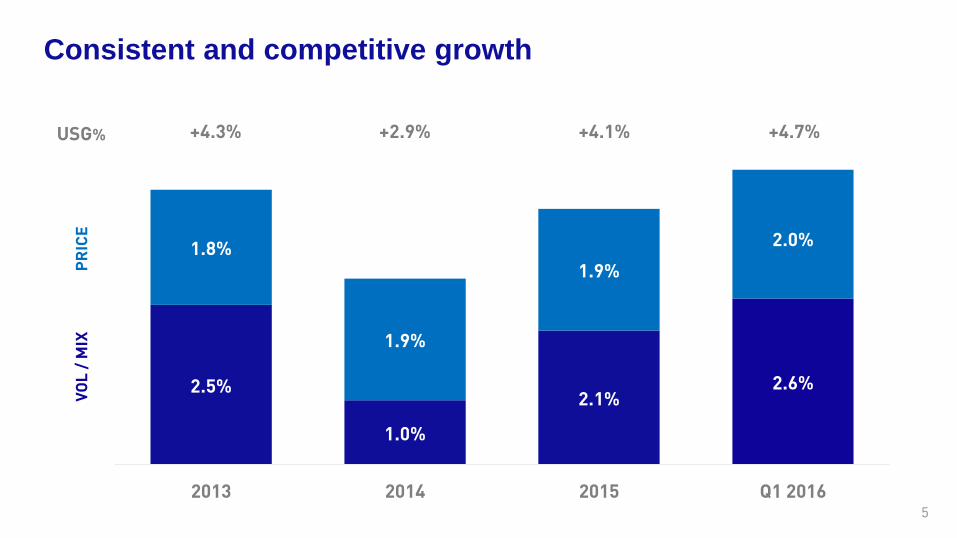
Consistent and competitive growth
2.5%
1.0%
2.1%2.6%
1.8%
1.9%
1.9%
2.0%
2013 2014 2015 Q1 2016
USG% +4.3% +2.9% +4.1% +4.7%
PR
ICE
VO
L /
MIX
5

Q1 2016: Turnover €12.5 billion
2015 USG% FXM&A 2016
€12.8bn €12.5bn+4.7% (7.1%)+0.7%
(2.0%)
6

Andrew Stephen

Personal Care: Innovating to grow the core & build premium
2015 Q1 2016
Growth accelerating
+4.1% +5.8%
USG%
8

Sustained return to growth
Foods: Innovating to accelerate growth
2015 Q1 2016
+1.5% +1.9%
USG%
9

2015 Q1 2016
Home Care: Innovating to grow margin & scale household care
Continued strong growth
+5.9% +7.0%
USG%
10

Competitive growth
Refreshment: Innovating in fast growing, premium segments
2015 Q1 2016
+5.4% +3.8%
USG%
11

Performance driven by Emerging Markets
Asia / AMET / RUB North AmericaLatin America Europe
UVG 4.2% UVG (0.1%)UVG 2.4% UVG 1.8%
€5.4bn
USG 5.0% USG 0.1%USG 17.9% USG (0.6%)
€1.8bn €2.2bn €3.1bn
Emerging markets +8.3% USG with +3.7% UVG
12

Graeme Pitkethly

2016 key initiatives
New Functional Models Zero Based BudgetingNet Revenue Management
MORE GLOBAL
AND
MORE LOCAL
14

Net Revenue Management
Underpinning consistent, competitive growth
+9 -3 +9
1kg 2kg 3kgPack size
Change in relative price index
Example: Brilhante Brazil
Share change (bps) +470 +380 +200
15Pricing remains at the sole discretion of the retailer

New Functional Models
More local Faster, simplerMore global
Faster scaling and roll-out of marketing programmes
Faster, more in tune with local trends and competition
Ready for the connected world
16
• More consumer & customer centric
• More resources market-facing
• Fewer layers
• Clearer accountabilities
• Faster decisions & lower cost

Zero Based Budgeting
Step 1: Visibility
Jan JulyApril
Step 2: Value targeting
Step 3:Implementation
Step 2: Value targeting
Dec
Wave 122 key markets
Wave 2Remaining markets
Global
Step 3:Implementation
2016 2017
17
ZBB and New Functional Models: €1bn p.a. savings by 2018Underpinning steady year on year margin progression

2016 priorities remain un-changed
Volume-driven growth ahead of our markets
Steady and sustainable improvement in core operating margin
Strong cash flow
18

Unilever Q1 2016 Results
Graeme Pitkethly / Andrew Stephen
April 14th 2016