Embed Size (px)
Citation preview
Mitigating climate change through investments infossil fuel technologies
UNITED NATIONS ECONOMIC COMMISSION FOR EUROPE
Lorem ipsum dolor sit amet, consectetuer adipiscing elit. Aenean commodo ligula eget dolor. Aenean massa. Cum sociis natoque penatibus et magnis dis parturient montes, nascetur ridiculus mus. Donec quam felis, ultricies nec, pellentesque eu, pretium quis, sem. Nulla consequat massa quis enim. Donec pede justo, fringilla vel, aliquet nec, vulputate eget, arcu. In enim justo, rhoncus ut, imperdiet a, venenatis vitae, justo. Nullam dictum felis eu pede mollis pretium. Integer tincidunt. Cras dapibus. Vivamus elementum semper nisi.
Aenean vulputate eleifend tellus. Aenean leo ligula, porttitor eu, consequat vitae, eleifend ac, enim. Aliquam lorem ante, dapibus in, viverra quis, feugiat a, tellus. Phasellus viverra nulla ut metus varius laoreet. Quisque rutrum. Aenean imperdiet. Etiam ultricies nisi vel augue. Curabitur ullamcorper ultricies nisi. Nam eget dui. Etiam rhoncus. Maecenas tempus, tellus eget condimentum rhoncus, sem quam semper libero, sit amet adipiscing sem neque sed ipsum. Nam quam nunc, blandit vel, luctus pulvinar, hendrerit id, lorem. Maecenas nec odio et ante tincidunt tempus.
Donec vitae sapien ut libero venenatis faucibus. Nullam quis ante. Etiam sit amet orci eget eros faucibus tincidunt. Duis leo. Sed fringilla mauris sit amet nibh. Donec sodales sagittis magna. Sed consequat, leo eget bibendum sodales, augue velit cursus nunc,
UN
EC
E
UN
ITE
D N
AT
ION
S
Mitig
atin
g clim
ate
change
thro
ugh
inve
stments in
fossil fu
el te
chnolo
gie
s - No
41
UNITED NATIONS
Miti
gatin
g cl
imat
e ch
ange
th
roug
h in
vest
men
tsin
foss
il fu
el te
chno
logi
es
40UNECE Energy Series
UNITED NATIONS ECONOMIC COMMISSION FOR EUROPE
Mitigating climate change
through investments
in fossil fuel technologies
A synthesis report based on national case studies from
Afghanistan, China, India, Kazakhstan, Kyrgyzstan,
Mongolia, Tajikistan, Ukraine, and Uzbekistan
UNITED NATIONS
New York and Geneva, 2013

2
NOTE
The designations employed and the presentation of the material in this publication do not imply the expression
of any opinion whatsoever on the part of the Secretariat of the United Nations concerning the legal status or
name of any country, territory, city or area, or of its authorities, or concerning the delimitation of its frontiers or
boundaries. Mention of any firm, licensed process, or commercial products does not imply endorsement by the
United Nations.
Copyright © United Nations, 2013
ECE/ENERGY/92
3
United Nations Economic Commission for Europe
The United Nations Economic Commission for Europe (UNECE) is one of the five United Nations regional
commissions administered by the Economic and Social Council (ECOSOC). It was established in 1947 with the
mandate to help rebuild post‐war Europe, develop economic activity and strengthen economic relations among
European countries, and between Europe and the rest of the world.
During the Cold War, UNECE served as a unique forum for economic dialogue and cooperation between East
and West. Despite the complexity of this period, significant achievements were made, with consensus reached
on numerous harmonization and standardization agreements. In the post-Cold War era, UNECE acquired not
only many new Member States, but also new functions. Since the early 1990s the organization has focused on
analyses of the transition process, using its harmonization experience to facilitate the integration of Central and
Eastern European countries into the global markets.
Today UNECE is the forum where the countries of whole Europe, Central Asia and North America—56
countries in all—come together to forge the tools of their economic cooperation. That cooperation concerns
economics, statistics, environment, transport, trade, sustainable energy, timber and habitat.
UNECE offers a regional framework for the elaboration and harmonization of conventions, norms and
standards. UNECE's experts provide technical assistance to the countries of South‐East Europe and the
Commonwealth of Independent States. This assistance takes the form of advisory services, training seminars
and workshops where countries can share their experiences and best practices.
UNECE Sustainable Energy
The UNECE Sustainable Energy sub-programme promotes a sustainable energy development strategy for the
region, with the objective to:
Provide sustained access to high quality energy services for all individuals in the UNECE region
Secure energy supplies in the short-, medium- and long-term
Facilitate a transition to a more sustainable energy future and introduce renewable energy sources to
reduce health and environmental impacts resulting from the production, transport and use of energy
Develop well-balanced energy network systems across the UNECE region, tailored to optimise
operating efficiencies and overall regional cooperation
Sustain improvements in energy efficiency, in production and use, particularly in countries with
economies in transition
Help promote, in the context of post-EU enlargement, the energy restructuring, legal, regulatory and
energy pricing reforms,
Assist UNECE Member States in incorporating the social and environmental dimensions into their
energy policy making
For more than twenty years, the UNECE Committee on Sustainable Energy has provided a platform for
intergovernmental dialogue on energy efficiency, natural gas, fossil fuel classification, clean electricity, and coal
methane management.
The sustainable energy sub-programme is designed to take into account the Secretary-General's initiative
"Sustainable Energy for All" and catalyse action in all UNECE Member States needed to achieve by 2030 the
three interlinked objectives: provide universal access to modern energy services; double the global rate of
improvement in energy efficiency; double the share of renewable energy in the global energy mix.
4
Contents
List of abbreviations 5
Executive summary 6
Chapter I: Background 9
Chapter II: Electricity sector overview 12
Chapter III: Fossil fuels in electricity generation 18
Chapter IV: Advanced fossil fuel technologies for cleaner electricity generation 26
Chapter V: Electricity demand growth and plans for the future 31
Chapter VI: The Role for FDI in introducing advanced fossil fuel technologies 45
Chapter VII: Investment climate 62
Chapter VIII: Findings and conclusions 71
5
List of Abbreviations
bcm billion cubic metres (of gas)
BLT Build Lease Transfer
BOOT Build Own and Operate or Transfer
BOT Build Operate Transfer
BROT Build Rehabilitate Lease Transfer
BTU British thermal unit (1,055 joule)
cbm Coalbed methane
CCGT Combined Cycle Gas Turbines
CCS Carbon capture and storage
CHP Combined heat and power
CHPGT Combined Heat and Power gas turbines
CNOOC China National Offshore Oil Corporation
CO2 Carbon dioxide
EBRD European Bank for Reconstruction and Development
EIA Energy Information Administration
EPC engineering, procurement and construction
FDI Foreign direct investments
GDP Gross Domestic Product
GHG greenhouse gas
GW Gigawatt
GWe Gigawatt (electric output)
ICGCC Integrated Coal Gasification combined cycle plants
IEA International Energy Agency
IPP Independent Power Producers
kWh kilowatt-hour
LNG Liquefied natural gas
MHI Mitsubishi Heavy Industries
Mpa Megapascal
MW Megawatt
MWh Megawatt-hour
PPA Power purchasing agreement
RLT Rehabilitate Lease Transfer
ROC Return on Capital
ROI Return on Investment
ROT Rehabilitate Operate Transfer
SBM Single buyer model
SCPC Supercritical pulverized coal burning steam generators
SOE State-owned enterprises
tcm trillion cubic meters
ton metric ton (1,000 kg)
TWh Terawatt-hour
UNDA United Nations Development Account
UNECE United Nations Economic Commission for Europe
UNESCAP Economic and Social Commission for Asia and the Pacific
USCPC Ultra-supercritical pulverized coal burning steam generators
6
Executive summary
About the project
This report is the principal written deliverable of the project "Mitigating climate change through attracting
foreign direct investment in advanced fossil fuel technologies", financed from the United Nations Development
Account (UNDA)1. The project, implemented in 2010-2012, covered nine countries: Afghanistan, China, India,
Kazakhstan, Kyrgyzstan, Mongolia, Tajikistan, Ukraine, and Uzbekistan.
The report takes into account findings of the national baseline studies, drafted for each of the nine countries
between November 2011 and August 2012. The report summarizes and interprets the experiences, policies, and
plans for the future of each country in developing a thermal electricity sector using advanced technologies that
reduce carbon dioxide (CO2) emissions and exploit the countries’ fossil fuel resources.
Climate change and electricity generation
According to the recently released portion of the Fifth Assessment Report of the United Nations
Intergovernmental Panel on Climate Change (Working Group I)2, the concentration of greenhouse gases in the
atmosphere has increased to levels unprecedented on earth in 800,000 years. Carbon dioxide (CO2) is the
principal greenhouse gas. Thermal electricity generation emits a substantial share of the world’s CO2 emissions.
Coal-fired plants are especially large contributors. The rapid growth in installed coal-fired electricity generation
capacity in the past 15 years has raised concerns about their deleterious effect on climate change. China and
India, in particular, have very large coal-burning electricity sectors and are the world’s first and third largest
CO2 emitters. Their emissions have shown very strong growth in the past decade.
The nine countries range from large and high-growth countries such as China and India—with large and rapidly
modernized electricity sectors—to smaller and relatively low-growth countries such as Tajikistan, Afghanistan,
Mongolia, and Kyrgyzstan—with small and rather obsolete fleet of power plants. In between are Kazakhstan,
Ukraine, and Uzbekistan, which inherited planned economies, electricity infrastructure, and fuel resources from
a centralized planning.
In all nine countries the electricity sector was developed, built, and operated by the state. The policy-makers in
these countries have long recognized that overall economic growth is supported and driven by the development
of electricity generation and distribution.
Advanced fossil fuel technologies
The advanced technologies for electricity generation from fossil fuels which currently offer the most promise for
delivering higher efficiencies and lower CO2 emissions are:
Combined Cycle Gas Turbines (CCGT)
Combined Heat and Power gas turbines (CHPGT)
Supercritical pulverized coal burning steam generators (SCPC)
Ultra-supercritical pulverized coal burning steam generators (USCPC)
Integrated Coal Gasification combined cycle plants (ICGCC)
1 The Development Account is a capacity development programme of the United Nations Secretariat aiming at enhancing
capacities of developing countries in the priority areas of the United Nations Development Agenda. The Development
Account is funded from the Secretariat’s regular budget and its projects are implemented by 10 entities; UNECE is one of
them.
2 More details as they become available can be found at: http://www.ipcc.ch/report/ar5/.
7
Over the past two decades there has been intensive research and development in making cleaner, more efficient
fossil fuel combustion technologies. Supercritical pulverized coal (SCPC) and ultra-supercritical pulverized coal
(USCPC) steam generators have been increasingly introduced into the world’s coal-fired electricity generation
fleet replacing less efficient sub-critical generators. Rapid advances in gas turbines used along with combined
cycle generators have increased efficiencies. These advanced technologies are expensive, however. For
example, the planned development program for new generation capacity for the current Five-Year plan in China
is estimated to cost $444 billion; in India the current 12th
Five-Year Plan calls for $265 billion for the electricity
sector.
China adopted a policy of introducing SCPC and USCPC generators in the 10th
Five-Year plan (2000-2005),
and since 2004 has been building them rapidly. By 2010 SCPC and USCPC power plants represented 54 per
cent of China’s total coal-burning electricity generation fleet. India mandated that 40 per cent of all new plants
shall be SCPC, while it has projected that in 2017-2022, 100 per cent of new coal plants must be SCPC or
USCPC. In Kazakhstan, Ukraine, and Mongolia, policy makers have recognized that there are issues with the
levels of CO2 that they emit from their coal based electricity generation. They have not yet committed to a
policy of adopting the advanced coal combustion technologies or in replacing their older coal-fired fleets.
Afghanistan, Tajikistan, and Kyrgyzstan all need more electricity than they currently generate, but these
countries can rely on hydro power.
Role of Foreign Direct Investments
Foreign direct investments (FDI) can have a positive effect on the economic development of a country through
the introduction of new, advanced technologies and production processes into an economy. Today FDI plays a
very important role in the economies of China and India; they are the first and third largest destinations for FDI.
On the other end, Uzbekistan, Kyrgyzstan, Tajikistan have received very little FDI in all sectors over the past
seven years.
China since 1985, India since 1991, Kazakhstan since 1995, and Ukraine since 1999 all have received FDI in the
electricity generation sector and all still have foreign investments in it. At this time all nine project countries
except China do need FDI to develop electricity sector based on advanced technologies. Unfortunately, nowhere
has FDI in electricity sector been on the scale required to impact the overall CO2 emissions. Here is how FDI
inflows in the electricity sector are estimated: since 1985 China has received about $16 billion in FDI, while
India since 2000 has received $5.9 billion. Kazakhstan has received since 1992 less than $700 million; Ukraine
$420 million; Tajikistan $280 million; Uzbekistan possibly $200 million. FDI into the electricity sectors of
Afghanistan and even Tajikistan have been more in the form of foreign development aid, which is not
considered FDI. Mongolia has to date not received any FDI.
All of the countries have laws and regulations which permit foreign direct investment in principal. But not all of
the countries actively promote FDI into the electricity generation. Based on the past performance, FDI is not
likely to deliver enough investment into advanced fossil fuel technologies to make a significant abatement
impact on the CO2 emissions of either China or India. It is still possible that Kazakhstan and Mongolia could
attract enough foreign investment in the coming decade in new large-scale high efficiency coal-fired power
plants that would make a contribution to the abatement of their CO2 emissions.
8
Risks, opportunities, investment climate
There are many general risks for a foreign investor into any industry of any developing economy; risks which do
not have anything to do with the legal or regulatory rules governing industry-specific FDI. These macro risk
factors which may inhibit FDI inflows include:
Security
Payments/exchange rate risk
Rule of law
Corruption
Political risk
In most of the nine countries the fundamental obstacle to foreign investments is the very low profitability of the
thermal electricity industry coupled with the relatively high risks of investing. The high risks are related to a
weakness in the enforcement of the rule of law—which may cause arbitrary rulings, project delays, inadequate
contract enforcement, confiscations, and general uncertainties. The very low profitability is tied, in every
country, to the lack of a market basis for building up electricity tariffs and ultimately to tariffs offered to
investors which are just too low and do not reflect the full costs of fuel, capital, operations, and returns.
The pricing of electricity is the fundamental problem. In none of the countries studied were tariffs flexible
enough to allow the pass-through of changing fuel costs. Instead, tariffs are set by fiat, often by local authorities
(meaning political considerations determine tariffs), and they most often reflect a political belief that the end
consumers cannot afford the full cost of energy, which should therefore be subsidized.
For investors into electricity generation there are a number of criteria that are more specific than the general
investment climate and that have the greatest impact on their investment decision. The criteria can be reduced to
six:
Regulatory system
Market framework
Commercial operations
Private sector involvement
Network access
Electricity tariffs
These six criteria represented the reference framework used to compare investment climate in the nine countries.
By these assessments, the two countries with the best terms for the investments in electricity generation are
India and Kazakhstan.
9
Chapter I: Background
The project was implemented in a vast region of Eurasia that some 2.5 billion people call home. The nine
countries covered by the project vary greatly in size and level of economic and social development, which is
reflected in their electricity sectors.
Five of the countries covered by the project—Kazakhstan, Kyrgyzstan, Tajikistan, Ukraine, and Uzbekistan—
are UNECE Member States. These countries became independent from the Soviet Union in 1992; today, they
are considered by the United Nations as the countries with economies in transition. Their electricity sectors were
built before or immediately after the Second World War, as part of the Soviet electrification programme. In
1992 they inherited an electricity infrastructure that was built through centralized planning using standardized
generating technologies. The fuel for these plants was often sourced outside those countries (e.g., gas from
Russia was used in Ukraine). The bulk of this huge surge in state-sponsored electricity investment was put into
power plants that burned fossil fuels, and to a much lesser extent into nuclear power generation and hydropower.
All project countries except Ukraine are Member States of the Economic and Social Commission for Asia and
the Pacific (UNESCAP). For this reason UNESCAP actively participated in project implementation. The four
non-UNECE countries covered by the project—Afghanistan, China, India, and Mongolia—are considered Asian
developing or emerging countries. After the Second World War and with the end of colonialism most of them
built up their electricity sectors as an integral part of their economic development to escape from poverty and
accelerate industrial development. From the 1950s through 1970s these countries built power plants that were
not the most advanced technologically but were the least expensive option based on the domestically available
fuel. During most of the past fifty years these countries have been investing heavily in the expansion of
electricity generation, trying to keep up with surging demand. Lately, this trend has accelerated tremendously:
according to the Global Warming Policy Foundation, China and India together are building three to four coal-
fired power plants every week3.
The substantial development of the fuel and electricity sectors was in most cases conducted by socialist or
centralized economies. The power plants and utilities were state owned enterprises which depended on
government budget financing and investment, pricing subsidies to plants and consumers, and fuel supplies. As
said before, the greatest need in this initial period of building was to keep ahead of demand. Output was the
overriding goal. Policy- and decision-makers were not concerned with market fundamentals or, least of all, with
the profits of the sectors and returns to investors. Indeed, electric power was almost deemed to be a fundamental
right and not a market commodity for which consumers—industrial or residential—had to pay the full cost.
There was a great deal of waste in power plant investment and operation, as well as in use of electricity and
energy in general. In the beginning state budgets were adequate and were dedicated to this massive
developmental effort. Efficiency and ecological “cleanliness” and “sustainability” were not priorities at that
time.
By the 1980s all project countries had already built up a substantial electric power infrastructure and generating
capacity. Their electricity sectors, however, were still lagging behind demand growth for electricity. In most
cases, the electricity sectors in these countries were huge industries commanding huge and growing amounts of
capital, fuel, and resources.
The costs of maintaining these sectors—much less expanding them—had become onerous on national budgets,
especially as economic growth began to take off in countries such as China and India. This pressure was
increased when global fuel prices—especially oil—increased dramatically and security of energy supply became
a serious determinant of national energy policy and further electricity development. Energy self-sufficiency—
meaning the priority use of local fuels such as coal instead of costly imports—became an important criterion for
further development of the electricity sectors. Increased economic development throughout Asian countries,
3 http://www.thegwpf.org/china-india-building-4-coal-power-plants-week/
10
even in market-oriented ones, was constrained by the heavy burden of continuing investment in and expansion
of the national electricity sectors.
At the same time, in the United States in the early 1980s, a major reform and deregulation of the electricity
sector released large amounts of investment capital. A new investment wave was created by the movement for
Independent Power Producers (IPP). These IPPs looked globally for opportunities to invest in new, latest
technology electricity generation plants. The demand for foreign investment in new electricity generation
capacity throughout Asia was enormous. The only requisite for the IPP movement was that the investors
required market conditions for the electricity sector in the country they invested in and market investment
returns from those plants they decided to build. There was very much an ideological motivation in the American
drive to invest in IPP in developing countries: namely, that was to break the socialist industrial development
model, to privatize state owned electricity enterprises, and to make a profit. In the 1980s and early 1990s,
American companies, such as the AES Corporation, Destec Energy, Mission Energy, AEI Energy, Consolidated
Electric Power Asia, and Enron, and Hong Kong-based companies such as Hopewell Holdings and CLP, began
investing in electricity generation plants in, for example, India, China, Ukraine, and Kazakhstan.
Simultaneously to this wave of IPP investments in developing countries, two initiatives began which have
shaped the electricity sector ever since. In the 1980s, as a result of regulatory pressures in the US, the clean coal
research and development movement began. A major thrust of this research was to develop the technologies to
reduce or remove altogether the carbon dioxide (CO2) emissions from coal-fired power plants. This latter
objective has become in itself a strong theme and development goal of power plant construction ever since,
namely the reduction of the absolute levels of CO2 emissions, whether through technologies such as clean coal,
or replacing coal-fired power plants with cleaner gas-fired ones, or through adopting renewable non-fossil fuel
energy resources, such as hydropower, solar, wind, or other low- or non-carbon emitting technologies.
The movement to reduce CO2 emissions from power plants gained ground throughout the 1980s and 1990s, and
found systematic, coordinated, global, and institutional structure and support in 1997 Kyoto Protocol. Ever since
then there has been increasing worldwide efforts to develop cleaner electricity generation through the
development and adoption of cleaner fossil fuel technologies and through the accelerated adoption of alternative
non-fossil fuel burning electricity generation technologies. This movement also gave a strong impetus to the
clean coal research and development movement, leading to the more rapid development and adoption of
advanced combustion technologies, research in the technologies of carbon capture and storage (CCS), and
research into technologies that removed carbon from the combustion stage altogether (such as use of syngas).
Both of these developments have had a major impact in electricity sector investment in the developing countries
of Asia and the transition economy countries (former USSR) of Eurasia. They have put pressure on countries to
adopt and build the new technologies, but adoption has come at a very high price. The new technologies are
expensive and require engineering skills, materials, and equipment which are not available in most developing
countries. And the economics of replacing fossil fuel-fired power plants—which provide the base-load power in
most of the world—with non-fossil fuel ones is staggering. Especially if the developing countries possess within
their borders extensive reserves of these fossil fuels, in particular coal and natural gas, which can cheaply and
rapidly be exploited for energy generation.
For all these reasons the United Nations General Assembly, through its Development Account capacity-building
programme, decided to support a project that would promote investments in advanced fossil fuel technologies in
electricity generation as a way to encourage developing countries and countries with economies in transition to
continue to develop their electricity sectors while keeping in mind the need to reduce overall CO2 emissions. In
particular, this project would promote adopting cleaner electricity technologies that would: use indigenous fuel
resources; reduce significantly emissions; and mitigate the financial burden of continued expansion of the
electricity sector. Further, recognizing the financial burden on national budgets, this project would promote in
these developing countries foreign direct investment as a means of financing the future costs of adopting the
new advanced technologies.
11
China, India, Ukraine, Kazakhstan, and Mongolia possess large reserves of coal, which they use as the principal
fuel for electricity generation. Uzbekistan and Kazakhstan possess large natural gas reserves, while in Tajikistan
and Afghanistan there are substantial but still potential natural gas resources. Electricity generation in
Afghanistan, Kyrgyzstan and Tajikistan—all being resource-poor, landlocked mountainous countries—is
dominated by hydropower. In nearly all project countries there is strong demand growth for electricity and thus
continuing demand to steadily expand electricity generation capacity for many years to come. Furthermore, in
China and India there is also an urgent need to reduce CO2 emissions, particularly those from thermal power
plants. In 2010, according to IEA estimates, China and India were the first and third CO2 emitters in the world.
The project consisted of several components. In each country, a study on the country’s electricity sector was
written. This study of the “baseline” condition of the electricity sector as of 2010-2011 would include a survey
of the role of coal in the country’s overall energy balance, plans and efforts to expand the thermal electricity
sector and to increase its efficiency and thus reduce CO2 emissions, a review of the country’s policies for future
power development and the technologies that will be adopted to best reduce emissions and fulfil demand, and
the country’s policies regarding foreign direct investment in the electricity sector. Along with these reports, a
number of regional and technical workshops were held, with the aim to promote foreign direct investment in
advanced technologies for low-CO2 electricity generation.
This report is a synthesis of findings of the “baseline” studies, drafted for each of the nine countries by national
consultants between November 2011 and August 2012. As such, the report aims to clarify, summarize and
interpret the experiences, policies, and plans for the future of each country in developing a thermal electricity
sector using advanced technologies that reduce CO2 emissions and exploit the countries’ fossil fuel resources. It
looks at the policies that have been put in place to encourage the investment in these technologies, from both
domestic and foreign investors. It also looks at the remaining obstacles to adoption of the low carbon
technologies and to foreign direct investment in them.
12
Chapter II: Electricity sector overview
Structure of electricity industry
The nine project countries range from large and high-growth countries with large and rapidly expanding
electricity sectors such as China and India to smaller and relatively low-growth countries with small electricity
sectors such as Tajikistan, Afghanistan, Mongolia, and Kyrgyzstan. In between are Kazakhstan, Ukraine, and
Uzbekistan, which inherited planned economies, substantial electricity infrastructure, and sizeable fuel resources
from centralized Soviet planning. (Of course Tajikistan, Kyrgyzstan, and to a certain extent Mongolia are also
former socialist economies with infrastructures built primarily by Soviet centralized planning.)
In all project countries policy-makers have long recognized that overall economic growth is supported and
driven by the development of electricity generation and distribution. In project countries with a socialist past,
developing electricity sector was not only an economic imperative but also an ideological one. As Lenin put it,
"communism is Soviet power plus the electrification of the whole country."
Today the electricity sector remains a key infrastructure needed to raise national wealth and make modern life
possible. In the past decade the economic growth in project countries correlated with the growth of electricity
generating capacity; when investment in new power plants lagged, economic growth slowed. For example, in
the five years immediately before the 2008 financial crisis, China’s electric generating capacity growth averaged
15.1 per cent, while Gross Domestic Product (GDP) average yearly growth was 11.9 per cent. From 2008,
annual investment in new capacity fell and capacity growth averaged only 11.0 per cent, while annual GDP
growth fell to 9.6 per cent. In India a similar correlation was noted.
The electricity sectors of all nine countries were built by state owned enterprises (SOEs). Only in the past fifteen
or so years have some of the project countries begun either to privatize the sector or allow direct private
investment in new power plants. Countries that opened the electricity sector to private investors include India,
Kazakhstan, and Mongolia. China, in reforming the electricity industry in the 1990s, first corporatized the power
SOEs and then allowed these new entities to offer shares to the public. Ukraine during the past four years has
begun a program of privatization of the sector, although its privatization program has not completely sold all of
its power companies and only sold the stakes to one Ukrainian private investor. In the remaining countries the
electricity sector remains in state hands although there have been policy discussions to allow private ownership
as an incentive for foreign direct investment.
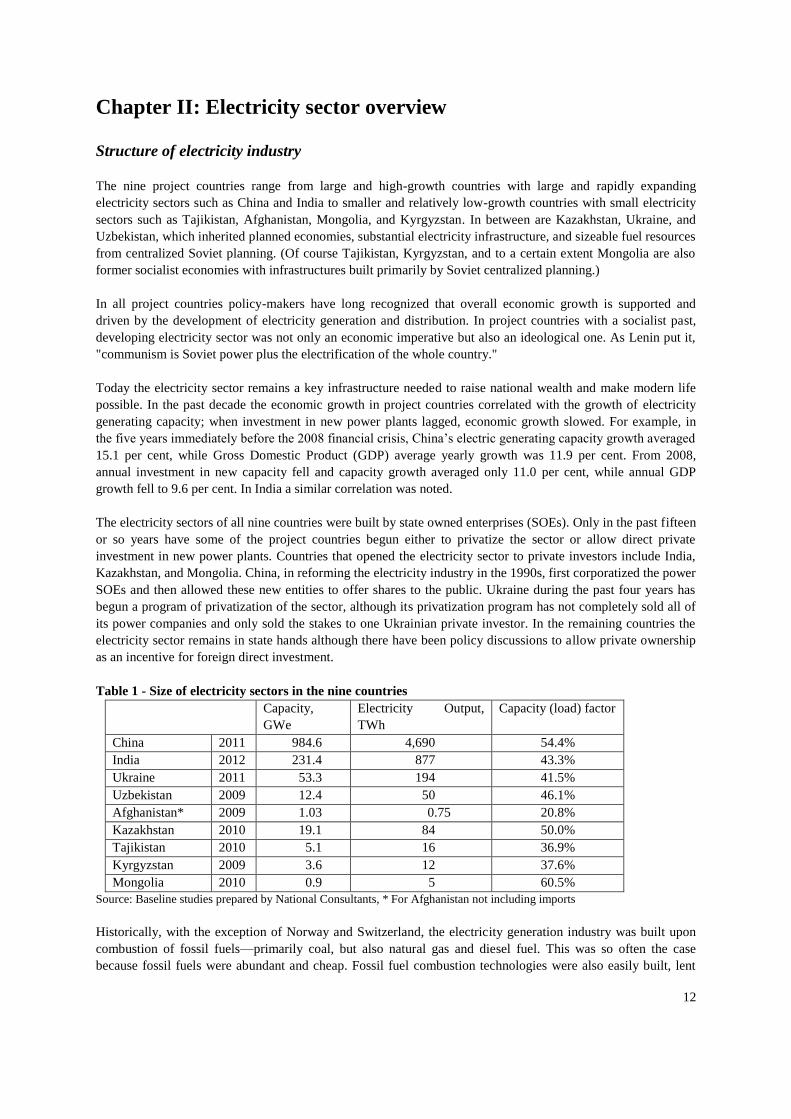
Table 1 - Size of electricity sectors in the nine countries
Capacity,
GWe
Electricity Output,
TWh
Capacity (load) factor
China 2011 984.6 4,690 54.4%
India 2012 231.4 877 43.3%
Ukraine 2011 53.3 194 41.5%
Uzbekistan 2009 12.4 50 46.1%
Afghanistan* 2009 1.03 0.75 20.8%
Kazakhstan 2010 19.1 84 50.0%
Tajikistan 2010 5.1 16 36.9%
Kyrgyzstan 2009 3.6 12 37.6%
Mongolia 2010 0.9 5 60.5%
Source: Baseline studies prepared by National Consultants, * For Afghanistan not including imports
Historically, with the exception of Norway and Switzerland, the electricity generation industry was built upon
combustion of fossil fuels—primarily coal, but also natural gas and diesel fuel. This was so often the case
because fossil fuels were abundant and cheap. Fossil fuel combustion technologies were also easily built, lent
13
themselves to economies of scale, and did not have excessively expensive capital costs. Furthermore, in many
countries the environmental pollution caused by fossil fuel combustion was not considered to be an excessive
social cost. This has also been the experience of the project countries, especially those where there have been
large, easily extracted coal resources such as in China, India, Mongolia, Kazakhstan, and Ukraine. The
“baseload” generating capacity in these countries has been built on coal combustion, while in Uzbekistan, which
has rich resources of natural gas, it has been built up on natural gas.
Six out of nine project countries generate electricity primarily from fossil fuels, while the other three
(Afghanistan, Tajikistan, and Kyrgyzstan), having insufficient fossil fuel resources, rely heavily on hydropower.
With the exception of Ukraine, nuclear power contributes a negligible share or nothing at all to electricity
generation. Furthermore, plans to expand nuclear capacity in all of these countries (with the possible exception
of China) appear to be undeveloped. Thermal power plants based on the combustion of fossil fuels will remain
the baseload in the future in six project countries (China, India, Ukraine, Uzbekistan, Kazakhstan, and
Mongolia). Indeed in four of these countries –China, India, Kazakhstan, and Mongolia—coal provides more
than half of electricity generated.
Burning fossil fuels releases carbon dioxide into the atmosphere and thus contributes to climate change. The
rapid growth of the thermal power sectors in China and India especially in the past two decades has elevated
these two countries to the top ranks of global polluters and CO2 emitters. This dire environmental problem has
been the incentive for developing electricity generated from diversified, more environmental friendly sources,
such as nuclear power, hydropower, and from renewable sources such as wind and solar power. The costs of
these alternative sources for now are higher than the capital and fuel costs of using coal or natural gas so going
forward there will be a constant debate over investment priorities.
While most investment in new capacity will continue going into thermal power plants in the coming years, there
will be growth in new hydropower and renewables capacity. And in China, India, and possibly Kazakhstan, in
the coming decade there will be new electricity generating capacity added from nuclear power.
Table 2 - Sources of commercial power generating capacity, percentage of the total
Data 2010 Coal Nat. gas Hydro Nuclear Renewable Other
China 70.0 2.4 17.5 0.9 9.3 nm
India 56.2 9.0 19.1 2.3 12.3 1.1
Ukraine 40.8 22.2 8.5 25.9 2.2 0.4
Uzbekistan 4.3 82.3 11.7 nm nm 1.7
Afghanistan nm 9.5 62.5 nm nm 28.0
Kazakhstan 66.1 22.1 11.4 nm 0.5 nm
Tajikistan nm nm 94.1 nm nm 5.9
Kyrgyzstan 18.6 nm 80.2 nm nm 1.4
Mongolia 97.0 nm nm nm nm 3.0
Source: National baseline studies, for Afghanistan US DOE EIA; nm=no meaningful data
In the past ten years growth in both generating capacity and electricity output has been strong in both China and
India. In this period China overcame the United States to become the largest electricity producer and consumer
in the world. Its electricity sector is still growing fast. In the same decade India has beco
me the fifth largest electricity producer in the world. In other project countries, there has been little or no growth
in electric generating capacity and only modest growth in electricity output. Investment in these countries has
primarily gone to capital maintenance and upgrading of older thermal capacity. In Afghanistan there has
actually been a loss in generating capacity because the insurgency there has diverted investment and sometimes
even blocked the operations of the country’s hydropower plants.
In China capacity has grown at an average of 12.5 per cent per year from 2002 to 2011, while output grew by
12.0 per cent a year. Most of that growth came from construction of coal-fired plants, as there has been a
14
program to retire smaller, less efficient plants from the fleet and to replace them with larger, more efficient ones.
In this program, since 2006 more than 70 GW of coal-fired capacity was taken out of service and replaced by
569 GW of more efficient coal plants, 65 per cent of which included supercritical and ultra-supercritical
generating plants. It is built into the current development plan that China will need to grow its electricity
generating capacity by 9.5 per cent a year in order to support the targeted GDP growth rates that the country
needs and desires. Most of that growth will be in coal-fired capacity.
Hydropower in China also grew over this period, but it witnessed growth in a step-wise fashion as the Three
Gorges Dam was finished and commissioned. For example, between the beginning of 2009 and the end of 2010
hydropower capacity grew by 22 per cent to 210 GW (the rated capacity of Three Gorges dam is 22.5 GW, but
its effective operating capacity will be more likely around 18.3 GW because of seasonal fluctuations). Nuclear
power capacity has grown more slowly in China in the past decade, but a new plan has put greater emphasis on
nuclear power development. As of 2011, China’s nuclear power capacity stood at 8.8 GW, but currently under
construction or in the final approval processes more than 26 GW of new nuclear plants are under way. Nuclear
power plants take much longer to design, to win approvals, to build and commission than thermal power plants
do, even in China.
India has seen slower and more variable growth in electricity generating capacity and output over the ten years
from 2002 to 2011. In this period, investments in new capacity grew by an average annual growth rate of 5.5 per
cent, which resulted in a growth of annual electricity output of 4.7 per cent. While this appears to be a
favourable growth rate, this rate was much slower than estimated electricity demand growth in the same period.
The slower than hoped for growth rate is widely attributed to the increasing difficulties, delays, and bureaucratic
hurdles faced by developers of power plants both in getting proposals approved and in construction. Nearly all
of the new added capacity in this past decade was in thermal generation, mostly in coal-fired plants. At the
present time there is a back-log of new projects totalling many GWs still awaiting approvals, construction, and
completion. In recent years much of the investment in new thermal capacity has been in “captive” power plants.
Captive electricity capacity grew by 57 per cent in the period 2002-2009, while publicly owned utilities only
added 41 per cent of new capacity in the same time period.
Nearly all project countries that used to be part of the former Soviet Union began their independence in 1992
with inherited high energy intensities. This was compounded in the past two decades by periods of economic
decline or slow economic growth. As a result, there have been low levels of new investment in electricity
generation. Most new investment in the decade 2002-2011 in these countries went into upgrading or
modernizing the legacy capacity that had been built in Soviet times, or went to electricity generation that was
“captive” to industrial complexes, that is, electricity produced in a plant linked to and aimed for a single specific
industrial site (such as a metallurgical plant) and not for the general wholesale market. This has been the
experience especially of Kazakhstan. In Kazakhstan in the past decade, electricity output has grown by an
average annual rate of 4.9 per cent from 58.2 TWh per year in 2002 to 83.8 TWh in 2011. This was achieved
without a significant growth in generating capacity or with very little new capacity additions. Between 2003 and
2011, electricity generating capacity grew overall by only 3.1 per cent; nearly all of this came in the upgrading
of existing coal-fired plants. Increased output of electricity resulted primarily from higher capacity utilization (a
higher capacity factor) and more efficient operations of the coal-fired generators. There were some new
additions to Kazakhstan’s hydropower capacity in this period.
In Ukraine, Uzbekistan, and the countries dependent on hydropower—Kyrgyzstan, Tajikistan, and
Afghanistan—there was virtually no investment in the electricity generating capacity during the period 2002-
2011. Not surprisingly there was also very little growth in electricity generated. This is not a sustainable
situation as the facilities get older and run less efficiently as they suffer from wear and tear.
Mongolia was in the period 2002-2010, like Kazakhstan, able to raise its electricity output with no increase in its
generating capacity. As there was strong demand growth in this period, the power plants ran at higher factor
capacity and electricity production grew at 4.8 per cent per year, while capacity remained at around 855 MWs
throughout the decade.
15
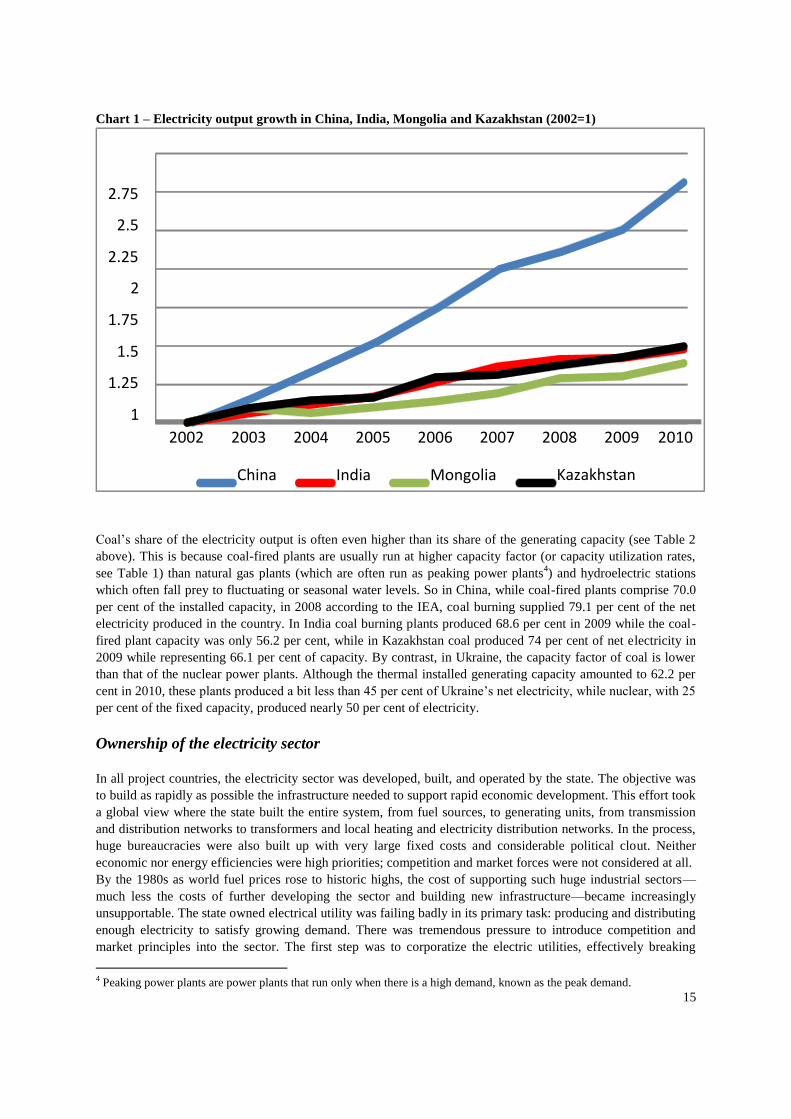
Chart 1 – Electricity output growth in China, India, Mongolia and Kazakhstan (2002=1)
Coal’s share of the electricity output is often even higher than its share of the generating capacity (see Table 2
above). This is because coal-fired plants are usually run at higher capacity factor (or capacity utilization rates,
see Table 1) than natural gas plants (which are often run as peaking power plants4) and hydroelectric stations
which often fall prey to fluctuating or seasonal water levels. So in China, while coal-fired plants comprise 70.0
per cent of the installed capacity, in 2008 according to the IEA, coal burning supplied 79.1 per cent of the net
electricity produced in the country. In India coal burning plants produced 68.6 per cent in 2009 while the coal-
fired plant capacity was only 56.2 per cent, while in Kazakhstan coal produced 74 per cent of net electricity in
2009 while representing 66.1 per cent of capacity. By contrast, in Ukraine, the capacity factor of coal is lower
than that of the nuclear power plants. Although the thermal installed generating capacity amounted to 62.2 per
cent in 2010, these plants produced a bit less than 45 per cent of Ukraine’s net electricity, while nuclear, with 25
per cent of the fixed capacity, produced nearly 50 per cent of electricity.
Ownership of the electricity sector
In all project countries, the electricity sector was developed, built, and operated by the state. The objective was
to build as rapidly as possible the infrastructure needed to support rapid economic development. This effort took
a global view where the state built the entire system, from fuel sources, to generating units, from transmission
and distribution networks to transformers and local heating and electricity distribution networks. In the process,
huge bureaucracies were also built up with very large fixed costs and considerable political clout. Neither
economic nor energy efficiencies were high priorities; competition and market forces were not considered at all.
By the 1980s as world fuel prices rose to historic highs, the cost of supporting such huge industrial sectors—
much less the costs of further developing the sector and building new infrastructure—became increasingly
unsupportable. The state owned electrical utility was failing badly in its primary task: producing and distributing
enough electricity to satisfy growing demand. There was tremendous pressure to introduce competition and
market principles into the sector. The first step was to corporatize the electric utilities, effectively breaking
4 Peaking power plants are power plants that run only when there is a high demand, known as the peak demand.
1
1.25
1.5
1.75
2
2.25
2.5
2.75
2002 2003 2004 2005 2006 2007 2008 2009 2010
China India Mongolia Kazakhstan
16
operating units out of the governing energy or electricity ministries. Once this was completed, the ministries
could more accurately measure the economics of the industry—the capital, fuel, and operating costs versus the
sales revenues and returns, if any—and also have better means of calculating what the electricity and heating
tariffs should be for the consumers. Generally, this initial step of corporatization was not followed in the nuclear
power and hydropower segments of the industry which have remained mainly in the hands of the state.
Still, in the thirty or so years since 1980, it was clear that the state-owned electricity generation, whether
corporatized or not, were not delivering the required goods. Competition and market principles needed to be
introduced into the system, and a means of introducing foreign investment and financing needed to be found. In
the 1990s the electricity generation sectors in India, then China began to be privatized.
India led the way with the reforms of 1991. Ironically, India has developed its electricity industry initially out of
private investment. The Calcutta Power Company (now CESC Ltd) was founded in 1897, Tata Power not long
afterwards. Only after independence in 1947 did the central governments nationalize the sector, although it did
not take over all of the privately owned generators and utilities. The socialist principles of early India–inspired
by the intensive heavy industrialization program of the Soviet Union—took over hydropower, transmission, and
thermal generation and built new facilities widely. Initially centralized in the Federal government, the ownership
of industry was then divided between the Central and local authorities with the foundation of the state owned
and run State Energy Boards (SEBs) in each regional Indian state. The SEBs were especially profligate and
politicized, and although they still operate, they are financially incapable of growing the sector or meeting
electricity demand growth. At the same time as the establishment of the SEBs, India set up a national power
generation company, NTPC, which now remains the largest single electricity generation operator in India
providing 27 per cent of India’s electricity output from 19 per cent of its installed capacity. It controls 29 power
plants (including joint ventures) with 39.2 GW of capacity located in all parts of the country, and has the largest
future construction plans of any group. Since 2009 the state retains 84.5 per cent stake, having offered the
balance of shares on the Bombay Stock Exchange. With the 1991 reform, the central government of India
allowed for private ownership (independent power producers or IPPs) and foreign investment into the
generation sector (including into hydro but not in nuclear power).
The first two foreign investors from 1992 were Enron and AES, both American corporations. The 1991 reform
also opened the door to Indian private entrepreneurs to new investment in privately held generation companies.
But after Enron’s failures, foreign investment has remained insignificant and has not contributed much to
India’s financing needs or electricity demand. Further reform in 2003, the Electricity Act, stimulated private
(local) investment, and power construction became major arms of the biggest entrepreneurial Indian industrial
groups. Private firms like the Adani Power, Reliance Infrastructure, Lanco, Tata Power, and Essar Power have
invested heavily and still have very ambitious future building plans. For the first time just recently, India’s
central power commission has allowed private investment into the transmission sector. But still the sector is
predominated by the state-owned enterprises (SOEs); state ownership, regulation, and control actually impedes
investment. Many of the electricity generating companies cannot run profitably, and further reform is needed.
In China, the first reforms occurred in the 2002 when the monopoly State Power Corporation was broken up into
eleven different SOEs; among them, in power generation, five major power corporations were set up on regional
lines. Likewise, there are regionally owned provincial power companies. Hydropower and nuclear power
remained wholly central state owned. Once corporatized, these five regional leaders—Chinese Datang
Corporation, China Guodian Corporation, China Huadian Group, China Huaneng Group, and China Power
Investment Corporation (CPI)—subsequently offered minority stakes for sale to public stock markets. Many of
the secondary SOEs—such as China Shenhua Energy Company, or China Resources Power Holdings—and
some of the provincial companies like the operator of the Three Gorges Dam hydropower plant, have also
offered shares on the markets in Shanghai, Hong Kong, or even New York.
The degree of state ownership in China remains quite high, by some estimates as high as 75 to 80 per cent.
There are no wholly privately-owned, electricity generating companies in China with the exception of two Hong
Kong (pre-1997 origins) based utilities; even foreign electricity investments have been in joint venture with
17
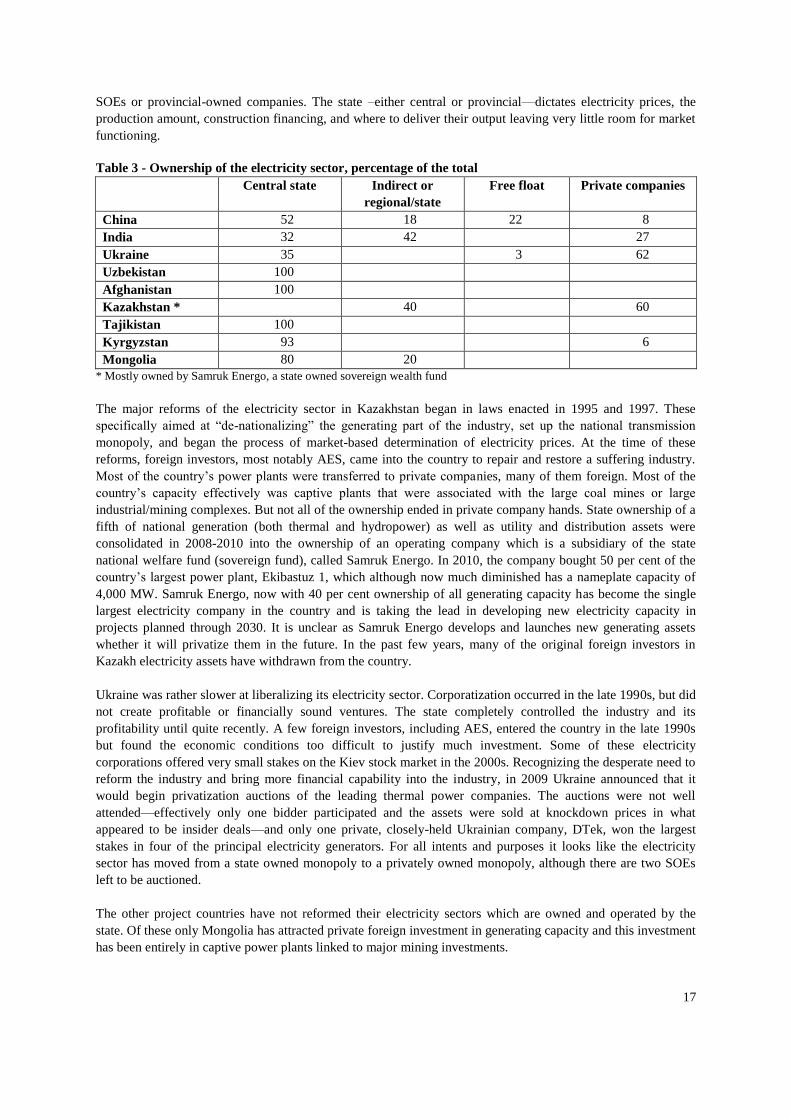
SOEs or provincial-owned companies. The state –either central or provincial—dictates electricity prices, the
production amount, construction financing, and where to deliver their output leaving very little room for market
functioning.
Table 3 - Ownership of the electricity sector, percentage of the total
Central state Indirect or
regional/state
Free float Private companies
China 52 18 22 8
India 32 42 27
Ukraine 35 3 62
Uzbekistan 100
Afghanistan 100
Kazakhstan * 40 60
Tajikistan 100
Kyrgyzstan 93 6
Mongolia 80 20
* Mostly owned by Samruk Energo, a state owned sovereign wealth fund
The major reforms of the electricity sector in Kazakhstan began in laws enacted in 1995 and 1997. These
specifically aimed at “de-nationalizing” the generating part of the industry, set up the national transmission
monopoly, and began the process of market-based determination of electricity prices. At the time of these
reforms, foreign investors, most notably AES, came into the country to repair and restore a suffering industry.
Most of the country’s power plants were transferred to private companies, many of them foreign. Most of the
country’s capacity effectively was captive plants that were associated with the large coal mines or large
industrial/mining complexes. But not all of the ownership ended in private company hands. State ownership of a
fifth of national generation (both thermal and hydropower) as well as utility and distribution assets were
consolidated in 2008-2010 into the ownership of an operating company which is a subsidiary of the state
national welfare fund (sovereign fund), called Samruk Energo. In 2010, the company bought 50 per cent of the
country’s largest power plant, Ekibastuz 1, which although now much diminished has a nameplate capacity of
4,000 MW. Samruk Energo, now with 40 per cent ownership of all generating capacity has become the single
largest electricity company in the country and is taking the lead in developing new electricity capacity in
projects planned through 2030. It is unclear as Samruk Energo develops and launches new generating assets
whether it will privatize them in the future. In the past few years, many of the original foreign investors in
Kazakh electricity assets have withdrawn from the country.
Ukraine was rather slower at liberalizing its electricity sector. Corporatization occurred in the late 1990s, but did
not create profitable or financially sound ventures. The state completely controlled the industry and its
profitability until quite recently. A few foreign investors, including AES, entered the country in the late 1990s
but found the economic conditions too difficult to justify much investment. Some of these electricity
corporations offered very small stakes on the Kiev stock market in the 2000s. Recognizing the desperate need to
reform the industry and bring more financial capability into the industry, in 2009 Ukraine announced that it
would begin privatization auctions of the leading thermal power companies. The auctions were not well
attended—effectively only one bidder participated and the assets were sold at knockdown prices in what
appeared to be insider deals—and only one private, closely-held Ukrainian company, DTek, won the largest
stakes in four of the principal electricity generators. For all intents and purposes it looks like the electricity
sector has moved from a state owned monopoly to a privately owned monopoly, although there are two SOEs
left to be auctioned.
The other project countries have not reformed their electricity sectors which are owned and operated by the
state. Of these only Mongolia has attracted private foreign investment in generating capacity and this investment
has been entirely in captive power plants linked to major mining investments.
18
Chapter III: Fossil fuels in electricity generation
Resources: Coal
Historically, electricity generating plants were built where fossil fuels were readily available, reliably delivered,
cheap and easy to handle. This has over time usually meant coal, although oil was sometimes used (as in the
Persian Gulf states), and latterly natural gas in countries having abundant gas reserves. An important, but often
unstated criterion in both developed and developing countries was security of energy supply: it is deemed better
to rely on domestic resources of fuel for electricity than to use interruptible sources which have to be imported.
It has only been in the past three decades that the need to control and reduce pollution and then CO2 emissions
has become an important criterion in building electricity generation plants.
This progression has occurred in the countries cover by the projects well as elsewhere; indeed significant power
plants have often been built at or near the coal mines as they were developed. Often the experience has been that
it is more economical to build at the mine head and transmit electricity than it has been to build in the urban or
industrial centres and build up transport infrastructure to deliver the fuels. Economically this has been by far the
least expensive means of building up an electricity sector quickly; cheaper than the alternative power sources
such as hydropower or nuclear power generation, and usually cheaper than importing fuels from more expensive
world markets.
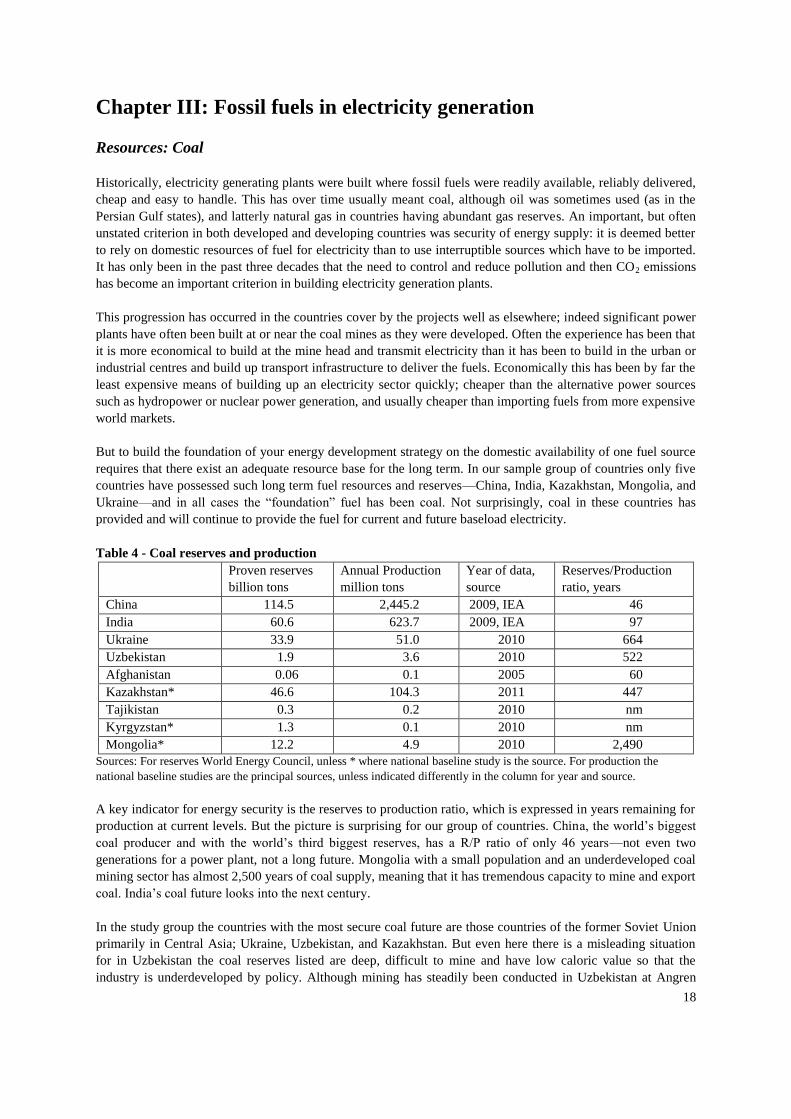
But to build the foundation of your energy development strategy on the domestic availability of one fuel source
requires that there exist an adequate resource base for the long term. In our sample group of countries only five
countries have possessed such long term fuel resources and reserves—China, India, Kazakhstan, Mongolia, and
Ukraine—and in all cases the “foundation” fuel has been coal. Not surprisingly, coal in these countries has
provided and will continue to provide the fuel for current and future baseload electricity.
Table 4 - Coal reserves and production
Proven reserves
billion tons
Annual Production
million tons
Year of data,
source
Reserves/Production
ratio, years
China 114.5 2,445.2 2009, IEA 46
India 60.6 623.7 2009, IEA 97
Ukraine 33.9 51.0 2010 664
Uzbekistan 1.9 3.6 2010 522
Afghanistan 0.06 0.1 2005 60
Kazakhstan* 46.6 104.3 2011 447
Tajikistan 0.3 0.2 2010 nm
Kyrgyzstan* 1.3 0.1 2010 nm
Mongolia* 12.2 4.9 2010 2,490
Sources: For reserves World Energy Council, unless * where national baseline study is the source. For production the
national baseline studies are the principal sources, unless indicated differently in the column for year and source.
A key indicator for energy security is the reserves to production ratio, which is expressed in years remaining for
production at current levels. But the picture is surprising for our group of countries. China, the world’s biggest
coal producer and with the world’s third biggest reserves, has a R/P ratio of only 46 years—not even two
generations for a power plant, not a long future. Mongolia with a small population and an underdeveloped coal
mining sector has almost 2,500 years of coal supply, meaning that it has tremendous capacity to mine and export
coal. India’s coal future looks into the next century.
In the study group the countries with the most secure coal future are those countries of the former Soviet Union
primarily in Central Asia; Ukraine, Uzbekistan, and Kazakhstan. But even here there is a misleading situation
for in Uzbekistan the coal reserves listed are deep, difficult to mine and have low caloric value so that the
industry is underdeveloped by policy. Although mining has steadily been conducted in Uzbekistan at Angren
19
since the 1940s, Uzbek coal reserves were during Soviet times dismissed as an uneconomic resource. At Angren
the reserves serve as the basis for the world’s longest running underground coal gasification program. In the
near future they may be used as fuel for thermal power plants to be converted from natural gas to coal in
Angren.
China as the world’s largest producer and consumer of coal, most of which goes to electricity generation, has
committed to continued development of its electricity industry based on coal. This is primarily for security of
energy supply reasons-- and related to this is the lower cost of using domestic coal as opposed to using imported
fuels—but also now that the coal industry has grown to the world’s largest and a major employer, there is huge
political pressure to remain committed to the support and expansion of the coal industry. This latter force is an
important policy consideration in the Indian, Ukrainian, and Kazakh coal industries.
China, India, Kazakhstan, Ukraine, and Mongolia have adopted policies where their future electricity
development plans rely primarily on the foundation of domestic coal consumption. Uzbekistan has indicated it
would like to diversify its fuel use in electricity generation, using more of its locally mined coal in place of
natural gas, but it does not have the investment resources to implement this policy.
In China, India, and Ukraine there are specific problems with a “coal first” policy. In all of these countries, the
domestic coal industries cannot keep up with demand growth. In China and India, especially, there is a growing
deficit between local supplies and the domestic electricity sector demand for thermal coal. In Ukraine and India
there are in addition serious problems of low calorific coal resources which are high in ash, moisture, and other
impurities. Likewise in Ukraine and India, coal mining is becoming more and more difficult and costly. In
Ukraine’s case it is the depth of the mines; in India’s it is access to mining properties for open cast mining, as
well as local opposition to mining. Likewise in India the delivery of prepared coal to power plants is unreliable
as the rail system cannot cope; it’s an intractable problem that will only get worse in the future. In only the past
five years both India and China—despite their official policies—have begun to import coal to compensate for
the growing deficit of domestic supplies. The Indian state coal company (CIL) forecasts that in 2012/13 it will
need to import 11 per cent of its targeted quota of 392 million tons which it must supply the power industry.
Private electricity companies are already importing large volumes outside the state supply quota. Import of coal
now exceeds 15 per cent of consumption. Despite the problems with its industry, India projects that its domestic
coal use will make it the second largest consumer of coal by 2020 (ahead of the US) as well as the largest
importer of coal.
In Tajikistan, Afghanistan, and Uzbekistan there are estimated to be significant unexplored coal resources. In
Tajikistan, for example, the government resources department estimates potential resources of up to 5 billion
tons, which, if found and developed, would more than suffice the country’s electricity needs. There is policy
interest in supporting the exploration and development of these resources and developing a coal industry, but
investment is lacking in all of these countries, and very little new investment in coal mining is expected in the
future. India has expressed an interest in exploring Afghanistan’s coal basins.
At the present time only Uzbekistan and China produce synthetic gas (syngas) from their coal resources.
Uzbekistan’s is the 60 year old project at Angren where an Australian company has recently bought control and
may invest in its expansion. China has several coal-to-syngas as well as coal –to-liquids projects, including ones
with Australian investors.
China has also made a major commitment to a large scale demonstration project to commercialize the
technology called Integrated Coal Gasification Combined Cycle based in Tianjin. This project, called GreenGen
continues to get strong support from the Chinese government. It has a pilot 250 MW plant already up and
running for the past seven years. It has attracted some foreign investment.
Although there has been much discussion about coalbed methane programs around the world, in our group only
China is actively pursuing this technology. China is reputed to have the largest resource base of coalbed
methane. One program in particular has begun in Xinjiang led by an Australian investor, the World Bank is
20
supporting another program in Shanxi, and the China National Offshore Oil Corporation (CNOOC) has just this
year signed a major contract for exploration for coalbed methane in Shanxi, Shaanxi and seven other provinces
of China where coal is plentiful.
Resources: Natural gas
Natural gas in recent decades has become the fossil fuel of choice for electricity generation because of its
“cleaning burning” characteristics. Of course it has to be readily available and a delivery infrastructure has to be
in place in order to base a power plant on gas. But in countries where natural gas has been available and
relatively cheap—such as in Russia, the U.K., Canada, and the United States—it has displaced coal in electricity
generation. In the countries cover by the project, natural gas is the primary fuel for electricity generation only in
Uzbekistan, although it could supply a significant share of future electricity generation in Kazakhstan as well
where most of the country’s reserves are being slated for export. In Ukraine, which has insufficient natural gas
reserves and which in the past relied for the overwhelming share of its energy on Russian gas imports, the
country’s energy planners have worked to replace gas fired power plants with coal-fired plants because of
pressing security of supply issues and the excessive burden on the balance of payments from Russian imports.
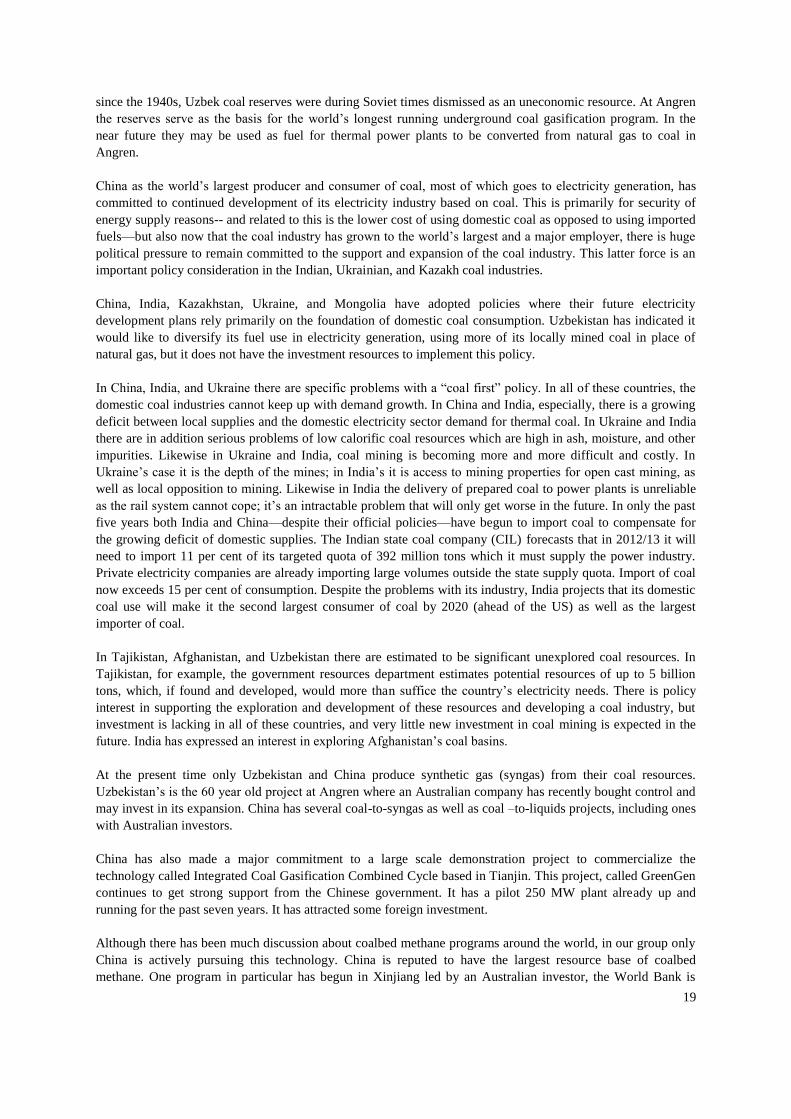
Of the nine countries, China has the largest proved reserves of gas with an estimated 3 trillion cubic meters
(tcm), but for its voracious energy appetite this volume of reserves is insufficient on which to base electricity
development and it is prohibitively expensive to build the needed transport infrastructure is with such a small
resource base. Kazakhstan has a relatively large resource of natural gas with proved reserves of 1.9 tcm located
primarily in the far west of the country. It should be promoting future electricity development using advanced
technology gas turbines, but at the same time it needs to connect the western electricity transmission grid with
the rest of the country.
Table 5 - Natural gas reserves and production
Proven reserves,
trillion cubic
meters
Annual production,
billion cubic meters
Year of data, Source of data Reserves
production
ratio, years
China 3.1 102.5 2011, BP Statistical Review 30
India 1.2 46.1 2011, BP Statistical Review 26
Ukraine 0.9 18.2 2011, BP Statistical Review 49
Uzbekistan 1.6 57.0 2011, BP Statistical Review 28
Afghanistan 0.1 0.03 2009, CIA World Fact Book 5
Kazakhstan 1.9* 19.3 2011, BP Statistical Review 98
Tajikistan 0.01 nm not available nm
Kyrgyzstan 0.01 nm na nm
Mongolia nm nm na nm
* The baseline study indicates 3.5 tcm of recoverable gas reserves for Kazakhstan which would give an R/P ratio of 181
years.
Only Uzbekistan in our study group has established the policy primacy for natural gas as the main source of
future electricity generation. Natural gas fired generators amount to more than 82 per cent of Uzbekistan’s total
capacity, with hydropower supplying the bulk of the remaining capacity. But nearly all of the gas turbines are
more than 20 years old and are in need of replacement with advanced gas turbines in order to achieve higher
efficiencies. Several units (435 MW) of the Navoi power plant are being modernized with Mitsubishi advanced
gas turbines.
Although natural gas is not the foundation fossil fuel for China and India both countries have permitted new
power plant investment based on advanced natural gas turbines. China in specific is preparing plans to import
large volumes natural gas both through pipeline sources and LNG especially for electricity generation as a
deliberate policy of reducing CO2 emissions and other pollutants. Gas will be sourced from Central Asia, LNG,
21
and perhaps from Russia. In India the initiative to develop new gas fired power plants is largely coming from
the private developers who are aware that the reliability of coal supply is low and will only get worse in the
future. They are planning new advanced gas turbine plants based on imported LNG, but face import restrictions
from the Indian government which is already having serious balance of payments difficulties. Current LNG
receiving facilities are being expanded and new ones are being planned around the country. Supply issues will
remain a constraint on the extensive or rapid development of gas-fired plants in the coming decade.
With regards to proven fossil fuel reserves, Kazakhstan is the one country in our group that could adopt natural
gas as a primary source of future electricity generating capacity. It has chosen not to do so in favour of
continued reliance on coal. Part of the reason stems from the location of the gas reserves in the far west of the
country and that this part of the country is not connected to the national transmission grid. So it is not likely that
advanced gas turbines will replace coal-fired plants in Kazakhstan as a means of mitigating CO2 emissions or in
increasing energy efficiency.
In China, the policy has moved in favour of natural gas, even though its reserves position does not suggest a
secure energy future based on natural gas. China is replacing coal-fired plant with gas fired plant based on gas
imports and it has an aggressive program of seeking out gas and LNG resources from a diversified number of
sources including Kazakhstan, Turkmenistan, Russia, east Africa, Australia, and Qatar.
The natural gas situation in China, India, and Ukraine could dramatically change in the coming years as new
advanced gas production technologies—specifically shale gas fracturing and coalbed methane production--
begin to be applied. Substantial conventional gas reserves could also yet be found in Afghanistan and Tajikistan
which are under-explored. In Afghanistan alone there is historical evidence that large resources exist in the north
of the country, as up until the 1970s the country was producing 30 bcm a year of natural gas.
Shale gas is a relatively new technology in the world gas market, yet it has scarcely been introduced in any of
the nine countries. The U.S. EIA in 2011 released a report which outlined the possible recoverable resources of
shale gas in the world outside the U.S. where it is now a well-established technology and a major contributor to
U.S. natural gas production. Shale gas is being actively explored for in China, which is forecast to sit on the
largest shale gas resource base in the world and expects to be producing 6.5 bcm a year in 2015. Ukraine only
this year gave out major exploration contracts, and India has announced that it will aim to award shale gas
exploration concessions beginning in December 2013.
China and Ukraine have both acknowledged the need for foreign private investment in the coming decade,
especially from those American firms with the greatest technological expertise and experience. In China and
Ukraine, the large multinational oil majors, such as Chevron, Shell, and ExxonMobil, have signed up to explore
for shale gas and will begin work next year. They have signed up contracts worth billions of dollars a year. But
although the resource base in China, India and Ukraine are sizeable, it will be some years before they are turned
into proved reserves and significant production begins. This is because it takes many years of trial and error
drilling to determine the appropriate combination of hydro fracture liquids, rock matrix, and correct drilling
depths and pressures to be able to reliably produce from shale formations. In the U.S. this took more than a
decade.
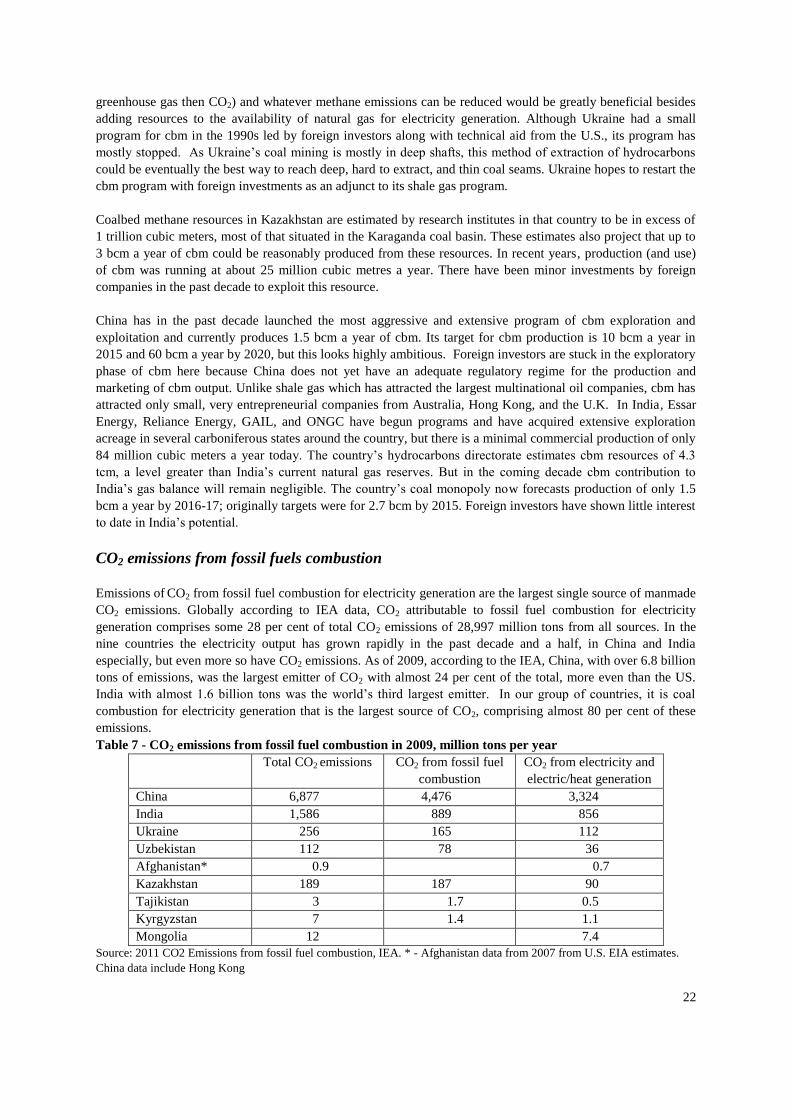
Table 6 - Shale gas resources from U.S. EIA 2011 report
Estimated resources tcm
U.S.A. 70.2
China 36.0
India 1.8
Ukraine* 1.2
* - Ukraine’s geological agency estimates resources of 3.5 tcm
Coalbed methane (cbm) is another advanced fossil fuel that if produced would greatly mitigate the emission of
greenhouse gases. Methane is one of the most destructive of greenhouse gases (it is 21 times more effective as a
22
greenhouse gas then CO2) and whatever methane emissions can be reduced would be greatly beneficial besides
adding resources to the availability of natural gas for electricity generation. Although Ukraine had a small
program for cbm in the 1990s led by foreign investors along with technical aid from the U.S., its program has
mostly stopped. As Ukraine’s coal mining is mostly in deep shafts, this method of extraction of hydrocarbons
could be eventually the best way to reach deep, hard to extract, and thin coal seams. Ukraine hopes to restart the
cbm program with foreign investments as an adjunct to its shale gas program.
Coalbed methane resources in Kazakhstan are estimated by research institutes in that country to be in excess of
1 trillion cubic meters, most of that situated in the Karaganda coal basin. These estimates also project that up to
3 bcm a year of cbm could be reasonably produced from these resources. In recent years, production (and use)
of cbm was running at about 25 million cubic metres a year. There have been minor investments by foreign
companies in the past decade to exploit this resource.
China has in the past decade launched the most aggressive and extensive program of cbm exploration and
exploitation and currently produces 1.5 bcm a year of cbm. Its target for cbm production is 10 bcm a year in
2015 and 60 bcm a year by 2020, but this looks highly ambitious. Foreign investors are stuck in the exploratory
phase of cbm here because China does not yet have an adequate regulatory regime for the production and
marketing of cbm output. Unlike shale gas which has attracted the largest multinational oil companies, cbm has
attracted only small, very entrepreneurial companies from Australia, Hong Kong, and the U.K. In India, Essar
Energy, Reliance Energy, GAIL, and ONGC have begun programs and have acquired extensive exploration
acreage in several carboniferous states around the country, but there is a minimal commercial production of only
84 million cubic meters a year today. The country’s hydrocarbons directorate estimates cbm resources of 4.3
tcm, a level greater than India’s current natural gas reserves. But in the coming decade cbm contribution to
India’s gas balance will remain negligible. The country’s coal monopoly now forecasts production of only 1.5
bcm a year by 2016-17; originally targets were for 2.7 bcm by 2015. Foreign investors have shown little interest
to date in India’s potential.
CO2 emissions from fossil fuels combustion
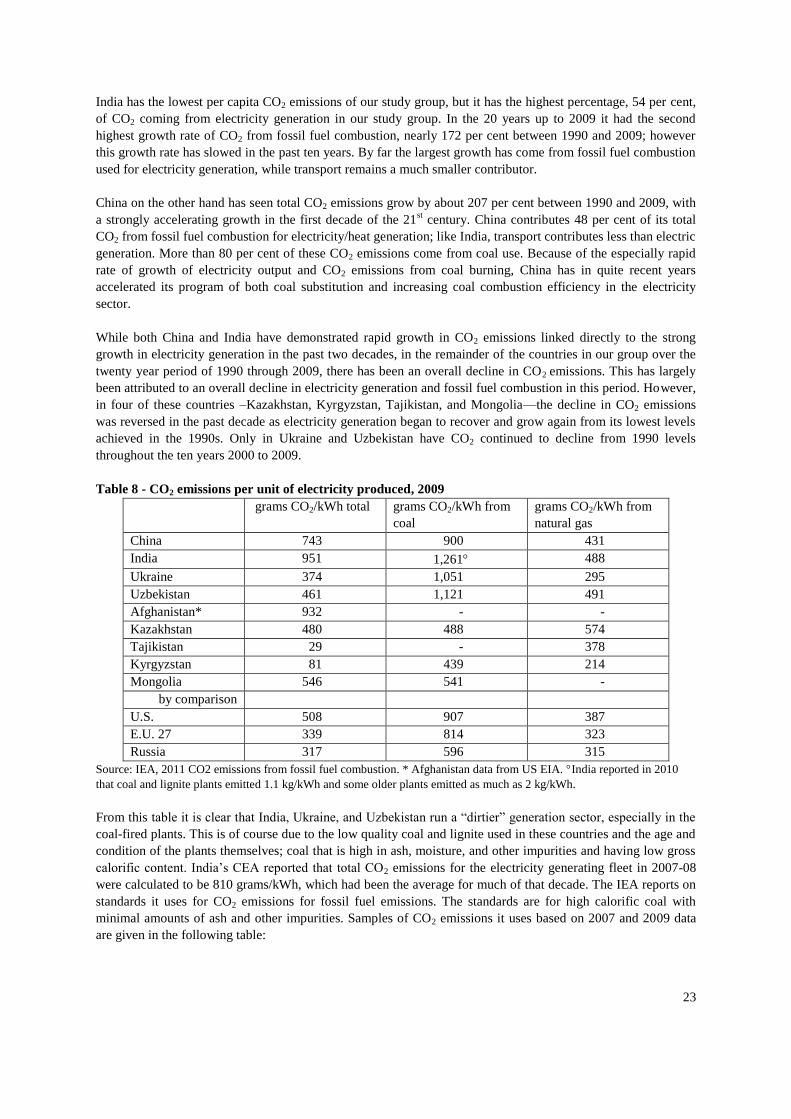
Emissions of CO2 from fossil fuel combustion for electricity generation are the largest single source of manmade
CO2 emissions. Globally according to IEA data, CO2 attributable to fossil fuel combustion for electricity
generation comprises some 28 per cent of total CO2 emissions of 28,997 million tons from all sources. In the
nine countries the electricity output has grown rapidly in the past decade and a half, in China and India
especially, but even more so have CO2 emissions. As of 2009, according to the IEA, China, with over 6.8 billion
tons of emissions, was the largest emitter of CO2 with almost 24 per cent of the total, more even than the US.
India with almost 1.6 billion tons was the world’s third largest emitter. In our group of countries, it is coal
combustion for electricity generation that is the largest source of CO2, comprising almost 80 per cent of these
emissions.
Table 7 - CO2 emissions from fossil fuel combustion in 2009, million tons per year
Total CO2 emissions CO2 from fossil fuel
combustion
CO2 from electricity and
electric/heat generation
China 6,877 4,476 3,324
India 1,586 889 856
Ukraine 256 165 112
Uzbekistan 112 78 36
Afghanistan* 0.9 0.7
Kazakhstan 189 187 90
Tajikistan 3 1.7 0.5
Kyrgyzstan 7 1.4 1.1
Mongolia 12 7.4
Source: 2011 CO2 Emissions from fossil fuel combustion, IEA. * - Afghanistan data from 2007 from U.S. EIA estimates.
China data include Hong Kong
23
India has the lowest per capita CO2 emissions of our study group, but it has the highest percentage, 54 per cent,
of CO2 coming from electricity generation in our study group. In the 20 years up to 2009 it had the second
highest growth rate of CO2 from fossil fuel combustion, nearly 172 per cent between 1990 and 2009; however
this growth rate has slowed in the past ten years. By far the largest growth has come from fossil fuel combustion
used for electricity generation, while transport remains a much smaller contributor.
China on the other hand has seen total CO2 emissions grow by about 207 per cent between 1990 and 2009, with
a strongly accelerating growth in the first decade of the 21st century. China contributes 48 per cent of its total
CO2 from fossil fuel combustion for electricity/heat generation; like India, transport contributes less than electric
generation. More than 80 per cent of these CO2 emissions come from coal use. Because of the especially rapid
rate of growth of electricity output and CO2 emissions from coal burning, China has in quite recent years
accelerated its program of both coal substitution and increasing coal combustion efficiency in the electricity
sector.
While both China and India have demonstrated rapid growth in CO2 emissions linked directly to the strong
growth in electricity generation in the past two decades, in the remainder of the countries in our group over the
twenty year period of 1990 through 2009, there has been an overall decline in CO2 emissions. This has largely
been attributed to an overall decline in electricity generation and fossil fuel combustion in this period. However,
in four of these countries –Kazakhstan, Kyrgyzstan, Tajikistan, and Mongolia—the decline in CO2 emissions
was reversed in the past decade as electricity generation began to recover and grow again from its lowest levels
achieved in the 1990s. Only in Ukraine and Uzbekistan have CO2 continued to decline from 1990 levels
throughout the ten years 2000 to 2009.
Table 8 - CO2 emissions per unit of electricity produced, 2009
grams CO2/kWh total grams CO2/kWh from
coal
grams CO2/kWh from
natural gas
China 743 900 431
India 951 1,261 488
Ukraine 374 1,051 295
Uzbekistan 461 1,121 491
Afghanistan* 932 - -
Kazakhstan 480 488 574
Tajikistan 29 - 378
Kyrgyzstan 81 439 214
Mongolia 546 541 -
by comparison
U.S. 508 907 387
E.U. 27 339 814 323
Russia 317 596 315
Source: IEA, 2011 CO2 emissions from fossil fuel combustion. * Afghanistan data from US EIA. India reported in 2010
that coal and lignite plants emitted 1.1 kg/kWh and some older plants emitted as much as 2 kg/kWh.
From this table it is clear that India, Ukraine, and Uzbekistan run a “dirtier” generation sector, especially in the
coal-fired plants. This is of course due to the low quality coal and lignite used in these countries and the age and
condition of the plants themselves; coal that is high in ash, moisture, and other impurities and having low gross
calorific content. India’s CEA reported that total CO2 emissions for the electricity generating fleet in 2007-08
were calculated to be 810 grams/kWh, which had been the average for much of that decade. The IEA reports on
standards it uses for CO2 emissions for fossil fuel emissions. The standards are for high calorific coal with
minimal amounts of ash and other impurities. Samples of CO2 emissions it uses based on 2007 and 2009 data
are given in the following table:
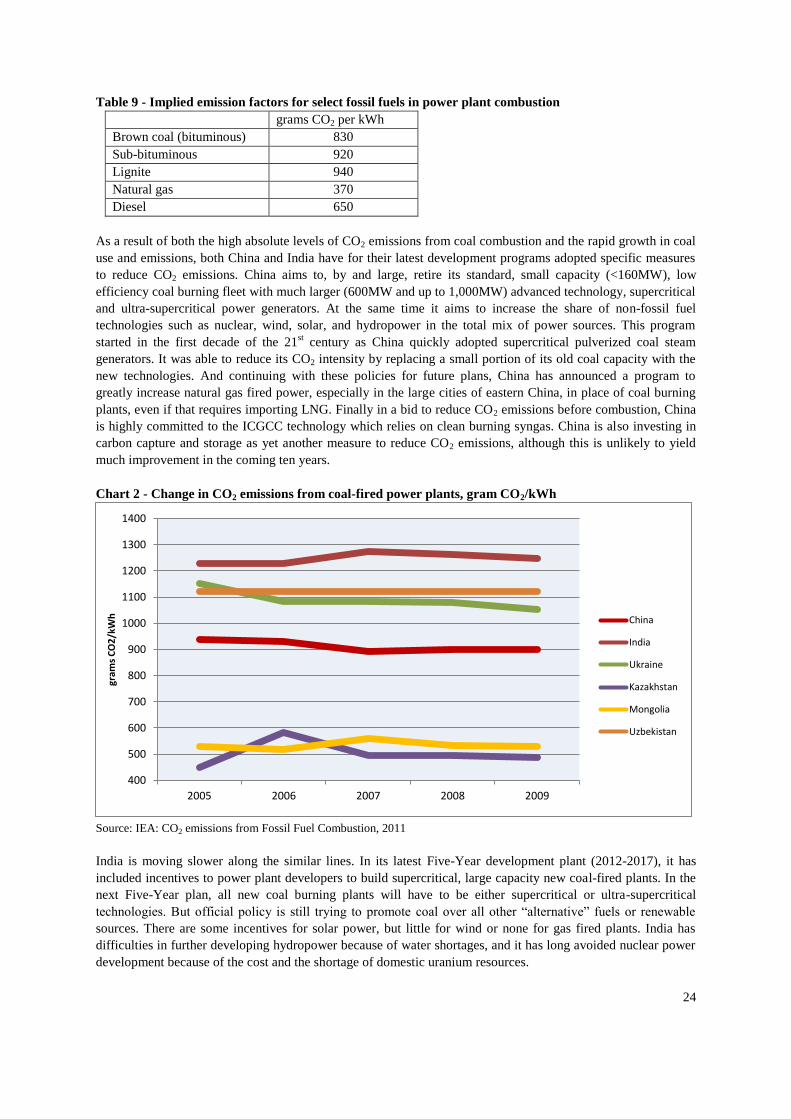
24
Table 9 - Implied emission factors for select fossil fuels in power plant combustion
grams CO2 per kWh
Brown coal (bituminous) 830
Sub-bituminous 920
Lignite 940
Natural gas 370
Diesel 650
As a result of both the high absolute levels of CO2 emissions from coal combustion and the rapid growth in coal
use and emissions, both China and India have for their latest development programs adopted specific measures
to reduce CO2 emissions. China aims to, by and large, retire its standard, small capacity (<160MW), low
efficiency coal burning fleet with much larger (600MW and up to 1,000MW) advanced technology, supercritical
and ultra-supercritical power generators. At the same time it aims to increase the share of non-fossil fuel
technologies such as nuclear, wind, solar, and hydropower in the total mix of power sources. This program
started in the first decade of the 21st century as China quickly adopted supercritical pulverized coal steam
generators. It was able to reduce its CO2 intensity by replacing a small portion of its old coal capacity with the
new technologies. And continuing with these policies for future plans, China has announced a program to
greatly increase natural gas fired power, especially in the large cities of eastern China, in place of coal burning
plants, even if that requires importing LNG. Finally in a bid to reduce CO2 emissions before combustion, China
is highly committed to the ICGCC technology which relies on clean burning syngas. China is also investing in
carbon capture and storage as yet another measure to reduce CO2 emissions, although this is unlikely to yield
much improvement in the coming ten years.
Chart 2 - Change in CO2 emissions from coal-fired power plants, gram CO2/kWh
Source: IEA: CO2 emissions from Fossil Fuel Combustion, 2011
India is moving slower along the similar lines. In its latest Five-Year development plant (2012-2017), it has
included incentives to power plant developers to build supercritical, large capacity new coal-fired plants. In the
next Five-Year plan, all new coal burning plants will have to be either supercritical or ultra-supercritical
technologies. But official policy is still trying to promote coal over all other “alternative” fuels or renewable
sources. There are some incentives for solar power, but little for wind or none for gas fired plants. India has
difficulties in further developing hydropower because of water shortages, and it has long avoided nuclear power
development because of the cost and the shortage of domestic uranium resources.
400
500
600
700
800
900
1000
1100
1200
1300
1400
2005 2006 2007 2008 2009
gram
s C
O2
/kW
h
China
India
Ukraine
Kazakhstan
Mongolia
Uzbekistan

25
While Ukraine has introduced some incentives for adopting alternative energy sources which produce less CO2
than coal combustion, none of Ukraine, Kazakhstan, Mongolia, or Uzbekistan has introduced policies, targets,
nor specific incentives to convert their coal burning fleets to advanced technology fossil fuel combustion power
plants. This means that output of CO2 in these countries will continue to rise both in absolute volumes and in
relative volumes per kWh in the coming decade.
26
Chapter IV: Advanced fossil fuel technologies for cleaner
electricity generation
Advanced technologies for using fossil fuels in electricity generation have evolved over the past decades
primarily as a means of achieving higher fuel energy efficiency through burning of these fuels at higher
temperatures. An important goal in recent years has also been to reduce CO2 emissions from power plants,
which historically have been the biggest single source of man-made CO2, as part of the global program of
mitigating climate change.
In many developed countries, there have even been calls to entirely abandon fossil fuels, and especially coal, as
a source of electricity. But with the abundance of fossil fuel resources (and especially in many countries the
abundance of coal resources) and their high energy content and relatively low cost, these calls make no
economic sense, either in the immediate or more distant future. Most research has focused on new technologies
which either increase energy efficiency of burning fossil fuels and reducing CO2 emissions, or attempt to
capture CO2 before or after the combustion. There is an inverse correlation between operating a fossil fuel fired
power generator at higher efficiency and reducing the generator’s CO2 emissions. The general rule is that for
each 1 per cent increase in efficiency of a coal burning power plant there is 2-3 per cent reduction of CO2
emissions. In general the greater the conversion and capture of heat generated from the fuel burned, the higher
the thermal efficiency of the plant. This is why combined cycle and combined heat and power plants regularly
generate power at higher efficiencies.
There has been steady technological innovation over the past two decades to increase the efficiency of fossil fuel
burning plants. There have been improvements in high pressure, high capacity gas turbines which makes gas the
cleanest and most efficient fuel. And there has been intense research in the Clean Coal initiative to increase the
efficiency of burning coal and reduce or even eliminate CO2 emissions.
The advanced technologies for electricity generation from fossil fuels which currently offer the most promise for
delivering higher efficiencies and lower carbon emissions are:
Combined Cycle Gas Turbines, (CCGT) now well understood and widely applied throughout the world
and is primarily fuelled by natural gas
Combined Heat and Power gas turbines, CHP, which have long been in service in many parts of the
world and usually are also natural gas fuelled
Supercritical pulverized coal burning steam generators (SCPC)used to drive power turbines, which are
just now being introduced in many countries with rich coal reserves
Ultra-supercritical pulverized coal burning steam generators (USCPC), a technology that is only
beginning to be applied
Integrated Coal Gasification combined cycle plants (IGCC), is a technology still in the research stage,
and which burn synthesis gas, a product of coal gasification
In general, the thermal efficiency of a gas turbine power plant is approximately 52 per cent up to 60 per cent,
nearly double the efficiency of standard coal-fired boilers used in most of the world today. By way of reference,
the efficiency of the US fleet of coal-fired power plants as of 2010 was about 32 per cent using high heating
value coal. The emissions of CO2 from gas turbine plants is also less than half of the emissions of high grade,
clean coal used in these same standard plants (about 435 g of CO2 per kWh from gas as compared with 1100
grams per kWh from the standard coal plant operating at 30 per cent efficiency).
Combined cycle gas turbines employ the concept of capturing the waste heat of the initial gas combustion to run
a second turbine, a heat recovery steam turbine, thus the combined cycle is actually one where two runs or
cycles are made from the same combustion where the waste heat (or exhaust) powers a steam turbine after the
gas turbine has been powered. These plants can have a single drive shaft for the electric generator or multiple
shafts, different ones for the gas turbine and the steam turbines. Just recently the world’s most efficient CCGT
27
plant has been opened in Irsching, Germany using Siemens technology. It has achieved efficiency rates of 62 per
cent.
The most common capacity size for a CCGT unit is 300 MW or 400 MW. The technology continues to advance
as higher and higher gas-inlet temperatures are employing, in turn requiring higher quality steel alloys. Where
natural gas is a reliable and available fuel, this technology has increasingly been the preferred one for new plants
in recent years. The EIA announced in April that in the US, gas-fired plants using CCGT have now equalled
coal-fired plants in electricity generated.
A combined heat and power plant (or cogeneration plants) are ones where the exhaust heat, usually steam or hot
water, from power turbines is distributed to users around and near the plant. It actually was the very first type of
commercial electricity plant built by Thomas Edison. It is a technology that is widespread in Europe and the
former Soviet Union. It can achieve high efficiencies has more of the thermal heat from fuel combustion is
captured and used than from conventional power plants. It is a technology that uses many fuels (from coal, to
gas, to biofuels, to nuclear) and has even been attached to combined cycle plants. It usually is based on gas or
steam turbines. Because the steam has to be transported to the users by insulated pipes usually CHP plants are
often located in urban areas or they are built as captive plants next to facilities that consume the heat.
The major technological advance in electricity generation using coal in recent years has been the introduction of
steam generators that produce supercritical steam for electric turbines in SCPC and USCPC plants. These
require very high temperatures and pressures and special steel alloys and special configurations to achieve the
sustained supercritical steam and to control and drive electric generators.
The supercritical steam generator operates at pressures above 24 MPa (the supercritical pressure above which
there is no phase state between liquid and gaseous water) and temperatures above 540 degrees Celsius. Since
1990, SCPC units have been steadily introduced throughout Europe, Japan, the United States, and, since 2005,
in China there are more than 500 such plants worldwide. They are achieving efficiencies of 38 to 46 per cent
and sizeable savings of fuel costs and reductions of CO2 emissions for their operators. The standard set for these
generators have now settled on 600 or 660 MW size. In India, recent plans for SCPC plants call for power plants
with 2, 3, and even 4 units of supercritical generators. China has adopted 600 MW units and has even been
building units of 1000 MW size. There is now a very substantial track record for this technology, which led to
an increased understanding of their operating costs, coal and water treatment, and emissions and waste heat
produced.
Continuing the application of higher temperatures and pressures to increase efficiency, research over the past
decade has introduced ultra-supercritical steam generators using pulverized coal. At the present time this
technology refers to supercritical steam generators run at pressures at or above 29 MPa and temperatures above
590o C. This sort of plant, of which there are about a dozen operational throughout the world, delivers
efficiencies of 44-52 per cent and reduced CO2 emissions, which are about 40 per cent below the average for
global sub-critical coal burning power plants. The most efficient coal burning power plant in the world today is
the 411 MW number 3 unit (built in 1998) of the Nordjylland power plant (Vattenfall) in Denmark, which is an
ultra-supercritical steam generator that is run as a cogeneration plant delivering both steam heat and hot water to
its nearby districts. It has achieved efficiencies of 91 per cent. The standard size for these highly efficient plants
is in the range of 800- 1,000 MW, designed larger as a means of capturing economies of scale.
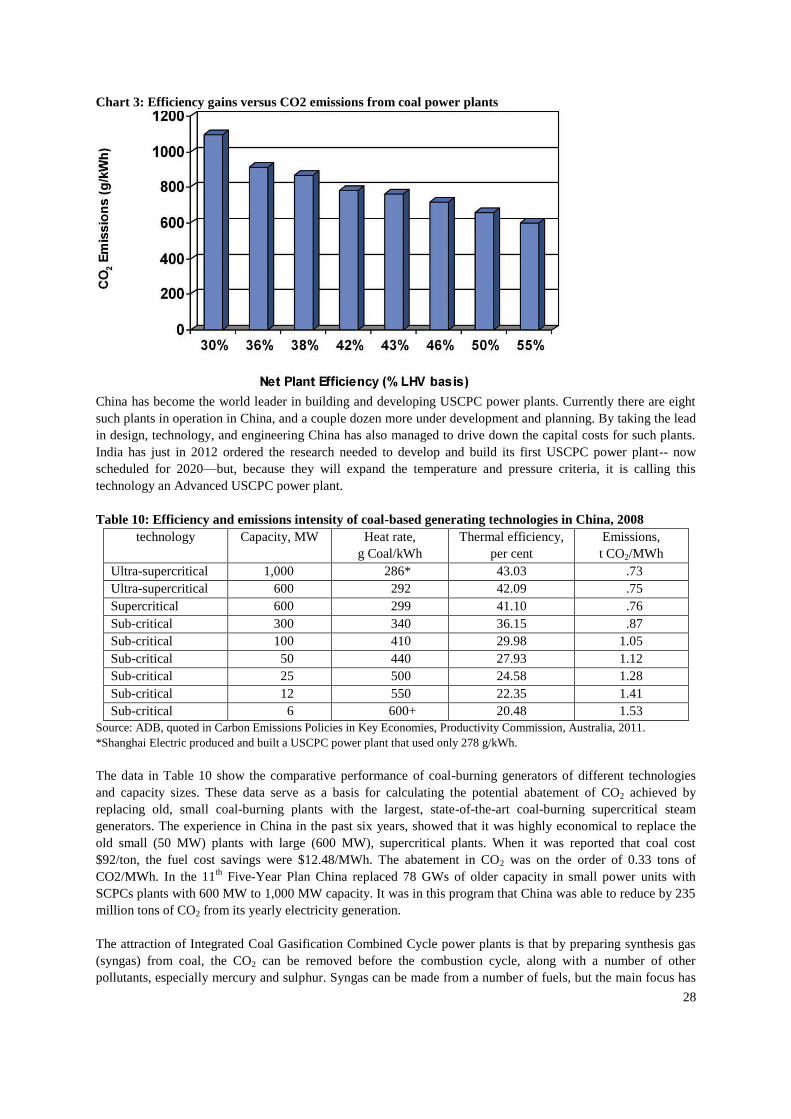
28
Chart 3: Efficiency gains versus CO2 emissions from coal power plants
China has become the world leader in building and developing USCPC power plants. Currently there are eight
such plants in operation in China, and a couple dozen more under development and planning. By taking the lead
in design, technology, and engineering China has also managed to drive down the capital costs for such plants.
India has just in 2012 ordered the research needed to develop and build its first USCPC power plant-- now
scheduled for 2020—but, because they will expand the temperature and pressure criteria, it is calling this
technology an Advanced USCPC power plant.
Table 10: Efficiency and emissions intensity of coal-based generating technologies in China, 2008
technology Capacity, MW Heat rate,
g Coal/kWh
Thermal efficiency,
per cent
Emissions,
t CO2/MWh
Ultra-supercritical 1,000 286* 43.03 .73
Ultra-supercritical 600 292 42.09 .75
Supercritical 600 299 41.10 .76
Sub-critical 300 340 36.15 .87
Sub-critical 100 410 29.98 1.05
Sub-critical 50 440 27.93 1.12
Sub-critical 25 500 24.58 1.28
Sub-critical 12 550 22.35 1.41
Sub-critical 6 600+ 20.48 1.53
Source: ADB, quoted in Carbon Emissions Policies in Key Economies, Productivity Commission, Australia, 2011.
*Shanghai Electric produced and built a USCPC power plant that used only 278 g/kWh.
The data in Table 10 show the comparative performance of coal-burning generators of different technologies
and capacity sizes. These data serve as a basis for calculating the potential abatement of CO2 achieved by
replacing old, small coal-burning plants with the largest, state-of-the-art coal-burning supercritical steam
generators. The experience in China in the past six years, showed that it was highly economical to replace the
old small (50 MW) plants with large (600 MW), supercritical plants. When it was reported that coal cost
$92/ton, the fuel cost savings were $12.48/MWh. The abatement in CO2 was on the order of 0.33 tons of
CO2/MWh. In the 11th
Five-Year Plan China replaced 78 GWs of older capacity in small power units with
SCPCs plants with 600 MW to 1,000 MW capacity. It was in this program that China was able to reduce by 235
million tons of CO2 from its yearly electricity generation.
The attraction of Integrated Coal Gasification Combined Cycle power plants is that by preparing synthesis gas
(syngas) from coal, the CO2 can be removed before the combustion cycle, along with a number of other
pollutants, especially mercury and sulphur. Syngas can be made from a number of fuels, but the main focus has
29
been on coal. After the syngas is prepared and purified it becomes the fuel stock for a gas turbine with a
combined cycle steam turbine for the exhaust heat.
Initial enthusiasm for IGCC technologies has faded in the past decade as a number of research and
demonstration projects have run into serious problems including high capital and operating costs, inconsistent
quality of input coal, cost overruns, and low efficiencies. So the technology still has not achieved a commercial
status for investors. The technology in pilot operation has been able to achieve 42 per cent efficiency. The only
profitable plant, which has been in operation since 1993, is the NUON owned plant in Buggenum, Netherlands,
which can convert biomass as well as coal to syngas. A number of small Italian IGCC plants use refined oil
products and have been operational for a long while.
Nevertheless, there are still a number of initiatives to build new high temperature and pressure IGCC plants.
Both India and China have committed to building scale demonstration plants. China’s GreenGen project in
Tianjin is a commercial scale plant under construction (near completion), while research is still being conducted
by India. China’s GreenGen project also aims to demonstrate the commercial feasibility of carbon capture and
storage.
These advanced fossil fuel technologies have been developed along with the development of specialized steel
alloys and engineering breakthroughs that can safely accommodate the much higher temperatures and pressures
which delivery the higher efficiencies. This research has been intensive throughout the past twenty years and has
engaged the full efforts of the world’s leading power engineering companies, has launched materials research,
and has garnered much government support in the developed world. In our Group of Nine Eurasian countries,
most of these design and engineering capabilities, equipment building, advanced materials, and construction
facilities are simply not available. Out of the Group, only over the past decade has China developed the design
and engineering capabilities through its own research and development efforts along with contributions of
technologies from leading Western power engineering firms such as Hitachi, Alstom, and Mitsubishi Heavy
Industries (MHI). China was an early convert to building SCPC power plants and has been building them at a
rapid rate, and recently been building USCPC power plants. India, meanwhile, has recognized its deficiencies in
the engineering and construction of these advanced power technologies, and, in the past few years, its
conventional power engineering firms have begun acquiring the capabilities to build the new technologies by
acquiring the technologies or by joint ventures with the established Western power engineering firms. For the
other countries, without the engineering and technical capacity, the equipment and materials needed to build
these new advanced fossil fuel electricity technologies will have to be imported by the investor.
As is typical with new and innovative advanced designs and technologies, there are still very few firms that have
the expertise, experience and know-how to produce them, and usually these are the firms that have lead the
research and development of these technologies. In the industrial heavy duty gas turbines which run the
combined cycle or cogeneration plants, the leading manufacturers globally are GE, Siemens, Alstom, and MHI.
They produce engines of the F through J classes that are 150 to 340 MW in capacity. These high temperatures,
high pressure gas turbines typically achieve 55-57 per cent efficiency. When combined with HRSG engines they
form the combined cycle block or set. The transfer of advanced gas turbine technology is only just beginning.
Shanghai Electric, Harbin Electric, Bharat Heavy Electrical have been the beneficiary of both licensing
agreements and joint ventures.
The manufacturers of the steam generators that go into SCPC and USCPC power plants include other specialty
engineering firms such as Babcock & Wilcox, Foster Wheeler, Burmeister & Wain Energy, Alstom, Toshiba,
and MHI. These firms have in turn transferred their technologies through investments or joint ventures in India
–Bharat Forge-Alstom, Toshiba JSW—and in China—Babcock &Wilcox Beijing, Shanghai Electric with MHI,
Wuhan Boiler Company with Alstom, and Harbin Electric Power Corporation with GE.
These cases of technology transfer have led to the situation where the Chinese and Indian companies mentioned
above not only manufacture and construct the high tech equipment for domestic power plant construction, they
are also increasingly competing for engineering, procurement and construction (EPC) contracts for new power
30
plants. Shanghai Electric, for example, one of the world’s leading producers of ultra-supercritical steam
generating units, provided the equipment and EPC work for a new SCPC plant in western India.
In addition to advanced fossil fuel combustion technologies, there are also new advanced technologies for the
exploration, production, or synthesis of advanced fossil fuels which then can go into cleaner combustion
generators. Often the end product of the exploration and extraction process is not an advanced fossil fuel as
such, but is the same as conventional fuels: shale gas and methane extracted from coal seams are usually
identical to conventional natural gas. Underground coal gasification, however, produces a new fuel altogether,
syngas. It too goes into specialized power combustion units, but the carbon has been already extracted from the
syngas so it is a clean fuel. Such advanced fossil fuels or advanced production technologies include:
Liquefied natural gas (LNG) allows for easier and cheaper transport over long distances of natural gas
which would otherwise not have a market.
Coalbed Methane (cbm) – methane is pure natural gas but it is a hazardous and waste product of coal
mining. Extracting this methane from large coal seams or coalbeds can often be of commercial quantities
and this “unconventional” natural gas can be used exactly as gas is. The advanced technology of this
fossil fuel is in the specialized methods of extracting the gas from the coal beds or underground coal
mines.
Shale gas—this is also natural gas but in recent decades technologies have been developed to extract it
from huge shale beds which are found on almost every continent. This is also a gas that is found and
produced by the same processes as oil and gas exploration and development and oil and gas companies
dominate its production.
Coal to liquids, coal to gas technologies—these are advanced technologies but they are not new. They
were developed in Germany during the Second World War and later in South Africa where there were
abundant coal resources but oil and natural gas imports were embargoed, so the coal was chemically
converted into liquid or gaseous fuels. There is underground coal gasification which produces syngas for
fuelling electricity generation, or coal to liquids which produce a syn-diesel for transport.
Of all of these advanced technologies only shale gas and LNG appear to be of the scale that has significant
climate change mitigation effect. As much as shale gas and LNG can displace coal in electricity generation, it
will reduce emissions.
31
Chapter V: Electricity demand growth and plans for the future
A country’s economic growth is directly underpinned by its growth in electricity output. Planners in China and
India have both forecast that electricity capacity needs to grow by 8.5-9.5 per cent per year and 8.0 per cent per
year, respectively, in order to support the planned annual growth in GDP of 10 per cent and 8 per cent in the
coming five years. Between 2010 and 2012—a period when Chinese planners were actively trying to slow the
economy—growth in electricity demand was about 7 per cent a year reaching a new high level of consumption
of 4.7 Petawatt hours (1,000 billion kWh). Demand already for electricity in both countries is greater than
production. In China, there was an implied deficit of 30 GWh of power in 2011, and it is estimated to be 40
GWh this year which means supply and demand are virtually balanced, but many regions of the country are
supply constrained or under-supplied. In India, meanwhile, there has been a systemic deficit in electricity
supply of about 8 per cent a year over the past decade. Planners expect that 94 GW of new capacity will be
needed in the coming five years just to keep up with the growth in demand, but not to close the deficit.
Keeping up with such strong demand growth will mean a major investment in huge amounts of new generating
capacity. China expects that between 2011 and 2015, installed capacity will increase by 452 GW, or about 90
GW a year—a yearly amount greater than the total installed capacity of the U.K or in one year equivalent to the
total projected capacity additions in India’s current Five-Year plan. Continuing the program started in the 11th
Five-Year plan, however, China will be trying to dramatically change the composition of its electricity
generation by source; aiming both to reduce energy intensity and CO2 emissions per unit of GDP and per kWh.
Still the forecast capital investment needed is put at around $445 billion. Although these are huge sums, there
does not appear to be any anxiety about financing such a huge construction program.
In India the outlook is rather more daunting. To meet its targets of nearly 8 per cent a year capacity growth,
India will have to add 94 GW of net new capacity by 2017 with an expected investment cost of $265 billion. But
this target set in the current (12th
) Five-Year plan is actually 76 GW of new projects and 19 GW of unachieved
projects being carried over from the 11th
Five-Year plan. Expectations are that in this ambitious new plan only
49 GW of plant will be completed by 2017. The financing of this very large program are straining India’s
capacity. Yet still this new power capacity will not satisfy pent-up and unmet demand. It is estimated that
around 30 per cent of Indians are without access to electricity.
To understand the relationship between demand growth for energy (or electricity) and the overall growth of the
economy (GDP), it is useful to look at the energy intensity of a country. This is an indirect measure of the
energy efficiency of the economy; that is, the measure of how much energy input is needed to produce a unit of
GDP. It varies over time depending on the stage of a country’s economic development, and over space
(countries in temperate climates tend to use less energy per unit of GDP than those in very cold or extremely hot
climates). Furthermore, countries with a high level of heavy industry will have higher energy intensities than
rural, agrarian or services based economies, so that their energy intensities will increase as they adopt
industrialization. But as countries adopt more energy efficiency technologies and energy conservation measures
their energy intensity tends to fall (as it has in the US over the past 20 years).
Another measure which can illuminate the future demand growth for electricity (or energy) is the absolute
number which measures per capita consumption of electricity in country. It is reasonable that as a country
develops its economy it will need to supply more energy to its citizens to raise their standards of living. In this
regard countries with very large populations have much further to go to deliver economic growth: China and
India may have moved far up the development scale in recent decades, but they still have very low consumption
of energy per capita.
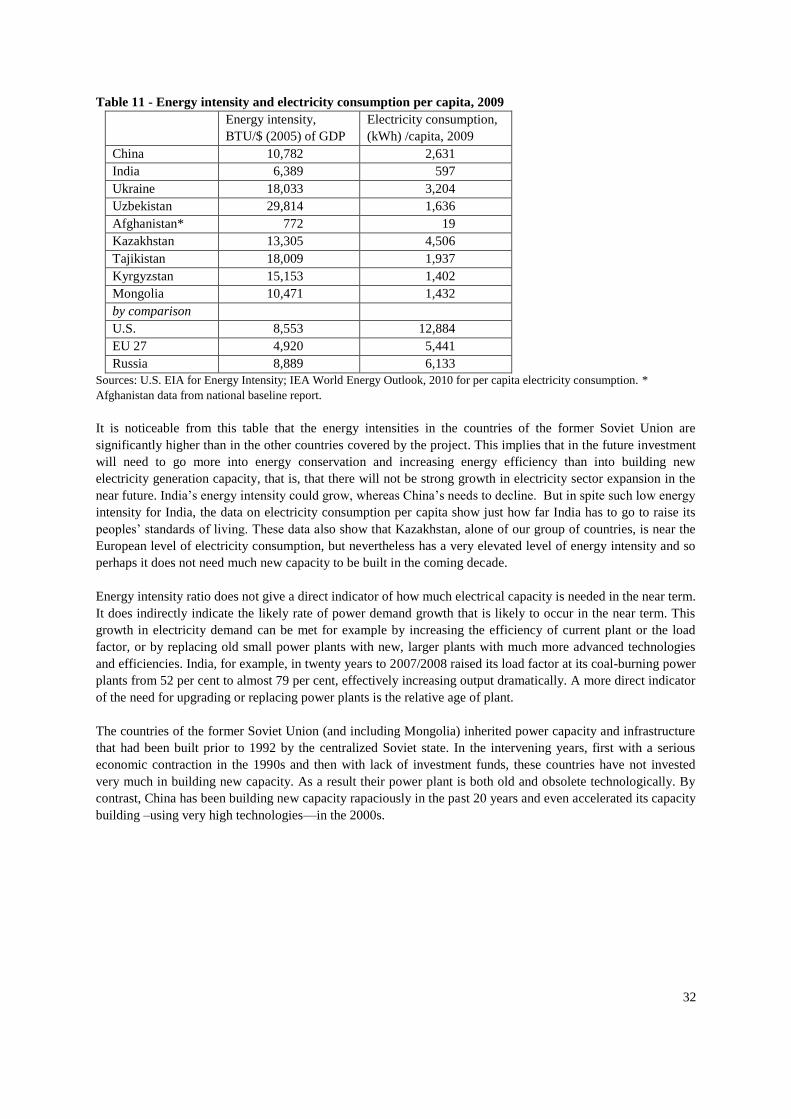
32
Table 11 - Energy intensity and electricity consumption per capita, 2009
Energy intensity,
BTU/$ (2005) of GDP
Electricity consumption,
(kWh) /capita, 2009
China 10,782 2,631
India 6,389 597
Ukraine 18,033 3,204
Uzbekistan 29,814 1,636
Afghanistan* 772 19
Kazakhstan 13,305 4,506
Tajikistan 18,009 1,937
Kyrgyzstan 15,153 1,402
Mongolia 10,471 1,432
by comparison
U.S. 8,553 12,884
EU 27 4,920 5,441
Russia 8,889 6,133
Sources: U.S. EIA for Energy Intensity; IEA World Energy Outlook, 2010 for per capita electricity consumption. *
Afghanistan data from national baseline report.
It is noticeable from this table that the energy intensities in the countries of the former Soviet Union are
significantly higher than in the other countries covered by the project. This implies that in the future investment
will need to go more into energy conservation and increasing energy efficiency than into building new
electricity generation capacity, that is, that there will not be strong growth in electricity sector expansion in the
near future. India’s energy intensity could grow, whereas China’s needs to decline. But in spite such low energy
intensity for India, the data on electricity consumption per capita show just how far India has to go to raise its
peoples’ standards of living. These data also show that Kazakhstan, alone of our group of countries, is near the
European level of electricity consumption, but nevertheless has a very elevated level of energy intensity and so
perhaps it does not need much new capacity to be built in the coming decade.
Energy intensity ratio does not give a direct indicator of how much electrical capacity is needed in the near term.
It does indirectly indicate the likely rate of power demand growth that is likely to occur in the near term. This
growth in electricity demand can be met for example by increasing the efficiency of current plant or the load
factor, or by replacing old small power plants with new, larger plants with much more advanced technologies
and efficiencies. India, for example, in twenty years to 2007/2008 raised its load factor at its coal-burning power
plants from 52 per cent to almost 79 per cent, effectively increasing output dramatically. A more direct indicator
of the need for upgrading or replacing power plants is the relative age of plant.
The countries of the former Soviet Union (and including Mongolia) inherited power capacity and infrastructure
that had been built prior to 1992 by the centralized Soviet state. In the intervening years, first with a serious
economic contraction in the 1990s and then with lack of investment funds, these countries have not invested
very much in building new capacity. As a result their power plant is both old and obsolete technologically. By
contrast, China has been building new capacity rapaciously in the past 20 years and even accelerated its capacity
building –using very high technologies—in the 2000s.
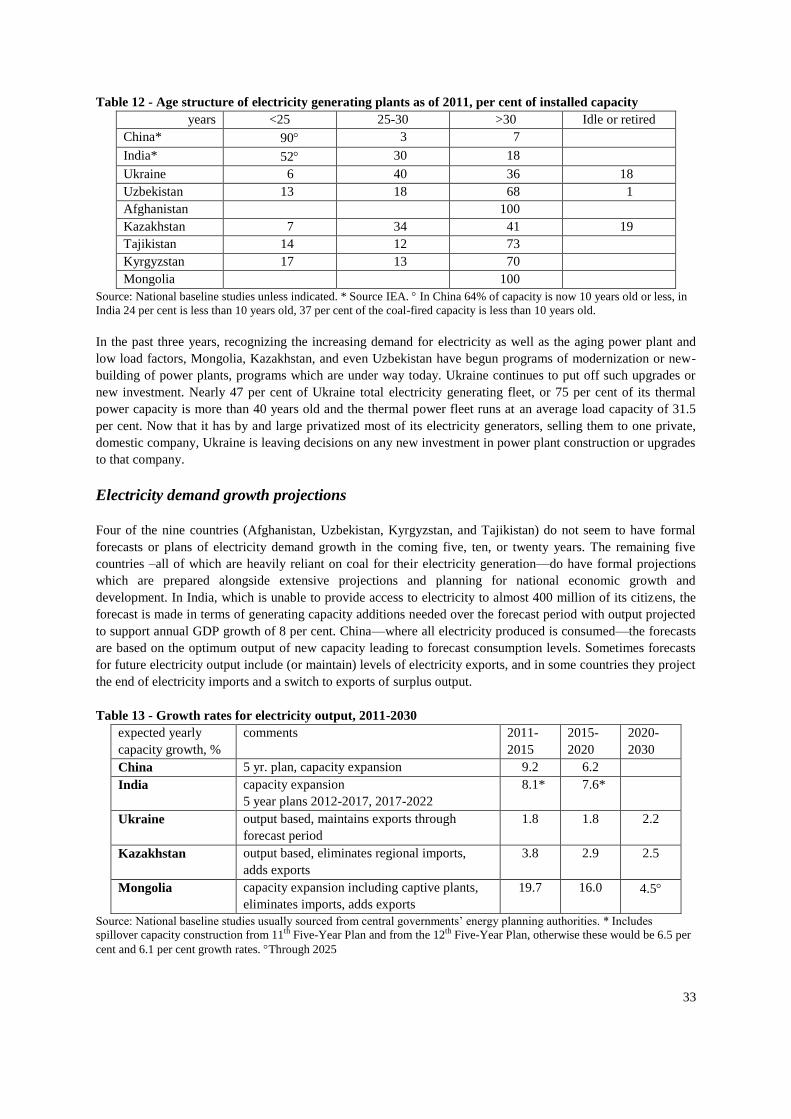
33
Table 12 - Age structure of electricity generating plants as of 2011, per cent of installed capacity
years <25 25-30 >30 Idle or retired
China* 90 3 7
India* 52 30 18
Ukraine 6 40 36 18
Uzbekistan 13 18 68 1
Afghanistan 100
Kazakhstan 7 34 41 19
Tajikistan 14 12 73
Kyrgyzstan 17 13 70
Mongolia 100
Source: National baseline studies unless indicated. * Source IEA. In China 64% of capacity is now 10 years old or less, in
India 24 per cent is less than 10 years old, 37 per cent of the coal-fired capacity is less than 10 years old.
In the past three years, recognizing the increasing demand for electricity as well as the aging power plant and
low load factors, Mongolia, Kazakhstan, and even Uzbekistan have begun programs of modernization or new-
building of power plants, programs which are under way today. Ukraine continues to put off such upgrades or
new investment. Nearly 47 per cent of Ukraine total electricity generating fleet, or 75 per cent of its thermal
power capacity is more than 40 years old and the thermal power fleet runs at an average load capacity of 31.5
per cent. Now that it has by and large privatized most of its electricity generators, selling them to one private,
domestic company, Ukraine is leaving decisions on any new investment in power plant construction or upgrades
to that company.
Electricity demand growth projections
Four of the nine countries (Afghanistan, Uzbekistan, Kyrgyzstan, and Tajikistan) do not seem to have formal
forecasts or plans of electricity demand growth in the coming five, ten, or twenty years. The remaining five
countries –all of which are heavily reliant on coal for their electricity generation—do have formal projections
which are prepared alongside extensive projections and planning for national economic growth and
development. In India, which is unable to provide access to electricity to almost 400 million of its citizens, the
forecast is made in terms of generating capacity additions needed over the forecast period with output projected
to support annual GDP growth of 8 per cent. China—where all electricity produced is consumed—the forecasts
are based on the optimum output of new capacity leading to forecast consumption levels. Sometimes forecasts
for future electricity output include (or maintain) levels of electricity exports, and in some countries they project
the end of electricity imports and a switch to exports of surplus output.
Table 13 - Growth rates for electricity output, 2011-2030
expected yearly
capacity growth, %
comments 2011-
2015
2015-
2020
2020-
2030
China 5 yr. plan, capacity expansion 9.2 6.2
India capacity expansion
5 year plans 2012-2017, 2017-2022
8.1* 7.6*
Ukraine output based, maintains exports through
forecast period
1.8 1.8 2.2
Kazakhstan output based, eliminates regional imports,
adds exports
3.8
2.9 2.5
Mongolia capacity expansion including captive plants,
eliminates imports, adds exports
19.7 16.0 4.5
Source: National baseline studies usually sourced from central governments’ energy planning authorities. * Includes
spillover capacity construction from 11th Five-Year Plan and from the 12th Five-Year Plan, otherwise these would be 6.5 per
cent and 6.1 per cent growth rates. Through 2025
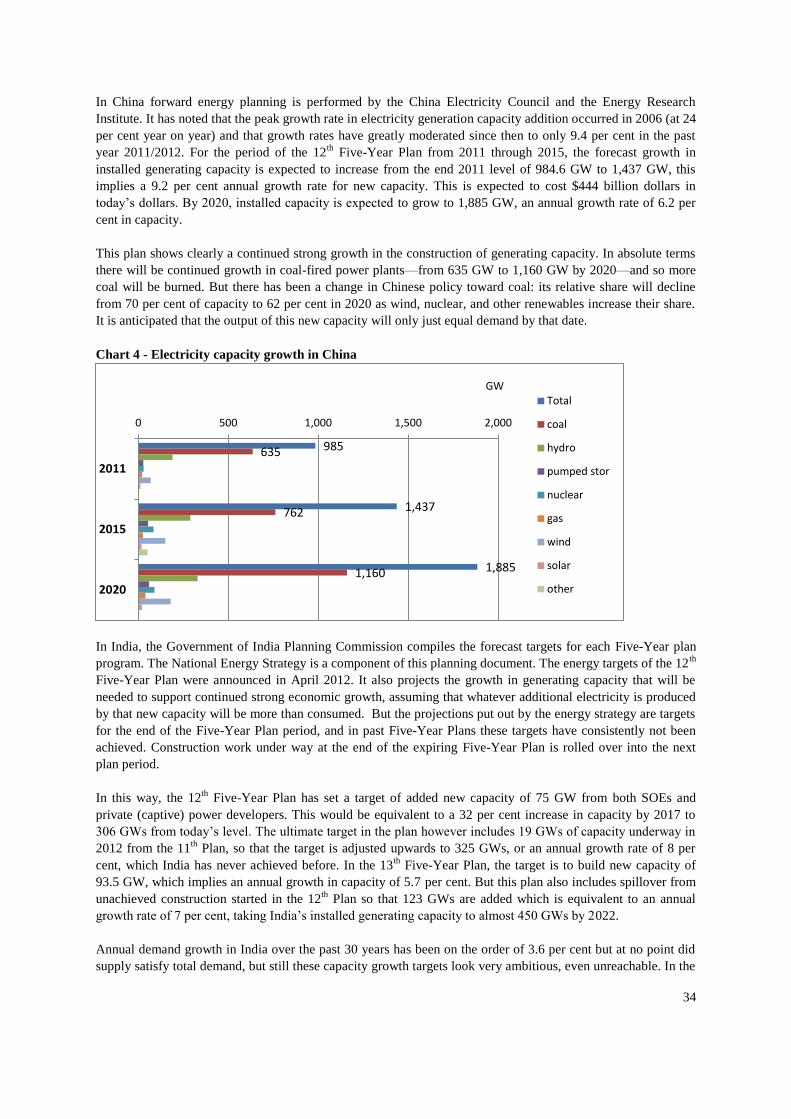
34
In China forward energy planning is performed by the China Electricity Council and the Energy Research
Institute. It has noted that the peak growth rate in electricity generation capacity addition occurred in 2006 (at 24
per cent year on year) and that growth rates have greatly moderated since then to only 9.4 per cent in the past
year 2011/2012. For the period of the 12th
Five-Year Plan from 2011 through 2015, the forecast growth in
installed generating capacity is expected to increase from the end 2011 level of 984.6 GW to 1,437 GW, this
implies a 9.2 per cent annual growth rate for new capacity. This is expected to cost $444 billion dollars in
today’s dollars. By 2020, installed capacity is expected to grow to 1,885 GW, an annual growth rate of 6.2 per
cent in capacity.
This plan shows clearly a continued strong growth in the construction of generating capacity. In absolute terms
there will be continued growth in coal-fired power plants—from 635 GW to 1,160 GW by 2020—and so more
coal will be burned. But there has been a change in Chinese policy toward coal: its relative share will decline
from 70 per cent of capacity to 62 per cent in 2020 as wind, nuclear, and other renewables increase their share.
It is anticipated that the output of this new capacity will only just equal demand by that date.
Chart 4 - Electricity capacity growth in China
In India, the Government of India Planning Commission compiles the forecast targets for each Five-Year plan
program. The National Energy Strategy is a component of this planning document. The energy targets of the 12th
Five-Year Plan were announced in April 2012. It also projects the growth in generating capacity that will be
needed to support continued strong economic growth, assuming that whatever additional electricity is produced
by that new capacity will be more than consumed. But the projections put out by the energy strategy are targets
for the end of the Five-Year Plan period, and in past Five-Year Plans these targets have consistently not been
achieved. Construction work under way at the end of the expiring Five-Year Plan is rolled over into the next
plan period.
In this way, the 12th
Five-Year Plan has set a target of added new capacity of 75 GW from both SOEs and
private (captive) power developers. This would be equivalent to a 32 per cent increase in capacity by 2017 to
306 GWs from today’s level. The ultimate target in the plan however includes 19 GWs of capacity underway in
2012 from the 11th
Plan, so that the target is adjusted upwards to 325 GWs, or an annual growth rate of 8 per
cent, which India has never achieved before. In the 13th
Five-Year Plan, the target is to build new capacity of
93.5 GW, which implies an annual growth in capacity of 5.7 per cent. But this plan also includes spillover from
unachieved construction started in the 12th
Plan so that 123 GWs are added which is equivalent to an annual
growth rate of 7 per cent, taking India’s installed generating capacity to almost 450 GWs by 2022.
Annual demand growth in India over the past 30 years has been on the order of 3.6 per cent but at no point did
supply satisfy total demand, but still these capacity growth targets look very ambitious, even unreachable. In the
985
1,437
1,885
635
762
1,160
0 500 1,000 1,500 2,000
2011
2015
2020
GW Total
coal
hydro
pumped stor
nuclear
gas
wind
solar
other
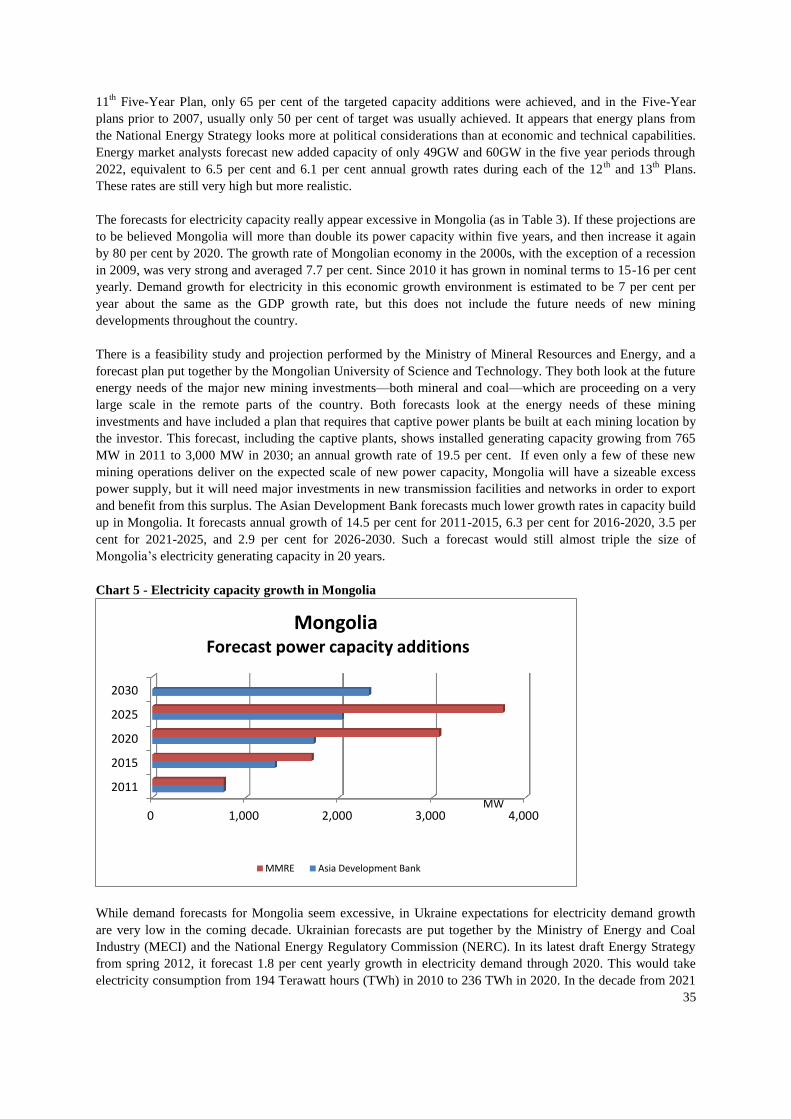
35
11th
Five-Year Plan, only 65 per cent of the targeted capacity additions were achieved, and in the Five-Year
plans prior to 2007, usually only 50 per cent of target was usually achieved. It appears that energy plans from
the National Energy Strategy looks more at political considerations than at economic and technical capabilities.
Energy market analysts forecast new added capacity of only 49GW and 60GW in the five year periods through
2022, equivalent to 6.5 per cent and 6.1 per cent annual growth rates during each of the 12th
and 13th
Plans.
These rates are still very high but more realistic.
The forecasts for electricity capacity really appear excessive in Mongolia (as in Table 3). If these projections are
to be believed Mongolia will more than double its power capacity within five years, and then increase it again
by 80 per cent by 2020. The growth rate of Mongolian economy in the 2000s, with the exception of a recession
in 2009, was very strong and averaged 7.7 per cent. Since 2010 it has grown in nominal terms to 15-16 per cent
yearly. Demand growth for electricity in this economic growth environment is estimated to be 7 per cent per
year about the same as the GDP growth rate, but this does not include the future needs of new mining
developments throughout the country.
There is a feasibility study and projection performed by the Ministry of Mineral Resources and Energy, and a
forecast plan put together by the Mongolian University of Science and Technology. They both look at the future
energy needs of the major new mining investments—both mineral and coal—which are proceeding on a very
large scale in the remote parts of the country. Both forecasts look at the energy needs of these mining
investments and have included a plan that requires that captive power plants be built at each mining location by
the investor. This forecast, including the captive plants, shows installed generating capacity growing from 765
MW in 2011 to 3,000 MW in 2030; an annual growth rate of 19.5 per cent. If even only a few of these new
mining operations deliver on the expected scale of new power capacity, Mongolia will have a sizeable excess
power supply, but it will need major investments in new transmission facilities and networks in order to export
and benefit from this surplus. The Asian Development Bank forecasts much lower growth rates in capacity build
up in Mongolia. It forecasts annual growth of 14.5 per cent for 2011-2015, 6.3 per cent for 2016-2020, 3.5 per
cent for 2021-2025, and 2.9 per cent for 2026-2030. Such a forecast would still almost triple the size of
Mongolia’s electricity generating capacity in 20 years.
Chart 5 - Electricity capacity growth in Mongolia
While demand forecasts for Mongolia seem excessive, in Ukraine expectations for electricity demand growth
are very low in the coming decade. Ukrainian forecasts are put together by the Ministry of Energy and Coal
Industry (MECI) and the National Energy Regulatory Commission (NERC). In its latest draft Energy Strategy
from spring 2012, it forecast 1.8 per cent yearly growth in electricity demand through 2020. This would take
electricity consumption from 194 Terawatt hours (TWh) in 2010 to 236 TWh in 2020. In the decade from 2021
0 1,000 2,000 3,000 4,000
2011
2015
2020
2025
2030
MW
Mongolia Forecast power capacity additions
MMRE Asia Development Bank
36
to 2030, growth is forecast to be somewhat stronger, at 2.2 per cent per year. This forecasts electricity
availability of 282 TWh, which includes 8 per cent losses and 2 per cent exports.
This growth in electricity output in Ukraine is expected to come from a decreasing share of coal based capacity
between 2011 and 2030. The decline in coal burning capacity will be replaced by increased capacity of nuclear
power generation, from 13.8 GW to 17.8 GW, as well as a huge relative increase in renewable energy sources.
In Kazakhstan, it is the Ministry of Industry and New Technologies which is responsible for drafting future
development plans and forecasting demand growth for the power industry. It has prepared a detailed short term
forecast for demand growth in the Development Program for the Electricity, and a more generalized program for
developing the energy industry in all its sub-sectors through 2030. Kazakhstan from 1990 to 1999 had a secular
decline in economic activity, GDP, and electricity consumption, the latter which fell from its historic high of
104.7 TWh to a low point of 50.7 TWh. This partly reflected a much overdue reduction of Kazakhstan’s very
high energy intensity and general inefficient use of energy. Since that low point consumption of electricity,
demand has grown back to 84 TWh in 2010 primarily driven by strong economic growth in the first decade of
the century which averaged over 7 per cent a year until the financial crisis in 2008-2010. Economic growth has
returned and forecasts now are for moderate electricity demand growth to 2014 when the expected consumption
will reach 96 TWh. Current projections show the country recovering to its electricity consumption high point
only in 2016-2018. By 2030, with less than 3 per cent annual demand growth over the 15 years from 2015,
consumption is forecast to 144.7 TWh.
Policy and plans for future development of the thermal electricity sector using advanced
fossil fuel technologies
From the national baseline studies it appears that only six of the nine countries have put in place policies and
development plans for their thermal power sectors that could possibly use advanced fossil fuels as a means of
mitigating CO2 emissions. The other three—Afghanistan, Tajikistan, and Kyrgyzstan—have development plans
that reflect their relative poverty of fossil fuel resources and abundance of hydropower resources. Of the
remaining six, only Uzbekistan primarily uses gas to fuel its power plants.
Uzbekistan
We have the least information about Uzbekistan’s policies and plans for further electricity sector development.
A cornerstone of the energy policy of Uzbekistan is fuel self-sufficiency; it also wants to maintain its role as an
energy exporter. It currently exports power to Afghanistan and is looking to further export to Pakistan. There
does not appear to be a specific policy to reduce CO2 emissions, although there are general statements
concerning pollution reduction.
The Uzbek Power Engineering Development program was formulated in 2006 and had initial targets of $1
billion of new investment to upgrade the electricity sector. A new program with a planned budget of $3.4
billion, part of the larger industrial development program, was announced in 2011. The original targets were to
upgrade and replace power units in three power plants at Navoi, Tashkent, and Mubarek in Qashqardaryo with
more advanced gas combined cycle turbines. To date the Navoi project is nearly finishing and should be
commissioned shortly. It used Mitsubishi Heavy Industries gas turbines with a capacity of 478MWs and was
engineered by a Turkish-Spanish joint venture, at a cost of $460 million. The Tashkent thermal power plant,
which is more than 40 years old, has re-launched a program to replace 370 MW of capacity with advanced
combined cycle gas turbines. The cost is estimated at $468 million which is being supported by a loan from the
Japanese development bank.
As part of the new program, there is a plan to increase coal’s share of thermal electricity generation from 4 per
cent to 12 per cent. This targets the conversion of five units of gas powered plant at Novo Angren to a coal
burning plant at a cost of about $50 million. This will be supported by Chinese Exim Bank. There is no
37
indication what technology will be employed in these new units. This is a step backwards in terms of energy
efficiency and CO2 emissions.
Mongolia
Like Uzbekistan, Mongolia is primarily a centrally-planned, command economy, but it has taken much greater
steps and reforms toward establishing a more market friendly economy. Still the electricity sector is state owned
and controlled. It has adopted a number of key policy priorities for the coming decade. Among these are: energy
self-sufficiency, new electricity generation capacity needed for the major new mining complexes to be built,
financed, and operated by the mining developer, introduction of foreign investment in the electricity sector,
developing the sector to be financially sustainable, development of renewable non-fossil fuel resources, and the
reduction of emissions of greenhouse gases and local pollutants from power plants. Energy self-sufficiency and
independence mean complete reliance on coal as the source of electricity in the future. Mongolia is a participant
in the Kyoto Protocol, but it has not specifically required power plants as policy to convert to specific advanced
coal combustion technologies, such as supercritical steam generators, as a means of reducing CO2 emissions.
Mongolia’s development plan for generating capacity is founded on two different approaches: one is to offer
concessions to build new combined heat and power plants near urban areas; the other is to require foreign coal
and mineral miners/developers to build and finance “captive” power plants primarily for their own needs. The
specific mining projects with planned captive power plants are:
Chandgana coal mine developer Prophecy Coal of Canada projected size 300-600 MW
Tsaidam nuur coal mine developer Burkhan Khaldun Group of Mongolia 600 MW
Mogoingol coal mine developer Mogoin Gol JSC of Mongolia 43 MW
Tavan Tolgoi coal mine developer Shenhua of China with international consortium 300 MW
Erdenetsogt coal mine developer Mangreat Group of Hong Kong 600 MW
Shivee Ovoo coal mine developer Erdenet Mongolia (SOE) 600 up to 4,200 MW
Oyu Tolgoi copper mine developer Rio Tinto of Australia 300 MW
Not all of these power projects have been approved and it is not clear that the mine developer must finance
them. Some of this new capacity will be competing with that of other mines, particularly in exporting the
surplus. But with this plan Mongolia’s electricity generating capacity would increase by more than 2.5-3.5
times, and there is no plan at the moment of how to connect the surplus from this huge potential electricity
output to the national grid (meaning the Central Electric System) or how to transmit electricity to the Chinese
grid. All of these projected power projects are seeking equity investors and financing. The developers have
claimed that they will build advanced coal burning technologies, but specific characteristics are not known and
Mongolian authorities are not requiring SCPC or USCPC plants.
The two power plants in Ulaan Bator and Dornod are both being offered by concession as build-operate-transfer
investments. The concession for CHP5 in Ulaan Bator has been preliminarily awarded to a foreign consortium
of Japanese, Korean, and French companies. The initial plant is targeted to be a 450MW coal burning plant with
the possibility of being expanded to 820 MW. While it was not specifically required to be a SCPC plant, the
operating characteristics desired by the Mongolian authorities (efficiency above 40 per cent for the electricity)
suggest a SCPC technology. It is reported that the proposal by the foreign consortium is to build 3 circulating
fluidized bed boilers of 150 MW each. The Dornod CHP plant, in the far east of the country, is a smaller 100
MW plant. A short-list of bidders for the concession was released in late 2011. China’s Harbin Electric was on
the short-list. As the size of the plant is small it will most probably not be an advanced coal burning clean
technology. It is hoped that both of these CHP projects will be completed by 2016, however it appears that
Mongolian authorities are having trouble advancing the awarding and inauguration of the programs.
It appears that Mongolia has laid out plans that are far in excess of demand, even including the incremental new
demand for electricity from the major mining investments. This suggests that the country will have difficulty
38
financing all this surplus electricity, especially as all this new capacity will require tremendous investment in
new transmission and distribution lines to connect the three network systems with the remote outlying mining
centres. This new projected investment in coal-fired plant also will greatly increase Mongolia’s CO2, and it
appears likely will not reduce relative CO2 emissions from the total electricity generating fleet.
Ukraine
Ukraine’s policies for the electricity industry are mainly concerned with propping up an old and inefficient fleet
of power plants for another decade while at the same time assuring the delivery of sufficient electricity supplies
to its people. This policy outlook mainly reflects the reality of a lack of capital for new investment and a system
that does not pay the full cost of energy. Ukraine is committed to nuclear power and coal burning as the
foundation of its power generation, primarily because it cannot afford the imports of Russian gas, and this
makes its politically vulnerable to Russia. The shortage of investment capital however makes the conditions of
the industry worse—C02 emissions from thermal plants are greater than 1,000 grams per kWh due primarily to
low efficiency and low load capacity due in turn to old plant and obsolete technologies.
The current policy recognizes these shortcomings: its projections are that more than 30 per cent of total capacity
must be modernized and upgraded by 2020 and new capacity amounting to 21 per cent or 11 GW must be built
in the period 2021-2030. This will be accomplished by retrofitting with more up to date technologies 14 GW of
thermal power plants, replacing 11 GWs of thermal power plants, building 4 GW of new nuclear capacity, and
retrofitting and modernizing 5.5 GW of hydropower capacity. In other words fossil fuel capacity relative to
clean renewable sources will decline in the coming 20 years. Planning documents estimate that the costs will be
about Euros 74 billion ($95 billion in today’s dollars) but they cannot see where this capital will come from. So
the new investments especially in clean coal technologies are put off until after 2020.
The priority policy until 2012 is to install flue gas scrubbers to reduce pollutants and particulates. But still this is
anticipated to total only $1.2 billion in the remaining years of this decade. A secondary priority is the
advancement of renewable energy resources. There are incentives to investors in wind, solar, and biomass
energy, but the authorities are looking primarily to foreign investors to import and operate those technologies.
Finally, the national strategy recognizes that an implementation plan is needed for its treaty acceptance of the
Kyoto Protocol. This implementation plan is not expected before 2013; i.e. after scheduled elections in the later
part of 2012. The new strategy released earlier in 2012 highlighted the environmental concerns, but still the
government does not mandate the development of advanced fossil fuel technologies such as SCPC or USCPC
plants to replace the current fleet of obsolete electricity generation technologies.
None of these very limited objectives will be achieved without significant reform of the energy markets in
Ukraine and a move to market-determined electricity prices. (Indeed, it is the state control of energy prices that
remains its main instrument for implementing its energy policies.) At the end of the day, the Ukrainian
consumer does not pay the full cost of electricity or heating delivered. The state run tariff system and Single
Buyer Market system is filled with destructive cross subsidies, which move profits back and forth between
industrial consumers, generators, residential consumers, utilities, and coal mines. All of these subsidies are
determined by political considerations so they will be very difficult to dismantle. Politicians do not believe that
Ukrainians can pay the real cost of their energy so they provide heavy subsidies which contribute greatly to the
national debt.
Kazakhstan
The development plans for the electricity sector have been formulated out of the conclusions and targets of the
National Strategic Development Plan through 2020, that is, electricity needs and growth are viewed in
perspective of the amounts needed to support and enable a forecast level of continued strong economic growth.
Energy self-sufficiency and independence is an important policy priority but not the overriding one. Like the
electric systems of much of the other former Soviet states, Kazakhstan’s fleet of generators and its transmission
lines are old and running at low load factors; it is critical to update and replace this old infrastructure within the
39
coming decade in order to continue to reliably supply the growing needs of the country. The system is also
unbalanced and fragmented because of the large size of the country and the concentration of the coal resources
in the northeast and northern regions of Kazakhstan. For this, massive new investment is needed in connecting
ultra-high voltage transmission lines between the three networks of the country. Finally it is important to
diversify the energy mix to reduce the over-reliance on coal and to improve the environmental friendliness of
electricity generation. Use of new renewable resources is given a low priority; new investment in these
technologies as planned would take renewables to only 1 per cent of future power output.
There is no explicit policy directive to adopt SCPC or USCPC generating technologies, neither for new-built
power plants nor for modernizations of old coal burning plants although there are general policy goals of
achieving higher efficiencies and cleaner combustion. However, a new policy directive in 2012 was to be issued
which set tough new guidelines for emissions and efficiency for both new and rehabilitated coal and gas fired
boilers. How these will be implemented will need to be seen.
Additions to capacity additions have already been identified and started so that they can be brought into
operation by the first targeted planning period by end of 2014. The 300 MW Moinak hydropower project was
inaugurated earlier this year, as was the 87 MW gas turbine plant in Akshabulak, which reduces flared
associated gas from oil production in the Kyzylorda region. A small gas turbine CHP plant was commissioned
in Uralsk in Western Kazakhstan in 2010-2011. Some of the major projects have been delayed, however. The
large Balkhash thermal power plant with eventual capacity of 2,640 MW was finally launched late this year with
the new completion dates pushed back to 2017-2019.
Over the long term, through 2030, new generating capacity of up to 14 GW is forecast to be needed. The
forecast baseload capacity is identified as a new nuclear power generator, and a coal burning generator based on
the Turgai coal. Both of these large projects are contentious. The Turgai thermal power plant is very dependent
on the commitment to full scale development of the Turgai brown coal reserves, something which is still
speculative. The expansion of Ekibastuz GRES 2 units 3, 4, and 5, which is currently on-going, is expected to
add almost 2 GWs through two phases by 2019.
The main policy directive concerns the rehabilitation and upgrading of current power plants. This program
already started in 2006 and is on-going. It aims to provide effectively 7 GWs of new, more up-to-date
generating capacities at several of the Kazakhstan’s largest power plants.
Extension of Atyrau cogeneration plant, implementation period: 2006-2010.
Rehabilitation of units No. 8, 2,1 at Ekibastuz GRES-1, implementation period: 2010-2015;
Construction of unit No. 3 at Ekibastuz GRES-2, implementation period: 2009-2013;
Rehabilitation of units 6,5,7,8 at Aksu GRES, implementation period: through 2019;
Modernization of Shardary hydropower plant, implementation period: 2009-2015;
Rehabilitation and extension of Almaty cogeneration plant-2 (phase 3, boiler unit No. 8 and boiler room),
implementation period: 2009-2013.
The twenty year forecast for these programs, new construction and rehabilitation/modernization, is expected to
cost $34 billion. There will plenty of opportunities for outside investors to participate in financing these
programs.
China
The policy, planning, and development strategies are put together by the National Development and Reform
Commission (NDRC) using an integrated view of the economic development of all the sectors of energy and
supporting sectors (transport, industrial growth, transmission, engineering, construction, environmental control).
It divides its policies for development into priority categories: highest priority, permitted, restricted, prohibited
and ranks development projects in those categories. Since the energy projects have a long-life investment cycle,
40
the policy plans and projections that are normally enclosed in the Five-Year Plans periods are extended over 20
years into the future to see the full cost economics of projects and developments.
The 12th
Five Year Plan (2011-2015) starts with a commitment to maintain and further implement strategic
policies and targets set in the previous Five Year Plan. The main thrust of this commitment is to continue the
highest priority of energy conservation and energy savings measures. Energy self-sufficiency and independence
are no longer top priorities, and although coal is still slated as the main source of energy it is already recognized
that its share of energy supplied will continue to decline. Access to energy and continuing expansion of
electricity service in regions of the country which are energy poor are top priorities but there is a new sensitivity
to the need to deliver electricity and energy at a sustainable cost (that is the market cost of energy production
and delivery must be borne by the consumers). The other priority measures:
Carbon mitigation targets will be advanced and be made more rigorous, reduce the growth rate of GHG
emissions, continue to reduce energy intensity;
Large scale thermal power and nuclear projects will be built, investment in improved energy
infrastructure, accelerate hydropower construction
Further optimization of electricity supply and electric grid structures;
Greater commitment and investment in renewable energy
Develop research and science centres for domestic energy innovations
Enhance and reform the pricing system so that energy is properly used and consumers pay the full cost.
After cutting China’s energy intensity in the 11th
Five-Year Plan by 19 per cent from 2005 levels, the new plan
aims for an additional cut in energy intensity by 16 per cent from 2010 levels. Increasing efficiency will also be
joined by continuing reduction of targets for CO2 and GHG emissions. In the 12th
Five-Year Plan the target will
be to reduce CO2 per unit of GDP by 17 per cent from 2010 levels. China estimates that it cut out 1.46 billion
tons of CO2 emissions in the last plan period. SOx and NOx emissions will also be scheduled to be reduced by
8 per cent and 10 per cent respectively. The 12th
Five-Year Plan and those beyond aim to put a cap on primary
energy consumption; trying to limit primary energy consumption at 4.1 billion tons of coal equivalent (tce) in
2015, 5.0 billion tce in 2020, and 5.5 billion tce in 2030.
Specifically in electricity strategies there will be a higher importance put on developing and increasing the
contribution from non-fossil fuel electricity generation. This strategy aims over a 20 year period to greatly
increase the installed capacity of nuclear power, hydropower, and power from renewable resources. Currently
8.9 GWs of nuclear capacity are being built around China, and nearly 63 GW of new hydropower plants are
under construction or approved for construction, as part of the Five-Year Plan. All of these alternative sources in
the 12th
Five-Year Plan and beyond will take a larger share of electricity generation at the expense of coal’s
share. The combined share of renewables in generating capacity is targeted to reach 11.4 per cent by 2015, up
from 9 per cent. The long term plan for nuclear power is to increase its share from 0.9 per cent of capacity to
more than 4 per cent by 2020. This will be achieved by building new nuclear power capacity of 80 GWs by
2020, and another 120 GWs by 2030. Hydropower’s share of total capacity—although a strong building
program is planned adding 140 GWs by 2020—is expected to fall from its current share of 19.3 per cent to 17.5
per cent in 2020.
The turn away from high carbon intensity since 2006 is also pushing Chinese policy to plan for more gas-fired
generating stations, particular in the eastern seaboard cities. And this means a more liberal policy for importing
natural gas both by overland pipelines and by LNG. There is currently a flurry of building new LNG importing
facilities on the coastline of eastern China, and this will be followed by intensive building of large-scale gas-
fired combined cycle power plants near those LNG receiving stations. Foreign investors are involved in the
construction of new LNG receiving stations, and Chinese authorities are inviting foreign investors to assist in
building the large, advanced combined cycle gas turbine plants that will consume this LNG.
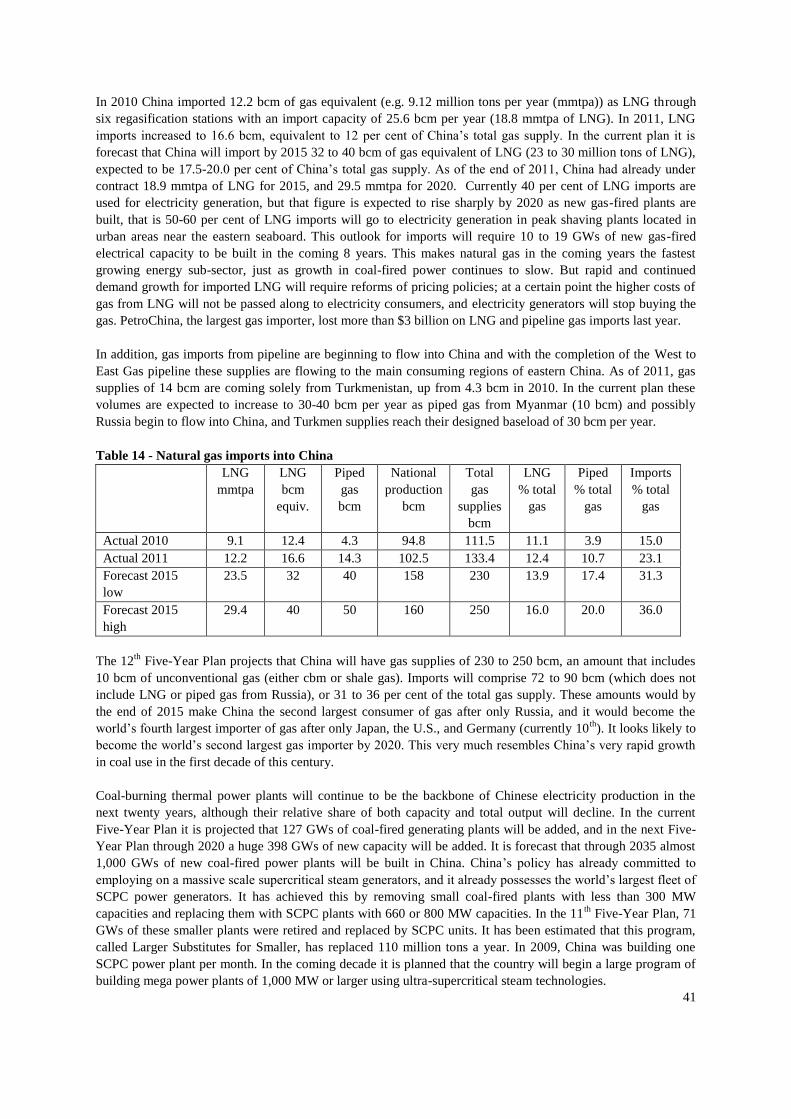
41
In 2010 China imported 12.2 bcm of gas equivalent (e.g. 9.12 million tons per year (mmtpa)) as LNG through
six regasification stations with an import capacity of 25.6 bcm per year (18.8 mmtpa of LNG). In 2011, LNG
imports increased to 16.6 bcm, equivalent to 12 per cent of China’s total gas supply. In the current plan it is
forecast that China will import by 2015 32 to 40 bcm of gas equivalent of LNG (23 to 30 million tons of LNG),
expected to be 17.5-20.0 per cent of China’s total gas supply. As of the end of 2011, China had already under
contract 18.9 mmtpa of LNG for 2015, and 29.5 mmtpa for 2020. Currently 40 per cent of LNG imports are
used for electricity generation, but that figure is expected to rise sharply by 2020 as new gas-fired plants are
built, that is 50-60 per cent of LNG imports will go to electricity generation in peak shaving plants located in
urban areas near the eastern seaboard. This outlook for imports will require 10 to 19 GWs of new gas-fired
electrical capacity to be built in the coming 8 years. This makes natural gas in the coming years the fastest
growing energy sub-sector, just as growth in coal-fired power continues to slow. But rapid and continued
demand growth for imported LNG will require reforms of pricing policies; at a certain point the higher costs of
gas from LNG will not be passed along to electricity consumers, and electricity generators will stop buying the
gas. PetroChina, the largest gas importer, lost more than $3 billion on LNG and pipeline gas imports last year.
In addition, gas imports from pipeline are beginning to flow into China and with the completion of the West to
East Gas pipeline these supplies are flowing to the main consuming regions of eastern China. As of 2011, gas
supplies of 14 bcm are coming solely from Turkmenistan, up from 4.3 bcm in 2010. In the current plan these
volumes are expected to increase to 30-40 bcm per year as piped gas from Myanmar (10 bcm) and possibly
Russia begin to flow into China, and Turkmen supplies reach their designed baseload of 30 bcm per year.
Table 14 - Natural gas imports into China
LNG
mmtpa
LNG
bcm
equiv.
Piped
gas
bcm
National
production
bcm
Total
gas
supplies
bcm
LNG
% total
gas
Piped
% total
gas
Imports
% total
gas
Actual 2010 9.1 12.4 4.3 94.8 111.5 11.1 3.9 15.0
Actual 2011 12.2 16.6 14.3 102.5 133.4 12.4 10.7 23.1
Forecast 2015
low
23.5 32 40 158 230 13.9 17.4 31.3
Forecast 2015
high
29.4 40 50 160 250 16.0 20.0 36.0
The 12th
Five-Year Plan projects that China will have gas supplies of 230 to 250 bcm, an amount that includes
10 bcm of unconventional gas (either cbm or shale gas). Imports will comprise 72 to 90 bcm (which does not
include LNG or piped gas from Russia), or 31 to 36 per cent of the total gas supply. These amounts would by
the end of 2015 make China the second largest consumer of gas after only Russia, and it would become the
world’s fourth largest importer of gas after only Japan, the U.S., and Germany (currently 10th
). It looks likely to
become the world’s second largest gas importer by 2020. This very much resembles China’s very rapid growth
in coal use in the first decade of this century.
Coal-burning thermal power plants will continue to be the backbone of Chinese electricity production in the
next twenty years, although their relative share of both capacity and total output will decline. In the current
Five-Year Plan it is projected that 127 GWs of coal-fired generating plants will be added, and in the next Five-
Year Plan through 2020 a huge 398 GWs of new capacity will be added. It is forecast that through 2035 almost
1,000 GWs of new coal-fired power plants will be built in China. China’s policy has already committed to
employing on a massive scale supercritical steam generators, and it already possesses the world’s largest fleet of
SCPC power generators. It has achieved this by removing small coal-fired plants with less than 300 MW
capacities and replacing them with SCPC plants with 660 or 800 MW capacities. In the 11th
Five-Year Plan, 71
GWs of these smaller plants were retired and replaced by SCPC units. It has been estimated that this program,
called Larger Substitutes for Smaller, has replaced 110 million tons a year. In 2009, China was building one
SCPC power plant per month. In the coming decade it is planned that the country will begin a large program of
building mega power plants of 1,000 MW or larger using ultra-supercritical steam technologies.
42
Ultra-supercritical power generation units have been added quickly since they were first built in China in 2006.
Shanghai Electric has built and installed more than 67 GWe of ultra-supercritical power units in the past six
years. While the forecast plan for installing USCPC power generators is not available, the totals are likely to be
a significant proportion (in excess of 60 per cent) of the nearly 400 GWs of new capacity to be added by 2020.
And these additions of high technologies are occurring while the retirement of China’s older and smaller,
subcritical coal-burning power plants will continue. This program of converting low tech, small capacity coal
plants with high tech, mega-sized plants does reduce CO2 emissions at an acceptable cost: the coal intensity has
fallen from 370 grams/kWh to an average of 333 grams/kWh (the average in the EU is 379g/kWh). The newest
USCPC technologies have achieved efficiencies of 282 g/kWh. This program of converting the coal-fired fleet
has already run a long way: today 75 per cent of China’s coal-fired fleet is already less than 20 years old and 80
per cent is more than 300 MWs in size. In order to reduce CO2 from the Chinese fleet beyond the current
replacement program, China will have to investigate how to retrofit carbon capture and storage (CCS) units onto
it operating units, while designing new units with CCS already built in.
While China remains committed to rolling out commercial IGCC technology through its large scale
demonstration project in Tianjin, this technology does not feature as a high priority target in the 12th
Five-Year
Plan.
India
The National Energy Strategy has evolved out of the 2006 Integrated Energy Strategy by the Indian Planning
Commission. The latest statement of this strategy has as its primary aim is a program that will meet the demand
for energy services in all sectors at competitive prices to deliver a sustained growth rate for the economy of 8
per cent through 2032. The 12th
Five-Year Plan, which started in April 2012, focuses on expansion of the
country’s electricity generating capacity. The strategy highlights that coal, because of its low cost advantage and
for domestic self-sufficiency reasons, will remain the dominant energy source for the next 20 years. This policy
requires a major reform of the coal industry because coal output from domestic mines will need to double by
2020. The strategy also raises the importance of increasing energy efficiency and lays out measures for reducing
CO2 and GHG emissions. These policies are continuations of the National Action Plan on Climate Change
which was issued in 2008 and is still being implemented.
The five-year target through 2017 is to add 75 GW of new capacity and complete roughly 19 GWs which were
started in the 11th
Five-Year Plan. Of this coal-fired capacity is expected to grow by 63.7 GWs. Large
hydropower projects are still given importance, but the implementation of a building program is expected to be
delayed as resistance in the country remains strong. Since the latest reform of the electricity generating industry
in 2003, the government has recognized that the industry needs to develop more on market related foundations.
This means that in effect the State can no longer dictate to the electricity companies or developers what they
shall develop. This reform also addressed the issue that there are problems with tariffs and cross subsidies, but
to date it has not taken measures which fully solve these issues.
The latest development plan recognizes the severe problems with the state-owned and run coal company and it
has accordingly liberalized access to imported coal for electricity companies. Most important for power
developers, the state has specifically committed to the adoption of clean coal technologies and has provided
incentives (in tariffs) for supercritical steam boilers and for ultra-supercritical steam boilers. It has provided a
target of 40 per cent of new coal-fired generators to be built in the Five-Year Plan should be SCPC. The
incentives (and dis-incentives for subcritical coal plants) are such that 100 per cent of new coal-fired capacity
has to be SCPC or USCPC in the 13th
Five-Year Plan. In 2010, India had no SCPC plants, now it already has 3
and has another 11 under development. The target is that India will have 50 GW of SCPC power plants by
2020. India has also committed to developing a domestic IGCC program (which admittedly will not be
completed until after the current plan period). A demonstration 200 MW IGCC plant is under construction at
Vijayawada.
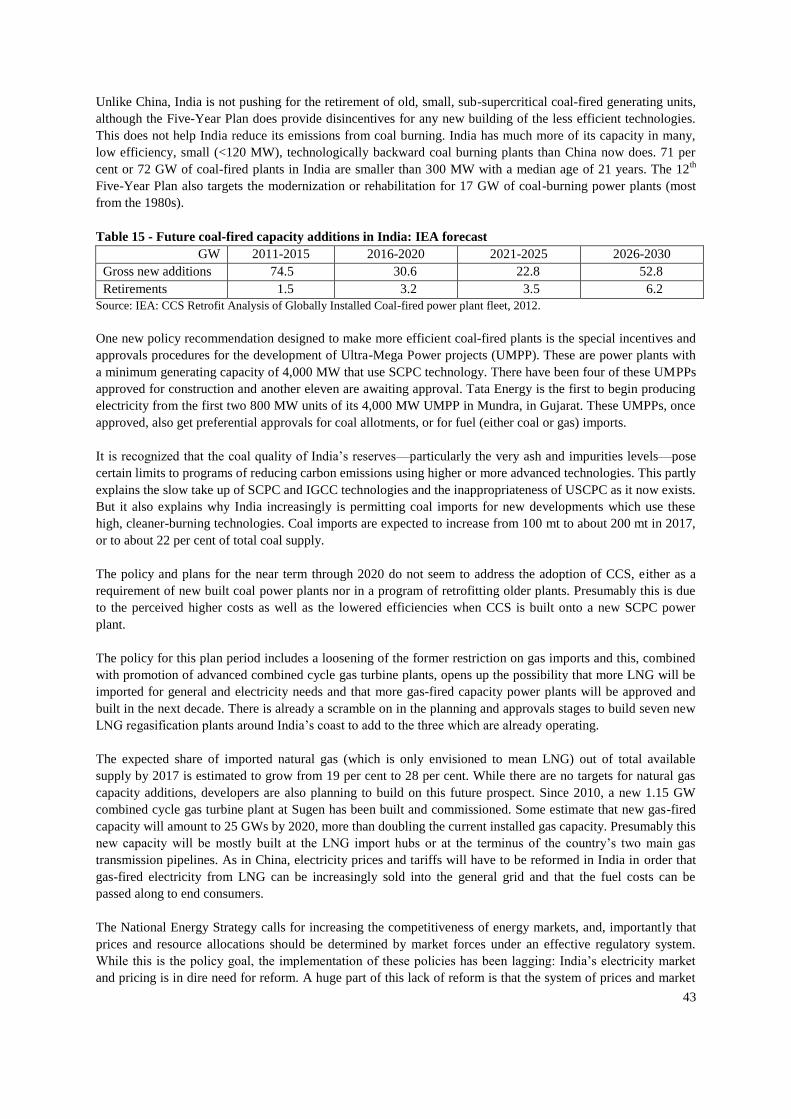
43
Unlike China, India is not pushing for the retirement of old, small, sub-supercritical coal-fired generating units,
although the Five-Year Plan does provide disincentives for any new building of the less efficient technologies.
This does not help India reduce its emissions from coal burning. India has much more of its capacity in many,
low efficiency, small (<120 MW), technologically backward coal burning plants than China now does. 71 per
cent or 72 GW of coal-fired plants in India are smaller than 300 MW with a median age of 21 years. The 12th
Five-Year Plan also targets the modernization or rehabilitation for 17 GW of coal-burning power plants (most
from the 1980s).
Table 15 - Future coal-fired capacity additions in India: IEA forecast
GW 2011-2015 2016-2020 2021-2025 2026-2030
Gross new additions 74.5 30.6 22.8 52.8
Retirements 1.5 3.2 3.5 6.2
Source: IEA: CCS Retrofit Analysis of Globally Installed Coal-fired power plant fleet, 2012.
One new policy recommendation designed to make more efficient coal-fired plants is the special incentives and
approvals procedures for the development of Ultra-Mega Power projects (UMPP). These are power plants with
a minimum generating capacity of 4,000 MW that use SCPC technology. There have been four of these UMPPs
approved for construction and another eleven are awaiting approval. Tata Energy is the first to begin producing
electricity from the first two 800 MW units of its 4,000 MW UMPP in Mundra, in Gujarat. These UMPPs, once
approved, also get preferential approvals for coal allotments, or for fuel (either coal or gas) imports.
It is recognized that the coal quality of India’s reserves—particularly the very ash and impurities levels—pose
certain limits to programs of reducing carbon emissions using higher or more advanced technologies. This partly
explains the slow take up of SCPC and IGCC technologies and the inappropriateness of USCPC as it now exists.
But it also explains why India increasingly is permitting coal imports for new developments which use these
high, cleaner-burning technologies. Coal imports are expected to increase from 100 mt to about 200 mt in 2017,
or to about 22 per cent of total coal supply.
The policy and plans for the near term through 2020 do not seem to address the adoption of CCS, either as a
requirement of new built coal power plants nor in a program of retrofitting older plants. Presumably this is due
to the perceived higher costs as well as the lowered efficiencies when CCS is built onto a new SCPC power
plant.
The policy for this plan period includes a loosening of the former restriction on gas imports and this, combined
with promotion of advanced combined cycle gas turbine plants, opens up the possibility that more LNG will be
imported for general and electricity needs and that more gas-fired capacity power plants will be approved and
built in the next decade. There is already a scramble on in the planning and approvals stages to build seven new
LNG regasification plants around India’s coast to add to the three which are already operating.
The expected share of imported natural gas (which is only envisioned to mean LNG) out of total available
supply by 2017 is estimated to grow from 19 per cent to 28 per cent. While there are no targets for natural gas
capacity additions, developers are also planning to build on this future prospect. Since 2010, a new 1.15 GW
combined cycle gas turbine plant at Sugen has been built and commissioned. Some estimate that new gas-fired
capacity will amount to 25 GWs by 2020, more than doubling the current installed gas capacity. Presumably this
new capacity will be mostly built at the LNG import hubs or at the terminus of the country’s two main gas
transmission pipelines. As in China, electricity prices and tariffs will have to be reformed in India in order that
gas-fired electricity from LNG can be increasingly sold into the general grid and that the fuel costs can be
passed along to end consumers.
The National Energy Strategy calls for increasing the competitiveness of energy markets, and, importantly that
prices and resource allocations should be determined by market forces under an effective regulatory system.
While this is the policy goal, the implementation of these policies has been lagging: India’s electricity market
and pricing is in dire need for reform. A huge part of this lack of reform is that the system of prices and market

44
functioning is administered not by the central Indian government but by the federal states, and thus pricing and
market functioning are politically manipulated at the local levels. Subsidies and price incentives are awarded for
local political gain, and can be changed or transferred with little economic analysis or justification again for
political ends. Electricity generating companies are often left footing the bill –huge and unpredictable losses
have been recording over the past ten years by many companies in almost all the regions of the country.
Probably very little reform will be accomplished in this area before Federal elections in 2014.
The difficulty of financing the planned program in this Five-Year Plan period is a problem that occupies much
of the strategy statement. It estimates that roughly $130 billion will be needed in new investment for the
electricity generation sector. Of this $75 billion will be needed for the investments in coal-based electricity
generation. The State Bank of India estimates this latter figure is more likely to be $110 billion. Over the next
ten years, through 2022, it is expected that $105 billion will be needed for investment in only the SCPC power
plants that are planned. Where these sources of investment capital are to be found is a serious difficulty for the
central government which is already coping with a huge national debt and budgetary deficits. It is foreseen that
50 per cent of the investment in generating capacity will probably come from the private sector.
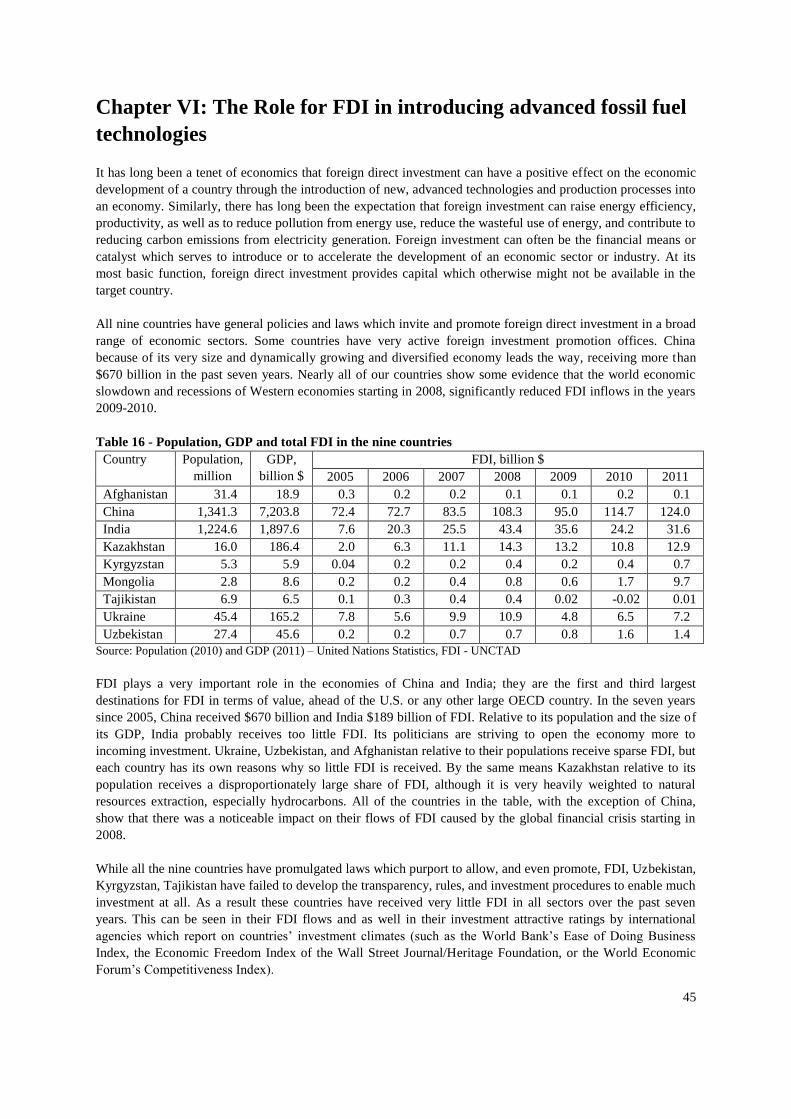
45
Chapter VI: The Role for FDI in introducing advanced fossil fuel
technologies
It has long been a tenet of economics that foreign direct investment can have a positive effect on the economic
development of a country through the introduction of new, advanced technologies and production processes into
an economy. Similarly, there has long been the expectation that foreign investment can raise energy efficiency,
productivity, as well as to reduce pollution from energy use, reduce the wasteful use of energy, and contribute to
reducing carbon emissions from electricity generation. Foreign investment can often be the financial means or
catalyst which serves to introduce or to accelerate the development of an economic sector or industry. At its
most basic function, foreign direct investment provides capital which otherwise might not be available in the
target country.
All nine countries have general policies and laws which invite and promote foreign direct investment in a broad
range of economic sectors. Some countries have very active foreign investment promotion offices. China
because of its very size and dynamically growing and diversified economy leads the way, receiving more than
$670 billion in the past seven years. Nearly all of our countries show some evidence that the world economic
slowdown and recessions of Western economies starting in 2008, significantly reduced FDI inflows in the years
2009-2010.
Table 16 - Population, GDP and total FDI in the nine countries
Country Population,
million
GDP,
billion $
FDI, billion $
2005 2006 2007 2008 2009 2010 2011
Afghanistan 31.4 18.9 0.3 0.2 0.2 0.1 0.1 0.2 0.1
China 1,341.3 7,203.8 72.4 72.7 83.5 108.3 95.0 114.7 124.0
India 1,224.6 1,897.6 7.6 20.3 25.5 43.4 35.6 24.2 31.6
Kazakhstan 16.0 186.4 2.0 6.3 11.1 14.3 13.2 10.8 12.9
Kyrgyzstan 5.3 5.9 0.04 0.2 0.2 0.4 0.2 0.4 0.7
Mongolia 2.8 8.6 0.2 0.2 0.4 0.8 0.6 1.7 9.7
Tajikistan 6.9 6.5 0.1 0.3 0.4 0.4 0.02 -0.02 0.01
Ukraine 45.4 165.2 7.8 5.6 9.9 10.9 4.8 6.5 7.2
Uzbekistan 27.4 45.6 0.2 0.2 0.7 0.7 0.8 1.6 1.4
Source: Population (2010) and GDP (2011) – United Nations Statistics, FDI - UNCTAD
FDI plays a very important role in the economies of China and India; they are the first and third largest
destinations for FDI in terms of value, ahead of the U.S. or any other large OECD country. In the seven years
since 2005, China received $670 billion and India $189 billion of FDI. Relative to its population and the size of
its GDP, India probably receives too little FDI. Its politicians are striving to open the economy more to
incoming investment. Ukraine, Uzbekistan, and Afghanistan relative to their populations receive sparse FDI, but
each country has its own reasons why so little FDI is received. By the same means Kazakhstan relative to its
population receives a disproportionately large share of FDI, although it is very heavily weighted to natural
resources extraction, especially hydrocarbons. All of the countries in the table, with the exception of China,
show that there was a noticeable impact on their flows of FDI caused by the global financial crisis starting in
2008.
While all the nine countries have promulgated laws which purport to allow, and even promote, FDI, Uzbekistan,
Kyrgyzstan, Tajikistan have failed to develop the transparency, rules, and investment procedures to enable much
investment at all. As a result these countries have received very little FDI in all sectors over the past seven
years. This can be seen in their FDI flows and as well in their investment attractive ratings by international
agencies which report on countries’ investment climates (such as the World Bank’s Ease of Doing Business
Index, the Economic Freedom Index of the Wall Street Journal/Heritage Foundation, or the World Economic
Forum’s Competitiveness Index).
46
Policies and incentives to permit and encourage foreign direct investment specific to the electricity industry do
not exist in Ukraine, Uzbekistan, Afghanistan, Kyrgyzstan, and Tajikistan, where rules and legislation address
foreign investments exist in a more general manner that would apply to any private investor. Nevertheless there
have been foreign investments made in the electricity sectors in Ukraine and Tajikistan. We estimate that
foreign investment in their countries in the electricity sector since 1992, including hydropower, has been in
order of $420 million for Ukraine and $280 million for Tajikistan. Uzbekistan claims there has been $200
million in FDI for the electricity sector, but on closer inspection it all appears to be foreign assistance lending.
Foreign investments made into the electricity sectors of Afghanistan and even Tajikistan (in its hydropower
projects) have been more in the form of foreign development aid grants or loans from developmental banks or
foreign governments, which are not considered FDI.
Foreign investments have been made into the electricity generation sectors of the remaining four countries
which have specific laws and directives for enabling FDI in the electricity sector, namely, in China since 1985,
India since 1991, Kazakhstan since 1994, and Mongolia since 2011. Since 1985, China has received about $16
billion in FDI into its electricity sector, while India since 2000 has received $5.9 billion. We estimate that
Kazakhstan has received since 1992 less than $700 million of FDI in its electricity sector and Mongolia has to
date not received any but has a commitment for $450 million for the CHP5 power plant.
The global IPP industry and FDI
In all nine countries the state operates, owns, and controls the electricity industry from generation through to
transmission and sales and distribution. FDI into the sector only became possible as countries liberalized their
electricity sectors and allowed for independent power producers (IPP, that is privately owned, non-SOE
investments in electricity). This liberalization in some countries included partial privatization of some sectors of
the industry, usually only generation, although this privatization has gone farther in some countries than others.
India, which had a private electricity sector which survived nationalization, since the 1991 reforms has
developed a significant private electricity sector. Kazakhstan has a privatized electricity generation sector since
1994, although the state retains a big ownership stake through its sovereign wealth fund. Ukraine has mostly
privatized its thermal generation sector by 2012. The other countries in our group have not to date privatized
their generation sectors and they must rely on special laws, exemptions, and regulations to allow IPPs (whether
national investors or foreign) to be able to invest and operate in their countries.
The recent development of public-private partnerships (PPPs) in the electricity sector are simply IPPs in joint
venture with SOEs, but still must function as private market operators if they are to attract private investment.
Only if IPPs are permitted to function, legally and profitably, can FDI occur in a country. An indicator of how
far IPPs are developing and operating is to see the amount of total investment capital. A comparison of the
private participation investment in China and India indicates how much more open the Indian economy is to
IPPs, and thus to what extent that FDI would be acceptable, than is China’s (see Chart 1). These data clearly
show the impact of China’s promotion of FDI in the late 1990s (and its subsequent sharp decline) and the rise of
the private sector in India since 2005, which is bringing large sums of investment capital into the electricity
sector (including FDI). For India, with a relatively large domestic private electricity sector, it can be seen that
domestic investment in power plants dwarfs FDI in the past seven years. By comparison, since 2005, as Ukraine
began its process of privatizing the electricity generation sub-sector, it has received $760 million of private
investment in the sector, while before 2006, the sums of private investment, including FDI, were negligible.
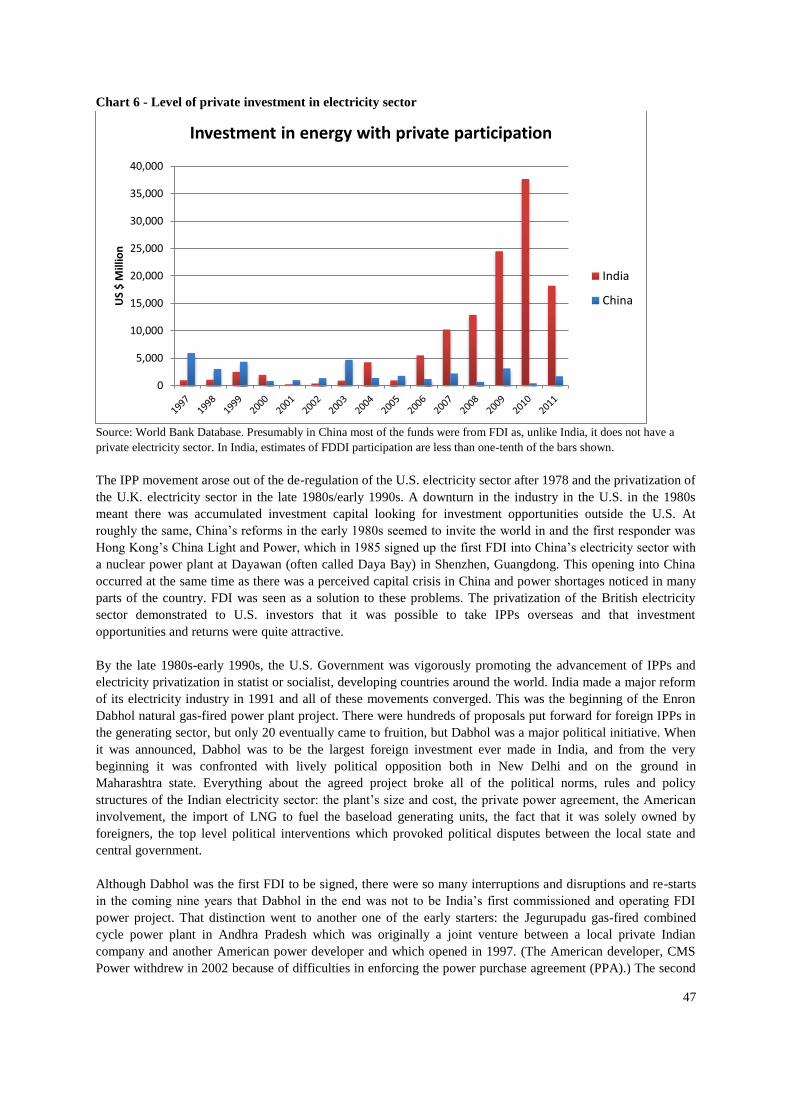
47
Chart 6 - Level of private investment in electricity sector
Source: World Bank Database. Presumably in China most of the funds were from FDI as, unlike India, it does not have a
private electricity sector. In India, estimates of FDDI participation are less than one-tenth of the bars shown.
The IPP movement arose out of the de-regulation of the U.S. electricity sector after 1978 and the privatization of
the U.K. electricity sector in the late 1980s/early 1990s. A downturn in the industry in the U.S. in the 1980s
meant there was accumulated investment capital looking for investment opportunities outside the U.S. At
roughly the same, China’s reforms in the early 1980s seemed to invite the world in and the first responder was
Hong Kong’s China Light and Power, which in 1985 signed up the first FDI into China’s electricity sector with
a nuclear power plant at Dayawan (often called Daya Bay) in Shenzhen, Guangdong. This opening into China
occurred at the same time as there was a perceived capital crisis in China and power shortages noticed in many
parts of the country. FDI was seen as a solution to these problems. The privatization of the British electricity
sector demonstrated to U.S. investors that it was possible to take IPPs overseas and that investment
opportunities and returns were quite attractive.
By the late 1980s-early 1990s, the U.S. Government was vigorously promoting the advancement of IPPs and
electricity privatization in statist or socialist, developing countries around the world. India made a major reform
of its electricity industry in 1991 and all of these movements converged. This was the beginning of the Enron
Dabhol natural gas-fired power plant project. There were hundreds of proposals put forward for foreign IPPs in
the generating sector, but only 20 eventually came to fruition, but Dabhol was a major political initiative. When
it was announced, Dabhol was to be the largest foreign investment ever made in India, and from the very
beginning it was confronted with lively political opposition both in New Delhi and on the ground in
Maharashtra state. Everything about the agreed project broke all of the political norms, rules and policy
structures of the Indian electricity sector: the plant’s size and cost, the private power agreement, the American
involvement, the import of LNG to fuel the baseload generating units, the fact that it was solely owned by
foreigners, the top level political interventions which provoked political disputes between the local state and
central government.
Although Dabhol was the first FDI to be signed, there were so many interruptions and disruptions and re-starts
in the coming nine years that Dabhol in the end was not to be India’s first commissioned and operating FDI
power project. That distinction went to another one of the early starters: the Jegurupadu gas-fired combined
cycle power plant in Andhra Pradesh which was originally a joint venture between a local private Indian
company and another American power developer and which opened in 1997. (The American developer, CMS
Power withdrew in 2002 because of difficulties in enforcing the power purchase agreement (PPA).) The second
0
5,000
10,000
15,000
20,000
25,000
30,000
35,000
40,000
US
$ M
illio
n
Investment in energy with private participation
India
China
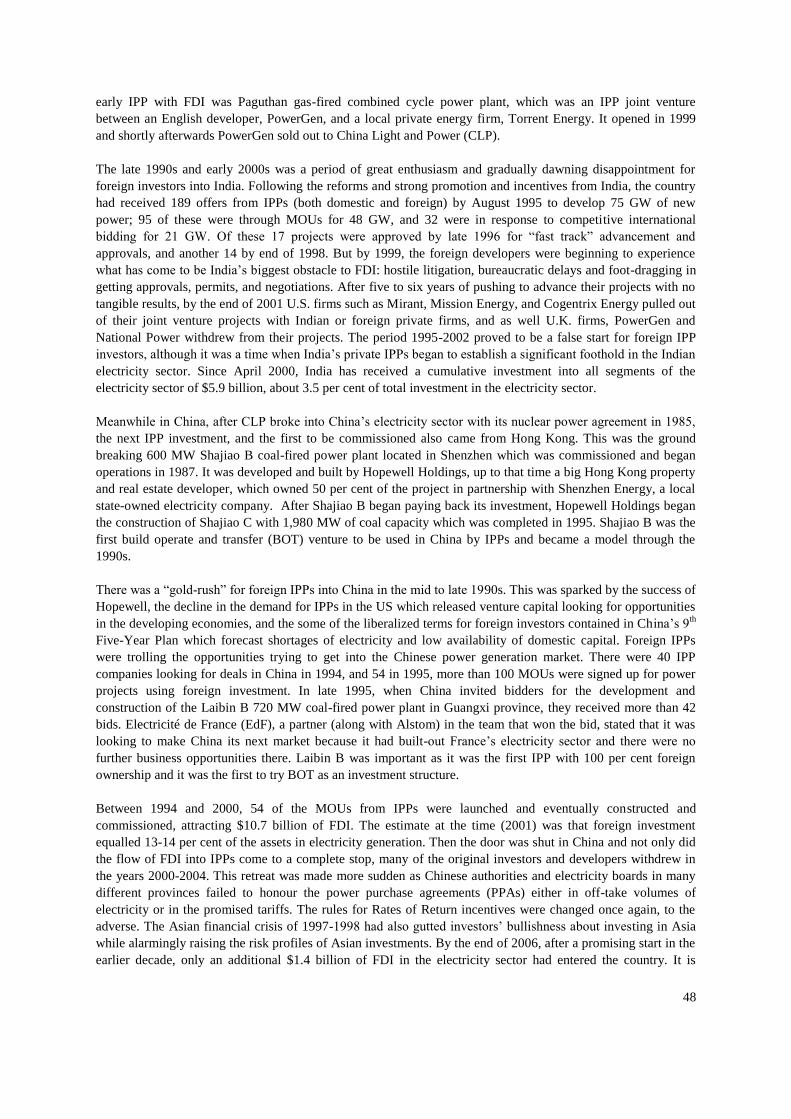
48
early IPP with FDI was Paguthan gas-fired combined cycle power plant, which was an IPP joint venture
between an English developer, PowerGen, and a local private energy firm, Torrent Energy. It opened in 1999
and shortly afterwards PowerGen sold out to China Light and Power (CLP).
The late 1990s and early 2000s was a period of great enthusiasm and gradually dawning disappointment for
foreign investors into India. Following the reforms and strong promotion and incentives from India, the country
had received 189 offers from IPPs (both domestic and foreign) by August 1995 to develop 75 GW of new
power; 95 of these were through MOUs for 48 GW, and 32 were in response to competitive international
bidding for 21 GW. Of these 17 projects were approved by late 1996 for “fast track” advancement and
approvals, and another 14 by end of 1998. But by 1999, the foreign developers were beginning to experience
what has come to be India’s biggest obstacle to FDI: hostile litigation, bureaucratic delays and foot-dragging in
getting approvals, permits, and negotiations. After five to six years of pushing to advance their projects with no
tangible results, by the end of 2001 U.S. firms such as Mirant, Mission Energy, and Cogentrix Energy pulled out
of their joint venture projects with Indian or foreign private firms, and as well U.K. firms, PowerGen and
National Power withdrew from their projects. The period 1995-2002 proved to be a false start for foreign IPP
investors, although it was a time when India’s private IPPs began to establish a significant foothold in the Indian
electricity sector. Since April 2000, India has received a cumulative investment into all segments of the
electricity sector of $5.9 billion, about 3.5 per cent of total investment in the electricity sector.
Meanwhile in China, after CLP broke into China’s electricity sector with its nuclear power agreement in 1985,
the next IPP investment, and the first to be commissioned also came from Hong Kong. This was the ground
breaking 600 MW Shajiao B coal-fired power plant located in Shenzhen which was commissioned and began
operations in 1987. It was developed and built by Hopewell Holdings, up to that time a big Hong Kong property
and real estate developer, which owned 50 per cent of the project in partnership with Shenzhen Energy, a local
state-owned electricity company. After Shajiao B began paying back its investment, Hopewell Holdings began
the construction of Shajiao C with 1,980 MW of coal capacity which was completed in 1995. Shajiao B was the
first build operate and transfer (BOT) venture to be used in China by IPPs and became a model through the
1990s.
There was a “gold-rush” for foreign IPPs into China in the mid to late 1990s. This was sparked by the success of
Hopewell, the decline in the demand for IPPs in the US which released venture capital looking for opportunities
in the developing economies, and the some of the liberalized terms for foreign investors contained in China’s 9th
Five-Year Plan which forecast shortages of electricity and low availability of domestic capital. Foreign IPPs
were trolling the opportunities trying to get into the Chinese power generation market. There were 40 IPP
companies looking for deals in China in 1994, and 54 in 1995, more than 100 MOUs were signed up for power
projects using foreign investment. In late 1995, when China invited bidders for the development and
construction of the Laibin B 720 MW coal-fired power plant in Guangxi province, they received more than 42
bids. Electricité de France (EdF), a partner (along with Alstom) in the team that won the bid, stated that it was
looking to make China its next market because it had built-out France’s electricity sector and there were no
further business opportunities there. Laibin B was important as it was the first IPP with 100 per cent foreign
ownership and it was the first to try BOT as an investment structure.
Between 1994 and 2000, 54 of the MOUs from IPPs were launched and eventually constructed and
commissioned, attracting $10.7 billion of FDI. The estimate at the time (2001) was that foreign investment
equalled 13-14 per cent of the assets in electricity generation. Then the door was shut in China and not only did
the flow of FDI into IPPs come to a complete stop, many of the original investors and developers withdrew in
the years 2000-2004. This retreat was made more sudden as Chinese authorities and electricity boards in many
different provinces failed to honour the power purchase agreements (PPAs) either in off-take volumes of
electricity or in the promised tariffs. The rules for Rates of Return incentives were changed once again, to the
adverse. The Asian financial crisis of 1997-1998 had also gutted investors’ bullishness about investing in Asia
while alarmingly raising the risk profiles of Asian investments. By the end of 2006, after a promising start in the
earlier decade, only an additional $1.4 billion of FDI in the electricity sector had entered the country. It is
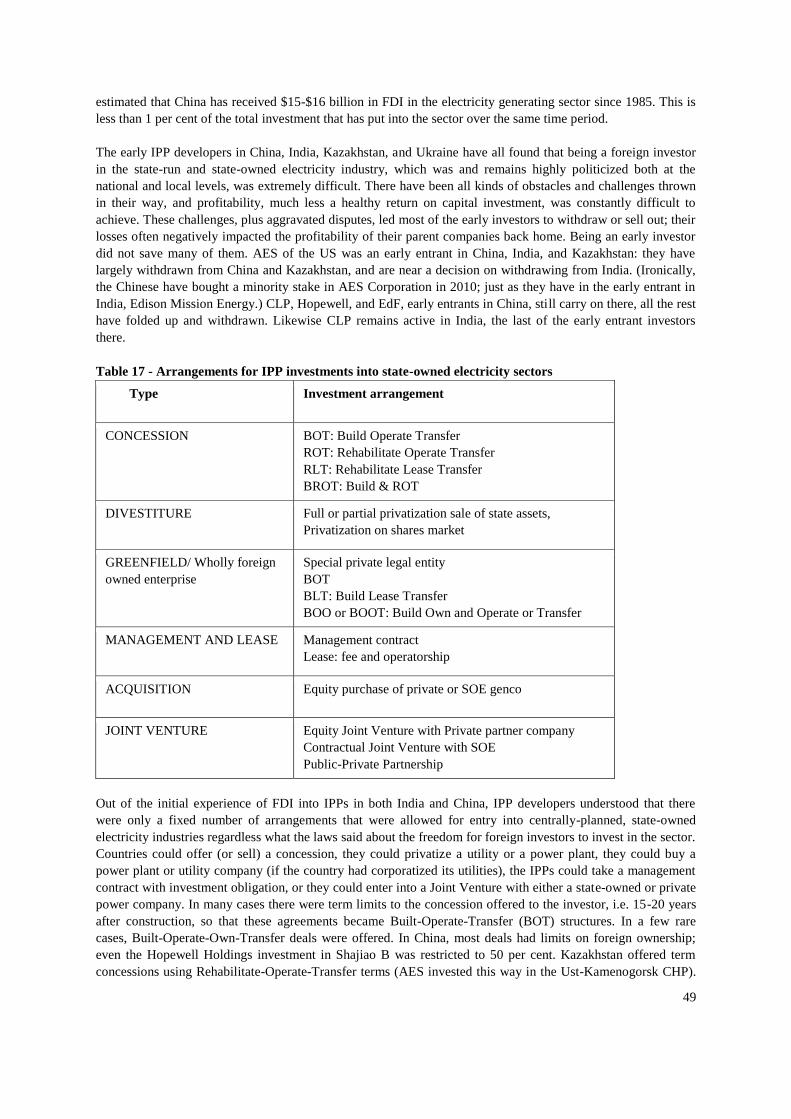
49
estimated that China has received $15-$16 billion in FDI in the electricity generating sector since 1985. This is
less than 1 per cent of the total investment that has put into the sector over the same time period.
The early IPP developers in China, India, Kazakhstan, and Ukraine have all found that being a foreign investor
in the state-run and state-owned electricity industry, which was and remains highly politicized both at the
national and local levels, was extremely difficult. There have been all kinds of obstacles and challenges thrown
in their way, and profitability, much less a healthy return on capital investment, was constantly difficult to
achieve. These challenges, plus aggravated disputes, led most of the early investors to withdraw or sell out; their
losses often negatively impacted the profitability of their parent companies back home. Being an early investor
did not save many of them. AES of the US was an early entrant in China, India, and Kazakhstan: they have
largely withdrawn from China and Kazakhstan, and are near a decision on withdrawing from India. (Ironically,
the Chinese have bought a minority stake in AES Corporation in 2010; just as they have in the early entrant in
India, Edison Mission Energy.) CLP, Hopewell, and EdF, early entrants in China, still carry on there, all the rest
have folded up and withdrawn. Likewise CLP remains active in India, the last of the early entrant investors
there.
Table 17 - Arrangements for IPP investments into state-owned electricity sectors
Type Investment arrangement
CONCESSION BOT: Build Operate Transfer
ROT: Rehabilitate Operate Transfer
RLT: Rehabilitate Lease Transfer
BROT: Build & ROT
DIVESTITURE Full or partial privatization sale of state assets,
Privatization on shares market
GREENFIELD/ Wholly foreign
owned enterprise
Special private legal entity
BOT
BLT: Build Lease Transfer
BOO or BOOT: Build Own and Operate or Transfer
MANAGEMENT AND LEASE Management contract
Lease: fee and operatorship
ACQUISITION Equity purchase of private or SOE genco
JOINT VENTURE Equity Joint Venture with Private partner company
Contractual Joint Venture with SOE
Public-Private Partnership
Out of the initial experience of FDI into IPPs in both India and China, IPP developers understood that there
were only a fixed number of arrangements that were allowed for entry into centrally-planned, state-owned
electricity industries regardless what the laws said about the freedom for foreign investors to invest in the sector.
Countries could offer (or sell) a concession, they could privatize a utility or a power plant, they could buy a
power plant or utility company (if the country had corporatized its utilities), the IPPs could take a management
contract with investment obligation, or they could enter into a Joint Venture with either a state-owned or private
power company. In many cases there were term limits to the concession offered to the investor, i.e. 15-20 years
after construction, so that these agreements became Built-Operate-Transfer (BOT) structures. In a few rare
cases, Built-Operate-Own-Transfer deals were offered. In China, most deals had limits on foreign ownership;
even the Hopewell Holdings investment in Shajiao B was restricted to 50 per cent. Kazakhstan offered term
concessions using Rehabilitate-Operate-Transfer terms (AES invested this way in the Ust-Kamenogorsk CHP).
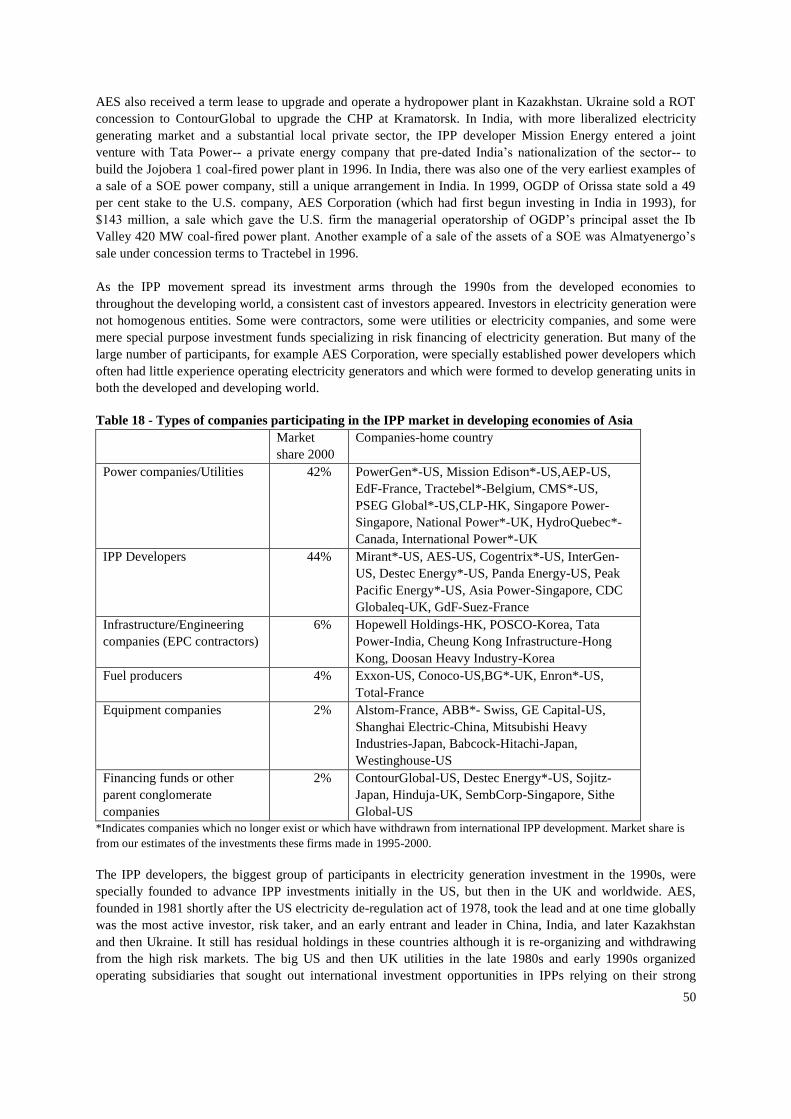
50
AES also received a term lease to upgrade and operate a hydropower plant in Kazakhstan. Ukraine sold a ROT
concession to ContourGlobal to upgrade the CHP at Kramatorsk. In India, with more liberalized electricity
generating market and a substantial local private sector, the IPP developer Mission Energy entered a joint
venture with Tata Power-- a private energy company that pre-dated India’s nationalization of the sector-- to
build the Jojobera 1 coal-fired power plant in 1996. In India, there was also one of the very earliest examples of
a sale of a SOE power company, still a unique arrangement in India. In 1999, OGDP of Orissa state sold a 49
per cent stake to the U.S. company, AES Corporation (which had first begun investing in India in 1993), for
$143 million, a sale which gave the U.S. firm the managerial operatorship of OGDP’s principal asset the Ib
Valley 420 MW coal-fired power plant. Another example of a sale of the assets of a SOE was Almatyenergo’s
sale under concession terms to Tractebel in 1996.
As the IPP movement spread its investment arms through the 1990s from the developed economies to
throughout the developing world, a consistent cast of investors appeared. Investors in electricity generation were
not homogenous entities. Some were contractors, some were utilities or electricity companies, and some were
mere special purpose investment funds specializing in risk financing of electricity generation. But many of the
large number of participants, for example AES Corporation, were specially established power developers which
often had little experience operating electricity generators and which were formed to develop generating units in
both the developed and developing world.
Table 18 - Types of companies participating in the IPP market in developing economies of Asia
Market
share 2000
Companies-home country
Power companies/Utilities 42% PowerGen*-US, Mission Edison*-US,AEP-US,
EdF-France, Tractebel*-Belgium, CMS*-US,
PSEG Global*-US,CLP-HK, Singapore Power-
Singapore, National Power*-UK, HydroQuebec*-
Canada, International Power*-UK
IPP Developers 44% Mirant*-US, AES-US, Cogentrix*-US, InterGen-
US, Destec Energy*-US, Panda Energy-US, Peak
Pacific Energy*-US, Asia Power-Singapore, CDC
Globaleq-UK, GdF-Suez-France
Infrastructure/Engineering
companies (EPC contractors)
6% Hopewell Holdings-HK, POSCO-Korea, Tata
Power-India, Cheung Kong Infrastructure-Hong
Kong, Doosan Heavy Industry-Korea
Fuel producers 4% Exxon-US, Conoco-US,BG*-UK, Enron*-US,
Total-France
Equipment companies 2% Alstom-France, ABB*- Swiss, GE Capital-US,
Shanghai Electric-China, Mitsubishi Heavy
Industries-Japan, Babcock-Hitachi-Japan,
Westinghouse-US
Financing funds or other
parent conglomerate
companies
2% ContourGlobal-US, Destec Energy*-US, Sojitz-
Japan, Hinduja-UK, SembCorp-Singapore, Sithe
Global-US
*Indicates companies which no longer exist or which have withdrawn from international IPP development. Market share is
from our estimates of the investments these firms made in 1995-2000.
The IPP developers, the biggest group of participants in electricity generation investment in the 1990s, were
specially founded to advance IPP investments initially in the US, but then in the UK and worldwide. AES,
founded in 1981 shortly after the US electricity de-regulation act of 1978, took the lead and at one time globally
was the most active investor, risk taker, and an early entrant and leader in China, India, and later Kazakhstan
and then Ukraine. It still has residual holdings in these countries although it is re-organizing and withdrawing
from the high risk markets. The big US and then UK utilities in the late 1980s and early 1990s organized
operating subsidiaries that sought out international investment opportunities in IPPs relying on their strong
51
credit and abilities to raise finance. EdF sought out international opportunities especially in nuclear power
development, taking an early position in China where it has remained involved since 1984. In the early-mid
1990s, many of the large multinational oil and gas companies jumped into power development. Castle Peak
Power Company of Hong Kong has been a 60 per cent-40 per cent joint venture of ExxonMobil and CLP for
nearly 30 years. But the multinational oil and gas companies did not remain long in the IPP market. Of all of the
oil companies that had power development divisions 15 years, only Exxon remains in the business and has a big
presence in Hong Kong’s electricity generation sector. The engineering firms and equipment manufacturers
have not often been investors in building electricity generation stations--almost never lead investors or
developers--although they have invested in joint venture equipment manufacturing in both China and India to
advance their sales of their power equipment in those countries.
By the first decade of the 21st century, the global IPP movement was beginning to wane, as investors were
finding it harder to make strong returns both in high risk markets, such as Asia, and in developed economies. In
the US the Enron bankruptcy was accompanied by the collapse of the California wholesale market and the IPPs
supporting it--a market structure which had been built and promoted by Enron. In addition to finding financing
harder to come by, IPP developers were finding good, profitable investments harder to find, and many of those
established as FDI in the 1990s ran into insurmountable problems in the markets of the developed world. The
state-owned power generators, in spite of reforms by central governments, did not want competition. Incentives
were taken away, pricing agreements and fuel supply contracts were not honoured, and the general environment
for foreign investors and operators became quite hostile. Many of the specialist IPP developers also struggled
with impossible debt levels and by the middle part of the decade many of them began to seek bankruptcy
protection in their home markets. They were followed into oblivion by the IPP development subsidiaries of the
large utilities, especially in the US and UK, which found that their parent utility companies did not have the risk
appetite, nor the endlessly deep pockets, in order to continue. By the end of the decade—even though there have
been new IPP developers to come out of Singapore, India, and even China—the global IPP investment
movement was effectively finished, and most of the participants of the 1990s had either disappeared or were
shrinking their businesses. The global financial crisis of 2008 has probably been the final death blow to the IPP
industry. One of the only survivors from the very beginning of the IPP movement is CLP of Hong Kong which
continues to operate its investments and to look for new business opportunities.
Captive power and FDI
Captive power development is that investment made into electricity generating plants which are built primarily
to supply an industrial development or mining complex with its own (thus “captive” or “mine-mouth” power
plants) and which thus do not primarily rely on sales of electricity to the national or wholesale grid in order to
prosper. While these power plants are usually “independent”, meaning privately owned, they do not rely on
revenues primarily from electricity sales into the national grid and so they are not really IPPs. Sometimes these
are sponsored by the industrial company developing the steel mill, coal or minerals mine, or chemicals or
industrial park to ensure that these complexes get the uninterrupted, reliable, and affordable electricity that they
need to operate. India is well known for these sorts of power plants which represented 15 per cent of India’s
installed generating capacity as of the beginning of the 12th
Five-Year Plan in April 2012. In other cases, an IPP
developer is the lead developer, who develops the power plant while looking for investors into a prospective
industrial park which will then become the main buyers (and economic justification) for its power plant
development. BG Power adopted this business model for IPP projects in S.E. Asia in the early 1990s. In the
former case captive power, especially in India, does not attract very much FDI especially if the industrial
developer or miner is a local company; in the latter case FDI is usually heavily involved.
India has a number of coal mine-mouth power plants which have been or are being developed by Indian coal
mining companies, steel companies, chemicals combines, that are the primarily sponsor and financiers of the
plant. Some of them, such as the mine-mouth SKS Ispat & Power Company-sponsored, 1,200 MW Chhattisgarh
coal-fired power plant, combines a local steel, coal, construction, and power conglomerate, the primary sponsor
and financier, with a U.S. IPP financing company, Sithe Global. But most of the captive power plants in India
52
have been exclusively developed and financed by private Indian firms such as Essar Energy, Torrent Power, or
Adani Power and have not entailed much or any FDI.
By contrast, most of the projected mine-mouth power plants in Mongolia will be sponsored by the foreign
mining companies which lead the coal or copper mining project. These will undoubtedly be mostly financed by
FDI. As another example, SembCorp of Singapore was invited to participate in a sponsored captive gas-fired co-
generation plant in Shanghai by the chemicals industrial park which is the lead developer and will be the main
owner. It is expected to supply 30 per cent of the financing of the plant’s $550 million cost.
The big power plants built at mine-mouths in Kazakhstan were developed in Soviet times and their linked power
plants were sold to the industrial companies which had bought the privatized coal or copper mines, such as
Kazakmys (copper) or Eurasia Natural Resources (coal). These mine-mouth power plants, Ekibastuz GRES 1
and Aksu power plant respectively, were built with such scale that the “captive” sales represent only a small
portion of their electricity output; most of their sales go into the national grid. Neither of these companies has
brought much FDI into electricity sector of Kazakhstan. They neither are really captive power nor were they IPP
developments.
Obstacles and risks for foreign investors into the power generating sector
Macro risks
Investors who bring FDI into a country have many motives, but foremost among them the investor wants a
profit and good return on investment. The more reliable and sooner the investor can get good profits and ROI
the better. The more obstacles there are in a recipient country to the investment earning an attractive, reliable
return the higher the risks are for the investor whose investment capital is “exposed”, and as these risks become
greater the less likely the investor will make an investment commitment. The same applies to lenders who
support FDI projects. The more obstacles there are to making the investment and getting a return, the higher the
risk. Investors have always and everywhere require higher, more assured returns to compensate them for the
higher risks (that there will not be any returns), which are perceived to exist in a specific country.
There are many general risks for a foreign investor into any industry of any developing economy; risks which do
not have anything to do with the legal or regulatory rules governing industry-specific FDI. These so called
macro obstacles can often be the over-riding concerns for potential investors and their presence impedes any
further consideration of investment. These macro risk factors which block FDI include:
Security: The presence of civil war or insurrections or other violent civil disturbances prevents the
evaluation of all but the most robust investment projects. Investments into IPP electricity generating plants –
which are by their nature exposed to high costs, large debt financing components, and long time periods for
development and to get a return-on-investment—into countries like Syria (active civil war) or Afghanistan
(active violent insurrection)—are at the moment virtually impossible investment destinations. Such places, until
they can assure security, can only expect to receive foreign assistance aid for power projects, and not FDI. It has
been noted in the past that companies in the extractive industries, particularly oil companies which can get a
quick result and can export their production, have been most tolerant of regions with high security risks.
Afghanistan may be able to attract mining investments, but it is unlikely to get electricity industry investments
under current circumstances.
Payments risk: FDI sends hard currency into a country where the investor earns his profits in the local
currency, which may or may not be exchangeable back into the hard currency at the same rates. This can exist in
countries where there are high national debt and balance of payments deficits and a history or expectation of
depreciation of the national currency (because of inflation or debts). These pose especially high risks for the
investor in projects which cost multi-hundreds of millions or even billions of dollars and which extend over a
decade or longer. If a country decides to devalue its currency or the markets force it to, this is a risk of loss that
is beyond the control of the Ministries with whom a foreign investor has its contracts, authorizations and power
purchasing agreements (PPA)
53
At the present time, India and Ukraine pose these currency devaluation risks. These are macro risks which hit
foreign investors in any sector in these countries. India’s rupee has fallen from 33.3 to the dollar in September
1995 to 54.4 rupees to the dollar in September 2012, and market expectations are that the rupee will continue to
depreciate to 80 to the dollar in just a few years. For the FDI investor in this period that means his rupee returns
have lost 38 per cent of their value relative to the dollar, and market participants expect the rupee will lose
another 32 per cent in value if as they expect it continues its slide to 80 to the dollar. In Ukraine in the same
period, the hryvnia has devalued from 1.5 to the dollar to 8 to the dollar, a loss of 81 per cent of its relative
value. Many observers fear that Ukraine’s high debt and low credit rating and inability to borrow further will
force it to devalue after the next election.
Another element of payment risk is the history of a country’s currency convertibility. Many countries have
currency exchange restrictions, Uzbekistan for one, where because of the unavailability of hard currency
reserves they restrict the amount of domestic currency that can be converted to hard currency and remitted
abroad. Even if the country has laws or rules that allow foreign investors to remit their profits abroad, if the
country does not have enough freely exchangeable currency or if it does not have enough foreign currency
reserves they may simply not comply with the request for profits remittances. This has been the history of
foreign investors in Pakistan. Uzbekistan has a regular history of refusing to allow the foreign investor hard
currency remittances. This is a very important reason why Uzbekistan receives so little FDI in general.
Rule of law: It has become clearer in recent decades that countries
o that are governed and administered by enforceable, transparent laws,
o where the terms of contracts are honoured,
o where the judicial system can redress grievances promptly, offer restitutions for wrongful
damages, and enforce contracts,
o where a foreign investor’s rights and investments are protected (both personal and commercial),
o where arbitrary or unpredictable laws or rules are not regularly changed nor applied to specific
circumstance or for best advantage,
o where state or provincial authorities cannot flaunt or disregard the national laws or policies and
apply their own terms and rulings,
o where the legal system protects the investor from criminals,
o where the economy runs according to laws and market rules and conventions, not but by fiat and
command,
o where permits and operations can be obtained by rules and open regular procedures and not solely
by connections or personal relationships,
are better destinations for foreign investment. Socialist states and most command economies have very weak
rule of law, authoritarian dictatorship also have arbitrary and non-transparent laws and protections for investors.
Unfortunately, experience has shown that China has weak rule of law and investors often discover once they are
invested how constricted their rights are and how disadvantaged they are in nearly all their dealings and business
activities. Uzbekistan repeatedly demonstrated a lack of legal protection for investors. The recent seizures of the
foreign investments of MTS and expulsion from the country over commercial disputes are one more
demonstration of the perils of investing in the country. Tajikistan, Kyrgyzstan, and Ukraine perform poorly in
this regard and in recent years abuses in Kazakhstan have shown that its rule of law has become poorer and
more arbitrary than it was in the 1990s when foreign investors first entered the country.
Corruption: This is actually an aspect of the rule of law and it also is a political risk, but corruption
can be a problem even in states with an established legal and judicial system. Its presence or extent can block
investment projects at almost every turn: land acquisition delayed, rules not enforced until a bribe is paid,
protection racketeering, licenses and permits not given or renewed, fuel supply contracts ignored, export rights
denied without unofficial payments. And it has a number of costs of course, not just monetary. Delay is one of
the biggest risks: the uncertainties of when a project can get the go ahead, can be built or completed, or can be
commissioned or expect to receive payments. These can be sizeable risks for foreign investors. India has a poor
reputation in this regard, and many foreign investors have discovered that China is periodically risky in this
54
regard. The racketeering and corruption that occur in Uzbekistan are frequently cited by foreigners doing
business there. Kyrgyzstan ranked 164th
out of the 183 countries for the rampant presence of corruption in
Transparency International’s Corruption Perception Index. The corruption has ranked as the main political
grievance in the country over the past 3 years.
Political risk: The electricity industry and how it develops is underpinned by political policies. Foreign
investment in major electricity projects are also made in accordance with political policies and decisions. And
there can always be political opposition to those policies, decisions, or investments and where there is
opposition there can be resistance and even dramatic political change.
There can often be strong political resentment and opposition to foreign investment in general, or it can be
directed to a specific industry or specific project and its locale. Opposition can also be directed against the
foreign investor’s nationality. (The Indian public in general and many politicians are generally hostile to big
American companies seeking to invest—this was especially true after Dow Chemical’s Bhopal disaster or
Enron’s Dabhol fiasco.) This antipathy and opposition can be strong enough that it can muster public, mass
demonstrations against a foreign investor’s project and its activities (clearing land of forest, using water, digging
an open pit coal mine, more recently violent protests by environmental opposition to the planed Jaitapur nuclear
power plant). This kind of public opposition or demonstrations can stop an investment project cold, or at least
delay it indefinitely. But there are also opposition politicians who can show their opposition to such foreign
projects for political advancement and if they gain power they can repudiate the investment project, the
contracts, and the enabling legislation. But even if they cannot gain power, their outspoken opposition could
force ruling politicians to modify or change the investor’s project for political reason. Although politics do not
appear to be public, it is clear that some policies in China contain political risk: Chinese do not like foreigners to
have complete control of power generators, they do not allow them in to the nuclear sector and restrict foreign
investors for political reasons which may only be manifested around the changing of the ruling heads of the
Party. China just learned about political risk in energy development when their major investment in a Myanmar
hydropower dam project was abruptly cancelled by the new government.
Kyrgyzstan has particular high political risk. It used to be viewed as a foreigner investor friendly country, but
after three violent changes of government in the past seven years, those foreign investors have discovered that
their investments do not look so assured of success. There have been violent attacks and demonstrations by
political opponents of the previous and current regime directed against the country’s largest foreign investment,
the Kumtor gold mine of Canada’s Centerra Gold. Some in the heated opposition are simply angry at the
appearance of foreign investors, claiming the politicians have sold off the country to foreigners. The violence of
the political actions in Kyrgyzstan, even without a big foreign investment to target, makes the general
environment for investment risky and unappealing.
Industry specific obstacles and risks for FDI in electricity generation
With the fall of the global IPP industry and the aftermath of the 2008 world economic crisis, overall investment
into the developing economies of the nine countries into electricity generation of all sorts has steadily declined
since 2005, most seriously into China and India. This is in spite of recent incentives that have been written into
FDI rules for investments into wind and other renewable energy resources. Foreign investors still have
profitability as their highest priority when committing to investments in the advanced fossil fuel technologies in
developing countries, whether they advance themselves as motivated by climate change concerns or
environmentally friendly business targets or whether they seek to transfer technologies which will mitigate CO2
emissions. The international financial community, including the multinational development aid lenders, also
demands profitability. None of them in fact will support the huge amounts of financing needed if the projects
will not pay back the interest on debt and pay a return on capital to the investor which will ensure his
commitment.
And it is not just profitability: foreign investors have to receive profits rates which are in excess to what they
could receive if they made similar investments in Western Europe or Japan. Following the nuclear disaster of
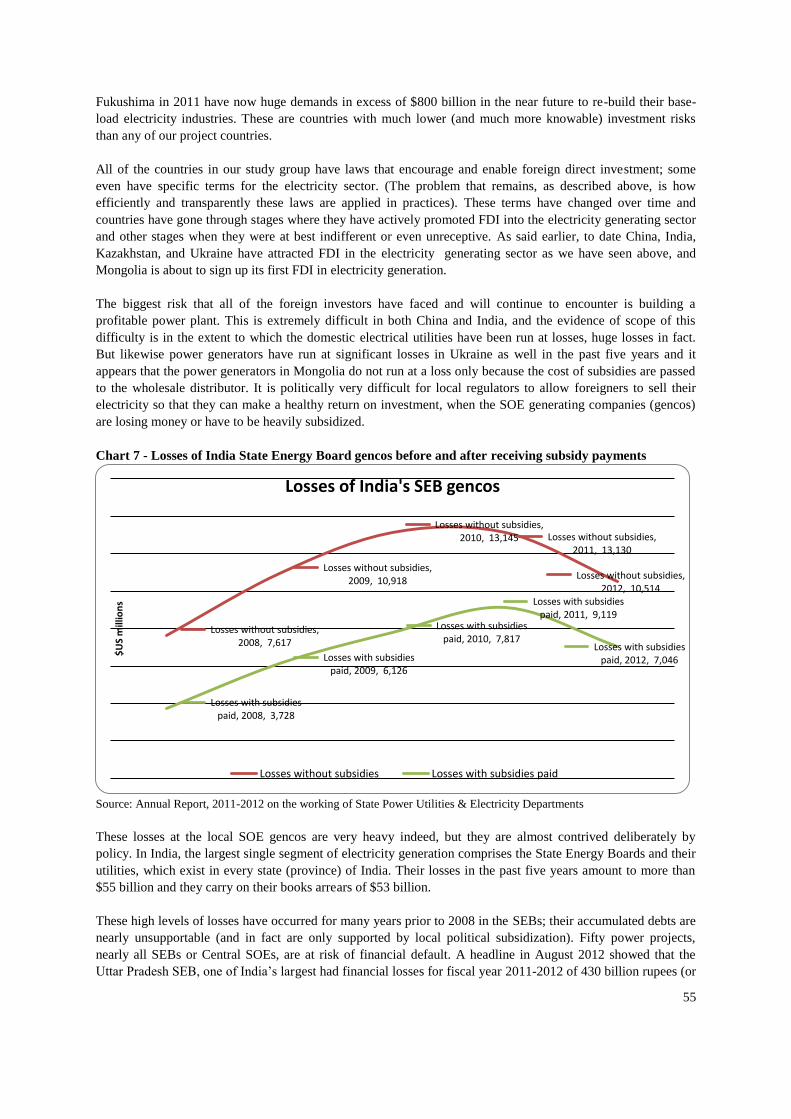
55
Fukushima in 2011 have now huge demands in excess of $800 billion in the near future to re-build their base-
load electricity industries. These are countries with much lower (and much more knowable) investment risks
than any of our project countries.
All of the countries in our study group have laws that encourage and enable foreign direct investment; some
even have specific terms for the electricity sector. (The problem that remains, as described above, is how
efficiently and transparently these laws are applied in practices). These terms have changed over time and
countries have gone through stages where they have actively promoted FDI into the electricity generating sector
and other stages when they were at best indifferent or even unreceptive. As said earlier, to date China, India,
Kazakhstan, and Ukraine have attracted FDI in the electricity generating sector as we have seen above, and
Mongolia is about to sign up its first FDI in electricity generation.
The biggest risk that all of the foreign investors have faced and will continue to encounter is building a
profitable power plant. This is extremely difficult in both China and India, and the evidence of scope of this
difficulty is in the extent to which the domestic electrical utilities have been run at losses, huge losses in fact.
But likewise power generators have run at significant losses in Ukraine as well in the past five years and it
appears that the power generators in Mongolia do not run at a loss only because the cost of subsidies are passed
to the wholesale distributor. It is politically very difficult for local regulators to allow foreigners to sell their
electricity so that they can make a healthy return on investment, when the SOE generating companies (gencos)
are losing money or have to be heavily subsidized.
Chart 7 - Losses of India State Energy Board gencos before and after receiving subsidy payments
Source: Annual Report, 2011-2012 on the working of State Power Utilities & Electricity Departments
These losses at the local SOE gencos are very heavy indeed, but they are almost contrived deliberately by
policy. In India, the largest single segment of electricity generation comprises the State Energy Boards and their
utilities, which exist in every state (province) of India. Their losses in the past five years amount to more than
$55 billion and they carry on their books arrears of $53 billion.
These high levels of losses have occurred for many years prior to 2008 in the SEBs; their accumulated debts are
nearly unsupportable (and in fact are only supported by local political subsidization). Fifty power projects,
nearly all SEBs or Central SOEs, are at risk of financial default. A headline in August 2012 showed that the
Uttar Pradesh SEB, one of India’s largest had financial losses for fiscal year 2011-2012 of 430 billion rupees (or
Losses without subsidies, 2008, 7,617
Losses without subsidies, 2009, 10,918
Losses without subsidies, 2010, 13,145 Losses without subsidies,
2011, 13,130
Losses without subsidies, 2012, 10,514
Losses with subsidies paid, 2008, 3,728
Losses with subsidies paid, 2009, 6,126
Losses with subsidies paid, 2010, 7,817
Losses with subsidies paid, 2011, 9,119
Losses with subsidies paid, 2012, 7,046
$U
S m
illio
ns
Losses of India's SEB gencos
Losses without subsidies Losses with subsidies paid
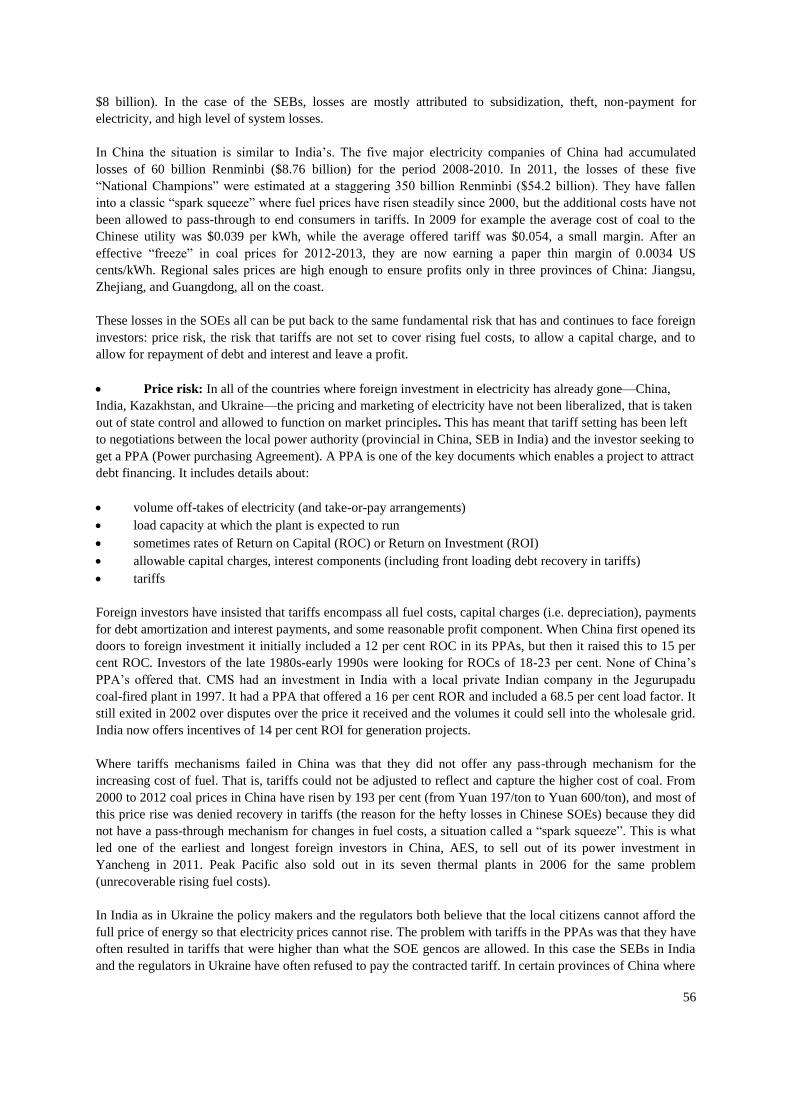
56
$8 billion). In the case of the SEBs, losses are mostly attributed to subsidization, theft, non-payment for
electricity, and high level of system losses.
In China the situation is similar to India’s. The five major electricity companies of China had accumulated
losses of 60 billion Renminbi ($8.76 billion) for the period 2008-2010. In 2011, the losses of these five
“National Champions” were estimated at a staggering 350 billion Renminbi ($54.2 billion). They have fallen
into a classic “spark squeeze” where fuel prices have risen steadily since 2000, but the additional costs have not
been allowed to pass-through to end consumers in tariffs. In 2009 for example the average cost of coal to the
Chinese utility was $0.039 per kWh, while the average offered tariff was $0.054, a small margin. After an
effective “freeze” in coal prices for 2012-2013, they are now earning a paper thin margin of 0.0034 US
cents/kWh. Regional sales prices are high enough to ensure profits only in three provinces of China: Jiangsu,
Zhejiang, and Guangdong, all on the coast.
These losses in the SOEs all can be put back to the same fundamental risk that has and continues to face foreign
investors: price risk, the risk that tariffs are not set to cover rising fuel costs, to allow a capital charge, and to
allow for repayment of debt and interest and leave a profit.
Price risk: In all of the countries where foreign investment in electricity has already gone—China,
India, Kazakhstan, and Ukraine—the pricing and marketing of electricity have not been liberalized, that is taken
out of state control and allowed to function on market principles. This has meant that tariff setting has been left
to negotiations between the local power authority (provincial in China, SEB in India) and the investor seeking to
get a PPA (Power purchasing Agreement). A PPA is one of the key documents which enables a project to attract
debt financing. It includes details about:
volume off-takes of electricity (and take-or-pay arrangements)
load capacity at which the plant is expected to run
sometimes rates of Return on Capital (ROC) or Return on Investment (ROI)
allowable capital charges, interest components (including front loading debt recovery in tariffs)
tariffs
Foreign investors have insisted that tariffs encompass all fuel costs, capital charges (i.e. depreciation), payments
for debt amortization and interest payments, and some reasonable profit component. When China first opened its
doors to foreign investment it initially included a 12 per cent ROC in its PPAs, but then it raised this to 15 per
cent ROC. Investors of the late 1980s-early 1990s were looking for ROCs of 18-23 per cent. None of China’s
PPA’s offered that. CMS had an investment in India with a local private Indian company in the Jegurupadu
coal-fired plant in 1997. It had a PPA that offered a 16 per cent ROR and included a 68.5 per cent load factor. It
still exited in 2002 over disputes over the price it received and the volumes it could sell into the wholesale grid.
India now offers incentives of 14 per cent ROI for generation projects.
Where tariffs mechanisms failed in China was that they did not offer any pass-through mechanism for the
increasing cost of fuel. That is, tariffs could not be adjusted to reflect and capture the higher cost of coal. From
2000 to 2012 coal prices in China have risen by 193 per cent (from Yuan 197/ton to Yuan 600/ton), and most of
this price rise was denied recovery in tariffs (the reason for the hefty losses in Chinese SOEs) because they did
not have a pass-through mechanism for changes in fuel costs, a situation called a “spark squeeze”. This is what
led one of the earliest and longest foreign investors in China, AES, to sell out of its power investment in
Yancheng in 2011. Peak Pacific also sold out in its seven thermal plants in 2006 for the same problem
(unrecoverable rising fuel costs).
In India as in Ukraine the policy makers and the regulators both believe that the local citizens cannot afford the
full price of energy so that electricity prices cannot rise. The problem with tariffs in the PPAs was that they have
often resulted in tariffs that were higher than what the SOE gencos are allowed. In this case the SEBs in India
and the regulators in Ukraine have often refused to pay the contracted tariff. In certain provinces of China where
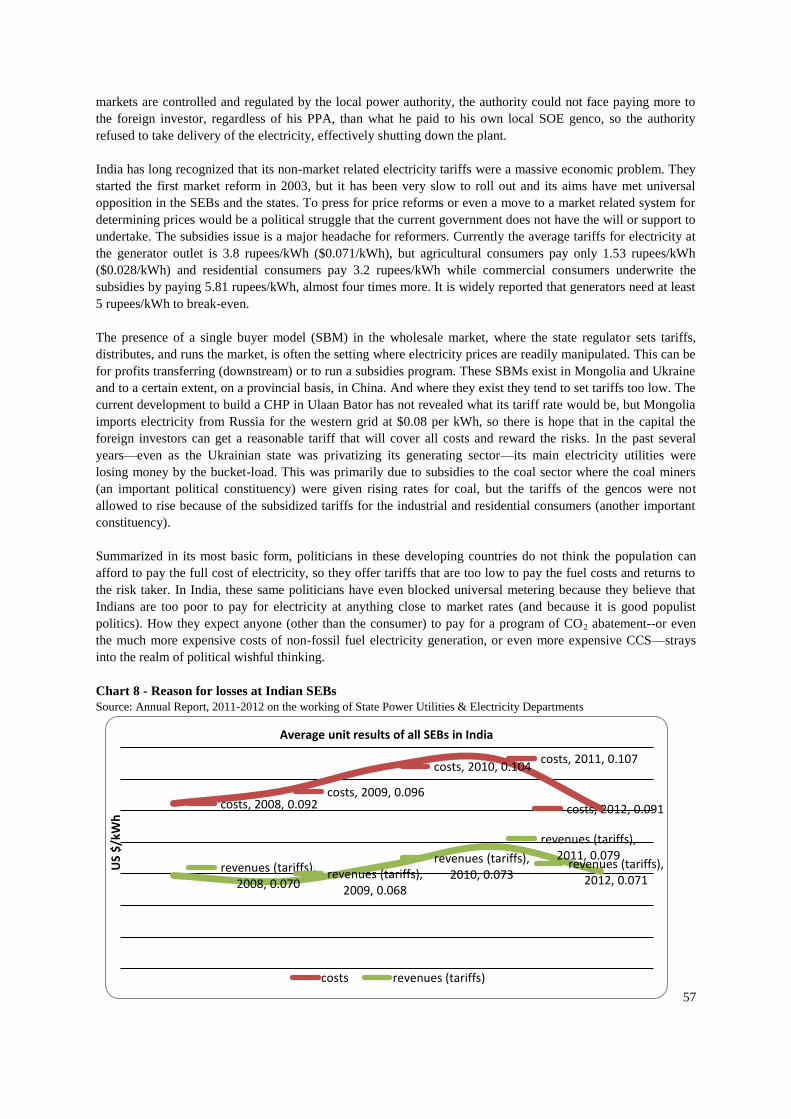
57
markets are controlled and regulated by the local power authority, the authority could not face paying more to
the foreign investor, regardless of his PPA, than what he paid to his own local SOE genco, so the authority
refused to take delivery of the electricity, effectively shutting down the plant.
India has long recognized that its non-market related electricity tariffs were a massive economic problem. They
started the first market reform in 2003, but it has been very slow to roll out and its aims have met universal
opposition in the SEBs and the states. To press for price reforms or even a move to a market related system for
determining prices would be a political struggle that the current government does not have the will or support to
undertake. The subsidies issue is a major headache for reformers. Currently the average tariffs for electricity at
the generator outlet is 3.8 rupees/kWh ($0.071/kWh), but agricultural consumers pay only 1.53 rupees/kWh
($0.028/kWh) and residential consumers pay 3.2 rupees/kWh while commercial consumers underwrite the
subsidies by paying 5.81 rupees/kWh, almost four times more. It is widely reported that generators need at least
5 rupees/kWh to break-even.
The presence of a single buyer model (SBM) in the wholesale market, where the state regulator sets tariffs,
distributes, and runs the market, is often the setting where electricity prices are readily manipulated. This can be
for profits transferring (downstream) or to run a subsidies program. These SBMs exist in Mongolia and Ukraine
and to a certain extent, on a provincial basis, in China. And where they exist they tend to set tariffs too low. The
current development to build a CHP in Ulaan Bator has not revealed what its tariff rate would be, but Mongolia
imports electricity from Russia for the western grid at $0.08 per kWh, so there is hope that in the capital the
foreign investors can get a reasonable tariff that will cover all costs and reward the risks. In the past several
years—even as the Ukrainian state was privatizing its generating sector—its main electricity utilities were
losing money by the bucket-load. This was primarily due to subsidies to the coal sector where the coal miners
(an important political constituency) were given rising rates for coal, but the tariffs of the gencos were not
allowed to rise because of the subsidized tariffs for the industrial and residential consumers (another important
constituency).
Summarized in its most basic form, politicians in these developing countries do not think the population can
afford to pay the full cost of electricity, so they offer tariffs that are too low to pay the fuel costs and returns to
the risk taker. In India, these same politicians have even blocked universal metering because they believe that
Indians are too poor to pay for electricity at anything close to market rates (and because it is good populist
politics). How they expect anyone (other than the consumer) to pay for a program of CO2 abatement--or even
the much more expensive costs of non-fossil fuel electricity generation, or even more expensive CCS—strays
into the realm of political wishful thinking.
Chart 8 - Reason for losses at Indian SEBs
Source: Annual Report, 2011-2012 on the working of State Power Utilities & Electricity Departments
costs, 2008, 0.092 costs, 2009, 0.096
costs, 2010, 0.104 costs, 2011, 0.107
costs, 2012, 0.091
revenues (tariffs), 2008, 0.070
revenues (tariffs), 2009, 0.068
revenues (tariffs), 2010, 0.073
revenues (tariffs), 2011, 0.079
revenues (tariffs), 2012, 0.071
US
$/k
Wh
Average unit results of all SEBs in India
costs revenues (tariffs)
58
Procedures for making FDI and investing into electricity generation: Although both China and
India make strong protestations that they want to promote FDI into their electricity sector, the interested investor
faces a bewildering procedure for locating and getting approvals for a new greenfield project. India has in fact
acknowledged that non-transparent approval and inauguration procedures have been a bane of investors (both
domestic and foreign) for much of the past two decades. And this is because the procedures cause seemingly
interminable and unpredictable long delays. In the past four years India has launched a new “fast track”
approvals procedure which it especially directs for its UMPPs and for advanced fossil fuel power plants. Before
delays could be up to seven years on getting a project off the ground and construction started. With the fast track
some have been developed and launched in less than three years. But India’s decentralized governance of the
electricity industry still leads to delays imposed by the states or even local authorities. Land acquisition permits
have been held up by local and state officials often for more than two years. In the western part of the country
water access permits are the issue of delays and unclear procedures.
In China, the procedures have been spelled out a number of times, but the reality is quite different from the
official “guidebook”. Getting through Chinese procedures for approvals and launching a greenfield power plant
are difficult, so the investors from Chinese speaking entities—Hong Kong, Taiwan, or Singapore—have big
competitive advantages over all other foreigners as they have consistently demonstrated in the past 35 years.
The procedures should be easy as the chart shows:
Chart 9 - Procedures for approvals in China
Source: National baseline study for China
In some extreme cases projects were supposed to get into the fundamental planning document (the Five-Year
Plan) in order to be considered. After approvals at the central state level, investors have, just as in India, often
had to deal with local or provincial officials who add another layer of procedures and delays. Nevertheless,
while procedural obfuscation and delays are a risk for foreign investors in China, historically the FDI projects
usually began construction in less than 2 years after raising the issue and then would commission in 2-3 years
depending on the scale of the plant, unlike India historically where approvals were 3-4 years and other delays
could run 3-5 years on construction.
Project approvals and launching procedures in Kazakhstan, Ukraine, and Mongolia are even less well-
established or straight-forward than China’s and India’s. Such lack of transparency may open the door to
corruption. Kazakhstan’s Balkhash coal-fired plant development took three years from signing a framework
Planning
(NDRC)
Pre-feasibility Study
(Each Designing
Institute )
Travel Permit
(Department of
Conservation、
NDRC、Statnett)
Feasibility Study
(Designing Institute)
Approval
(NDRC) Construction
Formally on Production Operation
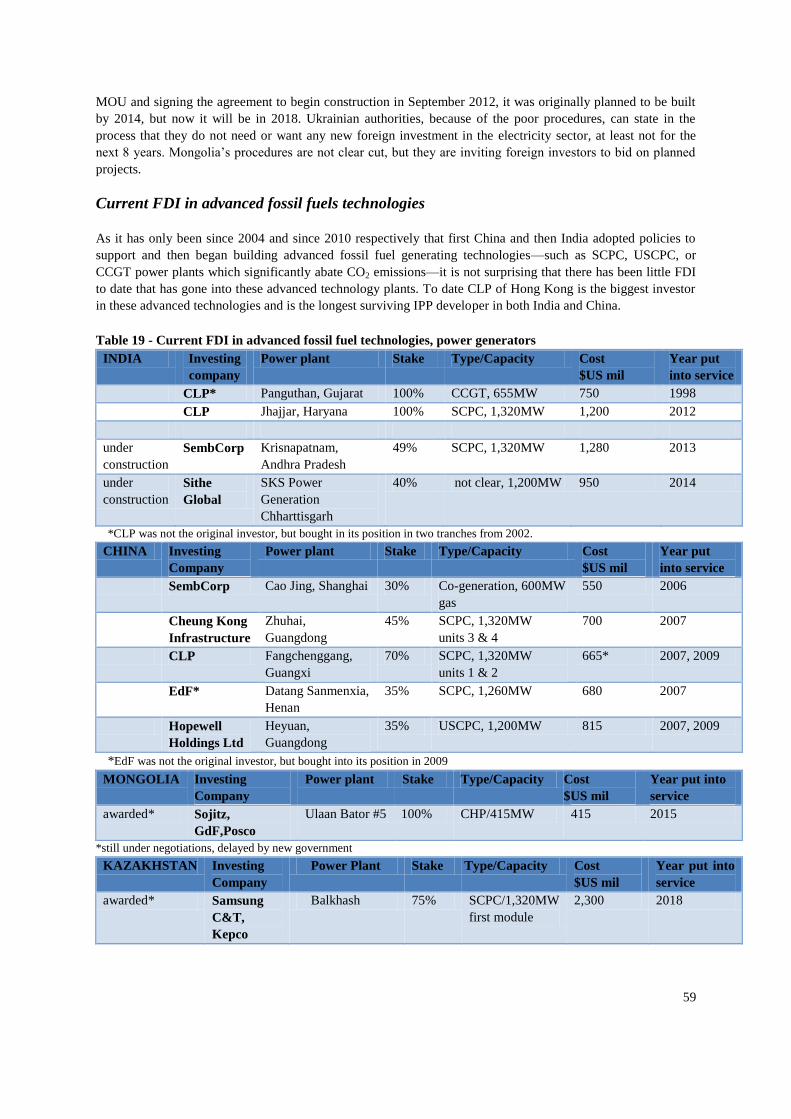
59
MOU and signing the agreement to begin construction in September 2012, it was originally planned to be built
by 2014, but now it will be in 2018. Ukrainian authorities, because of the poor procedures, can state in the
process that they do not need or want any new foreign investment in the electricity sector, at least not for the
next 8 years. Mongolia’s procedures are not clear cut, but they are inviting foreign investors to bid on planned
projects.
Current FDI in advanced fossil fuels technologies
As it has only been since 2004 and since 2010 respectively that first China and then India adopted policies to
support and then began building advanced fossil fuel generating technologies—such as SCPC, USCPC, or
CCGT power plants which significantly abate CO2 emissions—it is not surprising that there has been little FDI
to date that has gone into these advanced technology plants. To date CLP of Hong Kong is the biggest investor
in these advanced technologies and is the longest surviving IPP developer in both India and China.
Table 19 - Current FDI in advanced fossil fuel technologies, power generators
INDIA Investing
company
Power plant Stake Type/Capacity Cost
$US mil
Year put
into service
CLP* Panguthan, Gujarat 100% CCGT, 655MW 750 1998
CLP Jhajjar, Haryana 100% SCPC, 1,320MW 1,200 2012
under
construction
SembCorp Krisnapatnam,
Andhra Pradesh
49% SCPC, 1,320MW 1,280 2013
under
construction
Sithe
Global
SKS Power
Generation
Chharttisgarh
40% not clear, 1,200MW 950 2014
*CLP was not the original investor, but bought in its position in two tranches from 2002.
CHINA Investing
Company
Power plant Stake Type/Capacity Cost
$US mil
Year put
into service
SembCorp Cao Jing, Shanghai 30% Co-generation, 600MW
gas
550 2006
Cheung Kong
Infrastructure
Zhuhai,
Guangdong
45% SCPC, 1,320MW
units 3 & 4
700 2007
CLP Fangchenggang,
Guangxi
70% SCPC, 1,320MW
units 1 & 2
665* 2007, 2009
EdF* Datang Sanmenxia,
Henan
35% SCPC, 1,260MW 680 2007
Hopewell
Holdings Ltd
Heyuan,
Guangdong
35% USCPC, 1,200MW 815 2007, 2009
*EdF was not the original investor, but bought into its position in 2009
MONGOLIA Investing
Company
Power plant Stake Type/Capacity Cost
$US mil
Year put into
service
awarded* Sojitz,
GdF,Posco
Ulaan Bator #5 100% CHP/415MW 415 2015
*still under negotiations, delayed by new government
KAZAKHSTAN Investing
Company
Power Plant Stake Type/Capacity Cost
$US mil
Year put into
service
awarded* Samsung
C&T,
Kepco
Balkhash 75% SCPC/1,320MW
first module
2,300 2018
60
From these data it can be seen that FDI has made a contribution to the advanced fossil fuel power technologies
in both India and China in the past decade or more. In China it brought in a net $1.47 billion of new foreign
capital since 2006 in support of a net 2.6 GWs of new generating capacity. In India, since 1998, FDI contributed
$1.95 billion which built a net 1.95 GWs of new advanced generating capacity. In India, there are currently
underway two projects which could add another net 1.12 GWs of advanced coal-fired power plants or about
$1.0 billion of net new foreign capital. While any amount is encouraging, the sums are at best only very small
incremental contributions: over the past decade in China FDI in advanced coal technologies added only 0.2 per
cent to its total coal-fired capacity or approximately 1.1 per cent of the total fleet of advanced coal-fired
technologies that China has built since 2004. In India, on the other hand, FDI in advanced coal-fired
technologies added 0.9 per cent to it total fleet of coal-fired capacity. By comparison to FDI’s contribution,
India’s power developers since 2010 have installed and commissioned about 6.5 GWs of new capacity using
advanced fossil fuel technologies, and are embarked on investing in another 21 GWs currently.
To make any kind of noticeable contribution to the abatement of CO2 emissions from coal burning, FDI would
have to invest something on the order of $30-$40 billion (45 GWs) for new advanced technologies in India in
the coming decade, and something on the order of $75-$90 billion (90-95 GWs) in China. In China that is the
equivalent to replacing 50 per cent of the remaining small, older sub-critical coal powered fleet that still exist
after the completion of the first program China conducted (2006-2010) to replace the small sub-critical fleet
with large capacity advanced coal burning power plants.
These levels of investment are not going to come forward from foreign investors even with major reforms in the
next few years. We have seen how difficult it has been for both China and India in the past decade to reform
their electricity sectors and to make the changes that structure investment incentives and reduce risks to private
investors. Huge changes and reforms have already been made, but many of them have been vitiated and other
changes and reform initiatives have not been carried out or lasted very long.
Looking forward to the future experience in Mongolia, if the CHP5 power plant moves ahead and the selected
foreign investors build it as required (a high efficiency combined heat and power coal-burning plant); it would
make a noticeable abatement contribution to Mongolia’s CO2 emissions. What is uncertain up to now are the
technical specifications of the planned captive, mine-mouth, coal-burning power capacity that Mongolia wants
built at its many developing mining sites. If these are not advanced technologies, the positive impact of CHP5
on Mongolia’s CO2 emissions would be seriously diluted.
Likewise it is uncertain what the experience will be in Kazakhstan. The technical specifications of the newly
signed Balkhash thermal power plant are likely going to be advanced coal burning technology. If it is completed
with the capacity that has been announced, it would be equivalent to 10 per cent of Kazakhstan’s current coal-
fired capacity. That is a small abatement contribution, if the power plant is built with SCPC specifications. The
important contribution is that it would be a case of FDI introducing new technology into Kazakhstan.
As a contribution to abatement of CO2 emissions in India, China, and Kazakhstan it is clear that FDI that brings
advanced fossil fuel technologies will not in the coming decade make a meaningful contribution or remove a
significant amount of CO2 from their current emissions levels.
New FDI in advanced coal-burning technologies could help abate CO2 emissions in Ukraine with investments in
the range of 10 GWs of new advanced coal or gas fired capacity. Although Ukraine is very much looking
forward to attract FDI5, there seem to be no immediate plans for investing in new greenfield advanced
technology plants for at least a decade.
Still, for India, Kazakhstan, Mongolia, and Ukraine, FDI could be an important means for technology transfer in
both advanced coal and gas combustion technologies. Perhaps for advanced gas combustion technologies FDI
could contribute and be an important means of technology transfer for China’s planned expansion of its gas-
5 An illustration of such efforts is a deal between Shell and Ukraine signed in January 2013.
http://www.bbc.co.uk/news/world-europe-21191164

61
fired capacity. For advanced coal-burning technologies China actually will probably become a significant net
exporter of FDI in the coming decade as it has a world leading technological R&D in coal combustion
technologies and has the largest fleet of SCPC and USCPC power plants in the world. It has already begun
exporting its technological know-how to other coal burning countries, notably India.
62
Chapter VII: Investment climate
General investment climate, rankings
The general rules, functioning, regulations, and conditions of a country’s economy and business activity are the
background which makes up the investment climate for both domestic and foreign investors. Elements as
diverse as inflation, labour unions, demand growth, currency exchange restrictions, xenophobia, anti-monopoly
rules, presence of racketeering, public auction rules, political transparency, and domestic input requirements all
are part of the complex fabric of the investment climate.
Countries in our study group range broadly in the openness and attractiveness of their investment climate. And
while this is reflected in general domestic investment, the attractiveness of the investment climate is very clearly
demonstrated in recent years by the amount of foreign direct investment that countries have attracted in all
sectors from foreign investors, both in the nominal amounts of net FDI capital received and the amount of FDI
relative to the country’s GDP or population (see Chapter V).
Over the years a number of institutions have begun to examine the general business and investment climate in
the countries of the world and have constructed ranking indices which make assessments of the many variables
of a country’s rules and regulations for investment. To demonstrate the relative attractiveness of the investment
climate in the nine countries in our study, we look to three such rankings: the Ease of Doing Business Index
compiled by the World Bank, the Global Competitiveness Index of the World Economic Forum, and the
Economic Freedom Index by the Heritage Foundation along with the Wall Street Journal. The Economic
Freedom Index does not measure or rank Afghanistan for reasons related to the continuing insecurity problems
there. Likewise Global Competitiveness Index does not measure or rank Afghanistan and Uzbekistan because of
lack of data and lack of local observers.
Each of these three institutions applies a slightly different methodology but in all cases they assign scores to the
different components that comprise the investment climate. They utilize both surveys of businesses and
businessmen working locally as well as in some cases conducting their own empirical or topical studies or
specific country studies. From the scores compiled (or averaged) they then make a ranking comparing all
countries on a scale of one to 190 (depending on how comprehensive their world view, these ranking range from
144 countries to 190 countries of the world). They annually re-examine the data and make changes as reforms or
changes have been made in the countries reviewed. The World Bank, which uses data from more than 800
reports, began its Index in 2001, The World Economic Forum began its report in 1979, and the Heritage
Foundation/Wall Street Journal began issuing its Economic Freedom Index in 1995. All three of these indices
have attracted critics of their methods, and rankings, and economic assumptions. But all three have attracted
faithful users from both the investment community and the multinational aid and lending institutions.
The World Bank Ease of Doing Business index specifically addresses the business and economic conditions
facing small and medium sized businesses located in each country that it surveys. It measures and assesses
variables in ten basic areas: starting a business, construction permits, getting electricity, registering property,
getting credit, protecting investors, paying taxes, trading across borders, enforcing contracts, resolving
insolvency. In 2012, the World Bank addressed the correlation between the rankings of Ease of Doing Business
and attracting Foreign Direct Investment, and this report found that the better the ranking there was a distinct
improvement in the ability of the country to attract FDI, in other words as there was a better investment climate
for domestic business there was improved perception of the business climate for foreign investors and more FDI
was attracted. Each of the ten basic areas earns a score 0-10, with ten being the best performance and zero the
worst. The rankings of countries are inverse to their scores, that is the higher the composite score the lower (or
better) the countries’ standing in the over-all rankings. In our group of countries in the World Bank Ease of
Doing Business Index for 2013 Kazakhstan ranks as the best and Afghanistan as the worst out of 185 countries
ranked. With the exception of Kazakhstan, the countries of Central Asia rank poorly relative to most of the rest
of the world. On the other hand the Index scores both China and India low in the comparative rankings, even
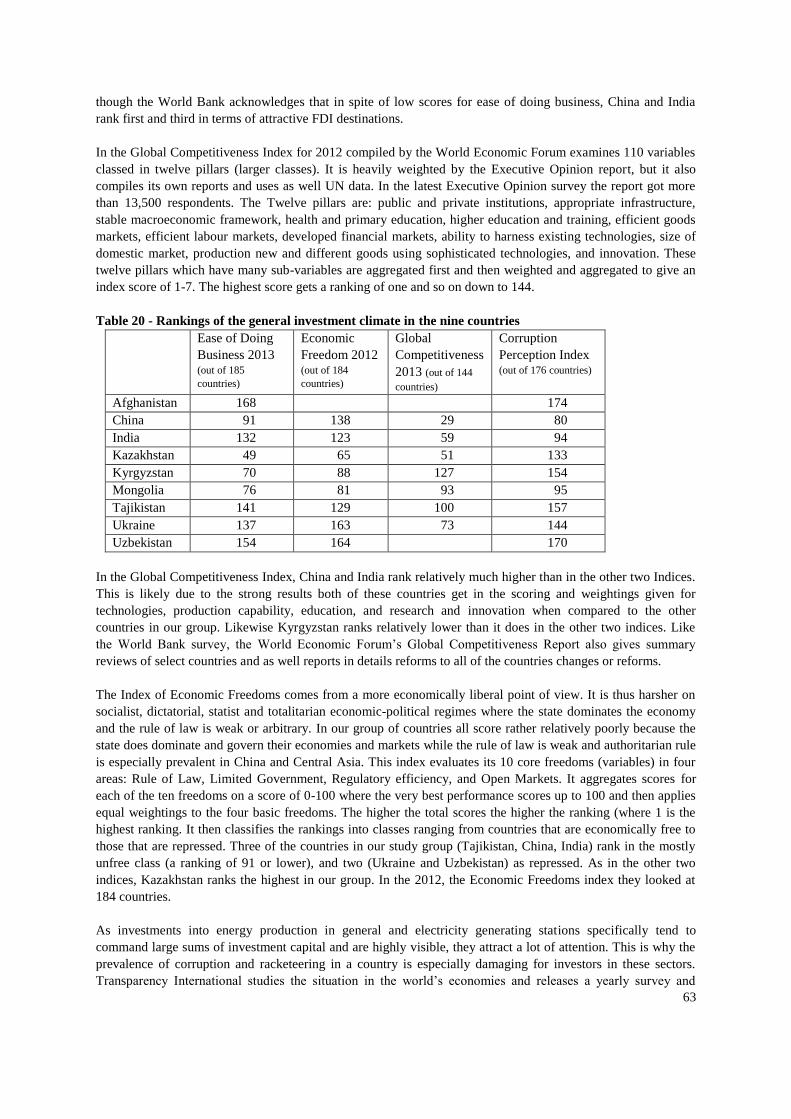
63
though the World Bank acknowledges that in spite of low scores for ease of doing business, China and India
rank first and third in terms of attractive FDI destinations.
In the Global Competitiveness Index for 2012 compiled by the World Economic Forum examines 110 variables
classed in twelve pillars (larger classes). It is heavily weighted by the Executive Opinion report, but it also
compiles its own reports and uses as well UN data. In the latest Executive Opinion survey the report got more
than 13,500 respondents. The Twelve pillars are: public and private institutions, appropriate infrastructure,
stable macroeconomic framework, health and primary education, higher education and training, efficient goods
markets, efficient labour markets, developed financial markets, ability to harness existing technologies, size of
domestic market, production new and different goods using sophisticated technologies, and innovation. These
twelve pillars which have many sub-variables are aggregated first and then weighted and aggregated to give an
index score of 1-7. The highest score gets a ranking of one and so on down to 144.
Table 20 - Rankings of the general investment climate in the nine countries
Ease of Doing
Business 2013 (out of 185
countries)
Economic
Freedom 2012 (out of 184
countries)
Global
Competitiveness
2013 (out of 144
countries)
Corruption
Perception Index (out of 176 countries)
Afghanistan 168 174
China 91 138 29 80
India 132 123 59 94
Kazakhstan 49 65 51 133
Kyrgyzstan 70 88 127 154
Mongolia 76 81 93 95
Tajikistan 141 129 100 157
Ukraine 137 163 73 144
Uzbekistan 154 164 170
In the Global Competitiveness Index, China and India rank relatively much higher than in the other two Indices.
This is likely due to the strong results both of these countries get in the scoring and weightings given for
technologies, production capability, education, and research and innovation when compared to the other
countries in our group. Likewise Kyrgyzstan ranks relatively lower than it does in the other two indices. Like
the World Bank survey, the World Economic Forum’s Global Competitiveness Report also gives summary
reviews of select countries and as well reports in details reforms to all of the countries changes or reforms.
The Index of Economic Freedoms comes from a more economically liberal point of view. It is thus harsher on
socialist, dictatorial, statist and totalitarian economic-political regimes where the state dominates the economy
and the rule of law is weak or arbitrary. In our group of countries all score rather relatively poorly because the
state does dominate and govern their economies and markets while the rule of law is weak and authoritarian rule
is especially prevalent in China and Central Asia. This index evaluates its 10 core freedoms (variables) in four
areas: Rule of Law, Limited Government, Regulatory efficiency, and Open Markets. It aggregates scores for
each of the ten freedoms on a score of 0-100 where the very best performance scores up to 100 and then applies
equal weightings to the four basic freedoms. The higher the total scores the higher the ranking (where 1 is the
highest ranking. It then classifies the rankings into classes ranging from countries that are economically free to
those that are repressed. Three of the countries in our study group (Tajikistan, China, India) rank in the mostly
unfree class (a ranking of 91 or lower), and two (Ukraine and Uzbekistan) as repressed. As in the other two
indices, Kazakhstan ranks the highest in our group. In the 2012, the Economic Freedoms index they looked at
184 countries.
As investments into energy production in general and electricity generating stations specifically tend to
command large sums of investment capital and are highly visible, they attract a lot of attention. This is why the
prevalence of corruption and racketeering in a country is especially damaging for investors in these sectors.
Transparency International studies the situation in the world’s economies and releases a yearly survey and
64
ranking called the Corruption Perceptions Index. This organization has been monitoring corruption, which is
defined as abusing positions of public power for private benefit, since 1995. Its countries are scored on a base of
0 to 100, where 0 is very corrupt and 100 is the very cleanest regime. In its 2012 report, just released,
Transparency International surveyed 176 countries. Afghanistan, North Korea, and Somalia score as the worst
countries in the world for corruption. Its data for scoring comes from 13 different surveys and studies and 12
multilateral institutions.
Investment climate specific to electricity sector
For investors into electricity generating stations there are a number of criteria that are more specific than the
general investment climate and that have the greatest impact on their investment decision. The criteria can be
reduced to six: the regulatory system, a market framework, commercial operations, private sector involvement,
network access, and electricity tariffs. All of the general conditions of the investment climate as scored in the
four surveys cited above still apply in investment decision-making, but these pose less of an immediate risk of
causing total investment project failure.
The conditions of the regulatory system that are critical for investors are: the independence of the regulatory
from state and political manipulation, the integrity of the regulation system –i.e. that there is a unified regulator
and not multiple regulators—the transparency and openness of decision making by the regulator, stability of
regulations, and the non-discriminatory nature of regulators’ decisions and regulations. For this study we have
ranked regulatory systems from 1 to 0 where 1 represents complete independence, high integrity of the system,
which makes decision-making transparent, open and non-discriminatory, and where 0 is complete lack of these
conditions.
The category of market framework looks at the presence of market mechanisms in determining prices. This
includes the presence of open markets for fuels and energy and price discovery is through open markets. Also
considered the presence of energy companies traded on public shares markets. Trade barriers to fuel imports are
examples of dysfunctional markets. Lack of open markets for land, i.e. state granting of land needs, are also
signs of a weak market system. Is there a functioning credit market with enough capacity for costly electricity
generating stations? Again a market economy would score 1, which a completely statist economy would rank 0.
The category of commercial operations measures the degree to which business is conducted on principles of
mutually beneficial transactions. Are payments made by buyers? Are supplies delivered of purchases inputs?
Does the state allow businesses to make profits, are purchase and sales transactions conducted by contracts, are
remittances of profits or dividends allowed, are there markets for labour? Are contract honoured and enforced?
Procurement is based on public bidding or auctions. What level is there competition for electricity sales and
purchases? Or does state ownership or regulation restrict competition? Is taxation based on profits or is taxation
primarily excise or punitive? A country where a company’s operations are conducted on a commercial basis
would be ranked 1 and one where operations were conducted in accordance with state mandates and directives,
where non-payments for sales occur, where inputs are acquired only through political determinations and not
contracts, would rate a 0.
The level to which the energy sector has been privatized is a very important consideration for electricity
generator investors, and especially private foreign investors. This measures the extent to which all the energy
sub-sectors have been privatized and have participants from the private sector. This would be private ownership
(and control) of electric generating stations, transmission and distribution companies, local utilities, and the fuel
extraction and production sub-sectors. Where there is no such privatization, private investors become
competitors to SOEs—a competition which they inevitably lose. But the aim of privatization of the electricity
sector is to increase competition, so privatizing state owned electricity companies to a private monopoly does
not increase competition. Likewise offering only a small stake of an electricity company’s shares to private
owners does not actually take the company out of state control and convert it to a higher productive, profits
seeking firm. The imbalanced competition between private investors and the state-owned and run electricity
companies in China and India has consistently been the greatest problems confronting the foreign investor in the
65
past 25 years. This level is measured by a range from 1 where all the energy sectors are privately owned and
operated, to 0 is where the state completely owns and operates the sector.
The category of network access looks at the availability of a transmission network, its adequacy and the degree
that the country is connected and served in a unified transmission network, or that there would be a connection
to the network without too much additional investment or delay at or near the site of the new electricity
generating station. Access means also that transmission tariffs are minimal not expropriate. This also looks at
non-discriminatory access to the transmission system, that the electricity producer can dispatch electricity to his
customer. A good transmission system with fair and open access and reasonably low tariffs rates a 1 in our
rankings, while a system that does not function or which has holes in the coverage for the country would rank
near a 0.
Always the crucially important factor in the investment decision for an electricity generating plant is the tariff
and how tariffs are determined. It is important both in the absolute nominal level of tariffs that the electricity
generator can expect to receive for its electricity sales, and in the structure and mechanism of tariff
determination. Do tariffs capture all of the investor’s costs and hoped for returns? Are they set up by fiat or by
formula that aim to capture those costs? Tariff caps and inflexible tariffs which do not respond to changes in
fuel costs are harmful. Is the tariff regime predictable and stable—i.e. they are not changed every year? Tariffs
that are devised by a regular formula that captures costs and returns, which are flexible, and which are high
enough to return a profit to the investor rate a 1, while those tariffs and tariff systems which subsidize other
parts of the economy or which do not return the costs and profits of the investor rate nearer to 0.
The EBRD is a major investor and lender to the energy sectors in six of the nine countries in our study group of
countries. Their latest assessment published in 2011 of the electricity sectors measures and compares the
electricity and gas sectors of the five former Soviet countries and Mongolia in a manner which defines well the
investment climate for foreign investors. (2010 Energy Sector Assessment, EBRD). We can extend their
assessment to India and China to demonstrate a comparative assessment of the investment climate for the
electric generating sector. Afghanistan is not included because the investment climate at the moment is
unattractive because of security concerns.
The assessments by the EBRD demonstrate that the countries of the former Soviet Union plus Mongolia—the
so-called transition economies-- with the exception of Kazakhstan, have not advanced or reformed their
economies far from their former Soviet structures. This applies equally to their electricity sectors. In almost all
of the countries—excepting Kazakhstan—privatization of the sector, liberalization of energy markets, liberal
business norms, and independent regulatory systems have not been accomplished. Prices for electricity are
everywhere subsidized and the state and politics play the overwhelmingly dominant role in the running of the
energy sectors. For this reason the countries Ukraine, Uzbekistan, Tajikistan, and Kyrgyzstan rank very poorly
on almost all counts, with the exception that Ukraine has mostly privatized its electricity generating companies.
This can be seen in the following chart.
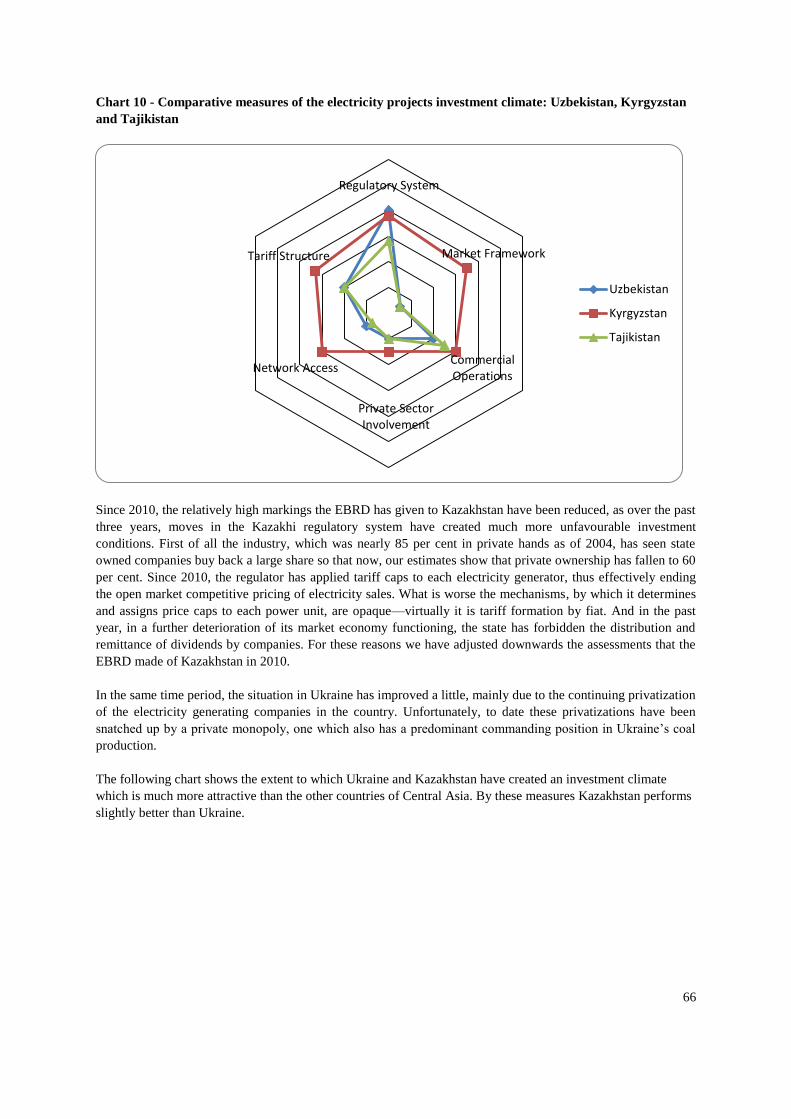
66
Chart 10 - Comparative measures of the electricity projects investment climate: Uzbekistan, Kyrgyzstan
and Tajikistan
Since 2010, the relatively high markings the EBRD has given to Kazakhstan have been reduced, as over the past
three years, moves in the Kazakhi regulatory system have created much more unfavourable investment
conditions. First of all the industry, which was nearly 85 per cent in private hands as of 2004, has seen state
owned companies buy back a large share so that now, our estimates show that private ownership has fallen to 60
per cent. Since 2010, the regulator has applied tariff caps to each electricity generator, thus effectively ending
the open market competitive pricing of electricity sales. What is worse the mechanisms, by which it determines
and assigns price caps to each power unit, are opaque—virtually it is tariff formation by fiat. And in the past
year, in a further deterioration of its market economy functioning, the state has forbidden the distribution and
remittance of dividends by companies. For these reasons we have adjusted downwards the assessments that the
EBRD made of Kazakhstan in 2010.
In the same time period, the situation in Ukraine has improved a little, mainly due to the continuing privatization
of the electricity generating companies in the country. Unfortunately, to date these privatizations have been
snatched up by a private monopoly, one which also has a predominant commanding position in Ukraine’s coal
production.
The following chart shows the extent to which Ukraine and Kazakhstan have created an investment climate
which is much more attractive than the other countries of Central Asia. By these measures Kazakhstan performs
slightly better than Ukraine.
Regulatory System
Market Framework
Commercial Operations
Private Sector Involvement
Network Access
Tariff Structure
Uzbekistan
Kyrgyzstan
Tajikistan
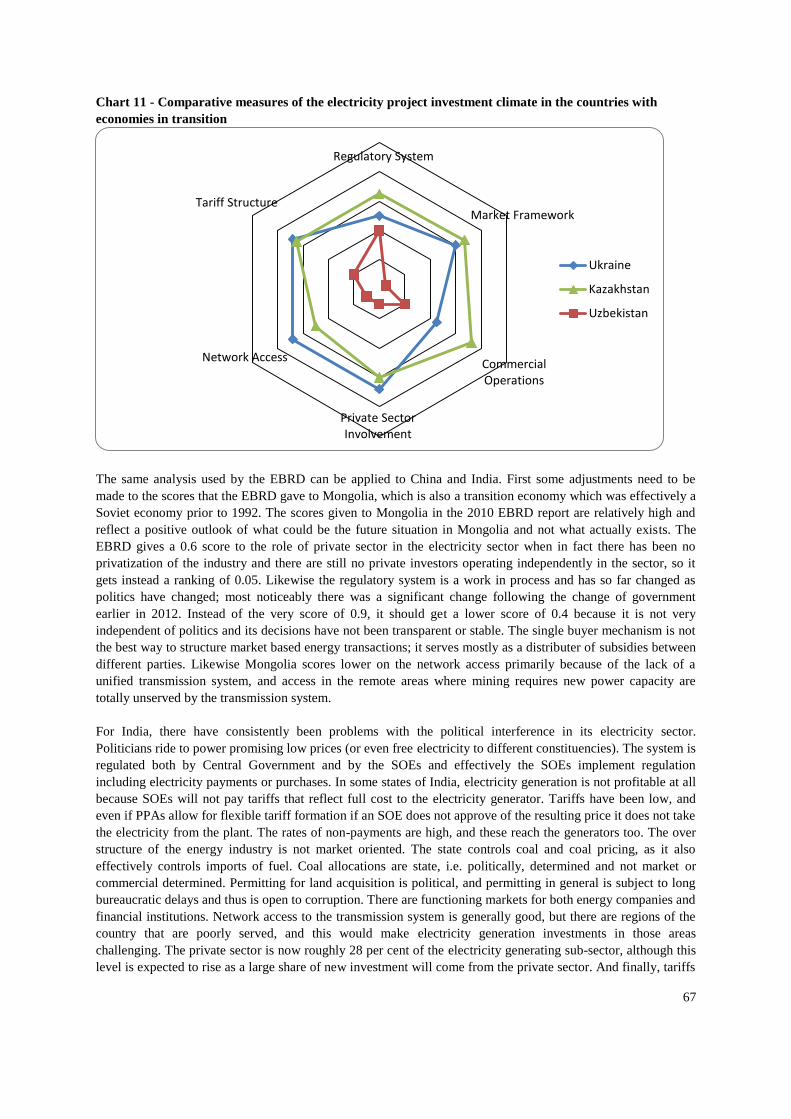
67
Chart 11 - Comparative measures of the electricity project investment climate in the countries with
economies in transition
The same analysis used by the EBRD can be applied to China and India. First some adjustments need to be
made to the scores that the EBRD gave to Mongolia, which is also a transition economy which was effectively a
Soviet economy prior to 1992. The scores given to Mongolia in the 2010 EBRD report are relatively high and
reflect a positive outlook of what could be the future situation in Mongolia and not what actually exists. The
EBRD gives a 0.6 score to the role of private sector in the electricity sector when in fact there has been no
privatization of the industry and there are still no private investors operating independently in the sector, so it
gets instead a ranking of 0.05. Likewise the regulatory system is a work in process and has so far changed as
politics have changed; most noticeably there was a significant change following the change of government
earlier in 2012. Instead of the very score of 0.9, it should get a lower score of 0.4 because it is not very
independent of politics and its decisions have not been transparent or stable. The single buyer mechanism is not
the best way to structure market based energy transactions; it serves mostly as a distributer of subsidies between
different parties. Likewise Mongolia scores lower on the network access primarily because of the lack of a
unified transmission system, and access in the remote areas where mining requires new power capacity are
totally unserved by the transmission system.
For India, there have consistently been problems with the political interference in its electricity sector.
Politicians ride to power promising low prices (or even free electricity to different constituencies). The system is
regulated both by Central Government and by the SOEs and effectively the SOEs implement regulation
including electricity payments or purchases. In some states of India, electricity generation is not profitable at all
because SOEs will not pay tariffs that reflect full cost to the electricity generator. Tariffs have been low, and
even if PPAs allow for flexible tariff formation if an SOE does not approve of the resulting price it does not take
the electricity from the plant. The rates of non-payments are high, and these reach the generators too. The over
structure of the energy industry is not market oriented. The state controls coal and coal pricing, as it also
effectively controls imports of fuel. Coal allocations are state, i.e. politically, determined and not market or
commercial determined. Permitting for land acquisition is political, and permitting in general is subject to long
bureaucratic delays and thus is open to corruption. There are functioning markets for both energy companies and
financial institutions. Network access to the transmission system is generally good, but there are regions of the
country that are poorly served, and this would make electricity generation investments in those areas
challenging. The private sector is now roughly 28 per cent of the electricity generating sub-sector, although this
level is expected to rise as a large share of new investment will come from the private sector. And finally, tariffs
Regulatory System
Market Framework
Commercial Operations
Private Sector Involvement
Network Access
Tariff Structure
Ukraine
Kazakhstan
Uzbekistan
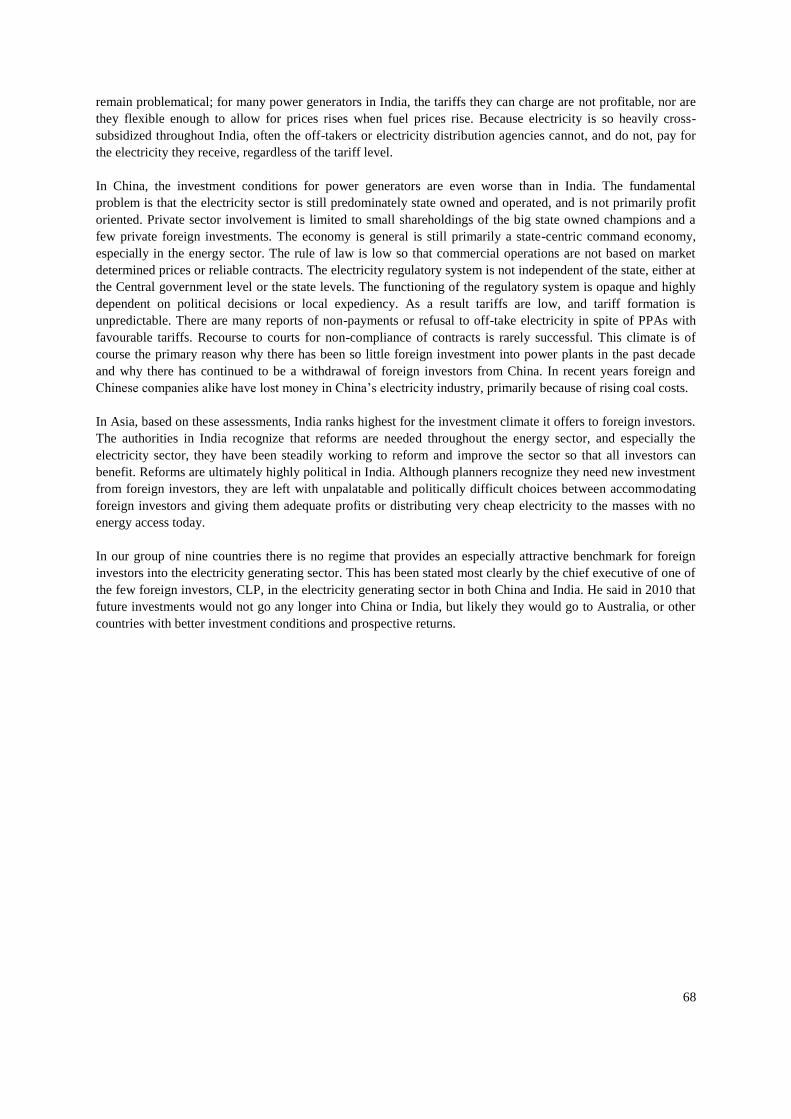
68
remain problematical; for many power generators in India, the tariffs they can charge are not profitable, nor are
they flexible enough to allow for prices rises when fuel prices rise. Because electricity is so heavily cross-
subsidized throughout India, often the off-takers or electricity distribution agencies cannot, and do not, pay for
the electricity they receive, regardless of the tariff level.
In China, the investment conditions for power generators are even worse than in India. The fundamental
problem is that the electricity sector is still predominately state owned and operated, and is not primarily profit
oriented. Private sector involvement is limited to small shareholdings of the big state owned champions and a
few private foreign investments. The economy is general is still primarily a state-centric command economy,
especially in the energy sector. The rule of law is low so that commercial operations are not based on market
determined prices or reliable contracts. The electricity regulatory system is not independent of the state, either at
the Central government level or the state levels. The functioning of the regulatory system is opaque and highly
dependent on political decisions or local expediency. As a result tariffs are low, and tariff formation is
unpredictable. There are many reports of non-payments or refusal to off-take electricity in spite of PPAs with
favourable tariffs. Recourse to courts for non-compliance of contracts is rarely successful. This climate is of
course the primary reason why there has been so little foreign investment into power plants in the past decade
and why there has continued to be a withdrawal of foreign investors from China. In recent years foreign and
Chinese companies alike have lost money in China’s electricity industry, primarily because of rising coal costs.
In Asia, based on these assessments, India ranks highest for the investment climate it offers to foreign investors.
The authorities in India recognize that reforms are needed throughout the energy sector, and especially the
electricity sector, they have been steadily working to reform and improve the sector so that all investors can
benefit. Reforms are ultimately highly political in India. Although planners recognize they need new investment
from foreign investors, they are left with unpalatable and politically difficult choices between accommodating
foreign investors and giving them adequate profits or distributing very cheap electricity to the masses with no
energy access today.
In our group of nine countries there is no regime that provides an especially attractive benchmark for foreign
investors into the electricity generating sector. This has been stated most clearly by the chief executive of one of
the few foreign investors, CLP, in the electricity generating sector in both China and India. He said in 2010 that
future investments would not go any longer into China or India, but likely they would go to Australia, or other
countries with better investment conditions and prospective returns.
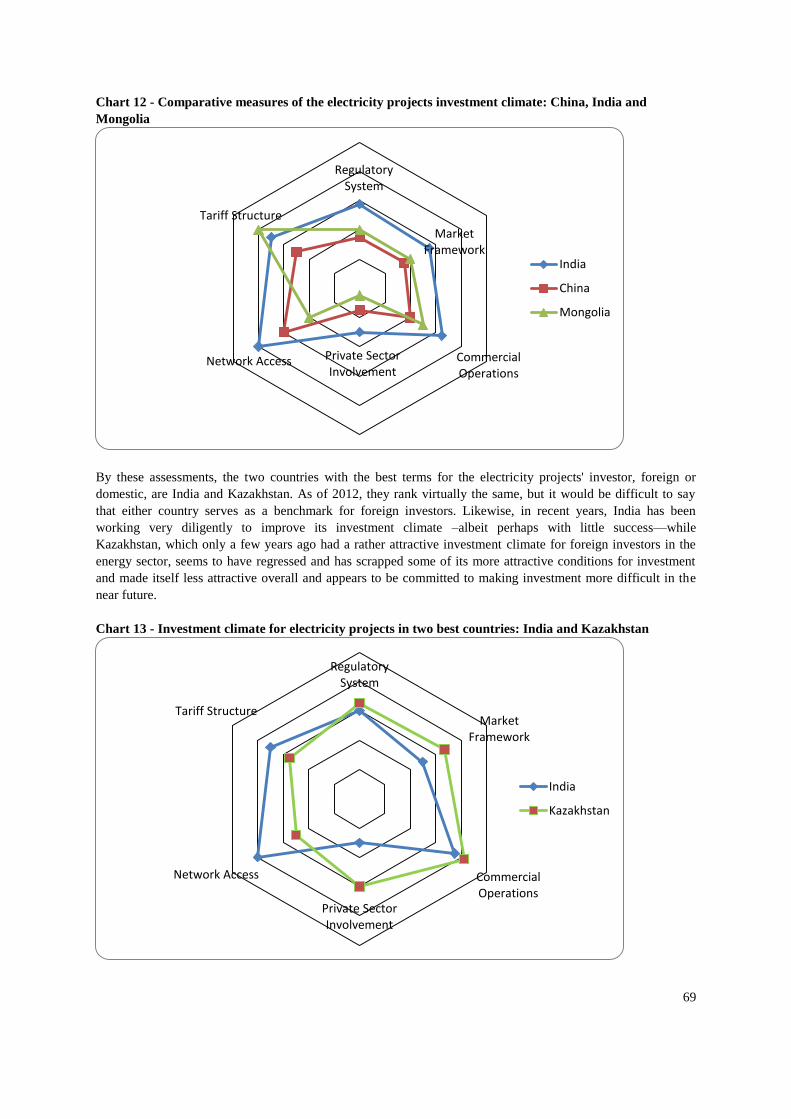
69
Chart 12 - Comparative measures of the electricity projects investment climate: China, India and
Mongolia
By these assessments, the two countries with the best terms for the electricity projects' investor, foreign or
domestic, are India and Kazakhstan. As of 2012, they rank virtually the same, but it would be difficult to say
that either country serves as a benchmark for foreign investors. Likewise, in recent years, India has been
working very diligently to improve its investment climate –albeit perhaps with little success—while
Kazakhstan, which only a few years ago had a rather attractive investment climate for foreign investors in the
energy sector, seems to have regressed and has scrapped some of its more attractive conditions for investment
and made itself less attractive overall and appears to be committed to making investment more difficult in the
near future.
Chart 13 - Investment climate for electricity projects in two best countries: India and Kazakhstan
Regulatory System
Market Framework
Commercial Operations
Private Sector Involvement
Network Access
Tariff Structure
India
China
Mongolia
Regulatory System
Market Framework
Commercial Operations
Private Sector Involvement
Network Access
Tariff Structure
India
Kazakhstan

70
In the case of Kazakhstan, perhaps authorities there have concluded that since they do not seriously need more
investment into new electricity generating capacity, they do not so urgently need to attract foreign investment.
While in India, the authorities know that they desperately need new investment from whatever source they can
get it, but especially from foreign investments and foreign lending. These are strong incentives for India to
continue to improve its investment terms.
71
Chapter VIII: Findings and conclusions
The Problem: Thermal electricity generation every year emits a substantial share of the world’s CO2. Coal-fired
plants are especially large contributors and the rapid growth in capacity of coal-fired power plants in the past 15
years has especially raised alarms about the sudden surge in carbon emissions and their deleterious effect on the
climate. China and India have very large coal-burning electricity sectors and are the world’s first and third
largest CO2 emitters—and their emissions have shown very strong growth in the past decade.
This project examines the thermal electricity sectors in nine countries of Asia, including Ukraine. The nine
countries covered by the project are (by order of population): China, India, Ukraine, Uzbekistan, Afghanistan,
Kazakhstan, Tajikistan, Kyrgyzstan, and Mongolia. Five (Ukraine, Kazakhstan, Kyrgyzstan, Uzbekistan and
Tajikistan) of these are former component states of the Soviet Union which by and large built their electricity
sectors prior to 1992 (as well this was the case with Mongolia). Six countries generate electricity primarily by
burning fossil fuels: China, India, Ukraine, Uzbekistan, Kazakhstan, and Mongolia. China and India possess the
world’s largest and third largest coal-fired electricity generation industries. Three countries—Afghanistan,
Tajikistan, Kyrgyzstan—being poor in fossil fuel resources—rely overwhelmingly on hydropower. Only one
country, Uzbekistan, generates electricity primarily by using natural gas, which is a much cleaner burning fuel
than coal. The other five countries rely on coal for up 80 per cent of their electricity needs primarily because
they are endowed with rich coal resources and because coal has been their cheapest available energy source so
that energy self-sufficiency mandates that coal be used.
A partial solution: Over the past two decades there has been intensive research and development in making
cleaner, more efficient fossil fuel combustion technologies. Of these supercritical pulverized coal (SCPC) and
ultra-supercritical pulverized coal (USCPC) steam generators have been shown to be commercial and have been
increasingly introduced into the world’s coal-burning electricity generation fleet replacing less efficient sub-
critical generators. Likewise rapid advances in gas turbines used along with combined cycle generators have
increased efficiencies. For the SCPC and USCPC technologies it has been seen that they are more effective in
very large capacity plants of 600 MW to 1,000 MW size. Most important, these advanced coal and gas
combustion technologies greatly reduce CO2 emissions, and their adoption can be used as a means of abating
CO2 emissions from large thermal electricity generating industries. Other clean coal technologies, carbon
capture and sequestration, and integrated coal gasification combined cycle (IGCC) generation, have not yet been
shown to be economically practical, although China and India are both committed to building commercial scale
IGCC plants.
These advanced technologies have been adopted by China and India as part of their carbon abatement strategies.
China adopted a policy of introducing SCPC and USCPC generators in the 10th
Five-Year plan (2000-2005),
and since 2004 has been building them rapidly to where, by the end of 2010, SCPC and USCPC power plants
represented 54 per cent of China’s total coal-burning electricity generation fleet and 38 per cent of its total
electricity generating capacity. Since 2006 China has had a program called Large Substitute for Small which has
removed smaller, older conventional coal-fired plants and replaced them with these new coal-burning
technologies. China plans to add 525 GWs of new advanced coal-burning power plants to its total stock by
2020. A major part of its carbon abatement strategy in that time period, however, is to raise the proportions of
natural gas, nuclear, hydro and wind power generation in the total share of electricity generation, thus reducing
coal’s share. A major program is underway to import more natural gas and direct it to combined cycle gas-
turbine power plants in the east of the country.
In India, meanwhile, private electricity companies have built the country’s first SCPC only in 2011, although the
country began to encourage SCPC adoption since 2006. In the 12th
Five-Year Plan, the country laid out a
program to advance the adoption of incentive policies to build new SCPC plants to help cut CO2 emissions. In
the plan it mandates that 40 per cent of all new building shall be SCPC, while it has projected that in the 13th
Five-Year Plan, 100 per cent of new coal plants must be SCPC or USCPC. India also adopted a program in
2008 to build Ultra Mega Power Plants as an accelerated way to demonstrate the benefits of higher efficiency.
72
To date only domestic Indian electricity companies participated in this program. Having quickly established a
world leading position in SCPC and USCPC technologies, China is sharing its technological progress in clean
coal technologies with India. The Indian government is looking to the private electricity sector to take up an
important part in developing and financing advanced coal-burning combustion power plants in the next ten
years. It is also looking at a greater reliance on renewables as a future source of electricity.
In Kazakhstan, Ukraine, and Mongolia, policy makers have recognized that there are issues with the levels of
CO2 that they emit from their coal based electricity generation sectors. They have not as of yet, however,
committed to a policy of adopting the advanced coal combustion technologies or in replacing their older coal-
burning fleets with a larger capacity, more efficient SCPC based fleet. Mongolia has specified a high efficiency
coal-burning plant be built for the new CHP5 power plant they have offered as a concession to a group of
foreign investors earlier this year. But this does not mandate a SCPC be built. From present plans it looks likely
that neither Mongolia before 2016, nor Kazakhstan before 2018 will get modern, high efficiency electricity
generators added to their present fleets.
Kazakhstan, other than its Balkhash power plant, does not have urgent need for new capacity in the remainder of
this decade. Ukraine likewise has no plans for the next ten years for new capacity additions. Instead the policy is
to upgrade or rehabilitate old, sub-critical coal-fired power plants and rely more on nuclear power, and perhaps,
if it can get outside investors, on more renewable power. Mongolia has an ambitious program to develop new
coal-fired power plants as captive power at its many large mining projects which will be developing over the
coming decade. Presumably Mongolia will look to the foreign mining developer to finance and build these
projected power plants, but there is no information on their likely technological specifications.
In Uzbekistan, policy makers have apparently moved in the wrong direction. Up to quite recently natural gas
power capacity amounted to 88 per cent of the country’s electricity capacity. Natural gas emits less than half the
CO2 that coal does. But Uzbekistan has decided to convert one of its gas-fired power plants into a coal-burning
power plant and it is planning to further increase the share of coal in its electricity generation, policies which
will increase CO2 emissions. It claims that this measure is a step to diversify its energy supply.
Afghanistan, Tajikistan, and Kyrgyzstan all need more electricity than they currently generate. But all three
countries are poor in hydrocarbon resources, but rich in hydropower resources. Their current plans are for
development of new dams and hydropower plants. Plans for Tajikistan and Kyrgyzstan are far advanced and
may have received foreign aid commitments. Afghanistan does not at the present time have concrete power
development plans. Afghanistan could only develop thermal power if it were to import natural gas from
Turkmenistan or Uzbekistan or if in some far distant date it were to find huge hitherto unknown reserves of gas
or coal.
All of the countries have laws and regulations which permit foreign direct investment in principal. But not all of
the countries actively promote or want FDI to come into the electric power generating sector. Those countries
which have not begun to liberalize or privatize their power sectors are especially unreceptive, countries such as
Uzbekistan, Tajikistan, Kyrgyzstan, and to a lesser extent Ukraine. Afghanistan actively promotes FDI into
infrastructure but, as is understandable, investors in such large investments (with such long paybacks) as are
required for electricity generation are not willing to go to Afghanistan without security guarantees. Mongolia is
the only country where the electricity industry has not been liberalized and which is actively promoting large
amounts of FDI into its electricity sector and is offering BOT concessions for generation and incentives for
investment in new transmission.
China since 1985, India since 1991, Kazakhstan since 1995, and Ukraine since 1999 all have received FDI in the
electricity generation sector and all still have foreign investments in it. The overall sums invested have been
relatively small in each country and have not made significant or lasting contributions in any country. Total FDI
into electricity generation in China from inception to date is estimated to be about $16 billion, for India it has
been estimated at $5.9 billion. In Kazakhstan since 1992 it is estimated that FDI has brought $700 million into
its electricity generating sector, while in Ukraine the figure is put at $420 million and in Tajikistan we calculate
it has totalled $200 million (although we are not certain whether this investment has been foreign aid or FDI).
73
As a carrier of advanced fossil fuel combustion technologies for cleaner electricity generation, FDI has to date
put in an insignificant sum of $3.4 billion in both China and India in seven projects.
The planned development program for new generation capacity for the current Five-Year plan in China is
estimated to cost $444 billion. Chinese planners—with an economy nearly four times that of India’s and foreign
reserves more than 11 times larger than India’s—do not think that it will be difficult financing this level of
investment. However they have opened up the prospect to foreign investors to make investments and participate
in building new nuclear power capacity and they are also trying to promote FDI for CCGT power plants.
In India the current 12th
Five-Year Plan calls for $265 billion for the electricity sector. The Indian planners
expect that they are short $38 billion for funding this huge bill and are looking for assistance from all directions,
including FDI but primarily from India’s private sector. They are working hard to promote new FDI for SCPC
power plants: currently a net $1 billion is being invested in two projects.
In the near future there are FDI-backed electricity generation projects in Kazakhstan and Mongolia which
should get under way soon, but it is not clear whether they will deliver advanced clean coal technologies. In
Mongolia terms of the investment are still under negotiation.
Based on past performance, FDI will not deliver enough investment into advanced fossil fuel technologies to
make a significant—or even measurable—abatement impact on the CO2 emissions of either China or India. In
the cases of China and India this situation is primarily due to the huge size of their coal-fired electricity sectors
and thus their CO2 emissions levels. It is still possible (but not likely) that Kazakhstan and Mongolia could
attract enough foreign investment in the coming decade in new large-scale high efficiency coal-fired electricity
generating plants that would make a contribution to the abatement of their CO2 emissions. Conversely to the
situation in China and India, in Kazakhstan and Mongolia, because of the relatively small size of their thermal
power sectors, just two or three large investments in new capacity in each country could make a significant
impact on their CO2 emissions.
In the six fossil fuels burning countries the fundamental obstacle to foreign investments is the very low
profitability on offer to the thermal power industry coupled with the relatively high risks of investing in each of
these countries. The high risks are related to the absence of the rule of law in every country—save in India—
which causes arbitrary rulings, project delays, lack of contract enforcement, confiscations, lack of recourse or
recompense, and general uncertainties. The very low profitability is tied, in every country, to the lack of a
market basis for building up electricity tariffs and ultimately to tariffs offered to investors which are just too low
and do not reflect the full costs of fuel, capital, operations, and returns. Payment issues are also a problem
especially in China, India, Ukraine, and Uzbekistan.
In none of the countries in this study are there tariffs set by cost build-up and which are flexible enough to allow
the pass-through of changing fuel costs. Instead, tariffs are set by fiat, often by local authorities (meaning
political considerations determine tariffs), and they most often reflect a political belief that the end consumers
cannot afford the full cost of energy, which should therefore be subsidized. Likewise there is everywhere a
reluctance to pay higher tariffs to foreign investors than to what is received by state-owned plants, even if the
foreign investor has a contract that permits higher tariff rates. Efforts to reform this situation have been, at best,
half-hearted and ineffective, or non-existent (put off to a later time). India offers contracts to foreign investors
that offer 16 per cent ROI, but investors have learned through hard experience that they cannot hope to earn
these rates of return and they have often had difficulty getting the courts to honour and enforce their power
purchase agreements.
In India, reforms of the electricity industry, and the coal industry that supports it, have been delayed. Market
reforms of electricity prices are something all Indian politicians fear and dread—and so they do not touch, even
when they know that reforms are desperately needed. In China, the economists who run the planning system
know that deeper reforms are still needed, but the real workings of the electricity industry are in the hands of
SOE gencos and local electricity regulators and they resist reforms at every turn.

74
The pricing of electricity is the fundamental problem causing the non-commerciality of the electricity generating
sector for all participants—including SOEs—almost all of our countries. In the past two years, electricity
generating companies in China, India, Ukraine, and Kazakhstan have repeatedly reported sizeable losses.
Mongolia’s gencos are not profitable. Presumably in Uzbekistan the situation in the state monopoly is worse as
the tariffs are so low they cannot cover fuel or operating costs.
Finally when planners in any of the nine countries project look to FDI to help grow their electricity industries
they do not account for the huge competition they face from alternative investment opportunities located
elsewhere in the world in other lower-risk countries. Electricity generating investment funds are looking to
invest in lower risk projects with more reliable rules and fewer uncertainties. The leader among the foreign
investors in China and India, CLP of Hong Kong, is looking for its incremental electricity generating
investments away from China and India and to Australia. In an ironic reversal of roles in the past five years the
major SOE Chinese electricity companies have begun to seek out foreign investments in greenfield projects in
lower-risk countries outside China and have bought positions in some of the IPP developers who first came to
China more than 15 years ago. Furthermore, in the developed countries of the OECD there is a very significant
hostility to any investment in electricity generation using coal. New funds are organized every month for
investments in renewables technologies—some are even specifically directed at the developing countries of Asia
(for example, Terra Firma of the U.K.)—but financing is getting harder everywhere to find for coal-burning
electricity generation.
* * *