Embed Size (px)
Citation preview

Universidade Federal do Rio de Janeiro – UFRJ
Centro de Ciências da Saúde
Faculdade de Odontologia
ESTUDO COMPARATIVO DOS EFEITOS DA EXPANSÃO RÁPIDA
DA MAXILA APÓS USO DO APARELHO TIPO HAAS E HYRAX POR
MEIO DE TOMOGRAFIA COMPUTADORIZADA DE FEIXE CÔNICO
Estela Maris Jurach
CD, MO
Tese submetida ao corpo docente da Faculdade de
Odontologia da Universidade Federal do Rio de Janeiro -
UFRJ, como parte dos requisitos, para a obtenção do Título
de Doutor em Odontologia (Ortodontia).
Rio de Janeiro
2011

ESTUDO COMPARATIVO DOS EFEITOS DA EXPANSÃO RÁPIDA DA
MAXILA APÓS O USO DO APARELHO TIPO HAAS E HYRAX POR MEIO DE
TOMOGRAFIA COMPUTADORIZADA DE FEIXE CÔNICO
ESTELA MARIS JURACH, CD, MO
Orientador: Profa. Dra. Matilde da Cunha Gonçalves Nojima
Tese submetida ao corpo docente da Faculdade de
Odontologia da Universidade Federal do Rio de Janeiro -
UFRJ, como parte dos requisitos para obtenção do Título
de Doutor em Odontologia (Ortodontia).
Comissão Examinadora _____________________________
Prof. Dr. Antônio Carlos de Oliveira Ruellas, CD,MO,D
_____________________________ Profa. Dra. Ana Maria Bolognese,
CD,MO,D
_____________________________ Profa. Dra. Matilde da Cunha
Gonçalves Nojima, CD, MO,D
______________________________ Profa. Dra. Marcia Tereza de Oliveira
Caetano, CD,MO,D
_____________________________ Prof. Dr. Renésio Armindo Grehs, CD,MO,D
Rio de Janeiro
2011

ii
Ficha Catalográfica
JURACH, Estela Maris
Estudo comparativo dos efeitos da expansão rápida da maxila após o
uso do aparelho tipo Haas e Hyrax por meio de tomografia computadorizada
de feixe cônico. Rio de Janeiro: UFRJ/Faculdade de Odontologia, 2011.
xxviii, 124 f.
Tese: Doutorado em Odontologia (Ortodontia) – Universidade Federal
do Rio de Janeiro, Faculdade de Odontologia, 2011.
1. Expansão rápida da maxila 2. Tomografia computadorizada
3. Alterações esqueléticas 4. Alterações dentoalveolares
5. Teses
I Título
II Tese (Doutorado – UFRJ/Faculdade de Odontologia)

iii
Ao meu filho, Gabriel, que, desde que nasceu, serve como estímulo,
inspiração e que, todos os dias, me ensina algo; ao meu marido, Gustavo, que
sempre me apoiou e me concedeu suporte para que esse trabalho pudesse ser
concluído; aos meus pais, Suelly e Eduilio, pela vida e pelo exemplo que me
deram, e aos meus irmãos que sempre me estimularam a crescer. Dedico a todos
vocês que amo muito!
iv
AGRADECIMENTOS
A Deus, pela vida, pelas oportunidades, pelas pessoas que colocou em
meu caminho, pela força que sempre tive para continuar.
À coordenadora do Programa de Pós-Graduação em Odontologia da
UFRJ, Profa. Dra. Margareth Maria Gomes de Souza, pela dedicação e pelo
compromisso com a formação de novos doutores.
À Profa. Dra. Matilde da Cunha Gonçalves Nojima, de forma especial,
pela amizade, dedicação, orientação e pelo apoio para a realização desta tese;
muito obrigada à sua família que, muitas vezes, ficou ausente por dedicar-se a
minha causa.
Aos professores do Departamento de Ortodontia, Profa. Dra. Ana Maria
Bolognese, Dr. Lincoln Nojima Prof. Dr. Antônio Carlos de Oliveira Ruellas,
Eduardo Franzotti Sant’ Anna, Profa. Dra. Mônica Tirre de Souza Araújo, pelo
apoio, pelos ensinamentos, pela amizade e pelo exemplo de dedicação ao ensino
e à pesquisa.
Aos professores da disciplina de Ortodontia da Universidade Federal de
Santa Maria que me substituíram, permitindo que eu pudesse afastar-me para a
realização do doutorado: Renésio Armindo Grehs e Vilmar Antonio Ferrazzo.
Aos funcionários do departamento: Valtencir, Robson, Mônica, Vanilda,
Fernandinha e Diane.

v
Aos meus colegas de doutorado, Hugo Caracas, José Vinicius
Bolognesi Maciel , pelo apoio e incentivo; de forma especial, José Columbano
Neto e Camilo Aquino Melgaço pela amizade, pelo apoio e pela dedicação na
realização e na conclusão da tese,
A minha mãe, Suelly que sempre esteve presente nas horas que mais
precisei; dando-me apoio; ao Gustavo e ao Gabriel por entenderem a
necessidade da minha ausência junto a eles para poder concluir a tese.
À FAPERJ, pelos recursos fornecidos para a obtenção do programa
DOLPHIN
À CAPES, pela bolsa de estudos concedida.
Muito obrigada!!
vi
RESUMO
JURACH, Estela Maris. Estudo comparativo dos efeitos da expansão rápida
da maxila após o uso do aparelho tipo Haas e Hyrax por meio de tomografia
computadorizada de feixe cônico. Orientadora: Dra. Matilde da Cunha
Gonçalves Nojima. Rio de Janeiro: UFRJ/Faculdade de Odontologia, 2011. Tese
(Doutorado em Odontologia – Ortodontia). xxviii, 124 f.
Os objetivos deste estudo foram verificar o comportamento esquelético,
dentário e das corticais ósseas vestibulares e palatinas dos dentes de suportes
de indivíduos tratados com expansão rápida da maxila (ERM), utilizando-se
aparelhos tipo Haas e Hyrax. Trinta e dois indivíduos em fase de crescimento,
com maturação das vértebras cervicais no estágio CS3, foram divididos, de forma
randomizada, em dois grupos: Grupo 1 (um), com 16 indivíduos submetidos à
ERM com aparelho tipo Haas e, Grupo 2(dois), formado por 16 indivíduos
submetidos à ERM com aparelho tipo Hyrax. Ambos os grupos seguiram o
mesmo protocolo de ativação: ¼ de volta pela manhã e ¼ à noite, até a expansão
necessária. Os dispositivos foram mantidos em boca pelo período de seis meses
para contenção. A comparação entre os grupos Haas e Hyrax foi realizada em
três tempos experimentais: inicial (T1), pós-ERM (T2) e após seis meses de

vii
contenção (T3), por meio da análise de tomografias computadorizadas de feixe
cônico (TCFC). Todas as variáveis foram submetidas à análise estatística por
meio de Teste t de Student, bem como à comparação dos intervalos (T2-T1, T3-
T1, T3-T2). A comparação dos desfechos entre os diferentes tempos
experimentais foi avaliada para cada grupo, isoladamente, por meio de Test t para
amostras pareadas (=0,05). Na comparação do efeito do tratamento ortopédico
entre os grupos, não houve diferenças estatísticas quanto à abertura da sutura
palatina mediana, largura maxilar óssea, largura da fossa nasal, bem como na
comparação da movimentação dentária de incisivos centrais, primeiros pré-
molares e primeiros molares superiores. A sutura palatina mediana abriu de forma
paralela no sentido vertical e no sentido ântero-posterior nos dois grupos. Houve
maior aumento da largura alveolar maxilar lingual no período de contenção na
região dos primeiros molares e primeiros pré-molares no grupo que utilizou
aparelho tipo Haas. No final do tratamento esta diferença permaneceu apenas na
região dos primeiros molares sendo estatisticamente significante. A largura
alveolar maxilar vestibular não apresentou diferença estatística entre os grupos
nos intervalos avaliados. O aparelho tipo Hyrax ofereceu maior perda da tábua
óssea vestibular dos dentes de suporte e, em contrapartida, apresentou, no
período após seis meses de contenção, maior espessura da tábua óssea palatina.
Em relação às corticais alveolares vestibulares, verificou-se que seis meses de
contenção são insuficientes para que aconteça o retorno às suas dimensões
originais.
viii
SUMMARY
JURACH, Estela Maris. Estudo comparativo dos efeitos da expansão rápida
da maxila após o uso do aparelho tipo Haas e Hyrax por meio de tomografia
computadorizada de feixe cônico. Orientadora: Dra. Matilde da Cunha
Gonçalves Nojima. Rio de Janeiro: UFRJ/Faculdade de Odontologia, 2011. Tese
(Doutorado em Odontologia – Ortodontia). xxviii, 124 f.
This study evaluated skeletal and dental changes, as well as changes in
buccal and palatal cortical bones of anchorage teeth, in individuals treated with
rapid maxillary expansion (RME) using Haas and Hyrax expanders. Thirty-two
growing individuals with cervical vertebrae in maturation stage CS3 were randomly
divided into two groups: Group 1, 16 individuals that underwent RME using a Haas
expander; and Group 2, 16 individuals treated with Hyrax expanders. Both groups
followed the same activation schedule, ¼ of a turn in the morning and ¼ at night
until the necessary expansion was achieved. After expansion, the expanders were
kept in the mouth for 6 months for retention. The Haas and Hyrax groups were
compared using cone beam computed tomography (CBCT) at 3 time points:
baseline (T1), after RME (T2) and after 6 months of retention (T3). All the
variables, as well as comparisons between time points (T2-T1, T3-T1, T3-T2),
were analyzed statistically using the Student t test. The comparison of outcomes

ix
at different time points was evaluated for each group separately using a t test for
paired samples (=0.05). The comparison of orthopedic outcomes between
groups did not reveal any statistically significant differences in midpalatal suture
opening, maxillary bone width, nasal fossa width or movement of maxillary central
incisors, first premolars or upper first molars. The opening of the midpalatal suture
was parallel vertically and anteroposteriorly in the two groups. A higher increase in
maxillary lingual alveolar width was observed during the retention period at the
premolars and first molar regions in the Haas group. At the end of the treatment,
this difference, which was statistically significant, remained only at the first molar
region. Maxillary buccal alveolar width showed no statistical difference between
the two groups at the different time points. The Hyrax expander generated greater
buccal bone plate loss at the level of the anchorage teeth; in contrast, the
thickness of the lingual bone plate was greater after 6 months of retention. The
evaluation of the buccal alveolar bone revealed that 6 months of retention was not
enough to regain the original dimension of cortical bone.
x
RESUMEN
JURACH, Estela Maris. Estudo comparativo dos efeitos da expansão rápida
da maxila após o uso do aparelho tipo Haas e Hyrax por meio de tomografia
computadorizada de feixe cônico. Orientadora: Dra. Matilde da Cunha
Gonçalves Nojima. Rio de Janeiro: UFRJ/Faculdade de Odontologia, 2011. Tese
(Doutorado em Odontologia – Ortodontia). xxviii, 124 f.
Los objetivos de este estudio fueron verificar el comportamiento
esquelético, dentario y de las corticales vestibulares y palatinas de los dientes de
anclaje de individuos tratados con expansión rápida del maxilar (ERM),
utilizándose aparatos de expansión tipo Haas y tipo Hyrax. Treinta y dos
individuos en fase de crecimiento, con madurez de las vértebras cervicales en el
estadio CS3, fueron divididos, aleatoriamente, en dos grupos: Grupo 1, con 16
individuos sometidos a la ERM con aparato tipo Haas, y Grupo 2, formado por 16
individuos sometidos a la ERM con aparato tipo Hyrax. Ambos grupos siguieron el
mismo protocolo de activación: ¼ de vuelta por la mañana y ¼ por la noche, hasta
lograrse la expansión necesaria. Se mantuvieron los dispositivos en la cavidad
bucal durante un período de seis meses para contención. Se hizo la comparación
entre los grupos Haas y Hyrax en 3 tiempos experimentales: inicial (T1), post
ERM (T2) y tras 6 meses de contención (T3), mediante el análisis de tomografías
computarizadas de haz cónico (TCHC). Todas las variables fueron sometidas al
análisis estadístico por medio de la prueba t de Student, bien como a la
comparación de las variables (T2-T1, T3-T1, T3-T2). La comparación de los
resultados entre los diferentes tiempos experimentales fue evaluada para cada
grupo, aisladamente, por medio de la prueba t para muestras pareadas (=0,05).

xi
En la comparación del efecto del tratamiento ortopédico entre los grupos, no hubo
diferencias estadísticas cuanto a la abertura de la sutura media palatina, anchura
maxilar ósea, anchura de la fosa nasal, bien como al movimiento dentario de
incisivos centrales, primeros premolares y primeros molares superiores. La sutura
media palatina se abrió de forma paralela, en las direcciones vertical y
anteroposterior, en los dos grupos. Hubo un mayor aumento en la anchura
alveolar maxilar lingual durante el periodo de contención en la región de primeros
molares y primeros premolares en el grupo Haas. Al final del tratamiento, esta
diferencia se mantuvo apenas en la región de los primeros molares, siendo
estadísticamente significativa. La anchura alveolar maxilar vestibular no presentó
diferencia estadística entre los grupos en los intervalos de tiempo evaluados. El
aparato tipo Hyrax proporcionó una mayor pérdida de la tabla ósea vestibular de
los dientes de anclaje y, en contrapartida, presentó, en el período después de 6
meses de contención, mayor espesura de la tabla ósea palatina. En relación a las
corticales alveolares vestibulares, se comprobó que 6 meses de contención son
insuficientes para el retorno a las dimensiones originales.
xii
LISTA DE FIGURAS
DELINEAMENTO DA PESQUISA
Quadro 1 - Dados básicos da coleta da casuística. ....................................... 6
Quadro 2 - Caracterização da casuística. ..................................................... 7
Figura 1 - Representação esquemática dos estágios de maturação
das vértebras cervicais segundo Baccetti et al. (2005). ............. 15
Figura 2 - Imagem digital da cabeça orientada de acordo com os
planos axial (azul), coronal (verde) e sagital (vermelho)
utilizados (Software Dolphin Imaging® versão 11.5). ................. 15
Figura 3 - Imagem do volume e RMPs. A Corte Coronal; B Corte
Sagital; C Corte Axial; D Reconstrução em 3D. (Fonte:
Dissertação UFRJ 2010 - Carolina Baratieri (orientador: Lincoln
Issamu Nojima) - Estudo tomográfico da expansão rápida da maxila
na maloclusão de Classe II, divisao 1). ............................................... 16
Figura 4 - Imagem das RMPs do Software Dolphin®, função
Measurement ilustrando metodologia para avaliação da
sutura palatina mediana. A Corte coronal passando pela
espinha nasal posterior com os pontos (1, 2, 3, 4) e
planos axial e sagital passando pelo ponto1; B Corte
sagital com a identificação de espinha nasal posterior

xiii
(ENP), planos axial e coronal passando sobre o ponto 1;
C Corte axial passando pelo assoalho da fossa nasal e
plano sagital sobre o ponto 1; D Reconstrução em 3D.
Plano sagital (linha vermelha); plano coronal (linha verde);
plano axial (linha azul). ............................................................. 19
Quadro 3 - Definição das medidas utilizadas para avaliação da sutura
palatina mediana na análise tomográfica. .................................. 19
Figura 5 - Imagem das RMPs do Software Dolphin®, função
Mesuarement, com a metodologia para localização do
ápice radicular do incisivo central superior esquerdo. A
corte coronal com o ponto Ice (Ar) localizado na
intersecção do plano axial e sagital; B corte sagital onde o
ponto Ice (Ar) está representado pela intersecção dos
planos axial e coronal; C corte axial e o ponto Ice (ar) está
representado pela intersecção dos planos coronal e plano
sagital passando sobre o ápice do incisivo central superior
esquerdo;. D Reconstrução em 3D. Plano sagital (linha
vermelha); plano coronal (linha verde); plano axial (linha
azul). ......................................................................................... 20
Figura 6 - Imagem das RMPs do Software Dolphin®, função
Measurement com a metodologia para localização do
ponto de referência na junção cemento-esmalte do
incisivo central permanente superior esquerdo. A Corte
coronal, ilustrando plano sagital posicionado na junção
cemento-esmalte do incisivo central superior esquerdo;
xiv
ponto Ice (jce) localizado na intersecção do plano sagital
com o axial; B Corte sagital tangenciando a mesial do
dente 21 mostrando plano axial sobre a junção cemento-
esmalte e plano coronal passando no meio do dente no
sentido vestíbulo-lingual; C Corte axial, confirmando a
localização dos pontos nos dentes 11-Icd (jce) e 21-Ice
(jce)(intersecção do plano sagital com o coronal) e
medição da distância linear entre ambos; D Reconstrução
em 3D. Plano sagital (linha vermelha); plano coronal
(linha verde); plano axial (linha azul). ........................................ 21
Quadro 4 - Definição dos pontos para avaliação da distância entre
incisivos centrais superiores na análise tomográfica. ................ 21
Quadro 5 - Definição das medidas utilizadas para avaliação da
distância entre incisivos centrais superiores na análise
tomográfica. .............................................................................. 22
Figura 7 - Imagem de reconstrução multiplanar (RMP) do Software
Dolphin®, função Mesuarement ilustrando metodologia
para avaliação da largura maxilar esquelética e largura da
fossa nasal: A Corte coronal passando pelo processo
zigomático da maxila com a identificação do plano sagital
passando sobre o ponto FnE localizada a 10mm acima do
plano da largura maxilar esquelética (MxD-MxE)
localizado sobre o plano axial, que passa pela borda mais
superior da concavidade do osso maxilar, caracterizada
pela junção da maxila com o processo zigomático da

xv
maxila. Identificação dos pontos MxD, MxE, FnD e FnE; B
Corte sagital passando na porção mais externa da fossa
nasal esquerda com a localização do ponto (FnE) sobre o
plano coronal e plano axial sobre a junção da maxila com
o processo zigomático da maxila; C Corte axial passando
pelo ponto mais profundo do contorno do processo
zigomático da maxila, com a marcação bilateral dos
pontos MxD e MxE onde passa o plano coronal; D
Reconstrução em 3D. Plano sagital (linha vermelha);
plano coronal (linha verde); plano axial (linha azul)
(Software Dolphin Imaging® 11.0). ............................................ 23
Quadro 6 - Definição das medidas utilizadas para avaliação da
largura maxilar esquelética e largura da fossa nasal na
análise tomográfica. .................................................................. 23
Figura 8 - Imagem das RMPs do Software Dolphin®, função
Measurement ilustrando metodologia para localização da
trifurcação dos primeiros molares: A Corte coronal com a
identificação do plano sagital (linha vermelha) e do plano
axial (linha azul), o qual passa sobre a trifurcação dos
elementos dentários 26; B Corte sagital com a
identificação do plano axial e plano coronal que passam
entre as raízes mésio-vestibular e disto-vestibular do
elemento 26, na altura da furca; C Corte axial
confirmando a localização do plano coronal e do plano
sagital sobre a trifurcação do primeiro molar permanente;
xvi
D Reconstrução em 3D plano coronal (linha verde)
passando entre as raízes mésio vestibular e disto-
vestibular do primeiro molar permanente. .................................. 25
Figura 9 - Imagem das RMPs do Software Dolphin®, função
Measurement ilustrando metodologia para demarcação
dos pontos para avaliação da largura maxilar alveolar. A
Corte coronal com a identificação do plano sagital (linha
vermelha) e do plano axial (linha azul), o qual passa sobre
o ponto Mav/26; localização dos pontos Mav/16, Map/16,
Map/26 B – corte sagital confirmando o ponto Mav/26 –
intersecção do plano coronal (verde) com o axial (azul) C
Corte axial confirmando a localização do ponto Mav/26
intersecção dos planos coronal e sagital; D Reconstrução
em 3D. Plano sagital; plano coronal (linha verde). ..................... 25
Quadro 7 - Definição dos pontos utilizados para avaliação da largura
maxilar alveolar na análise tomográfica. .................................... 26
Quadro 8 - Definição das medidas utilizadas para avaliação da
largura maxilar alveolar na análise tomográfica. ........................ 26
Figura 10 - Imagem das RMPs do Software Dolphin®, função
Measurement ilustrando metodologia para avaliação da
largura maxilar dentária. A Localização do ponto AP no
ápice da raíz palatina dos primeiros molares permanentes
superiores esquerdo (AP/26)-intersecção do plano
sagital(linha vermelha) com o planoaxial (linha azul), no
corte coronal; B. Ponto AP/26 localizado na intersecção

xvii
do plano coronal(verde) com axial (azul); C Ponto AP/26
localizado no corte axial-intersecção do plano coronal
(verde) com o plano sagital (vermelho); D. Reconstrução
em 3D evidenciando o plano coronal (verde) passando
sobre a raiz palatina do primeiro molar superior esquerdo. ........ 28
Quadro 9 - Definição das medidas utilizadas para avaliação da
largura maxilar dentária na análise tomográfica. ....................... 29
Quadro 10 - Definição das medidas utilizadas para avaliação da
largura maxilar dentária na análise tomográfica. ....................... 30
Quadro 11 - Definição das medidas utilizadas para avaliação da
angulação alveolar dos primeiros molares permanentes
superiores na análise tomográfica. ............................................ 31
Quadro 12 - Definição das medidas utilizadas para avaliação da
inclinação dos primeiros molares permanentes superiores
na análise tomográfica. ............................................................. 32
Figura 11 - Imagem das RMPs do Software Dolphin®, função
Measurement ilustrando metodologia para localização
tridimensional utilizada na avaliação das corticais ósseas
dos primeiros molares permanentes superiores: A Corte
coronal identificando o plano axial passando sobre a
trifurcação das raízes de 16 e 26 e plano sagital passando
sobre a cortical alveolar vestibular na altura da raiz disto-
vestibular do 26; B e C Corte sagital e axial
respectivamente confirmando a localização do ponto
sobre a cortical alveolar vestibular na altura da raiz disto-

xviii
vestibular do 26; D Reconstrução em 3D. Plano sagital
(linha vermelha); plano coronal (linha verde); plano axial
(linha azul). ............................................................................... 33
Quadro 13 - Definição das medidas utilizadas para avaliação da
espessura das corticais ósseas dos primeiros molares
permanentes na análise tomográfica. ........................................ 34
Quadro 14 - Definição das medidas utilizadas para avaliação da
espessura das corticais ósseas dos primeiros pré-molares
na análise tomográfica. ............................................................. 35
ARTIGO 1
Figure 1 - Multiplanar reconstruction images (MPR) to measure the
width of the midpalatal suture opening. Width of the
midpalatal suture in the PNS region at the level of the
nasal fossa between points 1 and 2 (PNS-NF). Width of
the midpalatal suture in the PNS region, at the level of the
HP, between points 3 and 4 (PNS-HP). Width of the
midpalatal suture in the anterior nasal spine region at the
level of the nasal fossa between points 5 and 6 (ANS-NF).
Width of the midpalatal suture in the anterior nasal spine
region at the level of the hard palate between points 7 and
8 (ANS-HP). A. Coronal slice intersecting PNS; B. Sagittal
slice and identification of PNS; C. Coronal slice
intersecting ANS; D. Sagittal slice and identification of
ANS (Dolphin Imaging® 11.0). .................................................. 44
xix
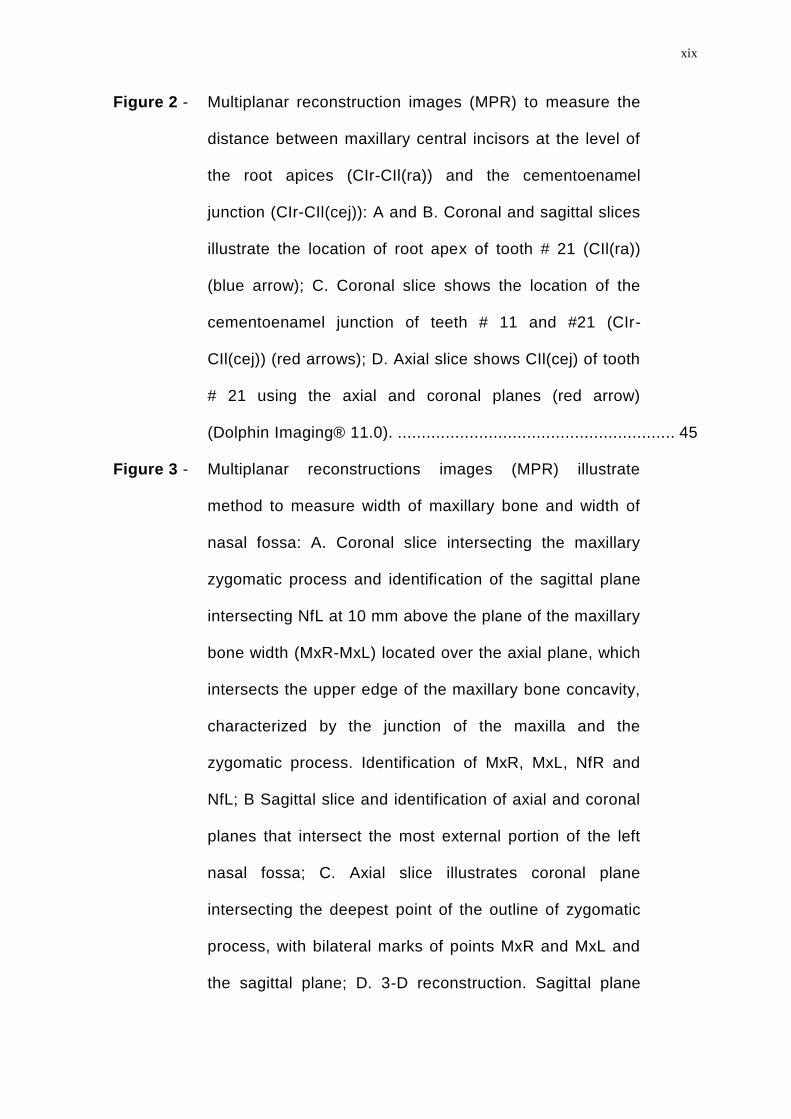
Figure 2 - Multiplanar reconstruction images (MPR) to measure the
distance between maxillary central incisors at the level of
the root apices (CIr-CIl(ra)) and the cementoenamel
junction (CIr-CIl(cej)): A and B. Coronal and sagittal slices
illustrate the location of root apex of tooth # 21 (CIl(ra))
(blue arrow); C. Coronal slice shows the location of the
cementoenamel junction of teeth # 11 and #21 (CIr-
CIl(cej)) (red arrows); D. Axial slice shows CIl(cej) of tooth
# 21 using the axial and coronal planes (red arrow)
(Dolphin Imaging® 11.0). .......................................................... 45
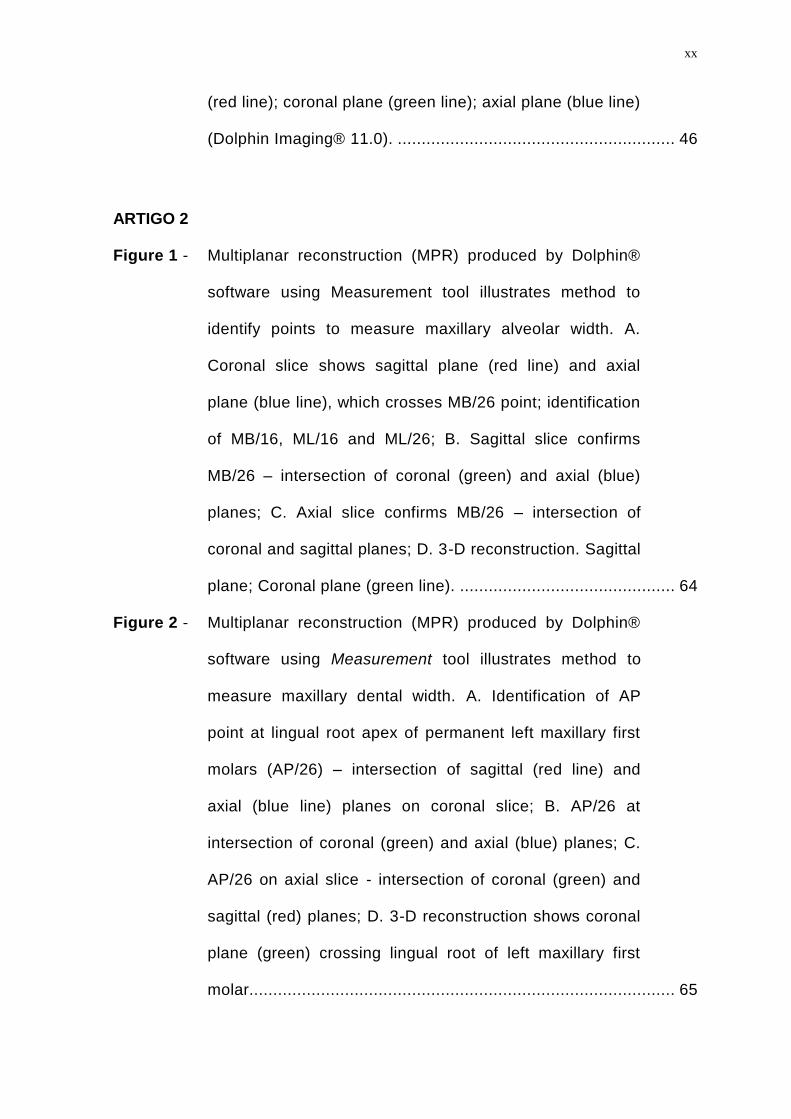
Figure 3 - Multiplanar reconstructions images (MPR) illustrate
method to measure width of maxillary bone and width of
nasal fossa: A. Coronal slice intersecting the maxillary
zygomatic process and identification of the sagittal plane
intersecting NfL at 10 mm above the plane of the maxillary
bone width (MxR-MxL) located over the axial plane, which
intersects the upper edge of the maxillary bone concavity,
characterized by the junction of the maxilla and the
zygomatic process. Identification of MxR, MxL, NfR and
NfL; B Sagittal slice and identification of axial and coronal
planes that intersect the most external portion of the left
nasal fossa; C. Axial slice illustrates coronal plane
intersecting the deepest point of the outline of zygomatic
process, with bilateral marks of points MxR and MxL and
the sagittal plane; D. 3-D reconstruction. Sagittal plane
xx
(red line); coronal plane (green line); axial plane (blue line)
(Dolphin Imaging® 11.0). .......................................................... 46
ARTIGO 2
Figure 1 - Multiplanar reconstruction (MPR) produced by Dolphin®
software using Measurement tool illustrates method to
identify points to measure maxillary alveolar width. A.
Coronal slice shows sagittal plane (red line) and axial
plane (blue line), which crosses MB/26 point; identification
of MB/16, ML/16 and ML/26; B. Sagittal slice confirms
MB/26 – intersection of coronal (green) and axial (blue)
planes; C. Axial slice confirms MB/26 – intersection of
coronal and sagittal planes; D. 3-D reconstruction. Sagittal
plane; Coronal plane (green line). ............................................. 64
Figure 2 - Multiplanar reconstruction (MPR) produced by Dolphin®
software using Measurement tool illustrates method to
measure maxillary dental width. A. Identification of AP
point at lingual root apex of permanent left maxillary first
molars (AP/26) – intersection of sagittal (red line) and
axial (blue line) planes on coronal slice; B. AP/26 at
intersection of coronal (green) and axial (blue) planes; C.
AP/26 on axial slice - intersection of coronal (green) and
sagittal (red) planes; D. 3-D reconstruction shows coronal
plane (green) crossing lingual root of left maxillary first
molar......................................................................................... 65

xxi
ARTIGO 3
Figure 1 - Multiplanar reconstruction images on the Dolphin®
software, Measurement function, showing the
methodology used to locate the trifurcation of first molars.
A) Coronal view showing the sagittal plane (red line) and
the axial plane (blue line) crossing the trifurcation of tooth
# 16 (yellow arrow), B) Sagittal view showing the axial and
coronal planes, positioned between the mesiobuccal and
distobuccal roots of tooth # 16, at the level of the furcation
(yellow arrow); C) Axial view confirming location of the
coronal and sagittal planes on the trifurcation of the
permanent first molar (yellow arrow); D) 3D
reconstruction, front view. ......................................................... 84
Figure 2 - Measurement of cortical bone of maxillary first permanent
molars. MBCBT = cortical bone thickness of mesiobuccal
root: distance from external edge of buccal cortical bone
to center of buccal surface of mesiobuccal root of first
permanent molar in both sides (16/MBCBT and
26/MBCBT); DBCBT = cortical bone thickness of
distobuccal root: distance from external edge of buccal
cortical bone to center of buccal surface of distobuccal
root of first permanent molar in both sides (16/DBCBT and
26/DBCBT); LCBT = cortical bone thickness of lingual
root: distance from external edge of lingual cortical bone

xxii
to center of lingual surface of lingual root of maxillary first
permanent molar (16/LCBT and 26/LCBT). ................................ 85
xxiii
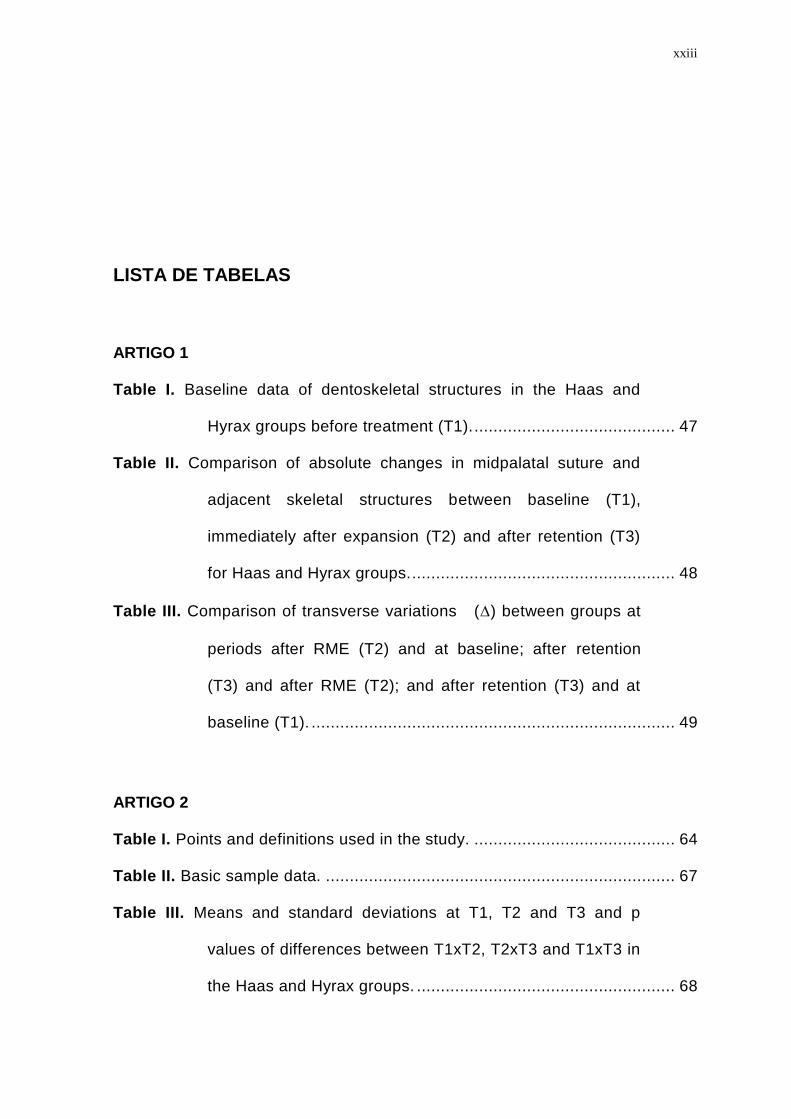
LISTA DE TABELAS
ARTIGO 1
Table I. Baseline data of dentoskeletal structures in the Haas and
Hyrax groups before treatment (T1). .......................................... 47
Table II. Comparison of absolute changes in midpalatal suture and
adjacent skeletal structures between baseline (T1),
immediately after expansion (T2) and after retention (T3)
for Haas and Hyrax groups. ....................................................... 48
Table III. Comparison of transverse variations () between groups at
periods after RME (T2) and at baseline; after retention
(T3) and after RME (T2); and after retention (T3) and at
baseline (T1). ............................................................................ 49
ARTIGO 2
Table I. Points and definitions used in the study. .......................................... 64
Table II. Basic sample data. ......................................................................... 67
Table III. Means and standard deviations at T1, T2 and T3 and p
values of differences between T1xT2, T2xT3 and T1xT3 in
the Haas and Hyrax groups. ...................................................... 68

xxiv
Table IV. Mean values and standard deviations of treatment effects (∆)
at intervals: T2-T1, T3-T1 and T3-T2 in Haas and Hyrax
groups and the comparison between them. ............................... 69
ARTIGO 3
Table I. Comparison of baseline data for cortical bone thickness
between Haas and Hyrax groups before treatment (T1). ............ 86
Table II. Comparisons of transverse measures between periods after
RME (T2) and at baseline; after retention (T3) and after
RME (T2); and between after retention (T3) and at
baseline (T1). ............................................................................ 87
Table III. Comparison of bone thickness changes/variations ()
between Haas and Hyrax groups, after RME (T2-T1), after
retention (T3-T2) and after retention in relation to baseline
(T3-T1). ..................................................................................... 88
xxv
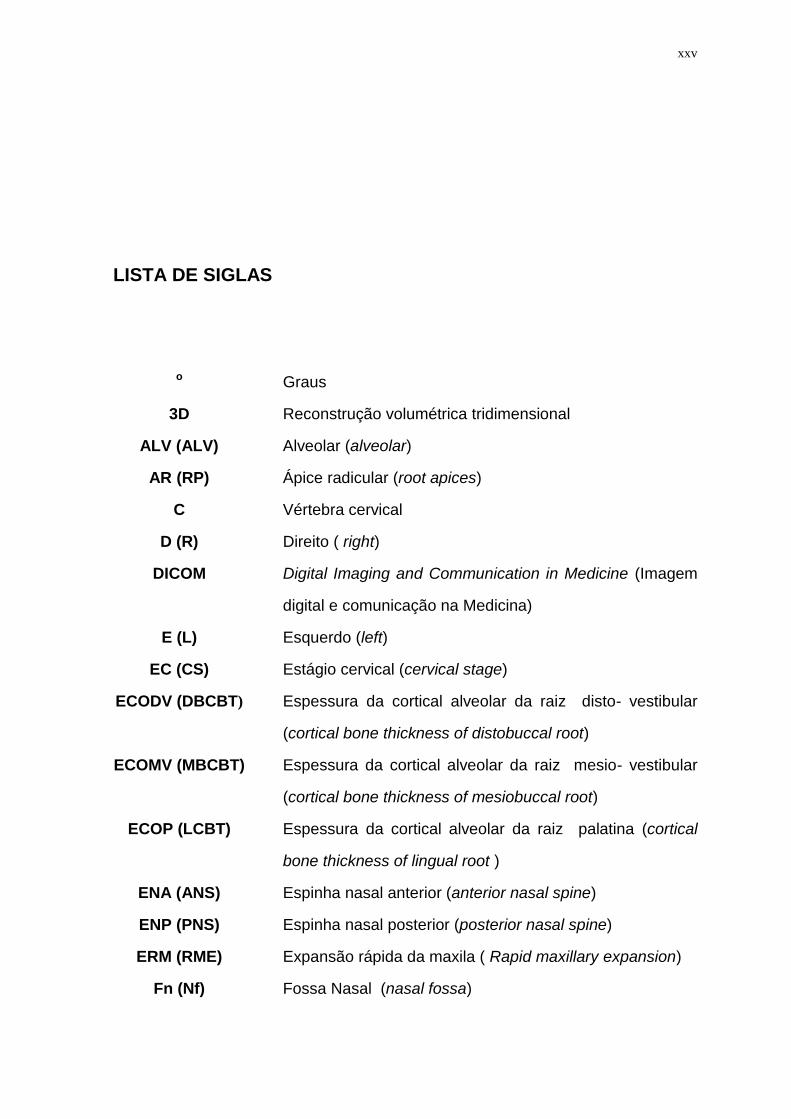
LISTA DE SIGLAS
o Graus
3D Reconstrução volumétrica tridimensional
ALV (ALV) Alveolar (alveolar)
AR (RP) Ápice radicular (root apices)
C Vértebra cervical
D (R) Direito ( right)
DICOM Digital Imaging and Communication in Medicine (Imagem
digital e comunicação na Medicina)
E (L) Esquerdo (left)
EC (CS) Estágio cervical (cervical stage)
ECODV (DBCBT) Espessura da cortical alveolar da raiz disto- vestibular
(cortical bone thickness of distobuccal root)
ECOMV (MBCBT) Espessura da cortical alveolar da raiz mesio- vestibular
(cortical bone thickness of mesiobuccal root)
ECOP (LCBT) Espessura da cortical alveolar da raiz palatina (cortical
bone thickness of lingual root )
ENA (ANS) Espinha nasal anterior (anterior nasal spine)
ENP (PNS) Espinha nasal posterior (posterior nasal spine)
ERM (RME) Expansão rápida da maxila ( Rapid maxillary expansion)
Fn (Nf) Fossa Nasal (nasal fossa)
xxvi
FOV Campo de visão (Field of view)
IESC Instituto de Estudos em Saúde Coletiva
INC (TIP) Inclinação ( tipping)
JCE (Cej) Junção cemento esmalte (Cementenamel junctions)
Kv Quilovoltagem
Ma (Ma) Maxilar alveolar ( maxillary alveolar)
mA Miliamperagem
mm Milímetro
Mx (Mx) Maxila (maxilla)
N Násio
OrD Orbital direito
OrE Orbital esquerdo
P (L) Palatino (lingual)
PD (HD) Palato duro (hard palate)
PoD Pório direito
PoE Pório esquerdo
RMP (MPR) Reconstruções multiplanares (multiplanar reconstruction)
SC(CG) Sulco central ( central groove)
T1 Tempo 1 (inicial)
T2 Tempo 2 ( imediatamente após a ativação do parafuso)
T3 Tempo 3 (pós-contenção)
TC Tomografia computadorizada
TCFC (CBCT) Tomografia computadorizada de feixe cônico (Cone
beam computed tomography)
UFRJ Universidade Federal do Rio de Janeiro
V (B) Vestibular( buccal)
xxvii
ÍNDICE
1 INTRODUÇÃO ............................................................................................. 1
2 PROPOSIÇÃO ............................................................................................. 4
3 DELINEAMENTO DA PESQUISA ................................................................ 5
3.1 Caracterização da casuística ...................................................................... 5
3.2 Protocolo para expansão rápida da maxila ............................................... 7
3.3 Etapas laboratoriais de confecção dos aparelhos tipo Haas e
aparelhos tipo Hyrax ......................................................................................... 8
3.3.1 Confecção do Aparelho tipo Haas .......................................................... 9
3.3.2 Confecção do Aparelho tipo Hyrax ....................................................... 10
3.4 Protocolo de instalação e ativação para ERM ......................................... 10
3.5 Obtenção das tomografias computadorizadas de feixe cônico
(TCFC) ............................................................................................................... 12
3.6 Metodologia para avaliação da idade esquelética .................................. 13
3.7 Metodologia para avaliação das imagens tomográficas ........................ 15
3.7.1 Pontos para localização dos planos de referência ............................... 16
3.7.2 Planos de referência ............................................................................ 17
3.7.3 Avaliação da Sutura Palatina Mediana ................................................. 17

xxviii
3.7.4 Avaliação da distância entre incisivos centrais superiores ................... 20
3.7.5 Avaliação da largura maxilar esquelética e largura da fossa nasal ...... 22
3.7.6 Avaliação da largura maxilar alveolar ................................................... 24
3.7.7 Avaliação da largura maxilar dentária .................................................. 27
3.7.8 Avaliação da angulação alveolar e inclinação dentária dos primeiros
molares permanentes superiores .................................................................. 30
3.7.9 Avaliação da espessura das corticais ósseas ...................................... 32
3.8 Análise estatística...................................................................................... 35
4 DESENVOLVIMENTO DA PESQUISA ....................................................... 37
4.1 ARTIGO 1 .................................................................................................... 37
4.2 ARTIGO 2 .................................................................................................... 37
4.3 ARTIGO 3 .................................................................................................... 38
5 DISCUSSÃO.............................................................................................. 98
6 CONCLUSÃO .......................................................................................... 109
7 RECOMENDAÇÕES ................................................................................ 113
8 REFERENCIAS BIBLIOGRAFICAS ......................................................... 114
9 ANEXOS 118
ANEXO I .......................................................................................................... 119
ANEXO II ......................................................................................................... 122
ANEXO III ........................................................................................................ 123

1 INTRODUÇÃO
A expansão rápida da maxila (ERM) tem como objetivo principal o aumento
da largura transversa do arco dental maxilar e da base apical com o mínimo de
movimento dentário dentro do osso alveolar (HAAS, 1961; HAAS, 1965). Essa
modalidade é indicada em pacientes que possuem deficiência de dimensão
transversa da maxila e apresentam crescimento ósseo, sem fechamento das
suturas (HAAS, 1965; MELSEN, 1975; WERTZ e DRESKIN, 1977; HAAS, 1980).
O diagnóstico deste problema exige a coleta adequada de dados no sentido de
estabelecer o programa terapêutico eficaz e evitar o desenvolvimento de
consequências desfavoráveis à saúde bucal (HAAS, 1965; 1980; McNAMARA,
2000). A deficiência transversa da maxila pode levar a desvios funcionais da
mandíbula e consequente crescimento assimétrico, comprometimento da estética
do sorriso, respostas periodontais adversas e alterações funcionais decorrentes
da constrição maxilar (FARRET et al., 1998; LIMA et al., 2005).
A expansão rápida da maxila caracteriza-se por utilizar forças de
magnitude elevada com o intuito de obter resposta esquelética máxima, através
da abertura da sutura palatina mediana, com movimento dentário mínimo. Dentre
os aparelhos expansores, os mais utilizados para obtenção de resposta
ortopédica são os disjuntores tipo Haas e Hyrax. A principal diferença entre
ambos consiste na presença de um bloco acrílico, apoiado sobre as paredes

2
laterais do palato, nos disjuntores de Haas. A sua função é aumentar a
ancoragem para potencializar o efeito ortopédico, além de proporcionar melhor
distribuição das forças produzidas durante a expansão, de maneira a não
sobrecarregar dentes de ancoragem e corticais ósseas vestibulares
correspondentes. O bloco de acrílico nos disjuntores de Haas também seria útil
durante a fase de contenção, atuando como anteparo, para evitar a recidiva da
região dentoalveolar (HAAS, 1970). O disjuntor tipo Hyrax, por não possuir a
porção de acrílico, apresenta a vantagem de ser mais higiênico e, desse modo,
evitaria irritações na mucosa palatina decorrentes da impacção alimentar
(BIEDERMAN, 1968).
A força distribuída na expansão rápida da maxila produz áreas de
compressão no ligamento periodontal dos dentes de suporte (CAVALCANTI et al.,
1999). A absorção óssea alveolar pode levar ao movimento dentário indesejado,
na mesma direção. Estudos em animais têm demonstrado forte correlação entre
movimento dentário e deiscência óssea (STEINER et al., 1981; WENNSTROM et
al., 1987). Entretanto, poucas pesquisas abordam a situação das corticais ósseas
vestibulares e palatinas após a ERM, especialmente em humanos (GREENBAUM
e ZACHRISSON, 1982; GARIB et al., 2006; RUNGCHARASSAENG et al., 2007;
BALLANTI et al., 2009)
No momento atual, avanços tecnológicos têm contribuído para aprimorar o
registro de dados de diagnóstico, permitindo avaliação minuciosa e precisa das
estruturas anatômicas (PODESSER et al., 2004; DA SILVA FILHO et al., 2005;
GARIB et al., 2005). A tomografia computadorizada (TC) constitui um dos grandes
avanços da atualidade na área de imagem, obtendo-se, com mais segurança, a
avaliação de estruturas anatômicas sem superposição de estruturas vizinhas
3
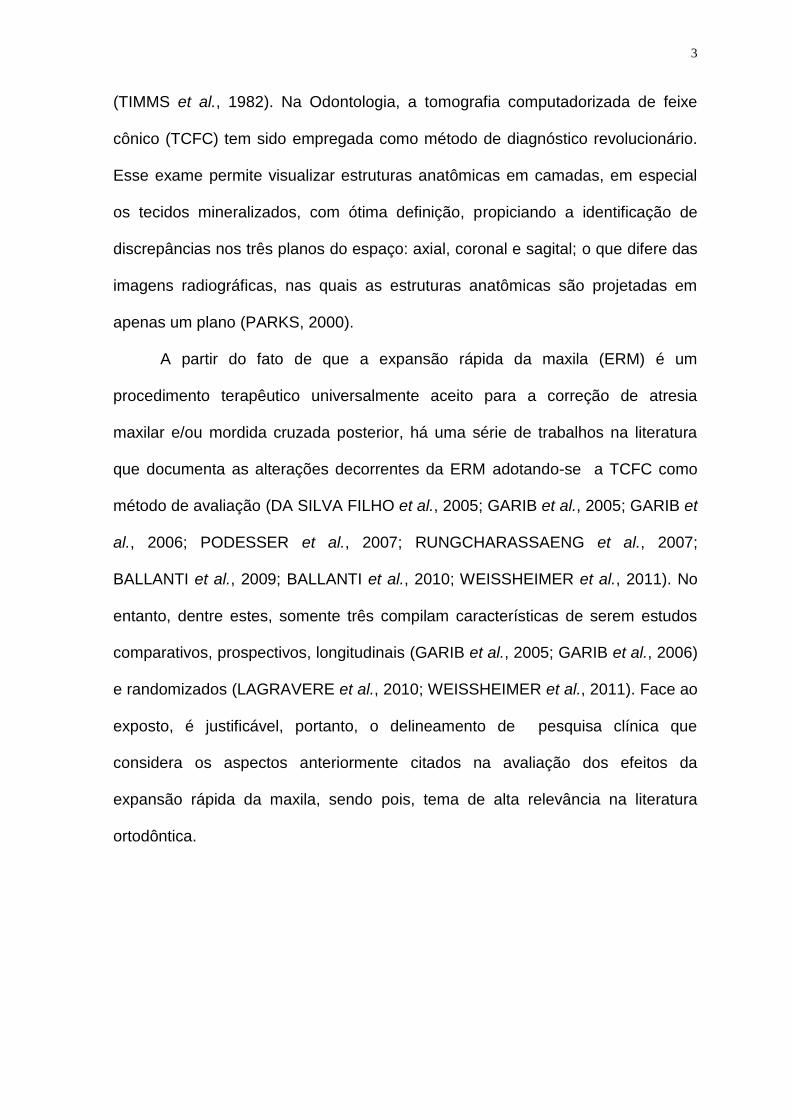
(TIMMS et al., 1982). Na Odontologia, a tomografia computadorizada de feixe
cônico (TCFC) tem sido empregada como método de diagnóstico revolucionário.
Esse exame permite visualizar estruturas anatômicas em camadas, em especial
os tecidos mineralizados, com ótima definição, propiciando a identificação de
discrepâncias nos três planos do espaço: axial, coronal e sagital; o que difere das
imagens radiográficas, nas quais as estruturas anatômicas são projetadas em
apenas um plano (PARKS, 2000).
A partir do fato de que a expansão rápida da maxila (ERM) é um
procedimento terapêutico universalmente aceito para a correção de atresia
maxilar e/ou mordida cruzada posterior, há uma série de trabalhos na literatura
que documenta as alterações decorrentes da ERM adotando-se a TCFC como
método de avaliação (DA SILVA FILHO et al., 2005; GARIB et al., 2005; GARIB et
al., 2006; PODESSER et al., 2007; RUNGCHARASSAENG et al., 2007;
BALLANTI et al., 2009; BALLANTI et al., 2010; WEISSHEIMER et al., 2011). No
entanto, dentre estes, somente três compilam características de serem estudos
comparativos, prospectivos, longitudinais (GARIB et al., 2005; GARIB et al., 2006)
e randomizados (LAGRAVERE et al., 2010; WEISSHEIMER et al., 2011). Face ao
exposto, é justificável, portanto, o delineamento de pesquisa clínica que
considera os aspectos anteriormente citados na avaliação dos efeitos da
expansão rápida da maxila, sendo pois, tema de alta relevância na literatura
ortodôntica.
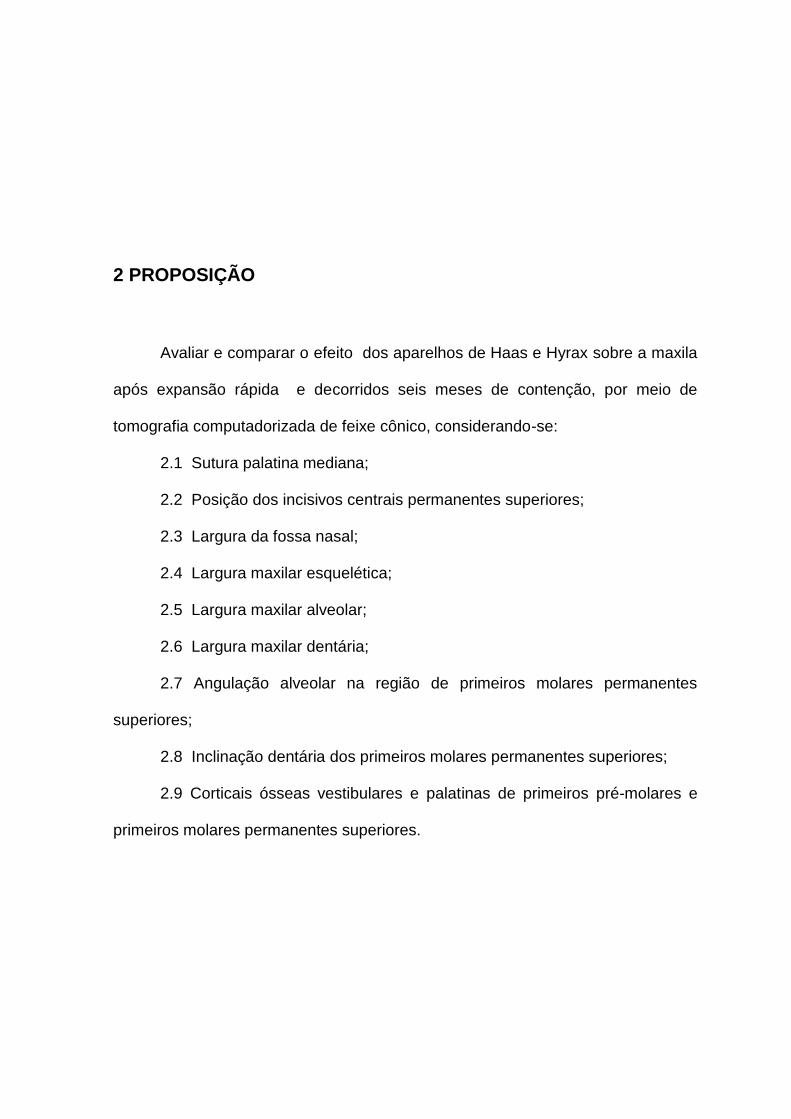
2 PROPOSIÇÃO
Avaliar e comparar o efeito dos aparelhos de Haas e Hyrax sobre a maxila
após expansão rápida e decorridos seis meses de contenção, por meio de
tomografia computadorizada de feixe cônico, considerando-se:
2.1 Sutura palatina mediana;
2.2 Posição dos incisivos centrais permanentes superiores;
2.3 Largura da fossa nasal;
2.4 Largura maxilar esquelética;
2.5 Largura maxilar alveolar;
2.6 Largura maxilar dentária;
2.7 Angulação alveolar na região de primeiros molares permanentes
superiores;
2.8 Inclinação dentária dos primeiros molares permanentes superiores;
2.9 Corticais ósseas vestibulares e palatinas de primeiros pré-molares e
primeiros molares permanentes superiores.
3 DELINEAMENTO DA PESQUISA
3.1 Caracterização da casuística
Para a realização deste estudo clínico longitudinal prospectivo, vinculado
ao Programa de Pós-graduação em Odontologia (Ortodontia) da Universidade
Federal do Rio de Janeiro (UFRJ), a casuística foi selecionada em escolas
públicas de Belo Horizonte. Foram examinadas 1035 crianças, das quais 50 se
enquadravam nos critérios de inclusão, para participarem do estudo. Os critérios
de inclusão determinados para compor a casuística foram: presença de
maloclusão Classe I de Angle com necessidade clínica de disjunção maxilar;
pacientes não submetidos a tratamentos ortodônticos prévios; idade cronológica
inferior a 15 anos; dentição permanente completa, com exceção dos terceiros
molares (em alguns casos, os segundos molares encontravam-se em erupção).
Dentre os 50 indivíduos selecionados, houve desistência de 15,
permanecendo 35 participantes na pesquisa, os quais foram submetidos aos
procedimentos de expansão rápida da maxila (ERM) (Quadro 1, página 6). A
casuística foi distribuída de forma randomizada em dois grupos, em que foram
utilizados: aparelho disjuntor tipo Haas (Grupo 1, n=18) e aparelho disjuntor tipo
Hyrax. (Grupo 2, n=17). A fase ativa do tratamento foi em média de duas
semanas, variando de acordo com a necessidade de expansão. A fase passiva

6
compreendeu a manutenção do disjuntor na cavidade bucal durante os seis
meses subsequentes à ERM.
n- número de indivíduos
Quadro 1 - Dados básicos da coleta da casuística.
A investigação nesta pesquisa fundamentou-se na análise de dados
provenientes de tomografias computadorizadas de feixe cônico (TCFC) que foram
realizadas, portanto, em três tempos específicos do estudo, caracterizados como:
período inicial (T1); imediatamente após a ERM (T2) e, decorridos seis meses de
contenção subsequentes à ERM (T3).
Considerando-se os 35 indivíduos que receberam o tratamento de ERM,
três foram excluídos da casuística por estarem no estágio C4 de crescimento
segundo Baccetti et al. 2005. Restaram, portanto, 32 pacientes; 19 meninas com
médias idades de 12 anos e 10 meses e 13 meninos com médias idades de 13
anos. Considerando os estágios de maturação vertebral propostos por Baccetti,
Franchi & McNamara Jr (BACCETTI et al., 2005), os pacientes encontravam-se
com as vértebras cervicais no estágio de maturação 3, indicando grande potencial
de crescimento ativo. Durante o período de contenção, três participantes
desistiram do tratamento, não tendo sido realizadas as suas respectivas TCFC
em T3 e, desse modo, seus dados não foram computados para esta fase do
estudo (Quadro 2, página 7).
Indivíduos
examinados (n)
Indivíduos
selecionados (n)
Indivíduos
desistentes (n)
Indivíduos
tratados (n)
1035 50 15 35
7
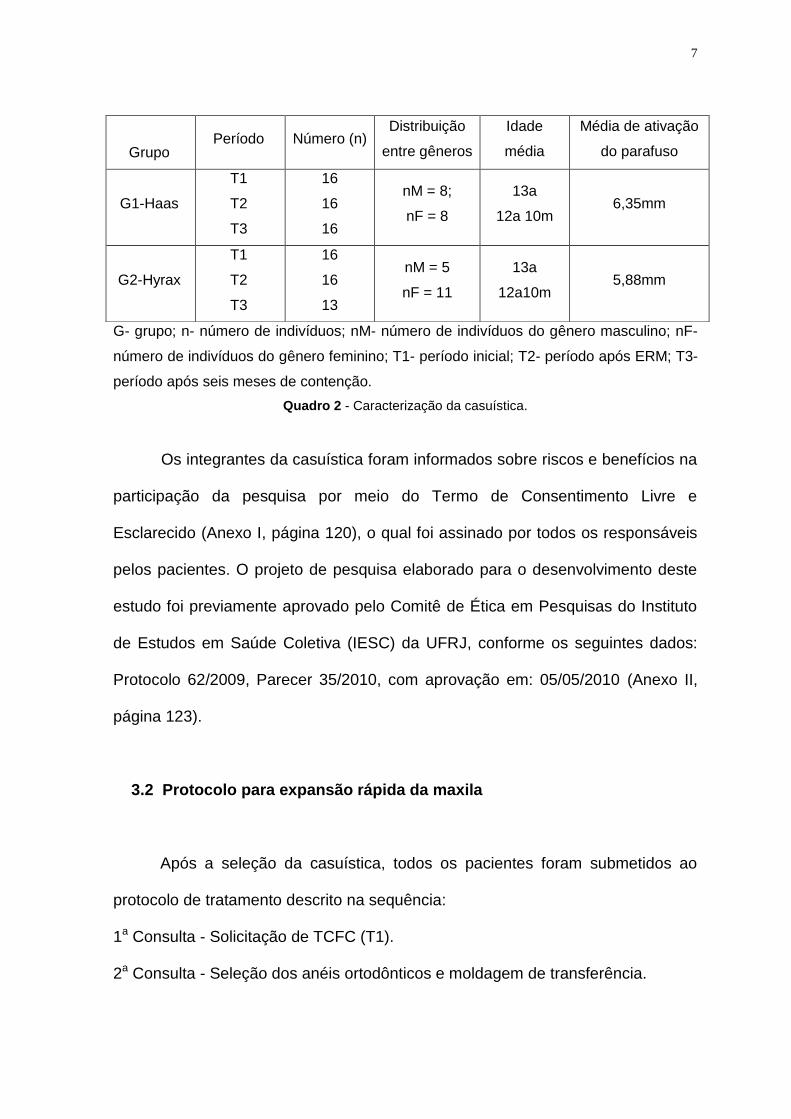
G- grupo; n- número de indivíduos; nM- número de indivíduos do gênero masculino; nF-
número de indivíduos do gênero feminino; T1- período inicial; T2- período após ERM; T3-
período após seis meses de contenção.
Quadro 2 - Caracterização da casuística.
Os integrantes da casuística foram informados sobre riscos e benefícios na
participação da pesquisa por meio do Termo de Consentimento Livre e
Esclarecido (Anexo I, página 120), o qual foi assinado por todos os responsáveis
pelos pacientes. O projeto de pesquisa elaborado para o desenvolvimento deste
estudo foi previamente aprovado pelo Comitê de Ética em Pesquisas do Instituto
de Estudos em Saúde Coletiva (IESC) da UFRJ, conforme os seguintes dados:
Protocolo 62/2009, Parecer 35/2010, com aprovação em: 05/05/2010 (Anexo II,
página 123).
3.2 Protocolo para expansão rápida da maxila
Após a seleção da casuística, todos os pacientes foram submetidos ao
protocolo de tratamento descrito na sequência:
1a Consulta - Solicitação de TCFC (T1).
2a Consulta - Seleção dos anéis ortodônticos e moldagem de transferência.
Grupo Período Número (n)
Distribuição
entre gêneros
Idade
média
Média de ativação
do parafuso
G1-Haas
T1
T2
T3
16
16
16
nM = 8;
nF = 8
13a
12a 10m 6,35mm
G2-Hyrax
T1
T2
T3
16
16
13
nM = 5
nF = 11
13a
12a10m 5,88mm
8
3a Consulta - Instalação do aparelho de Haas e/ou aparelho de Hyrax e ativação
de 4/4 de volta. A partir do segundo dia, 2/4 de ativação foi
realizada diariamente até a expansão necessária ter sido obtida.
4a Consulta - Estabilização do parafuso expansor e solicitação de TCFC (T2).
Durante o período de contenção, foram efetuadas consultas
bimestrais de controle.
5a Consulta - Após seis meses, solicitação de TCFC (T3).
6ª Consulta - Remoção do aparelho de Haas e/ou aparelho de Hyrax.
7ª Consulta - Instalação de placa de contenção superior.
3.3 Etapas laboratoriais de confecção dos aparelhos tipo Haas e
aparelhos tipo Hyrax
Na confecção dos aparelhos de Haas e aparelhos de Hyrax, seguiu-se o
protocolo detalhado a seguir:
1- Separação interproximal dos dentes de ancoragem (primeiros molares
permanentes superiores e primeiros pré-molares superiores), com o auxílio de
elásticos separadores radiopacos (Morelli ®).
2- Seleção e adaptação de anéis ortodônticos (Morelli ®) nos dentes de
ancoragem.
3- Moldagem de transferência da arcada superior, utilizando-se hidrocolóide
irreversível (Jeltrate- Dentsply Ind. e Com. LTDA).
4- Modelagem para obtenção do modelo de trabalho. (Gesso pedra amarelo de
endurecimento rápido, Herodent, Vigodent ®, RJ)

9
3.3.1 Confecção do Aparelho tipo Haas
Na confecção do aparelho de Haas foi seguida a sequência técnica
descrita em continuidade:
1- Confecção da estrutura metálica sobre o modelo de gesso, utilizando-se fio de
aço inoxidável com 1,0mm de diâmetro (Dental Morelli, São Paulo, Brasil).
Barras vestibulares e palatinas foram contornadas aos primeiros e segundos
pré-molares, assim como primeiros molares permanentes superiores, de
ambos os lados. As barras palatinas foram estendidas em direção à rafe
palatina mediana atuando como retenção para a construção da porção de
acrílico. As barras metálicas foram soldadas aos anéis ortodônticos dos
primeiros pré-molares e primeiros molares permanentes superiores.
2- Posicionamento de parafuso expansor (Dental Morelli, São Paulo, Brasil), com
abertura máxima de 11 mm, sobre a rafe palatina mediana. No sentido ântero-
posterior, a parte mediana do parafuso foi posicionada entre segundos pré-
molares e primeiros molares permanentes, sendo que as suas margens
laterais permaneceram afastadas 1 (um) mm das corticais laterais do palato.
3- Confecção da porção acrílica ( Resina acrílica autopolimerizável JET, Artigos
Odontológicos Clássico Ltda, SP) unindo as barras metálicas ao parafuso e,
assim, constituindo o aparelho dento-muco suportado;
4- Acabamento e polimento do Aparelho de Haas. Nesta fase, as margens do
acrílico foram arredondadas e os limites estabelecidos de forma que o acrílico
repousasse apenas na região entre primeiros pré-molares e primeiros molares
superiores, para evitar danos aos tecidos ricamente vascularizados, como
10
rugas palatinas, margens gengivais e tecidos que recobrem os forames
palatinos posteriores (HAAS, 1970).
3.3.2 Confecção do Aparelho tipo Hyrax
Para a confecção do aparelho de Hyrax seguiu-se a seguinte sequência
técnica:
1- Confecção da estrutura metálica sobre o modelo de gesso, a qual foi composta
por barras vestibulares e palatinas, em fio de aço inoxidável com 1 mm de
diâmetro (Dental Morelli, São Paulo, Brasil), soldadas aos anéis ortodônticos
adaptados aos primeiros pré-molares e primeiros molares permanentes. Na
região palatina, as próprias extensões do parafuso tipo Hyrax contornaram o
palato, em direção oclusal, até as superfícies palatinas dos anéis, sobre as
quais foram adaptadas e soldadas.
2- Posicionamento de parafuso expansor (Dental Morelli, São Paulo, Brasil), com
abertura máxima de 11 mm, sobre a rafe palatina mediana. No sentido ântero-
posterior, a parte mediana do parafuso foi posicionada entre segundos pré-
molares e primeiros molares permanentes, sendo que as suas margens
laterais permaneceram afastadas 1 mm das paredes laterais do palato.
3.4 Protocolo de instalação e ativação para ERM
Os aparelhos de Haas e Hyrax foram fixados com cimento ionômero de
vidro (Voco - Meron Glass ionomer cement- Germany). A cimentação foi realizada

11
sob isolamento relativo, tendo sido precedida pela profilaxia dos dentes
superiores, utilizando-se taça de borracha e pasta profilática.
Após a etapa de cimentação, os pacientes e os seus responsáveis foram
orientados em relação à higienização correta dos disjuntores. Os indivíduos do
Grupo 1 (um) foram especialmente instruídos a higienizar a região entre o bloco
acrílico e a mucosa palatina, com o auxílio de fio dental acoplado ao passa-fio.
Todos os pacientes do Grupo 1 (um) e Grupo 2 (dois) foram submetidos
ao mesmo protocolo de ativações para a ERM. No dia da cimentação, foram
realizadas 4/4 de volta, tendo sido obedecido um intervalo entre estas. A última
ativação foi realizada pelo responsável como forma de aprendizado. A partir do
segundo dia da instalação do aparelho disjuntor, as ativações foram efetivadas
em casa, pelos responsáveis, sendo, ¼ de volta realizada pela manhã e ¼ de
volta à noite, perfazendo o total diário de 2/4 de volta, ou seja, 0,4 mm de ativação
do parafuso. Os responsáveis receberam um calendário guia para registro do
número de ativações executadas por eles durante o período ativo de ERM (Anexo
III, página 124).
O controle clínico, nesta fase de tratamento, foi efetuado semanalmente
para controle das ativações. A quantidade de abertura do parafuso expansor foi
realizada conforme a necessidade de expansão maxilar de cada indivíduo. O
critério clínico utilizado para o encerramento da ativação constituiu-se na
observação do contato das cúspides palatinas dos dentes posteriores superiores
com as cúspides vestibulares dos dentes posteriores inferiores. Após o término da
fase ativa de ERM, os parafusos foram estabilizados com fio de amarrilho e os
pacientes encaminhados para tomada tomográfica (T2).
12
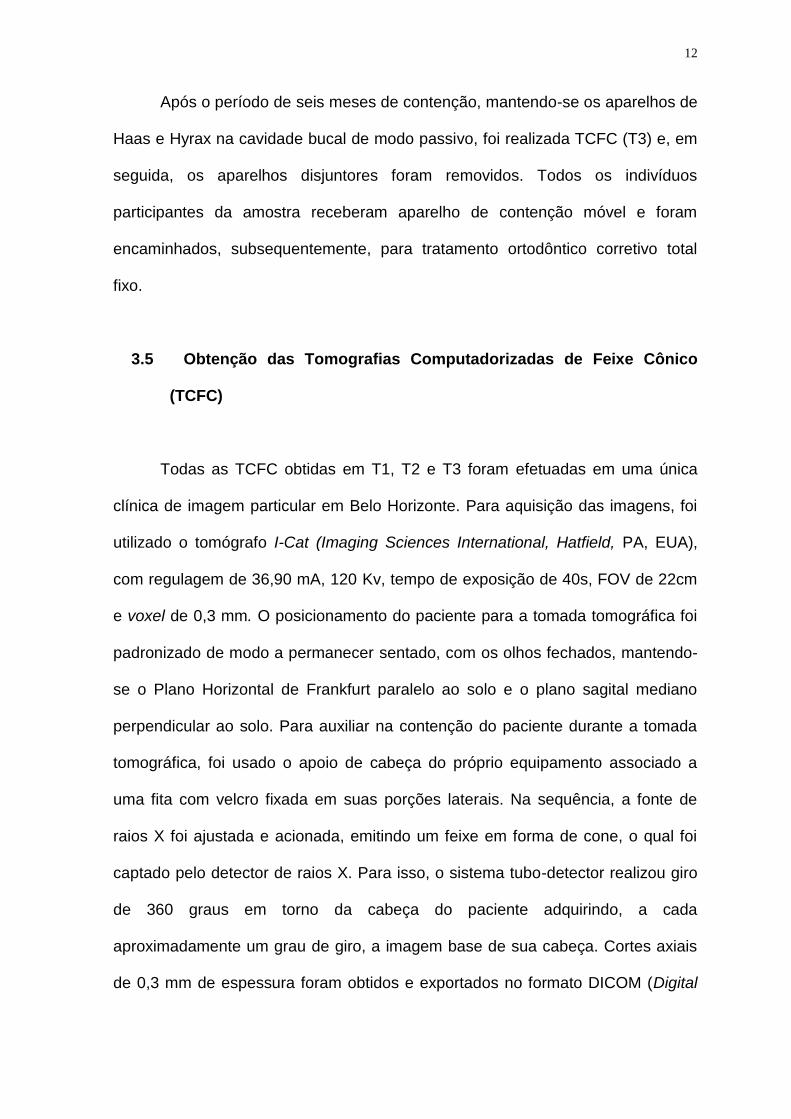
Após o período de seis meses de contenção, mantendo-se os aparelhos de
Haas e Hyrax na cavidade bucal de modo passivo, foi realizada TCFC (T3) e, em
seguida, os aparelhos disjuntores foram removidos. Todos os indivíduos
participantes da amostra receberam aparelho de contenção móvel e foram
encaminhados, subsequentemente, para tratamento ortodôntico corretivo total
fixo.
3.5 Obtenção das Tomografias Computadorizadas de Feixe Cônico
(TCFC)
Todas as TCFC obtidas em T1, T2 e T3 foram efetuadas em uma única
clínica de imagem particular em Belo Horizonte. Para aquisição das imagens, foi
utilizado o tomógrafo I-Cat (Imaging Sciences International, Hatfield, PA, EUA),
com regulagem de 36,90 mA, 120 Kv, tempo de exposição de 40s, FOV de 22cm
e voxel de 0,3 mm. O posicionamento do paciente para a tomada tomográfica foi
padronizado de modo a permanecer sentado, com os olhos fechados, mantendo-
se o Plano Horizontal de Frankfurt paralelo ao solo e o plano sagital mediano
perpendicular ao solo. Para auxiliar na contenção do paciente durante a tomada
tomográfica, foi usado o apoio de cabeça do próprio equipamento associado a
uma fita com velcro fixada em suas porções laterais. Na sequência, a fonte de
raios X foi ajustada e acionada, emitindo um feixe em forma de cone, o qual foi
captado pelo detector de raios X. Para isso, o sistema tubo-detector realizou giro
de 360 graus em torno da cabeça do paciente adquirindo, a cada
aproximadamente um grau de giro, a imagem base de sua cabeça. Cortes axiais
de 0,3 mm de espessura foram obtidos e exportados no formato DICOM (Digital

13
Imaging and Communication in Medicine) e, em continuidade, gravados em cd-
rom. Estas imagens foram exportadas para o programa de reconstrução
volumétrica tridimensional (3D), possibilitando a visualização de forma
padronizada nos planos axial, sagital e coronal. O programa empregado para a
obtenção da imagem em 3D foi o Dolphin Imaging (versão 11.5, Dolphin Imaging
& Management Solutions, Chatsworth, Calif).
3.6 Metodologia para avaliação da idade esquelética
Para avaliação dos estágios de ossificação esquelética dos indivíduos
participantes da pesquisa, aplicou-se o método descrito por Baccetti et al. em
2005. Este método fundamenta-se nos contornos anatômicos das vértebras C2,
C3 e C4, sob avaliação em telerradiografias. Neste estudo, as telerradiografias
foram obtidas a partir da reconstrução em 3D no software Dolphin Imaging
(versão 11.5, Dolphin Imaging & Management Solutions, Chatsworth, Calif), sendo
este procedimento executado por um avaliador cego, que não participou da
seleção da amostra (EMJ). Os participantes, nesta pesquisa encontravam-se com
as vértebras cervicais no estágio de maturação SC3, indicando potencial de
crescimento ativo.
Os estágios de maturação das vértebras cervicais, segundo Baccetti et al.
(BACCETTI et al., 2005), são descritos a seguir (Figura 1, página 15):
a) Estágio cervical 1 (EC1) onde as bordas inferiores das três vértebras
(C2, C3, C4) estão planas. Os corpos de C3 e C4 apresentam formato
trapezoidal (a borda superior é inclinada de posterior para anterior). O
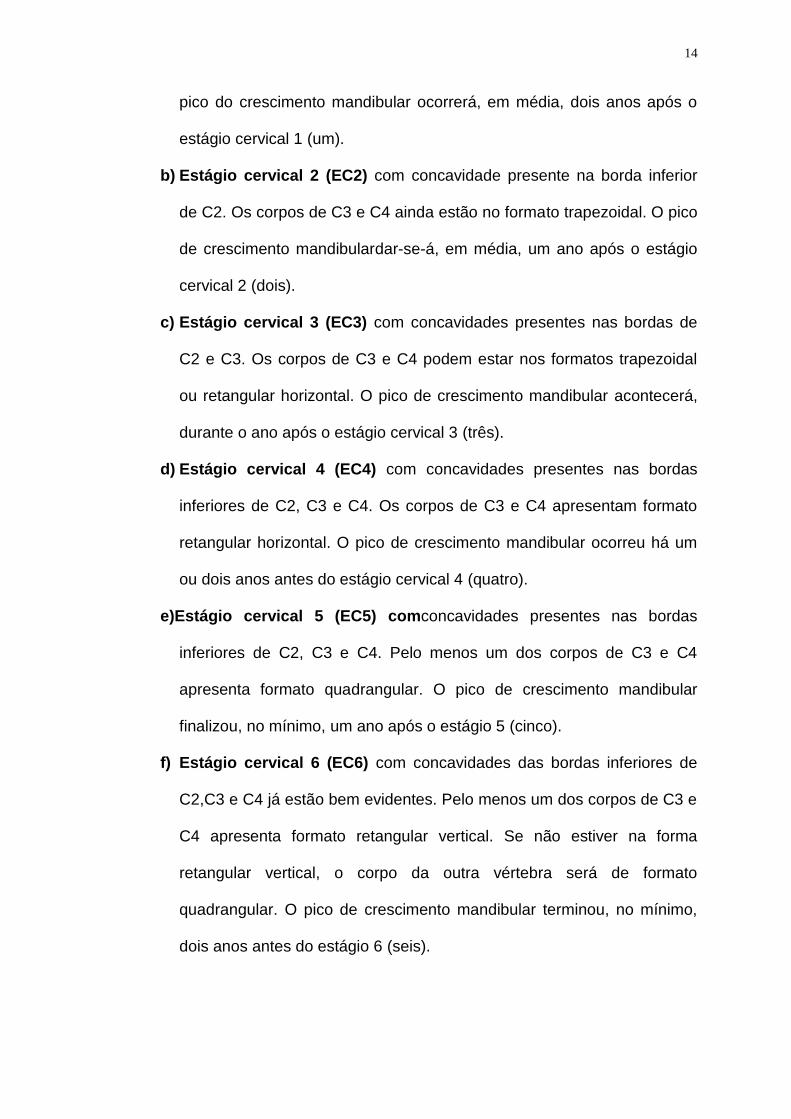
14
pico do crescimento mandibular ocorrerá, em média, dois anos após o
estágio cervical 1 (um).
b) Estágio cervical 2 (EC2) com concavidade presente na borda inferior
de C2. Os corpos de C3 e C4 ainda estão no formato trapezoidal. O pico
de crescimento mandibulardar-se-á, em média, um ano após o estágio
cervical 2 (dois).
c) Estágio cervical 3 (EC3) com concavidades presentes nas bordas de
C2 e C3. Os corpos de C3 e C4 podem estar nos formatos trapezoidal
ou retangular horizontal. O pico de crescimento mandibular acontecerá,
durante o ano após o estágio cervical 3 (três).
d) Estágio cervical 4 (EC4) com concavidades presentes nas bordas
inferiores de C2, C3 e C4. Os corpos de C3 e C4 apresentam formato
retangular horizontal. O pico de crescimento mandibular ocorreu há um
ou dois anos antes do estágio cervical 4 (quatro).
e)Estágio cervical 5 (EC5) comconcavidades presentes nas bordas
inferiores de C2, C3 e C4. Pelo menos um dos corpos de C3 e C4
apresenta formato quadrangular. O pico de crescimento mandibular
finalizou, no mínimo, um ano após o estágio 5 (cinco).
f) Estágio cervical 6 (EC6) com concavidades das bordas inferiores de
C2,C3 e C4 já estão bem evidentes. Pelo menos um dos corpos de C3 e
C4 apresenta formato retangular vertical. Se não estiver na forma
retangular vertical, o corpo da outra vértebra será de formato
quadrangular. O pico de crescimento mandibular terminou, no mínimo,
dois anos antes do estágio 6 (seis).
15
Figura 1 Representação esquemática dos estágios de maturação das vértebras cervicais segundo Baccetti et al. (2005).
3.7 Metodologia para avaliação das imagens tomográficas
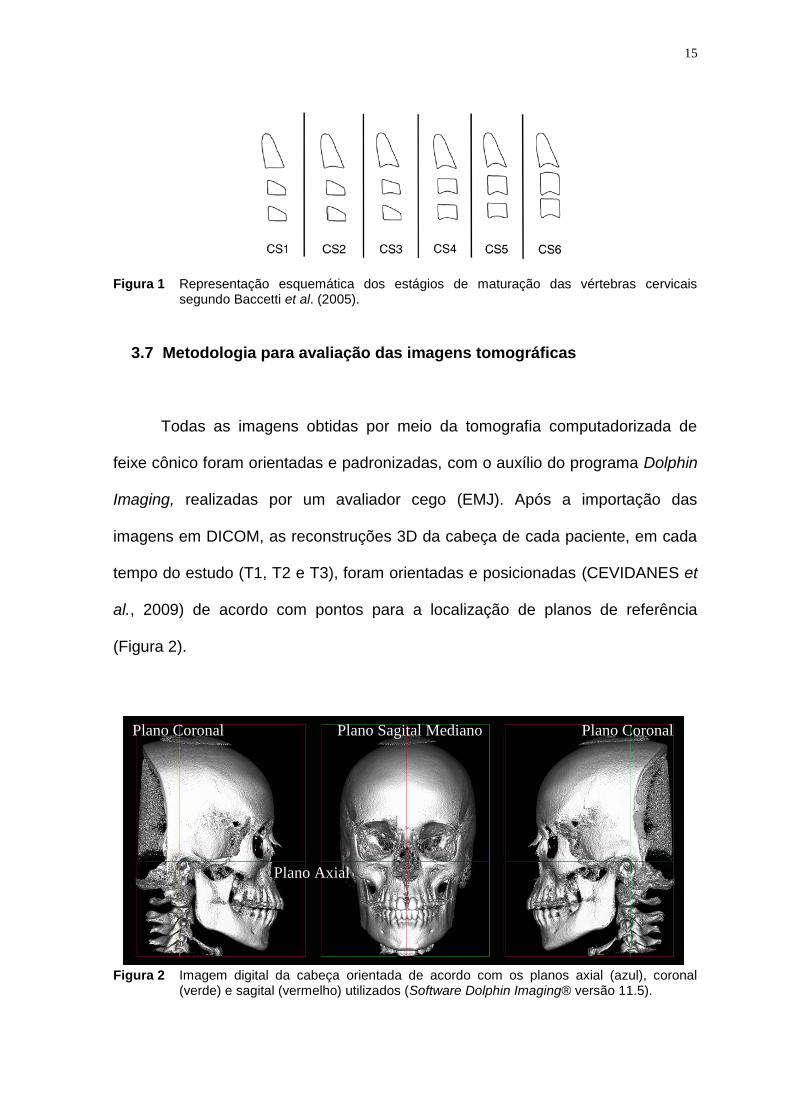
Todas as imagens obtidas por meio da tomografia computadorizada de
feixe cônico foram orientadas e padronizadas, com o auxílio do programa Dolphin
Imaging, realizadas por um avaliador cego (EMJ). Após a importação das
imagens em DICOM, as reconstruções 3D da cabeça de cada paciente, em cada
tempo do estudo (T1, T2 e T3), foram orientadas e posicionadas (CEVIDANES et
al., 2009) de acordo com pontos para a localização de planos de referência
(Figura 2).
Figura 2 Imagem digital da cabeça orientada de acordo com os planos axial (azul), coronal (verde) e sagital (vermelho) utilizados (Software Dolphin Imaging® versão 11.5).
Plano Coronal Plano Coronal Plano Sagital Mediano
Plano Axial
16
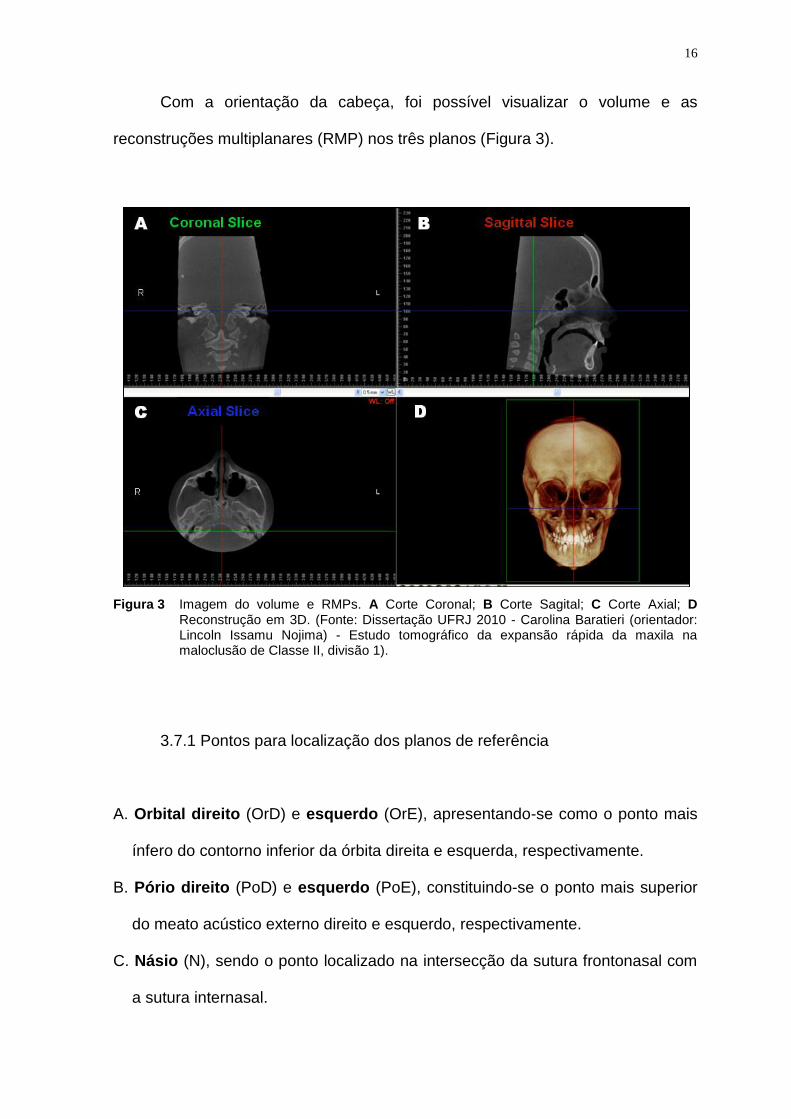
Com a orientação da cabeça, foi possível visualizar o volume e as
reconstruções multiplanares (RMP) nos três planos (Figura 3).
Figura 3 Imagem do volume e RMPs. A Corte Coronal; B Corte Sagital; C Corte Axial; D Reconstrução em 3D. (Fonte: Dissertação UFRJ 2010 - Carolina Baratieri (orientador: Lincoln Issamu Nojima) - Estudo tomográfico da expansão rápida da maxila na maloclusão de Classe II, divisão 1).
3.7.1 Pontos para localização dos planos de referência
A. Orbital direito (OrD) e esquerdo (OrE), apresentando-se como o ponto mais
ínfero do contorno inferior da órbita direita e esquerda, respectivamente.
B. Pório direito (PoD) e esquerdo (PoE), constituindo-se o ponto mais superior
do meato acústico externo direito e esquerdo, respectivamente.
C. Násio (N), sendo o ponto localizado na intersecção da sutura frontonasal com
a sutura internasal.
17
3.7.2 Planos de referência
A. Plano Axial, determinado pelos pontos Orbital Direito, Orbital Esquerdo e Pório
Direito e Pório Esquerdo.
B. Plano Coronal, passando pelos pontos Pório Direito e Pório Esquerdo, sendo
perpendicular ao plano axial selecionado.
C. Plano Sagital, interceptando o Ponto Násio, sendo perpendicular ao plano
axial e coronal selecionados.
3.7.3 Avaliação da Sutura Palatina Mediana
Para avaliar a abertura da sutura palatina mediana foi realizada a
localização tridimensional de oito pontos nas imagens de TCFC, utilizando os
cortes coronal, sagital e axial conforme descrito a seguir:
- Ponto 1 e Ponto 2: pontos localizados na altura do assoalho da fossa
nasal (FN) e da espinha nasal posterior (ENP) dos lados direito e
esquerdo, respectivamente. Como referência para a sua determinação,
manteve-seo plano sagital levemente desviado do plano sagital
mediano, o plano coronal interceptando a espinha nasal posterior e o
plano axial estabelecido na altura do assoalho da fossa nasal (Figura 4,
página 19).
- Ponto 3 e Ponto 4: pontos situados na altura do palato duro (PD) e da
espinha nasal posterior dos lados direito e esquerdo, respectivamente.
Como referência para a sua determinação, manteve-seo plano sagital

18
levemente desviado do plano sagital mediano, o plano coronal
interceptando a espinha nasal posterior e o plano axial estabelecido na
altura do assoalho do palato duro (Figura 4, página 19).
- Ponto 5 e Ponto 6: pontos localizados na altura do assoalho da fossa
nasal e da espinha nasal anterior (ENA) dos lados direito e esquerdo,
respectivamente. Como referência para sua a determinação, manteve-se
o plano sagital posicionado em região lateral à sutura palatina mediana,
o plano coronal interceptando a espinha nasal anterior e o plano axial
estabelecido na altura do assoalho da fossa nasal.
- Ponto 7 e Ponto 8: pontos que se situam na altura do palato duro e da
espinha nasal anterior dos lados direito e esquerdo, respectivamente.
Como referência para a sua determinação, manteve-se oplano sagital
levemente desviado do plano sagital mediano, o plano coronal
interceptando a espinha nasal anterior e o plano axial estabelecido na
altura do assoalho do palato duro.

19
Figura 4 Imagem das RMPs do Software Dolphin®, função Measurement ilustrando metodologia para avaliação da sutura palatina mediana. A Corte coronal passando pela espinha nasal posterior com os pontos (1, 2, 3, 4) e planos axial e sagital passando pelo ponto1; B Corte sagital com a identificação de espinha nasal posterior (ENP), planos axial e coronal passando sobre o ponto 1; C Corte axial passando pelo assoalho da fossa nasal e plano sagital sobre o ponto 1; D Reconstrução em 3D. Plano sagital (linha vermelha); plano coronal (linha verde); plano axial (linha azul).
Após a determinação dos pontos, foram executadas as medidas para a
avaliação da sutura palatina mediana, conforme citado no Quadro 3 (três).
Medidas Definição
ENP-FN Largura da abertura da sutura palatina mediana entre os pontos 1 e 2.
ENP-PD Largura da abertura da sutura palatina mediana entre os pontos 3 e 4.
ENA-FN Largura da abertura da sutura palatina mediana entre os pontos 5 e 6.
ENA-PD Largura da abertura da sutura palatina mediana entre os pontos 7 e 8.
Quadro 3 Definição das medidas utilizadas para a avaliação da sutura palatina mediana na
análise tomográfica.

20
3.7.4 Avaliação da distância entre incisivos centrais superiores
A distância entre incisivos centrais superiores foi mensurada em duas
regiões anatômicas distintas: nos ápices radiculares dos incisivos centrais
permanentes(Ar) e na junção cemento-esmalte (Jce) localizada na face mesial
dos incisivos centrais permanentes. Para a demarcação dos pontos Ar e Jce foi
considerada a coincidência dos planos axial, coronal e sagital sobre a estrutura
anatômica desejada conforme ilustrados nas Figura 5 e 6 (página 21), Quadro 4
(página 21) e Quadro 5 (página 22).
Figura 5 Imagem das RMPs do Software Dolphin®, função Measurement com a metodologia para localização do ápice radicular do incisivo central superior esquerdo. A corte coronal com o ponto Ice/Ar localizado na intersecção do plano axial e sagital; B corte sagital onde o ponto Ice/Ar está representado pela intersecção dos planos axial e coronal; C corte axial e o ponto Ice/Ar está representado pela intersecção dos planos coronal e plano sagital, passando sobre o ápice do incisivo central superior esquerdo. D Reconstrução em 3D. Plano sagital (linha vermelha); plano coronal (linha verde); plano axial (linha azul).

21
Figura 6 Imagem das RMPs do Software Dolphin®, função Measurement com a metodologia para localização do ponto de referência na junção cemento-esmalte do incisivo central permanente superior esquerdo. A Corte coronal, ilustrando plano sagital posicionado na junção cemento-esmalte do incisivo central superior esquerdo; ponto Ice (jce) localizado na intersecção do plano sagital com o axial; B Corte sagital tangenciando a mesial do dente 2, mostrando plano axial sobre a junção cemento-esmalte e plano coronal passando no meio do dente no sentido vestíbulo-lingual; C Corte axial, confirmando a localização dos pontos nos dentes 11-Icd (jce) e 21-Ice (jce)(intersecção do plano sagital com o coronal) e medição da distância linear entre ambos; D Reconstrução em 3D. Plano sagital (linha vermelha); plano coronal (linha verde); plano axial (linha azul).
Ponto Descrição
dente/ Ar Ponto localizado no ápice da raiz do incisivo central permanente.
dente / Jce Ponto localizado na face mesial do incisivo central permanente na
junção cemento-esmalte.
Quadro 4 Definição dos pontos para avaliação da distância entre incisivos centrais superiores na
análise tomográfica.

22
Medidas Definição
Icd-Ice(ar) Distância entre os ápices radiculares do incisivo central superior
direito e incisivo central superior esquerdo.
Icd-Ice(jce)
Distância entre dois pontos localizados na face mesial da junção
cemento-esmalte do incisivo central superior direito e incisivo central
superior esquerdo.
Quadro 5 Definição das medidas utilizadas para avaliação da distância entre incisivos centrais
superiores na análise tomográfica.
3.7.5 Avaliação da largura maxilar esquelética e largura da fossa nasal
Para determinar a largura maxilar esquelética, identificou-se, inicialmente,
na imagem tridimensional, o processo zigomático da maxila, para, em seguida,
estabelecer a localização dos pontos de referência MxD e MxE (Figura 7 e
Quadro 6, página 23).
Uma vez determinada a largura maxilar esquelética, utilizou-se a régua
própria do programa Dolphin Imaging para demarcar uma linha paralela à MxD -
MxE, situada 10 milímetros acima daquela, estabelecendo-se os pontos FnD e
FnE, localizados, respectivamente, nas paredes laterais das fossas nasais dos
lados direito e esquerdo. A união de ambos os pontos representou a largura da
fossa nasal. Considerou-se, para a localização dos pontos, o posicionamento
deles nos planos coronal, sagital e axial (Figura 7 e Quadro 6, página 23).

23
Figura 7 Imagem de reconstrução multiplanar (RMP) do Software Dolphin®, função Mesuarementilustrando metodologia para avaliação da largura maxilar esquelética e largura da fossa nasal: A Corte coronal passando pelo processo zigomático da maxila com a identificação do plano sagital passando sobre o ponto FnE localizado a 10mm acima do plano da largura maxilar esquelética (MxD-MxE) situado sobre o plano axial, que passa pela borda mais superior da concavidade do osso maxilar, caracterizada pela junção da maxila com o processo zigomático da maxila. Identificação dos pontos MxD, MxE, FnD e FnE; B Corte sagital passando na porção mais externa da fossa nasal esquerda com a localização do ponto (FnE) sobre o plano coronal e o plano axial sobre a junção da maxila com o processo zigomático da maxila; C Corte axial passando pelo ponto mais profundo do contorno do processo zigomático da maxila, com a marcação bilateral dos pontos MxD e MxE onde passa o plano coronal; D Reconstrução em 3D. Plano sagital (linha vermelha); plano coronal (linha verde); plano axial (linha azul) (Software Dolphin Imaging® 11.0).
Medidas Definição
MxD-MxE
(Largura Maxilar Esquelética)
Distância entre os pontos MxD e MxE (pontos direito
e esquerdo, em que os planos axial e sagital
interceptam o ponto mais profundo do contorno do
processo zigomático da maxila, no corte coronal).
FnD-FnE
(Largura da Fossa Nasal)
Distância entre os pontos FnD e FnE (pontos direito
e esquerdo, que tangenciam as paredes laterais das
fossas nasais, no corte coronal), localizada 10
milímetros acima de MxD-MxE).
Quadro 6 Definição das medidas utilizadas para a avaliação da largura maxilar esquelética e da largura da fossa nasal na análise tomográfica.
A
D C
B
MxD MxE
FnE FnD
MxD MxE
MxE MxD
FnE

24
3.7.6 Avaliação da largura maxilar alveolar
Para mensuração da largura alveolar maxilar foi primeiramente localizada a
furca dos primeiros molares permanentes (Figura 8, página 25). A localização
exata dos pontos de referência (Quadro 8, página 26), Mav e Map foi realizada
empregando-se os três cortes simultaneamente: no corte sagital, o plano coronal
passou entre as raízes mesio-vestibular e disto-vestibular dos primeiros molares
permanentes superiores; o plano axial passou na altura da furca, sendo
confirmada no corte axial; além disso, no corte axial, é visualizado o plano coronal
passando sobre as raízes mésio-vestibular e disto-vestibular dos primeiros
molares permanentes e, no corte coronal, o plano axial passou sobre a trifurcação
dos elementos dentários 16 e 26, demarcando um ponto na cortical alveolar
vestibular dos lados direito e esquerdo (Mav) e na cortical alveolar palatina dos
lados direito e esquerdo (Map) (Figura 9, página 25, e Quadros 7 e 8, página 26).
Metodologia semelhante foi usada para demarcar os pontos alveolares na cortical
vestibular e palatina na altura dos primeiros pré-molares. Foi seguida a orientação
da bifurcação daqueles dentes posicionando nesta altura os pontos: Mav/14,
Mav/24, Map/14-Map/24 (Quadro 8, página 26).
25
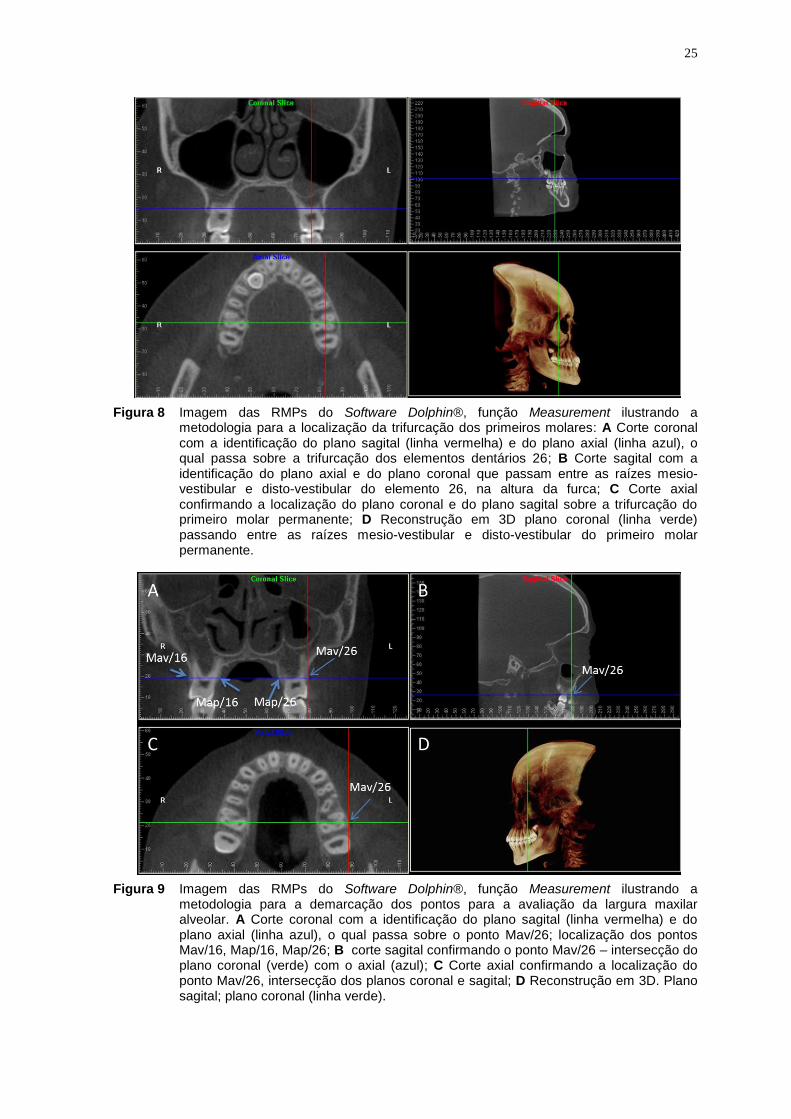
Figura 8 Imagem das RMPs do Software Dolphin®, função Measurement ilustrando a
metodologia para a localização da trifurcação dos primeiros molares: A Corte coronal com a identificação do plano sagital (linha vermelha) e do plano axial (linha azul), o qual passa sobre a trifurcação dos elementos dentários 26; B Corte sagital com a identificação do plano axial e do plano coronal que passam entre as raízes mesio-vestibular e disto-vestibular do elemento 26, na altura da furca; C Corte axial confirmando a localização do plano coronal e do plano sagital sobre a trifurcação do primeiro molar permanente; D Reconstrução em 3D plano coronal (linha verde) passando entre as raízes mesio-vestibular e disto-vestibular do primeiro molar permanente.
Figura 9 Imagem das RMPs do Software Dolphin®, função Measurement ilustrando a metodologia para a demarcação dos pontos para a avaliação da largura maxilar alveolar. A Corte coronal com a identificação do plano sagital (linha vermelha) e do plano axial (linha azul), o qual passa sobre o ponto Mav/26; localização dos pontos Mav/16, Map/16, Map/26; B corte sagital confirmando o ponto Mav/26 – intersecção do plano coronal (verde) com o axial (azul); C Corte axial confirmando a localização do ponto Mav/26, intersecção dos planos coronal e sagital; D Reconstrução em 3D. Plano sagital; plano coronal (linha verde).

26
Pontos Definição
Mav # dente- Ponto localizado no contorno externo da cortical vestibular do
rebordo alveolar da maxila na altura da trifurcação ou da
bifurcação do dente avaliado, utilizando, para localização, os
cortes coronal, axial e sagital, simultaneamente. Em cada corte, a
intersecção de dois planos localiza o ponto (Figura 9, página 25).
Map # dente Ponto localizado no contorno externo da cortical palatina do
rebordo alveolar da maxila na altura da trifurcação ou da
bifurcação do dente avaliado, utilizando, para localização, os
cortes coronal, axial e sagital, simultaneamente. Em cada corte a
intersecção de dois planos localiza o ponto (Figura 9, página 25).
Quadro 7 Definição dos pontos utilizados para avaliação da largura maxilar alveolar na análise
tomográfica.
Medidas Definição
Mav/16-Mav/26
(Largura Maxilar Alveolar
Vestibular)
Distância entre os pontos Mav localizado na cortical
alveolar vestibular, na altura da trifurcação dos primeiros
molares permanentes do lado direitodo lado esquerdo.
Map16-Map/26
(Largura Maxilar Alveolar
Palatina)
Distância entre os pontos Map-Map localizados na cortical
alveolar do lado palatino do primeiro molar permanente do
lado direito e do lado esquerdo.
Mav/14-Mav/24
(Largura Maxilar Alveolar
Vestibular)
Distância entre os pontos Mav-Mav localizados na cortical
alveolar vestibular na altura do primeiro pré-molar do lado
direito e do lado esquerdo.
Map14-Map/24
(Largura Maxilar Alveolar
Palatina)
Distância entre os pontos Map-Map localizados na cortical
alveolar palatina na altura do primeiro pré-molar do lado
direito e do lado esquerdo.
Quadro 8 Definição das medidas utilizadas para a avaliação da largura maxilar alveolar na
análise tomográfica.
27
Nas situações clínicas em que o plano oclusal estava desnivelado e/ou os
primeiros molares permanentes encontravam-se assimétricos no sentido ântero-
posterior, os pontos de referência foram marcados da forma já descrita. No
entanto, utilizou-se o paquímetro com projeção ortogonal para efetuar as
medições, assim como número maior de voxel para que houvesse mais cortes
sobrepostos, permitindo, dessa maneira, a visualização dos pontos que estavam
em planos diversos.
3.7.7 Avaliação da largura maxilar dentária
A largura maxilar dentária foi analisada considerando-se a distância entre
as raízes palatinas dos primeiros molares permanentes superiores e entre as
raízes palatinas dos primeiros pré-molares superiores e a distância entre os
sulcos centrais dos respectivos dentes (Figura 10, página 28, e Quadro 9, página
29).

28
Figura 10 Imagem das RMPs do Software Dolphin®, função Measurement ilustrando a metodologia para avaliação da largura maxilar dentária. A localização do ponto AP no ápice da raíz palatina dos primeiros molares permanentes superiores esquerdo (AP/26) - intersecção do plano sagital (linha vermelha) com o plano axial (linha azul), no corte coronal; B Ponto AP/26 localizado na intersecção do plano coronal (verde) com axial (azul); C Ponto AP/26 localizado no corte axial-intersecção do plano coronal (verde) com o plano sagital (vermelho); D Reconstrução em 3D evidenciando o plano coronal (verde) passando sobre a raiz palatina do primeiro molar superior esquerdo.

29
Medidas Definição
AP/16-AP/26
(Largura Maxilar Dentária entre
ápices radiculares)
Distância entre os pontos AP do primeiro molar
permanente do lado direito e AP do primeiro
molar superior esquerdo.
SC/16-SC/26
(Largura Maxilar Dentária entre
coroas dentárias)
Distância entre os pontos SC do primeiro molar
permanente superior direito e SC do primeiro
molar superior esquerdo.
AP/14-AP/24
(Largura Maxilar Dentária entre
ápices radiculares)
Distância entre os pontos AP do primeiro pré-
molar do lado direito e AP do primeiro pré-molar
superior esquerdo.
SC/14-SC/24
(Largura Maxilar Dentária entre
coroas dentárias)
Distância entre os pontos SC do primeiro pré-
molar do lado direito e SC do primeiro pré-molar
superior esquerdo.
Quadro 9 Definição das medidas utilizadas para a avaliação da largura maxilar dentária na
análise tomográfica.
A localização dos pontos (Quadro 10, página 30) foi efetuada com o uso
dos três cortes espaciais das tomografias conforme Figura 10 (página 28).

30
Ponto Definição
AP # dente
Ápice da raiz palatina do dente, localizado nos três planos de
espaço, considerando-se a interceptação dos planos axial,
coronal e sagital sobre o ápice radicular para a sua localização
tridimensional.
SC # dente
Sulco central da coroa do dente,localizado nos três planos de
espaço considerando-se a interceptação dos planos axial,
coronal e sagital sobre o sulco central para a sua localização
tridimensional.
Quadro 10 Definição das medidas utilizadas para a avaliação da largura maxilar dentária na
análise tomográfica.
3.7.8 Avaliação da angulação alveolar e inclinação dentária dos primeiros
molares permanentes superiores
Para a realização das medidas angulares foi usada uma linha de
referência, caracterizada como linha de orientação axial (plano axial). A sua
projeção no plano coronal foi empregada como referência para avaliar a
angulação alveolar na região de primeiros molares permanentes superiores,
estabelecendo as medidas que constam no Quadro 11 (página 31) (KARTALIAN
et al., 2010). Para definir a linha tangente ao rebordo alveolar, foi utilizado como
referência o ponto Map.

31
Medidas Definição
16/ALV
(Angulação alveolar do Primeiro
Molar Permanente Superior Direito)
Ângulo interno formado pela linha tangente à
parede interna da cortical alveolar palatina
adjacente ao primeiro molar permanente
superior direito com o plano axial.
26/ALV
(Angulação alveolar do Primeiro
Molar Permanente Superior
Esquerdo)
Ângulo interno formado pela linha tangente à
parede interna da cortical alveolar palatina
adjacente ao primeiro molar permanente
superior esquerdo com o plano axial.
Quadro 11 - Definição das medidas utilizadas para a avaliação da angulação alveolar dos
primeiros molares permanentes superiores na análise tomográfica.
Para determinar a inclinação dos primeiros molares permanentes
superiores também se utilizou o plano axial como referência. A trajetória da raiz
palatina dos elementos dentários 16 e 26 foi identificada a partir da seguinte
metodologia: localização do ápice radicular (ponto AP) dos respectivos dentes nos
planos axial, coronal e sagital. Uma vez identificado o ápice, foram marcados
sucessivos pontos, acompanhando a luz do canal radicular, até o centro da coroa
dentária. Sobre estes pontos foi traçado o longo eixo dos primeiros molares
permanentes superiores, estabelecendo-se as medidas que constam no Quadro
12 (página 32).

32
Medidas Definição
16/INCL
(Inclinação do Primeiro Molar
Permanente Superior Direito)
Ângulo interno formado pelo longo eixo da raiz
palatina do primeiro molar permanente superior
direito com o plano axial.
26/INCL
(Inclinação do Primeiro Molar
Permanente Superior Esquerdo)
Ângulo interno formado pelo longo eixo da raiz
palatina do primeiro molar permanente superior
esquerdo com o plano axial.
Quadro 12 Definição das medidas utilizadas para a avaliação da inclinação dos primeiros molares
permanentes superiores na análise tomográfica.
3.7.9 Avaliação da espessura das corticais ósseas
Para avaliação das espessuras das corticais ósseas vestibulares e
palatinas dos primeiros molares permanentes superiores, seguiu-se uma
metodologia para orientação anatômica dos planos axial, coronal e sagital (Figura
11, página 33), determinando os locais de interesse para as medições nas
imagens de CBCT (Quadro 13, página 34). As mensurações foram realizadas na
altura da furca dos primeiros molares permanentes (Figura 8, página 25) e dos
primeiros pré-molares.

33
Figura 11 Imagem das RMPs do Software Dolphin®, função Measurement ilustrando a metodologia para a localização tridimensional utilizada na avaliação das corticais ósseas dos primeiros molares permanentes superiores: A Corte coronal identificando o plano axial, passando sobre a trifurcação das raízes de 16 e 26 e plano sagital passando sobre a cortical alveolar vestibular na altura da raiz disto-vestibular do 26; B e C Corte sagital e axial, respectivamente confirmando a localização do ponto sobre a cortical alveolar vestibular na altura da raiz disto-vestibular do 26; D Reconstrução em 3D. Plano sagital (linha vermelha); plano coronal (linha verde); plano axial (linha azul).
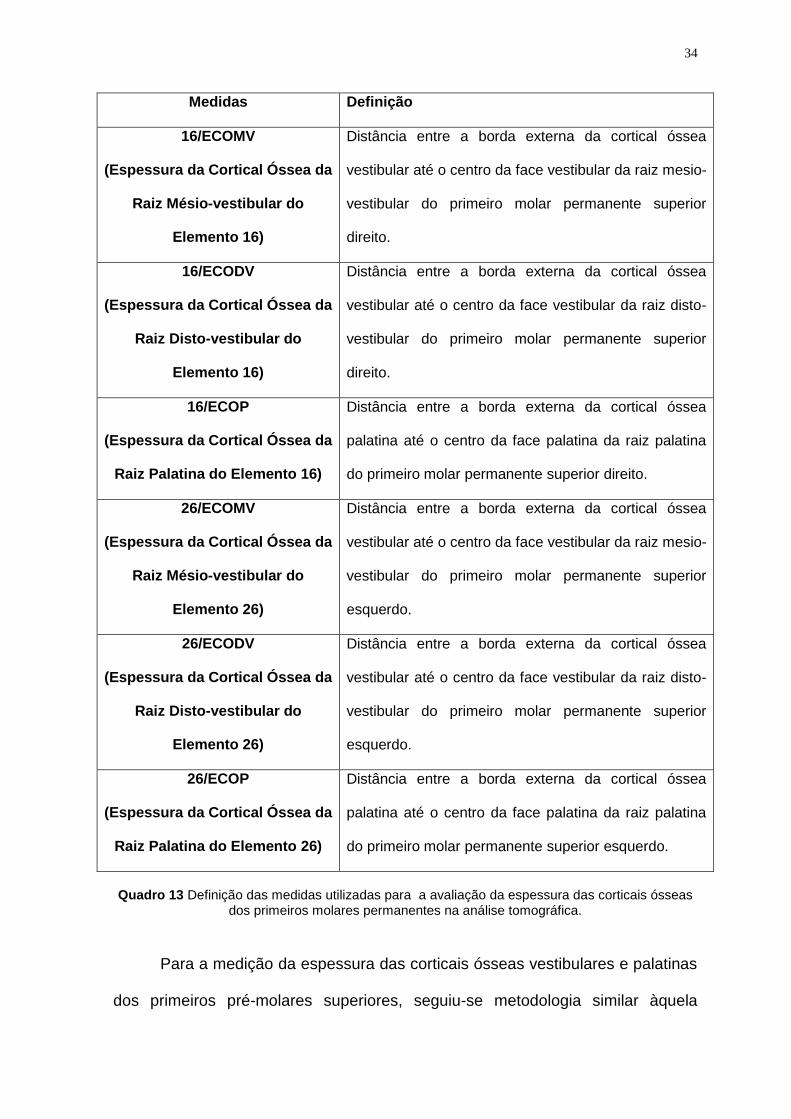
34
Medidas Definição
16/ECOMV
(Espessura da Cortical Óssea da
Raiz Mésio-vestibular do
Elemento 16)
Distância entre a borda externa da cortical óssea
vestibular até o centro da face vestibular da raiz mesio-
vestibular do primeiro molar permanente superior
direito.
16/ECODV
(Espessura da Cortical Óssea da
Raiz Disto-vestibular do
Elemento 16)
Distância entre a borda externa da cortical óssea
vestibular até o centro da face vestibular da raiz disto-
vestibular do primeiro molar permanente superior
direito.
16/ECOP
(Espessura da Cortical Óssea da
Raiz Palatina do Elemento 16)
Distância entre a borda externa da cortical óssea
palatina até o centro da face palatina da raiz palatina
do primeiro molar permanente superior direito.
26/ECOMV
(Espessura da Cortical Óssea da
Raiz Mésio-vestibular do
Elemento 26)
Distância entre a borda externa da cortical óssea
vestibular até o centro da face vestibular da raiz mesio-
vestibular do primeiro molar permanente superior
esquerdo.
26/ECODV
(Espessura da Cortical Óssea da
Raiz Disto-vestibular do
Elemento 26)
Distância entre a borda externa da cortical óssea
vestibular até o centro da face vestibular da raiz disto-
vestibular do primeiro molar permanente superior
esquerdo.
26/ECOP
(Espessura da Cortical Óssea da
Raiz Palatina do Elemento 26)
Distância entre a borda externa da cortical óssea
palatina até o centro da face palatina da raiz palatina
do primeiro molar permanente superior esquerdo.
Quadro 13 Definição das medidas utilizadas para a avaliação da espessura das corticais ósseas
dos primeiros molares permanentes na análise tomográfica.
Para a medição da espessura das corticais ósseas vestibulares e palatinas
dos primeiros pré-molares superiores, seguiu-se metodologia similar àquela

35
utilizada nos primeiros molares permanentes, considerando-se, como referência,
a área de bifurcação dos primeiros pré-molares (Quadro 14).
Medidas Definição
14/ECOV
(Espessura da Cortical Óssea da
Raiz Vestibular do Elemento 14)
Distância entre a borda externa da cortical óssea
vestibular até o centro da face vestibular da raiz
vestibular do primeiro pré-molar superior direito.
14/ECOP
(Espessura da Cortical Óssea da
Raiz Palatina do Elemento 14)
Distância entre a borda externa da cortical óssea
palatina até o centro da face palatina da raiz
palatina do primeiro pré-molar superior direito.
24/ECOV
(Espessura da Cortical Óssea da
Raiz Vestibular do Elemento 24)
Distância entre a borda externa da cortical óssea
vestibular até o centro da face vestibular da raiz
vestibular do primeiro pré-molar superior esquerdo.
24/ECOP
(Espessura da Cortical Óssea da
Raiz Palatina do Elemento 24)
Distância entre a borda externa da cortical óssea
palatina até o centro da face palatina da raiz
palatina do primeiro pré-molar superior esquerdo.
Quadro 14 Definição das medidas utilizadas para a avaliação da espessura das corticais ósseas
dos primeiros pré-molares na análise tomográfica.
3.8 Análise estatística
Os valores nominais de cada variável dependente avaliada em cada tempo
experimental foram tabulados em planilhas e analisados por meio de estatística
descritiva no programa SPSS (Statistical Package for Social Sciences, versão
18.0). Um estatístico, que não participou do delineamento e da execução da
pesquisa, procedeu à análise. A normalidade de distribuição foi verificada com o
teste de Shapiro-Wilk e a homogeneidade pela Prova de Levene. A comparação

36
entre os grupos Haas e o grupo Hyrax, para todas as variáveis nos três tempos
experimentais foi analisada por meio de Teste t de Student, bem como a
comparação das variáveis denominadas variação (T2-T1, T3-T1, T3-T2). A
comparação dos desfechos entre os diferentes tempos experimentais foi avaliada
para cada grupo, isoladamente, por meio de test t para amostras pareadas
(=0,05).

4 DESENVOLVIMENTO DA PESQUISA
4.1 ARTIGO 1
Effects of Haas and Hyrax expanders on midpalatal suture and adjacent
dentoskeletal structures after rapid maxillary expansion: prospective clinical
study
Estela Maris Jurach; Camilo Aquino Melgaço; José Columbano Neto; Lincoln
Issamu Nojima; Eduardo Sant’anna Franzotti; Matilde da Cunha Gonçalves
Nojima
Submissão: American Journal of Orthodontics and Dentofacial Orthopedics
4.2 ARTIGO 2
Effects of rapid maxillary expansion on dentoalveolar structures:
Comparison of growing individuals with Class I malocclusion
Estela Maris Jurach; José Columbano Neto; Camilo Aquino Melgaço; Lincoln
Issamu Nojima; Eduardo Sant’anna Franzotti; Matilde da Cunha Gonçalves
Nojima
Submissão: American Journal of Orthodontics and Dentofacial Orthopedics
38
4.3 ARTIGO 3
Study of the effects of rapid maxillary expansion using Haas and Hyrax
expanders on the thickness of cortical bone : A prospective and comparative
clinical study
Estela Maris Jurach; José Columbano Neto; Camilo Aquino Melgaço; Lincoln
Issamu Nojima; Eduardo Sant’anna Franzotti; Matilde da Cunha Gonçalves
Nojima
Submissão: American Journal of Orthodontics and Dentofacial Orthopedics

ARTIGO 1
Effects of Haas and Hyrax expanders on midpalatal suture and adjacent
dentoskeletal structures after rapid maxillary expansion: prospective clinical
study
ABSTRACT
Introduction: This study evaluated the opening of midpalatal suture, maxillary
width, nasal fossa width and the position of the permanent maxillary central
incisors immediately after expansion and after six months of retention to compare
the effects of the treatment of maxillary atresias using two types of expanders.
Material and methods: Thirty-two patients (mean age: boys, 12.88 years; girls,
13.06 years) were randomly divided into two groups according to type of
expander: group 1, Haas; and group 2, Hyrax. Cone beam computed tomography
images were obtained before treatment (T1), immediately after expansion (T2),
and after 6 months of retention (T3). Measurements were made and compared at
the three time points.
Results: Immediately after maxillary expansion there were no statistically
significant differences in opening of midpalatal suture, maxillary width, nasal fossa
width and movement of maxillary incisors between groups. Midpalatal suture
opening in the Haas and Hyrax group was parallel anteroposteriorly and vertically
Skeletal changes remained the same after 6 months of retention, when the
separation between the root apices of incisors was even greater.
Conclusion: Midpalatal suture opening and shape immediately after maxillary
expansion were similar in both groups (Haas and Hyrax), as were orthopedic and
40
dental effects. After 6 months of retention, skeletal changes became stable and
were similar in the two groups, but the midpalatal suture was not completely
closed and maxillary central incisors remained significantly separated.
INTRODUCTION
Rapid maxillary expansion (RME) as a result of midpalatal suture opening is
a classical procedure in the correction of, for example, true or relative maxillary
deficiency, respiratory disorders, and arch length deficiencies. Some of the
appliances more often used for RME are the tooth-tissue borne Haas expander,1
the tooth-borne Hyrax expander2 and the acrylic splint expander.3
There is no consensus in the literature, however, about how midpalatal
opening occurs. Using cephalometric studies, Haas4 found that the midpalatal
suture, after RME, opens in a parallel shape anteroposteriorly and, vertically, as a
triangle with its apex towards the nasal cavity. Wertz and Dreskin5 found that, after
RME, midpalatal suture opening was not parallel anteroposteriorly but, rather, was
wider at the level of the anterior nasal spine (ANS), and that its width decreased
posteriorly. Studies using cone beam computed tomography (CBCT) found
different results when analyzing how the midpalatal suture opened.6-13
RME has orthopedic effects on the nasal fossa (NF) because the maxillary
bones are part of the nasal cavity.8,9,11,14 Another result of midpalatal suture
opening is the separation of maxillary central incisor and the greater maxillary
width.11,14,15
Most studies in this area evaluated the effect of RME using only one
type of expander.6,8-11 Few studies compared interventions using different
expanders to investigate whether any provided better results. Garib, in 2005,16

41
conducted a comparative study between Hyrax and Haas expanders and found
that both had similar results.16 Weissheimer, in 2011,13 also evaluated the
effectiveness of the Haas and Hyrax expanders and found that both corrected
transverse maxillary deficiencies effectively. However, the group that used the
Hyrax expander had a more significant orthopedic effect.
Patient age may also affect the pattern of midpalatal suture opening.
Habersack et al.7 used multislice computed tomography and found that the pattern
of opening differs for individuals whose skeletal maturity is at different stages.
This study evaluated the opening of the midpalatal suture and the effects on
the adjacent dentoskeletal structures of a group of individuals at a similar skeletal
maturation stage treated with Haas or Hyrax expanders. It investigated whether
tooth-tissue-borne appliances, due to their acrylic pad in contact with the palate,
might lead to greater midpalatal suture opening and more substantial effects on
the adjacent structures, and also investigated whether retention for six months
was sufficient to achieve full closure of the midpalatal suture.
MATERIALS AND METHODS
This prospective study was approved by the Ethics in Research Committee
of the Institute for Collective Health Studies (IESC) of Universidade Federal do Rio
de Janeiro, under number 62/2009 and according to resolution no. 35/2010.
Patient parents or guardians provided free informed consent to participate in this
study. The sample was selected in 5 public schools in the city of Belo Horizonte,
Brazil. Inclusion criteria were: young individuals with permanent dentition,
malocclusion Angle Class I, clinical indication of orthopedic treatment with rapid
palatal expansion; cervical vertebrae maturation stage 317 and adequate clinical

42
crown of the maxillary permanent first premolars and first molars. Exclusion criteria
were: periodontal disease; metal restorations in posterior teeth; previous
orthodontic treatment; and genetic diseases.
The sample was randomly divided into two groups: Group 1 (Haas), with 16
individuals that underwent RME using a Haas expander; and Group 2 (Hyrax),
with 16 individuals treated with Hyrax expanders. In the two groups, the
permanent maxillary first premolars and first molars received metal bands. During
the manufacture of the expander, 1-mm buccal wires were soldered to the buccal
surface of the orthodontic bands. Appliances were rigorously manufactured
according to a previously defined protocol. The groups followed the same
activation schedule: the expanding screw (Morelli) was activated one full turn on
the day the appliance was placed and, after that, 1/4 of a turn in the morning and
1/4 at night every day until the necessary expansion was achieved. After the end
of the activation phase, the screw was stabilized with a ligature and kept in the
mouth for six months for retention.
Three-dimensional CBCT images were used for evaluations. Images were
acquired using an I-Cat scanner (Imaging Sciences International, Hatfield, PA) at
36.90 mA, 120 kV, 40s-s exposure time, FOV of 22 cm and voxel resolution of 0.3
mm. Records were made before treatment (T1), immediately after rapid palatal
expansion (T2) and after 6 months of retention (T3). All images were positioned
and standardized using the Dolphin Imaging 11.0 software (Dolphin Imaging &
Management Solutions, Chatsworth, CA).
After the images were imported as Digital Imaging and Communications in
Medicine (DICOM) files, 3D reconstruction of each patient at each time point (T1,
T2 and T3) were uploaded and positioned according to the orbital and porion

43
points (right and left sides) and the nasion to define the axial, coronal and sagittal
planes.18 In the frontal view, the floor of the orbits was parallel to the ground. In the
right lateral view, the Frankfort horizontal plane was parallel to the ground.19 The
left side was examined to confirm the position of the Frankfort horizontal plane.12
Points were marked on the CBCT images to obtain the linear measures
used the evaluation of: midpalatal suture (ANS-NF; ANS-HP; PNS-NF; PNS-HP);
distance between maxillary permanent incisors (CIr-CIl(ra); CIr-CIl(cej); width of
NF (NfR-NfL); skeletal maxillary width (MxR-MxL) (Figures 1, 2 and 3).
To evaluate midpalatal suture opening, eight points were defined on the
CBCT images, as described below (Figure 1).
Point 1 and Point 2 - located at the level of the floor of the NF and the posterior
nasal spine (PNS) on the right and left sides. The following parameters were used
as references to determine them: sagittal plane slightly away from the median
sagittal plane; coronal plane intercepting the PNS; and axial plane at the level of
the floor of the NF.
Point 3 and Point 4 - located at the level of the hard palate (HP) and the PNS on
the right and left sides. The following parameters were used as references to
determine them: sagittal plane slightly away from the median sagittal plane;
coronal plane intercepting the PNS; and axial plane at the level of the HP.

44
Figure 1 - Multiplanar reconstruction images (MPR) to measure the width of the midpalatal suture opening. Width of the midpalatal suture in the PNS region at the level of the nasal fossa between points 1 and 2 (PNS-NF). Width of the midpalatal suture in the PNS region, at the level of the HP, between points 3 and 4 (PNS-HP). Width of the midpalatal suture in the anterior nasal spine region at the level of the nasal fossa between points 5 and 6 (ANS-NF). Width of the midpalatal suture in the anterior nasal spine region at the level of the hard palate between points 7 and 8 (ANS-HP). A. Coronal slice intersecting PNS; B. Sagittal slice and identification of PNS; C. Coronal slice intersecting ANS; D. Sagittal slice and identification of ANS (Dolphin Imaging® 11.0).
Point 5 and Point 6 - located at the level of the floor of the NF and the ANS on
the right and left sides. The following parameters were used as references to
determine them: sagittal plane positioned lateral to midpalatal suture; coronal
plane intercepting the ANS; and axial plane at the level of the floor of the NF.
Point 7 and Point 8 - located at the level of the HP and the ANS on the right and
left sides. The following parameters were used as references to determine them:
sagittal plane slightly away from the median sagittal plane; coronal plane
intercepting the ANS; and axial plane at the level of the HP.
After that, measurements were made between points, as seen in Figure 1.
The distance between maxillary central incisors was measured at two
different anatomic regions: between root apices of the right and left maxillary

45
central incisors (CIr-CIl(ra)) and between the cementoenamel junctions of the
same teeth (CIr-CIl(cej)). Points were located according to the projection of the
axial, coronal and sagittal planes over the desired anatomic structures, as shown
in Figure 2.
The location of points for the measurement of the maxillary bone width and
NF width is shown in Figure 3.
Figure 2 - Multiplanar reconstruction images (MPR) to measure the distance between maxillary central incisors at the level of the root apices (CIr-CIl(ra)) and the cementoenamel junction (CIr-CIl(cej)): A and B. Coronal and sagittal slices illustrate the location of root apex of tooth # 21 (CIl(ra)) (blue arrow); C. Coronal slice shows the location of the cementoenamel junction of teeth # 11 and #21 (CIr-CIl(cej)) (red arrows); D. Axial slice shows CIl(cej) of tooth # 21 using the axial and coronal planes (red arrow) (Dolphin Imaging® 11.0).

46
Figure 3 - Multiplanar reconstructions images (MPR) illustrate method to measure width of maxillary bone and width of nasal fossa: A. Coronal slice intersecting the maxillary zygomatic process and identification of the sagittal plane intersecting NfL at 10 mm above the plane of the maxillary bone width (MxR-MxL) located over the axial plane, which intersects the upper edge of the maxillary bone concavity, characterized by the junction of the maxilla and the zygomatic process. Identification of MxR, MxL, NfR and NfL; B Sagittal slice and identification of axial and coronal planes that intersect the most external portion of the left nasal fossa; C. Axial slice illustrates coronal plane intersecting the deepest point of the outline of zygomatic process, with bilateral marks of points MxR and MxL and the sagittal plane; D. 3-D reconstruction. Sagittal plane (red line); coronal plane (green line); axial plane (blue line) (Dolphin Imaging® 11.0).
RESULTS
At T1 and T2, 32 individuals (19 girls and 13 boys) were included in the
study, 16 in group 1 and 16 in group 2. Mean age was 12 years and 10 months for
girls and 13 years for boys. At T3, the number of individuals in group 1 was the
same, but group 2 had only 13 participants. Mean opening of the expander screw
was 6.35 mm in the Haas group and 5.88 mm in the Hyrax group.
Concerning intraexaminer reliabilitymean ICC was 0.985 (lower limit =
0.962; upper limit = 0.995) for all variables, which confirmed excellent agreement.
Baseline data (T1) about dentoskeletal structures did not reveal any
significant statistical differences between Haas and Hyrax groups for each of the
variables under analysis (Table I). Descriptive statistics and comparisons between
C

47
appliances at T2 and T3, as well as comparisons between periods of evaluations
are shown in Tables II, III.
The separated evaluation of the Haas and Hyrax groups revealed that both
had significant statistical differences between T2 and T1 in all variables, as well as
between T3 and T1 evaluations. During retention (T3xT2), there were no
statistically significant variations in skeletal measurements (NfR-NfL; MxR-MxL)
(Table II).
The opening of midpalatal suture was confirmed in all patients after active
expansion. In both the Haas and Hyrax groups, opening was parallel
anteroposteriorly and vertically (Table III).
The comparison of the effect of the orthopedic treatment using Haas and
Hyrax expanders revealed that there were no significant differences in opening of
the midpalatal suture, maxillary bone width, NF width and incisor movement
between groups (Table III).
Table I. Baseline data of dentoskeletal structures in the Haas and Hyrax groups before treatment (T1).
Variable
Haas,
mean (SD)
Hyrax,
mean (SD)
Mean difference
p
NfR-NfL 32.10(1.95) 32.16(2.96) 0.06 0.94
MxR-MxL 63.76 (2.66) 63.07 (2.68) 0.69 0.47
Cir-CIl(ra) 6.67(1.06) 7.11(1.07) 0.43 0.25
Cir-CIl(cej) 1.85(0.48) 2.00(0.58) 0.14 0.44
*p value of t test for independent samples (α=95)
n = 16
Cir-CIl(cej) = distance between permanent maxillary central incisors at the level of the
cementoenamel junction; Cir-CIl(ra) = distance between root apices of permanent maxillary central
incisors; NfR-NfL = width of nasal fossa; MxR-MxL = skeletal maxillary width; SD = standard
deviation.
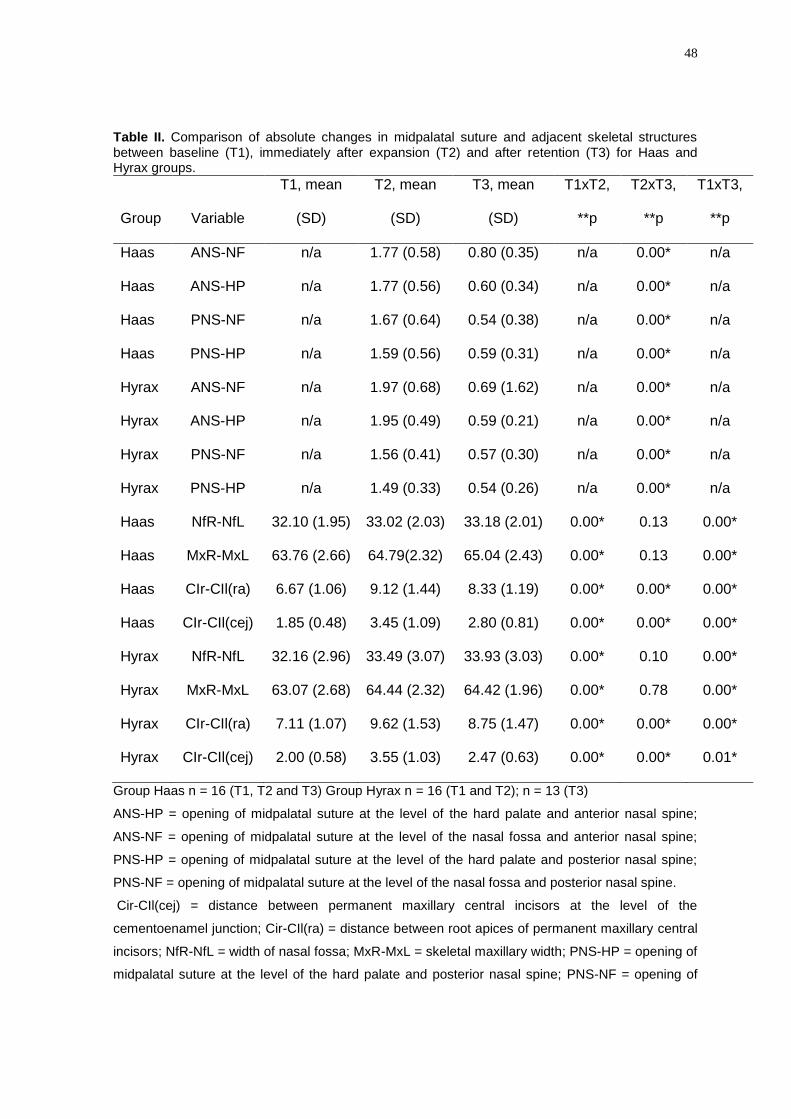
48
Table II. Comparison of absolute changes in midpalatal suture and adjacent skeletal structures between baseline (T1), immediately after expansion (T2) and after retention (T3) for Haas and Hyrax groups.
Group Variable
T1, mean
(SD)
T2, mean
(SD)
T3, mean
(SD)
T1xT2,
**p
T2xT3,
**p
T1xT3,
**p
Haas ANS-NF n/a 1.77 (0.58) 0.80 (0.35) n/a 0.00* n/a
Haas ANS-HP n/a 1.77 (0.56) 0.60 (0.34) n/a 0.00* n/a
Haas PNS-NF n/a 1.67 (0.64) 0.54 (0.38) n/a 0.00* n/a
Haas PNS-HP n/a 1.59 (0.56) 0.59 (0.31) n/a 0.00* n/a
Hyrax ANS-NF n/a 1.97 (0.68) 0.69 (1.62) n/a 0.00* n/a
Hyrax ANS-HP n/a 1.95 (0.49) 0.59 (0.21) n/a 0.00* n/a
Hyrax PNS-NF n/a 1.56 (0.41) 0.57 (0.30) n/a 0.00* n/a
Hyrax PNS-HP n/a 1.49 (0.33) 0.54 (0.26) n/a 0.00* n/a
Haas NfR-NfL 32.10 (1.95) 33.02 (2.03) 33.18 (2.01) 0.00* 0.13 0.00*
Haas MxR-MxL 63.76 (2.66) 64.79(2.32) 65.04 (2.43) 0.00* 0.13 0.00*
Haas CIr-CIl(ra) 6.67 (1.06) 9.12 (1.44) 8.33 (1.19) 0.00* 0.00* 0.00*
Haas CIr-CIl(cej) 1.85 (0.48) 3.45 (1.09) 2.80 (0.81) 0.00* 0.00* 0.00*
Hyrax NfR-NfL 32.16 (2.96) 33.49 (3.07) 33.93 (3.03) 0.00* 0.10 0.00*
Hyrax MxR-MxL 63.07 (2.68) 64.44 (2.32) 64.42 (1.96) 0.00* 0.78 0.00*
Hyrax CIr-CIl(ra) 7.11 (1.07) 9.62 (1.53) 8.75 (1.47) 0.00* 0.00* 0.00*
Hyrax CIr-CIl(cej) 2.00 (0.58) 3.55 (1.03) 2.47 (0.63) 0.00* 0.00* 0.01*
Group Haas n = 16 (T1, T2 and T3) Group Hyrax n = 16 (T1 and T2); n = 13 (T3)
ANS-HP = opening of midpalatal suture at the level of the hard palate and anterior nasal spine;
ANS-NF = opening of midpalatal suture at the level of the nasal fossa and anterior nasal spine;
PNS-HP = opening of midpalatal suture at the level of the hard palate and posterior nasal spine;
PNS-NF = opening of midpalatal suture at the level of the nasal fossa and posterior nasal spine.
Cir-CIl(cej) = distance between permanent maxillary central incisors at the level of the
cementoenamel junction; Cir-CIl(ra) = distance between root apices of permanent maxillary central
incisors; NfR-NfL = width of nasal fossa; MxR-MxL = skeletal maxillary width; PNS-HP = opening of
midpalatal suture at the level of the hard palate and posterior nasal spine; PNS-NF = opening of

49
midpalatal suture at the level of the nasal fossa and posterior nasal spine; SD = standard deviation;
n/a = not applicable; p value for t paired-test (α=95%).
Table III. Comparison of transverse variations () between groups at periods after RME (T2) and at baseline; after retention (T3) and after RME (T2); and after retention (T3) and at baseline (T1).
Variable Haas, mean (SD) Hyrax, mean (SD) Mean difference **p
∆ANS-NF T3-T2 -0.97(0.59) -1.28(0.74) 0.31 0.21
∆ANS-HP T3-T2 -1.16(0.62) -1.36(0.61) 0.20 0.40
∆PNS-NF T3-T2 -1.13(0.61) -0.99(0.37) -0.14 0.48
∆PNS-HP T3-T2 -1.00(0.60) -0.95(0.34) -0.05 0.80
∆NfR-NfL T2-T1 0.92 (0.71) 1.32 (0.72) -0.40 0.12
∆NfR-NfL T3-T1 1.08(0.64) 1.39(0.81) -0.31 0.25
∆NfR-NfL T3-T2 0.16(0.38) -0.00 (0.37) 0.16 0.27
∆MxR-MxL T2-T1 1.02 (0.66) 1.36 (0.91) -0.33 0.24
∆MxR-MxL T3-T1 1.28(0.97) 1.37(0.91) -010 0.77
∆MxR-MxL T3-T2 0.24(0.63) 0.03(0.46) 0.21 0.32
∆CIr-CIl(ra) T2-T1 2.44(1.06) 2.51(0.98) -0.07 0.85
∆CI—CIl(ra) T3-T1 1.65(0.90) 1.55(0.94) 0.10 0.75
∆CIr-CIl(ra) T3-T2 -0.78(0.85) -0.95(0.68) 0.17 0.56
∆CIr-CIl(cej) T2-T1 1.59(0.90) 1.55(0.85) -0.04 0.88
∆CIr-CIl(cej) T3-T1 0.94(0.69) 0.48(0.60) 0.46 0.06
∆CIr-CIl(cej) T3-T2 -0.65(0.54) -1.03(0.69) 0.38 0.10
Group Haas n = 16 (T1,T2 and T3) Group Hyrax n =16 (T1 and T2), n =13 (T3)
p value of t test for independent samples (α=95%).
ANS-HP = opening of midpalatal suture at the level of the hard palate and anterior nasal spine;
ANS-NF = opening of midpalatal suture at the level of the nasal fossa and anterior nasal spine;
PNS-HP = opening of midpalatal suture at the level of the hard palate and posterior nasal spine;
PNS-NF = opening of midpalatal suture at the level of the nasal fossa and posterior nasal spine;
CIr-CIl(cej) = width between the cementoenamel junctions of maxillary left and right central
incisors; Cir-CIl(ra) = width between rot apices of maxillary right and left central incisors; MxR-MxL
= skeletal width of maxilla between right and left side of maxilla; NfR-NfL = width between right and
left sides of nasal fossa;

50
DISCUSSION
The opening of the midpalatal suture is the main result in treatments using
RME, and its evaluation makes it possible to measure the skeletal gain for the
correction of dentoalveolar discrepancies, which is clearly confirmed in this study
(Table II). RME was achieved using two different appliances, Haas and Hyrax. The
manufacture of the Haas expander followed the protocol described in the study
published in 19611, in which, to obtain maximal anchorage, lingual and buccal
archwires were fixed close to the gingival outline of anchorage teeth and an acrylic
pad placed in contact with the palate. The acrylic pad was restricted to the area
between first premolar and molar to keep free the gingival and palatal tissues of
ischemic areas and, therefore, to provide good local conditions of tissue
reorganization during retention. According to Haas, such anchorage criteria are
important because the smaller the displacement of tooth anchorage, the greater
the maxillary expansion4. For the Hyrax expander, in addition to the internal
metallic structure, anchorage was achieved using archwires soldered to the buccal
surfaces of the first permanent premolars and molars.
The opening of the midpalatal suture occurred at the end of the active
maxillary expansion phase in the Haas and Hyrax groups (Tables II and III) with no
statistically significant difference between them (Table III). These findings are in
disagreement with the principles established by Haas, who suggested that tooth-
tissue-borne expanders, which have greater anchorage than the Hyrax expanders,
provide greater opening of the midpalatal suture. There were no differences in the
shape of the opening of the midpalatal suture between groups: resulted in the

51
parallel opening of the midpalatal suture anteroposteriorly and vertically. Although
there are studies in the literature that compared RME using Haas and Hyrax
expanders 13,16,20 , the relevance of the method used in our study to evaluate
midpalatal suture lies in the fact that it analyzes it anteroposteriorly and vertically
using the anterior and posterior nasal spine at the level of the HP and the NF as
skeletal references.
Weissheimer et al. 13 used active rapid maxillary expansion in a younger
sample than the one used in our study and found statistically significant
differences between the effects of the Haas and Hyrax expanders in the opening
of the midpalatal suture anteroposteriorly. Those authors found that the opening
was wedge-shaped and greater toward the anterior region after the use of both
types of expanders. Their evaluation was based on dental structures at the level of
the permanent first molar and canines, and that the mean anterior-posterior
difference was 1.12 mm.
Our study findings, described here, are in disagreement with those reported
in previous studies using frontal cephalometric radiographs, which found that
midpalatal suture opening was triangular with the base towards the roof of the
mouth and with its rotation center close to the frontonasal suture1,4,6,21,22 .
Evaluations using occlusal radiographs showed that the anteroposterior opening is
triangular with the greater opening in the region of the ANS 22. However, the PNS
region, due to bone superimpositions on radiographic images, is difficult to
evaluate. Occlusal radiographs clearly show the opening of the midpalatal suture
up to the midpalate. In contrast, the posterior region is not visualized due to the
superimposition of the bones of the base of the cranium. Three-dimensional
evaluation using CT provides visualization of PNS without superimposition of bone
52
structures and, therefore, of the shape of the midpalatal suture opening. Da Silva
Filho et al. 6 used CT to evaluate children with deciduous and mixed dentition that
used the Haas expander without a buccal archwire. They found that the midpalatal
suture opening had the shape of a pyramid anteroposteriorly, and that the
midpalatal suture opening in the PNS region was 43% of that found in the ANS
area. Ballanti et al. 11 found that the suture opening was practically parallel
vertically and triangular anteroposteriorly in a group that used the Hyrax expander,
Podesser et al. 8 and Christie et al. 12 used expanders with acrylic splints and
found that the midpalatal suture opening was parallel anteroposteriorly, findings
that are similar to those in our study. However, the mean values found by Christie
et al. were substantially greater (4.33 at 1MP mm and at canines ) than those
found in our study (Table III). In the study by Christie et al. 12 ,mean skeletal age
was lower than in our study. Therefore, results might be different because, in our
study, individuals were older and, consequently, midpalatal sutures were at a more
advanced stage of skeletal maturation23. The results reported by Podesser et al. 8
and Silva Filho et al. 6 for opening of the midpalatal suture were also similar to
ours. Wertz and Dreskin5 confirmed that orthopedic changes are greater when
patients undergo treatment before the age of 12 years. Habersack et al. 7
described the shape of the midpalatal suture opening, but did not report any
values. They found that it is parallel in younger individuals and pyramidal, both
vertically and sagittally in older individuals.
After retention (T3), the midpalatal suture in both groups was still not fully
closed (Table II). The reorganization of the hard tissues of the suture begins after
the active phase of the treatment1 and continues during retention24-26 . Other
studies10,11,27 found different values from those in our study, and demonstrated,
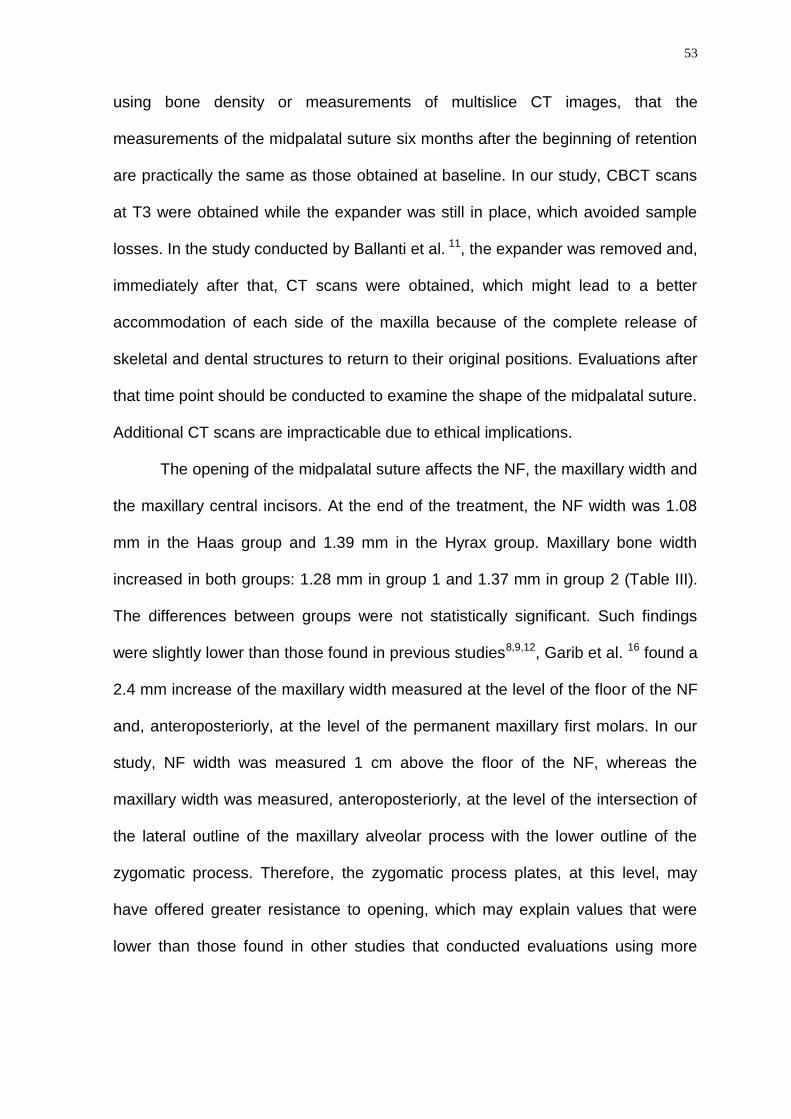
53
using bone density or measurements of multislice CT images, that the
measurements of the midpalatal suture six months after the beginning of retention
are practically the same as those obtained at baseline. In our study, CBCT scans
at T3 were obtained while the expander was still in place, which avoided sample
losses. In the study conducted by Ballanti et al. 11, the expander was removed and,
immediately after that, CT scans were obtained, which might lead to a better
accommodation of each side of the maxilla because of the complete release of
skeletal and dental structures to return to their original positions. Evaluations after
that time point should be conducted to examine the shape of the midpalatal suture.
Additional CT scans are impracticable due to ethical implications.
The opening of the midpalatal suture affects the NF, the maxillary width and
the maxillary central incisors. At the end of the treatment, the NF width was 1.08
mm in the Haas group and 1.39 mm in the Hyrax group. Maxillary bone width
increased in both groups: 1.28 mm in group 1 and 1.37 mm in group 2 (Table III).
The differences between groups were not statistically significant. Such findings
were slightly lower than those found in previous studies8,9,12, Garib et al. 16 found a
2.4 mm increase of the maxillary width measured at the level of the floor of the NF
and, anteroposteriorly, at the level of the permanent maxillary first molars. In our
study, NF width was measured 1 cm above the floor of the NF, whereas the
maxillary width was measured, anteroposteriorly, at the level of the intersection of
the lateral outline of the maxillary alveolar process with the lower outline of the
zygomatic process. Therefore, the zygomatic process plates, at this level, may
have offered greater resistance to opening, which may explain values that were
lower than those found in other studies that conducted evaluations using more

54
anterior points. Our results are similar to those reported in some cephalometric
studies14,28 , which used the same anatomic points for evaluation.
After opening of the midpalatal suture, one of the visible clinical results is
the appearance of a diastema between the maxillary central incisors. In our study,
they were separated in both groups. Separation was greater at the level of the root
apices, smaller at the cementoenamel junction, and was similar in both groups
immediately after expansion (T2) (Tables II and III). Our findings are in agreement
with studies that used cephalometry1,14 and CT 11 and found that the roots of
maxillary central incisors separate more than their crowns. After 6 months of
retention, incisor roots were still separated, but already closer to each other. The
crowns also were closer, but had still not returned to their original positions. After 6
months of retention, Ballanti et al. 11 found that the distance between crowns was
smaller (0.09 mm), whereas the roots were still separated (1.98 mm). Lagravère et
al. 15, in 2010, compared groups after active expansion and found values that are
similar to those reported in our study for the Hyrax group, with a separation of 1.67
mm (SD = 1.38 mm) between apices of the central incisors after RME and, after 6
months of retention, 1.51 mm (SD = 1.37 mm), which is also similar to the value
found in our study, which was 1.55 mm (SD = 1.37 mm), as shown in Table II.
CONCLUSIONS
In this study there were no significant differences between the effects of the
Haas and Hyrax expanders in the values of midpalatal suture opening, width of the
NF, width of the maxillary bone and position of maxillary central incisors
immediately after RME and after 6 months of retention.

55
The shape of the midpalatal suture opening was parallel vertically and
anteroposteriorly in the Haas group and the Hyrax group.
After 6 months of retention, the midpalatal suture was still not fully closed
and skeletal results remained unaltered.
Acknowledgements
We thank the support that this study received from CAPES and FAPERJ.

56
REFERENCES
1. Haas AJ. Rapid expansion of the maxillary dental arch and nasal cavity by
opening the midpalatal suture. Angle Orthod. 1961;31(2):73-90.
2. Biederman W. A hygienic appliance for rapid expansion. JPO J Pract
Orthod. 1968 Feb;2(2):67-70.
3. McNamara JA. Maxillary transverse deficiency. Am J Orthod Dentofacial
Orthop. 2000 May;117(5):567-70.
4. Haas AJ. Palatal expansion: just the beginning of dentofacial orthopedics.
Am J Orthod. 1970 Mar;57(3):219-55.
5. Wertz R, Dreskin M. Midpalatal suture opening: a normative study. Am J
Orthod. 1977 Apr;71(4):367-81.
6. da Silva Filho OG, Lara TS, de Almeida AM, da Silav HC. Evaluation of the
midpalatal suture during rapid palatal expansion in children: a CT study. J Clin
Pediatr Dent. 2005 Spring;29(3):231-8.
7. Habersack K, Karoglan A, Sommer B, Benner KU. High-resolution multislice
computerized tomography with multiplanar and 3-dimensional reformation imaging
in rapid palatal expansion. Am J Orthod Dentofacial Orthop. 2007 Jun;131(6):776-
81.
8. Podesser B, Williams S, Crismani AG, Bantleon HP. Evaluation of the
effects of rapid maxillary expansion in growing children using computer
tomography scanning: a pilot study. Eur J Orthod. 2007 Feb;29(1):37-44.
9. Garrett BJ, Caruso JM, Rungcharassaeng K, Farrage JR, Kim JS, Taylor
GD. Skeletal effects to the maxilla after rapid maxillary expansion assessed with
cone-beam computed tomography. Am J Orthod Dentofacial Orthop. 2008
Jul;134(1):8-9.
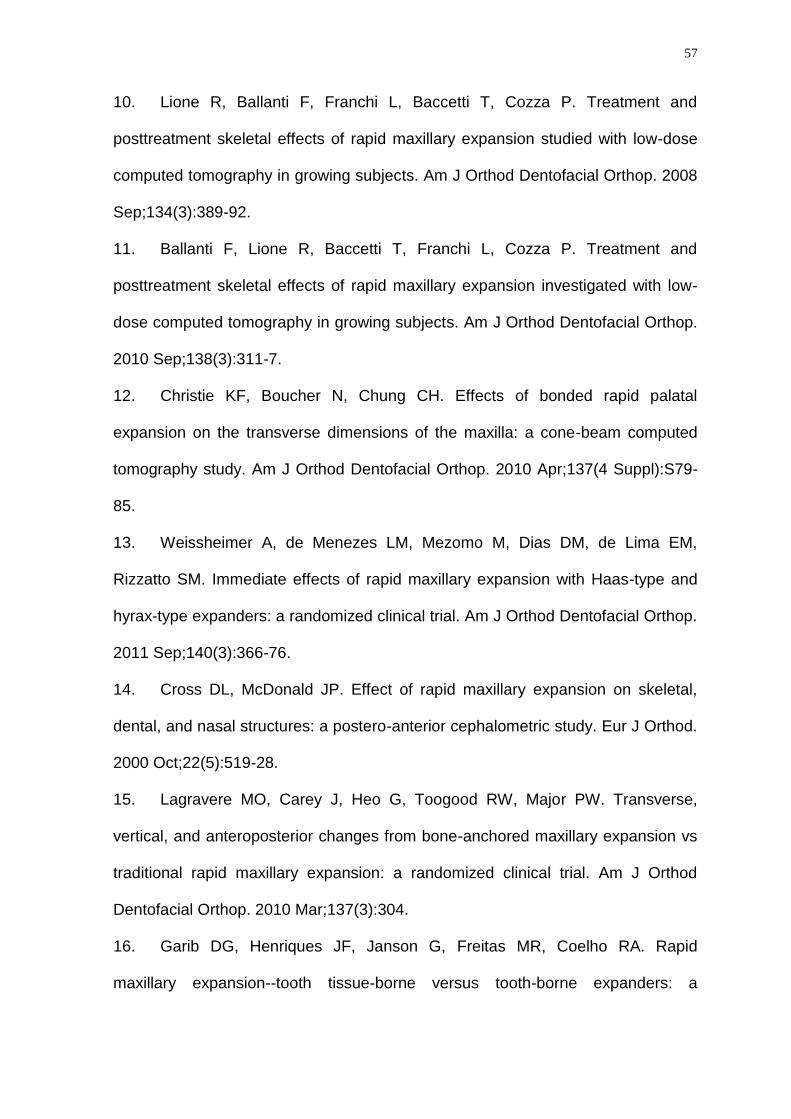
57
10. Lione R, Ballanti F, Franchi L, Baccetti T, Cozza P. Treatment and
posttreatment skeletal effects of rapid maxillary expansion studied with low-dose
computed tomography in growing subjects. Am J Orthod Dentofacial Orthop. 2008
Sep;134(3):389-92.
11. Ballanti F, Lione R, Baccetti T, Franchi L, Cozza P. Treatment and
posttreatment skeletal effects of rapid maxillary expansion investigated with low-
dose computed tomography in growing subjects. Am J Orthod Dentofacial Orthop.
2010 Sep;138(3):311-7.
12. Christie KF, Boucher N, Chung CH. Effects of bonded rapid palatal
expansion on the transverse dimensions of the maxilla: a cone-beam computed
tomography study. Am J Orthod Dentofacial Orthop. 2010 Apr;137(4 Suppl):S79-
85.
13. Weissheimer A, de Menezes LM, Mezomo M, Dias DM, de Lima EM,
Rizzatto SM. Immediate effects of rapid maxillary expansion with Haas-type and
hyrax-type expanders: a randomized clinical trial. Am J Orthod Dentofacial Orthop.
2011 Sep;140(3):366-76.
14. Cross DL, McDonald JP. Effect of rapid maxillary expansion on skeletal,
dental, and nasal structures: a postero-anterior cephalometric study. Eur J Orthod.
2000 Oct;22(5):519-28.
15. Lagravere MO, Carey J, Heo G, Toogood RW, Major PW. Transverse,
vertical, and anteroposterior changes from bone-anchored maxillary expansion vs
traditional rapid maxillary expansion: a randomized clinical trial. Am J Orthod
Dentofacial Orthop. 2010 Mar;137(3):304.
16. Garib DG, Henriques JF, Janson G, Freitas MR, Coelho RA. Rapid
maxillary expansion--tooth tissue-borne versus tooth-borne expanders: a

58
computed tomography evaluation of dentoskeletal effects. Angle Orthod. 2005
Jul;75(4):548-57.
17. Baccetti T, Franchi L, McNamara JR JA. The cervical vertebral maturation
(CVM) method for the assessment of optimal treatment timing in dentofacial
orthopedics. Semin Orthod. 2005;11(119-129).
18. Cevidanes LH, Styner M, Proffit WR. [Three-dimensional superimposition of
the skull base for the longitudinal evaluation of the effects of growth and of
treatment]. Orthod Fr. 2009 Dec;80(4):347-57.
19. Proffit WR, Fields HW. Contemporary orthodontics. St. Louis: Mosby; 2000.
20. Garib DG, Henriques JF, Janson G, de Freitas MR, Fernandes AY.
Periodontal effects of rapid maxillary expansion with tooth-tissue-borne and tooth-
borne expanders: a computed tomography evaluation. Am J Orthod Dentofacial
Orthop. 2006 Jun;129(6):749-58.
21. Haas AJ. The Treatment of Maxillary Deficiency by Opening the Midpalatal
Suture. Angle Orthod. 1965 Jul;35:200-17.
22. Wertz RA. Skeletal and dental changes accompanying rapid midpalatal
suture opening. Am J Orthod. 1970 Jul;58(1):41-66.
23. Melsen B. Palatal growth studied on human autopsy material. A histologic
microradiographic study. Am J Orthod. 1975 Jul;68(1):42-54.
24. Cleall JF, Bayne DI, Posen JM, Subtelny JD. Expansion of the Midpalatal
Suture in the Monkey. Angle Orthod. 1965 Jan;35:23-35.
25. Starnbach H, Bayne D, Cleall J, Subtelny JD. Facioskeletal and dental
changes resulting from rapid maxillary expansion. Angle Orthod. 1966
Apr;36(2):152-64.
59
26. Melsen B. A histological study of the influence of sutural morphology and
skeletal maturation on rapid palatal expansion in children. Trans Eur Orthod Soc.
1972:499-507.
27. Franchi L, Baccetti T, Lione R, Fanucci E, Cozza P. Modifications of
midpalatal sutural density induced by rapid maxillary expansion: A low-dose
computed-tomography evaluation. Am J Orthod Dentofacial Orthop. 2010
Apr;137(4):486-8.
28. Krebs A. Expansion of the midpalatal suture, studied by means of metallic
implants. Acta Odont Scand 1959;92(5):491-501.
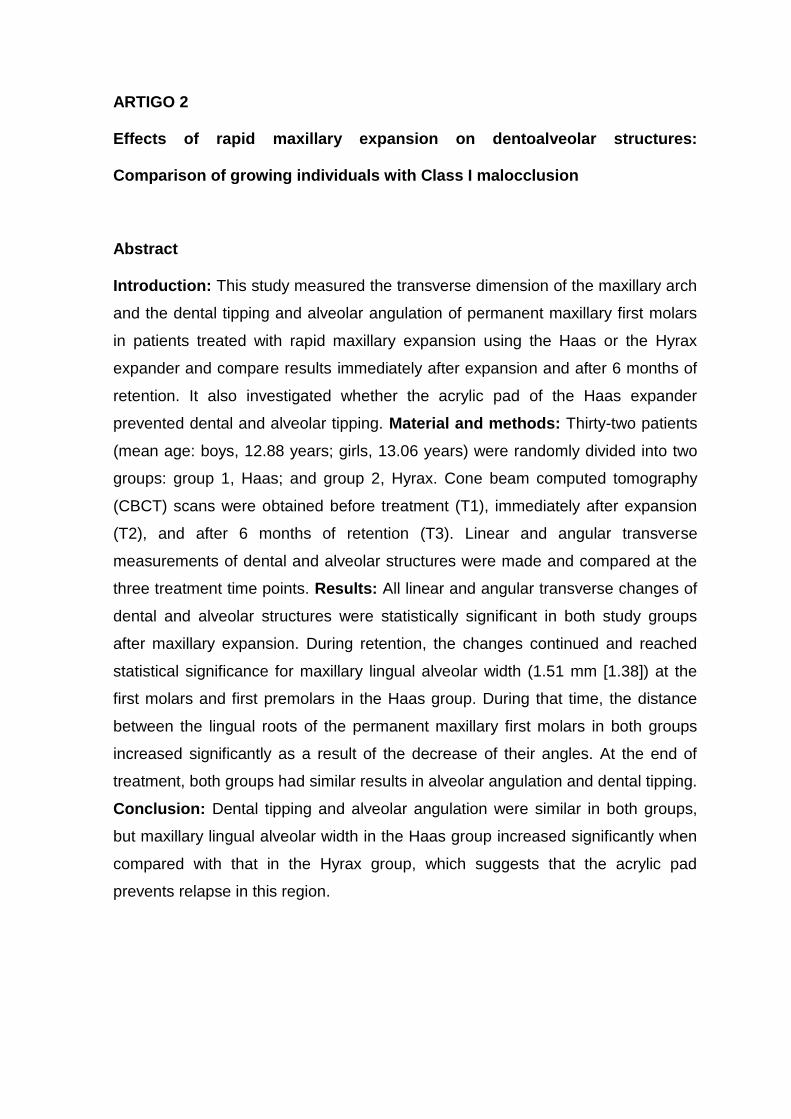
ARTIGO 2
Effects of rapid maxillary expansion on dentoalveolar structures:
Comparison of growing individuals with Class I malocclusion
Abstract
Introduction: This study measured the transverse dimension of the maxillary arch
and the dental tipping and alveolar angulation of permanent maxillary first molars
in patients treated with rapid maxillary expansion using the Haas or the Hyrax
expander and compare results immediately after expansion and after 6 months of
retention. It also investigated whether the acrylic pad of the Haas expander
prevented dental and alveolar tipping. Material and methods: Thirty-two patients
(mean age: boys, 12.88 years; girls, 13.06 years) were randomly divided into two
groups: group 1, Haas; and group 2, Hyrax. Cone beam computed tomography
(CBCT) scans were obtained before treatment (T1), immediately after expansion
(T2), and after 6 months of retention (T3). Linear and angular transverse
measurements of dental and alveolar structures were made and compared at the
three treatment time points. Results: All linear and angular transverse changes of
dental and alveolar structures were statistically significant in both study groups
after maxillary expansion. During retention, the changes continued and reached
statistical significance for maxillary lingual alveolar width (1.51 mm [1.38]) at the
first molars and first premolars in the Haas group. During that time, the distance
between the lingual roots of the permanent maxillary first molars in both groups
increased significantly as a result of the decrease of their angles. At the end of
treatment, both groups had similar results in alveolar angulation and dental tipping.
Conclusion: Dental tipping and alveolar angulation were similar in both groups,
but maxillary lingual alveolar width in the Haas group increased significantly when
compared with that in the Hyrax group, which suggests that the acrylic pad
prevents relapse in this region.

61
INTRODUCTION
Rapid maxillary expansion (RME), an effective classical procedure used to
treat transverse maxillary deficiencies of growing patients, has an orthodontic
effect, in addition to an orthopedic result, and contributes to the increase of the
maxillary arch.1
The orthopedic effect is characterized by suture separation and remodeling,
whereas the orthodontic effect refers to tooth movement and tipping.2-6 Two of the
appliances most often used for that purpose are the tooth-tissue borne Haas
expander2 and the tooth-borne Hyrax expander.7 Most studies in the literature
evaluated the Hyrax expander8-10 and few compared two types of expanders.11-14
There is no scientific evidence that one is more or less effective than the other.
The Hyrax expander is often selected because it is easy to manufacture and to
clean. According to Haas,2-4,6 the expander that he developed should reduce
orthodontic inclination of the alveolar processes laterally and, therefore, reduce
dental tipping because of its acrylic pad, which covered the palate, and of the
archwires soldered to the buccal and lingual surfaces of the anchorage teeth.
Garret et al., in 2008,15 found a negative correlation between retention time and
changes in maxillary palatal width in a sample that used the Hyrax expander,
which confirmed the expectations set by Haas and described above, as they found
a width reduction, or relapse, in this anatomic region at the end of the retention
time. Oliveira et al., in 2004,11 tested the two types of expanders (Haas and Hyrax)
and compared the results before treatment and after 3 months of retention. They
found differences in intermolar distances and in lingual angulations between
expanders. The Haas group had a greater intermolar distance and a smaller
lingual angulation. The acrylic pad in the Haas expander, which touches the

62
lingual alveolar process, might produce a more uniform expansion of the cortical
bone and prevent relapse.
Cone beam computed tomography has been currently used as a study
method to evaluate the effects of RME. Few studies have compared the effects of
the Haas and Hyrax expanders using this method,12,14 and only one12, evaluated
those effects after retention. This study measured the transverse dimension of the
maxillary arch and the dental tipping and alveolar angulation of permanent
maxillary first molars in patients treated with RME and compared the results
obtained with the Haas and Hyrax expanders immediately after expansion and
after 6 months of retention to test whether the tooth-tissue borne expander led to
fewer dentoalveolar.
MATERIAL AND METHODS
This prospective study was approved by the Ethics Committee of
Universidade Federal do Rio de Janeiro, under number 65/2009 and according to
resolution no. 35/2010. Parents or guardians provided free informed consent for
the participation of patients in this study. The sample was selected in 5 public
schools of the city of Belo Horizonte, Brazil. Inclusion criteria were: individuals with
young permanent dentition and malocclusion Angle Class I; clinical indication of
orthopedic treatment using RME; cervical vertebrae in maturation stage 3;16 and
adequate clinical crown of the maxillary permanent first premolars and first molars.
Exclusion criteria were: periodontal disease; metal restorations in posterior teeth;
previous orthodontic treatment; and genetic diseases.
The sample was randomly divided into two groups: Group 1 (Haas), with 16
individuals that underwent rapid maxillary expansion using a Haas expander; and

63
Group 2 (Hyrax), with 16 individuals treated with Hyrax expanders. Both groups
followed the same activation schedule: the expanding screw (Morelli) was
activated one full turn on the day the appliance was placed and, after that, 1/4 of a
turn in the morning and 1/4 at night every day until the necessary expansion was
achieved. After the end of the activation phase, the screw was stabilized with a
ligature and kept in the mouth for six months for retention.
Three-dimensional cone-beam computed tomography (CBCT) images were
used for measurements. Images were acquired using an I-Cat scanner (Imaging
Sciences International, Hatfield, PA) at 36.90 mA, 120 kV, 40-s exposure time,
FOV of 22 cm (full head) and voxel resolution of 0.3 mm. Records were made
before treatment (T1), immediately after RME (T2) and after 6 months of retention
(T3). All images were positioned and standardized using the Dolphin Imaging 11.0
software (Dolphin Imaging & Management Solutions, Chatsworth, CA).
After the images were imported as Digital Imaging and Communications in
Medicine (DICOM) files, 3-D reconstructions for each patient at each time point
(T1, T2 and T3) were positioned according to the orbital and porion points (right
and left sides) and nasion to define the axial, coronal and sagittal planes.17 In the
frontal view, the floor of the orbits was parallel to the ground. In the right lateral
view, the Frankfort horizontal plane was parallel to the ground.18 The left side was
examined to confirm the position of the Frankfort horizontal plane.19
The study method defined that the anatomic points were marked on the
CBCT images, and each one was simultaneously located on the coronal, sagittal
and axial slices and had its exact location confirmed on the three planes (Figure
1). The points and their definitions are shown in Table I. Cervical vertebrae were
evaluated using two-dimensional CBCT images, as described by Baccetti et al. 16

64
Figure 1 - Multiplanar reconstruction (MPR) produced by Dolphin® software using Measurement
tool illustrates method to identify points to measure maxillary alveolar width. A. Coronal slice shows sagittal plane (red line) and axial plane (blue line), which crosses MB/26 point; identification of MB/16, ML/16 and ML/26; B. Sagittal slice confirms MB/26 – intersection of coronal (green) and axial (blue) planes; C. Axial slice confirms MB/26 – intersection of coronal and sagittal planes; D. 3-D reconstruction. Sagittal plane; Coronal plane (green line).
Table I. Points and definitions used in the study.
Point Definition
MB # tooth Point in external margin of buccal cortical bone of maxillary alveolar ridge at
trifurcation or bifurcation of tooth under evaluation (Figure 1)
ML # tooth Point in external margin of lingual cortical bone of the maxillary alveolar ridge
at the level of trifurcation or bifurcation of tooth under evaluation (Figure 1)
AP # tooth Apex of lingual root of tooth, identified in three spatial planes (Figure 2)
CG # tooth Central groove of tooth crown, identified in three spatial planes
# = tooth number; AP = lingual root apex MB = maxillary buccal alveolar point; ML = maxillary
lingual alveolar point; CG = central groove.
Linear distances between each point were measured according to the
alveolar maxillary width at the level of the permanent first molars (MB16/MB26)
and of the maxillary permanent first premolars (MB14/MB24); also, dental width
was measured at the level of the root apices of lingual roots (AP16/AP26;
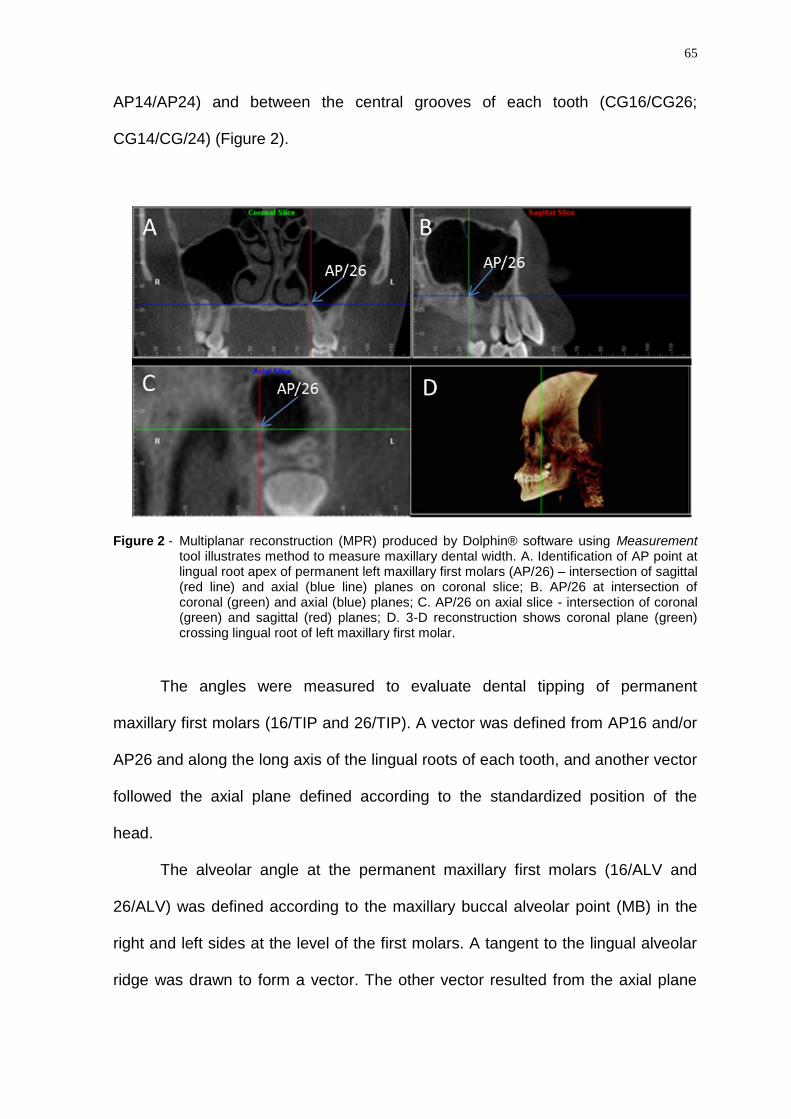
65
AP14/AP24) and between the central grooves of each tooth (CG16/CG26;
CG14/CG/24) (Figure 2).
Figure 2 - Multiplanar reconstruction (MPR) produced by Dolphin® software using Measurement tool illustrates method to measure maxillary dental width. A. Identification of AP point at lingual root apex of permanent left maxillary first molars (AP/26) – intersection of sagittal (red line) and axial (blue line) planes on coronal slice; B. AP/26 at intersection of coronal (green) and axial (blue) planes; C. AP/26 on axial slice - intersection of coronal (green) and sagittal (red) planes; D. 3-D reconstruction shows coronal plane (green) crossing lingual root of left maxillary first molar.
The angles were measured to evaluate dental tipping of permanent
maxillary first molars (16/TIP and 26/TIP). A vector was defined from AP16 and/or
AP26 and along the long axis of the lingual roots of each tooth, and another vector
followed the axial plane defined according to the standardized position of the
head.
The alveolar angle at the permanent maxillary first molars (16/ALV and
26/ALV) was defined according to the maxillary buccal alveolar point (MB) in the
right and left sides at the level of the first molars. A tangent to the lingual alveolar
ridge was drawn to form a vector. The other vector resulted from the axial plane

66
defined according to the standardized position of the head. The alveolar and
dental tipping angles were measured in the medial area.
The nominal values of each variable under evaluation at each time point
were entered in spreadsheets, and the Statistical Package for Social Sciences 18
(SPSS) was used for descriptive statistics. The normal distribution of the sample
was analyzed using the Shapiro-Wilk test, and the Levene test was used to
analyze homogeneity of variance. The comparisons between the Haas and Hyrax
groups for all variables at the three time points, as well as the comparison
between variables (T2-T1, T3-T1, T3-T2), were analyzed using the Student t test.
The comparison of variables between different time points was evaluated for each
group, separately, using a t test for paired samples ( = 0.05). All measurements
were made by the same author (EMJ), who had no access to clinical records. To
evaluate intraexaminer reproducibility, CBCT measurements at T1 and T2 were
made for 6 patients (18.75%) at two different time points (T1 and T2) at a 15-day
interval. Tabulated data were evaluated using the intraclass correlation coefficient
(ICC).
RESULTS
At T1 and T2, 32 adolescents (19 girls and 13 boys) were included in the
study, 16 in the Haas group and 16 in the Hyrax group. Their mean age was 12
years and 10 months for girls and 13 years for boys. At T3, the number of
participants in the Haas group remained the same, but the Hyrax group had 13
individuals.

67
Concerning intraexaminer reliability mean ICC was 0.98 (lower limit = 0.96;
upper limit = 0.99) for all linear variables. For angles, mean ICC was 0.92 (lower
limit = 0.85; upper limit = 0.99), which confirmed excellent agreement.
The comparison of transverse measurements of the maxillary arch width
and the angulation of permanent maxillary first molars betwenn groups at baseline
(T1) showed that the Haas and Hyrax groups were similar and comparable (Table
II).
Table II. Basic sample data.
Variable Haas, mean
(SD)
Hyrax, mean
(SD)
Mean
difference
Paired t
test*
MB/16-MB/26 (mm) 58.67 (3.52) 58.18 (2.51) 0.49 0.65
ML/16-ML/26 30.07 (2.48) 29.77 (2.12) 0.29 0.72
MB/14-MB/24 45.27 (3.05) 46.04 (2.40) 0.76 0.43
ML/14-ML/24 23.91 (3.25) 22.78 (1.88) 1.13 0.23
CG/16-CG/26 46.03 (2.57) 45.79 (2.42) 0.24 0.78
AP/16-AP/26 33.27 (3.62) 32.74 (2.68) 0.53 0.64
CG/14-CG/24 34.54 (2.48) 34.53 (3.23) 0.01 0.98
AP/14-AP/24 30.17 (3.44) 28.33 (6.99) 1.84 0.35
16/ALV (angle) 107.60 (6.42) 107.76 (4.62) 0.16 0.93
26/ALV 105.80 (3.68) 108.48 (5.43) 2.67 0.11
16/TIP 109.53 (3.44) 112.01 (6.61) 2.47 0.19
26/TIP 110.30 (6.40) 110.20 (6.35) 0.10 0.96
*p value of t test for independent samples (α=95); n = 16
ALV = alveolar; AP = lingual root apex; TIP = tipping; MB = maxillary buccal alveolar point; ML =
maxillary lingual alveolar point; CG = central groove SD = standard deviation.
The changes in each group are shown in Table III. At the end of RME
(T1xT2), there were statistically significant differences in all variables associated
with changes in alveolar ridge width and dental arch and in angles and dental
tipping of maxillary molars. During retention (T3xT2), the distance between the
lingual roots of the permanent maxillary first molars in both groups increased

68
significantly (Table III). The changes in the alveolar angle and tipping of the
maxillary first molars demonstrated that there was a tendency correct tipping
during the retention phase (Table III).
Table III. Means and standard deviations at T1, T2 and T3 and p values of differences between T1xT2, T2xT3 and T1xT3 in the Haas and Hyrax groups.
Group Variable T1, mean
(SD)
T2, mean
(SD)
T3, mean
(SD)
p
T1xT2
p
T2xT3
p
T1xT3
Haas MB/16-MB/26
(mm) 58.67 (3.52) 60.32 (3.32) 61.06 (3.04) 0.00* 0.02* 0.00*
Haas ML/16-ML/26 30.07 (2.48) 32.14 (2.24) 33.65 (2.37) 0.00* 0.00* 0.00*
Haas MB/14-MB/24 45.27 (3.05) 47.67 (2.84) 48.76 (2.82) 0.00* 0.00* 0.00*
Haas ML/14-ML/24 23.91 (3.25) 25.77 (2.66) 27.29 (2.35) 0.02* 0.00* 0.00*
Hyrax MB/16-MB/26 58.18 (2.51) 60.09 (2.25) 60.39 (1.89) 0.00* 0.15 0.00*
Hyrax ML/16-ML/26 29.77 (2.12) 31.48 (2.07) 31.06 (1.90) 0.00* 0.41 0.00*
Hyrax MB/14-MB/24 46.04 (2.40) 48.28 (2.30) 48.93 (2.19) 0.00* 0.00* 0.00*
Hyrax ML/14-ML/24 22.78 (1.88) 25.31 (1.80) 25.00 (2.36) 0.00* 0.36 0.00*
Haas CG/16-CG/26 46.03 (2.57) 50.43 (2.01) 50.78 (2.03) 0.00* 0.11 0.00*
Haas AP/16-AP/26 33.27 (3.62) 34.17 (3.45) 36.34 (3.75) 0.00* 0.00* 0.00*
Haas CG/14-CG/24 34.54 (2.48) 39.66 (2.45) 39.94 (2.54) 0.00* 0.64 0.00*
Haas AP/14-AP/24 30.17 (3.44) 32.65 (3.88) 33.85 (3.18) 0.00* 0.10 0.00*
Hyrax CG/16-CG/26 45.79 (2.42) 50.19 (2.17) 50.14 (2.00) 0.00* 0.65 0.00*
Hyrax AP/16-AP/26 32.74 (2.68) 33.83 (2.90) 35.87 (4.59) 0.00* 0.02* 0.00*
Hyrax CG/14-CG/24 34.53 (3.23) 39.65 (3.06) 38.95 (2.76) 0.00* 0.31 0.00*
Hyrax AP/14-AP/24 28.33 (6.99) 31.91 (2.52) 32.86 (2.51) 0.03* 0.02* 0.02*
Haas 16/ALV
degrees – 107.60 (6.42) 110.80 (7.24) 109.22 (4.07) 0.00* 0.21 0.17
Haas 26/ALV 105.80 (3.68) 110.76 (4.52) 110.56 (2.34) 0.00* 0.86 0.00*
Haas 16/TIP 109.53 (3.44) 116.01 (6.93) 110.60 (4.58) 0.00* 0.00* 0.24
Haas 26/TIP 110.30 (6.40) 115.74 (5.77) 112.04 (4.89) 0.00* 0.00* 0.11
Hyrax 16/ALV 107.76 (4.62) 112.18 (6.49) 111.68 (8.54) 0.00* 0.90 0.02*
Hyrax 26/ALV 108.48 (5.43) 110.16 (4.79) 110.47 (8.36) 0.06 0.92 0.15
Hyrax 16/TIP 112.01 (6.61) 116.03 (6.22) 112.02 (3.49) 0.00* 0.00* 0.32
Hyrax 26/TIP 110.20 (6.35) 114.54 (5.80) 111.57 (7.72) 0.00* 0.28 0.12
* p value for t paired-test (α=95%). Group Haas n = 16 (T1, T2 and T3); Group Hyrax n = 16 (T1 and T2), n = 16 (T2), n = 13 (T3). ALV = alveolar; AP = lingual root apex; TIP = tipping; MB = maxillary buccal alveolar point; ML = maxillary lingual alveolar point; CG = central groove SD = standard deviation.

69
The comparison of RME effects (∆) between groups 1 (Haas) and 2 (Hyrax)
in the T2-T1, T3-T1 and T3-T2 intervals is shown in Table IV. The main difference
between them was the increase in the lingual alveolar width during retention.
Table IV. Mean values and standard deviations of treatment effects (∆) at intervals: T2-T1, T3-T1 and T3-T2 in Haas and Hyrax groups and the comparison between them.
Variable Haas
mean (SD)
Hyrax
mean (SD)
Mean difference
P
∆ MB/16-MB/26 T2-T1 (mm) 1.64 (1.00) 1.91 (0.86) 0.26 0.42
∆ MB/16-MB/26 T3-T1 2.38 (1.37) 2.40 (1.34) -0.02 0.96
∆ MB/16-MB/26 T3-T2 0.73 (1.20) 0.39 (0.94) 0.34 0.41
∆ML/16-ML/26 T2-T1 2.07 (1.07) 1.64 (0.78) 0.42 0.20
∆ML/16-ML/26 T3-T1 3.58 (1.89) 1.51 (0.91) 2.07 0.00*
∆ML/16-ML/26 T3-T2 1.51 (1.38) -0.15 (0.66) 1.66 0.00*
∆MB/14-MB/24 T2-T1 2.39 (1.56) 2.13 (1.51) 0.25 0.64
∆ MB/14-MB/24 T3-T1 3.49 (1.96) 3.02 (1.36) 0.46 0.47
∆ MB/14-MB/24 T3-T2 1.09 (1.26) 0.84 (0.71) 0.25 0.53
∆ ML/14-ML/24 T2-T1 1.85 (3.06) 2.53 (1.07) 0.68 0.40
∆ ML/14-ML/24 T3-T1 3.37 (3.25) 2.36 (1.23) 1.01 0.29
∆ ML/14-ML/24 T3-T2 1.52 (1.30) -0.27 (1.07) 1.79 0.00*
∆ CG/16-CG/26 T2-T1 4.40 (1.44) 4.40 (1.06) 0.00 1.00
∆ CG/16-CG/26 T3-T1 4.74 (1.35) 4.62 (1.26) 0.12 0.81
∆ CG/16-CG/26 T3-T2 0.34 (0.82) 0.13 (1.04) 0.21 0.55
∆ AP/16-AP/26 T2-T1 0.90 (1.20) 1.08 (1.34) -0.18 0.68
∆ AP/16-AP/26 T3-T1 3.06 (1.76) 3.08 (3.24) -0.02 0.98
∆ AP/16-AP/26 T3-T2 2.16 (1.00) 2.10 (2.86) 0.06 0.93
∆CG/14-CG/24 T2-T1 5.11 (1.44) 5.13 (1.70) 0.01 0.98
∆CG/14-CG/24 T3-T1 5.40 (1.73) 4.94 (1.76) 0.46 0.49
∆CG/14-CG/24 T3-T2 0.17 (1.49) -0.28 (0.97) 0.45 0.34
∆ AP/14-AP/24 T2-T1 2.48 (1.98) 3.58 (6.80) -1.10 0.53
∆ AP/14-AP/24 T3-T1 3.68 (2.12) 4.91 (6.83) -1.23 0.49
∆ AP/14-AP/24 T3-T2 1.20 (2.76) 0.71 (0.97) 0.49 0.54
∆16/ALV-T2-T1 (degrees) 3.20 (4.21) 4.42 (3.47) 1.22 0.37
∆16/ALV-T3-T1 1.61 (4.54) 4.10 (5.78) -2.47 0.20
∆16/ALV-T3-T2 -1.58 (4.88) -0.15 (4.33) -1.43 0.41

70
∆26ALV-T2-T1 4.96 (3.87) 1.68 (3.35) 3.27 0.01*
∆26/ALV-T3-T1 4.76 (3.77) 2.43 (5.74) 2.32 0.20
∆26-/ALV-T3-T2 -0.19 (4.71) 0.12 (4.52) -0.31 0.85
∆16TIP-T2-T1 6.47 (5.06) 4.01 (3.42) 2.45 0.11
∆16TIP-T3-T1 1.06 (3.50) 1.31 (4.58) -0.25 0.86
∆16TIP-T3-T2 -5.41 (6.62) -2.96 (3.41) -2.44 0.23
∆26TIP-T2-T1 5.44 (3.05) 4.34 (2.89) 1.10 0.30
∆26TIP-T3-T1 1.76 (4.17) 2.77 (6.08) -1.01 0.60
∆26TIP-T3-T2 -3.67 (4.21) -1.63 (5.30) -2.04 0.25
* p value of t test for independent samples (α=95%).
Group Haas n = 16 (T1,T2 and T3) Group Hyrax n =16 (T1 and T2), n =13 (T3)
ALV = alveolar; AP = lingual root apex; TIP = tipping; MB = maxillary buccal alveolar point; ML =
maxillary lingual alveolar point; CG = central groove SD = standard deviation.
DISCUSSION
RME led to significant dental and alveolar changes in the Haas and Hyrax
groups (Tables III) in a sample with similar characteristics (Table II).
After expansion, the maxillary alveolar width behaved similarly in both
groups at the level of maxillary premolars and first molars when the buccal and
lingual cortical bones were analyzed (Table IV). Weissheimer et al. 2011,14 did not
find any statistical differences in alveolar width between the Haas and Hyrax
groups when the buccal cortical bone was measured at the level of the alveolar
ridge immediately after expansion. They found a mean difference of 0.28 mm
between expanders. In the same time interval and for the same type of
measurement, we found a mean difference of 0.26 mm (Table IV) between
expanders. Lagravère20 conducted a randomized controlled study to compare two
expanders (Hyrax and BAME) with a control group. Results after expansion
showed an increase of 1.30, 1.83 and -0.53 mm in buccal alveolar width measured
at the level of the dental apices in the Hyrax, BAME and control groups. In a
similar time interval (T2-T1), we found an increase of 1.91 mm (0.86) in the Hyrax

71
group (Table IV) when measurements were made at the level of the trifurcation, a
region where the effects of tipping may be substantial, which may, therefore, justify
the slightly greater value found in our study. Non-comparative studies that used
only the Hyrax expander found maxillary alveolar width increases measured at the
buccal cortical bone at the level of the maxillary first molars. Their values were 2.6
mm,212.67 mm15 and 3.00 mm.10 Another study used only the Haas expander22
and found an alveolar increase of 4.30 mm.
Alveolar width at the buccal cortical bone showed no statistically significant
differences between groups during all treatment phases. After 6 months of
retention, the results of our study revealed an increase of maxillary buccal alveolar
width at the level of the first molars, of 2.38 mm (1.37) in the Haas group and 2.40
mm (1.34) in the Hyrax group, without any statistically significant differences
between groups (Table IV), findings that are similar to those reported by Lagravère
in 2010.20 However, in the cortical bone, the increase of alveolar width was
different between the Haas and Hyrax groups at the level of the permanent first
molars and first premolars during retention (T3-T2) (Table IV). At the end of
treatment, a significant difference between groups was only found at the level of
permanent first molars in the measurement of lingual cortical bone. The difference
that appeared during retention suggests that the expander continues to act upon
the alveolar structures after the screw is locked in place. The greatest change was
seen in the Haas group, in which the distance between the palatal alveolar bones
at the level of the first molar increased 1.51 mm (1.38) at T3-T2, whereas in the
Hyrax group there was a decrease of -0.15 mm (0.66). At the level of first
premolars, changes were similar: the differences were 1.52 mm in the Haas group
and -0.27 in the Hyrax group in the same time interval (Table IV). These findings
72
may be assigned to the acrylic pad in the palate, justaposed to the alveolar region
in the Haas group, in which there was an increase in the maxillary alveolar width.
In the Hyrax group, this value decreased, which confirmed the expectations set by
Haas that the acrylic pad would work as a barrier to prevent alveolar relapse.4,6
Garret et al.15 also confirmed this hypothesis when they found a negative
correlation between retention time and amount of palatal alveolar expansion in a
group of patients using the Hyrax expander for RME. Therefore, when there is a
clinical indication to increase the space of the oral cavity, the Haas expander is the
best choice. Previous studies found an increase of about 21.7%22 in the volume of
the oral cavity in individuals treated with the Haas expander. Oliveira et al.11
conducted a comparative study and also found a greater volume increase in the
palate in the Haas group. Garib et al.23 used a similar method to compare the
effects of RME using Haas and Hyrax expanders after 3 months of retention, but
did not find any statistically significant differences between groups in buccal or
lingual dentoalveolar width. The t test does not demonstrate statistically significant
values when the sample is small (n = 8), which may explain the fact that their
results were not similar to ours.
The transverse expansion in T2-T1 occurred at the level of the crowns of
the permanent first molars and first premolars. In the alveolar region, expansion
was smaller (Tables III and IV). Greater responses in the form of dental rather than
alveolar expansion were also found in previous cephalometric23 and CT
studies.10,12,15,20-22
Anchorage teeth tipped buccally in both groups because there was greater
separation between crowns than between dental apices immediately after the
screw was locked in place: the increase of the distance between lingual roots at
73
the permanent first molars was 0.90 mm (1.20) in the Haas group and 1.08 mm
(1.34) in the Hyrax group without any statistically significant differences between
groups. In the same time interval, the separation of the apices of premolars was
much greater (Haas, 2.48 mm; Hyrax, 3.58 mm), which suggest that there was
less tipping of those teeth at that time point. During retention (T3-T2), there was a
greater separation between the root apices of molars (Haas, 2.16 mm [1.00];
Hyrax, 2.10 mm [2.86]), which produced less tooth tipping buccally at the end of
the retention time for these teeth. At the level of the premolars, there was less
movement of the root apices buccally during retention (Haas, 1.20 mm and Hyrax,
0.71 mm) (Table IV). In 2010, Lagravère 201020 found a greater separation of the
root apices of premolars than of molars after expansion and after 6 months of
retention, and a greater separation between the crowns of molars than of
premolars (molars, 5.51 mm; premolars, 3.99 mm). In our study, dental and
alveolar expansions were greater at the level of the first premolars than in the area
of first molars at T2 and T3 (Tables III and IV). After 6 months of retention, the
pattern of greater dental and alveolar expansion at the level of premolars
remained (Tables III and IV), and the difference between the anterior and posterior
regions was small (Tables III and IV). The smaller anteroposterior transverse
difference found in our study may be justified by the use of buccal archwires
soldered to the bands of the first premolars and molars. Additional anchorage
tends to balance opening anteroposteriorly.24 According to Haas, such anchorage
provides greater and uniform skeletal opening and, consequently, opening of the
dentoalveolar structures. Therefore, buccal archwires should be used in the
manufacture of expanders. Garib, in 2005,12 conducted comparisons after 3
months, and Garret, in 2008,15 evaluated the effects of the Hyrax expander after

74
the same time interval. Both found a slight anteroposterior increase at the dental
and alveolar level.
After RME, we found buccal tipping of the first molars in the right and left
sides, and the greater tipping was found in the Haas group, but the difference from
the results of the Hyrax group was not statistically different. The analysis of
alveolar angulation also revealed an increase in the same time interval, but the
difference in alveolar angulation in the left side was statistically significant between
groups. The alveolar angulation in the Haas group was 3.28 degrees greater than
that found in the Hyrax group (Table IV). At the end of retention, the alveolar angle
in the right and left sides changed similarly, and its analysis revealed a decrease
in both groups without any statistically significant differences between groups.
When adding the value of the right to the left side, the alveolar angle was 3.18
degrees in the Haas group and 3.26 degrees in the Hyrax group. Kartalian et al., in
2010,10 compared individuals that underwent RME using a Hyrax expander with a
control group. They found that the alveolar angulation of the RME group was 5.61
± 6.94 degrees, and of the control group, -2.84 ± 7.09 degrees. Garret et al., in
2008,15 evaluated alveolar angulation changes at the level of the first molars after
3 months of active expansion using a Hyrax expander. They used the angle
formed by the tangent to the alveolar ridge in the right and left sides and found a
mean increase of 4.75 ± 6.54 degrees, a statistically significant value. Oliveira et
al.11 found greater alveolar expansion in the Hyrax group after retention, and the
increased lingual angulation confirmed it.
The separate analysis of changes for each group (Tables III) revealed that
the increases of the alveolar angulation and dental tipping were significant after
screw activation in the Haas and Hyrax groups. After 6 months of retention, at the

75
end of treatment, the tipping of maxillary first molars decreased, but values were
not statistically significant (Table III), which indicated a tendency to return to their
original positions, in agreement with findings reported by Baratieri.22 The alveolar
angle had a similar tendency, but one side (Haas, #26; Hyrax, #16) had a
significant difference at the end of the treatment. This suggests that the results of
both expanders were similar. Garib et al., in 2005,12 compared the results of RME
using Haas and Hyrax expanders, and found that, after 3 months of retention, the
tipping of the permanent first molar was 3.5 degrees in the Haas group and 3.2
degrees in the Hyrax groups, without any statistically significant differences
between groups. In our study, tipping in the Haas group was greater than in the
Hyrax group immediately after expansion: 6.47 ± 5.06 degrees for tooth #16 and
5.44 ± 3.05 degrees for tooth #26 Few studies in the literature have evaluated the
effects of dentoalveolar changes when using the Haas and Hyrax
expanders.11,12,14 In our study, both expanders produced similar effects, and the
acrylic pad did not prevent the tipping of anchorage teeth or alveolar ridge,
specifically providing an increase of the alveolar palatal distance.
Further studies should be conducted to evaluate alveolar changes after
RME, as well as the volume of the oral cavity, by comparing the effects of different
expanders.
CONCLUSIONS
The separation between crowns of the permanent maxillary first molars and
first premolars was greater than that of their apices immediately after active
expansion, whereas after 6 months of retention, the distance between the lingual

76
root apices increased and the distance between their crowns remained practically
unchanged. This demonstrated that there was a tendency to correct the tipping of
anchorage teeth after retention in the two groups under study.
The acrylic pad in the Haas expander did not prevent dental or alveolar
tipping, and results were similar in both groups.
The Haas and Hyrax expanders produced important clinical changes to
correct dentoalveolar deficiencies.
The pattern of expansion of the dental and alveolar structures had the
shape of a pyramid in the frontal view, with the greater separation between the
dental crowns, and in the occlusal view, in which the greater separation was at the
level of premolars.
Acknowledgements
We thank the support that this study received from CAPES and FAPERJ.

77
REFERENCES
1. McNamara JA. Maxillary transverse deficiency. Am J Orthod Dentofacial Orthop
2000;117:567-570.
2. Haas AJ. Rapid expansion of the maxillary dental arch and nasal cavity by
opening the midpalatal suture. Angle Orthod 1961;31:73-90.
3. Haas AJ. The Treatment of Maxillary Deficiency by Opening the Midpalatal
Suture. Angle Orthod 1965;35:200-217.
4. Haas AJ. Palatal expansion: just the beginning of dentofacial orthopedics. Am J
Orthod 1970;57:219-255.
5. Wertz RA. Skeletal and dental changes accompanying rapid midpalatal suture
opening. Am J Orthod 1970;58:41-66.
6. Haas AJ. Long-term posttreatment evaluation of rapid palatal expansion. Angle
Orthod 1980;50:189-217.
7. Biederman W. A hygienic appliance for rapid expansion. JPO J Pract Orthod
1968;2:67-70.
8. Olmez H, Akin E, Karacay S. Multitomographic evaluation of the dental effects
of two different rapid palatal expansion appliances. Eur J Orthod 2007;29:379-
385.
9. Rungcharassaeng K, Caruso JM, Kan JY, Kim J, Taylor G. Factors affecting
buccal bone changes of maxillary posterior teeth after rapid maxillary
expansion. Am J Orthod Dentofacial Orthop 2007;132:428 e421-428.
10. Kartalian A, Gohl E, Adamian M, Enciso R. Cone-beam computerized
tomography evaluation of the maxillary dentoskeletal complex after rapid
palatal expansion. Am J Orthod Dentofacial Orthop 2010;138:486-492.
78
11. Oliveira NL, Da Silveira AC, Kusnoto B, Viana G. Three-dimensional
assessment of morphologic changes of the maxilla: a comparison of 2 kinds of
palatal expanders. Am J Orthod Dentofacial Orthop 2004;126:354-362.
12. Garib DG, Henriques JF, Janson G, Freitas MR, Coelho RA. Rapid maxillary
expansion--tooth tissue-borne versus tooth-borne expanders: a computed
tomography evaluation of dentoskeletal effects. Angle Orthod 2005;75:548-
557.
13. Garib DG, Henriques JF, Janson G, de Freitas MR, Fernandes AY.
Periodontal effects of rapid maxillary expansion with tooth-tissue-borne and
tooth-borne expanders: a computed tomography evaluation. Am J Orthod
Dentofacial Orthop 2006;129:749-758.
14. Weissheimer A, de Menezes LM, Mezomo M, Dias DM, de Lima EM, Rizzatto
SM. Immediate effects of rapid maxillary expansion with Haas-type and hyrax-
type expanders: a randomized clinical trial. Am J Orthod Dentofacial Orthop
2011;140:366-376.
15. Garrett BJ, Caruso JM, Rungcharassaeng K, Farrage JR, Kim JS, Taylor GD.
Skeletal effects to the maxilla after rapid maxillary expansion assessed with
cone-beam computed tomography. Am J Orthod Dentofacial Orthop
2008;134:8-9.
16. Baccetti T, Franchi L, McNamara JR JA. The cervical vertebral maturation
(CVM) method for the assessment of optimal treatment timing in dentofacial
orthopedics. Semin Orthod 2005;11.
17. Cevidanes L, Oliveira AE, Motta A, Phillips C, Burke B, Tyndall D. Head
orientation in CBCT-generated cephalograms. Angle Orthod 2009;79:971-977.
18. Proffit WR, Fields HW. Contemporary orthodontics. St. Louis: Mosby; 2000.

79
19. Christie KF, Boucher N, Chung CH. Effects of bonded rapid palatal expansion
on the transverse dimensions of the maxilla: a cone-beam computed
tomography study. Am J Orthod Dentofacial Orthop 2010;137:S79-85.
20. Lagravere MO, Carey J, Heo G, Toogood RW, Major PW. Transverse, vertical,
and anteroposterior changes from bone-anchored maxillary expansion vs
traditional rapid maxillary expansion: a randomized clinical trial. Am J Orthod
Dentofacial Orthop 2010;137:304.e1-12; discussion 304-305.
21. Podesser B, Williams S, Crismani AG, Bantleon HP. Evaluation of the effects
of rapid maxillary expansion in growing children using computer tomography
scanning: a pilot study. Eur J Orthod 2007;29:37-44.
22. Baratieri C, Nojima LI, Alves Júnior M, Souza MM, Nojima MG. Efeitos
transversais da expansão rápida da maxila em pacientes com má oclusão de
Classe II: avaliação por Tomografia Computadorizada Cone-Beam. Dental
Press J Orthod (Impr) 2010;15:89-97.
23. Garib DG, Henriques JF, Janson G, Freitas MR, Coelho RA. Rapid maxillary
expansion--tooth tissue-borne versus tooth-borne expanders: a computed
tomography evaluation of dentoskeletal effects. Angle Orthodontist
2005;75:548-557.
24. Braun S, Bottrel JA, Lee KG, Lunazzi JJ, Legan HL. The biomechanics of rapid
maxillary sutural expansion. Am J Orthod Dentofacial Orthop 2000;118:257-
261.

ARTIGO 3
Study of the effects of rapid maxillary expansion using Haas and Hyrax
expanders on the thickness of cortical bone : A prospective and comparative
clinical study
ABSTRACT
Introduction: This study compared expanders to evaluate thickness of cortical
bone and restoration after retention for six months. Methods: Thirty patients were
randomly divided into group 1 (Haas expanders) and group 2 (Hyrax expanders).
Cone-beam computed tomography was used to measure buccal and lingual bones
of permanent maxillary first premolars and first molars before treatment (T1), after
rapid maxillary expansion (T2), and after retention for 6 months (T3). Results:
After retention, there were statistically significant differences in buccal bone
thickness between the groups for the mesiobuccal root of tooth # 26 and the
buccal cortical bone of tooth # 24 – with the Hyrax group having a greater cortical
bone loss than the Haas group –, and in lingual bone thickness for teeth # 16 –
with an increase of 0.88 (±0.68) mm in the Hyrax group and of 0.34 (±0.41) mm in
the Haas group) – and # 26 – with an increase of 0.94 (±0.65) mm in the Hyrax
group and of 0.21 (±0.60) mm in the Haas group. Conclusion: After six months,
buccal bone thickness was still different from baseline, which demonstrated that
the complete reorganization of these structures had not been achieved yet.
81
INTRODUCTION AND LITERATURE REVIEW
Orthopedic appliances are used to increase the perimeter of the dental arch
by opening the medial palatine suture, but minimal tooth movement is desired.1
The Haas (tooth-tissue-borne) and the Hyrax (tooth-borne) expanders are the
devices most often used. The force applied by these expanders during rapid
maxillary expansion (RME) produces areas of compression in the periodontal
ligament2,3 and bone resorption, which may promote the movement of the
anchorage teeth in the direction of the force applied and, consequently, away from
the center of the alveolar process. Studies in the literature show that this
movement may increase the risk of producing or exacerbating bone defects.2,4
The strong correlation between tooth movement buccally and bone
dehiscence has been demonstrated using an animal model,2 and bone defects
caused by tooth movement undergo remodeling when teeth move back into their
alveoli.5,6 Studies with human beings evaluated events associated with periodontal
diseases, such as fenestration, dehiscence and vertical bone loss, associated or
not with orthodontic treatment.4,7-9
Specific studies examined bone loss due to palatal expansion,10-13 but only
one compared the effects of the Haas and Hyrax expanders.10 Tooth-tissue-borne
expanders seem to affect the cortical bone of the alveolar process less than the
tooth-borne expanders. Also, it is not clear whether a retention period of six
months is sufficient for the reorganization of adjacent periodontal tissues. This
study investigated whether the Haas and Hyrax expanders have different effects
on the cortical bone of anchorage teeth, and whether a six-month retention time is
sufficient for the restoration of cortical bone thickness after rapid maxillary
expansion.

82
MATERIAL AND METHODS
This prospective study was approved by the Ethics in Research Committee
of the Institute for Collective Health Studies (IESC) of Universidade Federal do Rio
de Janeiro, Rio de Janeiro, Brazil, under number 62/2009 and in agreement with
Resolution no. 35/2010. Parents or guardians provided free informed consent for
patient participation in this study. The sample was selected in 5 public schools in
the city of Belo Horizonte, Brazil. Inclusion criteria were: young individuals with
permanent dentition, Angle Class I malocclusion, clinical indication of orthopedic
treatment with rapid maxillary expansion (RME); cervical vertebrae in maturation
stage 3, which indicates great potential for active growth,14 and adequate clinical
crown of the maxillary first permanent premolars and first permanent molars.
Exclusion criteria were: periodontal disease; metal restorations in posterior teeth;
previous orthodontic treatment; and genetic diseases.
The sample was randomly divided into two groups: Group 1 (Haas) with 15
individuals that underwent rapid maxillary expansion using a Haas expander; and
Group 2 (Hyrax), with 15 individuals treated with Hyrax expanders. In the two
groups, the maxillary first permanent premolars and first permanent molars
received metal bands, and 1-mm buccal wires were soldered to the buccal surface
of the orthodontic bands when manufacturing the expander. The Haas expander
received an acrylic pad for the palate, whereas the Hyrax expander had a screw
connected to the lingual surfaces of the bands by a segment of 1.4-mm wire. The
groups followed the same activation schedule: the expanding screw (Morelli) was
activated one full turn on the day when the appliance was placed and, after that, ¼
of a turn in the morning and ¼ at night every day until the necessary expansion

83
was reached. After the end of the activation phase, the screw was stabilized with a
ligature and kept in the mouth for six months for retention.
This study evaluated three-dimensional cone-beam computed tomography
(CBCT) images acquired using an I-Cat scanner (Imaging Sciences International,
Hatfield, PA) at 36.90 mA, 120 kV, 40 s exposure time, 22 cm FOV and 0.3 mm
voxel resolution. Measurements were made before treatment (T1), immediately
after REM (T2) and after retention for 6 months (T3). All images were positioned
and standardized using the Dolphin Imaging 11.0 software (Dolphin Imaging &
Management Solutions, Chatsworth, CA).
After the images were imported as Digital Imaging and Communications in
Medicine (DICOM) files, 3D reconstructions of each patient at each time point (T1,
T2 and T3) were positioned using the orbitale and porion (right and left sides) and
the nasion as references to define the axial, coronal and sagittal planes.15 In the
frontal view, the orbital floor was parallel to the ground. In the right lateral view, the
Frankfort horizontal plane was parallel to the ground.16 The left side was examined
to confirm the position of the Frankfort horizontal plane.17
The method to assess the thickness of the buccal and lingual cortical bone
of the maxillary permanent molar was the following: using the axial view, the
coronal plane was positioned between the mesiobuccal and distobuccal roots of
the maxillary first molar; in the coronal view, the axial plane was identified by
drawing a tangent line to the trifurcation of the roots of teeth # 16 and 26, and the
sagittal plane was located between the mesiobuccal and distobuccal roots of the
respective teeth, which was confirmed on the sagittal view(Figure 1). This
procedure was followed in the right and left sides because molars may be at
different levels and asymmetrically positioned anteroposteriorly. To measure the

84
thickness of the buccal and lingual cortical bone of the first premolars, the same
identification method as the one used for the first molars was used, using the
bifurcation of teeth # 14 and 24 as the reference to define the axial plane. The
buccal and lingual cortical bone of the first permanent premolars and first
permanent molars was measured on the axial view (Figure 2).
Figure 1 - Multiplanar reconstruction images on the Dolphin® software, Measurement function,
showing the methodology used to locate the trifurcation of first molars. A) Coronal view showing the sagittal plane (red line) and the axial plane (blue line) crossing the trifurcation of tooth # 16 (yellow arrow), B) Sagittal view showing the axial and coronal planes, positioned between the mesiobuccal and distobuccal roots of tooth # 16, at the level of the furcation (yellow arrow); C) Axial view confirming location of the coronal and sagittal planes on the trifurcation of the permanent first molar (yellow arrow); D) 3D reconstruction, front view.
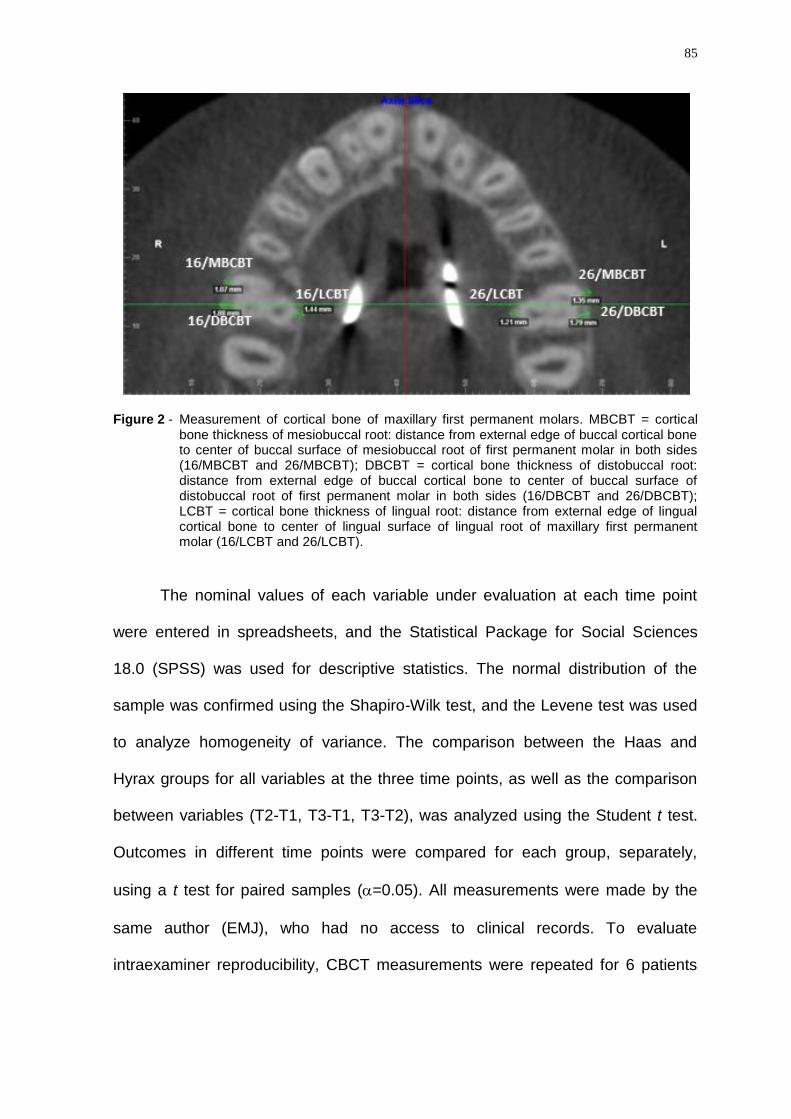
85
Figure 2 - Measurement of cortical bone of maxillary first permanent molars. MBCBT = cortical bone thickness of mesiobuccal root: distance from external edge of buccal cortical bone to center of buccal surface of mesiobuccal root of first permanent molar in both sides (16/MBCBT and 26/MBCBT); DBCBT = cortical bone thickness of distobuccal root: distance from external edge of buccal cortical bone to center of buccal surface of distobuccal root of first permanent molar in both sides (16/DBCBT and 26/DBCBT); LCBT = cortical bone thickness of lingual root: distance from external edge of lingual cortical bone to center of lingual surface of lingual root of maxillary first permanent molar (16/LCBT and 26/LCBT).
The nominal values of each variable under evaluation at each time point
were entered in spreadsheets, and the Statistical Package for Social Sciences
18.0 (SPSS) was used for descriptive statistics. The normal distribution of the
sample was confirmed using the Shapiro-Wilk test, and the Levene test was used
to analyze homogeneity of variance. The comparison between the Haas and
Hyrax groups for all variables at the three time points, as well as the comparison
between variables (T2-T1, T3-T1, T3-T2), was analyzed using the Student t test.
Outcomes in different time points were compared for each group, separately,
using a t test for paired samples (=0.05). All measurements were made by the
same author (EMJ), who had no access to clinical records. To evaluate
intraexaminer reproducibility, CBCT measurements were repeated for 6 patients

86
(18.75%) at T1 and T2 at a 15-day interval. Tabulated data were evaluated using
the intraclass correlation coefficient (ICC).
RESULTS
Concerning intraexaminer reliability ICC was 0.985 (lower bound = 0.962;
upper bound = 0.995) for the linear variables, which confirmed excellent
agreement.
Baseline cortical bone thicknesses in the Haas and Hyrax groups before the
treatment (T1) are shown in Table I.
Table I. Comparison of baseline data for cortical bone thickness between Haas and Hyrax groups before treatment (T1).
Variables
Haas (n=15)
Mean (SD)
Hyrax (n=15)
Mean (SD)
Mean
difference
p
16/MDCBT 1.07(0.60) 1.51(0.78) -0.43 0.09
26/MBCBT 1.89(0.69) 2.01(0.80) -0.12 0.66
16/LCBT 1.35(0.52) 1.26(0.38) 0.08 0.60
26/MBCBT 0.93(0.61) 1.68(0.70) -0.74 0.00*
26/DBCBT 1.92(0.62) 2.19(0.87) -0.26 0.34
26/LCBT 1.49(0.47) 1.31(0.43) 0.17 0.29
14/BCBT 0.64(0.57) 0.80(0.37) -0.16 0.37
14/LCBT 1.50(0.71) 1.44(0.77) 0.06 0.82
24/BCBT 0.53(0.41) 0.91(0.52) -0.38 0.03*
24/LCBT 1.24(0.67) 1.50(0.84) -0.26 0.35
p value of t test for independent samples (α=95%).
n = number of individuals; SD = standard deviation.
Descriptive statistics and comparisons between appliances at T2 and T3, as
well as comparisons between periods of evaluations are shown in Tables II and III.

87
Table II. Comparisons of transverse measures between periods after RME (T2) and at baseline; after retention (T3) and after RME (T2); and between after retention (T3) and at baseline (T1).
Group Variable
T1
Mean (SD)
T2
Mean (SD)
T3
Mean (SD)
T1xT2
p
T3xT2
p
T3xT1
p
Haas 16/MBCBT 1.07(0.60) 0.61(0.54) 0.65(0.50) 0.00* 0.57 0.00*
Haas 16/DBCBT 1.89(0.69) 1.62(0.67) 1.53(0.65) 0.02* 0.54 0.01*
Haas 16/LCBT 1.35(0.52) 1.40(0.48) 1.70(0.45) 0.67 0.05 0.00*
Haas 26/MBCBT 0.93(0.61) 0.71(0.48) 0.62(0.47) 0.01* 0.35 0.03*
Haas 26/DBCBT 1.92(0.62) 1.65(0.62) 1.49(0.68) 0.06 0.12 0.02*
Haas 26/LCBT 1.49(0.47) 1.43(0.55) 1.70(0.61) 0.57 0.10 0.19
Haas 14/BCBT 0.64(0.57) 0.16(0.22) 0.27(0.32) 0.00* 0.26 0.00*
Haas 14/LCBT 1.50(0.71) 1.33(0.77) 1.37(0.45) 0.12 0.75 0.31
Haas 24/BCBT 0.53(0.41) 0.17(0.29) 0.35(0.38) 0.00* 0.08 0.07
Haas 24/LCBT 1.24(0.67) 1.51(0.57) 1.43(0.87) 0.04* 0.63 0.19
Hyrax 16/MBCBT 1.51(0.78) 1.13(0.78) 0.99(0.74) 0.00* 0.29 0.00*
Hyrax 16/DBCBT 2.01(0.80) 1.70(0.83) 1.80(0.88) 0.02* 0.80 0.05
Hyrax 16/LCBT 1.26(0.38) 1.42(0.39) 2.14(0.62) 0.14 0.00* 0.00*
Hyrax 26/MBCBT 1.68(0.70) 1.11(0.69) 0.91(0.63) 0.00* 0.13 0.00*
Hyrax 26/DBCBT 2.19(0.87) 1.64(0.78) 1.68(0.82) 0.00* 0.67 0.00*
Hyrax 26/LCBT 1.31(0.43) 1.45(0.39) 2.22(0.58) 0.16 0.00* 0.00*
Hyrax 14/BCBT 0.80(0.37) 0.31(0.35) 0.19(0.39) 0.00* 0.73 0.00*
Hyrax 14/LCBT 1.44(0.77) 1.45(0.65) 1.79(0.91) 0.91 0.29 0.27
Hyrax 24/BCBT 0.91(0.52) 0.50(0.53) 0.23(0.36) 0.01* 0.32 0.00*
Hyrax 24/LCBT 1.50(0.84) 1.50(0.65) 1.95(0.81) 0.95 0.03* 0.09
Group Haas: n = 15 (T1, T2 and T3); Group Hyrax:n=15 (T1 and T2) n=12 T3 n = number of individuals; SD = standard deviation; p value for t paired-test (α=95%). MBCBT= cortical bone thickness of mesiobuccal root; DBCBT = cortical bone thickness of distobuccal root; LCBT = cortical bone thickness of lingual.

88
Table III. Comparison of bone thickness changes/variations () between Haas and Hyrax groups, after RME (T2-T1), after retention (T3-T2) and after retention in relation to baseline (T3-T1).
Variables
Haas
Mean (SD)
Hyrax
Mean (SD)
Mean
difference
p
∆ 16/MBCBT T2-T1 -0.45 (0.30) -0.37(0.28) -0.08 0.46
∆ 16/MBCBT T3-T1 -0.42(0.33) -0.46(0.27) 0.04 0.74
∆ 16/MBCBT T3-T2 0.04(0.23) -0.06(0.21) 0.09 0.24
∆ 16/DBCBT T2-T1 -0.27(0.41) -0.31(0.49) 0.03 0.82
∆ 16/DBCBT T3-T1 -0.36(0.47) -0.19 (0.30) -017 0.29
∆ 16/DBCBT T3-T2 -0.08(0.54) 0.03 (0.41) -0.11 0.54
∆ 16/LCBT T2-T1 0.05(0.46) 0.16(0.40) -0.10 0.50
∆ 16/LCBT T3-T1 0.34(0.41) 0.88(0.68) -0.54 0.01*
∆ 16/LCBT T3-T2 0.29(0.55) 0.74(0.57) -0.45 0.04*
∆26/MBCBT T2-T1 -0.21(0.30) -0.56(0.24) 0.34 0.00*
∆26/MBCBT T3-T1 -0.30(0.50) -0.78(0.35) 0.48 0.01*
∆26/MBCBT T3-T2 -0.08(0.36) -0.15(0.33) 0.07 0.63
∆ 26/DBCBT T2-T1 -0.27(0.53) -0.54(0.39) 0.27 0.11
∆ 26/DBCBT T3-T1 -0.43(0.65) -0.47(0.32) 0.04 0.86
∆ 26/DBCBT T3-T2 -0.16(0.38) 0.05(0.43) -0.21 0.17
∆ 26/LCBT T2-T1 -0.05(0.39) 0.13(0.35) -0.19 0.17
∆ 26/LCBT T3-T1 0.21(0.60) 0.94(0.65) -0.73 0.00*
∆ 26/LCBT T3-T2 0.27(0.59) 0.80(0.85) -0.53 0.06
∆ 14/BCBT T2-T1 -0.48(0.48) -0.49(0.40) 0.01 0.95
∆ 14/BCBT T3-T1 -0.36(0.43) -0.57(0.48) 0.21 0.23
∆14/BCBT T3-T2 0.11(0.39) -0.03(0.34) 0.14 0.29
∆ 14/LCBT T2-T1 -0.17(0.40) 0.01(0.45) -0.18 0.25
∆ 14/LCBT T3-T1 -0.12(0.47) 0.29(0.88) -0.41 0.12
∆ 14/LCBT T3-T2 0.04(0.52) 0.23(0.74) -019 0.43
∆ 24/BCBT T2-T1 -0.36 (0.28) -0.40(0.38) 0.04 0.71
∆ 24/BCBT T3-T1 -0.18(0.37) -0.62(0.47) 0.44 0.01*
∆ 24/BCBT T3-T2 0.17(0.36) -0.15(0.52) 0.33 0.06
∆ 24/LCBT T2-T1 0.26(0.47) 0.00(0.59) 0.26 0.16
∆ 24/LCBT T3-T1 0.19(0.53) 0.43(0.80) -0.24 0.36
∆ 24/LCBT T3-T2 -0.07(0.60) 0.42(0.61) -0.50 0.04*
p value of t test for independent samples (α=95%).
n = number of individuals;
Group Haas: T1, T2 and T3 n=15
Group Hyrax: T1 and T2 n=15; T3 n=12
SD = standard deviation.

89
After active expansion, both groups 1 and 2 had a significant decrease in
buccal bone thickness (Table II), but with no statistical differences when their
results were compared, except for the buccal surface of the mesiobuccal root of
tooth # 26 (∆ 26/MBCBT) (Table III).
During retention, there were significant changes in the thickness of the
lingual cortical bone of the first molars and premolars in the Hyrax group. In the
Haas group, there were no statistically significant differences in the same time
interval (Table II).
The buccal bone thicknesses of the teeth under evaluation had negative
values after 6 months (T3-T1), which suggests that they did not return to their
baseline dimensions (Table III).
Table III shows the comparisons between groups and confirms that there
were significant differences between expanders after retention for the lingual
cortical bone of teeth # 16 and # 26 and for the mesiobuccal root of tooth # 26 and
the buccal cortical bone of tooth # 24. The Hyrax group showed higher increase in
lingual cortical bone thickness and higher decrease in buccal cortical bone
thickness .
DISCUSSION
In this study, the samples in the Haas and Hyrax groups were similar, which
made their comparison possible (Table I). The comparison of changes in the
thickness of cortical bone of the anchorage teeth during active expansion (T2-T1)
revealed that the Haas and Hyrax expanders led to a decrease in the thickness of
buccal cortical bone and an slight increase in most lingual cortical bone (Table II).

90
This may be assigned to the compression over the buccal bone and the
consequent bone resorption. In the lingual side of teeth, however, there was new
bone formation due to the tension and stretching of periodontal fibers, as reported
by Starnbach et al.5
The main change in buccal cortical bone after the active phase of RME was
seen in the buccal surface of the mesiobuccal root of the left maxillary first molar
(∆ 26/MBCBT) of the Hyrax group, and the mean difference between groups was
0.34 mm (Table III). The other variables of the buccal and lingual surfaces did not
have any differences between expanders, which revealed that both produced
similar results immediately after palatal expansion (T2). These results suggest that
tooth-borne expanders do not expose patients to greater risk of buccal cortical
bone loss immediately after the end of the activation time.
At the end of the treatment (T3-T1), there were statistically significant
differences between the Haas and Hyrax groups for the ∆ 26/MBCBT and
∆24/BCBT variables (Table III). The use of the Hyrax expander led to greater
reduction of the cortical bone thickness in the sites described above than the Haas
expander (Table III). In 2006, Garib et al.10 did not find any statistical differences
between the effects of these two expanders after a three-month retention time.
During retention, there were significant changes in the thickness of lingual
cortical bone of the anchorage teeth from the Hyrax group (Table II), which
revealed differences between groups, with the increase in thickness, particularly in
the lingual cortical surface of roots of teeth # 16 and # 24 (Table III). As a final
effect at the end of the treatment (T3-T1), the lingual cortical bone of the
anchorage teeth, particularly in the first permanent molars, was thicker, and values
were greater in the Hyrax group (Table III). These results indicated that

91
individuals treated with the Hyrax expanders had a greater amount of bone
apposition and an increase of the lingual cortical bone thickness after full
treatment time, which corroborates findings reported by Garib et al.10 and Ballanti
et al.12 The pressure applied by the acrylic pad of the Haas expander may
stimulate bone resorption on the lingual surface of the alveolar process18 . Using
an experimental study model, Starnbach et al.5 found new bone formation in the
lingual cortical bone after 3 months of palatal expansion and, after three months of
retention, the tissue had not returned to normal, which is in agreement with our
findings.
The analysis of individual behavior in the Haas and Hyrax groups
immediately after RME, that is, in the T2-T1 interval, revealed a statistically
significant decrease of all buccal cortical bone thicknesses of the anchorage teeth,
except for the buccal bone of the distobuccal root of tooth # 26 in the Haas group,
which had a decrease, although not statistically significant (Table II). Similar
results were reported by Ballanti et al.,12 who evaluated the behavior of Hyrax
expanders after RME and found a greater bone resorption in the cortical bone of
the mesiobuccal roots of the first permanent molars. However, cortical bone of
premolars was not evaluated in their study. In the T2-T1 time interval, the lingual
cortical bone did not show any significant changes, and, in the Haas group, it
remained practically the same or had very little decreases from initial thicknesses.
The only statistically significant increase, of 0.26 mm, was seen in the lingual
surface of teeth # 24. In the Hyrax group, there was a little increase or no change
in the lingual bone thickness immediately after RME (Table II), in agreement with
the findings reported by Ballanti et al.12
92
During retention (T3-T2), there were significant changes in the lingual
cortical bone in the Hyrax group (Table II). These findings suggest that, after
palatal expansion, the Hyrax expander may continue inducing periodontal fiber
stretching and new bone formation. In this period, the thickness of the lingual
cortical bone in the Haas group slightly increased at some sites under
investigation by decreased at others (Table II). The lingual cortical bone resorption
in tooth # 24 in the Haas group increased gradually up to the end of the retention
period, differing from other cortical bones, probably due to the overcompression
exerted by acrylic on this cortical bone. Similar biological responses have already
been reported in the literature.10,13 Findings suggest that, as the Hyrax expander is
a tooth-borne appliance, lingual tissue may remain free of contact, which might
favor blood flow and tissue regeneration.
After six months of retention following RME, results revealed that Group 1
(Haas) and Group 2 (Hyrax) had values lower than those obtained before the
treatment (T1) for the cortical bone of buccal roots of the anchorage teeth, which
demonstrates that there was no complete restoration of their thickness. The
weakest sign of recovery was seen in the cortical bone of buccal roots of first
premolars in the Hyrax group (Table II). The negative values shown in Table III
related to the difference between T3 and T1 demonstrates that there was new
bone formation, in an attempt to restore the initial thickness of cortical boneThe
study conducted by Stanrnabach et al.5 had already found that, after a 3-month
retention time following RME, cell metabolism still suggested activity to restore the
normal pattern of dentoalveolar structures. Garib et al.,10 as well as
Rungcharassaeng et al.,11 found that there was more marked bone loss in the
buccal cortical bone of premolars and molars after 3 months of retention than in

93
our study, which suggests that retention may have to be longer. The clinical
importance of this study also lies on the fact that it investigated responses after 6
months of retention following RME, which ensured a longer time for the
reorganization of periodontal tissues.
CONCLUSIONS
1. At the end of the retention time, the buccal cortical bone of the maxillary first
permanent premolars and first permanent molars remained thinner than at
baseline, which suggests that 6 months of retention was not sufficient for the
restoration of original thicknesses.
2. After six months of retention, most buccal cortical bones had a similar
behavior in both groups, except for 26/MBCBT and 24/BCT sites, which had
a 0.48mm and a 0.44mm greater bone loss, respectively.
3. After six months of retention, the thickness of lingual cortical bones of
permanent first molars showed greater increase in Hyrax group compared to
the Haas group, with a statistically significant difference.
4. The two RME treatments, using Haas or Hyrax expanders, led to changes in
the cortical bone of the anchorage teeth. The greatest loss of thickness in the
buccal cortical bone of the buccal roots was found in the Haas group,
whereas the greatest new bone formation in the lingual cortical bone of the
lingual roots was found in the Hyrax group, particularly in the permanent first
molars.
Acknowledgements

94
We thank the support that this study received from CAPES and FAPERJ.

95
REFERENCES
1. Haas AJ. The treatment of maxillary deficiency by opening the midpalatal
suture. Angle Orthod 1965;35:200-217.
2. Steiner GG, Pearson JK, Ainamo J. Changes of the marginal periodontium
as a result of labial tooth movement in monkeys. J Periodontol
1981;52:314-320.
3. Wennström JL, Lindhe J, Sinclair F, Thilander B. Some periodontal tissue
reactions to orthodontic tooth movement in monkeys. J Clin Periodontol
1987;14:121-129.
4. Fuhrmann R. Three-dimensional interpretation of periodontal lesions and
remodeling during orthodontic treatment. Part III. J Orofac Orthop
1996;57:224-237.
5. Starnbach H, Bayne D, Cleall J, Subtelny JD. Facioskeletal and dental
changes resulting from rapid maxillary expansion. Angle Orthod
1966;36:152-164.
6. Engelking G, Zachrisson BU. Effects of incisor repositioning on monkey
periodontium after expansion through the cortical plate. Am J Orthod
1982;82:23-32.
7. Evangelista K, Vasconcelos Kde F, Bumann A, Hirsch E, Nitka M, Silva MA.
Dehiscence and fenestration in patients with Class I and Class II Division 1
malocclusion assessed with cone-beam computed tomography. Am J
Orthod Dentofacial Orthop 2010;138:133.e1-7; discussion 133-135.
8. Wehrbein H, Bauer W, Diedrich P. Mandibular incisors, alveolar bone, and
symphysis after orthodontic treatment. A retrospective study. Am J Orthod
Dentofacial Orthop 1996;110:239-246.

96
9. Mostafa YA, El Sharaby FA, El Beialy AR. Do alveolar bone defects merit
orthodontists' respect? World J Orthod 2009;10:16-20.
10. Garib DG, Henriques JF, Janson G, de Freitas MR, Fernandes AY.
Periodontal effects of rapid maxillary expansion with tooth-tissue-borne and
tooth-borne expanders: a computed tomography evaluation. Am J Orthod
Dentofacial Orthop 2006;129:749-758.
11. Rungcharassaeng K, Caruso JM, Kan JY, Kim J, Taylor G. Factors
affecting buccal bone changes of maxillary posterior teeth after rapid
maxillary expansion. Am J Orthod Dentofacial Orthop 2007;132:428.e1-8.
12. Ballanti F., Lione R, Fanucci E, Franchi L, Baccetti T, Cozza P. Immediate
and post-retention effects of rapid maxillary expansion investigated by
computed tomography in growing patients. Angle Orthod 2009;79:24-29.
13. Vanarsdall RL Jr. Transverse dimension and long-term stability. Semin
Orthod 1999;5:171-180.
14. Baccetti T, Franchi L, McNamara Jr J. The cervical vertebral maturation
(cvm) method for the assessment of optimal treatment timing in dentofacial
orthopedics. Semin Orthod 2005;11:119-129.
15. Cevidanes L, Oliveira AE, Motta A, Phillips C, Burke B, Tyndall D. Head
orientation in CBCT-generated cephalograms. Angle Orthod 2009;79:971-7.
16. Proffit W, Fields Jr H. Contemporary orthodontics. St Louis: Mosby; 2000
17. Christie KF, Boucher N, Chung CH. Effects of bonded rapid palatal
expansion on the transverse dimensions of the maxilla: a cone-beam
computed tomography study. Am J Orthod Dentofacial Orthop
2010;137:S79-85.

97
18. Haas AJ. Rapid palatal expansion: A recommmended prerequisite to Class
III treatment. Trans Eur Orthod Soc1973;311-318.
5 DISCUSSÃO
Haas em 1961 (HAAS, 1961) publicou trabalhos relacionados aos efeitos
da expansão rápida da maxila nos Estados Unidos da América os quais tornaram
o método da disjunção palatina amplamento aceito na comunidade ortodôntica. .
Desde então, muitas pesquisas foram executadas, buscando respostas às
dúvidas relacionadas aos efeitos ortopédicos e ortodônticos provocados por esse
tratamento.. Para isso, foram utilizadas radiografias cefalométricas frontais,
laterais e modelos de estudo. Em 1982, Timms et al. (1982) revolucionaram a
forma de obter informações sobre os efeitos do tratamento ortopédico para
maxilas atrésicas, recomendando, como método de estudo da expansão rápida
da maxila, a tomografia computadorizada. Os primeiros estudos foram feitos em
tomógrofos multislices para fins médicos, contudo, com o surgimento da
tomografia computadorizada de feixe cônico (ARAI et al., 1999), o acesso a essa
modalidade de diagnóstico foi facilitado. A tomografia computadorizada de feixe
cônico é uma técnica de obtenção de imagem multiplanar que permite a
visualização de cortes bem como a reconstrução em 3D como a tomografia
computadorizada médica, mas com doses de radiação ionizantes bem mais
baixas (HATCHER e ABOUDARA, 2004; SCARFE et al., 2006; BALLRICK et al.,
2008). Este meio de diagnóstico vem se tornando mais acessível e é um

99
excelente método para a pesquisa, porque elimina a superposição de imagens,
característica nas radiografias, que propicia visualização em 2D.
Novas possibilidades surgiram na busca por respostas vinculadas aos
efeitos da expansão rápida da maxila, após o advento da tomografia
computadorizada de feixe cônico. No presente estudo, foi utilizado este método
de avaliação devido à possibilidade de visualização das imagens sem a
sobreposição de estruturas anatômicas que caracteriza os estudos em
radiografias, sendo um exame adequado para examinar áreas craniofaciais; além
de apresentar alta resolução; mínima distorção e nível baixo de radiação, quando
comparado à tomografia computadorizada multislice (SCARFE et al., 2006; DE
VOS et al., 2009).
Outro fator importante considerado, no caso da presente pesquisa, foi a
disponibilidade e a acessibilidade aos programas criados para avaliação das
imagens em DICOM, possibilitando também obtenção de radiografias a partir da
imagem em 3D (MAH et al., 2010). A TCCB é um método testado que proporciona
confiabilidade e precisão quando adotado para medições de estruturas
esqueléticas e dentárias (MISCH et al., 2006; LOU et al., 2007; LUND et al., 2010;
DAMSTRA et al., 2011).
No estudo que ora se apresenta, foi estabelecido um número diferenciado
de amostra em relação a outros trabalhos citados na literatura. De 35 indivíduos,
três foram excluídos por apresentarem-se no estágio cervical 4 (quatro) de
crescimento (BACCETTI et al., 2005). A análise do estágio de crescimento foi
realizada após a primeira captação da imagem tomográfica (T1). A partir desta
imagem, foi extraída uma radiografia cefalométrica lateral para avaliar as
vértebras, segundo o método preconizado por Baccetti, em 2005 (BACCETTI et

100
al., 2005). Dessa forma, foi definido o critério para avaliar o crescimento dos
indivíduos participantes. O estudo foi prospectivo, considerando-se diferentes
períodos para a análise. O tempo T2 foi identificado como período imediatamente
após a expansão ativa, com a estabilização do parafuso. O tempo T3 foi avaliado
ao final de seis meses de contenção. Não foi estabelecido um grupo controle
devido às implicações éticas em escolher um grupo semelhante de indivíduos,
submetê-lo a radiações sem, no entanto, receber o tratamento da maloclusão. Os
pacientes foram distribuídos de forma randomizada entre os grupos Haas e
Hyrax. Os aparelhos foram confeccionados pelo mesmo laboratório e seguiram
um protocolo previamente estabelecido. A confecção do aparelho de Haas adotou
o protocolo preconizado no seu estudo, em 1961 (HAAS, 1961). Para obtenção de
ancoragem máxima, barras linguais e vestibulares foram colocadas tão próximas
à margem gengival quanto possível e soldadas aos anéis que foram cimentados
aos dentes de ancoragem. Estas barras foram contornadas de modo a
apresentarem máxima adaptação aos dentes de suporte e segundos pré-molares
superiores. A porção de acrílico ficou confinada à zona entre primeiros pré-
molares e primeiros molares, com a finalidade de deixar livres os tecidos que não
devem sofrer isquemia: rugas palatinas, tecidos gengivais e tecidos que
sobrepõem a foramina alveolar posterior. Estes locais possuem suprimento
sanguíneo abundante, que são importantes para manter as condições locais de
reorganização dos tecidos. Segundo Haas, este sistema de ancoragem é
fundamental, uma vez que quanto menor o deslocamento da ancoragem dental,
maior a separação da maxila. No aparelho de Haas, as unidades de ancoragem
são as paredes da abóboda palatina, os processos alveolares vestibulares, os
dentes posteriores e as suas respectivas fibras periodontais (HAAS, 1970). No
101
aparelho tipo Hyrax, foram confeccionadas e soldadas barras às faces
vestibulares dos primeiros pré-molares e primeiros molares superiores, com o
objetivo de aumentar a ancoragem.
O tempo de ativação dos aparelhos expansores não foi previamente
estabelecido, tendo sido definido o comportamento clínico para realizar a ativação
do parafuso expansor até ocorrer a sobrecorreção (cúspides palatinas dos
molares permanentes superiores tocando nas cúspides vestibulares dos
permanentes molares inferiores). A amostra não apresentou diferenças
estatísticas entre os grupos no baseline (T1), indicando, portanto, que eram
similares e passíveis de comparação (Tabela I do artigo 1, página 46; Tabela II do
artigo 2, página 68; e Tabela I do artigo 3, página 87).
Esta pesquisa clínica foi delineada para a avaliação de alterações
esqueléticas, dentoalveolares e periodontais após a ERM. A análise esquelética
incluiu a avaliação da sutura palatina mediana, a largura da fossa nasal e a
largura maxilar óssea. A avaliação das estruturas dentoalveolares foi direcionada
para a análise da largura maxilar alveolar e da largura dentária na região de
primeiros pré-molares e primeiros molares superiores (nas regiões vestibular e
palatina); a inclinação dentária e a angulação alveolar dos primeiros molares
superiores permanentes, além do comportamento dos incisivos centrais
superiores. A avaliação periodontal incluiu o estudo da espessura das corticais
ósseas vestibulares e palatinas dos primeiros pré-molares e primeiros molares
superiores.
Constatou-se que a abertura da sutura palatina mediana ocorreu ao final da
fase ativa de expansão maxilar nos grupos Haas e Hyrax (Tabela III do artigo 1,
página 49) sem diferenças estatísticas significantes entre ambos. O aumento da

102
largura maxilar óssea e da largura da fossa nasal, também aconteceram nesta
fase do tratamento, permanecendo estes resultados após seis meses de
contenção, sem diferenças estatísticas entre os grupos avaliados (Tabela IV do
artigo 1, página 50). Outro efeito da abertura da sutura palatina mediana é o
afastamento dos incisivos centrais permanentes superiores. Os resultados
revelaram que o aparelho dento-muco suportado de Haas e o aparelho dento-
suportado tipo Hyrax proporcionou abertura paralela da sutura palatina mediana
nos sentidos ântero-posterior e vertical. Weissheimer et al. (2011) encontraram,
em uma amostra mais jovem do que a utilizada no estudo aqui discutido,
diferenças estatísticas entre os efeitos dos aparelhos Haas e Hyrax para a
abertura da sutura palatina mediana, em avaliação no sentido ântero-posterior. A
forma encontrada pelos autores foi de cunha nos dois grupos avaliados, sendo
que a maior abertura encontrava-se direcionada para frente. Ballanti et al. (2010)
verificaram que a abertura da sutura palatina mediana foi praticamente paralela
no sentido vertical e triangular no sentido ântero-posterior em um grupo que
utilizou aparelho tipo Hyrax. Podesser et al. (2007) e Christie et al. (2010)
utilizando expansores com split em acrílico, encontraram abertura da sutura
palatina mediana de forma paralela no sentido ântero-posterior.
No final da contenção (T3), a sutura palatina mediana de ambos os grupos
ainda não estava completamente fechada (Tabela III do artigo 1, página 49). Os
valores, no período, variaram de 0,54 a 0,80mm. Outros estudos evidenciaram
valores diferentes àqueles encontrados no presente estudo, mostrando, através
de densidade óssea ou mensurações em imagens obtidas da tomografia
computadorizada multislice, que a sutura palatina mediana encontrava-se

103
praticamente com valores iguais aos iniciais, quando analisada após seis meses
de contenção (LIONE et al., 2008; FRANCHI et al., 2010).
No final do tratamento (T3-T1), o aumento da largura da fossa nasal foi de
1,08mm para o grupo que utilizou Haas e 1,39mm para o grupo Hyrax. A largura
maxilar esquelética também aumentou nos dois grupos: 1,28mm para o grupo
Haas e 1,37mm para o grupo Hyrax. Estas diferenças entre os grupos não foram
estatisticamente significantes. Os valores encontrados, neste estudo foram
inferiores aos obtidos por Podesser et al. (2007), os quais registraram
LFN=1,20mm e LME = 1,70mm, assim como nos estudos de Christie et al. (2010)
(LFN=2,73mm LME = 3,33mm), Garret et al. (2008) (LFN=1,89mm), Garib et al.
(LME = 2,4mm) e Baratieri et al. (LME = 1,95mm).
Após a abertura da sutura palatina, um dos aspectos clinicamente visíveis
é a separação dos incisivos centrais permanentes. No presente estudo, houve
separação dos mesmos em ambos os grupos após a expansão maxilar, sendo
esta maior ao nível dos ápices radiculares e menor na altura da junção cemento-
esmalte. Este aspecto permaneceu após seis meses de contenção, no entanto,
com dimensões menores (Tabela II e IV do artigo 1, páginas 48 e 50,
respectivamente). Os dados mencionados concordam com os achados de
estudos cefalométricos (HAAS, 1961; CROSS e McDONALD, 2000) e
tomográficos (BALLANTI et al., 2010), os quais mencionam que as raízes dos
incisivos superiores divergem mais do que suas respectivas coroas.
Alterações alveolares na maxila aconteceram como efeito da ERM.
Imediatamente após a expansão, o comportamento da largura alveolar maxilar foi
similar entre os grupos, na região de pré-molares e primeiros molares, tanto no
lado vestibular como no lado palatino (Tabela IV do artigo 2, página 70). Após seis
104
meses de contenção, a largura alveolar maxilar, no lado vestibular, continuou sem
diferenças estatísticas entre os grupos; entretanto, no lado palatino, o aumento da
largura alveolar maxilar apresentou diferenças estatísticas entre os grupos na
região de primeiros molares permanentes (Tabela IV do artigo 2, página 70). Esta
diferença que apareceu durante o período de contenção expressa que o efeito do
aparelho continua sobre as estruturas alveolares após a estabilização do
parafuso. A grande modificação ocorreu no grupo Haas, em que, no período T3-
T2, a distância entre os alvéolos palatinos do lado direito e esquerdo, na região
dos primeiros molares, apresentou aumento de 1,51mm; enquanto, no grupo
Hyrax, verificou-se diminuição de 0,15mm. Na região dos primeiros pré-molares, o
comportamento foi similar (Tabela IV do artigo 2, página 70).
Comparando-se os resultados da largura alveolar maxilar e largura dentária
maxilar no período T2-T1,observou-se que ocorreu maior expansão ao nível das
coroas dentárias dos primeiros molares permanentes e dos primeiros pré-
molares. Ao nível alveolar, a expansão foi menor (Tabelas III e IV do artigo 2,
páginas 69 e 70, respectivamente). Esta característica de maior abertura dentária
do que alveolar já havia sido descrita em estudos cefalométricos (CROSS e
MCDONALD, 2000) e tomográficos (GARIB et al., 2005; PODESSER et al., 2007;
GARRETT et al., 2008; KARTALIAN et al., 2010; LAGRAVERE et al., 2010).
Os dentes de ancoragem inclinaram no sentido vestibular nos dois
grupos,sem diferenças estatísticas entre os mesmos.Ocorreu maior afastamento
das coroas do que dos ápices radiculares logo após a estabilização do parafuso
expansor. Os primeiros molares permanentes tiveram aumento entre as raízes
palatinas no grupo Haas de 0,90mm e no grupo Hyrax de 1,08mm,. No mesmo
período, o afastamento dos ápices dos pré-molares foi bem maior, sendo de 2,48
105
mm no grupo Haas, e 3,58 mm no grupo Hyrax, sugerindo a sua menor inclinação
ao final do T2. Durante o período de contenção (T3-T2), foi observado que o
afastamento dos ápices das raízes dos primeiros molares no grupo Haas
(2,16mm) e no Grupo Hyrax (2,10mm) continuou, refletindo em sua menor
inclinação dentária em direção bucal neste momento. Na região de pré-molares,
verificou-se, menor movimentação dos ápices radiculares para vestibular 1,20
mm no grupo Haas e 0,71mm no grupo Hyrax ,durante o período de contenção,
pois, logo após a expansão nesta região os ápices já haviam tido afastamento
considerável. (Tabela IV do artigo 2, página 70). Lagravère et al., em 2010,
encontraram maior afastamento dos ápices das raízes dos pré-molares do que
nos molares nos períodos de pós-ativação e após seis meses de contenção, mas
observaram maior afastamento das coroas dos molares do que dos pré-molares
(5,51 mm para molares e 3,99 mm para os pré-molares). No presente estudo, a
expansão dentária e a expansão alveolar foram maiores na região de primeiros
pré-molares do que na região de primeiros molares, imediatamente após a ERM e
após os seis meses de contenção (Tabelas III e IV do artigo 2, páginas 69 e 70,
respectivamente). O padrão de maior expansão dentária e alveolar na região de
pré-molares, após seis meses de contenção, permaneceu, sendo a diferença
pequena de anterior para posterior (Tabelas III e IV do artigo 2, páginas 69 e 70,
respectivamente). A menor diferença transversal encontrada, em nosso estudo,
no sentido ântero-posterior, pode ser justificada pela utilização de barras
vestibulares soldadas nas bandas dos primeiros pré-molares e primeiros molares.
A ancoragem adicional tende a equilibrar a abertura no sentido ântero-posterior
(BRAUN et al., 2000). Haas descreveu que tal ancoragem proporcionaria maior
abertura esquelética de modo uniforme e, consequentemente, das estruturas
106
dentoalveolares. Dessa forma, ressalta-se a importância da utilização das barras
vestibulares na confecção dos aparelhos expansores. Garib et al. (2005), em seu
estudo comparativo, após três meses de contenção, assim como Garret et al.
(2008), avaliando o comportamento do aparelho tipo Hyrax após o mesmo
período, encontraram leve aumento ao nível dentário e alveolar, de anterior para
posterior.
Imediatamente após a expansão ativa, os dois grupos apresentaram
aumento de inclinação dentária e angulação alveolar sem diferenças estatísticas
entre os grupos ( Tabela IV, página 70). Após os seis meses de contenção, no
final do tratamento, a inclinação dos primeiros molares superiores diminuiu
mostrando a tendência de retorno às suas inclinações originais, concordando,
desse modo, com os achados de Baratieri et al. (2010). Após seis meses de
contenção o aumento do ângulo alveolar tendeu a ficar mais próximo do valor
alcançado após a expansão sem diferenças entre os grupos estudados (tabela IV
, página 70) Tal dado sugere que os aparelhos expansores apresentam
resultados similares. Garib et al. (2005), em 2005, ao comparar os resultados da
ERM com aparelho tipo Haas e aparelho tipo Hyrax, constatou que, após três
meses de contenção, a inclinação dos primeiros molares permanentes foi de 3,5o
no grupo Haas e de 3,2 o no grupo Hyrax, sem diferenças estatísticas entre
ambos. Weissheimer et al. (2011), encontraram maior inclinação no grupo Haas
imediatamente após a expansão rápida da maxila. Na literatura, há poucos
estudos buscando respostas quanto aos efeitos das alterações dentoalveolares
entre os aparelhos Haas e Hyrax (OLIVEIRA et al., 2004; GARIB et al., 2005;
WEISSHEIMER et al., 2011). De acordo com nossos achados, verificou-se que os
expansores tipo Haas e Hyrax trabalham de forma similar e que o anteparo de
107
acrílico não evita inclinação dos dentes de suporte e do rebordo alveolar, o que
ele proporciona é o aumento da distância alveolar palatina.
Ao comparar as modificações ocorridas nas espessuras das corticais
ósseas dos dentes de suporte no período após a expansão (T2-T1), verificou-se
que os aparelhos tipo Haas e tipo Hyrax provocaram diminuição da espessura das
corticais ósseas vestibulares e aumento da espessura na maioria das corticais
ósseas palatinas. A principal modificação deu-se nas corticais ósseas
vestibulares, após a ERM, que foi constatada na face vestibular da raiz mesio-
vestibular do primeiro molar superior esquerdo (∆ 26/ECOMV), sendo a diferença
média entre os grupos Haas e Hyrax de 0,34 mm (Tabela III do artigo 3, página
89). As demais variáveis referentes às faces palatinas e vestibulares não
apresentaram diferenças entre os aparelhos, demostrando que ambos produziram
resultados semelhantes imediatamente após a expansão maxilar. Sendo assim,
conclui-se que o aparelho dentossuportado não oferece maior risco à perda óssea
vestibular logo após o término da ativação do parafuso. No entanto, observando-
se o tempo integral de tratamento (T3-T1), apareceram diferenças com
significância estatística, entre os grupos Haas e Hyrax, para as variáveis
∆26/ECOMV e ∆24/ECOV (Tabela III do artigo 3, página 89). O aparelho tipo
Hyrax provocou maior diminuição da espessura da cortical óssea nos sítios
supracitados em relação ao aparelho tipo Haas. Garib et al. (2006), em 2006,
após o período de três meses de contenção, não encontrou diferenças
estatísticas entre os efeitos de ambos os aparelhos expansores.
Em relação às corticais ósseas palatinas, foram evidenciadas diferenças
expressivas entre os grupos que se achavam relacionadas ao aumento de sua
espessura no intervalo de contenção (T3-T2), em especial, nas corticais das

108
raízes palatinas dos elementos 16 e 24 (Tabela III do artigo 3, página 89). Como
efeito final, após o período total de tratamento (T3-T1), as espessuras das
corticais ósseas palatinas dos dentes de suporte, especialmente nos primeiros
molares permanentes, apresentaram os seus valores aumentados, sendo este
maior no grupo Hyrax. Mesmo as variáveis que não demonstraram diferença
estatística significante devem ser consideradas do ponto de vista clínico, pois
indicam que os indivíduos que utilizaram aparelho de Hyrax mostraram maior grau
de aposição óssea e aumento da espessura das corticais palatinas, após o
período completo de intervenção considerado neste estudo, corroborando os
achados de Garib et al. (2006) e Ballanti et al. (2009). Os resultados evidenciados
no estudo aqui apresentado podem sugerir que a pressão exercida pelo suporte
de acrílico do aparelho tipo Haas estimule reabsorção óssea na face palatina do
processo alveolar associado aos dentes de suporte (HAAS, 1973).
A expansão rápida da maxila envolve uma série de modificações nas
estruturas esqueléticas, faciais e dentárias. As alterações, que ocorrem a partir
das forças aplicadas no aparelho expansor, refletem na abertura da sutura
palatina mediana e modificações nas estruturas adjacentes. O entendimento do
que ocorre em todos os segmentos da face é importante para o planejamento do
tratamento da maloclusão,visto que, em decorrência disto, o aproveitamento dos
efeitos pode contribuir para a melhor resolução de problemas esqueléticos
alveolares e dentários.

6 CONCLUSÃO
Após o término do estudo podemos concluir em relação à(s) :
6.1 Sutura palatina mediana
6.1.1 A abertura da sutura palatina mediana ocorreu nos dois
grupos sem diferenças estatísticas entre eles abrindo de forma paralela no
sentido vertical e no sentido ântero-posterior. Após seis meses de contenção foi
possível observar que a sutura ainda não tinha fechado completamente;
6.2 Posição dos incisos centrais permanentes superiores
6.2.1 Após a expansão ativa os grupos apresentaram
comportamento similar mostrando separação maior dos incisos centrais
permanentes ao nível do ápice. A separação entre as coroas foi menor sem
diferenças estatísticas entre os grupos..Ao final do período de contenção, as
distâncias entre os ápices e as coroas diminuíram, mas sem retorno às posições
originais.
6.3 Largura da fossa nasal
6.3.1 A largura da fossa nasal aumentou após a abertura da sutura
palatina mediana, sendo esta largura estatisticamente significativa para ambos os

110
grupos avaliados e sem significância estatística entre eles. A largura da fossa
nasal manteve-se após seis meses de contenção.
6.4 Largura maxilar esquelética
6.4.1 A largura maxilar esquelética aumentou após a abertura da
sutura palatina mediana, sendo esta largura estatisticamente significativa para
ambos os grupos avaliados e sem significância estatística entre eles. A largura da
maxilar esquelética manteve-se após seis meses de contenção.
6.5 Largura alveolar maxilar
6.5.1 Após o período de pós-expansão ativa, a largura alveolar
maxilar aumentou estatisticamente significante no lado vestibular e palatino em
ambos os grupos na altura dos primeiros molares permanentes e nos primeiros
pré-molares permanentes, sem diferenças estatísticas entre os grupos.
6.5.2 No período de contenção e após a contenção houve aumento
da distância alveolar palatina com diferenças estatísticas entre os grupos, sendo
que no Haas, o aumento foi maior.
6.6 Largura maxilar dentaria
6.6.1 As coroas dos molares e dos pré-molares afastam mais do
que os seus ápices, imediatamente após a expansão ativa, enquanto que, depois
de seis meses de contenção, a distância entre os ápices das raízes palatinas
aumentou e das coroas permaneceu praticamente igual, demonstrando a
tendência de correção da inclinação dos molares e dos pré-molares após o
período de contenção.

111
6.7 Angulação alveolar na região de primeiros molares permanentes
superiores
6.7.1 Ambos os aparelhos provocaram alterações na angulação
alveolar sem diferenças estatísticas entre os grupos após seis meses de
contenção, portanto o resultado foi similar entre eles, mostrando que o apoio de
acrílico não impede o aumento da inclinação das estruturas alveolares.
6.7.2 Para cada grupo isolado alterações significativas na variação
do tempo T2xT1 ocorreram em relação à angulação alveolar;
6.8 Inclinação dos primeiros molares permanentes superiores:
6.8.1 Ambos os aparelhos provocam inclinações dentárias após a
expansão rápida da maxila sem diferenças estatísticas entre os grupos. Após o
período de contenção os dentes inclinados tendem a retornar às suas posições
originais sem diferençasestatísticas entre os grupos.
6.9 Corticais ósseas vestibulares e palatinas de primeiros pré-
molares e primeiros molares permanentes superiores
6.9.1 Ao final do período de contenção, as espessuras das corticais
ósseas vestibulares de primeiros pré-molares e primeiros molares permanentes
superiores continuaram menores do que no período inicial, indicando que seis
meses de contenção não foram suficientes para restabelecer a sua espessura
original.
6.9.2 As corticais ósseas palatinas dos respectivos dentes de
suporte, no grupo Hyrax, apresentaram grande aumento de espessura durante o

112
período de contenção. No grupo Haas, as corticais ósseas palatinas mantiveram a
sua espessura ao final do tratamento, com exceção da raiz palatina do dente 14,
que mostrou diminuição.
6.9.3 Ambos os tratamentos de ERM, com aparelhos de Haas ou
Hyrax, ocasionaram alterações nas corticais ósseas alveolares dos dentes de
suporte. A maior perda de espessura nas corticais vestibulares das raízes
vestibulares relacionou-se ao grupo Hyrax, e a maior deposição nas corticais
palatinas das raízes palatinas dos respectivos dentes foi revelada também no
grupo Hyrax.
7 RECOMENDAÇÕES
Estudos adicionais em tomografia computadorizada seriam interessantes
em um período mais prolongado de pós-contenção para avaliar as características
da abertura da sutura palatina mediana. Outro aspecto a ser considerado diz
respeito aos diferentes pontos da fossa nasal para efetuar as mensurações, tais
como: pontos mais altos, próximo à sutura frontonasal. Avaliações posteriores aos
seis meses de contenção seriam indicadas para avaliar o posicionamento dos
incisivos.
8 REFERÊNCIAS BIBLIOGRÁFICAS
ARAI, Y. et al. Development of a compact computed tomographic apparatus for dental use. Dentomaxillofac Radiol, v. 28, n. 4, p. 245-248, Jul. 1999. BACCETTI, T. et al. The Cervical Vertebral Maturation (CVM) Method for the Assessment of Optimal Treatment Timing in Dentofacial Orthopedics. Semin Orthod, v. 11, n. 3, p. 119-129, 2005. BALLANTI, F. et al. Treatment and posttreatment skeletal effects of rapid maxillary expansion investigated with low-dose computed tomography in growing subjects. Am J Orthod Dentofacial Orthop, v. 138, n. 3, p. 311-317, Sep. 2010. BALLANTI, F. et al. Immediate and post-retention effects of rapid maxillary expansion investigated by computed tomography in growing patients. Angle Orthod, v. 79, n. 1, p. 24-29, Jan. 2009. BALLRICK, J. W. et al. Image distortion and spatial resolution of a commercially available cone-beam computed tomography machine. Am J Orthod Dentofacial Orthop, v. 134, n. 4, p. 573-582, Oct. 2008. BARATIERI, C. et al. Efeitos transversais da expansão rápida da maxila em pacientes com maloclusão de Classe II: avaliação por Tomografia Computadorizada Cone-Beam. Dental Press J Orthod, v. 15, p. 89-97, 2010. BIEDERMAN, W. A hygienic appliance for rapid expansion. JPO J Pract Orthod, v. 2, n. 2, p. 67-70, Feb. 1968. BRAUN, S. et al. The biomechanics of rapid maxillary sutural expansion. Am J Orthod Dentofacial Orthop, v. 118, n. 3, p. 257-261, Sep. 2000. CAVALCANTI, M. G. et al. Accurate linear measurements in the anterior maxilla using orthoradially reformatted spiral computed tomography. Dentomaxillofac Radiol, v. 28, n. 3, p. 137-140, May. 1999. CEVIDANES, L. et al. Head orientation in CBCT-generated cephalograms. Angle Orthod, v. 79, n. 5, p. 971-977, Sep. 2009.

115
CHRISTIE, K. F. et al. Effects of bonded rapid palatal expansion on the transverse dimensions of the maxilla: a cone-beam computed tomography study. Am J Orthod Dentofacial Orthop, v. 137, n. 4 Suppl, p. S79-85, Apr. 2010. CROSS, D. L.; MCDONALD, J. P. Effect of rapid maxillary expansion on skeletal, dental, and nasal structures: a postero-anterior cephalometric study. Eur J Orthod, v. 22, n. 5, p. 519-528, Oct. 2000. DA SILVA FILHO, O. G. et al. Evaluation of the midpalatal suture during rapid palatal expansion in children: a CT study. J Clin Pediatr Dent, v. 29, n. 3, p. 231-238, Spring. 2005. DAMSTRA, J. et al. Comparison between two-dimensional and midsagittal three-dimensional cephalometric measurements of dry human skulls. Br J Oral Maxillofac Surg, v. 49, n. 5, p. 392-395, Jul. 2011. DE VOS, W. et al. Cone-beam computerized tomography (CBCT) imaging of the oral and maxillofacial region: a systematic review of the literature. Int J Oral Maxillofac Surg, v. 38, n. 6, p. 609-625, Jun. 2009. FARRET, M. M. et al. Relationship between malocclusion and fonoarticulatory disorders. Int J Oral Myol, v. 24, p. 20-26, 1998. FRANCHI, L. et al. Modifications of midpalatal sutural density induced by rapid maxillary expansion: A low-dose computed-tomography evaluation. Am J Orthod Dentofacial Orthop, v. 137, n. 4, p. 486-488, 2010. GARIB, D. G. et al. Rapid maxillary expansion--tooth tissue-borne versus tooth-borne expanders: a computed tomography evaluation of dentoskeletal effects. Angle Orthod, v. 75, n. 4, p. 548-557, Jul. 2005. GARIB, D. G. et al. Periodontal effects of rapid maxillary expansion with tooth-tissue-borne and tooth-borne expanders: A computed tomography evaluation. Am J Orthod Dentofacial Orthop, v. 129, n. 6, p. 749-758, Jun. 2006. GARRETT, B. J. et al. Skeletal effects to the maxilla after rapid maxillary expansion assessed with cone-beam computed tomography. Am J Orthod Dentofacial Orthop, v. 134, n. 1, p. 8-9, Jul. 2008. GREENBAUM, K. R.; ZACHRISSON, B. U. The effect of palatal expansion therapy on the periodontal supporting tissues. Am J Orthod, v. 81, n. 1, p. 12-21, Jan. 1982. HAAS, A. J. Rapid expansion of the maxillary dental arch and nasal cavity by opening the midpalatal suture. Angle Orthod, v. 31, n. 2, p. 73-90, 2011/07/31. 1961. HAAS, A. J. The treatment of maxillary deficiency by opening the midpalatal suture. Angle Orthod, v. 35, p. 200-217, Jul. 1965.
116
HAAS, A. J. Palatal expansion: just the beginning of dentofacial orthopedics. Am J Orthod, v. 57, n. 3, p. 219-255, Mar. 1970. HAAS, A. J. Rapid palatal expansion: A recommmended prerequisite to Class III treatment. Trans Eur Orthod Soc, p. 311-318, 1973. HAAS, A. J. A biological approach to diagnosis, mechanics and treatment of vertical dysplasia. Angle Orthod, v. 50, n. 4, p. 279-300, Oct. 1980. HATCHER, D. C.; ABOUDARA, C. L. Diagnosis goes digital. Am J Orthod Dentofacial Orthop, v. 125, n. 4, p. 512-515, Apr. 2004. KARTALIAN, A. et al. Cone-beam computerized tomography evaluation of the maxillary dentoskeletal complex after rapid palatal expansion. Am J Orthod Dentofacial Orthop, v. 138, n. 4, p. 486-492, Oct. 2010. LAGRAVERE, M. O. et al. Transverse, vertical, and anteroposterior changes from bone-anchored maxillary expansion vs traditional rapid maxillary expansion: a randomized clinical trial. Am J Orthod Dentofacial Orthop, v. 137, n. 3, p. 304 e301-312; discussion 304-305, Mar. 2010. LIMA, A. L. et al. Long-term clinical outcome of rapid maxillary expansion as the only treatment performed in Class I malocclusion. Angle Orthod, v. 75, n. 3, p. 416-420, May. 2005. LIONE, R. et al. Treatment and posttreatment skeletal effects of rapid maxillary expansion studied with low-dose computed tomography in growing subjects. Am J Orthod Dentofacial Orthop, v. 134, n. 3, p. 389-392, Sep. 2008. LOU, L. et al. Accuracy of measurements and reliability of landmark identification with computed tomography (CT) techniques in the maxillofacial area: a systematic review. Oral Surg Oral Med Oral Pathol Oral Radiol Endod, v. 104, n. 3, p. 402-411, Sep. 2007. LUND, H. et al. Cone beam computed tomography for assessment of root length and marginal bone level during orthodontic treatment. Angle Orthod, v. 80, n. 3, p. 466-473, May. 2010. MAH, J. K. et al. Practical applications of cone-beam computed tomography in orthodontics. J Am Dent Assoc, v. 141 Suppl 3, p. 7S-13S, Oct. 2010. MCNAMARA, J. A. Maxillary transverse deficiency. Am J Orthod Dentofacial Orthop, v. 117, n. 5, p. 567-570, May. 2000. MELSEN, B. Palatal growth studied on human autopsy material. A histologic microradiographic study. Am J Orthod, v. 68, n. 1, p. 42-54, Jul. 1975. MISCH, K. A. et al. Accuracy of cone beam computed tomography for periodontal defect measurements. J Periodontol, v. 77, n. 7, p. 1261-1266, Jul. 2006.

117
OLIVEIRA, N. L. et al. Three-dimensional assessment of morphologic changes of the maxilla: a comparison of 2 kinds of palatal expanders. Am J Orthod Dentofacial Orthop, v. 126, n. 3, p. 354-362, Sep. 2004. PARKS, E. T. Computed tomography applications for dentistry. Dent Clin North Am, v. 44, n. 2, p. 371-394, Apr. 2000. PODESSER, B. et al. Quantitation of transverse maxillary dimensions using computed tomography: a methodological and reproducibility study. Eur J Orthod, v. 26, n. 2, p. 209-215, Apr. 2004. PODESSER, B. et al. Evaluation of the effects of rapid maxillary expansion in growing children using computer tomography scanning: a pilot study. Eur J Orthod, v. 29, n. 1, p. 37-44, Feb. 2007. RUNGCHARASSAENG, K. et al. Factors affecting buccal bone changes of maxillary posterior teeth after rapid maxillary expansion. Am J Orthod Dentofacial Orthop, v. 132, n. 4, p. 428 e421-428, Oct. 2007. SCARFE, W. C. et al. Clinical applications of cone-beam computed tomography in dental practice. J Can Dent Assoc, v. 72, n. 1, p. 75-80, Feb. 2006. STEINER, G. G. et al. Changes of the marginal periodontium as a result of labial tooth movement in monkeys. J Periodontol, v. 52, n. 6, p. 314-320, Jun. 1981. TIMMS, D. J. et al. A computed tomographic assessment of maxillary movement induced by rapid expansion - a pilot study. Eur J Orthod, v. 4, n. 2, p. 123-127, May. 1982. WEISSHEIMER, A. et al. Immediate effects of rapid maxillary expansion with Haas-type and hyrax-type expanders: a randomized clinical trial. Am J Orthod Dentofacial Orthop, v. 140, n. 3, p. 366-376, Sep. 2011. WENNSTROM, J. L. et al. Some periodontal tissue reactions to orthodontic tooth movement in monkeys. J Clin Periodontol, v. 14, n. 3, p. 121-129, Mar. 1987. WERTZ, R.; DRESKIN, M. Midpalatal suture opening: a normative study. Am J Orthod, v. 71, n. 4, p. 367-381, Apr. 1977.

9 ANEXOS

119
ANEXO I
TERMO DE CONSENTIMENTO LIVRE E ESCLARECIDO
Universidade Federal do Rio de Janeiro - UFRJ
Faculdade de Odontologia
Departamento de Odontopediatria e Ortodontia
Você foi convidado a participar de um estudo que tem como título
Avaliação Longitudinal dos Efeitos da Expansão Rápida da Maxila por Meio
de Tomografia Computadorizada Cone beam e deve ficar à vontade para
decidir se deseja ou não participar. Leia, cuidadosamente, o que segue e
pergunte ao profissional responsável sobre qualquer dúvida que você possa ter.
Você, paciente, será submetido a exames de diagnóstico e procedimento
terapêutico não invasivo, que oferece risco mínimo e visa a correção das
alterações funcionais e esqueléticas decorrentes de atresia maxilar. Essa fase de
tratamento deve ser executada durante o crescimento craniofacial.
O aparelho que você utilizará será do tipo fixo (não poderá ser removido) e
deverá permanecer em boca por um período médio de 6 meses e, via de regra,
não lhe causará ferimentos ou dores.
Para obtenção dos dados referentes ao tratamento você será submetido a:
- 3 (três) exames de Tomografia Computadorizada Cone beam, sendo: a
inicial, realizada para estudo e planejamento do tratamento; a segunda, para
avaliação dos resultados obtidos logo após a abertura do parafuso expansor e, a
terceira será realizada (6) meses após a expansão maxilar quando será feita a
remoção definitiva do aparelho.
- set fotográfico registrando cada fase do tratamento e,
- modelos de estudo para registro.
Na fase de tratamento o paciente e o seu responsável receberão instruções
e informações sobre higienização, forma de ativação do aparelho e o período que
deverão retornar para as consultas de controle.
Todos os procedimentos clínicos serão realizados na Clínica do Programa
de Pós-graduação Odontologia - (área de concentração em Ortodontia) da FO-
UFRJ, exceto as tomografias, as quais serão realizadas na Radiologia

120
Odontológica Doutor Murilo Torres (Visc. Pirajá, 303, An 5 Sl 510, Ipanema, RJ,
22410-001- Fone: (21) 2247-0189/ 3579-8250/3042-4808).
Durante a fase de seu tratamento (período em que o aparelho expansor
permanecer na boca) não haverá custos financeiros. Os exames tomográficos, set
fotográfico e modelos de estudo necessários para este estudo serão gratuitos.
A presente pesquisa será desenvolvida pelos alunos de doutorado do
Programa de Pós-graduação Odontologia - (área de concentração em Ortodontia)
da FO-UFRJ, José Columbano Neto ([email protected]), Estela Maris
Jurach ([email protected]) e Camilo de Aquino Melgaço
([email protected] ) sob orientação dos Prof. Dr. Eduardo Franzotti
Sant’Anna ([email protected]), Profa. Matilde da Cunha Gonçalves
Nojima ([email protected]) e Prof. Lincoln Issamu Nojima
([email protected]). Após a conclusão do estudo, os resultados estarão à
disposição dos interessados na biblioteca do CCS – Centro de Ciências da
Saúde. Para qualquer esclarecimento, colocamo-nos à disposição no
Departamento de Odontopediatria e Ortodontia da UFRJ pelos telefones (21)
2590-2727, 2590-9771 ou através dos e-mail acima citados.
Diante do exposto acima eu, ___________________________________,
responsável legal por _________________________________________, li e
compreendi a natureza e objetivo do estudo para o qual fui convidado (a) a
participar. Concordo, voluntariamente, em participar deste estudo, tendo
sido esclarecido sobre todas as etapas e riscos do tratamento. Concordo
que toda a documentação e exames complementares solicitados, como:
prontuários, fotos, modelos de estudo, exames tomográficos e laudos
possam ser utilizados para fins de publicações científicas, salvo o meu
direito de não identificação. Fica esclarecido que sou livre para interromper
a minha participação no estudo a qualquer momento, sem justificar minha
decisão.
Declaro que, após ter sido convenientemente esclarecido pelo
pesquisador, consinto em participar na amostragem do projeto de pesquisa
em questão, por livre vontade sem que tenha sido submetido a qualquer tipo
de pressão.

121
Rio de Janeiro______de_____________________de 2009.
__________________________________
Assinatura do voluntário da pesquisa
_____________________________________________
Assinatura do responsável pelo voluntário da pesquisa
__________________________________________________
Assinatura do pesquisador(es) (carimbo ou nome legível).
__________________________________________________
Assinatura do pesquisador(es) (carimbo ou nome legível).
Caso você tenha dificuldade em entrar em contato com o pesquisador responsável,
entre em contato com o Comitê de Ética em Pesquisa (CEP) – IESC, tel.: (21) 2598-
9328.
Data da elaboração do TCLE: 30/09/2009

122
ANEXO II
Parecer da aprovação do projeto pelo Comitê de ética da UFRJ.

123
ANEXO III
TABELA DE CONTROLE DAS ATIVAÇÕES
NOME DO PACIENTE:______________________________________
RESPONSÁVEL:___________________________________________
DATA/DIA DA SEMANA ¼ VOLTA (manhã) ¼ VOLTA (noite)