Embed Size (px)
Citation preview
Disclaimer: The information contained in this document is intended only for use during the presentation and should not be disseminated or distributed to parties outside the presentation. Phillip Securities accepts no liability whatsoever with respect to the use of this document or its contents.
Phillip Securities Research Pte Ltd (A member of PhillipCapital) Co. Reg. No. 198803136N © PhillipCapital 2017. All Rights Reserved. For internal circulation only.
US Strategy - Defensive Dividends
Playing Defense through the Aristocrats
Ho Kang Wei
Phillip Securities Research Pte Ltd
11 September 2017
11 Sept 17, 8.15am/11.15am Morning Call/Webinar
Disclaimer: The information contained in this document is intended only for use during the presentation and should not be disseminated or distributed to parties outside the presentation. Phillip Securities accepts no liability whatsoever with respect to the use of this document or its contents.
Phillip Securities Research Pte Ltd (A member of PhillipCapital) Co. Reg. No. 198803136N © PhillipCapital 2017. All Rights Reserved. For internal circulation only.
2
Disclaimer
The information contained in this presentation has been obtained from public sources which Phillip Securities Research Pte Ltd (“PSR”) has no reason to believe are unreliable and
any analysis, forecasts, projections, expectations and opinions (collectively the “Research”) contained in this presentation are based on such information and are expressions of belief
only. PSR has not verified this information and no representation or warranty, express or implied, is made that such information or Research is accurate, complete or verified or
should be relied upon as such. Any such information or Research contained in this presentation is subject to change, and PSR shall not have any responsibility to maintain the
information or Research made available or to supply any corrections, updates or releases in connection therewith. In no event will PSR be liable for any special, indirect, incidental or
consequential damages which may be incurred from the use of the information or Research made available, even if it has been advised of the possibility of such damages.
This presentation is intended for general circulation only and does not take into account the specific investment objectives, financial situation or particular needs of any particular
person.
You should seek advice from a financial adviser regarding the suitability of the investment product, taking into account your specific investment objectives, financial situation or
particular needs, before making a commitment to invest in such products.
Disclaimer: The information contained in this document is intended only for use during the presentation and should not be disseminated or distributed to parties outside the presentation. Phillip Securities accepts no liability whatsoever with respect to the use of this document or its contents.
Phillip Securities Research Pte Ltd (A member of PhillipCapital) Co. Reg. No. 198803136N © PhillipCapital 2017. All Rights Reserved. For internal circulation only.
3
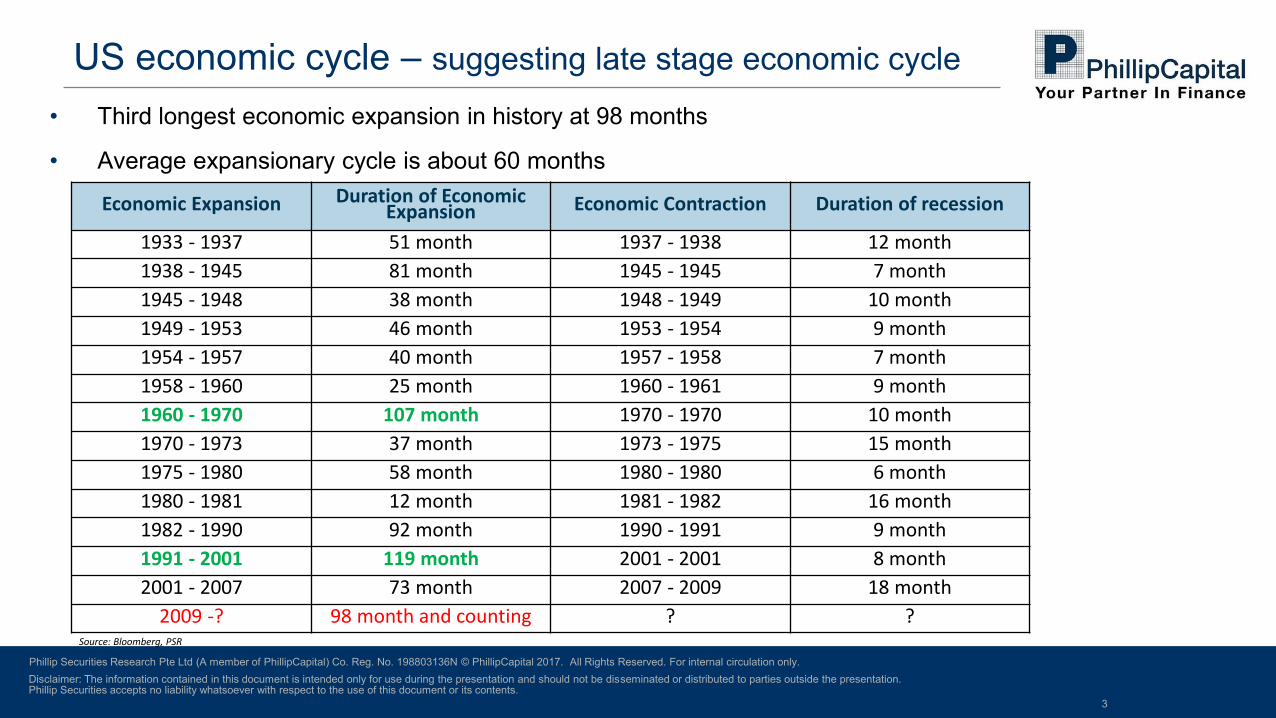
• Third longest economic expansion in history at 98 months
• Average expansionary cycle is about 60 months
US economic cycle – suggesting late stage economic cycle
Economic Expansion Duration of Economic Expansion Economic Contraction Duration of recession
1933 - 1937 51 month 1937 - 1938 12 month
1938 - 1945 81 month 1945 - 1945 7 month
1945 - 1948 38 month 1948 - 1949 10 month
1949 - 1953 46 month 1953 - 1954 9 month
1954 - 1957 40 month 1957 - 1958 7 month
1958 - 1960 25 month 1960 - 1961 9 month
1960 - 1970 107 month 1970 - 1970 10 month
1970 - 1973 37 month 1973 - 1975 15 month
1975 - 1980 58 month 1980 - 1980 6 month
1980 - 1981 12 month 1981 - 1982 16 month
1982 - 1990 92 month 1990 - 1991 9 month
1991 - 2001 119 month 2001 - 2001 8 month
2001 - 2007 73 month 2007 - 2009 18 month
2009 -? 98 month and counting ? ? Source: Bloomberg, PSR
Disclaimer: The information contained in this document is intended only for use during the presentation and should not be disseminated or distributed to parties outside the presentation. Phillip Securities accepts no liability whatsoever with respect to the use of this document or its contents.
Phillip Securities Research Pte Ltd (A member of PhillipCapital) Co. Reg. No. 198803136N © PhillipCapital 2017. All Rights Reserved. For internal circulation only.
4
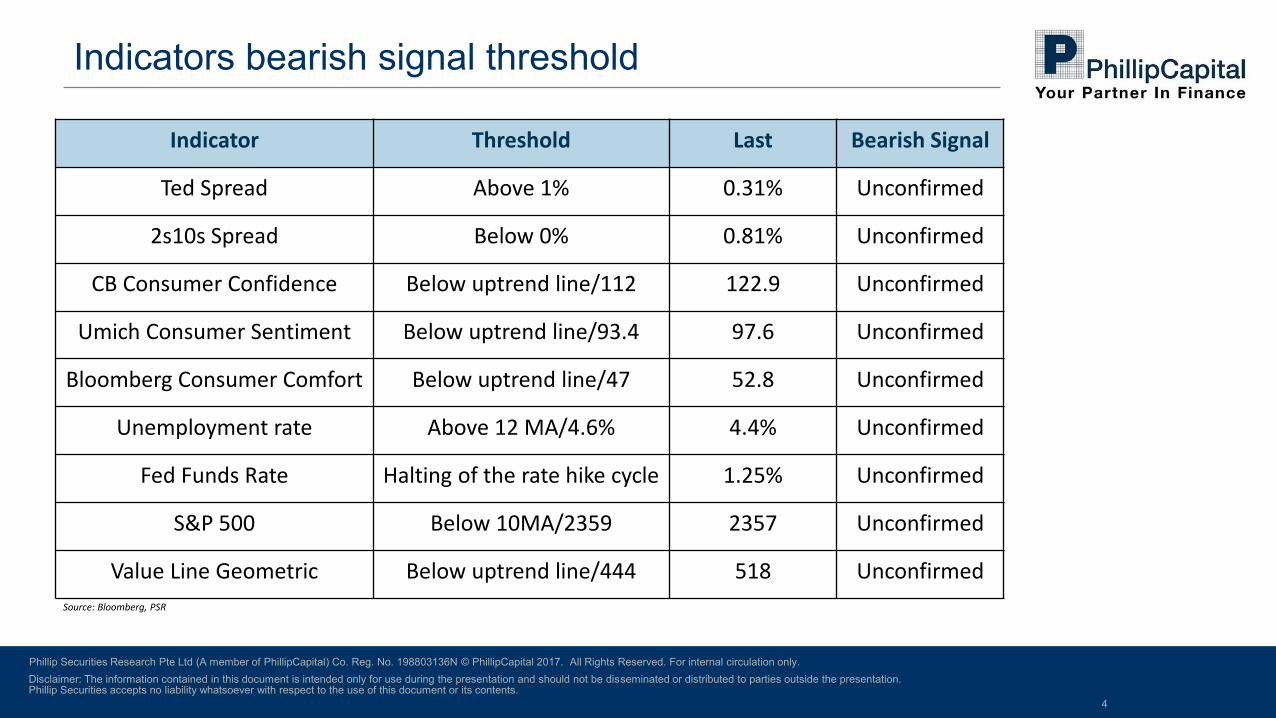
Indicators bearish signal threshold
Indicator Threshold Last Bearish Signal
Ted Spread Above 1% 0.31% Unconfirmed
2s10s Spread Below 0% 0.81% Unconfirmed
CB Consumer Confidence Below uptrend line/112 122.9 Unconfirmed
Umich Consumer Sentiment Below uptrend line/93.4 97.6 Unconfirmed
Bloomberg Consumer Comfort Below uptrend line/47 52.8 Unconfirmed
Unemployment rate Above 12 MA/4.6% 4.4% Unconfirmed
Fed Funds Rate Halting of the rate hike cycle 1.25% Unconfirmed
S&P 500 Below 10MA/2359 2357 Unconfirmed
Value Line Geometric Below uptrend line/444 518 Unconfirmed
Source: Bloomberg, PSR
Disclaimer: The information contained in this document is intended only for use during the presentation and should not be disseminated or distributed to parties outside the presentation. Phillip Securities accepts no liability whatsoever with respect to the use of this document or its contents.
Phillip Securities Research Pte Ltd (A member of PhillipCapital) Co. Reg. No. 198803136N © PhillipCapital 2017. All Rights Reserved. For internal circulation only.
5
S&P 500 Dividend Aristocrats
• List of S&P 500 constituents
• Increased dividend payout for 25 consecutive years or more
• In the past two major crises
1. Fell significantly less than the S&P 500 index
2. Recovered faster than the index
3. Continued to increase dividends
• Tradeable Instrument:
• ProShares S&P 500 Dividend Aristocrats ETF (AMEX:NOBL)
Disclaimer: The information contained in this document is intended only for use during the presentation and should not be disseminated or distributed to parties outside the presentation. Phillip Securities accepts no liability whatsoever with respect to the use of this document or its contents.
Phillip Securities Research Pte Ltd (A member of PhillipCapital) Co. Reg. No. 198803136N © PhillipCapital 2017. All Rights Reserved. For internal circulation only.
6
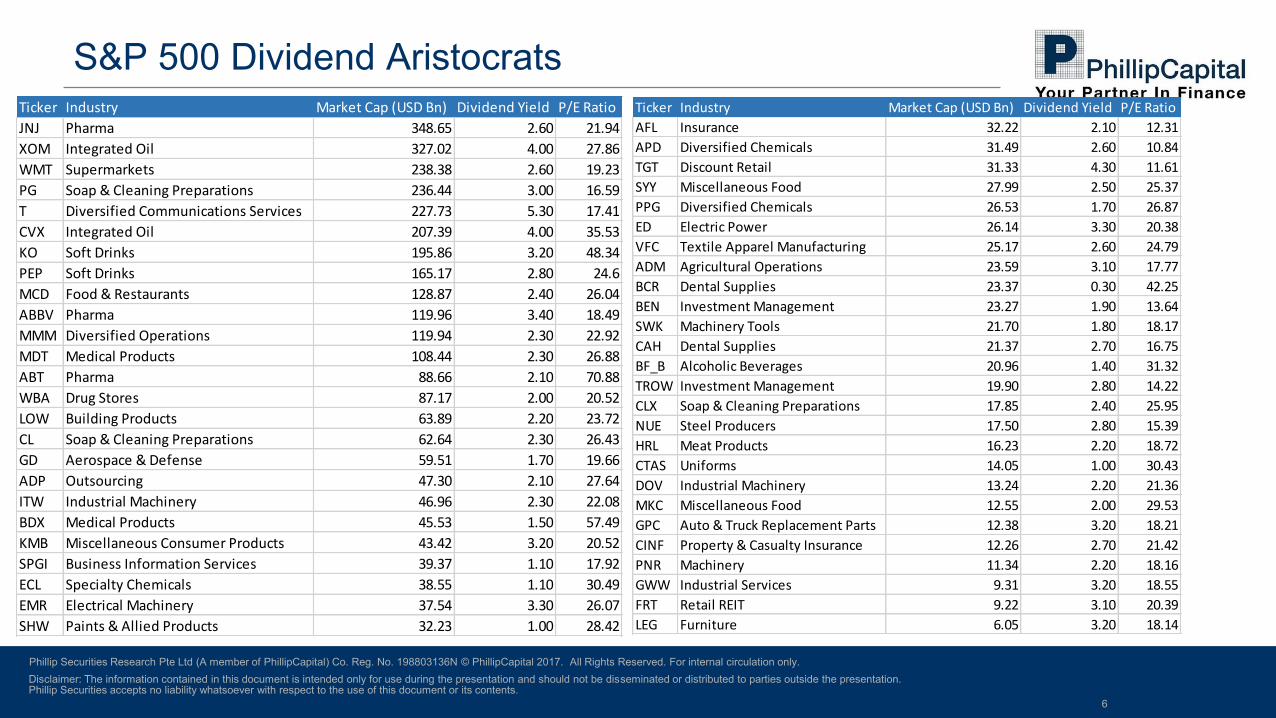
S&P 500 Dividend Aristocrats Ticker Industry Market Cap (USD Bn) Dividend Yield P/E Ratio
JNJ Pharma 348.65 2.60 21.94
XOM Integrated Oil 327.02 4.00 27.86
WMT Supermarkets 238.38 2.60 19.23
PG Soap & Cleaning Preparations 236.44 3.00 16.59
T Diversified Communications Services 227.73 5.30 17.41
CVX Integrated Oil 207.39 4.00 35.53
KO Soft Drinks 195.86 3.20 48.34
PEP Soft Drinks 165.17 2.80 24.6
MCD Food & Restaurants 128.87 2.40 26.04
ABBV Pharma 119.96 3.40 18.49
MMM Diversified Operations 119.94 2.30 22.92
MDT Medical Products 108.44 2.30 26.88
ABT Pharma 88.66 2.10 70.88
WBA Drug Stores 87.17 2.00 20.52
LOW Building Products 63.89 2.20 23.72
CL Soap & Cleaning Preparations 62.64 2.30 26.43
GD Aerospace & Defense 59.51 1.70 19.66
ADP Outsourcing 47.30 2.10 27.64
ITW Industrial Machinery 46.96 2.30 22.08
BDX Medical Products 45.53 1.50 57.49
KMB Miscellaneous Consumer Products 43.42 3.20 20.52
SPGI Business Information Services 39.37 1.10 17.92
ECL Specialty Chemicals 38.55 1.10 30.49
EMR Electrical Machinery 37.54 3.30 26.07
SHW Paints & Allied Products 32.23 1.00 28.42
Ticker Industry Market Cap (USD Bn) Dividend Yield P/E Ratio
AFL Insurance 32.22 2.10 12.31
APD Diversified Chemicals 31.49 2.60 10.84
TGT Discount Retail 31.33 4.30 11.61
SYY Miscellaneous Food 27.99 2.50 25.37
PPG Diversified Chemicals 26.53 1.70 26.87
ED Electric Power 26.14 3.30 20.38
VFC Textile Apparel Manufacturing 25.17 2.60 24.79
ADM Agricultural Operations 23.59 3.10 17.77
BCR Dental Supplies 23.37 0.30 42.25
BEN Investment Management 23.27 1.90 13.64
SWK Machinery Tools 21.70 1.80 18.17
CAH Dental Supplies 21.37 2.70 16.75
BF_B Alcoholic Beverages 20.96 1.40 31.32
TROW Investment Management 19.90 2.80 14.22
CLX Soap & Cleaning Preparations 17.85 2.40 25.95
NUE Steel Producers 17.50 2.80 15.39
HRL Meat Products 16.23 2.20 18.72
CTAS Uniforms 14.05 1.00 30.43
DOV Industrial Machinery 13.24 2.20 21.36
MKC Miscellaneous Food 12.55 2.00 29.53
GPC Auto & Truck Replacement Parts 12.38 3.20 18.21
CINF Property & Casualty Insurance 12.26 2.70 21.42
PNR Machinery 11.34 2.20 18.16
GWW Industrial Services 9.31 3.20 18.55
FRT Retail REIT 9.22 3.10 20.39
LEG Furniture 6.05 3.20 18.14
Disclaimer: The information contained in this document is intended only for use during the presentation and should not be disseminated or distributed to parties outside the presentation. Phillip Securities accepts no liability whatsoever with respect to the use of this document or its contents.
Phillip Securities Research Pte Ltd (A member of PhillipCapital) Co. Reg. No. 198803136N © PhillipCapital 2017. All Rights Reserved. For internal circulation only.
7
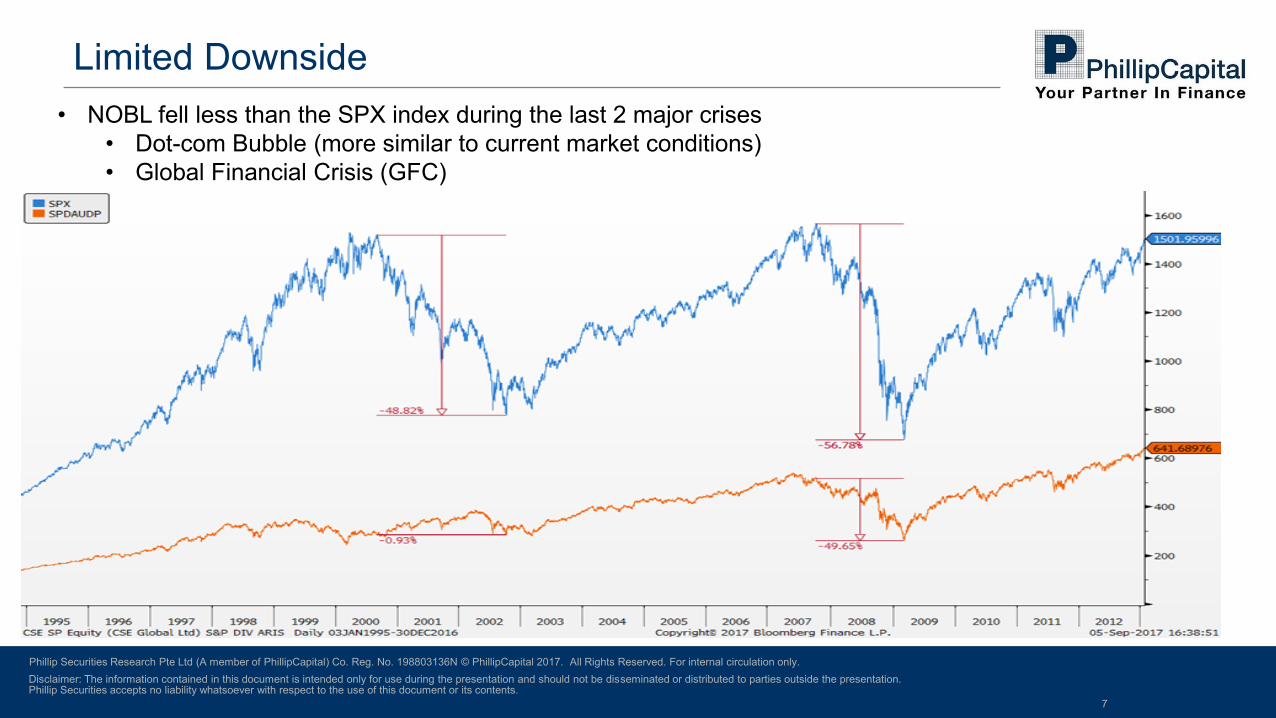
Limited Downside
• NOBL fell less than the SPX index during the last 2 major crises
• Dot-com Bubble (more similar to current market conditions)
• Global Financial Crisis (GFC)
Disclaimer: The information contained in this document is intended only for use during the presentation and should not be disseminated or distributed to parties outside the presentation. Phillip Securities accepts no liability whatsoever with respect to the use of this document or its contents.
Phillip Securities Research Pte Ltd (A member of PhillipCapital) Co. Reg. No. 198803136N © PhillipCapital 2017. All Rights Reserved. For internal circulation only.
8
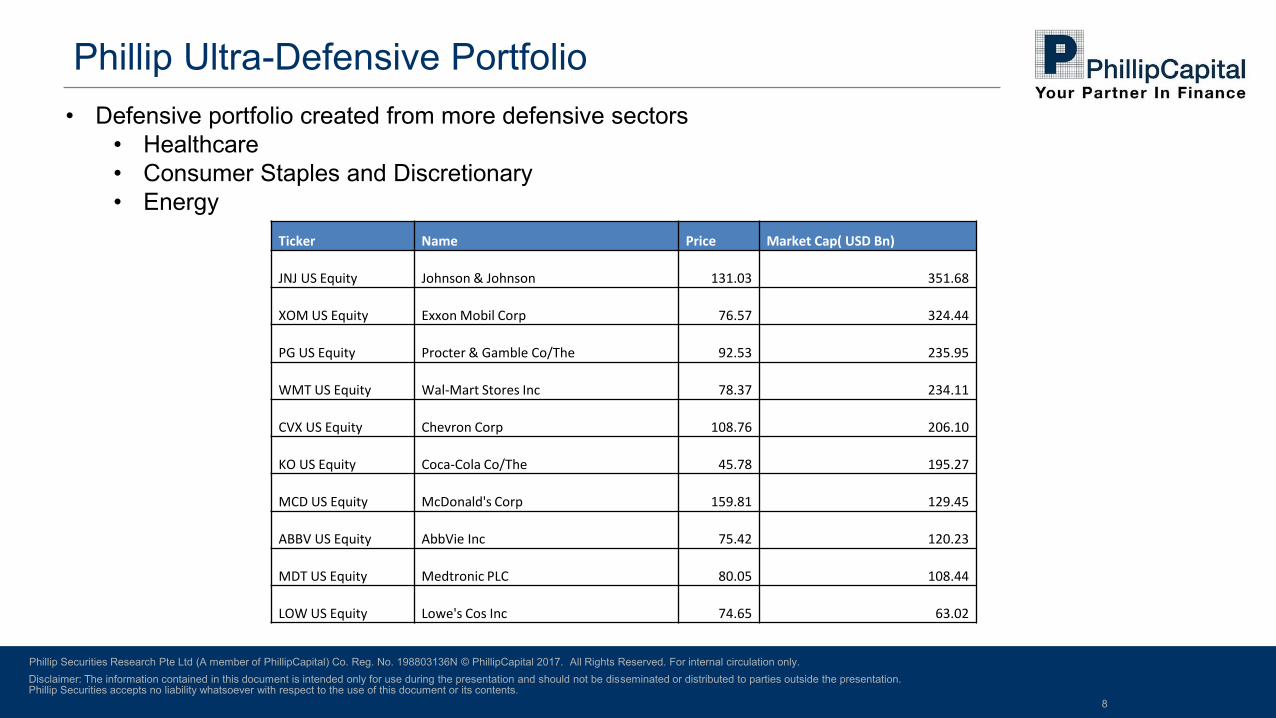
Phillip Ultra-Defensive Portfolio
• Defensive portfolio created from more defensive sectors
• Healthcare
• Consumer Staples and Discretionary
• Energy
Ticker Name Price Market Cap( USD Bn)
JNJ US Equity Johnson & Johnson 131.03 351.68
XOM US Equity Exxon Mobil Corp 76.57 324.44
PG US Equity Procter & Gamble Co/The 92.53 235.95
WMT US Equity Wal-Mart Stores Inc 78.37 234.11
CVX US Equity Chevron Corp 108.76 206.10
KO US Equity Coca-Cola Co/The 45.78 195.27
MCD US Equity McDonald's Corp 159.81 129.45
ABBV US Equity AbbVie Inc 75.42 120.23
MDT US Equity Medtronic PLC 80.05 108.44
LOW US Equity Lowe's Cos Inc 74.65 63.02
Disclaimer: The information contained in this document is intended only for use during the presentation and should not be disseminated or distributed to parties outside the presentation. Phillip Securities accepts no liability whatsoever with respect to the use of this document or its contents.
Phillip Securities Research Pte Ltd (A member of PhillipCapital) Co. Reg. No. 198803136N © PhillipCapital 2017. All Rights Reserved. For internal circulation only.
9
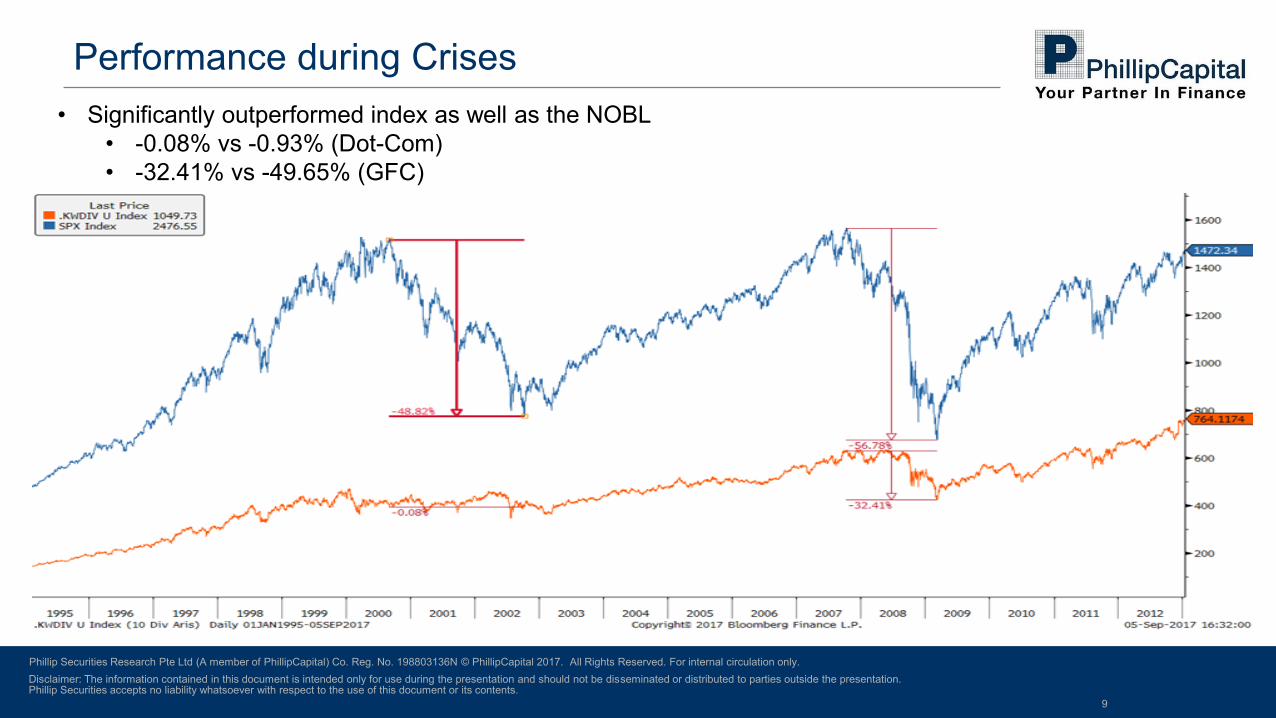
Performance during Crises
• Significantly outperformed index as well as the NOBL
• -0.08% vs -0.93% (Dot-Com)
• -32.41% vs -49.65% (GFC)
Disclaimer: The information contained in this document is intended only for use during the presentation and should not be disseminated or distributed to parties outside the presentation. Phillip Securities accepts no liability whatsoever with respect to the use of this document or its contents.
Phillip Securities Research Pte Ltd (A member of PhillipCapital) Co. Reg. No. 198803136N © PhillipCapital 2017. All Rights Reserved. For internal circulation only.
10
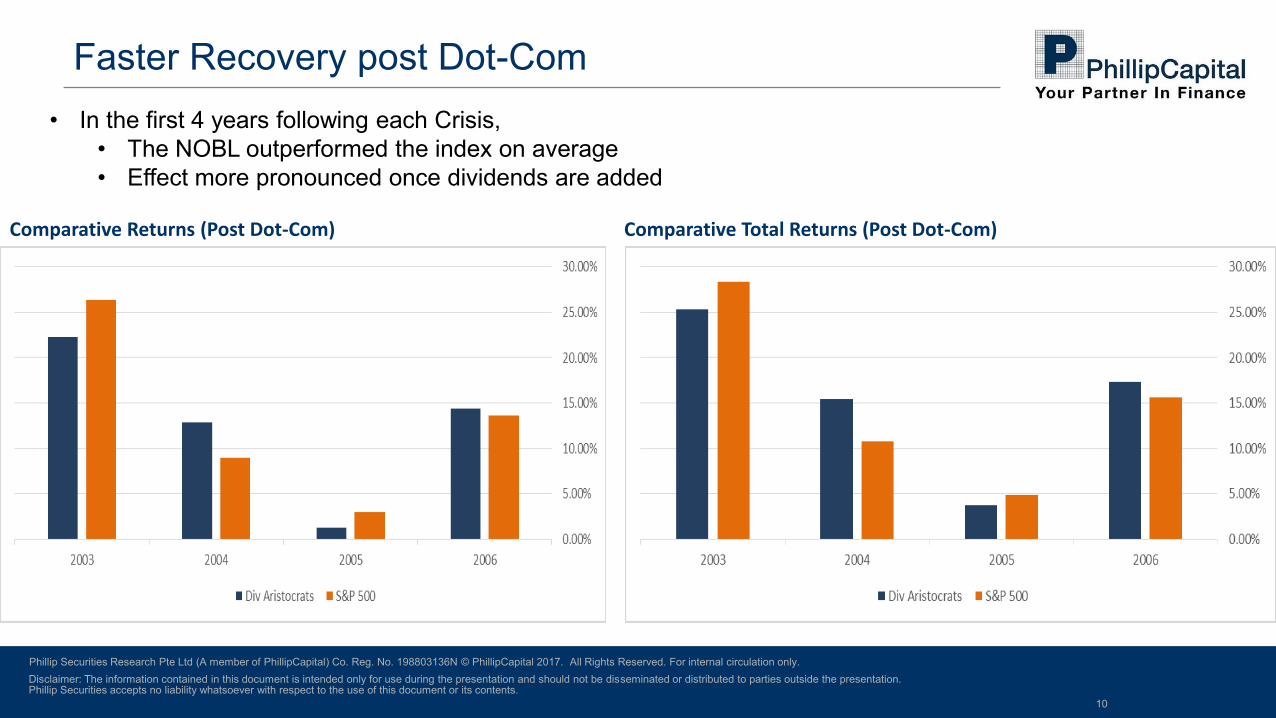
Faster Recovery post Dot-Com
• In the first 4 years following each Crisis,
• The NOBL outperformed the index on average
• Effect more pronounced once dividends are added
Comparative Total Returns (Post Dot-Com) Comparative Returns (Post Dot-Com)
Disclaimer: The information contained in this document is intended only for use during the presentation and should not be disseminated or distributed to parties outside the presentation. Phillip Securities accepts no liability whatsoever with respect to the use of this document or its contents.
Phillip Securities Research Pte Ltd (A member of PhillipCapital) Co. Reg. No. 198803136N © PhillipCapital 2017. All Rights Reserved. For internal circulation only.
11
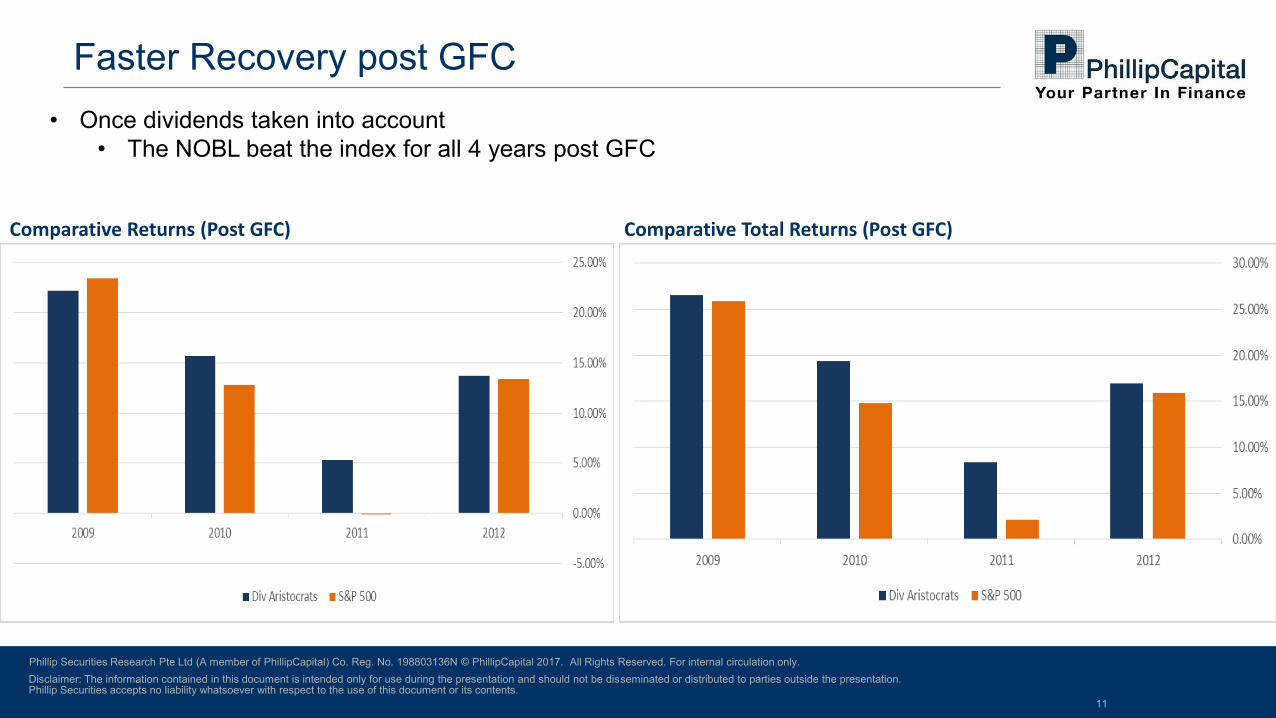
Faster Recovery post GFC
• Once dividends taken into account
• The NOBL beat the index for all 4 years post GFC
Comparative Total Returns (Post GFC) Comparative Returns (Post GFC)
Disclaimer: The information contained in this document is intended only for use during the presentation and should not be disseminated or distributed to parties outside the presentation. Phillip Securities accepts no liability whatsoever with respect to the use of this document or its contents.
Phillip Securities Research Pte Ltd (A member of PhillipCapital) Co. Reg. No. 198803136N © PhillipCapital 2017. All Rights Reserved. For internal circulation only.
12
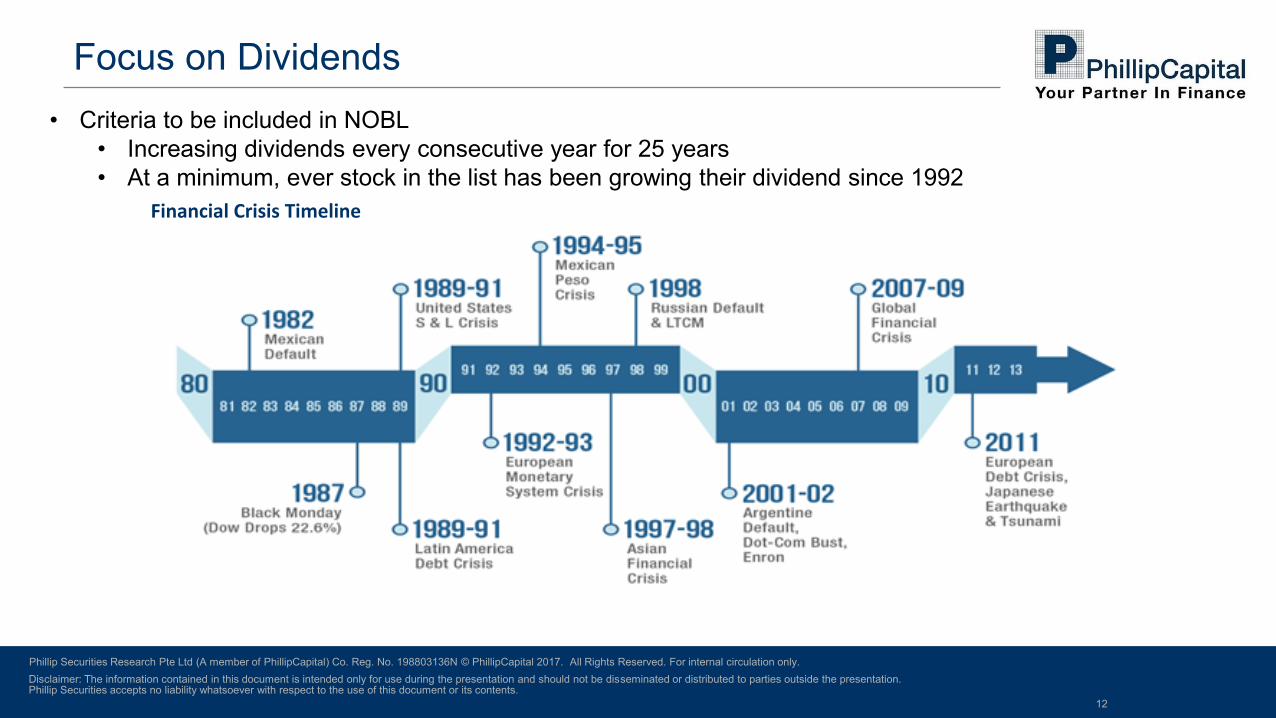
Focus on Dividends
• Criteria to be included in NOBL
• Increasing dividends every consecutive year for 25 years
• At a minimum, ever stock in the list has been growing their dividend since 1992
Financial Crisis Timeline
Disclaimer: The information contained in this document is intended only for use during the presentation and should not be disseminated or distributed to parties outside the presentation. Phillip Securities accepts no liability whatsoever with respect to the use of this document or its contents.
Phillip Securities Research Pte Ltd (A member of PhillipCapital) Co. Reg. No. 198803136N © PhillipCapital 2017. All Rights Reserved. For internal circulation only.
13
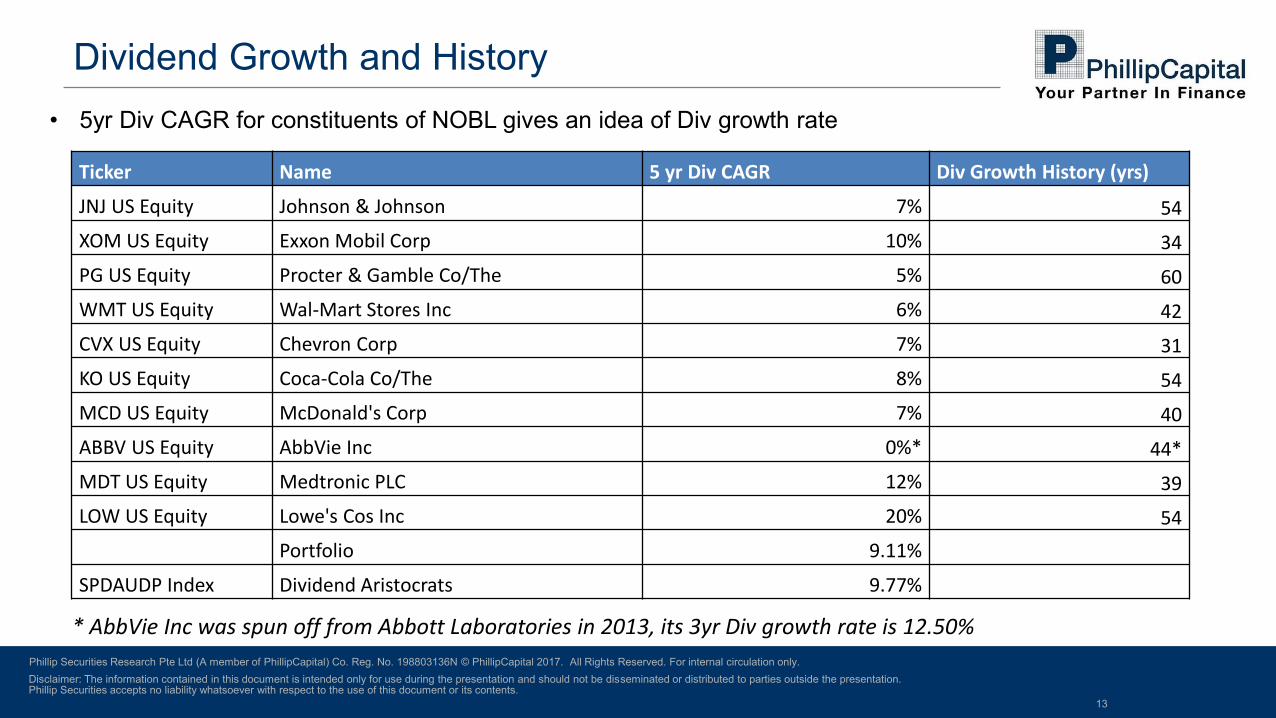
Dividend Growth and History
• 5yr Div CAGR for constituents of NOBL gives an idea of Div growth rate
Ticker Name 5 yr Div CAGR Div Growth History (yrs)
JNJ US Equity Johnson & Johnson 7% 54
XOM US Equity Exxon Mobil Corp 10% 34
PG US Equity Procter & Gamble Co/The 5% 60
WMT US Equity Wal-Mart Stores Inc 6% 42
CVX US Equity Chevron Corp 7% 31
KO US Equity Coca-Cola Co/The 8% 54
MCD US Equity McDonald's Corp 7% 40
ABBV US Equity AbbVie Inc 0%* 44*
MDT US Equity Medtronic PLC 12% 39
LOW US Equity Lowe's Cos Inc 20% 54
Portfolio 9.11%
SPDAUDP Index Dividend Aristocrats 9.77%
* AbbVie Inc was spun off from Abbott Laboratories in 2013, its 3yr Div growth rate is 12.50%
Disclaimer: The information contained in this document is intended only for use during the presentation and should not be disseminated or distributed to parties outside the presentation. Phillip Securities accepts no liability whatsoever with respect to the use of this document or its contents.
Phillip Securities Research Pte Ltd (A member of PhillipCapital) Co. Reg. No. 198803136N © PhillipCapital 2017. All Rights Reserved. For internal circulation only.
14
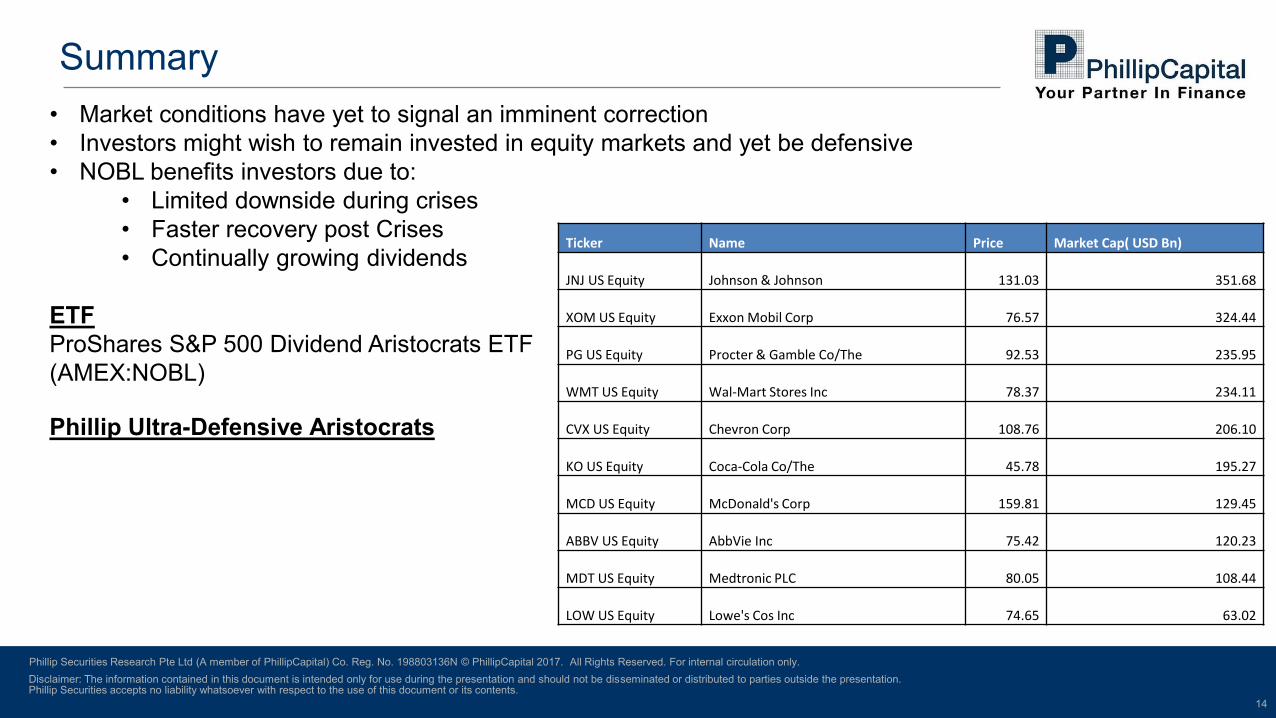
Summary
• Market conditions have yet to signal an imminent correction
• Investors might wish to remain invested in equity markets and yet be defensive
• NOBL benefits investors due to:
• Limited downside during crises
• Faster recovery post Crises
• Continually growing dividends
ETF
ProShares S&P 500 Dividend Aristocrats ETF
(AMEX:NOBL)
Phillip Ultra-Defensive Aristocrats
Ticker Name Price Market Cap( USD Bn)
JNJ US Equity Johnson & Johnson 131.03 351.68
XOM US Equity Exxon Mobil Corp 76.57 324.44
PG US Equity Procter & Gamble Co/The 92.53 235.95
WMT US Equity Wal-Mart Stores Inc 78.37 234.11
CVX US Equity Chevron Corp 108.76 206.10
KO US Equity Coca-Cola Co/The 45.78 195.27
MCD US Equity McDonald's Corp 159.81 129.45
ABBV US Equity AbbVie Inc 75.42 120.23
MDT US Equity Medtronic PLC 80.05 108.44
LOW US Equity Lowe's Cos Inc 74.65 63.02
Disclaimer: The information contained in this document is intended only for use during the presentation and should not be disseminated or distributed to parties outside the presentation. Phillip Securities accepts no liability whatsoever with respect to the use of this document or its contents.
Phillip Securities Research Pte Ltd (A member of PhillipCapital) Co. Reg. No. 198803136N © PhillipCapital 2017. All Rights Reserved. For internal circulation only.
11 September 17, 8.15am/11.15am Morning Call/Webinar
Singapore strategy update –
September
Paul Chew
Phillip Securities Research Pte Ltd
11 September 2017
Disclaimer: The information contained in this document is intended only for use during the presentation and should not be disseminated or distributed to parties outside the presentation. Phillip Securities accepts no liability whatsoever with respect to the use of this document or its contents.
Phillip Securities Research Pte Ltd (A member of PhillipCapital) Co. Reg. No. 198803136N © PhillipCapital 2017. All Rights Reserved. For internal circulation only.
Singapore strategy update – September
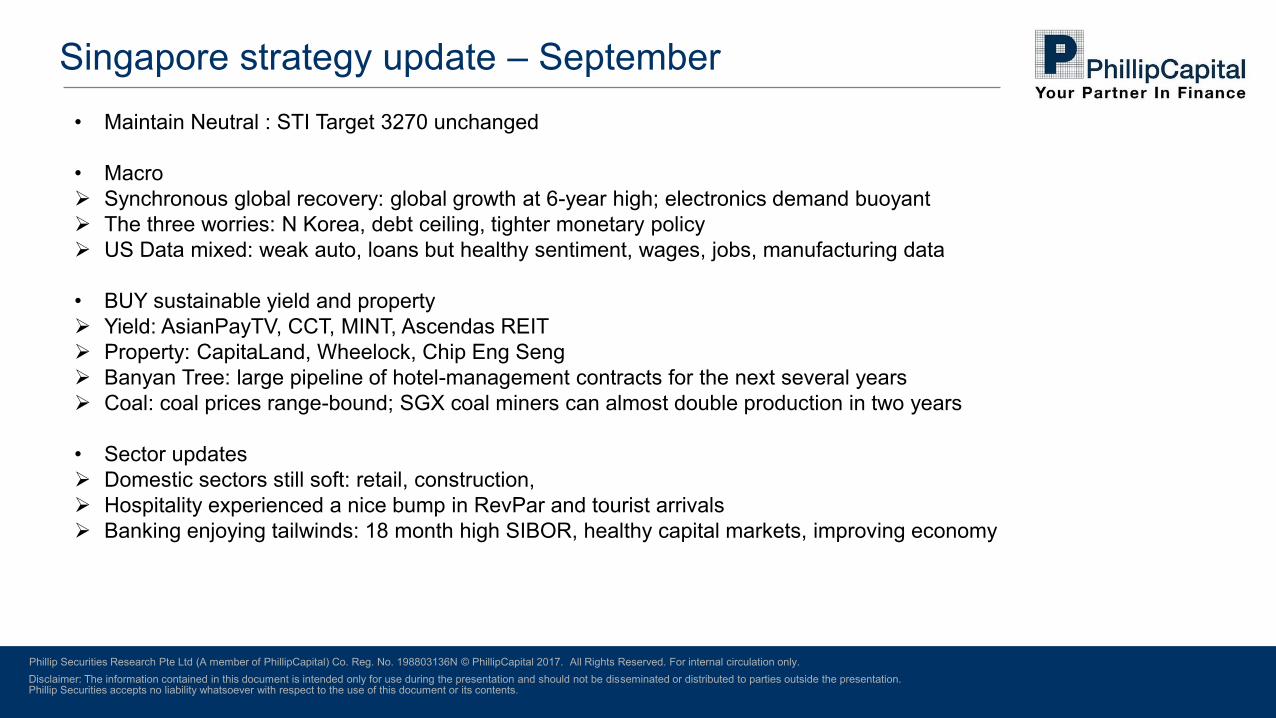
• Maintain Neutral : STI Target 3270 unchanged
• Macro
Synchronous global recovery: global growth at 6-year high; electronics demand buoyant
The three worries: N Korea, debt ceiling, tighter monetary policy
US Data mixed: weak auto, loans but healthy sentiment, wages, jobs, manufacturing data
• BUY sustainable yield and property
Yield: AsianPayTV, CCT, MINT, Ascendas REIT
Property: CapitaLand, Wheelock, Chip Eng Seng
Banyan Tree: large pipeline of hotel-management contracts for the next several years
Coal: coal prices range-bound; SGX coal miners can almost double production in two years
• Sector updates
Domestic sectors still soft: retail, construction,
Hospitality experienced a nice bump in RevPar and tourist arrivals
Banking enjoying tailwinds: 18 month high SIBOR, healthy capital markets, improving economy
Disclaimer: The information contained in this document is intended only for use during the presentation and should not be disseminated or distributed to parties outside the presentation. Phillip Securities accepts no liability whatsoever with respect to the use of this document or its contents.
Phillip Securities Research Pte Ltd (A member of PhillipCapital) Co. Reg. No. 198803136N © PhillipCapital 2017. All Rights Reserved. For internal circulation only.
11 September 17, 8.15am/11.15am Morning Call/Webinar
The Phillip 20
August Monthly Review
Jeremy Ng
Phillip Securities Research Pte Ltd
11 September 2017
Disclaimer: The information contained in this document is intended only for use during the presentation and should not be disseminated or distributed to parties outside the presentation. Phillip Securities accepts no liability whatsoever with respect to the use of this document or its contents.
Phillip Securities Research Pte Ltd (A member of PhillipCapital) Co. Reg. No. 198803136N © PhillipCapital 2017. All Rights Reserved. For internal circulation only.
18
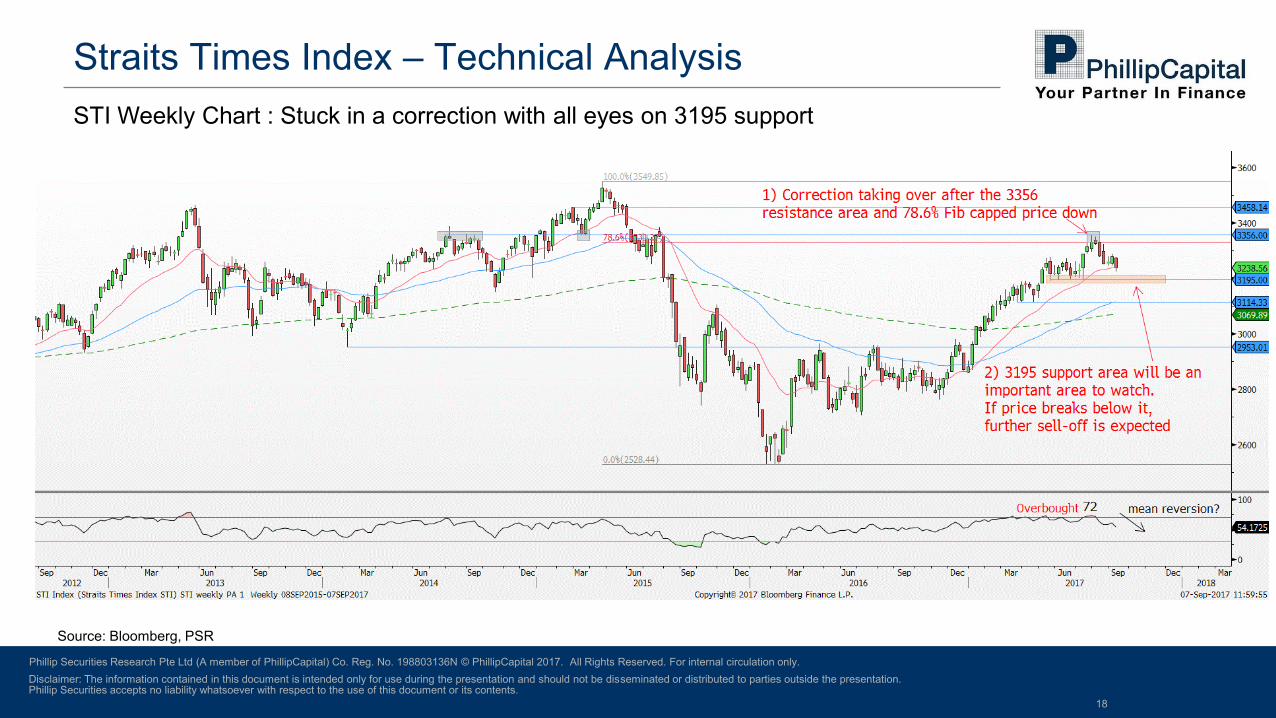
Straits Times Index – Technical Analysis
Source: Bloomberg, PSR
STI Weekly Chart : Stuck in a correction with all eyes on 3195 support
+3.2% in July 17
Disclaimer: The information contained in this document is intended only for use during the presentation and should not be disseminated or distributed to parties outside the presentation. Phillip Securities accepts no liability whatsoever with respect to the use of this document or its contents.
Phillip Securities Research Pte Ltd (A member of PhillipCapital) Co. Reg. No. 198803136N © PhillipCapital 2017. All Rights Reserved. For internal circulation only.
19
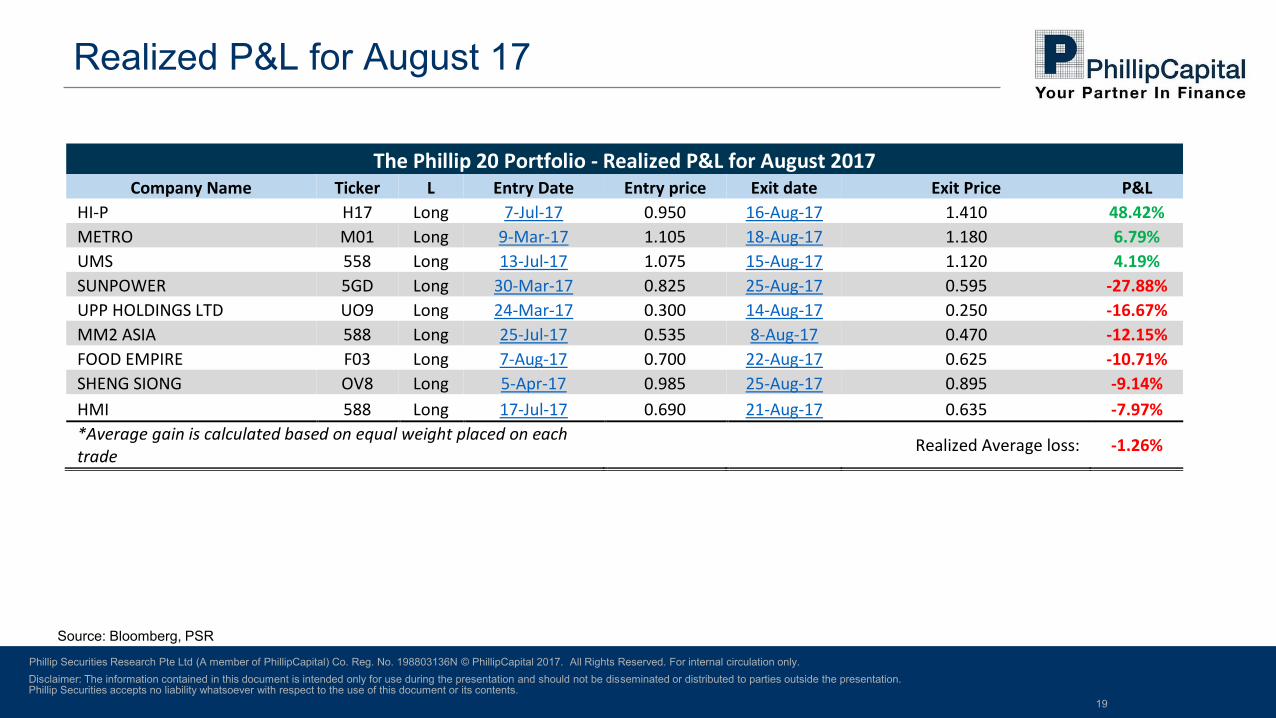
Realized P&L for August 17
Source: Bloomberg, PSR
The Phillip 20 Portfolio - Realized P&L for August 2017 Company Name Ticker L Entry Date Entry price Exit date Exit Price P&L
HI-P H17 Long 7-Jul-17 0.950 16-Aug-17 1.410 48.42%
METRO M01 Long 9-Mar-17 1.105 18-Aug-17 1.180 6.79%
UMS 558 Long 13-Jul-17 1.075 15-Aug-17 1.120 4.19%
SUNPOWER 5GD Long 30-Mar-17 0.825 25-Aug-17 0.595 -27.88%
UPP HOLDINGS LTD UO9 Long 24-Mar-17 0.300 14-Aug-17 0.250 -16.67%
MM2 ASIA 588 Long 25-Jul-17 0.535 8-Aug-17 0.470 -12.15%
FOOD EMPIRE F03 Long 7-Aug-17 0.700 22-Aug-17 0.625 -10.71%
SHENG SIONG OV8 Long 5-Apr-17 0.985 25-Aug-17 0.895 -9.14%
HMI 588 Long 17-Jul-17 0.690 21-Aug-17 0.635 -7.97%
*Average gain is calculated based on equal weight placed on each trade
Realized Average loss: -1.26%
Disclaimer: The information contained in this document is intended only for use during the presentation and should not be disseminated or distributed to parties outside the presentation. Phillip Securities accepts no liability whatsoever with respect to the use of this document or its contents.
Phillip Securities Research Pte Ltd (A member of PhillipCapital) Co. Reg. No. 198803136N © PhillipCapital 2017. All Rights Reserved. For internal circulation only.
20
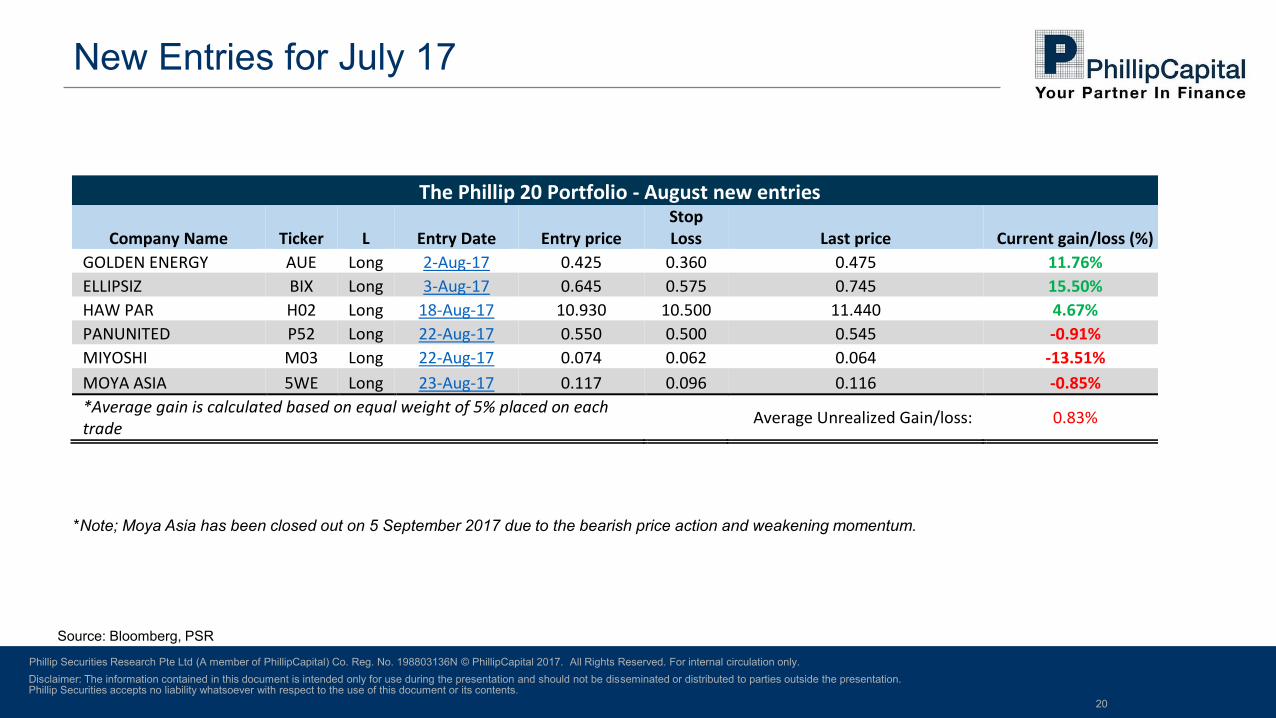
New Entries for July 17
Source: Bloomberg, PSR
The Phillip 20 Portfolio - August new entries
Company Name Ticker L Entry Date Entry price Stop Loss Last price Current gain/loss (%)
GOLDEN ENERGY AUE Long 2-Aug-17 0.425 0.360 0.475 11.76%
ELLIPSIZ BIX Long 3-Aug-17 0.645 0.575 0.745 15.50%
HAW PAR H02 Long 18-Aug-17 10.930 10.500 11.440 4.67%
PANUNITED P52 Long 22-Aug-17 0.550 0.500 0.545 -0.91%
MIYOSHI M03 Long 22-Aug-17 0.074 0.062 0.064 -13.51%
MOYA ASIA 5WE Long 23-Aug-17 0.117 0.096 0.116 -0.85%
*Average gain is calculated based on equal weight of 5% placed on each trade
Average Unrealized Gain/loss: 0.83%
*Note; Moya Asia has been closed out on 5 September 2017 due to the bearish price action and weakening momentum.
Disclaimer: The information contained in this document is intended only for use during the presentation and should not be disseminated or distributed to parties outside the presentation. Phillip Securities accepts no liability whatsoever with respect to the use of this document or its contents.
Phillip Securities Research Pte Ltd (A member of PhillipCapital) Co. Reg. No. 198803136N © PhillipCapital 2017. All Rights Reserved. For internal circulation only.
21
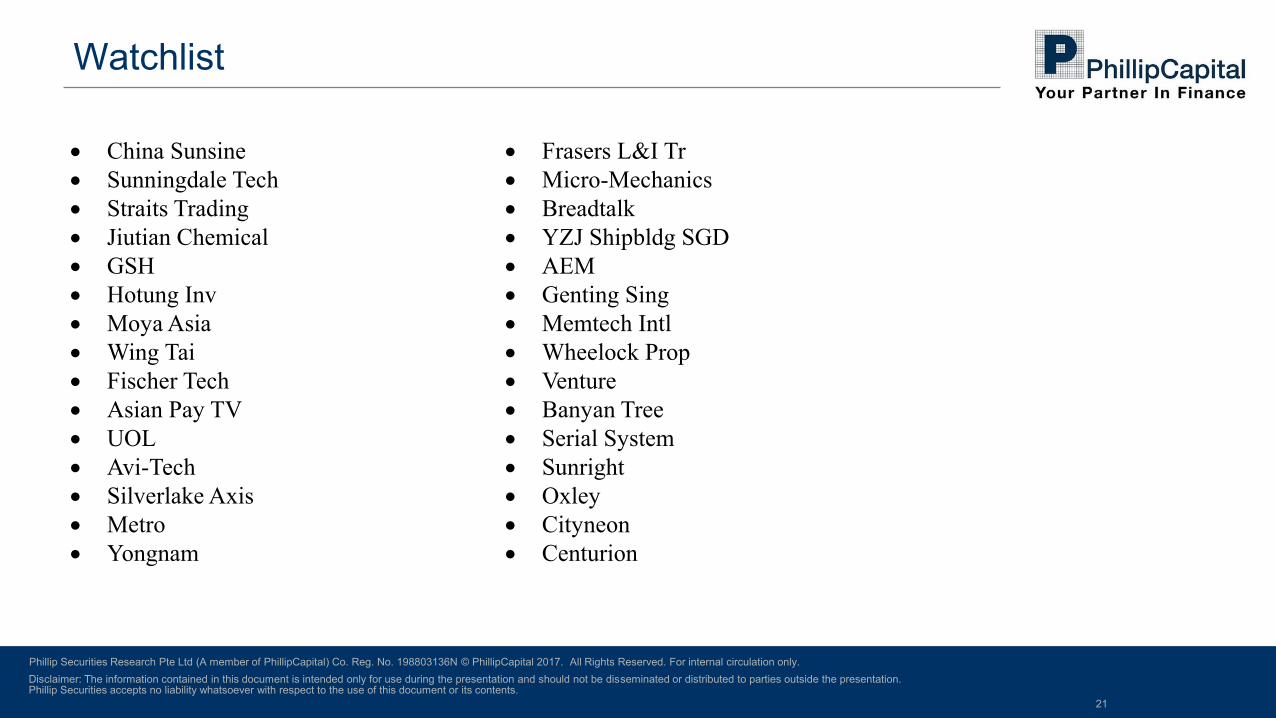
Watchlist
China Sunsine Frasers L&I Tr
Sunningdale Tech Micro-Mechanics
Straits Trading Breadtalk
Jiutian Chemical YZJ Shipbldg SGD
GSH AEM
Hotung Inv Genting Sing
Moya Asia Memtech Intl
Wing Tai Wheelock Prop
Fischer Tech Venture
Asian Pay TV Banyan Tree
UOL Serial System
Avi-Tech Sunright
Silverlake Axis Oxley
Metro Cityneon
Yongnam Centurion
Disclaimer: The information contained in this document is intended only for use during the presentation and should not be disseminated or distributed to parties outside the presentation. Phillip Securities accepts no liability whatsoever with respect to the use of this document or its contents.
Phillip Securities Research Pte Ltd (A member of PhillipCapital) Co. Reg. No. 198803136N © PhillipCapital 2017. All Rights Reserved. For internal circulation only.
22
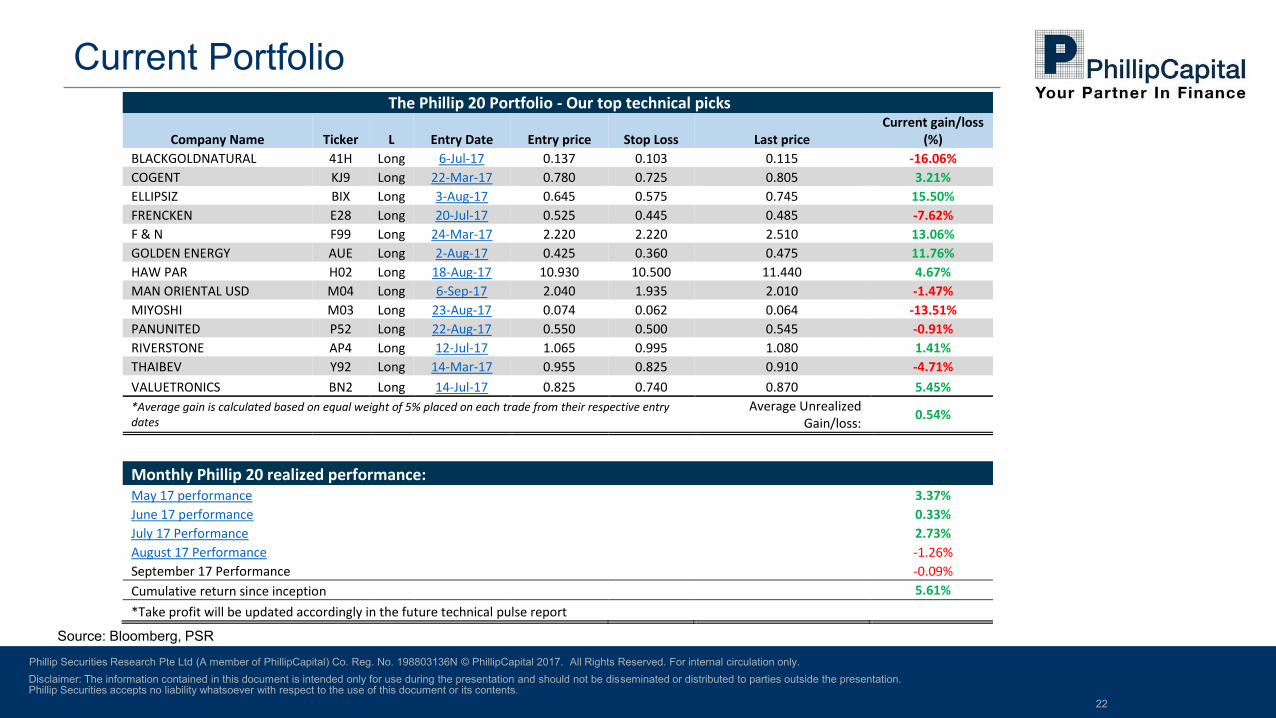
Current Portfolio
Source: Bloomberg, PSR
The Phillip 20 Portfolio - Our top technical picks
Company Name Ticker L Entry Date Entry price Stop Loss Last price Current gain/loss
(%)
BLACKGOLDNATURAL 41H Long 6-Jul-17 0.137 0.103 0.115 -16.06%
COGENT KJ9 Long 22-Mar-17 0.780 0.725 0.805 3.21%
ELLIPSIZ BIX Long 3-Aug-17 0.645 0.575 0.745 15.50%
FRENCKEN E28 Long 20-Jul-17 0.525 0.445 0.485 -7.62%
F & N F99 Long 24-Mar-17 2.220 2.220 2.510 13.06%
GOLDEN ENERGY AUE Long 2-Aug-17 0.425 0.360 0.475 11.76%
HAW PAR H02 Long 18-Aug-17 10.930 10.500 11.440 4.67%
MAN ORIENTAL USD M04 Long 6-Sep-17 2.040 1.935 2.010 -1.47%
MIYOSHI M03 Long 23-Aug-17 0.074 0.062 0.064 -13.51%
PANUNITED P52 Long 22-Aug-17 0.550 0.500 0.545 -0.91%
RIVERSTONE AP4 Long 12-Jul-17 1.065 0.995 1.080 1.41%
THAIBEV Y92 Long 14-Mar-17 0.955 0.825 0.910 -4.71%
VALUETRONICS BN2 Long 14-Jul-17 0.825 0.740 0.870 5.45%
*Average gain is calculated based on equal weight of 5% placed on each trade from their respective entry dates
Average Unrealized Gain/loss:
0.54%
Monthly Phillip 20 realized performance:
May 17 performance
3.37%
June 17 performance
0.33%
July 17 Performance
2.73%
August 17 Performance
-1.26%
September 17 Performance -0.09%
Cumulative return since inception
5.61%
*Take profit will be updated accordingly in the future technical pulse report
Disclaimer: The information contained in this document is intended only for use during the presentation and should not be disseminated or distributed to parties outside the presentation. Phillip Securities accepts no liability whatsoever with respect to the use of this document or its contents.
Phillip Securities Research Pte Ltd (A member of PhillipCapital) Co. Reg. No. 198803136N © PhillipCapital 2017. All Rights Reserved. For internal circulation only.
23
Disclaimer
The information contained in this presentation has been obtained from public sources which Phillip Securities Research Pte Ltd (“PSR”) has no
reason to believe are unreliable and any analysis, forecasts, projections, expectations and opinions (collectively the “Research”) contained in this
presentation are based on such information and are expressions of belief only. PSR has not verified this information and no representation or
warranty, express or implied, is made that such information or Research is accurate, complete or verified or should be relied upon as such. Any
such information or Research contained in this presentation is subject to change, and PSR shall not have any responsibility to maintain the
information or Research made available or to supply any corrections, updates or releases in connection therewith. In no event will PSR be liable for
any special, indirect, incidental or consequential damages which may be incurred from the use of the information or Research made available, even
if it has been advised of the possibility of such damages.
This presentation is intended for general circulation only and does not take into account the specific investment objectives, financial situation or
particular needs of any particular person.
You should seek advice from a financial adviser regarding the suitability of the investment product, taking into account your specific investment
objectives, financial situation or particular needs, before making a commitment to invest in such products.
Disclaimer: The information contained in this document is intended only for use during the presentation and should not be disseminated or distributed to parties outside the presentation. Phillip Securities accepts no liability whatsoever with respect to the use of this document or its contents.
Phillip Securities Research Pte Ltd (A member of PhillipCapital) Co. Reg. No. 198803136N © PhillipCapital 2017. All Rights Reserved. For internal circulation only.
24
Analysts Paul Chew, Head of Research
Pei Sai Teng, Macro
Jeremy Ng, Technical Analysis
Jeremy Teong, Banking & Finance
Soh Lin Sin, Consumer | Healthcare
Richard Leow, Transport | REITs (Industrial)
Dehong Tan, REITs (Commercial, Retail, Healthcare) | Property
Ho Kang Wei, US Equity
Chen Guangzhi, Oil and Gas | Energy
By Phillip Securities Research Mohamed Amiruddin, Operations Exec
Ask Questions!
Archived Webinar videos can be accessed at:
https://www.poems.com.sg/education/webinars/