Embed Size (px)
Citation preview
A R C H I V E S O F M E T A L L U R G Y A N D M A T E R I A L S
Volume 60 2015 Issue 2
DOI: 10.1515/amm-2015-0181
O. WYSOCKA-FOTEK∗, M. MAJ∗, W. OLIFERUK ∗,∗∗ ,]
USE OF PULSED IR THERMOGRAPHY FOR DETERMINATION OF SIZE AND DEPTH OF SUBSURFACE DEFECT TAKINGINTO ACCOUNT THE SHAPE OF ITS CROSS-SECTION AREA
ZASTOSOWANIE IMPULSOWEJ TERMOGRAFII PODCZERWIENI DO SZACOWANIA WIELKOŚCI I POŁOŻENIA DEFEKTÓWPODPOWIERZCHNIOWYCH Z UWZGLĘDNIENIEM KSZTAŁTU ICH PRZEKROJÓW POPRZECZNYCH
The paper is devoted to reconstruction of size and depth (distance from the tested surface) of artificial defects withsquare and rectangular cross-section areas using the pulsed IR thermography. Defects in form of flat-bottom holes weremade in austenitic steel plate. The defect size was estimated on the basis of surface distribution of the time derivative ofthe temperature. In order to asses the depth of defects with considered geometries on the basis of calibration relations (i.e.dependence of time of contrast maximum vs. defect depth for given defect diameter) obtained for circular defects, the ‘equivalentdiameter’ describing not only the defect cross-section area but also its shape was assigned. It has been shown that presentedapproach gives satisfactory results.
Keywords: pulsed IR thermography, defect size, defect depth, cross-section shape of defect
Praca dotyczy wyznaczania wielkości i głębokości (odległości od badanej powierzchni) symulowanych defektów o prze-kroju kwadratowym i prostokątnym przy użyciu impulsowej termografii podczerwieni. Defekty, w formie nieprzelotowychotworów o płaskim dnie, wykonano w blasze ze stali austenitycznej. Wielkość defektów określano analizując powierzchniowyrozkład pochodnej temperatury względem czasu.
Aby wykorzystać zależności kalibracyjne (zależności czasu odpowiadającemu maksimum kontrastu temperatury od głę-bokości defektu o danej średnicy) dla defektów o przekroju kołowym do oszacowania głębokości defektów kwadratowych iprostokątnych, przyporządkowano im „ekwiwalentną średnicę” uwzględniającą nie tylko pole przekroju defektu, ale także kształtdefektu. Pokazano, że dla rozpatrywanych geometrii defektów, zaproponowane podejście daje satysfakcjonujące rezultaty.
1. Introduction
Pulsed infrared (IR) thermography is one of active IRtechniques in which a surface of tested material is stimulatedby a short heat pulse and the thermal response of the ma-terial is analysed [1-11]. The response contains informationabout subsurface material defects. After the heat pulse thetemperature decrease rate is different on surface over defect incomparison to that over the sound material. It is caused by adifference between values of thermal effusivity of the defectedregion and the sound one. The thermal effusivity of the givenmaterial is defined as:
e =√
kρc, (1)
where: k is thermal conductivity, ρ is a mass density and c isspecific heat of the material. If the thermal effusivity of defectis lower than the effusivity of the matrix, the surface temper-ature over defect will be higher comparing to that over thesound material. As the quantitative measure of the differencebetween values of the surface temperature over defected zone
and over the sound material the standard thermal contrast C (t)is used [9]:
C (t) =Tde f (t) − Tde f (t0)
Ts (t) − Ts (t0), (2)
where Tde f is the surface temperature over defect, TS is thesurface temperature over the sound material, t0 is the time justbefore pulse heating and t is the current time of the coolingprocess.
It has been shown that the relation of thermal contrastvs. cooling time has a maximum [1, 7-15, 18-20]. But, thetime related to the thermal contrast maximum is dependenton both size of defect and its depth [10-12]. In the literature,the time corresponding to thermal contrast maximum is oftenused for the defect depth determination [1, 7, 10-13, 15-20].However, in most papers authors concern only defects of thesame size located at the different depths [12-17, 19]. Suchproblem is easy to solve because it is not taking into accountthe conjugated effect of defect depth and size on the time ofthermal contrast maximum. Nevertheless, our previous workshave shown that the time of thermal contrast maximum can
∗ INSTITUTE OF FUNDAMENTAL TECHNOLOGICAL RESEARCH POLISH ACADEMY OF SCIENCES, WARSAW, POLAND∗∗ BIALYSTOK UNIVERSITY OF TECHNOLOGY, BIALYSTOK, POLAND] Corresponding author: [email protected]
616
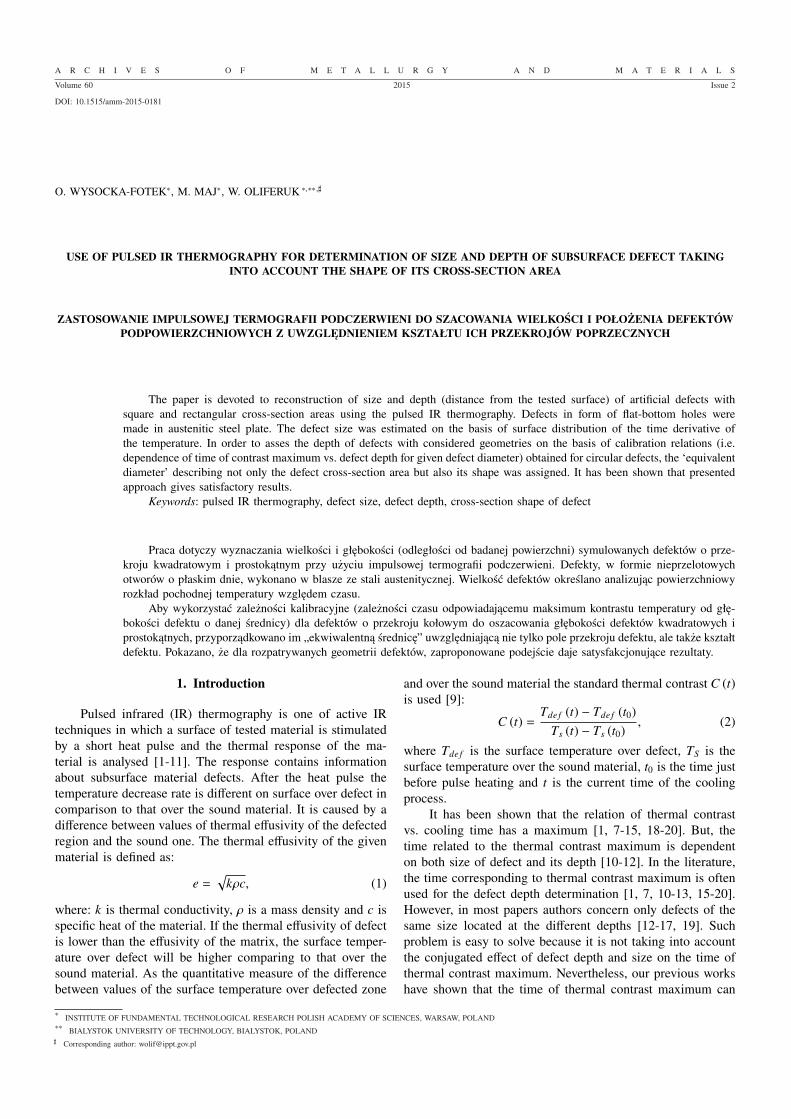
be the same for different depths and sizes of defects [10, 11].It means that in order to determine the defect depth on the ba-sis of the time of thermal contrast maximum, it is necessaryto know the defect size. In our previous works, the experi-mental methods of defect size and depth determination wereproposed [10, 11]. The defect size was estimated on the basisof surface distribution of the time derivative of temperature,whereas the defect depth was assessed from the dependenceof surface thermal contrast vs. cooling time. To reconstructthe defect depth using this method, the calibration relationsare needed. These are relations between defect depth and thetime of thermal contrast maximum for given defect diameters.Such calibration relations for subsurface defects in austeniticsteel plate are presented in Fig. 1 [10, 11]. On the basis ofthese relations, the depth of defect of reconstructed diametercan be estimated.
Fig. 1. Dependence of defect depth vs. time of thermal contrast max-imum (the calibration relations)
However, the experiments have been performed, as inmost other papers [1-4, 7, 8, 13, 15-20], on the specimenwith artificial defects in form of the circular flat-bottom holes.Therefore, the question is: Whether the calibration relationsobtained for circular defects could be used for depth determi-nation of defects with different shape? In order to answer thequestion the experiments for square and rectangular defectswere performed. Thus, the objective of this work is to recon-struct depth of square and rectangular defects on the basis ofcalibration relations obtained for circular defects.
2. Experimental procedure
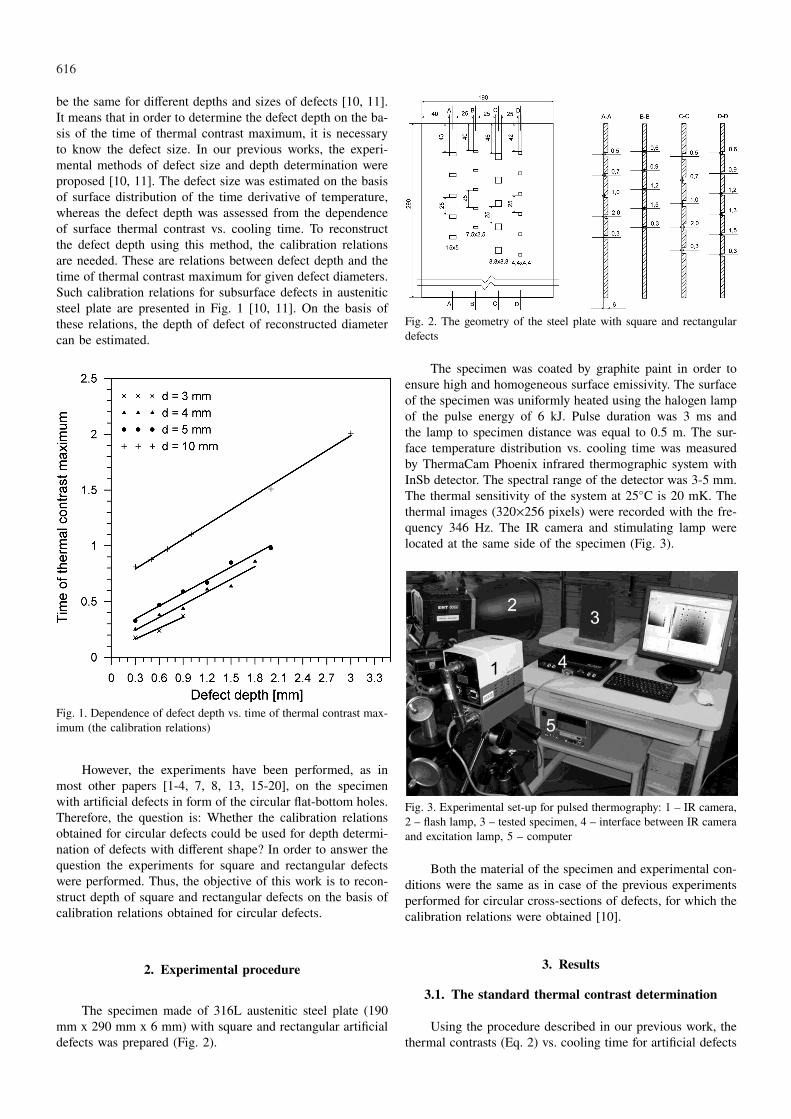
The specimen made of 316L austenitic steel plate (190mm x 290 mm x 6 mm) with square and rectangular artificialdefects was prepared (Fig. 2).
Fig. 2. The geometry of the steel plate with square and rectangulardefects
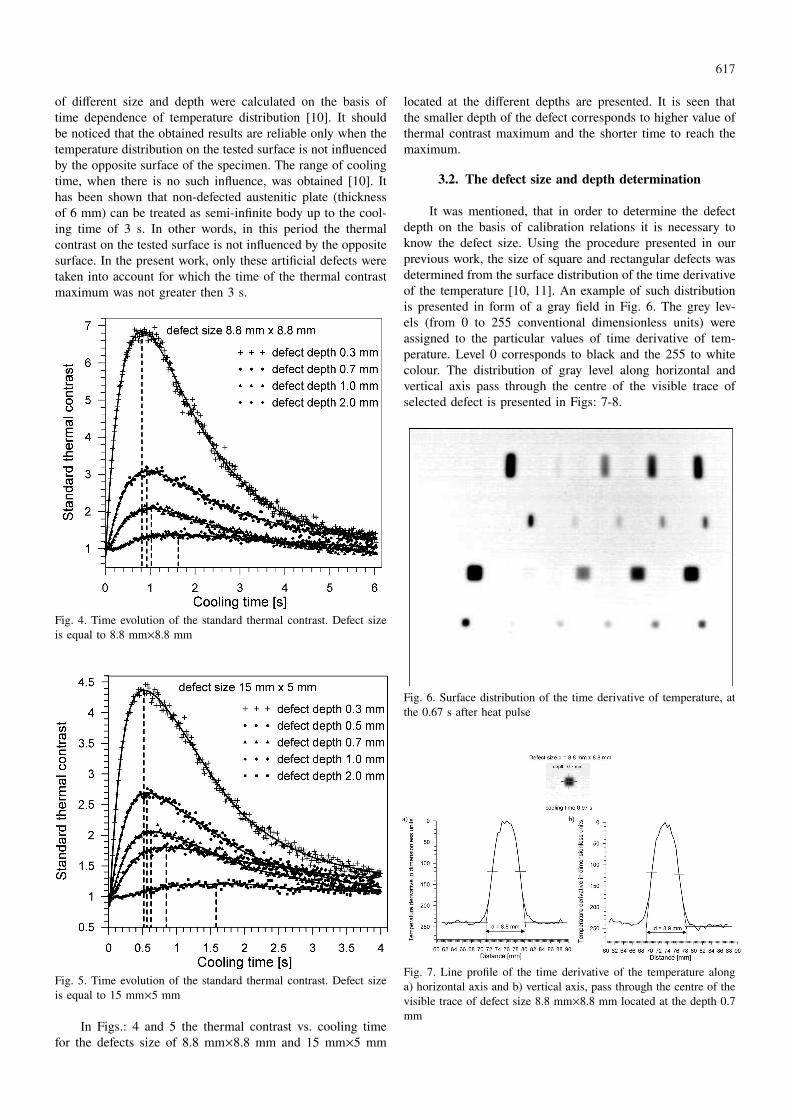
The specimen was coated by graphite paint in order toensure high and homogeneous surface emissivity. The surfaceof the specimen was uniformly heated using the halogen lampof the pulse energy of 6 kJ. Pulse duration was 3 ms andthe lamp to specimen distance was equal to 0.5 m. The sur-face temperature distribution vs. cooling time was measuredby ThermaCam Phoenix infrared thermographic system withInSb detector. The spectral range of the detector was 3-5 mm.The thermal sensitivity of the system at 25◦C is 20 mK. Thethermal images (320×256 pixels) were recorded with the fre-quency 346 Hz. The IR camera and stimulating lamp werelocated at the same side of the specimen (Fig. 3).
Fig. 3. Experimental set-up for pulsed thermography: 1 – IR camera,2 – flash lamp, 3 – tested specimen, 4 – interface between IR cameraand excitation lamp, 5 – computer
Both the material of the specimen and experimental con-ditions were the same as in case of the previous experimentsperformed for circular cross-sections of defects, for which thecalibration relations were obtained [10].
3. Results
3.1. The standard thermal contrast determination
Using the procedure described in our previous work, thethermal contrasts (Eq. 2) vs. cooling time for artificial defects
617
of different size and depth were calculated on the basis oftime dependence of temperature distribution [10]. It shouldbe noticed that the obtained results are reliable only when thetemperature distribution on the tested surface is not influencedby the opposite surface of the specimen. The range of coolingtime, when there is no such influence, was obtained [10]. Ithas been shown that non-defected austenitic plate (thicknessof 6 mm) can be treated as semi-infinite body up to the cool-ing time of 3 s. In other words, in this period the thermalcontrast on the tested surface is not influenced by the oppositesurface. In the present work, only these artificial defects weretaken into account for which the time of the thermal contrastmaximum was not greater then 3 s.
Fig. 4. Time evolution of the standard thermal contrast. Defect sizeis equal to 8.8 mm×8.8 mm
Fig. 5. Time evolution of the standard thermal contrast. Defect sizeis equal to 15 mm×5 mm
In Figs.: 4 and 5 the thermal contrast vs. cooling timefor the defects size of 8.8 mm×8.8 mm and 15 mm×5 mm
located at the different depths are presented. It is seen thatthe smaller depth of the defect corresponds to higher value ofthermal contrast maximum and the shorter time to reach themaximum.
3.2. The defect size and depth determination
It was mentioned, that in order to determine the defectdepth on the basis of calibration relations it is necessary toknow the defect size. Using the procedure presented in ourprevious work, the size of square and rectangular defects wasdetermined from the surface distribution of the time derivativeof the temperature [10, 11]. An example of such distributionis presented in form of a gray field in Fig. 6. The grey lev-els (from 0 to 255 conventional dimensionless units) wereassigned to the particular values of time derivative of tem-perature. Level 0 corresponds to black and the 255 to whitecolour. The distribution of gray level along horizontal andvertical axis pass through the centre of the visible trace ofselected defect is presented in Figs: 7-8.
Fig. 6. Surface distribution of the time derivative of temperature, atthe 0.67 s after heat pulse
Fig. 7. Line profile of the time derivative of the temperature alonga) horizontal axis and b) vertical axis, pass through the centre of thevisible trace of defect size 8.8 mm×8.8 mm located at the depth 0.7mm
618
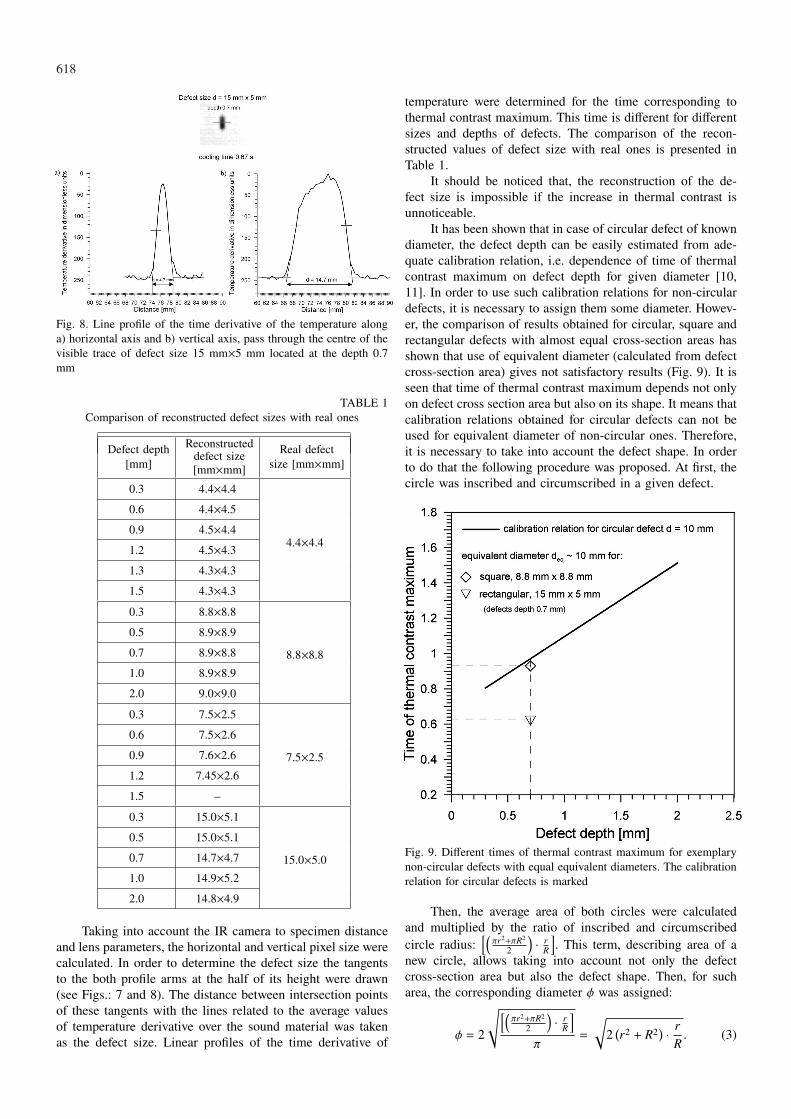
Fig. 8. Line profile of the time derivative of the temperature alonga) horizontal axis and b) vertical axis, pass through the centre of thevisible trace of defect size 15 mm×5 mm located at the depth 0.7mm
TABLE 1Comparison of reconstructed defect sizes with real ones
Defect depth[mm]
Reconstructeddefect size[mm×mm]
Real defectsize [mm×mm]
0.3 4.4×4.4
4.4×4.4
0.6 4.4×4.5
0.9 4.5×4.4
1.2 4.5×4.3
1.3 4.3×4.3
1.5 4.3×4.3
0.3 8.8×8.8
8.8×8.8
0.5 8.9×8.9
0.7 8.9×8.8
1.0 8.9×8.9
2.0 9.0×9.0
0.3 7.5×2.5
7.5×2.5
0.6 7.5×2.6
0.9 7.6×2.6
1.2 7.45×2.6
1.5 –
0.3 15.0×5.1
15.0×5.0
0.5 15.0×5.1
0.7 14.7×4.7
1.0 14.9×5.2
2.0 14.8×4.9
Taking into account the IR camera to specimen distanceand lens parameters, the horizontal and vertical pixel size werecalculated. In order to determine the defect size the tangentsto the both profile arms at the half of its height were drawn(see Figs.: 7 and 8). The distance between intersection pointsof these tangents with the lines related to the average valuesof temperature derivative over the sound material was takenas the defect size. Linear profiles of the time derivative of
temperature were determined for the time corresponding tothermal contrast maximum. This time is different for differentsizes and depths of defects. The comparison of the recon-structed values of defect size with real ones is presented inTable 1.
It should be noticed that, the reconstruction of the de-fect size is impossible if the increase in thermal contrast isunnoticeable.
It has been shown that in case of circular defect of knowndiameter, the defect depth can be easily estimated from ade-quate calibration relation, i.e. dependence of time of thermalcontrast maximum on defect depth for given diameter [10,11]. In order to use such calibration relations for non-circulardefects, it is necessary to assign them some diameter. Howev-er, the comparison of results obtained for circular, square andrectangular defects with almost equal cross-section areas hasshown that use of equivalent diameter (calculated from defectcross-section area) gives not satisfactory results (Fig. 9). It isseen that time of thermal contrast maximum depends not onlyon defect cross section area but also on its shape. It means thatcalibration relations obtained for circular defects can not beused for equivalent diameter of non-circular ones. Therefore,it is necessary to take into account the defect shape. In orderto do that the following procedure was proposed. At first, thecircle was inscribed and circumscribed in a given defect.
Fig. 9. Different times of thermal contrast maximum for exemplarynon-circular defects with equal equivalent diameters. The calibrationrelation for circular defects is marked
Then, the average area of both circles were calculatedand multiplied by the ratio of inscribed and circumscribedcircle radius:
[(πr2+πR2
2
)· r
R
]. This term, describing area of a
new circle, allows taking into account not only the defectcross-section area but also the defect shape. Then, for sucharea, the corresponding diameter φ was assigned:
φ = 2
√[(πr2+πR2
2
)· r
R
]
π=
√2(r2 + R2) · r
R. (3)
619
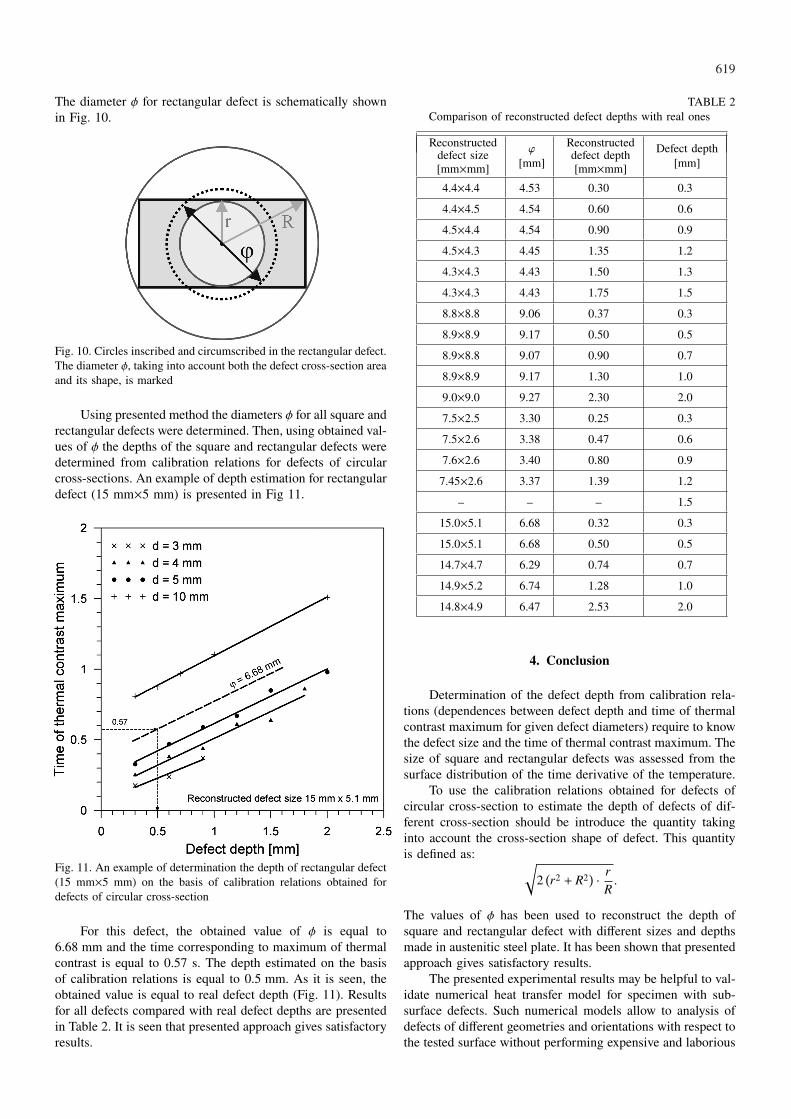
The diameter φ for rectangular defect is schematically shownin Fig. 10.
Fig. 10. Circles inscribed and circumscribed in the rectangular defect.The diameter φ, taking into account both the defect cross-section areaand its shape, is marked
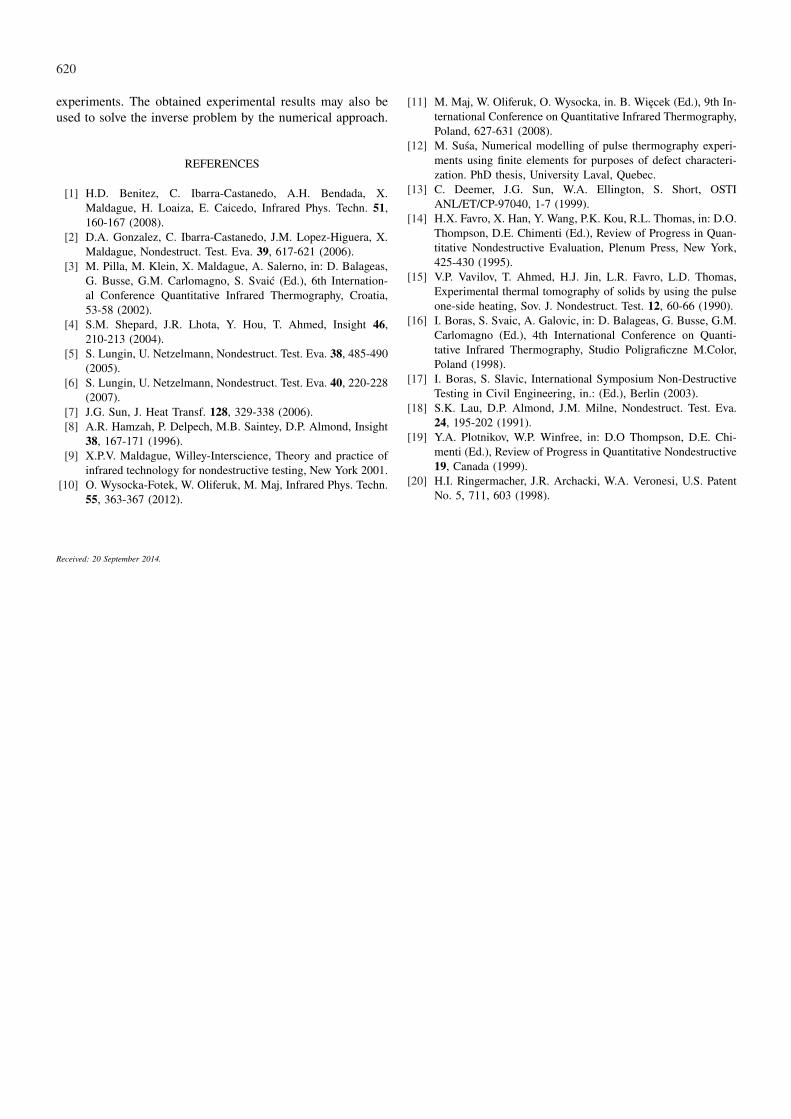
Using presented method the diameters φ for all square andrectangular defects were determined. Then, using obtained val-ues of φ the depths of the square and rectangular defects weredetermined from calibration relations for defects of circularcross-sections. An example of depth estimation for rectangulardefect (15 mm×5 mm) is presented in Fig 11.
Fig. 11. An example of determination the depth of rectangular defect(15 mm×5 mm) on the basis of calibration relations obtained fordefects of circular cross-section
For this defect, the obtained value of φ is equal to6.68 mm and the time corresponding to maximum of thermalcontrast is equal to 0.57 s. The depth estimated on the basisof calibration relations is equal to 0.5 mm. As it is seen, theobtained value is equal to real defect depth (Fig. 11). Resultsfor all defects compared with real defect depths are presentedin Table 2. It is seen that presented approach gives satisfactoryresults.
TABLE 2Comparison of reconstructed defect depths with real ones
Reconstructeddefect size[mm×mm]
ϕ
[mm]
Reconstructeddefect depth[mm×mm]
Defect depth[mm]
4.4×4.4 4.53 0.30 0.3
4.4×4.5 4.54 0.60 0.6
4.5×4.4 4.54 0.90 0.9
4.5×4.3 4.45 1.35 1.2
4.3×4.3 4.43 1.50 1.3
4.3×4.3 4.43 1.75 1.5
8.8×8.8 9.06 0.37 0.3
8.9×8.9 9.17 0.50 0.5
8.9×8.8 9.07 0.90 0.7
8.9×8.9 9.17 1.30 1.0
9.0×9.0 9.27 2.30 2.0
7.5×2.5 3.30 0.25 0.3
7.5×2.6 3.38 0.47 0.6
7.6×2.6 3.40 0.80 0.9
7.45×2.6 3.37 1.39 1.2
– – – 1.5
15.0×5.1 6.68 0.32 0.3
15.0×5.1 6.68 0.50 0.5
14.7×4.7 6.29 0.74 0.7
14.9×5.2 6.74 1.28 1.0
14.8×4.9 6.47 2.53 2.0
4. Conclusion
Determination of the defect depth from calibration rela-tions (dependences between defect depth and time of thermalcontrast maximum for given defect diameters) require to knowthe defect size and the time of thermal contrast maximum. Thesize of square and rectangular defects was assessed from thesurface distribution of the time derivative of the temperature.
To use the calibration relations obtained for defects ofcircular cross-section to estimate the depth of defects of dif-ferent cross-section should be introduce the quantity takinginto account the cross-section shape of defect. This quantityis defined as: √
2(r2 + R2) · r
R.
The values of φ has been used to reconstruct the depth ofsquare and rectangular defect with different sizes and depthsmade in austenitic steel plate. It has been shown that presentedapproach gives satisfactory results.
The presented experimental results may be helpful to val-idate numerical heat transfer model for specimen with sub-surface defects. Such numerical models allow to analysis ofdefects of different geometries and orientations with respect tothe tested surface without performing expensive and laborious
620
experiments. The obtained experimental results may also beused to solve the inverse problem by the numerical approach.
REFERENCES
[1] H.D. Benitez, C. Ibarra-Castanedo, A.H. Bendada, X.Maldague, H. Loaiza, E. Caicedo, Infrared Phys. Techn. 51,160-167 (2008).
[2] D.A. Gonzalez, C. Ibarra-Castanedo, J.M. Lopez-Higuera, X.Maldague, Nondestruct. Test. Eva. 39, 617-621 (2006).
[3] M. Pilla, M. Klein, X. Maldague, A. Salerno, in: D. Balageas,G. Busse, G.M. Carlomagno, S. Svaić (Ed.), 6th Internation-al Conference Quantitative Infrared Thermography, Croatia,53-58 (2002).
[4] S.M. Shepard, J.R. Lhota, Y. Hou, T. Ahmed, Insight 46,210-213 (2004).
[5] S. Lungin, U. Netzelmann, Nondestruct. Test. Eva. 38, 485-490(2005).
[6] S. Lungin, U. Netzelmann, Nondestruct. Test. Eva. 40, 220-228(2007).
[7] J.G. Sun, J. Heat Transf. 128, 329-338 (2006).[8] A.R. Hamzah, P. Delpech, M.B. Saintey, D.P. Almond, Insight
38, 167-171 (1996).[9] X.P.V. Maldague, Willey-Interscience, Theory and practice of
infrared technology for nondestructive testing, New York 2001.[10] O. Wysocka-Fotek, W. Oliferuk, M. Maj, Infrared Phys. Techn.
55, 363-367 (2012).
[11] M. Maj, W. Oliferuk, O. Wysocka, in. B. Więcek (Ed.), 9th In-ternational Conference on Quantitative Infrared Thermography,Poland, 627-631 (2008).
[12] M. Suśa, Numerical modelling of pulse thermography experi-ments using finite elements for purposes of defect characteri-zation. PhD thesis, University Laval, Quebec.
[13] C. Deemer, J.G. Sun, W.A. Ellington, S. Short, OSTIANL/ET/CP-97040, 1-7 (1999).
[14] H.X. Favro, X. Han, Y. Wang, P.K. Kou, R.L. Thomas, in: D.O.Thompson, D.E. Chimenti (Ed.), Review of Progress in Quan-titative Nondestructive Evaluation, Plenum Press, New York,425-430 (1995).
[15] V.P. Vavilov, T. Ahmed, H.J. Jin, L.R. Favro, L.D. Thomas,Experimental thermal tomography of solids by using the pulseone-side heating, Sov. J. Nondestruct. Test. 12, 60-66 (1990).
[16] I. Boras, S. Svaic, A. Galovic, in: D. Balageas, G. Busse, G.M.Carlomagno (Ed.), 4th International Conference on Quanti-tative Infrared Thermography, Studio Poligraficzne M.Color,Poland (1998).
[17] I. Boras, S. Slavic, International Symposium Non-DestructiveTesting in Civil Engineering, in.: (Ed.), Berlin (2003).
[18] S.K. Lau, D.P. Almond, J.M. Milne, Nondestruct. Test. Eva.24, 195-202 (1991).
[19] Y.A. Plotnikov, W.P. Winfree, in: D.O Thompson, D.E. Chi-menti (Ed.), Review of Progress in Quantitative Nondestructive19, Canada (1999).
[20] H.I. Ringermacher, J.R. Archacki, W.A. Veronesi, U.S. PatentNo. 5, 711, 603 (1998).
Received: 20 September 2014.