Embed Size (px)
Citation preview

Using Stock-Specific Thermal Physiology to Simulate In-River Mortality of Fraser River
Sockeye Salmon
by
Jennifer Carter
B.Sc., University of Colorado, 2010
Research Project Submitted In Partial Fulfillment of the
Requirements for the Degree of
Master of Resource Management
in the
School of Resource and Environmental Management
Faculty of Environment
Report No. 587
©Jennifer Carter 2014
SIMON FRASER UNIVERSITY
Spring 2014
ii
Approval
Name: Jennifer Carter
Degree: Master of Resource Management
Report No. 587
Title of Project: Using Stock-Specific Thermal Physiology to Simulate In-River Mortality of Fraser River Sockeye Salmon
Examining Committee: Chair: Annika Putt MRM Candidate
Sean Cox Senior Supervisor Professor
David Patterson Supervisor Adjunct Professor
Date Defended:
January 27, 2014
iii
Partial Copyright Licence
iv
Abstract
Annual estimates of mortality en-route to spawning grounds for certain
populations of Fraser River Sockeye salmon (Oncorhynchus nerka) can routinely exceed
50% posing challenges for harvest management and salmon conservation. High
estimates of mortality are also correlated with high migration temperatures, suggesting
temperature is one of the main factors. However, these estimates of apparent mortality
are uncertain as they currently rely on discrepancies between up-river spawning ground
estimates and lower river escapement estimates adjusting for estimates of in-river catch.
Therefore, applying thermal physiology may serve as a tool to explain the potential
contribution temperature-related mortality could have in calculating annual apparent
mortality estimates for specific populations. I incorporated short- and long-term mortality
functions based on population-specific aerobic scope temperature thresholds and an
aggregate accumulation of degree-days threshold to a simulation model to estimate en-
route mortality associated with temperature exposure for six Fraser River Sockeye
salmon populations: Early Stuart, Gates Creek, Stellako, Chilko, and Weaver Creek. I
compared simulated temperature based mortality rates to apparent mortality estimates
(i.e., difference between estimates) and tested model sensitivity to uncertainty in short-
and long-term LD50, arrival timing, and movement rate parameters. Results show that
high temperature is likely a key driver of large en-route loss as both simulated mortality
and apparent mortality estimates were higher in warmer years and lower in cooler years.
I attribute the simulated mortality rates being generally lower than apparent mortality to
the role that other sources of mortality can play (e.g., source error, high discharge).
Simulated mortality rates were most sensitive to the short-term LD50 parameter,
followed by the long-term LD50 and arrival timing parameters. However, simulated
mortality rates were not sensitive to changes in movement rates. The model can explain
temperature-related population-specific differences in apparent mortality between co-
migrating populations (e.g., up to 80% absolute differences between Chilko and co-
migrating populations) and provides evidence that these differences are driven by
differences in aerobic scope. My results could inform managers of the relative
importance of key parameters (short- and long-term mortality, and arrival timing) when
estimating population-specific temperature-related mortality.

v
Keywords: en route mortality; Fraser River; run size adjustment; salmon; simulation; thermal physiology

vi
Acknowledgements
I have many people to thank for the development, inter-workings, and external
support of this project. First and foremost, I would like to thank my supervisory
committee, Sean Cox and David Patterson, who have offered their knowledge,
guidance, and support throughout this project. I am equally thankful to Aaron Springford,
who developed the FRSMM, modified the model specifically for this project, and had the
patience to answer all of my frantic email questions and coding problems. I am
especially thankful to Erika Eliason, who provided all of her data and expertise on
salmon physiology. Thanks to Mike Lapointe, Steve Latham, and Merran Hague at the
Pacific Salmon Foundation for their expert advice and data that were essential to this
project. Thank you Cameron Noble at LGL limited and the Environmental Watch team at
DFO for data. Thank you Eduardo Martins for your input and expertise on salmon
mortality and physiology. I want to thank the Fisheries Group at R.E.M. for challenging
me and providing me with a wealth of knowledge and support, the Southern Endowment
Fund, Mitacs, and ACCASP. I am particularly grateful to my friends and family, who have
provided the upmost support and encouragement throughout my degree.

vii
Table of Contents
Approval............................................................................................................................. ii Partial Copyright Licence .................................................................................................. iii Abstract............................................................................................................................. iv Acknowledgements...........................................................................................................vi Table of Contents............................................................................................................. vii List of Tables................................................................................................................... viii List of Figures ................................................................................................................... ix List of Acronyms ................................................................................................................x Glossary............................................................................................................................xi
1. Introduction ............................................................................................................ 1
2. Methods .................................................................................................................. 6 2.1 Overview .................................................................................................................. 6 2.2 Data ......................................................................................................................... 6 2.3 Model ....................................................................................................................... 7 2.4 Movement ................................................................................................................ 8 2.5 Mortality ................................................................................................................. 10 2.6 Sensitivity Analysis ................................................................................................ 12
3. Results .................................................................................................................. 15
4. Discussion ............................................................................................................ 18
5. Conclusion............................................................................................................ 22
Reference....................................................................................................................... 31
Appendices.................................................................................................................... 35 Appendix A. Sensitivity analysis ............................................................................. 36 Appendix B. Sensitivity Analysis Comparison for all stocks ................................... 40

viii
List of Tables
Table 1 Range of simulated en-route mortality rate estimates for all stocks for years 2002 to 2006. Changes >10% are indicated by bold font. .................. 24

ix
List of Figures
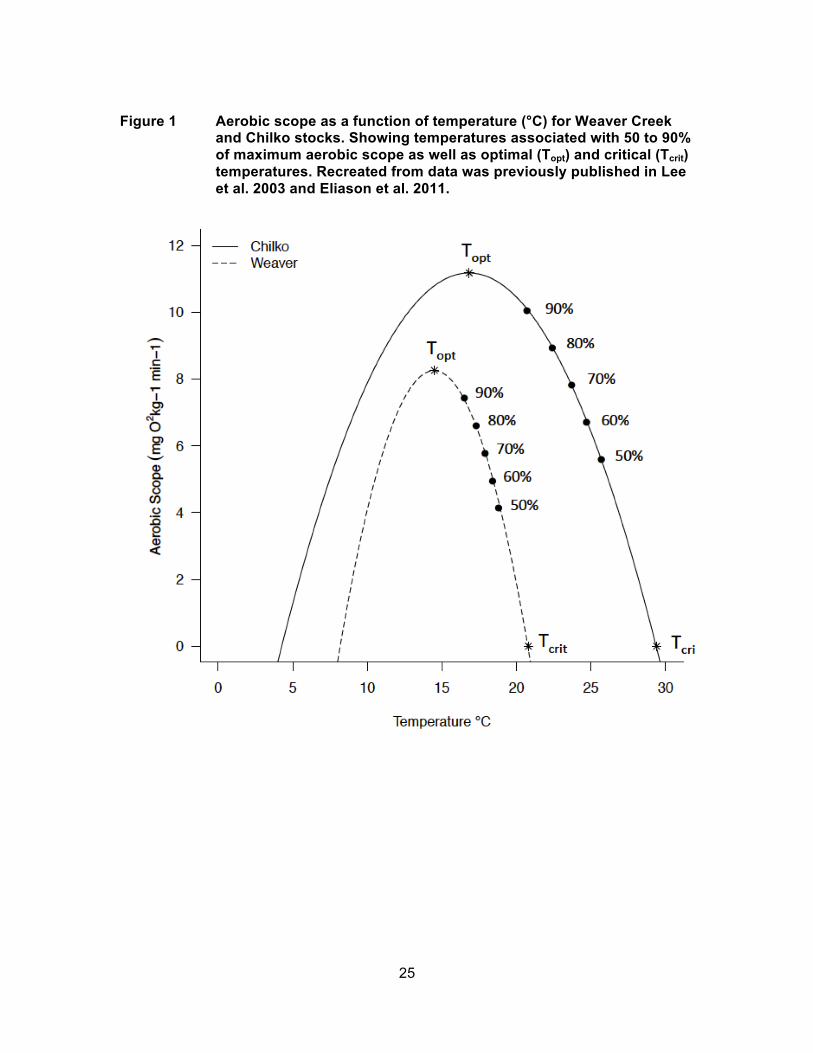
Figure 1 Aerobic scope as a function of temperature (°C) for Weaver Creek and Chilko stocks. Showing temperatures associated with 50 to 90% of maximum aerobic scope as well as optimal (Topt) and critical (Tcrit) temperatures. Recreated from data was previously published in Lee et al. 2003 and Eliason et al. 2011................................................................ 25
Figure 2 Fraser River map used in FRSMM simulation. Reach boundaries (●) are 10 km apart. ............................................................................................ 26
Figure 3 Short-term LD50 parameter sensitivity test, base case (●), and DBEr (○) mortality rate estimates for Quesnel and Stellako stocks for years 2002 to 2006. Base case short-term parameter mean was varied with temperatures associated with 50 (▽), 60 (▼), 70 (△), and 90% (▲) of maximum aerobic scope. .............................................................................. 27
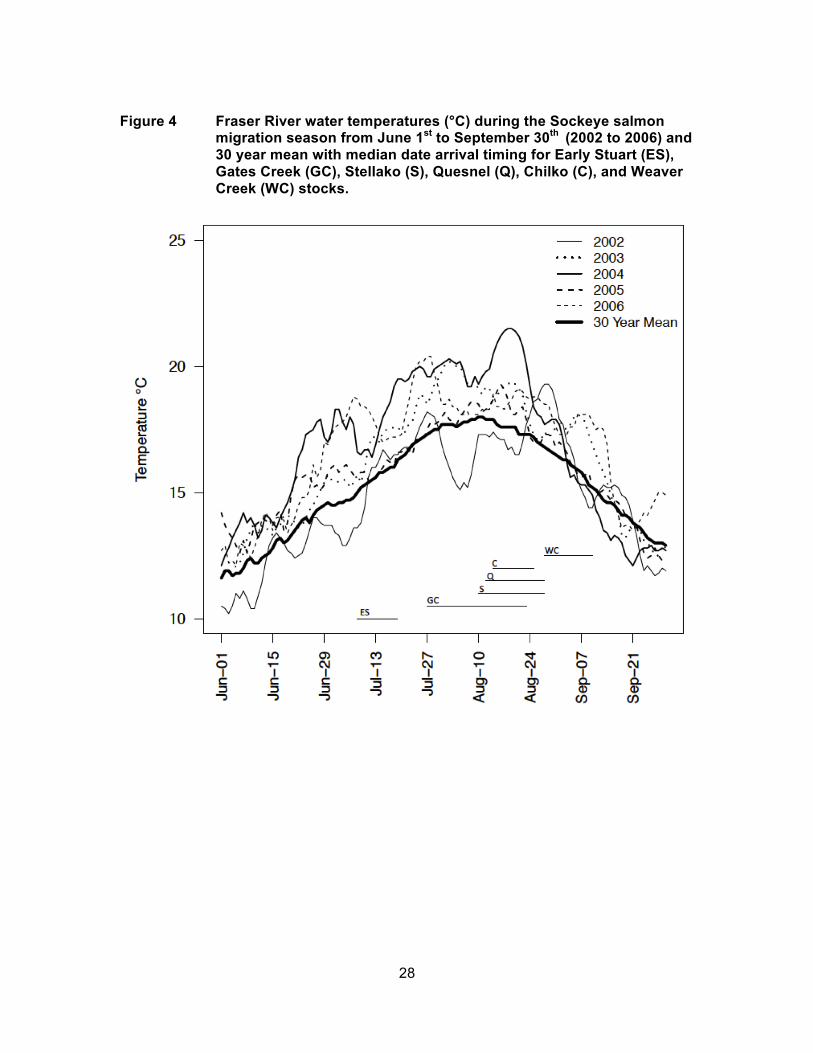
Figure 4 Fraser River water temperatures (°C) during the Sockeye salmon migration season from June 1st to September 30th (2002 to 2006) and 30 year mean with median date arrival timing for Early Stuart (ES), Gates Creek (GC), Stellako (S), Quesnel (Q), Chilko (C), and Weaver Creek (WC) stocks. ....................................................................................... 28
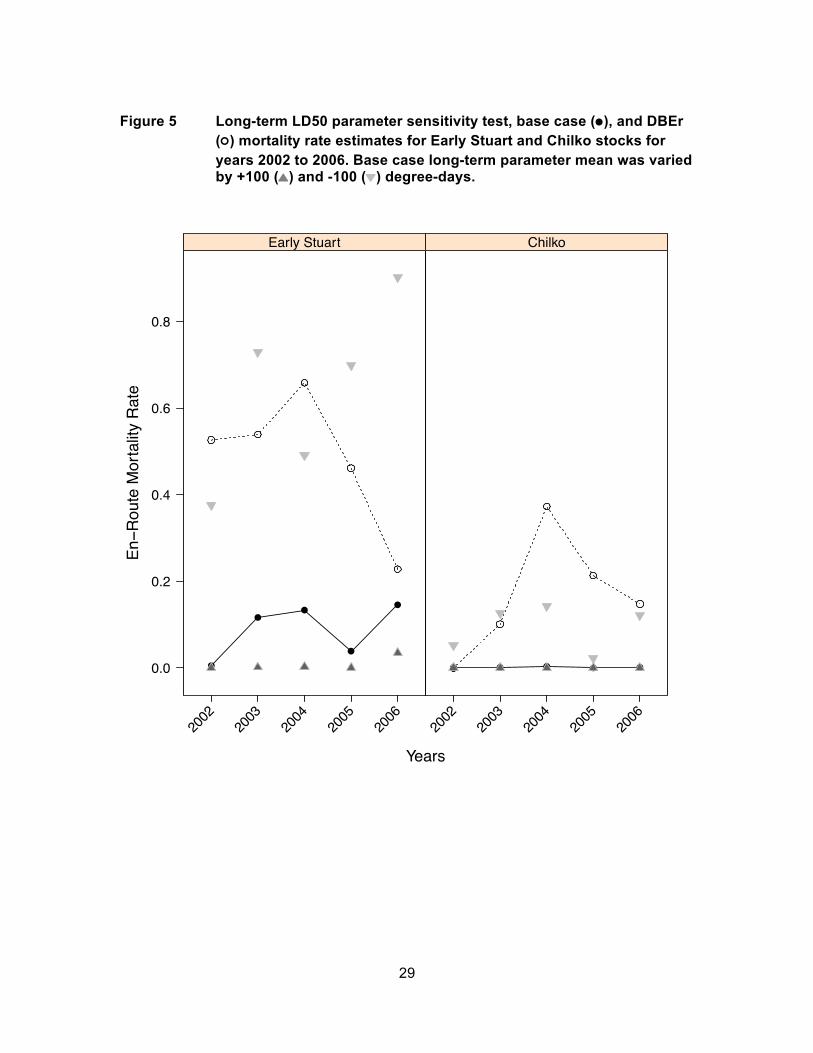
Figure 5 Long-term LD50 parameter sensitivity test, base case (●), and DBEr (○) mortality rate estimates for Early Stuart and Chilko stocks for years 2002 to 2006. Base case long-term parameter mean was varied by +100 (▲) and -100 (▼) degree-days. ....................................................... 29
Figure 6 Arrival timing parameter sensitivity test, base case (●), and DBEr (○) mortality rate estimates for Gates and Weaver Creek stocks for years 2002 to 2006. Base case arrival timing parameter mean was varied by +2 days (△) , -2 days (▽), +4 days (▲), and -4 days (▼). ............................ 30

x
List of Acronyms
DFO Department of Fisheries and Oceans
DBE Difference Between Estimates
DBEr Difference Between Estimates Mortality Rate
RSA Run Size Adjustments
FRSMM Fraser River Sockeye Management Model
BOTS Bots are Objects for Tracking States

xi
Glossary
Accumulated Degree Days Cumulative temperature (°C) experienced by adult salmon during a set period of time (e.g., freshwater migration).
Aerobic Scope The difference between routine and maximum oxygen consumption. Used to determine the total amount of energy available for activity for a given temperature.
En-Route Mortality Mortality occurring while migrating from lower river (e.g., Mission) to their spawning grounds. Also termed “in-river loss”.
Escapement Fish that escape past a fishery.
Run Timing Group Stocks of Fraser River Sockeye salmon that initiate upstream spawning migration at similar times. Run timing groups are: Early Stuart that migrate in June/July, Early Summer that migrate in July/August, Summer that migrate in August, and Later Summer that migrate in September/October.
1
1. Introduction
Water temperature affects many aspects of fish physiology (Fry 1971, Moore and
Wohlschlag 1971), making this taxa particularly susceptible to climate warming (Ficke et
al. 2007). High water temperature has been identified as a key factor contributing to
increased mortality in several fish species leading to conservation concerns and
economic losses to fisheries (La and Cooke 2011, Cooke et al. 2012). Estimating the
background rate of natural mortality is already a difficult challenge for fisheries scientists
(Hewitt and Hoenig 2005, Patterson et al. 2007b, La and Cooke 2011) and the
compounding effect of climate change will only exacerbate this problem. Thermal
physiology, which provides a mechanistic understanding of how mortality varies with
water temperature, could be an important tool for assessing the future of climate-
sensitive fisheries (Pörtner and Knust 2007, Hague et al. 2011).
Global increases in river temperatures as a result of recent climate warming
(Petersen and Kitchell 2001, Webb and Nobilis 2007) may threaten salmon migration
success (Goniea et al. 2006, Keefer et al. 2008). High river temperatures affect the
physiology of migrating salmon which in turn affects short-term (0 to 96hrs; e.g., Farrell
et al. 2008) and long term survival (> 96hrs; e.g., Wagner et al. 2005, Crossin et al.
2008). A key physiological process affecting short-term survival is aerobic collapse,
which occurs when the total amount of aerobic energy available is insufficient to support
activity demands. Aerobic scope, which estimates the total amount of energy available
for activity, has a dome-shaped relationship to temperature that peaks at an optimum
(Topt) and is zero at very low and very high temperatures (Tcrit) (Figure 1). Short-term
exposure to high temperatures near Tcrit causes aerobic collapse where anaerobic
metabolism can completely replace aerobic metabolism leading to oxidative stress and
possible immediate death (Pörtner and Knust 2007, Keefer et al. 2008, Steinhausen et
al. 2008). Long-term survival can also be negatively affected by continued exposure to
suboptimal temperatures above Topt that elevate routine metabolic costs causing further
depletion of limited energy reserves (Rand et al. 2006, Pörtner and Knust 2007).
2
In addition to temperature-metabolism relationships, long-term exposure to warm
water increases the rate of parasite development and disease incidence in fish, which
may cause pre-mature death of migrating anadromous salmon (Wagner et al. 2005,
Bradford et al. 2010). Accumulated degree-days can be used to estimate prolonged
exposure to warm water and therefore be applied as an indicator of long-term survival
probability for adult salmon returning to freshwater (Hinch et al. 2012).
This study derives mortality rates as a function of long-term and short-term
physiological responses to temperature and applies them in a simulation model of Fraser
River Sockeye salmon (Oncorhynchus nerka) upstream migration to determine whether
apparent mortality can be explained by thermal physiology for this economically
important and culturally iconic species for use in management. The Fraser River
Sockeye salmon fishery is well suited to test the application of a stock-specific thermal
physiology models to management because of the following factors: high population
diversity; extensive water temperature data; specific knowledge of Sockeye salmon
physiology in relation to migration biology; and an immediate need for an alternative
mortality estimation approach. The Fraser River is home to seven Pacific salmon
species and is one of the largest producers of wild salmon in the world (Northcote and
Larkin 1989), with Sockeye salmon being the most commercially valuable (Cooke et al.
2004). Managers of Sockeye salmon fisheries are rethinking how they manage the 19
major stocks because large in-river losses have been attributed to rising river
temperatures (Hague and Patterson 2008). Average peak summer water temperatures
in the Fraser River have increased by more than 1.5°C over the past 40 years (Patterson
et al. 2007a). As a consequence of these elevated temperatures and changes to river
entry timing, all Fraser River Sockeye salmon stocks now experience river temperatures
that routinely exceed 19°C at some point during their upriver migration and some stocks
experience 4°C warmer average water temperatures than historical levels (Patterson et
al. 2007b). For instance, in 2004, extremely high river temperatures were a key factor
explaining the estimated 57% overall en-route mortality rate of Fraser River Sockeye
salmon (2004 Southern Salmon Fishery Post-Season Review Committee 2005, Mathes
et al. 2010). However, there was considerable variability in mortality estimates (10% to
95%) among stocks, highlighting the need to match stock-specific physiology with
thermal exposure to more accurately estimate migration mortality.

3
Fraser River Sockeye salmon consist of multiple stocks with different migration
challenges and physiological adaptations to historic migration conditions (Farrell et al.
2008, Eliason et al. 2011). Migration challenges range considerably among stocks, and
include: average river temperatures from 9°C to 22°C; arrival times to the Fraser River
estuary from June to November; upriver migration distances from 50 km to 1,250 km;
Fraser River discharge from 2,000 m3 s-1 to 10,000 m3 s-1 ; and elevation gains from 10 m
to 1,200 m. Stocks that migrate over greater distances and elevations tend to have
larger heart muscle and broader aerobic scope, which provides an ability to withstand a
wider range of temperatures (Eliason et al. 2011). In addition, temperature levels
corresponding to aerobic scope parameters, Topt and Tcrit, are closely associated with
historical average temperatures experienced by each stock (Lee et al. 2003, Eliason et
al. 2011). Estimating the variation in migration survival associated with temperature for
an individual fish will depend primarily on the upriver migration distance to spawning
grounds (i.e., exposure time) and the timing of upstream migration, where the latter
influences water temperatures that fish experience (Cooke et al. 2004, Eliason et al.
2011).
Matching thermal exposure to stock-specific thermal tolerances could be used to
forecast stock-specific migration mortality over the migration season (e.g., Farrell et al.
2008, Hague et al. 2011). Stock-specific aerobic scope relationships with temperature
have yet to be formally incorporated into management practices, but they have been
used as a biological rationale for predictive methods of (a) estimating en-route mortality
during the fishing season (Hague and Patterson 2008, Macdonald et al. 2010); (b)
modelling future en-route losses under alternative climate scenarios (Hague et al. 2011);
and (c) comparing mortality estimates derived from escapement discrepancies with
tagging loss estimates for individual stocks (Farrell et al. 2008). For Fraser River
Sockeye salmon, managers estimate migration mortality for each major stock at the end
of each season. In general, managers estimate one in-river loss rate for each group of
stocks that initiate spawning migration at similar times (i.e., a run timing group), even
though physiology and thermal tolerances vary substantially among stocks. It is likely
that one loss rate applied to an aggregate of stocks will result in biased estimates of total
mortality for individual stocks. A finer scale mortality estimation approach integrating

4
what we know about stock-specific physiological processes into current methods may
therefore improve mortality rate estimates.
Measured discrepancies between abundance estimates obtained at lower and
upper river sites, after accounting for catch, are the most consistent indication of in-river
losses for Fraser River Sockeye salmon (Cummings et al. 2011), but can be
supplemented by additional tagging data (e.g., Keefer et al. 2008) and/or carcass
observations (e.g., Patterson et al. 2007b). Specifically, managers use the difference
between estimates (DBE) of escapement past Mission (lower river escapement
estimate) and spawning grounds, after accounting for in-river catch estimates, as a
proxy for en-route loss from environmental conditions (Macdonald et al. 2010). Since
1992, the DBE influences how many fish will be added back to catch and spawning
escapement to generate total run size for a given year and stock, termed run size
adjustment (RSA). However, there are many uncertainties associated with catch,
Mission escapement, and spawning ground escapement estimates (Xie et al. 2002,
Schubert & Houtman 2007, Patterson et al. 2007b) and little biological evidence exists
as to whether DBEs are realistic given the temperatures experienced by fish (Macdonald
et al. 2010). In particular, fish kill investigations rarely found any direct physical evidence
to rationalize the large DBEs that were observed in eight out of fifteen years (Patterson
et al. 2007b). Error in any or all contributions to DBEs can propagate through to total run
size and stock productivity estimates, which can in turn lead to over- or under-estimation
of fishery reference points. Temperature-mortality relationships based on physiological
tolerance could provide a more scientifically defensible method of estimating in-river
mortality that is independent of the DBE method.
The objective of this study is to determine whether apparent mortality can be
explained by thermal physiology. I used a simulation model as a mechanistic approach
for estimating in-river mortality from thermal exposure. Run reconstruction models have
been used to quantitatively assess in-season salmon fisheries for over 60 years (Starr
and Hilborn 1988). Run reconstructions simulate fish migration through space and time
to generate forecasts of stock-specific catch, exploitation rates, and arrival and spawning
ground abundances (Starr and Hilborn 1988, English et al. 2007). Using a run
reconstruction model enables me to incorporate cumulative exposure to temperature in
addition to movement rates and migration timing to generate direct en-route mortality

5
rate estimates. Mortality functions are based on short-term (aerobic scope) and long-
term (degree-days) temperature thresholds for six Sockeye salmon stocks. I conducted
a sensitivity test to determine how parameter uncertainty associated with mortality
functions, arrival timing, and movement rates influences mortality rate estimates. I
compared simulated mortality rates to DBEs to assess whether thermal physiology is
consistent with the current method for estimating apparent mortality.
6
2. Methods
2.1 Overview
I used a spatially explicit individual-based model to simulate in-river mortality of
migrating adult Sockeye salmon as a function of cumulative exposure to typical Fraser
River temperatures occurring during the migration season. The Fraser River Salmon
Management Model (FRSMM) is calibrated for six co-migrating Sockeye salmon stocks
based on arrival timing and abundance at Mission, B.C. and migration rates estimated
from tagging studies. Temperature-related mortality is based on a weighted combination
of simulated short- and long-term exposure of fish to historical temperatures in the
Fraser River. The following sections describe the input data, simulation model structure,
and sensitivity analyses I used to determine whether apparent mortality can be
explained by thermal physiology.
2.2 Data
I chose six major Sockeye salmon stocks: Early Stuart, Gates Creek, Quesnel,
Chilko, Stellako, and Weaver Creek (Figure 2), based on the reliability and availability of
migration data as well as representation of at least one stock from each of the major run-
timing groups: Early Stuart (June/July), Early Summer (July/August), Summer (mid to
late August), and Late Summer (August/September). Arrival timing to Mission, total run
size, spawning ground escapement, and DBEs for each stock were provided by the
Pacific Salmon Commission. Mean daily temperature from thirteen stations along the
Fraser River were obtained from Fisheries and Oceans Canada (Patterson et al. 2007a,
Hague & Patterson 2008). Migration rates for each run-timing group were estimated from
radio telemetry studies in 2002 and 2006 (English et al. 2005, 2007).
7
Arrival timing was determined from the median date at which 50% of the
migrating stock passed the hydroaccoustic counting facility at Mission, BC (Hague and
Patterson 2008). Due to the complexity of modeling actual arrival timing distributions,
which contain spikes in abundance, distributions were smoothed using a normal
distribution. I used the central 90% range of arrival timing at Mission to fit the normal
curve and excluded the outer 10% to avoid uncertain stock compositions resulting from
overlap between run-timing groups. However, I used the total number of fish that passed
Mission for a given stock and year to compute the arrival timing distribution.
The model simulates a mortality rate, whereas the DBE is an absolute mortality
estimate. For comparison purposes, I converted DBEs to a mortality rate by dividing the
DBE by the total run size estimated to have passed Mission, hereafter referred to as
DBEr.
Eq. (1)
where is the DBEr, is the DBE, and is the total run size at Mission.
2.3 Model
The FRSMM framework simulates co-migrating populations in the presence of
varying environmental conditions that could affect movement rates and survival. Effects
on the movement and survival of the populations as they migrate can be both acute and
cumulative as explained below. The simulation model represents migrating salmon both
as aggregated groups, or "boxcars", and as individual fish. The boxcar component
represents the majority of migrating salmon from each stock as aggregate abundances
Ni,t,r grouped by stock (i), time step (t) and reach (r). This component tracks aggregate
stock movement along a one-dimensional spatial grid comprised of a sequence of 10 km
reaches. A 12-hour time step was chosen because Sockeye salmon typically migrate 25
km to 30 km per day in the Fraser River (English et al. 2005). Stock-specific arrival
timing distributions at Mission, movement, and in-river mortality are used to simulate
changes in aggregate abundances as salmon migrate upriver from Mission to spawning
grounds. Empirical temperature data derived from temperature monitoring stations are
used to simulate realistic river conditions experienced by migrating salmon. Migration is

8
initiated at Mission because I focus only on in-river mortality even though some natural
mortality may occur during inshore migration through marine areas.
The individual-based component of the model uses a random subsample of
individual fish from each stock to track cumulative impacts of environmental stressors on
survival rates. These individuals are referred to using the recursive acronym BOTS (i.e.,
BOTS are Objects for Tracking States). Individual BOTS move according to the same
rules (described below) as the boxcar component of the stock to which they belong. The
number of BOTS present in each stock is actively managed throughout a simulation to
ensure that (i) BOTS are present in the same locations and time steps as the aggregate
boxcar component, thus accurately reflecting conditions experienced by the total stock,
and (ii) the number of BOTS is sufficient to provide statistically reliable values for
survival and migration rates at each location and time step. BOTS and aggregate boxcar
stocks therefore experience similar mortality risks, but when BOTS die, new BOTS are
spawned from the survivors as needed to meet the above conditions (i–ii). Thus,
cumulative environmental experiences of the stock are maintained in the BOTS and vice
versa.
2.4 Movement
The movement sub-model of FRSMM simulates fish movement through a
sequence of stock-specific reaches R, ranging from Mission, B.C. to the spawning
grounds. For clarity reasons, the movement model is described using a single stock
migrating over time steps t = 1,2,...T and reaches r = 1,2,...R. The stochastic movement
model in FRSMM involves a set of transition probabilities representing
the proportion of fish present in location i at time t-1 that move to 9 possible new
locations in one time step. There are no restrictions on except the usual probability
constraints, namely that all and . The latter constraint forces all fish to
remain somewhere within the pre-defined set of reaches.
9
Transition probabilities are computed using an ordered multinomial logit model
defined by an average response variable , where the covariates X could include
factors such as discharge and temperature that may affect movement rates, and a
spread parameter , which determines the range of reaches over which fish will
spread around the expected reach. In the simulations presented here, I assume a
constant movement that is independent of environmental conditions as well as a spread
that is constant among stocks. Simulating movement involves two steps: (1) generate
the transition probabilities based on the average movement rate and spread, and (2)
randomly distribute the total number of fish present in reach r at time t to a new set of
reaches at time t+1. The procedure is slightly different for individual BOTS as explained
below.
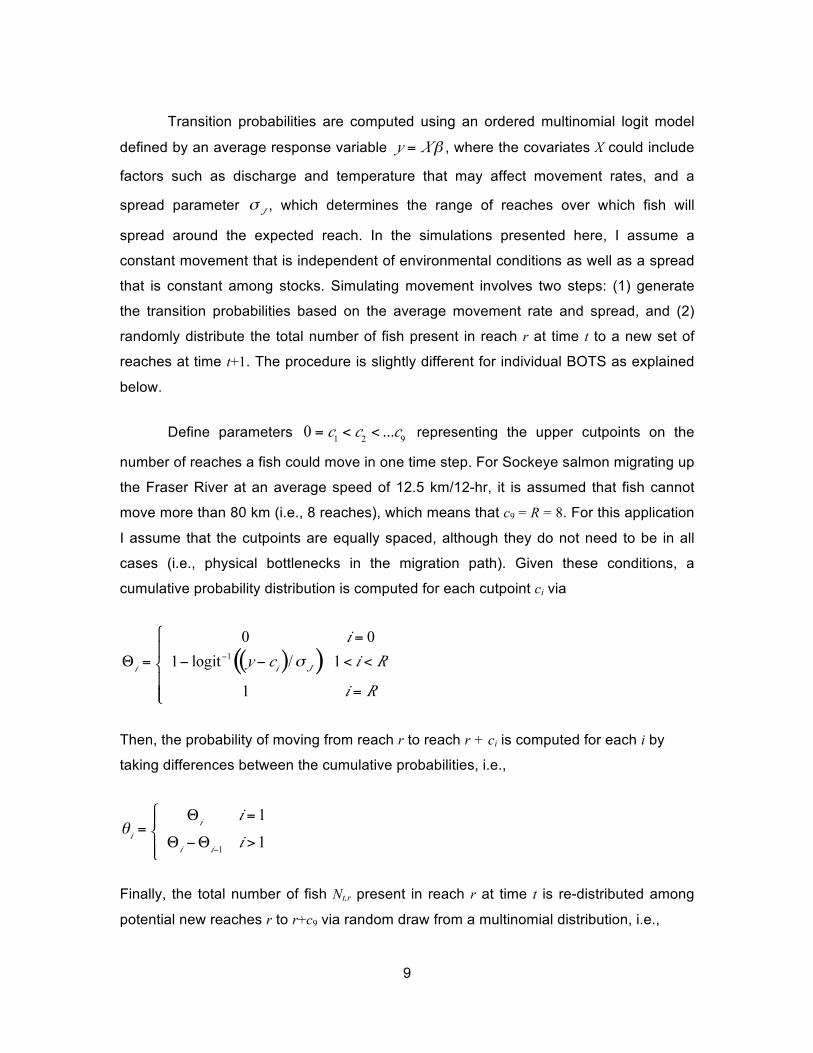
Define parameters representing the upper cutpoints on the
number of reaches a fish could move in one time step. For Sockeye salmon migrating up
the Fraser River at an average speed of 12.5 km/12-hr, it is assumed that fish cannot
move more than 80 km (i.e., 8 reaches), which means that c9 = R = 8. For this application
I assume that the cutpoints are equally spaced, although they do not need to be in all
cases (i.e., physical bottlenecks in the migration path). Given these conditions, a
cumulative probability distribution is computed for each cutpoint ci via
Then, the probability of moving from reach r to reach r + ci is computed for each i by
taking differences between the cumulative probabilities, i.e.,
Finally, the total number of fish Nt,r present in reach r at time t is re-distributed among
potential new reaches r to r+c9 via random draw from a multinomial distribution, i.e.,

10
where the notation r:r+c9 indicates a vector of reaches from r to r+c9. BOTS move
according to the same rules except that the multinomial draw uses a sample size of 1.
2.5 Mortality
Temperature-related mortality risks are captured by BOTS because these
simulated individuals keep track of the environmental conditions experienced during
migration through all reaches between Mission, B.C. and the spawning grounds. The in-
river mortality component of the simulation model attempts to represent short-term
mortality risk caused by both aerobic collapse and long-term mortality risk from
cumulative exposure to high temperature. The probability of death at each timestep is
calculated independently for each exposure type and for each BOT as a function of
accumulated temperatures over the most recent 96-hour interval (short-term) as well as
the entire duration (long-term) in fresh water. A cumulative normal distribution function is
used to represent a sigmoidal dose-response relationship between the probability of
death and each temperature variable. For short-term temperature mortality risk, this
model has the form
Eq. (2)
where is short-term (S) average temperature at time t computed over the eight
most recent 12-hour time steps for BOT b, i is the stock to which BOT belongs, and
are the mean and standard deviation, respectively, of the cumulative normal
distribution for stock i. Parameter represents the temperature at which there is a
11
50% probability of death and determines the steepness of the function around this
point. The model for long-term temperature-related mortality is identical to Eq. (2) except
substituting long-term accumulated temperature over the entire freshwater
residency and long-term temperature parameters . For the remainder of this
paper, I refer to parameters as the short-term and long-term LD50 values,
respectively.
Short-term LD50’s are based on stock-specific maximum aerobic scope
temperature threshold values (Figure 1) (Lee et al. 2003, Eliason et al. 2011). Although it
is uncertain what aerobic scope level is needed to complete migration, temperatures
reducing aerobic scope to 80% of its maximum can impact survival (Farrell et al. 2008,
E. Eliason, personal communication, January 18, 2013,). Therefore, I set the base case
short-term LD50 to reflect stock-specific temperature thresholds associated with 80% of
maximum aerobic scope. I tested the uncertainty in the value by changing the short-term
LD50 to reflect temperature thresholds associated with 50% to 90% of maximum aerobic
scope in 10% intervals. Standard deviations used in sensitivity analyses were
approximated using the 95% confidence intervals of the stock-specific aerobic scope
curves (Eliason et al. 2011).
Limited information on the mechanisms by which long-term temperature
exposure impact migration success focus on the negative impacts of an extended
freshwater residency and high water temperature (Hinch et al. 2012). Accumulated
degree-days greater than 500 to 600 can result in severe development of the disease P.
minibicornis, which could impact migration success (Wagner et al. 2005). Therefore, I
assigned the base case long-term LD50 to 600 degree-days across all stocks with
standard deviation parameters equal to 50 degree-days (Wagner et al. 2005). I tested
the sensitivity of simulated mortality rates to the uncertainty in the degree-day threshold
by changing the long-term LD50 to 500 and 700 degree-days.
I assumed that the two individual sources of temperature-related mortality affect
total mortality rates of each BOT in the following additive way,

12
Eq. (3)
where the weight w = 0.50. These BOT-specific mortality rates are used in Bernoulli
draws to determine whether each BOT present in reach r (reach is implicit in the above
formulas) lives or dies at time t. BOTS that die are removed from the model along with
their accumulated temperature histories. The mean mortality rate and variance
computed over all BOTS for stock i at time t in reach r are then used to determine
the overall mortality of the aggregate boxcar stock at each time step and reach. Method-
of-moment estimators are used to calculate Beta distribution function shape and scale
parameters for each stock, time step, and reach, i.e.,
Eq. (4)
Eq. (5)
Finally, the total number of fish dying from temperature-related mortality is randomly
drawn from a Beta-Binomial distribution, i.e.,
Eq. (6)
2.6 Sensitivity Analysis
I performed sensitivity analyses to evaluate how uncertainties in model
parameter values associated with Mission arrival timing, movement rates, and LD50
values can each affect simulated mortality rates.
Sockeye salmon arrival timing to Mission can greatly impact the types of
environmental conditions that fish encounter, and thus migration survival (Cooke et al.
2004, Hague and Patterson 2008, Donaldson et al. 2010). Uncertainties in arrival timing
exist because a mixture of stocks arrive together at Mission counting facilities, and errors
13
ranging from 0 to 4 days can occur in assigning acoustic signals to specific Sockeye
salmon stocks (M. Lapointe, personal communication, March, 11, 2013). The baseline
simulation model uses stock-specific mean arrival timing determined from the date at
which 50% of the run passes Mission counting facility, while sensitivity tests assess
mortality rate estimates as a result of +/- 2 days and +/- 4 days around this date.
Movement rates may affect mortality estimates because slower movement could
decrease survival as a result of increased temperature exposure (Keefer et al. 2008).
Error in residence time estimates may exist in the model because movement rates are
only based on two years of tagging data and are generated for run-timing groups, not by
stock (English et al. 2005, 2007). I used run-timing group movement rate estimates as
the base case for the movement rate parameter for each stock and sensitivity analyses
to test how +/- 25% and +/-50% changes in these rates might affect mortality. For
example, if a run-timing group had a movement rate of 25 km/day moving from Mission
to Hope and I increased it by 25%, then the new movement rate would be 31.25 km/day
from Mission to Hope. Each subsequent movement rate would change throughout the
migration by that same percentage.
Aerobic scope is used to set the short-term LD50 temperature threshold, which
directly affects mortality estimates by defining how sensitive fish are to a given
temperature range. Uncertainties in aerobic scope estimates arise from (1) biological
aerobic scope measurements that only include fish that have survived experiments, and
(2) fish may be less sensitive to temperature exposure than what tagging and lab studies
indicate because of added handling and confinement stress (Martins et al. 2012,
Robinson et al. 2013). Furthermore, the maximum aerobic scope needed to complete
migration probably varies among individuals (Farrell et al. 2008, Hague et al. 2011). In a
sensitivity analysis, I tested temperatures associated with 50% to 90% of maximum
aerobic scope in 10% intervals relative to the base case, which was 80% of maximum
aerobic scope. Setting the short-term LD50 parameter to reflect temperatures associated
with 90% of maximum aerobic scope may address issue (1) having only data from fish
that survived. What is believed to be 90% of maximum aerobic scope may be lower due
to fish that did not survive experiments and were not accounted for when calculating
scope curves. Alternatively, setting the short-term LD50 to reflect less than 80% of
maximum aerobic scope may address issue (2) the possibility that wild fish are less
14
sensitive because of experimental stress. This is because temperatures reflecting less
than 80% of maximum aerobic scope suggest less sensitivity to temperature.
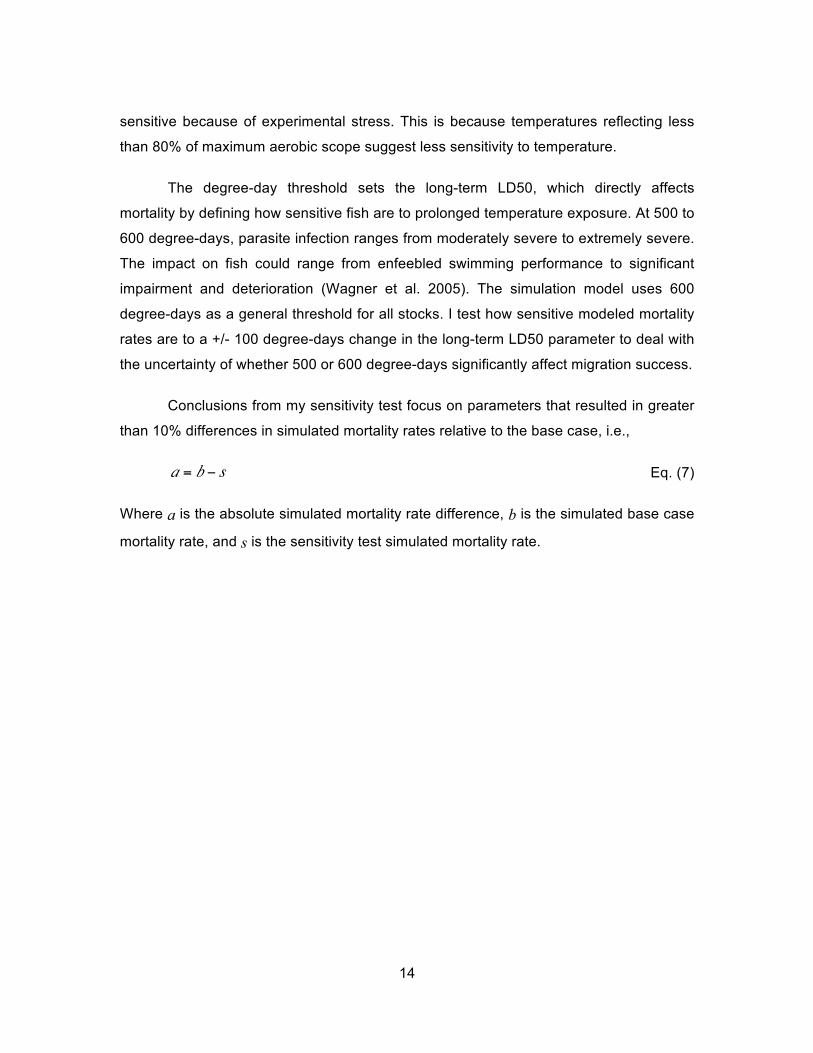
The degree-day threshold sets the long-term LD50, which directly affects
mortality by defining how sensitive fish are to prolonged temperature exposure. At 500 to
600 degree-days, parasite infection ranges from moderately severe to extremely severe.
The impact on fish could range from enfeebled swimming performance to significant
impairment and deterioration (Wagner et al. 2005). The simulation model uses 600
degree-days as a general threshold for all stocks. I test how sensitive modeled mortality
rates are to a +/- 100 degree-days change in the long-term LD50 parameter to deal with
the uncertainty of whether 500 or 600 degree-days significantly affect migration success.
Conclusions from my sensitivity test focus on parameters that resulted in greater
than 10% differences in simulated mortality rates relative to the base case, i.e.,
Eq. (7)
Where a is the absolute simulated mortality rate difference, b is the simulated base case
mortality rate, and s is the sensitivity test simulated mortality rate.

15
3. Results
Simulated annual en-route mortality rates under the base case model were lower,
on average, than the DBEr for most stocks and years. The only exceptions were Stellako
and Quesnel stocks for 2004 when the model estimated an additional 49% and 21%
mortality rate than the DBEr for Stellako and Quesnel, respectively (Figure 3). Although
on different scales, the simulated mortality rates and DBEr estimates followed a similar
pattern across years and stocks. For example, both DBEr and simulated mortality rates
indicated substantially higher en-route mortality during 2003 and 2004, which were
warmer years than average (Figure 4) and lower mortality during 2002, which was a cool
year. For warm years, both the simulated mortality rates and DBEr estimates were as
high as 86% and 66%, respectively, and in cool years were nearly zero. Chilko at the
base scenario did not track the DBEr because all of the simulated temperature-related
mortality rates were equal to zero for all years.
Stock-specific absolute differences in simulated mortality rates were as high as
80% in the Summer run-timing group. For example, both Stellako and Quesnel stocks
experienced 84% and 86% simulated mortality rates, respectively, for 2004 when Fraser
River temperatures reached a maximum of 21.5°C, and were above 20°C for 10
consecutive days during their migration in August. Chilko Sockeye salmon also migrate
in August, but their simulated mortality rate was zero.
Simulated mortality rates were non-linearly related to the short-term LD50
parameter for all stocks. Increasing the short-term LD50 from the temperature at 80% of
maximum aerobic scope (base case) to 70% (i.e., increasing the temperature threshold)
decreased the simulated mortality rate from 18% to zero for Stellako and 11% to zero for
Quesnel for 2003 (Figure 3). Alternatively, decreasing the short-term LD50 from the
temperature at 80% of maximum aerobic scope to 90% (i.e., decreasing the temperature
threshold) increased the simulated mortality rate from 18% to 89% for Stellako and from
11% to 80% for Quesnel Sockeye salmon for 2003. For 2004 migration conditions,

16
increasing the short-term LD50 from the temperature at 80% to 70% of maximum
aerobic scope decreased the simulated en-route mortality rate from 84% to 54% for
Stellako and from 86% to 43% for Quesnel Sockeye salmon. Decreasing the short-term
LD50 from the temperature at 80% to 90% of maximum aerobic scope increased
mortality from 84% to 92% for Stellako and 86% to 93% for Quesnel Sockeye salmon for
2004.
Simulated en-route mortality rates were less sensitive to the long-term LD50 than
short-term LD50 parameter. Decreasing the long-term LD50 from 600 degree-days
(base case) to 500 degree-days increased the simulated mortality rate for Early Stuart
from 15% to 90% for 2006, which was the warmest year experienced by Early run-timing
groups, and from zero to 12% for Chilko Sockeye salmon for 2006 (Figure 5). Increasing
the long-term LD50 parameter from 600 degree-days to 700 degree-days decreased the
simulated mortality rate from 15% to 3% for Early Stuart for 2006, but did not change
mortality for Chilko because it was already zero for all years under the base case long-
term LD50 parameter. Decreasing the long-term LD50 from 600 degree-days to 500
degree-days for 2002, which was the coolest year, increased mortality from 1% to 38%
for Early Stuart, but only from zero to 5% for Chilko Sockeye salmon. Increasing the
long-term LD50 to 700 degree-days did not affect mortality for either stock because it
was already zero under the base case long-term LD50 parameter. Early Stuart Sockeye
salmon accumulated high degree-days even in cool years making them most sensitive to
changes in the long-term LD50 parameter.
Simulated mortality rates for Weaver Creek Sockeye salmon were sensitive to
changes in arrival timing over more years than any other stock. Based on environmental
conditions for 2002 and 2004, a 4-day earlier or 4-day later shift in arrival timing
compared to the base case caused 9% to 12% absolute increases and 11% to 13%
absolute decreases in mortality, respectively. Mortality only increased with later arrival
timing for 2003 conditions when the simulated mortality rate increased from 37% to 51%
with arrival timing two days later (Figure 6). For 2003, the base case arrival timing
(August 28th) was the earliest of all years for Weaver Creek Sockeye salmon, and
corresponded to the seasonal increase in river temperatures rather than the seasonal
decrease that normally occurs at this time (Figure 4). Early arrivals therefore
17
experienced higher temperatures and higher simulated mortality rates whereas later
arrivals experienced cooler temperatures and lower mortality, on average.
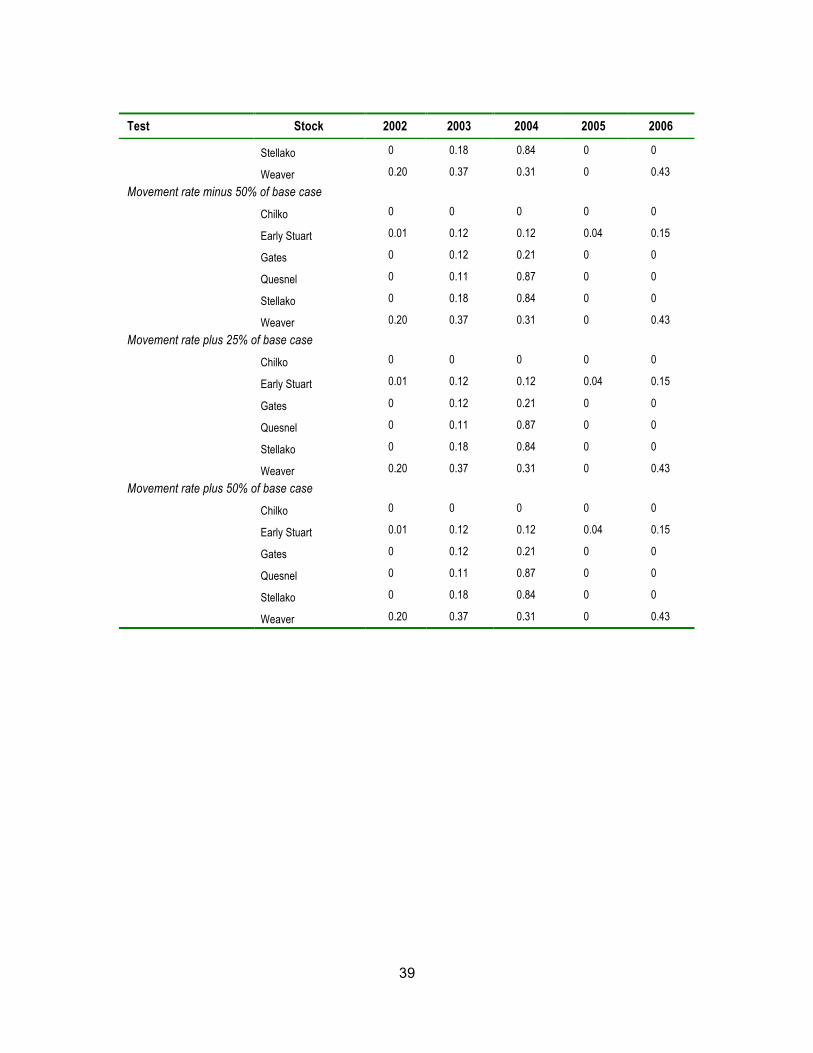
Simulated mortality rates differed only slightly from the base case with changes in
movement rates (Table 1). The absolute difference in simulated mortality rates was less
than approximately 3% when decreasing or increasing the movement rate by 25% and
50%.

18
4. Discussion
My results suggest that thermal physiology may explain some portion of apparent
upriver migration mortality of Fraser River Sockeye salmon. Simulated mortality rates
based on thermal physiology were consistent with empirical studies showing a negative
impact of high temperatures (Cooke et al. 2004, Crossin et al. 2008, Farrell et al. 2008)
as well as stock-specific differences in migration survival (Hague et al. 2011, Eliason et
al. 2011). The overall mortality ascribed to thermal physiology was on average less than
DBE values currently used to estimate in-river loss, suggesting that factors other than
temperature also drive loss estimates. I show that short- and long-term temperature-
related mortality combined with arrival timing variation could be important determinants
of stock-specific simulated mortality rates. In contrast, variations in migration rates were
not influential, and therefore knowing the relative importance of different parameters can
guide the utility of future research and provide advice to management on the likely
impact of key factors on estimating temperature-related mortality.
Similar patterns between simulated en-route mortality rates and DBEr values
suggest that temperature is one of the key factors contributing to en-route mortality;
however, some portion of apparent mortality could arise from alternative causes. For
instance, discharge related mortality is not accounted for in the model, but could account
for observed losses of Early Stuart migrants because they arrive during the spring
freshet. High discharge forces migrating salmon to use more energy than normal, which
reduces energy reserves and can cause higher mortality (Macdonald et al. 2000, Rand
et al. 2006). Indirect fishing related mortality is also not represented in the model.
Salmon that have encountered fishing gear, or are caught and released, experience
physical abrasion and stress from entanglement in nets, human handling, and air
exposure (Gale et al. 2013). Furthermore, the combined effect of indirect fishing related
mortality and temperature could account for large portions of apparent losses during
warm temperature years (Wilkie et al. 1996, Davis 2002, Martins et al. 2011).

19
Temperature-related mortality alone cannot explain all en-route mortality; therefore, the
values represented here are likely the minimum associated with direct thermal exposure.
Variation in stock-specific mortality among Fraser River Sockeye salmon
populations could result from differences in thermal exposure (Macdonald 2000),
variations in swimming behaviour (Macdonald et al. 2010), and more recently
temperature dependent differences in aerobic scope capacity (Martins et al. 2011).
Altering migration timing, and therefore thermal exposure, did result in variations in
survival within stocks. However, in my simulations, co-migrating stocks exposed to
similar environmental conditions still had distinct differences in mortality, suggesting
thermal exposure risk alone is not sufficient to explain the documented mortality
discrepancies for co-migrating stocks (see Macdonald et al. 2010). Similarly, altering
swimming behaviour by adjusting migration rates did not change simulated mortality
rates. However, my results are consistent with stock-specific differences in aerobic
scope, using the short-term mortality function (i.e., higher short-term LD50 parameter),
being sufficient to simulate the levels of mortality differences observed in empirical
studies. For example, Martins et al. (2011) reported that Chilko mortality rates are 32%
and 42% lower than Stellako and Quesnel, respectively, using empirical tagging data.
Herein, Chilko Sockeye salmon experienced much lower simulated temperature-related
mortality to Stellako and Quesnel Sockeye salmon despite all three stocks migrating at
the same time and experiencing similar temperature exposure. My work provides a link
between stock-specific thermal physiology (Eliason et al. 2011) and realistic thermal
exposure profiles to generate plausible patterns in mortality among co-migrating stocks.
The non-linear response of simulated mortality rates to changes in the short-term
LD50 results from the steepness of the short-term mortality function and temperature
exposure. With a steep slope, each shift in the short-term LD50 results in a large change
in the probability of mortality. The slope of the sigmoidal mortality function around the
short-term LD50 is set by the confidence intervals around the aerobic scope curve.
Confidence intervals decrease, on average, with increasing percent of maximum aerobic
scope, indicating that more individual variability in aerobic scope occurs at high
temperatures (i.e., low percent of maximum aerobic scope); however, this also steepens
the slope around the short-term LD50 parameter with increasing percent of maximum
aerobic scope. As the short-term LD50 parameter is shifted to reflect +10% change of
20
maximum aerobic scope (i.e., decreasing temperature thresholds), the steeper slope
causes larger changes in mortality, whereas a -10% change (i.e., increasing temperature
thresholds) reduces the mortality function steepness, causing weaker sensitivity to
temperature. However, for 2004, temperatures were consistently high; therefore,
decreasing temperature sensitivity caused a small increase in mortality because cooler
temperatures occurred less frequently. Alternatively, for 2003, decreasing temperature
sensitivity caused large increases in mortality because, in addition to a steeper mortality
slope, lower temperatures were experienced more frequently.
Simulated mortality rates were generally insensitive to the long-term LD50
mortality parameter, which may be attributed to underestimating long-term temperature
exposure by assuming continual migration. Simulated mortality rates for Early Stuart
were sensitive to changes in the long-term LD50, whereas mortality rates for Weaver
Creek Sockeye salmon were insensitive. However, Early Stuart and Weaver Creek
Sockeye salmon exhibit similar severity of disease infection as a result of freshwater
residency time despite large differences in migration distance (~1200 km versus ~120
km) (Jones et al. 2003). Weaver Creek Sockeye salmon exhibit migration delays where
they remain in one location for an extended period of time rather than continuously
moving as predicted by the simulation model. Some fish exhibit such holding behaviour
in the Fraser River instead of Harrison Lake, which prolongs their freshwater residency
time in warm water and can increase their accumulation of degree-days. For example,
tagged Weaver Creek Sockeye salmon holding in the warmer Fraser River, instead of
the cooler Harrison Lake, accumulated over 800 degree-days and never made it to
spawning grounds (Mathes et al. 2010). Ignoring holding behaviour in the simulation
model can underestimate the long-term thermal exposure for short distant migrants like
Weaver Creek Sockeye salmon because what takes three days to migrate in the
simulation model takes about a month in reality. For instance, tagging data suggest
around 70% mortality in warm years (Farrell et al. 2008, Mathes et al. 2010), which is
consistent with the DBEr, and is probably a result of high temperature over a long
duration of freshwater residency time (Farrell et al. 2008, Mathes et al. 2010).
Weaver Creek Sockeye salmon are most sensitive to arrival timing because they
arrive in early fall while river temperatures are declining. I found that early arrivals
experience higher mortality because they enter the river when temperatures are high,

21
and later arrivals experience lower mortality because they enter the river after
temperatures have cooled, on average. For example, for 2004 all tagged early arriving
Weaver Creek Sockeye salmon experienced temperatures near their critical threshold
(>19.5°C) and none survived to reach spawning grounds (Farrell et al. 2008). Also,
Weaver stocks have been entering the river two to six weeks earlier than historical
timing, which can cause substantially higher mortality rates (Cooke et al. 2004, Lapointe
et al. 2004, English et al. 2005). The abnormal arrival timing and associated exposure to
higher temperatures than experienced historically, combined with a lower aerobic scope
threshold, makes Weaver Creek Sockeye salmon vulnerable to temperature-related
mortality.
Simulated mortality rates were not sensitive to Sockeye salmon movement rates,
which may be because the model assumes that total mortality risk is an additive and
equally weighted combination of short- and long-term temperature exposure. An equally
weighted, additive mortality function was chosen arbitrarily because no data exist to
support more complex models. Such as assumption may limit the models’ ability to
simulate long-term mortality because, when short-term mortality is absent, the highest
long-term mortality rate is 50%. Slower movement rates prolong simulated migration
times, thereby increasing the accumulated degree-days and risk of death by long-term
temperature-related mortality. However, while the probability of long-term mortality
increases with migration time, the probability of short-term mortality decreases, at least
near the end of the migration, because temperatures are generally cooler near the
spawning grounds. Future research involving FRSMM should investigate a competing
risks of death model that could consider short-term and long-term mortality as mutually
exclusive events. This type of mortality function affects the baseline mortality in a
multiplicative way, which has been shown to produce higher estimates of mortality than
the additive approach (Rosalba et al. 2007). However, using a competing risks of death
function is not appropriate when independence between cause of death cannot be safely
assumed and incidence of multiple causes of mortality is high (Rosalba et al. 2007).
Although not mutually exclusive, the incidence of both types mortality causing death is
rare given that short-term temperature exposure affects fish early in migration and long-
term nearer to spawning grounds.

22
5. Conclusion
Fraser River Sockeye salmon managers are faced with the task of determining
an adjustment to total run-size based on estimates of in-river mortality for 19 major
stocks as part of post-season management analyses. My analysis could augment
current tools, such as DBE estimates and expert opinion, used to weight the evidence
before deciding on RSA values for the six stocks I examined. Two advantages of using
thermal physiology relationships to provide an estimate of in-river mortality are (1) that
en-route mortality estimates are independent of DBEs and the associated problems with
source data errors (Macdonald et al. 2010) and (2) they account for stock-specific
differences in temperature-related mortality risk.
The FRSMM modeling approach allowed me to examine the relative importance
of key parameters (short- and long-term mortality, migration rate, arrival timing) when
estimating stock-specific temperature-related mortality, as well as to identify the
importance of future research in this area. I show that short-term mortality is probably
most important to simulated en-route mortality rates, followed by the long-term mortality,
and arrival timing. Simulated mortality rates were sensitive to changes in the short-term
mortality function for all stocks, suggesting research effort should primarily be focused
on establishing stock-specific critical temperature thresholds at 96 hours. The mortality
rates were less sensitive to long-term mortality, but more effort should be placed on
establishing stock-specific degree-day accumulation thresholds given that I used a
general Fraser Sockeye salmon data set to for this parameter. As such, the simulated
mortality rate should be considered a minimum estimate for Weaver Creek because of
the holding behaviour that is not reflected in the model. Efforts to improve arrival timing
information would be beneficial given how sensitive mortality rates were to changes in
migration timing of all stocks. The sensitivity to arrival date is really a surrogate for
exposure to different temperatures with changes in entry date. This suggests that post-
season determinations of RSA that focus on temperature exposure will need to be

23
cognizant that subtle changes in thermal profiles matched to migration profiles can result
in large differences in mortality.
Understanding how elevated water temperatures will impact Sockeye salmon
migration survival becomes increasingly important for conservation and management as
future scenarios of climate change show continued alterations to river temperatures.
Hydrological models for the Fraser River predict 2°C to 4°C average warming of peak
summer water temperatures over the next few decades (Morrison et al. 2002, Ferrari
2008) and a tripling of the number of days water temperatures will exceed 19 °C by the
end of the 21st century (Hague et al. 2011). As river temperatures increase, so does the
need to adopt a method for estimating the impact on migration success that is based on
thermal physiology. Currently, indicators of en-route mortality are empirical
measurements containing uncertainty and bias. I show that stock-specific thermal
physiology could be used to provide an additional indicator of Fraser River Sockeye
salmon en-route mortality that may explain portions of loss that occur from high river
temperatures.

24
Table 1 Range of simulated en-route mortality rate estimates for all stocks for years 2002 to 2006. Changes >10% are indicated by bold font.
Range of Mortality Rates
Parameter Range of
Parameter Stock 2002 2003 2004 2005 2006
Early Stuart 0 – 0.01 0.06 – 0.12 0.11 – 0.28 0.03 – 0.04 0.11 – 0.82
Gates Creek 0 0 – 0.65 0 – 0.85 0 0 – 0.01
Stellako 0.10 0 – 0.89 0.07 – 0.92 0 – 0.22 0 – 0.57
Quesnel 0 – 0.34 0 – 0.80 0 – 0.93 0 – 0.07 0 – 0.82
Chilko 0 0 0 – 0.71 0 0
Short-term LD50
50 to 90% maximum aerobic scope including base case (80% max)
Weaver 0.06 – 0.29 0.06 – 0.49 0.14 – 0.36 0 – 0.04 .09 – 0.49
Early Stuart 0 – 0.38 0 – 0.73 0 – 0.49 0 – 0.70 .03 – 0.90 Gates Creek 0 0.12 0.21 0 0
Stellako 0 – 0.01 0.18 – 0.20 0.84 0 0 – 0.10
Quesnel 0 0.10 – 0.11 0.86 0 0
Chilko 0 – 0.05 0 – 0.13 0 – 0.14 0 – 0.02 0 – 0.12
Long-term LD50
500 and 700 degree-days and base case (600 degree-days)
Weaver 0.18 – 0.20 0.37 – 0.39 0.32 – 0.34 0 0.41 – 0.43
Early Stuart 0 – 0.06 0.08 – 0.12 0.10 – 0.14 0.03 – 0.05 0.11 – 0.24
Gates Creek 0 – 0.07 0.08 – 0.12 0.15 – 0.27 0 0 – 0.01
Stellako 0 – 0.06 0.07 – 0.34 0.83 – 0.84 0 0
Quesnel 0 – 0.04 0.05 – 0.20 0.82 – 0.86 0 0
Chilko 0 0 – 0.01 0 – 0.01 0 0
Arrival timing mean
2 days and 4 days +/- Mission arrival
timing (base case)
and base case Weaver 0.07 – 0.32 0.33 – 0.51 0.22 – 0.42 0 – 0.01 0.39 – 0.47
Early Stuart 0.01 0.12 0.12 – 0.13 0.04 0.15
Gates Creek 0 0.12 0.21 0 0
Stellako 0 0.18 0.84 0 0
Movement rate
+/- 25,50% of base case
and base case Quesnel 0 0.11 0.86 – 0.87 0 0
Chilko 0 0 0 0 0
Weaver 0.20 0.37 0.31 – 0.33 0 0.43
25
Figure 1 Aerobic scope as a function of temperature (°C) for Weaver Creek and Chilko stocks. Showing temperatures associated with 50 to 90% of maximum aerobic scope as well as optimal (Topt) and critical (Tcrit) temperatures. Recreated from data was previously published in Lee et al. 2003 and Eliason et al. 2011.

26
Figure 2 Fraser River map used in FRSMM simulation. Reach boundaries (●) are 10 km apart.

27
Figure 3 Short-term LD50 parameter sensitivity test, base case (●), and DBEr (○) mortality rate estimates for Quesnel and Stellako stocks for years 2002 to 2006. Base case short-term parameter mean was varied with temperatures associated with 50 (▽), 60 (▼), 70 (△), and 90% (▲) of maximum aerobic scope.
28
Figure 4 Fraser River water temperatures (°C) during the Sockeye salmon migration season from June 1st to September 30th (2002 to 2006) and 30 year mean with median date arrival timing for Early Stuart (ES), Gates Creek (GC), Stellako (S), Quesnel (Q), Chilko (C), and Weaver Creek (WC) stocks.
29
Figure 5 Long-term LD50 parameter sensitivity test, base case (●), and DBEr (○) mortality rate estimates for Early Stuart and Chilko stocks for years 2002 to 2006. Base case long-term parameter mean was varied by +100 (▲) and -100 (▼) degree-days.

30
Figure 6 Arrival timing parameter sensitivity test, base case (●), and DBEr (○) mortality rate estimates for Gates and Weaver Creek stocks for years 2002 to 2006. Base case arrival timing parameter mean was varied by +2 days (△) , -2 days (▽), +4 days (▲), and -4 days (▼).

31
Reference
Bradford, M.J., Lovy, J., and Patterson, D.A. 2010. Infection of gill and kidney of Fraser River sockeye salmon, Oncorhynchus nerka (Walbaum), by Parvicapsula minibicornis and its effect on host physiology. J. Fish Dis. 33: 769–79.
Cooke, S.J., Hinch, S.G., Farrell, A.P., Lapointe, M.F., Jones, S.R.M., Macdonald, J.S., Patterson, D.A., Healey, M.C., and Van Der Kraak, G. 2004. Abnormal migration timing and high en route mortality of sockeye salmon in the Fraser River, British Columbia. Fisheries 29: 22–33.
Crossin, G.T., Hinch, S.G., Cooke, S.J., Welch, D.W., Patterson, D.A., Jones, S.R.M., Lotto, A.G., Leggatt, R.A., Mathes, M.T., Shrimpton, J.M., Van Der Kraak, G., and Farrell, A.P. 2008. Exposure to high temperature influences the behaviour, physiology, and survival of sockeye salmon during spawning migration. Can. J. Zool. 86: 127–140.
Cummings, J.W., Hague, M.J., Patterson, D.A., and Peterman, R.M. 2011. The impact of different performance measures on model selection for Fraser River sockeye salmon. North Am. J. Fish. Manag. 31: 323–334.
Davis, M.W. 2002. Key principles for understanding fish bycatch discard mortality. Can. J. Fish. Aquat. Sci. 59: 1834–1843.
Donaldson, M.R., Hinch, S.G., Patterson, D.A., Farrell, A.P., Shrimpton, J.M., Miller-Saunders, K.M., Robichaud, D., Hills, J., Hruska, K.A., Hanson, K.C., English, K.K., Van Der Kraak, G., and Cooke, S.J. 2010. Physiological condition differentially affects the behavior and survival of two stocks of sockeye salmon during their freshwater spawning migration. Physiol. Biochem. Zool. 83: 446–58.
Eliason, E.J., Clark, T.D., Hague, M.J., Hanson, L.M., Gallagher, Z.S., Jeffries, K.M., Gale, M.K., Patterson, D.A., Hinch, S.G., and Farrell, A.P. 2011. Differences in thermal tolerance among sockeye salmon stocks. Science 332: 109–12.
English, K., Bailey, R.E., and Robichaud, D. 2007. Assessment of Chinook salmon returns to the Fraser River watershed using run reconstruction techniques, 1982-04. Canadian Science Advisory Scecretariat 2007/020 76p.
English, K.K., Koski, W.R., Sliwinski, C., Blakley, A., Cass, A., and Woodey, J.C. 2005. Migration timing and river survival of late-run Fraser River sockeye salmon estimated using radiotelemetry techniques. Trans. Am. Fish. Soc. 134: 1342–1365.

32
Farrell, A.P., Hinch, S.G., Cooke, S.J., Patterson, D.A., Crossin, G.T., Lapointe, M., and Mathes, M.T. 2008. Pacific salmon in hot water: applying aerobic scope models and biotelemetry to predict the success of spawning migrations. Physiol. Biochem. Zool. 81: 697–709.
Ferrari, M.R. 2008. Mid and high latitude hydroclimatology: A modeling study of the observations and future temperature trends in the Fraser and Lena River basins. PhD dissertation, Rutgers The State University of New Jersey - New Brunswick.
Gale, M.K., Hinch, S.G., and Donaldson, M.R. 2013. The role of temperature in the capture and release of fish. Fish Fish. 14: 1–33.
Gale, M.K., Hinch, S.G., Eliason, E.J., Cooke, S.J., and Patterson, D.A. 2011. Physiological impairment of adult sockeye salmon in fresh water after simulated capture-and-release across a range of temperatures. Fish. Res. 112: 85–95.
Goniea, T.M., Keefer, M.L., Bjornn, T.C., Peery, C.A., Bennett, D.H., and Stuehrenberg, L.C. 2006. Behavioral thermoregulation and slowed migration by adult fall Chinook salmon in esponse to high Columbia River water temperatures. Trans. Am. Fish. Soc. 135: 408–419.
Hague, M., and Patterson, D.A. 2008. Improvements to Environmental Management Adjustment Models: SEF Final Report.
Hague, M.J., Ferrari, M.R., Miller, J.R., Patterson, D.A., Russell, G.L., Farrell, A.P., and Hinch, S.G. 2011. Modelling the future hydroclimatology of the lower Fraser River and its impacts on the spawning migration survival of sockeye salmon. Glob. Chang. Biol. 17: 87–98.
Hinch, S.G., Cooke, S.J., Farrell, A.P., Miller, K.M., Lapointe, M., and Patterson, D.A. 2012. Dead fish swimming: a review of research on the early migration and high premature mortality in adult Fraser River sockeye salmon Oncorhynchus nerka. J. Fish Biol. 81: 576–99.
Keefer, M.L., Peery, C.A., and Heinrich, M.J. 2008. Temperature-mediated en route migration mortality and travel rates of endangered Snake River sockeye salmon. Ecol. Freshw. Fish 17: 136–145.
Lee, C.G., Farrell, A.P., Lotto, A., MacNutt, M.J., Hinch, S.G., and Healey, M.C. 2003. The effect of temperature on swimming performance and oxygen consumption in adult sockeye (Oncorhynchus nerka) and coho (O. kisutch) salmon stocks. J. Exp. Biol. 206: 3239–3251.
Macdonald, J.S., Foreman, M.G.G., Farrell, T., Williams, I.V., Grout, J., Cass, A., Woodey, J.C., Enzenhofer, A., Clarke, W.C., Houtman, R., Donaldson, E.M., and Barnes, D. 2000. The influence of extreme water temperatures on migrating Fraser River sockeye salmon (Oncorhynchus Nerka) during the 1998 spawning season. Can. Tech. Rep. of Fish. and Aquat. Sci. 2326.

33
Macdonald, J.S., Patterson, D.A., Hague, M.J., and Guthrie, I.C. 2010. Modeling the influence of environmental factors on spawning migration mortality for sockeye salmon fisheries management in the Fraser River, British Columbia. Trans. Am. Fish. Soc. 139: 768–782.
Martins, E.G., Hinch, S.G., Patterson, D.A., Hague, M.J., Cooke, S.J., Miller, K.M., Lapointe, M.F., English, K.K., and Farrell, A.P. 2011. Effects of river temperature and climate warming on stock-specific survival of adult migrating Fraser River sockeye salmon (Oncorhynchus nerka). Glob. Chang. Biol. 17: 99–114.
Martins, E.G., Hinch, S.G., Patterson, D.A., Hague, M.J., Cooke, S.J., Miller, K.M., Robichaud, D., English, K.K., Farrell, A.P., and Jonsson, B. 2012. High river temperature reduces survival of sockeye salmon (Oncorhynchus nerka) approaching spawning grounds and exacerbates female mortality. Can. J. Fish. Aquat. Sci. 69: 330–342.
Mathes, M.T., Hinch, S.G., Cooke, S.J., Crossin, G.T., Patterson, D.A., Lotto, A.G., and Farrell, A.P. 2010. Effect of water temperature, timing, physiological condition, and lake thermal refugia on migrating adult Weaver Creek sockeye salmon (Oncorhynchus nerka). Can. J. Fish. Aquat. Sci. 67: 70–84.
Morrison, J., Quick, M.C., and Foreman, M.G. 2002. Climate change in the Fraser River watershed: flow and temperature projections. J. Hydrol. 263: 230–244.
Northcote, T.G., and Larkin, P.A. 1989. The Fraser River: A major salmonine production system.
Patterson, D.A., Macdonald, J.S., Skibo, K.M., Barnes, D.P., Guthrie, I., and Hills, J. 2007a. Reconstructing the summer thermal history for the lower Fraser River, 1941 to 2006, and implications for adult sockeye salmon (Oncorhynchus nerka) spawning migration. Can. Tech. Rep. of Fish. and Aquat. Sci. 2724.
Patterson, D.A., Skibo, K.M., Barnes, D.P., Hills, J.A., and Macdonald, J.S. 2007b. The influence of water temperature on time to surface for adult sockeye salmon carcasses and the limitations in estimating salmon carcasses in the Fraser River, British Columbia. North Am. J. Fish. Manag. 27: 878–884.
Petersen, J.H., and Kitchell, J.F. 2001. Climate regimes and water temperature changes in the Columbia River: bioenergetic implications for predators of juvenile salmon. Can. J. Fish. Aquat. Sci. 58: 1831–1841.
Pörtner, H.O., and Knust, R. 2007. Climate change affects marine fishes through the oxygen limitation of thermal tolerance. Science 315: 95–7.
Rand, P.S., Hinch, S.G., Morrison, J., Foreman, M.G.G., MacNutt, M.J., Macdonald, J.S., Healey, M.C., Farrell, A.P., and Higgs, D.A. 2006. Effects of river discharge, temperature, and future climates on energetics and mortality of adult migrating Fraser River sockeye salmon. Trans. Am. Fish. Soc. 135: 655–667.
34
Robinson, K.A., Hinch, S.G., Gale, M.K., Clark, T.D., Wilson, S.M., Donaldson, M.R., Farrell, A.P., Cooke, S.J., and Patterson, D.A. 2013. Effects of post-capture ventilation assistance and elevated water temperature on sockeye salmon in a simulated capture-and-release experiment. Conserv. Physiol. 1: cot015–cot015.
Rosato, R., Ciccone, G., Bo, S., Pagano, G.F., Merletti, F., and Gregori, D. 2007. Evaluating cardiovascular mortality in type 2 diabetes patients: an analysis based on competing risks Markov chains and additive regression models. J. Eval. Clin. Pract. 13: 422–8.
Schubert, N.D., and Houtman, R. 2007. Estimating the 1998 Fraser River sockeye salmon (Oncorhynchus nerka) escapement , with special reference to the effect of migration stress on estimation accuracy. Can. Tech. Rep. of Fish. and Aquat. Sci. 2732.
Southern Salmon Fishery Post-Season Review Committee, 2004. 2005. 2004 Southern salmon fishery post-season review committee. http://www.dfo-mpo.gc.ca/Library/314601.pdf.
Starr, P., and Hilborn, R. 1988. Reconstruction of harvest rates and stock contribution in gauntlet salmon fisheries: application to British Columbia and Washington sockeye (Oncorhynchus nerka). Can. J. Fish. Aquat. Sci. 45: 2216–2229.
Steinhausen, M.F., Sandblom, E., Eliason, E.J., Verhille, C, and Farrell, A.P. 2008. The effect of acute temperature increases on the cardiorespiratory performance of resting and swimming sockeye salmon (Oncorhynchus nerka). J. Exp. Biol. 211: 3915–26.
Wagner, G.N., Hinch, S.G., Kuchel, L.J., and Lotto, A. 2005. Metabolic rates and swimming performance of adult Fraser River sockeye salmon (Oncorhynchus nerka) after a controlled infection with Parvicapsula minibicornis. Can. J. Fish. Aquat. Sci. 62: 2124–2133.
Webb, B.W., and Nobilis, F. 2007. Long-term changes in river temperature and the influence of climatic and hydrological factors. Hydrol. Sci. J. 52: 74–85.
Wilkie, M.P., Davidson, K., Brobbel, M.A., Kieffer, J.D., Booth, R.K., Bielak, A.T., and Tufts, B.L. 1996. Physiology and survival of wild Atlantic salmon following angling in warm summer waters. Trans. Am. Fish. Soc. 125: 572–580.
Xie, Y., Mulligan, T., Cronkite, G., and Gray, A. 2002. Assessment of potential bias in hydroacoustic estimation of Fraser River sockeye and pink salmon at Mission, BC. Pacif. Sal. Comm. Tech. Rep. 11.

35
Appendices

36
Appendix A. Sensitivity analysis Table A.1 Topt, Tcrit, and temperatures (°C) and standard deviations associated
with 50 to 90% of maximum aerobic scope for each stock.
Stock 50% 60% 70% 80% 90% Topt Tcrit
Weaver 18.9 (0.52) 18.4 (0.40) 17.9 (0.26) 17.3 (0.12) 16.5 (0.03) 14.5 20.8
Gates 23.3 (0.88) 22.6 (1.12) 21.7 (1.04) 20.8 (0.49) 19.5 (0.08) 16.4 26.1
Chilko 25.7 (1.29) 24.7 (0.90) 23.7 (0.50) 22.4 (0.25) 20.7 (0.05) 16.8 29.4
Stellako 21.8 (0.28) 21.3 (0.19) 20.7 (0.19) 20 (0.28) 19 (0.40) 16.8 24.0
Quesnel 22.7 (0.32) 21.9 (0.25) 21 (0.26) 19.9 (0.34) 18.5 (0.17) < 18.5 25.9
Early Stuart 23.3 (0.75) 22.7 (0.40) 21.9 (0.15) 21.1 (0.02) 19.9 (0.05) 17.2 25.8
Table A.2 Median date arrival timing at Mission (base case parameter) for all stocks for years 2002 to 2006.
Stock 2002 2003 2004 2005 2006 Early Stuart 8-Jul 13-Jul 10-Jul 19-Jul 15-Jul
Gates 27-Jul 2-Aug 28-Jul 23-Aug 17-Aug
Stellako 10-Aug 10-Aug 11-Aug 23-Aug 19-Aug
Chilko 17-Aug 14-Aug 15-Aug 25-Aug 19-Aug
Quesnel 17-Aug 16-Aug 12-Aug 28-Aug 20-Aug
Weaver 4-Sep 28-Aug 31-Aug 10-Sep 30-Aug
Table A.3 Simulated en-route mortality rates from all sensitivity tests for all stocks for years 2002 to 2006.
Test Stock 2002 2003 2004 2005 2006 Base case
Chilko 0 0 0 0 0
Early Stuart 0.01 0.12 0.13 0.04 0.15
Gates 0 0.12 0.21 0 0
Quesnel 0 0.11 0.86 0 0
Stellako 0 0.18 0.84 0 0

37
Test Stock 2002 2003 2004 2005 2006
Weaver 0.20 0.37 0.33 0 0.43
Short-term LD50 at 50% Aerobic Scope
Chilko 0 0 0 0 0
Early Stuart 0 0.11 0.12 0.03 0.12
Gates 0 0 0 0 0
Quesnel 0 0 0 0 0
Stellako 0 0 0.07 0 0
Weaver 0.06 0.06 0.14 0 0.09
Short-term LD50 at 60% Aerobic Scope
Chilko 0 0 0 0 0
Early Stuart 0 0.11 0.11 0.04 0.11
Gates 0 0.03 0.05 0 0
Quesnel 0 0 0.02 0 0
Stellako 0 0 0.27 0 0
Weaver 0.12 0.12 0.18 0 0.16
Short-term LD50 at 70% Aerobic Scope
Chilko 0 0 0 0 0
Early Stuart 0 0.06 0.13 0.04 0.11
Gates 0 0.08 0.24 0 0.01
Quesnel 0 0 0.43 0 0
Stellako 0 0 0.54 0 0
Weaver 0.17 0.15 0.24 0 0.28
Short-term LD50 at 90% Aerobic Scope
Chilko 0 0 0.71 0 0
Early Stuart 0.01 0.10 0.28 0.04 0.82
Gates 0 0.65 0.85 0 0.01
Quesnel 0.34 0.8 0.93 0.07 0.82
Stellako 0.10 0.89 0.92 0.22 0.57
Weaver 0.29 0.49 0.36 0.04 0.49
Long-term LD50 at 500 degree-days
Chilko 0.05 0.13 0.14 0.02 0.12
Early Stuart 0.38 0.73 0.49 0.70 0.90
Gates 0 0.12 0.21 0 0
Quesnel 0 0.10 0.86 0 0
Stellako 0.01 0.2 0.84 0 0.01
Weaver 0.18 0.38 0.32 0 0.41
Long-term LD50 at 700 degree-days
Chilko 0 0 0 0 0

38
Test Stock 2002 2003 2004 2005 2006
Early Stuart 0 0 0 0 0.03
Gates 0 0.12 0.21 0 0
Quesnel 0 0.11 0.86 0 0
Stellako 0 0.19 0.84 0 0
Weaver 0.20 0.39 0.34 0 0.42
Median arrival timing minus two days
Chilko 0 0 0 0 0
Early Stuart 0 0.09 0.11 0.04 0.19
Gates 0 0.12 0.18 0 0
Quesnel 0 0.15 0.86 0 0
Stellako 0 0.26 0.83 0 0
Weaver 0.26 0.38 0.35 0 0.44
Median arrival timing minus four days
Chilko 0 0.01 0.01 0 0
Early Stuart 0 0.08 0.10 0.03 0.24
Gates 0 0.11 0.15 0 0.01
Quesnel 0 0.2 0.85 0 0
Stellako 0 0.34 0.83 0 0
Weaver 0.32 0.38 0.42 0.01 0.47
Median arrival timing plus two days
Chilko 0 0 0 0 0
Early Stuart 0.06 0.12 0.13 0.05 0.12
Gates 0.07 0.11 0.24 0 0
Quesnel 0.04 0.17 0.85 0 0
Stellako 0.06 0.25 0.84 0 0
Weaver 0.24 0.51 0.27 0 0.44
Median arrival timing plus four days
Chilko 0 0 0 0 0
Early Stuart 0.01 0.13 0.14 0.05 0.11
Gates 0 0.08 0.27 0 0
Quesnel 0.01 0.05 0.82 0 0
Stellako 0 0.07 0.83 0 0
Weaver 0.07 0.33 0.22 0 0.39
Movement rate minus 25% of base case
Chilko 0 0 0 0 0
Early Stuart 0.01 0.12 0.12 0.04 0.15
Gates 0 0.12 0.21 0 0
Quesnel 0 0.11 0.87 0 0
39
Test Stock 2002 2003 2004 2005 2006
Stellako 0 0.18 0.84 0 0
Weaver 0.20 0.37 0.31 0 0.43
Movement rate minus 50% of base case
Chilko 0 0 0 0 0
Early Stuart 0.01 0.12 0.12 0.04 0.15
Gates 0 0.12 0.21 0 0
Quesnel 0 0.11 0.87 0 0
Stellako 0 0.18 0.84 0 0
Weaver 0.20 0.37 0.31 0 0.43
Movement rate plus 25% of base case
Chilko 0 0 0 0 0
Early Stuart 0.01 0.12 0.12 0.04 0.15
Gates 0 0.12 0.21 0 0
Quesnel 0 0.11 0.87 0 0
Stellako 0 0.18 0.84 0 0
Weaver 0.20 0.37 0.31 0 0.43
Movement rate plus 50% of base case
Chilko 0 0 0 0 0
Early Stuart 0.01 0.12 0.12 0.04 0.15
Gates 0 0.12 0.21 0 0
Quesnel 0 0.11 0.87 0 0
Stellako 0 0.18 0.84 0 0
Weaver 0.20 0.37 0.31 0 0.43

40
Appendix B. Sensitivity Analysis Comparison for all stocks Figure B.1 Short-term LD50 parameter sensitivity test, base case (●), and DBEr
(○) en-route mortality rate estimates for all stocks for years 2002 to 2006. Base case short-term mean was varied with temperatures associated with 50 (▽), 60 (▼), 70 (△), and 90% (▲) of maximum aerobic scope.

41
Figure B.2 Long-term LD50 parameter sensitivity test, base case (●), and DBEr (○) mortality rate estimates for all stocks for years 2002 to 2006. Base case long-term mean was increased by 100 (▲) and decreased by 100 (▼) degree-days.
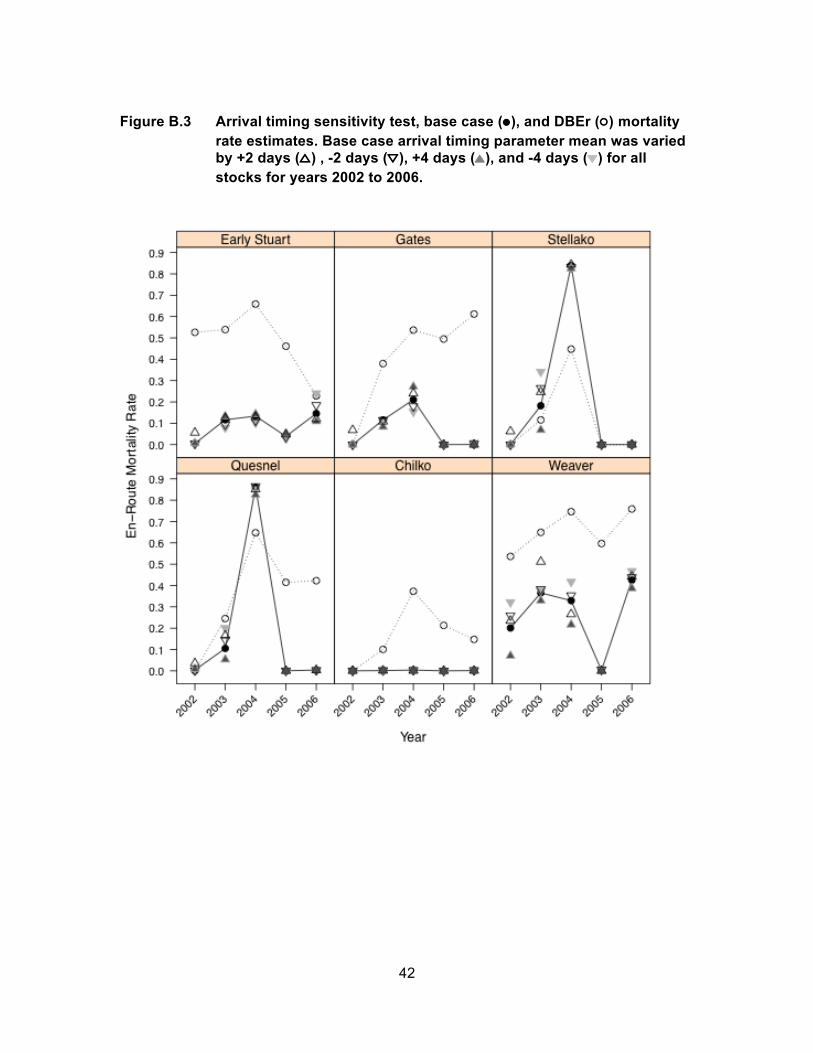
42
Figure B.3 Arrival timing sensitivity test, base case (●), and DBEr (○) mortality rate estimates. Base case arrival timing parameter mean was varied by +2 days (△) , -2 days (▽), +4 days (▲), and -4 days (▼) for all stocks for years 2002 to 2006.

43
Figure B.4 Movement rate sensitivity test, base case (●), and DBEr (○) mortality rate estimates. Base case movement rate parameter was increased by 25% (△) and 50% (▲), and decreased by 25% (▽) and 50% (▼) for all stocks for years 2002 to 2006.