Embed Size (px)
Citation preview
originalni naučni rad
70Bankarstvo, 2016, vol. 45, br. 4
UDK 339.727.22(497.11)330.34(497.11)
doi: 10.5937/bankarstvo1604070K
UTICAJ STRANIH DIREKTNIH
INVESTICIJA NA PRIVREDNI I
DRUŠTVENI RAZVOJ SRBIJE
Radovan KastratovićInstitut za poslovna
istraživanja - MBA
Prevod obezbedio
autor
Rezime
Strane direktne investicije poslednjih decenija dobijaju sve više na značaju u svetu.U ovom radu se istražuju faktori koji utiču na privlačenje stranih direktnih investicija i uticaj stranih direktnih investicija na privredni i društveni razvoj i međunarodnu integraciju Republike Srbije. Analizirani su tokovi, struktura i efekti stranih direktnih investicija uz korišćenje sekundarnih izvora podataka i primenu većeg broja metoda: istorijskog, deskriptivnog, matematičko-statističkih i komparativnog.
Ključne reči: strane direktne investicije, privredni razvoj, društveni razvoj, Srbija
JEL: E22, F21
Primljen: 29.09.2016. Prihvaćen: 03.10.2016.
71 Bankarstvo, 2016, Vol. 45, Issue 4
original scientific paper
THE INFLUENCE OF FOREIGN DIRECT
INVESTMENTS ON ECONOMIC
AND SOCIAL DEVELOPMENT OF
SERBIA
Radovan KastratovićInstitute of Business Research - MBA
Translation provided by the author
Summary
Foreign direct investments have gained prominence in the world during the past several decades. This article explores the factors which have influenced the attraction of foreign direct investments, and the influence of foreign direct investments on economic and social development and the international integration of the Republic of Serbia. Foreign direct investments’ flows, structure and effects have been analyzed, by using secondary sources of data and by applying a number of methods, such as historical, descriptive, mathematical-statistical and comparative method.
Keywords: foreign direct investments, economic development, social development, Serbia
JEL: E22, F21
Received: 29.09.2016 Accepted: 03.10.2016
UDC 339.727.22(497.11)330.34(497.11)
doi: 10.5937/bankarstvo1604070K
Obim i struktura stranih direktnih investicija u Srbiji
Strane direktne investicije danas predstavljaju ključni pokretač međunarodnih ekonomskih integracija. Uz adektvatan okvir ekonomske politike, strane direktne investicije mogu obezbediti finansijsku stabilnost, privredni rast i uopšte prosperitet jednog društva. Organizacija za ekonomsku saradnju i razvoj (Orgnaization for Economic Cooperation and Development - OECD) definiše strane direktne investicije kao investicije gde je cilj matičnog preduzeća, rezidenta jedne zemlje, ostvarivanje trajnog interesa i kontrole nad drugim preduzećem u drugoj zemlji. Trajni interes implicira postojanje dugoročnog odnosa između matičnog preduzeća i filijale u inostranstvu. Konkretno, smatra se da postoji dugoročan odnos između dva preduzeća ukoliko matično preduzeće direktno ili indirektno poseduje najmanje 10% vlasništva nad inostranom filijalom. Strani direktni investitor se može definisati kao rezident jedne zemlje koji pribavlja direktno ili indirektno najmanje 10% vlasništva nad kompanijom koja je rezident druge zemlje. To može biti: pojedinac, grupa pojedinaca, preduzeće, grupa preduzeća, vladina tela, druge organizacije (poput trustova) ili bilo koja kombinacija pomenutih. U slučaju da dva preduzeća unakrsno poseduju 10% i više vlasništva nad drugim, oba se smatraju direktnim investitorom u drugo preduzeće.
Strane direktne investicije obuhvataju tri komponente:• Vlasnički kapital;• Reinvestirane zarade i• Unutarkompanijsko pozajmljivanje.
Vlasnički kapital podrazumeva kupovinu akcija preduzeća u inostrastvu od strane direktnog stranog investitora. Reinvestirane zarade obuhvataju udeo zarade filijale koja pripada direktnom stranom investitoru a koja nije isplaćena u vidu dividendi i nije repatrirana direktnom stranom investitoru. To je deo profita filijale koji se reinvestira. Unutarkompanijske pozajmice se odnose na pozajmice između matične kompanije i njenih inostranih filijala.
Tokom 1990-ih godina, prilivi stranih direktnih investicija u Srbiji su se najvećim delom odvijali putem zajedničkih ulaganja.
Domaća preduzeća su, pored problema sa kojima su se u ovo vreme suočavala, uspela da donekle održe veze sa inostranim preduzećima, uspostavljene tokom 1980-ih godina. Najveći priliv stranih direktnih investicija je u Srbiji tokom 1990-ih godina ostvaren 1997. godine, kada su italijanska kompanija STET - Societa Finanziaria Telefonica otkupila 29% i grčka kompanija Organismos Tilepikinonion Ellados - OTE 20% akcija Telekoma Srbije. Sve do 2001. godine prilivi stranih direktnih investicija u Srbiju su bili na veoma skromnom nivou. Od te godine počinje stalni rast priliva stranih direktnih investicija u zemlji koji traje sve do izbijanja svetske ekonomske krize. U ovom periodu (2001-2007) godišnji prilivi stranih direktnih investicija su se povećavali prosečnom godišnjom stopom od 18,92%.
Ovakvoj promeni dinamike priliva stranih direktnih investicija doprinelo je više faktora. Prvo okončani su ratni sukobi i došlo je do političkih promena, što je doprinelo poboljšanju stabilnosti zemlje i rastu atraktivnosti za strane investitore. Pored toga, izmenjen je model privatizacije i zakonski okvir donošenjem izmena i dopuna Zakona o svojinskoj transformaciji februara 2001. i novog Zakona o privatizaciji juna 2001. godine. Do 2004. godine privatizovano je ukupno 1.382 preduzeća, čime je ostvaren ukupan prihod od približno 1,64 milijardi USD. U istom periodu privučeno je ukupno 2,97 milijardi USD stranih direktnih investicija. Nove izmene Zakona o privatizaciji su donete 2003. i 2005. godine. Njima je dodatno olakšana privatizacija, jer je ukinut uslov da se zaposleni u kompaniji koja se privatizuje slože sa kupoprodajom, smanjen je rok u kome je zabranjeno otpuštanje zaposlenih nakon privatizacije i omogućen je uslovni otpis dugova preduzeća prema državi. Sve ovo je učinilo društvena preduzeća atraktivnijim za strane investitore, što se odrazilo i na povećanje priliva stranih direktnih investicija u narednim godinama. Već 2005. godine ostvaren je rast priliva stranih direktnih investicija od 60,45% u odnosu na prethodnu godinu. Tada je ostvaren ukupan priliv od 1,55 milijardi USD. Tome je najviše doprinela investicija kompanije StarBev iz Češke Republike, koja je te godine preuzela Apatinsku pivaru i investirala ukupno 487 miliona EUR. Takođe u februaru 2005. godine
Kastratović R.Uticaj stranih direktnih investicija na
privredni i društveni razvoj SrbijeBankarstvo, 2016, vol. 45, br. 4 72
The volume and structure of foreign direct investments in Serbia
Foreign direct investments represent an important driver of international economic integrations today. With the appropriate economic policy framework, foreign direct investments may secure financial stability, economic growth and general prosperity of a society. The Organization for Economic Cooperation and Development (OECD) defines foreign direct investments as the investments where the goal of a parent company, which is a resident of one country, is to establish a lasting interest and control over another company in a different country. The term ‘Lasting Influence’ implies the existence of a long term relationship between a parent company and its foreign subsidiary. In particular, it is considered that a long term relationship between two companies exists when a parent company owns, either directly or indirectly, at least 10% of the foreign company’s equity. A foreign direct investor can be defined as a resident of one country who acquires, either directly or indirectly, at least 10% of the equity of a company, which is a resident of another country. The investor can be an individual, a group of individuals, a company, a group of companies, governmental or non-governmental organizations (such as trusts) or any other combination of the aforementioned. In case that two companies own 10% of each other’s equity, both are considered to be a foreign direct investor, investing in one another.
Foreign direct investments consist of three components:• Equity investments;• Reinvested earnings and• Intercompany loans.
Equity investments refer to the purchase of the foreign company’s shares by the foreign direct investor. Reinvested earnings consist of subsidiary earnings which belong too a foreign direct investor, and which are not paid out through dividends or repatriated by the foreign investor. It is the part of profits which the subsidiary reinvests. Intercompany loans refer to the loans between the parent company and its foreign subsidiaries.
During the 1990s, the majority of foreign
direct investments inflows in Serbia have been realized through joint ventures. The Serbian companies have managed to maintain the relationships with foreign companies established during the 1980s to an extent, despite the problems they were facing. The largest inflow of foreign direct investments during the 1990s in Serbia was recorded in 1997, when the Italian company STET - Societa Finanziaria Telefonica purchased 29%, and the Greek company OTE - Organismos Tilepikinonion Ellados purchased 20% of the outstanding shares of Telekom Serbia. Up until 2001 the foreign direct investment inflows in Serbia were modest. That year a consistent growth of foreign direct investment inflows started, and it lasted until the beginning of the World Financial Crisis. During this period (2001-2007) the annual foreign direct investment inflows were increasing steadily at an average annual growth rate of 18.92%.
Such a change in the foreign direct investment inflows dynamic was caused by multiple factors. Firstly, the war conflicts ended and political changes contributed to the improvement of the political stability of Serbia and the attractiveness of the country for foreign direct investors. In addition to that, the model of privatization was changed as well as the legal framework, mainly by enacting the Law on Property Transformation in February 2001, and the new Privatization Law in June 2001. Until 2004 the total of 1382 companies was privatized, which increased the revenues of the Serbian government by 1.64 billion USD. In the same period 2.97 billion USD of foreign direct investments were attracted. The Privatization Law was amended in 2003 and 2005. This has further facilitated privatization by abolishing the condition that company employees must agree to the privatization of the company they work for, the period in which it is forbidden to fire employees after privatization was reduced, and the conditional write off of debts towards the government was made possible. All these changes have made the government-owned enterprises much more attractive to foreign investors, which had an influence on the increase of foreign direct investment inflows in the following years. In 2005 there was a growth of foreign direct investment inflows by 60.45%,
Kastratović R.The influence of foreign direct investments on economic and social development of Serbia
73 Bankarstvo, 2016, Vol. 45, Issue 4

75% akcija Delta banke je preuzela italijanska Banca Intesa, a do avgusta iste godine Banca Intesa je preuzela ukupno 90% akcija. Do 2013. godine ova banka je ukupno investirala 508 miliona EUR u Srbiji. Ubedljivo najveći prilivi stranih direktnih investicija u Srbiji su ostvareni 2006. godine. Prema podacima Narodne banke Srbije, te godine je ostvaren rekordan priliv stranih direktnih investicija od 4,26 milijardi USD. Najveći uticaj na ovaj rezultat imale su investicije stranih kompanija u oblasti telekomunikacija: norveška kompanija Telenor je te godine od države otkupila Mobtel za 1,6 milijardi EUR, što i danas predstavlja najveću pojedinačnu stranu direktnu investiciju u Srbiji. Pored toga, austrijska kompanija Mobilkom je iste godine otkupila licencu za trećeg operatera mobilne telefonije u Srbiji za 320 miliona EUR i ukupno je do 2013. godine investirala 633 miliona EUR, što predstavlja najveću zabeleženu greenfield investiciju u Srbiji. Iste godine su privatizovane i dve značajne banke: Nacionalna Štedionica (koju je preuzela grčka kompanija Eurobank EFG i koja je do 2013. ukupno investirala 500 miliona EUR) i Vojvođanska Banka (koju je otkupila grčka kompanija National Bank of Greece za 385 miliona EUR). Sledeće godine prilivi stranih direktnih investicija su smanjeni za 48,52%. Situacija se popravlja 2008. godine kada su ostvareni ukupni prilivi stranih direktnih investicija od 3,49 milijardi USD. Ostvarenom prilivu su najviše doprinele investicije Gazproma i Fiata. Ruski Gazprom je te godine, kao deo strateškog sporazuma iz oblasti energetike između Srbije i Ruske Federacije, preuzeo Naftnu industriju Srbije za 400 miliona EUR, a investirao je dodatnih 543 miliona EUR do 2013. godine. Fiat je iste godine od države preuzeo 70% akcija kompanije Zastava automobili i do 2013. investirao ukupno 700 miliona EUR. Do pada priliva stranih direktnih investicija, ponovo dolazi 2009. godine kada je ostvaren priliv od 1,81 milijarde USD, što se može objasniti usporavanjem privredne i investicione aktivnosti u svetu, usled svetske
ekonomske krize. Situacija se pogoršava naredne godine, kada su prilivi stranih direktnih investicija opali za 23,11% u odnosu na prethodnu godinu. Te godine je ostvaren najslabiji priliv stranih direktnih investicija od 2005. Prilivi stranih direktnih investicija su znatno porasli 2011. kada je u Srbiju investirano 3,26 milijardi USD, pri čemu je najveća pojedinačna investicija koja je doprinela takvom rezultatu bila preuzimanje kompanije Maxi od strane belgijske kompanije Delhaize za 932,5 miliona EUR. Izuzetno nizak priliv stranih direktnih investicija u odnosu na prethodnih 10 godina ostvaren je 2012. godine - ukupno 659 miliona USD. Sledeće godine je povećan priliv stranih direktnih investicija koji je, međutim, ostao i dalje na relativno niskom nivou od 1,38 milijardi USD. Ostvarenom prilivu 2013. godine je najviše doprinela investicija izraelske kompanije Big Cee koja je investirala 470 miliona EUR u izgradnju tržnih centara, od kojih je već završen jedan u Novom Sadu. Prilivi stranih direktnih investicija nastavili su sa rastom i u 2014. godini, kada je ostvaren ukupan priliv stranih direktnih investicija od 2,01 milijarde USD. Rast priliva stranih direktnih investicija u Srbiji može se očekivati i u budućnosti sa popravljanjem uslova u globalnom ekonomskom okruženju i predstojećim privatizacijama strateških kompanija. U periodu od 2008. do 2014. godine srpska preduzeća su u inostranstvo investirala ukupno 1,27 milijardi USD, pri čemu je najviše investirano 2014. godine - 348 miliona USD.
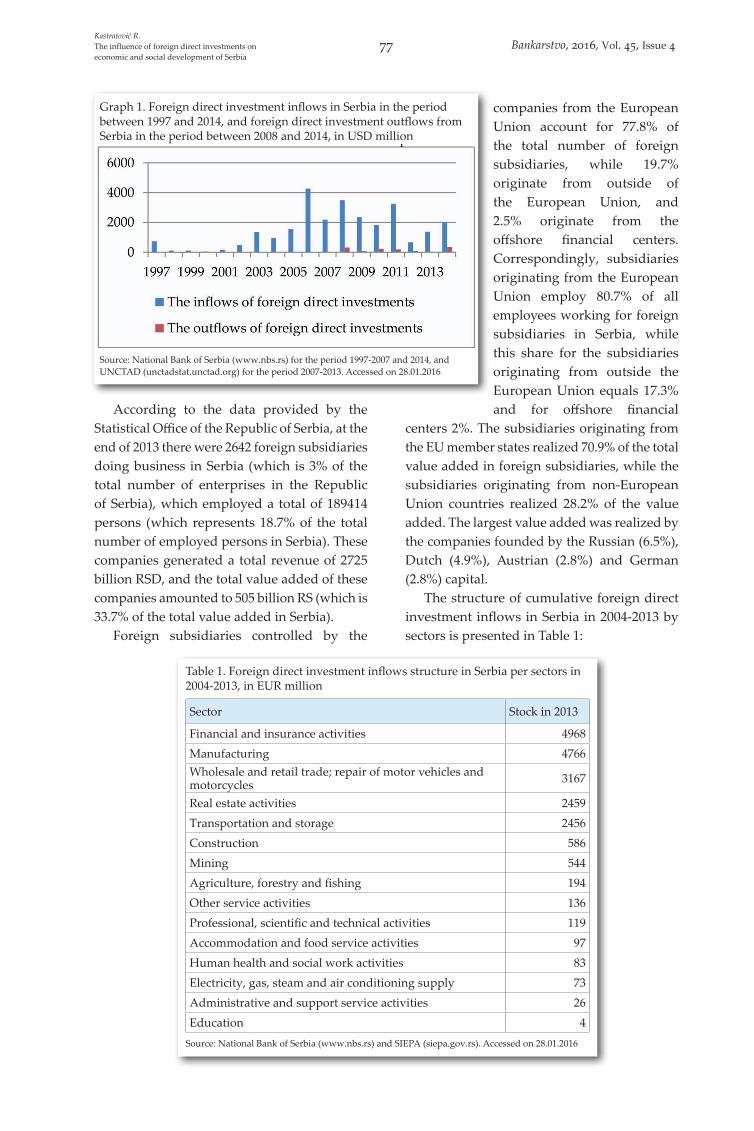
Tokovi stranih direktnih investicija u Srbiji u periodu od 1997. do 2014. prikazani su na bazi podataka Narodne banke Srbije i UNCTAD-a grafikonom 1.
Grafikon 1. Prilivi stranih direktnih investicija u Srbiji u periodu 1997-2014 i odlivi stranih direktnih investicija iz Srbije u periodu 2008-2014, podaci dati u milionima US
Izvor: Narodna banka Srbije (www.nbs.rs) za period 1997-2007 i 2014. godinu i UNCTAD (unctadstat.unctad.org) za period 2007-2013. Pristup 28.01.2016. godine.
Kastratović R.Uticaj stranih direktnih investicija na
privredni i društveni razvoj SrbijeBankarstvo, 2016, vol. 45, br. 4 74
compared to the previous year. The total inflow of foreign direct investments amounted to 1.55 billion USD. The largest contribution to this amount was made by the Czech company StarBev, which acquired Apatinska Pivara and invested a total of 487 million EUR. In addition to that, in February 2005 75% of Delta Banka’s shares was acquired by Italian Banca Intesa, and by August of the same year, Banca Intesa acquired a total of 90% of these shares. By 2013 this bank invested a total of 508 million EUR in Serbia. By far the largest inflow of foreign direct investments in Serbia was realized in 2006. According to the data from the National Bank of Serbia, during that year, the record foreign direct investment inflows of 4.26 billion USD were realized. The most significant contribution to this result was made by the investments of foreign companies in the sector of telecommunications: the Norwegian company Telenor acquired the Serbian company Mobtel, owned by the Serbian Government, for 1.6 billion EUR, which represents the largest individual foreign direct investment in Serbia so far. Additionally, the Austrian company Mobilkom bought the license for the third mobile telephone operator in Serbia for 320 million EUR, and by 2013 invested 633 million EUR in total, which is the largest recorded greenfield investment in Serbia to this date. The same year, two important banks were also privatized: Nacionalna Štedionica (taken over by the Greek Eurobank EFG, which invested 500 million EUR in Serbia by 2013) and Vojvođanska Banka (acquired by the National Bank of Greece for 385 million EUR). The following year the inflow of foreign direct investments was reduced by 48.52%. The situation improved in 2008 when the total inflow of foreign direct investments amounted to 3.49 billion USD. The improved inflows were driven mainly by the investments of Gazprom and Fiat. That year the Russian Gazprom took over Naftna industrija Srbije for 400 million EUR, and further invested 543 million EUR by 2013, as the part of the strategic agreement regarding the energy sector between Serbia and the Russian Federation. In the same year Fiat acquired 70% of shares of Zastava automobili from the Government of Serbia and additionally invested 700 million EUR by 2013. The inflow of foreign direct investments
in Serbia fell again in 2009, the total amount of inflow being 1.81 billion USD, which could be explained by slowing down of economic and investment activities in the world due to the Global Economic Crisis. The situation worsened the following year, when the inflow fell by the additional 23.11% compared to the previous year. During that year the smallest inflow of foreign direct investments in Serbia was recorded since 2005. The inflow of foreign direct investments increased significantly in 2011, when 3.26 billion USD was invested in Serbia, the most significant contribution to this result being made by the Delhaize’s acquisition of Maxi company worth 932.5 billion EUR. A particularly low inflow of foreign direct investments, considering the previous 10 years, was realized in 2012 - total inflows standing at 659 million USD. The following year an increase in the inflow of foreign direct investments was recorded, the flow, however, reaching a relatively low level of 1.38 billion USD. The largest contribution to the realized inflow was the investment of the Israeli company Big Cee which invested 470 million EUR in the development of shopping malls in Serbia, one of which was completed recently in Novi Sad. The inflow of foreign direct investments continued growing in 2014 as well, when the total inflow reached 2.01 billion USD. The growth of inflows of foreign direct investments in Serbia can be expected in the future, with the improving global economic environment and the upcoming privatizations of strategic companies. In the period between 2008 and 2014 the Serbian companies invested a total of 1.27 billion USD abroad, and the largest realized outflow was recorded in 2014 - a total of 348 million USD.
The foreign direct investment flows in the period 1997-2014 are presented in the Graph 1 based on the data provided by the National Bank of Serbia and UNCTAD:
Kastratović R.The influence of foreign direct investments on economic and social development of Serbia
75 Bankarstvo, 2016, Vol. 45, Issue 4
Prema podacima Republičkog zavoda za statistiku, na kraju 2013. godine su u Srbiji poslovale 2.642 strane filijale (što predstavlja 3% ukupnog broja poslovnih subjekata u Republici Srbiji), koje su zapošljavale ukupno 189.414 osoba (što predstavlja 18,7% ukupnog broja zaposlenih lica). Ova preduzeća su ostvarila ukupan promet od 2.725 milijardi RSD, a ukupna dodata vrednost ovih preduzeća bila je 505 milijardi RSD (odnosno 33,7% ukupno ostvarene dodate vrednosti u Srbiji).
Strane filijale koje su poreklom iz zemalja članica Evropske unije čine 77,8% ukupnog broja stranih podružnica, dok 19,7% potiče iz zemalja izvan Evropske unije i 2,5% iz offshore finansijskih centara. Pri tome, filijale poreklom iz zemalja članica Evropske unije zapošljavaju
80,7% od ukupnog broja zaposlenih u stranim filijalama, dok taj procenat za filijale poreklom iz zemalja izvan Evropske unije iznosi 17,3%, a za offshore finansijske centre 2%. Filijale koje potiču iz zemalja Evropske unije su ostvarile 70,9% ukupne dodate vrednosti ostvarene u inostranim filijalama, dok su filijale poreklom iz zemalja izvan Evropske unije ostvarile 28,2% dodate vrednosti. Najveću dodatu vrednost ostvarile su filijale osnovane ruskim (6,5%), holandskim (4,9%), austrijskim (2,8%) i nemačkim kapitalom (2,8%).
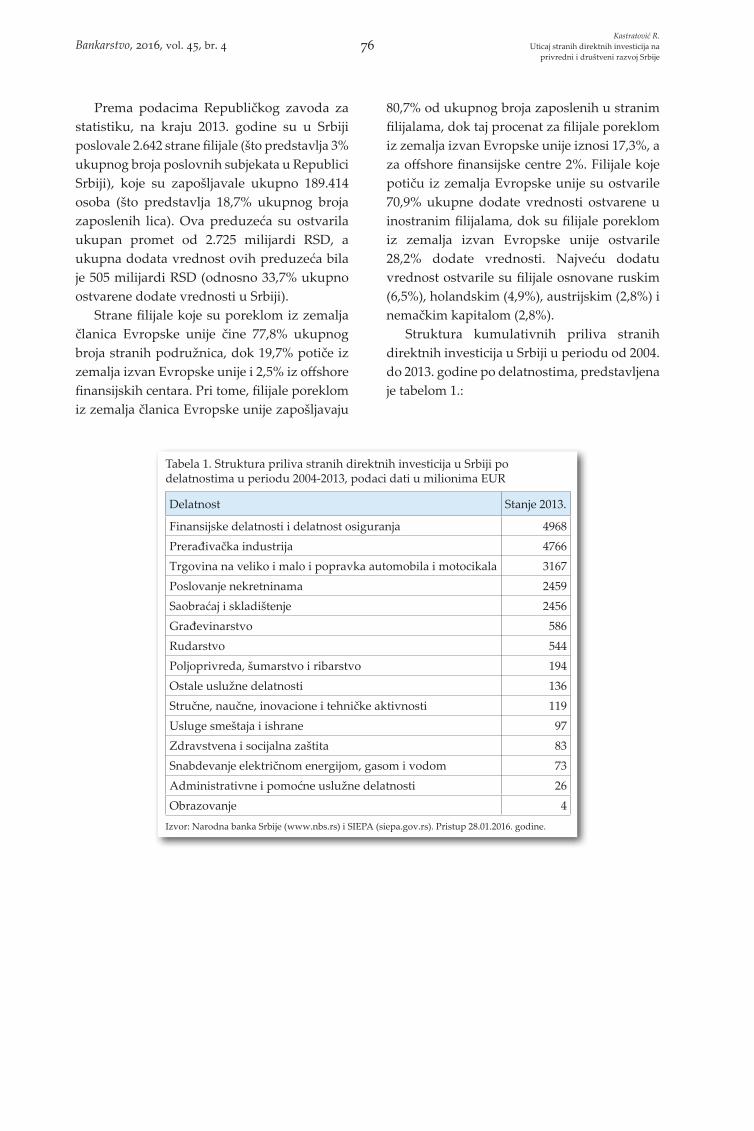
Struktura kumulativnih priliva stranih direktnih investicija u Srbiji u periodu od 2004. do 2013. godine po delatnostima, predstavljena je tabelom 1.:
Tabela 1. Struktura priliva stranih direktnih investicija u Srbiji po delatnostima u periodu 2004-2013, podaci dati u milionima EUR
Delatnost Stanje 2013.
Finansijske delatnosti i delatnost osiguranja 4968Prerađivačka industrija 4766Trgovina na veliko i malo i popravka automobila i motocikala 3167Poslovanje nekretninama 2459Saobraćaj i skladištenje 2456Građevinarstvo 586Rudarstvo 544Poljoprivreda, šumarstvo i ribarstvo 194Ostale uslužne delatnosti 136Stručne, naučne, inovacione i tehničke aktivnosti 119Usluge smeštaja i ishrane 97Zdravstvena i socijalna zaštita 83Snabdevanje električnom energijom, gasom i vodom 73Administrativne i pomoćne uslužne delatnosti 26Obrazovanje 4
Izvor: Narodna banka Srbije (www.nbs.rs) i SIEPA (siepa.gov.rs). Pristup 28.01.2016. godine.
Kastratović R.Uticaj stranih direktnih investicija na
privredni i društveni razvoj SrbijeBankarstvo, 2016, vol. 45, br. 4 76
According to the data provided by the Statistical Office of the Republic of Serbia, at the end of 2013 there were 2642 foreign subsidiaries doing business in Serbia (which is 3% of the total number of enterprises in the Republic of Serbia), which employed a total of 189414 persons (which represents 18.7% of the total number of employed persons in Serbia). These companies generated a total revenue of 2725 billion RSD, and the total value added of these companies amounted to 505 billion RS (which is 33.7% of the total value added in Serbia).
Foreign subsidiaries controlled by the
companies from the European Union account for 77.8% of the total number of foreign subsidiaries, while 19.7% originate from outside of the European Union, and 2.5% originate from the offshore financial centers. Correspondingly, subsidiaries originating from the European Union employ 80.7% of all employees working for foreign subsidiaries in Serbia, while this share for the subsidiaries originating from outside the European Union equals 17.3% and for offshore financial
centers 2%. The subsidiaries originating from the EU member states realized 70.9% of the total value added in foreign subsidiaries, while the subsidiaries originating from non-European Union countries realized 28.2% of the value added. The largest value added was realized by the companies founded by the Russian (6.5%), Dutch (4.9%), Austrian (2.8%) and German (2.8%) capital.
The structure of cumulative foreign direct investment inflows in Serbia in 2004-2013 by sectors is presented in Table 1:
Graph 1. Foreign direct investment inflows in Serbia in the period between 1997 and 2014, and foreign direct investment outflows from Serbia in the period between 2008 and 2014, in USD million
Source: National Bank of Serbia (www.nbs.rs) for the period 1997-2007 and 2014, and UNCTAD (unctadstat.unctad.org) for the period 2007-2013. Accessed on 28.01.2016
Table 1. Foreign direct investment inflows structure in Serbia per sectors in 2004-2013, in EUR million
Sector Stock in 2013
Financial and insurance activities 4968Manufacturing 4766Wholesale and retail trade; repair of motor vehicles and motorcycles 3167
Real estate activities 2459Transportation and storage 2456Construction 586Mining 544Agriculture, forestry and fishing 194Other service activities 136Professional, scientific and technical activities 119Accommodation and food service activities 97Human health and social work activities 83Electricity, gas, steam and air conditioning supply 73Administrative and support service activities 26Education 4
Source: National Bank of Serbia (www.nbs.rs) and SIEPA (siepa.gov.rs). Accessed on 28.01.2016
Kastratović R.The influence of foreign direct investments on economic and social development of Serbia
77 Bankarstvo, 2016, Vol. 45, Issue 4
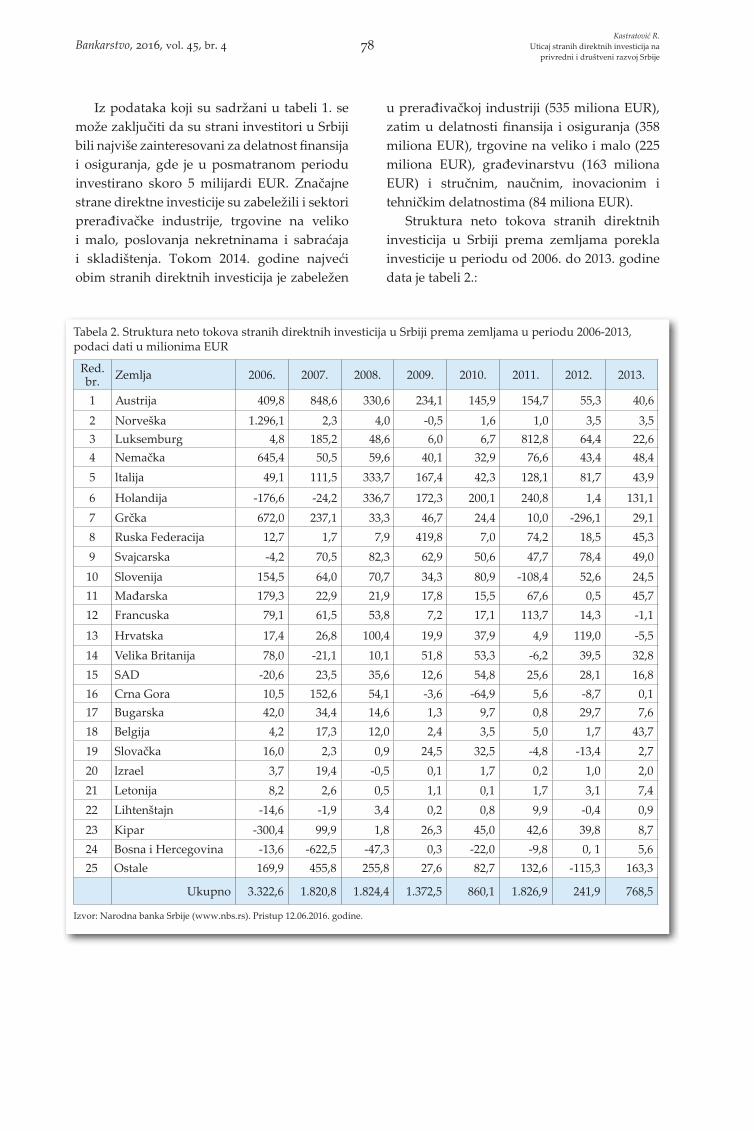
Iz podataka koji su sadržani u tabeli 1. se može zaključiti da su strani investitori u Srbiji bili najviše zainteresovani za delatnost finansija i osiguranja, gde je u posmatranom periodu investirano skoro 5 milijardi EUR. Značajne strane direktne investicije su zabeležili i sektori prerađivačke industrije, trgovine na veliko i malo, poslovanja nekretninama i sabraćaja i skladištenja. Tokom 2014. godine najveći obim stranih direktnih investicija je zabeležen
u prerađivačkoj industriji (535 miliona EUR), zatim u delatnosti finansija i osiguranja (358 miliona EUR), trgovine na veliko i malo (225 miliona EUR), građevinarstvu (163 miliona EUR) i stručnim, naučnim, inovacionim i tehničkim delatnostima (84 miliona EUR).
Struktura neto tokova stranih direktnih investicija u Srbiji prema zemljama porekla investicije u periodu od 2006. do 2013. godine data je tabeli 2.:
Tabela 2. Struktura neto tokova stranih direktnih investicija u Srbiji prema zemljama u periodu 2006-2013, podaci dati u milionima EUR
Red. br. Zemlja 2006. 2007. 2008. 2009. 2010. 2011. 2012. 2013.
1 Austrija 409,8 848,6 330,6 234,1 145,9 154,7 55,3 40,6
2 Norveška 1.296,1 2,3 4,0 -0,5 1,6 1,0 3,5 3,53 Luksemburg 4,8 185,2 48,6 6,0 6,7 812,8 64,4 22,64 Nemačka 645,4 50,5 59,6 40,1 32,9 76,6 43,4 48,45 ltalija 49,1 111,5 333,7 167,4 42,3 128,1 81,7 43,9
6 Holandija -176,6 -24,2 336,7 172,3 200,1 240,8 1,4 131,17 Grčka 672,0 237,1 33,3 46,7 24,4 10,0 -296,1 29,18 Ruska Federacija 12,7 1,7 7,9 419,8 7,0 74,2 18,5 45,39 Svajcarska -4,2 70,5 82,3 62,9 50,6 47,7 78,4 49,0
10 Slovenija 154,5 64,0 70,7 34,3 80,9 -108,4 52,6 24,511 Mađarska 179,3 22,9 21,9 17,8 15,5 67,6 0,5 45,712 Francuska 79,1 61,5 53,8 7,2 17,1 113,7 14,3 -1,1
13 Hrvatska 17,4 26,8 100,4 19,9 37,9 4,9 119,0 -5,514 Velika Britanija 78,0 -21,1 10,1 51,8 53,3 -6,2 39,5 32,815 SAD -20,6 23,5 35,6 12,6 54,8 25,6 28,1 16,816 Crna Gora 10,5 152,6 54,1 -3,6 -64,9 5,6 -8,7 0,117 Bugarska 42,0 34,4 14,6 1,3 9,7 0,8 29,7 7,618 Belgija 4,2 17,3 12,0 2,4 3,5 5,0 1,7 43,719 Slovačka 16,0 2,3 0,9 24,5 32,5 -4,8 -13,4 2,720 lzrael 3,7 19,4 -0,5 0,1 1,7 0,2 1,0 2,021 Letonija 8,2 2,6 0,5 1,1 0,1 1,7 3,1 7,422 Lihtenštajn -14,6 -1,9 3,4 0,2 0,8 9,9 -0,4 0,923 Kipar -300,4 99,9 1,8 26,3 45,0 42,6 39,8 8,724 Bosna i Hercegovina -13,6 -622,5 -47,3 0,3 -22,0 -9,8 0, 1 5,625 Ostale 169,9 455,8 255,8 27,6 82,7 132,6 -115,3 163,3
Ukupno 3.322,6 1.820,8 1.824,4 1.372,5 860,1 1.826,9 241,9 768,5
Izvor: Narodna banka Srbije (www.nbs.rs). Pristup 12.06.2016. godine.
Kastratović R.Uticaj stranih direktnih investicija na
privredni i društveni razvoj SrbijeBankarstvo, 2016, vol. 45, br. 4 78
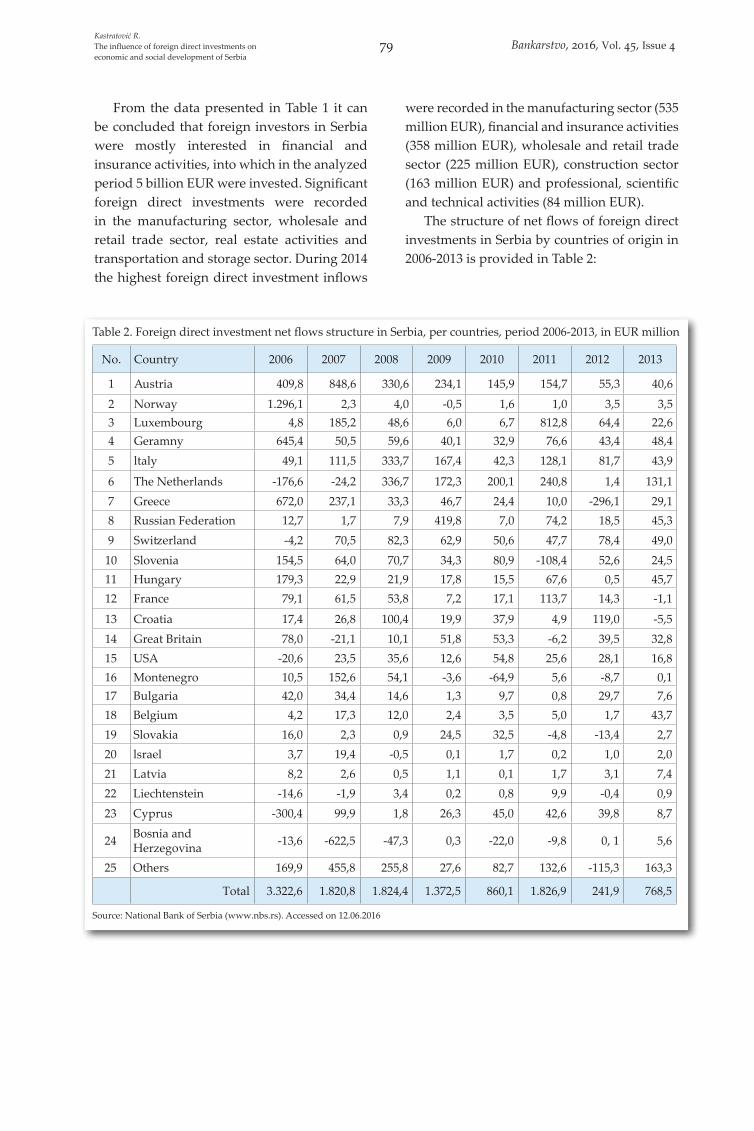
From the data presented in Table 1 it can be concluded that foreign investors in Serbia were mostly interested in financial and insurance activities, into which in the analyzed period 5 billion EUR were invested. Significant foreign direct investments were recorded in the manufacturing sector, wholesale and retail trade sector, real estate activities and transportation and storage sector. During 2014 the highest foreign direct investment inflows
were recorded in the manufacturing sector (535 million EUR), financial and insurance activities (358 million EUR), wholesale and retail trade sector (225 million EUR), construction sector (163 million EUR) and professional, scientific and technical activities (84 million EUR).
The structure of net flows of foreign direct investments in Serbia by countries of origin in 2006-2013 is provided in Table 2:
Table 2. Foreign direct investment net flows structure in Serbia, per countries, period 2006-2013, in EUR million
No. Country 2006 2007 2008 2009 2010 2011 2012 2013
1 Austria 409,8 848,6 330,6 234,1 145,9 154,7 55,3 40,6
2 Norway 1.296,1 2,3 4,0 -0,5 1,6 1,0 3,5 3,53 Luxembourg 4,8 185,2 48,6 6,0 6,7 812,8 64,4 22,64 Geramny 645,4 50,5 59,6 40,1 32,9 76,6 43,4 48,45 ltaly 49,1 111,5 333,7 167,4 42,3 128,1 81,7 43,9
6 The Netherlands -176,6 -24,2 336,7 172,3 200,1 240,8 1,4 131,17 Greece 672,0 237,1 33,3 46,7 24,4 10,0 -296,1 29,18 Russian Federation 12,7 1,7 7,9 419,8 7,0 74,2 18,5 45,39 Switzerland -4,2 70,5 82,3 62,9 50,6 47,7 78,4 49,0
10 Slovenia 154,5 64,0 70,7 34,3 80,9 -108,4 52,6 24,511 Hungary 179,3 22,9 21,9 17,8 15,5 67,6 0,5 45,712 France 79,1 61,5 53,8 7,2 17,1 113,7 14,3 -1,1
13 Croatia 17,4 26,8 100,4 19,9 37,9 4,9 119,0 -5,514 Great Britain 78,0 -21,1 10,1 51,8 53,3 -6,2 39,5 32,815 USA -20,6 23,5 35,6 12,6 54,8 25,6 28,1 16,816 Montenegro 10,5 152,6 54,1 -3,6 -64,9 5,6 -8,7 0,117 Bulgaria 42,0 34,4 14,6 1,3 9,7 0,8 29,7 7,618 Belgium 4,2 17,3 12,0 2,4 3,5 5,0 1,7 43,719 Slovakia 16,0 2,3 0,9 24,5 32,5 -4,8 -13,4 2,720 lsrael 3,7 19,4 -0,5 0,1 1,7 0,2 1,0 2,021 Latvia 8,2 2,6 0,5 1,1 0,1 1,7 3,1 7,422 Liechtenstein -14,6 -1,9 3,4 0,2 0,8 9,9 -0,4 0,923 Cyprus -300,4 99,9 1,8 26,3 45,0 42,6 39,8 8,7
24 Bosnia and Herzegovina -13,6 -622,5 -47,3 0,3 -22,0 -9,8 0, 1 5,6
25 Others 169,9 455,8 255,8 27,6 82,7 132,6 -115,3 163,3
Total 3.322,6 1.820,8 1.824,4 1.372,5 860,1 1.826,9 241,9 768,5
Source: National Bank of Serbia (www.nbs.rs). Accessed on 12.06.2016
Kastratović R.The influence of foreign direct investments on economic and social development of Serbia
79 Bankarstvo, 2016, Vol. 45, Issue 4
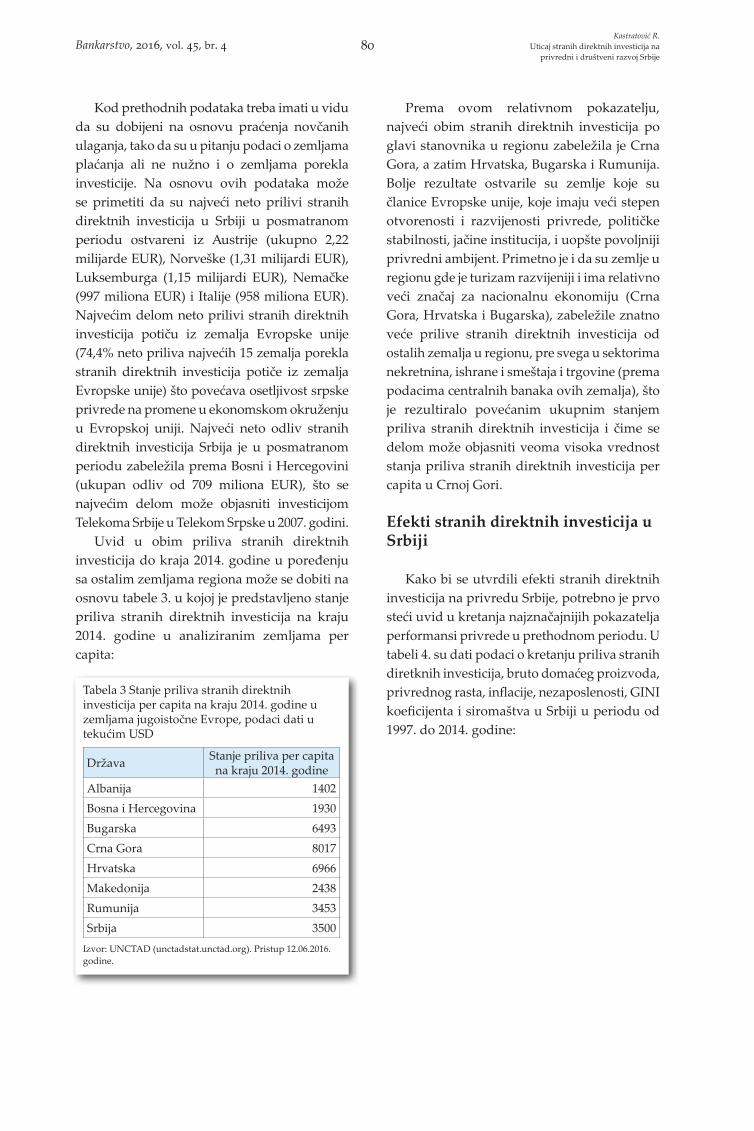
Kod prethodnih podataka treba imati u vidu da su dobijeni na osnovu praćenja novčanih ulaganja, tako da su u pitanju podaci o zemljama plaćanja ali ne nužno i o zemljama porekla investicije. Na osnovu ovih podataka može se primetiti da su najveći neto prilivi stranih direktnih investicija u Srbiji u posmatranom periodu ostvareni iz Austrije (ukupno 2,22 milijarde EUR), Norveške (1,31 milijardi EUR), Luksemburga (1,15 milijardi EUR), Nemačke (997 miliona EUR) i Italije (958 miliona EUR). Najvećim delom neto prilivi stranih direktnih investicija potiču iz zemalja Evropske unije (74,4% neto priliva najvećih 15 zemalja porekla stranih direktnih investicija potiče iz zemalja Evropske unije) što povećava osetljivost srpske privrede na promene u ekonomskom okruženju u Evropskoj uniji. Najveći neto odliv stranih direktnih investicija Srbija je u posmatranom periodu zabeležila prema Bosni i Hercegovini (ukupan odliv od 709 miliona EUR), što se najvećim delom može objasniti investicijom Telekoma Srbije u Telekom Srpske u 2007. godini.
Uvid u obim priliva stranih direktnih investicija do kraja 2014. godine u poređenju sa ostalim zemljama regiona može se dobiti na osnovu tabele 3. u kojoj je predstavljeno stanje priliva stranih direktnih investicija na kraju 2014. godine u analiziranim zemljama per capita:
Prema ovom relativnom pokazatelju, najveći obim stranih direktnih investicija po glavi stanovnika u regionu zabeležila je Crna Gora, a zatim Hrvatska, Bugarska i Rumunija. Bolje rezultate ostvarile su zemlje koje su članice Evropske unije, koje imaju veći stepen otvorenosti i razvijenosti privrede, političke stabilnosti, jačine institucija, i uopšte povoljniji privredni ambijent. Primetno je i da su zemlje u regionu gde je turizam razvijeniji i ima relativno veći značaj za nacionalnu ekonomiju (Crna Gora, Hrvatska i Bugarska), zabeležile znatno veće prilive stranih direktnih investicija od ostalih zemalja u regionu, pre svega u sektorima nekretnina, ishrane i smeštaja i trgovine (prema podacima centralnih banaka ovih zemalja), što je rezultiralo povećanim ukupnim stanjem priliva stranih direktnih investicija i čime se delom može objasniti veoma visoka vrednost stanja priliva stranih direktnih investicija per capita u Crnoj Gori.
Efekti stranih direktnih investicija u Srbiji
Kako bi se utvrdili efekti stranih direktnih investicija na privredu Srbije, potrebno je prvo steći uvid u kretanja najznačajnijih pokazatelja performansi privrede u prethodnom periodu. U tabeli 4. su dati podaci o kretanju priliva stranih diretknih investicija, bruto domaćeg proizvoda, privrednog rasta, inflacije, nezaposlenosti, GINI koeficijenta i siromaštva u Srbiji u periodu od 1997. do 2014. godine:
Tabela 3 Stanje priliva stranih direktnih investicija per capita na kraju 2014. godine u zemljama jugoistočne Evrope, podaci dati u tekućim USD
Država Stanje priliva per capita na kraju 2014. godine
Albanija 1402Bosna i Hercegovina 1930Bugarska 6493Crna Gora 8017Hrvatska 6966Makedonija 2438Rumunija 3453Srbija 3500
Izvor: UNCTAD (unctadstat.unctad.org). Pristup 12.06.2016. godine.
Kastratović R.Uticaj stranih direktnih investicija na
privredni i društveni razvoj SrbijeBankarstvo, 2016, vol. 45, br. 4 80
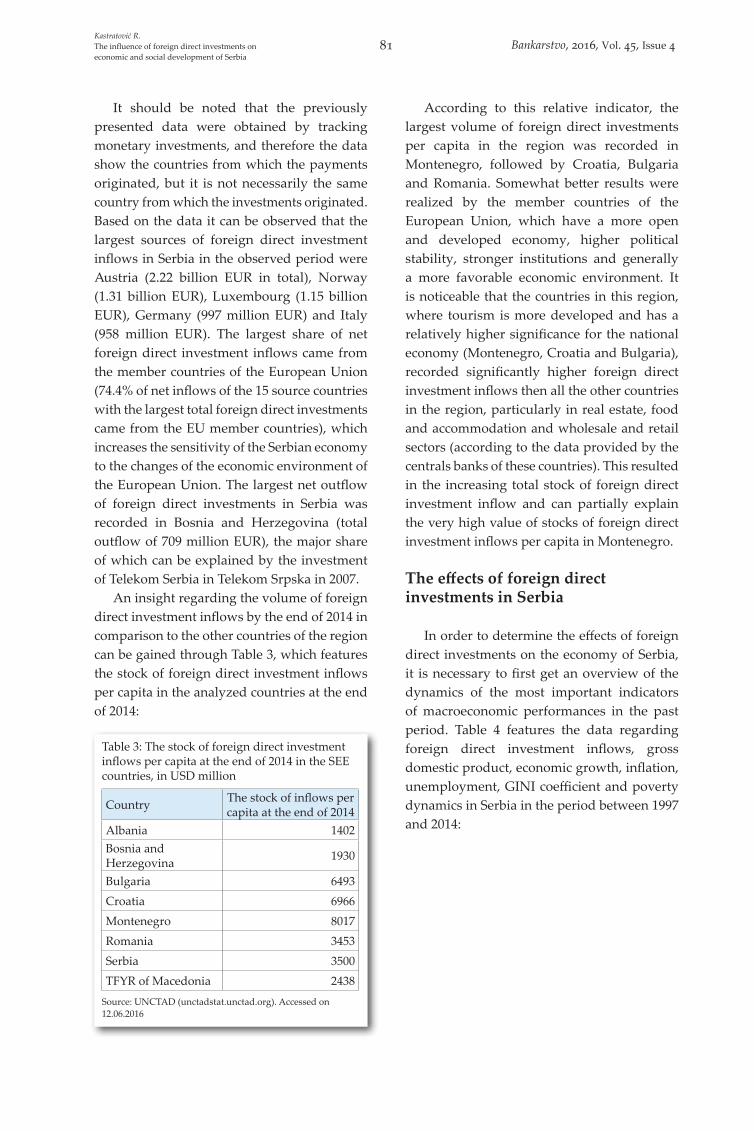
It should be noted that the previously presented data were obtained by tracking monetary investments, and therefore the data show the countries from which the payments originated, but it is not necessarily the same country from which the investments originated. Based on the data it can be observed that the largest sources of foreign direct investment inflows in Serbia in the observed period were Austria (2.22 billion EUR in total), Norway (1.31 billion EUR), Luxembourg (1.15 billion EUR), Germany (997 million EUR) and Italy (958 million EUR). The largest share of net foreign direct investment inflows came from the member countries of the European Union (74.4% of net inflows of the 15 source countries with the largest total foreign direct investments came from the EU member countries), which increases the sensitivity of the Serbian economy to the changes of the economic environment of the European Union. The largest net outflow of foreign direct investments in Serbia was recorded in Bosnia and Herzegovina (total outflow of 709 million EUR), the major share of which can be explained by the investment of Telekom Serbia in Telekom Srpska in 2007.
An insight regarding the volume of foreign direct investment inflows by the end of 2014 in comparison to the other countries of the region can be gained through Table 3, which features the stock of foreign direct investment inflows per capita in the analyzed countries at the end of 2014:
According to this relative indicator, the largest volume of foreign direct investments per capita in the region was recorded in Montenegro, followed by Croatia, Bulgaria and Romania. Somewhat better results were realized by the member countries of the European Union, which have a more open and developed economy, higher political stability, stronger institutions and generally a more favorable economic environment. It is noticeable that the countries in this region, where tourism is more developed and has a relatively higher significance for the national economy (Montenegro, Croatia and Bulgaria), recorded significantly higher foreign direct investment inflows then all the other countries in the region, particularly in real estate, food and accommodation and wholesale and retail sectors (according to the data provided by the centrals banks of these countries). This resulted in the increasing total stock of foreign direct investment inflow and can partially explain the very high value of stocks of foreign direct investment inflows per capita in Montenegro.
The effects of foreign direct investments in Serbia
In order to determine the effects of foreign direct investments on the economy of Serbia, it is necessary to first get an overview of the dynamics of the most important indicators of macroeconomic performances in the past period. Table 4 features the data regarding foreign direct investment inflows, gross domestic product, economic growth, inflation, unemployment, GINI coefficient and poverty dynamics in Serbia in the period between 1997 and 2014:
Table 3: The stock of foreign direct investment inflows per capita at the end of 2014 in the SEE countries, in USD million
Country The stock of inflows per capita at the end of 2014
Albania 1402Bosnia and Herzegovina 1930
Bulgaria 6493Croatia 6966Montenegro 8017Romania 3453Serbia 3500TFYR of Macedonia 2438
Source: UNCTAD (unctadstat.unctad.org). Accessed on 12.06.2016
Kastratović R.The influence of foreign direct investments on economic and social development of Serbia
81 Bankarstvo, 2016, Vol. 45, Issue 4
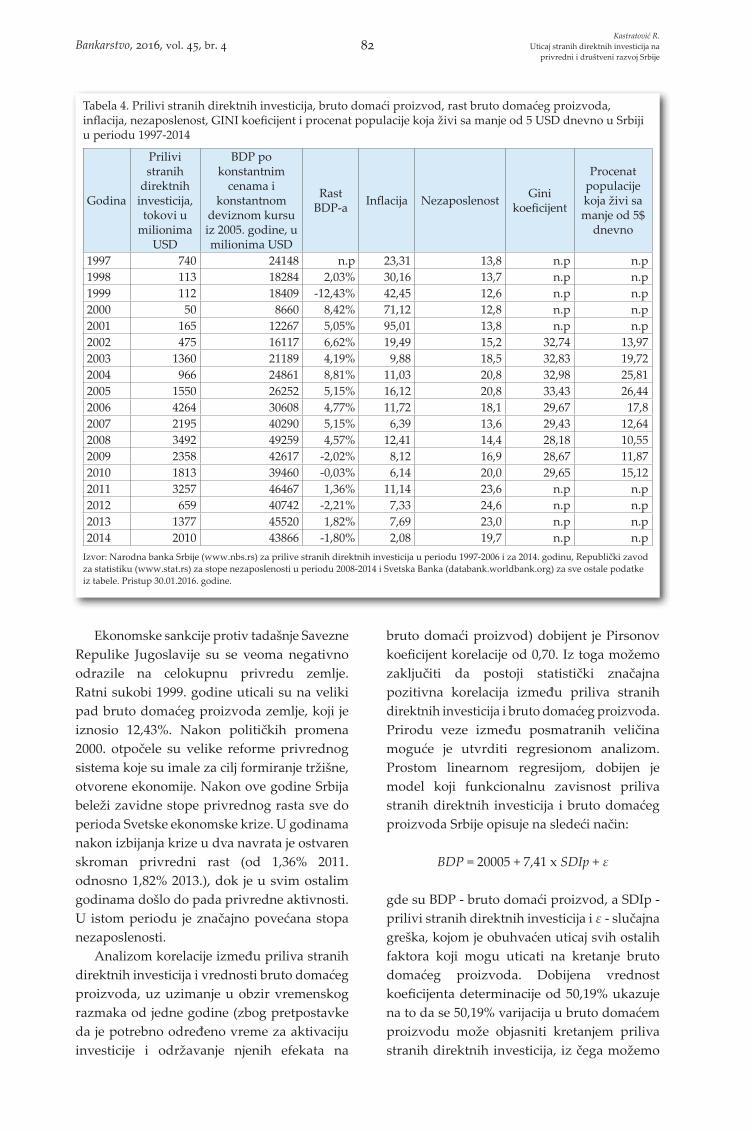
Ekonomske sankcije protiv tadašnje Savezne Repulike Jugoslavije su se veoma negativno odrazile na celokupnu privredu zemlje. Ratni sukobi 1999. godine uticali su na veliki pad bruto domaćeg proizvoda zemlje, koji je iznosio 12,43%. Nakon političkih promena 2000. otpočele su velike reforme privrednog sistema koje su imale za cilj formiranje tržišne, otvorene ekonomije. Nakon ove godine Srbija beleži zavidne stope privrednog rasta sve do perioda Svetske ekonomske krize. U godinama nakon izbijanja krize u dva navrata je ostvaren skroman privredni rast (od 1,36% 2011. odnosno 1,82% 2013.), dok je u svim ostalim godinama došlo do pada privredne aktivnosti. U istom periodu je značajno povećana stopa nezaposlenosti.
Analizom korelacije između priliva stranih direktnih investicija i vrednosti bruto domaćeg proizvoda, uz uzimanje u obzir vremenskog razmaka od jedne godine (zbog pretpostavke da je potrebno određeno vreme za aktivaciju investicije i održavanje njenih efekata na
bruto domaći proizvod) dobijent je Pirsonov koeficijent korelacije od 0,70. Iz toga možemo zaključiti da postoji statistički značajna pozitivna korelacija između priliva stranih direktnih investicija i bruto domaćeg proizvoda. Prirodu veze između posmatranih veličina moguće je utvrditi regresionom analizom. Prostom linearnom regresijom, dobijen je model koji funkcionalnu zavisnost priliva stranih direktnih investicija i bruto domaćeg proizvoda Srbije opisuje na sledeći način:
BDP = 20005 + 7,41 x SDIp + ε
gde su BDP - bruto domaći proizvod, a SDIp - prilivi stranih direktnih investicija i ε - slučajna greška, kojom je obuhvaćen uticaj svih ostalih faktora koji mogu uticati na kretanje bruto domaćeg proizvoda. Dobijena vrednost koeficijenta determinacije od 50,19% ukazuje na to da se 50,19% varijacija u bruto domaćem proizvodu može objasniti kretanjem priliva stranih direktnih investicija, iz čega možemo
Tabela 4. Prilivi stranih direktnih investicija, bruto domaći proizvod, rast bruto domaćeg proizvoda, inflacija, nezaposlenost, GINI koeficijent i procenat populacije koja živi sa manje od 5 USD dnevno u Srbiji u periodu 1997-2014
Godina
Prilivi stranih
direktnih investicija, tokovi u
milionima USD
BDP po konstantnim
cenama i konstantnom
deviznom kursu iz 2005. godine, u milionima USD
Rast BDP-a Inflacija Nezaposlenost Gini
koeficijent
Procenat populacije koja živi sa manje od 5$
dnevno
1997 740 24148 n.p 23,31 13,8 n.p n.p1998 113 18284 2,03% 30,16 13,7 n.p n.p1999 112 18409 -12,43% 42,45 12,6 n.p n.p2000 50 8660 8,42% 71,12 12,8 n.p n.p2001 165 12267 5,05% 95,01 13,8 n.p n.p2002 475 16117 6,62% 19,49 15,2 32,74 13,972003 1360 21189 4,19% 9,88 18,5 32,83 19,722004 966 24861 8,81% 11,03 20,8 32,98 25,812005 1550 26252 5,15% 16,12 20,8 33,43 26,442006 4264 30608 4,77% 11,72 18,1 29,67 17,82007 2195 40290 5,15% 6,39 13,6 29,43 12,642008 3492 49259 4,57% 12,41 14,4 28,18 10,552009 2358 42617 -2,02% 8,12 16,9 28,67 11,872010 1813 39460 -0,03% 6,14 20,0 29,65 15,122011 3257 46467 1,36% 11,14 23,6 n.p n.p2012 659 40742 -2,21% 7,33 24,6 n.p n.p2013 1377 45520 1,82% 7,69 23,0 n.p n.p2014 2010 43866 -1,80% 2,08 19,7 n.p n.p
Izvor: Narodna banka Srbije (www.nbs.rs) za prilive stranih direktnih investicija u periodu 1997-2006 i za 2014. godinu, Republički zavod za statistiku (www.stat.rs) za stope nezaposlenosti u periodu 2008-2014 i Svetska Banka (databank.worldbank.org) za sve ostale podatke iz tabele. Pristup 30.01.2016. godine.
Kastratović R.Uticaj stranih direktnih investicija na
privredni i društveni razvoj SrbijeBankarstvo, 2016, vol. 45, br. 4 82
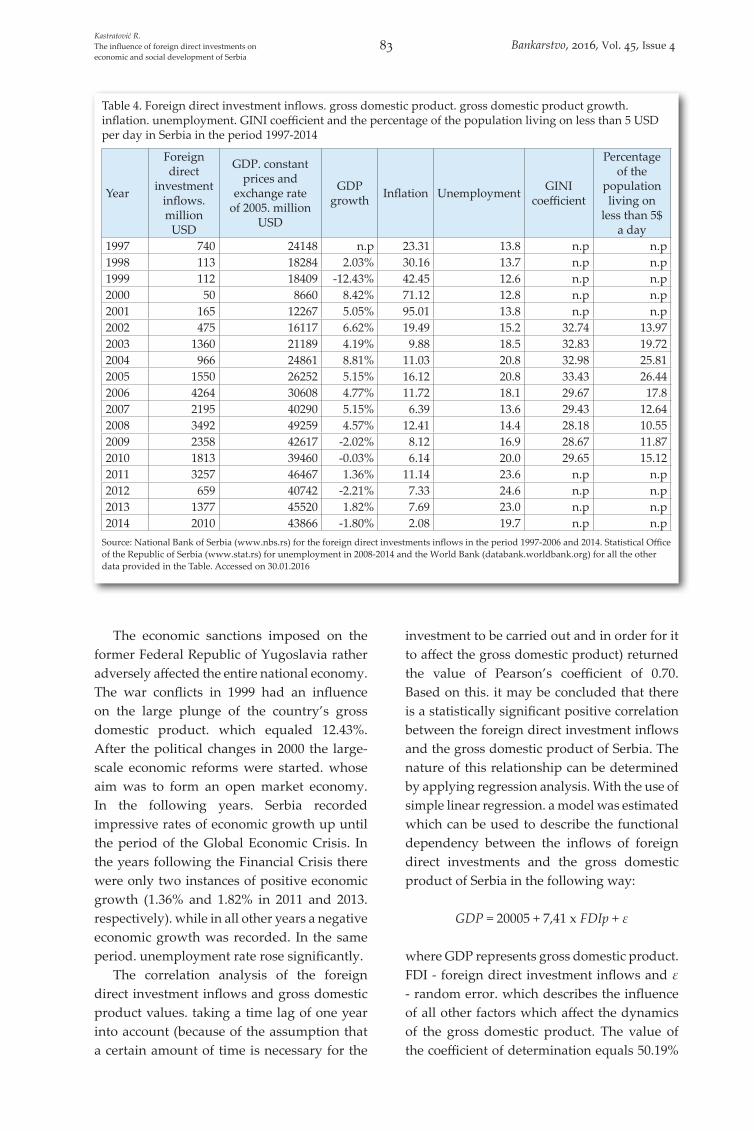
The economic sanctions imposed on the former Federal Republic of Yugoslavia rather adversely affected the entire national economy. The war conflicts in 1999 had an influence on the large plunge of the country’s gross domestic product. which equaled 12.43%. After the political changes in 2000 the large-scale economic reforms were started. whose aim was to form an open market economy. In the following years. Serbia recorded impressive rates of economic growth up until the period of the Global Economic Crisis. In the years following the Financial Crisis there were only two instances of positive economic growth (1.36% and 1.82% in 2011 and 2013. respectively). while in all other years a negative economic growth was recorded. In the same period. unemployment rate rose significantly.
The correlation analysis of the foreign direct investment inflows and gross domestic product values. taking a time lag of one year into account (because of the assumption that a certain amount of time is necessary for the
investment to be carried out and in order for it to affect the gross domestic product) returned the value of Pearson’s coefficient of 0.70. Based on this. it may be concluded that there is a statistically significant positive correlation between the foreign direct investment inflows and the gross domestic product of Serbia. The nature of this relationship can be determined by applying regression analysis. With the use of simple linear regression. a model was estimated which can be used to describe the functional dependency between the inflows of foreign direct investments and the gross domestic product of Serbia in the following way:
GDP = 20005 + 7,41 x FDIp + ε
where GDP represents gross domestic product. FDI - foreign direct investment inflows and ε - random error. which describes the influence of all other factors which affect the dynamics of the gross domestic product. The value of the coefficient of determination equals 50.19%
Table 4. Foreign direct investment inflows. gross domestic product. gross domestic product growth. inflation. unemployment. GINI coefficient and the percentage of the population living on less than 5 USD per day in Serbia in the period 1997-2014
Year
Foreign direct
investment inflows. million
USD
GDP. constant prices and
exchange rate of 2005. million
USD
GDP growth Inflation Unemployment GINI
coefficient
Percentage of the
population living on
less than 5$ a day
1997 740 24148 n.p 23.31 13.8 n.p n.p1998 113 18284 2.03% 30.16 13.7 n.p n.p1999 112 18409 -12.43% 42.45 12.6 n.p n.p2000 50 8660 8.42% 71.12 12.8 n.p n.p2001 165 12267 5.05% 95.01 13.8 n.p n.p2002 475 16117 6.62% 19.49 15.2 32.74 13.972003 1360 21189 4.19% 9.88 18.5 32.83 19.722004 966 24861 8.81% 11.03 20.8 32.98 25.812005 1550 26252 5.15% 16.12 20.8 33.43 26.442006 4264 30608 4.77% 11.72 18.1 29.67 17.82007 2195 40290 5.15% 6.39 13.6 29.43 12.642008 3492 49259 4.57% 12.41 14.4 28.18 10.552009 2358 42617 -2.02% 8.12 16.9 28.67 11.872010 1813 39460 -0.03% 6.14 20.0 29.65 15.122011 3257 46467 1.36% 11.14 23.6 n.p n.p2012 659 40742 -2.21% 7.33 24.6 n.p n.p2013 1377 45520 1.82% 7.69 23.0 n.p n.p2014 2010 43866 -1.80% 2.08 19.7 n.p n.p
Source: National Bank of Serbia (www.nbs.rs) for the foreign direct investments inflows in the period 1997-2006 and 2014. Statistical Office of the Republic of Serbia (www.stat.rs) for unemployment in 2008-2014 and the World Bank (databank.worldbank.org) for all the other data provided in the Table. Accessed on 30.01.2016
Kastratović R.The influence of foreign direct investments on economic and social development of Serbia
83 Bankarstvo, 2016, Vol. 45, Issue 4
zaključiti da postoji još faktora koji utiču na kretanje bruto domaćeg proizvoda u Srbiji, pored stranih direktnih investicija. Na osnovu dobijenog modela možemo zaključiti da svaki dolar priliva stranih direktnih investicija u Srbiji rezultira povećanjem bruto domaćeg proizvoda između 3,35 i 11,47 USD, uz koeficijent poverenja od 95%. Drugim rečima, strane direktne investicije izrazito povoljno utiču na povećanje bruto domaćeg proizvoda, uz pretpostavku konstantnosti svih ostalih faktora koji takođe mogu imati uticaja.
Da bi se govorilo o privrednom razvoju jedne zemlje, pored privrednog rasta, treba uzeti u obzir i to koliko je celokupna populacija jedne države imala koristi od rasta, odnosno kakve su promene učinjene u pogledu nezaposlenosti, nejednakosti i siromaštva. Korelaciona analiza kretanja priliva stranih direktnih investicija i stope nezaposlenosti dala je rezultat Pirsonovog koreficijenta korelacije od 0,24 što znači da je međuzavisnost stranih direktnih investicija i stope nezaposlenosti u Srbiji na niskom nivou, odnosno statistički beznačajnom. To se može objasniti činjenicom da su određene strane direktne investicije (u formi akvizicija velikih neefikasnih društvenih preduzeća) bile praćene restrukturiranjem i otpuštanjem velikog broja zaposlenih što je uticalo na rast stope nezaposlenosti u jednom periodu (od 2000. do 2005. godine), dok su druge strane direktne investicije (posebno greenfield investicije) bile praćene kreiranjem novih radnih mesta čime je stopa nezaposlenosti smanjivana. Kada se zbirno posmatra kretanje ove dve veličine u celokupnom osamnaestogodišnjem periodu, nemoguće je izvući jednoznačan zaključak u pogledu uticaja stranih direktnih investicija na nezaposlenost u Srbiji. Međutim, ako se posmatra kretanje tokova stranih direktnih investicija i stope nezaposlenosti u periodu od 1997. do 2005. godine, može se primetiti jaka pozitivna korelacija između priliva stranih direktnih investicija i stope nezaposlenosti, od čemu svedoči vrednost Pirsonovog koeficijenta korelacije od 0,76. Prostom linearnom regresijom (uz uzimanje u obzir vremenskog razmaka od jedne godine između priliva stranih direktnih investicija i stope nezaposlenosti) je ocenjeno, uz koeficijent poverenja 95%, da je svakih milijardu USD priliva stranih direktnih
investicija do 2005. godine jednoznačno uticalo na rast stope nezaposlenosti i to najmanje za 0,99 a najviše na 7,81 procentnih poena, uz prosečnu procenjenu vrednost od 4,40 procentnih poena. Pri tome je dobijen koeficijent determinacije od 0,57, što znači da su strane direktne investicije, u vidu privatizacije društvenih preduzeća imale značajan uticaj na rast nezaposlenosti u posmatranom periodu, s tim što treba imati u vidu da postoji još faktora koji su takođe u tom periodu imali uticaja na kretanje nezaposlenosti. Analiza korelacije između priliva stranih direktnih investicija i stope nezaposlenosti za period nakon 2005. godine dala je vrednost Pirsonovog koeficijenta korelacije od -0,44 što znači da je nakon 2005. godine utvrđena izvesna negativna korelacija između priliva stranih direktnih investicija i stope nezaposlenosti. Prostom linearnom regresijom je utvrđeno da je svakih milijardu USD priliva stranih direktnih investicija u Srbiji nakon 2005. godine uticalo na smanjenje stope nezaposlenosti za 1,52 procentna poena, uz standardnu grešku od 1,08, koeficijent poverenja od 95% i pretpostavku konstantnosti svih ostalih faktora koji su u posmatranom periodu uticali na kretanje stope nezaposlenosti. Analiza je pokazala i koeficijent determinacije od 0,20, što znači da su strane direktne investicije bile samo jedan od faktora koji su uticali na nezaposlenost u posmatranom periodu i da postoji veći broj drugih faktora koji su imali snažniji uticaj na kretanje nezaposlenosti. Preokret u smeru uticaja stranih direktnih investicija na zaposlenost u Srbiji može se objasniti time što je do 2005. dovoljno povećana politička stabilnost zemlje i poboljšan privredni ambijent. Pored toga povećana je usklađenost zakonodavstva Srbije sa pravilima Evropske unije i uvedeni su značajni finansijski podsticaji za strane direktne investitore u slučaju otvaranja značajnijeg broja radnih mesta. Sve ovo je pozitivno uticalo na rast poverenja stranih investitora, koji su počeli da intenzivnije ulažu u greenfield projekte u Srbiji i proširuju postojeću proizvodnju, što je imalo pozitivnog uticaja na zapošljavanje. Ipak, nezaposlenost je i dalje jedan od najvećih problema privrede Srbije i u prvom kvartalu 2016. je prema podacima Republičkog zavoda za statistiku iznosila 19,0%, čemu je u velikoj meri doprinela Svetska ekonomska kriza.
Kastratović R.Uticaj stranih direktnih investicija na
privredni i društveni razvoj SrbijeBankarstvo, 2016, vol. 45, br. 4 84
which indicates that 50.19% of the gross domestic product variations can be explained by the movements in the gross domestic product from which it can be concluded that there are more factors influencing the movements in the gross domestic product of Serbia. besides foreign direct investments. Based on the calculated model. it can be concluded that every dollar of the foreign direct investment inflow in Serbia results in the increase of the gross domestic product by between 3.35 and 11.47 USD. with the confidence coefficient of 95%. In other words. foreign direct investments have a highly positive influence on the growth of the gross domestic product. assuming that all other factors. which also may have an influence. remain constant.
In order for economic development to take place. besides economic growth. the benefit of the entire population of a country must also be taken into consideration. namely the changes made in terms of unemployment. inequality and poverty. The correlation analysis of the foreign direct investment inflows and the unemployment rate resulted in Pearson’s coefficient equaling 0.24. which implies that there is no statistically significant correlation between foreign direct investments and unemployment in Serbia. This can be explained by the fact that certain foreign direct investments (in the form of acquisitions of large inefficient business companies) were followed by the restructuring and massive lay-offs which caused the growth of the unemployment rate in 2000-2015. while the other foreign direct investments (especially greenfield investments) were followed by the jobs creation which caused the reduction of the unemployment rate. When the movements in these two variables are considered as a whole. it is impossible to draw an unambiguous conclusion regarding the influence of the foreign direct investment inflows on unemployment in Serbia. However. if we only take the period 1997-2005 into account while observing the movements in the inflows of foreign direct inflows and the unemployment rates. a high positive correlation can be estimated between the foreign direct investment inflows and the unemployment rate. with the value of Pearson’s coefficient of 0.76. By applying the simple linear regression (taking a time lag of one year
between the foreign direct investment inflows and the unemployment rate into consideration) it was estimated that. with the confidence interval of 95%. every billion USD of foreign direct investment inflow. until 2005. resulted in the increase of the unemployment rate at least by 0.99 percentage points. and at most 7.81 percentage points. the average estimated value standing at 4.40 percentage points. In addition to that. the coefficient of determination was calculated at 0.57. which implies that foreign direct investments. in the form of privatizations of business companies had a significant influence on the growth of unemployment in the analyzed period. noting that there are other factors as well which also exerted an influence on the dynamics of unemployment. The correlation analysis of the foreign direct investment inflows and the unemployment rate after 2005 resulted in Pearson’s coefficient value of -0.44 which means that there was a moderate negative correlation between the foreign direct investment inflows and the unemployment rate. By applying the simple linear regression it was estimated that. with the confidence interval of 95%. every billion USD of the foreign direct investment inflow resulted in the reduction of the unemployment rate by an average of 1.52 percentage points. standard error being 1.08. assuming that all other factors influencing the unemployment rate remain constant. The analysis also resulted in the determination coefficient of 0.20. which implies that foreign direct investments were just one of the factors influencing the unemployment in the analyzed period. and that there is a large number of other factors which had a stronger influence on the unemployment dynamics. The turn in the direction of the influence that foreign direct investments had on the employment of Serbia can be explained by sufficient improvements in political stability and economic environment made by 2005. Other than that. the compatibility of the Serbian laws with the European Union’s regulations was increased and significant financial incentives for foreign direct investors were introduced to reward the investors creating a large number of jobs. All of this has a positive impact on the growth of trust among foreign investors. who started to invest in greenfield projects in Serbia and increase
Kastratović R.The influence of foreign direct investments on economic and social development of Serbia
85 Bankarstvo, 2016, Vol. 45, Issue 4
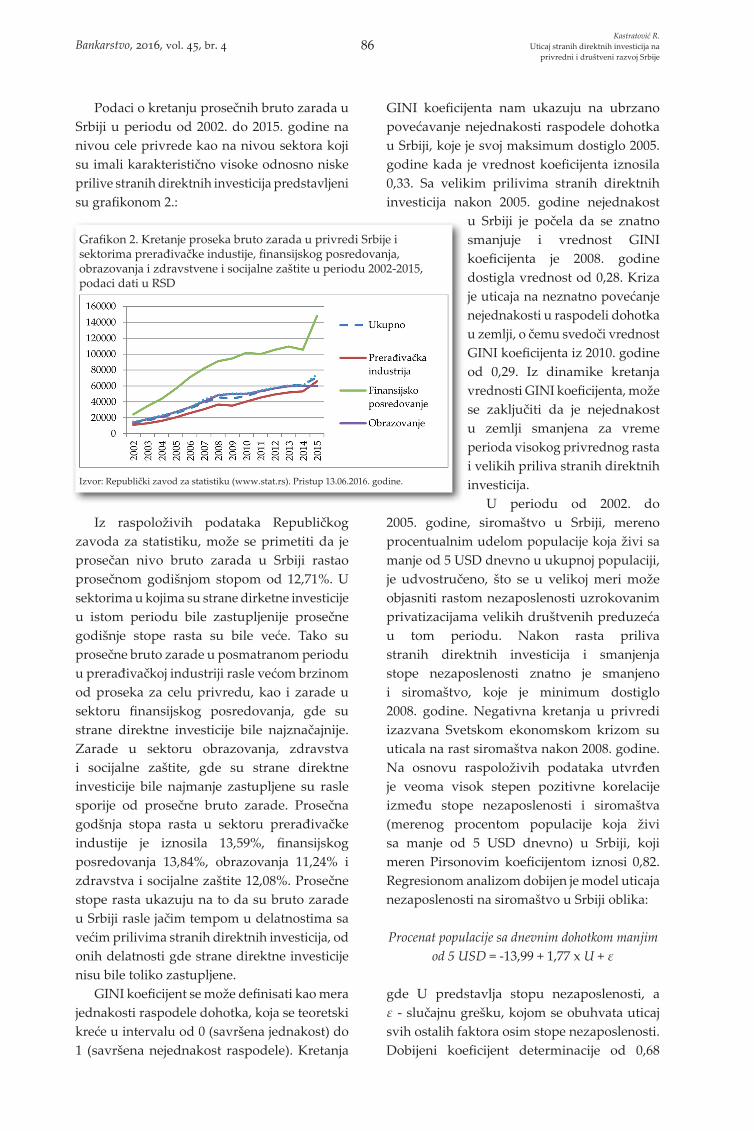
Podaci o kretanju prosečnih bruto zarada u Srbiji u periodu od 2002. do 2015. godine na nivou cele privrede kao na nivou sektora koji su imali karakteristično visoke odnosno niske prilive stranih direktnih investicija predstavljeni su grafikonom 2.:
Iz raspoloživih podataka Republičkog zavoda za statistiku, može se primetiti da je prosečan nivo bruto zarada u Srbiji rastao prosečnom godišnjom stopom od 12,71%. U sektorima u kojima su strane dirketne investicije u istom periodu bile zastupljenije prosečne godišnje stope rasta su bile veće. Tako su prosečne bruto zarade u posmatranom periodu u prerađivačkoj industriji rasle većom brzinom od proseka za celu privredu, kao i zarade u sektoru finansijskog posredovanja, gde su strane direktne investicije bile najznačajnije. Zarade u sektoru obrazovanja, zdravstva i socijalne zaštite, gde su strane direktne investicije bile najmanje zastupljene su rasle sporije od prosečne bruto zarade. Prosečna godšnja stopa rasta u sektoru prerađivačke industije je iznosila 13,59%, finansijskog posredovanja 13,84%, obrazovanja 11,24% i zdravstva i socijalne zaštite 12,08%. Prosečne stope rasta ukazuju na to da su bruto zarade u Srbiji rasle jačim tempom u delatnostima sa većim prilivima stranih direktnih investicija, od onih delatnosti gde strane direktne investicije nisu bile toliko zastupljene.
GINI koeficijent se može definisati kao mera jednakosti raspodele dohotka, koja se teoretski kreće u intervalu od 0 (savršena jednakost) do 1 (savršena nejednakost raspodele). Kretanja
GINI koeficijenta nam ukazuju na ubrzano povećavanje nejednakosti raspodele dohotka u Srbiji, koje je svoj maksimum dostiglo 2005. godine kada je vrednost koeficijenta iznosila 0,33. Sa velikim prilivima stranih direktnih investicija nakon 2005. godine nejednakost
u Srbiji je počela da se znatno smanjuje i vrednost GINI koeficijenta je 2008. godine dostigla vrednost od 0,28. Kriza je uticaja na neznatno povećanje nejednakosti u raspodeli dohotka u zemlji, o čemu svedoči vrednost GINI koeficijenta iz 2010. godine od 0,29. Iz dinamike kretanja vrednosti GINI koeficijenta, može se zaključiti da je nejednakost u zemlji smanjena za vreme perioda visokog privrednog rasta i velikih priliva stranih direktnih investicija.
U periodu od 2002. do 2005. godine, siromaštvo u Srbiji, mereno procentualnim udelom populacije koja živi sa manje od 5 USD dnevno u ukupnoj populaciji, je udvostručeno, što se u velikoj meri može objasniti rastom nezaposlenosti uzrokovanim privatizacijama velikih društvenih preduzeća u tom periodu. Nakon rasta priliva stranih direktnih investicija i smanjenja stope nezaposlenosti znatno je smanjeno i siromaštvo, koje je minimum dostiglo 2008. godine. Negativna kretanja u privredi izazvana Svetskom ekonomskom krizom su uticala na rast siromaštva nakon 2008. godine. Na osnovu raspoloživih podataka utvrđen je veoma visok stepen pozitivne korelacije između stope nezaposlenosti i siromaštva (merenog procentom populacije koja živi sa manje od 5 USD dnevno) u Srbiji, koji meren Pirsonovim koeficijentom iznosi 0,82. Regresionom analizom dobijen je model uticaja nezaposlenosti na siromaštvo u Srbiji oblika:
Procenat populacije sa dnevnim dohotkom manjim od 5 USD = -13,99 + 1,77 x U + ε
gde U predstavlja stopu nezaposlenosti, a ε - slučajnu grešku, kojom se obuhvata uticaj svih ostalih faktora osim stope nezaposlenosti. Dobijeni koeficijent determinacije od 0,68
Grafikon 2. Kretanje proseka bruto zarada u privredi Srbije i sektorima prerađivačke industije, finansijskog posredovanja, obrazovanja i zdravstvene i socijalne zaštite u periodu 2002-2015, podaci dati u RSD
Izvor: Republički zavod za statistiku (www.stat.rs). Pristup 13.06.2016. godine.
Kastratović R.Uticaj stranih direktnih investicija na
privredni i društveni razvoj SrbijeBankarstvo, 2016, vol. 45, br. 4 86
the existing production more intensively which consequently had a positive impact on employment. Still. the unemployment remains one of the greatest problems of the Serbian economy and in the first quarter of 2016. according to the data provided by the Statistical Office of the Republic of Serbia the unemployment rate was 19.0%. which was largely influenced by the Global Economic Crisis.
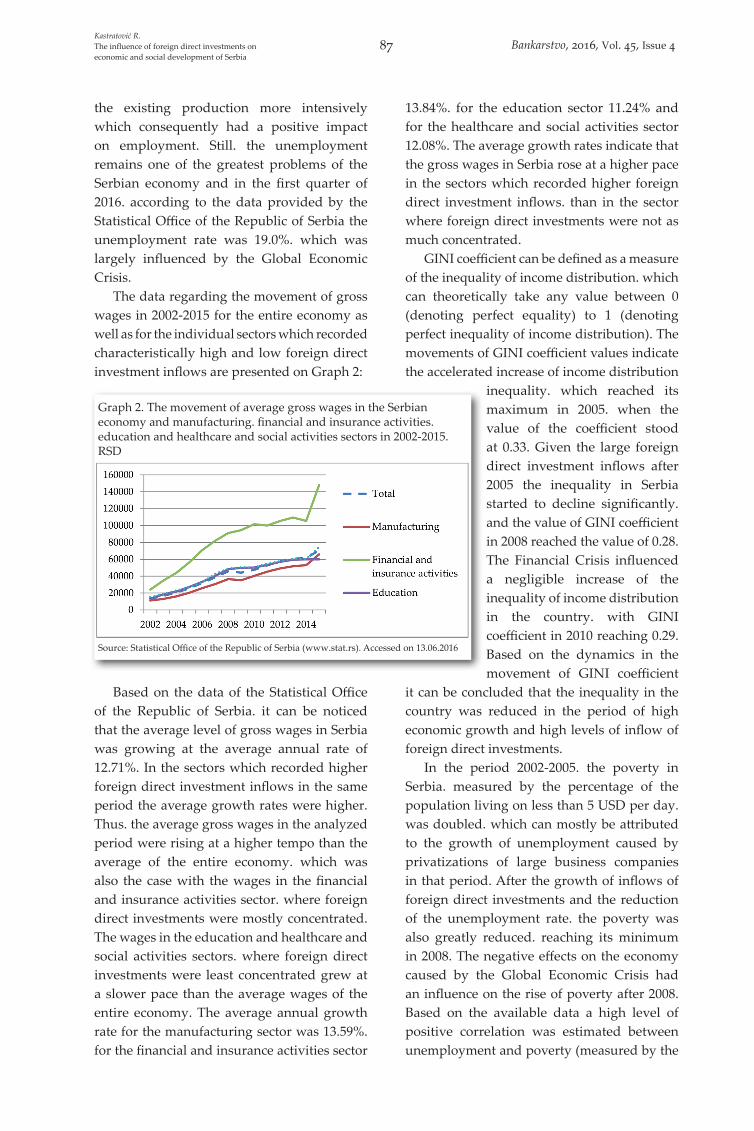
The data regarding the movement of gross wages in 2002-2015 for the entire economy as well as for the individual sectors which recorded characteristically high and low foreign direct investment inflows are presented on Graph 2:
Based on the data of the Statistical Office of the Republic of Serbia. it can be noticed that the average level of gross wages in Serbia was growing at the average annual rate of 12.71%. In the sectors which recorded higher foreign direct investment inflows in the same period the average growth rates were higher. Thus. the average gross wages in the analyzed period were rising at a higher tempo than the average of the entire economy. which was also the case with the wages in the financial and insurance activities sector. where foreign direct investments were mostly concentrated. The wages in the education and healthcare and social activities sectors. where foreign direct investments were least concentrated grew at a slower pace than the average wages of the entire economy. The average annual growth rate for the manufacturing sector was 13.59%. for the financial and insurance activities sector
13.84%. for the education sector 11.24% and for the healthcare and social activities sector 12.08%. The average growth rates indicate that the gross wages in Serbia rose at a higher pace in the sectors which recorded higher foreign direct investment inflows. than in the sector where foreign direct investments were not as much concentrated.
GINI coefficient can be defined as a measure of the inequality of income distribution. which can theoretically take any value between 0 (denoting perfect equality) to 1 (denoting perfect inequality of income distribution). The movements of GINI coefficient values indicate the accelerated increase of income distribution
inequality. which reached its maximum in 2005. when the value of the coefficient stood at 0.33. Given the large foreign direct investment inflows after 2005 the inequality in Serbia started to decline significantly. and the value of GINI coefficient in 2008 reached the value of 0.28. The Financial Crisis influenced a negligible increase of the inequality of income distribution in the country. with GINI coefficient in 2010 reaching 0.29. Based on the dynamics in the movement of GINI coefficient
it can be concluded that the inequality in the country was reduced in the period of high economic growth and high levels of inflow of foreign direct investments.
In the period 2002-2005. the poverty in Serbia. measured by the percentage of the population living on less than 5 USD per day. was doubled. which can mostly be attributed to the growth of unemployment caused by privatizations of large business companies in that period. After the growth of inflows of foreign direct investments and the reduction of the unemployment rate. the poverty was also greatly reduced. reaching its minimum in 2008. The negative effects on the economy caused by the Global Economic Crisis had an influence on the rise of poverty after 2008. Based on the available data a high level of positive correlation was estimated between unemployment and poverty (measured by the
Graph 2. The movement of average gross wages in the Serbian economy and manufacturing. financial and insurance activities. education and healthcare and social activities sectors in 2002-2015. RSD
Source: Statistical Office of the Republic of Serbia (www.stat.rs). Accessed on 13.06.2016
Kastratović R.The influence of foreign direct investments on economic and social development of Serbia
87 Bankarstvo, 2016, Vol. 45, Issue 4
ukazuje da model dobro objašnjava kretanje siromaštva preko kretanja nezaposlenosti, mada treba imati u vidu da nezaposlenost nije jedini faktor koji utiče na siromaštvo. Ukoliko pretpostavimo da je nezaposlenost jedini faktor koji utiče na siromaštvo, smanjenje stope nezaposlenosti za jedan procentni poen dovodi do smanjenja udela populacije sa dnevnim dohotkom manjim od 5 USD u ukupnoj populaciji za najmanje 0,69, a najviše 2,85 procentna poena, uz koeficijent poverenja 95%. Iz toga možemo zaključiti da su smanjenje nezaposlenosti, a samim tim i strane direktne investicije (posebno u formi greenfield ulaganja), od izuzetnog značaja za smanjenje siromaštva u zemlji.
Na osnovu prethodnih razmatranja može se zaključiti da su strane direktne investicije u Srbiji uopšte, a posebno nakon 2005. godine, imale uticaja ne samo na privredni rast, već i na rast zaposlenosti, jednakosti i smanjenje siromaštva u zemlji. Iz tog razloga može se reći da je su u Srbiji strane direktne investicije u posmatranom periodu povoljno uticale na celokupan privredni i društveni razvoj zemlje.
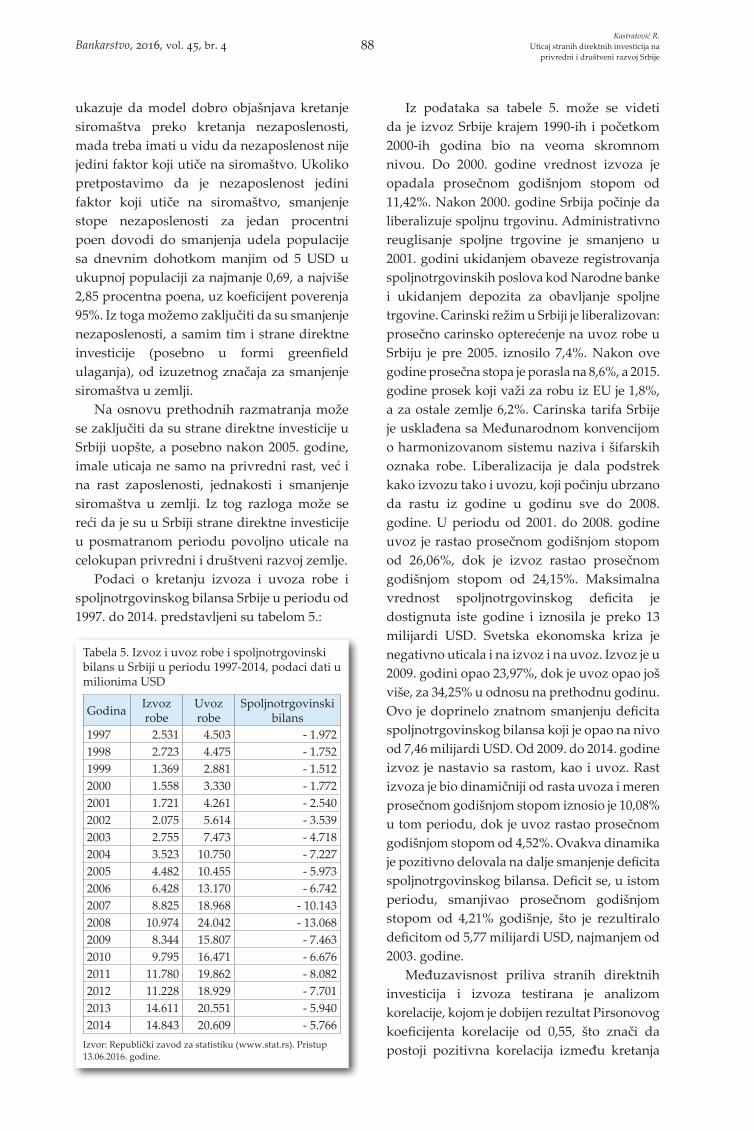
Podaci o kretanju izvoza i uvoza robe i spoljnotrgovinskog bilansa Srbije u periodu od 1997. do 2014. predstavljeni su tabelom 5.:
Iz podataka sa tabele 5. može se videti da je izvoz Srbije krajem 1990-ih i početkom 2000-ih godina bio na veoma skromnom nivou. Do 2000. godine vrednost izvoza je opadala prosečnom godišnjom stopom od 11,42%. Nakon 2000. godine Srbija počinje da liberalizuje spoljnu trgovinu. Administrativno reuglisanje spoljne trgovine je smanjeno u 2001. godini ukidanjem obaveze registrovanja spoljnotrgovinskih poslova kod Narodne banke i ukidanjem depozita za obavljanje spoljne trgovine. Carinski režim u Srbiji je liberalizovan: prosečno carinsko opterećenje na uvoz robe u Srbiju je pre 2005. iznosilo 7,4%. Nakon ove godine prosečna stopa je porasla na 8,6%, a 2015. godine prosek koji važi za robu iz EU je 1,8%, a za ostale zemlje 6,2%. Carinska tarifa Srbije je usklađena sa Međunarodnom konvencijom o harmonizovanom sistemu naziva i šifarskih oznaka robe. Liberalizacija je dala podstrek kako izvozu tako i uvozu, koji počinju ubrzano da rastu iz godine u godinu sve do 2008. godine. U periodu od 2001. do 2008. godine uvoz je rastao prosečnom godišnjom stopom od 26,06%, dok je izvoz rastao prosečnom godišnjom stopom od 24,15%. Maksimalna vrednost spoljnotrgovinskog deficita je dostignuta iste godine i iznosila je preko 13 milijardi USD. Svetska ekonomska kriza je negativno uticala i na izvoz i na uvoz. Izvoz je u 2009. godini opao 23,97%, dok je uvoz opao još više, za 34,25% u odnosu na prethodnu godinu. Ovo je doprinelo znatnom smanjenju deficita spoljnotrgovinskog bilansa koji je opao na nivo od 7,46 milijardi USD. Od 2009. do 2014. godine izvoz je nastavio sa rastom, kao i uvoz. Rast izvoza je bio dinamičniji od rasta uvoza i meren prosečnom godišnjom stopom iznosio je 10,08% u tom periodu, dok je uvoz rastao prosečnom godišnjom stopom od 4,52%. Ovakva dinamika je pozitivno delovala na dalje smanjenje deficita spoljnotrgovinskog bilansa. Deficit se, u istom periodu, smanjivao prosečnom godišnjom stopom od 4,21% godišnje, što je rezultiralo deficitom od 5,77 milijardi USD, najmanjem od 2003. godine.
Međuzavisnost priliva stranih direktnih investicija i izvoza testirana je analizom korelacije, kojom je dobijen rezultat Pirsonovog koeficijenta korelacije od 0,55, što znači da postoji pozitivna korelacija između kretanja
Tabela 5. Izvoz i uvoz robe i spoljnotrgovinski bilans u Srbiji u periodu 1997-2014, podaci dati u milionima USD
Godina Izvoz robe
Uvoz robe
Spoljnotrgovinski bilans
1997 2.531 4.503 - 1.9721998 2.723 4.475 - 1.7521999 1.369 2.881 - 1.5122000 1.558 3.330 - 1.7722001 1.721 4.261 - 2.5402002 2.075 5.614 - 3.5392003 2.755 7.473 - 4.7182004 3.523 10.750 - 7.2272005 4.482 10.455 - 5.9732006 6.428 13.170 - 6.7422007 8.825 18.968 - 10.1432008 10.974 24.042 - 13.0682009 8.344 15.807 - 7.4632010 9.795 16.471 - 6.6762011 11.780 19.862 - 8.0822012 11.228 18.929 - 7.7012013 14.611 20.551 - 5.9402014 14.843 20.609 - 5.766
Izvor: Republički zavod za statistiku (www.stat.rs). Pristup 13.06.2016. godine.
Kastratović R.Uticaj stranih direktnih investicija na
privredni i društveni razvoj SrbijeBankarstvo, 2016, vol. 45, br. 4 88
share of the population living on less than 5 USD per day) in Serbia. which. measured by the Pearson’s coefficient. equals 0.82. A model of the influence of unemployment on poverty in Serbia was estimated by applying the regression analysis:
The percentage of the population with daily income less than 5 USD = -13,99 + 1,77 x U + ε
where U - denotes the unemployment rate and ε - random error. which includes the influence of all other factors except the unemployment rate. The calculated determination coefficient of 0.68 suggests that the model can explain the movement of poverty by the movement of unemployment well. however it should be noted that the unemployment is not the only factor influencing poverty. With the assumption that unemployment is the only factor influencing poverty. the model estimates that the reduction of the unemployment by one percentage point reduces the share of population living with a daily income less than 5 USD by at least 0.69 and at most 2.85 percentage points. the confidence coefficient standing at 95%. Based on this. a conclusion can be drawn that the reduction of unemployment. and with it also of foreign direct investments (especially in the form of greenfield investments) had a significant impact on the reduction of poverty in the country.
Based on the presented analysis it can be concluded that the foreign direct investments in Serbia generally. and especially after 2005. had an impact not only on the economic growth. but also on the growth of employment. equality and the reduction of poverty in the country. For this reason it can be argued that foreign direct investments in the analyzed period affected the general economic and social development of Serbia in a positive manner.
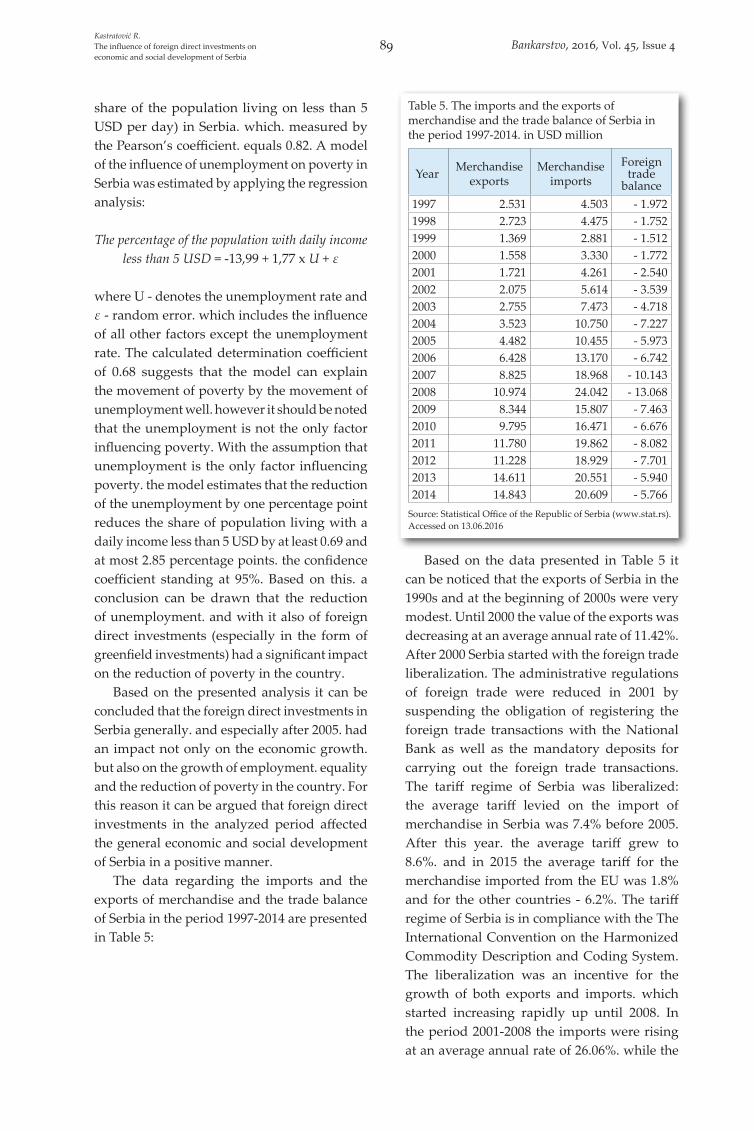
The data regarding the imports and the exports of merchandise and the trade balance of Serbia in the period 1997-2014 are presented in Table 5:
Based on the data presented in Table 5 it can be noticed that the exports of Serbia in the 1990s and at the beginning of 2000s were very modest. Until 2000 the value of the exports was decreasing at an average annual rate of 11.42%. After 2000 Serbia started with the foreign trade liberalization. The administrative regulations of foreign trade were reduced in 2001 by suspending the obligation of registering the foreign trade transactions with the National Bank as well as the mandatory deposits for carrying out the foreign trade transactions. The tariff regime of Serbia was liberalized: the average tariff levied on the import of merchandise in Serbia was 7.4% before 2005. After this year. the average tariff grew to 8.6%. and in 2015 the average tariff for the merchandise imported from the EU was 1.8% and for the other countries - 6.2%. The tariff regime of Serbia is in compliance with the The International Convention on the Harmonized Commodity Description and Coding System. The liberalization was an incentive for the growth of both exports and imports. which started increasing rapidly up until 2008. In the period 2001-2008 the imports were rising at an average annual rate of 26.06%. while the
Table 5. The imports and the exports of merchandise and the trade balance of Serbia in the period 1997-2014. in USD million
Year Merchandise exports
Merchandise imports
Foreign trade
balance1997 2.531 4.503 - 1.9721998 2.723 4.475 - 1.7521999 1.369 2.881 - 1.5122000 1.558 3.330 - 1.7722001 1.721 4.261 - 2.5402002 2.075 5.614 - 3.5392003 2.755 7.473 - 4.7182004 3.523 10.750 - 7.2272005 4.482 10.455 - 5.9732006 6.428 13.170 - 6.7422007 8.825 18.968 - 10.1432008 10.974 24.042 - 13.0682009 8.344 15.807 - 7.4632010 9.795 16.471 - 6.6762011 11.780 19.862 - 8.0822012 11.228 18.929 - 7.7012013 14.611 20.551 - 5.9402014 14.843 20.609 - 5.766
Source: Statistical Office of the Republic of Serbia (www.stat.rs). Accessed on 13.06.2016
Kastratović R.The influence of foreign direct investments on economic and social development of Serbia
89 Bankarstvo, 2016, Vol. 45, Issue 4
priliva stranih direktnih investicija i vrednosti robnog izvoza. Kako bi se utvrdila priroda veze posmatranih tokova, urađena je i regresiona analiza. Regresionom analizom je utrvđen koeficijent determinacije od 30,22%, što znači da su strane direktne investicije samo jedan od faktora koji utiču na kretanje izvoza robe u Srbiji. Analizom je dobijen model oblika:
X = 3916 + 2,02 x SDIp + ε
gde su X - vrednost izvoza robe, SDIp - prilivi stranih direktnih investicija i ε - slučajna greška, kojom se obuhvata uticaj svih ostalih faktora na kretanje izvoza. Treba pomenuti da je pretpostavljen vremenski razmak od jedne godine između priliva investicije i registrovanja njenih efekata na izvoz Srbije. Na bazi ovog modela, procena je da svaki dolar stranih direktnih investicija u Srbiji jednoznačno doprinosi povećanju izvoza, i to najmanje za 0,33, a najviše za 3,71 dolara, uz pretpostavku da svi ostali faktori koji utiču na povećanje ili smanjenje izvoza ostanu konstantni i uz koeficijent poverenja od 95%.
Što se strukture izvoza tiče, 2000. godine, pre intenziviranja tokova stranih direktnih investicija, u Srbiji je repromaterijal imao najveće učeće u izvozu (57,3%), zatim roba široke potrošnje (34,8%) i oprema (7,8%). Sudeći po konačnim podacima o spoljnotrgovinskoj razmeni Srbije za 2014. nakon perioda velikih priliva stranih direktnih investicija i rasta obima izvoza, struktura izvoza Srbije se nije bitno promenila. I dalje repromaterijal ima najveće učešće u izvozu, s tim što je ono malo smanjeno i sada iznosi 52,4%. Slede roba za široku potrošnju, čije je učešće povećano na 39,9% i oprema čije je učešće ostalo na sličnom nivou i iznosi 7,7%.
Najvažnije zemlje u koje je Srbija izvozila 2000. godine bile su Bosna i Hercegovina (sa učešćem u ukupnom izvozu od 15,3%), Italija (13,4%), Makedonija (13,2%), Nemačka (11,3%) i Rusija (4,7%). Glavni spoljnotrgovinski partneri Srbije u izvozu su 2014. godine bili Italija (koja je u ukupnom izvozu Srbije 2014. godine učestvovala sa 17,36%), Nemačka (11,94%), Bosna i Hercegovina (8,89%), Rusija (6,93%) i Rumunija (5,59%). Učešće izvoza Srbije u Evropsku uniju je u posmatranom periodu
povećano sa 40,3% na 63,7%. Najznačajnije grupe izvoznih proizvoda u Srbiji su drumska vozila, električne mašine i aparati, žitarice, povrće i voće i odevni predmeti, čija ukupna vrednost izvoza čini 36,3% izvoza Srbije.
Iz priloženog se može izvesti nedvosmislen zaključak da strane direktne investicije u Srbiji imaju pozitivan uticaj na rast izvoza. Kada je u pitanju izvoz, treba posebno imati u vidu da je daleko značajnije u koje sektore i sa kojim motivom su sredstva plasirana od zbirnog obima investicija. Može se primetiti i da su strane direktne investicije povećale zavisnost Srbije od kretanja u privrednom okruženju Evropske unije. Pri tome struktura spoljne trgovine Srbije nije popravljena, te se i dalje u velikoj meri zasniva na trgovini repromaterijalom i poluproizvodima. Takva situacija ukazuje na to da se Srbija trenutno nalazi u poluproizvodnoj fazi uključivanja u globalne lance vrednosti. Povećanje izvozne konkurentnosti i tehnološkog nivoa Srbije dovelo bi do više faze uključivanja naše zemlje u globalne lance vrednosti, što bi omogućilo dodatno povećanje izvoza i dovelo do rekompozicije strukture izvoza. Na taj način bi mogao biti smanjen visok udeo repromaterijala u ukupnom izvozu, a povećan udeo robe široke potrošnje. Tome bi mogao doprineti i viši obim stranih direktnih investicija koje bi podstakle podizanje tehnološkog nivoa i inovativne aktivnosti u preduzećima u Srbiji i usklađivanje domaće izvozne ponude sa strukturom svetske uvozne tražnje.
Zaključak
Strane direktne investicije se mogu definisati kao vid međunarodnog kretanja kapitala, gde ulagač, rezident jedne zemlje, investira u preduzeće koje je rezident druge zemlje, radi ostvarivanja trajnog interesa i kontrole nad tim preduzećem i obuhvataju ulaganja u vlasnički kapital, reinvestirane zarade i unutarkompanijske pozajmice.
Poslednjih decenija, sa globalizacijom i liberalizacijom međunarodne trgovine, liberalizovano je i tržište kapitala što je dovelo do velikog rasta značaja stranih direktnih investicija u svetu. Kod zemalja u razvoju one predstavljaju jedan od pokretača privrednog
Kastratović R.Uticaj stranih direktnih investicija na
privredni i društveni razvoj SrbijeBankarstvo, 2016, vol. 45, br. 4 90
exports were growing at an average annual rate of 24.15%. The maximum value of the trade deficit was reached in 2008 and stood at 13 billion USD. The Global Economic Crisis had a negative impact on both exports and imports. The exports declined by 23.97% in 2009. with the import of the same year recorded an even sharper decline by 34.25%. compared to the previous year. This contributed to the significant reduction of trade deficit which fell to the level of 7.46 billion USD. In the period 2009 to 2014 the exports continued to grow. as well as the imports. The export growth was stronger than the import growth. the average annual rate of the export growth being 10.08% in the observed period. while the imports grew at an average annual rate of 4.52%. Such dynamics had a positive impact on the further reduction of the trade deficit. The deficit. in the same observed period. was reducing at an average annual rate of 4.21% which resulted in the deficit at the level of 5.77 billion USD. which was the lowest level of deficit since 2003.
The interdependence of the foreign direct investment inflows and the exports was tested by the correlation analysis. which returned the value of the Pearson’s coefficient of 0.55. which implies the existence of a positive correlation between the movement in the foreign direct investment inflows and the values of the exports of merchandise. In order to determine the nature of the relationship of the observed flows. the regression analysis was used. The regression analysis returned the determination coefficient of 30.22%. which suggests that the foreign direct investments are just one of the many factors influencing the movement of the merchandise exports in Serbia. The analysis also returned the following estimated model:
X = 3916 + 2,02 x FDI + ε
where X denotes the value of the merchandise exports. FDI - the foreign direct investment inflows and ε - random error. which includes the influences of all other factors affecting the movement of the exports. It should also be noted that it was assumed that a time lag of one year exists between the recorded inflow of foreign direct investments and its effect on the exports of Serbia. Based on this model. it is estimated
that every dollar of foreign direct investments in Serbia causes the increase of the exports by at least 0.33 and at most 3.71 dollars. assuming that all other factors affecting the increase and decrease of the exports remain constant. with the confidence coefficient of 95%.
The export structure of Serbia in 2000 indicates that. before the flows of foreign direct investments intensified. the raw materials had the largest share in the Serbian exports (57.3%). followed by consumer goods (34.8%) and capital goods (7.8%). Based on the data regarding the foreign trade of Serbia in 2014. after the period of high foreign direct investment inflows. the structure of the Serbian exports did not change significantly. Raw materials remain dominant in exports. although their share is slightly reduced to 52.4%. Raw materials are followed by consumer goods. which increased their share in exports to 39.9% and capital goods. whose share remained relatively constant (7.7%).
The most important export destinations for Serbia in 2000 were Bosnia and Herzegovina (with the 15.3% share in total exports). Italy (13.4%). Macedonia (13.2%). Germany (11.3%) and Russia (4.7%). The most important export partners of Serbia in 2014 were Italy (with the 17.36% share in total Serbian exports in 2014). Germany (11.94%). Bosnia and Herzegovina (8.89%). Russia (6.93%) and Romania (5.59%). The most important groups of exported goods in Serbia were motor vehicles. electrical machines and appliances. wheat. vegetables and fruits and clothing. whose total value of exports make up for 36.3% of the Serbian exports.
From the presented data it can be unambiguously concluded that foreign direct investments in Serbia have a positive impact on the export growth. It is important to take into account that. for exports. it is considerably more important in which sectors the foreign direct investments were concentrated and what was the motivation for these investments. rather than the total volume of foreign direct investments. It can be noticed that foreign directs investments increased the dependence of Serbia on the changes of the European Union’s economic environment. Thereby. the structure of the Serbian trade was not improved. being highly dependent on the raw materials and semi-products trade. This situation indicates
Kastratović R.The influence of foreign direct investments on economic and social development of Serbia
91 Bankarstvo, 2016, Vol. 45, Issue 4
rasta i razvoja i imaju značajan uticaj na zapošljavanje, platni bilans, spoljnu trgovinu, povećanje produktivnosti i transfer novih tehnologija.
Analiza uticaja stranih direktnih investicija na privredni i društveni razvoj Srbije, kao i na stepen njene međunarodne integracije u ovom radu je pokazala da strane direktne investicije utiču na ubrzavanje privrednog rasta, smanjenje nezaposlenosti, nejednakosti i siromaštva i povećanje izvoza u Srbiji. One su potencijalno značajne i zbog transfera novih tehnologija i metoda upravljanja, kao i mogućih efekata prelivanja na ostala preduzeća koja posluju u zemlji. Iako je Srbija ostvarila značajne prilive stranih direktnih investicija, kada se uzme u obzir broj stanovnika ona i dalje zaostaje za zemljama iz regiona koje su članice Evropske unije kao i za Crnom Gorom. Više faktora su negativno uticali na prilive stranih direktnih investicija u Srbiji: problemi u zakonskoj regulativi, nerešeni vlasnički odnosi, neefikasno sudstvo, nedosledno sprovođenje sistema katastra, nerazvijena infrastruktura, zakasnelost reformi, visoki porezi i uopšte nepovoljan privredni ambijent. Ovo su ključni problemi koje je potrebno rešiti, kako bi u budućnosti priliv stranih direktnih investicija u Srbiji bio povećan.
Literatura / References
1. Kovačević, Radovan. Ekonomski odnosi Srbije sa inostranstvom. Beograd: Centar za izdavačku delatnost Ekonomskog fakulteta u Beogradu, 2012.
2. Kovačević, Radovan. Međunarodno tržište kapitala: savremene tendencije. Beograd: Centar za izdavačku delatnost Ekonomskog fakulteta u Beogradu, 2012.
3. Kozomara, Jelena. Osnove međunarodnog poslovanja. Beograd: Centar za izdavačku delatnost Ekonomskog fakulteta u Beogradu, 2013.
4. Kozomara, Jelena; Stojadinović Jovanović, Sandra. Međunarodno poslovno finansiranje. Beograd: Centar za izdavačku delatnost Ekonomskog fakulteta u Beogradu, 2011.
5. Moosa, Imad A. Foreign Direct Investment: Theory, Evidence and Practice. New York: Palgrave Macmilan, 2002.
6. Narodna banka Srbije. Zvanični veb sajt. www.nbs.rs.
7. Obradović, Zoran. Uticaj vlasništva na kvalitet korporativnog upravljanja u Srbiji. Beograd: Univerzitet Singidunum, 2013.
8. OECD. Benchmark Definition of Foreign Direct Investment: Fourth Edition. 2008.
9. Republički zavod za statistiku. Baza podataka. Adresa: www.stat.rs. Datum pristupa: 13.06.2016.
10. UNCTAD. FDI/MINE baza podataka. Adresa: unctadstat.unctad.org Datum pristupa: 13.06.2016.
11. World Bank. Statistika Svetske banke. Adresa: data.worldbank.org. Datum pristupa 30.01.2016.
12. World Trade Organization. Statistika međunarodne trgovine. Adresa: stat.wto.org. Datum pristupa: 13.06.2016.
Kastratović R.Uticaj stranih direktnih investicija na
privredni i društveni razvoj SrbijeBankarstvo, 2016, vol. 45, br. 4 92
that Serbia is currently in the stage of semi-products involvement in the global value chains. The increase of export competitiveness and technology levels of Serbia would move the country higher up the global value chains. which would allow the exports to further increase and would reorganize the export structure. This would lead to the reduction of the high share of raw materials in total exports. and would increase the share of consumer goods. The contribution to this could also be made by a higher volume of foreign direct investments which would encourage the rise of the level of technology and the innovative activities of the Serbian companies as well as the harmonization of domestic export supply with the structure of the global import demand.
Conclusion
Foreign direct investments can be defined as a form of international movement of capital. where an investor. a resident of a country. invests in an enterprise which is a resident of a different country in order to obtain a lasting interest and control over the foreign enterprise. It comprises investments in equity capital. reinvested earnings and intercompany loans.
In the last several decades. along with globalization and international trade liberalization. the capital markets were also liberalized which led to a sharp increase in the importance of foreign direct investments globally. In the developing countries. foreign
direct investments are one the drivers of economic growth and development and have a significant influence on employment. balance of payments. foreign trade. increase of productivity and transfer of new technologies.
The analysis of the influences of foreign direct investments on economic and social developments of Serbia. as well as its level of international integration in this article has demonstrated that foreign direct investments have an impact on the acceleration of economic growth. the reduction of unemployment. inequality and poverty and the increase of exports in Serbia. In addition to that. they are important for the transfer of new technologies and new management methods as well as for the possible spillover effects affecting other companies doing business in the country. Although Serbia did attract significant levels of foreign direct investments. when the population is taken into account. it still lags behind other countries in the region which are the European Union member states. as well as behind Montenegro. The factors which affected the foreign direct investment inflows are numerous and include: the problems regarding regulations. unresolved property issues. inefficient. inconsistent implementation of the cadaster system practices. insufficiently developed infrastructure. lagging reforms. high taxes and an overall negative business environment. These are the key issues which must be addressed in order to increase the foreign direct investment inflows in the future.
Kastratović R.The influence of foreign direct investments on economic and social development of Serbia
93 Bankarstvo, 2016, Vol. 45, Issue 4