Embed Size (px)
Citation preview
Page 1
Veraison to HarVestStatewide Vineyard Crop Development Update #9
November 6, 2016Edited by Tim Martinson and Chris Gerling
People always ask me, and probably ask you if you’re reading this, “how are the grapes looking this year?” In three of the past four years, the answer from April to Labor Day has mostly been some version of a shrug (“Hard to say…I don’t know…not sure”).
Right. Yes, if you actually work in vineyards, the an-swer is long and detailed, probably involving gestures, definitely involving swearing, eventually resulting in the question-asker making a hasty retreat when the vineyard worker pauses to wipe a tear from his or her eye. It’s always hard to make early predictions, but in many years there has been an enormous range of pos-sible scenarios, from raging success to outright fiasco.
It hasn’t been easy. The seasonal team has been strug-gling. Winter’s been hogging lines and stepping on ev-eryone’s toes. Summer seems to lose focus.
Long Island: Merlot harvested at Macari Vineyards, Mattituck, NY.Photo Courtesy Macari VineyardsFinal Issue...
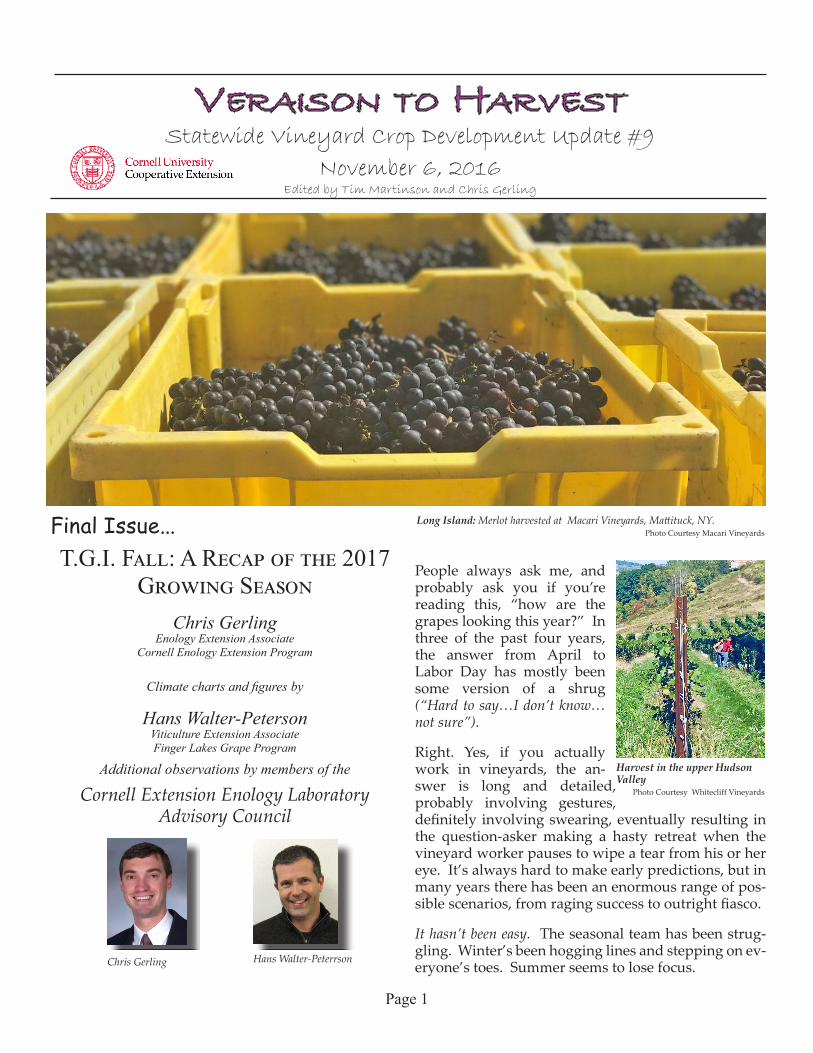
T.G.I. Fall: A Recap of the 2017 Growing Season
Chris GerlingEnology Extension Associate
Cornell Enology Extension Program
Climate charts and figures by
Hans Walter-PetersonViticulture Extension Associate Finger Lakes Grape Program
Additional observations by members of the
Cornell Extension Enology Laboratory Advisory Council
Chris Gerling Hans Walter-Peterrson
Harvest in the upper Hudson Valley
Photo Courtesy Whitecliff Vineyards
Page 2
Spring—okay I’ll say it because we’ve all noticed and someone has to say something—spring just doesn’t seem to care enough to show up when it’s supposed to—if it even has the common courte-sy to show up at all. Spring has not been a team player.
Fall, on the other hand, fall has really been com-ing through. When it comes to making wine in New York, fall has been playing a critical role in the quality and maturity of agricultural products statewide. Such was the case in 2014 and 2015, and once more in 2017. Let’s review.
Winter. N/A. Hallelujah! Winter has been trying to elbow its way into this article for years now, with varying degrees of success. “Spring’s not even trying,” it says. “I’m where the real drama happens,” it says.
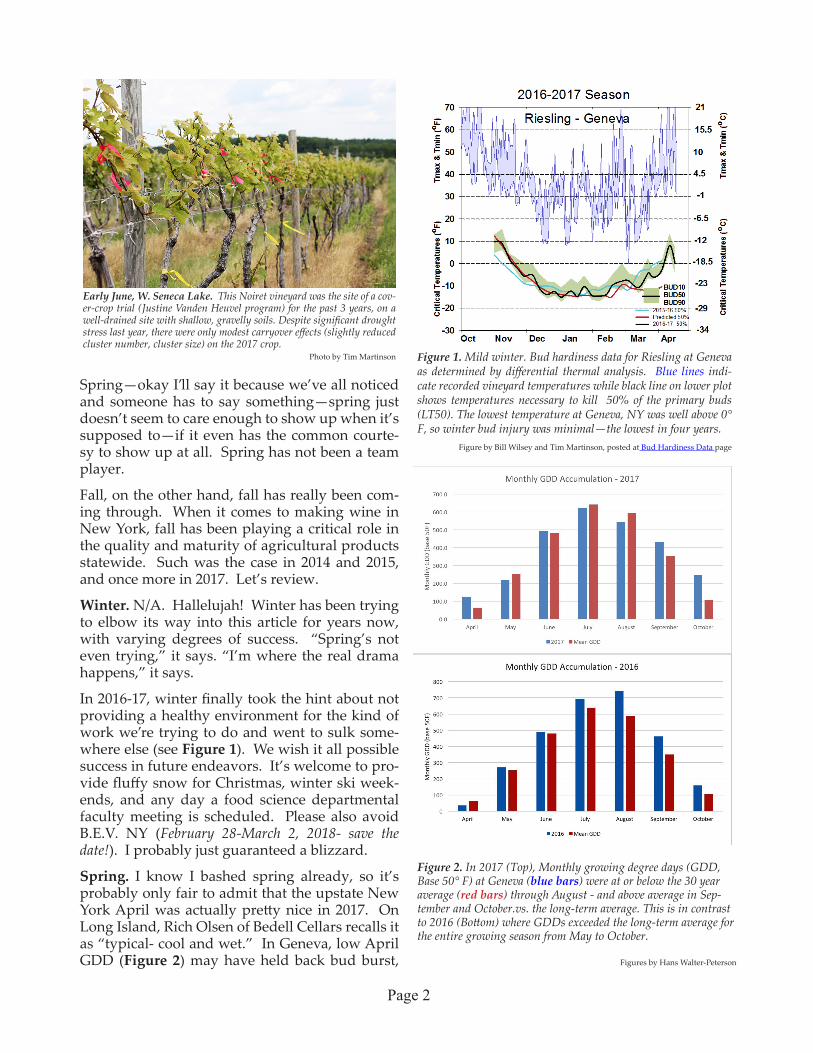
In 2016-17, winter finally took the hint about not providing a healthy environment for the kind of work we’re trying to do and went to sulk some-where else (see Figure 1). We wish it all possible success in future endeavors. It’s welcome to pro-vide fluffy snow for Christmas, winter ski week-ends, and any day a food science departmental faculty meeting is scheduled. Please also avoid B.E.V. NY (February 28-March 2, 2018- save the date!). I probably just guaranteed a blizzard.
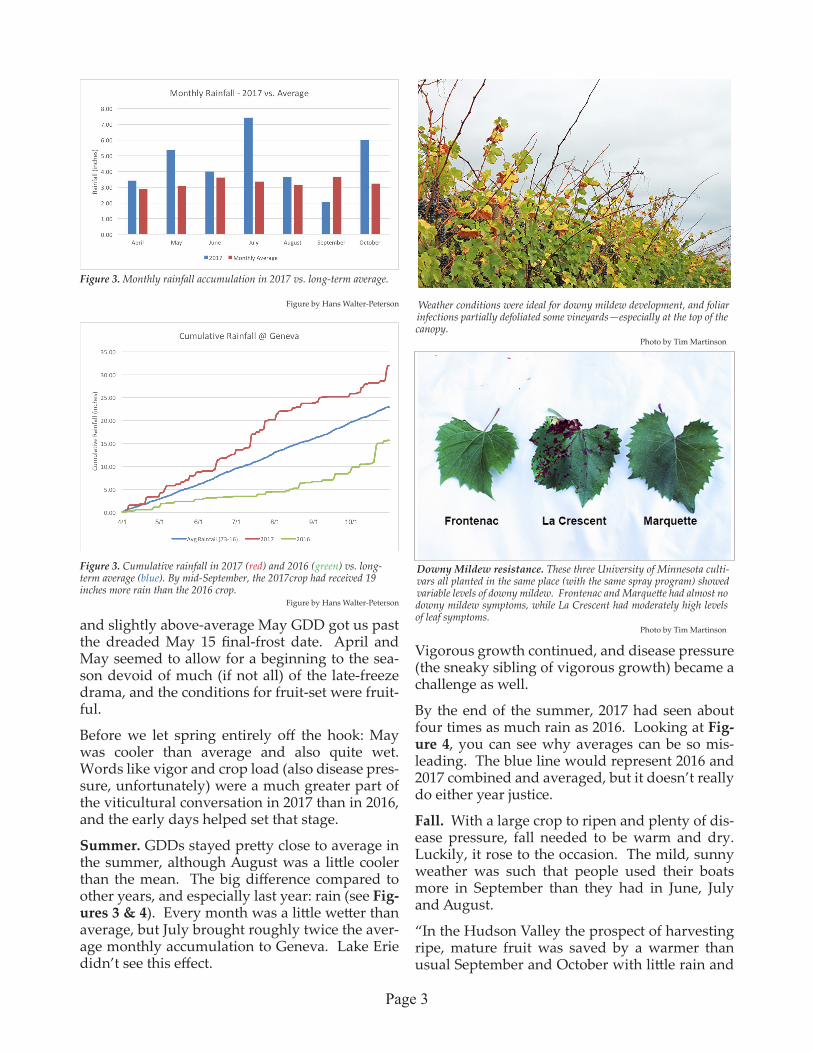
Spring. I know I bashed spring already, so it’s probably only fair to admit that the upstate New York April was actually pretty nice in 2017. On Long Island, Rich Olsen of Bedell Cellars recalls it as “typical- cool and wet.” In Geneva, low April GDD (Figure 2) may have held back bud burst,
Figure 1. Mild winter. Bud hardiness data for Riesling at Geneva as determined by differential thermal analysis. Blue lines indi-cate recorded vineyard temperatures while black line on lower plot shows temperatures necessary to kill 50% of the primary buds (LT50). The lowest temperature at Geneva, NY was well above 0° F, so winter bud injury was minimal—the lowest in four years.
Figure by Bill Wilsey and Tim Martinson, posted at Bud Hardiness Data page
Figure 2. In 2017 (Top), Monthly growing degree days (GDD, Base 50° F) at Geneva (blue bars) were at or below the 30 year average (red bars) through August - and above average in Sep-tember and October.vs. the long-term average. This is in contrast to 2016 (Bottom) where GDDs exceeded the long-term average for the entire growing season from May to October.
Figures by Hans Walter-Peterson
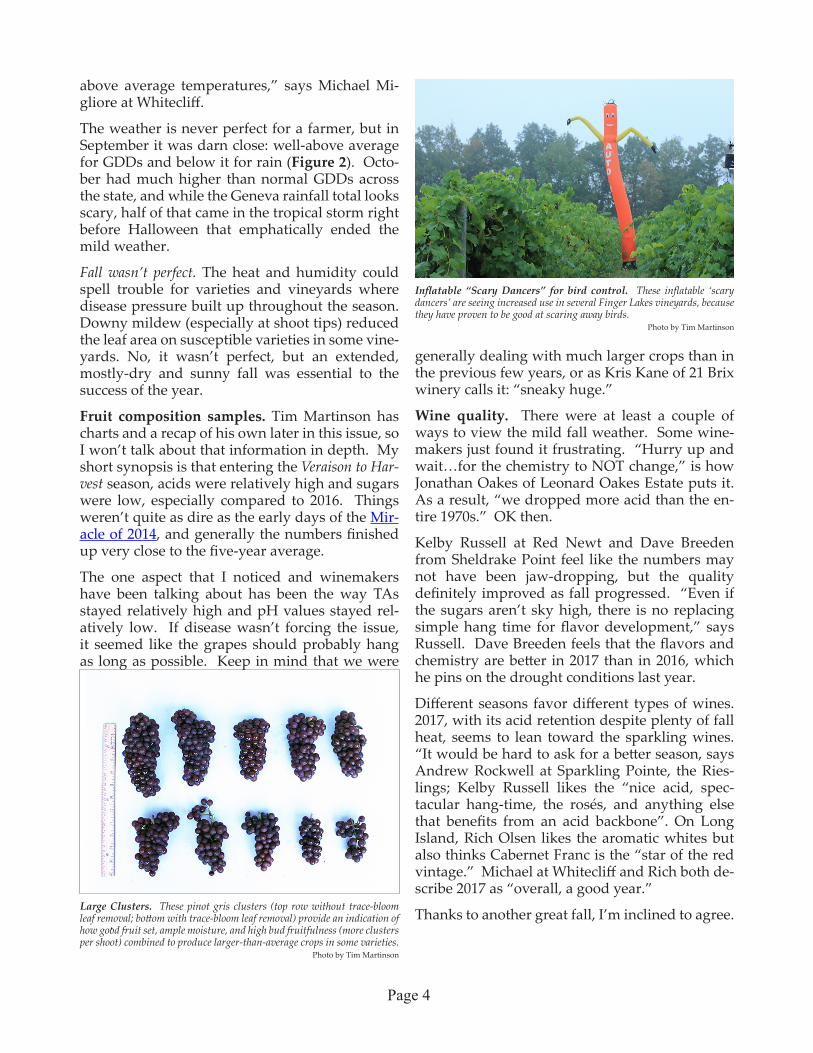
Early June, W. Seneca Lake. This Noiret vineyard was the site of a cov-er-crop trial (Justine Vanden Heuvel program) for the past 3 years, on a well-drained site with shallow, gravelly soils. Despite significant drought stress last year, there were only modest carryover effects (slightly reduced cluster number, cluster size) on the 2017 crop.
Photo by Tim Martinson
Page 3
Vigorous growth continued, and disease pressure (the sneaky sibling of vigorous growth) became a challenge as well.
By the end of the summer, 2017 had seen about four times as much rain as 2016. Looking at Fig-ure 4, you can see why averages can be so mis-leading. The blue line would represent 2016 and 2017 combined and averaged, but it doesn’t really do either year justice.
Fall. With a large crop to ripen and plenty of dis-ease pressure, fall needed to be warm and dry. Luckily, it rose to the occasion. The mild, sunny weather was such that people used their boats more in September than they had in June, July and August.
“In the Hudson Valley the prospect of harvesting ripe, mature fruit was saved by a warmer than usual September and October with little rain and
and slightly above-average May GDD got us past the dreaded May 15 final-frost date. April and May seemed to allow for a beginning to the sea-son devoid of much (if not all) of the late-freeze drama, and the conditions for fruit-set were fruit-ful.
Before we let spring entirely off the hook: May was cooler than average and also quite wet. Words like vigor and crop load (also disease pres-sure, unfortunately) were a much greater part of the viticultural conversation in 2017 than in 2016, and the early days helped set that stage.
Summer. GDDs stayed pretty close to average in the summer, although August was a little cooler than the mean. The big difference compared to other years, and especially last year: rain (see Fig-ures 3 & 4). Every month was a little wetter than average, but July brought roughly twice the aver-age monthly accumulation to Geneva. Lake Erie didn’t see this effect.
Figure 3. Monthly rainfall accumulation in 2017 vs. long-term average.
Figure by Hans Walter-Peterson Weather conditions were ideal for downy mildew development, and foliar infections partially defoliated some vineyards—especially at the top of the canopy.
Photo by Tim Martinson
Figure 3. Cumulative rainfall in 2017 (red) and 2016 (green) vs. long-term average (blue). By mid-September, the 2017crop had received 19 inches more rain than the 2016 crop.
Figure by Hans Walter-Peterson
Downy Mildew resistance. These three University of Minnesota culti-vars all planted in the same place (with the same spray program) showed variable levels of downy mildew. Frontenac and Marquette had almost no downy mildew symptoms, while La Crescent had moderately high levels of leaf symptoms.
Photo by Tim Martinson
Page 4
above average temperatures,” says Michael Mi-gliore at Whitecliff.
The weather is never perfect for a farmer, but in September it was darn close: well-above average for GDDs and below it for rain (Figure 2). Octo-ber had much higher than normal GDDs across the state, and while the Geneva rainfall total looks scary, half of that came in the tropical storm right before Halloween that emphatically ended the mild weather.
Fall wasn’t perfect. The heat and humidity could spell trouble for varieties and vineyards where disease pressure built up throughout the season. Downy mildew (especially at shoot tips) reduced the leaf area on susceptible varieties in some vine-yards. No, it wasn’t perfect, but an extended, mostly-dry and sunny fall was essential to the success of the year.
Fruit composition samples. Tim Martinson has charts and a recap of his own later in this issue, so I won’t talk about that information in depth. My short synopsis is that entering the Veraison to Har-vest season, acids were relatively high and sugars were low, especially compared to 2016. Things weren’t quite as dire as the early days of the Mir-acle of 2014, and generally the numbers finished up very close to the five-year average.
The one aspect that I noticed and winemakers have been talking about has been the way TAs stayed relatively high and pH values stayed rel-atively low. If disease wasn’t forcing the issue, it seemed like the grapes should probably hang as long as possible. Keep in mind that we were
generally dealing with much larger crops than in the previous few years, or as Kris Kane of 21 Brix winery calls it: “sneaky huge.”
Wine quality. There were at least a couple of ways to view the mild fall weather. Some wine-makers just found it frustrating. “Hurry up and wait…for the chemistry to NOT change,” is how Jonathan Oakes of Leonard Oakes Estate puts it. As a result, “we dropped more acid than the en-tire 1970s.” OK then.
Kelby Russell at Red Newt and Dave Breeden from Sheldrake Point feel like the numbers may not have been jaw-dropping, but the quality definitely improved as fall progressed. “Even if the sugars aren’t sky high, there is no replacing simple hang time for flavor development,” says Russell. Dave Breeden feels that the flavors and chemistry are better in 2017 than in 2016, which he pins on the drought conditions last year.
Different seasons favor different types of wines. 2017, with its acid retention despite plenty of fall heat, seems to lean toward the sparkling wines. “It would be hard to ask for a better season, says Andrew Rockwell at Sparkling Pointe, the Ries-lings; Kelby Russell likes the “nice acid, spec-tacular hang-time, the rosés, and anything else that benefits from an acid backbone”. On Long Island, Rich Olsen likes the aromatic whites but also thinks Cabernet Franc is the “star of the red vintage.” Michael at Whitecliff and Rich both de-scribe 2017 as “overall, a good year.”
Thanks to another great fall, I’m inclined to agree.
Inflatable “Scary Dancers” for bird control. These inflatable ‘scary dancers’ are seeing increased use in several Finger Lakes vineyards, because they have proven to be good at scaring away birds.
Photo by Tim Martinson
Large Clusters. These pinot gris clusters (top row without trace-bloom leaf removal; bottom with trace-bloom leaf removal) provide an indication of how good fruit set, ample moisture, and high bud fruitfulness (more clusters per shoot) combined to produce larger-than-average crops in some varieties.
Photo by Tim Martinson
Page 5
All major juice and wine processors have closed and very few grapes are left to be harvested for the small wineries. Temperatures in October were well above average – and some juice grape acreage required the October heat to ripen the crop. Much of the Lake Erie wine tonnage was much rip-er than average.
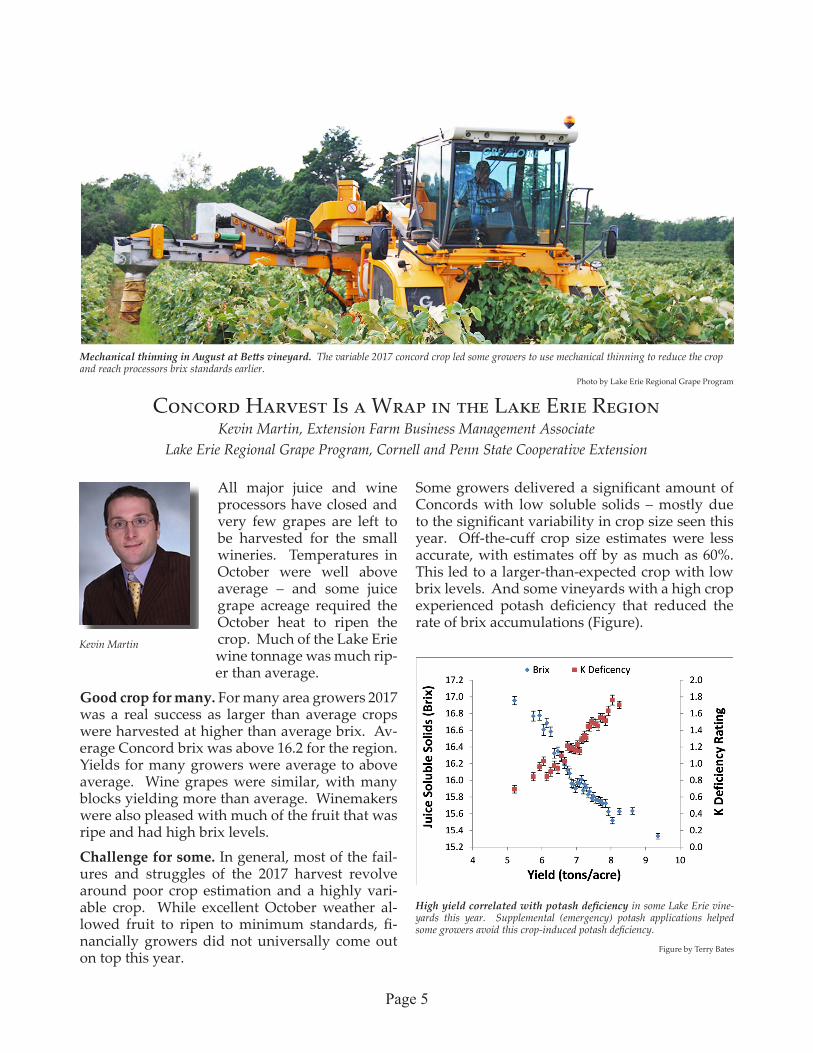
Good crop for many. For many area growers 2017 was a real success as larger than average crops were harvested at higher than average brix. Av-erage Concord brix was above 16.2 for the region. Yields for many growers were average to above average. Wine grapes were similar, with many blocks yielding more than average. Winemakers were also pleased with much of the fruit that was ripe and had high brix levels.
Challenge for some. In general, most of the fail-ures and struggles of the 2017 harvest revolve around poor crop estimation and a highly vari-able crop. While excellent October weather al-lowed fruit to ripen to minimum standards, fi-nancially growers did not universally come out on top this year.
Some growers delivered a significant amount of Concords with low soluble solids – mostly due to the significant variability in crop size seen this year. Off-the-cuff crop size estimates were less accurate, with estimates off by as much as 60%. This led to a larger-than-expected crop with low brix levels. And some vineyards with a high crop experienced potash deficiency that reduced the rate of brix accumulations (Figure).
Kevin Martin
Concord Harvest Is a Wrap in the Lake Erie RegionKevin Martin, Extension Farm Business Management Associate
Lake Erie Regional Grape Program, Cornell and Penn State Cooperative Extension
Mechanical thinning in August at Betts vineyard. The variable 2017 concord crop led some growers to use mechanical thinning to reduce the crop and reach processors brix standards earlier.
Photo by Lake Erie Regional Grape Program
High yield correlated with potash deficiency in some Lake Erie vine-yards this year. Supplemental (emergency) potash applications helped some growers avoid this crop-induced potash deficiency.
Figure by Terry Bates

Page 6
Crop-related K deficiency and low brix. For growers that delivered Concords with soluble solids below 15.0 °Brix, most will receive less than $180 per ton. Some will receive less than $100 per ton. There was a lack of thinning, a lack of emer-gency potash applications and significant disrup-tions for harvest logistics. These are the problems that arise when growers miss the mark on crop load management. At least in 2018, it did not ap-pear that growers were unwilling to make the in-vestments in ameliorating their crop load. Rather, growers that had high yields and over-cropped vines, were caught off-guard by their yields.
Despite some situations of over-cropped vines, nearly all (or all) growers reached the absolute minimum quality standards of 14.0 – 14.5° brix. But since processors changed their standards in 2012, growers need to aim for higher than the minimum brix levels to maximize profitabil-ity. Additionally, lower brix indicate that these vineyards were over-cropped. We expect this to reduce to 2018 tonnage for individual growers. Since crop load was so variable, it is not likely to impact overall quality or tonnage in 2018.
The wine grape growers faced similar crop esti-mation challenges. High-acid grapes, used as an ingredient for wine making by major processors such as Constellation Brands, was in short supply this season. This shortage extended across all ma-jor wineries in the Lake Erie Region and includ-ed Catawba and a number of white varieties. A shortage of acid led to a call for additional tonnage that was thought to be unavailable. By the end of harvest acid needs were not met entirely but tanks were mostly full and growers sold a signifi-cant amount of non-contracted tonnage for lower prices. Scheduling and processing was somewhat more difficult both because of high crop load vari-ability and inaccurate crop estimates. 2017 was a
great reminder that over-cropping in years when acreage under-cropped increases the risks and fi-nancial penalties of over-cropping.
Accurate crop estimation a goal for effective risk management. Overall 2017 will be remembered yet another successful harvest, as we continue to string consecutive above-average years together. Our take-away at extension is that there is still room to improve crop estimation, soil health and risk management as growers continue to manage crops that vary significantly.
Concord berry curve: 2017 Berry weight (red line) in the CLEREL moni-toring vineyard was 20% higher than last year (green line), and slightly above the 18 year average.
Terry Bates
Concord Soluble Solids: Soluble solids at CLEREL in 2017 were 2° Brix above the 18-yr average at 24 d post-veraison, and reached 17.0 ° Brix 18 days ahead of the 18 year trend (black line).
Terry Bates
Black Leaf. Black leaf symptoms of Potassium (K) deficiency were seen in many vineyards with heavy crops this year. It is thought that this K defi-ciency may have been related to lack of uptake during last year’s drought.
Photo by Terry Bates
Page 7
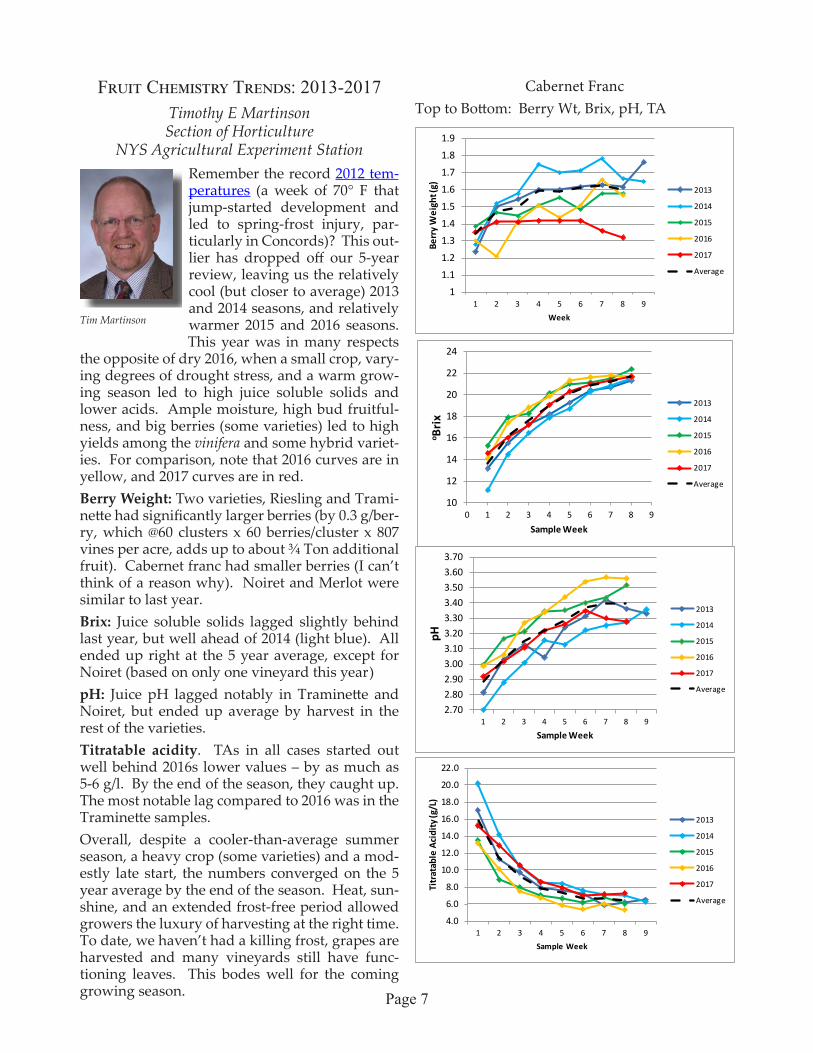
Fruit Chemistry Trends: 2013-2017Timothy E MartinsonSection of Horticulture
NYS Agricultural Experiment StationRemember the record 2012 tem-peratures (a week of 70° F that jump-started development and led to spring-frost injury, par-ticularly in Concords)? This out-lier has dropped off our 5-year review, leaving us the relatively cool (but closer to average) 2013 and 2014 seasons, and relatively warmer 2015 and 2016 seasons. This year was in many respects
the opposite of dry 2016, when a small crop, vary-ing degrees of drought stress, and a warm grow-ing season led to high juice soluble solids and lower acids. Ample moisture, high bud fruitful-ness, and big berries (some varieties) led to high yields among the vinifera and some hybrid variet-ies. For comparison, note that 2016 curves are in yellow, and 2017 curves are in red. Berry Weight: Two varieties, Riesling and Trami-nette had significantly larger berries (by 0.3 g/ber-ry, which @60 clusters x 60 berries/cluster x 807 vines per acre, adds up to about ¾ Ton additional fruit). Cabernet franc had smaller berries (I can’t think of a reason why). Noiret and Merlot were similar to last year.Brix: Juice soluble solids lagged slightly behind last year, but well ahead of 2014 (light blue). All ended up right at the 5 year average, except for Noiret (based on only one vineyard this year)pH: Juice pH lagged notably in Traminette and Noiret, but ended up average by harvest in the rest of the varieties.Titratable acidity. TAs in all cases started out well behind 2016s lower values – by as much as 5-6 g/l. By the end of the season, they caught up. The most notable lag compared to 2016 was in the Traminette samples.Overall, despite a cooler-than-average summer season, a heavy crop (some varieties) and a mod-estly late start, the numbers converged on the 5 year average by the end of the season. Heat, sun-shine, and an extended frost-free period allowed growers the luxury of harvesting at the right time. To date, we haven’t had a killing frost, grapes are harvested and many vineyards still have func-tioning leaves. This bodes well for the coming growing season.
Cabernet Franc Top to Bottom: Berry Wt, Brix, pH, TA
1
1.1
1.2
1.3
1.4
1.5
1.6
1.7
1.8
1.9
1 2 3 4 5 6 7 8 9
Berr
y W
eigh
t (g)
Week
2013
2014
2015
2016
2017
Average
10
12
14
16
18
20
22
24
0 1 2 3 4 5 6 7 8 9
o Bri
x
Sample Week
2013
2014
2015
2016
2017
Average
2.702.802.903.003.103.203.303.403.503.603.70
1 2 3 4 5 6 7 8 9
pH
Sample Week
2013
2014
2015
2016
2017
Average
4.0
6.0
8.0
10.0
12.0
14.0
16.0
18.0
20.0
22.0
1 2 3 4 5 6 7 8 9
Titr
atab
le A
cidi
ty (g
/L)
Sample Week
2013
2014
2015
2016
2017
Average
Tim Martinson

Page 8
MerlotTop to Bottom: Berry Wt, Brix, pH, TA
NoiretTop to Bottom: Berry Wt, Brix, pH, TA
1.40
1.50
1.60
1.70
1.80
1.90
2.00
2.10
1 2 3 4 5 6 7 8 9
Berr
y W
eigh
t (g)
Week
2013
2014
2015
2016
2017
Average
10
12
14
16
18
20
22
24
0 1 2 3 4 5 6 7 8 9
o Bri
x
Sample Week
2013
2014
2015
2016
2017
Average
2.8
3
3.2
3.4
3.6
3.8
4
1 2 3 4 5 6 7 8
pH
Sample Week
2013
2014
2015
2016
2017
Average
2
4
6
8
10
12
14
16
18
1 2 3 4 5 6 7 8
Titr
atab
le A
cidi
ty (g
/L)
Sample Week
2013
2014
2015
2016
2017
Average
1.40
1.50
1.60
1.70
1.80
1.90
2.00
2.10
1 2 3 4 5 6 7 8
Berr
y W
eigh
t (g)
Week
2013
2014
2015.00
2016
2017
Average
1011121314151617181920
0 1 2 3 4 5 6 7 8 9
o Bri
x
Sample Week
2013
2014
2015
2016
2017
Average
2.80
2.90
3.00
3.10
3.20
3.30
3.40
3.50
3.60
1 2 3 4 5 6 7 8
pH
Sample Week
2013
2014
2015
2016
2017
Average
5
7
9
11
13
15
17
19
21
1 2 3 4 5 6 7 8
Titr
atab
le A
cidi
ty (g
/L)
Sample Week
2013
2014
2015
2016
2017
Average

Page 9
RieslingTop to Bottom: Berry Wt, Brix, pH, TA
TraminetteTop to Bottom: Berry Wt, Brix, pH, TA
11.11.21.31.41.51.61.71.81.9
1 2 3 4 5 6 7 8 9
Berr
y W
eigh
t (g)
Week
2013
2014
2015
2016
2017
Average
8.0
10.0
12.0
14.0
16.0
18.0
20.0
22.0
0 1 2 3 4 5 6 7 8 9
o Bri
x
Sample Week
2013
2014
2015
2016
2017
Average
2.5
2.6
2.7
2.8
2.9
3
3.1
3.2
3.3
1 2 3 4 5 6 7 8 9
pH
Sample Week
2013
2014
2015
2016
2017
Average
5
10
15
20
25
30
1 2 3 4 5 6 7 8 9
Titr
atab
le A
cidi
ty (g
/L)
Sample Week
2013
2014
2015
2016
2017
Average
1.201.301.401.501.601.701.801.902.002.102.20
1 2 3 4 5 6 7 8 9
Berr
y W
eigh
t (g)
Week
2013
2014
2015
2016
2017
Average
8
10
12
14
16
18
20
22
24
0 1 2 3 4 5 6 7 8 9
o Bri
x
Sample Week
2013
2014
2015
2016
2017
Average
2.502.602.702.802.903.003.103.203.303.40
1 2 3 4 5 6 7 8
pH
Sample Week
2013
2014
2015
2016
2017
Average
579
1113151719212325
1 2 3 4 5 6 7 8
Titr
atab
le A
cidi
ty (g
/L)
Sample Week
2013
2014
2015
2016
2017
Average
Page 10
The CrewThanks to the many people who contributed to bringing
Véraison to Harvest to press each week.
The information, including any advice or recommendations, con-tained herein is based upon the research and experience of Cornell Cooperative Extension person-nel. While this information constitutes the best judgement/opinion of such personnel at the time issued, neither Cornell Cooperative Extension nor any representative thereof makes any representation or warrantee, express or implied, of any particular result or application of such information, or regarding any product. Users of any product are encouraged to read and follow product-labeling instructions and check with the manufacturer or supplier for updated information. Nothing contained in this information should be interpreted as an endorsement expressed or implied of any particular product.
This newsletter was made possible with support from the New York Wine and Grape Foundation, the J. M. Kaplan Fund, and USDA Federal Formula funding through the Cornell and New York State Agricultural Experiment Stations.
Veraison to Harvest is a joint publication of: Cornell Enology Extension Program
Statewide Viticulture Extension ProgramLong Island Grape Program - Suffolk CCE
Finger Lakes Grape ProgramLake Erie Regional Grape Program
Eastern NY Commercial Horticulture ProgramCopyright 2017© Cornell University
Lake Erie: Scott Ebert Tim Weigle and Kevin Martin
Thanks to Our Funders
Veraison to Harvest started in the 2008 growing season. This is the tenth year that the New York Wine and Grape Foundation has provided funding that allows us to provide data-based harvest updates to the New York industry through Véraison to Harvest. We
want to especially thank the Foundation and its board of directors, along with the Lake Erie Regional Grape Program, Inc. for providing us with the resources to put out this newsletter.
Additional support was provided through the Federal Formula Funds Grants program of Cornell University and New York State Agricultural experiment Station.
Long Island: Amanda Gardner, Bill McGrath and Alice Wise
Finger Lakes Grape Program Hans Walter-Peterson, Gillian Trimber, and John Kurtz.
Extension Enology, Geneva:
Cortni Stahl & Pamela Raes (pictured)
Chris Gerling
Statewide Viticulture Extension:
Bill Wilsey (pictured) and
Tim Martinson
Eastern NY Commercial Horticulture Program:
Jim Meyers (pictured) Laura McDermott
Amy Ivy Abby Henderson