Embed Size (px)
Citation preview
1
Videosonde Observation in the Tropics
The Third International SOWER MeetingLake Shikotsu
July 18-20, 2006Kyukamura Shikotsuko, Lake Shikotsu, Japan
Kenji SuzukiYamaguchi University, Japan
2
Table of Contents
1. Motivation2. Videosonde
3. Previous videosonde observation
4. R/V Mirai MR04-08 cruise
5. Summary and future plan
3
Motivation 1
In the tropical western Pacific region, - Warm pool convection- Release of latent heat
drive the global circulation
Precipitation mechanisms relate to- Upward transportation of water vapor- Vertical heat budget
4
Motivation 2- Liu & Fu (2001), Takayabu (2002)
TRMM data different precipitation system over ocean and land
- The difference originates from - - -Specific heat properties of land and sea? Large-scale circulation pattern? Cloud microphysics?
- Importance of in situ microphysical observation of clouds developed over the tropical ocean
- Goal: to investigate the precipitation particle distribution over the ocean using Videosonde
5
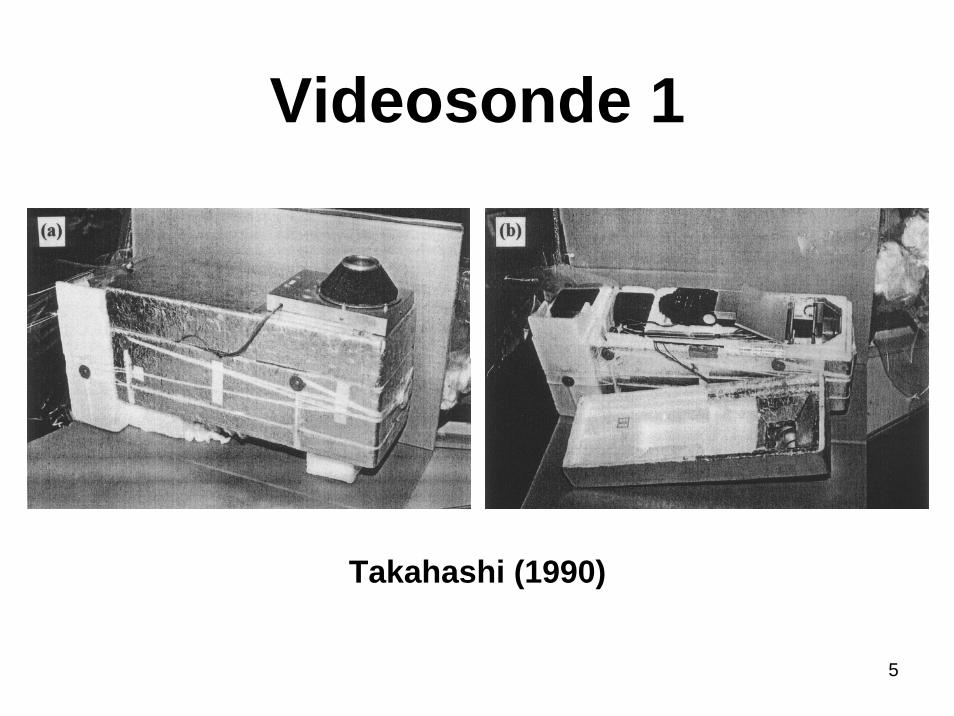
Videosonde 1
Takahashi (1990)

6
Videosonde 1
Takahashi (1990)
7
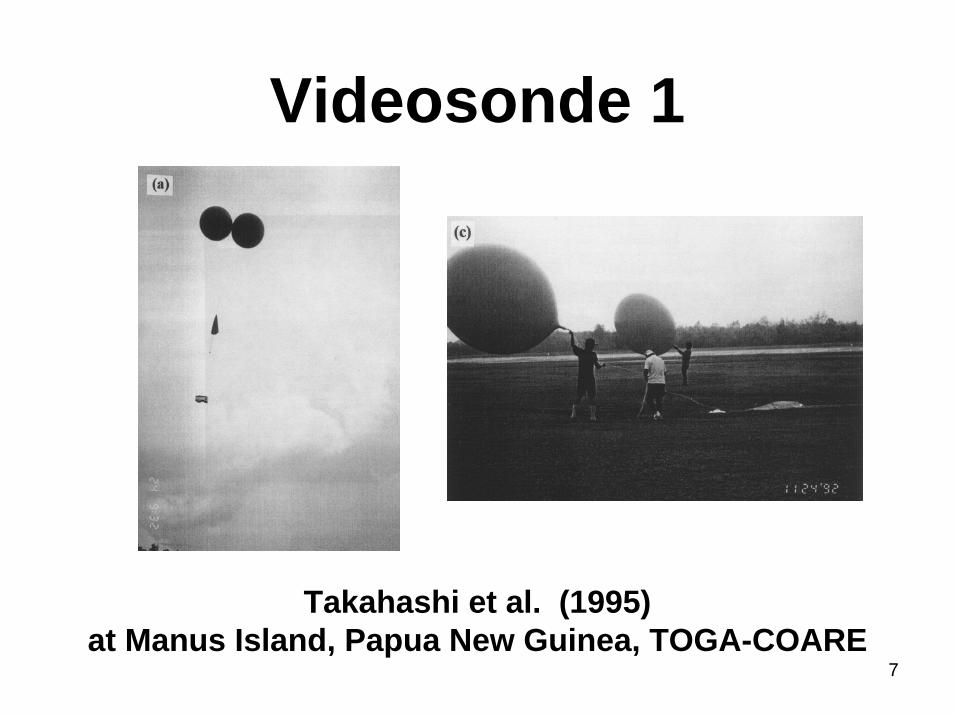
Videosonde 1
Takahashi et al. (1995)at Manus Island, Papua New Guinea, TOGA-COARE
8
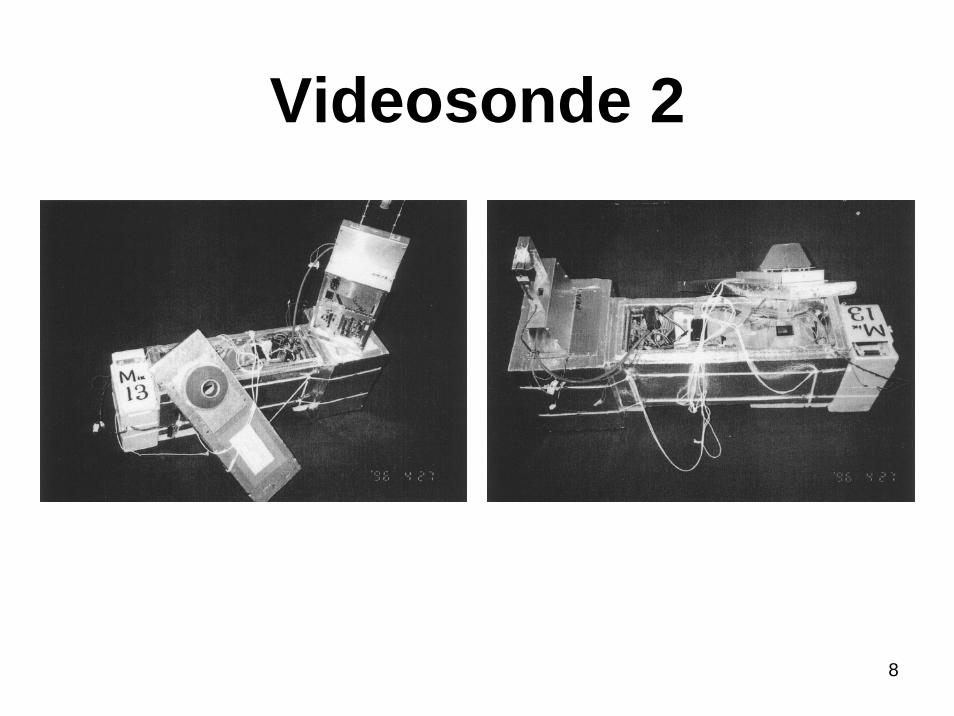
Videosonde 2
9
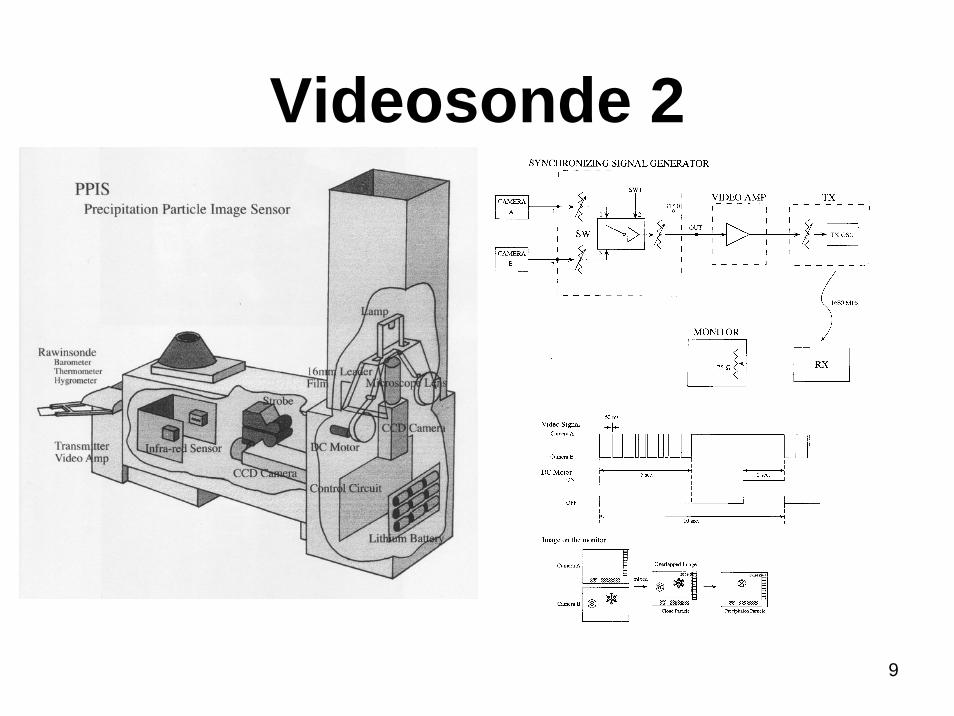
Videosonde 2
10
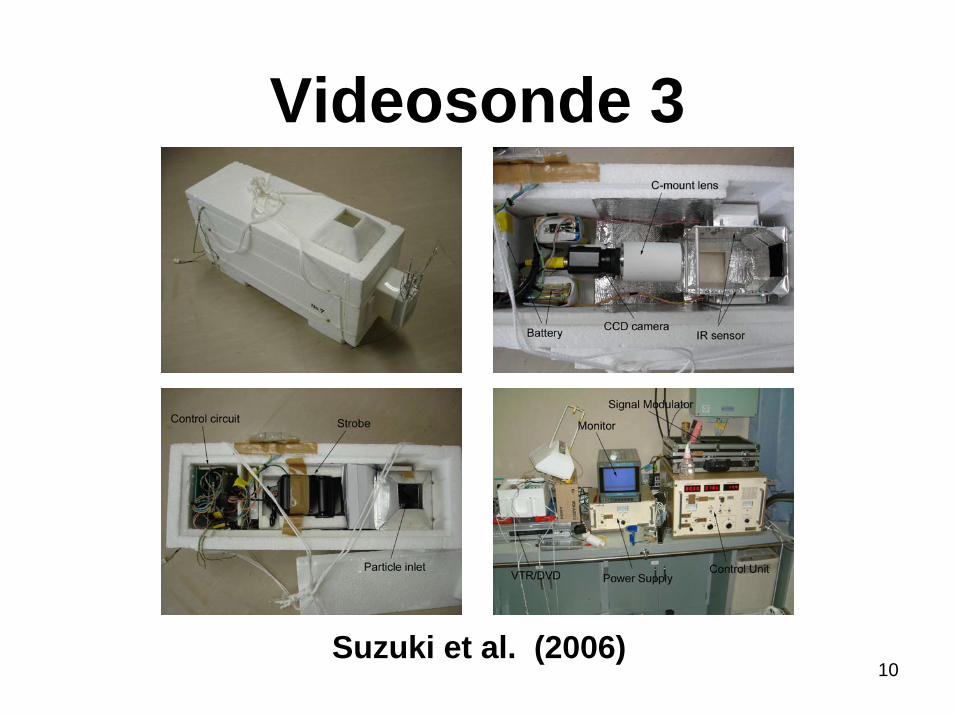
Videosonde 3
Suzuki et al. (2006)

11
SpecificationTotal observation time 60 minutes approximatelyParticle size resolution 0.1mm (0.01 mm for videosonde 2)Video picture Black and whiteTransmission power 0.5 WCarrier frequency 1680 MHzVideo band width 10 Hz to 1 MHzModulation FMBand width less than 4 MHzBattery Lithium/Alkaline batteryDimensions 570mm*180mm*340mm (videosonde 1)
800mm*240mm*400mm (videosonde 2)450mm*160mm*220mm (videosonde 3)
Weight 4.0 kg (videosonde 1)4.5 kg (videosonde 2)1.8 kg (videosonde 3) * present 1.2kg
Cost ¥¥¥
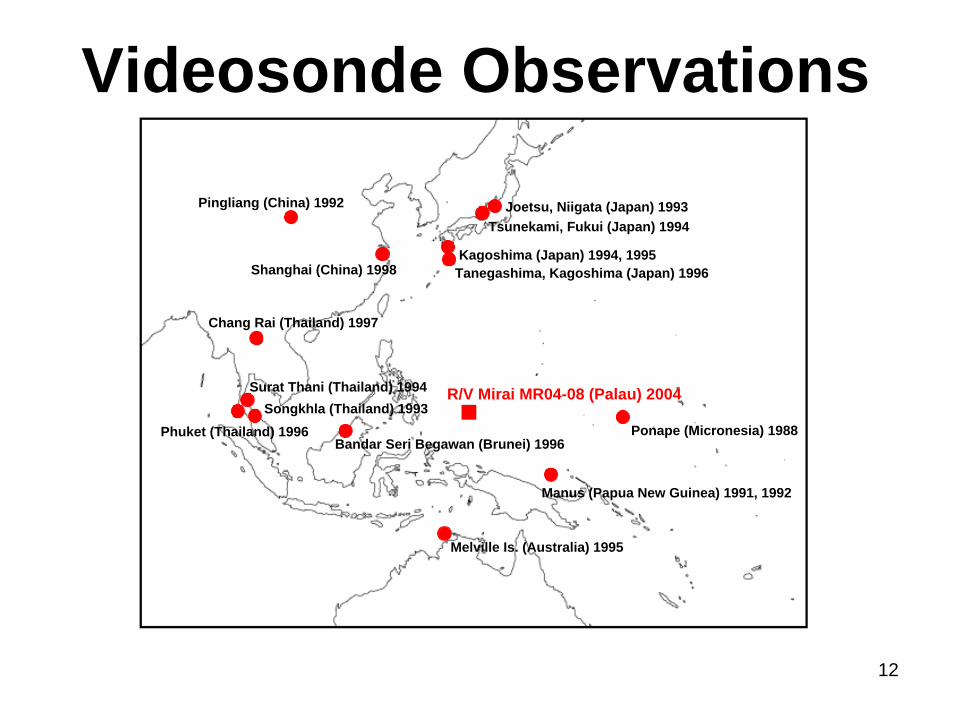
12
Joetsu, Niigata (Japan) 1993Tsunekami, Fukui (Japan) 1994
Kagoshima (Japan) 1994, 1995Tanegashima, Kagoshima (Japan) 1996
Ponape (Micronesia) 1988
Manus (Papua New Guinea) 1991, 1992
Melville Is. (Australia) 1995
Surat Thani (Thailand) 1994Songkhla (Thailand) 1993
Phuket (Thailand) 1996Bandar Seri Begawan (Brunei) 1996
Pingliang (China) 1992
Shanghai (China) 1998
Chang Rai (Thailand) 1997
■R/V Mirai MR04-08 (Palau) 2004
Videosonde Observations

13
Joetsu, Niigata (Japan) 1993Tsunekami, Fukui (Japan) 1994
Kagoshima (Japan) 1994, 1995Tanegashima, Kagoshima (Japan) 1996
Ponape (Micronesia) 1988
Manus (Papua New Guinea) 1991, 1992
Melville Is. (Australia) 1995
Surat Thani (Thailand) 1994Songkhla (Thailand) 1993
Phuket (Thailand) 1996Bandar Seri Begawan (Brunei) 1996
Pingliang (China) 1992
Shanghai (China) 1998
Chang Rai (Thailand) 1997
■R/V Mirai MR04-08 (Palau) 2004
0.1 0.4 0.5 0.60.70.80.91 4 5 6 7 8 9 10
0
1
2
3
4
5
6
7
8
9
10
11
12
13
14
15
16
17
D I A M E T E R ( m m )
HE
IGH
T(k
m)
0 8 3 6 ( L C T ) O C T . 4 1 9 8 8
TE
MP
ER
AT
UR
E (
℃)
RAINDROP
GRAUPEL
SNOWFLAKE
ICE CRYSTAL
FROZEN DROP0
–10
–20
–30
–40
–50
–60
–70
–80
20
10
0.1 0.4 0.5 0.60.70.80.91 4 5 6 7 8 910
0
1
2
3
4
5
6
7
8
D I A M E T E R ( m m )
HE
IGH
T(k
m)
0 9 5 2 ( L C T ) N O V . 2 4 1 9 9 2
TE
MP
ER
AT
UR
E (
℃)
RAINDROP
GRAUPEL
FROZEN DROP
ICE CRYSTAL
10
0
–10
–20
20
Maritime Region
14
Joetsu, Niigata (Japan) 1993Tsunekami, Fukui (Japan) 1994
Kagoshima (Japan) 1994, 1995Tanegashima, Kagoshima (Japan) 1996
Ponape (Micronesia) 1988
Manus (Papua New Guinea) 1991, 1992
Melville Is. (Australia) 1995
Surat Thani (Thailand) 1994Songkhla (Thailand) 1993
Phuket (Thailand) 1996Bandar Seri Begawan (Brunei) 1996
Pingliang (China) 1992
Shanghai (China) 1998
Chang Rai (Thailand) 1997
■R/V Mirai MR04-08 (Palau) 2004
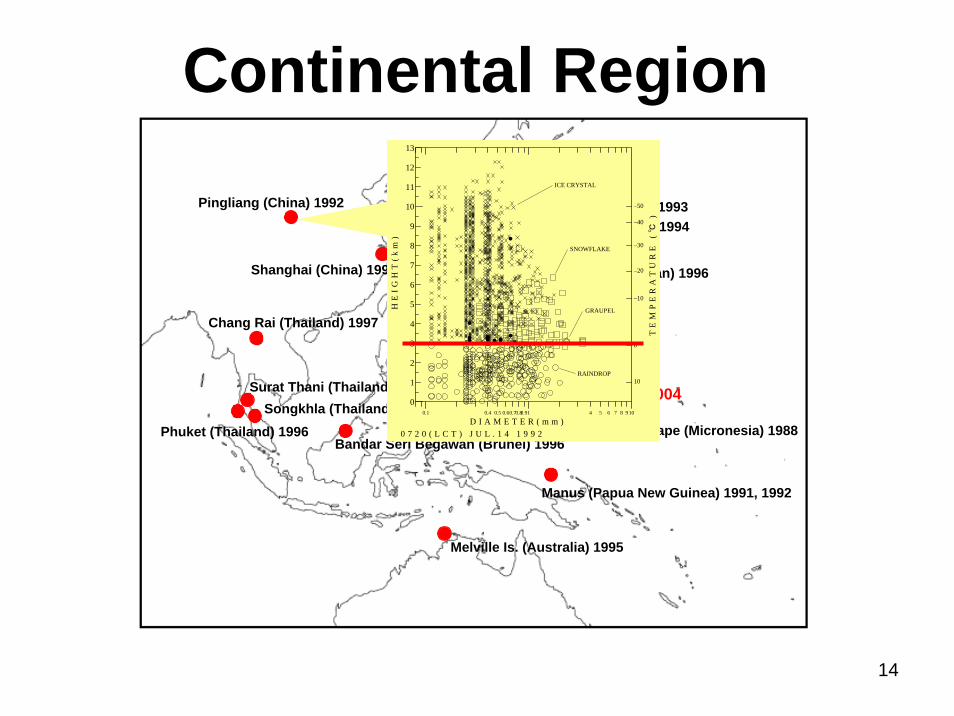
Continental Region
0.1 0.4 0.5 0.60.70.80.91 4 5 6 7 8 910
0
1
2
3
4
5
6
7
8
9
10
11
12
13
D I A M E T E R ( m m )
HE
IGH
T(k
m)
0 7 2 0 ( L C T ) J U L . 1 4 1 9 9 2
TE
MP
ER
AT
UR
E (
℃)
RAINDROP
GRAUPEL
SNOWFLAKE
ICE CRYSTAL
10
0
–10
–20
–30
–40
–50
15
Joetsu, Niigata (Japan) 1993Tsunekami, Fukui (Japan) 1994
Kagoshima (Japan) 1994, 1995Tanegashima, Kagoshima (Japan) 1996
Ponape (Micronesia) 1988
Manus (Papua New Guinea) 1991, 1992
Melville Is. (Australia) 1995
Surat Thani (Thailand) 1994Songkhla (Thailand) 1993
Phuket (Thailand) 1996Bandar Seri Begawan (Brunei) 1996
Pingliang (China) 1992
Shanghai (China) 1998
Chang Rai (Thailand) 1997
■R/V Mirai MR04-08 (Palau) 2004
0.1 0.4 0.5 0.6 0.70.80.91 4 5 6 7
0
1
2
3
4
5
6
7
8
9
10
11
12
13
D I A M E T E R ( m m )
HE
IGH
T(k
m)
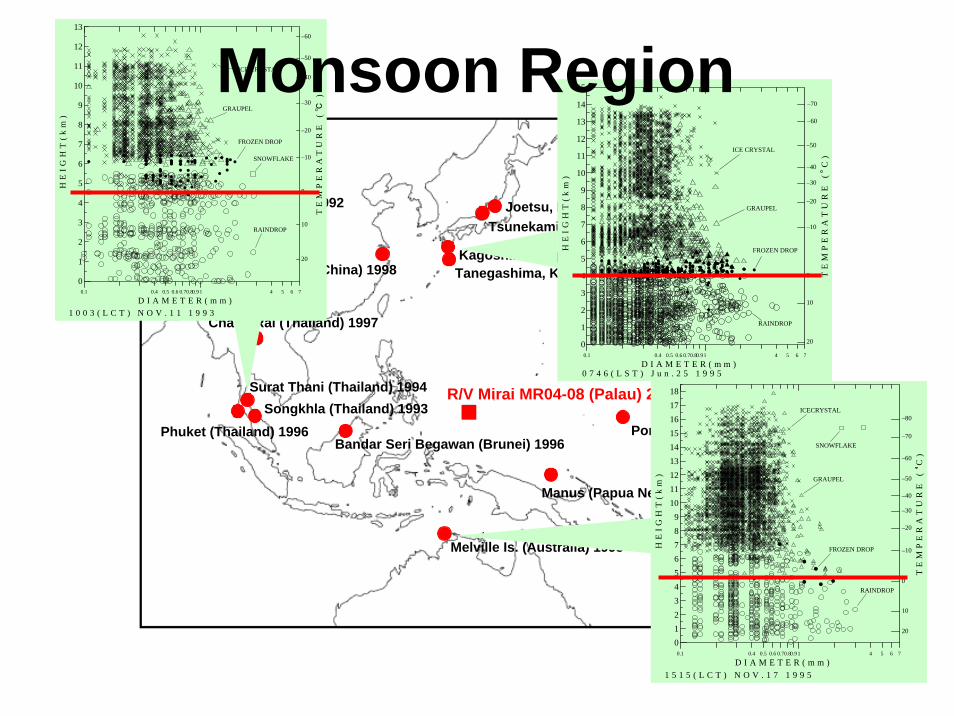
1 0 0 3 ( L C T ) N O V . 1 1 1 9 9 3T
EM
PE
RA
TU
RE
(℃
)
RAINDROP
GRAUPEL
SNOWFLAKE
ICE CRYSTAL
10
0
–10
–20
–30
20
FROZEN DROP
–40
–50
–60
0.1 0.4 0.5 0.6 0.70.80.91 4 5 6 7
0
1
2
3
4
5
6
7
8
9
10
11
12
13
14
15
D I A M E T E R ( m m )
HE
IGH
T(k
m)
0 7 4 6 ( L S T ) J u n . 2 5 1 9 9 5
TE
MP
ER
AT
UR
E (
C)
RAINDROP
FROZEN DROP
GRAUPEL
ICE CRYSTAL
20
10
0
–10
–20
–30
–40
–50
–60
–70
Monsoon Region
0.1 0.4 0.5 0.6 0.70.80.91 4 5 6 7
0123456789
101112131415161718
D I A M E T E R ( m m )H
EIG
HT
(km
)
1 5 1 5 ( L C T ) N O V . 1 7 1 9 9 5
TE
MP
ER
AT
UR
E (
C)
RAINDROP
FROZEN DROP
GRAUPEL
SNOWFLAKE
ICECRYSTAL
20
10
0
–10
–20
–30
–40
–50
–60
–70
–80
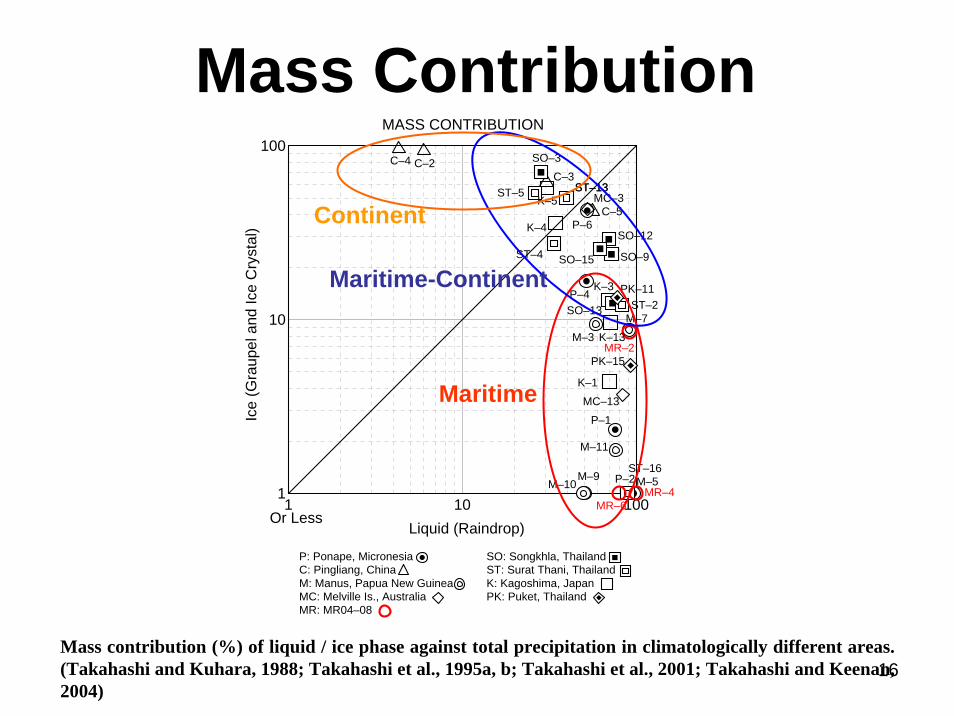
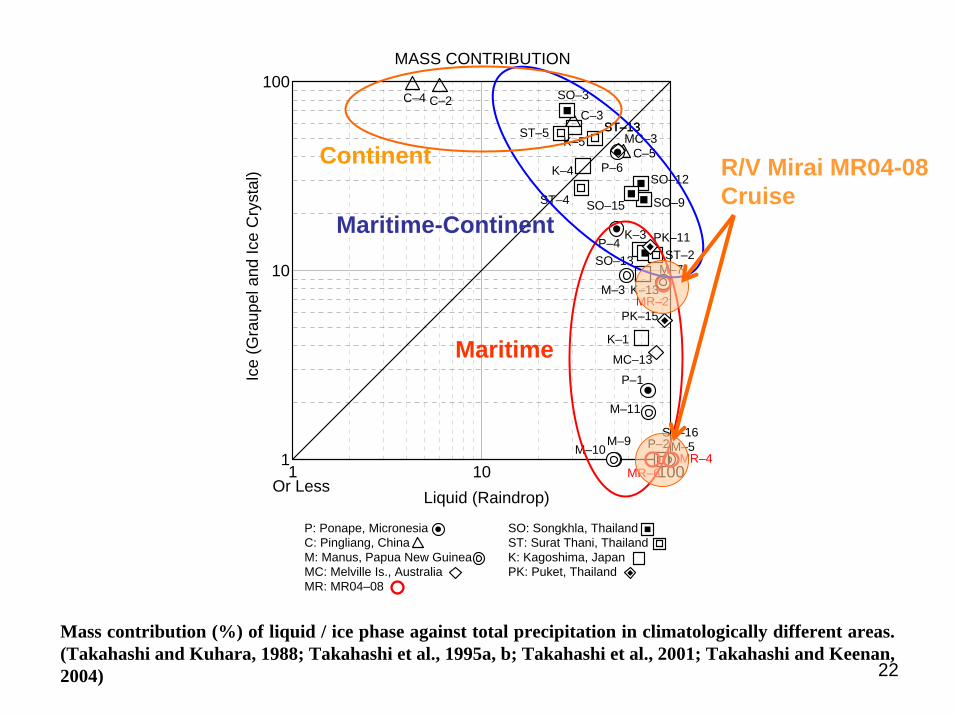
16Mass contribution (%) of liquid / ice phase against total precipitation in climatologically different areas. (Takahashi and Kuhara, 1988; Takahashi et al., 1995a, b; Takahashi et al., 2001; Takahashi and Keenan, 2004)
1 10 1001
10
100
Or LessLiquid (Raindrop)
Ice
(Gra
upel
and
Ice
Cry
stal
)
MASS CONTRIBUTION
P: Ponape, MicronesiaC: Pingliang, ChinaM: Manus, Papua New GuineaMC: Melville Is., Australia
SO: Songkhla, ThailandST: Surat Thani, ThailandK: Kagoshima, JapanPK: Puket, Thailand
MR: MR04–08
C–4 C–2
P–4
P–6
P–1
P–2
C–3
C–5
M–10
M–11
M–3M–7
M–9 M–5
MR–6MR–4
MR–2
K–1
K–13
K–3
K–4
K–5
SO–3
SO–12
SO–9
SO–13
SO–15
ST–5 ST–13ST–13
ST–4
MC–3
ST–2PK–11
PK–15
MC–13
ST–16
Continent
Maritime-Continent
Maritime
Mass Contribution
17
Joetsu, Niigata (Japan) 1993Tsunekami, Fukui (Japan) 1994
Kagoshima (Japan) 1994, 1995Tanegashima, Kagoshima (Japan) 1996
Ponape (Micronesia) 1988
Manus (Papua New Guinea) 1991, 1992
Melville Is. (Australia) 1995
Surat Thani (Thailand) 1994Songkhla (Thailand) 1993
Phuket (Thailand) 1996Bandar Seri Begawan (Brunei) 1996
Pingliang (China) 1992
Shanghai (China) 1998
Chang Rai (Thailand) 1997
■R/V Mirai MR04-08 (Palau) 2004
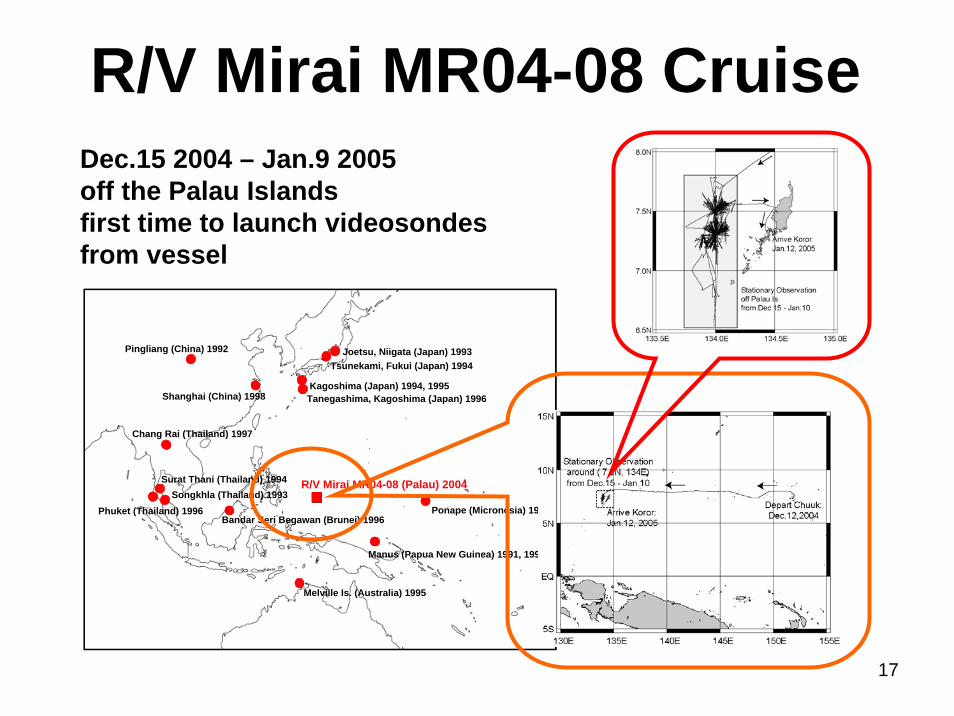
Dec.15 2004 – Jan.9 2005off the Palau Islandsfirst time to launch videosondesfrom vessel
R/V Mirai MR04-08 Cruise
18
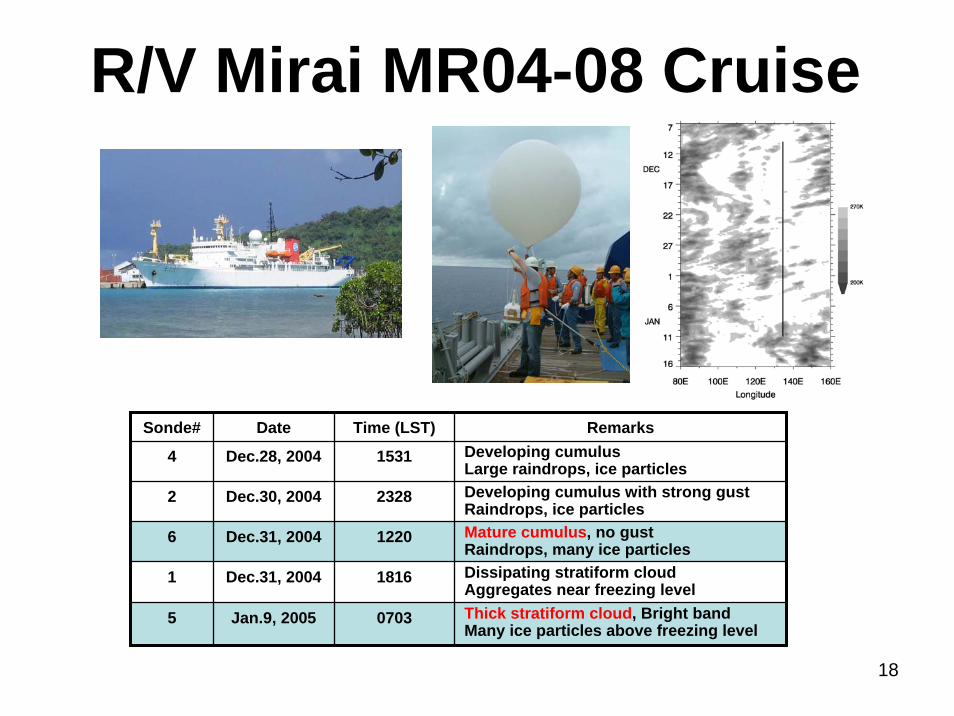
Sonde# Date Time (LST) Remarks
4 Dec.28, 2004 1531 Developing cumulusLarge raindrops, ice particles
2 Dec.30, 2004 2328 Developing cumulus with strong gustRaindrops, ice particles
6 Dec.31, 2004 1220 Mature cumulus, no gustRaindrops, many ice particles
1 Dec.31, 2004 1816 Dissipating stratiform cloudAggregates near freezing level
5 Jan.9, 2005 0703 Thick stratiform cloud, Bright bandMany ice particles above freezing level
R/V Mirai MR04-08 Cruise
19
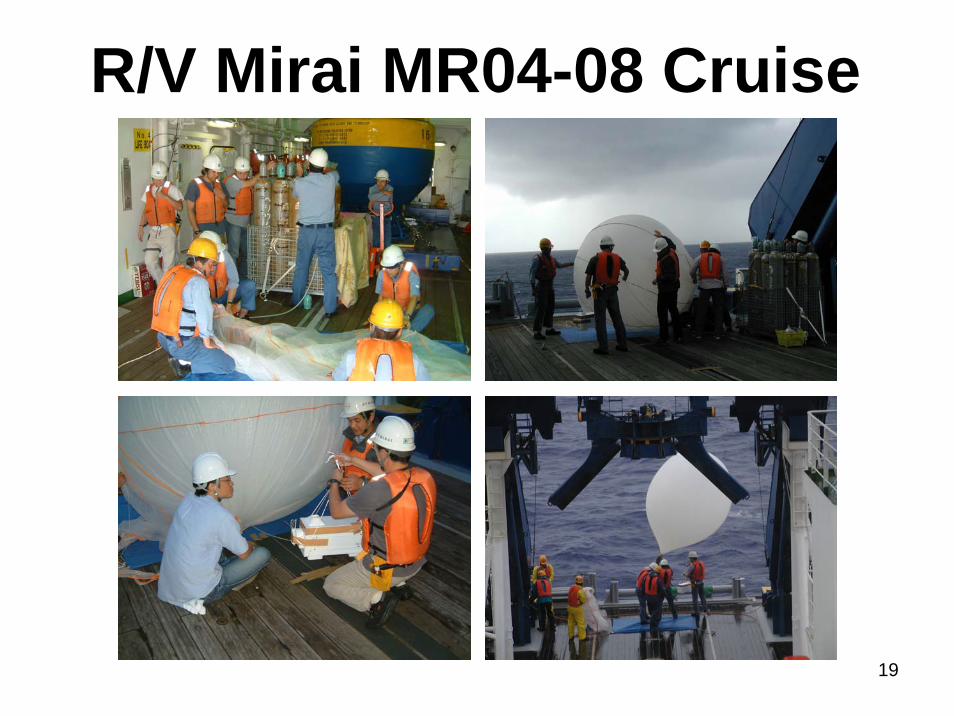
R/V Mirai MR04-08 Cruise
20
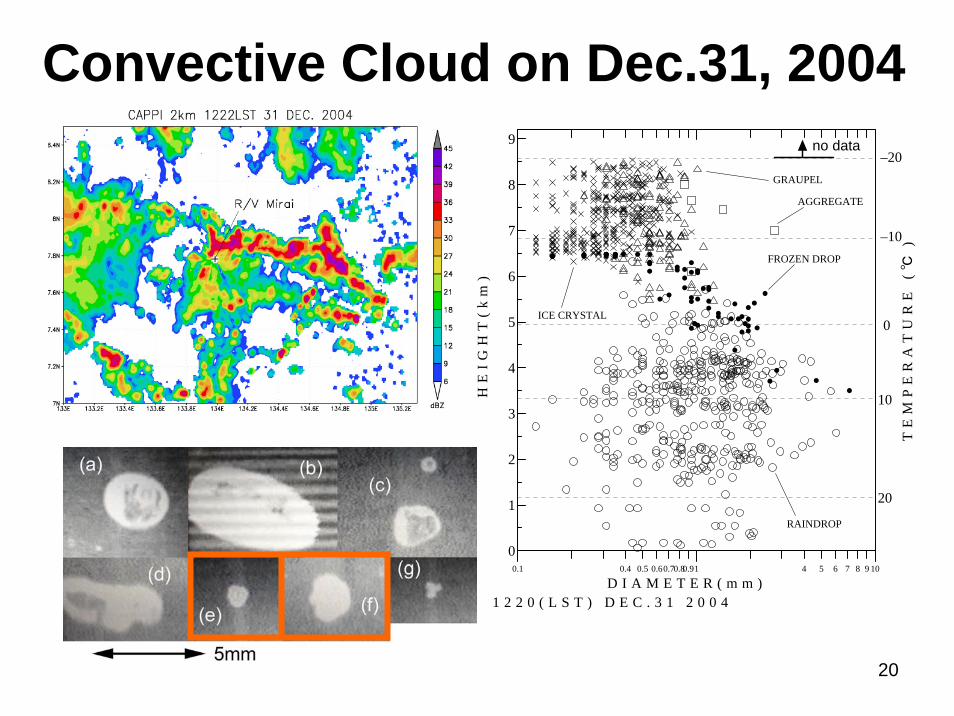
0.1 0.4 0.5 0.60.70.80.91 4 5 6 7 8 9 10
0
1
2
3
4
5
6
7
8
9
D I A M E T E R ( m m )
HE
IGH
T(k
m)
1 2 2 0 ( L S T ) D E C . 3 1 2 0 0 4
TE
MP
ER
AT
UR
E (
℃)
RAINDROP
GRAUPEL
ICE CRYSTAL
10
0
–10
20
–20
FROZEN DROP
AGGREGATE
no data
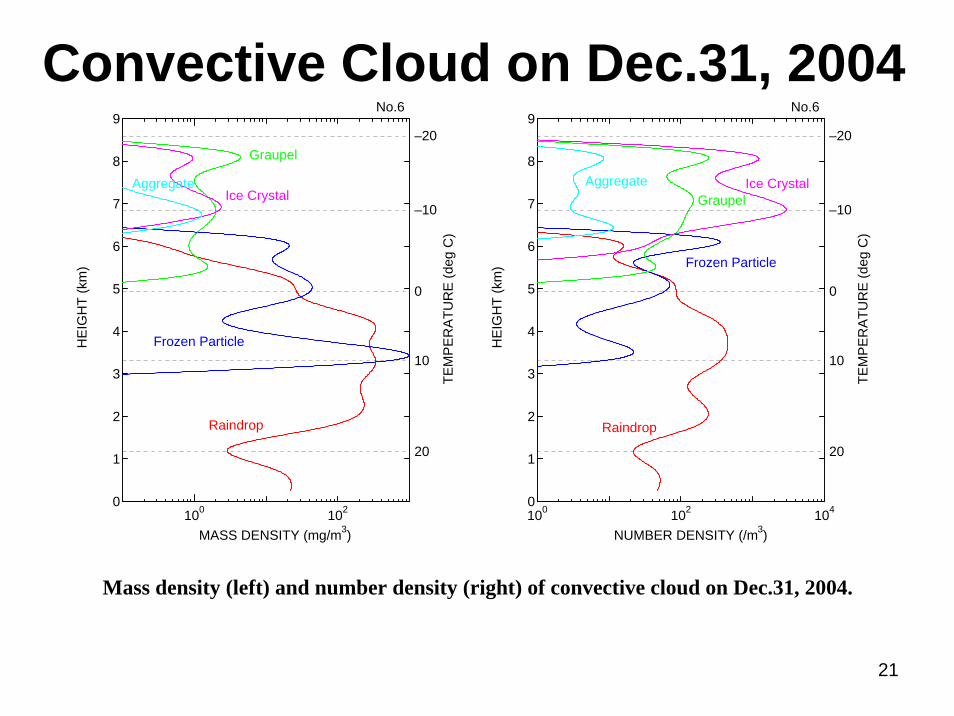
Convective Cloud on Dec.31, 2004
21
Mass density (left) and number density (right) of convective cloud on Dec.31, 2004.
100 1020
1
2
3
4
5
6
7
8
9
MASS DENSITY (mg/m3)
No.6
Raindrop
Graupel
Ice CrystalAggregate
HE
IGH
T (k
m)
TEM
PE
RA
TUR
E (d
eg C
)
–20
–10
0
10
20
Frozen Particle
100 102 1040
1
2
3
4
5
6
7
8
9
NUMBER DENSITY (/m3)
No.6
Raindrop
GraupelIce CrystalAggregate
HE
IGH
T (k
m)
TEM
PE
RA
TUR
E (d
eg C
)
–20
–10
0
10
20
Frozen Particle
Convective Cloud on Dec.31, 2004
22
1 10 1001
10
100
Or LessLiquid (Raindrop)
Ice
(Gra
upel
and
Ice
Cry
stal
)
MASS CONTRIBUTION
P: Ponape, MicronesiaC: Pingliang, ChinaM: Manus, Papua New GuineaMC: Melville Is., Australia
SO: Songkhla, ThailandST: Surat Thani, ThailandK: Kagoshima, JapanPK: Puket, Thailand
MR: MR04–08
C–4 C–2
P–4
P–6
P–1
P–2
C–3
C–5
M–10
M–11
M–3M–7
M–9 M–5
MR–6MR–4
MR–2
K–1
K–13
K–3
K–4
K–5
SO–3
SO–12
SO–9
SO–13
SO–15
ST–5 ST–13ST–13
ST–4
MC–3
ST–2PK–11
PK–15
MC–13
ST–16
Continent
Maritime-Continent
Maritime
Mass contribution (%) of liquid / ice phase against total precipitation in climatologically different areas. (Takahashi and Kuhara, 1988; Takahashi et al., 1995a, b; Takahashi et al., 2001; Takahashi and Keenan, 2004)
R/V Mirai MR04-08Cruise
23
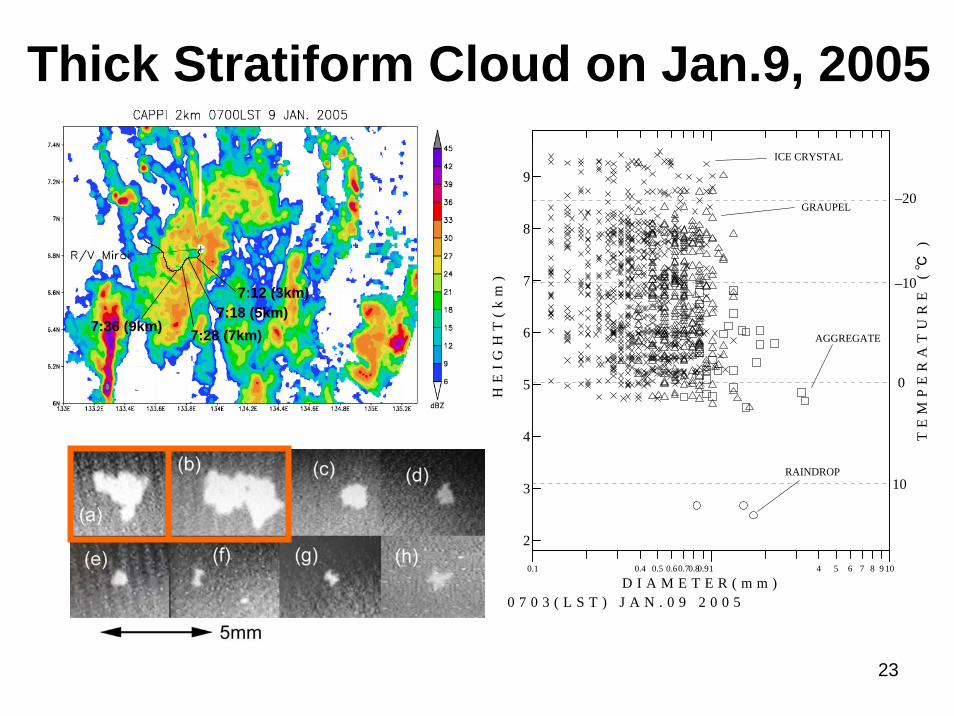
7:12 (3km)7:18 (5km)
7:28 (7km)7:36 (9km)
0.1 0.4 0.5 0.60.70.80.91 4 5 6 7 8 9 10
2
3
4
5
6
7
8
9
D I A M E T E R ( m m )
HE
IGH
T(k
m)
0 7 0 3 ( L S T ) J A N . 0 9 2 0 0 5
TE
MP
ER
AT
UR
E (
℃)
RAINDROP
GRAUPEL
ICE CRYSTAL
10
0
–10
–20
AGGREGATE
Thick Stratiform Cloud on Jan.9, 2005
24
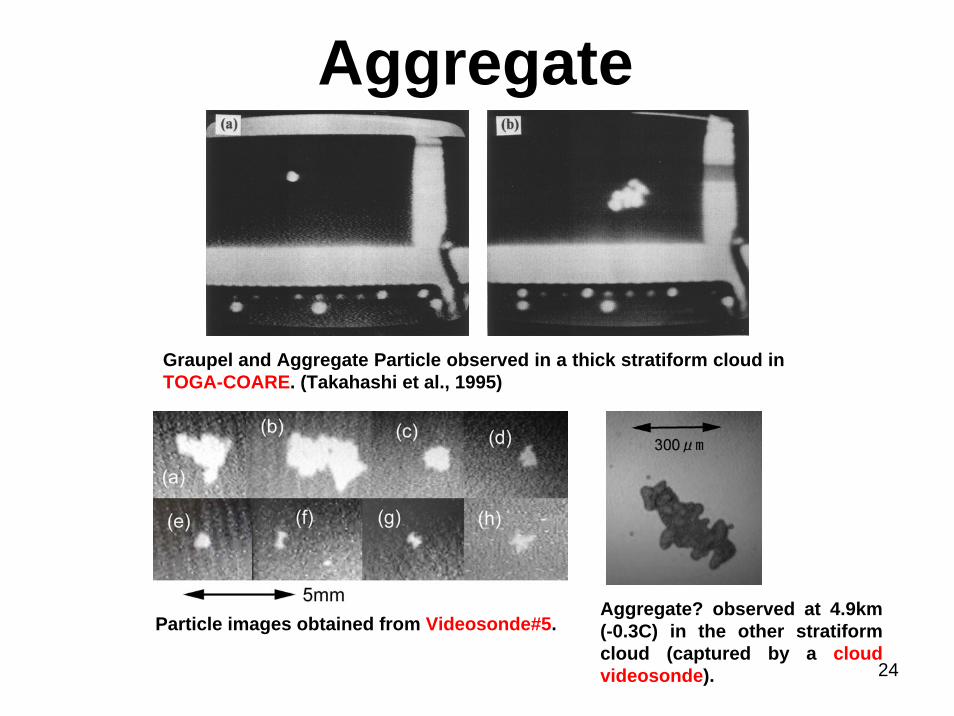
Aggregate? observed at 4.9km (-0.3C) in the other stratiformcloud (captured by a cloud videosonde).
Particle images obtained from Videosonde#5.
Graupel and Aggregate Particle observed in a thick stratiform cloud in TOGA-COARE. (Takahashi et al., 1995)
Aggregate
25
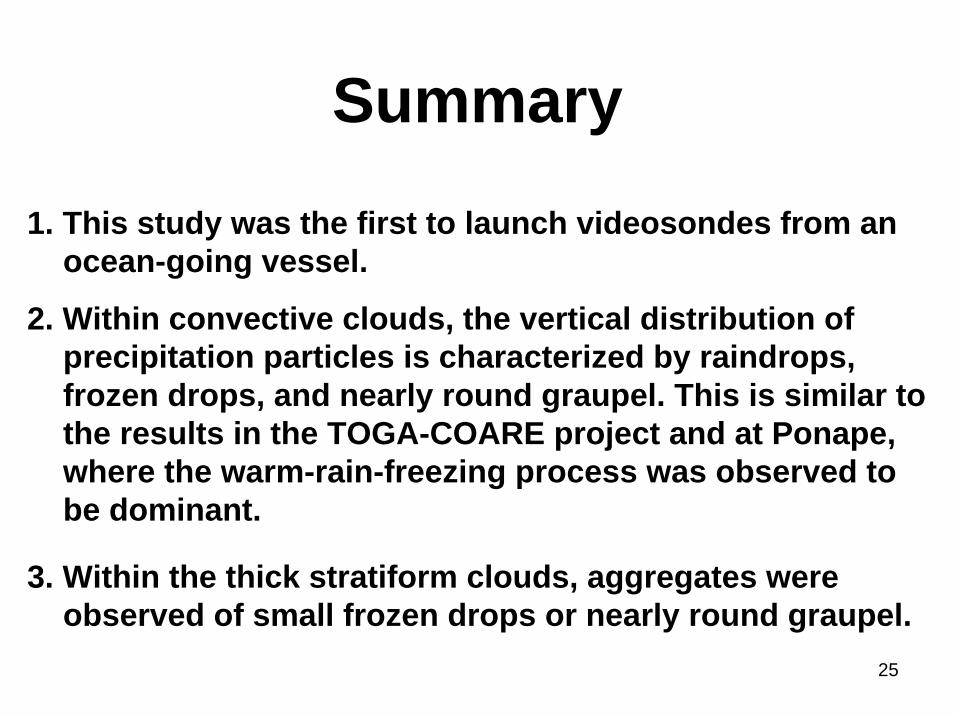
Summary
1. This study was the first to launch videosondes from an ocean-going vessel.
2. Within convective clouds, the vertical distribution of precipitation particles is characterized by raindrops, frozen drops, and nearly round graupel. This is similar to the results in the TOGA-COARE project and at Ponape, where the warm-rain-freezing process was observed to be dominant.
3. Within the thick stratiform clouds, aggregates were observed of small frozen drops or nearly round graupel.
26
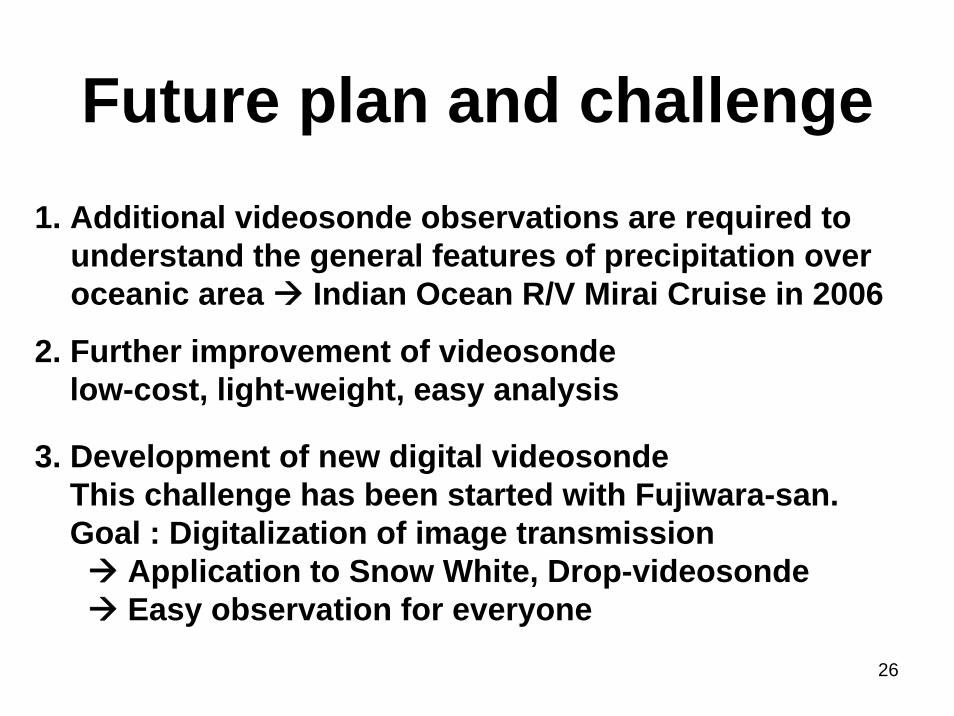
Future plan and challenge1. Additional videosonde observations are required to
understand the general features of precipitation over oceanic area Indian Ocean R/V Mirai Cruise in 2006
2. Further improvement of videosondelow-cost, light-weight, easy analysis
3. Development of new digital videosondeThis challenge has been started with Fujiwara-san.Goal : Digitalization of image transmission
Application to Snow White, Drop-videosondeEasy observation for everyone


![CONTENTS *Tropics -ENSO [Neutral] -MJO *Extra-tropics *Verification of ASO & October 2014 Outlooks *Drought *Selected Weather/Climate Events *Outlooks](https://img.pdfslide.tips/doc/110x75/56649d705503460f94a51e0b/contents-tropics-enso-neutral-mjo-extra-tropics-verification-of-aso.jpg)