Embed Size (px)
Citation preview

8/3/2019 WCM Pro CTSX 2010
http://slidepdf.com/reader/full/wcm-pro-ctsx-2010 1/13
International Research Journal of Finance and Economics
ISSN 1450-2887 Issue 47 (2010)© EuroJournals Publishing, Inc. 2010
http://www.eurojournals.com/finance.htm
Working Capital Management and Corporate
Performance of Manufacturing Sector in Pakistan
Abdul Raheman
PhD Scholar, Department of Management Sciences, COMSATS Islamabad &
Asst. Professor, University Institute of Management Sciences
PMAS-Arid Agri. University Rawalpindi
E-mail: [email protected]
Talat Afza
Professor & Dean, Faculty of Management Sciences, COMSATS Lahore, Pakistan
E-mail: [email protected]
Abdul Qayyum
Professor / Registrar, Pakistan Institute of Development Economics, Islamabad
E-mail: [email protected]
Mahmood Ahmed BodlaProfessor & Director, COMSATS Sahiwal, Pakistan
E-mail: [email protected]
Abstract
Working capital management plays a significant role in better performance of manufacturing firms. This paper analyzes the impact of working capital management on
firm’s performance in Pakistan for the period 1998 to 2007. For this purpose, balancedpanel data of 204 manufacturing firms is used which are listed on Karachi Stock Exchange.
The results indicate that the cash conversion cycle, net trade cycle and inventory turnover
in days are significantly affecting the performance of the firms. The manufacturing firmsare in general facing problems with their collection and payment policies. Moreover, the
financial leverage, sales growth and firm size also have significant effect on the firm’s
profitability. The study also concludes that firms in Pakistan are following conservativeworking capital management policy and the firms are needed to concentrate and improve
their collection and payment policy. The effective policies must be formulated for the
individual components of working capital. Furthermore, efficient Management andfinancing of working capital (current assets and current liabilities) can increase the
operating profitability of manufacturing firms. For efficient working capital management,
specialized persons in the fields of finance should be hired by the firms for expert advice
on working capital management in the manufacturing sector.
Keywords: Working Capital Management, Cash Conversion Cycle, Net Trade Cycle,Average Collection Period, Average Payment Period, Manufacturing Sector,
Fixed Effect Model.

8/3/2019 WCM Pro CTSX 2010
http://slidepdf.com/reader/full/wcm-pro-ctsx-2010 2/13
International Research Journal of Finance and Economics - Issue 47 (2010) 152
1. IntroductionManufacturing is the second largest sector of the economy of Pakistan after agriculture sector and it
accounts for 19.1% of GDP. It grew by 8.4 percent during 2007 as against 10 percent last year. In themanufacturing sector, large scale manufacturing plays a vital role and accounts for approximately 70
percent of overall manufacturing (Government of Pakistan, 2006-07). As an important sector in the
overall economic growth, manufacturing sector requires in depth analysis at industry as well as firmlevel. The sector is dominated by textile, oil and gas, cement and automobile sectors in terms of assets
size and credit allocation. Working capital management efficiency is vital especially for manufacturing firms, where a
major part of assets is composed of current assets (Horne and Wachowitz, 2000). It directly affects the
profitability and liquidity of firms (Raheman and Nasr, 2007). The profitability liquidity tradeoff is
important because if working capital management is not given due considerations then the firms are
likely to fail and face bankruptcy (Kargar and Bluementhal, 1994). The significance of working capitalmanagement efficiency is irrefutable (Filbeck and Krueger, 2005). Working capital is known as life
giving force for any economic unit and its management is considered among the most important
function of corporate management. Every organization whether, profit oriented or not, irrespective of size and nature of business, requires necessary amount of working capital. Working capital is the most
crucial factor for maintaining liquidity, survival, solvency and profitability of business
(Mukhopadhyay, 2004). Working capital management is one of the most important areas while makingthe liquidity and profitability comparisons among firms (Eljelly, 2004), involving the decision of the
amount and composition of current assets and the financing of these assets. The greater the relative
proportion of liquid assets, the lesser the risk of running out of cash, all other things being equal. Allindividual components of working capital including cash, marketable securities, account receivables
and inventory management play a vital role in the performance of any firm. Shin and Soenen, (1998)
argued that efficient working capital management is very important to create value for the shareholders
while Smith et. al., (1997) emphasized that profitability and liquidity are the salient goals of workingcapital management.
Considering the importance of working capital management the researchers focused on
evaluating the working capital management and profitability relationship such as Uyar, 2009;
Samiloglu and Demirgunes, 2008; Vishnani and Shah, 2007; Teruel and Solano, 2007; Lazaridis &Tryfonidis, 2006; Padachi, 2006; Shin and Soenen, 1998; Smith et al., 1997 and Jose et al., 1996
among others. However, there are a few studies with reference to Pakistan like Afza and Nazir 2007 &2008; Raheman and Nasr 2007 and Shah and Sana 2006. Afza and Nazir (2007, 2008) focused only on
the working capital management financing policies. Other two studies focused on the relationship
between profitability and working capital management in Pakistan. Shah and Sana (2006) concentrated
on the oil and gas sector and estimated the relationship using small sample of 7 firms. Raheman andNasr (2007) analyzed profitability and working capital management performance of only 94 firms
listed on Karachi Stock Exchange for the period 1999-2004 only by using Ordinary Least Square and
Generalized Least Square. However this study ignored the fixed effect of each firm as each firm has itsunique characteristics and also ignored sector wise analysis of working capital management
performance of manufacturing firms. Insufficient evidences on the firm’s performance and workingcapital management with reference to Pakistan provide a strong motivation for evaluating therelationship between working capital management and firm performance in detail.
Therefore the current study focused on evaluating the impact of working capital management
and the performance, in terms of profitability, of Pakistani firms listed on KSE and to identifyimportant variables that are influencing working capital management efficiency. Moreover the
objective is also to see the investment and financing policies of working capital for the manufacturing
firms. This study has included a large sample of 204 firms listed on Karachi Stock Exchange (KSE) for
the period 1998 - 2007.
8/3/2019 WCM Pro CTSX 2010
http://slidepdf.com/reader/full/wcm-pro-ctsx-2010 3/13
153 International Research Journal of Finance and Economics - Issue 47 (2010)
The next section presents the literature review. Methodology, data and variable issues are
discussed in section three whereas section four presents the empirical results. Section five concludes
the finding of the study.
2. Literature ReviewThe relationship of Cash Conversion Cycle with firm size and profitability for firms listed at Istanbul
Stock Exchange was studied by Uyar (2009) using ANOVA and correlation analysis. The resultsshowed retail/wholesale industry has shorter Cash Conversion Cycle (CCC) than manufacturingindustries. Furthermore, study found significant negative correlation between CCC and profitability as
well as between CCC and firm size. Lazaridis and Tryfonidis (2006) investigated the relationship of
corporate profitability and working capital management for firms listed at Athens Stock Exchange.
They reported that there is statistically significant relationship between profitability measured by grossoperating profit and the Cash Conversion Cycle. Furthermore, Managers can create profit by correctly
handling the individual components of working capital to an optimal level. Padachi (2006) has
examined the trends in working capital management and its impact on firm’s performance for 58Mauritian small manufacturing firms during 1998 to 2003. He explained that a well designed and
implemented working capital management is expected to contribute positively to the creation of firm’s
value. The results indicated that high investment in inventories and receivables is associated with lowprofitability and also showed an increasing trend in the short term component of working capital
financing.
Most of the empirical studies support the traditional belief about working capital andprofitability that reducing working capital investment would positively affect the profitability of firm
(aggressive policy) by reducing proportion of current assets in total assets. Deloof (2003) analyzed a
sample of Belgian firms, and Wang (2002) analyzed a sample of Japanese and Taiwanese firms,
emphasized that the way the working capital is managed has a significant impact on the profitability of firms and increase in profitability by reducing number of day’s accounts receivable and reducing
inventories. A shorter Cash Conversion Cycle and net trade cycle is related to better performance of the
firms. Furthermore, efficient working capital management is very important to create value for the
shareholders. Shin Soenen (1998) analyzed a sample of US firms also reported similar findings buthave used Net Trading Cycle (NTC) as comprehensive measure of working capital management and
found significant negative relationship between NTC and profitability. However, this relationship wasnot found to be very significant when the analysis was for specific industry (Soenen, 1993). Jose, et al.
(1996) performed an industry wise analysis and measured the ongoing liquidity by Cash Conversion
Cycle. Controlling industry and size differences they have concluded that more aggressive liquidity
management is associated with higher profitability for several industries.However, divergent to traditional belief, more investment in working capital (conservative
policy) might also increase profitability. When high inventory is maintained, it reduces the cost of
interruptions in the production process, decrease in supply cost, protection against price fluctuation andloss of business due to scarcity of products (Blinder and Maccini, 1991). Czyzewski and Hicks (1992)
also concluded that firms with the highest return on assets hold higher cash balances but they did notconsider liquidity management beyond static cash and assets ratio.
There are few studies with reference to working capital management in Pakistan like Afza and
Nazir (2008), who studied the factors determining the working capital requirements for a large sample
of 204 firms in sixteen manufacturing sub sectors during 1998-2006. Another study by Afza and Nazir(2007) investigated the relationship between aggressive and conservative working capital policies for a
large sample of 205 firms in 17 sectors listed on Karachi Stock Exchange during 1998-2005. They
found a negative relationship between the profitability measures of firms and degree of aggressiveness
of working capital investment and financing policies. Raheman and Nasr (2007) studied therelationship between working capital management and corporate profitability for 94 firms listed on
Karachi Stock Exchange using static measure of liquidity and ongoing operating measure of working

8/3/2019 WCM Pro CTSX 2010
http://slidepdf.com/reader/full/wcm-pro-ctsx-2010 4/13
International Research Journal of Finance and Economics - Issue 47 (2010) 154
capital management during 1999-2004. The findings of study suggested that there exist a negative
relation between working capital management measures and profitability. Shah and Sana (2006) used a
very small sample of 7 oil and gas sector firms to investigate this relationship for period 2001-2005.The results suggested that managers can generate positive return for the shareholders by effectively
managing working capital.
Lack of empirical evidence on the working capital management and its impact on the firm
performance in case of manufacturing sector of Pakistan is main motivating force to study the subject
in more detail. Existing literature with reference to Pakistan on the comparison of different workingcapital measures on sectoral basis lacks the empirical evidence and regression analysis is undertaken
for a relatively small sample with reference to Pakistan. Therefore, the present study is an attempt tofill this gap and estimates the relationship between working capital management and firm performance
for a large sample of 204 manufacturing firms listed on Karachi Stock Exchange during 1998-2007.
3. MethodologyThe impact of working capital management on corporate performance of manufacturing sector is testedby panel data methodology. The panel data methodology used has certain benefits like using the
assumption that firms are heterogeneous, more variability, less colinearity between variables, more
informative data, more degree of freedom and more efficiency (Baltagi, 2001).
3.1. Model Specification
In order to find out the relationship between different variables, first Pearson Correlation Coefficients
are calculated. The impact of working capital management on firms’ performance is than investigatedusing balanced panel data of manufacturing firms listed at Karachi Stock Exchange. For this purpose,
we develop an empirical framework first used by Deloof (2003) and subsequent work of Padachi
(2006). We specify our model as;
NOP it = β 0 + β 1 (WCM it) + β 2 (GWCTR it) + β 3 (CATAR it) + β 4 (CLTAR it) +
β 5 (FDR it) + β 6 (LOS it) + β 7 (SG it) + β 8 (CR it) + ηi + λ t + it (3.1)
Where, Net Operating Profitability (NOP) is used as a measure of firm’s performance. WCM isWorking Capital Management, which is a key variable of the study used as a vector of AverageCollection Period (ACP), Inventory Turnover in Days (ITID), Average Payment Period (APP), Cash
Conversion Cycle (CCC) and Net Trading Cycle (NTC) of the firm. It is expected that WCM has
negative relationship with the corporate profitability. If we reduce number of days in receivables(ACP), inventory (ITID), Cash Conversion Cycle (CCC) and Net Trade Cycle (NTC), it will enhancethe corporate profitability. Furthermore, Average Payment Period is directly associated with
profitability. Other explanatory variables typically assumed to affect firm performance are GWCTR is
the Gross Working Capital Turnover Ratio which is expected to have positive relationship withprofitability, CATAR is the Current Assets to Total Assets Ratio and CLTAR is the Current Liabilities
to Total Assets Ratio are used to check the investing and financing policy of working capital
management respectively. Financial Debt Ratio (FDR) representing leverage is expected to havenegative relationship and natural logarithm of sales (LOS) representing size has positive relationship
with corporate profitability. SG is sales growth which represent the investment growth opportunities
while CR is Current Ratio to measure liquidity of firm. ηi measures the specific characteristics of eachfirm called unobservable heterogeneity ,whereas λ t is a parameter for time dummy variables which is
equal for all firms in each year but changes over time and is the error term.
A classical test for the panel data is one of Random effect model versus fixed effect model
(Yafee, 2003). For estimating the models, first we need to determine whether there exists a correlationbetween the independent variables. If the correlation exists then a fixed effect model will give
consistent results otherwise random effect model will be an efficient estimators and it is estimated by
generalized least square (Teruel and Solano, 2007). Fixed effects are computed by subtracting the
ε
ε
8/3/2019 WCM Pro CTSX 2010
http://slidepdf.com/reader/full/wcm-pro-ctsx-2010 5/13
155 International Research Journal of Finance and Economics - Issue 47 (2010)
“within” mean from each variable and estimating Panel Least Square using the transformed data. In
fixed effect model, it assumes firm specific intercepts and capture effects of those variables which are
specific to each firm and constant over time. In random effect model it is assumed that there is a singlecommon intercept and it varies from firm to firm in a random manner. To determine which of these
two models is appropriate, coefficients are estimated by both fixed and random effects. We have used
Hausman (1978) test to determine whether fixed or random effect should be used. If the null
hypothesis i.e. E (ηi / xit) = 0 is accepted, then random effect will be an efficient estimator otherwise in
case of rejection of null hypothesis, fixed effect estimation will give better or efficient estimation of betas. Hausman test rejects the null hypothesis, therefore decision is taken to use fixed effect model.
We have used EVIEWS to estimate the above models.
3.2. Data and Variables
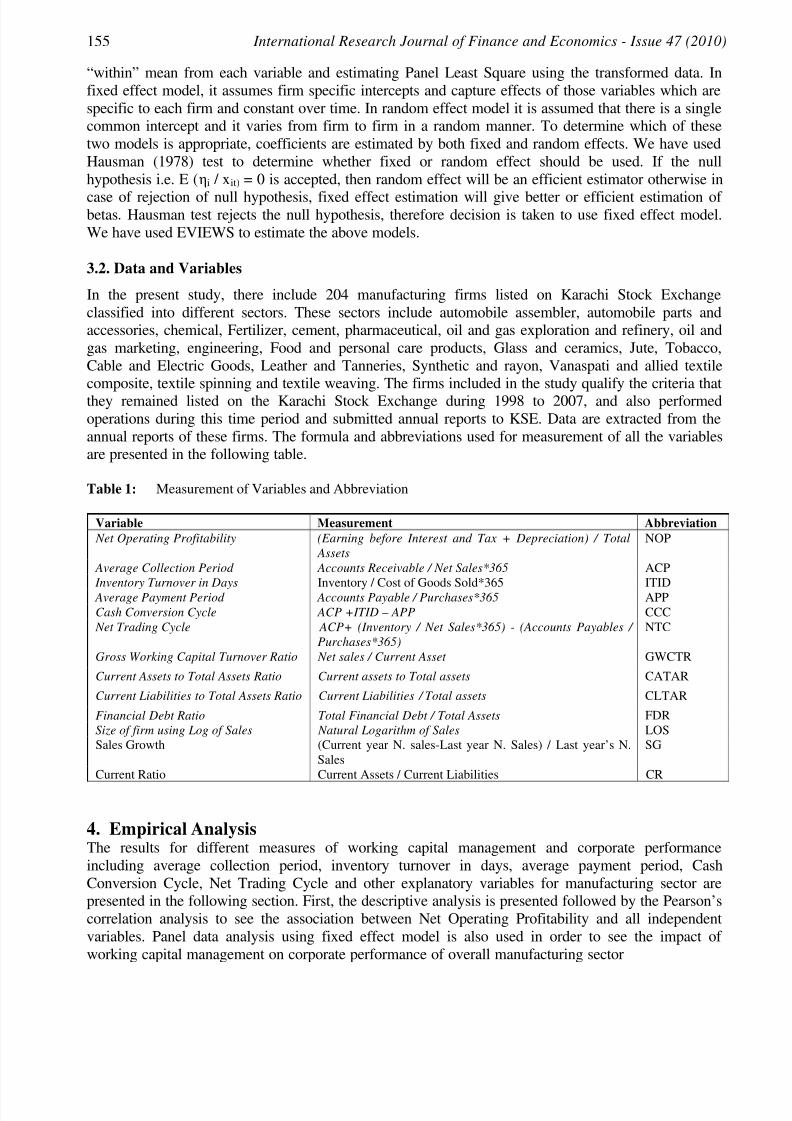
In the present study, there include 204 manufacturing firms listed on Karachi Stock Exchange
classified into different sectors. These sectors include automobile assembler, automobile parts andaccessories, chemical, Fertilizer, cement, pharmaceutical, oil and gas exploration and refinery, oil and
gas marketing, engineering, Food and personal care products, Glass and ceramics, Jute, Tobacco,
Cable and Electric Goods, Leather and Tanneries, Synthetic and rayon, Vanaspati and allied textilecomposite, textile spinning and textile weaving. The firms included in the study qualify the criteria thatthey remained listed on the Karachi Stock Exchange during 1998 to 2007, and also performed
operations during this time period and submitted annual reports to KSE. Data are extracted from the
annual reports of these firms. The formula and abbreviations used for measurement of all the variablesare presented in the following table.
Table 1: Measurement of Variables and Abbreviation
Variable Measurement Abbreviation
Net Operating Profitability (Earning before Interest and Tax + Depreciation) / Total
Assets
NOP
Average Collection Period Accounts Receivable / Net Sales*365 ACP
Inventory Turnover in Days Inventory / Cost of Goods Sold*365
ITID Average Payment Period Accounts Payable / Purchases*365 APP
Cash Conversion Cycle ACP +ITID – APP CCC
Net Trading Cycle ACP+ (Inventory / Net Sales*365) - (Accounts Payables /
Purchases*365)
NTC
Gross Working Capital Turnover Ratio Net sales / Current Asset GWCTR
Current Assets to Total Assets Ratio Current assets to Total assets CATAR
Current Liabilities to Total Assets Ratio Current Liabilities / Total assets CLTAR
Financial Debt Ratio Total Financial Debt / Total Assets FDR
Size of firm using Log of Sales Natural Logarithm of Sales LOS
Sales Growth (Current year N. sales-Last year N. Sales) / Last year’s N.
Sales
SG
Current Ratio Current Assets / Current Liabilities CR
4. Empirical AnalysisThe results for different measures of working capital management and corporate performance
including average collection period, inventory turnover in days, average payment period, Cash
Conversion Cycle, Net Trading Cycle and other explanatory variables for manufacturing sector arepresented in the following section. First, the descriptive analysis is presented followed by the Pearson’s
correlation analysis to see the association between Net Operating Profitability and all independent
variables. Panel data analysis using fixed effect model is also used in order to see the impact of
working capital management on corporate performance of overall manufacturing sector

8/3/2019 WCM Pro CTSX 2010
http://slidepdf.com/reader/full/wcm-pro-ctsx-2010 6/13
International Research Journal of Finance and Economics - Issue 47 (2010) 156
4.1. Descriptive Statistics
The mean, median, minimum and maximum values with standard deviation of different variables in the
model during the period 1998 to 2007 are presented in the Table 2. Manufacturing firms on average
has 52 days of Cash Conversion Cycle and 78 days of Net Trade Cycle with standard deviation of 141and 101 days respectively. The firms have an Average Collection Period of 39 days, Inventory
Turnover in Days of 78 days and Average Payment Period of 64 days. The sample firms have on
average about 50% of the total assets in current form and sales growth of almost 17% annually whileon average 62% of the assets are financed with debt. The performance measure used in the analysis isNet Operating Profitability of the firms, which is on average 14% with a standard deviation of 0.12.
The median values for almost all the variables are near to mean values except average collection and
average payment periods.
Table 2: Descriptive Statistics of Variables for Manufacturing Sector
Variables Mean Std. Dev Median Minimum Maximum
ACP(in days) 39 58 20 0 730
APP(in days) 64 103 28 0 960
ITID(in days) 78 78 60 0 947
CCC(in days) 52 141 57 -348 910NTC(in days) 78 101 61 -666 1048
CATAR(ratio) 0.48 0.22 0.46 0.00 1.00
CLTAR(ratio) 0.45 0.26 0.42 0.01 3.34
CR(ratio) 1.35 1.27 1.08 0.04 20.16
FDR(ratio) 0.62 0.38 0.58 0.02 5.80
GWCTR(ratio) 2.92 2.02 2.37 0.03 22.02
LOS(ln) 20.82 1.57 20.64 13.13 26.58
SG 0.17 0.74 0.08 -0.98 16.35
NOP 0.14 0.12 0.13 -0.20 1.50
The sample firms belong to different sectors and each sector has its own characteristics andpolicies, therefore, overall manufacturing sector has relatively high standard deviation for almost all
the variables.
4.2. Correlation Analysis
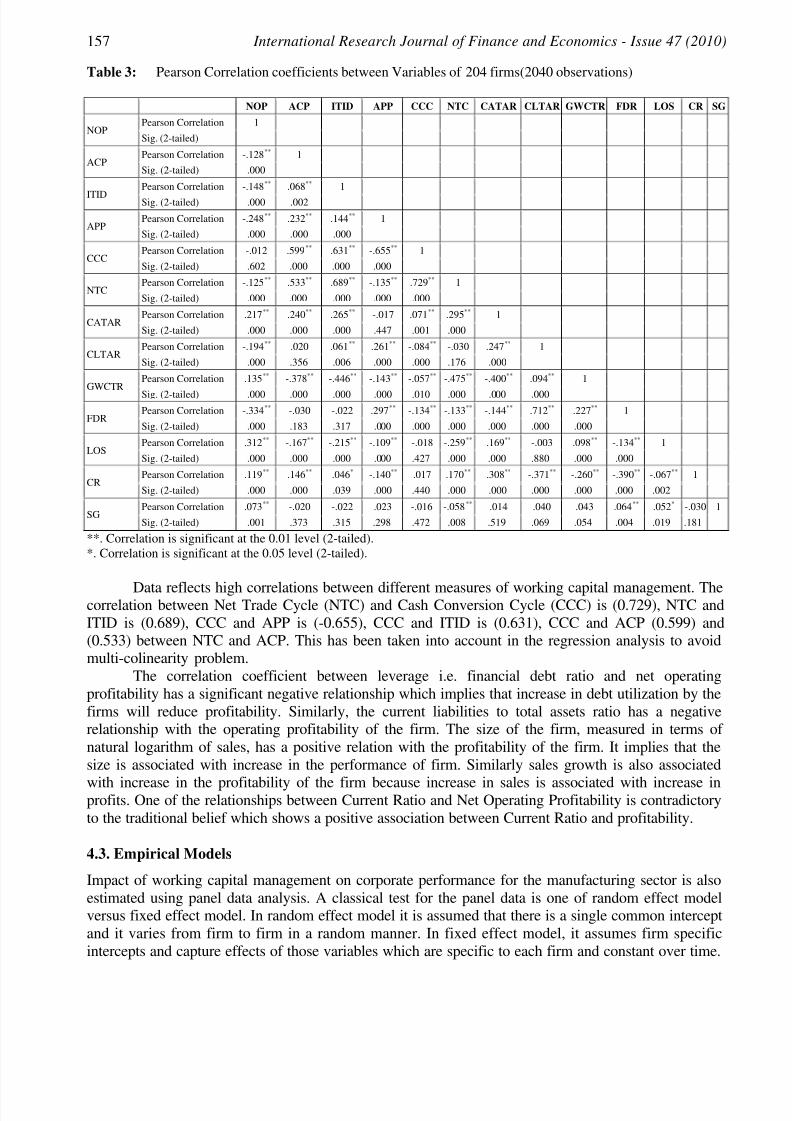
Correlation matrix of all variables included in the analysis is presented in Table 3 which is calculated
based on data of 204 firms with 2040 firms year observations. The table shows that Operating
Profitability is negatively associated with measures of working capital management (Average
Collection Period, inventory turnover in days, Average Payment Period, Cash Conversion Cycle andNet Trade Cycle). The correlation coefficients for all measures of working capital management are
significant except for Cash Conversion Cycle. These results are consistent with the view that making
payment to suppliers, collecting payments form customers earlier and keeping product or inventory inthe stock for lesser time are associated with increase in profitability. A negative relation between
Average Payment Period and Net Operating Profitability suggests that less profitable firms wait longer
to pay their accounts payables. These three variables jointly form Cash Conversion Cycle and thereexists negative relationship between CCC and operating profitability but it is not significant. It might
not be a surprise because all the three components of CCC has negative association with the
profitability and Average Payment Period is subtracted from sum of ACP and ITID to form Cash
Conversion Cycle. Similar result was found for study conducted by Deloof (2003) for Belgian firms.Another measure of working capital management is the Net Trade Cycle which has also a significant
negative relationship with profitability. It implies that if a firm is able to reduce the Net Trade Cycle
period, it can enhance the profitability for the firm and will ultimately create value for the shareholders.
8/3/2019 WCM Pro CTSX 2010
http://slidepdf.com/reader/full/wcm-pro-ctsx-2010 7/13
157 International Research Journal of Finance and Economics - Issue 47 (2010)
Table 3: Pearson Correlation coefficients between Variables of 204 firms(2040 observations)
NOP ACP ITID APP CCC NTC CATAR CLTAR GWCTR FDR LOS CR SG
NOPPearson Correlation 1
Sig. (2-tailed)
ACPPearson Correlation -.128** 1
Sig. (2-tailed) .000
ITID
Pearson Correlation -.148** .068** 1
Sig. (2-tailed) .000 .002
APPPearson Correlation -.248** .232** .144** 1
Sig. (2-tailed) .000 .000 .000
CCCPearson Correlation -.012 .599** .631** -.655** 1
Sig. (2-tailed) .602 .000 .000 .000
NTCPearson Correlation -.125** .533** .689** -.135** .729** 1
Sig. (2-tailed) .000 .000 .000 .000 .000
CATARPearson Correlation .217** .240** .265** -.017 .071** .295** 1
Sig. (2-tailed) .000 .000 .000 .447 .001 .000
CLTARPearson Correlation -.194** .020 .061** .261** -.084** -.030 .247** 1
Sig. (2-tailed) .000 .356 .006 .000 .000 .176 .000
GWCTRPearson Correlation .135** -.378** -.446** -.143** -.057** -.475** -.400** .094** 1
Sig. (2-tailed) .000 .000 .000 .000 .010 .000 .000 .000
FDRPearson Correlation -.334** -.030 -.022 .297** -.134** -.133** -.144** .712** .227** 1
Sig. (2-tailed) .000 .183 .317 .000 .000 .000 .000 .000 .000
LOSPearson Correlation .312** -.167** -.215** -.109** -.018 -.259** .169** -.003 .098** -.134** 1
Sig. (2-tailed) .000 .000 .000 .000 .427 .000 .000 .880 .000 .000
CRPearson Correlation .119** .146** .046* -.140** .017 .170** .308** -.371** -.260** -.390** -.067** 1
Sig. (2-tailed) .000 .000 .039 .000 .440 .000 .000 .000 .000 .000 .002
SGPearson Correlation .073** -.020 -.022 .023 -.016 -.058** .014 .040 .043 .064** .052* -.030 1
Sig. (2-tailed) .001 .373 .315 .298 .472 .008 .519 .069 .054 .004 .019 .181
**. Correlation is significant at the 0.01 level (2-tailed).
*. Correlation is significant at the 0.05 level (2-tailed).
Data reflects high correlations between different measures of working capital management. Thecorrelation between Net Trade Cycle (NTC) and Cash Conversion Cycle (CCC) is (0.729), NTC and
ITID is (0.689), CCC and APP is (-0.655), CCC and ITID is (0.631), CCC and ACP (0.599) and(0.533) between NTC and ACP. This has been taken into account in the regression analysis to avoidmulti-colinearity problem.
The correlation coefficient between leverage i.e. financial debt ratio and net operating
profitability has a significant negative relationship which implies that increase in debt utilization by the
firms will reduce profitability. Similarly, the current liabilities to total assets ratio has a negativerelationship with the operating profitability of the firm. The size of the firm, measured in terms of
natural logarithm of sales, has a positive relation with the profitability of the firm. It implies that the
size is associated with increase in the performance of firm. Similarly sales growth is also associated
with increase in the profitability of the firm because increase in sales is associated with increase inprofits. One of the relationships between Current Ratio and Net Operating Profitability is contradictory
to the traditional belief which shows a positive association between Current Ratio and profitability.
4.3. Empirical Models
Impact of working capital management on corporate performance for the manufacturing sector is also
estimated using panel data analysis. A classical test for the panel data is one of random effect modelversus fixed effect model. In random effect model it is assumed that there is a single common intercept
and it varies from firm to firm in a random manner. In fixed effect model, it assumes firm specific
intercepts and capture effects of those variables which are specific to each firm and constant over time.
8/3/2019 WCM Pro CTSX 2010
http://slidepdf.com/reader/full/wcm-pro-ctsx-2010 8/13
International Research Journal of Finance and Economics - Issue 47 (2010) 158
Regression coefficients were estimated by both fixed and random effects to determine which of these
two models is appropriate. Using Hausman test, decision is taken to use fixed effect model.
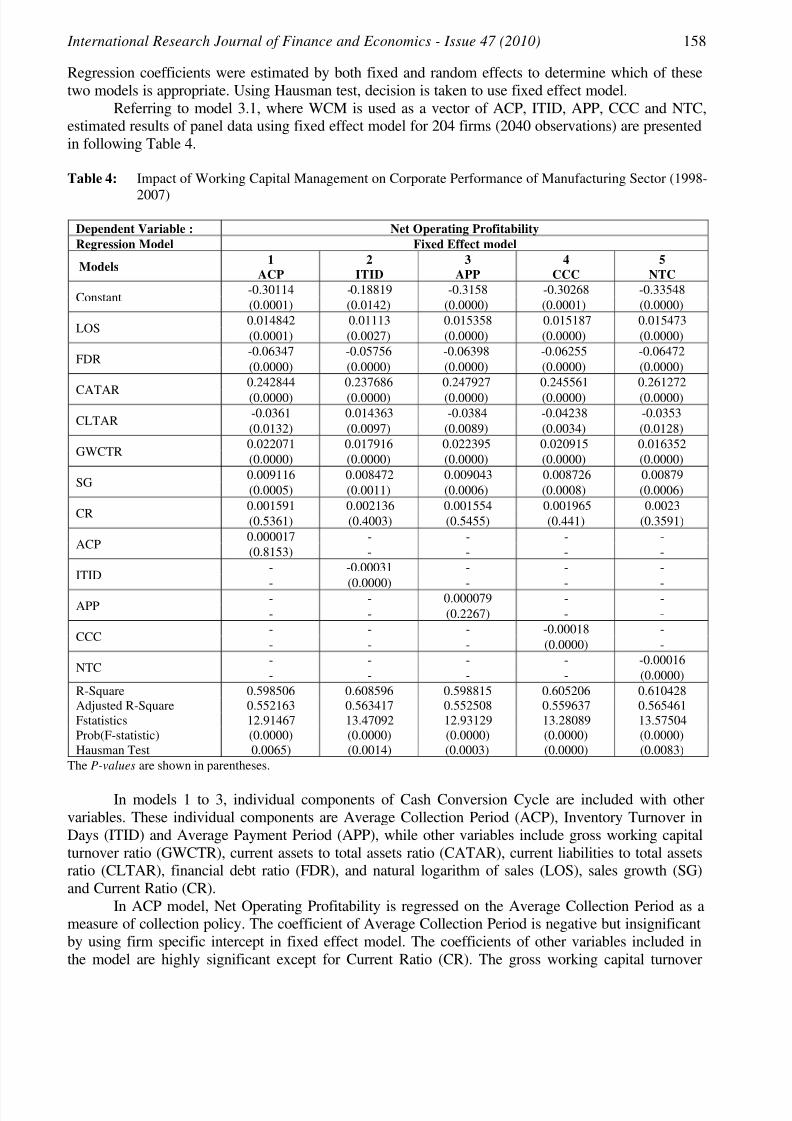
Referring to model 3.1, where WCM is used as a vector of ACP, ITID, APP, CCC and NTC,estimated results of panel data using fixed effect model for 204 firms (2040 observations) are presented
in following Table 4.
Table 4: Impact of Working Capital Management on Corporate Performance of Manufacturing Sector (1998-
2007)
Dependent Variable : Net Operating Profitability
Regression Model Fixed Effect model
Models1
ACP
2
ITID
3
APP
4
CCC
5
NTC
Constant-0.30114 -0.18819 -0.3158 -0.30268 -0.33548
(0.0001) (0.0142) (0.0000) (0.0001) (0.0000)
LOS0.014842 0.01113 0.015358 0.015187 0.015473
(0.0001) (0.0027) (0.0000) (0.0000) (0.0000)
FDR-0.06347 -0.05756 -0.06398 -0.06255 -0.06472
(0.0000) (0.0000) (0.0000) (0.0000) (0.0000)
CATAR
0.242844 0.237686 0.247927 0.245561 0.261272
(0.0000) (0.0000) (0.0000) (0.0000) (0.0000)
CLTAR-0.0361 0.014363 -0.0384 -0.04238 -0.0353
(0.0132) (0.0097) (0.0089) (0.0034) (0.0128)
GWCTR0.022071 0.017916 0.022395 0.020915 0.016352
(0.0000) (0.0000) (0.0000) (0.0000) (0.0000)
SG0.009116 0.008472 0.009043 0.008726 0.00879
(0.0005) (0.0011) (0.0006) (0.0008) (0.0006)
CR0.001591 0.002136 0.001554 0.001965 0.0023
(0.5361) (0.4003) (0.5455) (0.441) (0.3591)
ACP0.000017 - - - -
(0.8153) - - - -
ITID- -0.00031 - - -
- (0.0000) - - -APP
- - 0.000079 - -
- - (0.2267) - -
CCC- - - -0.00018 -
- - - (0.0000) -
NTC- - - - -0.00016
- - - - (0.0000)
R-Square 0.598506 0.608596 0.598815 0.605206 0.610428
Adjusted R-Square 0.552163 0.563417 0.552508 0.559637 0.565461
Fstatistics 12.91467 13.47092 12.93129 13.28089 13.57504
Prob(F-statistic) (0.0000) (0.0000) (0.0000) (0.0000) (0.0000)
Hausman Test 0.0065) (0.0014) (0.0003) (0.0000) (0.0083)
The P-values are shown in parentheses.
In models 1 to 3, individual components of Cash Conversion Cycle are included with other
variables. These individual components are Average Collection Period (ACP), Inventory Turnover in
Days (ITID) and Average Payment Period (APP), while other variables include gross working capital
turnover ratio (GWCTR), current assets to total assets ratio (CATAR), current liabilities to total assetsratio (CLTAR), financial debt ratio (FDR), and natural logarithm of sales (LOS), sales growth (SG)
and Current Ratio (CR).
In ACP model, Net Operating Profitability is regressed on the Average Collection Period as ameasure of collection policy. The coefficient of Average Collection Period is negative but insignificant
by using firm specific intercept in fixed effect model. The coefficients of other variables included in
the model are highly significant except for Current Ratio (CR). The gross working capital turnover

8/3/2019 WCM Pro CTSX 2010
http://slidepdf.com/reader/full/wcm-pro-ctsx-2010 9/13
159 International Research Journal of Finance and Economics - Issue 47 (2010)
ratio has significant positive impact on Net Operating Profitability which implies that as a firm is able
to increase the working capital turnover, it will enhance the profits of the firm as well. To check the
working capital investment policy and financing policy, two variables as current assets to total assetsratio and current liabilities to total assets ratio are also included in the regression. The first variable
current assets to total assets show a significant positive relationship with the profitability which show
that firms in general following the conservative policy of working capital management. On the other
side current liabilities to total assets ratio is also showing a significant negative relationship with
profitability. It implies that the firms in the manufacturing sector in general follow the conservativepolicy of financing working capital which implies that it would be better for firms if they finance the
working capital by medium term loans rather than short term loan. It will enhance their profitability.Financial debt ratio is negatively associated with Net Operating Profitability which means increase in
the financial leverage leads to decrease in the operating profitability of firm. The result is highly
significant. This finding is in support of Myers and Majlof (1984), Rajan and Zingales (1995), shin andSoenen (1998) and Deloof (2003) who predicted a negative relationship between leverage and
profitability. The natural logarithm of sales is used for size in the regression model as this log
transformation reduces the hetroskedasticity and influences of outliers in the regression model. Size ispositively related to profitability and is significant which implies that larger size seems to favor the
Generation of profitability therefore larger firms are more profitable. Sales growth is also included in
the model to see the impact of growth on the performance. It indicates a firm’s business opportunities.This variable is also significantly affecting the performance of firm in a positive way. The growth insales of firms increases the performance of firms. Shin and Soenen (1998) and Deloof (2003) also
concluded that sales growth had a positive relation to changes in accounting measure of profitability.
The Current Ratio which is a theoretical measure of liquidity has no significant impact on profitabilityin case of Pakistan’s manufacturing firms.
In ITID model, we have same set of independent variables as in ACP model, except for
substitution of Average Collection Period (ACP) with Inventory Turnover in Days (ITID). ITID hassignificant negative impact on Net Operating Profitability (P-value = 0.0000). This implies that
profitability can be improved by reducing the Inventory Turnover in Days or by keeping inventory for
lesser time can improve profitability of firm. Most of the studies found a significant negative impact of
Inventory Turnover in Days on the profitability of firms.In APP model, Inventory Turnover in Days (ITID) is replaced with Average Payment Period
(APP). The coefficient of Average Payment Period is positive which implies that lengthening the
payment period increase the profitability. This result is not significant but positive sign does makeeconomic sense because longer a firm takes time to make payments to credit suppliers, the higher level
of working capital it reserves and use to improve profitability.
In CCC model, Cash Conversion Cycle is included with other variables. This model provides astrong evidence of negative relationship between Cash Conversion Cycle (a comprehensive measure of
working capital management) and corporate profitability where the coefficient is negative and highly
significant. It is consistent with the view that decreasing the Cash Conversion Cycle will generate more
profits for the company. It also implies that firms can create value for their shareholders by keeping the
Cash Conversion Cycle to minimum.In NTC model, another comprehensive measure of the working capital management which is
Net Trade Cycle is used as included by Shin and Soenen, (1998). We have included Net Trading Cyclein stead of Cash Conversion Cycle in this model, while all other variables are same as in the previous
models. The results of this model provide a strong evidence of negative relationship between Net Trade
Cycle and profitability of firms as the coefficient of NTC is negative and highly significant. It impliesthat a firm with relatively shorter NTC is more profitable. Further, by reducing NTC to increase the
efficiency of working capital management results in increased operating income. Therefore, it can be
said that by reducing NTC firm can create additional value for the shareholders. All other variableshave similar type of results as in the previous equations.
8/3/2019 WCM Pro CTSX 2010
http://slidepdf.com/reader/full/wcm-pro-ctsx-2010 10/13
International Research Journal of Finance and Economics - Issue 47 (2010) 160
The results of all regressions models suggest that managers can increase the Net Operating
Profitability by increasing the gross working capital turnover ratio, current assets to total assets ratio,
sales growth and size of the firm. On the other side it decreases with increase in inventory turnover indays, Cash Conversion Cycle, Net Trading Cycle, current liabilities to total assets and financial debt
ratio. The adjusted R-Square is between 55 to 57% in all five fixed effect model and F-statistics is
significant. In the fixed effect model using firm specific intercept improves the explanatory Power of
the models.
We have also estimated these models using ordinary least square method (OLS). The results of these models using OLS can be seen in Appendix-I. The major difference between Using fixed effect
model and ordinary least square method is for the Average Collection Period and Average PaymentPeriod. The coefficient of ACP which was negative and significant in OLS at 0.01 levels loses its
significance in case of fixed effect model. This implies that while using fixed effect model, the firms
are not efficient in their collection policy. In order to improve their collection policy, firms mustconcentrate on improving their Average Collection Period. The coefficient for Inventory Turnover in
Days is still significant with negative sign which implies that firms are improving their profitability by
reducing the inventory turnover in days. The result for the Average Payment Period or payment policynot only loses its significance but also changed the sign of coefficient by using fixed effect model. The
coefficient of APP which was negative and significant in OLS at 0.01 level is positive but not
significant. This might be possible because there are number of firms from different sectors. Thesectoral differences and differences in the nature of firms might cause this change in sign andsignificance in Average Payment Period.
The above analysis includes firms from all manufacturing sectors. It is known that significant
sectoral effect exists on a firm’s working capital investment. Hawawini et. al. (1986) explained thatindustry/sector benchmarks exists in industry groups, which needs to be kept in mind while setting
working capital investment policy
5. ConclusionThe contribution of manufacturing sector, the second largest sector of the economy, plays a significant
role in the economic growth of Pakistan. In this perspective, the main objectives of the study is toempirically analyze the impact of working capital management on performance of manufacturing firms
listed at Karachi Stock Exchange using panel data. Furthermore, the objective is also to find out thedegree of aggressiveness in investment and financing policies of working capital for manufacturing
sector.
The results shows that for overall manufacturing sector, Working Capital Management has a
significant impact on profitability of the firms and plays a key role in value creation for shareholders aslonger Cash Conversion Cycle and Net Trade Cycle have negative impact on Net Operating
Profitability of a firm. The Cash Conversion Cycle and Net Trade Cycle offer easy and useful way to
check working capital management efficiency. For value creation of shareholders, firms must try tokeep these numbers of days to minimum level. The negative association of Average Collection Period
with Net Operating Profitability has not been validated using fixed effect model. This shows problemswith the collection policy in general for the firms in manufacturing sector. There exists negativeassociation between Inventory Turnover in Days and Net Operating Profitability for the manufacturing
sector as a whole, which implies that keeping lesser inventories will increase profitability. Similar to
Average Collection Period, the positive association of Average Payment Period with Net OperatingProfitability is not proven in case of fixed effect model for the manufacturing sector in general which
also shows the problems with the payment policy of firm.
The Gross Working Capital Turnover Ratio and Current Assets to Total Assets also has the
significant positive impact on profitability. The Current Assets to Total Assets Ratio shows that firmsin general have lower degree of aggressiveness in working capital investment policy and Net Operating
Profitability. The negative sign of Current Liabilities to Total Assets Ratio indicates lower degree of

8/3/2019 WCM Pro CTSX 2010
http://slidepdf.com/reader/full/wcm-pro-ctsx-2010 11/13
161 International Research Journal of Finance and Economics - Issue 47 (2010)
aggressiveness in working capital financing policy and Net Operating Profitability. Leverage is
negatively associated with Profitability which implies that increase in debt financing; adversely affect
the performance of a firm measured by profitability. Regarding the size and profitability, increase insize (measured in terms of natural logarithm of sales), leads to an increase in the profitability of the
firm. Sales Growth has positive association with profitability since growth, as an indicator of firm’s
business opportunities, is a very important factor which allows firm to enjoy more profits.
Theoretically, it is found that there exist a negative relationship between liquidity and profitability of
the firms; therefore, the measures of liquidity, Current Ratio should have negative association with theprofitability. However, empirical researches have found both positive and negative association between
current ratio and profitability. Similarly, in our research negative relationship is not proven betweencurrent ratio and net operating profitability. Furthermore, we also found that CCC and NTC measures
the liquidity different form conventional Current Ratio.
Several policy implications can be drawn from the above findings of the study which includethat working capital management should be the concern of all the manufacturing sectors firms and need
to be given due importance. The collection and payment policies of the firms in manufacturing sectors,
in general, need to be thoroughly reviewed. It is generally argued that firms need to accelerate theircash collections and slowdown their payments. This can only be possible with some professional
advice and supervision. The findings indicate that firm managers/executives can enhance performance
of the firms by reducing the number of days in inventories, Cash Conversion Cycle and Net TradeCycle to a reasonable minimum. This is only possible if the components of Cash Conversion Cycle andNet Trade Cycle (ACP, ITID and APP) may be dealt individually and an optimal / effective policy is
formulated for these components. Furthermore, efficient Management and financing of working capital
(current assets and current liabilities) can increase the operating profitability of manufacturing firms.For efficient working capital management, specialized persons in the fields of finance should be hired
by the firms for expert advice in the manufacturing sector because there are number of firms where
there is only one department and one person who is looking after all financial activities of firmsincluding handling of accounts etc.
References[1] Afza, T. and M. S. Nazir, (2007). Working Capital Management Policies of Firms: Empirical
Evidence from Pakistan. Conference Proceedings of 9th South Asian Management Forum
(SAMF) on February 24-25, North South University, Dhaka, Bangladesh.
[2] Afza, T. and M. S. Nazir, (2008). Working Capital Approaches and Firm’s Returns. Pakistan
Journal of Commerce and Social Sciences. 1(1), 25-36.
[3] Baltagi, B. H. (2001). Econometric Analysis of Panel Data. 2nd
Edition, John Wiley & Sons.Chichester.
[4] Blinder, A. S. and L. Macinni, (1991). Taking Stock: A critical Assessment of Recent Research
on Inventories. Journal of Economic Perspectives. 5(1), 73-96.[5] Czyzewski, A.B., and D.W. Hicks, (1992). Hold Onto Your Cash. Management Accounting.
27-30.[6] Deloof, M. (2003). Does Working Capital Management Affects profitability of Belgian Firms?
Journal of Business Finance & Accounting. 30(3) & (4), 0306-686X.
[7] Economic Survey of Pakistan, (2006-07). Finance Division, Government of Pakistan.
[8] Eljelly, M.A. (2004). Liquidity – Profitability Tradeoff: An empirical investigation in anemerging market. International Journal of Commerce & Management . 14(2).
[9] Filbeck, G. and T. M. Krueger, (2005). An Analysis of Working Capital Management results
across Industries. American Journal of Business. 20(2), 11-18.
[10] Garcia-Teruel, P.J. and Martinez-Solano, P. (2007). Effects of Working Capital Managementon SME Profitability. International Journal of Managerial Finance. 3(2), 164-177.
8/3/2019 WCM Pro CTSX 2010
http://slidepdf.com/reader/full/wcm-pro-ctsx-2010 12/13
International Research Journal of Finance and Economics - Issue 47 (2010) 162
[11] Gitman, L.J. (1991). Principles of Managerial Finance. Collins Publishers Inc. Harper. New
York.
[12] Hausman, J.A. (1978), Specification Tests in Econometrics. Econometrica. 46, 1251-71.[13] Jose, M. L., C. Lancaster, and J. L. Stevens, (1996). Corporate Returns and Cash Conversion
Cycles. Journal of Economics and Finance. 20(1), 33-46.
[14] Kargar, J. and R. A. Blumenthal, (1994). Leverage Impact of Working Capital in Small
Businesses. TMA Journal. 14(6), 46-53.
[15] Lazaridis, I. and D. Tryfonidis, (2006). Relationship between Working Capital Managementand Profitability of Listed Companies in the Athens Stock Exchange. Journal of Financial
Management and Analysis. 19 (1), 26 – 35.[16] Mukhopadhyay, D. (2004). Working Capital Management in Heavy Engineering Firms—A
Case Study. Accessed from myicwai.com/knowledgebank/fm48.
[17] Padachi, K. (2006). Trends in Working Capital Management and its Impact on Firms’Performance: An Analysis of Mauritian Small Manufacturing Firms. International Review of
Business Research Papers. 2(2), 45 - 58.
[18] Raheman, A. and M. Nasr, (2007). Working Capital Management and Profitability – Case of Pakistani Firms. International Review of Business Research Papers. 3 (2), 275 - 296.
[19] Samiloglu, F. and K. Demirgunes, (2008). The Effects of Working Capital Management on
Firm Profitability: Evidence from Turkey. The International Journal of Applied Economics and Finance. 2(1), 44-50.
[20] Shah, A. and A. Sana, (2006). Impact of Working Capital Management on the Profitability of
Oil and Gas Sector of Pakistan. European Journal of Scientific Research. 15(3), 301 - 307.
[21] Shin, H., and L. Soenen, (1998). Efficiency of Working Capital and Corporate Profitability.
Financial Practice and Education. 8(2), 37–45.
[22] Smith, M. Beaumont, E. Begemann, (1997). Measuring Association between Working Capital
and return on Investment. South African Journal of Business Management . 28(1).[23] Soenen, L.A. (1993). Cash Conversion Cycle and Corporate Profitability. Journal of Cash
Management . 13, 53-57
[24] Uyar, A. (2009). The Relationship of Cash Conversion Cycle with Firm Size and Profitability:
An Empirical Investigation in Turkey. International Research Journal of Finance and Economics. 24.
[25] Van Horne, J. C. and J. M. Wachowicz, (2000). Fundamentals of Financial Management.
Eleventh edition, Prentice Hall Inc.[26] Vishnani, S. and K.S. Bhupesh, (2007). Impact of Working Capital Management Policies on
Corporate Performance- An Empirical Study. Global Business Review. 8. 267
[27] Wang, Y.J. (2002). Liquidity Management, Operating Performance, and Corporate Value:Evidence from Japan and Taiwan. Journal of Multinational Financial Management . 12, 159-
169.

8/3/2019 WCM Pro CTSX 2010
http://slidepdf.com/reader/full/wcm-pro-ctsx-2010 13/13
163 International Research Journal of Finance and Economics - Issue 47 (2010)
Appendix IImpact of Working Capital Management on Corporate Performance of Manufacturing Sector – OLS
Estimation (1998-2007)
Dependent Variable : Net Operating Profitability
Regression Model Ordinary Least Square Method
Models1
ACP
2
ITID
3
APP
4
CCC
5
NTCConstant
-0.20259 -0.1907 -0.21097 -0.22385 -0.1825
(0.0000) (0.0000) (0.0000) (0.0000) (0.0000)
LOS0.013994 0.013655 0.014504 0.014734 0.013202
(0.0000) (0.0000) (0.0000) (0.0000) (0.0000)
FDR-0.08032 -0.0814 -0.07574 -0.08209 -0.08334
(0.0000) (0.0000) (0.0000) (0.0000) (0.0000)
CATAR0.176495 0.178014 0.165666 0.171155 0.179408
(0.0000) (0.0000) (0.0000) (0.0000) (0.0000)
CLTAR-0.06069 -0.06014 -0.05397 -0.0597 -0.06034
(0.0001) (0.0001) (0.0005) (0.0001) (0.0001)
GWCTR0.016622 0.016313 0.016539 0.017841 0.016223
(0.0000) (0.0000) (0.0000) (0.0000) (0.0000)
SG 0.010929 0.010946 0.011214 0.010961 0.010606(0.0004) (0.0004) (0.0003) (0.0004) (0.0007)
CR-0.00271 -0.00369 -0.00323 -0.00289 -0.00313
(0.2168) (0.0953) (0.1409) (0.1889) (0.1538)
ACP-0.00015 - - - -
(0.001) - - - -
ITID- -0.00011 - - -
- (0.0019) - - -
APP- - -0.00024 - -
- - (0.0000) - -
CCC- - - -3.53E-06 -
- - - (0.8657) -
NTC- - - - -0.000096
- - - - (0.0007)R-Square 0.281644 0.281251 0.284552 0.277825 0.281934
Adjusted R-Square 0.278814 0.278419 0.281734 0.27498 0.279105
Fstatistics 99.53607 99.34265 100.9727 97.66712 99.67866
Prob(F-statistic) (0.0000) (0.0000) (0.0000) (0.0000) (0.0000)
The P-values are shown in parenthese.