No 128- May 2011
China’s Manufacturing and Industrialization in
Africa
Ron Sandrey and Hannah Edinger
Correct citation: Sandrey, Ron and Edinger, Hannah (2011), China’s Manufacturing and Industrialization in Africa, Series N° 128, African Development Bank, Tunis, Tunisia.
Editorial Committee
Vencatachellum, Désiré (Chair) Anyanwu, John C. Verdier-Chouchane, Audrey Ngaruko, Floribert Faye, Issa Shimeles, Abebe Salami, Adeleke
Salami, Adeleke
Coordinators
Copyright © 2011 African Development Bank Angle des l’avenue du Ghana et des rues Pierre de Coubertin et Hédi Nouira BP 323 -1002 TUNIS Belvédère (Tunisia) Tél: +216 71 333 511 Fax: +216 71 351 933 E-mail: [email protected]
Rights and Permissions
All rights reserved.
The text and data in this publication may be reproduced as long as the source is cited. Reproduction for commercial purposes is forbidden.
The Working Paper Series (WPS) is produced by the Development Research Department of the African Development Bank. The WPS disseminates the findings of work in progress, preliminary research results, and development experience and lessons, to encourage the exchange of ideas and innovative thinking among researchers, development practitioners, policy makers, and donors. The findings, interpretations, and conclusions expressed in the Bank’s WPS are entirely those of the author(s) and do not necessarily represent the view of the African Development Bank, its Board of Directors, or the countries they represent.
Working Papers are available online at http:/www.afdb.org/
China’s Manufacturing and Industrialization in Africa
Ron Sandrey1 and Hannah Edinger2
1 Ron Sandrey is Research Associate at the Trade Law Centre for Southern Africa (tralac) and Professor Extraordinary at the Department of Agricultural Economics, University of Stellenbosch, South Africa. 2 Hannah Edinger is Senior Manager and Head of Research at Frontier Advisory (Pty) Ltd, and affiliated to the China-Africa Network, Gordon Institute of Business Science (GIBS), University of Pretoria, South Africa.
Office of the Chief Economist
AFRICAN DEVELOPMENT BANK GROUP
Working Paper No. 128
May 2011
4
Abstract
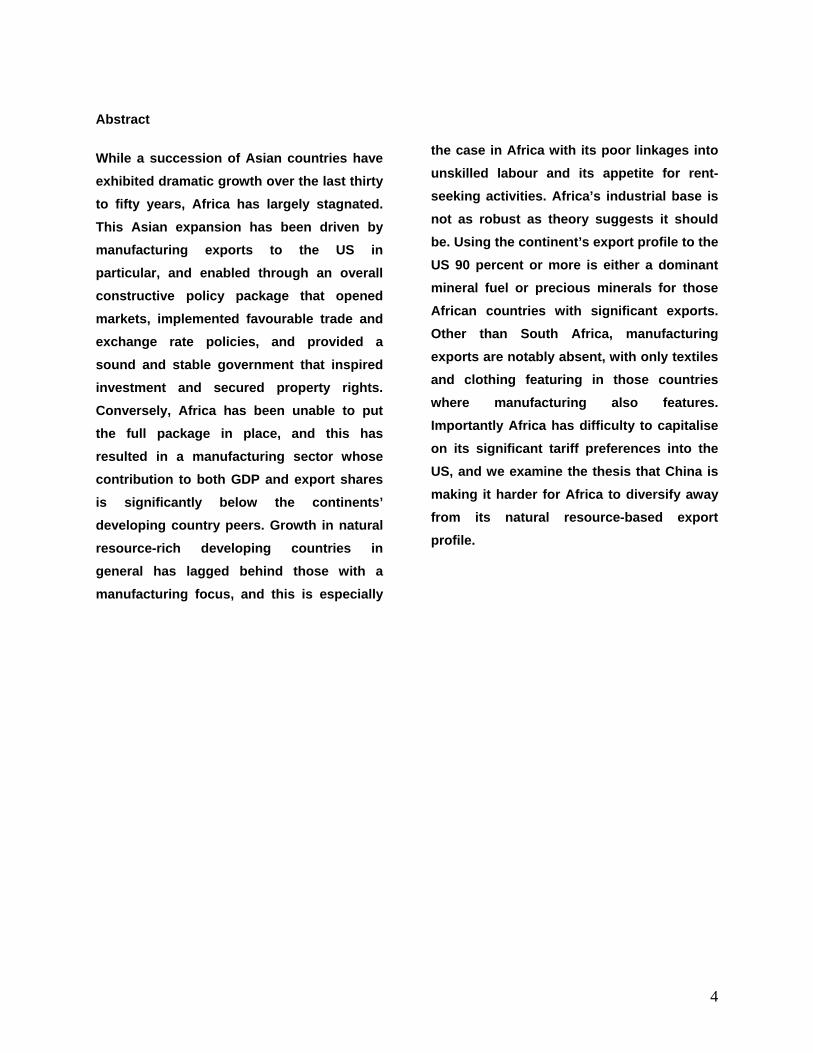
While a succession of Asian countries have exhibited dramatic growth over the last thirty to fifty years, Africa has largely stagnated. This Asian expansion has been driven by manufacturing exports to the US in particular, and enabled through an overall constructive policy package that opened markets, implemented favourable trade and exchange rate policies, and provided a sound and stable government that inspired investment and secured property rights. Conversely, Africa has been unable to put the full package in place, and this has resulted in a manufacturing sector whose contribution to both GDP and export shares is significantly below the continents’ developing country peers. Growth in natural resource-rich developing countries in general has lagged behind those with a manufacturing focus, and this is especially
the case in Africa with its poor linkages into unskilled labour and its appetite for rent-seeking activities. Africa’s industrial base is not as robust as theory suggests it should be. Using the continent’s export profile to the US 90 percent or more is either a dominant mineral fuel or precious minerals for those African countries with significant exports. Other than South Africa, manufacturing exports are notably absent, with only textiles and clothing featuring in those countries where manufacturing also features. Importantly Africa has difficulty to capitalise on its significant tariff preferences into the US, and we examine the thesis that China is making it harder for Africa to diversify away from its natural resource-based export profile.
5
Table of Contents
1. Introduction ........................................................................................................................... 6 2. The State of Industrialization in Africa .............................................................................. 7
2.1. The Background .............................................................................................................. 7 2.2. What Should Africa Produce? ........................................................................................ 9 2.3. Where is Africa Competitive? ....................................................................................... 10 2.4. The Apparel Sector ........................................................................................................ 13
3. Challenges Facing Africa in the Age of the Chinese Dragon .......................................... 14 3.1. China trade with Africa versus other regions .............................................................. 15 3.2. Competition from China in manufactures ................................................................... 17 3.3. China exports and manufactures prices ....................................................................... 19 3.4. The impact of China’s growth on Africa’s commodity sector ..................................... 21 3.5. Chinese support for African infrastructure ................................................................. 23 3.6. The potential for Chinese support for African manufactures ..................................... 24
4. Conclusion ........................................................................................................................... 27 References .................................................................................................................................... 29
6
1. Introduction
China, as well as several other Asian economies, has achieved spectacular growth rates through
opening markets to facilitate sensible price signals, operating trade and exchange rate policies
that favour exports over imports in at least the initial stages, providing a sound incentives
framework for investment, and developing large-scale physical infrastructure. These policies
have fostered dynamic gains from increased production and export of manufactures. In Africa,
by contrast, the acceleration of growth from 2001 until the global recession was based on higher
primary commodity prices, while diversification into manufactures production has been limited.
The objective of this paper is to examine the state of industrialization in Africa and to discuss the
interactions between China’s growth and African development. African nations are linked to
China through that country’s importance in determining the prices of raw materials, China’s
demand for Africa’s raw materials exports, substantial investments in Africa, and exports of low-
cost investment and consumer goods. However, there is concern that these exports are damaging
Africa’s industrial base, while reliance on commodity exports will not support poverty reduction
as commodity production generates limited demand for unskilled labour and increasing scope for
reliance on rent-seeking rather than productive activities. Goldstein et al. (2006) conclude that
China can have a net positive impact on Africa, but only with improvements in governance and
policies that support diversification, backward and forward linkages between sector enclaves and
the rest of the economy, increased demand for labour, and skills upgrading.
We begin with an analysis of Africa’s export performance and diversification. The next section
considers how China has affected African growth over the past decade or so, focusing on the
implications of China’s manufactured exports, Chinese investment in Africa’s resource sector,
and China’s encouragement of export processing zones. A key question is whether China’s rapid
growth in manufacturing combined with Africa’s exports of natural resources is effectively
blocking off Africa’s ability to follow a manufacturing-led growth path. The final section offers
some policy recommendations.
7
2. The State of Industrialization in Africa
2.1. The Background Given its natural resource wealth, it is only natural that Africa exports a considerable share of its
oil and mineral commodities. This is consistent with general trade theory. But most African
states import many goods that require a large semi-skilled and unskilled labour base to produce.
This is not so consistent with theory, as these African countries, with a large pool of unskilled
labour, should be producing and exporting these goods.
Most African countries have achieved only limited diversification from primary commodity
exports to manufactures, and often small gains in diversification have been reversed quickly
(Hammouda and others, 2006). The United Nations Economic Commission for Africa (UNECA,
2007) describes Africa’s progress in diversification over the last few decades as “slow and
volatile”. Progress has differed across regions. North Africa recently has achieved the most
gains, and SADC and COMESA also have made progress, led by structural transformation in key
economies (in the case of SADC, South Africa) (UNECA, 2007).
The production of manufactures (value added as a share of GDP) in Africa remained constant
from 1995 to 2004, and has remained far below the average of its developing country peers
(Table 1). Manufactures accounted for only 10.9 percent of the GDP of the 20 largest African
economies in 2006 (9.6 percent if South Africa is excluded).3 Fukunishi (2004) finds that
manufactured exports equalled only 6 percent of Sub-Saharan Africa’s GDP—a little over half of
the 11 percent average for all low income countries—and the value of manufactured exports
equalled 50 percent of value added in manufacturing, compared to 59 percent for all low-income
countries. He concludes that the poor export performance is the key reason for the stagnation of
the manufacturing sector in Sub-Saharan Africa.
3 This calculation is based on data from UNIDO. The average weighted MVA for 2000 was 11.6 for the top twenty economies with South Africa and 10.2 without South Africa, as South Africa’s MVA declined from 17.25 in 2000 to 16.33 in 2006. Of the top twenty economies in 2006 the MVA was below 5 for seven, between 5 and 9.9 for six, between 10 and 14.9 for two and over 15 for the remaining five (South Africa, Egypt, Tunisia, Cote d’Ivoire and Senegal). Of the twenty, twelve saw a decline in MVA ratios between 2000 and 2006.
8
Table 1: Share of manufacturing value add (MVA) as a % of GDP (at constant 1995 prices)
1995 2000 2004* Africa 12.1 12.3 12.1
China 34.7 36.7 39.0
India 16.3 15.7 15.0
Developing Group excluding China 19.2 20.0 20.4
WORLD 19.8 20.1 19.9 Source: UNIDO International Year Book 2006, reported in Kaplinsky (2008)
Fukunishi (2004) and Kaplinsky and Morris (2008) show that SSA’s productivity is lower and
that labour costs are higher than in other low-income economies (and in Asia in particular), and
that these factors are accentuated by over-valued exchange rates, low FDI levels and small firm
sizes in Africa. Although there are differences among African countries, in general high indirect
costs and business-environment related losses impair the productivity of African firms. African
gross productivity4 is only 40-80 percent of China’s.5
The creation of competitive industrial capacity has been hindered by: (i) low investment; (ii)
poor infrastructure services, resulting in higher production and transaction costs; (iii) high
sovereign risk, poor governance and weak institutions; (iv) ill-advised industrial policies; and (v)
generally rigid macro-economic frameworks (UNECA, 2007). Africa’s problems are accentuated
by the small size and ethnic fragmentation of many countries that too often results in internal
conflict, by the geographical nature of many landlocked resource-scare states, and by the
implications of letting Asia “get too far ahead”. Soderbom and Teal (2001) caution that
improved macroeconomic policies alone may not be sufficient to boost economic growth.
Policies that target improvements in the operational efficiency of firms, coupled with
macroeconomic reforms, would help firms become successful exporters and substantially
4 Where gross productivity relates to the usual concept of total factor productivity, while net total factor productivity takes out the indirect costs that are outside of the control of the individual firms but contribute to higher operating costs. 5 This range depends upon how the productivity estimate is calculated and falls even further when net productivity is analysed, to only 20-40 percent of China’s productivity.
9
improve countries’ economic performance. In general, political leadership is required to
eliminate constraints on infrastructure, skills development, and entrepreneurship.
2.2. What Should Africa Produce? The desirable structure of African production is a matter of some controversy. Wood and Mayer
(2001) argue that Africa should follow a land-abundant development path similar to that
followed by the United States, rather than the model followed by the land-scarce Asian
economies.6 The highest priority should be to raise exports, relying on Africa’s abundant natural
resources. They argue that even if Africa were to eliminate the policy constraints on
manufactures production, so that manufactures export performance achieved its estimated
potential, manufactures would still make up less than 30 percent of total exports, marginally
above Latin America’s 28 percent but significantly below the 60 to 70 percent levels in East and
South Asia. The limited potential for manufactures implies that substantial increases in SSA’s
output and exports must depend on the expansion of natural resource-based activities. Eifert et al.
(2005) confirm that African manufacturing and manufactured exports are high-cost relative to
the continent’s levels of income and productivity. And Lederman and Maloney (2007) state that
raw materials should be seen as “neither a curse nor destiny”, and can contribute to development
when coupled with policies that support innovation. Knowledge, the availability of
infrastructure, and the quality of governance together determine what countries produce and how
they produce it.7
Other observers find that Africa’s dependence on natural resources must be overcome because it
limits development. Natural resource dependence has often been accompanied by widespread
corruption, weak institutions, and rent seeking. Volatile primary commodity prices have imposed
high levels of volatility on resource-dependent African economies, while these economies have
only limited ability to protect the vulnerable. Investments in natural resources contribute little to
the employment of the unskilled, and thus often have a limited role in reducing poverty. And
resource-rich developing countries have often experienced slower growth than their non
resource-rich developing country peers since the 1960s.
6 By now, of course, the US has moved towards a service economy. 7 For most sectors, the patterns of comparative advantage are better explained by the set of new endowments (what one does) than by traditional endowments (what one has). Only in the raw materials and forestry sectors do the traditional endowments predominate over the new endowments that are affected by public policies such as knowledge, schooling, infrastructure, ICT and institutions.
10
2.3. Where is Africa Competitive?
Determining what goods Africa is most suited to produce, given its resource endowments and
input costs, is a difficult exercise. Export performance can indicate what products are
competitive in global markets, although the level and commodity composition of exports are
influenced by distorted trading regimes in many African countries, as well as import preferences
offered by trading partners. Given the general problem of reliability and timeliness of African
data, our analysis of the competitiveness of African manufactures will use US import data, as the
United States is the world’s main export destination for manufactured goods.8
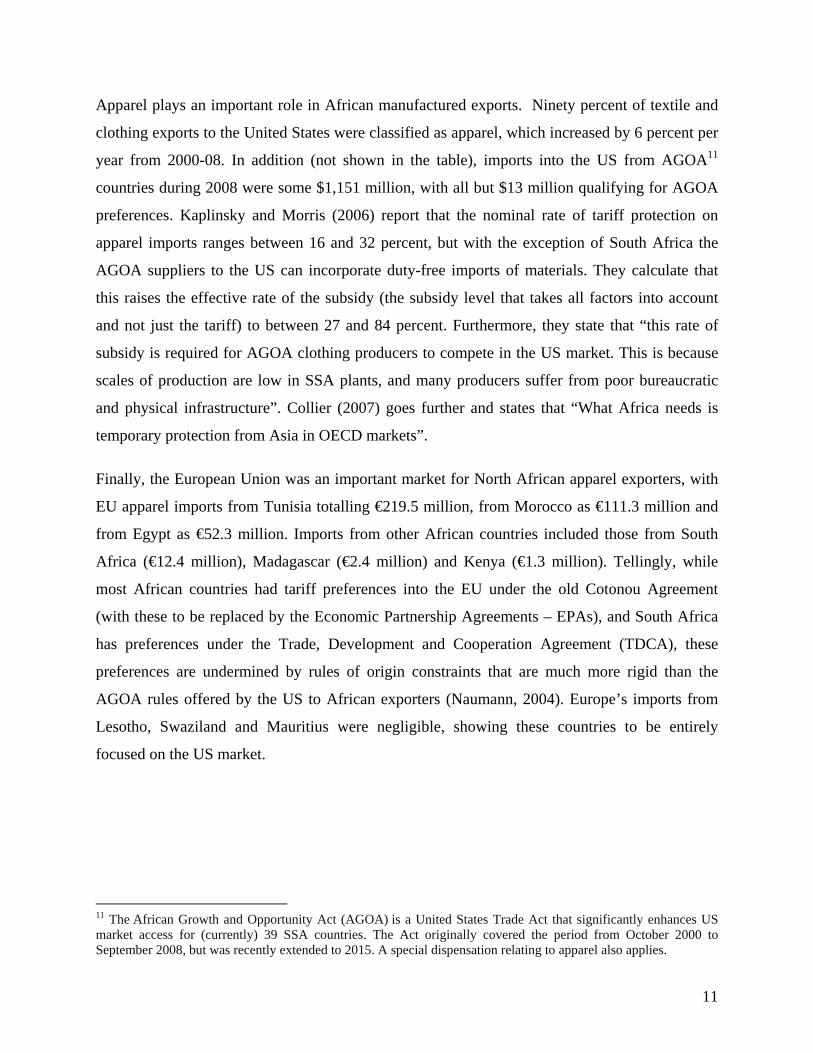
Several aspects of African exports are worth highlighting, in terms of country breakdown,
commodity composition, and in comparison to Asian exports (table 2 & 3).9 The bulk (89
percent) of Africa’s exports to the United States are fuels or minerals, which account for more
than 99 percent of exports from Nigeria, Algeria and Angola, and about 40 percent of exports
from Egypt and South Africa. Fuels also dominated the only significant exporters among the
medium-sized African economies. Textiles and clothing made up only 2 percent of exports
(about $1 billion each from Sub-Saharan Africa and North Africa) to the United States, three-
quarters of this supplied by Egypt, Kenya, Mauritius and Lesotho. Nevertheless, textiles and
clothing accounted for a significant share of Africa’s manufactured exports to the United States,
with other major products including transport-related goods (1.7 percent of total exports), base
metals (1.5 percent), chemicals (1.3 percent), prepared foods (0.9 percent), and machinery and
electrical equipment (0.6 percent).10
8 We have omitted an analysis of African trade with the EU, although this trade is more important than the US trade for several North African and West African economies. We use the US as the benchmark manufacturing market as this market has been the final manufacturing market for successive waves of Asian growth economies. 9 The data were selected for table 4 to show exports by: (i) The 20 largest African economies (South Africa, Egypt, Nigeria, Algeria, Morocco, Angola, Libya, Sudan, Tunisia, Ethiopia, Kenya, Tanzania, Cameroon, Ivory Coast, Ghana, Uganda, Botswana, Senegal, Gabon and the Congo), broken down by North Africa and Sub-Saharan Africa: (ii) the six largest African economies shown separately; (iii) countries where exports of clothing are important (Kenya, Mauritius and Lesotho); and (iv) some Asian comparators. Total exports are broken down by fuels and minerals (codes 27 and 71 of the Harmonized System (HS)), textile and clothing (HS codes 50 to 63 of Section XI), and within T&C, apparel (HS codes 61 and 62). 10 Other African exports to the United States included a ‘Special’ category reserved by the US for classification purposes (0.5%), fruit and vegetables (0.4%) and plastics and rubber products (0.3%), with only the latter minor category being of traditional manufacturing interest. Wood and fats and oils reached individual shares of 0.1 percent, while “miscellaneous manufacturing”, pulp and paper products, instruments (surgical etc), hides and leather, stones/glass/ceramics, footwear and arms/ammunition did not register significantly.
11
Apparel plays an important role in African manufactured exports. Ninety percent of textile and
clothing exports to the United States were classified as apparel, which increased by 6 percent per
year from 2000-08. In addition (not shown in the table), imports into the US from AGOA11
countries during 2008 were some $1,151 million, with all but $13 million qualifying for AGOA
preferences. Kaplinsky and Morris (2006) report that the nominal rate of tariff protection on
apparel imports ranges between 16 and 32 percent, but with the exception of South Africa the
AGOA suppliers to the US can incorporate duty-free imports of materials. They calculate that
this raises the effective rate of the subsidy (the subsidy level that takes all factors into account
and not just the tariff) to between 27 and 84 percent. Furthermore, they state that “this rate of
subsidy is required for AGOA clothing producers to compete in the US market. This is because
scales of production are low in SSA plants, and many producers suffer from poor bureaucratic
and physical infrastructure”. Collier (2007) goes further and states that “What Africa needs is
temporary protection from Asia in OECD markets”.
Finally, the European Union was an important market for North African apparel exporters, with
EU apparel imports from Tunisia totalling €219.5 million, from Morocco as €111.3 million and
from Egypt as €52.3 million. Imports from other African countries included those from South
Africa (€12.4 million), Madagascar (€2.4 million) and Kenya (€1.3 million). Tellingly, while
most African countries had tariff preferences into the EU under the old Cotonou Agreement
(with these to be replaced by the Economic Partnership Agreements – EPAs), and South Africa
has preferences under the Trade, Development and Cooperation Agreement (TDCA), these
preferences are undermined by rules of origin constraints that are much more rigid than the
AGOA rules offered by the US to African exporters (Naumann, 2004). Europe’s imports from
Lesotho, Swaziland and Mauritius were negligible, showing these countries to be entirely
focused on the US market.
11 The African Growth and Opportunity Act (AGOA) is a United States Trade Act that significantly enhances US market access for (currently) 39 SSA countries. The Act originally covered the period from October 2000 to September 2008, but was recently extended to 2015. A special dispensation relating to apparel also applies.
12
Table 2: US imports from selected African and Asian countries ($ billion/million and %)
Region country
$ billion total imports
% HS 27 & 71 fuels & minerals
T&C $ million
T&C %
HS 61-62 % of T&C
Growth 61&62
Africa 113.5 89.1 2,266 2.0 90.6 6.0 North Africa 27.4 89.9 1,080 3.9 83.5 6.7 SSA 86.1 88.8 1,186 1.4 97.1 5.4 RSA 10.0 42.2 50 0.5 36.4 Egypt 2.4 40.3 915 38.6 81.1 7.5 Nigeria 38.1 99.4 00 0.0 73.3 Algeria 19.4 99.7 0 0.0 Morocco 0.9 1.9 94 10.7 97.2 -0.6 Angola 18.9 100 0 0.0 Kenya 0.7 0.5 247 71.9 99.9 Mauritius 0.2 14.4 102 57.6 99.7 -11.0 Lesotho 0.4 8.2 340 90.8 100 11.1 Asian countries China 337.8 1.4 31,489 9.3 76.2 16.9 Vietnam 12.9 8.7 5,271 40.9 97.7 58.7 Cambodia 2.4 0.0 2,382 98.8 99.6 13.6
Note: Country composition and commodity definitions are given in footnote 21.
Source: US Department of Commerce, Trade Stats Express at http://tse.export.gov/
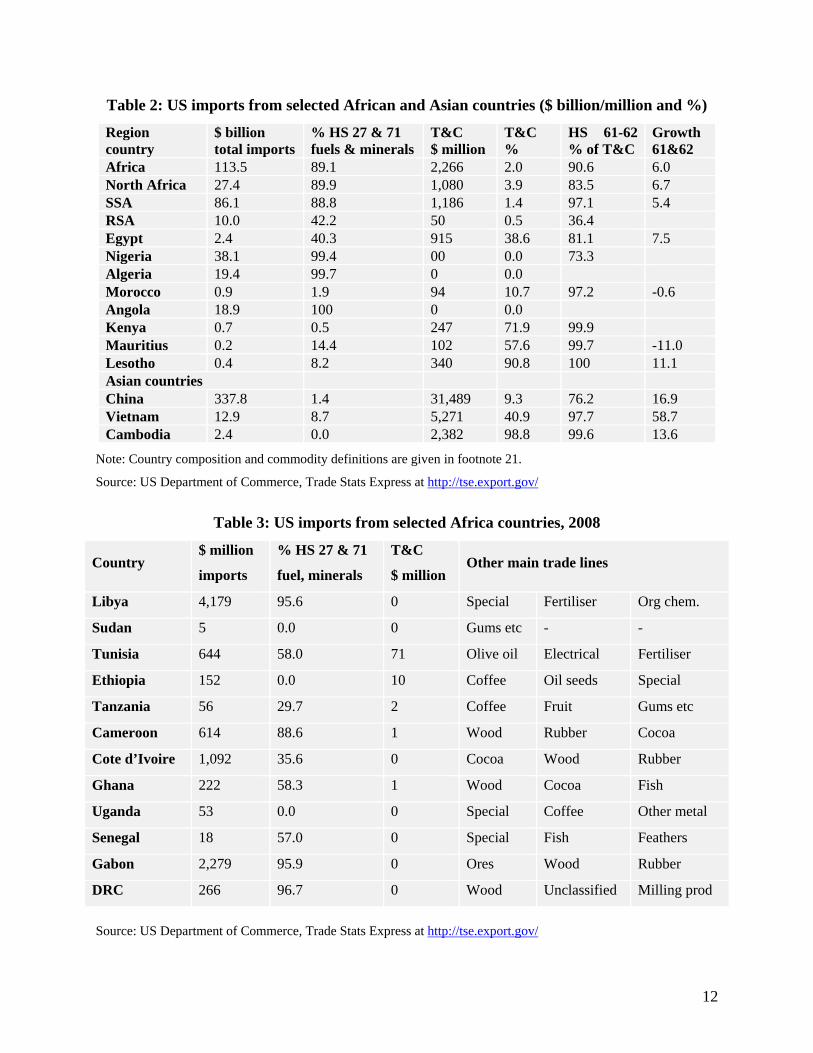
Table 3: US imports from selected Africa countries, 2008
Country $ million
imports
% HS 27 & 71
fuel, minerals
T&C
$ million Other main trade lines
Libya 4,179 95.6 0 Special Fertiliser Org chem.
Sudan 5 0.0 0 Gums etc - -
Tunisia 644 58.0 71 Olive oil Electrical Fertiliser
Ethiopia 152 0.0 10 Coffee Oil seeds Special
Tanzania 56 29.7 2 Coffee Fruit Gums etc
Cameroon 614 88.6 1 Wood Rubber Cocoa
Cote d’Ivoire 1,092 35.6 0 Cocoa Wood Rubber
Ghana 222 58.3 1 Wood Cocoa Fish
Uganda 53 0.0 0 Special Coffee Other metal
Senegal 18 57.0 0 Special Fish Feathers
Gabon 2,279 95.9 0 Ores Wood Rubber
DRC 266 96.7 0 Wood Unclassified Milling prod
Source: US Department of Commerce, Trade Stats Express at http://tse.export.gov/
13
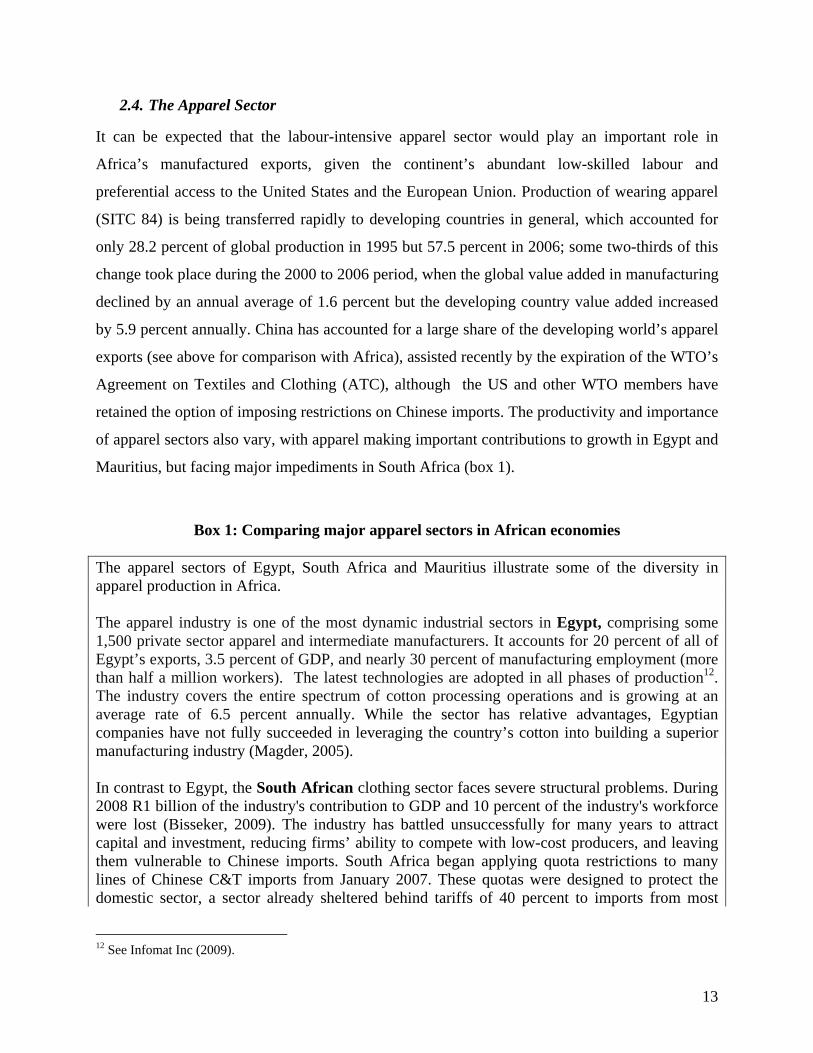
2.4. The Apparel Sector
It can be expected that the labour-intensive apparel sector would play an important role in
Africa’s manufactured exports, given the continent’s abundant low-skilled labour and
preferential access to the United States and the European Union. Production of wearing apparel
(SITC 84) is being transferred rapidly to developing countries in general, which accounted for
only 28.2 percent of global production in 1995 but 57.5 percent in 2006; some two-thirds of this
change took place during the 2000 to 2006 period, when the global value added in manufacturing
declined by an annual average of 1.6 percent but the developing country value added increased
by 5.9 percent annually. China has accounted for a large share of the developing world’s apparel
exports (see above for comparison with Africa), assisted recently by the expiration of the WTO’s
Agreement on Textiles and Clothing (ATC), although the US and other WTO members have
retained the option of imposing restrictions on Chinese imports. The productivity and importance
of apparel sectors also vary, with apparel making important contributions to growth in Egypt and
Mauritius, but facing major impediments in South Africa (box 1).
Box 1: Comparing major apparel sectors in African economies
The apparel sectors of Egypt, South Africa and Mauritius illustrate some of the diversity in apparel production in Africa. The apparel industry is one of the most dynamic industrial sectors in Egypt, comprising some 1,500 private sector apparel and intermediate manufacturers. It accounts for 20 percent of all of Egypt’s exports, 3.5 percent of GDP, and nearly 30 percent of manufacturing employment (more than half a million workers). The latest technologies are adopted in all phases of production12. The industry covers the entire spectrum of cotton processing operations and is growing at an average rate of 6.5 percent annually. While the sector has relative advantages, Egyptian companies have not fully succeeded in leveraging the country’s cotton into building a superior manufacturing industry (Magder, 2005). In contrast to Egypt, the South African clothing sector faces severe structural problems. During 2008 R1 billion of the industry's contribution to GDP and 10 percent of the industry's workforce were lost (Bisseker, 2009). The industry has battled unsuccessfully for many years to attract capital and investment, reducing firms’ ability to compete with low-cost producers, and leaving them vulnerable to Chinese imports. South Africa began applying quota restrictions to many lines of Chinese C&T imports from January 2007. These quotas were designed to protect the domestic sector, a sector already sheltered behind tariffs of 40 percent to imports from most
12 See Infomat Inc (2009).
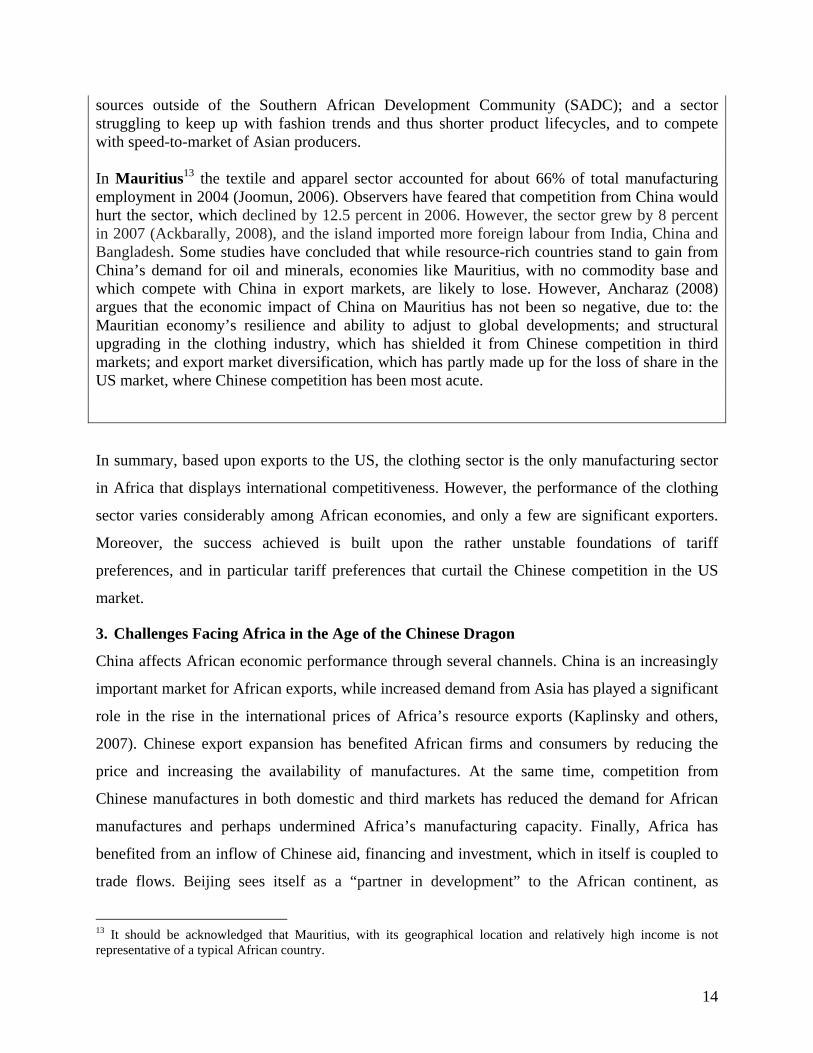
14
sources outside of the Southern African Development Community (SADC); and a sector struggling to keep up with fashion trends and thus shorter product lifecycles, and to compete with speed-to-market of Asian producers. In Mauritius13 the textile and apparel sector accounted for about 66% of total manufacturing employment in 2004 (Joomun, 2006). Observers have feared that competition from China would hurt the sector, which declined by 12.5 percent in 2006. However, the sector grew by 8 percent in 2007 (Ackbarally, 2008), and the island imported more foreign labour from India, China and Bangladesh. Some studies have concluded that while resource-rich countries stand to gain from China’s demand for oil and minerals, economies like Mauritius, with no commodity base and which compete with China in export markets, are likely to lose. However, Ancharaz (2008) argues that the economic impact of China on Mauritius has not been so negative, due to: the Mauritian economy’s resilience and ability to adjust to global developments; and structural upgrading in the clothing industry, which has shielded it from Chinese competition in third markets; and export market diversification, which has partly made up for the loss of share in the US market, where Chinese competition has been most acute.
In summary, based upon exports to the US, the clothing sector is the only manufacturing sector
in Africa that displays international competitiveness. However, the performance of the clothing
sector varies considerably among African economies, and only a few are significant exporters.
Moreover, the success achieved is built upon the rather unstable foundations of tariff
preferences, and in particular tariff preferences that curtail the Chinese competition in the US
market.
3. Challenges Facing Africa in the Age of the Chinese Dragon
China affects African economic performance through several channels. China is an increasingly
important market for African exports, while increased demand from Asia has played a significant
role in the rise in the international prices of Africa’s resource exports (Kaplinsky and others,
2007). Chinese export expansion has benefited African firms and consumers by reducing the
price and increasing the availability of manufactures. At the same time, competition from
Chinese manufactures in both domestic and third markets has reduced the demand for African
manufactures and perhaps undermined Africa’s manufacturing capacity. Finally, Africa has
benefited from an inflow of Chinese aid, financing and investment, which in itself is coupled to
trade flows. Beijing sees itself as a “partner in development” to the African continent, as
13 It should be acknowledged that Mauritius, with its geographical location and relatively high income is not representative of a typical African country.
15
reiterated in numerous state visits and the Forum on China-Africa Cooperation (FOCAC)
summits (Davies et al, 2008). While China’s financial support is often seen as a longer-term
strategy for its own development and benefit, direct and indirect assistance has resulted in
economic benefits to Africa, spurring activity in the commercial corridor between China and
Africa. The net impact of all of these influences varies greatly among African economies,
depending on the commodity composition of their trade and their resource endowment, among
other factors.
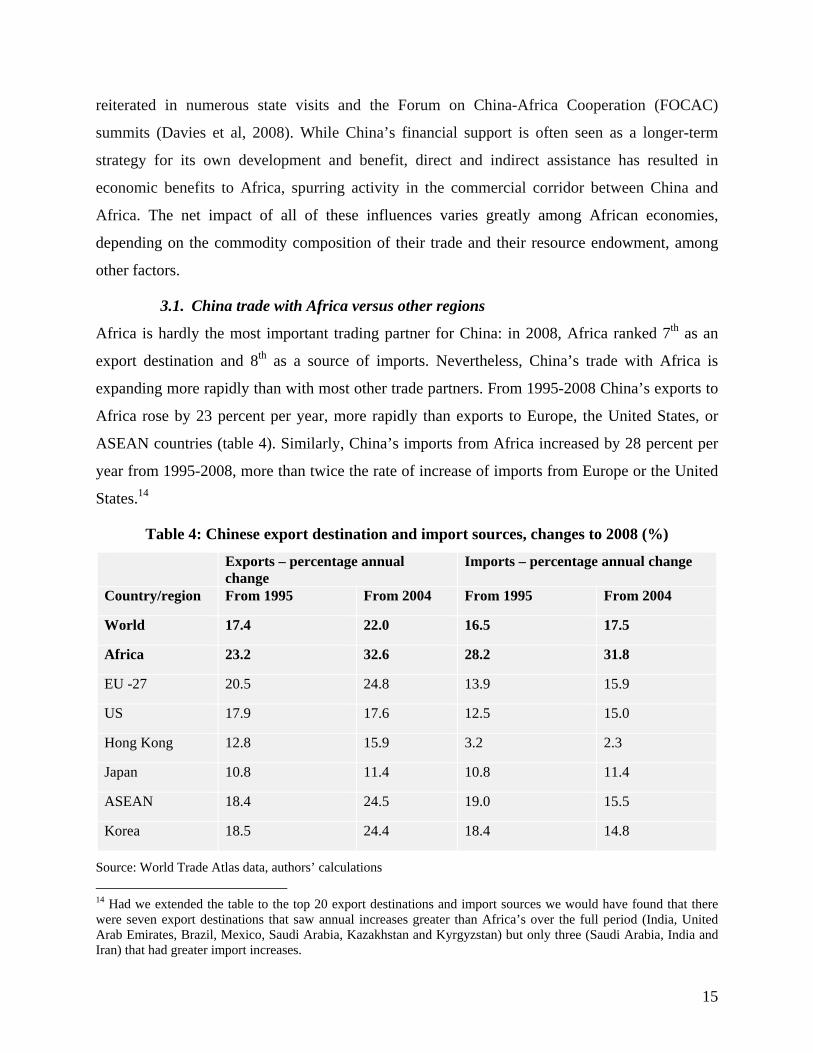
3.1. China trade with Africa versus other regions
Africa is hardly the most important trading partner for China: in 2008, Africa ranked 7th as an
export destination and 8th as a source of imports. Nevertheless, China’s trade with Africa is
expanding more rapidly than with most other trade partners. From 1995-2008 China’s exports to
Africa rose by 23 percent per year, more rapidly than exports to Europe, the United States, or
ASEAN countries (table 4). Similarly, China’s imports from Africa increased by 28 percent per
year from 1995-2008, more than twice the rate of increase of imports from Europe or the United
States.14
Table 4: Chinese export destination and import sources, changes to 2008 (%)
Exports – percentage annual change
Imports – percentage annual change
Country/region From 1995 From 2004 From 1995 From 2004
World 17.4 22.0 16.5 17.5
Africa 23.2 32.6 28.2 31.8
EU -27 20.5 24.8 13.9 15.9
US 17.9 17.6 12.5 15.0
Hong Kong 12.8 15.9 3.2 2.3
Japan 10.8 11.4 10.8 11.4
ASEAN 18.4 24.5 19.0 15.5
Korea 18.5 24.4 18.4 14.8
Source: World Trade Atlas data, authors’ calculations 14 Had we extended the table to the top 20 export destinations and import sources we would have found that there were seven export destinations that saw annual increases greater than Africa’s over the full period (India, United Arab Emirates, Brazil, Mexico, Saudi Arabia, Kazakhstan and Kyrgyzstan) but only three (Saudi Arabia, India and Iran) that had greater import increases.
16
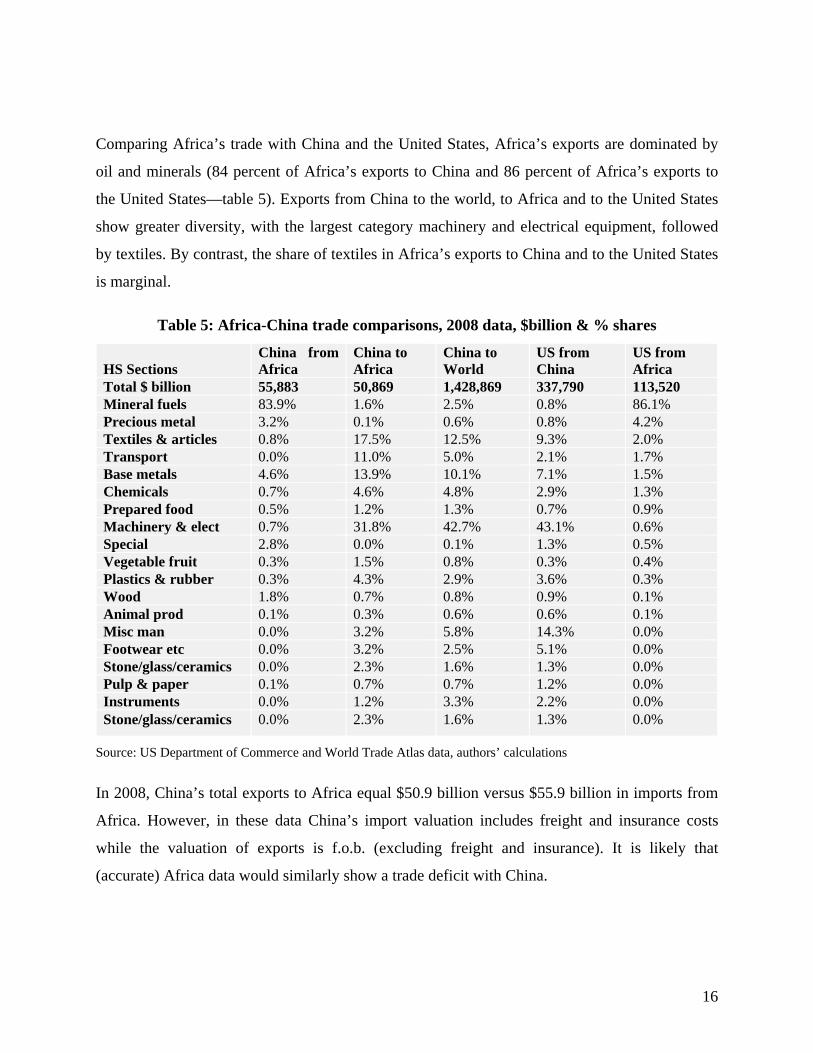
Comparing Africa’s trade with China and the United States, Africa’s exports are dominated by
oil and minerals (84 percent of Africa’s exports to China and 86 percent of Africa’s exports to
the United States—table 5). Exports from China to the world, to Africa and to the United States
show greater diversity, with the largest category machinery and electrical equipment, followed
by textiles. By contrast, the share of textiles in Africa’s exports to China and to the United States
is marginal.
Table 5: Africa-China trade comparisons, 2008 data, $billion & % shares
HS Sections China from Africa
China to Africa
China to World
US from China
US from Africa
Total $ billion 55,883 50,869 1,428,869 337,790 113,520 Mineral fuels 83.9% 1.6% 2.5% 0.8% 86.1% Precious metal 3.2% 0.1% 0.6% 0.8% 4.2% Textiles & articles 0.8% 17.5% 12.5% 9.3% 2.0% Transport 0.0% 11.0% 5.0% 2.1% 1.7% Base metals 4.6% 13.9% 10.1% 7.1% 1.5% Chemicals 0.7% 4.6% 4.8% 2.9% 1.3% Prepared food 0.5% 1.2% 1.3% 0.7% 0.9% Machinery & elect 0.7% 31.8% 42.7% 43.1% 0.6% Special 2.8% 0.0% 0.1% 1.3% 0.5% Vegetable fruit 0.3% 1.5% 0.8% 0.3% 0.4% Plastics & rubber 0.3% 4.3% 2.9% 3.6% 0.3% Wood 1.8% 0.7% 0.8% 0.9% 0.1% Animal prod 0.1% 0.3% 0.6% 0.6% 0.1% Misc man 0.0% 3.2% 5.8% 14.3% 0.0% Footwear etc 0.0% 3.2% 2.5% 5.1% 0.0% Stone/glass/ceramics 0.0% 2.3% 1.6% 1.3% 0.0% Pulp & paper 0.1% 0.7% 0.7% 1.2% 0.0% Instruments 0.0% 1.2% 3.3% 2.2% 0.0% Stone/glass/ceramics 0.0% 2.3% 1.6% 1.3% 0.0%
Source: US Department of Commerce and World Trade Atlas data, authors’ calculations
In 2008, China’s total exports to Africa equal $50.9 billion versus $55.9 billion in imports from
Africa. However, in these data China’s import valuation includes freight and insurance costs
while the valuation of exports is f.o.b. (excluding freight and insurance). It is likely that
(accurate) Africa data would similarly show a trade deficit with China.
17
3.2. Competition from China in manufactures
In little more than 25 years China has evolved from an internationally isolated, centrally planned
communist state into one of the world’s fastest-growing economies, increasingly outwardly-
oriented and market-driven. A “package” of reinforcing macroeconomic and political policies,
fostering FDI inflows, as well as an export-led development strategy has positioned the country
as a leading global manufacturing powerhouse and seen hundreds of millions of people move out
of abject poverty. Thus Africa’s adoption of outward-looking policies has come at a time when
excess capacity in China and other Asian exporters has limited the continent’s access to markets
(Kaplinsky and Morris, 2008).
China’s manufacturing sector is likely to continue to expand, supported by low wages and an
enormous potential labour pool with high levels of innovation. The surplus labour force in China
is possibly in the order of 100 to 200 million, in contrast to the earlier Asian growth economies
(Japan and Korea) that quickly ran up against labour shortages and hence rising wage levels as
their economies expanded (Bannister, 2005). Rapid growth in China’s manufactured exports has
reduced African manufacturers’ market share in both domestic and third markets, as confirmed
by Villoria (2009) for the clothing industries in Kenya, Mauritius and SACU members. At the
same time, Chinese manufactured exports have reduced the prices of both consumer goods and
industrial inputs in African economies. However, estimations of their terms-of-trade effects
suggest that the reductions in export prices outweigh the decrease in import prices, and these
countries were net losers from Chinese manufactures export expansion.
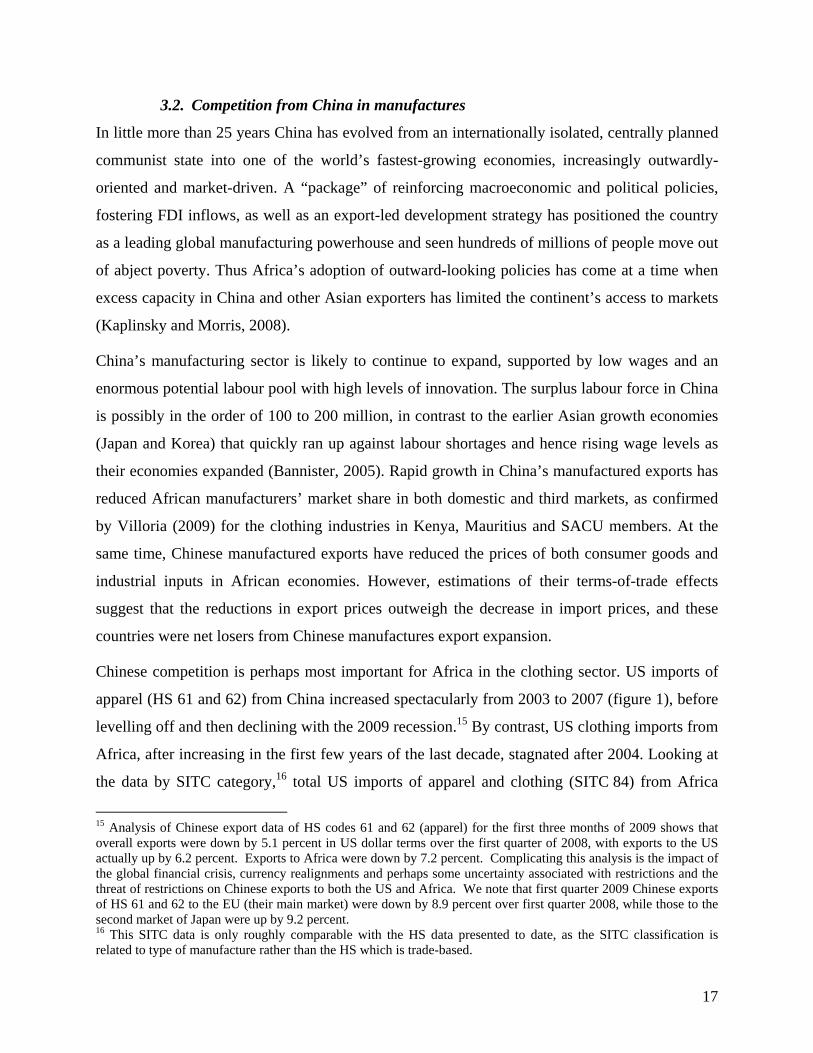
Chinese competition is perhaps most important for Africa in the clothing sector. US imports of
apparel (HS 61 and 62) from China increased spectacularly from 2003 to 2007 (figure 1), before
levelling off and then declining with the 2009 recession.15 By contrast, US clothing imports from
Africa, after increasing in the first few years of the last decade, stagnated after 2004. Looking at
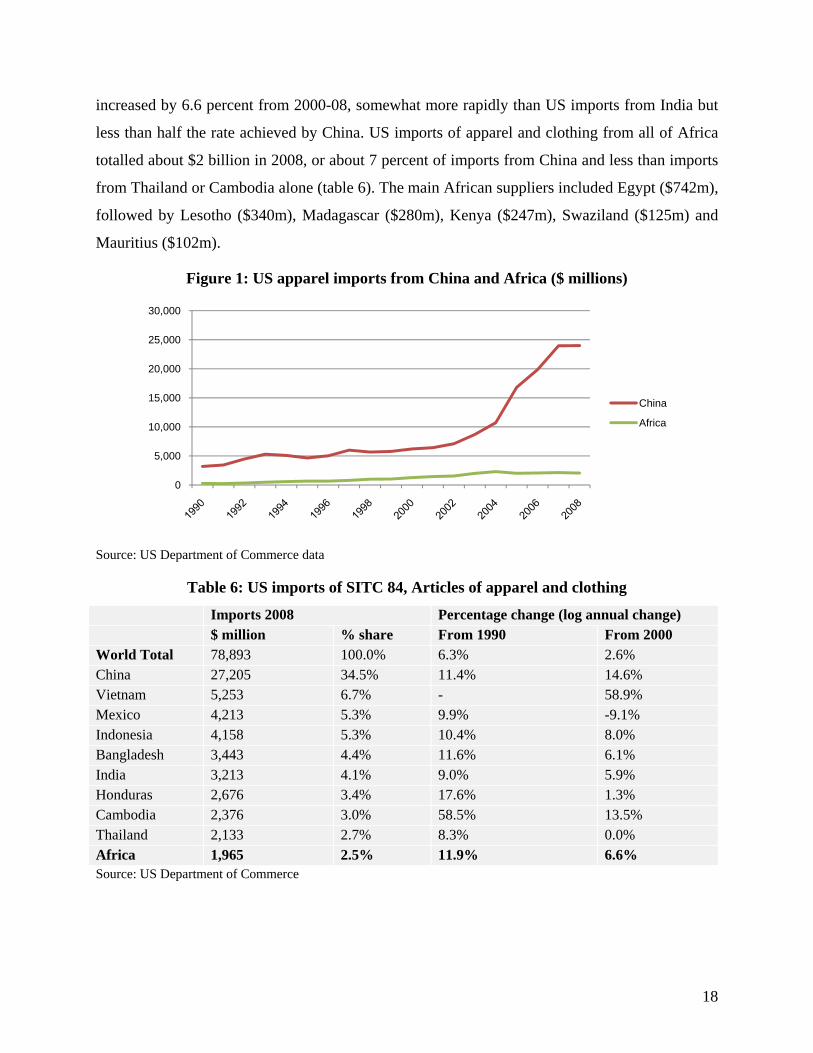
the data by SITC category,16 total US imports of apparel and clothing (SITC 84) from Africa
15 Analysis of Chinese export data of HS codes 61 and 62 (apparel) for the first three months of 2009 shows that overall exports were down by 5.1 percent in US dollar terms over the first quarter of 2008, with exports to the US actually up by 6.2 percent. Exports to Africa were down by 7.2 percent. Complicating this analysis is the impact of the global financial crisis, currency realignments and perhaps some uncertainty associated with restrictions and the threat of restrictions on Chinese exports to both the US and Africa. We note that first quarter 2009 Chinese exports of HS 61 and 62 to the EU (their main market) were down by 8.9 percent over first quarter 2008, while those to the second market of Japan were up by 9.2 percent. 16 This SITC data is only roughly comparable with the HS data presented to date, as the SITC classification is related to type of manufacture rather than the HS which is trade-based.
18
increased by 6.6 percent from 2000-08, somewhat more rapidly than US imports from India but
less than half the rate achieved by China. US imports of apparel and clothing from all of Africa
totalled about $2 billion in 2008, or about 7 percent of imports from China and less than imports
from Thailand or Cambodia alone (table 6). The main African suppliers included Egypt ($742m),
followed by Lesotho ($340m), Madagascar ($280m), Kenya ($247m), Swaziland ($125m) and
Mauritius ($102m).
Figure 1: US apparel imports from China and Africa ($ millions)
Source: US Department of Commerce data
Table 6: US imports of SITC 84, Articles of apparel and clothing
Imports 2008 Percentage change (log annual change) $ million % share From 1990 From 2000 World Total 78,893 100.0% 6.3% 2.6% China 27,205 34.5% 11.4% 14.6% Vietnam 5,253 6.7% - 58.9% Mexico 4,213 5.3% 9.9% -9.1% Indonesia 4,158 5.3% 10.4% 8.0% Bangladesh 3,443 4.4% 11.6% 6.1% India 3,213 4.1% 9.0% 5.9% Honduras 2,676 3.4% 17.6% 1.3% Cambodia 2,376 3.0% 58.5% 13.5% Thailand 2,133 2.7% 8.3% 0.0% Africa 1,965 2.5% 11.9% 6.6% Source: US Department of Commerce
0
5,000
10,000
15,000
20,000
25,000
30,000
China
Africa
19
An open question remains as to why Africa, with a modest presence in the US market at the start
of the period, was not able to enhance that presence at a time when African economies were
expanding and enjoyed a significant tariff preference over China through the AGOA scheme.
Asia, and particularly China, have dominated apparel imports by OECD countries despite
somewhat higher wages than in many African economies: Cadot and Nasir (2001) calculate that
wage costs, adjusted for productivity differences, per shirt produced in Madagascar, Kenya,
Ghana, Mozambique, Lesotho ranged from $0.12 to $0.19 (in South Africa it was $0.65),
compared to $0.17 for India and $0.29 for Chinese export processing zones. Competitive
environments differ enormously within Africa; wages vary from relatively high levels of $3,355
per year in Morocco, $2,834 in Mauritius and $2.669 in Tunisia, to the medium level of $1,611
in South Africa, to a lower level of $897 in Egypt and only $429 in Lesotho. And wages are only
one factor in the determination of per unit costs of production (although an important one in a
low-skilled operation such as garment manufacture), so that China’s success in apparel exports is
due to other competitive advantages.17 He (2009) reports that the total cost of a pair of pants
made in China is about $1 while a similar product produced in South Africa costs ten times as
much.
China’s rapid productivity gains and huge capacity indicate that Africa requires continued trade
preferences to develop (Collier and Venables 2007a and Collier 2007). Kaplinsky and Morris
(2006) also demonstrate that current trade preferences are needed to maintain the ability of
AGOA clothing producers to compete in the US market. However, while trade preferences offer
windows of opportunity, they are not lasting solutions. African economies need to use the space
offered by trade preferences to improve their ability to compete in global markets.
3.3. China exports and manufactures prices
China has significantly reduced world prices for manufactures, and especially for wearing
apparel and footwear (Villoria, 2009b), thus reducing African import prices. Some evidence for
China’s impact can be seen in data from South Africa. The average import values for a selection
17 This success is arguably beyond wage or exchange rate-related advantages, but largely a function of productivity as a main driver of competitiveness; supported by low energy costs and consistent government spending on infrastructure, which has lowered the cost of logistics for enterprises; as well as economies of scale and integration into regional and global product supply chains. One controversial aspect of Chinese manufacturing is the blurring of lines between government and the private sector which makes it hard to determine the actual cost of production, although we note that China is moving towards a more open market-orientated approach to export manufacturing.
20
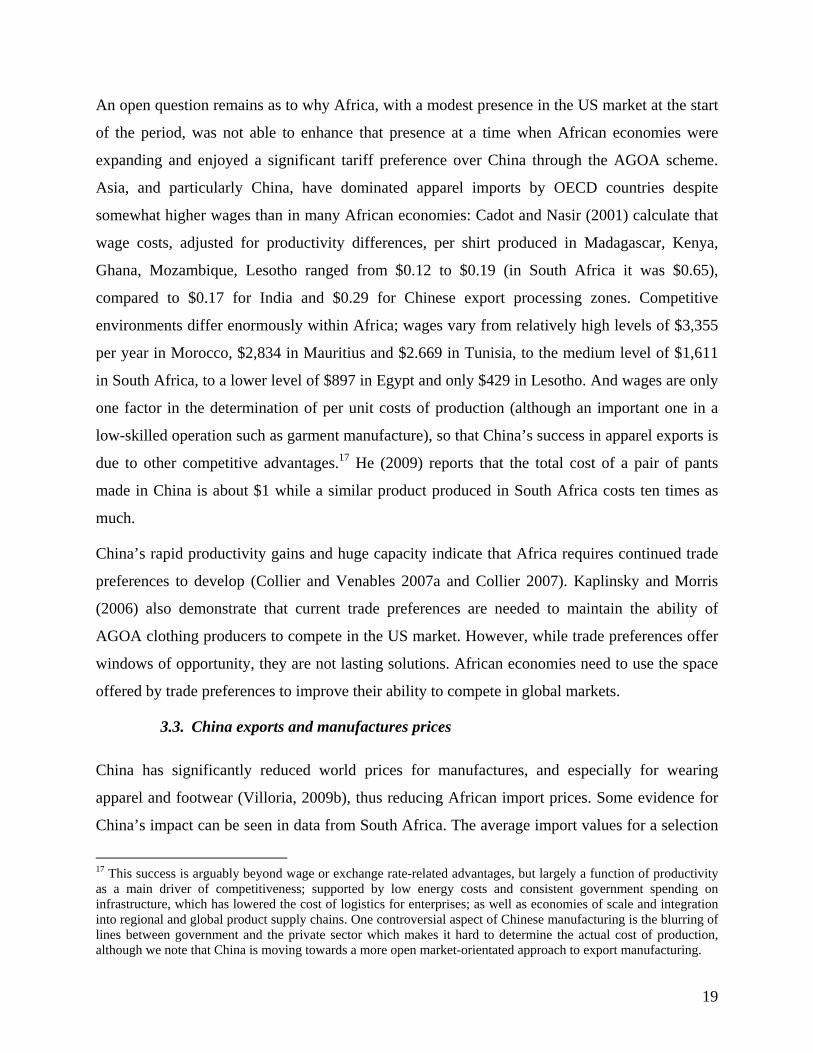
of South Africa’s clothing imports dominated by Chinese products (and covering 59 percent of
total clothing imports) shows: (i) an increase of 25 percent or higher for all import lines from
1996-2005; and (ii) for most imports, either very modest increases or declines in import prices in
both rand and US dollar terms from 1996-2005 (table 7). While who benefited from these limited
increases or actual declines in prices is unknown, there is a strong case that price reductions of
Chinese clothing imports have resulted in cheaper clothing for consumers.
Table 7: Average changes in import values for main lines of clothing into South Africa,
1996-2005
2005 China % Ave Change period % HS code $m Description RSA imp US$ Ave price Rand Imports 6103.4 13.4 Men’s knit trousers 77 -4.0 1.0 42.3 6104.6 10.8 Women’s knit trousers 82 7.1 -4.4 53.4 6105 12.4 Men’s shirts 53 0.7 5.2 25.7 6106 17.9 Women’s blouses 69 1.8 5.9 55.5 6111 29.9 Babies knit garments 96 -2.6 2.4 29.8 6203.3 10.8 Men’s woven jackets 77 4.8 9.5 27.0 6203.4 70.2 Men’s woven trousers 83 -1.3 3.1 27.6 6204.3 12.6 Women woven jackets 80 -2.7 1.3 53.0 6204.5 26.1 Women woven skirts 67 -7.3 -2.9 62.0 6204.6 62.1 Women woven trouser 86 -6.5 -1.5 53.6 6205 27.8 Men’s woven shirts 61 1.1 5.6 34.5 6206 25.1 Women woven blouses 60 -15.6 -10.9 28.4 6212.1 10.3 Bras 81 -7.5 -3.0 42.9
Source: Sandrey, 2006
The South African government imposed quotas on clothing and textile imports from China from
January 2007. The objective was to protect the South African sector, a sector that hides behind
40 percent tariff barriers but was still unable to compete against burgeoning imports from China
and others. Sandrey and Fundira (2008) examine the impact of the first full year of these quotas
and find that average prices increased by between 16 percent (cotton fabrics) and 50 percent
(female blouses). Thus the quotas were reversing the stable or declining prices previously
enjoyed by South African consumers over the previous decade.
China’s impact on African manufactures prices (and industrial competition) would be all the
more significant if China tends to ‘price to market’, that is, charge less on its exports to poor
21
countries than it does on exports to rich countries. The data show a mixed story.18 Sandrey
(2008) finds that the average price of China’s exports to the United States was some 13 percent
above the global average for 2007 and 16 percent above for 2006, indicating that China may
have charged higher prices in that developed market. However, higher average prices could also
result if the United States were importing higher-quality goods within these HS 6 lines. By
contrast, the average price of Chinese exports at the HS 6 level to South Africa were
approximately equal to the world average (for 2007 the figure was slightly above, and for 2006
slightly below), indicating that China was not lowering its export prices, on average, in that
developing market. Considering just the clothing exports in HS 61 and 62 and using the more
disaggregated HS 8 lines rather than the HS 6 lines, the average price of China’s exports to South
Africa was nearly three percent below the global average in 2005, perhaps indicating some
tendency towards pricing to market. Interestingly, the average price of China’s exports to South
Africa increased to one percent above the global average for 2007, the first year of the South
African quotas, perhaps reflecting increases in prices by Chinese exporters to gain some of the
excess profits resulting from trade restrictions.
3.4. The impact of China’s growth on Africa’s commodity sector
Rapid growth in China has boosted global demand for oil and minerals. China consumes about
20% of global aluminium and copper resources, 30% of steel and coal, about half of globally
traded iron ore, and is the second largest consumer of oil after the US, importing about one
quarter to one fifth of its oil needs from Africa. Rising demand from China helped fuel the boom
in commodity prices prior to the global recession. Oil prices peaked at almost $150 per barrel in
mid-2008, and copper prices more than tripled during 2002-08. The rise in prices greatly
increased the export revenues of Africa’s oil and minerals exporters, and attracted large inflows
of capital into resource-rich but also undeveloped regions across Africa.
18 The data examined were the commercially obtainable World Trade Atlas (WTA) data for Chinese exports to the world at the HS 6 detailed level.
22
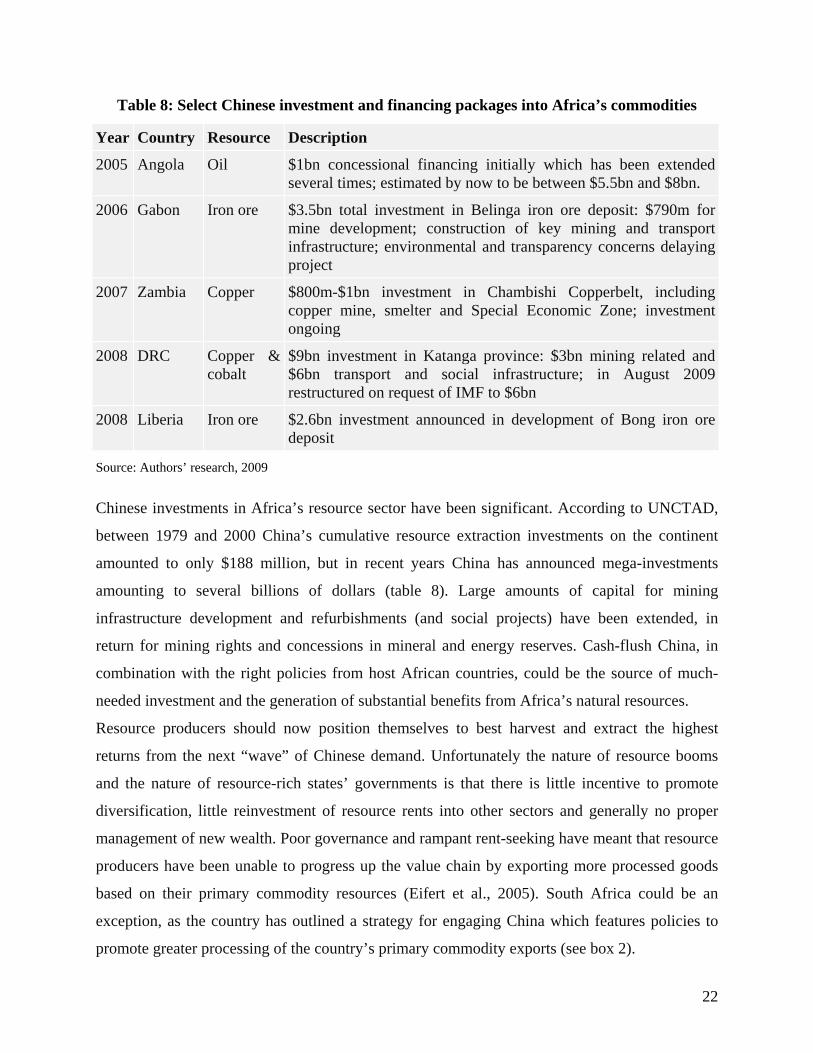
Table 8: Select Chinese investment and financing packages into Africa’s commodities
Year Country Resource Description
2005 Angola Oil $1bn concessional financing initially which has been extended several times; estimated by now to be between $5.5bn and $8bn.
2006 Gabon Iron ore $3.5bn total investment in Belinga iron ore deposit: $790m for mine development; construction of key mining and transport infrastructure; environmental and transparency concerns delaying project
2007 Zambia Copper $800m-$1bn investment in Chambishi Copperbelt, including copper mine, smelter and Special Economic Zone; investment ongoing
2008 DRC Copper & cobalt
$9bn investment in Katanga province: $3bn mining related and $6bn transport and social infrastructure; in August 2009 restructured on request of IMF to $6bn
2008 Liberia Iron ore $2.6bn investment announced in development of Bong iron ore deposit
Source: Authors’ research, 2009
Chinese investments in Africa’s resource sector have been significant. According to UNCTAD,
between 1979 and 2000 China’s cumulative resource extraction investments on the continent
amounted to only $188 million, but in recent years China has announced mega-investments
amounting to several billions of dollars (table 8). Large amounts of capital for mining
infrastructure development and refurbishments (and social projects) have been extended, in
return for mining rights and concessions in mineral and energy reserves. Cash-flush China, in
combination with the right policies from host African countries, could be the source of much-
needed investment and the generation of substantial benefits from Africa’s natural resources.
Resource producers should now position themselves to best harvest and extract the highest
returns from the next “wave” of Chinese demand. Unfortunately the nature of resource booms
and the nature of resource-rich states’ governments is that there is little incentive to promote
diversification, little reinvestment of resource rents into other sectors and generally no proper
management of new wealth. Poor governance and rampant rent-seeking have meant that resource
producers have been unable to progress up the value chain by exporting more processed goods
based on their primary commodity resources (Eifert et al., 2005). South Africa could be an
exception, as the country has outlined a strategy for engaging China which features policies to
promote greater processing of the country’s primary commodity exports (see box 2).
23
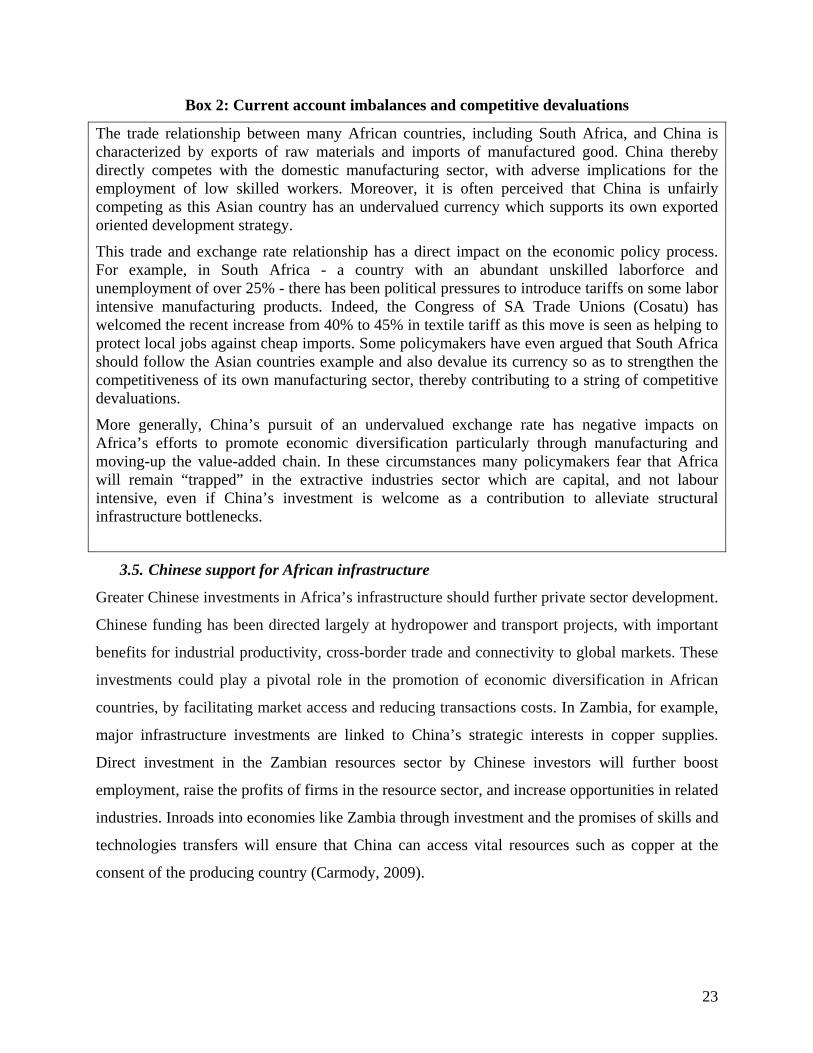
Box 2: Current account imbalances and competitive devaluations
The trade relationship between many African countries, including South Africa, and China is characterized by exports of raw materials and imports of manufactured good. China thereby directly competes with the domestic manufacturing sector, with adverse implications for the employment of low skilled workers. Moreover, it is often perceived that China is unfairly competing as this Asian country has an undervalued currency which supports its own exported oriented development strategy.
This trade and exchange rate relationship has a direct impact on the economic policy process. For example, in South Africa - a country with an abundant unskilled laborforce and unemployment of over 25% - there has been political pressures to introduce tariffs on some labor intensive manufacturing products. Indeed, the Congress of SA Trade Unions (Cosatu) has welcomed the recent increase from 40% to 45% in textile tariff as this move is seen as helping to protect local jobs against cheap imports. Some policymakers have even argued that South Africa should follow the Asian countries example and also devalue its currency so as to strengthen the competitiveness of its own manufacturing sector, thereby contributing to a string of competitive devaluations.
More generally, China’s pursuit of an undervalued exchange rate has negative impacts on Africa’s efforts to promote economic diversification particularly through manufacturing and moving-up the value-added chain. In these circumstances many policymakers fear that Africa will remain “trapped” in the extractive industries sector which are capital, and not labour intensive, even if China’s investment is welcome as a contribution to alleviate structural infrastructure bottlenecks.
3.5. Chinese support for African infrastructure
Greater Chinese investments in Africa’s infrastructure should further private sector development.
Chinese funding has been directed largely at hydropower and transport projects, with important
benefits for industrial productivity, cross-border trade and connectivity to global markets. These
investments could play a pivotal role in the promotion of economic diversification in African
countries, by facilitating market access and reducing transactions costs. In Zambia, for example,
major infrastructure investments are linked to China’s strategic interests in copper supplies.
Direct investment in the Zambian resources sector by Chinese investors will further boost
employment, raise the profits of firms in the resource sector, and increase opportunities in related
industries. Inroads into economies like Zambia through investment and the promises of skills and
technologies transfers will ensure that China can access vital resources such as copper at the
consent of the producing country (Carmody, 2009).
24
3.6. The potential for Chinese support for African manufactures
Another potential benefit of China’s involvement in Africa is its support for export processing
zones. Eifert et al (2005) argue that a critical mass of firms is necessary to generate the scale
economies, network effects, and spread of technology required for structural change and
diversification to manufactures production. Successful industrialisation efforts of countries such
as South Korea and Taiwan were based on “surges of investment” coupled with export
promotion strategies (Trindade, 2005). But implementing economy-wide reforms to attract
greater FDI into manufacturing industries and more value-added exports can be difficult. Thus
several countries have chosen to create special geographic regions, known as Export Processing
Zones (EPZ), Special Economic Zones (SEZ), industrial zones, or free trade zones, with more
liberal policies towards trade and investment and (usually) with significant investments in
infrastructure. These zones provide a favourable economic environment for investment in
manufacturing and foster the clustering of production facilities of domestic and foreign investors
(Din, 1994; Ge, 1999). Many countries in East Asia, Latin America, and the Caribbean have
achieved substantial success in promoting manufactured exports through such policies (Graham,
2004). China, for example, established five major SEZs and opened a further 14 coastal cities
and three coastal areas to foreign investors between 1979 and 1988 (Ge, 1999).19
Unfortunately, attempts by African countries (except Mauritius) to develop such export and
investment zones, including the wave of EPZ regulations in southern Africa initiated during the
early 1990s (Jauch, 2002), have not been successful. These failures were due to several causes,
including a lack of adequate infrastructure, insufficient entrepreneurial capacity, institutional
challenges, socio-political aspects such as attitudes and culture, and even investor ignorance
(World Bank, 2001).
China has initiated efforts (announced at the third FOCAC summit) to set up five special
economic zones in Africa, with more on the drawing board (Edinger, 2008; Davies, 2008), which
could make a substantial contribution to industrial development on the continent. The policies
governing the zones are likely to differ across countries, although most should offer a more
liberal environment for both Chinese and other investors, including tax breaks, customs duty 19 While no direct comparison between China’s economic growth miracle and Africa’s point of departure and industrialization efforts should be drawn, the rollout of SEZs along coastal provinces and cities of China played a significant role in the structural transformation of the country (Davies, 2008). The country experienced with market liberalization through promoting such zones (Interview in Beijing, April 2008).
25
waivers, less strict labour laws, discounted land, and various services; and significant
infrastructure investments, particularly transport and power within the zones and tied into ports
and regional markets. In some zones, joint venture partnerships between Chinese and other
foreign investors with local counterparts is encouraged. While these zones will assist China with
its “going global” policy and create safe havens for Chinese capital20, they also represent a great
opportunity for African industry to gain access to capital, infrastructure services, and skills and
technology transfers, as well as backward (to the country’s hinterland) and forward (to third
markets) linkages. Most importantly, the zones are anticipated to boost employment and generate
higher and more diversified sources of foreign exchange earnings (World Bank, 2001). Some
African economies have more experience with the establishment of EPZ and attracting capital
into these zones21 (see box 3).
Box 3: African Special Economic Zones supported by China
The first zone, announced in February 2007 and referred to as the Multi Facility Economic Zone (MFEZ), is located in the mining area of Chambishi, Kalulushi, in Zambia (Edinger, 2007). The main objective of the MFEZ is to catalyse “industrial and economic development in the manufacturing sector for the purpose of enhancing both domestic and export orientated business”. It is designed to “operate on the principal of value-addition”.22 The second SEZ is located in Mauritius, near Port Luis. Construction was said to have commenced in October 2007, although progress has been slow. Unlike other Chinese-initiated SEZs in Africa, the zone will focus on the service industry. The Mauritius SEZ is intended to host the regional headquarters of companies in southern and eastern Africa, provide a commodity trade and transit route to markets in East Asia, and serve as a springboard and gateway for Chinese companies to invest on the continent. The limited focus on value-added manufacturing of this zone is likely planned because Mauritius already has achieved considerable success in exporting manufactures.23
Most foreign investment in Egypt takes place under the laws which define incentives in SEZs. China’s investment in the Egyptian SEZ in Port of Sokhna (near Suez) began in early 2007. It is hoped that a clustering of Chinese enterprises in the SEZ will encourage integration with global supply chains.24 The zone is expected to focus on infrastructure, logistics, electronics, ICT, construction, car components and chemicals investments and production. It will also serve as a key bridge between the Middle East and North Africa (MENA) region and SSA, providing access to markets in the MENA region and the EU. Similarly, SEZ developments in Nigeria, 20 See Davies (2008) for more details on this. 21 Kenya, Egypt and Mauritius are probably the most proactive countries in Africa establishing such zones (Edinger, 2008). 22 See Ministry of Commerce, Trade & Industry website 23 The manufactured exports sector has been dominated by T&C but spans across the whole value chain, with focus on vertical integration within this industry. Significant investment in the industry was channeled previously through mainly Taiwanese firms (Ancharaz, 2008). 24 See People’s Daily Online (2007)
26
Uganda, and potentially also Angola, Algeria, Mozambique, Tanzania and Ethiopia, are expected. The zones in Mauritius, Egypt and Nigeria are partially supported by the China-Africa Development Fund (CADFund) (Teng, 2009), which is assisting with zone construction and infrastructure rollouts and supporting investment by Chinese companies.
Limiting reforms designed to attract investment and promote exports to dedicated zones is not a
first-best solution to development (Madani, 1999; and Jenkins et al., 1998). Such zones can raise
employment and foreign exchange earnings, and where infrastructure and other government
services are weak, expanding services in a limited geographical area may be easier and more
productive than attempting to expand services throughout the country (World Bank, 2001). Thus
such zones may help initiate the process of industrialization, but generally do not result in
massive increases in industrialization and growth. Also, the easing of rules that protect workers
and limit negative externalities from investment may cause neighbouring countries to lower their
own standards, referred to as the “race to the bottom” (Jauch 2002). Such effects were seen in the
series of zones established in southern Africa and more recently in some countries attempting to
attract Chinese SEZ investment, for example Cape Verde.25 A focus on SEZs also could limit
progress towards regional integration, as countries compete for foreign investment from outside
the region.
Another area where China could assist in the diversification of African manufacturing is in tariff
preferences. Sandrey (2009) estimates that the average duty assessed on Chinese imports from
Africa was 0.83 percent in 2008 (0.64 percent if imports from South Africa are excluded).
Combined with Africa’s current commodity-dominated export profile this highlights that the
continent already has almost duty-free access to China.26 However, across the broader spectrum
of non-commodity goods, duties on some imports remain high. Importantly, imports of cotton
valued at $315.6 million attracted duties of $126.2 million (40%), and this means that raw
cotton, a crucial input into the Chinese clothing export sector, is contributing 42.5 percent of the
total duties assessed against African imports. This highlights the importance of expanding zero-
tariff treatment to 95 percent of the products for African Least Developed Countries (LDC), part
25 See Afrol News (2007) 26 This is based on the value of imports from Africa assessed against the Chinese tariff schedule as downloaded from the WTO website.
27
of the FOCAC engagement, with the result of the continent enjoying additional stimulus to
access the Chinese market for manufactured products in particular.27
4. Conclusion
Why has Africa failed to emulate the rapid growth of Asian economies, supported by spectacular
increases in manufactured exports? One problem is that Africa’s economic policies, governance,
and institutions have been far weaker than in many of the successful Asian economies.
Moreover, Africa’s abundance of natural resources has starved manufacturing sectors of
resources, while resource-rich economies (not only in Africa) have generally failed to achieve
rapid growth, in part because of weak linkages between the natural resource sector and abundant
unskilled labour, and in part because government control of natural resources has encouraged
rent-seeking activities rather than productive investment. Africa’s limited diversification poses
grave threats to development, owing to the volatility of primary commodity prices and the failure
to reap the potential gains from economies of scale and productivity advances available in
manufactures.
Africa needs to strengthen ‘the policy umbrella’ through more stable macroeconomic policies,
more dependable provision of government services, and expanded infrastructure investments,
including support for regional trade (e.g. improved roads and border post management).
Regional and multilateral negotiations should address ‘tariff escalation’, whereby imports of
processed goods incur higher tariffs than imports of primary commodities, and should improve
the value of tariff preferences by eliminating onerous and unworkable rules of origin. Dedicated
geographic zones with less restrictive rules facing investment could support manufactured
exports, although the extent to which such zones will further African development is uncertain.
Finally, linkages need to be established between tariff and trade policies on the one side, and
industrial policies on the other. In some cases (South Africa is the outstanding example), a
combination of earlier unilateral liberalisation and bilateral, regional and multilateral agreements
have limited the policy space to nurture industrial development.
An examination of many Asian success stories demonstrates that the coordination of trade and
industrial policies can be an effective means of promoting development. Many African
economies tried to promote industrialization during the 1970s and 1980s with import protection 27 However, supply-side constraints in Africa and restrictive Chinese non-tariff barriers such as rules of origin may well undermine the full potential of such an agreement for Africa.
28
and government subsidies, but with extraordinary dismal results. Perhaps the critical difference
between many of the interventionist regimes pursued in Asia and African policies was that the
former ensured that favoured industries were exposed to international competition, often by
setting export targets, and furthermore the successful Asian economies were (a) more successful
in getting the appropriate ‘basket’ of policies in place and (b) willing to recognise mistakes
earlier and sacrifice poorly performing sectors. Whether such Asian-type policies, which
involved inter-alia tariff protection and subsidies, are possible now with WTO disciplines and
greater sensitivity in industrial economies to competition from developing countries is an open
question.
29
References
Ackbarally, N. (2008) ‘Mauritius: Clothing sector not hanging by a thread Anymore’, Inter Press Service, 14th March. http://www.afrika.no/Detailed/16371.html
Afrol News (2007) ‘Cape Verde joins struggle for Chinese economic zones’, July 18. http://www.afrol.com/articles/26135
Bannister, J. (2005) ‘Manufacturing Employment and Compensation in China’, Beijing Javelin Investment Consulting Company report, November 2005. http://www.bls.gov/opub/mlr/2005/08/art3full.pdf
Bisseker, C. (2009) ‘State of the Clothing and Textile Industry: on pins and needles’, Financial Mail, 24th April. http://secure.financialmail.co.za/09/0424/cover/coverstory.htm
Cadot, O. and Nasir, J. (2001) ‘Incentives and Obstacles to Growth: Lessons from Manufacturing case studies in Madagascar’, Regional Program on Enterprise Development Working Paper No 117, World Bank, Washington D.C.
Carmody, P. (2009) ‘An Asian-Driven Economic Recovery in Africa? The Zambian Case’, World Development, Vol. 37, No. 7, pp. 1197-1207.
Collier, P., (2007) ‘Managing Commodity Booms: Lessons of International Experience’, African Economic Research Consortium, Nairobi.
Collier, P. and Venables, A.J. (2007a) ‘Trade Preference and manufacturing export response; lessons from theory and policy’ http://users.ox.ac.uk/~econpco/research/pdfs/TradePrefs-Manufacturing.pdf
Davies, M., Edinger, H., Tay, N. and Naidu, S. (2008) ‘How China Delivers Development Assistance to Africa’, Centre for Chinese Studies, University of Stellenbosch.
Davies, M. J. (2008) ‘Special Economic Zones: China’s Developmental Model Comes to Africa’, in Rotberg, R. I. (ed) (2008) ‘China into Africa: Trade, Aid and Influence’, March, pp. 137-154.
Din, M. (1994) ‘Export Processing Zones and Backward Linkages’, Journal of Development Economics, Vol. 43, No.2, pp. 369- 385.
Edinger, H. (2007) ‘In Hu’s Agenda’, The China Monitor, Issue 15, Centre for Chinese Studies, University of Stellenbosch.
Edinger, H. (2008) ‘China’s Commercial Relationship with Africa: Evaluating Special Economic Zones’, presented at the Institute for West Asian and African Studies (IWAAS), Chinese Academy of Social Sciences, Beijing, China, 15th April 2008.
30
Eifert, B., Gelb, A. and Ramachandran, V. (2005) ‘Business Environment and Comparative Advantage in Africa: Evidence from the Investment Climate data’, Center for Global Development, Working Paper No. 56, February.
Fukunishi, T. (2004) ‘International Competitiveness of Manufacturing Firms in Sub-Saharan Africa: Why has the manufacturing sector remained small?’ Institute of Developing Economies. Discussion Paper No. 2, Chiba, Japan.
Ge, W. (1999) ‘Special economic zones and the opening of the Chinese economy: Some lessons for economic liberalization’, World Development, Vol. 27, No. 7, pp. 1267-85.
Goldstein A., N.Pinaud, H.Reisen, X.Chen: The Rise of China and India, OECD Development, 2006.
Graham, E. M. (2004) ‘Do export processing zones attract FDI and its benefits: The experience from China’, International Economics and Economic Policy, Vol. 1, pp. 87-103.
Hammouda, B.H., Karingi, S.N., Njuguna, A.E. and Sadni-Jallab, M. (2006) ‘Diversification: Towards a New Paradigm for Africa’, United Nations Economic Commission for Africa: Africa Trade Policy Centre, Working Paper Number 35.
He, W., (2009). “Bottlenecks in China-Africa Relations” http://www.africanexecutive.com/modules/magazines/articles.php?article=3129 Infomat Inc (2009) ‘The Egypt Apparel Market Research Report’, January. http://www.infomat.com/fido/getpublication.fcn?&type=research&SearchString=apparel&id=737870ST0000886&start=5&tr=18
Jauch, H. (2002) ‘Export processing zones and the quest for sustainable development: a Southern African perspective’, Environment & Urbanization, Vol. 14, No. 1, pp. 101-113.
Jenkins, M., Esquivel, G. and Larrain, F., (1998) ‘Export Processing Zones in Latin America’, Harvard Institute for International Development, Development Discussion Paper. No 646.
Joomun, G., (2006) ‘The Textile and Clothing Industry in Mauritius’, in Herbert Jauch / Rudolf Traub-Merz (eds.) The Future of the Textile and Clothing Industry in Sub-Saharan Africa Bonn: Friedrich-Ebert-Stiftung, Bonn, Germany.
Kaplinsky, R. (2008) ’What does the Rise of China Do for Industrialisation in Sub-Saharan Africa?”, Review of African Political Economy, Vol. 35, No. 115, pp. 7-22.
Kaplinsky, R., McCormick, D. and Morris, M. (2007) ‘The Impact of China on Sub-saharan Africa’, Institute of Development Studies Working Paper n°291.
Kaplinsky, R., and Morris, M. (2006) ‘The Asian Drivers and SSA: MFA Quota Removal and the Portents for African Industrialisation’, Institute of Development Studies, Brighton.
31
Kaplinsky, R., and Morris, M. (2008) ‘Do the Asian Drivers undermine Export-orientated industrialization in SSA?’, Special Issue of World Development on Impact of the Asian Drivers on the South, Vol. 36, No. 2, pp. 254-273.
Lederman, D. and Maloney W. F., (eds) (2007) ‘Natural Resources - Neither Curse nor Destiny’, World Bank publications, World Bank, Washington D.C.
Madani, D. (1999) ‘A Review of the Role and Impact of Export Processing Zones’, World Bank, Washington D.C,
Magder, D. (2005) ‘Egypt after the Multi-Fiber Arrangement: Global Apparel and Textile Supply Chains as a Route for Industrial Upgrading’ Institute for International Economics, Working Paper No. 05-8. http://papers.ssrn.com/sol3/papers.cfm?abstract_id=794805
Ministry of Commerce (2009), China Commerce Yearbook 2009 Beijing: China Commerce and Trade Press.
Naumann, Echart (2004), “Rules of origin under EU-South African Trade, Development and Cooperation Agreement and Cotonou Agreement: the textile and clothing sectors”, in “The impact of Preferential Rules of Origin in the textile and clothing sectors in Africa”, 2004, Commonwealth Secretariat Economic Paper 65.
People’s Daily Online (2007) ‘Chinese SEZ likely in Egypt’, 14 November. http://english.people.com.cn/90001/90778/90857/6302146.html
Sandrey, R. (2008) ‘South African imports of clothing from China’, unpublished memo, tralac.
Sandrey, R. (2009) ‘China-Africa merchandise trade for the December 2008 year’, tralac Working Paper 07, 2009, tralac, Stellenbosch.
Sandrey, R.and Fundira, T. (2008) ‘Quota imports of Chinese clothing into South Africa: the first year analysis’. tralac Trade Brief 4. www.tralac.org
Söderbom, M. and Teal, F. (2001) ‘Can African manufacturing firms become successful exporters?’ Centre for the Study of African Economies-United Nations Industrial Development Organization Working Paper No. 4.
Teng, L. (2009) ‘China’s First Equity Investment to facilitate the African Continent’, Presentation by the Southern African Representative of the China-Africa Development Fund (CADFund) at the opening of the Asian Business Centre at the Gordon Institute of Business Science (GIBS), Johannesburg, South Africa, 26th March
Trindade, V. (2005) ‘The big push, industrialization and international trade: The role of exports’, Journal of Development Economic, Vol. 78, No. 1, pp. 22- 48
United Nations Economic Commission for Africa (2007) ‘Economic Report on Africa 2007’, United Nations, Addis Ababa, Ethiopia. http://www.uneca.org/era2007/
32
Villoria, N. (2009) ‘China and the Manufacturing Terms-of-Trade of African Exporters’. Journal of African Economies.
Wood, A. and Mayer, J. (2001) ‘Africa’s Export Structure in a Comparative Perspective’, Cambridge Journal of Economics No. 25, pp. 369–94.
World Bank (2001) ‘Export Processing Zones in Sub-Saharan Africa’, Economic and Social Policy, 193, October 2001.
33
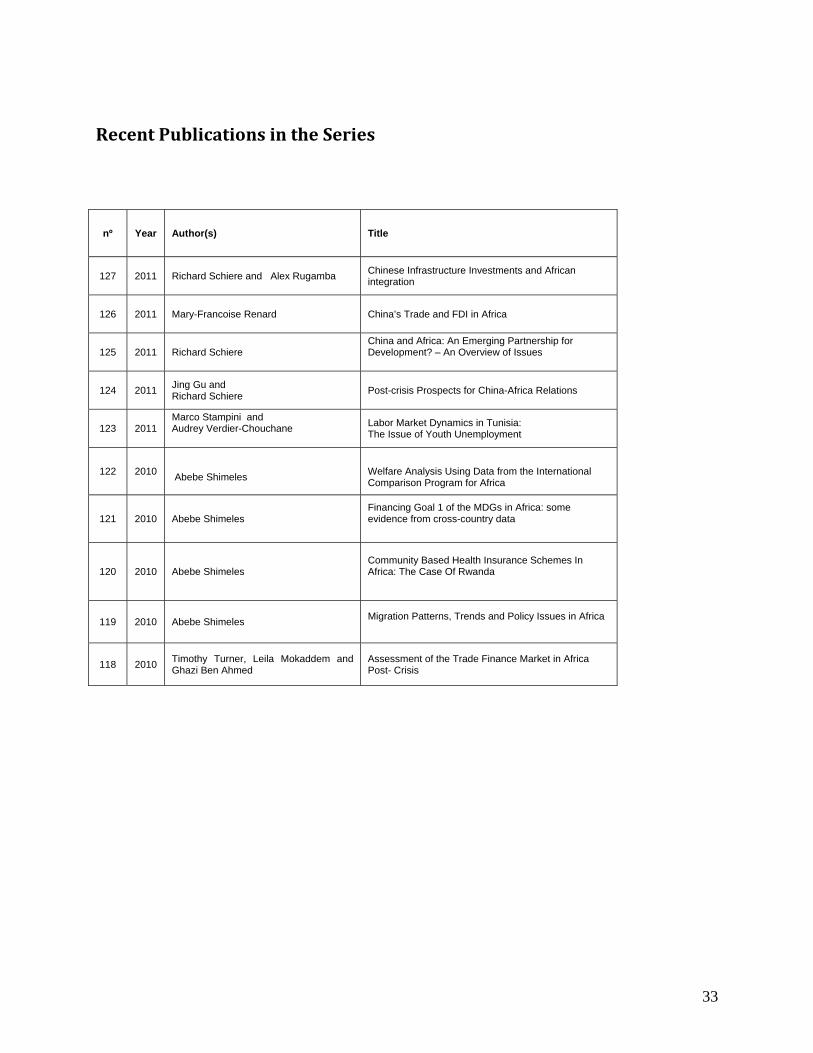
Recent Publications in the Series
nº Year Author(s) Title
127 2011 Richard Schiere and Alex Rugamba Chinese Infrastructure Investments and African integration
126 2011 Mary-Francoise Renard China’s Trade and FDI in Africa
125 2011 Richard Schiere China and Africa: An Emerging Partnership for Development? – An Overview of Issues
124 2011 Jing Gu and Richard Schiere Post-crisis Prospects for China-Africa Relations
123 2011 Marco Stampini and Audrey Verdier-Chouchane
Labor Market Dynamics in Tunisia: The Issue of Youth Unemployment
122 2010 Abebe Shimeles
Welfare Analysis Using Data from the International Comparison Program for Africa
121 2010 Abebe Shimeles Financing Goal 1 of the MDGs in Africa: some evidence from cross-country data
120 2010 Abebe Shimeles
Community Based Health Insurance Schemes In Africa: The Case Of Rwanda
119 2010 Abebe Shimeles Migration Patterns, Trends and Policy Issues in Africa
118 2010 Timothy Turner, Leila Mokaddem and Ghazi Ben Ahmed
Assessment of the Trade Finance Market in Africa Post- Crisis
34
Recommended