Genetics of common psychiatric disorders: A Mendelian perspective based on genetic analyses of large pedigrees
Dissertation zur
Erlangung des Doktorgrades der Naturwissenschaften
aus dem
Fachbereich I – Psychobiologie
vorgelegt von
Michelle Kaiqi Lin
Betreuer:
Prof. Dr. Jobst Meyer
Prof. Dr. Claude Muller
Trier, 2011
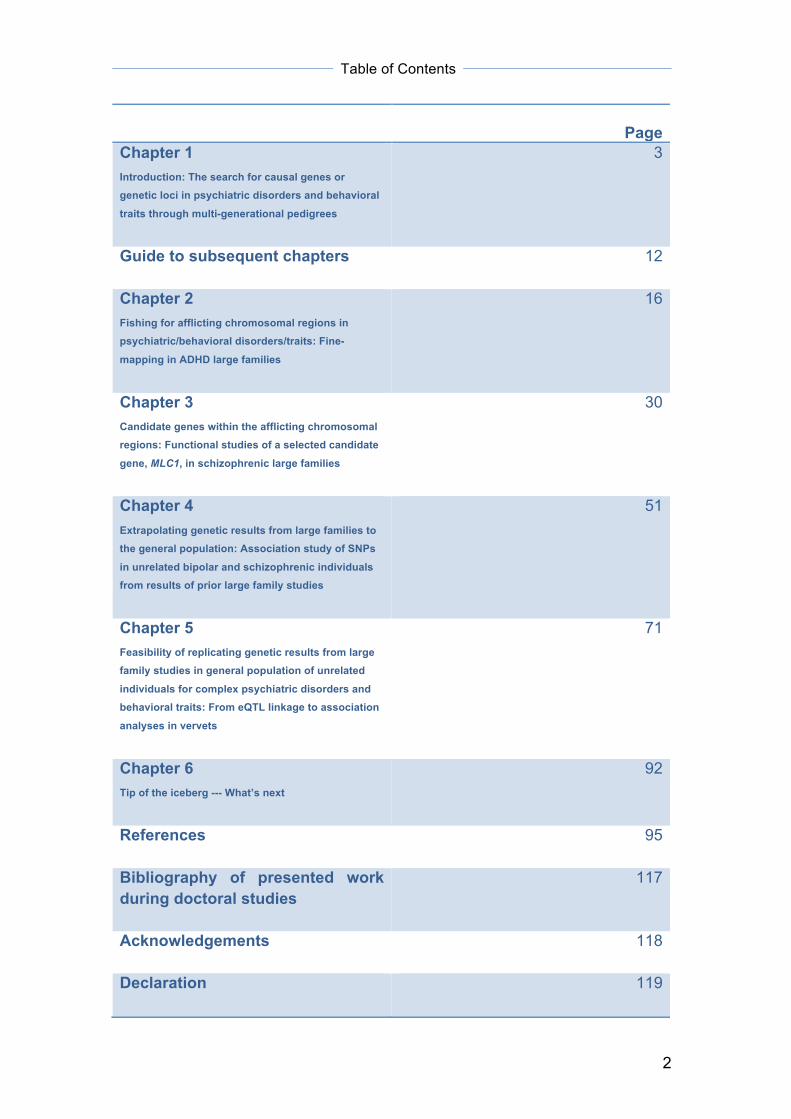
Table of Contents
2
Page
Chapter 1 Introduction: The search for causal genes or genetic loci in psychiatric disorders and behavioral
traits through multi-generational pedigrees
3
Guide to subsequent chapters
12
Chapter 2 Fishing for afflicting chromosomal regions in psychiatric/behavioral disorders/traits: Fine-
mapping in ADHD large families
16
Chapter 3 Candidate genes within the afflicting chromosomal regions: Functional studies of a selected candidate
gene, MLC1, in schizophrenic large families
30
Chapter 4 Extrapolating genetic results from large families to the general population: Association study of SNPs
in unrelated bipolar and schizophrenic individuals from results of prior large family studies
51
Chapter 5 Feasibility of replicating genetic results from large family studies in general population of unrelated
individuals for complex psychiatric disorders and behavioral traits: From eQTL linkage to association
analyses in vervets
71
Chapter 6 Tip of the iceberg --- What’s next
92
References
95
Bibliography of presented work during doctoral studies
117
Acknowledgements
118
Declaration
119
Chapter 1
3
Chapter 1 Introduction: The search for causal genes or genetic loci in psychiatric disorders and behavioral traits through multi-generational pedigrees
In psychiatric and behavioral sciences, many scientists face complex
problems in trying to unveil the underlying mechanisms that brought about
psychiatric and behavioral phenotypes. Mendelian disorders or traits are
phenotypes, which are caused by one genotype at one genetic locus (i.e.
monogenic) and can be found to occur with high frequencies in large families.
They are contradictory to the non-Mendelian multifactorial disorders/traits,
otherwise known as complex disorders/traits, which are brought about by the
effect of multiple genotypes located at multiple genetic loci and the
environment (i.e. polygenic). Psychiatric and behavioral disorders/traits are
generally categorized as complex disorders/traits, similarly to that of many
other physiological disorders/traits 1. However, until recently, efforts to
understand their genetic mechanisms have been lagging behind that of their
more physio-physical clinical counterparts, which may be due to the later
acknowledgement that psychiatric and behavioral disorders/traits should be
treated as any other genetic disorders/traits. Despite that, the field of
psychiatric and neurobehavioral genetics has progressed rapidly in recent
years with the extensive collaborations within various international consortia
that encompass research perspectives ranging from endophenotyping to the
classical linkage and association studies 2,3. In this chapter, we will
contemplate the progress of molecular genetics, with special emphasis on the
pattern of Mendelian inheritance, in the general field of psychiatric and
behavioral disorders/traits.
From family, twin and adoption studies, many psychiatric and behavioral
disorders/traits are known to be heritable and are influenced by genetic
factors, albeit not totally (i.e. environmental factors and non-familial genetic
factors, which we will not be going into details here). Francis Galton (cousin of
Charles Darwin, founder of the evolution theory), who devoted much of his
Chapter 1
4
research passion on quantifying human traits variation (e.g. height, weight,
eye colour, arm length), recognized the value of twins for studying human
genetics and is the documented first to inquire into the concept of heritability
and environment 4. Monozygotic (MZ) twins are genetically identical as
compared to dizygotic twins (DZ), who only share half of their genes. Hence, if
a trait has a large genetic component driving its expression, MZ twins will
display higher instances of the trait than DZ twins or other unrelated
individuals. If a trait has a larger genetic component than environmental
component, the MZ twins who were brought up apart (i.e. adopted into
different families, living in different environment) will nevertheless have the
same chances of expressing the trait. However, if the trait in question is
largely under environmental influences, the adopted MZ twins will have
different probabilities of expressing the trait. The earliest modern studies
showing heritability in psychiatric disorders through such family, twin and
adoption study designs were largely made with schizophrenic samples in the
1960s and 1970s, propelled by Gottesman and Shields, who went on to
establish the yardstick for many modern researches into the genetics of
behavior and psychopathy 5,6.
There are different camps of thought with regards to the genetic model of
most psychiatric/behavioral disorders/traits. The two main views by which the
phenotypes arise are via: 1) multiple common genetic variants, each of small
effect (i.e. polygenic), otherwise known as the common variant – common
disorder (CVCD) hypothesis 7; or 2) a single rare genetic variant of major
effect (rare variant occurs in different genes for different families or
individuals, who display the same phenotype), also known as the common
disease/rare variant (CD/RV) hypothesis 8. Genome-wide association studies
(GWAS) are carried out in the hypothesis-free (with no candidate genes
apparent in mind) search for genetic loci associated with a particular
psychiatric disorder or behavioral trait. The main assumption for GWAS is the
accumulative small effects of multiple genes, belonging to the CVCD camp,
which cause the phenotypic disorder/trait observed 9. In spite of the ever-
increasing sample sizes, which has recently reached over tens of thousands
Chapter 1
5
of subjects, replication of results across independent studies for any particular
trait/disorder proved difficult in many cases 10. On the other spectrum, rare
genetic variants of major effects are considered in linkage studies using
extended pedigrees, with the CD/RV hypothesis in mind.
Under normal circumstances, psychiatric disorders or behavioral traits are
considered to be polygenic, involving several to many genes of both small and
large effect sizes, ultimately contributing to the phenotype. This is unlike
monogenic disorders/traits, which are due to the effect of a single gene.
However, the existence of multiplex families with numerous individuals
carrying a particular psychiatric disorder or behavioral trait, steer us towards a
Mendelian genetic exception in these families. The existence of large multi-
generational pedigrees, comprising of multiple affected members, are present
for quite a number of psychiatric disorders or behavioral traits such as bipolar
disorder in the Amish extended pedigree 11, autism in the Utah autistic
pedigrees 12 and schizophrenia in the Palau schizophrenic pedigrees 13, just
to name a few. The revelation of singular rare variants in the respective
families cumulatively adds to the genetic databases for the disorder/trait,
which will in turn allow a larger picture of the genetic mechanism driving the
disorder/trait that affects others in the general population. Mitchell and
Porteous have recently written a review on understanding the genetic
architecture of psychiatric disorders through Mendelian cases occurring in
large pedigrees 14. Using schizophrenia as an example, they argued that
despite only a small percentage of schizophrenic cases being explained by
highly penetrant mutation in a single gene each time, if these exceptional
cases (with their unique rare variant or mutation) appears frequently enough,
then it makes logical sense that one can assume that a significant portion of
the psychiatric disorder is accounted for by rare variants or mutations.
In the following paragraphs, we shall discuss how large families with many
individuals affected by psychiatric disorders can 1) be useful in understanding
genetic mechanisms of behavioral pathologies; 2) provide sample cases to
dissect overlapping genetic causes in cross-disorders of two or more
Chapter 1
6
psychiatric traits in comorbidity; 3) offer better insights in introducing clearer
subtyping of psychiatric diagnoses; and 4) give clues as to which
environmental factors may come into play in the disease manifestation.
(1) Mendelian patterns in large families affected by psychiatric disorders
In extended families with several generations, consisting of multiple affected
individuals in each generation, one can follow the transmission of the disorder
from parents to offspring. The first step is usually a genome-wide linkage
analysis in these families in search of chromosomal regions, which is highly
linked to the disorder being studied. After which, a segregation analysis
ensues to more accurately fine-map the chromosomal regions, which co-
segregate with the disease status in the family. This is can be done by
analyzing genetic biomarkers, which are either the fragment size of
microsatellite repeats or the single nucleotide polymorphisms (SNPs), in the
genome of as many family members as possible. By doing so, it is possible to
construct haplotypes, which are certain sets of microsatellite fragment sizes or
SNPs in a region of the genome. Haplotypes can be traced from a ‘founder’
affected individual (usually the eldest in the pedigree with clinical diagnosis
and genotype known) down to his or her descendants. In the event that the
psychiatric trait has a Mendelian tendency in a particular family, a specific
haplotype is seen in all affected members in the family but not in the
unaffected members. In ideal situations as such, one has come across a fully
penetrant dominant psychiatric trait in that family, with a known causative
genetic locus.
Genetic mutations or variations in the genetic locus co-segregating with the
psychiatric disorder in the family can be further explored in an attempt to
better understand the genetic mechanisms underlying the disorder. Almost all
genetic variants or mutations uncovered via such approach in large pedigrees
are rare and private to the families being investigated. These rare and private
mutations or variants are believed to exert the majority of the effect resulting
Chapter 1
7
in the disorder. As they are rare, they will not likely show up in most
association studies utilizing the general population as sample base. It follows
that large-scale GWAS most probably has a very low/or no chance of picking
up these genetic loci signals. Therefore, multiplex families can play a very
important role to reveal genetic anomalies, which induce complex disorders or
traits 15.
Ultimately, many researchers and clinicians are interested in what causes the
disorder. Rare genetic mutations and variants give clues to which genetic
pathways and thus, the bio-chemical pathways when affected, give rise to the
disorder. In complex disorders, as most psychiatric disorders are believed to
be, many genes interact with each other in extensive webs of communication
and the malfunction of any one of the genes may result in the same disorder,
known as genetic heterogeneity. In other words, rare and private genetic
mutations/variants can provide insights into the pathophysiological pathways
of the disorder, which are also affecting other patients from the general
population. For many psychiatric disorders to date, their etiologies are still an
enigma in many aspects but extended pedigree studies can serve to add
more information to uncover the causation of the disorder.
More often than not, there are several exceptions, which one has to consider
while looking for Mendelian inheritance of psychiatric disorders in large family-
based studies and they are chiefly, i) incomplete penetrance; ii) sporadic
cases; and iii) bilineality. i) Incomplete penetrance happens when an
unaffected individual carries the haplotype that all other affected individuals in
the family are carrying. Depending on the occurrence rate of such status in
the family, the penetrance level for the disorder at a particular genetic locus
can vary drastically. This is where one has to consider other non-familial
genetic factors and/or environmental factors exerting their influences, and
only having fulfilled the criteria of those factors, will the said haplotype co-
segregating with the diseased trait lead to the expression of the phenotypic
trait 16. ii) On the other hand, there may be instances when an affected
individual diagnosed with a psychiatric disorder, does not carry the same
Chapter 1
8
haplotype, which all other affected family members carry. Sporadic cases,
though rare in large pedigrees, can still be expected to appear at about the
same percentage rate as in the general population for the disorder being
investigated. iii) Apart from such problems, there is also bilineality in extensive
pedigrees to consider. As with many disorders, the reproductive fitness in
psychiatric individuals is lower than that of the general healthy population.
Unless it is an early on-set disease like autism, many people afflicted with
psychiatric disorders still manage to marry and start their own families 17-19.
Thus, there are two possible lines of Mendelian alleles (either from the
paternal side or the maternal side of the family) being transmitted to their
descendants. This complicates matters as further down the family tree, one
will most probably come across several individuals who are affected but are
carrying different haplotypes (some from the paternal and others from
maternal line). Another usual occurrence is large pedigrees with multiple
generations involving more than one affected spouse/s can be found in
consanguine families in certain social cultures, which encourage close-ties
(e.g. between first cousins) marriages 20,21. In large inbred pedigrees, rare
genetic variants of recessive psychiatric disorders can be detected very
easily.
(2) Cross-disorders among psychiatric traits – how multiplex families may
support the analyses
Shared heritability arises due to genetic pleiotropy, a situation where one
gene gives rise to different phenotypes. A recent example of shared
heritability was presented in a metal-analysis of genetic studies carried out on
attention-deficit/hyperactivity disorder (ADHD) and autism spectrum disorder
(ASD)22. There is a high frequency of co-occurrence of ADHD and ASD in
children, hence the hypothesis that the two disorders share similar genetic
factors. In multiplex families consisting of individuals diagnosed with multiple
psychiatric problems, tracking differences in genetic sequences (which are
cost-realistic and do-able within an acceptable time-frame with the diving
Chapter 1
9
costs and improvements in the next-generation sequencing technologies) and
comparing among affected individuals with comorbidities, affected individuals
without comorbidities and unaffected individuals in the same family may be
easier to yield leads to the dissection of genetic components which give rise
to genetic pleiotropy. As many of the psychiatric disorders have one or more
criteria that may overlap, the differences in diagnosing these criteria may be
subtle. Since large families are powerful sample bases to detect genetic
anomalies of major effect sizes, it is more plausible to find hints to tease apart
the overlapping genetic mechanisms between disorders via their gene-gene
interaction network. This will in itself also allow better comprehension of the
etiologies of each disorder.
A recent success on psychiatric cross-disorders of schizophrenia and bipolar
disorder used information collected from families as a foundation for the
study. Lichtenstein et al. utilized more than two million nuclear families in
Sweden to assess the effects of genes and the environment in contributing
towards the two disorders 23. They managed to show evidence that
schizophrenia and bipolar disorder share a common genetic cause to a
certain extent. Another genome-wide study by Huang and colleagues
attempted to investigate the cross-disorder of schizophrenia, bipolar disorder
and depression using large number of unrelated affected individuals but they
were not as successful 24.
(3) Subtyping of psychiatric disorders for improved diagnostic criteria with
multiplex pedigrees
Psychiatric genetics is quite unlike the other branches of human genetics. A
salient difference is the diagnostic tools used to determine the disorder –
usually a series of questionnaire tests and structured interviews of the
individuals in question, which may or may not include interviews of other non-
affected individuals in close contact with the clinical proband. ‘Non-physical’
methods of examination and categorization of psychiatric disorders as such
Chapter 1
10
are open to debate at times about their objectivity during diagnoses despite
much effort of the clinicians to standardize and coordinate across different
executers of the tests and interviews. Hence, psychiatric diagnoses have
been termed as ‘the weak component of modern research’ 25. Over the years,
there are constant improvements in the psychiatric testing tools but
contrasting to most other human disorders, which can be more easily
concluded via a physical test like blood testing of hormones or x-rays and
mammograms of body parts, such physical tests for use in psychiatry are still
in early stages of development. Many of the psychiatric labels are broad and
encompass several subtle phenotypes that can either be different categories
(e.g. DSM-IV, Diagnostic and Statistical Manual of Mental Disorders, 4th
edition; and ICD-10, International Statistical Classification of Diseases and
Related Health Problems, 10th edition) 26,27 of the same disorder or a wholly
different disorder as in the cases of co-mobidities/cross-disorders. Perhaps
such broad definitions for psychiatric diagnoses are the main culprit for the
increased toughness in delving their genetics compared to other complex
diseases. Efforts to subtype each psychiatric disorder to provide a finer
diagnostic report are underway to combat these problems in many
laboratories and clinics presently. As discussed in the preceding paragraphs
on dichotomizing the subtleties between cross-disorders, multiplex families
offer a beautiful and effective sample set-up to discover genes of large effect
size, which may be hidden in the different sub-groups of a particular disorder 28,29. These major effect genes may offer more options in defining a cleaner
cut between categories of a disorder through groupings by pathway-specific
gene malfunction; and may also serve as predicament of other onset of
psychiatric problems in the same patients in future via observations of the
causative genes in their possible gene-gene interaction network.
An example, periodic catatonia (OMIM: %605419), which belongs to a sub-
category of schizophrenia with a bipolar course, is presented in chapter 3. A
polymorphism of the MLC1 gene, which was found to co-segregate with all
periodic catatonia-affected members in one of our large families, was
associated only to the periodic catatonia sub-group of schizophrenia 30. In the
Chapter 1
11
chapter, we did further functional studies on this candidate gene of periodic
catatonia to investigate its role in relation to this sub-group of schizophrenia.
(4) Clues in large family-based studies to possible environmental
consequences in development of psychiatric symptoms or behavioral traits
Some may argue about certain behavioral phenotypes being the result of
nurture (environmental factors) as oppose to nature (genetics factors). In
eating disorder cases, there is a markedly increased recurrence risk in first-
degree relatives 31,32. Despite so, it has only been recently (in the past two
decades) acknowledged that it is a psychiatric disorder with a genetic basis 33,34. The genetic work on eating disorders is in the early stages but it is still
considered by many clinicians as having a strong familial behavioral influence 35. As eating disorders have early onset at adolescence 35, multiplex families
offer a good experimental setting in studying the environmental influence on
the genetic factors in such disorder with known high heritability rate.
Assuming the family members are still staying close to each other during the
discovery of onset of the disorder at each generation, the environmental
factors for most in the family members for that generation can be considered
uniform to a certain extent. By investigating large multi-generational pedigrees
of such disorders, one can elucidate the effect on the environment on the
genes by looking within each generation and also comparing them to that of
across the different generations and branches of the main families (which
have different environmental influences since one can assume that after
setting up a new family with their spouses, each nuclear family then live
separately). In other words, it is possible to compare several different
environment before/during onset of the disorder for one familial set of genes
with increased power to detect the disease heritability.
Chapter 1
12
Guide to the subsequent chapters
The special theme of this thesis is to investigate large pedigrees showing
Mendelian pattern for various psychiatric disorders (namely attention-
deficit/hyperactivity disorder (ADHD), schizophrenia and bipolar disorder), in
the bid to understand more about the genetic architecture of general
psychiatric/behavioral disorders/traits, which have a late start as compared to
many other physiological disorders/traits. Other problems mainly specific to
the psychiatric and behavioral sciences, like frequent cross-disorders and
sometimes quite subjective diagnostic tools used, further add to the difficulties
of psychiatric/behavioral genetics research.
The following chapters explore a series of experiments using the classical
genetic approach, as explained in the following figure (figure 3), on various
psychiatric disorders and behavioral traits. This classical two-stage genetic
approach is widely used by many human geneticists to study a wide range of
human physiological disorders in the past decades but is only recently being
applied to the field of psychiatric and behavioral sciences. One of the earlier
successful efforts to execute a large-scale international two-stage genetic
approach in psychiatry was carried out by Moises and et al. in schizophrenic
samples using large multi-generational pedigrees from an Icelandic population
isolate in the linkage step and they proceeded on to the association step with
independent population (i.e. non-pedigreed) samples from eight different
countries 36.
Chapter 1
13
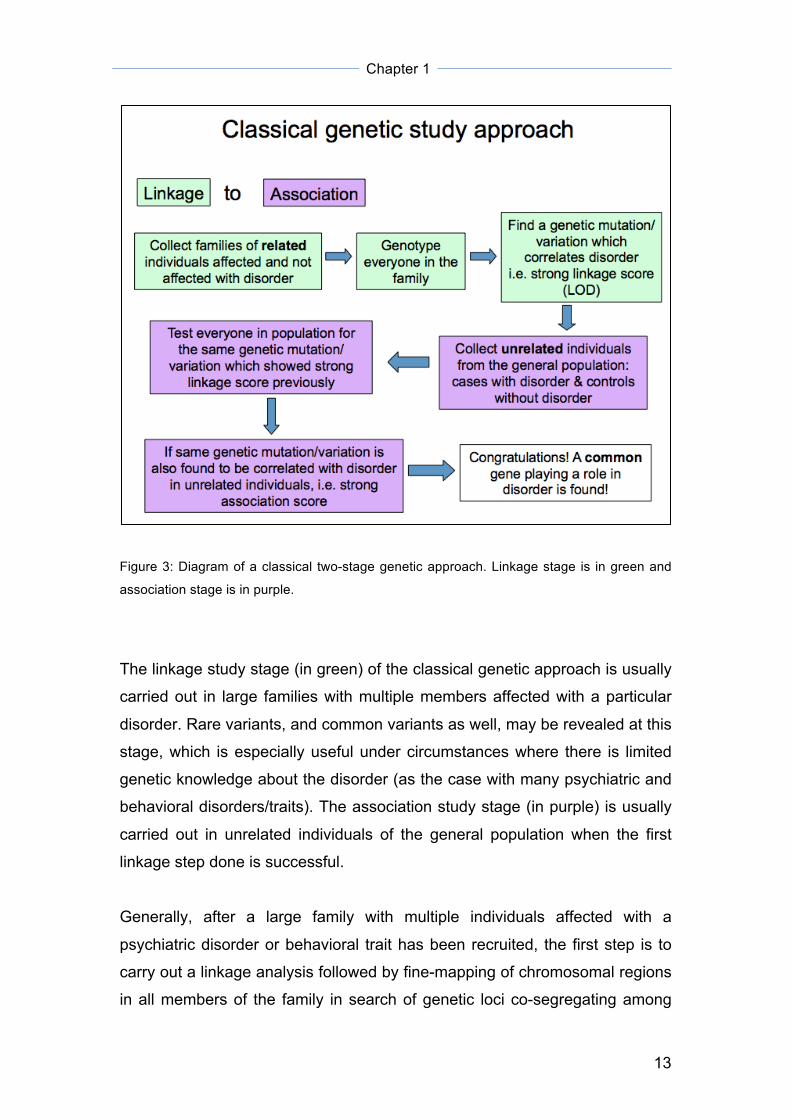
Figure 3: Diagram of a classical two-stage genetic approach. Linkage stage is in green and
association stage is in purple.
The linkage study stage (in green) of the classical genetic approach is usually
carried out in large families with multiple members affected with a particular
disorder. Rare variants, and common variants as well, may be revealed at this
stage, which is especially useful under circumstances where there is limited
genetic knowledge about the disorder (as the case with many psychiatric and
behavioral disorders/traits). The association study stage (in purple) is usually
carried out in unrelated individuals of the general population when the first
linkage step done is successful.
Generally, after a large family with multiple individuals affected with a
psychiatric disorder or behavioral trait has been recruited, the first step is to
carry out a linkage analysis followed by fine-mapping of chromosomal regions
in all members of the family in search of genetic loci co-segregating among
Chapter 1
14
family members with the disorder/trait. The hypothesis for this particular step
is that causal genes or genes playing a major role in contributing to the
susceptibility of the disorder/trait are present within the co-segregating
chromosomal region. Chapter 2, ‘Fishing for afflicting chromosomal regions in
psychiatric/behavioral disorders/traits: Fine-mapping in ADHD large families’,
examines the fine-mapping of chromosomal regions from prior linkage
analysis done to search for narrowed down genomic regions, which has a
high probability in containing genes contributing to the said disorder.
The second step following a successful positional cloning effort (i.e. fine-
mapping) is to identify interesting candidate genes within the narrowed down
chromosomal regions. Functional studies on the candidate genes are later
carried out to better understand if and how they may play a part in causing the
disorder/trait. In chapter 3, ‘Candidate genes within the afflicting chromosomal
regions: Functional studies of a selected candidate gene, MLC1, in
schizophrenic large families’, shows an example of a candidate gene within a
fine-mapped chromosomal region, which was selected for further functional
study to learn if, and how, the gene may contribute to the phenotype of the
disorder.
In parallel, the next step after successful positional cloning, is to investigate
whether the particular mutations or variations of the candidate genes
identified in the narrowed down chromosomal regions are also found in
unrelated individuals in the general population who are similarly affected by
the same disorder/trait. Chapter 4, ‘Extrapolating genetic results from large
families to the general population: Association study of SNPs in unrelated
bipolar and schizophrenic individuals from results of prior large family studies’,
completes the whole process of the classical two-stage genetic approach,
which brings the reader through linkage study in large families to association
study in the general population of two well-known psychiatric disorders.
Chapter 5, ‘Feasibility of replicating genetic results from large family studies in
general population of unrelated individuals for complex psychiatric disorders
Chapter 1
15
and behavioral traits: From eQTL linkage to association analyses in vervets’,
focuses on another genetic aspect, expression quantitative trait loci or eQTL
(not only on genes, but the expression level of genes), but still following the
classical two-stage genetic approach. This chapter also presents attempts to
answer three main questions relevant to the summation of the current thesis
and the possible future direction in psychiatric and behavioral genetics: 1)
does the classical genetic two-stage approach works as well when applied to
complex traits with a smaller but still suitably sized population of unrelated
individuals as compared to many of the large sample-sized experiments in
psychiatric and behavioral genetic association studies nowadays. This
question is paramount to today’s psychiatric genetics research since large
samples, amounting to tens of thousands of subjects, are necessary to detect
significant results in the association stage 37; 2) aside from functional genes,
which is the original focus of many psychiatric/behavioral genetic studies, is it
possible for other genetic aspects to be involved, e.g. eQTL (genetic regions
which regulate the expression of genes); and 3) is it possible to set up an
accurate map of blood biomarkers to study the neuro-physical states of both
psychiatric disorders and behavioral traits. This is a pilot-study to create a
blood-brain correlated gene expression map that can used to study physical
brain changes for psychiatric/behavioral disorders/traits with just blood
samples alone. Future experimental successes may lead to plausible
definitive genetic markers (similarly to many clinical physiological disorders)
for psychiatric disorders or behavioral traits in the coming years and more
importantly, deeper insights into the web of gene interactions resulting in the
psychiatric/behavioral phenotypes.
Chapter 6, the concluding chapter of this thesis, will touch upon several
popular ideas that are driving recent psychiatric and behavioral genetics
studies, in which large pedigrees can be of good use.
Chapter 2
16
Chapter 2 Fishing for afflicting chromosomal regions in psychiatric/behavioral disorders/traits: Fine-mapping in ADHD large families
This chapter is presented as a manuscript (under re-review by the European
Journal of Human Genetics as of 5th September 2011) entitled:
Haplotype co-segregation with ADHD in unrelated German multi-generation families Michelle K. Lin1, Christine M. Freitag2, Haukur Pálmason1, Christiane Seitz3,
Tobias J. Renner4, Marcel Romanos4,8, Susanne Walitza4,7, Christian P.
Jacob5, Andreas Reif5, Andreas Warnke4, Rita M. Cantor6, Klaus-Peter
Lesch5 and Jobst Meyer1
1 Department of Neurobehavioral Genetics, Institute of Psychobiology, University of Trier, Germany; 2 Department of Child and Adolescent Psychiatry, Goethe University Frankfurt am Main, Germany; 3 Department of Child and Adolescent Psychiatry, Saarland University Hospital, Homburg, Germany; 4 Department of Child and Adolescent Psychiatry and Psychotherapy, University of Wuerzburg, Germany; 5 Department of Psychiatry, Psychosomatics and Psychotherapy, University of Wuerzburg, Germany; 6 Department of Human Genetics, School of Medicine, University of California Los Angeles, United States of America; 7 Department of Child and Adolescent Psychiatry and Psychotherapy, University of Zurich, Switzerland; 8 Department of Child and Adolescent Psychiatry, Psychosomatics and Psychotherapy, University Hospital of Munich, Germany.
Chapter 2
17
Abstract Complex disorders proved to be elusive in the search for underlying genetic
causes. In the presence of large multi-generation pedigrees with multiple
affected individuals, a Mendelian dominant inheritance model can be
observed in those families by following the haplotypes being transmitted
predominantly to all the affected members in the families. Particular shared
haplotypes among all affected individuals can reveal the chromosomal
regions where the disease-related genes may be located and the critical
pathways involved can be exposed.
We have recruited eight large Attention-Deficit/Hyperactivity Disorder (ADHD)
families of German descent. Densely spaced informative microsatellite
markers with high heterozygosity rates were used to fine-map and haplotype
chromosomal regions of interest in these families. In three subsets of the eight
ADHD families, haplotypes co-segregating with ADHD-affected individuals
were identified at chromosomes 5q11 – 5q13, 9q31 – 9q32 and 18q11 –
18q21, which are supported by positive LOD scores.
The existence of haplotypes co-segregating among all affected individuals in
large ADHD pedigrees suggests the existence of Mendelian forms of the
disorder and that ADHD-related genes are located within these haplotypes.
New-generation sequencing tools will allow whole of these regions to be
sequenced more easily to identify causal genetic mechanisms, providing
further insights into the genetics of ADHD.
Chapter 2
18
Introduction Genetic architecture of complex disorders is generally difficult to elucidate and
the search for causal gene or a set of causal genes, where multiple pathways
may be involved, is an uphill work. Unlike monogenic disorders, complex
disorders do not usually follow a Mendelian inheritance pattern. However, the
existence of large pedigrees with many related individuals affected with the
same complex illness, demonstrate the possibility of that complex disorder
segregating in a Mendelian dominant fashion. Examples of past results from
numerous large family-based studies of complex diseases for hypertension 38,
type II diabetes and Maturity Onset Diabetes of the Young (MODY) 39,
inflammatory bowel disease 40, Parkinson’s disease 41, bipolar disorder 42, and
schizophrenia 43, to name a few, support the Mendelian model of inheritance
in these families. For a particular complex disorder, different families may
exhibit different causal genes, alleles or genetic loci, pointing to private rare
mutations in the different families. A probable explanation for such is that
among the intricacies of complex disorders lies genetic heterogeneity, where
different variants or mutations in the same gene, and/or different genes in the
same or related pathways, may lead to the manifestation of the same
disorder.
Large pedigrees with multiple individuals afflicted with a complex disease
permit the tracking of haplotype transmission among the affected family
members and the lack of transmission to those who are unaffected. The
recurrence of a particular haplotype among all the affected family members,
but not the unaffected, can provide valuable insights into the plausible
candidate genes in those regions, which may cause the disorder running in
the family. Despite the high probability of uncovering genetic variants or
mutations that are rare and usually private to the respective families, the
knowledge gleaned from this approach can ultimately be extrapolated into the
general affected population by providing clues about the pathophysiological
pathways causing the disease from these genes.
Chapter 2
19
Attention-Deficit/Hyperactivity Disorder (ADHD) is a common neuro-
psychiatric disorder, which affects approximately 1 in 20 children 44, and has
about a 50% probability of persisting into adulthood 45. This etiologically
complex and clinically heterogeneous condition is characterized by an early
onset (before 7 years) of age-inappropriate inattention, hyperactivity and
increased impulsivity observed in different settings (e.g. at school, at home
and/or at work), leading to impairment in social functioning. Previous twin and
adoption studies showed a strong heritability (70 – 80 %) of childhood ADHD 46,47, which is comorbid with many other traits like anxiety disorder, affective
disorders, depression, oppositional defiant or conduct disorder and substance
abuse 48. However, in a recent twin-family study, heritability of adult ADHD
was estimated to be about 30 % 49.
We have recruited eight large ADHD pedigrees of German origin. These
families comprised of a total of 191 individuals, of whom 95 are affected with
ADHD. From the family trees, ADHD appears to segregate in a dominant
manner. Hence, postulating a dominant Mendelian model of genetic
inheritance of ADHD in these pedigrees, we investigated densely spaced (~
0.5 Mb) microsatellite markers on all available family members in
chromosomal regions derived from our previous 50 K SNP chip-based study
on these families 50. The previous 50 K SNP genome-wide linkage study was
done using a few selected individuals to represent each family, which did not
allow us to obtain enough information to examine the co-segregation of
haplotypes with the disorder. However, it provided us with important leads to
where we can apply our microsatellite markers in the vast genome. From our
haplotype segregation analysis in the present study, we were also able to
determine the borders of regions on the chromosomes that are shown to be
co-segregating with ADHD, which was not possible in the earlier study. The
present study allows us to identify chromosomal regions co-segregating with
ADHD in the respective families by the observation that these haplotypes are
predominant in the affected individuals in the families but not in the unaffected
members.
Chapter 2
20
We have investigated all reported linkage regions from our 50 K SNP study in
all available family members, in accordance as to which significant linkage
regions coincide with which large ADHD families 50. Interestingly, most
genetic loci with significant linkage peaks in the previous SNP study did not
show co-segregation with ADHD but were shown to be present in a random
manner among the members of the families, maintaining the need for this
study. Through the present analysis, three chromosomal regions are
revealed, at chromosomes 5q11 – 5q13, 9q31 – 9q32 and 18q11 – 18q21, to
be co-segregating with the affected status in our different ADHD pedigrees.
Genetic mutations, variants or structural variants within these regions found to
co-segregate with ADHD may contribute to the better understanding of the
molecular mechanisms leading to ADHD.
Materials and methods
Family ascertainment/assessment and sample description
Families were recruited through index children referred to the three outpatient
clinics in Trier, Homburg and Wuerzburg and were of German origin. The
index children were aged 6 or above and met the criteria for the ADHD
combined type according to DSM-IV. Individuals exhibiting ADHD symptoms
without a typical childhood history and individuals with unclear etiology of
symptoms were considered as 'unknown' in the diagnosis. The families P1,
P2, P3 and P4 were recruited in Wuerzburg, and families P5, P6, P7 and P8
in Homburg and Trier. The eight families included in this study comprised of
191 individuals, of whom 95 were affected with ADHD. These families are 2 -
4 generation multiplex pedigrees, which were depicted in more details in
figure 1 of Romanos et al. 50. All participants and/or their legal guardians have
signed an informed written consent. Approval by the ethics committees at the
Julius-Maximilians University (Wuerzburg) and the Saarland Doctors’
Association (Saarbruecken) was granted.
Chapter 2
21
For a full description of the diagnostic procedure, please refer to Romanos et
al. 50. In short, children and adolescents were assessed by semi-structured
interview (Kiddie-SADS-PL German version 51 or Kinder-DIPS 52, the Child
Behavior Checklist 53), by an ADHD diagnostic checklist applying DSM-IV
criteria (ADHD-DC) 54, and teacher ratings (TRF 53 or FBB-HKS 55). All adults
were assessed by SCID I 56 and SCID II 57, the ADHD diagnosis checklist
(ADHD-DC) and the Wender Utah Rating Scale 58. Measurement for
intelligence was by the non-verbal CFT1/20 59,60 in children, and MWT in
adults 61. None of the participants display an IQ below 80. All participants
were assessed by at least two clinicians experienced in childhood and adult
ADHD diagnosis. Under circumstances that a complete assessment was not
possible, the individual’s ADHD status is taken to be ‘unknown’.
Genotyping and haplotype estimation
DNA was extracted from blood samples according to standard protocols.
Fine-mapping was done with microsatellite markers over the regions that
exhibited significant or suggestive linkage from the ~ 50 K SNP analysis done
previously 50. A total of thirteen regions were tested out of the fifteen
previously reported, with each region having a MOD score of at least 2.56 to
4.17 in the ~ 50 K SNP study. Unlike the previous study, the present study
focuses on assessing alleles, which co-segregate particularly with ADHD in a
Mendelian model. All 155 individuals with available DNA, both affected and
unaffected, were genotyped in the present study. The microsatellite markers
were selected from the deCODE linkage maps and the genotyping was done
with a resolution of ~ 0.5 Mb. A total of ninety-nine microsatellite markers
were tested. Numbers of markers for each of the thirteen regions tested vary
according to the size of the region. In the cases where no microsatellite
markers in the region of interest were observed in the deCODE linkage map,
self-designed microsatellite markers were used (self-designed marker primers
can be made available on request). Linear extrapolation between the two
closest flanking markers at each end with known positions was used to
Chapter 2
22
calculate the genetic position of self-designed markers. Positions of markers
are defined according to the UCSC genome bioinformatics browser, human
genome assembly March 2006.
Polymerase chain reactions (PCRs) were done using primers specific for the
deCODE markers as stated in the UniSTS platform. Primers were dye-labeled
at the 5’-end with either BMN6 or Cy5 and were ordered from Biomers (Ulm,
Germany). The PCR products were then processed in the Beckman Coulter
CEQ 8000 Genetic Analyzer with the Beckman Coulter GenomeLabTM
fragment analysis protocol. The different fragments were analyzed and
recorded using the Beckman Coulter CEQ analysis system. The fragment
information was imported into SimWalk2 62 using the EasyLinkage bundle
(version 5.02) 63 to obtain haplotype information. Following which, the
Haplopainter software (version 1.043) 64 was used to draw the haplotypes for
each of the genotyped members of the families.
Linkage analysis
Parametric multi-point linkage analysis was conducted using SimWalk2 62
under a dominant model. Such a model was used in conjunction with our
hypothesis of a Mendelian model of ADHD in some sub-branches of the multi-
generational pedigrees. The disease allele frequency was set to 0.001 and it
was assumed that there was no heterogeneity (alpha = 1.000) within an
individual family. A series of penetrance level between 80 % to 100 % was
used and those, which produced the best LOD scores, were recorded (fully
penetrant for families P1 and P3, and 0.80 for family P2). Generally, only
markers with above 0.70 heterogeneity according to the Marshfield genetic
maps 65 were used, and marker allele frequencies were estimated using all
individuals in the pedigrees. All runs were checked for non-Mendelian
genotyping errors using Merlin (version 1.1.2) 66 and markers with genotyping
errors were removed for those showing the genotyping error.
Chapter 2
23
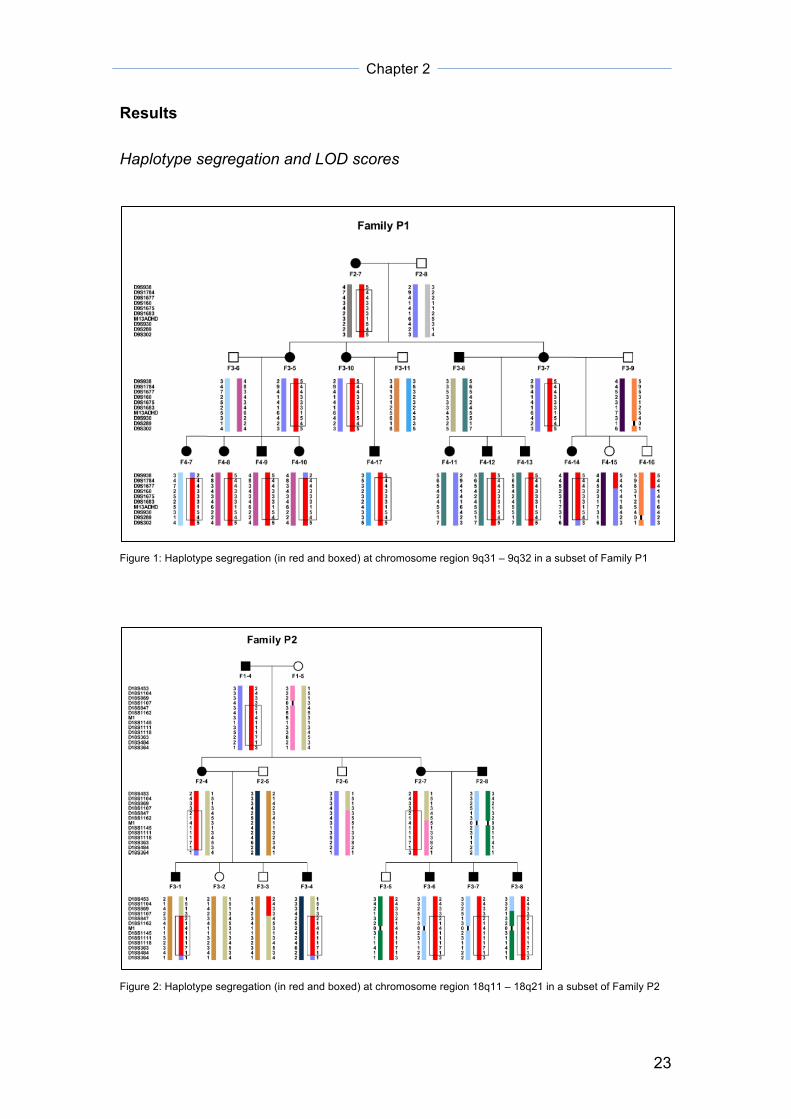
Results Haplotype segregation and LOD scores
Figure 1: Haplotype segregation (in red and boxed) at chromosome region 9q31 – 9q32 in a subset of Family P1
Figure 2: Haplotype segregation (in red and boxed) at chromosome region 18q11 – 18q21 in a subset of Family P2
Chapter 2
24
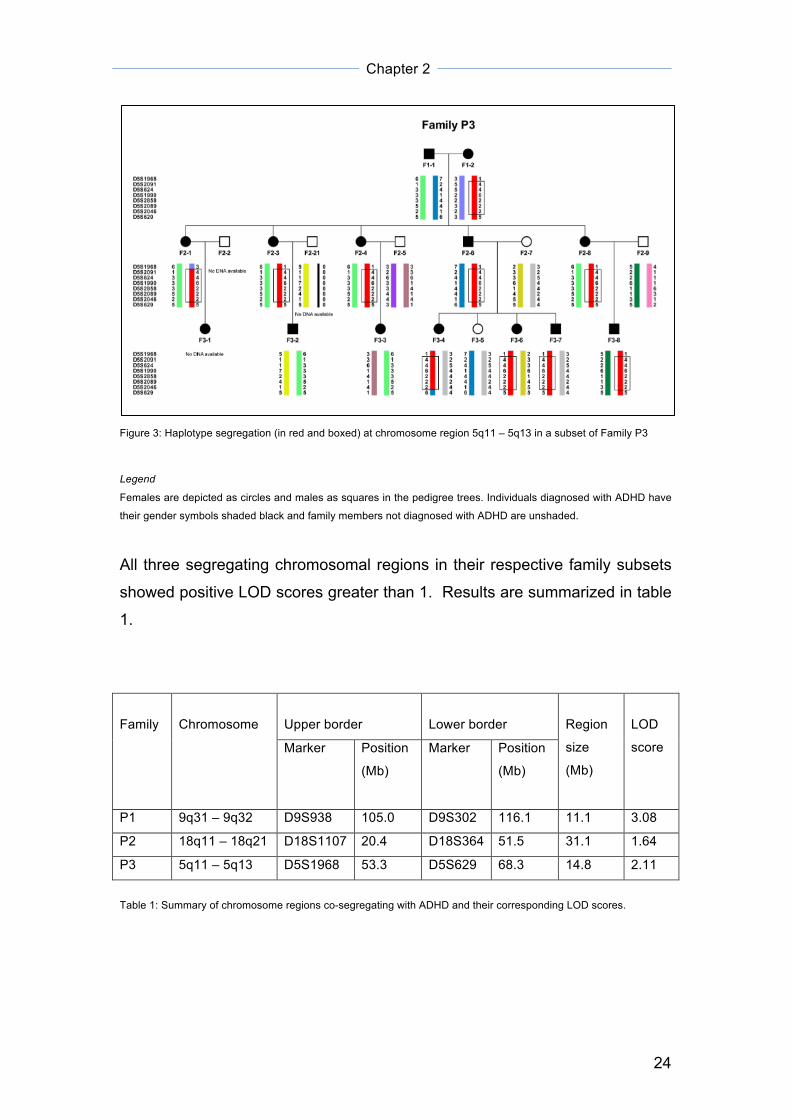
Figure 3: Haplotype segregation (in red and boxed) at chromosome region 5q11 – 5q13 in a subset of Family P3
Legend
Females are depicted as circles and males as squares in the pedigree trees. Individuals diagnosed with ADHD have
their gender symbols shaded black and family members not diagnosed with ADHD are unshaded.
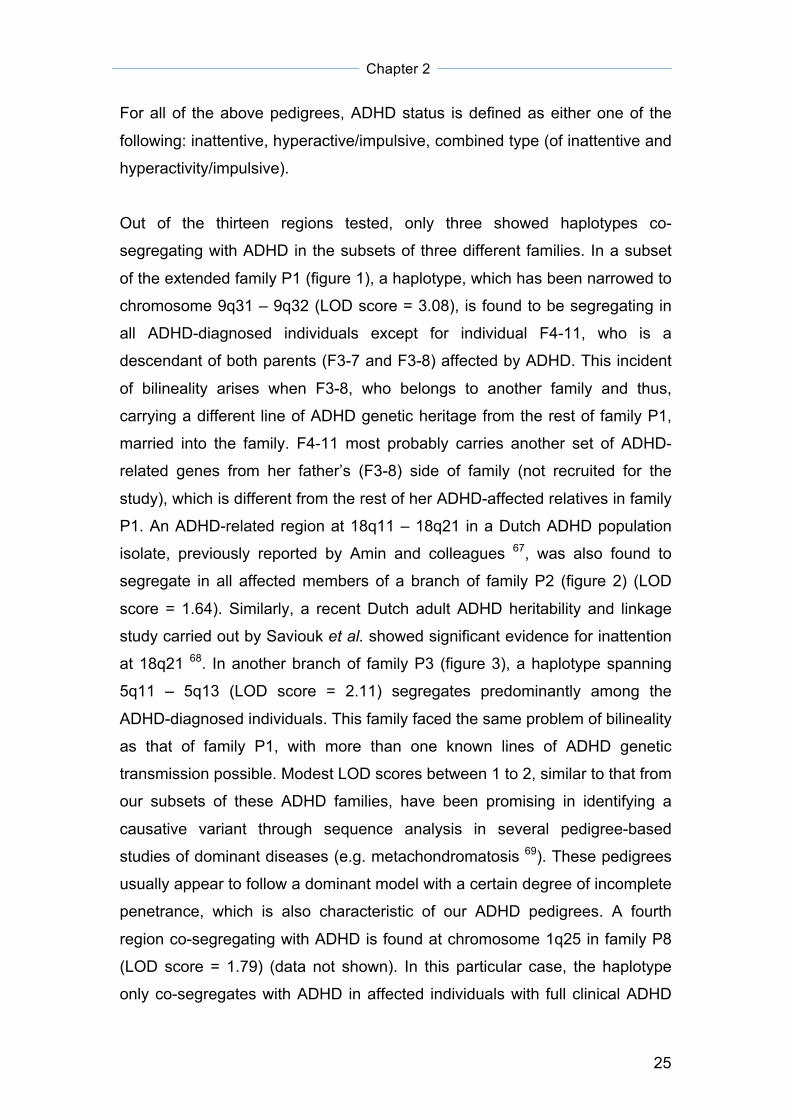
All three segregating chromosomal regions in their respective family subsets
showed positive LOD scores greater than 1. Results are summarized in table
1.
Family
Chromosome
Upper border
Lower border
Region
size
(Mb)
LOD
score Marker Position
(Mb)
Marker Position
(Mb)
P1 9q31 – 9q32 D9S938 105.0 D9S302 116.1 11.1 3.08
P2 18q11 – 18q21 D18S1107 20.4 D18S364 51.5 31.1 1.64
P3 5q11 – 5q13 D5S1968 53.3 D5S629 68.3 14.8 2.11
Table 1: Summary of chromosome regions co-segregating with ADHD and their corresponding LOD scores.
Chapter 2
25
For all of the above pedigrees, ADHD status is defined as either one of the
following: inattentive, hyperactive/impulsive, combined type (of inattentive and
hyperactivity/impulsive).
Out of the thirteen regions tested, only three showed haplotypes co-
segregating with ADHD in the subsets of three different families. In a subset
of the extended family P1 (figure 1), a haplotype, which has been narrowed to
chromosome 9q31 – 9q32 (LOD score = 3.08), is found to be segregating in
all ADHD-diagnosed individuals except for individual F4-11, who is a
descendant of both parents (F3-7 and F3-8) affected by ADHD. This incident
of bilineality arises when F3-8, who belongs to another family and thus,
carrying a different line of ADHD genetic heritage from the rest of family P1,
married into the family. F4-11 most probably carries another set of ADHD-
related genes from her father’s (F3-8) side of family (not recruited for the
study), which is different from the rest of her ADHD-affected relatives in family
P1. An ADHD-related region at 18q11 – 18q21 in a Dutch ADHD population
isolate, previously reported by Amin and colleagues 67, was also found to
segregate in all affected members of a branch of family P2 (figure 2) (LOD
score = 1.64). Similarly, a recent Dutch adult ADHD heritability and linkage
study carried out by Saviouk et al. showed significant evidence for inattention
at 18q21 68. In another branch of family P3 (figure 3), a haplotype spanning
5q11 – 5q13 (LOD score = 2.11) segregates predominantly among the
ADHD-diagnosed individuals. This family faced the same problem of bilineality
as that of family P1, with more than one known lines of ADHD genetic
transmission possible. Modest LOD scores between 1 to 2, similar to that from
our subsets of these ADHD families, have been promising in identifying a
causative variant through sequence analysis in several pedigree-based
studies of dominant diseases (e.g. metachondromatosis 69). These pedigrees
usually appear to follow a dominant model with a certain degree of incomplete
penetrance, which is also characteristic of our ADHD pedigrees. A fourth
region co-segregating with ADHD is found at chromosome 1q25 in family P8
(LOD score = 1.79) (data not shown). In this particular case, the haplotype
only co-segregates with ADHD in affected individuals with full clinical ADHD
Chapter 2
26
status but not in those who are diagnosed with subclinical ADHD. Such
difference between full clinical and subclinical groups in genetic susceptibility
to the disorder show the importance of subtyping phenotypes at the diagnostic
stage for genetic studies.
Discussion ADHD is widely believed to be a multifactorial disorder, which arises from the
overall contribution of many genes, each with a small phenotypic effect, as
well as environmental influences. Association studies are usually applied to
identify genes with small genetic influences 70 in cases like this. However,
large-scale association analyses of many different complex disorders in the
psychiatric field are difficult to replicate in independent samples. Up to now,
genome-wide association studies (GWAS) in ADHD did not yield as many
significant results across the different studies as expected 71. Additionally,
prior to association studies, various linkage analyses of relatively small sib
pair families with ADHD did not replicate as consistently as hoped, saved for
one region on chromosome 16 so far 72.
Given these inconsistencies, we have come to view the genetics of ADHD
from a different perspective – that perhaps, in large multi-generation
pedigrees, one may have a better chance to pick out single genes of large
effect. This approach has been effective for some complex common
disorders, with the classic example being the Maturity Onset Diabetes of the
Young (MODY; OMIM #606391) where pedigrees were identified among
individuals affected with type II diabetes 39. It was discovered that although
the causal genes for the different MODY families were different, they still led
to similar phenotype. From such information, the pathways leading to the
disorder was more efficiently dissected and the pathology of the disease
better understood.
Chapter 2
27
We have been fortunate to identify large pedigrees in which ADHD appears to
be segregating in a Mendelian dominant manner. As has been done in many
pedigree studies with traits believed to be the result of a single gene of large
effect, a haplotype segregation analytical approach was applied to these
ADHD families. This enabled us to uncover haplotypes that co-segregate with
ADHD, resulting in specific chromosomal regions, which are shown to be
jointly inherited by the affected members in the families. A recent copy
number variation (CNV) screening carried out in a separate study, showing
co-segregation of a duplication on chromosome 7p15 with the ADHD status in
a branch of our multi-generational ADHD family (family P3), further supports
monogenic dominant inheritance of ADHD in parts of our large pedigrees 73.
Here, we present three subsets of our initial eight large ADHD pedigrees,
which displayed haplotypes that are co-segregating predominantly among the
affected individuals. Several of these eight pedigrees contain episodes of
bilineality through assortative matings (when two affected individuals marry
and have descendants), which introduces more than one line of possible
ADHD genetic heritage. Hence, a certain branch of a large pedigree may
exhibit a particular haplotype co-segregating with ADHD but not another
branch of the same pedigree due to multiple founder ancestors who are
affected by the disorder in just one pedigree. The remaining branch of the
said pedigree will most probably have another haplotype co-segregating with
ADHD, which is not explored by the set of microsatellite markers in the
present study. Only subsets, or branches, of the extended pedigrees with
haplotype and ADHD status co-segregation were shown to avoid confusion
even though we genotyped all available family members of the whole large
pedigrees. The size of our subsets are comparable to that of a recent study of
Dutch multi-generational ADHD family by Vegt and colleagues, which
revealed similar co-segregation patterns of haplotypes with ADHD in
chromosomal regions on 7p15 and 14q11 74.
In another study, Arcos-Burgos and colleagues have also recruited ADHD
families in a large population isolate of Colombian Paisa lineage and similarly,
Chapter 2
28
carried out a fine-mapping study in an attempt to find chromosomal regions,
which co-segregate with ADHD in those families 75. They were successful with
this approach, leading to the identification of the latrophilin 3 gene (LPHN3) as
an ADHD susceptibility gene, which was statistically confirmed in an
association study in a worldwide ADHD cohort of 2627 ADHD cases and 2531
controls 76. Population isolates such as theirs have large advantages in
mapping complex traits genes due to the larger effect of genetic and
environmental homogeneity than outbred populations 77. However, in our
study, we collected ADHD families of German descent, which are not of a
population isolate and are unrelated in terms of known recent common
ancestors. Although this may give us a more representative genetic pool for
ADHD in the German population, we are limited by the usually smaller size of
the families, and more heterogeneity in the genetic make-up and
environmental factors. ADHD is also known to develop under certain
environmental conditions, and gene x environment interactions 78.
Furthermore, we cannot exclude the possibility that some of the ADHD cases,
which are present may be due to chance, given that the prevalence for the
disorder is about 5 % in the general population 44. In line with this thought, our
study design was not apt to control for possible comorbid disorders that may
segregate within the respective families as well. Still, the data garnered from
this study can bring us a little step towards comprehending the genetics of
ADHD by directing our attention on several chromosomal regions of these
families, which most probably contain ADHD-related genes, variants,
mutations or even non-coding mutations and structural variants.
Our previous 50 K SNP study reported fifteen suggestive and significant
linkage regions, most of which we were unable to replicate when we
genotyped more family members of the respective families with more densely
spaced microsatellite markers if we only accept a Mendelian co-segregation
of the haplotype with ADHD status. As there is currently no sole reigning
genetic model for ADHD, we also accept that there exist other possibilities,
aside from the Mendelian model, as observed from the discrepancies
between the non-Mendelian specified model of our previous 50 K SNP and
Chapter 2
29
the present haplotype-based study. On the other hand, familial haplotype
segregations, predominantly among the ADHD individuals in subsets of the
presented large pedigrees, point to a probable Mendelian dominant model in
these families. Using a Mendelian approach in large pedigrees for a complex
disorder like ADHD may reveal rare familial forms that can provide insight into
critical pathways that may not be previously known to be associated with
ADHD. With the availability of the next-generation sequencing technology,
whole-region sequencing is feasible in the narrowed chromosomal regions.
Genes, as well as non-coding mutations, in these regions that may be
contributing to ADHD in these families can thus be identified. Such a
Mendelian strategy in the study of complex disorders remains one of the most
powerful and successful methods to date for gaining valuable genetic and
molecular information in complex diseases such as ADHD 15.
Chapter 3
30
Chapter 3 Candidate genes within the afflicting chromosomal regions: Functional studies of a selected candidate gene, MLC1, in schizophrenic large families This chapter is presented as a manuscript entitled (accepted by Journal of
Nucleic Acids Investigation):
Unusual 5'-regulatory structure and regulation of the murine Mlc1 gene: Lack of promoter-specific functional elements Darja Henseler1, Jonathan D. Turner2, Matthias Eckhardt3, Maaike van der
Mark4, Yanina Revsin4, Michelle K. Lin1, Thorsten Kranz1, Claude Muller2 and
Jobst Meyer1
1 Department of Neurobehavioral Genetics, Institute of Psychobiology, University of Trier, Germany; 2 Institute of Immunology, Centre de Recherche Public-Santé, Laboratoire National de Santé, Luxembourg; 3 Institute of Biochemistry and Molecular Biology, University of Bonn, Germany; 4 Division of Medical Pharmacology, LACDR/LUMC, Leiden University, The Netherlands.
Chapter 3
31
Abstract The MLC1 gene is involved in an autosomal recessive neurological disorder,
megalencephalic leucoencephalopathy with subcortical cysts (MLC), which is
characterized by macrocephaly during the first year of life and swollen white
matter (leucoencephaly). Variants of MLC1 have also been associated with
psychiatric disorders such as schizophrenia, major depression and bipolar
disorder. Currently, little is known about the encoded protein (MLC1). Judging
from its similarity to other known proteins, it may serve as a trans-membrane
transporter. However, the function of the encoded protein and its gene
regulation has not been investigated successfully so far. We investigated the
5’ region of the murine Mlc1 with respect to regulatory elements for gene
expression. A promoter search and an in silico analysis were conducted.
Luciferase reporter gene constructs with potential promoter regions were
created to study promoter activity in vitro. We found two alternative first exons
for the murine Mlc1 but were not able to detect any promoter activity for the
investigated reporter gene constructs in different cell lines, thus pointing to the
presence of essential cis-acting elements far outside of the region. In silico
analysis indicated an uncommon promoter structure for Mlc1, with CCAAT-
boxes representing the only noticeable elements.
N.B. MLC1/MLC1 refers to the human gene/protein and Mlc1/Mlc1 refers to the murine gene/protein.
Chapter 3
32
Introduction Autosomal recessive mutations, either homozygous or compound
heterozygous, of MLC1 cause megalencephalic leucoencephalopathy with
subcortical cysts (MLC). This disease was first described in 1995 by van der
Knaap and colleagues as a neurological disorder characterized by
macrocephaly and leucoencephalopathy. Onset occurs during the first year of
life and subsequently leads to deterioration of motor functions and mental
decline. Magnetic resonance imaging (MRI) showed swollen white matter of
the cerebral hemisphere and subcortical cysts in the anterior-temporal and
frontoparietal regions 79. Furthermore, several reports point to an association
of MLC1 variants with several psychiatric disorders. Meyer and co-workers
described a Leu309Met mutation of MLC1, co-segregating with schizophrenia
in a large family 80. Similarly, a Leu308Gln mutation co-segregated with
bipolar disorder in a single affected family, and single nucleotide
polymorphisms of MLC1 have been associated with schizophrenia and bipolar
disorder 81. Rubie and colleagues found the Leu309Met mutation in a single
schizophrenic patient and his father 82, and Selch and co-workers confirmed
association of MLC1 polymorphisms with schizophrenia 30. Additionally,
Spijker and colleagues described a change in MLC1 gene expression level in
patients suffering from major depression 83. The MLC1 gene (OMIM *605908)
is mainly expressed in astrocytes, as well as in ependymal cells, Bergman glia
and leucocytes 84-86. In mice, Mlc1 expression has also been detected in
neurons 87. Immunostaining and electron microscopy demonstrated the
localization of Mlc1 in perivascular astrocytic end-feet and astrocyte-astrocyte
contact regions. Mlc1 is concentrated at brain barriers like pia mater and
ependymal 84,86. However, the actual function of Mlc1 is still unknown. It has
been reported that Mlc1 is a protein with most probably eight trans-membrane
domains and a marginal sequence identity to ABC2 transporters and the
potassium channel Kv1.1 80,84,88. Since most of the proteins containing eight
trans-membrane domains have transporter or channel function 84, the function
of Mlc1 as trans-membrane transport protein seems to be probable, even if no
ion transport activity could be demonstrated and no ligand of Mlc1 has been
Chapter 3
33
identified so far 80,88. The murine Mlc1 is located on chromosome 15E3. It
consists of 12 exons, whereby the translation start site (TLSS) is located in
exon 2. The gene encodes a 382 amino acid protein, which shows 87 %
sequence identity to the human protein. To date, nothing is known about the
regulation of Mlc1, however, whilst determining the genomic structure, Steinke
et al. suggested a putative promoter region. Several transcription start sites
were found in a 5’ region of approximately 70 bp, with the putative TSS being
deposited in the GenBank database under accession no. BG297871 89, in line
with the transcriptional start site provided by Ensembl version 56. In this
study, the 5’ region of Mlc1 was analyzed in more detail to achieve further
information about the structure of the regulatory region and the regulation of
Mlc1. Several putative promoter regions have been investigated by luciferase
reporter gene assays. Mlc1 was also studied with respect to four potential
alternative first exons, and in silico analyses of the upstream region of Mlc1
were conducted.
Design and methods
Expression studies
Whole brain, testis, amygdalae, hippocampi, hypothalami, cortex and
cerebella of Mus musculus domesticus Black 6 (C57BL/6) were used for
mRNA isolation. Reverse transcription into cDNA was performed with the
RevertAid First Strand cDNA Synthesis Kit (Fermentas) using oligodT-
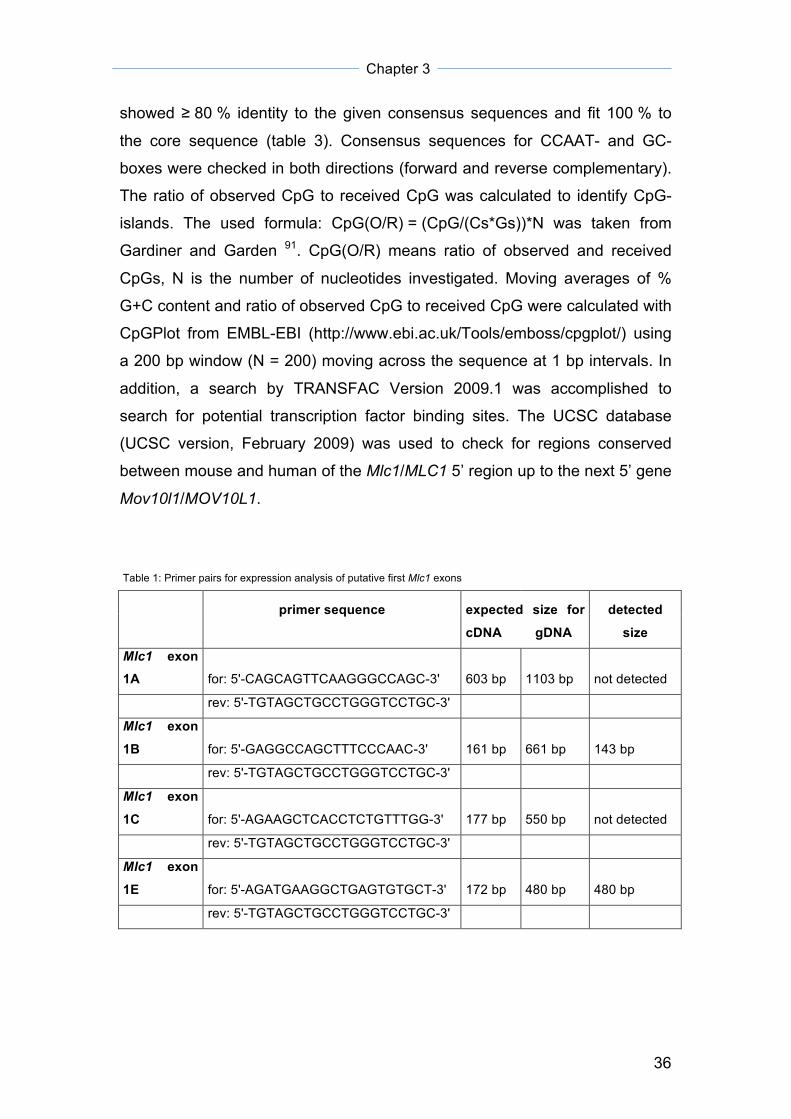
primers. Primers used for expression analysis of the alternative first Mlc1
exons are shown in table 1. Primers were optimized on genomic DNA. The
PCR for Mlc1 exon1A was performed using 10 pmol of each primer, 200 µM
dNTPs, 2.0 mM MgCl2, 50 mM KCl, 10 mM TrisHCl (pH 8.3), 0.0025 mg/ml
BSA, 0.025 % Tween20 and 1 U Taq-Polymerase. PCR for Mlc1 exon1B,
exon1C and exon1E were performed using 10 pmol of each primer, 200 µM
dNTPs, 1.5 mM MgCl2, 50 mM KCl, 10 mM TrisHCl (pH 8.3), 0.0025 mg/ml
BSA, 0.025 % Tween20 and 1 U Taq-Polymerase. The following thermocycler
protocol was used: initial denaturation step (4 min, 94 °C), followed by 39
Chapter 3
34
cycles of denaturation (30 sec, 94 °C), annealing (30 sec at appropriate
temperature) and extension (30 - 60 sec, 72 °C), ending with a final extension
(10 min, 72 °C) and cooling down to 4°C. PCR for Mlc1 expression was
conducted with an annealing temperature of 63 °C. Purity of cDNA was
controlled by taking intron spanning Beta-actin (ActB) primers (for: 5’-
AGGCTGTGCTGTCCCTGTAT-3’; rev: 5’-GTTTGCTCCAACCAACTGCT-3’)
using an annealing temperature of 60 °C. Primers for detection of Pomp
pseudogene expression (for: 5’-GGCTGTGCTAGAGGTCCTTG-3’; rev: 5’-
AGAGCTCCGCAACTGGAATA-3’) worked at an annealing temperature of
57 °C.
Assembly of luciferase reporter gene constructs
Reporter gene constructs were assembled by cloning putative promoter
sequences into the pGL3-Basic vector (Promega). The putative promoter
sequences were originated from the 5’ region of Mlc1 (ENSMUSG
00000035805; Ensembl version 56) and amplified by PCR. High Fidelity Taq
Polymerase from Fermentas was used for amplification. The primers used
contained MluI- and XhoI-specific restriction sites for subsequent cloning into
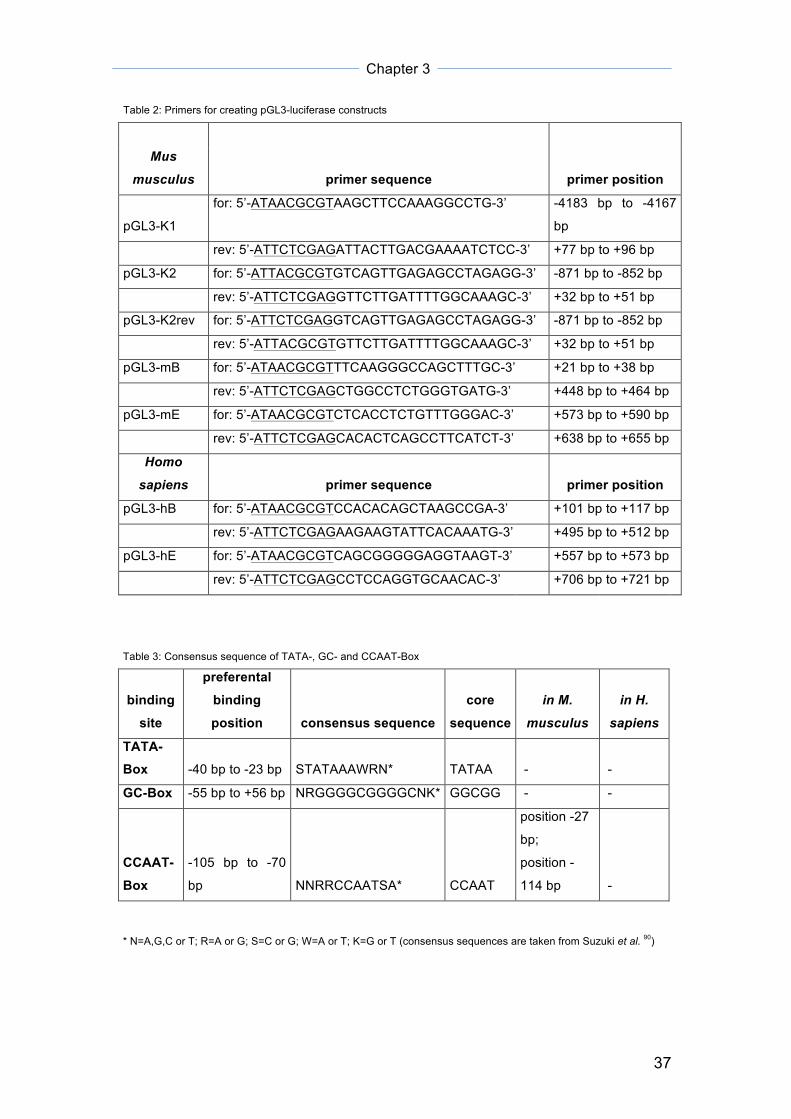
the pGL3-Basic vector. Primer sequences, sizes and positions of the
investigated putative promoter sequences are shown in table 2. Restriction
sites and nucleotide overhang of 3 bp, which were used for a better restriction
efficiency, are underlined.
Cell culture
Experiments were performed in two Mlc1-expressing cell types, U373 MG
glioblastoma-astrocytoma cells (ECACC 89081403), and a murine astrocyte
cell line generated by transfecting primary astrocytes with an expression
plasmid encoding the SV40 large T-antigen. Both cell types were grown in D-
MEM High Glucose, supplemented with 10 % fetal calf serum (FCS), 2 mM L-
glutamine and 1 % penicillin/streptomycin (Pen/Strep) at 37 °C in a humidified
atmosphere of 5 % CO2. Cells were passaged at around 80 % confluency.
Chapter 3
35
Transfection and stimulation
Cells were seeded at a density of 8 x 10⁴ cells/ml in 24-well plates 24 hours
prior to transfection. Transfection was done with Superfect (Qiagen) in a v/w
ration of 10:1 (µl Superfect: µg DNA). 1 µg DNA contained 0.96 µg pGL3-
luciferase constructs and 0.04 µg pGL4-74 (HRLUC/TK, Renilla luciferase;
Promega). After 24 hours of incubation, cells were treated with one of the
following: 50 µM dexamethasone, 50 µM Forskolin (For), 2 µM phorbol 12-
myristate acetate for 24 hours, or with lipopolysaccharide (LPS) for
30 minutes.
Luciferase Assay
Cells were harvested in 50 µl Passive Lysis Buffer (PLB; Promega) 48 hours
after transfection. Firefly and Renilla luciferase activities were measured
sequentially with 10 µl of total cell lysates and 50 µl of luciferase assay
reagent (LAR), followed by the addition of 50 µl of Stop & Glo reagent. The
activity was determined by luminescence measurement for 10 sec in a liquid
scintillation spectrophotometer (Berthold). The luminescence was given in
Relative Light Units (RLU). Experiments were done in triplicates or
quadruplicates from three independent trials. Promoter activities are given as
ratio of firefly luciferase activity (RLU) divided by the activity of Renilla
luciferase (RLU). While the firely luciferase activity indicates promoter activity,
activity of Renilla luciferase is used as a control for transfection efficiency.
In silico analysis
PROSCAN Version 1.7 (http://www-bimas.cit.nih.gov/molbio/proscan/) was
used for in silico analysis of the 5’ region of Mlc1. Further in silico analysis
was conducted for the region between 350 bp upstream of the first exon of
Mlc1 released in the ensembl database and the beginning of the TLSS in
exon 2. Search for common promoter elements like TATA-, CCAAT- and GC-
boxes was done according to the consensus sequences described by Suzuki
and colleagues 90. Sequences were considered as binding sites if they
Chapter 3
36
showed ≥ 80 % identity to the given consensus sequences and fit 100 % to
the core sequence (table 3). Consensus sequences for CCAAT- and GC-
boxes were checked in both directions (forward and reverse complementary).
The ratio of observed CpG to received CpG was calculated to identify CpG-
islands. The used formula: CpG(O/R) = (CpG/(Cs*Gs))*N was taken from
Gardiner and Garden 91. CpG(O/R) means ratio of observed and received
CpGs, N is the number of nucleotides investigated. Moving averages of %
G+C content and ratio of observed CpG to received CpG were calculated with
CpGPlot from EMBL-EBI (http://www.ebi.ac.uk/Tools/emboss/cpgplot/) using
a 200 bp window (N = 200) moving across the sequence at 1 bp intervals. In
addition, a search by TRANSFAC Version 2009.1 was accomplished to
search for potential transcription factor binding sites. The UCSC database
(UCSC version, February 2009) was used to check for regions conserved
between mouse and human of the Mlc1/MLC1 5’ region up to the next 5’ gene
Mov10l1/MOV10L1.
Table 1: Primer pairs for expression analysis of putative first Mlc1 exons
primer sequence
expected size for
cDNA gDNA
detected
size
Mlc1 exon 1A for: 5'-CAGCAGTTCAAGGGCCAGC-3' 603 bp 1103 bp not detected
rev: 5'-TGTAGCTGCCTGGGTCCTGC-3'
Mlc1 exon
1B for: 5'-GAGGCCAGCTTTCCCAAC-3' 161 bp 661 bp 143 bp
rev: 5'-TGTAGCTGCCTGGGTCCTGC-3'
Mlc1 exon
1C for: 5'-AGAAGCTCACCTCTGTTTGG-3' 177 bp 550 bp not detected
rev: 5'-TGTAGCTGCCTGGGTCCTGC-3'
Mlc1 exon
1E for: 5'-AGATGAAGGCTGAGTGTGCT-3' 172 bp 480 bp 480 bp
rev: 5'-TGTAGCTGCCTGGGTCCTGC-3'
Chapter 3
37
Table 2: Primers for creating pGL3-luciferase constructs
primer sequence
Mus
musculus primer position
pGL3-K1
for: 5’-ATAACGCGTAAGCTTCCAAAGGCCTG-3’ -4183 bp to -4167
bp
rev: 5’-ATTCTCGAGATTACTTGACGAAAATCTCC-3’ +77 bp to +96 bp
pGL3-K2 for: 5’-ATTACGCGTGTCAGTTGAGAGCCTAGAGG-3’ -871 bp to -852 bp
rev: 5’-ATTCTCGAGGTTCTTGATTTTGGCAAAGC-3’ +32 bp to +51 bp
pGL3-K2rev for: 5’-ATTCTCGAGGTCAGTTGAGAGCCTAGAGG-3’ -871 bp to -852 bp
rev: 5’-ATTACGCGTGTTCTTGATTTTGGCAAAGC-3’ +32 bp to +51 bp
pGL3-mB for: 5’-ATAACGCGTTTCAAGGGCCAGCTTTGC-3’ +21 bp to +38 bp
rev: 5’-ATTCTCGAGCTGGCCTCTGGGTGATG-3’ +448 bp to +464 bp
pGL3-mE for: 5’-ATAACGCGTCTCACCTCTGTTTGGGAC-3’ +573 bp to +590 bp
rev: 5’-ATTCTCGAGCACACTCAGCCTTCATCT-3’ +638 bp to +655 bp
Homo
sapiens primer sequence primer position
pGL3-hB for: 5’-ATAACGCGTCCACACAGCTAAGCCGA-3’ +101 bp to +117 bp
rev: 5’-ATTCTCGAGAAGAAGTATTCACAAATG-3’ +495 bp to +512 bp
pGL3-hE for: 5’-ATAACGCGTCAGCGGGGGAGGTAAGT-3’ +557 bp to +573 bp
rev: 5’-ATTCTCGAGCCTCCAGGTGCAACAC-3’ +706 bp to +721 bp
Table 3: Consensus sequence of TATA-, GC- and CCAAT-Box
binding
site
preferental
binding
position consensus sequence
core
sequence
in M.
musculus
in H.
sapiens
TATA-Box -40 bp to -23 bp STATAAAWRN* TATAA - -
GC-Box -55 bp to +56 bp NRGGGGCGGGGCNK* GGCGG - -
CCAAT-
Box
-105 bp to -70
bp NNRRCCAATSA* CCAAT
position -27
bp;
position -
114 bp -
* N=A,G,C or T; R=A or G; S=C or G; W=A or T; K=G or T (consensus sequences are taken from Suzuki et al. 90)
Chapter 3
38
Results Structural characterization of the 5’ region of Mlc1
As a first step to find any regulatory regions for Mlc1, an analysis with the
promoter search PROSCAN Version 1.7 software was conducted. The closest
putative promoter predicted by PROSCAN was located 4.3 kb upstream of
Mlc1. Interestingly, this predicted promoter region of 345 bp seemed to work
in a bi-directional modus. The sequence is flanked by Mov10l1, the adjacent
annotated gene on the opposite strand with respect to Mlc1, and BB614475,
located on the same strand as Mlc1. A database search for ESTs between
Mov10l1 and Mlc1 provided two sequences, GenBank accession numbers
BB614475 and AV253704, both being located on the same strand as Mlc1
and part of the same cDNA clone (clone ID: 921504G13) (figure 1A). The
expressed sequence of clone ID: 921504G13 AV253704 has already been
reported by Steinke and colleagues 89. They described a high sequence
similarity to the Homo sapiens voltage-gated K channel beta subunit 4.1
mRNA (Hspc014), which is officially named proteasome maturation protein
gene (Pomp). Additionally, they described an Alu-J-like element being located
between AV253704 and Mlc1 (figure 1). As the expression of BB614475 and
AV253704 were known for testis (according to the RIKEN gene bank entry),
we wanted to test whether 1) the whole sequence between BB614475 and
AV253704 is transcribed; and 2) BB614475 and AV253704 were also
expressed in the murine brain. Therefore, PCRs with murine testis and murine
brain cDNA were conducted. The forward primer was located in BB614475
and the reverse primer in AV253704. The result showed that there is no
expression in murine brain. For murine testis, the result showed one small
PCR product of ~700 bp and one larger of 2015 bp. Direct sequencing of the
smaller amplicon revealed two different splice variants of the Pomp
pseudogene, showing the same size of 675 bp. Splicing occurred at repetitive
sequences; therefore, it is not possible to provide the exact splicing positions.
Sequencing of the 2015 bp amplicon confirmed the expected size and
sequence of the murine genomic DNA. The last 707 bp of the larger amplicon
show a 87 % identity to Pomp, but there was no similarity for the first 1308 bp.
Chapter 3
39
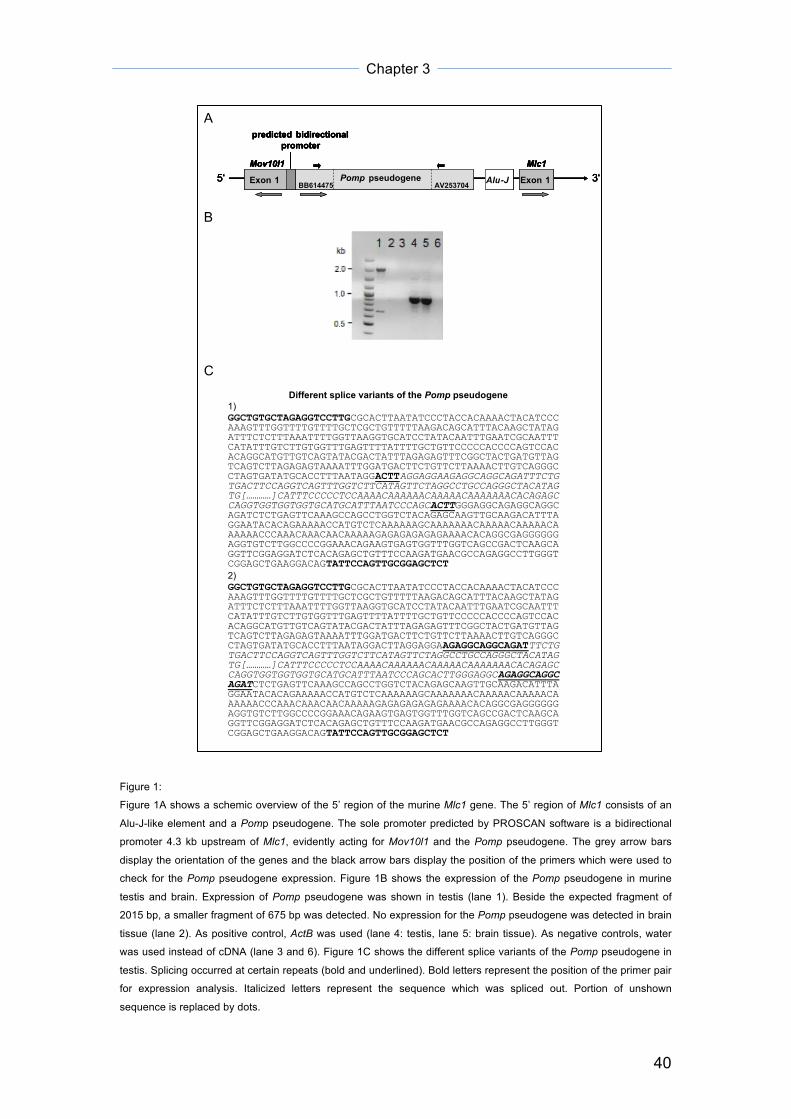
Due to the partial similarity to Pomp, we have consequently termed this the
Pomp pseudogene. As far as a contamination of the PCR with gDNA could be
excluded, this experiment showed that there are at least three different Pomp
mRNAs transcribed. Expression levels and sequences of the Pomp
pseudogene splice variants are shown in figures 1B + 1C. Even if the Pomp
pseudogene may have no influence on Mlc1 expression, as it is not
expressed in brain, this transcript seems to be an interesting finding because
of its unconventional splicing.
Chapter 3
40
Figure 1:
Figure 1A shows a schemic overview of the 5’ region of the murine Mlc1 gene. The 5’ region of Mlc1 consists of an
Alu-J-like element and a Pomp pseudogene. The sole promoter predicted by PROSCAN software is a bidirectional
promoter 4.3 kb upstream of Mlc1, evidently acting for Mov10l1 and the Pomp pseudogene. The grey arrow bars
display the orientation of the genes and the black arrow bars display the position of the primers which were used to
check for the Pomp pseudogene expression. Figure 1B shows the expression of the Pomp pseudogene in murine
testis and brain. Expression of Pomp pseudogene was shown in testis (lane 1). Beside the expected fragment of
2015 bp, a smaller fragment of 675 bp was detected. No expression for the Pomp pseudogene was detected in brain
tissue (lane 2). As positive control, ActB was used (lane 4: testis, lane 5: brain tissue). As negative controls, water
was used instead of cDNA (lane 3 and 6). Figure 1C shows the different splice variants of the Pomp pseudogene in
testis. Splicing occurred at certain repeats (bold and underlined). Bold letters represent the position of the primer pair
for expression analysis. Italicized letters represent the sequence which was spliced out. Portion of unshown
sequence is replaced by dots.
Different splice variants of the Pomp pseudogene1)GGCTGTGCTAGAGGTCCTTGCGCACTTAATATCCCTACCACAAAACTACATCCCAAAGTTTGGTTTTGTTTTGCTCGCTGTTTTTAAGACAGCATTTACAAGCTATAGATTTCTCTTTAAATTTTGGTTAAGGTGCATCCTATACAATTTGAATCGCAATTTCATATTTGTCTTGTGGTTTGAGTTTTATTTTGCTGTTCCCCCACCCCAGTCCACACAGGCATGTTGTCAGTATACGACTATTTAGAGAGTTTCGGCTACTGATGTTAGTCAGTCTTAGAGAGTAAAATTTGGATGACTTCTGTTCTTAAAACTTGTCAGGGCCTAGTGATATGCACCTTTAATAGGACTTAGGAGGAAGAGGCAGGCAGATTTCTGTGACTTCCAGGTCAGTTTGGTCTTCATAGTTCTAGGCCTGCCAGGGCTACATAGTG[…………]CATTTCCCCCTCCAAAACAAAAAACAAAAACAAAAAAACACAGAGCCAGGTGGTGGTGGTGCATGCATTTAATCCCAGCACTTGGGAGGCAGAGGCAGGCAGATCTCTGAGTTCAAAGCCAGCCTGGTCTACAGAGCAAGTTGCAAGACATTTAGGAATACACAGAAAAACCATGTCTCAAAAAAGCAAAAAAACAAAAACAAAAACAAAAAACCCAAACAAACAACAAAAAGAGAGAGAGAGAAAACACAGGCGAGGGGGGAGGTGTCTTGGCCCCGGAAACAGAAGTGAGTGGTTTGGTCAGCCGACTCAAGCAGGTTCGGAGGATCTCACAGAGCTGTTTCCAAGATGAACGCCAGAGGCCTTGGGTCGGAGCTGAAGGACAGTATTCCAGTTGCGGAGCTCT2)GGCTGTGCTAGAGGTCCTTGCGCACTTAATATCCCTACCACAAAACTACATCCCAAAGTTTGGTTTTGTTTTGCTCGCTGTTTTTAAGACAGCATTTACAAGCTATAGATTTCTCTTTAAATTTTGGTTAAGGTGCATCCTATACAATTTGAATCGCAATTTCATATTTGTCTTGTGGTTTGAGTTTTATTTTGCTGTTCCCCCACCCCAGTCCACACAGGCATGTTGTCAGTATACGACTATTTAGAGAGTTTCGGCTACTGATGTTAGTCAGTCTTAGAGAGTAAAATTTGGATGACTTCTGTTCTTAAAACTTGTCAGGGCCTAGTGATATGCACCTTTAATAGGACTTAGGAGGAAGAGGCAGGCAGATTTCTGTGACTTCCAGGTCAGTTTGGTCTTCATAGTTCTAGGCCTGCCAGGGCTACATAGTG[…………]CATTTCCCCCTCCAAAACAAAAAACAAAAACAAAAAAACACAGAGCCAGGTGGTGGTGGTGCATGCATTTAATCCCAGCACTTGGGAGGCAGAGGCAGGCAGATCTCTGAGTTCAAAGCCAGCCTGGTCTACAGAGCAAGTTGCAAGACATTTAGGAATACACAGAAAAACCATGTCTCAAAAAAGCAAAAAAACAAAAACAAAAACAAAAAACCCAAACAAACAACAAAAAGAGAGAGAGAGAAAACACAGGCGAGGGGGGAGGTGTCTTGGCCCCGGAAACAGAAGTGAGTGGTTTGGTCAGCCGACTCAAGCAGGTTCGGAGGATCTCACAGAGCTGTTTCCAAGATGAACGCCAGAGGCCTTGGGTCGGAGCTGAAGGACAGTATTCCAGTTGCGGAGCTCT
A
B
C
5‘ Pomp -pseudogeneMlc1Mov10l1
Alu-J
predicted bidirectionalpromoter
3‘Exon 1 Exon 1BB614475 AV2537045‘ Pomp pseudogene
Mlc1Mov10l1
Alu-J
predicted bidirectionalpromoter
3‘Exon 1 Exon 1BB614475 AV2537045‘ Pomp -pseudogene
Mlc1Mov10l1
Alu-J
predicted bidirectionalpromoter
3‘Exon 1 Exon 1BB614475 AV2537045‘ Pomp pseudogene
Mlc1Mov10l1
Alu-J
predicted bidirectionalpromoter
3‘Exon 1 Exon 1BB614475 AV253704
Chapter 3
41
Expression studies
For the human MLC1, several alternative first exons are known, which are
described in the database of transcriptional start sites (DBTSS). To
investigate if alternative first exons of Mlc1 in mice exist, we compared the
sequence of the human MLC1 first exons with the orthologous murine Mlc1
sequence. Several MLC1 first exons were released in the DBTSS, but only
first exons with common acceptor- and donor-sites (GT/AG) were examined
for sequence similarity to the murine Mlc1 in the present study. Sequences of
the first exons fulfilling this condition (exon 1A, exon 1B, exon 1C and
exon 1E) were used for alignments with the orthologous murine sequence.
Sequence identity varied from 47.8 % (exon 1E) to 76.7 % (exon 1B). To test
the expression of the alternative first exons in mice, PCRs with cDNA from
different murine brain regions and a murine astrocyte cell line were
conducted. For this, the forward primer was located in the orthologous first
exon sequence and the reverse primer was located in exon 2, downstream of
the translation start site (TLSS). Used primers and expected amplicon sizes
are shown in table 1. Expression was detected for Mlc1 exon 1B and exon 1E
only (figures 2A + 2B). Real time PCR experiments were conducted to
compare the expression rate of both exons. The experiment failed to quantify
the expression rate of exon1E, so no conclusion of the relationship between
expression of exon1B and exon1E can be drawn. Expression for both first
exons could be detected in amygdala, hippocampus, hypothalamus,
cerebellum, cortex and the murine astrocyte cell line. Sequencing of exon 1B
resulted in a 143 bp sequence with a splice position at +492 bp/+1010 bp.
This diverged from the data provided by Ensembl, where the exon 2 of Mlc1
starts at position +993 bp. All positions are according to the Mlc1 exon 1
released in the Ensembl database version 56 (ENSMUSG 00000035805),
where +1 is representing the transcriptional start site of exon 1. The murine
exon 1E showed a size of 480 bp, which was assumed to be the identical size
of the related genomic DNA sequence. The sequencing of exon 1E confirmed
this assumption as the same sequence as the genomic DNA is shown.
Sequencing data are available on request.
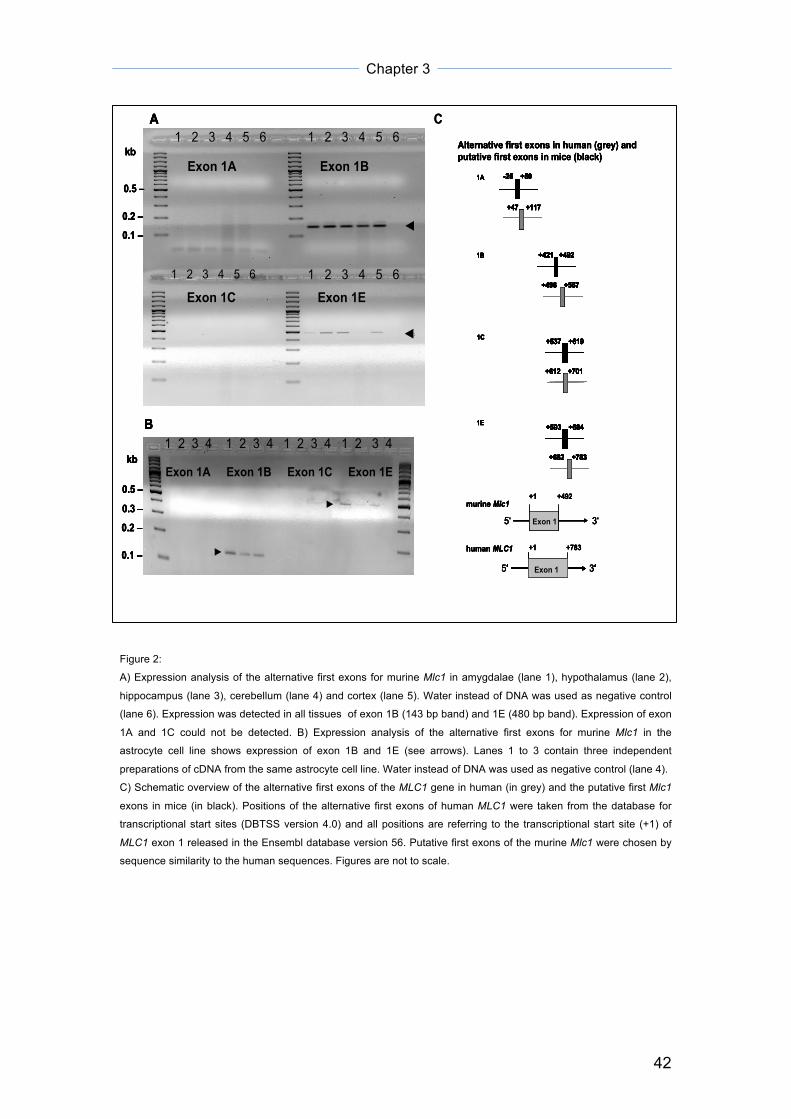
Chapter 3
42
Figure 2:
A) Expression analysis of the alternative first exons for murine Mlc1 in amygdalae (lane 1), hypothalamus (lane 2),
hippocampus (lane 3), cerebellum (lane 4) and cortex (lane 5). Water instead of DNA was used as negative control
(lane 6). Expression was detected in all tissues of exon 1B (143 bp band) and 1E (480 bp band). Expression of exon
1A and 1C could not be detected. B) Expression analysis of the alternative first exons for murine Mlc1 in the
astrocyte cell line shows expression of exon 1B and 1E (see arrows). Lanes 1 to 3 contain three independent
preparations of cDNA from the same astrocyte cell line. Water instead of DNA was used as negative control (lane 4).
C) Schematic overview of the alternative first exons of the MLC1 gene in human (in grey) and the putative first Mlc1
exons in mice (in black). Positions of the alternative first exons of human MLC1 were taken from the database for
transcriptional start sites (DBTSS version 4.0) and all positions are referring to the transcriptional start site (+1) of
MLC1 exon 1 released in the Ensembl database version 56. Putative first exons of the murine Mlc1 were chosen by
sequence similarity to the human sequences. Figures are not to scale.
Exon 1A Exon 1B
Exon 1C Exon 1E
kb
0.5 –
0.2 –
0.1 –
►
►
1 2 3 4 5 61 2 3 4 5 6
1 2 3 4 5 61 2 3 4 5 6
kb
0.5 –
0.3 –
0.2 –
0.1 –
1 2 3 4 1 2 3 4 1 2 3 4 1 2 3 4
Exon 1A Exon 1B Exon 1C Exon 1E
►
►
A
B
Exon 1A Exon 1B
Exon 1C Exon 1E
kb
0.5 –
0.2 –
0.1 –
►
►
1 2 3 4 5 61 2 3 4 5 6
1 2 3 4 5 61 2 3 4 5 6
kb
0.5 –
0.3 –
0.2 –
0.1 –
1 2 3 4 1 2 3 4 1 2 3 4 1 2 3 4
Exon 1A Exon 1B Exon 1C Exon 1E
►
►
A
B
C
Alternative first exons in human (grey) and putative first exons in mice (black)
1B +421 +492
+496 +567
1A -25 +50
+47 +117
1C +537 +619
+612 +701
1E +593 +684
+682 +783
3‘Exon 15‘ ‘Exon 1‘ ‘Exon 1‘
+1 +783
+1 +492
Exon 1 3‘Exon 15‘
murine Mlc1
human MLC1
Alternative first exons in human (grey) and putative first exons in mice (black)
1B +421 +492
+496 +567
1B +421 +492
+496 +567
+421 +492+421 +492
+496 +567+496 +567
1A -25 +50
+47 +117
1A -25 +50
+47 +117
-25 +50-25 +50
+47 +117+47 +117
1C +537 +619
+612 +701
1C +537 +619
+612 +701
+537 +619+537 +619+537 +619
+612 +701+612 +701
1E +593 +684
+682 +783
1E +593 +684
+682 +783
+593 +684+593 +684
+682 +783+682 +783
3‘Exon 15‘ ‘Exon 1‘ ‘Exon 1‘
+1 +783
+1 +492
Exon 1 3‘Exon 15‘
murine Mlc1
human MLC1
Exon 1A Exon 1B
Exon 1C Exon 1E
kb
0.5 –
0.2 –
0.1 –
►
►
1 2 3 4 5 61 2 3 4 5 6
1 2 3 4 5 61 2 3 4 5 6
kb
0.5 –
0.3 –
0.2 –
0.1 –
1 2 3 4 1 2 3 4 1 2 3 4 1 2 3 4
Exon 1A Exon 1B Exon 1C Exon 1E
►
►
A
B
Exon 1A Exon 1B
Exon 1C Exon 1E
kb
0.5 –
0.2 –
0.1 –
►
►
1 2 3 4 5 61 2 3 4 5 6
1 2 3 4 5 61 2 3 4 5 6
kb
0.5 –
0.3 –
0.2 –
0.1 –
1 2 3 4 1 2 3 4 1 2 3 4 1 2 3 4
Exon 1A Exon 1B Exon 1C Exon 1E
►
►
A
B
C
Alternative first exons in human (grey) and putative first exons in mice (black)
1B +421 +492
+496 +567
1A -25 +50
+47 +117
1C +537 +619
+612 +701
1E +593 +684
+682 +783
3‘Exon 15‘ ‘Exon 1‘ ‘Exon 1‘
+1 +783
+1 +492
Exon 1 3‘Exon 15‘
murine Mlc1
human MLC1
Alternative first exons in human (grey) and putative first exons in mice (black)
1B +421 +492
+496 +567
1B +421 +492
+496 +567
+421 +492+421 +492
+496 +567+496 +567
1A -25 +50
+47 +117
1A -25 +50
+47 +117
-25 +50-25 +50
+47 +117+47 +117
1C +537 +619
+612 +701
1C +537 +619
+612 +701
+537 +619+537 +619+537 +619
+612 +701+612 +701
1E +593 +684
+682 +783
1E +593 +684
+682 +783
+593 +684+593 +684
+682 +783+682 +783
3‘Exon 15‘ ‘Exon 1‘ ‘Exon 1‘
+1 +783
+1 +492
Exon 1 3‘Exon 15‘
murine Mlc1
human MLC1
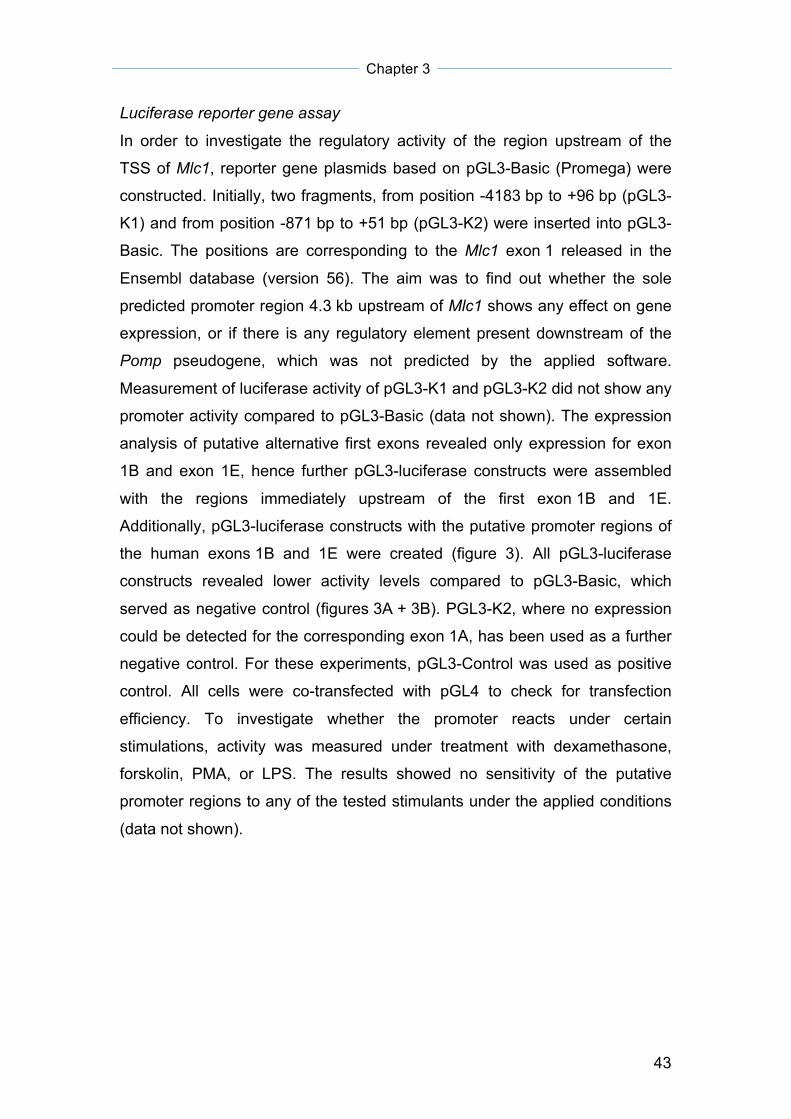
Chapter 3
43
Luciferase reporter gene assay
In order to investigate the regulatory activity of the region upstream of the
TSS of Mlc1, reporter gene plasmids based on pGL3-Basic (Promega) were
constructed. Initially, two fragments, from position -4183 bp to +96 bp (pGL3-
K1) and from position -871 bp to +51 bp (pGL3-K2) were inserted into pGL3-
Basic. The positions are corresponding to the Mlc1 exon 1 released in the
Ensembl database (version 56). The aim was to find out whether the sole
predicted promoter region 4.3 kb upstream of Mlc1 shows any effect on gene
expression, or if there is any regulatory element present downstream of the
Pomp pseudogene, which was not predicted by the applied software.
Measurement of luciferase activity of pGL3-K1 and pGL3-K2 did not show any
promoter activity compared to pGL3-Basic (data not shown). The expression
analysis of putative alternative first exons revealed only expression for exon
1B and exon 1E, hence further pGL3-luciferase constructs were assembled
with the regions immediately upstream of the first exon 1B and 1E.
Additionally, pGL3-luciferase constructs with the putative promoter regions of
the human exons 1B and 1E were created (figure 3). All pGL3-luciferase
constructs revealed lower activity levels compared to pGL3-Basic, which
served as negative control (figures 3A + 3B). PGL3-K2, where no expression
could be detected for the corresponding exon 1A, has been used as a further
negative control. For these experiments, pGL3-Control was used as positive
control. All cells were co-transfected with pGL4 to check for transfection
efficiency. To investigate whether the promoter reacts under certain
stimulations, activity was measured under treatment with dexamethasone,
forskolin, PMA, or LPS. The results showed no sensitivity of the putative
promoter regions to any of the tested stimulants under the applied conditions
(data not shown).
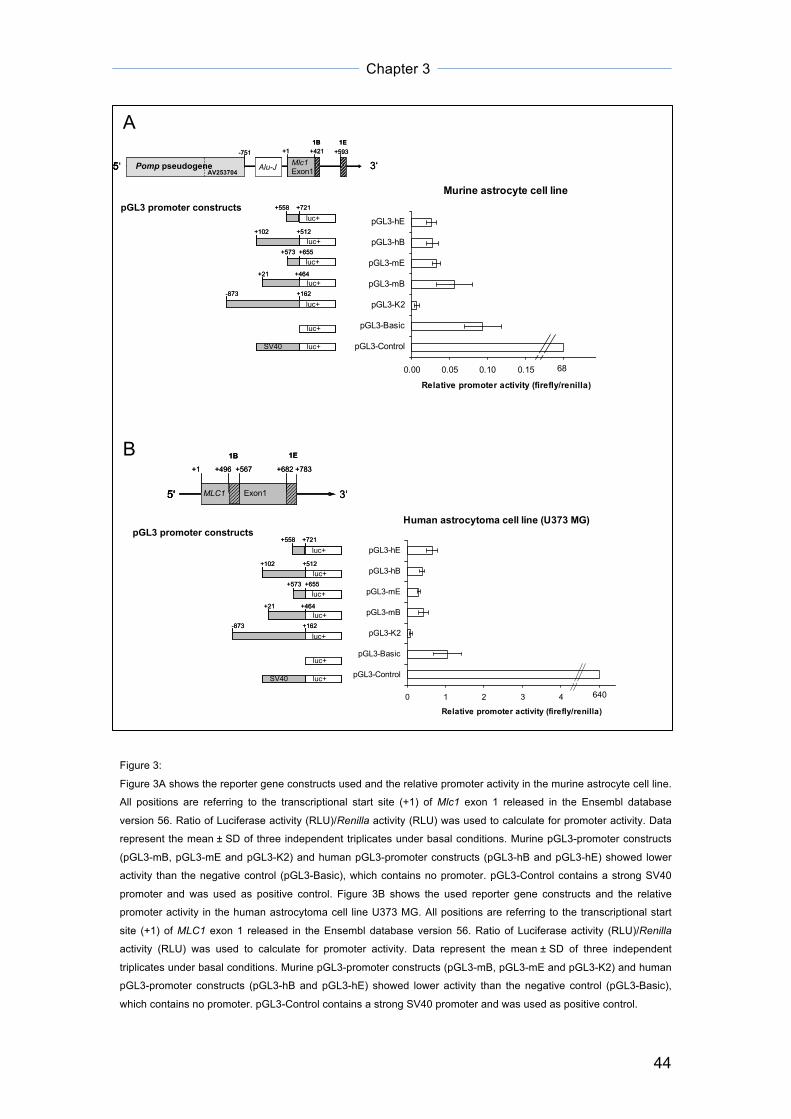
Chapter 3
44
Figure 3:
Figure 3A shows the reporter gene constructs used and the relative promoter activity in the murine astrocyte cell line.
All positions are referring to the transcriptional start site (+1) of Mlc1 exon 1 released in the Ensembl database
version 56. Ratio of Luciferase activity (RLU)/Renilla activity (RLU) was used to calculate for promoter activity. Data
represent the mean ± SD of three independent triplicates under basal conditions. Murine pGL3-promoter constructs
(pGL3-mB, pGL3-mE and pGL3-K2) and human pGL3-promoter constructs (pGL3-hB and pGL3-hE) showed lower
activity than the negative control (pGL3-Basic), which contains no promoter. pGL3-Control contains a strong SV40
promoter and was used as positive control. Figure 3B shows the used reporter gene constructs and the relative
promoter activity in the human astrocytoma cell line U373 MG. All positions are referring to the transcriptional start
site (+1) of MLC1 exon 1 released in the Ensembl database version 56. Ratio of Luciferase activity (RLU)/Renilla
activity (RLU) was used to calculate for promoter activity. Data represent the mean ± SD of three independent
triplicates under basal conditions. Murine pGL3-promoter constructs (pGL3-mB, pGL3-mE and pGL3-K2) and human
pGL3-promoter constructs (pGL3-hB and pGL3-hE) showed lower activity than the negative control (pGL3-Basic),
which contains no promoter. pGL3-Control contains a strong SV40 promoter and was used as positive control.
Human astrocytoma cell line (U373 MG)
0 1 2 3 4 5 6
pGL3-Control
pGL3-Basic
pGL3-K2
pGL3-mB
pGL3-mE
pGL3-hB
pGL3-hE
Relative promoter activity (firefly/renilla)
640
Human astrocytoma cell line (U373 MG)
0 1 2 3 4 5 6
pGL3-Control
pGL3-Basic
pGL3-K2
pGL3-mB
pGL3-mE
pGL3-hB
pGL3-hE
Relative promoter activity (firefly/renilla)
640
A
B
Murine astrocyte cell line
0.00 0.05 0.10 0.15 0.20 0.25
pGL3-Control
pGL3-Basic
pGL3-K2
pGL3-mB
pGL3-mE
pGL3-hB
pGL3-hE
Relative promoter activity (firefly/renilla)
68
Murine astrocyte cell line
0.00 0.05 0.10 0.15 0.20 0.25
pGL3-Control
pGL3-Basic
pGL3-K2
pGL3-mB
pGL3-mE
pGL3-hB
pGL3-hE
Relative promoter activity (firefly/renilla)
68
pGL3 promoter constructs
pGL3 promoter constructs
luc++102 +512
luc+SV40
+558 +721
luc+
luc+
+573 +655luc+
+21 +464luc+
-873 +162
luc+
luc++102 +512
luc+SV40
+558 +721
luc+
luc+luc+
+573 +655luc+
+21 +464luc+
-873 +162
luc+
luc++102 +512
luc+SV40
+558 +721
luc+
luc+
+573 +655luc+
+21 +464luc+
-873 +162
luc+
luc++102 +512
luc+SV40
+558 +721
luc+
luc+luc+
+573 +655luc+
+21 +464luc+
-873 +162
luc+
1B 1E
+496 +567 +682
5‘ 3‘5‘
+1 +783
MLC1 Exon1
1B 1E
+496 +567 +682
5‘ 3‘5‘
+1 +783
MLC1 Exon1
5 pseudogene Alu-J Exon 1
+1
AV2537045‘ Pomp pseudogene Alu-J 3‘
1B 1E
AV253704
+421 +593
Exon1Mlc1
-751
5 pseudogene Alu-J Exon 1
+1
AV2537045‘ Pomp pseudogene Alu-J 3‘
1B 1E
AV253704
+421 +593
Exon1Mlc1
-751
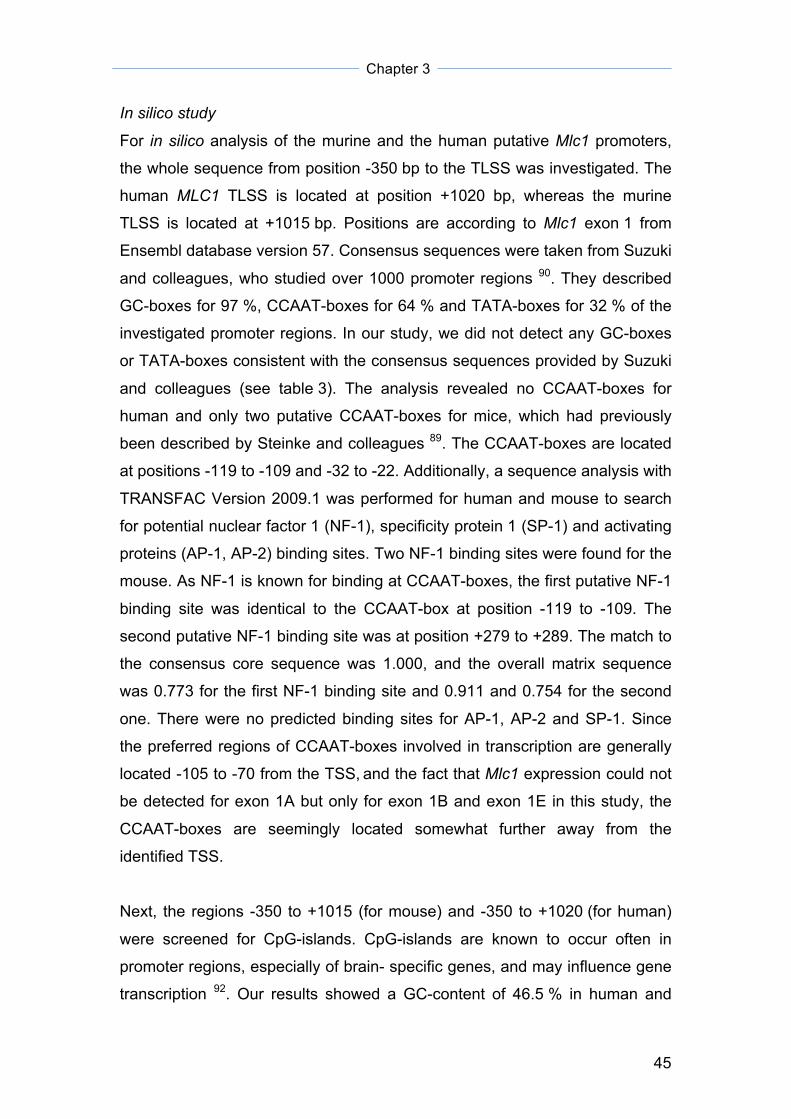
Chapter 3
45
In silico study
For in silico analysis of the murine and the human putative Mlc1 promoters,
the whole sequence from position -350 bp to the TLSS was investigated. The
human MLC1 TLSS is located at position +1020 bp, whereas the murine
TLSS is located at +1015 bp. Positions are according to Mlc1 exon 1 from
Ensembl database version 57. Consensus sequences were taken from Suzuki
and colleagues, who studied over 1000 promoter regions 90. They described
GC-boxes for 97 %, CCAAT-boxes for 64 % and TATA-boxes for 32 % of the
investigated promoter regions. In our study, we did not detect any GC-boxes
or TATA-boxes consistent with the consensus sequences provided by Suzuki
and colleagues (see table 3). The analysis revealed no CCAAT-boxes for
human and only two putative CCAAT-boxes for mice, which had previously
been described by Steinke and colleagues 89. The CCAAT-boxes are located
at positions -119 to -109 and -32 to -22. Additionally, a sequence analysis with
TRANSFAC Version 2009.1 was performed for human and mouse to search
for potential nuclear factor 1 (NF-1), specificity protein 1 (SP-1) and activating
proteins (AP-1, AP-2) binding sites. Two NF-1 binding sites were found for the
mouse. As NF-1 is known for binding at CCAAT-boxes, the first putative NF-1
binding site was identical to the CCAAT-box at position -119 to -109. The
second putative NF-1 binding site was at position +279 to +289. The match to
the consensus core sequence was 1.000, and the overall matrix sequence
was 0.773 for the first NF-1 binding site and 0.911 and 0.754 for the second
one. There were no predicted binding sites for AP-1, AP-2 and SP-1. Since
the preferred regions of CCAAT-boxes involved in transcription are generally
located -105 to -70 from the TSS, and the fact that Mlc1 expression could not
be detected for exon 1A but only for exon 1B and exon 1E in this study, the
CCAAT-boxes are seemingly located somewhat further away from the
identified TSS.
Next, the regions -350 to +1015 (for mouse) and -350 to +1020 (for human)
were screened for CpG-islands. CpG-islands are known to occur often in
promoter regions, especially of brain- specific genes, and may influence gene
transcription 92. Our results showed a GC-content of 46.5 % in human and
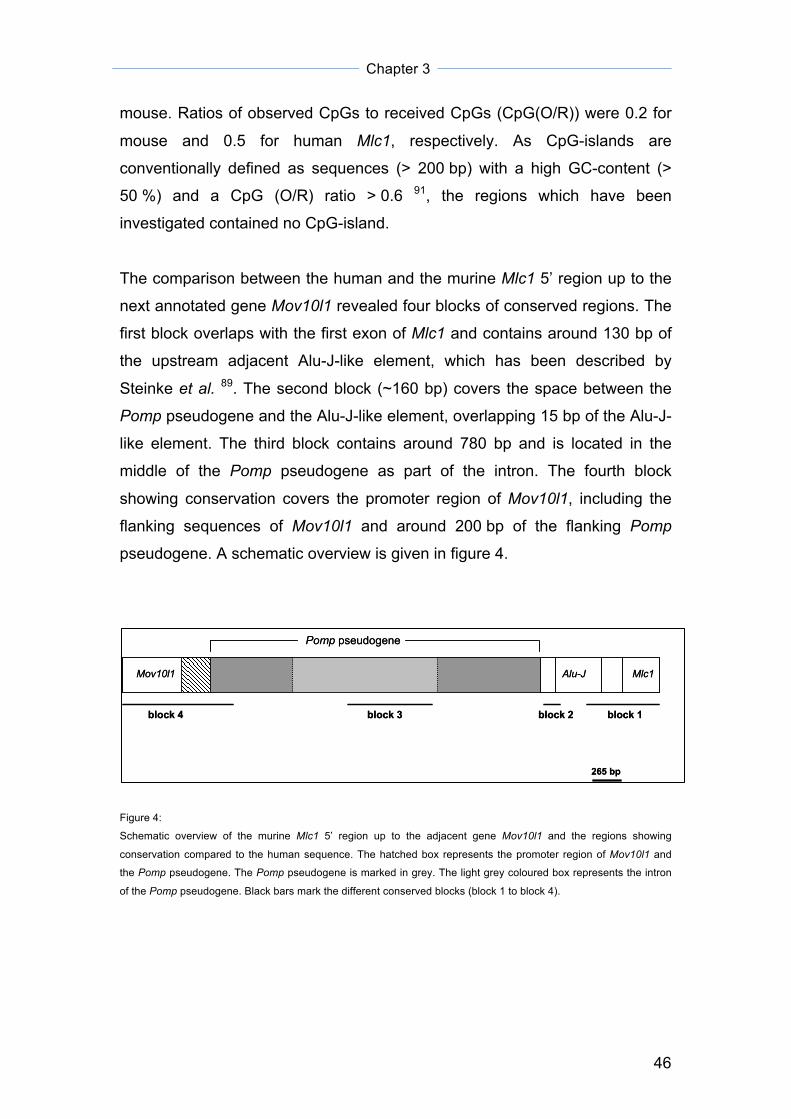
Chapter 3
46
mouse. Ratios of observed CpGs to received CpGs (CpG(O/R)) were 0.2 for
mouse and 0.5 for human Mlc1, respectively. As CpG-islands are
conventionally defined as sequences (> 200 bp) with a high GC-content (>
50 %) and a CpG (O/R) ratio > 0.6 91, the regions which have been
investigated contained no CpG-island.
The comparison between the human and the murine Mlc1 5’ region up to the
next annotated gene Mov10l1 revealed four blocks of conserved regions. The
first block overlaps with the first exon of Mlc1 and contains around 130 bp of
the upstream adjacent Alu-J-like element, which has been described by
Steinke et al. 89. The second block (~160 bp) covers the space between the
Pomp pseudogene and the Alu-J-like element, overlapping 15 bp of the Alu-J-
like element. The third block contains around 780 bp and is located in the
middle of the Pomp pseudogene as part of the intron. The fourth block
showing conservation covers the promoter region of Mov10l1, including the
flanking sequences of Mov10l1 and around 200 bp of the flanking Pomp
pseudogene. A schematic overview is given in figure 4.
Figure 4:
Schematic overview of the murine Mlc1 5’ region up to the adjacent gene Mov10l1 and the regions showing
conservation compared to the human sequence. The hatched box represents the promoter region of Mov10l1 and
the Pomp pseudogene. The Pomp pseudogene is marked in grey. The light grey coloured box represents the intron
of the Pomp pseudogene. Black bars mark the different conserved blocks (block 1 to block 4).
Alu-J Mlc1Mov10l1
block 4 block 3 block 2 block 1
Pomp pseudogene
265 bp
Alu-J Mlc1Mov10l1
block 4 block 3 block 2 block 1
Pomp pseudogene
265 bp
Chapter 3
47
Discussion The brain-specific expression of the megalencephalic leucoencephalopathy
with subcortical cysts gene MLC1, and its involvement in neurological
disorders like MLC as well as mental disorders like schizophrenia and bipolar
disorder, supports the importance of the role of MLC1 for brain development
and physiological brain function. A certain homology to ABC2-transporters,
which are known to play a role in drug resistance 93, has been reported by
Leegwater and colleagues 88. As the membrane spanning MLC1 is
predominantly located at astrocytic end-feet at the blood brain barrier and
glial-limiting membrane, a functional role as a selective transport protein, most
probably as an exporter, could be presumed. Furthermore, Ambrosini and
colleagues described an association between the dystrophin-glycoprotein
complex (DGC) and MLC1 94. DGC is essential to anchor the cell membrane
to the extra cellular matrix and its need for the stability of the blood brain
barrier 95. Defects in MLC1 may affect stability of the DGC, causing instability
and dysfunction of the blood brain barrier; the latter has been found in
schizophrenic and depressive patients 96-98. So far, neither the real function of
the protein, nor the gene regulation of MLC1 is known. Here, we studied the
upstream region of the murine Mlc1 to find regulatory elements and define a
promoter region. As no promoter could be identified by promoter prediction
software, Mlc1 was investigated for promoter elements known to be essential
for initiation of transcription. Suzuki and colleagues described binding sites for
transcription factors appearing in most of the promoter regions they
investigated 90. They mentioned an appearance of GC-boxes for 97 %,
CCAAT-boxes for 64 % and TATA-boxes for 32 % of the investigated
promoter regions. Here, we detected three CCAAT-boxes in the mouse, which
may act as NF-1 binding site. Beside NF-1, CCAAT-boxes are potential
binding sites for the nuclear factor NF-Y, which requires a high conservation
of the five core nucleotides 99. NF-1 and NF-Y are known to be ubiquitous
transcription factors acting on a variety of genes. While NF-1- mediated gene
expression might be influenced by the organization of DNA into chromatin
leading to a ~100 fold change in gene activity 100, NF-Y seems to be acting as
Chapter 3
48
a switch between gene activation and repression by influencing deposition of
positive and negative histone methyl marks 101,102. Nevertheless, the CCAAT-
boxes we found were not located within the usual region of about -105 to -
70 bp from the TSS. TATA-boxes and GC-boxes were absent in the human
and murine Mlc1 promoter region. Carninci and colleagues mentioned that
roughly 90 % of TATA-independent transcription initiation occurs within a CpG
island 103. Roider and colleagues also showed that for genes which are
predominantly expressed in brain it is common to have CpG islands in their
promoter region 92. Beside the lack of TATA-boxes and GC-boxes, our study
did not show any CpG-island within the promoter region, therefore, the
promoter region of Mlc1 is quite uncommon. Additionally, reporter gene
assays with pGL3-luciferase-constructs showed no promoter activity, further
supporting the lack of promoter-specific functional elements. Measurements
of pGL3-mB, pGL3-mE, pGL3-hB and pGL3-hE revealed no significant
differences in activity, independent of the presence or absence of CCAAT-
boxes. Although no transcription for first exons of MLC1/Mlc1 genes could be
demonstrated by this method, neither under basal nor under stimulated
conditions, Mlc1 expression was detectable in the cells by polymerase chain
reaction. It is known that there are post-transcriptional regulating processes,
like miRNAs, which are able to bind at AUGs of the 5’UTR and inhibits
translation of the mRNA 104. This may be one explanation for finding no
activity of our reporter gene. However, it has been published that MLC1
protein is expressed in astrocyte membranes and we had verified the gene
expression 87. Thus, it can be assumed that there is a translation process.
Furthermore, we tested several promoter constructs, containing different parts
of the 5’UTR and hence, sequences with different ATGs. It would be highly
improbable if every construct would contain such a repressive ATGs.
Therefore, a more probable assumption is that either a distal enhancer
element or an activating co-factor is crucial for Mlc1 expression, which is not
included in the investigated promoter region. It was shown that other genes,
like the Keratin 19 gene (K19), have an upstream promoter, which needs an
enhancer element to be active. As an example, Hu and colleagues conducted
a CAT-reporter gene assay showing the same low CAT-activity for the
Chapter 3
49
plasmid with and without the K19 promoter, with the plasmid containing the
K19 promoter and the 3’ flanking sequence of the K19 revealing a 10-fold
increase in expression level 105. Other reports also found crucial enhancer
elements for promoter activity, as shown for the importance of the 5’UTR
intron of the Ubiquitin C gene for its expression 106. Interestingly, there are
also some reports on MLC1 supporting the assumption that there might be a
crucial enhancer element or an activating co-factor. Despite MLC being
considered as an autosomal recessive disorder, Boor and colleagues
described patients suffering from MLC but containing only one or no mutated
MLC1 allele. In these patients, linkage analysis revealed linkage to the MLC1-
locus. 5’-UTR and 3’-UTR had been screened for mutations with a negative
result. Boor and colleagues investigated expression of MLC1 in
lymphoblastoid cell lines of affected versus non-affected patients. The result
showed that MLC1 expression of patients with only one or no mutated MLC1
allele compared to patients with homozygous MLC1 mutations revealed a
reduced expression level of MLC1, leading to the assumption that there must
be a second mutation somewhere near the MLC1 gene which affects
expression of MLC 107. Leegwater and colleagues found a few MLC-affected
patients with no mutated MLC1 allele showing no linkage to the MLC1 locus
on chromosome 22qtel 88,108, which indicates a second gene locus for the
disease. Lopez-Hernandez and colleagues recently found the second gene
locus causing MLC 109. They describe mutations in HEPCAM, encoding for an
IgG-like cell adhesion molecule that interacts with MLC1. If there is still
another important gene locus affecting MLC1 expression remains still unclear.
However, we found no regulatory element upstream of Mlc1, which was
capable of activating the gene’s transcription. Furthermore, the predicted
promoter 4.3 kb upstream of Mlc1 does not influence activity of the
investigated pGL3-K1. Since this predicted promoter fills the whole intergenic
spacer between Mov1l and the Pomp pseudogene, and both genes are
demonstrably expressed in testis, it is rather likely that this bi-directional
promoter is specific for both genes but not for Mlc1. It is quite striking that a
pseudogene, which obviously originated from retrotransposition because it
lacks intronic regions, and an Alu-J-like element, that belongs to a family of
Chapter 3
50
transposable elements, are located in the 5’ prime region of the murine Mlc1.
It can be assumed that the 5’ region of Mlc1 was a subject of repeated
transposon integration events in former times. Therefore, it would make sense
that this region is somehow repressed as a kind of protection. Even if there is
no Pomp pseudogene or Alu-J-like element in the 5’ prime region of human
MLC1, there are two blocks showing conservation, which contains flanking
parts of the Alu-J-like element described in mice. Interestingly, the 5’ region of
exon1A and 1B shows a low CpG content and contains no CpG-islands. A
high CpG content correlates with repressed gene activity via methylation 110. It
was further observed that 70 % of all genes expressed in the brain contain
CpG-islands 92. Although Mlc1 is expressed in brain, it does not harbour CpG-
islands. In summary, the promoters of both human and murine MLC1/Mlc1
genes display unusual structural and functional features, with yet undetected
cis-acting elements and trans-acting co-factors likely playing a crucial role for
Mlc1 gene expression.
Chapter 4
51
Chapter 4 Extrapolating genetic results from large families to the general population: Association study of SNPs in unrelated bipolar and schizophrenic individuals from results of prior large family studies This chapter has been adapted from the manuscript (in preparation as of 5th
September 2011) entitled: The chromosome 15q14 locus for bipolar disorder and schizophrenia: Is C15orf53 a major candidate gene? Thorsten Kranz1*, Savira Ekawardhani1*, Michelle K. Lin1, Simone R. Alt2,
Fabian Streit3, Ulrike Schuelter1, Hans Bauer1, Darja Henseler1, Jonathan D.
Turner2, Claude P. Muller2, Andreas Reif4, Andrea B. Schote1 and Jobst
Meyer1
* these authors contributed equally to this work
1 Department of Neurobehavioral Genetics, Institute of Psychobiology, University of Trier, Germany; 2 Institute of Immunology, Centre de Recherche Public-Santé, Laboratoire National de Santé, Luxembourg; 3 Department of Genetic Epidemiology in Psychiatry, Central Institute for Mental Health, Mannheim, Germany; 4 Department of Psychiatry, Psychosomatics and Psychotherapy, University of Wuerzburg, Germany.
Chapter 4
52
Abstract
Family and twin studies revealed a high heritability for psychiatric conditions
like bipolar disorder and schizophrenia. Both are complexly inherited
disorders with currently unknown etiologies. Recently, two independent
genome-wide association studies for bipolar disorder identified a small region
on chromosome 15q14, containing the C15orf53 gene 111,112. Previously, this
genomic region was also found to co-segregate with periodic catatonia
(SCZD10, OMIM %605419), an unsystematic schizophrenia according to
Leonhard’s classification, in several of our multiplex SCZD10 families, thus
pointing to overlapping etiologies of both conditions. Here, we narrowed down
the susceptibility locus to a 4.5 Mb region on chromosome 15q14-15.1
between the genomic markers D15S1042 (centromeric) and D15S968
(telomeric) in seven unrelated German multiplex SCZD10 families. Mutation
and segregation analyses of C15orf53 in these families were accomplished.
We further conducted an association analysis of C15orf53 in 274 unrelated
individuals affected by BD and SCZD10 and 230 controls (case-control
sample were recruited in the same geographical region in Germany as all the
multiplex SCZD10 pedigrees) as well as expression analysis in post mortem
human brain tissues.
C15orf53 revealed no mutations in our SCZD10 family members but a
segregation of two common haplotypes of C15orf53 in our multiplex SCZD10
families were found. Further association analysis of these C15orf53
haplotypes with BD and/or SCZD10 was carried out in our case-control
samples but no significant association signal was detected. Expression of
C15orf53 could be demonstrated for immune system-derived cells but not for
the post mortem human limbic brain tissues. We concluded that C15orf53 is
probably not causative for the etiologies of BD and SCZD10 in our samples.
Chapter 4
53
Introduction Psychiatric disorders such as schizophrenia and bipolar disorder (BD) are
typically heterogeneous with respect to their etiologies and pathophysiologies,
and show a significant genetic component 113,114. The lifetime prevalence to
develop schizophrenia or BD is about ~1 % across the world’s populations
115,116. The high heritability (71 % - 90 %) has been demonstrated in
numerous twin and family studies, but only a small portion of that heritability
could be linked to known genetic variations and explicit causative genetic
variants remain unknown 117,118. Similarly to the majority of physiological
disorders, psychiatric and behavioural traits are usually of polygenic nature,
where the effect of many genes comes about together to cause a particular
phenotype to manifest. Dissecting the numerous layers of genetic pathways of
complex disorders is never easy as compared to monogenic disorders,
whereby only one gene of major effect is able to cause a particular
phenotype. Interestingly, there exist many exceptions for such a
straightforward polygenic versus monogenic categorization of genetic traits,
where a seemingly polygenic trait may be a monogenic trait in multi-
generational pedigrees comprising of multiple members affected with the
particular trait being studied. Therefore, despite psychiatric diseases being
commonly considered to be complexly inherited, rare Mendelian instances
have also been described as in our schizophrenic (periodic catatonia,
SCZD10, OMIM %605419) multi-generational pedigrees 119.
SCZD10, a condition phenotypically similar to BD, is a clinical subtype of
unsystematic schizophrenias according to Leonhard’s classification system 120. Patients diagnosed with SCZD10 are most likely to be diagnosed with
bipolar I disorder by the application of DSM-IV criteria 121. SCZD10 patients
exhibit subtle derangements of facial expression and gestures, so-called
psychomotor disturbances. They express a highly variable phenotype
comprising of hyperkinesia with stereotypies and parakinetic movements,
increased anxiety, impulsivity and aggressiveness as well as akinetic
negativism, immobility and mutism. In most cases, hallucinations and
Chapter 4
54
delusions occur during the acute psychotic episodes. In the remission phase,
there remains a catatonic residual state with psychomotorical weakness of
mimics. SCZD10 is highly heritable with a morbidity risk of ~27 % among first-
degree relatives 122.
The results of genetics and heritability studies in human disorders rest heavily
on the experimental sample, with issues like ethnicities and environmental
influences having the power to shift the experimental results in misleading
directions (i.e. false-negative and/or false-positive results). The point of a
homogenous population in the basic genetic approach is to try to ensure that
in the event of a significant finding, it is due to linkage or association of
particular genetic loci to the disorder being studied but not because of inter-
ethnic genomic differences (i.e. variations in parts of the human genome due
to difference in ethnicities). In our attempt to ensure a homogeneous ethnic
study sample throughout the study, the case-control population of our
unrelated individuals stems from the same geographical region (around
Wuerzburg) in Germany, hence ethnically homogeneous, as with our
multiplex SCZD10 families 123. We therefore reasoned that despite being
unrelated to the multiplex SCZD10 families, all involved study subjects (both
from the case-control population and the multiplex families) share closer
recent common ancestors than across other European populations. Hence,
rare genetic variations or mutations that exert a major effect in the causation
of the disorder specific to the families may have a higher probability in
showing up in the general population of the case-control sample group. Here,
we executed the classical two-stage genetic approach, from linkage analysis
in the large SCZD10 families to association analysis of the candidate gene,
C15orf53, in the general population of unrelated case-control subjects.
Previously, through a genome-wide linkage analysis in twelve of our unrelated
SCZD10 families of German descent, we found significant linkage on
chromosome 15q15 to SCZD10 124. In the present study, we carried out fine-
mapping of the 15q15 region in our twelve SCZD10 families and a 4.5 Mb
region on chromosome 15q14 – 15q15.1 was found to be co-segregating with
Chapter 4
55
the SCZD10 status in seven of the SZCD10 multi-generational families. Within
this region lie several candidate genes and one of these genes, C15orf53,
was chosen for further mutation analysis. No mutation of the C15orf53 gene
was found in the SCZD10-affected members who were analysed. We
continued with the genotyping of three SNPs, rs7171233, rs7165988 and
rs2172835, which appeared in our mutation analysis effort of our candidate
gene C15orf53, in the SCZD10 pedigrees. Two haplotypes of C15orf53, A-G-
T and T-C-C, were revealed to be co-segregating among all SCZD10 subjects
in our SCZD10 multiplex families. We proceeded on with association analyses
of these SNPs in 203 BD and 71 SCZD10 subjects, who were matched with
230 healthy subjects in a case-control study design. However, no significant
association was reached for these two C15orf53 haplotypes in the BD and
SCZD10 case-control study of unrelated individuals. We also carried out a
gene expression analysis of C15orf53 in various post mortem human brain
tissues and several immune cell lines but were only able to detect C15orf53
expression in the immune cell lines. Taking these findings into account, we
concluded that C15orf53 is highly unlikely to play a major role in the genetic
pathway of BD and SCZD10 in our samples.
Material & Methods Clinical samples
Members of large SCZD10 families were recruited around Wuerzburg,
Germany, as previously described in detail 125. From all patients, genomic
DNA was isolated and used for further analysis. From twelve multiplex
pedigrees, 57 SCZD10 patients from the first genome-wide scan study 119
were included in the fine-mapping. Extensive clinical evaluation confirmed the
diagnosis according to Leonhard’s classification system and the ICD-10.
Additional information was collected from different sources, including case
history, medical records and/or family informants.
Chapter 4
56
In addition, 203 BD affected patients, previously described by us 123 and 71
patients diagnosed with SCZD10 were included in the present study. None of
the subjects showed neurological comorbidities, epilepsy, mental retardation,
or a history of substance abuse. The control sample consisted of 230 healthy
subjects without any history of psychiatric disorder and from the same
geographic region (Wuerzburg, Germany) as the patient group. Mean age of
patients was 46±15 years, of controls 32±10.5 years. Only patients and
healthy volunteers who have given written informed consent after oral and
written explanation about the aim and scope of the investigation were enrolled
in this study. The ethics committee of the University of Wuerzburg, Germany,
approved the study.
Selection of SNPs, microsatellite markers and primer design
Microsatellite markers, single nucleotide polymorphisms (SNPs) markers and
primer selections for C15orf53 were based on annotations derived from
Ensembl (May 2009) and UCSC (May 2004). Primer pairs were designed
using the software Primer3 126.
Fine-mapping of chromosome 15 in multiplex SCZD10 families
Twenty-five microsatellite markers were chosen for the fine-mapping of
chromosome 15q11.2-15q15. A 17 Mb genomic area was covered,
encompassed by the microsatellite markers D15S1035 (chr15: 22 908578-22
908827) and D15S1044 (chr15: 39 668975-39 669161). Marker amplifications
were accomplished on GeneAmp 9700 thermal cyclers (PerkinElmer, USA)
and fragment analysis was done on ABI Prism® 310 Genetic Analyzer
(supplementary information (SI) 1A).
Linkage analysis in multiplex SCZD10 families
Nonparametric, model-free multipoint linkage analyses were performed for
chromosome 15-linked pedigrees (seven pedigrees) using the SIMWALK
Chapter 4
57
program 127 with the easyLinkage program as the interface 128. Statistical
significance was estimated based on shared allele’s identical-by-descent
(IBD) of all affected persons.
Mutation analysis of C15orf53
The segregating region contains four genes (SPRED1, FAM98B, RASGRP1
and C15orf53), of which C15orf53 was further investigated. Primers
encompassing the proximal promoter region, 5´-UTR, coding regions and
intron-exon boundaries of C15orf53 were used for genomic DNA amplification
from seven SCZD10-affected patients. DNA was amplified by polymerase
chain reaction (PCR) and subsequently sequenced (SI 1B and 1C).
Genotyping of C15orf53 in SCZD10 multiplex families, and bipolar disorder
and SCZD10 case-control samples
Genomic regions encompassing the SNPs rs7171233, rs7165988 and
rs2172835 were amplified by PCR (SI 1D). The subsequent genotypes of the
SNPs rs7171233 and rs7165988 were determined by restriction digestion with
RsaI and those of SNP rs2172835 with Hin1II, all incubated at 37 °C for 4
hours. Restriction products were separated and visualized on 2 % agarose
gels.
Association analysis in bipolar disorder and SCZD10 case-control samples
Linkage disequilibrium among the three SNPs was determined and
haplotypes were estimated using Haploview 4.2 129. Only haplotypes with a
frequency of over two percent were included in the analyses. We tested the
haplotypes for association in a case-control design for the following groups: a)
BD-affected (203 subjects) versus controls (230 subjects), b) SCZD10-
affected (71 subjects) versus controls, and c) pooled sample of BD-affected
and SCZD10-affected versus controls.
Chapter 4
58
cDNA from human brain post mortem tissues, human cell lines and immune
cells
Post mortem limbic brain tissues (amygdala, hippocampus, inferior gyrus,
cingulate gyrus and nucleus accumbens) from six donors free of central
nervous system (CNS) diseases and without a history of longterm
psychotropic medication were obtained from the Dutch Brain Bank
(Netherlands Institute of Neuroscience). All patients have provided pre
mortem consent for brain autopsy and use of brain material for research
purposes as previously reported 130.
Isolation of CD4+, CD8+, CD14+, CD19+ cells and peripheral blood
mononuclear cells (PBMCs) from fresh blood of a healthy donor was
performed using the appropriate MACS® MicroBeads Kits (Miltenyi Biotech,
Germany) according to the manufacturer’s protocol. Total RNA was purified
with the High Pure RNA Isolation Kit (Roche, Germany) by following the
manufacturer’s instructions. cDNA synthesis was realised using standard
protocols.
C15orf53 expression analysis
For expression analysis of C15orf53, quantitative PCR (qPCR) was performed
in duplicates (SI 1E). Glyceraldehyde-3-phosphate dehydrogenase (GAPDH)
expression was included as an internal control. The qPCR products were
separated and visualized on 2 % agarose gel. The amplicons were directly
sequenced and confirmed.
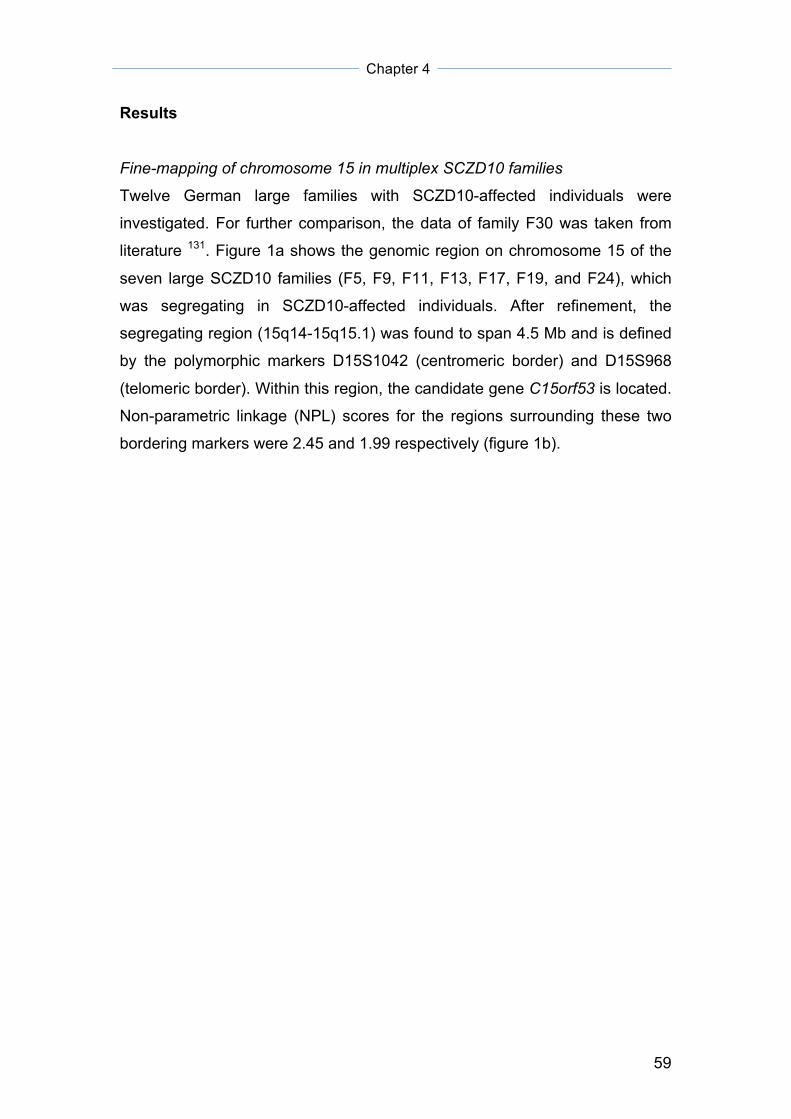
Chapter 4
59
Results Fine-mapping of chromosome 15 in multiplex SCZD10 families
Twelve German large families with SCZD10-affected individuals were
investigated. For further comparison, the data of family F30 was taken from
literature 131. Figure 1a shows the genomic region on chromosome 15 of the
seven large SCZD10 families (F5, F9, F11, F13, F17, F19, and F24), which
was segregating in SCZD10-affected individuals. After refinement, the
segregating region (15q14-15q15.1) was found to span 4.5 Mb and is defined
by the polymorphic markers D15S1042 (centromeric border) and D15S968
(telomeric border). Within this region, the candidate gene C15orf53 is located.
Non-parametric linkage (NPL) scores for the regions surrounding these two
bordering markers were 2.45 and 1.99 respectively (figure 1b).
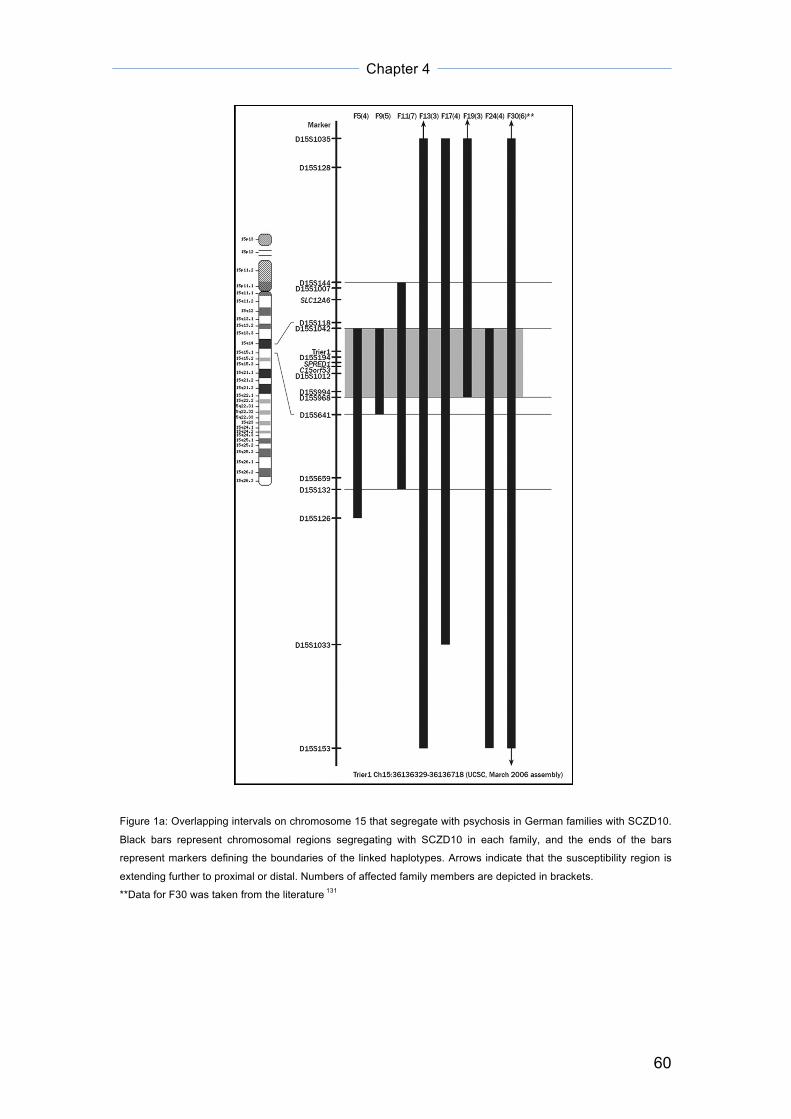
Chapter 4
60
Figure 1a: Overlapping intervals on chromosome 15 that segregate with psychosis in German families with SCZD10.
Black bars represent chromosomal regions segregating with SCZD10 in each family, and the ends of the bars
represent markers defining the boundaries of the linked haplotypes. Arrows indicate that the susceptibility region is
extending further to proximal or distal. Numbers of affected family members are depicted in brackets.
**Data for F30 was taken from the literature 131
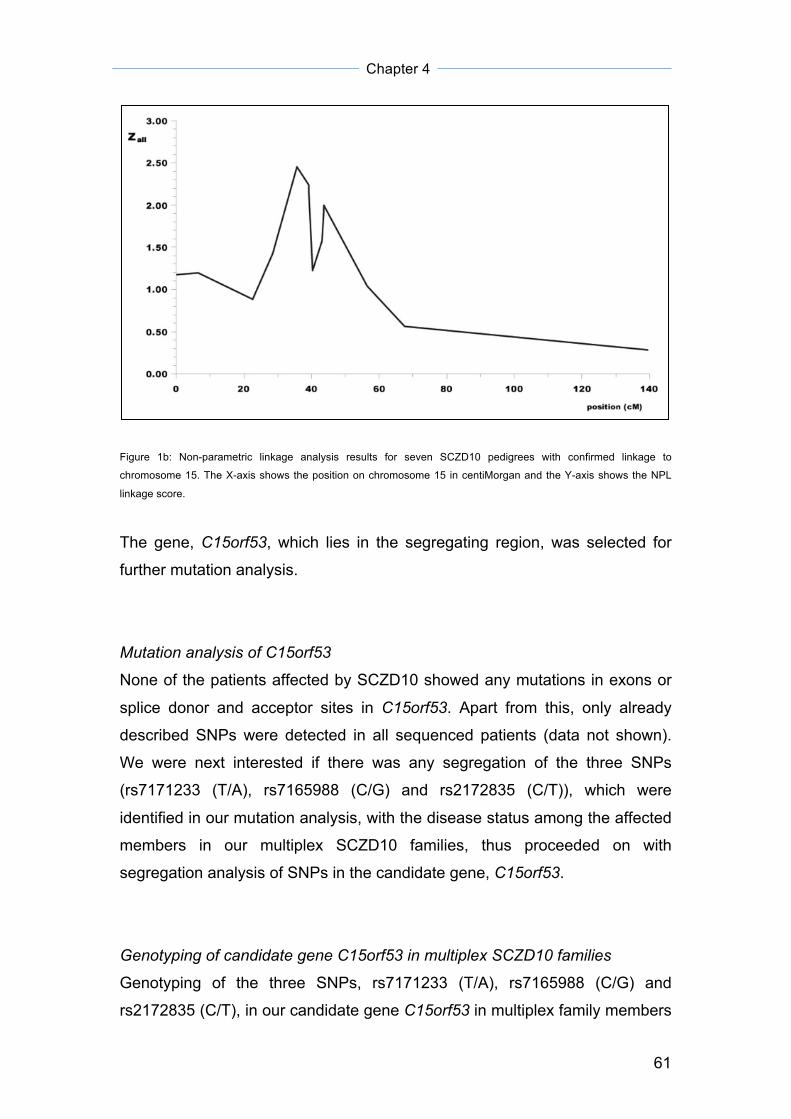
Chapter 4
61
Figure 1b: Non-parametric linkage analysis results for seven SCZD10 pedigrees with confirmed linkage to
chromosome 15. The X-axis shows the position on chromosome 15 in centiMorgan and the Y-axis shows the NPL
linkage score.
The gene, C15orf53, which lies in the segregating region, was selected for
further mutation analysis.
Mutation analysis of C15orf53
None of the patients affected by SCZD10 showed any mutations in exons or
splice donor and acceptor sites in C15orf53. Apart from this, only already
described SNPs were detected in all sequenced patients (data not shown).
We were next interested if there was any segregation of the three SNPs
(rs7171233 (T/A), rs7165988 (C/G) and rs2172835 (C/T)), which were
identified in our mutation analysis, with the disease status among the affected
members in our multiplex SCZD10 families, thus proceeded on with
segregation analysis of SNPs in the candidate gene, C15orf53.
Genotyping of candidate gene C15orf53 in multiplex SCZD10 families
Genotyping of the three SNPs, rs7171233 (T/A), rs7165988 (C/G) and
rs2172835 (C/T), in our candidate gene C15orf53 in multiplex family members
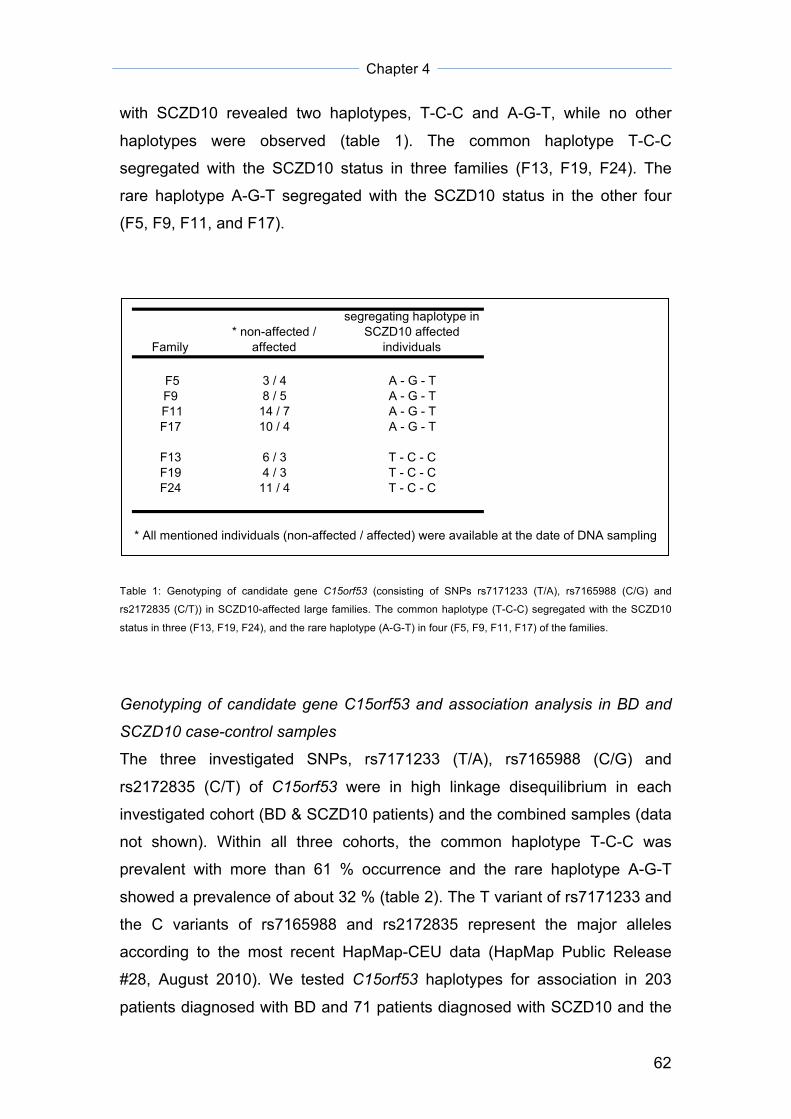
Chapter 4
62
with SCZD10 revealed two haplotypes, T-C-C and A-G-T, while no other
haplotypes were observed (table 1). The common haplotype T-C-C
segregated with the SCZD10 status in three families (F13, F19, F24). The
rare haplotype A-G-T segregated with the SCZD10 status in the other four
(F5, F9, F11, and F17).
Table 1: Genotyping of candidate gene C15orf53 (consisting of SNPs rs7171233 (T/A), rs7165988 (C/G) and
rs2172835 (C/T)) in SCZD10-affected large families. The common haplotype (T-C-C) segregated with the SCZD10
status in three (F13, F19, F24), and the rare haplotype (A-G-T) in four (F5, F9, F11, F17) of the families.
Genotyping of candidate gene C15orf53 and association analysis in BD and
SCZD10 case-control samples
The three investigated SNPs, rs7171233 (T/A), rs7165988 (C/G) and
rs2172835 (C/T) of C15orf53 were in high linkage disequilibrium in each
investigated cohort (BD & SCZD10 patients) and the combined samples (data
not shown). Within all three cohorts, the common haplotype T-C-C was
prevalent with more than 61 % occurrence and the rare haplotype A-G-T
showed a prevalence of about 32 % (table 2). The T variant of rs7171233 and
the C variants of rs7165988 and rs2172835 represent the major alleles
according to the most recent HapMap-CEU data (HapMap Public Release
#28, August 2010). We tested C15orf53 haplotypes for association in 203
patients diagnosed with BD and 71 patients diagnosed with SCZD10 and the
Family * non-affected /
affected
segregating haplotype in SCZD10 affected
individuals
F5 3 / 4 A - G - TF9 8 / 5 A - G - T
F11 14 / 7 A - G - TF17 10 / 4 A - G - T
F13 6 / 3 T - C - CF19 4 / 3 T - C - CF24 11 / 4 T - C - C
* All mentioned individuals (non-affected / affected) were available at the date of DNA sampling
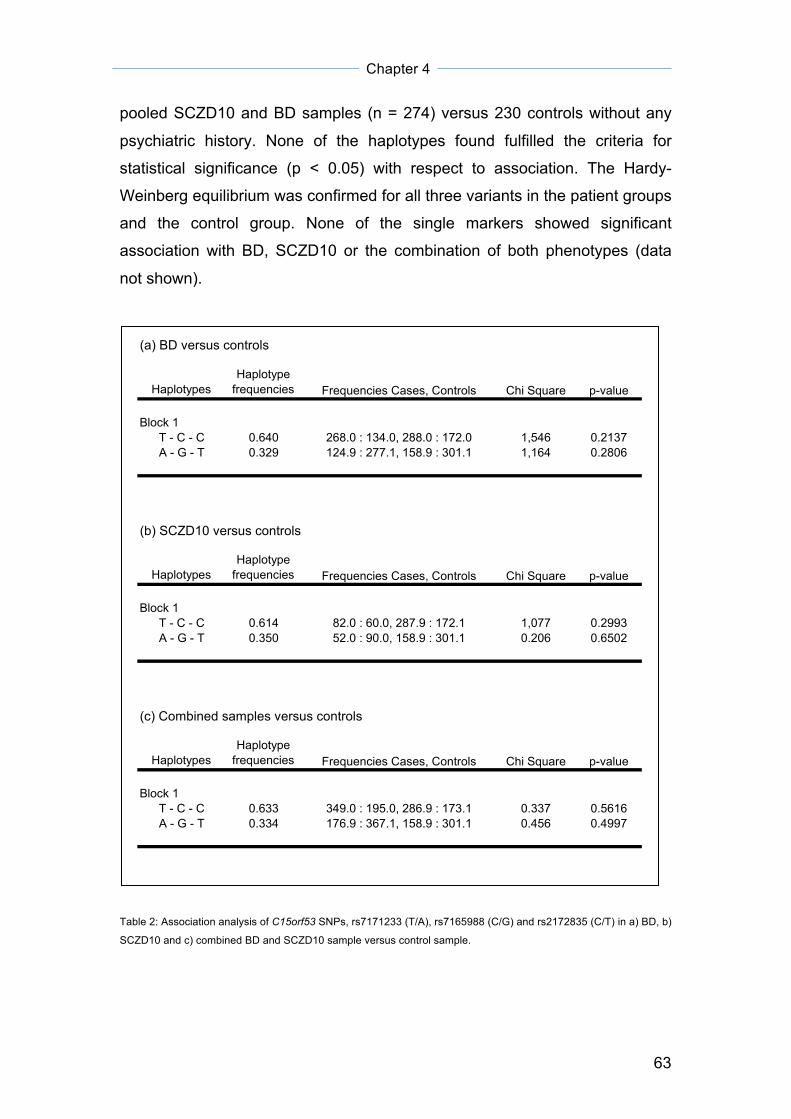
Chapter 4
63
pooled SCZD10 and BD samples (n = 274) versus 230 controls without any
psychiatric history. None of the haplotypes found fulfilled the criteria for
statistical significance (p < 0.05) with respect to association. The Hardy-
Weinberg equilibrium was confirmed for all three variants in the patient groups
and the control group. None of the single markers showed significant
association with BD, SCZD10 or the combination of both phenotypes (data
not shown).
Table 2: Association analysis of C15orf53 SNPs, rs7171233 (T/A), rs7165988 (C/G) and rs2172835 (C/T) in a) BD, b)
SCZD10 and c) combined BD and SCZD10 sample versus control sample.
HaplotypesHaplotype
frequencies Frequencies Cases, Controls Chi Square p-value
Block 1T - C - C 0.640 268.0 : 134.0, 288.0 : 172.0 1,546 0.2137A - G - T 0.329 124.9 : 277.1, 158.9 : 301.1 1,164 0.2806
(b) SCZD10 versus controls
HaplotypesHaplotype
frequencies Frequencies Cases, Controls Chi Square p-value
Block 1 T - C - C 0.614 82.0 : 60.0, 287.9 : 172.1 1,077 0.2993A - G - T 0.350 52.0 : 90.0, 158.9 : 301.1 0.206 0.6502
(c) Combined samples versus controls
HaplotypesHaplotype
frequencies Frequencies Cases, Controls Chi Square p-value
Block 1T - C - C 0.633 349.0 : 195.0, 286.9 : 173.1 0.337 0.5616A - G - T 0.334 176.9 : 367.1, 158.9 : 301.1 0.456 0.4997
(a) BD versus controls
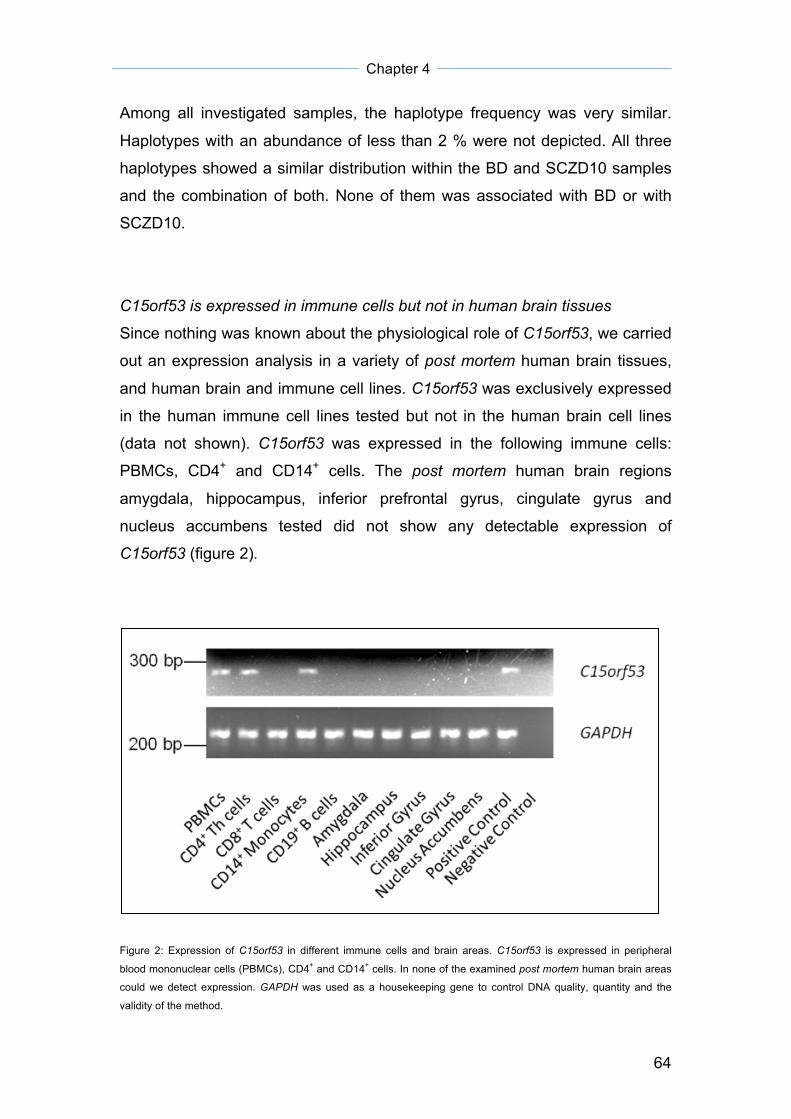
Chapter 4
64
Among all investigated samples, the haplotype frequency was very similar.
Haplotypes with an abundance of less than 2 % were not depicted. All three
haplotypes showed a similar distribution within the BD and SCZD10 samples
and the combination of both. None of them was associated with BD or with
SCZD10.
C15orf53 is expressed in immune cells but not in human brain tissues
Since nothing was known about the physiological role of C15orf53, we carried
out an expression analysis in a variety of post mortem human brain tissues,
and human brain and immune cell lines. C15orf53 was exclusively expressed
in the human immune cell lines tested but not in the human brain cell lines
(data not shown). C15orf53 was expressed in the following immune cells:
PBMCs, CD4+ and CD14+ cells. The post mortem human brain regions
amygdala, hippocampus, inferior prefrontal gyrus, cingulate gyrus and
nucleus accumbens tested did not show any detectable expression of
C15orf53 (figure 2).
Figure 2: Expression of C15orf53 in different immune cells and brain areas. C15orf53 is expressed in peripheral
blood mononuclear cells (PBMCs), CD4+ and CD14+ cells. In none of the examined post mortem human brain areas
could we detect expression. GAPDH was used as a housekeeping gene to control DNA quality, quantity and the
validity of the method.
Chapter 4
65
Discussion
A genome-wide linkage analysis followed by fine-mapping with microsatellite
markers revealed a 4.5 Mb region on chromosome 15q14 that is co-
segregating with the SCZD10-affected members in seven of our multiplex
SCZD10 families. Coincidentally, the chromosomal region 15q11-14 has been
the focus of numerous studies investigating a variety of neuropsychiatric
disorders like schizophrenia, bipolar disorder, autism and mental retardation 131-133. Chromosome 15q11-13 also happens to be a major susceptibility locus
for the Prader-Willi/Angelman imprinting syndrome, which was found to
overlap with schizophrenia and other psychoses in a recent large-scale study 134. On our part, we have previously demonstrated that rare variants of the
potassium chloride co-transporter 3 gene (KCC3), located on chromosome
15q14, which co-segregate with SCZD10 in our multiplex SCZD10 families,
are significantly associated with BD 123. Chromosome 15q14 as a
susceptibility region for BD is further supported by a recent BD genome-wide
association study (GWAS) on European American and African American
samples 111. Another recently published GWAS on 4387 BD and 6209 control
subjects by Ferreira et al. showed a strong association with BD on
chromosome 15q14, with the highest association signal (p = 7.5 x 10⁻⁷) by a
SNP (rs 2172835) on C15orf53 112. Taking into account unpublished results
on functional studies carried out by Ekici and colleagues on the other SCZD10
candidate genes located in the chromosome 15q14 region and Ferreira’s
work, we have decided to select C15orf53 as a BD/SCZD10 candidate gene
for further study.
With the ever-enlarging sample sizes in the majority of psychiatric genetic
studies (amounting to even tens of thousands of test subjects), which usually
involve heterogeneous population samples consisting of mixed ethnicities, we
tried to use a suitably yet moderately sized study sample to replicate a
significant signal in our BD/SCZD10 study. In order to do so, instead of using
a larger and more genetically heterogeneous European population in our
case-control sample, we used a much smaller but more genetically
homogeneous study sample from the same geographical region (around
Chapter 4
66
Wuerzburg) in Germany as with our multiplex SCZD10 families 123. In doing
so, rare genetic variants or mutations that exert a major effect in the causation
of the BD/SCZD10, specific to the families, may have a higher probability of
showing up in the general population of the case-control sample group.
Here, we report that mutation and segregation analyses for C15orf53 revealed
neither a mutation nor a rare haplotype of our candidate gene C15orf53 in our
SCZD10 families. In the subsequent case-control study, possible association
of C15orf53 with either SCZD10 or BD in separate and combined patient
samples were investigated. We showed that all three SNPs, rs7171233,
rs7165988 and rs2172835 of C15orf53 identified by mutation analysis, were in
high linkage disequilibrium. We tested the respective haplotypes for
association with SCZD10 or BD but found no association of C15orf53, neither
in the separate BD/SCZD10 samples nor in the combined samples in
comparison to our control group. Since there is currently no information about
C15orf53, except that the databases revealed its expression in human spleen
tissue, we decided to carry out an expression analysis of C15orf53 in various
human immune and brain cell lines and human post mortem brain tissues. In
our study, we showed for the first time that C15orf53 is expressed in the
human immune system but not in the brain.
The reported results indicate a high probability of excluding C15orf53 in
playing a major role causing BD/SCZD10 in our sample. Despite our well
selected (in terms of ethic-group homogeneity) pedigreed and case-control
samples, we were unable to detect any association signal of our proposed
candidate gene. Several other explanations may be plausible aside from the
exclusion of C15orf53 as BD/SCZD10 causative gene: 1) Even though we
have taken care to include genetically well matched samples, we did not
consider the effect of environment influences on genes in the current study.
Factors such as epigenetics and incomplete penetrance may also influence
the probability of the manifestation of the disorder; 2) the sample size in our
case-control may indeed be insufficient as the minor allele frequency (MAF) of
the alleles being studied is exceptionally low, hence the next probable step
Chapter 4
67
would be to execute a power calculation in predicting a statistically more
suitable case-control sample size; and 3) we have so far focused on genes as
plausible candidates for the causation of BD/SCZD10 but recent psychiatric
genetic studies showed that structural variations in the genome, affecting
more than 50 bp of sequence, not necessarily involving genes (i.e. may occur
over gene deserts in the genome) 135,136, and gene expression trait loci
(eQTL), which influence the expression of genes located a distance away on
the genome 137,138, may also affect the regulation and expression of causative
genes.
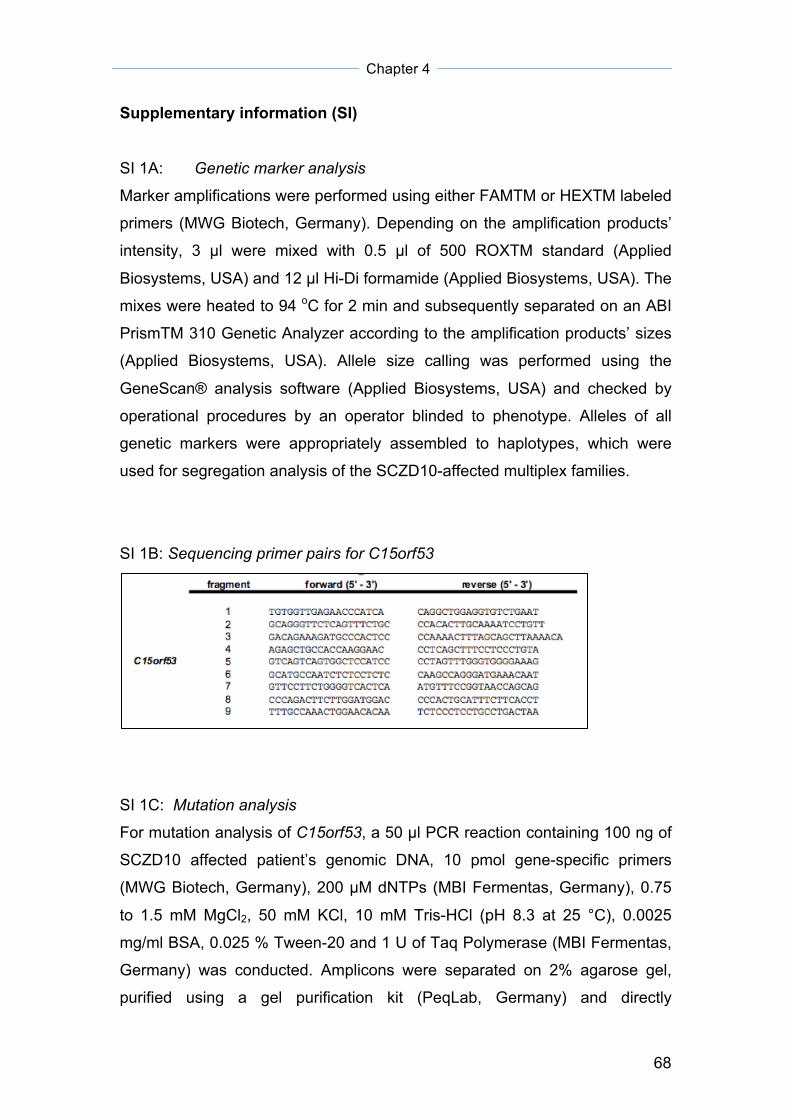
Chapter 4
68
Supplementary information (SI) SI 1A: Genetic marker analysis
Marker amplifications were performed using either FAMTM or HEXTM labeled
primers (MWG Biotech, Germany). Depending on the amplification products’
intensity, 3 µl were mixed with 0.5 µl of 500 ROXTM standard (Applied
Biosystems, USA) and 12 µl Hi-Di formamide (Applied Biosystems, USA). The
mixes were heated to 94 oC for 2 min and subsequently separated on an ABI
PrismTM 310 Genetic Analyzer according to the amplification products’ sizes
(Applied Biosystems, USA). Allele size calling was performed using the
GeneScan® analysis software (Applied Biosystems, USA) and checked by
operational procedures by an operator blinded to phenotype. Alleles of all
genetic markers were appropriately assembled to haplotypes, which were
used for segregation analysis of the SCZD10-affected multiplex families.
SI 1B: Sequencing primer pairs for C15orf53
SI 1C: Mutation analysis
For mutation analysis of C15orf53, a 50 µl PCR reaction containing 100 ng of
SCZD10 affected patient’s genomic DNA, 10 pmol gene-specific primers
(MWG Biotech, Germany), 200 µM dNTPs (MBI Fermentas, Germany), 0.75
to 1.5 mM MgCl2, 50 mM KCl, 10 mM Tris-HCl (pH 8.3 at 25 °C), 0.0025
mg/ml BSA, 0.025 % Tween-20 and 1 U of Taq Polymerase (MBI Fermentas,
Germany) was conducted. Amplicons were separated on 2% agarose gel,
purified using a gel purification kit (PeqLab, Germany) and directly
Chapter 4
69
sequenced. Sequencing reactions were performed for both DNA strands with
the sequencing primers depicted in supplementary information 1B using the
CEQ DTCS Quick Start Kit (Beckman Coulter, Germany) according to the
manufacturer’s protocol and analyzed using the ChromasLite program
(Technelysium Ltd) and the reference sequence from the Ensembl genome
browser (May 2009).
SI 1D: PCR conditions for genotyping of C15orf53
PCR reactions were carried out in a total volume of 50 µl with 100 ng of
genomic DNA, 10 pmol of each primer, 200 µM dNTPs, 2.0 or 2.5 mM MgCl2,
50 mM KCl, 10 mM Tris-HCl (pH 8.3 at 25 °C), 0.0025 mg/ml BSA, 0.025 %
Tween-20 and 2.5 U High-Fidelity Taq Polymerase (MBI Fermentas,
Germany) and 5 % (v/v) dimethylsulfoxide (DMSO). PCR reaction 1
(rs7171233 and rs7165988) was performed with forward primer 5’-
TGTGGTTGAGAACCCATCA-’3 and reverse primer 5’-
CAGGCTGGAGGTGTCTGAAT-3’. The SNP rs2172835 was amplified using
forward primer 5’-AGAGCTGCCACCAAGGAAC-3’ and reverse primer 5’-
CCTCAGCTTTCCTCCCTGTA-3’. All PCR reactions were performed in a
MultigeneThermocylerTM TC9600 (Labnet, USA). Conditions for PCR
reactions were: 5 min at 94 °C followed by 40 cycles of 45 s at 94 °C, 45 s at
56 °C or 58 °C, 45 s at 72 °C and a final extension for 7 min at 72 °C. PCR
products were separated and visualized on 1.5 % agarose gel.
SI 1E: Expression analysis of C15orf53
Quantitative PCR reactions were conducted in a total volume of 25 µl
containing 50 mM KCl, 200 mM dNTPs, 20 mM Tris-HCl (pH 8.3 at 25 °C), 2.5
U Platinum Taq Polymerase (Invitrogen, USA) and 1x concentrated SYBR®
green I (Cambrex, Belgium). The exon- spanning primers used for the
amplification of C15orf53 were forward primer 5’-
GCGTCTGTTTGGATGGCTGGAGG-3’ and reverse primer 5’-
GGAAGTGGTGAACGGCGGGG-3’. For GAPDH amplification we used
Chapter 4
70
forward primer 5'-GAAGGTGAAGGTCGGAGTC-3' and reverse primer 5'-
GAAGATGGTGATGGGATTTC-3'. The thermal cycling was carried out in
DNA Engine Opticon® 2 (Biorad, USA).
Chapter 5
71
Chapter 5 Feasibility of replicating genetic results from large family studies in general population of unrelated individuals for complex psychiatric disorders and behavioral traits: From eQTL linkage to association analyses in vervets
This chapter is presented as an adaptation of the manuscript (in preparation
as of 5th September 2011) entitled:
A non-human primate system for large-scale genetic studies of complex traits
Anna J. Jasinska 1, Michelle K. Lin 1,2, Susan Service 1, Oi-Wa Choi 1, Joseph
DeYoung 1, Olivera Grujic 1, Sit-yee Kong 1, Matthew J. Jorgensen 2, Lynn A.
Fairbanks 1, Trudy Turner 3, J. David Jentsch 4 and Nelson B. Freimer 1.
1 Center for Neurobehavioral Genetics, University of California Los Angeles, United States of America; 2 Department of Neurobehavioral Genetics, Institute of Psychobiology, University of Trier, Germany; 3 Department of Pathology, Section on Comparative Medicine, Wake Forest University Health Sciences, Winston-Salem, NC, United States of America; 4 Department of Psychology, University of California Los Angeles, United States of America.
Chapter 5
72
Abstract
A classical two-stage genetic approach utilizing both pedigree and population
samples of non-human primate species, on which strategies that are
infeasible in human studies can be applied, can provide powerful means for
genetically dissecting complex traits. We describe here a proof of concept of
an approach for genetically dissecting transcriptomic variation in tissues that
are largely inaccessible in humans (i.e. brain tissues), using their more readily
available counterparts (i.e. blood tissues) as substitutes. We have access to
347 related vervet monkeys (Chlorocebus aethiops sabaeus) from the
UCLA/Wake Forest University Vervet Research Colony (VRC) and 299
unrelated vervets from the feral vervet population from St. Kitts, Carribean.
Through linkage and association analyses of gene expression patterns in
peripheral blood from vervet monkeys, we have genetically mapped a
candidate regulatory locus for B3GALTL expression in the brain. We have
hereby proven our concept that 1) the classical multistage genetic approach is
applicable in mapping expression quantitative trait loci (eQTL), which regulate
gene expression; and 2) gene expression patterns in inaccessible tissues can
possibly be studied using those of accessible tissues as substitutes.
Chapter 5
73
Introduction Non-human primates (NHP) fill a critical need for biomedical models that 1)
are more directly relevant to human biology and disease than rodents or other
commonly employed model systems and 2) permit longitudinal or invasive
investigations that are infeasible in humans 139. The advent of next generation
sequencing has raised interest in genetic and genomic investigations of NHP
as a means of illuminating diverse human traits including HIV/AIDS,
cardiometabolic diseases, and disorders of brain and behavior. Yet, the
perceived lack of suitably sized NHP samples has thus far inhibited the
implementation of such investigations. Here, we describe a strategy for large-
scale genetic mapping studies utilizing genetically homogeneous populations
of feral vervet monkeys (also termed African green monkeys, Chlorocebus
aethiops sabaeus) inhabiting the Caribbean islands of St. Kitts and Nevis,
together with pedigreed monkeys descended from these populations, in the
UCLA/Wake Forest University Vervet Research Colony (VRC).
During the early colonial era (16th-17th centuries), very small numbers of West
African vervets were introduced to the Caribbean islands of St. Kitts, Nevis,
and Barbados, and they rapidly established feral populations (figure 1). In the
absence of predators, these populations expanded dramatically, reaching
estimates as high as 100,000 for the total vervet population on the three
islands. The multi-generational VRC pedigree, founded in the 1970s with 57
monkeys from St. Kitts and Nevis, is presumed to be broadly representative of
the populations of St. Kitts and Nevis from which it derives. We therefore
reasoned that variants implicated in quantitative traits within the VRC would
likely be associated with the same traits in the feral population of these
islands, but would be contained in much shorter genome segments of shared
identity by descent (IBD) among feral monkeys compared to pedigree
monkeys.
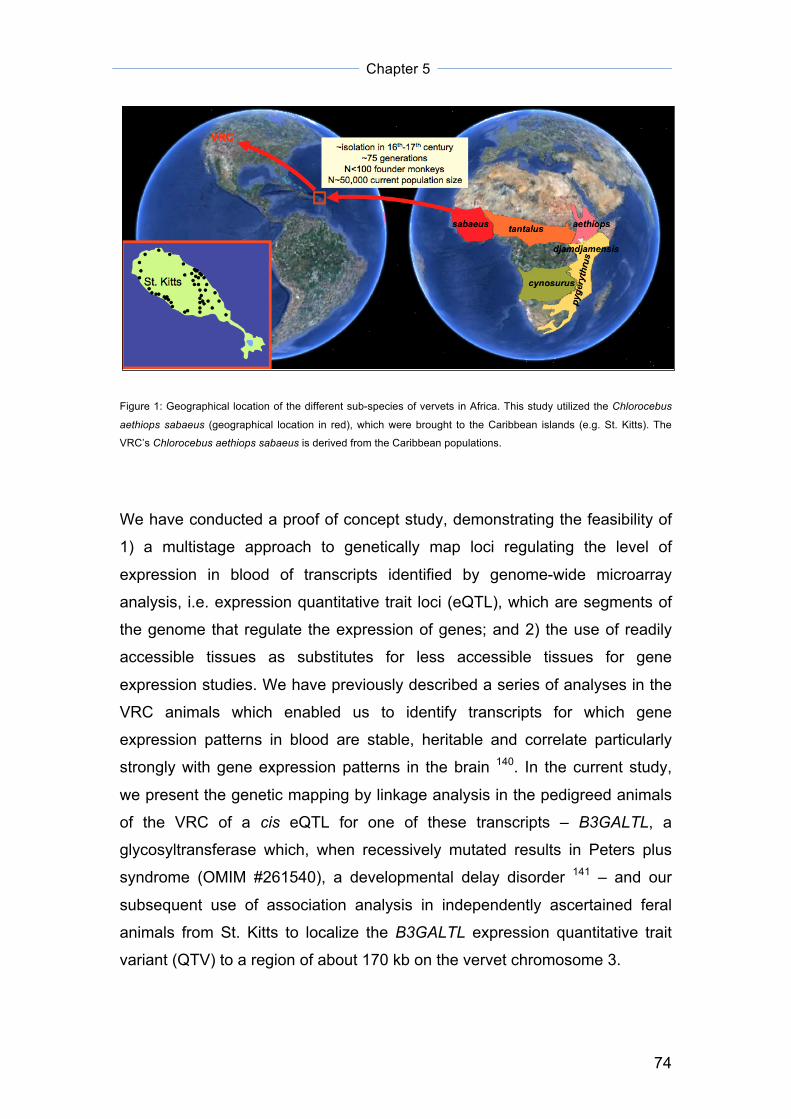
Chapter 5
74
Figure 1: Geographical location of the different sub-species of vervets in Africa. This study utilized the Chlorocebus
aethiops sabaeus (geographical location in red), which were brought to the Caribbean islands (e.g. St. Kitts). The
VRC’s Chlorocebus aethiops sabaeus is derived from the Caribbean populations.
We have conducted a proof of concept study, demonstrating the feasibility of
1) a multistage approach to genetically map loci regulating the level of
expression in blood of transcripts identified by genome-wide microarray
analysis, i.e. expression quantitative trait loci (eQTL), which are segments of
the genome that regulate the expression of genes; and 2) the use of readily
accessible tissues as substitutes for less accessible tissues for gene
expression studies. We have previously described a series of analyses in the
VRC animals which enabled us to identify transcripts for which gene
expression patterns in blood are stable, heritable and correlate particularly
strongly with gene expression patterns in the brain 140. In the current study,
we present the genetic mapping by linkage analysis in the pedigreed animals
of the VRC of a cis eQTL for one of these transcripts – B3GALTL, a
glycosyltransferase which, when recessively mutated results in Peters plus
syndrome (OMIM #261540), a developmental delay disorder 141 – and our
subsequent use of association analysis in independently ascertained feral
animals from St. Kitts to localize the B3GALTL expression quantitative trait
variant (QTV) to a region of about 170 kb on the vervet chromosome 3.
Chapter 5
75
Materials and Methods Study samples
Two groups of vervet monkeys were investigated: related members of the
large inbred pedigree that constitutes the VRC; and apparently unrelated
individuals from the vervet population of St. Kitts. Pedigree samples consisted
of 347 individuals two years and older at the time of sample collection
(December 2007 - January 2008) and were described in Jasinska et al. 140.
The St. Kitts population sample consisted of 299 Caribbean vervets sampled
at the Saint Kitts Biomedical Research Foundation, SKBRF, (273 females and
26 males with mean (sd) ages of 11.95 (4.5) and 11.62 (4.8) years,
respectively), 279 of whom passed SNP genotyping quality control metrics
and provided high quality gene expression measurements using real time-
quantitative polymerase chain reaction (RT-qPCR).
Biological material
Genomic DNA samples were obtained from peripheral blood preserved in
ACD (acid-citrate-dextrose) anticoagulant or PaxGene DNA tubes using an
automated Gentra Autopure LS system (Qiagen, USA) and Gentra Puregene
chemistry (Qiagen, USA) or a standard phenol/chloroform extraction
procedure.
The PaxGene RNA system (PreAnalyticX) was used to preserve blood for
RNA extraction, which was subsequently performed using a PAXgene Blood
RNA Kit (Qiagen, USA) or PAXgene 96 Blood RNA Kit (Qiagen, USA). RNA
quality was determined with a Bioanalyzer 2100 (Agilent, USA) and RNA
quantity was determined using Nanodrop 8000 (Thermo Scientific, USA) or
PicoGreen (Invitrogen, USA).
Chapter 5
76
Expression microarray analysis
Microarray gene expression measurements for eQTL mapping were
performed using an Illumina HumanRef-8 v2 chip in 347 individuals from the
VRC pedigree, as described previously 140.
Filtering criteria for selecting the best eQTL candidates
A detailed description of the strategy to identify the most promising candidate
transcripts for eQTL mapping was presented in Jasinska et al. 140. Briefly, to
identify eQTL for which expression patterns in blood are highly correlated with
expression patterns in the brain, we created two datasets: 1) a set of matched
tissues from eight brain regions and peripheral blood from 12 individuals
(figure 2a); and 2) a set of duplicate blood samples from 18 individuals, all of
whom were sampled at two different time points (figure 2b). We developed
three criteria based on Spearman rank correlation (SRC) and variance
components analysis: 1) correlation between at least one brain region and
blood expression profiles SRC > 0.55; 2) the proportion of variability (PV) of
expression attributable to inter-individual differences, as compared to between
tissues within individual, for at least one brain-blood comparison > 0.55; and
3) the PV of expression attributable to inter-individual differences, as
compared to between replicate samples within individual > 0.55. Finally, we
focused only on probes, which were detected in all samples from both data
sets.
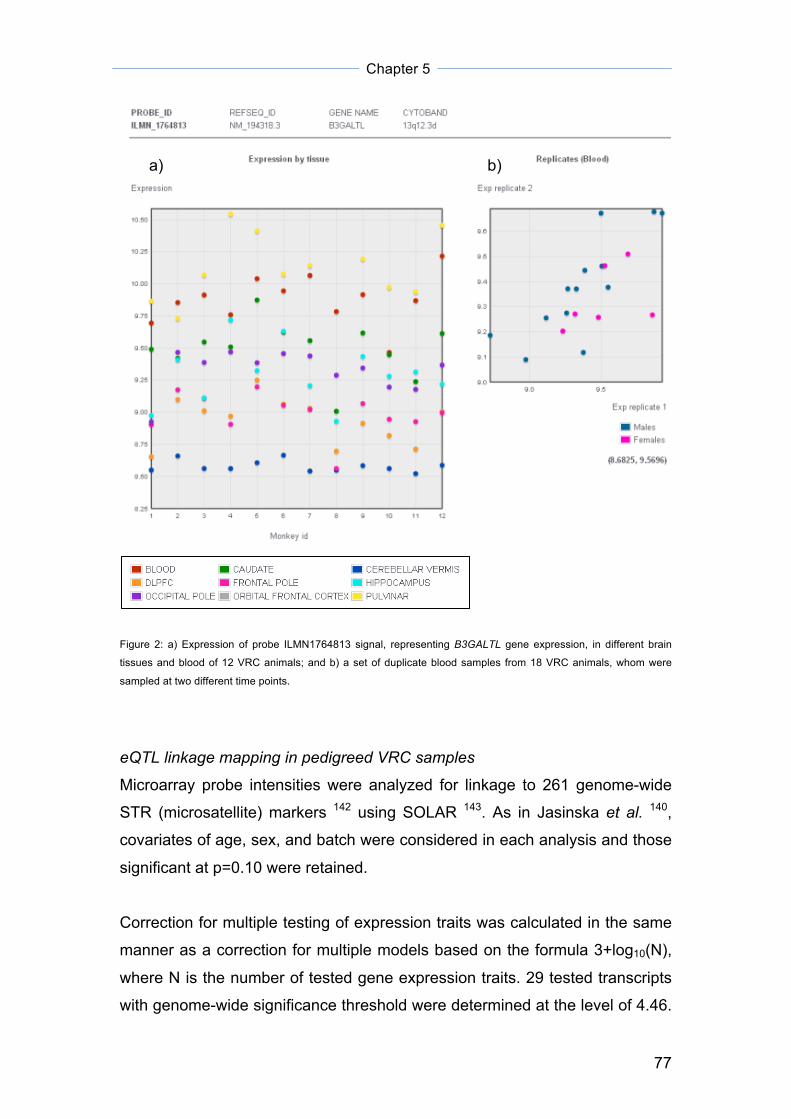
Chapter 5
77
Figure 2: a) Expression of probe ILMN1764813 signal, representing B3GALTL gene expression, in different brain
tissues and blood of 12 VRC animals; and b) a set of duplicate blood samples from 18 VRC animals, whom were
sampled at two different time points.
eQTL linkage mapping in pedigreed VRC samples
Microarray probe intensities were analyzed for linkage to 261 genome-wide
STR (microsatellite) markers 142 using SOLAR 143. As in Jasinska et al. 140,
covariates of age, sex, and batch were considered in each analysis and those
significant at p=0.10 were retained.
Correction for multiple testing of expression traits was calculated in the same
manner as a correction for multiple models based on the formula 3+log10(N),
where N is the number of tested gene expression traits. 29 tested transcripts
with genome-wide significance threshold were determined at the level of 4.46.
a) b)
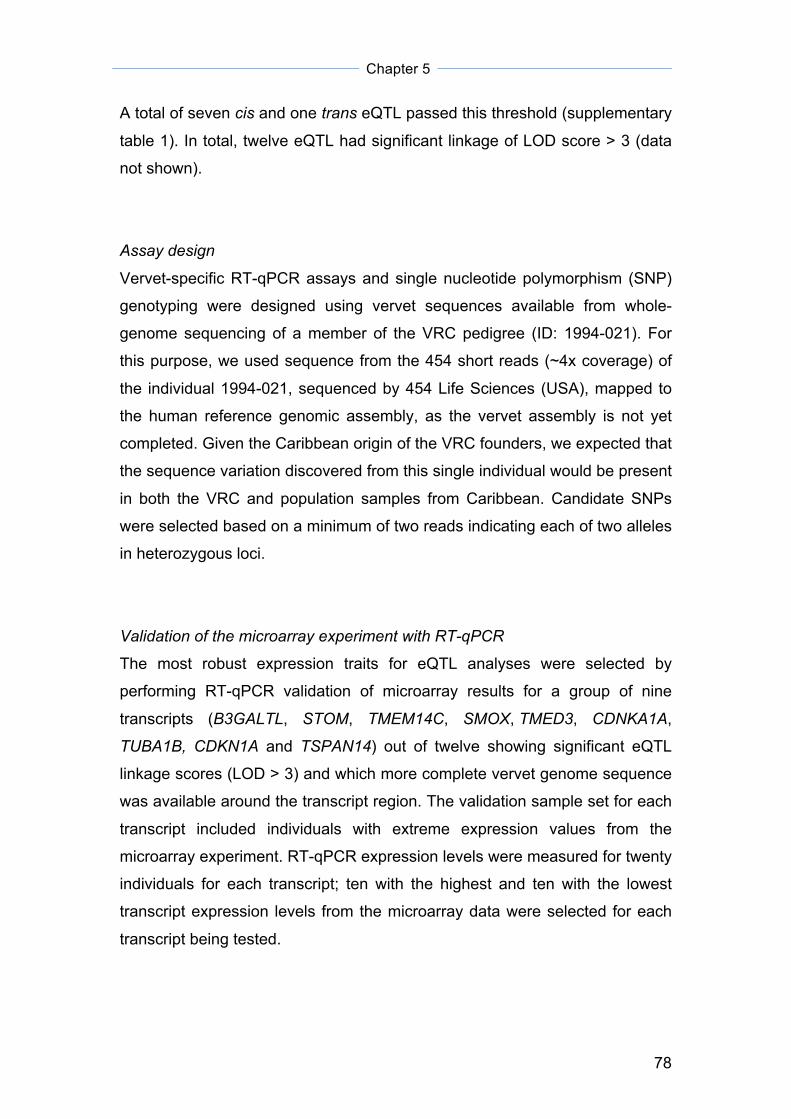
Chapter 5
78
A total of seven cis and one trans eQTL passed this threshold (supplementary
table 1). In total, twelve eQTL had significant linkage of LOD score > 3 (data
not shown).
Assay design
Vervet-specific RT-qPCR assays and single nucleotide polymorphism (SNP)
genotyping were designed using vervet sequences available from whole-
genome sequencing of a member of the VRC pedigree (ID: 1994-021). For
this purpose, we used sequence from the 454 short reads (~4x coverage) of
the individual 1994-021, sequenced by 454 Life Sciences (USA), mapped to
the human reference genomic assembly, as the vervet assembly is not yet
completed. Given the Caribbean origin of the VRC founders, we expected that
the sequence variation discovered from this single individual would be present
in both the VRC and population samples from Caribbean. Candidate SNPs
were selected based on a minimum of two reads indicating each of two alleles
in heterozygous loci.
Validation of the microarray experiment with RT-qPCR
The most robust expression traits for eQTL analyses were selected by
performing RT-qPCR validation of microarray results for a group of nine
transcripts (B3GALTL, STOM, TMEM14C, SMOX, TMED3, CDNKA1A,
TUBA1B, CDKN1A and TSPAN14) out of twelve showing significant eQTL
linkage scores (LOD > 3) and which more complete vervet genome sequence
was available around the transcript region. The validation sample set for each
transcript included individuals with extreme expression values from the
microarray experiment. RT-qPCR expression levels were measured for twenty
individuals for each transcript; ten with the highest and ten with the lowest
transcript expression levels from the microarray data were selected for each
transcript being tested.
Chapter 5
79
For RT-qPCR experiments, 500 ng of blood-isolated RNA was converted into
cDNA using the High Capacity RNA-to-cDNA kit (Applied Biosystems, USA)
according to the manufacturer’s protocol. RT-qPCR reactions were prepared
using the SYBR® PCR Master Mix from Applied Biosystems (USA) and oligos
from Invitrogen (USA), and analyzed with the 7900HT Fast Real Time PCR
System (Applied Biosystems, USA), according to the manufacturers’
protocols. Amplicons used ranged from 80 to 120 bp in size. For cDNA
amplification, 25-50 ng of cDNA and 300 nM primers were used per sample
reaction and each sample was analyzed in triplicates. The amount of cDNA
used was according to optimized conditions per transcript; all average Ct
values were less than 30 cycles. Expression changes for each transcript were
quantified relative to GAPDH, selected as an endogenous control, using the
Pfaffl method 144. The medians of expression from the bottom tail and top tail
as defined by microarray results were compared with RT-qPCR quantification
results using a non-parametric Wilcoxon test.
SNP genotyping in the St. Kitts population samples
For fine-mapping the selected eQTL, we focused on the regions centered on
a target gene and approximately 100 kb flanks. A total of 92 candidate SNPs
localized in target genes (B3GALTL, STOM and SMOX) and their flanks were
genotyped in these population samples (table 2). SNP genotyping was
performed with the Sequenom iPLEX system technology (Sequenom, USA).
Three multiplex PCR assays (36-, 33-, 23-plex) consisting a total of 92 SNPs
were designed using the MassARRAY software (v3.1), with default settings of
the software and no-masking of repeats. Oligos for the PCR reactions and
mass-extend reactions were ordered from Integrated DNA Technologies,
USA. Reactions for the SNP genotyping were prepared according to the
MassARRAY® iPLEX® Gold SNP Genotyping protocol from Sequenom, USA.
Multiple positive, negative and non-amplification controls were included. The
success rate of SNP discovery was 45.6% (42 out of 92 genotyped SNPs
showed common polymorphism in Hardy-Weinberg equilibrium and were
used for association analysis).
Chapter 5
80
Association fine-mapping
Correlation between blood expression levels of three transcripts B3GALTL,
STOM and SMOX measured by RT-qPCR and local SNPs were measured in
a population of St. Kitts vervets. We tested for association between SNP
genotypes and overall gene expression (from both alleles) at a given locus
using regression analysis. Each genotype was coded as 0, 1 or 2 copies of
the minor allele, and expression levels regressed on this variable, assuming
an additive model of action of the minor allele.
Bonferroni correction was used to adjust for multiple testing in association
analysis. Taking into consideration the correction for 42 informative SNPs,
which were used for association studies, the genome-wide significance
threshold was determined as 0.05/42=0.0012.
Results Using 347 animals from the VRC, we conducted genome-wide linkage
mapping of 29 gene expression traits. The animals had been genotyped for
the 261 microsatellite markers that constitute the first generation vervet
genetic map 142 and gene expression in peripheral blood was assayed in
these monkeys using the Illumina HumanRef-8 v2 chip. As previously
described in Jasinska et al. 140, these 29 expression measures showed
significant heritability in the VRC, and represented transcripts whose
expression pattern in blood was stable across at least two time points and
was highly correlated with their expression pattern in brain tissues in twelve
VRC animals. Twelve significant eQTL (LOD > 3) were identified from the 29
transcripts; ten cis and two trans in the eQTL linkage mapping. Out of the
twelve transcripts, we selected nine with the most robust expression for eQTL
analyses for validation using RT-qPCR. Six transcripts – B3GALTL, STOM,
TMEM14C, SMOX, TMED3 and CDNKA1A – were validated successfully
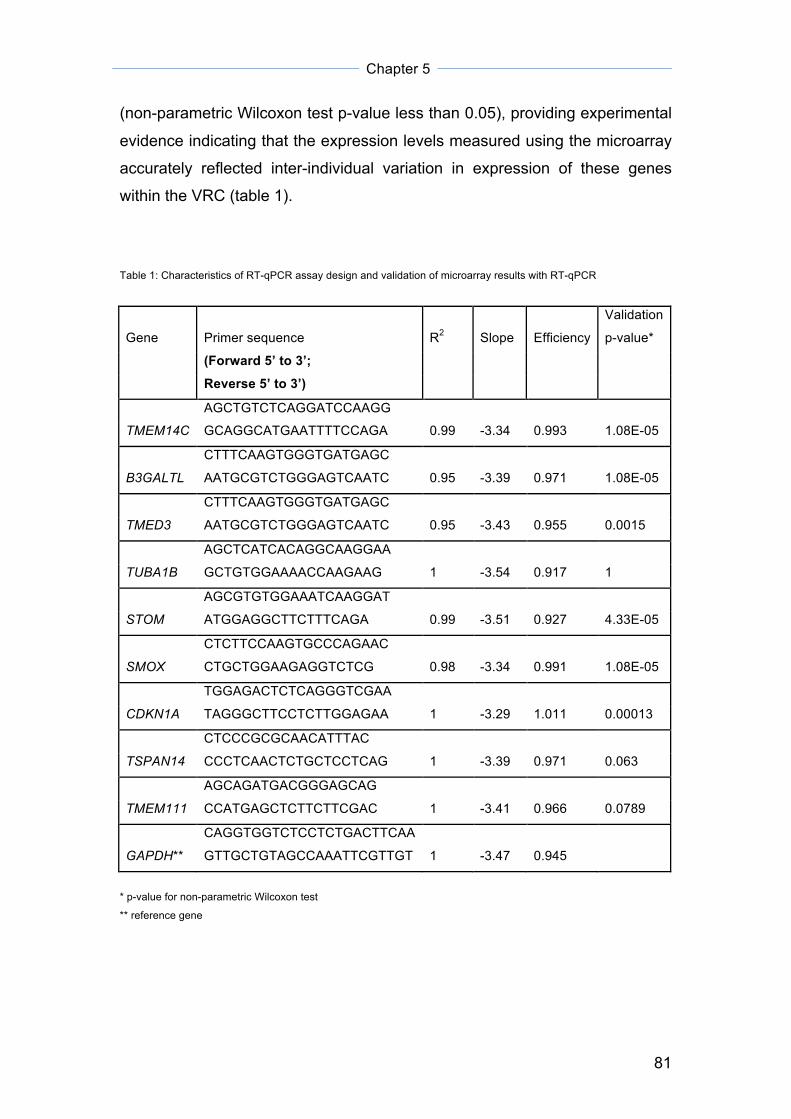
Chapter 5
81
(non-parametric Wilcoxon test p-value less than 0.05), providing experimental
evidence indicating that the expression levels measured using the microarray
accurately reflected inter-individual variation in expression of these genes
within the VRC (table 1).
Table 1: Characteristics of RT-qPCR assay design and validation of microarray results with RT-qPCR
Gene Primer sequence R2 Slope Efficiency
Validation
p-value*
(Forward 5’ to 3’;
Reverse 5’ to 3’)
AGCTGTCTCAGGATCCAAGG
TMEM14C GCAGGCATGAATTTTCCAGA 0.99 -3.34 0.993 1.08E-05
CTTTCAAGTGGGTGATGAGC
B3GALTL AATGCGTCTGGGAGTCAATC 0.95 -3.39 0.971 1.08E-05
CTTTCAAGTGGGTGATGAGC
TMED3 AATGCGTCTGGGAGTCAATC 0.95 -3.43 0.955 0.0015
AGCTCATCACAGGCAAGGAA
TUBA1B GCTGTGGAAAACCAAGAAG 1 -3.54 0.917 1
AGCGTGTGGAAATCAAGGAT
STOM ATGGAGGCTTCTTTCAGA 0.99 -3.51 0.927 4.33E-05
CTCTTCCAAGTGCCCAGAAC
SMOX CTGCTGGAAGAGGTCTCG 0.98 -3.34 0.991 1.08E-05
TGGAGACTCTCAGGGTCGAA
CDKN1A TAGGGCTTCCTCTTGGAGAA 1 -3.29 1.011 0.00013
CTCCCGCGCAACATTTAC
TSPAN14 CCCTCAACTCTGCTCCTCAG 1 -3.39 0.971 0.063
AGCAGATGACGGGAGCAG
TMEM111 CCATGAGCTCTTCTTCGAC 1 -3.41 0.966 0.0789
CAGGTGGTCTCCTCTGACTTCAA
GAPDH** GTTGCTGTAGCCAAATTCGTTGT 1 -3.47 0.945
* p-value for non-parametric Wilcoxon test
** reference gene
Chapter 5
82
A particularly strong linkage (peak LOD score of 8.65) was detected for a
transcript within B3GALTL to the marker D13S1233 (supplementary table 1,
supplementary figure 1 and 5a) in the eQTL linkage analytical stage, which
expression was also validated. Hence, using this transcript from B3GALTL as
an example, we continued on to the second stage of the classical two-stage
genetic approach where we further tested the utility of the feral vervet
population samples to refine the QTL findings from the pedigreed VRC. SNPs
in the region of B3GALTL were obtained from the Vervet Genome
Sequencing Project (VGSP). The VGSP generates a reference assembly by
combining short-read whole-genome sequencing of a VRC animal (ID: 1994-
021) previously used to create a vervet BAC library (CHORI-252). Given the
Caribbean origin of the VRC, we expected that sequence variation discovered
from this single individual would be present both in the VRC pedigree and in
the natural Caribbean population. We identified 26 putative SNPs over an
interval that incorporated the entire extent of B3GALTL, including
approximately 100 kb at both the 5’ and 3’ flanks in a SNP discovery effort
specific to the vervet genome (supplementary figure 2). We used 15 SNPs
that were polymorphic in this sample to genotype 279 feral-born and
presumably unrelated animals from St. Kitts, all of whom had been assayed
for B3GALTL gene expression using the same vervet-specific RT-qPCR
assay previously employed in the VRC (table 2, supplementary figure 3). Four
of B3GALTL SNPs displayed significant association at p <0.0001. Twenty
vervet SNPs of STOM and seven SNPs of SMOX were also tested for
association in the Caribbean population but no significant association of these
two eQTL was found (table 2).
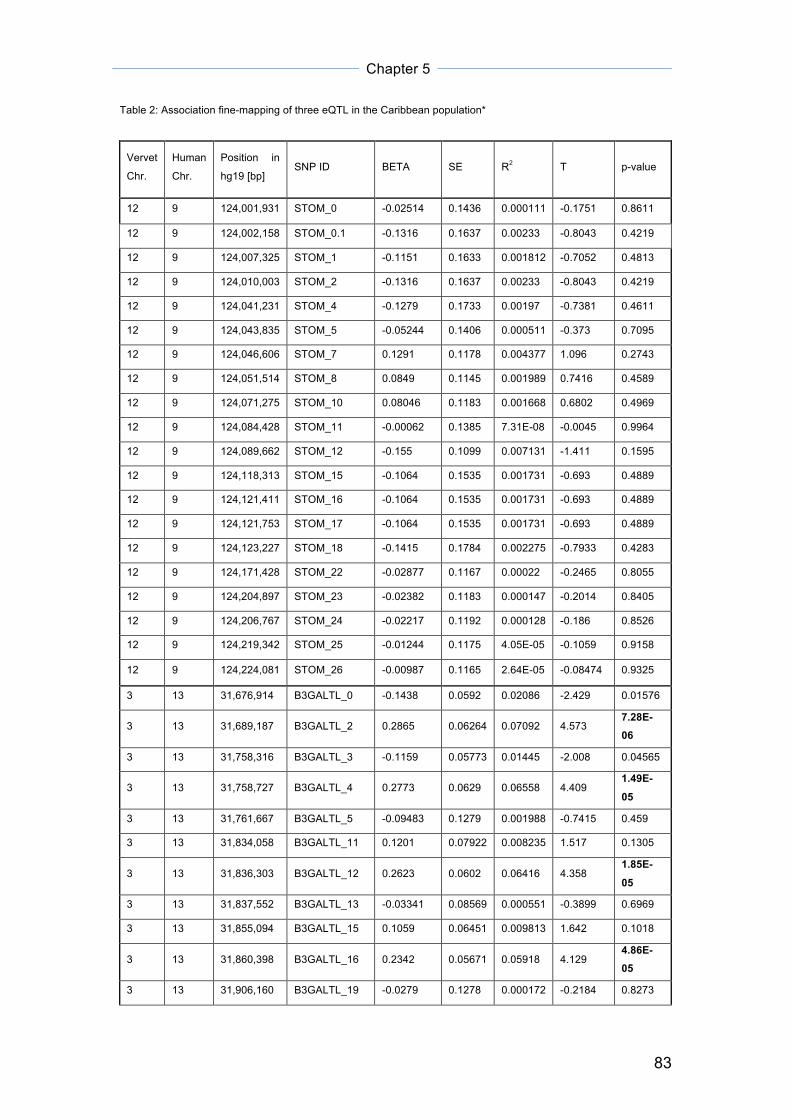
Chapter 5
83
Table 2: Association fine-mapping of three eQTL in the Caribbean population*
Vervet
Chr.
Human
Chr.
Position in
hg19 [bp] SNP ID BETA SE R2 T p-value
12 9 124,001,931 STOM_0 -0.02514 0.1436 0.000111 -0.1751 0.8611
12 9 124,002,158 STOM_0.1 -0.1316 0.1637 0.00233 -0.8043 0.4219
12 9 124,007,325 STOM_1 -0.1151 0.1633 0.001812 -0.7052 0.4813
12 9 124,010,003 STOM_2 -0.1316 0.1637 0.00233 -0.8043 0.4219
12 9 124,041,231 STOM_4 -0.1279 0.1733 0.00197 -0.7381 0.4611
12 9 124,043,835 STOM_5 -0.05244 0.1406 0.000511 -0.373 0.7095
12 9 124,046,606 STOM_7 0.1291 0.1178 0.004377 1.096 0.2743
12 9 124,051,514 STOM_8 0.0849 0.1145 0.001989 0.7416 0.4589
12 9 124,071,275 STOM_10 0.08046 0.1183 0.001668 0.6802 0.4969
12 9 124,084,428 STOM_11 -0.00062 0.1385 7.31E-08 -0.0045 0.9964
12 9 124,089,662 STOM_12 -0.155 0.1099 0.007131 -1.411 0.1595
12 9 124,118,313 STOM_15 -0.1064 0.1535 0.001731 -0.693 0.4889
12 9 124,121,411 STOM_16 -0.1064 0.1535 0.001731 -0.693 0.4889
12 9 124,121,753 STOM_17 -0.1064 0.1535 0.001731 -0.693 0.4889
12 9 124,123,227 STOM_18 -0.1415 0.1784 0.002275 -0.7933 0.4283
12 9 124,171,428 STOM_22 -0.02877 0.1167 0.00022 -0.2465 0.8055
12 9 124,204,897 STOM_23 -0.02382 0.1183 0.000147 -0.2014 0.8405
12 9 124,206,767 STOM_24 -0.02217 0.1192 0.000128 -0.186 0.8526
12 9 124,219,342 STOM_25 -0.01244 0.1175 4.05E-05 -0.1059 0.9158
12 9 124,224,081 STOM_26 -0.00987 0.1165 2.64E-05 -0.08474 0.9325
3 13 31,676,914 B3GALTL_0 -0.1438 0.0592 0.02086 -2.429 0.01576
3 13 31,689,187 B3GALTL_2 0.2865 0.06264 0.07092 4.573 7.28E-06
3 13 31,758,316 B3GALTL_3 -0.1159 0.05773 0.01445 -2.008 0.04565
3 13 31,758,727 B3GALTL_4 0.2773 0.0629 0.06558 4.409 1.49E-
05
3 13 31,761,667 B3GALTL_5 -0.09483 0.1279 0.001988 -0.7415 0.459
3 13 31,834,058 B3GALTL_11 0.1201 0.07922 0.008235 1.517 0.1305
3 13 31,836,303 B3GALTL_12 0.2623 0.0602 0.06416 4.358 1.85E-
05
3 13 31,837,552 B3GALTL_13 -0.03341 0.08569 0.000551 -0.3899 0.6969
3 13 31,855,094 B3GALTL_15 0.1059 0.06451 0.009813 1.642 0.1018
3 13 31,860,398 B3GALTL_16 0.2342 0.05671 0.05918 4.129 4.86E-05
3 13 31,906,160 B3GALTL_19 -0.0279 0.1278 0.000172 -0.2184 0.8273
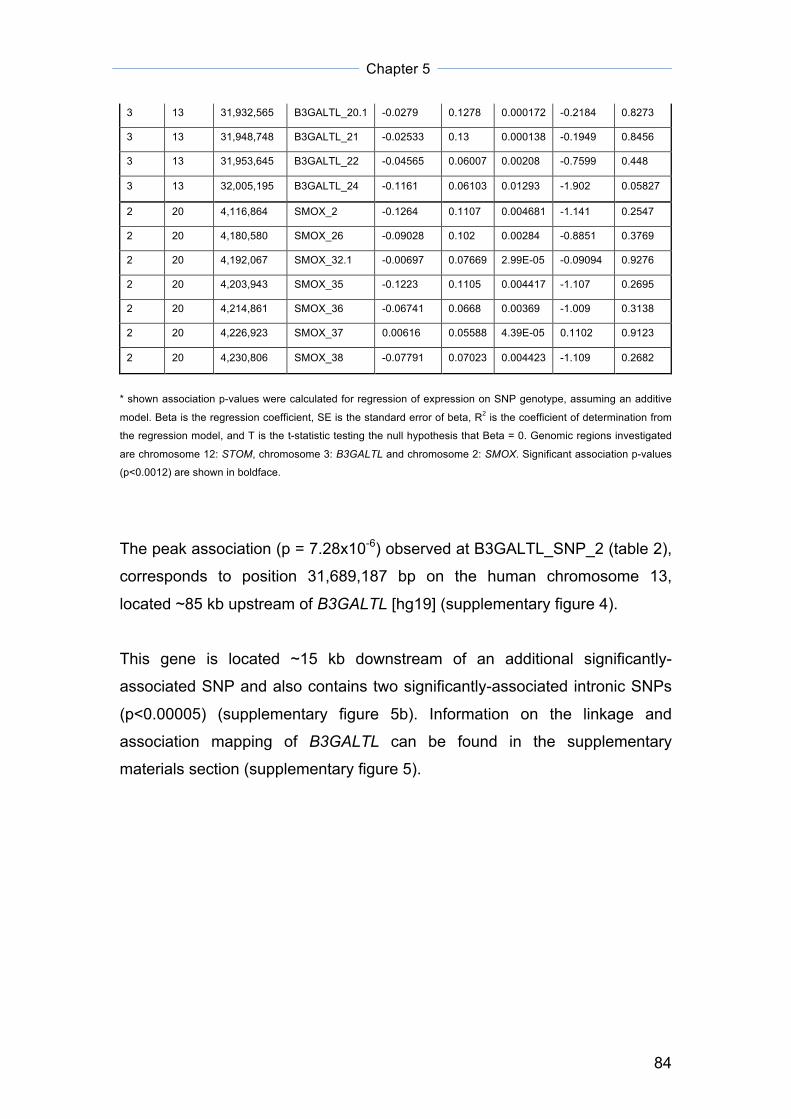
Chapter 5
84
3 13 31,932,565 B3GALTL_20.1 -0.0279 0.1278 0.000172 -0.2184 0.8273
3 13 31,948,748 B3GALTL_21 -0.02533 0.13 0.000138 -0.1949 0.8456
3 13 31,953,645 B3GALTL_22 -0.04565 0.06007 0.00208 -0.7599 0.448
3 13 32,005,195 B3GALTL_24 -0.1161 0.06103 0.01293 -1.902 0.05827
2 20 4,116,864 SMOX_2 -0.1264 0.1107 0.004681 -1.141 0.2547
2 20 4,180,580 SMOX_26 -0.09028 0.102 0.00284 -0.8851 0.3769
2 20 4,192,067 SMOX_32.1 -0.00697 0.07669 2.99E-05 -0.09094 0.9276
2 20 4,203,943 SMOX_35 -0.1223 0.1105 0.004417 -1.107 0.2695
2 20 4,214,861 SMOX_36 -0.06741 0.0668 0.00369 -1.009 0.3138
2 20 4,226,923 SMOX_37 0.00616 0.05588 4.39E-05 0.1102 0.9123
2 20 4,230,806 SMOX_38 -0.07791 0.07023 0.004423 -1.109 0.2682
* shown association p-values were calculated for regression of expression on SNP genotype, assuming an additive
model. Beta is the regression coefficient, SE is the standard error of beta, R2 is the coefficient of determination from
the regression model, and T is the t-statistic testing the null hypothesis that Beta = 0. Genomic regions investigated
are chromosome 12: STOM, chromosome 3: B3GALTL and chromosome 2: SMOX. Significant association p-values
(p<0.0012) are shown in boldface.
The peak association (p = 7.28x10⁻⁶) observed at B3GALTL_SNP_2 (table 2),
corresponds to position 31,689,187 bp on the human chromosome 13,
located ~85 kb upstream of B3GALTL [hg19] (supplementary figure 4).
This gene is located ~15 kb downstream of an additional significantly-
associated SNP and also contains two significantly-associated intronic SNPs
(p<0.00005) (supplementary figure 5b). Information on the linkage and
association mapping of B3GALTL can be found in the supplementary
materials section (supplementary figure 5).
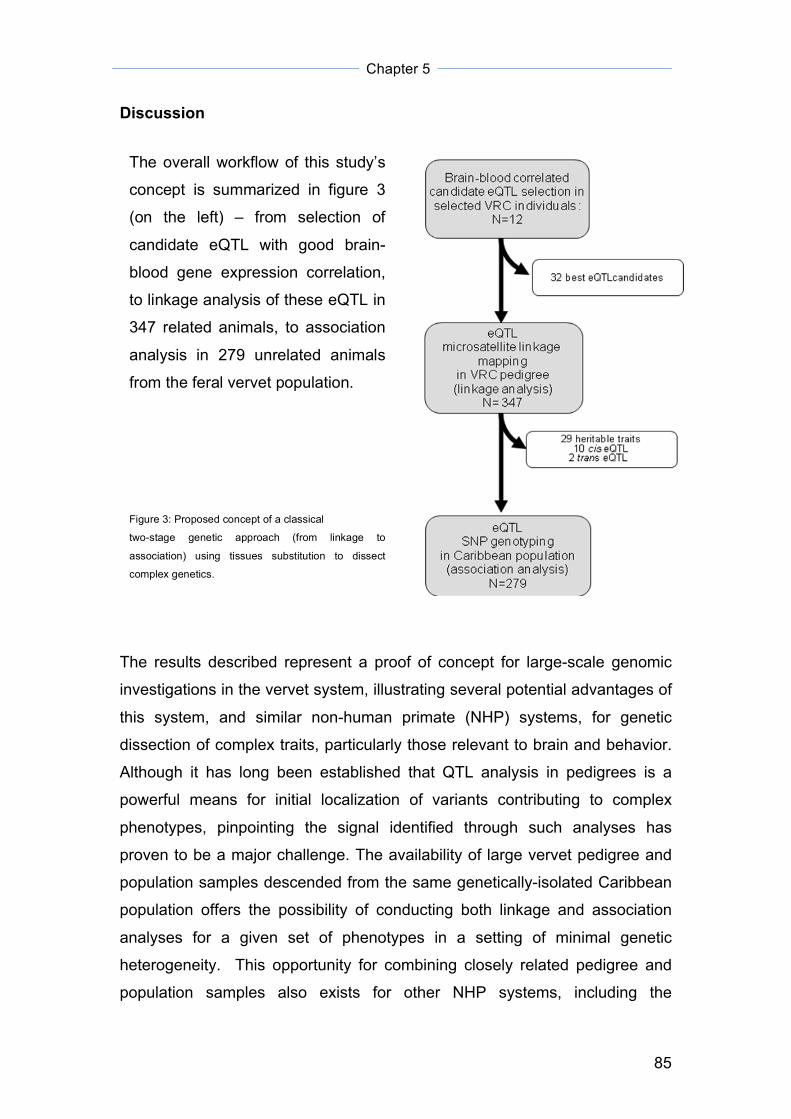
Chapter 5
85
Discussion
The results described represent a proof of concept for large-scale genomic
investigations in the vervet system, illustrating several potential advantages of
this system, and similar non-human primate (NHP) systems, for genetic
dissection of complex traits, particularly those relevant to brain and behavior.
Although it has long been established that QTL analysis in pedigrees is a
powerful means for initial localization of variants contributing to complex
phenotypes, pinpointing the signal identified through such analyses has
proven to be a major challenge. The availability of large vervet pedigree and
population samples descended from the same genetically-isolated Caribbean
population offers the possibility of conducting both linkage and association
analyses for a given set of phenotypes in a setting of minimal genetic
heterogeneity. This opportunity for combining closely related pedigree and
population samples also exists for other NHP systems, including the
The overall workflow of this study’s
concept is summarized in figure 3
(on the left) – from selection of
candidate eQTL with good brain-
blood gene expression correlation,
to linkage analysis of these eQTL in
347 related animals, to association
analysis in 279 unrelated animals
from the feral vervet population.
Figure 3: Proposed concept of a classical
two-stage genetic approach (from linkage to
association) using tissues substitution to dissect
complex genetics.
Chapter 5
86
cynomolgous macaques from the island of Mauritius 145 and vervets of the
pygerytherus subspecies in the Western Cape Province of South Africa 146.
Traditionally, genetic investigations of NHP have been limited to relatively
small samples that could be maintained in primate colonies. The development
of technologies for tracking and repeat identification of wild or feral NHP
populations now enables a wide range of longitudinal investigations of various
biomedically important traits. Given the size of such populations, the vervet
population in sub-Saharan Africa likely includes several million monkeys, and
even large-scale genetic investigations in such systems may be relatively
inexpensive compared to human research.
Such investigations are now possible given the rapid development of tools for
NHP genomic research. The current study was conducted with relatively
rudimentary genomic information; it required the utilization of human genomic
information and reagents, including the genome assembly, sparse
microsatellite sets, and gene expression arrays, which diminished the
opportunities for identifying both linkage and association signals. The
imminent availability of the vervet reference genome assembly, genome-wide
genetic variants, and tissue-specific transcriptome databases will greatly
expand the scope of genetic investigation in this system. In particular, the
vervet will permit large-scale implementation of a strategy for systematic
functional genomic characterization of inaccessible tissues, which is largely
infeasible in humans.
The combination of genome-wide gene expression and genetic variation data
has proven invaluable in the genetic dissection of a wide range of complex
traits 147. eQTL mapping provides a link to specific genetic markers that are
associated with the trait being studied and the expression of specific gene/s.
For example, SNPs that represent eQTL are more likely than other SNPs to
identify significant association in GWAS 148. The study of eQTL can
complement GWAS data in picking out unobvious candidate genes. A
successful example was shown in an asthma study, which initial strong
Chapter 5
87
association signal spanning over 200 kb on chromosome 17q23 containing 19
genes but no obvious candidate for asthma pathology 149. Subsequent eQTL
study was carried out and the eQTL data was used with the association data,
which indicated that the genetic variants regulating ORMDL3 gene expression
determine the susceptibility to childhood asthma. Another successful example
is a GWAS carried out for Crohn’s disease, in which results showed genetic
markers with strong association signals located in a gene desert on
chromosome 5p13.1 150. However, a comparison with eQTL database
revealed that this associated region modulates the gene expression of
PTGER4, which is located 270 kb away.
In human, gene expression studies is generally limited to readily accessible
tissues, particularly blood and lymphoblastoid cell lines (LCLs), and the use of
such tissues has enabled insights into the functional impact of genetic
variation for several genes implicated in complex brain-specific phenotypes.
Yet, many phenotypes depend on functional variation that is distinctive to – or
in some cases limited to – particular tissues, for example, the effects of a
substantial proportion of eQTL may be cell-type dependent 151. The possibility
of assaying virtually all tissue types with the vervet samples that are also
suitable for large-scale genetic investigations offers a unique opportunity to
initiate primate systems biology.
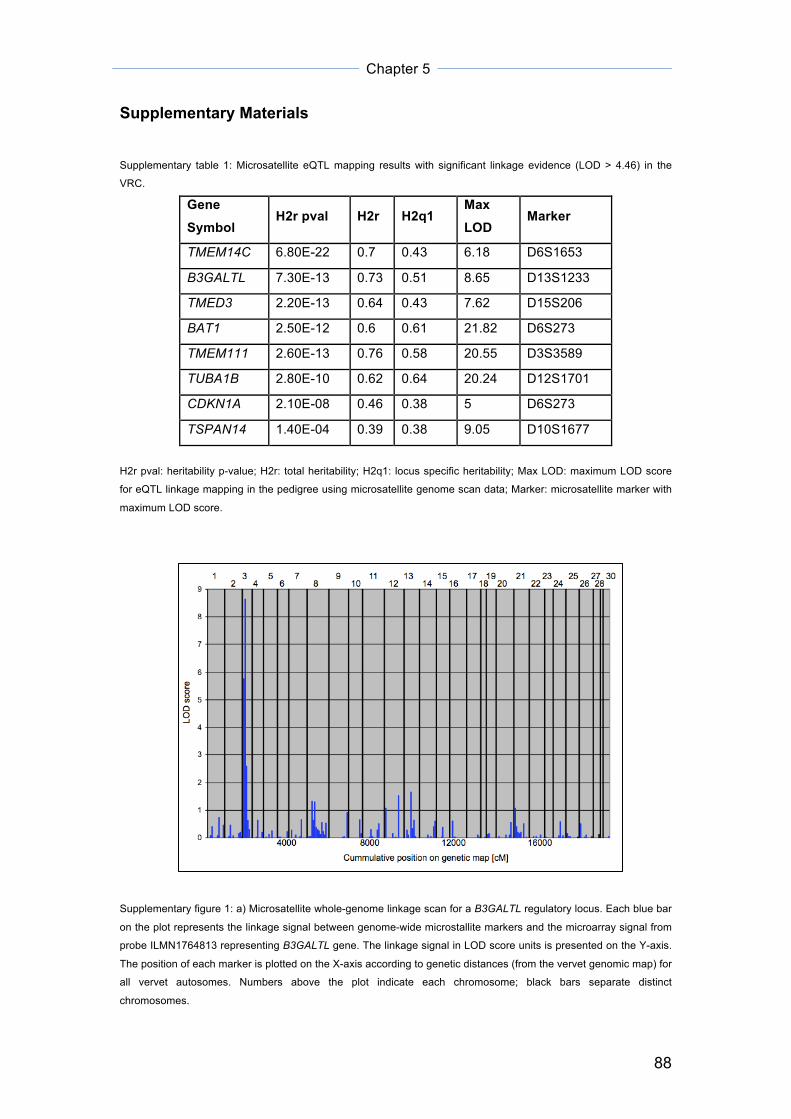
Chapter 5
88
Supplementary Materials Supplementary table 1: Microsatellite eQTL mapping results with significant linkage evidence (LOD > 4.46) in the
VRC.
Gene
Symbol H2r pval H2r H2q1
Max
LOD Marker
TMEM14C 6.80E-22 0.7 0.43 6.18 D6S1653
B3GALTL 7.30E-13 0.73 0.51 8.65 D13S1233
TMED3 2.20E-13 0.64 0.43 7.62 D15S206
BAT1 2.50E-12 0.6 0.61 21.82 D6S273
TMEM111 2.60E-13 0.76 0.58 20.55 D3S3589
TUBA1B 2.80E-10 0.62 0.64 20.24 D12S1701
CDKN1A 2.10E-08 0.46 0.38 5 D6S273
TSPAN14 1.40E-04 0.39 0.38 9.05 D10S1677
H2r pval: heritability p-value; H2r: total heritability; H2q1: locus specific heritability; Max LOD: maximum LOD score
for eQTL linkage mapping in the pedigree using microsatellite genome scan data; Marker: microsatellite marker with
maximum LOD score.
Supplementary figure 1: a) Microsatellite whole-genome linkage scan for a B3GALTL regulatory locus. Each blue bar
on the plot represents the linkage signal between genome-wide microstallite markers and the microarray signal from
probe ILMN1764813 representing B3GALTL gene. The linkage signal in LOD score units is presented on the Y-axis.
The position of each marker is plotted on the X-axis according to genetic distances (from the vervet genomic map) for
all vervet autosomes. Numbers above the plot indicate each chromosome; black bars separate distinct
chromosomes.
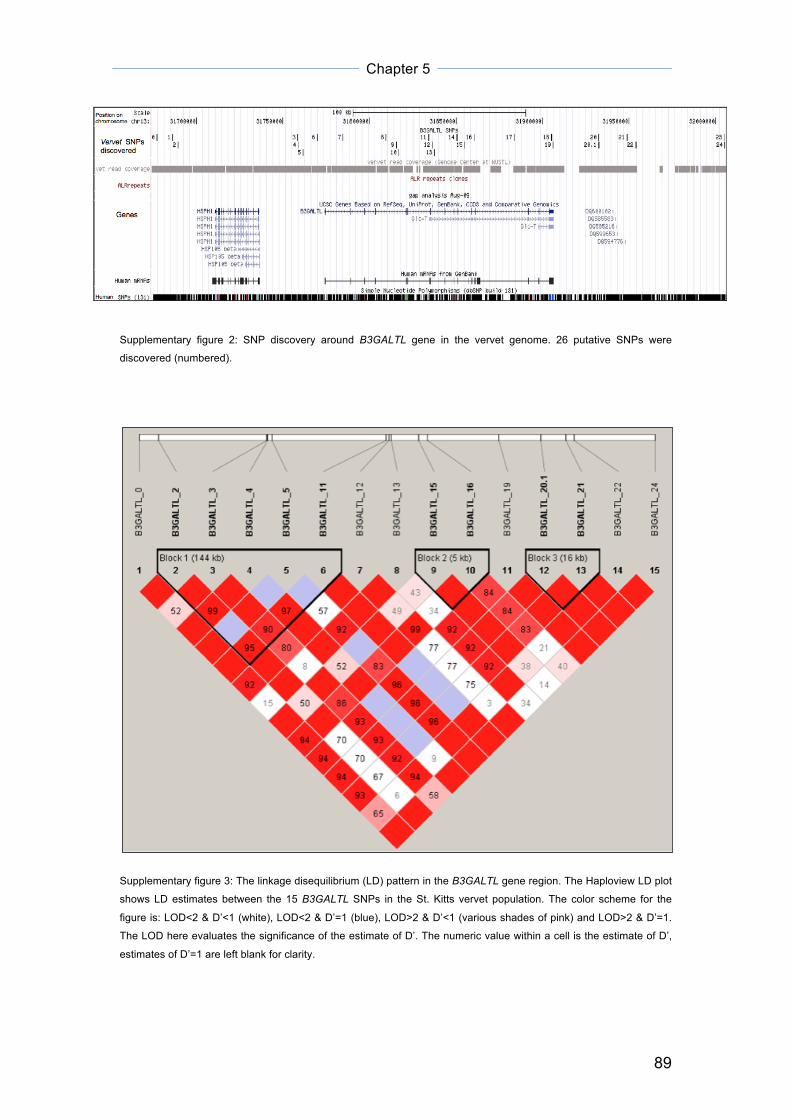
Chapter 5
89
Supplementary figure 2: SNP discovery around B3GALTL gene in the vervet genome. 26 putative SNPs were
discovered (numbered).
Supplementary figure 3: The linkage disequilibrium (LD) pattern in the B3GALTL gene region. The Haploview LD plot
shows LD estimates between the 15 B3GALTL SNPs in the St. Kitts vervet population. The color scheme for the
figure is: LOD<2 & D’<1 (white), LOD<2 & D’=1 (blue), LOD>2 & D’<1 (various shades of pink) and LOD>2 & D’=1.
The LOD here evaluates the significance of the estimate of D’. The numeric value within a cell is the estimate of D’,
estimates of D’=1 are left blank for clarity.
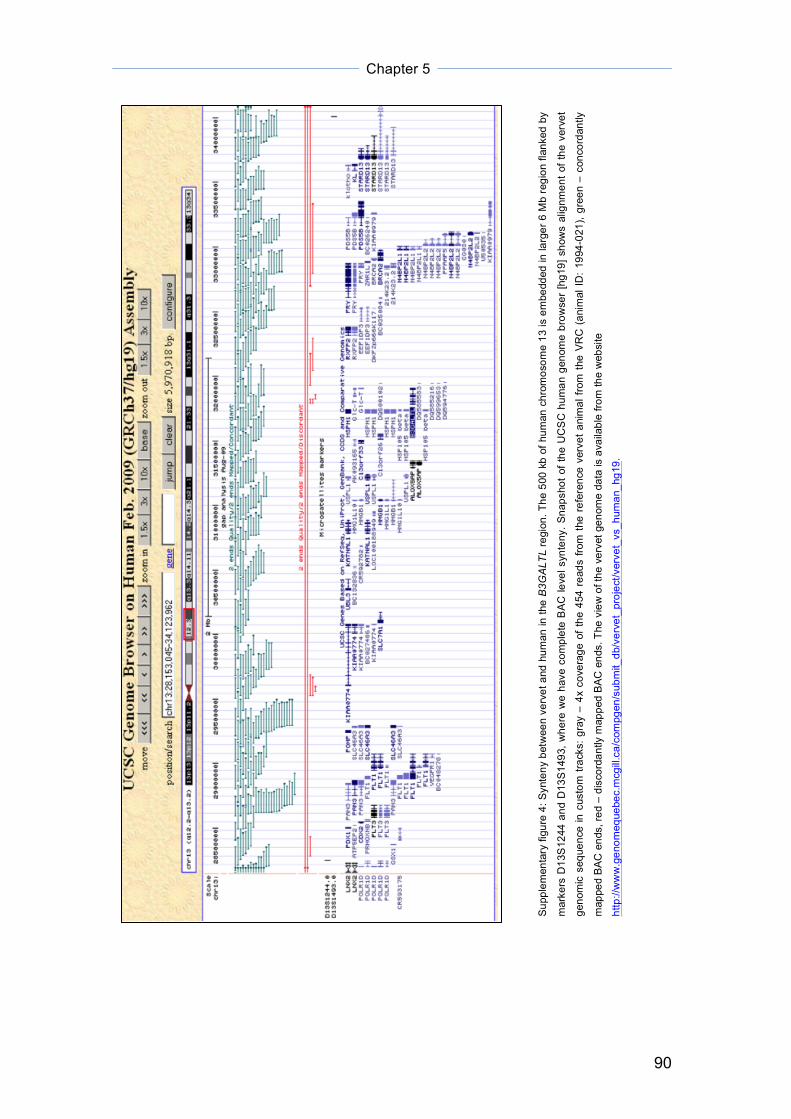
Chapter 5
90
Sup
plem
enta
ry fi
gure
4: S
ynte
ny b
etw
een
verv
et a
nd h
uman
in th
e B
3GA
LTL
regi
on. T
he 5
00 k
b of
hum
an c
hrom
osom
e 13
is e
mbe
dded
in la
rger
6 M
b re
gion
flan
ked
by
mar
kers
D13
S12
44 a
nd D
13S
1493
, whe
re w
e ha
ve c
ompl
ete
BA
C le
vel s
ynte
ny. S
naps
hot o
f the
UC
SC
hum
an g
enom
e br
owse
r [h
g19]
sho
ws
alig
nmen
t of t
he v
erve
t
geno
mic
seq
uenc
e in
cus
tom
trac
ks: g
ray
– 4x
cov
erag
e of
the
454
read
s fro
m t
he r
efer
ence
ver
vet a
nim
al f
rom
the
VR
C (
anim
al ID
: 19
94-0
21),
gree
n –
conc
orda
ntly
map
ped
BA
C e
nds,
red
– di
scor
dant
ly m
appe
d B
AC
end
s. T
he v
iew
of t
he v
erve
t gen
ome
data
is a
vaila
ble
from
the
web
site
http
://w
ww
.gen
omeq
uebe
c.m
cgill
.ca/
com
pgen
/sub
mit_
db/v
erve
t_pr
ojec
t/ver
vet_
vs_h
uman
_hg1
9.
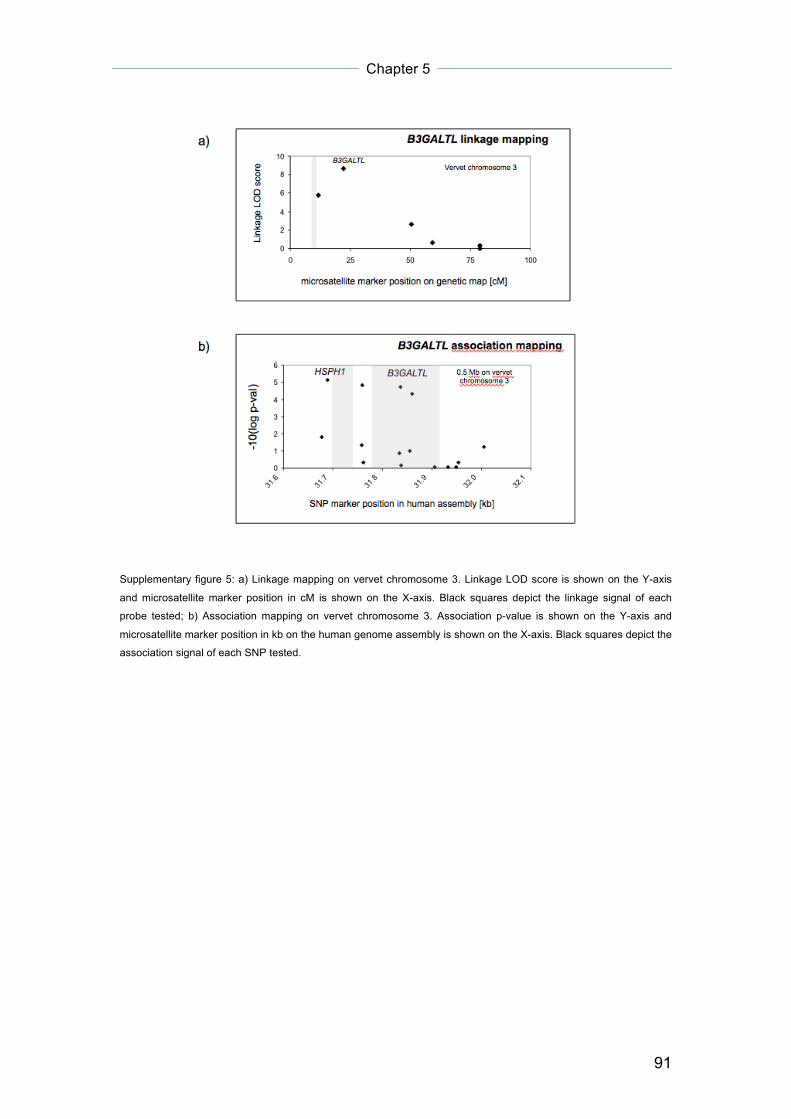
Chapter 5
91
Supplementary figure 5: a) Linkage mapping on vervet chromosome 3. Linkage LOD score is shown on the Y-axis
and microsatellite marker position in cM is shown on the X-axis. Black squares depict the linkage signal of each
probe tested; b) Association mapping on vervet chromosome 3. Association p-value is shown on the Y-axis and
microsatellite marker position in kb on the human genome assembly is shown on the X-axis. Black squares depict the
association signal of each SNP tested.
92
Chapter 6
Chapter 6
Tip of the iceberg --- What’s next?
From linkage mapping in large families with Mendelian pattern of inheritance
to association studies in the general population, the earlier chapters, 2 to 4,
attempt to cover the classical genetic approach in search for genes or genetic
variations, which are qualitative factors, influencing psychiatric diseases.
Rounding up the bulk of the previous chapters, chapter 5 not only investigates
the feasibility of applying the classical two-stage genetic approach to
psychiatric and behavioral disorders/traits, it also introduces another genetic
perspective, which is expression quantitative trait loci (eQTL), a quantitative
factor, to consider aside from the traditional candidate gene studies. eQTL are
segments of the genome which regulate gene expression, found to be usually
located a distance away from the gene that they are regulating 152.
Aside from the typical gene mutations, variants and expression profiling
presented in the previous chapters, there are other genetic aspects one can
consider in elucidating the genetic architecture of psychiatric and behavioral
phenotypes, in which large families can endow the experimental power more
than non-familial-based setups. Some popular genetic aspects in recent
psychiatric and behavioral studies, in which large family-based investigation
can be useful, are briefly introduced below:
1) Genome structural variations
Structural variants are genomic rearrangements that affect more than 50 bp of
sequence, which include deletions, insertions, inversions, duplications,
transpositions and translocations 153. Copy number variations (CNVs) are
defined as structural variants resulting in varying numbers of base pairs in the
genome. A recent Nature Genetics review on genome structural variation has
summarized from a number of studies that human genomes differ more as a
Chapter 6
93
consequence of structural variations than single base-pair differences; and
that rare CNVs are collectively quite common in the general population, with
significant differences in neurocognitive and neuropsychiatric diseases 154. As
described in chapter 1, rare genetic occurrences (e.g. genetic mutations and
variants), which can also include structural variations, can be more easily
discovered from large family-based studies. An example of such has been
reported in one of our attention-deficit/hyperactivity disorder (ADHD) families
in chapter 2, where a seemingly monogenic CNV is revealed to be co-
segregating with ADHD by our collaborators’ efforts 155.
2) Endophenotypes
According to Gottesman, an endophenotype should be a heritable factor that
co-segregates with a psychiatric disorder and can be found in non-affected
family members at a higher frequency than in the general population 156. It has
been proposed that it is easier to analyze the genetic basis of
endophenotypes than the very psychiatric disorders themselves because of
the belief that endophenotypes provide more definite biological components
compared to that of the diagnostic criteria used, hence the attractiveness of
endophenotyping large families in psychiatric genetics research. However, a
review compiled by Flint and Munafo about the endophenotype concept in
psychiatric genetics showed that the genetic architecture of endophenotypes
is not necessary easier to dissect than all other psychiatric disorders 157.
Nevertheless, endophenotyping large families can better aid in garnering
more information about psychiatric disorders such as their disease
susceptibility and discovering possible biomarkers correlating to the disorders.
3) Phenomics
An emerging field in neuropsychiatric research is phenomics, which is the
systematic study of phenotypes on a genome-wide scale 158. Better
Chapter 6
94
characterization of phenotypes will facilitate genetic studies of the
phenotypes. It can allow better insights to how genomic variants can affect
phenotypes, how one gene may affect more than one phenotype (pleiotropy),
and help decipher complex disorders and traits 159. Large families can assist
phenomics by enabling the Mendelian randomization approach, which allows
studies of both the genomes and phenomes of individuals in separate familial
populations 160. Mendelian randomization refers to the natural genetic setting
whereby the genetic segregation within families and the variation in
environmental exposures among the individuals during their lives can be
studied to understand how the genes segregating in certain populations can
contribute to understanding the environment factors that cause complex
disorders/traits 161. A more detailed categorization of phenotypes from
phenomics can provide sharper diagnostic criteria, which will aid in many
psychiatric and behavioral studies as discussed in the sections on cross-
disorders and subtyping of disorders in chapter 1.
The previous chapters all explore the theme on large family studies and how
they can benefit psychiatric and behavioral research. However, even if large
families are recruited, there is still no guarantee that one will be fortunate
enough to sample the families for which a major genetic determinant is co-
segregating with the disorder or trait being investigated. Despite this, they still
offer a higher probability in detecting rare genetic factors of disorders/traits.
Past successes in many physiological disorders and traits have proven that
studying multiplex families allow geneticists to delve into the complexities of
multifactorial disorders/traits and unfold the genetic architecture, through
piecing together the missing puzzles of the genetic mechanism, rare variant
by rare variant 15.
95
References
References
1. Comings DE: Why different rules are required for polygenic inheritance:
lessons from studies of the DRD2 gene. Alcohol 1998; 16: 61-70.
2. Burmeister M, McInnis MG, Zollner S: Psychiatric genetics: progress
amid controversy. Nat Rev Genet 2008; 9: 527-540.
3. Sullivan PF: The psychiatric GWAS consortium: big science comes to
psychiatry. Neuron 2010; 68: 182-186.
4. Burbridge D: Francis Galton on twins, heredity and social class. Br J
Hist Sci 2001; 34: 323-340.
5. Gottesman II, Shields J, Meehl PE: Schizophrenia and genetics; a twin
study vantage point. New York,: Academic Press, 1972.
6. Rosenthal D: Searches for the mode of genetic transmission in
schizophrenia: reflections and loose ends. Schizophr Bull 1977; 3: 268-
276.
7. Lander ES: The new genomics: global views of biology. Science 1996;
274: 536-539.
8. Cirulli ET, Goldstein DB: Uncovering the roles of rare variants in
common disease through whole-genome sequencing. Nat Rev Genet
2010; 11: 415-425.
References
96
9. Cichon S, Craddock N, Daly M et al: Genomewide association studies:
history, rationale, and prospects for psychiatric disorders. Am J
Psychiatry 2009; 166: 540-556.
10. Goldstein DB: Common genetic variation and human traits. N Engl J
Med 2009; 360: 1696-1698.
11. Ginns EI, Ott J, Egeland JA et al: A genome-wide search for
chromosomal loci linked to bipolar affective disorder in the Old Order
Amish. Nat Genet 1996; 12: 431-435.
12. Allen-Brady K, Robison R, Cannon D et al: Genome-wide linkage in
Utah autism pedigrees. Mol Psychiatry 2010; 15: 1006-1015.
13. Devlin B, Bacanu SA, Roeder K et al: Genome-wide multipoint linkage
analyses of multiplex schizophrenia pedigrees from the oceanic nation
of Palau. Mol Psychiatry 2002; 7: 689-694.
14. Mitchell KJ, Porteous DJ: Rethinking the genetic architecture of
schizophrenia. Psychol Med 2011; 41: 19-32.
15. Peltonen L, Perola M, Naukkarinen J, Palotie A: Lessons from studying
monogenic disease for common disease. Hum Mol Genet 2006; 15 Spec No 1: R67-74.
16. Raj A, Rifkin SA, Andersen E, van Oudenaarden A: Variability in gene
expression underlies incomplete penetrance. Nature 2010; 463: 913-
918.
References
97
17. Bassett AS, Bury A, Hodgkinson KA, Honer WG: Reproductive fitness
in familial schizophrenia. Schizophr Res 1996; 21: 151-160.
18. Uher R: The role of genetic variation in the causation of mental illness:
an evolution-informed framework. Mol Psychiatry 2009; 14: 1072-1082.
19. Merikangas KR: Assortative mating for psychiatric disorders and
psychological traits. Arch Gen Psychiatry 1982; 39: 1173-1180.
20. Teltsh O, Kanyas K, Karni O et al: Genome-wide linkage scan, fine
mapping, and haplotype analysis in a large, inbred, Arab Israeli
pedigree suggest a schizophrenia susceptibility locus on chromosome
20p13. Am J Med Genet B Neuropsychiatr Genet 2008; 147B: 209-
215.
21. Mansour H, Klei L, Wood J et al: Consanguinity associated with
increased risk for bipolar I disorder in Egypt. Am J Med Genet B
Neuropsychiatr Genet 2009; 150B: 879-885.
22. Rommelse NN, Franke B, Geurts HM, Hartman CA, Buitelaar JK:
Shared heritability of attention-deficit/hyperactivity disorder and autism
spectrum disorder. Eur Child Adolesc Psychiatry 2010; 19: 281-295.
23. Lichtenstein P, Yip BH, Bjork C et al: Common genetic determinants of
schizophrenia and bipolar disorder in Swedish families: a population-
based study. Lancet 2009; 373: 234-239.
References
98
24. Huang J, Perlis RH, Lee PH et al: Cross-disorder genomewide analysis
of schizophrenia, bipolar disorder, and depression. Am J Psychiatry
2010; 167: 1254-1263.
25. Angst J: Psychiatric diagnoses: the weak component of modern
research. World Psychiatry 2007; 6: 94-95.
26. American Psychiatric Association. Diagnostic and Statistical Manual of
Mental Disorders
(http://www.psych.org/MainMenu/Research/DSMIV/DSMIVTR/DSMIVv
sDSMIVTR.aspx).
27. World Health Organization. International Classification of Diseases
(http://www.who.int/classifications/icd/en/).
28. Peltonen L, Jalanko A, Varilo T: Molecular genetics of the Finnish
disease heritage. Hum Mol Genet 1999; 8: 1913-1923.
29. Peltonen L, Palotie A, Lange K: Use of population isolates for mapping
complex traits. Nat Rev Genet 2000; 1: 182-190.
30. Selch S, Strobel A, Haderlein J et al: MLC1 polymorphisms are
specifically associated with periodic catatonia, a subgroup of chronic
schizophrenia. Biol Psychiatry 2007; 61: 1211-1214.
31. Lilenfeld LR, Kaye WH, Greeno CG et al: A controlled family study of
anorexia nervosa and bulimia nervosa: psychiatric disorders in first-
degree relatives and effects of proband comorbidity. Arch Gen
Psychiatry 1998; 55: 603-610.
References
99
32. Strober M, Freeman R, Lampert C, Diamond J, Kaye W: Controlled
family study of anorexia nervosa and bulimia nervosa: evidence of
shared liability and transmission of partial syndromes. Am J Psychiatry
2000; 157: 393-401.
33. Bulik CM, Sullivan PF, Wade TD, Kendler KS: Twin studies of eating
disorders: a review. Int J Eat Disord 2000; 27: 1-20.
34. Wang K, Zhang H, Bloss CS et al: A genome-wide association study
on common SNPs and rare CNVs in anorexia nervosa. Mol Psychiatry
2011; 16: 949-959.
35. Kral TV, Rauh EM: Eating behaviors of children in the context of their
family environment. Physiol Behav 2010; 100: 567-573.
36. Moises HW, Yang L, Kristbjarnarson H et al: An international two-stage
genome-wide search for schizophrenia susceptibility genes. Nat Genet
1995; 11: 321-324.
37. A framework for interpreting genome-wide association studies of
psychiatric disorders. Mol Psychiatry 2009; 14: 10-17.
38. Geller DS, Zhang J, Wisgerhof MV, Shackleton C, Kashgarian M, Lifton
RP: A novel form of human mendelian hypertension featuring
nonglucocorticoid-remediable aldosteronism. J Clin Endocrinol Metab
2008; 93: 3117-3123.
References
100
39. Froguel P, Velho G, Passa P, Cohen D: Genetic determinants of type 2
diabetes mellitus: lessons learned from family studies. Diabete Metab
1993; 19(1): 1-10.
40. Panhuysen CI, Karban A, Knodle Manning A et al: Identification of
genetic loci for basal cell nevus syndrome and inflammatory bowel
disease in a single large pedigree. Hum Genet 2006; 120(1): 31-41.
41. Lee SL, Murdock DG, Mccauley JL et al: A Genome-wide Scan in an
Amish Pedigree with Parkinsonism. Ann Hum Genet 2008; 72(Pt 5): 621-629.
42. Yang S, Wang K, Gregory B et al: Genomic landscape of a three-
generation pedigree segregating affective disorder. PLos One 2009;
4(2): e4474.
43. Teltsh O, Kanyas K, Karni O et al: Genome-wide linkage scan, fine
mapping, and haplotype analysis in a large, inbred, Arab Israeli
pedigree suggest a schizophrenia susceptibility locus on chromosome
20p13. Am J Med Genet B Neuropsychiatr Genet 2008; 147B(2): 209-
215.
44. Polanczyk G, de Lima MS, Horta BL, Biederman J, Rohde L: The
worldwide prevalence of ADHD: A systemic review and metaregression
analysis. Am J Psychiatry 2007; 164: 942-948.
45. Kessler RC, Adler LA, Barkley R et al: Patterns and predictors of
attention-deficit/hyperactivity disorder persistence into adulthood:
results from the national comorbidity survey replication. Biol Psychiatry
2005; 57: 1442-1451.
References
101
46. Faraone SV, Perlis RH, Doyle AE et al: Molecular genetics of attention-
deficit/hyperactivity disorder. Biol Psychiatry 2005; 57(11): 1313-1323.
47. Sprich S, Biederman J, Crawford MH, Mundy E, Faraone S: Adoptive
and biological families of children and adolescents with ADHD. J Am
Acad Child Adolesc Psychiatry 2000; 39(11): 1432-1437.
48. Jacob CP, Romanos J, Dempfle A et al: Co-morbidity of adult attention-
deficit/hyperactivity disorder with focus on personality traits and related
disorders in a tertiary referral center. Eur Arch Psychiatry Clin Neurosci
2007; 257(6): 309-317.
49. Boomsma DI, Saviouk V, Hottenga JJ et al: Genetic epidemiology of
attention deficit hyperactivity disorder (ADHD index) in adults. PLoS
One 2010; 5: e10621.
50. Romanos M, Freitag C, Jacob C et al: Genome-wide linkage analysis
of ADHD using high density SNP arrays: novel loci at 5q13.1 and
14q12. Mol Psychiatry 2008; 13: 522-530.
51. Kaufman J, Birmaher B, Brent D et al: Schedule for affective disorders
and schizophrenia fro school-age children - present and lifetime
version (K-SADS-PL): initial reliability and validity data. J Am Acad
Child Adolesc Psychiatry 1997; 36: 980-988.
52. Schneider S, Margraf J, Unnewehr S: Kinder-DIPS Diagnostisches
Interview bei Psychischen Stoerungen von Kindern. Berlin: Springer
1995.
References
102
53. Achenbach T, Rescorla L: Manual for the Child Behavior Checklist/6-
18. University of Vermont, Department of Psychiatry, Burlington, VT
2001.
54. Rösler M, Retz W, Retz-Junginger P et al: Tools for the diagnosis of
attention-deficit/hyperactivity disorder in adults. Self-rating behavior
questionnaire and diagnostic checklist. Nervenarzt 2004; 75: 888-895.
55. Doepfner M, Lehmkukl G: Diagnostik-System fuer psychische
Stoerungen im Kindes- und Jungenalter nach ICD-10/DSM-IV
(DISYPS-KJ). 2nd corrected and extended edition. Bern: Hans Huber
2003.
56. Wittchen H-U, Wunderlich U, Gruschwitz S, M Z: SKID I. Göttingen:
Hogrefe, 1997.
57. Fydrich T, Renneberg B, Schmitz B, H-U W: SKID II. Göttingen:
Hogrefe, 1997.
58. Retz-Junginger P, Retz W, Blocher D et al: Wender Utah rating scale.
The short version for the assessment of the attention-deficit
hyperactivity disorder in adults. Nervenarzt 2002; 73: 830-838.
59. Cattell RB, Weiss R, Osterland J: Grundintelligenztest Skala 1-CFT1.
Goettingen: Hogrefe 1997.
60. Weiss R: Grundintelligenztest Skala 2-CFT20. Goettingen: Hogrefe
1998.
References
103
61. Lehrl S, Triebig G, B F: Multiple choice vocabulary test MWT as a valid
and short test to estimate premorbid intelligence. Acta Neurol Scand
1995; 91: 335-345.
62. Sobel E, Lange K: Descent graphs in pedigree analysis: applications to
haplotyping, location scores, and marker sharing statistics. Am J Hum
Genet 1996; 58: 1323-1337.
63. Lindner TH, Hoffmann K: easyLINKAGE: a PERL script for easy and
automated two-/multi-point linkage analyses. Bioinformatics 2005;
21(3): 405-407.
64. Thiele H, Nuernberg P: HaploPainter: a tool for drawing pedigrees with
complex haplotypes. Bioinformatics 2005; 21(8): 1730-1732.
65. Broman KW, Murray JC, Sheffield VC, White RL, Weber J:
Comprehensive human genetic maps: Individual and sex-specific
variation in recombination. Am J Hum Genet 1998; 63: 861-869.
66. Abecasis GR, Cherny SS, Cookson WO, Cardon L: Merlin--rapid
analysis of dense genetic maps using sparse gene flow trees. Nat
Genet 2002; 30(1): 97-101.
67. Amin N, Aulchenko YS, Dekker MC et al: Suggestive linkage of ADHD
to chromosome 18q22 in a young genetically isolated Dutch
population. Eur J Hum Genet 2009; 7: 958-966.
References
104
68. Saviouk V, Hottenga JJ, Slagboom EP et al: ADHD in Dutch adults:
heritability and linkage study. Am J Med Genet B Neuropsychiatr Genet
2011; 156B: 352-362.
69. Sobreira NLM, Cirulli ET, Avramopoulos D et al: Whole-genome
sequencing of a single proband together with linkage anlaysis identifies
a Mendelian disease gene. PLos Genet 2010; 6(6): e1000991.
70. Risch N, Merikangas K: The future of genetic studies of complex
human diseases. Science 1996; 273(5281): 1516-1517.
71. Neale BM, Medland S, Ripke S et al: Case-Control Genome-Wide
Association Study of Attention-Deficit/Hyperactivity Disorder. J Am
Acad Child Adolesc Psychiatry 2010; 49(9): 906-920.
72. Zhou K, Dempfle A, Arcos-Burgos M et al: Meta-analysis of genome-
wide linkage scans of attention deficit hyperactivity disorder. Am J Med
Genet B Neuropsychiatr Genet 2008; 147B(8): 1392-1398.
73. Lesch KP, Selch S, Renner TJ et al: Genome-wide copy number
variation analysis in attention-deficit/hyperactivity disorder: association
with neuropeptide Y gene dosage in an extended pedigree. Mol
Psychiatry 2010; [Epub ahead of print].
74. Vegt R, Bertoli-Avella AM, Tulen JH et al: Genome-wide linkage
analysis in a Dutch multigenerational family with attention deficit
hyperactivity disorder. Eur J Hum Genet 2010; 18(2): 206-211.
References
105
75. Arcos-Burgos M, Castellanos FX, Pineda D et al: Attention-
Deficit/Hyperactivity Disorder in a Population Isolate: Linkage to Loci at
4q13.2, 5q33.3, 11q22, and 17p11. Am J Hum Genet 2004; 75(6): 998-
1014.
76. Arcos-Burgos M, Jain M, Acosta MT et al: A common variant of the
latrophilin 3 gene, LPHN3, confers susceptibility to ADHD and predicts
effectiveness of stimulant medication. Mol Psychiatry 2010; 15 (11): 1053-1066.
77. Varilo T, Peltonen L: Isolates and their potential use in complex gene
mapping efforts. Curr Opin Genet Dev 2004; 14(3): 316-323.
78. Banerjee TD, Middleton F, Faraone S: Environmental risk factors for
attention-deficit hyperactivity disorder. Acta Paediatr 2007; 96(9): 1269-1274.
79. van der Knaap MS, Barth PG, Stroink H et al: Leukoencephalopathy
with swelling and a discrepantly mild clinical course in eight children.
Ann Neurol 1995; 37: 324-334.
80. Meyer J, Huberth A, Ortega G et al: A missense mutation in a novel
gene encoding a putative cation channel is associated with catatonic
schizophrenia in a large pedigree. Mol Psychiatry 2001; 6: 302-306.
81. Verma R, Mukerji M, Grover D et al: MLC1 gene is associated with
schizophrenia and bipolar disorder in Southern India. Biol Psychiatry
2005; 58: 16-22.
References
106
82. Rubie C, Lichtner P, Gartner J et al: Sequence diversity of
KIAA0027/MLC1: are megalencephalic leukoencephalopathy and
schizophrenia allelic disorders? Hum Mutat 2003; 21: 45-52.
83. Spijker S, Van Zanten JS, De Jong S et al: Stimulated gene expression
profiles as a blood marker of major depressive disorder. Biol Psychiatry
2010; 68: 179-186.
84. Boor PK, de Groot K, Waisfisz Q et al: MLC1: a novel protein in distal
astroglial processes. J Neuropathol Exp Neurol 2005; 64: 412-419.
85. Schmitt A, Gofferje V, Weber M, Meyer J, Mossner R, Lesch KP: The
brain-specific protein MLC1 implicated in megalencephalic
leukoencephalopathy with subcortical cysts is expressed in glial cells in
the murine brain. Glia 2003; 44: 283-295.
86. Teijido O, Martinez A, Pusch M et al: Localization and functional
analyses of the MLC1 protein involved in megalencephalic
leukoencephalopathy with subcortical cysts. Hum Mol Genet 2004; 13: 2581-2594.
87. Teijido O, Casaroli-Marano R, Kharkovets T et al: Expression patterns
of MLC1 protein in the central and peripheral nervous systems.
Neurobiol Dis 2007; 26: 532-545.
88. Leegwater PA, Yuan BQ, van der Steen J et al: Mutations of MLC1
(KIAA0027), encoding a putative membrane protein, cause
megalencephalic leukoencephalopathy with subcortical cysts. Am J
Hum Genet 2001; 68: 831-838.
References
107
89. Steinke V, Meyer J, Syagailo YV et al: The genomic organization of the
murine Mlc1 (Wkl1, KIAA0027) gene. J Neural Transm 2003; 110: 333-
343.
90. Suzuki Y, Tsunoda T, Sese J et al: Identification and characterization
of the potential promoter regions of 1031 kinds of human genes.
Genome Res 2001; 11: 677-684.
91. Gardiner-Garden M, Frommer M: CpG islands in vertebrate genomes.
J Mol Biol 1987; 196: 261-282.
92. Roider HG, Lenhard B, Kanhere A, Haas SA, Vingron M: CpG-depleted
promoters harbor tissue-specific transcription factor binding signals--
implications for motif overrepresentation analyses. Nucleic Acids Res
2009; 37: 6305-6315.
93. Dean M: ABC transporters, drug resistance, and cancer stem cells. J
Mammary Gland Biol Neoplasia 2009; 14: 3-9.
94. Ambrosini E, Serafini B, Lanciotti A et al: Biochemical characterization
of MLC1 protein in astrocytes and its association with the dystrophin-
glycoprotein complex. Mol Cell Neurosci 2008; 37: 480-493.
95. Cohn RD: Dystroglycan: important player in skeletal muscle and
beyond. Neuromuscul Disord 2005; 15: 207-217.
96. Gudmundsson P, Skoog I, Waern M et al: The relationship between
cerebrospinal fluid biomarkers and depression in elderly women. Am J
Geriatr Psychiatry 2007; 15: 832-838.
References
108
97. Muller N, Ackenheil M: Immunoglobulin and albumin content of
cerebrospinal fluid in schizophrenic patients: relationship to negative
symptomatology. Schizophr Res 1995; 14: 223-228.
98. Schwarz MJ, Ackenheil M, Riedel M, Muller N: Blood-cerebrospinal
fluid barrier impairment as indicator for an immune process in
schizophrenia. Neurosci Lett 1998; 253: 201-203.
99. Mantovani R: A survey of 178 NF-Y binding CCAAT boxes. Nucleic
Acids Res 1998; 26: 1135-1143.
100. Blomquist P, Belikov S, Wrange O: Increased nuclear factor 1 binding
to its nucleosomal site mediated by sequence-dependent DNA
structure. Nucleic Acids Res 1999; 27: 517-525.
101. Donati G, Gatta R, Dolfini D, Fossati A, Ceribelli M, Mantovani R: An
NF-Y-dependent switch of positive and negative histone methyl marks
on CCAAT promoters. PLoS One 2008; 3: e2066.
102. Mantovani R: The molecular biology of the CCAAT-binding factor NF-
Y. Gene 1999; 239: 15-27.
103. Carninci P, Sandelin A, Lenhard B et al: Genome-wide analysis of
mammalian promoter architecture and evolution. Nat Genet 2006; 38: 626-635.
104. Ajay SS, Athey BD, Lee I: Unified translation repression mechanism for
microRNAs and upstream AUGs. BMC Genomics 2010; 11: 155.
References
109
105. Hu L, Gudas LJ: Activation of keratin 19 gene expression by a 3'
enhancer containing an AP1 site. J Biol Chem 1994; 269: 183-191.
106. Bianchi M, Crinelli R, Giacomini E, Carloni E, Magnani M: A potent
enhancer element in the 5'-UTR intron is crucial for transcriptional
regulation of the human ubiquitin C gene. Gene 2009; 448: 88-101.
107. Ilja Boor PK, de Groot K, Mejaski-Bosnjak V et al: Megalencephalic
leukoencephalopathy with subcortical cysts: an update and extended
mutation analysis of MLC1. Hum Mutat 2006; 27: 505-512.
108. Leegwater PA, Boor PK, Yuan BQ et al: Identification of novel
mutations in MLC1 responsible for megalencephalic
leukoencephalopathy with subcortical cysts. Hum Genet 2002; 110: 279-283.
109. Lopez-Hernandez T, Ridder MC, Montolio M et al: Mutant GlialCAM
causes megalencephalic leukoencephalopathy with subcortical cysts,
benign familial macrocephaly, and macrocephaly with retardation and
autism. Am J Hum Genet 2011; 88: 422-432.
110. Chevalier-Mariette C, Henry I, Montfort L et al: CpG content affects
gene silencing in mice: evidence from novel transgenes. Genome Biol
2003; 4: R53.
111. Smith EN, Bloss CS, Badner JA et al: Genome-wide association study
of bipolar disorder in European American and African American
individuals. Mol Psychiatry 2009; 14: 755-763.
References
110
112. Ferreira MA, O'Donovan MC, Meng YA et al: Collaborative genome-
wide association analysis supports a role for ANK3 and CACNA1C in
bipolar disorder. Nat Genet 2008; 40: 1056-1058.
113. McGuffin P, Owen MJ, Farmer AE: Genetic basis of schizophrenia.
Lancet 1995; 346: 678-682.
114. Potash JB, DePaulo JR, Jr.: Searching high and low: a review of the
genetics of bipolar disorder. Bipolar Disord 2000; 2: 8-26.
115. Saha S, Chant D, Welham J, McGrath J: A systematic review of the
prevalence of schizophrenia. PLoS Med 2005; 2: e141.
116. Perala J, Suvisaari J, Saarni SI et al: Lifetime prevalence of psychotic
and bipolar I disorders in a general population. Arch Gen Psychiatry
2007; 64: 19-28.
117. Sullivan PF, Kendler KS, Neale MC: Schizophrenia as a complex trait:
evidence from a meta-analysis of twin studies. Arch Gen Psychiatry
2003; 60: 1187-1192.
118. Smoller JW, Finn CT: Family, twin, and adoption studies of bipolar
disorder. Am J Med Genet C Semin Med Genet 2003; 123C: 48-58.
119. Stober G, Pfuhlmann B, Nurnberg G et al: Towards the genetic basis of
periodic catatonia: pedigree sample for genome scan I and II. Eur Arch
Psychiatry Clin Neurosci 2001; 251 Suppl 1: I25-30.
References
111
120. Leonhard K, H B: Classification of endogeneous psychoses and their
differential etiology, 2nd edn. Vienna and New York: Springer, 1999.
121. Taylor MA, Fink M: Catatonia in psychiatric classification: a home of its
own. Am J Psychiatry 2003; 160: 1233-1241.
122. Stober G, Franzek E, Lesch KP, Beckmann H: Periodic catatonia: a
schizophrenic subtype with major gene effect and anticipation. Eur
Arch Psychiatry Clin Neurosci 1995; 245: 135-141.
123. Meyer J, Johannssen K, Freitag CM et al: Rare variants of the gene
encoding the potassium chloride co-transporter 3 are associated with
bipolar disorder. Int J Neuropsychopharmacol 2005; 8: 495-504.
124. Stober G, Saar K, Ruschendorf F et al: Splitting schizophrenia: periodic
catatonia-susceptibility locus on chromosome 15q15. Am J Hum Genet
2000; 67: 1201-1207.
125. Stober G, Meyer J, Nanda I et al: Linkage and family-based association
study of schizophrenia and the synapsin III locus that maps to
chromosome 22q13. Am J Med Genet 2000; 96: 392-397.
126. Rozen S, Skaletsky H: Primer3 on the WWW for general users and for
biologist programmers. Methods Mol Biol 2000; 132: 365-386.
127. Sobel E, Lange K: Descent graphs in pedigree analysis: applications to
haplotyping, location scores, and marker-sharing statistics. Am J Hum
Genet 1996; 58: 1323-1337.
References
112
128. Hoffmann K, Lindner TH: easyLINKAGE-Plus--automated linkage
analyses using large-scale SNP data. Bioinformatics 2005; 21: 3565-
3567.
129. Barrett JC, Fry B, Maller J, Daly MJ: Haploview: analysis and
visualization of LD and haplotype maps. Bioinformatics 2005; 21: 263-
265.
130. Alt SR, Turner JD, Klok MD et al: Differential expression of
glucocorticoid receptor transcripts in major depressive disorder is not
epigenetically programmed. Psychoneuroendocrinology 2010; 35: 544-
556.
131. Stober G, Seelow D, Ruschendorf F, Ekici A, Beckmann H, Reis A:
Periodic catatonia: confirmation of linkage to chromosome 15 and
further evidence for genetic heterogeneity. Hum Genet 2002; 111: 323-
330.
132. Ben-Shachar S, Lanpher B, German JR et al: Microdeletion 15q13.3: a
locus with incomplete penetrance for autism, mental retardation, and
psychiatric disorders. J Med Genet 2009; 46: 382-388.
133. Dykens EM, Sutcliffe JS, Levitt P: Autism and 15q11-q13 disorders:
behavioral, genetic, and pathophysiological issues. Ment Retard Dev
Disabil Res Rev 2004; 10: 284-291.
134. Ingason A, Kirov G, Giegling I et al: Maternally derived
microduplications at 15q11-q13: implication of imprinted genes in
psychotic illness. Am J Psychiatry 2011; 168: 408-417.
References
113
135. Buizer-Voskamp JE, Muntjewerff JW, Strengman E et al: Genome-
Wide Analysis Shows Increased Frequency of Copy Number Variation
Deletions in Dutch Schizophrenia Patients. Biol Psychiatry 2011.
136. Williams NM, Zaharieva I, Martin A et al: Rare chromosomal deletions
and duplications in attention-deficit hyperactivity disorder: a genome-
wide analysis. Lancet 2010; 376: 1401-1408.
137. Richards AL, Jones L, Moskvina V et al: Schizophrenia susceptibility
alleles are enriched for alleles that affect gene expression in adult
human brain. Mol Psychiatry 2011.
138. Liu C: Brain expression quantitative trait locus mapping informs genetic
studies of psychiatric diseases. Neurosci Bull 2011; 27: 123-133.
139. Bearden CE, Jasinska AJ, Freimer NB: Methodological issues in
molecular genetic studies of mental disorders. Annu Rev Clin Psychol
2009; 5: 49-69.
140. Jasinska AJ, Service S, Choi OW et al: Identification of brain
transcriptional variation reproduced in peripheral blood: an approach
for mapping brain expression traits. Hum Mol Genet 2009; 18: 4415-
4427.
141. Lesnik Oberstein SA, Kriek M, White SJ et al: Peters Plus syndrome is
caused by mutations in B3GALTL, a putative glycosyltransferase. Am J
Hum Genet 2006; 79: 562-566.
References
114
142. Jasinska AJ, Service S, Levinson M et al: A genetic linkage map of the
vervet monkey (Chlorocebus aethiops sabaeus). Mamm Genome
2007; 18: 347-360.
143. Almasy L, Blangero J: Multipoint quantitative-trait linkage analysis in
general pedigrees. Am J Hum Genet 1998; 62: 1198-1211.
144. Pfaffl MW: A new mathematical model for relative quantification in real-
time RT-PCR. Nucleic Acids Res 2001; 29: e45.
145. Mee ET, Badhan A, Karl JA et al: MHC haplotype frequencies in a UK
breeding colony of Mauritian cynomolgus macaques mirror those found
in a distinct population from the same geographic origin. J Med
Primatol 2009; 38: 1-14.
146. de Vries A, Holmes MC, Heijnis A et al: Prenatal dexamethasone
exposure induces changes in nonhuman primate offspring
cardiometabolic and hypothalamic-pituitary-adrenal axis function. J Clin
Invest 2007; 117: 1058-1067.
147. Goring HH, Curran JE, Johnson MP et al: Discovery of expression
QTLs using large-scale transcriptional profiling in human lymphocytes.
Nat Genet 2007; 39: 1208-1216.
148. Nicolae DL, Gamazon E, Zhang W, Duan S, Dolan ME, Cox NJ: Trait-
associated SNPs are more likely to be eQTLs: annotation to enhance
discovery from GWAS. PLoS Genet 2010; 6: e1000888.
References
115
149. Moffatt MF, Kabesch M, Liang L et al: Genetic variants regulating
ORMDL3 expression contribute to the risk of childhood asthma. Nature
2007; 448: 470-473.
150. Libioulle C, Louis E, Hansoul S et al: Novel Crohn disease locus
identified by genome-wide association maps to a gene desert on
5p13.1 and modulates expression of PTGER4. PLoS Genet 2007; 3: e58.
151. Dimas AS, Deutsch S, Stranger BE et al: Common regulatory variation
impacts gene expression in a cell type-dependent manner. Science
2009; 325: 1246-1250.
152. Cookson W, Liang L, Abecasis G, Moffatt M, Lathrop M: Mapping
complex disease traits with global gene expression. Nat Rev Genet
2009; 10: 184-194.
153. Durbin RM, Abecasis GR, Altshuler DL et al: A map of human genome
variation from population-scale sequencing. Nature 2010; 467: 1061-
1073.
154. Alkan C, Coe BP, Eichler EE: Genome structural variation discovery
and genotyping. Nat Rev Genet 2011; 12: 363-376.
155. Lesch KP, Selch S, Renner TJ et al: Genome-wide copy number
variation analysis in attention-deficit/hyperactivity disorder: association
with neuropeptide Y gene dosage in an extended pedigree. Mol
Psychiatry 2011; 16: 491-503.
References
116
156. Gottesman, II, Gould TD: The endophenotype concept in psychiatry:
etymology and strategic intentions. Am J Psychiatry 2003; 160: 636-
645.
157. Flint J, Munafo MR: The endophenotype concept in psychiatric
genetics. Psychol Med 2007; 37: 163-180.
158. Bilder RM: Phenomics: building scaffolds for biological hypotheses in
the post-genomic era. Biol Psychiatry 2008; 63: 439-440.
159. Houle D, Govindaraju DR, Omholt S: Phenomics: the next challenge.
Nat Rev Genet 2010; 11: 855-866.
160. Rockman MV: Reverse engineering the genotype-phenotype map with
natural genetic variation. Nature 2008; 456: 738-744.
161. Davey Smith G, Ebrahim S: 'Mendelian randomization': can genetic
epidemiology contribute to understanding environmental determinants
of disease? Int J Epidemiol 2003; 32: 1-22.
Bibliography of presented work
117
Bibliography of presented work during doctoral studies (October 2007 – December 2010)
Invited Talks
1) ADHD Symposium (Wuerzburg, Germany, June 2008)
‘Linkage analysis in multiplex families with ADHD’
2) IMpACT Symposium on adult ADHD and complex psychiatric genetics
(Wuerzburg, Germany, June 2010)
‘Linkage analysis and fine-mapping in multiplex ADHD pedigrees’
Oral Presentations
1) German Society of Neurogenetics (Luebeck, Germany, September 2008)
‘Fine-mapping of multiplex families with ADHD’
2) World Congress on Psychiatric Genetics (San Diego, USA, October 2009)
‘Haplotype segregation in multiplex ADHD families at different chromosomal
loci’
3) IRTG Autumn School (Luxembourg, November 2009)
‘ADHD, Stress and Genes’
Poster Presentations
1) World Congress on Psychiatric Genetics (Osaka, Japan, October 2008)
‘Linkage analysis in multiplex families with ADHD’
2) European Human Genetics Conference (Vienna, Austria, May 2009)
‘Monogeneous inheritance in ADHD? Report from a fine-mapping study’
3) International Research Day (Trier, Germany, December 2010)
‘Genetics of blunted stress response: Perspectives from ADHD study’

Acknowledgements
118
Acknowledgements
Heartfelt gratitude to my mentor, Professor Jobst Meyer, with whose guidance
helped and encouraged each little step in my academic pursuit these past
years.
Many thanks to:
Professor Claude Muller, Ulrike Schuelter and all colleagues from the
Department of Neurobehavioral Genetics (Institute of Psychobiology,
University of Trier), International Research Training Group (Trier-Leiden) and
collaborating institutes for their professional support and moral
encouragement;
Professor Hartmut Schaechinger for his generosity in making a fruitful
academic exchange with the Semel Institute at UCLA possible;
Professor Nelson Freimer and Dr. Anna Jasinska for their hospitality and
guidance during my academic exchange stint with them;
and the many impressive scientists, whom I have met along the way, for their
invaluable advices on scientific matters and kind words when the going gets
tough.
Michelle Lin
Trier, September 2011

Declaration
119
ERKLÄRUNG
Ich erkläre hiermit, dass ich die vorliegende Arbeit ohne unzulässige Hilfe Dritter und ohne
Benutzung anderer als der angegebenen Hilfsmittel angefertigt habe. Die aus anderen
Quellen direkt oder indirekt übernommenen Daten und Konzepte sind unter Angabe der
Quelle gekennzeichnet.
Bei der Auswahl und Auswertung folgenden Materials haben mir die nachstehend
aufgeführten Personen in der jeweils beschriebenen Weise entgeltlich/unentgeltlich geholfen:
1. .....................................................
2. ......................................................
3. ......................................................
Weitere Personen waren an der inhaltlich-materiellen Erstellung der vorliegenden Arbeit nicht
beteiligt. Insbesondere habe ich hierfür nicht die entgeltliche Hilfe von Vermittlungs- bzw.
Beratungsdiensten (Promotionsberater oder andere Personen) in Anspruch genommen.
Niemand hat von mir unmittelbar oder mittelbar geldwerte Leistungen für Arbeit erhalten, die
im Zusammenhang mit dem Inhalt der vorliegenden Dissertation stehen.
Die Arbeit wurde bisher weder im In- noch im Ausland in gleicher oder ähnlicher Form einer
anderen Prüfungsbehörde vorgelegt.
Ich versichere die Richtigkeit der vorangegangenen Erklärung und bin mir der strafrechtlichen
Folgen einer Falschaussage bewusst.
-------------------------------------- ----------------------------------------
Ort, Datum Unterschrift
(Michelle Lin)
Recommended